2 0 1 Annual Report 3 - pancaglobal.co.id · global financial market, resulting in capital outflow...
81
Annual Report Survive by Quality Develop by Innovaon PANCA GLOBAL SECURITIES Member of Indonesia Stock Exchange 2 0 1 3
Transcript of 2 0 1 Annual Report 3 - pancaglobal.co.id · global financial market, resulting in capital outflow...

Annual ReportSurvive by Quality Develop by Innovation
PANCA GLOBALSECURITIES
Member of Indonesia Stock Exchange
2013
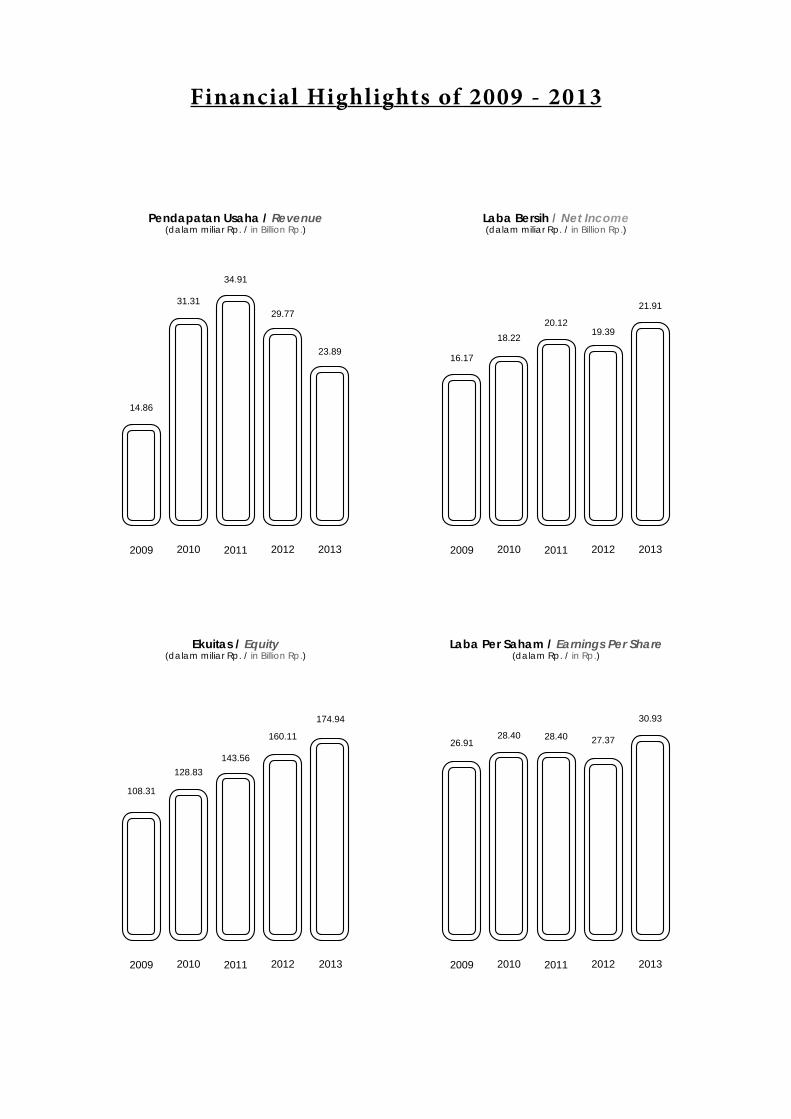
Pendapatan Usaha / Revenue(dalam miliar Rp. / in Billion Rp.)
Laba Bersih / Net Income(dalam miliar Rp. / in Billion Rp.)
Laba Per Saham / Earnings Per Share(dalam Rp. / in Rp.)
Ekuitas / Equity(dalam miliar Rp. / in Billion Rp.)
Financial Highlights of 2009 - 2013
2012
2012
2012
2012
2010
2010
2010
2010
2013
2013
2013
2013
2011
2011
2011
2011
2009
2009
2009
2009
34.91
31.31
14.86
143.56128.83
108.31
160.11
174.94
28.4028.4026.91 27.37
30.93
20.12
16.17
19.3918.22
21.9129.77
23.89

Ikhtisar Keuangan | Financial Highlights
Kinerja Saham dan Dividen| Stock Performance and Dividend
Laporan Dewan Komisaris | Report by the Board of Commissioners
Laporan Direksi | Report by the Board of Directors
Laporan Pertanggungjawaban Tahunan Komiter Audit | Annual Compliance Statement Audit Committee
Profil Perusahaan | Company’s Profile
Kegiatan Usaha, Produk dan Layanan | Business Division, Products and Services
Visi dan Misi | Vision and Mission
Struktur Organisasi | Organization Structure
Riwayat Singkat | Brief History
Profil Dewan Komisaris | Profile of the Board of Commissioners
Profil Direksi | Profile of the Board of Directors
Sumber Daya Manusia | Human Resources
Skema Pemegang Saham Pengendali | Schematic Controller Shareholder
Analisa dan Pembahasan Manajemen | Management Analysis and Discussion
Tata Kelola Perusahaan | Corporate Governance
Pernyataan Manajemen Atas Laporan Tahunan 2013 | Management’s Declaration on 2013 Annual Report
Laporan Keuangan | Financial Statement
2 -
4 -
5 -
7 -
10 -
11 -
12 -
12 -
13 -
14 -
16 -
17 -
18 -
19 -
20 -
30 -
40 -
Daftar Isi
Contents
2 Laporan Tahunan Annual Report 2013 PT Panca Global Securities Tbk
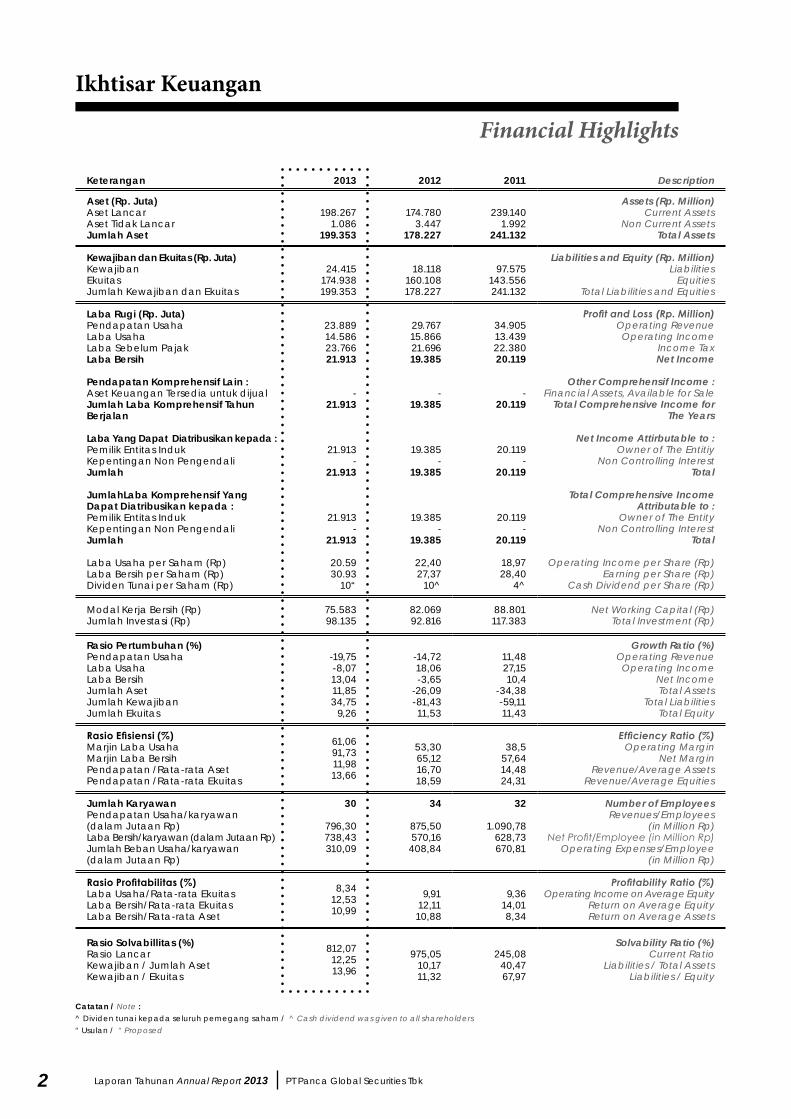
Ikhtisar Keuangan
Financial Highlights
Keterangan 2013 2012 2011 Description
Aset (Rp. Juta)Aset LancarAset Tidak LancarJumlah Aset
198.2671.086
199.353
174.7803.447
178.227
239.1401.992
241.132
Assets (Rp. Million)Current Assets
Non Current AssetsTotal Assets
Kewajiban dan Ekuitas (Rp. Juta)KewajibanEkuitasJumlah Kewajiban dan Ekuitas
24.415174.938199.353
18.118160.108178.227
97.575143.556241.132
Liabilities and Equity (Rp. Million)Liabilities
EquitiesTotal Liabilities and Equities
Laba Rugi (Rp. Juta)Pendapatan UsahaLaba UsahaLaba Sebelum PajakLaba Bersih
Pendapatan Komprehensif Lain :Aset Keuangan Tersedia untuk dijualJumlah Laba Komprehensif Tahun Berjalan
Laba Yang Dapat Diatribusikan kepada :Pemilik Entitas IndukKepentingan Non PengendaliJumlah
JumlahLaba Komprehensif Yang Dapat Diatribusikan kepada :Pemilik Entitas IndukKepentingan Non PengendaliJumlah
Laba Usaha per Saham (Rp)Laba Bersih per Saham (Rp)Dividen Tunai per Saham (Rp)
23.88914.58623.76621.913
-21.913
21.913-
21.913
21.913-
21.913
20.5930.93
10“
29.76715.86621.69619.385
-19.385
19.385-
19.385
19.385-
19.385
22,4027,37
10^
34.90513.43922.38020.119
-20.119
20.119-
20.119
20.119-
20.119
18,9728,40
4^
Profit and Loss (Rp. Million)Operating RevenueOperating Income
Income TaxNet Income
Other Comprehensif Income :Financial Assets, Available for Sale
Total Comprehensive Income for The Years
Net Income Attirbutable to :Owner of The Entitiy
Non Controlling InterestTotal
Total Comprehensive Income Attributable to :
Owner of The EntityNon Controlling Interest
Total
Operating Income per Share (Rp)Earning per Share (Rp)
Cash Dividend per Share (Rp)
Modal Kerja Bersih (Rp)Jumlah Investasi (Rp)
75.58398.135
82.06992.816
88.801117.383
Net Working Capital (Rp)Total Investment (Rp)
Rasio Pertumbuhan (%)Pendapatan UsahaLaba UsahaLaba BersihJumlah AsetJumlah KewajibanJumlah Ekuitas
-19,75-8,0713,0411,8534,75
9,26
-14,7218,06-3,65
-26,09-81,4311,53
11,4827,1510,4
-34,38-59,1111,43
Growth Ratio (%)Operating RevenueOperating Income
Net IncomeTotal Assets
Total LiabilitiesTotal Equity
Rasio Efisiensi (%)Marjin Laba UsahaMarjin Laba BersihPendapatan /Rata-rata AsetPendapatan /Rata-rata Ekuitas
61,0691,7311,9813,66
53,3065,1216,7018,59
38,557,6414,4824,31
Efficiency Ratio (%)Operating Margin
Net MarginRevenue/Average Assets
Revenue/Average Equities
Jumlah KaryawanPendapatan Usaha/karyawan(dalam Jutaan Rp)Laba Bersih/karyawan (dalam Jutaan Rp)Jumlah Beban Usaha/karyawan(dalam Jutaan Rp)
30
796,30738,43310,09
34
875,50570,16408,84
32
1.090,78628,73670,81
Number of EmployeesRevenues/Employees
(in Million Rp)Net Profit/Employee (in Million Rp)
Operating Expenses/Employee (in Million Rp)
Rasio Profitabilitas (%)Laba Usaha/Rata-rata EkuitasLaba Bersih/Rata-rata EkuitasLaba Bersih/Rata-rata Aset
8,3412,5310,99
9,9112,1110,88
9,3614,018,34
Profitability Ratio (%)Operating Income on Average Equity
Return on Average EquityReturn on Average Assets
Rasio Solvabillitas (%)Rasio LancarKewajiban / Jumlah AsetKewajiban / Ekuitas
812,0712,2513,96
975,0510,1711,32
245,0840,4767,97
Solvability Ratio (%)Current Ratio
Liabilities / Total AssetsLiabilities / Equity
Catatan / Note :^ Dividen tunai kepada seluruh pemegang saham / ^ Cash dividend was given to all shareholders“ Usulan / “ Proposed

3PT Panca Global Securities Tbk Laporan Tahunan Annual Report 2013
Laba Usaha / Operating Profit
Komposisi Aset per 31 Desember 2013Breakdown of Assets as of 31st December, 2013
Komposisi Kewajiban dan Ekuitas per 31 Desember 2013Breakdown of Liabilities and Equity as of 31st December, 2013
Pertumbuhan Aktiva, Kewajiban dan EkuitasGrowth of Assets, Liabilities and Equities
Pertumbuhan Pendapatan, Laba Usaha dan laba BersihGrowth of Revenues, Operating Income and Net Income
Aktiva / AssetsKewajiban / LiabilitiesEkuitas / Equity
Pendapatan / Revenue
Laba Bersih / Net Profit
250
200
150
100
50
0
Mily
ar R
p B
illion
Rp
2013
2013
2011
2011
35
30
25
20
15
10
5
0
Mily
ar R
p B
illion
Rp
10%Hutang Nasabah dan LKP /Customer and LKP payables
12.6%Portofolio Efek Bersih / Securities
6.3%Kas dan Setara Kas /
Cash and Cash Equivalent
47.7%Piutang Nasabah dan LKP /Customer and LKP Receivables
1.5%Piutang Lainnya / Other Receivable
2.2%Aktiva Tetap dan Lainnya /
Fixed and Others Assets
29.7%Efek Beli dgn
Janji Jual KembaliReverse Repo
0.1%Hutang Pajak / Tax Payables
2.1%Hutang Lainnya /Other payables
87.8%Ekuitas /Equity
2012
2012

4 Laporan Tahunan Annual Report 2013 PT Panca Global Securities Tbk
Harga Saham Tertinggi, Terendah dan PenutupanTable of Highest, Lowest and Closing Price
Akhir / ClosingTerendah / LowestTertinggi / Highest
(Rupiah)
350
300
250
200
150
100
50
1Q12
2Q12
3Q12
4Q12
1Q13
2Q13
3Q13
4Q13
Kinerja Saham dan Dividen
Stock Performance and Dividend
Tahun Buku 2012 2013 Financial Year
Jumlah Saham yang Beredar 708.354.264 708.354.264 The Number Outstanding Shares
Kapatalisasi Harga Pasar*(Milliar Rp) 159 195 The Market Capitalization*
(Bill.Rp)
Volume Perdagangan* 81.151.940 18.877.850 Trading Volume*
* sumber/ source : IDX Annually Statistic 2013/2012
Harga / Price 1Q 12 2Q 12 3Q 12 4Q 12 1Q 13 2Q 13 3Q 13 4Q 13
Tertinggi / Highest 220 310 270 260 250 300 275 275
Terendah / Lowest 220 260 265 225 230 270 275 275
Penutupan / Closing 220 270 265 225 240 280 275 275

5PT Panca Global Securities Tbk Laporan Tahunan Annual Report 2013
We viewed that the Company had sailed through an interesting year in 2013. It can be illustrated by the Indonesia Composite Index which reached its all-time peak of 5.215 level in May by rising 21% from the beginning of 2013 before plunging to close the year at 4.274 level.
Nonetheless, capital market activities and transactions remained strong but more on the selling pressure side with the index reflecting such volatility. Particularly, the second semester of 2013 was hit hard by tapering off issue from the Feds while domestically, our economy suffered from twin deficits and inflation hike due to fuel subsidy reduction, which also weakened the Rupiah currency.
Amid the aforementioned environment, the Management had steered the Company to achieve its highest ever net profit at Rp 21 billion. This was achieved through vigilant cash management and cost efficiencies. We believe that our shareholders should be pleased with the 13.7% return from our 2012 equity.
Our yearly profit contributes in building up our equity base and with such healthy capital, we are confident that we can thrive in the present and the future of Indonesia’s capital market. This is backed by our unique business model which focuses on our core competencies and strong experiences in the brokerage and corporate financing business whilst we shy away from highly risky and unclear ventures.
On a seperate note, income from brokerage fee had partially suffered from competitiveness since our industry still has 116 active brokers, which is the most in the region and there is yet any policy to regulate the minimum fee level to avoid cut-throat competition.
We encourage the Board of Directors to continue and steer the Company in the current direction which also relies on prudence and conservative approach in its management which has proven to be able to survive downcycle and thrive during upcycle, which nevertheless maintain consistant and sustainable profitability.
Kita melihat bahwa perusahaan telah mengarungi tahun 2013 yang menarik. Hal tersebut dapat diilustrasikan dengan Indeks Bursa Efek Indonesia yang mencapai puncaknya pada tingkat 5,215 pada bulan Mei 2013 meningkat sebesar 21% dari awal tahun, sebelum jatuh ke tingkat 4,274 pada tutup tahun.
Meskipun demikian, aktivitas dan transaksi pasar modal tetap kuat, tetapi lebih pada tekanan sisi Jual dengan indeks yang mencerminkan volatilitas tersebut. Khususnya pada semester kedua 2013 terkena imbas dari The Fed, sementara pengaruh dari perekonomian dalam negeri yang mengalami defisit transaksi berjalan dan kenaikan inflasi akibat pengurangan subsidi bahan bakar, yang juga berpengaruh terhadap pelemahan mata uang Rupiah.
Di tengah-tengah keadaan tersebut diatas, manajemen telah mengarahkan jalannya Perseroan untuk mencapai laba bersih tertinggi yang pernah dicapai, yaitu sebesar Rp 21 miliar. Ini dapat dicapai melalui efisiensi manajemen kas dan efisiensi biaya. Kami percaya bahwa para pemegang saham seyogyanya puas dengan tingkat pengembalian investasi sebesar 13,7% dari ekuitas tahun 2012.
Laba tahunan kami berkontribusi dalam memperkuat ekuitas dan dengan permodalan yang sehat, kami sangat yakin bahwa Perseroan dapat berkembang terus di masa sekarang maupun pada masa yang akan datang. Hal ini didukung oleh model bisnis yang unik dan berfokus pada kompetensi inti serta pengalaman kuat pada kegiatan Perantara Pedagang Efek dan fasilitas pembiayaan perusahaan, dimana sementara ini kami menghindar dari usaha-usaha maupun kerjasama lainnya yang berisiko tinggi.
Sebagai catatan yang terpisah, pendapatan dari biaya Perantara Pedagang Efek telah mengalami tekanan karena ketatnya persaingan sejak industri kami masih memiliki 116 Perantara Pedagang Efek yang aktif, dimana sampai dengan saat ini belum ada kebijakan untuk mengatur tingkat biaya minimum untuk menghindari persaingan yang tidak sehat.
Kami mendorong Direksi agar terus menerus mengarahkan jalannya Perseroan sesuai situasi kondisi perekonomian terkini dengan berpegang pada prinsip kehati-hatian yang cukup konservatif dan pendekatan manajemen yang telah terbukti mampu bertahan dan berkembang, serta tetap konsisten menjaga pertumbuhan laba yang berkelanjutan.
Laporan Dewan Komisaris
Report by the Board of Commissioners
6 Laporan Tahunan Annual Report 2013 PT Panca Global Securities Tbk
PT PAnCA GLoBAL SECURiTiES Tbk
Melihat perkembangan situasi politik dalam negeri terkini Indonesia, kami optimis bahwa setelah diumumkannya hasil Pemilihan Umum Legislatif dan Presiden pada tahun 2014 ini, perekonomian jangka panjang dan prospek investasi Indonesia akan lebih cerah dengan meningkatnya aliran investasi langsung maupun tidak langsung ke Indonesia. Skenario seperti ini juga akan berpengaruh positif bagi perkembangan pasar modal di masa depan. Manajemen telah meyakinkan Dewan Komisaris bahwa mereka telah menerapkan pandangan untuk memasuki era pertumbuhan yang kuat.
Akhir kata, perusahaan tidak akan seperti sekarang tanpa dukungan nasabah yang setia, karyawan yang berdedikasi dan mitra usaha kami. Oleh karena itu, kami ucapkan rasa terima kasih dan penghargaan yang sebesar-besarnya kepada semua pemangku kepentingan untuk menjadikan Perseroan seperti sekarang. Mari kita menatap ke depan bersama-sama menuju masa depan yang lebih makmur.
Semoga Tuhan memberkati kita semua.
As we look over the horizon, we are in optimism that once the legislative and presidential elections are concluded this year, the long term economic and investment prospects for Indonesia would brighten further with more direct and indirect investment pouring into the nation. Such scenario should also bodes well for the capital market’s future. The Management has convinced the Board of Commissioners that they have set sight to ride into such strong growth era.
Finally, the Company will not be where it is now without its loyal clients, dedicated employees and support from our partners. Hence, we express our upmost gratitude and appreciation to all stakeholders for making us as who we are. Let us look ahead together towards a more prosperous future.
May the Almighty God always bless us all.
Farida Eva Riyanti Hutapea Komisaris I Commissioner
SuliantoKomisaris I Commissioner
Chengwy KarlamKomisaris Utama I President Commissioner

7PT Panca Global Securities Tbk Laporan Tahunan Annual Report 2013
Another challenging year had passed which we, as a player within the financial industry, remembered it for the economic pressure that also adversely impacted Rupiah’s exchange rate. Moreover, the reduction in fuel subsidies weakened our industrial competitiveness and contributed to the trade deficit. This also resulted in high inflation which forced interest rates to be raised. On five occassions, Bank Indonesia had to raise its benchmark rate at a total of 1.75 percentage points throughout 2013 to try to contain the current account deficit. Subsequently, Indonesia’s economic growth was subdued to 5.8%, compared with annual growth of more than 6 percent in 2010, 2011 and 2012.
Such less conducive economic climate was also reflected in the Indonesia Composite Index which started 2013 by continuing the bullish trend to peak at all time high of 5.251 level in the first half of the year before greater volatility and uncertainty stepped in to reverse the tide and plunged the index to its year’s low of 3.837 and then settled to close the year at 4.274 level from that of 4.317 as of December 2012.
Issue on the tapering off of monetary stimulus by the Fed of the United States of America created panic within the global financial market, resulting in capital outflow from emerging markets, including Indonesia. The phenomena was worsened by domestic issue on the fuel subsidy reduction coinciding during the fasting month which seasonally booked higher inflation. Consequently, Rupiah was the worst performing currency which fell 27% from December 2012 to Rp 12.270/USD 1 at the end of 2013.
Nonetheless, our bourse activities still recorded a strong equity transactions at total value of Rp 1.522 trillion in 2013, a 37% increase from that of 2012. This is the largest value transactions ever recorded by the Exchange but it was based more on selling pressure, characterized by foreign net selling of Rp 21 trillion for 2013 versus net purchase of Rp 16 trillion in 2012.
Throughout 2013, a total of Rp 115 trillion was also raised from Indonesia capital market with 74% from corporate bond issuance, 17% from rights issue and 9% from primary listing. There were 31 new listing last year, helping the market capitalization to reach Rp 4.127 trillion as end of December 2013.
Tahun 2013 yang sarat tantangan telah berlalu, dimana kita sebagai salah satu pemain dalam industri keuangan, mengenangnya karena tekanan ekonomi yang juga memberikan dampak negatif terhadap nilai tukar Rupiah. Disamping itu, pengurangan subsidi bahan bakar minyak telah melemahkan daya saing industri dan memberikan kontribusi terhadap defisit neraca perdagangan. Hal ini juga menyebabkan inflasi tinggi yang memaksa terjadinya kenaikan suku bunga pinjaman. Bank Indonesia harus menaikkan tingkat suku bunga acuan sebanyak lima kali dengan total poin persentase 1,75 sepanjang tahun 2013 untuk mencoba menahan defisit neraca transaksi berjalan. Selanjutnya, pertumbuhan ekonomi Indonesia adalah sebesar 5,8%, turun dibandingkan dengan pertumbuhan tahunan yang lebih dari 6 persen pada tahun 2010, 2011 dan 2012.
Iklim ekonomi yang kurang kondusif juga tercermin dari Index Harga Saham Gabungan Indonesia yang mulai melanjutkan tren bullish pada 2013 dan mencapai rekor tertinggi pada tingkat 5,251 pada semester pertama, sebelum volatilitas yang lebih besar dan ketidakpastian menerpa sehingga membalikkan situasi dan menjatuhkan indeks ke tingkat paling rendah menjadi 3,837 dan kemudian menutup IHSG tahun 2013 pada tingkat 4,274. Turun sedikit dibandingkan dengan Desember 2012 pada tingkat 4,317.
Masalah penerapan stimulus moneter oleh The Fed dari Amerika Serikat yang membuat panik pasar keuangan global telah mengakibatkan keluarnya modal dari pasar modal negara berkembang, termasuk indonesia. Fenomena itu diperburuk lagi oleh masalah domestik atas pengurangan subsidi bbm yang waktunya bertepatan selama bulan puasa sehingga membuat inflasi menjadi lebih tinggi. Akibatnya, Rupiah menjadi mata uang dengan kinerja nilai tukar yang terburuk dan mengalami penurunan nilai sebesar 27% dari Desember tahun 2012, yaitu melemah menjadi Rp 12,270/USD pada akhir 2013.
Meskipun demikian, kegiatan transaksi bursa efek masih mencatatkan transaksi ekuitas yang cukup kuat dengan total nilai transaksi sebesar Rp 1,522 triliun pada tahun 2013, meningkat 37% dari tahun 2012. Ini adalah total nilai transaksi terbesar yang pernah tercatat oleh Bursa Efek Indonesia, tetapi hal ini lebih didasarkan pada tekanan jual, yaitu ditandai dengan penjualan bersih asing sebesar 21 triliun untuk tahun 2013 dibandingkan pembelian bersih asing sebesar Rp 16 triliun pada tahun 2012.
Sepanjang tahun 2013, dana sejumlah Rp115 triliun telah diraih dari pasar modal Indonesia melalui instrumen sebagai berikut; 74% dari penerbitan obligasi korporasi, 17% dari Hak Memesan Efek Terlebih Dahulu dan 9% dari penawaran perdana. Ada 31 perusahaan tercatat baru tahun lalu, membantu meningkatkan kapitalisasi pasar sehingga mencapai Rp 4,127 triliun pada akhir Desember 2013.
Laporan Direksi
Report by the Board of Directors

8 Laporan Tahunan Annual Report 2013 PT Panca Global Securities Tbk
Sepanjang tahun 2013 yang penuh tantangan di pasar modal domestik, Perseroan telah berhasil mengelola Rasio Imbal Hasil Ekuitas yang cukup mengesankan, yaitu sebesar 13,7% dari ekuitas tahun 2012 sejumlah Rp 160 miliar. Hal ini berasal dari pertumbuhan laba bersih tahun 2013 yang mencapai dua digit yaitu sebesar 11,5% bila dibandingkan dengan tahun 2012 dan mencatatkan laba bersih sejumlah Rp 21,9 miliar yang merupakan rekor tertinggi pencatatan laba bersih sepanjang sejarah berdirinya Perseroan. Hal Tersebut didukung oleh Pendapatan lain-lain Perseroan yang tumbuh sebesar 36,5% dari tahun 2012 menjadi Rp 9,2 miliar yang mana dapat menutupi penurunan laba operasi Perseroan sebesar 8,8%, yaitu Rp 14,6 miliar pada tahun ini. Dalam situasi dan kondisi usaha sepanjang tahun 2013, Perseroan menekankan pada pengelolaan manajemen kas yang solid untuk memastikan bahwa tingkat pengembalian investasi cukup tinggi dan dapat memberikan kontribusi yang signifikan terhadap profitabilitas Perseroan. Sebagai konsekuensinya ekuitas Perseroan menjadi lebih kuat dan meningkat menjadi Rp 175 miliar pada akhir 2013.
Pendapatan Perusahaan menurun 20% dibanding tahun lalu menjadi Rp 24 miliar karena lemahnya pendapatan komisi perdagangan efek dan pendapatan bunga dari fasilitas pembiayaan margin, namun diimbangi dengan realisasi keuntungan yang lebih besar dari investasi surat berharga. Yang mengesankan adalah kemampuan Perseroan untuk memastikan bahwa efisiensi operasional dapat terwujud untuk mencatatkan marjin operasi menjadi 61%, yang merupakan peningkatan efesiensi biaya dari 53% pada tahun 2012.
Otoritas Jasa Keuangan (OJK)secara efektif akan dimulai tahun 2014 setelah proses transisi konsolidasi antara Bapepam-LK maupun Bank Indonesia pada tahun lalu. Berbagai kebijakan baru telah ditetapkan. Salah satu yang menjadi perhatian kami adalah biaya pungutan yang dikenakan pada anggota bursa dan bagaimana hal itu bisa memberi dampak negatif terhadap keuntungan Perseroan. Selain itu, Bursa Efek Indonesia juga berencana untuk mendirikan lembaga baru dengan nama PT. Penyelenggara Program Perlindungan Investor Efek Indonesia (P3IEI). Hal ini dapat meningkatkan kepercayaan dan kredibilitas bagi nasabah, namun persyaratan pemenuhan modalnya akan bersumber dari perantara pedagang efek, yang tentunya akan membebani Perseroan lebih lanjut.
Mulai 6 januari 2014, Bursa Efek Indonesia juga telah merevisi fraksi per lot saham menjadi 100 saham dari sebelumnya 500 saham serta diperkecilnya pengelompokan fraksi harga. Bursa Efek Indonesia berharap bahwa perubahan-perubahan tersebut dapat menarik lebih banyak lagi investor ritel ke pasar modal karena jumlah investasi yang dibutuhkan menjadi lebih terjangkau. Waktu yang akan menjawab apakah tindakan perubahan lot dan fraksi harga tersebut akan memberikan jumlah frekuensi dan nilai transaksi yang lebih besar di masa depan.
During the challenging domestic capital market landscape of 2013, the Company still managed an impressive Return of Equity of 13.7% from our 2012 equity of Rp 160 billion. This is derived from our remarkable double-digits net income growth of 11.5% yoy to Rp 21.9 billion, a record profit in the Company’s history. This is supported by our other incomes which had grown 36.5% yoy to Rp 9.2 billion which more than offset the slightly weaker operating profit by 8.8% yoy to Rp 14.6 billion. The Company’s emphasis on solid cash management ensured that our yield are high and contributed significantly to our profitability. Consequently, our equity base is strengthened to Rp 175 billion by the end of 2013.
The Company’s 2013 revenue dropped 20% yoy to Rp 24 billion due to across the board weakness in brokerage fee and interest income from margin trading, which were partially offset by greater realized gain on marketable securities. What is remarkable is the Company’s ability to be nimble in ensuring that operational efficiency can be realized to book an operating margin of 61%, which is a respectable improvement from 53% in 2012.
The Financial Service Authority (Otoritas Jasa Keuangan or “OJK”) effectively commences this 2014 after the transition process in consolidating both the Bapepam-LK as well as Bank Indonesia last year. Various policies are to be in placed. One which is the most concern to us is the fee imposed on the members of the Exchange and how it could negatively affect our profitability. Additionally, the Exchange is also planning to establish an investor protection institution with the name of PT. Penyelenggara Program Perlindungan Investor Efek Indonesia (P3IEI). This should enhance the confidence and credibility for investors. However, the capital requirement is planned to source from the brokers, which will burden us further.
Starting from 6th January 2014, Indonesia Stock Exchange has also revised down the share fraction of per lot into 100 shares from 500 shares previously as well as the grouping of the price fraction. The Exchange hopes that such changes can capture more retail investors into the capital market since investment can become more affordable. Time will tell whether such action will result in greater transactions.

9PT Panca Global Securities Tbk Laporan Tahunan Annual Report 2013
PT PAnCA GLoBAL SECURiTiES Tbk
Hendra H. KustarjoDirektur Utama President Director
Trisno LimantoDirektur Director
Theresia Yolanda MangundapDirektur Director
Particularly for 2014, we believe that the capital market will monitor intesively and track with the progress of the general legislative and presidential elections. There is optimism that the new government could carry the nation into a new era of prosperities. Externally, the interest rate movement by major central banks of the world, the tapering process of the Fed of the United States of America and condition of China’s economy would also affect our domestic capital market performance.
Last but not least, the Board of Directors would like to sincerely express our greatest acknowledgement and appreciation to all of our Stakeholders in realizing the Company to what it is today. Throughout the year of 2013, we had received the trust, support and loyalty of our valued customers and staffs. Moreover, the guidance and direction of our Shareholders and the Board of Commissioners throughout the challenging year of 2013 had also helped the management team in winning the trust and confidence of employees, clients and partners. Thanks to our valued Stakeholders, we believe that the Company will have an even brighter prospect going forward.
Khususnya untuk 2014, kami percaya bahwa para pelaku pasar modal akan memantau secara intensif dan mengikuti perkembangan pemilihan umum legislatif dan Presiden secara seksama. Optimisme bahwa terpilihnya pemerintahan baru bisa membawa rakyat Indonesia menuju era kemakmuran baru. Pengaruh eksternal, pergerakan suku bunga oleh bank sentral utama dunia, progres stimulus The Fed Amerika Serikat dan perkembangan kondisi ekonomi Republik Rakyat Tiongkok juga akan mempengaruhi kinerja pasar modal dalam negeri.
Pada akhirnya, Direksi Perseroan ingin menyampaikan penghargaan dan apresiasi yang sebesar-besarnya untuk semua pemangku kepentingan yang menjadikan Perseroan seperti sekarang ini. Sepanjang tahun 2013, kami telah mendapatkan kepercayaan, dukungan, dan kesetiaan dari seluruh nasabah dan staff Perseroan. Selain itu, bimbingan dan arahan Pemegang Saham serta Dewan Komisaris selama tahun yang menantang di 2013 juga membantu manajemen dalam memperoleh kepercayaan dan keyakinan dari para pegawai, nasabah, dan rekanan Perseroan. Berkat dukungan dari para pemangku kepentingan, kami yakin Perseroan akan memiliki prospek ke depan yang lebih cerah.
10 Laporan Tahunan Annual Report 2013 PT Panca Global Securities Tbk
Laporan Pertanggungjawaban Tahunan Komite Audit
Annual Compliance Statement Audit Committee
Date : 20 March 2014To : Board of Commissioner PT Panca Global Securities TbkPeriod : 1 January – 31 December 2013
In accordance with the Audit Committee Terms of Reference as stipulated, the Audit Committee met 4(four) times during the year ended 31 December 2012. Audit committee help the board of commissioners in running function the supervision by carrying out research on integrity financial report; risk management and internal control ; adherence to the legal and legislation; performance, qualifications and insdependency auditor external; and implementation of the internal audit. Audit committee coördinate duty closely with unit internal audit and auditor external.
We have carried out our duty in the above period in accordance with the Charter of the Audit Committee as follows:• Analysis and assessment reports monthly, quarterly
and annual financial statements of the company.• Review process of risk management and internal
control.• Corporate compliance Review of the regulations
in force and the application of Good corporate governance
• Review terms of reference the selection requirements of public accountant (KAP).
• Review Audit reports and Audit results public accountant.
• Examines the findings of the KAP and its relevance as well as follow-ups.
• Meetings of the Audit Committee.• Other activities such as reporting and the tasks
assigned by the Board of Commissioners.
Signed today by all members audit committee.
Tanggal : 20 Maret 2014Kepada : Dewan Komisaris PT Panca Global Securities TbkPeriode : 1 Januari – 31 Desember 2013
Sesuai dengan Piagam Komite Audit PT Panca Global Securities Tbk, Komite Audit telah melakukan 4 (empat) kali Rapat Komite Audit untuk tahun yang berakhir pada tanggal 31 Desember 2013. Komite Audit membantu Dewan Komisaris dalam menjalankan fungsi kepengawasannya dengan melaksanakan kajian atas integritas laporan keuangan; manajemen risiko dan pengendalian internal; kepatuhan terhadap ketentuan hukum dan perundang-undangan; kinerja, kualifikasi dan independensi auditor eksternal; dan implementasi dari fungsi audit internal. Komite Audit mengkoordinasikan tugasnya secara erat dengan Unit Internal Audit dan Auditor Eksternal.
Kami telah melaksanakan tugas kami dalam periode diatas sesuai dengan Piagam Komite Audit sebagai berikut :• Analisa dan pengkajian laporan bulanan, triwulanan
dan laporan keuangan tahunan perusahaan.• Review Proses Manajemen Resiko dan Pengendalian
Intern.• Review kepatuhan perusahaan terhadap peraturan
perundang-undangan yang berlaku dan penerapan Tata Kelola Perusahaan Yang Baik (Good Corporate Governance)
• Review kerangka Acuan (Term of Reference) persyaratan seleksi Kantor Akuntan Publik (KAP).
• Review pelaksanaan Audit dan Laporan Hasil Audit Kantor Akuntan Publik.
• Mengkaji temuan KAP dan relevansinya serta tindak lanjutnya.
• Rapat Komite Audit.• Kegiatan lain seperti pelaporan dan tugas-tugas yang
ditugaskan oleh Dewan Komisaris.
Ditandatangani pada hari ini, oleh seluruh Anggota Komite Audit.
PT PANCA GLOBAL SECURITIES Tbk
Chengwy KarlamKetua Komite Audit Head of Audit Committee
Arriany SimajuntakAnggota Member
Unikasari SetioAnggota Member

11PT Panca Global Securities Tbk Laporan Tahunan Annual Report 2013
Akuntan Publik
Public Accountant
Kantor Akuntan Publik Doli, Bambang, Sulistyanto, Dadang & Ali
Menara Kuningan 11th Floor
Jl. HR. Rasuna Said Blok X-7 Kav. 5
Jakarta 12940
Biro Administrasi Efek
Share Registrar
PT. Blue Chip Mulia
Gedung Bina Mulia I Lt. 4
Jl. HR. Rasuna Said Kav. 10
Jakarta 12950
Nama Name PT. Panca Global Securities Tbk.
Kantor Pusat Head Office Indonesia Stock Exchange, Tower I Suite 1706A
Jl. Jend. Sudirman Kav. 52-53, Jakarta 12190
Telepon Telephone (62 21) 515 5456
Faksimili Facsimile (62 21) 515 5466
Email Email [email protected]
Kegiatan Usaha
Lines of Business
Perantara Pedagang Efek I Brokerage
Penjamin Emisi Efek I Underwriting
Anak Perusahaan
Subsidiary Company
PT PG Aset Management
Gedung Bursa Efek Indonesia Tower I Lantai 17 Suite 1707
Jl. Jend. Sudirman Kav. 52-53, Jakarta 12190
Profil Perusahaan
Company’s Profile
Lembaga dan / atau Profesi Penunjang Pasar Modal The Institutional and / or Profession of Supporting the Capital Market
Perusahaan telah menunjuk auditor eksternal Kantor Akuntan Publik Doli, Bambang, Sulistiyanto, Dadang & Ali. Untuk melakukan Review Laporan Keuangan untuk Tahun Buku 2013 yang merupakan Kantor Akuntan Publik (KAP) yang terdaftar di Bapepam-LK. Total biaya yang dikeluarkan untuk audit Laporan Keuangan Konsolidasi tahun 2013 adalah sebesar Rp. 36.300.000(termasuk OPE dan PPN). Kantor Akuntan Publik Doli, Bambang, Sulistyanto, Dadang & Ali menjadi auditor Perusahaan sejak tahun buku 2012. KAP tersebut telah menyelesaikan tugasnya secara independent sesuai standar professional akuntan publik, perjanjian kerja serta ruang lingkup yang telah ditetapkan. Kantor Akuntan Doli, Bambang, Sulistyanto, Dadang & Ali tidak memberikan jasa konsultasi lainnya kepada PT Panca Global Securities Tbk. Akuntan yang menandatangani Laporan Auditor Independen Tahun Buku 2013 adalah Drs. Bambang Hariadi, M. Ec., CPA.
The company has appointed external auditor, public accounting firm Doli, Bambang, Sulistiyanto, Dadang & Ali. To do a Review of the Financial Statements for period ended 2013 which is a public accountant listed on the Bapepam-LK. Total costs incurred for the audit of consolidated Financial Statement 2013 is Rp 36.300.000 (including OPE and VAT). Public Accountant Doli, Bambang, Sulistyanto, Dadang & Ali became the company’s auditor since the period ended 2012. The Public Accountant has completed its work for the independent Public Accountant professional standards, as well as the scope of work agreement. Public Accountant Doli, Bambang, Sulistyanto, Dadang & Ali did not give any other consultation services to PT Panca Global Securities Tbk. Accountant who signed the Independent Auditor’s report for the period ended 2013 is Drs. Bambang Hariadi, M. Ec., CPA.
12 Laporan Tahunan Annual Report 2013 PT Panca Global Securities Tbk
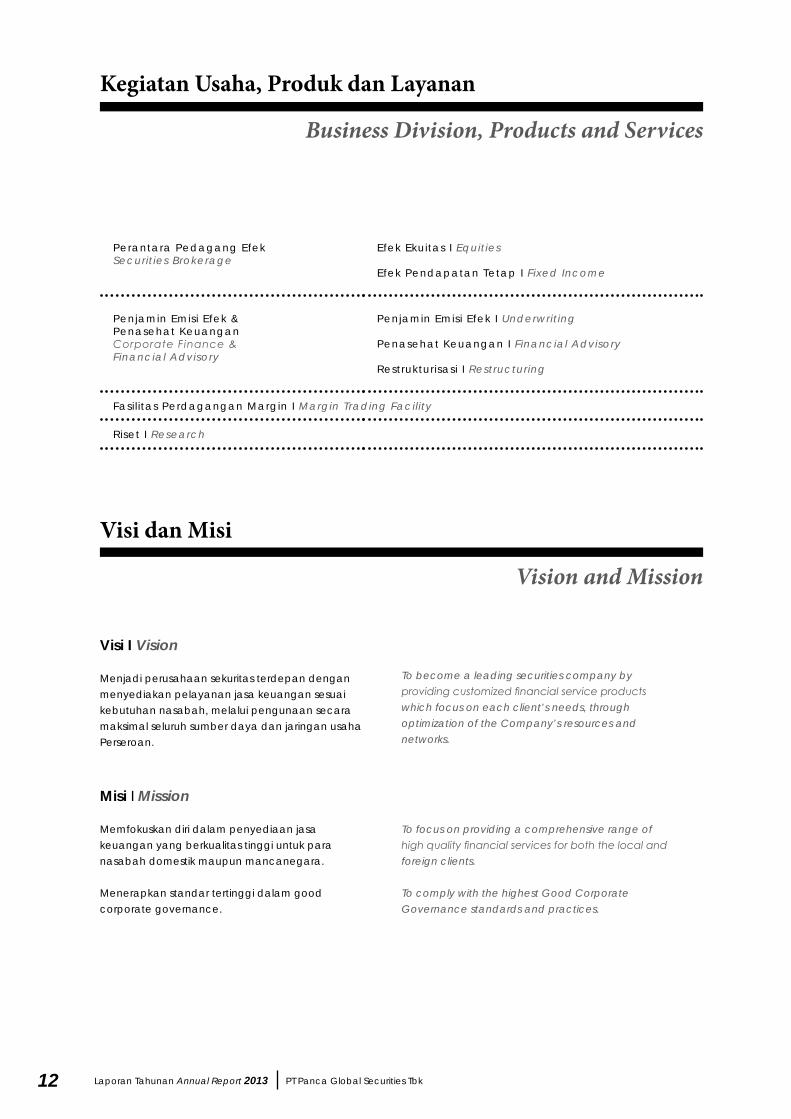
Visi i Vision
Menjadi perusahaan sekuritas terdepan dengan menyediakan pelayanan jasa keuangan sesuai kebutuhan nasabah, melalui pengunaan secara maksimal seluruh sumber daya dan jaringan usaha Perseroan.
Kegiatan Usaha, Produk dan Layanan
Business Division, Products and Services
Perantara Pedagang EfekSecurities Brokerage
Efek Ekuitas I Equities
Efek Pendapatan Tetap I Fixed Income
Penjamin Emisi Efek &Penasehat KeuanganCorporate Finance &Financial Advisory
Penjamin Emisi Efek I Underwriting
Penasehat Keuangan I Financial Advisory
Restrukturisasi I Restructuring
Fasil itas Perdagangan Margin I Margin Trading Facility
Riset I Research
Misi I Mission
Memfokuskan diri dalam penyediaan jasa keuangan yang berkualitas tinggi untuk para nasabah domestik maupun mancanegara.
Menerapkan standar tertinggi dalam good corporate governance.
Visi dan Misi
Vision and Mission
To become a leading securities company by providing customized financial service products which focus on each client’s needs, through optimization of the Company’s resources and networks.
To focus on providing a comprehensive range of high quality financial services for both the local and foreign clients.
To comply with the highest Good Corporate Governance standards and practices.
13PT Panca Global Securities Tbk Laporan Tahunan Annual Report 2013
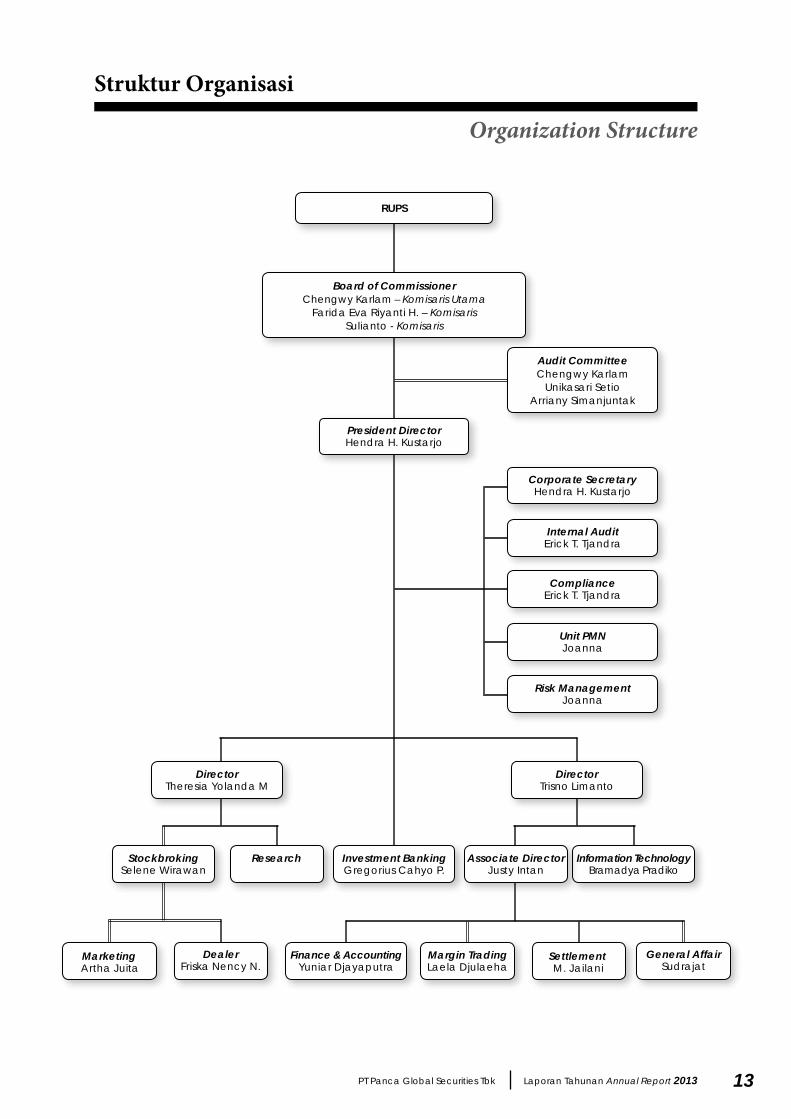
Board of CommissionerChengwy Karlam – Komisaris Utama
Farida Eva Riyanti H. – KomisarisSulianto - Komisaris
President DirectorHendra H. Kustarjo
Audit CommitteeChengwy Karlam
Unikasari SetioArriany Simanjuntak
Corporate SecretaryHendra H. Kustarjo
Internal AuditErick T. Tjandra
DirectorTheresia Yolanda M
DirectorTrisno Limanto
Investment BankingGregorius Cahyo P.
RUPS
ComplianceErick T. Tjandra
Unit PMNJoanna
StockbrokingSelene Wirawan
Research
DealerFriska Nency N.
MarketingArtha Juita
Finance & AccountingYuniar Djayaputra
Margin TradingLaela Djulaeha
SettlementM. Jailani
General AffairSudrajat
Risk ManagementJoanna
Information TechnologyBramadya Pradiko
Associate DirectorJusty Intan
Struktur Organisasi
Organization Structure
14 Laporan Tahunan Annual Report 2013 PT Panca Global Securities Tbk
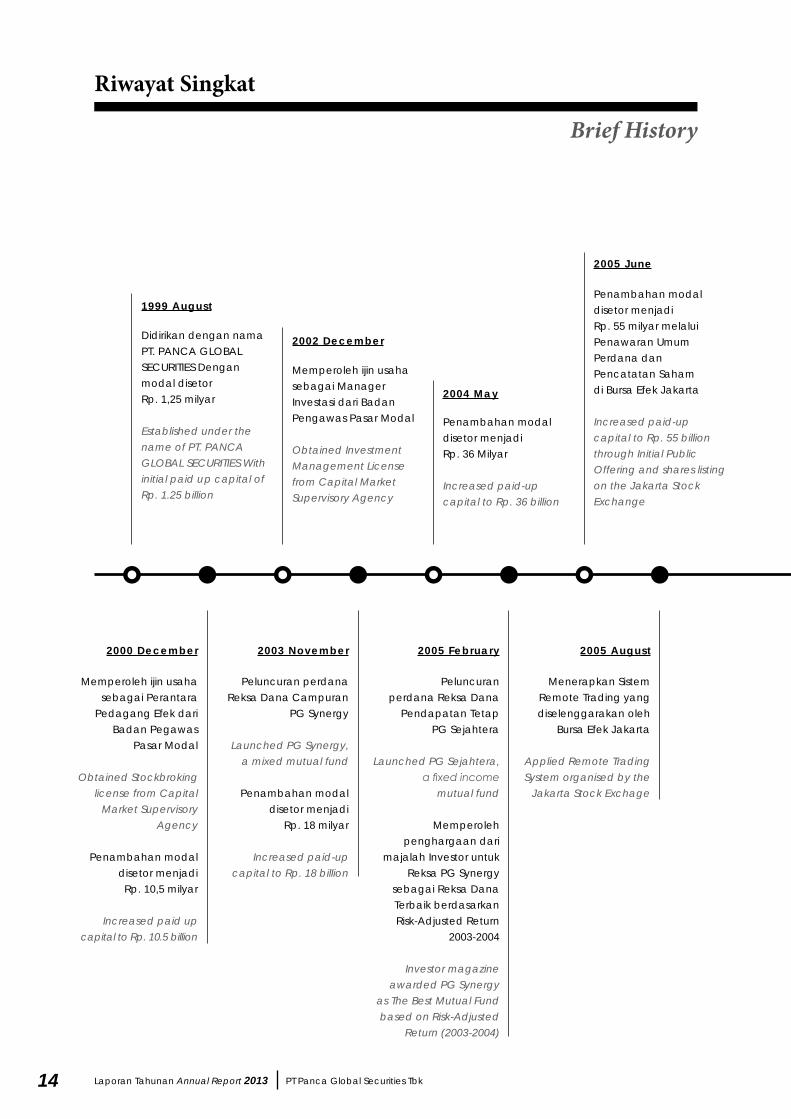
Riwayat Singkat
Brief History
Memperoleh ijin usaha sebagai Perantara
Pedagang Efek dari Badan Pegawas
Pasar Modal
Obtained Stockbroking license from Capital
Market Supervisory Agency
Penambahan modal disetor menjadiRp. 10,5 milyar
Increased paid up capital to Rp. 10.5 billion
Peluncuranperdana Reksa Dana
Pendapatan TetapPG Sejahtera
Launched PG Sejahtera, a fixed income
mutual fund
Memperoleh penghargaan dari
majalah Investor untuk Reksa PG Synergy
sebagai Reksa Dana Terbaik berdasarkan Risk-Adjusted Return
2003-2004
Investor magazine awarded PG Synergy
as The Best Mutual Fund based on Risk-Adjusted
Return (2003-2004)
Peluncuran perdana Reksa Dana Campuran
PG Synergy
Launched PG Synergy, a mixed mutual fund
Penambahan modal disetor menjadi
Rp. 18 milyar
Increased paid-up capital to Rp. 18 billion
Menerapkan Sistem Remote Trading yang diselenggarakan oleh
Bursa Efek Jakarta
Applied Remote Trading System organised by the
Jakarta Stock Exchage
2000 December 2005 February2003 november 2005 August
Didirikan dengan nama PT. PANCA GLOBAL SECURITIES Dengan modal disetorRp. 1,25 milyar
Established under the name of PT. PANCA GLOBAL SECURITIES With initial paid up capital of Rp. 1.25 billion
1999 August
Penambahan modal disetor menjadiRp. 36 Milyar
Increased paid-up capital to Rp. 36 billion
2004 May
Penambahan modal disetor menjadiRp. 55 milyar melalui Penawaran Umum Perdana dan Pencatatan Sahamdi Bursa Efek Jakarta
Increased paid-up capital to Rp. 55 billion through Initial Public Offering and shares listing on the Jakarta Stock Exchange
2005 June
Memperoleh ijin usaha sebagai Manager Investasi dari Badan Pengawas Pasar Modal
Obtained Investment Management License from Capital Market Supervisory Agency
2002 December

15PT Panca Global Securities Tbk Laporan Tahunan Annual Report 2013
Penambahan modal disetor menjadiRp. 55,1 Milyar melalui pelaksanaan waran
Paid-up capital increased toRp. 55.1 billion through warrants exercise
Penambahan modal disetor menjadiRp. 70,8 Milyar melalui pembagian saham bonus
Paid-up capital rincreased to Rp. 70.8 billion through bonus shares distribution
Pendirian anak perusahaan, PT PG Asset Management dalam rangka spin-off sebagaimana dipersyaratkan oleh Badan Pengawas asar Modal
Establishment of PT PG Asset Management in relation with spin-off as required by Capital Market Supervisory Agency
Penambahan modal disetor menjadiRp. 61,3 Milyar melalui pelaksanaan waran
Paid-up capital increased toRp. 61.3 billion through warrants exersice
Membangun Sistem Perdagangan Online
Developed an Inhouse OnlineTrading Platform
2007 2011 2009
Memperoleh izin usaha sebagai Penjamin Emisi Efek dari Badan Pengawas Pasar Modal
Obtained Underwriting License from Capital Market Supervisory Agency
2005 September
Penambahan modal disetor menjadi Rp. 67,5 Milyar melalui pelaksanaan waran
Paid-up capital increased to Rp. 67.5 billion through warrants exersice
Peluncuran PGSolid – Sistem Perdagangan Online. Launching21 Juni 2010
Launching PGSolid – On-line Trading System. Launched on 21st June 2010
2010
Pengembalian Ijin Manajer Investasi Perseroan kepada Bapepam-LK sebagaimana dipersyaratkan dalam rangka spin-off kepada anak perusahaan
Returned Investment Management license in relation with spin-off business activity as required by Capital Market Supervisory Agency to affiliate company
PT PG Asset Management memperoleh IjinManajer Investasi dariBapepam-LK
PT PG Asset Management obtained Investment Management license from Capital Market Supervisory Agency
2012
Penambahan modal disetor menjadiRp. 58,9 Milyar melalui pelaksanaan waran
Paid-up capital became Rp. 58.9 billion through warrants exercise
2008

16 Laporan Tahunan Annual Report 2013 PT Panca Global Securities Tbk
Profil Dewan Komisaris
Profile of the Board of Commissioners
Warga Negara Indonesia, lahir di Makassar tahun 1970. Lulus dari Sarjana Perdagangan dan Sarjana Kesenian dari Curtin University-Australia. Memulai karir pada tahun 1995 – 1997 sebagai Direktur PT Diana Indonesia. Tahun 1997 – 2001 sebagai Head of Research PT Panin Sekuritas Tbk. Tahun 2001 – 2003 sebagai Institutional Research Analyst PT G.K. Goh Indonesia. Tahun 2003 – sekarang sebagai Pendiri Yayasan Pendidikan Global. Tahun 2003 – 2005 sebagai Fund Manager Perseroan. Tahun 2005 – 2006 sebagai Consultant to the Special Staff of the Coordinating Minister for Economic Affairs untuk The World Bank. Tahun 2004 – 2009 sebagai Direktur PT Independent Research & Advisory Indonesia. Sejak Juni 2010 – Sekarang sebagai Komisaris Utama Perseroan. Sejak Juni 2010 - sekarang sebagai Ketua Komite Audit Perseroan.
Warga Negara Indonesia, lahir di Jambi tahun 1965. Lulus dari Fakultas Ekonomi Jurusan Akuntansi, Universitas Tarumanagara tahun 1988. Memulai karir pada tahun 1986 – 1987 sebagai Auditor di Kantor Akuntan Johan, Malonda & Rekan. Tahun 1988 – 1989 sebagai Auditor di Kantor Akuntan Hanadi Soedjendro. Tahun 1989 – 1990 sebagai Chief Accounting di PT. Satwika Permai Indah dan PT. Delta Buana Experindo. Tahun 1990 – 1992 sebagai Direktur Utama PT. BPR Multijaya Artaprima. Tahun 1993 – 1994 sebagai Direktur Utama di PT. BPR Artamas Mitra Sejati. Tahun 1995 – 1997 sebagai Direktur Utama PT. Putra Swareka Perdana. Tahun 1997 – 2002 sebagai Direktur Marketing PT. Putra Saridaya Persada. Pada Januari 2002 – Juni 2002 sebagai Investment Banking PT. Mandiri Sekuritas. Pada Juli 2002 – April 2003 sebagai Direktur Utama PT. Jakarta Artha Visi Abadi Securities. Pada Juni 2003 – Juli 2004 sebagai Komisaris Utama Prudence Asset Management. Pada September 2004 – sekarang sebagai Komisaris Perseroan.
Pengangkatan Dewan Komisaris sesuai dengan Akta No. : 56, tanggal 14 Desember 2011 yang dibuat oleh Notaris Fathiah Helmi, SH di Jakarta.
Indonesian citizen, born in Makassar in 1970. Bachelor of Commerce and Bachelor of Arts from Curtin University – Australia. Began his career in 1995 to 1997 as Director of PT. Diana Indonesia. In 1997 to 2001 as Head of Research of PT. Panin Sekuritas Tbk. In 2001 to 2003 as Institutional Research Analyst for PT. G.K.Goh Indonesia. From 2003 till now, as founder of Yayasan Pendidikan Global. In 2003 to 2005, as Fund Manager of the Company. In 2005 to 2006, as Consultant to the Special Staff of the Coordinating Minister for Economic Affairs on behalf of The World Bank. In 2004 to 2009, as Director of PT. Independent Research & Advisory Indonesia. Since June 2010 to present, as President Commissioner of The Company. Since June 2010 till now, as the Head of Audit Committee of the Company.
Indonesian citizen, born in Jambi in 1965. Graduated in Economics from Tarumanegara University in 1988. Began his career in 1986 to 1987, as Auditor in Johan Malonda & Rekan Public Accountant. In 1988 to 1989 as Auditor in Hanadi Soedjendro Public Accountant. In 1989 to 1990 as Chief Accountant of PT. Satwika Permai Indah and PT. Delta Buana Experindo, In 1990 to 1992, as President Director of PT. BPR Multijaya Artaprima. In 1993 to 1994, as President Director of PT. BPR Artamas Mitra Sejati. In 1995 to 1997 as President Director of PT. Putra Swareka Perdana. In 1997 to 2002, as Marketing Director of PT. Putra Saridaya Persada. In January 2002 to June 2002, as Investment Banker of PT. Mandiri Sekuritas. In July 2002 to April 2003, as President Director of PT. Jakarta Artha Visi Abadi Securities. In June 2003 to July 2004, as President Commissioner of Prudence Asset Management. In September 2004 till present, as Commissioner of the Company.
The assignation of the Board of Commissioners in accordance with a deed no. : 56, 14 December 2011 made by Notary Fathiah Helmi, SH in Jakarta.
Warga Negara Indonesia, lahir di Jakarta tahun 1949. Lulus dari Fakultas Ekonomi Jurusan Akuntansi, Universitas Indonesia tahun 1974. Memulai karir pada tahun 1973 – 1976 sebagai Accountant Intern, Accounting System & Procedure Manager PT. United Tractors Tbk, Tahun 1976 – 1982 sebagai Audit Manager Drs, Siddharta & Co. Tahun 1982-1989 sebagai Direktur Salim Group. Tahun 1989 – 1993 sebagai Executive Director Salim Group. Tahun 1993 – 1999 sebagai Senior Executive Director Salim Group. Tahun 1999 – 2004 sebagai Presiden Direktur & CEO PT. Indofood Sukses Makmur Tbk. Tahun 2004 – 2007 sebagai Komisaris Independen PT Indosat Tbk. Tahun 2004 – Sekarang sebagai Presiden Direktur PT. Usaha Kita Makmur Indonesia. Tahun 2009 – Sekarang sebagai Komisaris PT Daya Makara UI. Tahun 2010 – Sekarang sebagai Komisaris Perseroan.
Indonesian citizen, born in Jakarta in 1949. Graduated in Economics from University of Indonesia in 1974. Began her career in 1973 to 1976 as Intern Accountant , then as Accounting System & Procedure Manager of PT. United Tractors Tbk. In 1976 to 1982, as Audit Manager of Drs. Siddharta & Co. In 1982 to 1989, as Director of Salim Group. In 1989 to 1993, as Executive Director of Salim Group. In 1993 to 1999, as Senior Executive Director of Salim Group. In 1999 to 2004, as President Director & CEO of PT. Indofood Sukses Makmur Tbk. In 2004 to 2007 as Independent Commissioner of PT. Indosat Tbk. In 2004 till now, as President Director of PT. Usaha Kita Makmur Indonesia. In 2009 till now as Commissioner of PT. Daya Makara UI. In 2010 till now as Commissioner of the Company.
Chengwy Karlam - Komisaris Utama / President Commissioner
Farida Eva Riyanti Hutapea - Komisaris / Commissioner
Sulianto - Komisaris / Commissioner
17PT Panca Global Securities Tbk Laporan Tahunan Annual Report 2013
Warga Negara Indonesia, lahir di Bogor tahun 1964. Lulus dari Universitas Trisakti, Fakultas Ekonomi Jurusan Akuntansi pada tahun 1990. Memulai karirnya pada tahun 1987 – 1989 sebagai Auditor di Kantor Akuntan Publik Johan, Malonda & Rekan (Koresponden Ernst & Whinney) Jakarta. Tahun 1989 – 1990 di Kantor Akuntan Publik Drs Hadi Sutanto (Koresponden Price Waterhouse). Tahun 1990 – 1992 sebagai Head of Operation Department PT. Nomura Indonesia. Tahun 1992 – 1995 sebagai Head of Capital Market & Corporate Finance Department PT. Nomura Indonesia. Tahun 1995 – 2001 berkarir di PT. Panin Sekuritas Tbk dengan jabatan terakhir sebagai Vice President Director. Tahun 2001- 2002 sebagai Senior Advisor Investment Banking PT. Kresna Graha Sekurindo Tbk. Tahun 2002- 2004 sebagai Presiden Komisaris PT Emperor Finance Indonesia Tbk. Pada tahun 2002 – 2004 sebagai Presiden Komisaris Perseroan dan sejak bulan Mei 2004 - sekarang menjadi Direktur Utama Perseroan. Pada tahun 2003 – 2005 sebagai anggota Komite Pengembangan Usaha PT Bursa Efek Jakarta. Pada Oktober 2004 – sekarang merangkap jabatan sebagai Sekretaris Perseroan. Jabatan lainnya sejak tahun 2003 – Sekarang menjadi Anggota Departemen Penjamin Emisi dari Asosiasi Perusahaan Efek Indonesia. Sejak bulan September 2013 sampai dengan sekarang sebagai Anggota Komite Disiplin Anggota PT Bursa Efek Indonesia.
Warga Negara Indonesia, lahir di Makassar tahun 1966. Selain kursus – kursus di bidang Pasar Modal juga memperoleh gelar Master of Business Administration dari European University, Antwerp, Belgia pada tahun 1989. Memulai karirnya di bidang pasar modal pada tahun 1990 – 1992 sebagai Research Analyst PT. Multicor. Tahun 1993 – 1996 sebagai Head of Research PT. Nomura Indonesia. Tahun 1996 – 2000 sebagai Head of Sales & Trading PT. Panin Sekuritas Tbk. Tahun 2000 – 2004 sebagai Direktur Utama Perseroan. Sejak bulan Mei 2004 hingga sekarang sebagai Direktur Perseroan.
Warga Negara Indonesia, lahir di Manado tahun 1972. Memperoleh gelar Sarjana Ekonomi dari Sekolah Tinggi Ilmu Keuangan dan Perbankan Indonesia (STEKPI) Jurusan Ekonomi, Keuangan dan Perbankan. Memulai karir di Pasar Modal sejak tahun 1995 – 1996 sebagai Staff Finance & Accounting PT. Panin Sekuritas Tbk. Tahun 1996 – 2000 sebagai Equity Sales PT. Panin Sekuritas Tbk. Tahun 2000 – 2001 sebagai Equity Manager di Perseroan. Sejak tahun 2001 – sekarang sebagai Direktur Perseroan.
Pengangkatan Direksi sesuai dengan Akta No. : 32, tanggal 14 Mei 2009, yang dibuat oleh Notaris Fathiah Helmi, SH di Jakarta.
Indonesian Citizen, born in Bogor in 1964. Graduated in Economics from Trisakti University Jakarta in 1990. Began his career in 1987 to 1989 as Auditor in Public Accountant Firm Johan, Malonda & Rekan (Correspondent of Ernst & Whinney) in Jakarta. In 1989 to 1990 in as Public Accountant Firm for Drs. Hadi Sutanto (Correspondent of Price WaterHouse). In 1990 to 1992 as Head of Operation Department of PT. Nomura Indonesia. In 1992 to 1995 as Head of Capital Market & Corporate Finance Department of PT. Nomura Indonesia. In 1995 to 2001 worked in PT. Panin Sekuritas Tbk. with last position as Vice President Director. In 2001 to 2002 as Senior Advisor of Investment Banking for PT. Kresna Graha Sekurindo T b k . I n 2 0 0 2 t o 2 0 0 4 a s P r e s i d e n t C o m m i s s i o n e r o f PT. Emperor Finance Indonesia Tbk. In 2002 to 2004 as President Commissioner of PT. Panca Global Securities and since May 2004 to present as President Director of PT. Panca Global Securities Tbk. Since October 2004 to present as Corporate Secretary of PT. Panca Global Securities Tbk. Since 2003 to 2005 as member of Business Development Committee of The Jakarta Stock Exchange. Since 2003 to present as Member of Underwriting Department for the Association of Indonesian Securities Companies. Since September 2013 to present as Member of Membership Discipline Commitee PT Bursa Efek Indonesia.
Indonesian Citizen, born in Makassar in 1966. Graduated with Master of Business Administration from European University, Antwerp, Belgium in 1989. Began his career in 1990 to 1992 as Research Analyst for PT. Multicor. In 1993 to 1996 as Head of Research of PT. Nomura Indonesia. In 1996 to 2000 as Head of Sales and Trading for PT. Panin Sekuritas Tbk. In 2000 to 2004 as President Director in PT. Panca Global Securities Tbk. Since May 2004 to present as Director of PT. Panca Global Securities Tbk.
Indonesian Citizen, born in Manado in 1972. Graduated in Economics, Finance and Banking from STEKPI (Sekolah Tinggi Ilmu Keuangan dan Perbankan Indonesia). Began her career in 1995 to 1996 as Finance and Accounting Staff of PT. Panin Sekuritas Tbk. In 1996 to 2000 as Equity Sales of PT. Panin Sekuritas Tbk. In 2000 to 2001 as Equity Manager in PT. Panca Global Securities. Since 2001 to present as Director of PT. Panca Global Securities Tbk.
The assignation of the Board of Directors in accordance with a deed no. : 32, 14 May 2009 made by Notary Fathiah Helmi, SH in Jakarta.
Profil Direksi
Profile of the Board of Directors
Hendra H. Kustarjo - Direktur Utama / President Director
Trisno Limanto - Direktur / Director
Theresia Yolanda Mangundap - Direktur / Director
18 Laporan Tahunan Annual Report 2013 PT Panca Global Securities Tbk
Sumber Daya Manusia
Human Resources
Even though the Company has not formed any Employees Cooperation, nor any Employee’s Pension Fund program, yet in the course of improving employees’ prosperity, the Company provides numerous benefits such as the New Year Day Allowance, Worker Social Security Program (JAMSOSTEK), Incentive Program and Additional Bonus, Salary above the Regional Minimum Pay (UMR) set by the Government and give insurance program provided by Central Asia Raya Insurance for health security in the form of medical charge and hospital treatment reimbursement for specific amount.
Meskipun hingga saat ini Perseroan belum membentuk koperasi karyawan dan belum adanya program Dana Pensiun Karyawan, namun dalam usaha meningkatkan kesejahteraan karyawan, Perseroan memberikan berbagai fasilitas seperti Tunjangan Hari Raya, Jaminan Sosial Tenaga Kerja (JAMSOSTEK), Program Insentif dan Bonus Tahunan, upah karyawan di atas upah minimum regional dan mengikuti program asuransi dari Central Asia Raya untuk jaminan kesehatan dalam bentuk penggantian biaya pengobatan dan perawatan rumah sakit sampai dengan batas tertentu.
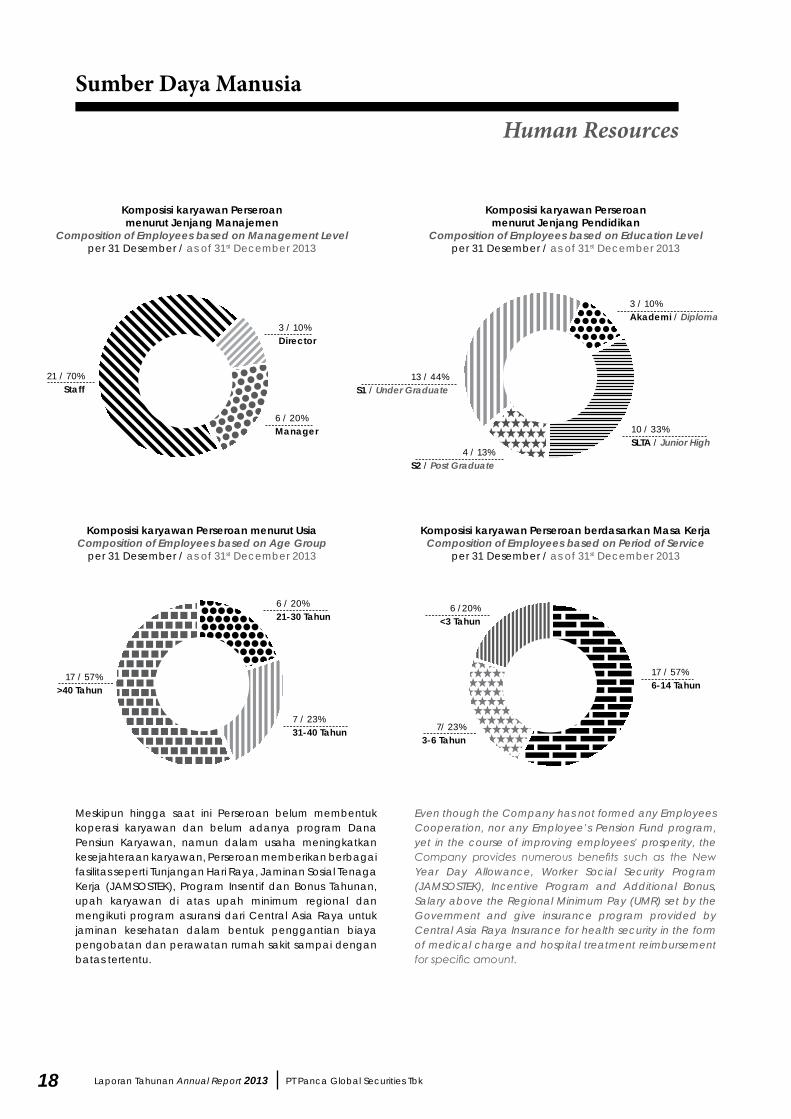
Komposisi karyawan Perseroan menurut Jenjang Manajemen
Composition of Employees based on Management Levelper 31 Desember / as of 31st December 2013
Komposisi karyawan Perseroan menurut Jenjang Pendidikan
Composition of Employees based on Education Levelper 31 Desember / as of 31st December 2013
Komposisi karyawan Perseroan menurut UsiaComposition of Employees based on Age Group
per 31 Desember / as of 31st December 2013
Komposisi karyawan Perseroan berdasarkan Masa KerjaComposition of Employees based on Period of Service
per 31 Desember / as of 31st December 2013
3 / 10%Director
21 / 70%Staff
6 / 20%Manager 10 / 33%
SLTA / Junior High
13 / 44%S1 / Under Graduate
3 / 10%Akademi / Diploma
4 / 13%S2 / Post Graduate
6 / 20%21-30 Tahun
7 / 23%31-40 Tahun
17 / 57%>40 Tahun
17 / 57%6-14 Tahun
6 /20%<3 Tahun
7/ 23%3-6 Tahun

19PT Panca Global Securities Tbk Laporan Tahunan Annual Report 2013
PT Panca Global Securities Tbk
namaName
Jumlah SahamNumber of Shares
Modal DisetorPaid Up Capital
PersentasePercentage
Hendra H. Kustarjo
UBS AG Singapore
Trisno Limanto
Farida Eva Riyanti Hutapea
Masyarakat
158.287.500
103.409.250
52.500.000
34.125.000
360.032.514
15.828.750.000
10.340.925.000
5.250.000.000
3.412.500.000
36.003.251.400
22,35%
14,60%
7,41%
4,82%
50,83%
Total 708.354.264 70.835.426.400 100%
Kepemilikan Saham (per 31 Desember 2013)Composition of Shareholder’s (as of 31th December, 2013)
Hendra H. Kustarjo22,35%
UBS AG, Singapore 14,60%
Trisno Limanto7,41%
Farida Eva. R.H.4,82%
Masyarakat50,83%
Skema Pemegang Saham Pengendali
Schematic Controller Shareholders

20 Laporan Tahunan Annual Report 2013 PT Panca Global Securities Tbk
The Management’s analysis and discussion below, was prepared in accordance to Company’s Financial Statement for the period ended at 31st December 2013 and 2012 and had been audited by Public Accountant Office Doli, Bambang, Sulistyanto, Dadang & Ali as per 30th January 2014 with unqualified opinion. Details are as followed :
REVENUESCompany’s operating revenues consist of Brokerage Commissions, Interest Income from Margin Trading, Net Realized Gain on Trading of Marketable Securities, Net Unrealized Gain (Loss) on trading of Marketable Securities, as well as service revenues which consist of Selling Agent Fees, Investment Management Fees, Underwriting Fees, Investment Advisory Fees, and Dividend. Since the year 2013 the company did not carry out business activities in the investment management.
Company’s operating revenues for the 12-month period ended 31 December 2013 amounted to Rp 23.8 billion, declined by Rp 5.8 billion or 20% from the previous year of Rp 29.7 billion. The following are the details of Company’s operating revenues:
Brokerage CommissionsBrokerage Commissions accounted for 34.37% of the company’s total revenues for the year 2013. Brokerage Commissions from securities trading activities conducted by the Company in the year 2013 amounted to Rp 8.21 billion, declined 44.32% from Rp 14.7 billion in 2012. Although the Brokerage Commissions has decreased but the value of
Analisis dan pembahasan manajemen di bawah ini, disusun berdasarkan Laporan Keuangan Perseroan pada periode 31 Desember 2013 dan 2012 yang telah diaudit oleh kantor Akuntan Publik Doli, Bambang, Sulistiyanto, Dadang & Ali tertanggal 30 Januari 2014 dengan pendapat wajar tanpa pengecualian. Rincian nya sebagaimana berikut ini :
AnALiSA LABA RUGi KoMPREHEnSiF
PEnDAPATAn USAHAPendapatan Usaha Perseroan terdiri atas Komisi dari Transaksi Perantara Pedagang Efek, Pendapatan Bunga atas Pembiayaan Nasabah (Marjin), Laba Bersih atas Perdagangan Efek yang Terealisasi, Laba (Rugi) Bersih atas Portofolio Efek yang Belum Terealisasi, serta jasa meliputi Jasa Agen Penjualan, Jasa Penjamin Emisi Efek, Jasa Penasehat Keuangan dan Dividen. Sejak tahun 2013 Perseroan tidak melaksanakan usaha di bidang Manajemen Investasi.
Pendapatan usaha Perseroan untuk periode 12 bulan yang berakhir pada 31 Desember 2013 sebesar Rp 23,8 miliar, turun Rp 5,8 miliar atau 20% dibandingkan Rp 29,7 milliar pada tahun sebelumnya. Berikut adalah rincian dari jenis pendapatan usaha Perseroan:
Komisi dari Transaksi Perantara Pedagang EfekKomisi dari transaksi Perantara Pedagang Efek memberikan kontribusi sebesar 34,37% terhadap jumlah pendapatan usaha perseroan untuk tahun 2013. Pendapatan komisi dari aktivitas perdagangan efek yang dilakukan Perseroan di tahun 2013 tercatat sebesar Rp 8,21miliar, turun 44,32% dari Rp 14,7 miliar pada tahun 2012. Meskipun Pendapatan komisi
Analisa dan Pembahasan Manajemen
Management Analysis and Discussion
Dalam Jutaan Rupiah Million Rupiah
2013 2012
Pendapatan UsahaBeban UsahaLaba UsahaPendapatan lain-lain BersihPendapatan Sebelum Pajak PenghasilanBeban Pajak PenghasilanLaba Bersih
23.8899.303
14.5869.180
23.7661.853
21.913
29.76713.90115.866
5.83021.696(2.311)19.385
RevenuesOperating Expenses
Operating IncomeOther Income-Net
Income before Income TaxIncome Tax Espenses
Net Income
Dalam Jutaan Rupiah Million Rupiah
2013Porsi
% 2012Porsi
%
Komisi dari transaksi Perantara pedagang EfekPendapatan Bunga atas pembiayaan NasabahLaba Bersih atas perdagangan efek yang terealisasiLaba (Rugi) Bersih atas Portofolio efek yang belum terealisasiJasa Agen PenjualanJasa Manajemen InvestasiJasa Penjamin Emisi EfekJasa Penasehat KeuanganDividen
8.2113.916
11.716(946)
451-
35500
7
34,3716,3949,04(3,96)
1,89-
0,152,090,08
14.7486.9037.847
(1.084)
487249311300
6
49,5423,1926,36(3,64)
1,640,841,041,010,02
Brokerage CommissionsInterest Income Margin Trading
Realized Gain onTrading of Marketable Securities-NetUnrealized Gain (Loss) on Marketable Securities-Net
Selling Agent FeesInvestment Management Fees
Underwriting FeesInvestment Advisory Fees
Dividend
Jumlah Pendapatan Usaha 23.890 100,00 29.767 100,00 Total Revenues
Dalam Jutaan Rupiah Million Rupiah

21PT Panca Global Securities Tbk Laporan Tahunan Annual Report 2013
trading securities made by the Company experienced a significant increase. Based on data from Statistics IDX 2013, the transaction value of the Company’s stock trading is done cumulatively during the year 2013 amounted to Rp 5.1 trillion, increased by 55% against the previous year amounting to Rp 3.3 trillion. It is related to the management measures in anticipation of the fierce competition resulting in lower average level of securities trading commissions charged to customers.
Interest Income from Margin TradingThe Company provides margin financing facility only for the transaction of marginable shares that are issued by the IDX. Interest income from margin financing in 2013 amounted to Rp 3.9 billion declined by Rp 3 billion or 43.28% compared to the year 2012 amounting to Rp 6.9 billion. This decline is in line with the change in management policy in terms of the financing activities in 2013, the Company recorded receivable from margin facility of Rp 1.2 billion compared to the year 2012 amounted to Rp 67.5 billion or decreased significantly by 99%. This resulted in a decrease in contribution interest income from margin trading to total operating revenues of the Company, where the contribution in 2012 is 23.19% to 16.39% in 2013.
Net Realized Gain on Trading of Marketable SecuritiesNet Realized Gain on Trading of Marketable Securities for the 12-month period ended at 31 December 2013 is amounted to Rp 11.7 billion or increased 49.31% from Rp 7.8 billion in 2012. The increase was primarily due to increase in gains on securities trading portfolio of the Company which has been realized. This type of income is the biggest contributor or by 49.04% to total Revenue of the Company.
Net Unrealized Gain (Loss) on Trading of Marketable SecuritiesThe decline occurred in the Net Unrealized Gain (Loss) on Trading of Marketable Securities until December 31, 2013 by 13% to a loss Rp 0.1 billion in 2013 compared to loss of Rp 1.1 billion by the end of 2012. The Company’s portfolio consists of equity securities and debt securities. The amount of losses occurred because the market prices of the portfolio securities held by the Company experienced a decline at the end of the year.
Investment Management FeeBeginning in 2013 the Company had not completely run the business in Investment Management.
Underwriting and Selling Agent FeeThe revenues from underwriting and selling agent fees are derived from initial public offering of shares and bond. Income derived from underwriting activities throughout the year 2013 decreased 89% to Rp 34.8 million from Rp 311.2 million in the year 2012 it is due to the declining number of companies doing IPOs in along 2013. For Selling Agent fee decreased by 7% to Rp 450.8 million compared to the year 2012 amounting to Rp 486.8 million.
Investment Advisory FeeInvestment Advisory Fee in 2013 increased 75%, to Rp 500 million from Rp 300 million in 2012. This increase is caused by the increasing number of corporate actions of the Company handled.
dari Perantara Pedagang Efek mengalami penurunan namun nilai perdagangan efek yang dilakukan Perseroan mengalami kenaikan yang cukup signifikan. Berdasarkan data dari IDX Statistics 2013, nilai transaksi perdagangan saham yang dilakukan Perseroan secara kumulatif sepanjang tahun 2013 adalah sebesar Rp 5,1 triliun atau naik 55% terhadap tahun sebelumnya yaitu sebesar Rp 3,3 triliun. Hal ini terkait dengan langkah manajemen dalam mengantisipasi persaingan ketat sehingga menurunkan tingkat rata-rata komisi perdagangan efek yang dibebankan kepada nasabah.
Pendapatan Bunga atas Pembiayaan nasabahPerseroan juga menyediakan fasilitas pembiayaan kepada nasabah atas pembelian saham yang terdaftar sebagai saham marjin di Bursa Efek. Pendapatan bunga marjin pada tahun 2013 tercatat sebesar Rp 3,9 miliar, mengalami penurunan sebesar Rp 3 miliar atau 43,28% dibandingkan tahun 2012 sebesar Rp 6,9 miliar. Penurunan ini seiring dengan perubahan kebijakan Manajemen dalam menentukan sasaran pembiayaan, dimana tahun 2013 Perseroan mencatat Piutang Marjin sebesar Rp 1,2 miliar dibandingkan tahun 2012 sebesar Rp 67,5 milliar atau mengalami penurunan tajam sebesar 99%. Hal ini mengakibatkan besarnya porsi kontribusi Pendapatan bunga marjin terhadap jumlah pendapatan usaha Perseroan menurun, dimana kontribusi tahun 2012 adalah 23,19% dan tahun 2013 sebesar 16,39%.
Laba Bersih atas Perdagangan Efek Yang TerealisasiLaba Bersih atas Perdagangan Efek Yang Terealisasi untuk periode 12 bulan yang berakhir pada tanggal 31 Desember 2013 tercatat sebesar Rp 11,7 miliar atau naik sebesar 49,31% dari Rp 7,8 miliar pada tahun 2012. Peningkatan ini terutama disebabkan oleh kenaikan keuntungan atas perdagangan efek portofolio Perseroan yang telah terealisasi. Pendapatan jenis ini merupakan penyumbang terbesar atau sebesar 49,04% terhadap jumlah Pendapatan Usaha Perseroan.
Laba (Rugi) Bersih atas Protofolio Efek yang Belum TerealisasiPenurunan terjadi pada rugi bersih atas portofolio Efek yang Belum Terealisasi hingga tanggal 31 Desember 2013 sebesar 13% menjadi rugi Rp 0,1 miliar di tahun 2013 dibandingkan posisi Rugi Rp 1,1 miliar pada akhir tahun 2012. Portofolio Efek Perseroan terdiri dari efek ekuitas dan efek hutang. Besarnya kerugian terjadi karena harga pasar dari portofolio efek yang dipegang Perseroan mengalami penurunan pada akhir tahun.
Jasa Manajemen investasiMulai tahun 2013 Perseroan sudah tidak sama sekali menjalankan usaha di bidang Manajemen Investasi.
Jasa Penjamin Emisi Efek dan Jasa Agen PenjualanMerupakan imbalan jasa sebagai penjamin emisi dan agen penjual atas penawaran umum saham dan obligasi. Pendapatan yang diperoleh dari kegiatan penjaminan emisi sepanjang tahun 2013 mengalami penurunan 89% menjadi Rp 34,8 juta dari Rp 311,2 juta pada tahun 2012 hal ini seiring dengan menurunnya jumlah perusahaan yang melakukan IPO. Untuk Jasa Agen Penjualan terjadi penurunan sebesar 7% menjadi Rp 450,8 juta dibandingkan posisi tahun 2012 sebesar Rp 486,8 juta.
Jasa Penasehat KeuanganJasa Penasehat Keuangan pada tahun 2013 mengalami peningkatan sebesar 65% menjadi Rp 500 juta dari Rp 300 juta pada tahun sebelumnya. Peningkatan ini diakibatkan oleh meningkatnya jumlah aksi korporasi yang di tangani Perseroan.
22 Laporan Tahunan Annual Report 2013 PT Panca Global Securities Tbk
OPERATING EXPENSESThe Company’s operating expenses consist of transaction cost, salaries, depreciation, general & administrative and office rent and maintenance. Operating expenses in 2013 amounted to Rp 9.3 billion, decreased 33.08% compared to the year 2012 amounting to Rp 13.9 billion. Triggering increased operating margin ratio to 61.06% from 53.3% in 2012.
OPERATING INCOMEThe Company recorded operating income for 2013 amounted to Rp 14.6 billion, a decrease of Rp 1.3 billion from 2012. It is caused by a decrease in the transactions cost of equities. The decrease in operating income is in line with lower revenues of the Company.
OTHER INCOMES (EXPENSES)The company’s Other income in 2013 was recorded at Rp 9.2 billion, up 57.46% from Rp 5.8 billion in 2012. This increase is able to compensate for the decrease in operating income due to lower revenues so in the end the Company is able to maintain growth in net profit.
COMPREHENSIVE INCOMEComprehensive Income of the Company for a period of 12 months ended December 31, 2013 amounted to Rp 21.9 billion, up 13.04% from Rp 19.4 billion in 2012. The increase was attributable to an increase in other income of the Company that is able to cover other operating profit of the Company, so the Company successfully managed to increase its net margin 91.73% in 2013 from 65.12% in 2012.
FINANCIAL POSITION ANALYSIS
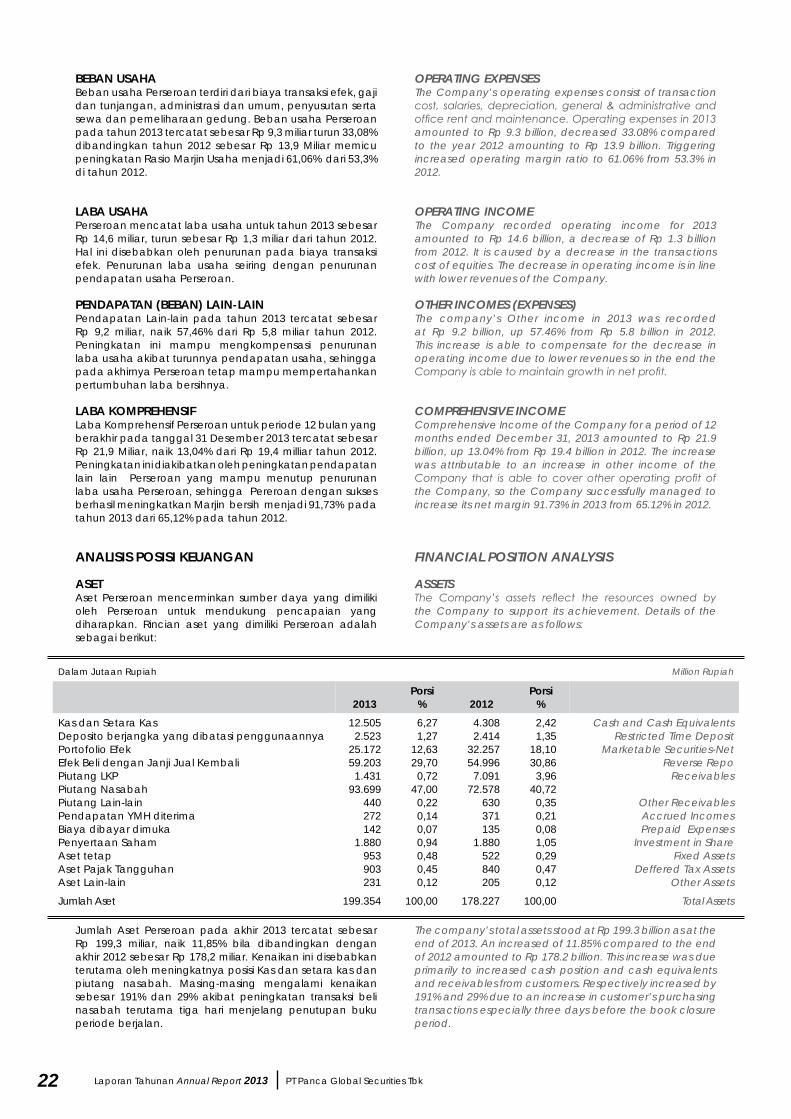
ASSETSThe Company’s assets reflect the resources owned by the Company to support its achievement. Details of the Company’s assets are as follows:
The company’s total assets stood at Rp 199.3 billion as at the end of 2013. An increased of 11.85% compared to the end of 2012 amounted to Rp 178.2 billion. This increase was due primarily to increased cash position and cash equivalents and receivables from customers. Respectively increased by 191% and 29% due to an increase in customer’s purchasing transactions especially three days before the book closure period.
BEBAn USAHABeban usaha Perseroan terdiri dari biaya transaksi efek, gaji dan tunjangan, administrasi dan umum, penyusutan serta sewa dan pemeliharaan gedung. Beban usaha Perseroan pada tahun 2013 tercatat sebesar Rp 9,3 miliar turun 33,08% dibandingkan tahun 2012 sebesar Rp 13,9 Miliar memicu peningkatan Rasio Marjin Usaha menjadi 61,06% dari 53,3% di tahun 2012.
LABA USAHAPerseroan mencatat laba usaha untuk tahun 2013 sebesar Rp 14,6 miliar, turun sebesar Rp 1,3 miliar dari tahun 2012. Hal ini disebabkan oleh penurunan pada biaya transaksi efek. Penurunan laba usaha seiring dengan penurunan pendapatan usaha Perseroan.
PEnDAPATAn (BEBAn) LAin-LAinPendapatan Lain-lain pada tahun 2013 tercatat sebesar Rp 9,2 miliar, naik 57,46% dari Rp 5,8 miliar tahun 2012. Peningkatan ini mampu mengkompensasi penurunan laba usaha akibat turunnya pendapatan usaha, sehingga pada akhirnya Perseroan tetap mampu mempertahankan pertumbuhan laba bersihnya.
LABA KoMPREHEnSiF Laba Komprehensif Perseroan untuk periode 12 bulan yang berakhir pada tanggal 31 Desember 2013 tercatat sebesar Rp 21,9 Miliar, naik 13,04% dari Rp 19,4 milliar tahun 2012. Peningkatan ini diakibatkan oleh peningkatan pendapatan lain lain Perseroan yang mampu menutup penurunan laba usaha Perseroan, sehingga Pereroan dengan sukses berhasil meningkatkan Marjin bersih menjadi 91,73% pada tahun 2013 dari 65,12% pada tahun 2012.
AnALiSiS PoSiSi KEUAnGAn
ASETAset Perseroan mencerminkan sumber daya yang dimiliki oleh Perseroan untuk mendukung pencapaian yang diharapkan. Rincian aset yang dimiliki Perseroan adalah sebagai berikut:
Jumlah Aset Perseroan pada akhir 2013 tercatat sebesar Rp 199,3 miliar, naik 11,85% bila dibandingkan dengan akhir 2012 sebesar Rp 178,2 miliar. Kenaikan ini disebabkan terutama oleh meningkatnya posisi Kas dan setara kas dan piutang nasabah. Masing-masing mengalami kenaikan sebesar 191% dan 29% akibat peningkatan transaksi beli nasabah terutama tiga hari menjelang penutupan buku periode berjalan.
Dalam Jutaan Rupiah Million Rupiah
2013Porsi
% 2012Porsi
%Kas dan Setara KasDeposito berjangka yang dibatasi penggunaannyaPortofolio EfekEfek Beli dengan Janji Jual KembaliPiutang LKPPiutang NasabahPiutang Lain-lainPendapatan YMH diterimaBiaya dibayar dimukaPenyertaan SahamAset tetapAset Pajak TangguhanAset Lain-lain
12.5052.523
25.17259.203
1.43193.699
440272142
1.880953903231
6,271,27
12,6329,70
0,7247,00
0,220,140,070,940,480,450,12
4.3082.414
32.25754.996
7.09172.578
630371135
1.880522840205
2,421,35
18,1030,86
3,9640,72
0,350,210,081,050,290,470,12
Cash and Cash EquivalentsRestricted Time Deposit
Marketable Securities-NetReverse Repo
Receivables
Other ReceivablesAccrued IncomesPrepaid Expenses
Investment in ShareFixed Assets
Deffered Tax AssetsOther Assets
Jumlah Aset 199.354 100,00 178.227 100,00 Total Assets

23PT Panca Global Securities Tbk Laporan Tahunan Annual Report 2013
Cash and Cash EquivalentsCash and Cash Equivalents per December 2013 amounted to Rp 12.5 billion. This number increased by Rp 8.1 billion or 190% compared to the position in 2012 amounted to Rp 4.3 billion. The increase in cash was due to the net increase in the number of sale transactions made by customers towards the end of the year.
Marketable Securities - NetThe Company’s marketable securities decreased 21.97% in 2013 to Rp 25.2 billion compared to 2012 amounting to Rp 32.3 billion. The decrease is due to the Company’s action to realize profit of its securities portfolio.
Reverse RepoIn 2013 the Company allocated its funds amounting to Rp 59.2 billion in Reverse Repo agreement. Securities purchased are PT Modernland Realty Tbk dan PT Steel Pipe Industry of Indonesia.
Receivables from Clearing and Guarantee BodyThe amount of receivables from clearing and guarantee body in 2013 amounted to Rp 1.4 billion a decrease of Rp 5.6 billion or 79.62% from Rp 7.1 billion in 2012. This trend shows a decline in the securities transaction value by the Company’s customers at the end of the year.
Customer ReceivablesThe amount of receivables from company’s customer in 2013 increased by Rp 21.1 billion, or 29.10% to Rp 93.7 billion when compared to 2012 amounting to Rp 72.6 billion. This increase indicated strengthening of buying transactions by customers on a day towards the end of the year.
LIABILITIESThe entire liabilities to be covered by the Company as of December 31, 2013 to third parties, are as follow:
Total Liabilities Company as of December 31, 2013 amounted to Rp 24.4 billion, with the largest amount of debt to customers. This number increased by Rp 6.3 billion or 34.75% compared with the year 2012 amounting to Rp 18.1 billion. The increase was due primarily to increased buying marketable securities transactions by customers of the Company at the end of the year.
Payables to Clearing and Guarantee InstitutionPayables position to the Clearing and Guarantee Institution decreased by Rp 2.8 billion, due to drop in the purchase of equity towards the end of December 2013 by the Company’s clients that have not due compared to 31 December 2012.
Kas dan Setara KasKas dan Setara Kas per Desember 2013 adalah sebesar Rp 12,5 miliar. Jumlah ini mengalami peningkatan sebesar Rp 8,1miliar atau 190% jika dibandingkan dengan posisi tahun 2012 sebesar Rp 4,3 miliar. Peningkatan kas ini disebabkan oleh meningkatnya jumlah transaksi penjualan bersih yang dilakukan oleh nasabah menjelang akhir tahun.
Portofolio EfekPortofolio efek yang dimiliki Perseroan menurun 21,97% pada tahun 2013 menjadi Rp 25,2 miliar jika dibandingkan dengan tahun 2012 sebesar Rp 32,3 miliar. Penurunan ini disebabkan adanya tindakan Perseroan untuk merealisasikan profit dari portofolio surat berharga.
Efek Beli dengan Janji Jual KembaliPada tahun 2013, Perseroan menempatkan dananya pada Efek Beli dengan Janji Jual Kembali sebesar Rp 59,2 miliar. Efek yang ditransaksikan meliputi saham PT Modernland Realty Tbk dan PT Steel Pipe Industry of Indonesia.
Piutang Lembaga Kliring dan PenjaminanPosisi jumlah piutang dari Lembaga Kliring dan Penjaminan pada 2013 Perseroan sebesar Rp 1,4 miliar, menurun sebesar Rp 5,6 miliar atau 79,62% dari posisi Rp 7,1 miliar pada tahun 2012. Tren ini menunjukkan adanya penurunan nilai penjualan efek oleh para nasabah Perseroan pada akhir tahun.
Piutang nasabahPosisi jumlah piutang dari nasabah Perseroan pada tahun 2013 meningkat sebesar Rp 21,1 miliar atau 29,10% menjadi Rp 93,7 miliar jika dibandingkan dengan tahun 2012 sebesar Rp 72,6 miliar. Peningkatan ini menunjukkan menguatnya transaksi beli oleh nasabah pada hari hari menjelang akhir tahun.
LiABiLiTASSeluruh liabilitas yang harus dipenuhi oleh Perseroan per 31 Desember 2013 kepada pihak lain sebagaimana tabel di bawah ini:
Jumlah Liabilitas Perseroan per 31 Desember 2013 sebesar Rp 24,4 miliar dengan jumlah terbesar adalah utang kepada nasabah. Jumlah ini mengalami peningkatan sebesar Rp 6,3 miliar atau 34,75% dibandingkan dengan tahun 2012 sebesar Rp 18,1 miliar. Peningkatan ini diakibatkan terutama oleh meningkatnya transaksi beli surat berharga oleh nasabah Perseroan pada akhir tahun.
Utang LKPPosisi utang kepada LKP mengalami penurunan sebesar Rp 2,8 miliar, dikarenakan adanya penurunan transaksi pembelian efek di akhir bulan Desember 2013 oleh nasabah Perseroan yang belum jatuh tempo dibandingkan dengan periode 31 Desember 2012.
Dalam Jutaan Rupiah Million Rupiah
2013Porsi
% 2012Porsi
%Utang LKPUtang NasabahUtang PajakBiaya Yang Masih Harus DibayarLiabilitas Manfaat karyawanUtang Lain-lain
4.67815.317
252528
3.6391
19,1662,741,082,16
14,900,00
7.5066.762
411309
3.1246
41,4337,32
2,271,71
17,240,08
Payables to Clearing & Guarantee InstitutionPayables to Customers
Tax PayableAccrued Expenses
Employee Benefit LiabilitiesOther Payables
Jumlah Liabilitas 24.415 100,00 18.118 100,00 Total Liabilities
24 Laporan Tahunan Annual Report 2013 PT Panca Global Securities Tbk
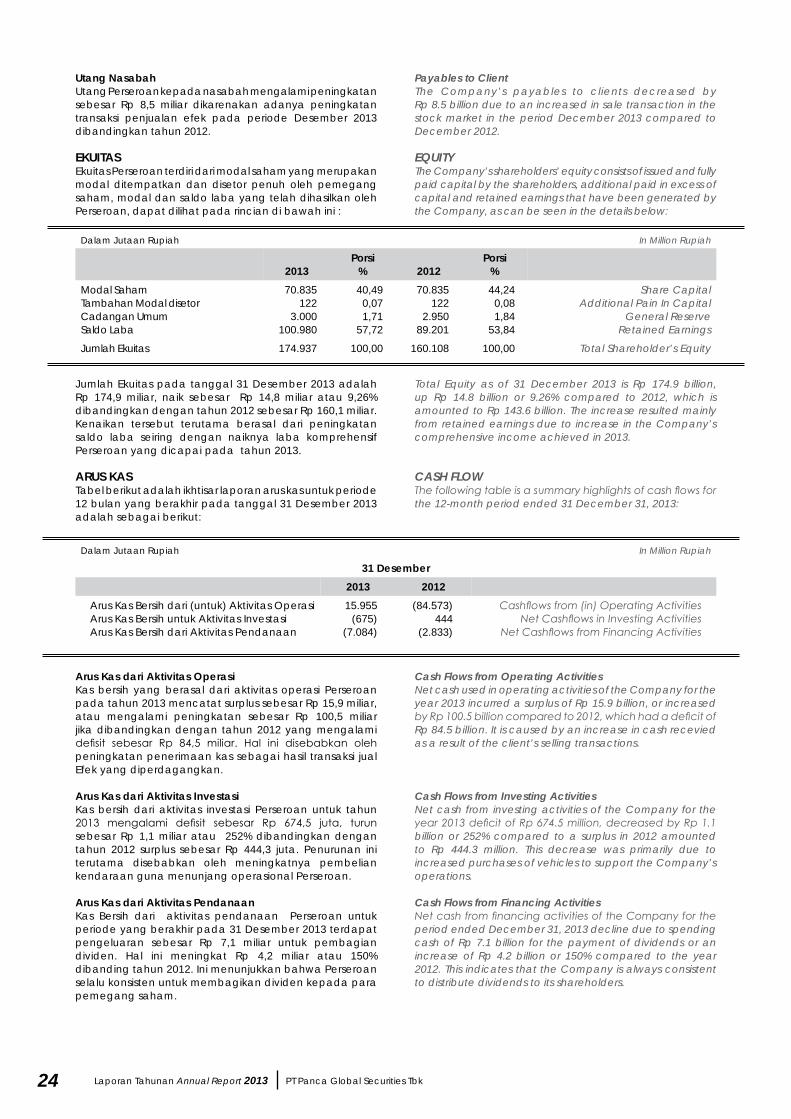
Payables to ClientThe Company’s payables to clients decreased by Rp 8.5 billion due to an increased in sale transaction in the stock market in the period December 2013 compared to December 2012.
EQUITYThe Company’s shareholders’ equity consists of issued and fully paid capital by the shareholders, additional paid in excess of capital and retained earnings that have been generated by the Company, as can be seen in the details below:
Total Equity as of 31 December 2013 is Rp 174.9 billion, up Rp 14.8 billion or 9.26% compared to 2012, which is amounted to Rp 143.6 billion. The increase resulted mainly from retained earnings due to increase in the Company’s comprehensive income achieved in 2013.
CASH FLOWThe following table is a summary highlights of cash flows for the 12-month period ended 31 December 31, 2013:
Cash Flows from Operating ActivitiesNet cash used in operating activities of the Company for the year 2013 incurred a surplus of Rp 15.9 billion, or increased by Rp 100.5 billion compared to 2012, which had a deficit of Rp 84.5 billion. It is caused by an increase in cash recevied as a result of the client’s selling transactions.
Cash Flows from Investing ActivitiesNet cash from investing activities of the Company for the year 2013 deficit of Rp 674.5 million, decreased by Rp 1.1 billion or 252% compared to a surplus in 2012 amounted to Rp 444.3 million. This decrease was primarily due to increased purchases of vehicles to support the Company’s operations.
Cash Flows from Financing ActivitiesNet cash from financing activities of the Company for the period ended December 31, 2013 decline due to spending cash of Rp 7.1 billion for the payment of dividends or an increase of Rp 4.2 billion or 150% compared to the year 2012. This indicates that the Company is always consistent to distribute dividends to its shareholders.
Utang nasabahUtang Perseroan kepada nasabah mengalami peningkatan sebesar Rp 8,5 miliar dikarenakan adanya peningkatan transaksi penjualan efek pada periode Desember 2013 dibandingkan tahun 2012.
EKUiTASEkuitas Perseroan terdiri dari modal saham yang merupakan modal ditempatkan dan disetor penuh oleh pemegang saham, modal dan saldo laba yang telah dihasilkan oleh Perseroan, dapat dilihat pada rincian di bawah ini :
Jumlah Ekuitas pada tanggal 31 Desember 2013 adalah Rp 174,9 miliar, naik sebesar Rp 14,8 miliar atau 9,26% dibandingkan dengan tahun 2012 sebesar Rp 160,1 miliar. Kenaikan tersebut terutama berasal dari peningkatan saldo laba seiring dengan naiknya laba komprehensif Perseroan yang dicapai pada tahun 2013.
ARUS KASTabel berikut adalah ikhtisar laporan arus kas untuk periode 12 bulan yang berakhir pada tanggal 31 Desember 2013 adalah sebagai berikut:
Arus Kas dari Aktivitas operasiKas bersih yang berasal dari aktivitas operasi Perseroan pada tahun 2013 mencatat surplus sebesar Rp 15,9 miliar, atau mengalami peningkatan sebesar Rp 100,5 miliar jika dibandingkan dengan tahun 2012 yang mengalami defisit sebesar Rp 84,5 miliar. Hal ini disebabkan oleh peningkatan penerimaan kas sebagai hasil transaksi jual Efek yang diperdagangkan.
Arus Kas dari Aktivitas investasiKas bersih dari aktivitas investasi Perseroan untuk tahun 2013 mengalami defisit sebesar Rp 674,5 juta, turun sebesar Rp 1,1 miliar atau 252% dibandingkan dengan tahun 2012 surplus sebesar Rp 444,3 juta. Penurunan ini terutama disebabkan oleh meningkatnya pembelian kendaraan guna menunjang operasional Perseroan.
Arus Kas dari Aktivitas PendanaanKas Bersih dari aktivitas pendanaan Perseroan untuk periode yang berakhir pada 31 Desember 2013 terdapat pengeluaran sebesar Rp 7,1 miliar untuk pembagian dividen. Hal ini meningkat Rp 4,2 miliar atau 150% dibanding tahun 2012. Ini menunjukkan bahwa Perseroan selalu konsisten untuk membagikan dividen kepada para pemegang saham.
Dalam Jutaan Rupiah In Million Rupiah
2013Porsi
% 2012Porsi
%Modal SahamTambahan Modal disetorCadangan UmumSaldo Laba
70.835122
3.000100.980
40,490,071,71
57,72
70.835122
2.95089.201
44,240,081,84
53,84
Share CapitalAdditional Pain In Capital
General ReserveRetained Earnings
Jumlah Ekuitas 174.937 100,00 160.108 100,00 Total Shareholder’s Equity
Dalam Jutaan Rupiah In Million Rupiah
31 Desember2013 2012
Arus Kas Bersih dari (untuk) Aktivitas OperasiArus Kas Bersih untuk Aktivitas InvestasiArus Kas Bersih dari Aktivitas Pendanaan
15.955(675)
(7.084)
(84.573)444
(2.833)
Cashflows from (in) Operating ActivitiesNet Cashflows in Investing Activities
Net Cashflows from Financing Activities

25PT Panca Global Securities Tbk Laporan Tahunan Annual Report 2013
LIQUIDITYThe level of liquidity reflects the Company’s ability to meet its liabilities primarily on stock transactions to LKP and its clients. The Company manages liquidity by maintaining adequate reserves which entirely rely on its internal funds. The company has continuously complied with the stringent requirement of Adjusted Net Working Capital (MKBD) calculation set by the regulators. As of December 2013, the Company’s MKBD was amounted to Rp 75.6 billion compared to Rp 82.1 billion in 2012. Liquidity of the Company in 2013 amounted to 11.81x. While liquidity in 2012 was 9.6x.
SOLVENCYSolvency is the ability of the Company to meet its entire liabilities, which are measured by comparing the amount of its liabilities over its assets as well as comparing the amount of liabilities on the amount of equity.
The ratio of Liabilities to AssetsThe ratio of total liabilities to total assets of the Company on December 31, 2013 amounted to 8.33%, an improvement from the previous year of 10.17%. The decreasing of this ratio was primarily due to a faster increase in assets compared to its liabilities. This showed that the Company’s increase ability to serve all its liabilities.
Liabilities to Equity RatioThe ratio of total liabilities to total equity of the Company on December 31, 2013 amounted to 13.96%, an increase compared to the year 2012 in the amount of 11.32%. This indicates that the equity of the Company is able to meet its liabilities to third parties.
PROFITABILITYProfitability is an indicator of the Company’s ability to generate earnings in a period of time. Profitability can be seen from the ratio of comprehensive income, return on investment and return on equity.
LiKUiDiTASTingkat likuiditas mencerminkan kemampuan Perseroan dalam memenuhi kewajiban terutama utang atas transaksi saham kepada LKP dan kepada nasabah. Perseroan mengelola likuiditas dengan mempertahankan cadangan yang memadai dimana seluruhnya berasal dari dana internal Perseroan. Dengan menggunakan variable yang digunakan dalam penghitungan Modal Kerja Bersih Disesuaikan (MKBD), maka pada Desember 2013 MKBD Perseroan tercatat sebesar Rp 75,6 miliar dibandingkan dengan Rp 82,1 miliar di tahun 2012. Likuiditas Perseroan pada tahun 2013 adalah 11,81X sedangkan tahun 2012 adalah 9,6x.
SoLVABiLiTASSolvabilitas adalah kemampuan Perseroan untuk memenuhi seluruh kewajibannya, yang diukur dengan membandingkan jumlah liabilitas dengan jumlah aset ataupun membandingkan jumlah liabilitas dengan jumlah ekuitas.
Rasio Liabilitas terhadap AsetRasio total liabilitas terhadap total aset Perseroan pada tanggal 31 Desember 2013 adalah sebesar 8,33%, mengalami perbaikan dari tahun sebelumnya yaitu sebesar 10,17%. Penurunan rasio ini terutama disebabkan oleh peningkatan aset lebih cepat dari pada peningkatan liabilitas menunjukkan peningkatan kemampuan Perseroan melalui asetnya untuk membayar seluruh kewajibannya.
Rasio Liabilitas terhadap EkuitasRasio total liabilitas terhadap total ekuitas Perseroan pada tanggal 31 Desember 2013 adalah sebesar 13,96% atau mengalami kenaikan dibandingkan dengan tahun 2012 yaitu sebesar 11,32%. Hal ini menunjukkan bahwa dengan modal sendiri yang dimiliki Perusahaan berkemampuan memenuhi kewajiban terhadap pihak ketiga adalah sangat kuat.
REnTABiLiTASRentabilitas merupakan indikator kemampuan Perseroan untuk menghasilkan laba pada suatu periode waktu tertentu. Rentabilitas dapat dilihat dari rasio laba komprehensif, imbal hasil investasi dan imbal hasil ekuitas.
Dalam Jutaan Rupiah In Million Rupiah
31 Desember2013 2012
Laba KomprehensifPendapatan UsahaTotal AsetTotal EkuitasRasio Laba Komprehensif (%)Rasio Imbal Hasil Investasi (%)Rasio Imbal Hasil Ekuitas (%)
21.91323.889
293.052174.938
91,737,48
12,53
19.38529.767
178.227160.109
65,1210,8812,11
Comprehensive IncomeRevenues
Total AssetsTotal Equity
Net Profit Margin (%)Return on Asset (%)
Return on Equity (%)
Dalam Jutaan Rupiah In Million Rupiah
31 Desember2013 2012
Total AsetTotal LiabilitasTotal EkuitasRasio SolvabilitasLiabilitas/Ekuitas (%)Liabilitas/Aset (%)
293.05224.415
174.938
13,968,33
178.22718.119
160.108
11,3210,17
Total AssetsTotal Liabilities
Total EquitiesSolvancy Ratio
Liabilities/Equity (%)Liabilities/Assets (%)
26 Laporan Tahunan Annual Report 2013 PT Panca Global Securities Tbk
Net Profit MarginNet profit margin is the ratio of net income (loss) to total revenues. The Company’s net profit margin ratio for the 12-month period ended in 31 December 2013 and the year ended 31 December 2012 amounted to 91.73% and 65.12% respectively. This indicates that the Company is able to generate income despite declining revenues.
Return on AssetsReturn on Assets is measured by the Company’s ability to generate net income from its total assets. The Company’s Return on Assets for the twelve months ended 31 December 2013 and 2012 were 7.48% and 10.88%, respectively. This is due to higher increase in its total asset compared to its net income.
Return on EquityReturn on Equity ratio is the Company’s ability to generate net income from its total equity. The Company’s return on equity ratio in for 2013 and 2012 were recorded at 12.53% and 12.11%, respectively. Return on Equity ratio rose even though the Company distributed dividend.
Ability to Service DebtFor the financial year ended December 2013 and 2012, The company has no working capital loan and long term loan. The Company’s entire operation is funded by its internal cash.
The collectibility of receivables which presents the calculation of relevant ratiosUp to date, the company has not recorded any collection problem on its clients receivables. Thus can be concluded that the level of the company collectibility receivables is very high.
CAPITAL STRUCTUREIn the financial statements ended December 31, 2013 showed that the capital structure of the Company consists of Shareholder’s equity only with no long-term debt. its consists of sharecapital, additional paid-in capital and retained earnings. Management believes that capital adequacy is still in a safe position, sufficient to support the healthy operations and meet the requirements of the capital market regulator. It is expected that a healthy capital structure can provide optimum value to our shareholders.
INVESTMENT IN CAPITAL GOODSIn 2013 the Company did not make any capital expenditures. Acquisition of fixed assets was limited to support the operational activities of the Company. In the statement of cash flows, the Company has used funds in investing activities amounted to Rp 1.078 billion to purchase vehicle and computers. Therefore, in the year ended December 2013 the Company did not have any material liabilities either for the purpose of investment in capital goods or working capital to any parties.
OCCURED AFTER THE REPORT DATE
The Company does not have any information and material facts occurring after accountant reporting date.
Marjin Laba (Rugi) KomprehensifMarjin laba komprehensif merupakan rasio laba (rugi) komprehensif terhadap pendapatan usaha. Marjin laba (rugi) komprehensif Perseroan per 31 Desember 2013 dan 2012 masing-masing sebesar 91,73% dan 65,12%. Hal ini menunjukkan kemampuan Perseroan untuk menghasilkan pendapatan lainnya, meskipun pendapatan usaha yang menurun.
Rasio imbal Hasil investasimbal hasil Investasi adalah kemampuan Perusahaan untuk menghasilkan laba bersih dari aset yang dimilikinya. Imbal hasil investasi Perseroan untuk periode 31 Desember 2013 dan 2012 adalah 7,48% dan 10,88%. Penurunan ini disebabkan oleh kenaikan total aset lebih besar dibanding dengan kenaikan laba komprehensif.
Rasio imbal Hasil EkuitasImbal hasil Ekuitas adalah kemampuan Perusahaan untuk menghasilkan laba bersih atas ekuitas yang dimilikinya. Tingkat imbal hasil ekuitas Perseroan untuk tahun 2013 dan 2012 adalah 12,53% dan 12,11%. Rasio Ekuitas mengalami pertumbuhan meskipun Perseroan melaksanakan pembagian dividen.
Kemampuan membayar hutang Perseroan pada tahun buku yang berakhir pada Desember 2013 dan 2012 tercatat tidak memiliki hutang jangka pendek maupun hutang jangka panjang. Seluruh Kegiatan usaha Perseroan di biayai dengan modal sendiri.
Tingkat kolektibilitas piutang perusahaan yang menyajikan perhitungan rasio yang relevanPerseroan sampai dengan saat ini tidak pernah mengalami masalah kolektibilitas piutang dari nasabah. Dengan demikian dapat disimpulkan bahwa tingkat kolektibilitas piutang Perseroan sangat sehat.
STRUKTUR PERMoDALAnPada laporan keuangan yang berakhir pada tanggal 31 Desember 2013 menunjukkan bahwa struktur permodalan yang dimiliki Perseroan hanya terdiri dari hanya ekuitas tanpa hutang jangka panjang. Ekuitas terdiri dari modal pemegang saham, tambahan modal disetor dan saldo laba. Manajemen beranggapan bahwa kecukupan modal masih dalam posisi aman, masih memadai dalam mendukung operasional yang sehat dan memenuhi ketentuan dari regulator pasar modal. Diharapkan struktur permodalan yang sehat dapat memberi nilai optimal kepada para pemegang saham.
inVESTASi BARAnG MoDALPada tahun 2013 Perseroan tidak melakukan belanja modal, perolehan aset tetap hanya sebatas untuk menunjang aktifitas operasional Perseroan. Dalam laporan arus kas, Perseroan telah menggunakan dana dalam aktivitas investasi sebesar Rp 1,078 miliar yang digunakan untuk membeli kendaraan dan perlengkapan komputer. Oleh karena itu dalam tahun 2013 Perseroan tidak memiliki suatu ikatan yang bernilai material baik untuk kepentingan investasi barang modal ataupun modal kerja kepada pihak manapun.
inFoRMASi DAn FAKTA MATERiAL YAnG TERJADi SETELAH TAnGGAL LAPoRAn Perseroan tidak memiliki informasi dan fakta material yang terjadi setelah tanggal laporan akuntan.

27PT Panca Global Securities Tbk Laporan Tahunan Annual Report 2013
PROSPECTSThe company’s performance is mainly depend on the trading value of securities made by investors in the stock market. The transaction activities on the stock exchange are subjected to the financial performance of the listed companies, political stability, domestic macroeconomic policy and the global economy.
The Indonesia Composite Index (ICI) in 2013 was considered highly volatile. At the beginning of 2013, the ICI stood at 4.322. By May of 2013, The Indonesia Composite Index surged by 21.4% to its all time high record of 5.251. However, by August 2013, ICI plunged 26.8% from its peak to 3.837. At the end of 2013 Indonesia Composite Index closed at 4.274, up marginally by 0.5% compared to beginning of the year.
Volatility of ICI in 2013 was mainly due to the FED’s plan to reduce its monetary stimulus plan or tapering in the USA. This trigger negative sentiment and uncertainties across the exchanges.
Meanwhile in 2013, the Indonesian trade balance is coming under heavy pressure. The current account deficit is projected to reach 3.5% of Gross Domestic Product (GDP), significantly higher than in 2012 of 2.8%. The surplus on the capital and financial account was also on declining. Similarly, the Indonesian Rupiah depreciated 26.4% in the year 2013 adding uncertainty to the market in general. Nevertheless, the Indonesian economy managed to grow by 5.7% (yoy).
In 2014 the global economy is expected to slow down that is marked by the IMF has cut its forecast for global economic growth for 2014 from 3.8% to 3.6%. The slowdown will adversely affect Indonesia’s macroeconomic indicators, especially trade account deficit. Several measures has been carried out by the government in order to curb economic slowdown, combat inflation, raise in interest rates and weakening of the exchange rates. Hence, foreign investors are expected to return to Indonesia.
There are challenges in the Indonesian capital market industry, implementation of the ASEAN Economic Community (AEC) by 2015 which could add pressure to competition, especially for securities company. Nevertheless, securities companies are poised to improve professionalism to achieve an expected “level of playing field”. Another challenge is the implementation of levies by the OJK, which began on March 1, 2014 were deemed to burden the financial industry and the capital markets.
There are opportunities in the Indonesian capital market, namely implementation the BEI regulations regarding lot size and the fraction of the stock price as per January 6, 2014. The regulators expect this new regulation will deem as a positive catalyst to boost ICI transaction value as well as the overall number of domestic Investors.
The General Election in 2014 in related to Vision and Mission of the Presidential Candidate is expected to bring a positive contribution on ICI. Hence, capitalizing growth opportunities of listed companies.
PRoSPEK USAHAKinerja Perusahaan efek terutama dipengaruhi oleh nilai perdagangan saham yang dilakukan oleh para investor di lantai bursa. Tinggi rendahnya aktivitas perdagangan saham dipengaruhi oleh kinerja perusahaan terbuka yang ada di lantai bursa, stabilitas politik, kebijakan makronya ekonomi Indonesia dan ekonomi global.
Pergerakan IHSG sepanjang tahun 2013 terbilang sangat bergejolak. IHSG di awali pada posisi 4,322 kemudian melonjak sebesar 21,4% mencapai rekor tertinggi 5,251 pada bulan Mei 2013. Namun sekitar akhir bulan Agustus IHSG terperosok hingga level terendah yaitu 3,837 atau terkoreksi sebesar 26,8% dari rekor tertinggi. Pada penghujung tahun 2013, IHSG tercatat pada 4,274 atau naik tipis 0,5% terhadap awal 2013.
Volatilitas IHSG pada tahun 2013 terpengaruh dengan rencana pengurangan stimulus moneter atau tapering off di AS. Rencana ini memicu sentimen negatif dan ketidakpastian pada seluruh bursa dunia.
Sementara pada tahun 2013, di Indonesia terjadi tekanan terhadap Neraca Perdagangan. Defisit transaksi berjalan diprakirakan mencapai 3,5% dari Produk Domestik Bruto (PDB) lebih tinggi dari pada tahun 2012 yaitu sebesar 2,8%. Surplus di sisi transaksi modal dan finansial pun menurun. Demikian pula, nilai tukar rupiah terdepresiasi 26,4% di tahun 2013 dengan volatilitas yang meningkat. Meskipun demikian ekonomi Indonesia mampu mencatat pertumbuhan sebesar 5,7% (yoy).
Tahun 2014 ekonomi dunia diperkirakan melambat ditandai dengan sikap IMF yang telah memangkas proyeksi pertumbuhan ekonomi global dari 3,8% menjadi 3,6%. Perlambatan ini dikawatirkan akan berdampak buruk bagi makroekonomi domestik, terutama pada defisit neraca perdagangan. Berbagai langkah telah diambil pemerintah agar dapat menahan perlambatan pertumbuhan ekonomi, laju inflasi, kenaikan suku bunga dan pelemahan nilai tukar Rupiah. Dengan demikian, investors asing di harapkan dapat kembali berinvestasi di Indonesia.
Terdapat tantangan di dalam industri pasar modal Indonesia antara lain akan mulai diterapkan ASEAN Economic Community (AEC) pada tahun 2015 yang dapat menambah persaingan usaha khususnya pada Perusahaan Efek. Perusahaan Efek diharapkan dapat lebih meningkatkan profesionalismenya untuk mencapai “level of playing field”. Tantangan lainnya adalah pemberlakuan pungutan oleh OJK yang dimulai tanggal 1 Maret 2014 yang dirasa akan memberatkan pelaku industri keuangan dan pasar modal.
Terdapat peluang di industri pasar modal Indonesia yaitu pelaksanaan peraturan BEI atas satuan perdagangan dan fraksi perubahan harga saham yang mulai diberlakukan tanggal 6 Januari 2014 yang diperkirakan menjadi katalis positif untuk menopang IHSG dimana peraturan ini dapat membantu penyerapan jumlah Investor Saham di Indonesia terlebih dari Investor ritel.
Pelaksanaan Pemilihan Umum tahun 2014 terkait Visi dan Misi para Calon Presiden yang mampu membuat sentimen positif sehingga mendorong pergerakan IHSG dan memanfaatkan peluang pertumbuhan rata-rata laba bersih perusahaan tercatat.
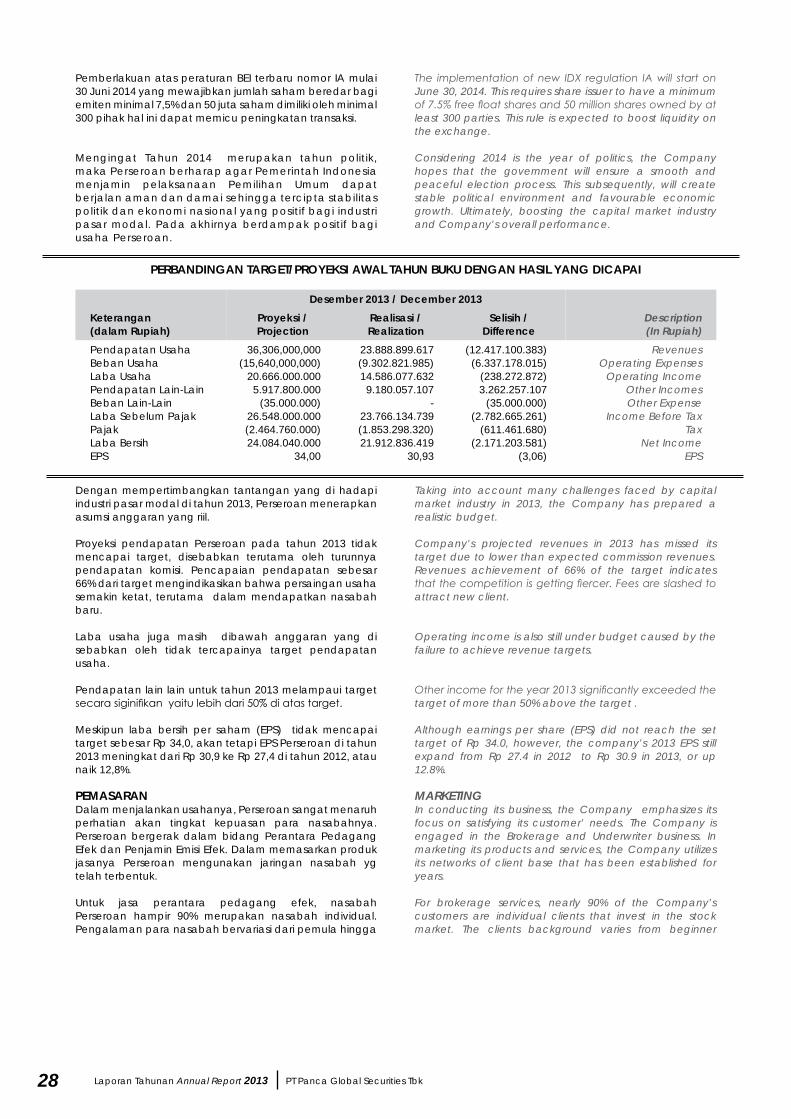
28 Laporan Tahunan Annual Report 2013 PT Panca Global Securities Tbk
The implementation of new IDX regulation IA will start on June 30, 2014. This requires share issuer to have a minimum of 7.5% free float shares and 50 million shares owned by at least 300 parties. This rule is expected to boost liquidity on the exchange.
Considering 2014 is the year of politics, the Company hopes that the government will ensure a smooth and peaceful election process. This subsequently, will create stable political environment and favourable economic growth. Ultimately, boosting the capital market industry and Company’s overall performance.
Taking into account many challenges faced by capital market industry in 2013, the Company has prepared a realistic budget.
Company’s projected revenues in 2013 has missed its target due to lower than expected commission revenues. Revenues achievement of 66% of the target indicates that the competition is getting fiercer. Fees are slashed to attract new client.
Operating income is also still under budget caused by the failure to achieve revenue targets.
Other income for the year 2013 significantly exceeded the target of more than 50% above the target .
Although earnings per share (EPS) did not reach the set target of Rp 34.0, however, the company’s 2013 EPS still expand from Rp 27.4 in 2012 to Rp 30.9 in 2013, or up 12.8%.
MARKETINGIn conducting its business, the Company emphasizes its focus on satisfying its customer’ needs. The Company is engaged in the Brokerage and Underwriter business. In marketing its products and services, the Company utilizes its networks of client base that has been established for years.
For brokerage services, nearly 90% of the Company’s customers are individual clients that invest in the stock market. The clients background varies from beginner
Pemberlakuan atas peraturan BEI terbaru nomor IA mulai 30 Juni 2014 yang mewajibkan jumlah saham beredar bagi emiten minimal 7,5% dan 50 juta saham dimiliki oleh minimal 300 pihak hal ini dapat memicu peningkatan transaksi.
Mengingat Tahun 2014 merupakan tahun politik, maka Perseroan berharap agar Pemerintah Indonesia menjamin pelaksanaan Pemilihan Umum dapat berjalan aman dan damai sehingga tercipta stabilitas politik dan ekonomi nasional yang positif bagi industri pasar modal. Pada akhirnya berdampak positif bagi usaha Perseroan.
Dengan mempertimbangkan tantangan yang di hadapi industri pasar modal di tahun 2013, Perseroan menerapkan asumsi anggaran yang riil.
Proyeksi pendapatan Perseroan pada tahun 2013 tidak mencapai target, disebabkan terutama oleh turunnya pendapatan komisi. Pencapaian pendapatan sebesar 66% dari target mengindikasikan bahwa persaingan usaha semakin ketat, terutama dalam mendapatkan nasabah baru.
Laba usaha juga masih dibawah anggaran yang di sebabkan oleh tidak tercapainya target pendapatan usaha.
Pendapatan lain lain untuk tahun 2013 melampaui target secara siginifikan yaitu lebih dari 50% di atas target.
Meskipun laba bersih per saham (EPS) tidak mencapai target sebesar Rp 34,0, akan tetapi EPS Perseroan di tahun 2013 meningkat dari Rp 30,9 ke Rp 27,4 di tahun 2012, atau naik 12,8%.
PEMASARAnDalam menjalankan usahanya, Perseroan sangat menaruh perhatian akan tingkat kepuasan para nasabahnya. Perseroan bergerak dalam bidang Perantara Pedagang Efek dan Penjamin Emisi Efek. Dalam memasarkan produk jasanya Perseroan mengunakan jaringan nasabah yg telah terbentuk.
Untuk jasa perantara pedagang efek, nasabah Perseroan hampir 90% merupakan nasabah individual. Pengalaman para nasabah bervariasi dari pemula hingga
PERBAnDinGAn TARGET/PRoYEKSi AWAL TAHUn BUKU DEnGAn HASiL YAnG DiCAPAi
Desember 2013 / December 2013Keterangan(dalam Rupiah)
Proyeksi / Projection
Realisasi / Realization
Selisih / Difference
Description(in Rupiah)
Pendapatan UsahaBeban UsahaLaba UsahaPendapatan Lain-LainBeban Lain-LainLaba Sebelum PajakPajakLaba BersihEPS
36,306,000,000 (15,640,000,000)
20.666.000.0005.917.800.000
(35.000.000)26.548.000.000(2.464.760.000)24.084.040.000
34,00
23.888.899.617(9.302.821.985)14.586.077.632
9.180.057.107-
23.766.134.739(1.853.298.320)21.912.836.419
30,93
(12.417.100.383)(6.337.178.015)
(238.272.872)3.262.257.107
(35.000.000)(2.782.665.261)
(611.461.680)(2.171.203.581)
(3,06)
RevenuesOperating Expenses
Operating IncomeOther IncomesOther Expense
Income Before TaxTax
Net IncomeEPS

29PT Panca Global Securities Tbk Laporan Tahunan Annual Report 2013
to experience. In conducting brokerage services, the Company implements a personal approach basis. Every sales staff maintains a portfolio of clients that becomes his/her responsibility. Consequently, this ensure that the sales staffs know the characters of their individual client and how to satisfy their clients needs in order to perform the right investment decision.
For the Underwriter services, the strategy taken by the Company is targeting prospective share issuers through establishment of joint syndication. In addition, the company also actively participates in syndication of public offering of shares and bonds.
DIVIDEND POLICYThe Company plans to pay dividends at least once a year, depending on the financial condition of the Company during the respective year.
MATERIAL INFORMATIONThe Company has no material infomation on investment, expansion, divestation, merger, acquisition, capital/debt restructuring, conflicting transaction and transaction withaffiliated party on year ended.
The realization of the use of funds The company has published the report on the realization of the use of funds from the public offering in accordance with the regulation no. X.K.4. letter with number No. 116/PGS /VI/2005 on 29 June 2005 and has been used at the time.
The company stated that there was no change in the use of funds as stated in the prospectus of the company’s initial public offering.
Changes in laws and regulations that significantly influence the company and its impact on the financial statements
Rules that significantly impact the company’s financial statements is the Regulation of Indonesian Republic Government No. 11 year 2014 on OJK Fee. This affects to the Company’s additional operating expenses.
Changes in accounting policyThere is no change in accounting policy that affect the financial statements.
berpengalaman. Dalam menjalankan usahanya, Perseroan melakukan strategi pelayanan dengan pendekatan pribadi. Setiap staf pemasaran memiliki portofolio nasabah yang menjadi tanggung jawabnya. Dengan demikian, setiap staf pemasaran dapat mengetahui karakter masing-masing nasabahnya dan tingkat layanan yang diperlukan agar nasabah dapat mengambil keputusan investasi yang tepat.
Untuk jasa Penjamin Emisi Efek, strategi yang diterapkan oleh Perseroan dalam membidik calon emiten adalah menjalin dan membentuk kemitraan melalui pembentukan sindikasi bersama. Perseroan secara aktif ikut berpartisipasi dalam sindikasi penawaran umum saham maupun obligasi.
KEBiJAKAn DiViDEnPerseroan merencanakan untuk membayarkan dividen sekurang-kurangnya sekali dalam setahun, tergantung pada kondisi keuangan Perseroan dalam tahun yang bersangkutan.
inFoRMASi MATERiALPerseroan tidak memiliki informasi material mengenai investasi, ekspansi, divestasi, penggabungan/ peleburan usaha, akusisi, restrukturisasi utang/ modal, transaksi afiliasi dan transaksi yang mengandung benturan kepentingan yang terjadi pada tahun buku.
Realisasi Penggunaan DanaPerseroan telah menyampaikan laporan Realisasi Penggunaan Dana Hasil Penawaran Umum sesuai dengan Peraturan No. X.K.4. dengan nomor surat No. 116/PGS-Umum/VI/2005 pada tanggal 29 Juni 2005 dan telah habis terpakai pada saat itu.
Perseroan menyatakan bahwa tidak terdapat perubahan penggunaan dana sebagaimana tercantum pada Prospektus Penawaran Umum Perdana Saham Perseroan.
Perubahan peraturan perundang-undangan yang berpengaruh signifikan terhadap perusahaan dan dampaknya terhadap laporan keuangan Peraturan perundang-undangan yang berpengaruh terhadap laporan keuangan Perseroan adalah Peraturan Pemerintah Republik Indonesia No. 11 tahun 2014 tentang Pungutan oleh OJK. Hal ini berpengaruh terhadap pos biaya operasional.
Perubahan kebijakan akuntansiTidak terdapat perubahan kebijakan akuntansi yang berpengaruh terhadap laporan keuangan.
Tahun Buku 2012 2011 2010 Financial YearLaba Bersih (Rp. Juta)Dividen (Rp. Juta)Dividen per Saham (Rp.)Rasio Pembayaran (%)
19.3857.081
1036,60
20.1192.883
414,08
18.2245.397
829,61
Net income (Rp. Million)Devidend (Rp. Million)
Devidend per Share (Rp.)Pay Out Ratio (%)

30 Laporan Tahunan Annual Report 2013 PT Panca Global Securities Tbk
The application of good corporate governance (GCG) is as a form of compliance to regulations that have been set. Corporate governance practices are essential to enhance performance and provide a good service to all customers. Good GCG, can reduce the risk of certain adverse risks-operational and financial performance of the company.
GCG is implemented at the general meeting of shareholders), Board of Commissioners and the Board of Directors and the Audit Committee. The sequential structure of corporate governance is the general meeting of shareholders, Board of Commissioners, and the Board of Directors. The highest authority and the main decision-making forum is the Annual GENERAL MEETING OF SHAREHOLDERS is held once a year. Through the meeting of the shareholders can exercise his right to make decisions, and make an endorsement of various company policies.
Board of CommissionersThe Board of Commissioners are representatives of the company’s shareholders. The Board of Commissioners has the responsibility to supervise the management of the Company that are performed by the directors and also provide advice to the directors.
The main duties of a Board of Commissioners as stipulated in the Company’s Articles of Association are as follows :
• Board of Commissioner supervises on the management‘s policies in general, about the company or business company and giving advice to the Board of Directors.
• Board of Commissioners has the right to enter the company during the office hours and has the right to check its financial statements, documents and other evidences, checking and balancing the cash situation and has the right to know every acts of the Board of Directors
• And all other matters that are related to the Company’s management.
Candidate for commissioners could be proposed by all shareholders whereas the independent commissioner could only be proposed by the minority shareholders. The names of the member of commissioners have to be submitted to the Capital Market Supervisor Agency to get its approval. Members of the commissioners must have a good personality, be able to act judicially, never being stated of bankruptcy and never been punished for any financial crime. Commissioners can then be appointed and released by the General Shareholders Meeting
Remuneration and Compensation Board of CommissionersIn 2013, the Board of Commissioners received a total of Rp 0.1 billion in total salaries, remuneration and other compensation.
Remuneration of members of the Board of Commissioners and the Board of Directors is carried out by:• Remuneration for members of the Board of Commissioners
is granted on the basis of the formula set by the Annual General Shareholders Meeting.
Penerapan tata kelola perusahaan yang baik (GCG) adalah sebagai wujud kepatuhan pada peraturan yang telah ditetapkan. Penerapan tata kelola perusahaan sangat penting untuk meningkatkan kinerja dan memberikan pelayanan yang baik kepada seluruh nasabah. GCG yang baik, dapat mengurangi risiko-risiko tertentu yang merugikan operasional dan kinerja keuangan perusahaan.
GCG tersebut diterapkan pada Rapat Umum Pemegang Saham (RUPS), Dewan Komisaris dan Direksi dan Komite Audit. Secara berurutan struktur tata kelola perusahaan adalah Rapat Umum Pemegang Saham (RUPS), Dewan Komisaris, dan Direksi. Otoritas tertinggi dan forum utama pengambilan keputusan adalah RUPS Tahunan yang diselenggarakan sekali dalam setahun. Melalui rapat tersebut para pemegang saham dapat menggunakan haknya untuk menghasilkan keputusan, dan membuat pengesahan atas berbagai kebijakan perusahaan.
Dewan KomisarisDewan Komisaris merupakan perwakilan dari seluruh pemegang saham Perseroan. Dewan Komisaris bertugas untuk mengawasi pengurusan Perseroan yang dilakukan oleh Direksi dan memberikan nasihat kepada Direksi.
Tugas pokok Dewan Komisaris sebagaimana ditetapkan didalam Anggaran Dasar Perseroan adalah sebagai berikut :
• Dewan Komisaris melakukan pengawasan atas kebijakan pengurusan jalannya pengurusan pada umumnya, baik mengenai Perseroan maupun usaha Perseroan, dan memberi nasehat kepada Direksi.
• Dewan Komisaris setiap waktu dalam jam kerja Perseroan berhak memasuki bangunan dan halaman atau tempat lain yang dipergunakan atau yang dikuasai oleh Perseroan dan berhak untuk memeriksa semua pembukuan, surat dan alat bukti lainnya, memeriksa dan mencocokan keadaan uang kas dan lain-lain serta berhak untuk mengetahui segala tindakan yang telah dijalankan oleh Direksi.
• Dan hal-hal lain yang berkaitan dengan pengelolaan Perseroan.
Calon anggota komisaris dapat diajukan oleh seluruh pemegang saham, sementara calon anggota komisaris independen hanya dapat diajukan oleh pemegang saham minoritas. Seluruh nama calon anggota komisaris tersebut harus diajukan terlebih dahulu kepada Otoritas Jasa Keuangan (OJK) untuk mendapatkan persetujuan. Calon anggota komisaris harus memiliki akhlak dan moral yang baik, mampu melaksanakan perbuatan hukum, tidak pernah dinyatakan pailit dan tidak pernah dihukum karena melakukan tindak pidana di bidang keuangan. Selanjutnya Komisaris diangkat dan diberhentikan oleh Rapat Umum Pemegang Saham.
Remunerasi dan Kompensasi Dewan KomisarisDi tahun 2013, Dewan Komisaris menerima total Rp 0,1 miliar dalam bentuk gaji, remunerasi dan tunjangan lainnya.
Remunerasi Anggota Dewan Komisaris dan Direksi dilakukan dengan:• Remunerasi bagi anggota Dewan Komisaris diberikan
dengan basis formula yang di tetapkan oleh RUPS.
Tata Kelola Perusahaan
Corporate Governance
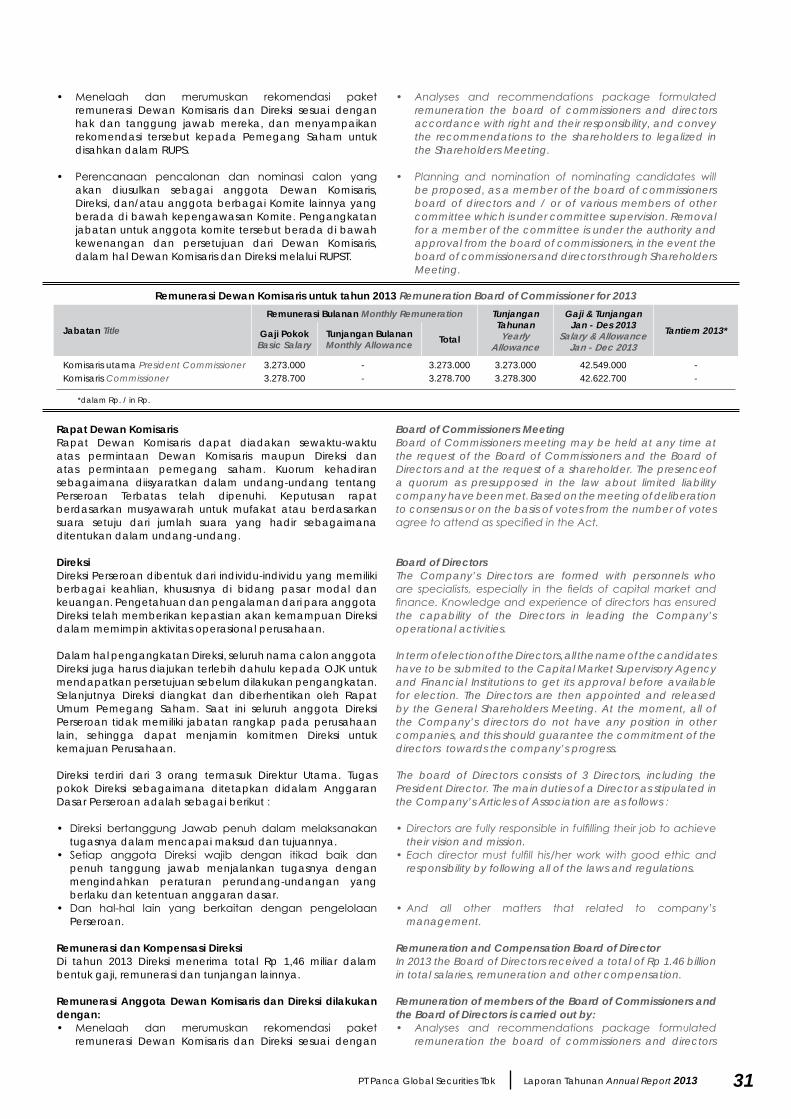
31PT Panca Global Securities Tbk Laporan Tahunan Annual Report 2013
• Analyses and recommendations package formulated remuneration the board of commissioners and directors accordance with right and their responsibility, and convey the recommendations to the shareholders to legalized in the Shareholders Meeting.
• Planning and nomination of nominating candidates will be proposed, as a member of the board of commissioners board of directors and / or of various members of other committee which is under committee supervision. Removal for a member of the committee is under the authority and approval from the board of commissioners, in the event the board of commissioners and directors through Shareholders Meeting.
Board of Commissioners MeetingBoard of Commissioners meeting may be held at any time at the request of the Board of Commissioners and the Board of Directors and at the request of a shareholder. The presenceof a quorum as presupposed in the law about limited liability company have been met. Based on the meeting of deliberation to consensus or on the basis of votes from the number of votes agree to attend as specified in the Act.
Board of DirectorsThe Company’s Directors are formed with personnels who are specialists, especially in the fields of capital market and finance. Knowledge and experience of directors has ensured the capability of the Directors in leading the Company’s operational activities.
In term of election of the Directors, all the name of the candidates have to be submited to the Capital Market Supervisory Agency and Financial Institutions to get its approval before available for election. The Directors are then appointed and released by the General Shareholders Meeting. At the moment, all of the Company’s directors do not have any position in other companies, and this should guarantee the commitment of the directors towards the company’s progress.
The board of Directors consists of 3 Directors, including the President Director. The main duties of a Director as stipulated in the Company’s Articles of Association are as follows :
• Directors are fully responsible in fulfilling their job to achieve their vision and mission.
• Each director must fulfill his/her work with good ethic and responsibility by following all of the laws and regulations.
• And all other matters that related to company’s management.
Remuneration and Compensation Board of DirectorIn 2013 the Board of Directors received a total of Rp 1.46 billion in total salaries, remuneration and other compensation.
Remuneration of members of the Board of Commissioners and the Board of Directors is carried out by:• Analyses and recommendations package formulated
remuneration the board of commissioners and directors
• Menelaah dan merumuskan rekomendasi paket remunerasi Dewan Komisaris dan Direksi sesuai dengan hak dan tanggung jawab mereka, dan menyampaikan rekomendasi tersebut kepada Pemegang Saham untuk disahkan dalam RUPS.
• Perencanaan pencalonan dan nominasi calon yang akan diusulkan sebagai anggota Dewan Komisaris, Direksi, dan/atau anggota berbagai Komite lainnya yang berada di bawah kepengawasan Komite. Pengangkatan jabatan untuk anggota komite tersebut berada di bawah kewenangan dan persetujuan dari Dewan Komisaris, dalam hal Dewan Komisaris dan Direksi melalui RUPST.
Rapat Dewan Komisaris Rapat Dewan Komisaris dapat diadakan sewaktu-waktu atas permintaan Dewan Komisaris maupun Direksi dan atas permintaan pemegang saham. Kuorum kehadiran sebagaimana diisyaratkan dalam undang-undang tentang Perseroan Terbatas telah dipenuhi. Keputusan rapat berdasarkan musyawarah untuk mufakat atau berdasarkan suara setuju dari jumlah suara yang hadir sebagaimana ditentukan dalam undang-undang.
Direksi Direksi Perseroan dibentuk dari individu-individu yang memiliki berbagai keahlian, khususnya di bidang pasar modal dan keuangan. Pengetahuan dan pengalaman dari para anggota Direksi telah memberikan kepastian akan kemampuan Direksi dalam memimpin aktivitas operasional perusahaan.
Dalam hal pengangkatan Direksi, seluruh nama calon anggota Direksi juga harus diajukan terlebih dahulu kepada OJK untuk mendapatkan persetujuan sebelum dilakukan pengangkatan. Selanjutnya Direksi diangkat dan diberhentikan oleh Rapat Umum Pemegang Saham. Saat ini seluruh anggota Direksi Perseroan tidak memiliki jabatan rangkap pada perusahaan lain, sehingga dapat menjamin komitmen Direksi untuk kemajuan Perusahaan.
Direksi terdiri dari 3 orang termasuk Direktur Utama. Tugas pokok Direksi sebagaimana ditetapkan didalam Anggaran Dasar Perseroan adalah sebagai berikut :
• Direksi bertanggung Jawab penuh dalam melaksanakan tugasnya dalam mencapai maksud dan tujuannya.
• Setiap anggota Direksi wajib dengan itikad baik dan penuh tanggung jawab menjalankan tugasnya dengan mengindahkan peraturan perundang-undangan yang berlaku dan ketentuan anggaran dasar.
• Dan hal-hal lain yang berkaitan dengan pengelolaan Perseroan.
Remunerasi dan Kompensasi Direksi Di tahun 2013 Direksi menerima total Rp 1,46 miliar dalam bentuk gaji, remunerasi dan tunjangan lainnya.
Remunerasi Anggota Dewan Komisaris dan Direksi dilakukan dengan:• Menelaah dan merumuskan rekomendasi paket
remunerasi Dewan Komisaris dan Direksi sesuai dengan
Remunerasi Dewan Komisaris untuk tahun 2013 Remuneration Board of Commissioner for 2013
Jabatan Title
Remunerasi Bulanan Monthly Remuneration Tunjangan TahunanYearly
Allowance
Gaji & Tunjangan Jan - Des 2013
Salary & Allowance Jan - Dec 2013
Tantiem 2013*Gaji PokokBasic Salary
Tunjangan Bulanan Monthly Allowance Total
Komisaris utama President CommissionerKomisaris Commissioner
3.273.0003.278.700
--
3.273.0003.278.700
3.273.0003.278.300
42.549.00042.622.700
--
*dalam Rp. / in Rp.

32 Laporan Tahunan Annual Report 2013 PT Panca Global Securities Tbk
accordance with right and their responsibility, and convey the recommendations to the shareholders to legalized in the Shareholders Meeting.
• Planning and nomination of nominating candidates will be proposed, as a member of the board of commissioners board of directors and / or of various members of other committee which is under committee supervision. Removal for a member of the committee is under the authority and approval from the board of commissioners, in the event the board of commissioners and directors through Shareholders Meeting.
Performance assessment system and the remuneration of the Board of Directors is carried out by:• Shareholders assess the performance of the Board of
Directors as a whole and each Member of the Board of Directors through the mechanism of the Shareholders Meeting.
• Individual Assessment for each Member of the Board of Directors is performed by the President Director and reported to the GMS when they and considered.
• The assessment performance of directors to base calculations remuneration of directors.
• Remuneration of the Board of Directors must be able to motivate the directors to achieve long-term growth and success of the company in a controlled framework.
Meeting of DirectorsMeeting by the Boardof Directors is always held periodically as well as temporarily, to anticipate each progress that might be related to the Company promptly and accurately. Periodic meeting has been held at the middle of each month.
Decision of the Shareholders Meeting of the previous year and its realization in the year book
The company has realized the decision of annual meeting of shareholders on year 2013, according to annual meeting of shareholders deed No. 31 dated May 10, 2013.
Audit CommitteeAudit Committee is a Committee established by and responsible to the Board of Commissioners in order to help carry out the duties and functions of the Board of Commissioners.
The Audit Committee assists the Board of Commissioners in carrying out the functions monitoring and carry out a review of the integrity of the financial statements; risk management and internal control; compliance with the provisions of law and legislation; performance, qualifications and independence of the external auditor; and implementation of the internal audit function. The Audit Committee is coordinating its work closely with the Internal Audit Unit and External Auditors.
Profile of Audit CommitteeChengwy Karlam, Head of Audit Committee Indonesian citizen, born in Makassar in 1970. Bachelor of Commerce and Bachelor of Arts from Curtin University – Australia. Began his carrier from 1995 to 1997 as Director of
hak dan tanggung jawab mereka, dan menyampaikan rekomendasi tersebut kepada Pemegang Saham untuk disahkan dalam RUPS.
• Perencanaan pencalonan dan nominasi calon yang akan diusulkan sebagai anggota Dewan Komisaris, Direksi, dan/atau anggota berbagai Komite lainnya yang berada di bawah kepengawasan Komite. Pengangkatan jabatan untuk anggota komite tersebut berada di bawah kewenangan dan persetujuan dari Dewan Komisaris, dalam hal Dewan Komisaris dan Direksi melalui RUPST.
Sistem Penilaian Kinerja dan Remunerasi Direksi dilakukan dengan :• Pemegang Saham menilai kinerja Direksi secara keseluruhan
dan masing-masing anggota Direksi melalui mekanisme RUPS.
• Penilaian individual untuk tiap anggota Direksi dilakukan
oleh Direktur Utama dan dilaporkan kepada RUPS untuk ditelaah dan dipertimbangkan.
• Hasil penilaian kinerja Direksi menjadi dasar perhitungan remunerasi Direksi.
• Remunerasi Direksi harus dapat memotivasi Direksi untuk mencapai pertumbuhan jangka panjang dan kesuksesan Perusahaan dalam kerangka kerja yang terkontrol.
Rapat DireksiRapat Direksi selalu dilaksanakan secara rutin maupun temporer, guna mengantisipasi secara cepat dan akurat atas setiap perkembangan yang terjadi berkaitan dengan perusahaan. Rapat yang dilakukan secara rutin telah dilaksanakan setiap pertengahan bulan.
Keputusan Rapat Umum Pemegang Saham tahun sebelumnya dan realisasinya pada tahun buku
Perseroan telah merealisasikan keputusan Rapat Umum Pemegang Saham Tahunan pada tahun buku 2013, sesuai dengan Akta Berita Acara Rapat Umum Pemegang Saham Tahunan Perseroan No. 31 tanggal 10 Mei 2013.
Komite AuditKomite Audit adalah komite yang dibentuk oleh dan bertanggung jawab kepada Dewan Komisaris dalam rangka membantu melaksanakan tugas dan fungsi Dewan Komisaris.
Komite Audit membantu Dewan Komisaris dalam menjalankan fungsi kepengawasannya dengan melaksanakan kajian atas integritas laporan keuangan; manajemen risiko dan pengendalian internal; kepatuhan terhadap ketentuan hukum dan perundang-undangan; kinerja, kualifikasi dan independensi auditor eksternal; dan implementasi dari fungsi audit internal. Komite Audit mengkoordinasikan tugasnya secara erat dengan Unit Internal Audit dan Auditor Eksternal.
Profil Komite AuditChengwy Karlam, Ketua Komite Audit Warga Negara Indonesia, lahir di Makassar tahun 1970. Lulus dari Sarjana Perdagangan dan Sarjana Kesenian dari Curtin University-Australia. Memulai karir pada tahun 1995 – 1997
Rapat Direksi The Board of Directors Meeting
nama / Name Jumlah Rapat / Number of Meeting Kehadiran / Attendance
Hendra H. KustarjoTrisno LimantoTheresia Yolanda Mangundap
121212
100%100%100%

33PT Panca Global Securities Tbk Laporan Tahunan Annual Report 2013
PT. Diana Indonesia. In 1997 to 2001, as Head of Research of PT. Panin Sekuritas Tbk. In 2001 to 2003, as Institutional Research Analyst of PT. G.K.Goh Indonesia. In 2003 till now, as Founder of Yayasan Pendidikan Global. In 2003 to 2004, as Fund Manager of the Company. In 2005 to 2006, as Consultant to the Special Staff of the Coordinating Minister for Economic Affairs, on behalf of the World Bank. In 2004 to 2009, as Director of PT. Independent Research & Advisory Indonesia. Since June 2010 till now, as President Commissioner of The Company. Since June 2010 till now, as Head of Audit Committee of the Company.
Unikasari Setio, MemberIndonesian Citizen, born in Jakarta in 1959. Graduated in Economics from Trisakti University in 1984. Began her carrier in 1982 to 1983, as Lecture Assistant of Trisakti University. In 1983 to 1985, as Junior Auditor of Internal Audit Division of PT. Inti Salim Corp. In 1985 to 1986, as Accountant of Reading & Bates Oil Exploration. In 1986 to 1993, as Finance/ Accounting of Salim Group. In 1993 to 2004, as Director of PT. Cipta Mustika. In 2004 till now, as Director of PT. Usaha Kita Makmur Indonesia. Since January 2010 till now, as Member of Audit Committee.
Arriany Simajuntak, MemberIndonesian Citizen, born in Jakarta in 1969. Graduated in Master Degree IMNI Jakarta in 2004. Began her carrier in 1991 to 1995 as Accounting of PT Bank Central Asia. In 1995 to 2000, as Settlement and Reconcilement Standard Chartered Bank. In 2001 – 2003 as Complaint handling officer Standard Chartered Bank. In 2004 – 2005 as Credit Card Product Officer. In 2005 – 2010 as Marketing Communication Manager Standard Charterd Bank. In 2011 till now own Business Batik. In January 2012 till now as Marketing Product PT UKM Indonesia. In October 2012 till now as member of Audit Committee.
The period of service of the Audit Committee should not be longer than the term of the Board of Commissioners as set forth in the articles of Association and can be re-elected for only one subsequent period.
The Audit Committee is responsible and accountable for delivering a professional and independent opinion to the Board of Commissioners with respect to reports or matters submitted by the Board of Directors to the Board of Commissioners, and carry out other tasks relating to the duties of the Commissioner.
The company has no other committee beside audit committee.
The Independent Audit Committee StatementThe Audit Committee is in charge of and responsible for providing a professional and independent opinion to the Board of Commissioners with respect to reports or matters submitted by the Board of Directors to the Board of Commissioners, and carry out other tasks relating to the Commissioner duties.
sebagai Direktur PT Diana Indonesia. Tahun 1997 – 2001 sebagai Head of Research PT Panin Sekuritas Tbk. Tahun 2001 – 2003 sebagai Institutional Research Analyst PT G.K. Goh Indonesia. Tahun 2003 – Sekarang sebagai Pendiri Yayasan Pendidikan Global. Tahun 2003 – 2004 sebagai Fund Manager Perseroan. Tahun 2005 – 2006 sebagai Consultant to the Special Staff of the Coordinating Minister for Economic Affairs, The World Bank. Tahun 2004 – 2009 sebagai Direktur PT Independent Research & Advisory Indonesia. Sejak Juni 2010 – Sekarang sebagai Komisaris Utama Perseroan. Sejak Juni 2010 - Sekarang sebagai Ketua Komite Audit Perseroan.
Unikasari Setio, AnggotaWarga Negara Indonesia, lahir di Jakarta tahun 1959. Lulus dari Fakultas Ekonomi Jurusan Akuntansi, Universitas Trisakti tahun 1984. Memulai karir pada tahun 1982 – 1983 sebagai Asisten Dosen Universitas Trisakti. Tahun 1983 – 1985 sebagai Junior Auditor Internal Audit Divison PT Inti Salim Corp. Tahun 1985 – 1986 sebagai Accountant, Reading & Bates Oil Exploration. Tahun 1986 – 1993 sebagai Finance/ Accounting, Salim Group. Tahun 1993 – 2004 sebagai Direktur PT Cipta Mustika. Tahun 2004 – Now sebagai Direktur PT Usaha Kita Makmur Indonesia. Sejak Januari 2010 – Sekarang sebagai Anggota Komite Audit Perseroan.
Arriany Simajuntak, AnggotaWarga Negara Indonesia, lahir di Jakarta tahun 1969. memperoleh gelar Master of Business Administration IMNI Jakarta tahun 2004. Memulai karir pada tahun 1991 – 1995 sebagai Accounting PT Bank Central Asia. Tahun 1995 – 2000 sebagai Settlement and Reconcilement Standard Chartered Bank. Tahun 2001 – 2003 sebagai Complaint handling officer Standard Chartered Bank. Tahun 2004 – 2005 sebagai Credit Cards Product Officer. Tahun 2005 – 2010 sebagai Marketing Communication Manager Standard Chareterd Bank. Tahun 2011 – sekarang memiliki bisnis Batik. Pada Bulan Januari 2012 – sekarang sebagai Marketing Product PT UKM Indonesia. Pada bulan Oktober 2012 – sekarang sebagai Anggota Komite Audit Perseroan.
Masa tugas Komite Audit tidak boleh lebih lama dari masa jabatan Dewan Komisaris sebagaimana diatur dalam Anggaran Dasar dan dapat dipilih kembali hanya untuk satu periode berikutnya.
Komite Audit bertugas dan bertanggung jawab untuk memberikan pendapat profesional dan independen kepada Dewan Komisaris terhadap laporan atau hal-hal yang disampaikan oleh Direksi kepada Dewan Komisaris, dan melaksanakan tugas-tugas lain yang berkaitan dengan tugas komisaris.
Perseroan tidak memiliki komite lain selain Komite Audit.
Pernyataan independen Komite AuditKomite Audit bertugas dan bertanggung jawab untuk memberikan pendapat profesional dan independen kepada Dewan Komisaris terhadap laporan atau hal-hal yang disampaikan oleh Direksi kepada Dewan Komisaris, dan melaksanakan tugas-tugas lain yang berkaitan dengan tugas komisaris.
Rapat Komite Audit The Board of Audit Committee Meeting
nama / Name Jumlah Rapat / Number of Meeting Kehadiran / Attendance
Chengwy Karlam Unikasari SetioArriany Simajuntak
444
100%100%100%

34 Laporan Tahunan Annual Report 2013 PT Panca Global Securities Tbk
All members of the Audit Committee are independent so they do not have a financial relationship, management, ownership and/or family relations with the Board of Commissioners, the Board of Directors and/or Controlling Shareholders or relationships with PT Panca Global Securities Tbk which may affect their action to act independently. Composition, qualifications and independence of the Audit Committee have been in accordance with the regulations of Bank Indonesia and Bapepam and LK.
Corporate SecretaryThe Company has appointed its Corporate Secretary since becoming a public company and listed its shares in Indonesia Stock Exchange in 2005. Corporate Secretary has the responsibility to monitor any progress in the capital market, especially on regulations on capital market, give services to the public for information related to the Company’s condition, give input to directors in complying with capital market regulations, and as the intermediary between the Company and the Capital Market Supervisory Agency and Financial Institutions, as well as the Indonesia Stock Exchange and public.
Corporate Secretary ProfileHendra H. KustarjoIndonesian Citizen, born in Bogor in 1964. Graduated in Economics from Trisakti University Jakarta in 1990. Began his carrier in 1987to1989 as Auditor in Public Accountant Firm Johan, Malonda & Rekan (Correspondent of Ernst & Whinney) in Jakarta. In 1989 to 1990 in Public Accountant Firm Drs. Hadi Sutanto (Correspondent of Price WaterHouse). In 1990 to1992, as Head of Operation Department of PT. Nomura Indonesia. In 1992 to1995, as Head of Capital Market & Corporate Finance Department of PT. Nomura Indonesia. In 1995 to 2001, in PT. Panin Sekuritas Tbk. with last position as Vice President Director. In 2001 to 2002, as Senior Advisor Investment Banking for PT. Kresna Graha Sekurindo Tbk. In 2002 to 2004, as President Commissioner of PT. Emperor Finance Indonesia Tbk. In 2002 to 2004, as President Commissioner of PT. Panca Global Securities and since May 2004 till present, as President Director of PT. Panca Global Securities Tbk. Since October 2004 till present, as Corporate Secretary of PT. Panca Global Securities Tbk. Since 2003 to 2005, as member of Business Development Committee of The Jakarta Stock Exchange. Since 2003 to present, as Member of Underwriting Department for the Association of Indonesian Securities Companies. Since September 2013 to present as Member of Membership Discipline Commitee of PT Bursa Efek Indonesia.
Based on the letter of appointment of Directors No.: 111/PGS-CF/X/2004 of 8 October 2004, appointing Hendra H. Kustarjo as the Corporate Secretary adjusted to the respective tenure as President Director of the company up to General Shareholders Meeting in 2014.
The Corporate Secretary is responsible for several functions related to aspects of compliance and information disclosure. The Company Secretary ensures that the principles of Good Corporate Governance have been understood and applied consistently in the Company.
The Corporate Secretary is also the communicator with parties OJK and Indonesia stock exchange as well as the community, Corporate Secretary ensures that the management of the company to know the development of the regulation of capital markets regulation.
Seluruh anggota Komite Audit adalah independen sehingga tidak memiliki hubungan keuangan, kepengurusan, kepemilikan saham dan/ atau hubungan keluarga dengan Dewan Komisaris, Direksi dan/ atau Pemegang Saham Pengendali atau hubungan dengan PT Panca Global Securities Tbk yang dapat mempengaruhi kemampuannya untuk bertindak independen. Komposisi, kualifikasi dan independensi Komite Audit telah sesuai dengan Peraturan Bank Indonesia maupun Peraturan Bapepam dan LK.
Sekretaris PerusahaanPerseroan telah memiliki Sekretaris Perusahaan sejak Perseroan menjadi perusahaan publik dan mencatatkan sahamnya di Bursa Efek Indonesia pada tahun 2005. Sekretaris Perusahaan mempunyai tugas antara lain mengikuti perkembangan pasar modal khususnya peraturan-peraturan yang berlaku di bidang pasar modal, memberikan pelayanan kepada masyarakat atas setiap informasi yang berkaitan dengan kondisi Perseroan, memberi masukan kepada Direksi dalam mematuhi ketentuan pasar modal, serta sebagai penghubung antara Perseroan dengan OJK, Bursa Efek Indonesia dan masyarakat.
Profil Sekretaris Perusahaan Hendra H. KustarjoWarga Negara Indonesia, lahir di Bogor tahun 1964. Lulus dari Universitas Trisakti, Fakultas Ekonomi Jurusan Akuntansi pada tahun 1990. Memulai karirnya pada tahun 1987 – 1989 sebagai Auditor di Kantor Akuntan Publik Johan, Malonda & Rekan (Koresponden Ernst & Whinney) Jakarta. Tahun 1989 – 1990 di Kantor Akuntan Publik Drs Hadi Sutanto (Koresponden Price Waterhouse). Tahun 1990 – 1992 sebagai Head of Operation Department PT. Nomura Indonesia. Tahun 1992 – 1995 sebagai Head of Capital Market & Corporate Finance Department PT. Nomura Indonesia. Tahun 1995 – 2001 berkarir di PT. Panin Sekuritas Tbk dengan jabatan terakhir sebagai Vice President Director. Tahun 2001- 2002 sebagai Senior Advisor Investment Banking PT. Kresna Graha Sekurindo Tbk. Tahun 2002- 2004 sebagai Presiden Komisaris PT Emperor Finance Indonesia Tbk. Pada tahun 2002 – 2004 sebagai Presiden Komisaris Perseroan dan sejak bulan Mei 2004 - sekarang menjadi Direktur Utama Perseroan. Pada tahun 2003 – 2005 sebagai anggota Komite Pengembangan Usaha PT Bursa Efek Jakarta.Pada Oktober 2004 – sekarang merangkap jabatan sebagai Sekretaris Perseroan. Jabatan lainnya sejak tahun 2003 – Sekarang menjadi Anggota Departemen Penjamin Emisi dari Asosiasi Perusahaan Efek Indonesia. Sejak bulan September 2013 sampai dengan sekarang sebagai Anggota Komite Disiplin Anggota PT Bursa Efek Indonesia.
Berdasarkan Surat Penunjukkan Direksi No.: 111/PGS-CF/X/2004 tanggal 8 Oktober 2004, menunjuk Saudara Hendra H. Kustarjo sebagai Corporate Secretary disesuaikan dengan masa jabatan yang bersangkutan sebagai Direktur Utama Perseroan yaitu sampai dengan Rapat Umum Pemegang Saham pada tahun 2014.
Sekretaris Perusahaan bertanggung jawab atas beberapa fungsi yang terkait dengan aspek kepatuhan dan keterbukaan informasi. Sekretaris Perusahaan memastikan bahwa prinsip-prinsip Good Corporate Governance telah dipahami dan diterapkan secara konsisten di Perusahaan.
Sekretaris Perusahaan juga sebagai pihak penghubung dengan OJK dan Bursa Efek Indonesia serta masyarakat, Sekretaris Perusahaan memastikan bahwa manajemen perusahaan untuk mengetahui perkembangan peraturan – peraturan pasar modal.

35PT Panca Global Securities Tbk Laporan Tahunan Annual Report 2013
Following some Corporate Secretary duties:a. Attendance at Board of Directors ‘ meetings and preparing
minutes of meetings; b. Be responsible for conducting general meetings of
shareholders; c. Find out information that affects the development of the
capital market, particularly the regulations that affect the market;
d. Know the condition of the public company Issuers so as to provide services and information to the public and investors;
e. Responsible for relations between the company and the general public with OJK as representative of Public companies.
Unit Internal AuditInternal Audit is an activity grant of conviction (assurance) and consulting that is independent and objective, which was created to increase value and improve the operations of the company.
The internal audit Unit is a unit of work in the public company Issuers or running the Internal Audit function.
The activity of the Internal Audit Unit to help the company achieve the goal through a systematic and controlled approach to evaluate and improve the effectiveness of risk management and internal control.
Erick T. TjandraIndonesia citizen, born in Bogor in 1970. Unika Atmajaya University, Jakarta, majoring in accounting in 1996. Began his career the 1993-1996 as Senior Auditor in Public Accounting Firm Prasetio Utomo. 1996 - 1998 as Accounting PT Pindo Deli Manager at Pulp & Paper Mills - Sinar Mas Group. 1998 - 2000 as Finance Accounting Manager PT Univenus & Co and PT Paperindo Perkasa Asia - Sinar Mas Group. 2000 - 2001 as Chief Financial Officer of PT Univenus & Co Sinar Mas Group. 2001 - 2007 as Director of PT Berlian Mulya Persada. 2005 - 2009 as Deputy Director of Finance & Accounting PT Adibaladika Agung and Director of PT Multi Unggul Sejahtera Utama. Year 2009 - October 2012 as the Controller at PT Interkayu Nusantara. Now in 2011 as Controller at PT Sentra Niaga Bersama. September 2011- present as the Internal Audit of the company.
The requirements of the auditor who is sitting in the activity of the Internal Audit Unita. Have integrity and professional conduct, independent,
honest and objective in the performance of his duties;
b. Have the knowledge and experience of the technical audits and other disciplines that are relevant to the field of duty;
c. Have the knowledge about the laws and regulations on capital market and other related legislation;
d. Have the proficiencty to interact and communicate with either oral or written effectively;
e. Comply with standards released by the profession of Internal Audit
f. Comply with the code of ethics the internal audit g. Maintaining the confidentiality of the information and/
or data related to the company’s implementation of the duties and responsibilities of the Internal Audit unless required by laws and regulations or the determination/court rulings;
h. Understanding the principles of risk management; i. Increase the knowledge, skills and abilities of profesionalisme
constantly.
Berikut ini beberapa tugas Sekretaris Perusahaan lainnya, yaitu :a. Hadir pada pertemuan Direksi dan menyiapkan notulen
rapat;b. Bertanggung jawab atas penyelenggaraan Rapat Umum
Pemegang Saham;c. Mengetahui perkembangan informasi yang mempengaruhi
Pasar Modal, khususnya peraturan yang mempengaruhi pasar;
d. Mengetahui kondisi Perusahaan Publik Emiten sehingga dapat memberikan pelayanan dan informasi kepada masyarakat dan investor;
e. Bertanggung jawab terhadap hubungan antara Perusahaan Publik dengan OJK dan masyarakat sebagai wakil dari Perusahaan Emiten.
Unit Audit internal Audit Internal adalah suatu aktivitas pemberian keyakinan (assurance) dan konsultasi yang bersifat independen dan obyektif, yang dibuat untuk meningkatkan nilai dan memperbaiki operasional perusahaan.
Unit audit internal adalah unit kerja dalam Emiten atau Perusahaan Publik yang menjalankan fungsi Audit Internal.
Aktivitas Unit Audit Internal membantu perusahaan mencapai tujuannya melalui suatu pendekatan yang sistematis dan terkendali untuk mengevaluasi dan meningkatkan efektivitas manajemen risiko dan pengendalian intern.
Erick T. TjandraWarga Negara Indonesia, lahir di Bogor tahun 1970. Lulus dari Universitas Unika Atmajaya Jakarta, Jurusan Akuntansi tahun 1996. Memulai karirnya para tahun 1993 - 1996 sebagai Senior Auditor di Public Accounting Firm Prasetio Utomo. Tahun 1996 – 1998 sebagai Accounting Manager di PT Pindo Deli Pulp & Paper Mills – Sinar Mas Group. Tahun 1998 – 2000 sebagai Finance Accounting Manager PT Univenus & Co dan PT Asia Paperindo Perkasa – Sinar Mas Group. Tahun 2000 – 2001 sebagai Chief Financial Officer di PT Univenus & Co – Sinar Mas Group. Tahun 2001 – 2007 sebagai Direktur PT Berlian Mulya Persada. Tahun 2005 – 2009 sebagai Deputy Director Finance & Accounting PT Adhibaladika Agung dan Direktur PT Multi Unggul Sejahtera Utama. Tahun 2009 – Oktober 2012 sebagai Controller di PT Interkayu Nusantara. Tahun 2011 – Sekarang sebagai Controller di PT Sentra Niaga Bersama. September 2011 – Sekarang sebagai Internal Audit Perseroan.
Persyaratan auditor yang duduk dalam Aktivitas Unit Audit internala. Memiliki integritas dan perilaku yang profesional,
independen, jujur dan obyektif dalam pelaksanaan tugasnya;
b. Memiliki pengetahuan dan pengalaman mengenai teknis audit dan disiplin ilmu lain yang relevan dengan bidang tugasnya;
c. Memiliki pengetahuan tentang peraturan perundang-undangan di bidang pasar modal dan peraturan perundang-undangan terkait lainnya;
d. Memiliki kecakapan untuk berinteraksi dan berkomunikasi baik lisan maupun tertulis secara efektif;
e. Mematuhi standar profesi yang dikeluarkan oleh Ikatan Internal Audit
f. Mematuhi kode etik audit internalg. Menjaga kerahasiaan informasi dan/atau data perusahaan
terkait dengan pelaksanaan tugas dan tanggung jawab Audit Internal kecuali diwajibkan berdasarkan peraturan perundang-undangan atau penetapan/putusan pengadilan;
h. Memahami prinsip-prinsip manajemen risiko;i. Meningkatkan pengetahuan, keahlian dan kemampuan
profesionalismenya secara terus-menerus.
36 Laporan Tahunan Annual Report 2013 PT Panca Global Securities Tbk
Structure, status and Accountability Internal Audit Unit Activity
a. Internal audit unit headed by a chief,internal audit internal, audit unit consisting of one adapted to the internal auditors for levels of complexity and business activities or public utilities, hence acting as internal audit and the internal audit unit head.
b. Unit head internal audit appointed and terminated by President Director with approval from the board of commissioners.
Duties and responsibilities of the Internal Audit Unit Activitya. Develop and implement annual activities of the internal
audit unit based on priority risks in accordance with the objectives of the company;
b. Testing and evaluating the implementation of the internal control and risk management systems in accordance with company policy;
c. Perform an examination and assessment of efficiency and effectiveness in the areas of finance, accounting, operations, human resources, marketing, information technology and other activities;
d. Give advice on improvements and objective information about the activities that are checked at all levels of management;
e. Reporting on audit results and submit these reports to the President Director and Board of Commissioners;
f. Monitor, analyse and report on the implementation of the follow-up to the improvements that have been suggested;
g. Works closely with the Audit Committee; h. Draft programme to evaluate the quality of the internal
audit activity is doing; and i. Special checks where necessary.
The Purpose Activity Of The Internal Audit UnitThe activity of the Internal Audit Unit to help the company achieve the goal through a systematic and controlled approach to evaluate and improve the effectiveness of risk management and internal control.
Internal ControlThe company has devised and has Internal Control Systems in the form of a series of policies and standard procedures in carrying out its operational activities as well as any information and reporting systems to support management decision-making. This system constantly evolved and is currently rated effective enough to control and minimize the risks involved. Is the duty of the Internal Audit Division to ensure internal control system that is already good and effective run in every field of endeavor. This is done to provide objective and independent assessments as well as providing consultative services in terms of the effectiveness and adequacy of risk management, control and corporate governance.
Risk Management SystemRisk management aims to minimize the risk of losses.
Risk management at least includes:• Identify potential internal risks at every function/unit and
the potential risks that may affect the performance of the external company;
• Handling risk management strategies; • Implement management programs to reduce risk;
• Evaluates the success of the risk management.
The benefits of risk management is to minimize the impact of the loss of the uncertainty in the venture.
Struktur, Kedudukan dan Pertanggungjawaban Aktivitas Unit Audit internala. Unit Audit Internal dipimpin oleh seorang Kepala Audit
Internal, Unit Audit Internal terdiri dari satu orang auditor internal karena disesuaikan dengan besaran dan tingkat kompleksitas kegiatan usaha Emiten atau Perusahaan Publik, maka audit internal tersebut bertindak pula sebagai kepala Unit Audit Internal.
b. Kepala Unit Audit Internal diangkat dan diberhentikan oleh Direktur Utama atas persetujuan Dewan Komisaris.
Tugas dan Tanggung Jawab Aktivitas Unit Audit internala. Menyusun dan melaksanakan aktivitas unit audit internal
tahunan berdasarkan prioritas risiko sesuai dengan tujuan perusahaan;
b. Menguji dan mengevaluasi pelaksanaan pengendalian intern dan sistem manajemen risiko sesuai dengan kebijakan perusahaan;
c. Melakukan pemeriksaan dan penilaian atas efisiensi dan efektivitas di bidang keuangan, akuntansi, operasional, sumber daya manusia, pemasaran, teknologi informasi dan kegiatan lainnya;
d. Memberikan saran perbaikan dan informasi yang obyektif tentang kegiatan yang diperiksa pada semua tingkat manajemen;
e. Membuat laporan hasil audit dan menyampaikan laporan tersebut kepada Direktur Utama dan Dewan Komisaris;
f. Memantau, menganalisis dan melaporkan pelaksanaan tindak lanjut perbaikan yang telah disarankan;
g. Bekerja sama dengan Komite Audit;h. Menyusun program untuk mengevaluasi mutu kegiatan
audit internal yang dilakukannya; dan i. Melakukan pemeriksaan khusus apabila diperlukan.
Tujuan Aktivitas Unit Audit internalAktivitas Unit Audit Internal membantu perusahaan mencapai tujuannya melalui suatu pendekatan yang sistematis dan terkendali untuk mengevaluasi dan meningkatkan efektivitas manajemen risiko dan pengendalian intern.
Sistem Pengendalian internalPerseroan telah menyusun dan mempunyai Sistem Pengendalian Internal berupa serangkaian kebijakan dan standar prosedur dalam menjalankan setiap kegiatan operasionalnya serta sistem informasi dan pelaporan untuk menunjang pengambilan keputusan manajemen. Sistem ini terus mengalami penyempurnaan dan hingga saat ini dinilai cukup efektif untuk mengendalikan dan meminimalkan risiko yang ada. Adalah tugas divisi Audit Internal untuk memastikan sistem pengendalian internal yang ada sudah baik dan efektif dijalankan di setiap bidang usaha. Hal ini dilakukan untuk memberikan penilaian yang obyektif dan independen serta memberikan layanan konsultatif dalam hal keefektifan dan kecukupan control, manajemen risiko dan tata kelola perusahaan.
Sistem Manajemen ResikoManajemen risiko bertujuan untuk meminimalisasi risiko kerugian.
Manajemen risiko sekurang-kurangnya mencakup:• Mengidentifikasi potensi risiko internal pada setiap fungsi/
unit dan potensi risiko eksternal yang dapat mempengaruhi kinerja Perusahaan;
• Mengembangkan strategi penanganan pengelolaan risiko; • Mengimplementasikan program-program pengelolaan
untuk mengurangi risiko; • Mengevaluasi keberhasilan manajemen risiko.
Manfaat manajemen risiko adalah memperkecil dampak kerugian dari ketidakpastian dalam usaha.
37PT Panca Global Securities Tbk Laporan Tahunan Annual Report 2013
Disclosure of awards & administrative sanctions (reward & punishment) which is subject to the company/Board of Commissioners/directors;The management of Human Resources of the human dimension in building efforts justice. This means that employees are not only judged from its positive contribution (assets & factor). Employees also deserved given rewards (reward) and sanctions (punishment), due to the burden of negative (liability factor). The Spirit of the company to give reward and punishment are the same wear, which aims to improve and restore the power of the employees, so as to benefit both for employees and for the company. The main instruments used to measure the performance of the employee is to use performance management instruments (performance management). The implementation of these measurements are done every year in the form of Employee Performance Appraisals.
RewardCompanies can reward parties that considered giving example in applying the company’s ethical standards in accordance with company policy.
The consequences of the violations of the company’s ethical standards:• Partners of proven violation, it will be penalized in
accordance with the regulations and the decisions of the company.
• In a clearly proved to have committed a violation of the company’s ethical standards, any employee in any depth will be penalized in accordance with.
• Employees proven infringement of the company’s ethical standards may be subject to disciplinary actions in the form of oral or written reprimands, warnings and suspensions until the termination of hard working relationship.
• If existing conditions involve violations of criminal law and the civil code, the problem can be forwarded to the authorities.
• If proven to have been violations of the company’s ethical standards that is indisipliner, it will be further processed by the Personnel Section.
• Nature of the disciplinary action taken, will depend on the seriousness of the offence committed and the related situation.
Case facing the CompanyTill now, the Company, Board of Directors and Board of Commissioners are not facing any legal suit and are not involved in any dispute.
Administrative SanctionsAdministrative sanctions in the form of fines for several times late in reporting of bond transactions to Capital Market Supervisory Agency amounting to Rp. 630.000,-.
The code of conduct and corporate cultureThe company must declare and define the rules of corporate governance and in accordance with the principles of this code of conduct. The regulations must be in the form of manuals and available as a reference for the Board of Directors. This should be communicated to the Commission that will evaluate the submission taking into account the code of conduct, and taking into account the size and nature of business of the company. Chairman of the Board is in charge of and is responsible for ensuring compliance with the code of practice and corporate governance unless mandated by law.
Pengungkapan penghargaan & sanksi administratif (reward & punishment) yang dikenakan kepada perusahaan/ Dewan Komisaris/ Direksi;Pengelolaan SDM tidak lepas dari upaya membangun manusia dalam dimensi keadilan. Artinya, karyawan tidak hanya dinilai dari kontribusi positifnya (assets factor) saja. Karyawan juga pantas diberikan imbalan (reward) dan sanksi (punishment) akibat beban negatifnya (liability factor). Spirit perusahaan untuk memberikan reward dan mengenakan punishment adalah sama, yaitu bertujuan untuk meningkatkan dan mengembalikan kekuatan karyawan, sehingga bermanfaat baik bagi karyawan maupun bagi perusahaan. Instrumen utama yang digunakan untuk mengukur kinerja karyawan adalah dengan menggunakan instrumen manajemen kinerja (performance management). Implementasi pengukuran ini dilakukan setiap tahun dalam bentuk Penilaian Kinerja Karyawan (Performance Appraisal).
PenghargaanPerusahaan dapat memberikan penghargaan kepada pihak-pihak yang dianggap memberikan keteladanan dalam penerapan Standar Etika Perusahaan sesuai dengan kebijakan Perusahaan.
Konsekuensi-konsekuensi atas pelanggaran Standar Etika Perusahaan :• Mitra Kerja yang terbukti melakukan pelanggaran, maka
akan dikenakan sanksi sesuai dengan peraturan dan keputusan Perusahaan.
• Apabila jelas terbukti telah melakukan pelanggaran terhadap Standar Etika Perusahaan, setiap pegawai dalam tingkatan apapun akan dikenakan sanksi sesuai ketentuan.
• Pegawai yang terbukti melakukan pelanggaran atas Standar Etika Perusahaan dapat dikenai tindakan-tindakan disipliner berupa teguran lisan maupun tulisan, peringatan keras dengan skorsing sampai pemutusan hubungan kerja.
• Jika kondisi yang ada melibatkan pelanggaran hukum pidana dan perdata, permasalahan dapat diteruskan kepada pihak yang berwajib.
• Jika terbukti telah terjadi pelanggaran Standar Etika Perusahaan yang bersifat indisipliner, maka akan diproses lebih lanjut oleh bagian Personalia.
• Sifat dari tindakan disipliner yang diambil, akan tergantung dari keseriusan pelanggaran yang dilakukan serta situasi terkait.
Perkara yang dihadapi PerseroanPerseroan, Anggota Direksi dan Dewan Komisaris sampai dengan saat ini tidak tersangkut dalam suatu perkara apapun.
Sanksi Administratif Sanksi administratif berupa denda atas beberapa kali keterlambatan pelaporan transaksi efek berpendapatan tetap kepada Bapepam-LK sebesar Rp. 630.000,-.
Kode Etik dan Budaya Perusahaan Perusahaan harus mengumumkan dan menetapkan peraturan tata kelola perusahaan dan prinsip-prinsip sesuai dengan Kode Etik ini. Peraturan harus dalam bentuk manual dan tersedia sebagai referensi bagi direksi. Hal ini harus disampaikan kepada Komisi yang akan mengevaluasi kepatuhan dengan mempertimbangkan Kode Etik ini, dan mempertimbangkan ukuran dan sifat usaha perusahaan. Ketua Dewan bertugas dan bertanggung jawab untuk menjamin kepatuhan terhadap praktek dan kode tata kelola perusahaan kecuali diamanatkan oleh hukum.
38 Laporan Tahunan Annual Report 2013 PT Panca Global Securities Tbk
Code of conduct and corporate culture is one form of commitment of PT Panca Global Securities Tbk upon implementation of management companies and is set as commitment consisting of business ethics PT Panca Global Securities Tbk which arranged in order to influence, forming, coordination and do conformity mannerisms so be achieved output that consistent corresponding with corporate culture of PT Panca Global Securities Tbk in achieving vision and his mission. Code of conduct and corporate culture shall apply for all individuals acting on behalf of PT Panca Global Securities Tbk said as subsidiary entity and affiliates under control, stockholders (investors) and all stakeholders or working partners who transacts business with PT Panca Global Securities Tbk and also serve as the implementation basis of the decision making.
The Program share ownership by employees and/or managementCurrently the company does not have to implement the programme planning ESA (Employee Share Allocation ).
Whistleblowing SystemTo create the company’s operational activities which is free from the practices of corruption, collusion and nepotism as well as upholding the Ethical Guidelines, where the company is trying to increase the role and actively involved all the company resources and other stakeholders through a mechanism of fair and transparent responses, one of them through the Violations or Whistleblowing Reporting System (WBS).
The implementation of whistleblowers system which managed by the Audit Committee, determined by the Board of Commissioners and ratified by decision of Board of Directors. The Audit Committee will follow up any complaints from employees and from a third party with regard to:
• Accounting and Auditing. Problems of accounting and internal control on financial reporting that could potentially lead to material misstatement in the financial statements and audit problems especially regarding the independency of the independent auditors;
• Violation of regulations. Violation of the rules and regulations of the capital market legislation is related to the operations of the company as well as a violation of internal regulations that could potentially result in loss for the company;
• Alleged fraud and/or alleged corruption committed by officials and/or employees; and
• Code of ethics. The Board of Directors and management behavior that is not potentially defame the reputation of the admirable company or resulted in losses for the company. The Board of Directors and management behavior that does not include, among others: admirable is not honest, the potential conflict of interest (conflict of interest) or give misleading information to the public.
Reporting mechanisms for Violations (whistleblowing) are as follows:
1. The reporting done in writing a. Official letter addressed to the company Board of
Commissioners in particular, by means of a direct submission, sent by facsimile, or by post to the company. b. By email: [email protected] c. Delivered to the official address: PT Panca Global Securities, Tbk, Indonesia Stock Exchange Building, Tower I, 17th Fl Jl. Jend. Sudirman Kav. 52-53 Jakarta 12190
Kode Etik dan Budaya Perusahaan merupakan salah satu bentuk komitmen PT Panca Global Securities Tbk atas implementasi Tata Kelola Perusahaan dan merupakan sekumpulan komitmen yang terdiri dari etika bisnis PT Panca Global Securities Tbk yang disusun untuk mempengaruhi, membentuk, mengatur dan melakukan kesesuaian tingkah laku sehingga tercapai keluaran yang konsisten yang sesuai dengan budaya PT Panca Global Securities Tbk dalam mencapai visi dan misinya. Kode Etik dan Budaya Perusahaan berlaku untuk seluruh individu yang bertindak atas nama PT Panca Global Securities Tbk, entitas anak dan afilisasi dibawah pengendalian, pemegang saham (investor) serta seluruh stakeholders atau mitra kerja yang melakukan transaksi bisnis dengan PT Panca Global Securities Tbk dan juga berfungsi sebagai dasar pelaksanaan proses pengambilan keputusan.
Program Kepemilikan Saham oleh Karyawan dan/ atau manajemen Saat ini Perseroan belum memiliki perencanaan untuk melaksanakan program ESA (Employee Share Allocation).
Whistleblowing SystemUntuk menciptakan kegiatan operasional Perseroan yang terbebas dari praktik-praktik korupsi, kolusi dan nepotisme serta menjunjung tinggi Pedoman Etika, dimana Perseroan berusaha untuk meningkatkan peran serta secara aktif dari seluruh unsur Perusahaan dan para pemangku kepentingan lainnya melalui suatu mekanisme penanganan yang adil dan transparan, salah satunya melalui Sistem Pelaporan Pelanggaran atau Whistleblowing System (WBS).
Penerapan system whistleblower yang dikelola oleh Komite Audit ditetapkan dengan Keputusan Dewan Komisaris dan diratifikasi dengan Keputusan Direksi. Komite Audit akan menindaklanjuti pengaduan yang berasal dari karyawan dan dari pihak ketiga yang berkaitan dengan:
• Akuntansi dan Auditing. Permasalahan akuntansi dan pengendalian internal atas pelaporan keuangan yang berpotensi mengakibatkan salah saji material dalam laporan keuangan serta permasalahan audit terutama mengenai independensi auditor independen;
• Pelanggaran Peraturan. Pelanggaran peraturan pasar modal dan peraturan perundangan terkait dengan operasi Perusahaan maupun pelanggaran terhadap peraturan internal yang berpotensi mengakibatkan kerugian bagi Perusahaan;
• Dugaan kecurangan dan/atau dugaan korupsi yang dilakukan oleh pejabat dan/atau karyawan; dan
• Kode Etik. Perilaku direksi dan manajemen yang tidak terpuji yang berpotensi mencemarkan reputasi Perusahaan atau mengakibatkan kerugian bagi Perusahaan. Perilaku direksi dan manajemen yang tidak terpuji meliputi antara lain: tidak jujur, potensi benturan kepentingan (conflict of interest) atau memberikan informasi yang menyesatkan kepada publik.
Mekanisme Pelaporan Pelanggaran (whistleblowing) yaitu sebagai berikut :
1. Pelaporan dilakukan secara tertulisa. Menyampaikan surat resmi yang ditujukan kepada
Perusahaan c.q. Dewan Komisaris, dengan cara diantar langsung, dikirim melalui facsimile, atau melalui pos ke Perusahaan.
b. Melalui email : [email protected]. Disampaikan ke alamat resmi : PT Panca Global Securities,Tbk Indonesia Stock Exchange Building, Tower I, 17th Fl Jl. Jend. Sudirman Kav. 52-53 Jakarta 12190
39PT Panca Global Securities Tbk Laporan Tahunan Annual Report 2013
d. Reporting violations in writing must include a photocopy of the personal identity and supporting documents such as: documents relating to the transactions carried out and/or reporting violations to be delivered
2. Representatives of stakeholders In reporting violations filed by stakeholders representative,
then in addition to the above documents has to submitted other documents, such as: a. A copy of identity of stakeholders and stakeholders
representatives. b. Power of Attorney from stakeholders. c. If stakeholders representatives is an institution or a legal
entity, it must be enclosed with the documents stated that the proposed Violations Reporting are authorised to represent the legal institution or entity.
3. Acceptance of Violations Reporting by the company• Company received any violations reporting filed by
stakeholders and/or stakeholders Representative whether oral or written.
• Company provides an explanation of the policies and settlement procedures Violations Reporting at the time of completion of stakeholders and/or stakeholders representative propose violations Reporting.
• Company provides receipt, if violations reporting filed in writing.
• Admission Violations Reporting is the Board of Commissioners in particular the Audit Committee of the company.
The mechanism of Violations Reporting has to socialized to all stakeholders in the framework of the implementation of GCG in the company.
Corporate Social Responsibility• The company’s realized corporate social responsibility and
contribute to the development and empowerment of the community.
• Corporate social responsibility (CSR) is part of the company’s vision to deliver added value to the relevant stakeholders in order to create a good synergy, advanced, and grow together.
The purpose of the corporate social responsibility of companies• Cultivate the image which is positive for the company in
the eyes of the community and stakeholders. • Embody the application of the principles of corporate
responsibility.
The Corporate Social Responsibility (CSR) Program
• The company has a measure to assess the effectiveness of CSR.
• The Company did continuous evalution to all programs that has been done.
In 2013, the company actively participated in social activities, namely, conducting blood donor activities in cooperation with the Indonesia Red Cross and the Indonesia stock exchange, held on August 20, 2013 at Indonesia Stock Exchange Gallery.
The Company total donated amount was Rp23.65 million for the blood donor activity above.
d. Pelaporan pelanggaran secara tertulis beridentitas dilengkapi fotokopi identitas dan dokumen pendukung seperti : dokumen yang berkaitan dengan transaksi yang dilakukan dan/ atau pelaporan pelanggaran yang akan disampaikan.
2. Perwakilan stakeholders Apabila pelaporan pelanggaran diajukan perwakilan
stakeholders, maka selain dokumen diatas juga diserahkan dokumen lainnya, yaitu :a. Fotokopi buku identitas stakeholders dan perwakilan
stakeholders.b. Surat kuasa dari stakeholders.c. Jika perwakilan stakeholders adalah lembaga atau
badan hukum, maka harus dilampiri dengan dokumen yang dinyatakan bahwa pihak yang mengajukan Pelaporan Pelanggaran berwenang untuk mewakili lembaga atau badan hukum tersebut.
3. Penerimaan Pelaporan Pelanggaran oleh Perusahaan• Perusahaan menerima setiap pelaporan pelanggaran
yang diajukan oleh stakeholders dan/ atau Perwakilan stakeholders baik secara lisan maupun tertulis.
• Perusahaan memberikan penjelasan mengenai kebijakan dan prosedur penyelesaian Pelaporan Pelanggaran pada saat stakeholders dan/ atau perwakilan stakeholders mengajukan Pelaporan Pelanggaran.
• Perusahaan memberikan tanda terima, jika pelaporan pelanggaran diajukan secara tertulis.
• Penerimaan Pelaporan Pelanggaran adalah Dewan Komisaris c.q. Komite Audit Perusahaan.
Mekanisme Pelaporan Pelanggaran disosialisasikan kepada seluruh stakeholders dalam rangka implementasi GCG di Perusahaan.
Tanggung Jawab Sosial Perusahaan• Perusahaan mewujudkan kepedulian sosial dan
memberikan kontribusi bagi pengembangan dan pemberdayaan masyarakat.
• Tanggung jawab sosial perusahaan/corporate social responsibility (CSR) merupakan bagian dari visi Perusahaan untuk memberikan nilai tambah bagi stakeholders dalam rangka terciptanya sinergi yang baik, maju, dan tumbuh bersama.
Tujuan dari kepedulian sosial Perusahaan • Menumbuhkan citra (image) yang positif bagi Perusahaan
di mata masyarakat dan stakeholders.• Mewujudkan penerapan prinsip responsibilitas.
Program Tanggung Jawab Sosial/Corporate Social Responsibility (CSR)
• Perusahaan memiliki suatu ukuran untuk menilai efektivitas pelaksanaan program CSR.
• Perusahaan melakukan evaluasi yang berkesinambungan atas program-program yang telah dilakukan.
Pada tahun 2013, Perseroan ikut berpartisipasi aktif dalam kegiatan sosial, yaitu melaksanakan kegiatan donor darah yang bekerjasama dengan Palang Merah Indonesia dan Bursa Efek Indonesia, yang dilaksanakan pada tanggal 20 Agustus 2013 yang bertempat di Galeri Bursa Efek Indonesia.
Adapun total keseluruhan dana Perseroan yang terpakai untuk kegiatan donor darah tersebut adalah adalah sebesar Rp23,65 juta.

40 Laporan Tahunan Annual Report 2013 PT Panca Global Securities Tbk
We signed below, declare that all information in the annual report of PT Panca Global Securities Tbk. in 2013 has loaded completely and fully responsibility for the truth of the contents of the annual report of the company.
This statement was made with actual.
Jakarta, April 2014
Kami yang bertanda tangan dibawah ini menyatakan bahwa semua informasi dalam laporan tahunan PT Panca Global Securities Tbk. tahun 2013 telah dimuat secara lengkap dan bertanggung jawab penuh atas kebenaran isi laporan tahunan perusahaan.
Demikian pernyataan ini dibuat dengan sebenarnya.
Jakarta, April 2014
Dewan KomisarisBoard of Commisioners
Dewan DireksiBoard of Directors
Hendra H. Kustarjo Direktur Utama I President Director
Farida Eva Riyanti HutapeaKomisaris I Commissioner
SuliantoKomisaris I Commissioner
Trisno LimantoDirektur I Director
Theresia Yolanda MangundapDirektur I Director
Chengwy KarlamKomisaris Utama I President Commissioner
Pernyataan Manajemen atas Laporan Tahunan 2013
Management Declaration on 2013 Annual Report

Laporan Auditor Independen Atas Laporan Keuangan
PT Panca Global Securities Tbkuntuk tahun-tahun yang berakhir pada 31 Desember 2013 dan 2012
Independent Auditor’s Report on the Financial Statement of
PT Panca Global Securities Tbkfor the years ended Desember 31th 2013 dan 2012
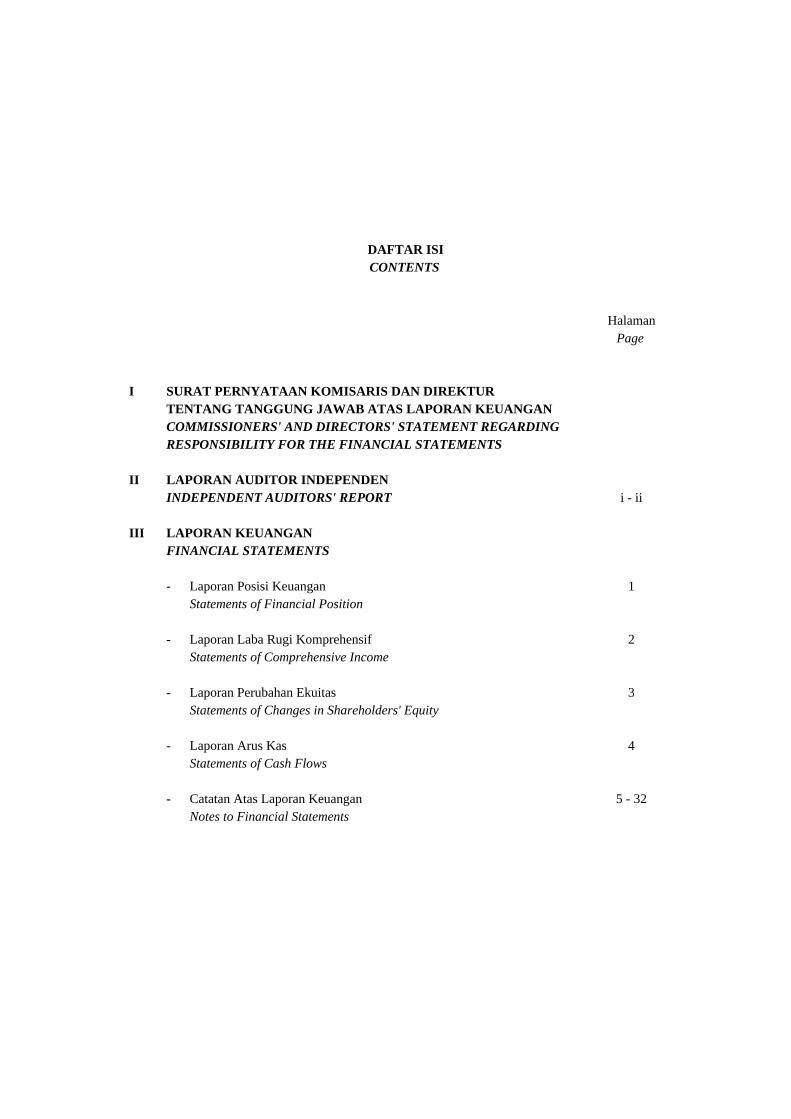
HalamanPage
I SURAT PERNYATAAN KOMISARIS DAN DIREKTURTENTANG TANGGUNG JAWAB ATAS LAPORAN KEUANGANCOMMISSIONERS' AND DIRECTORS' STATEMENT REGARDING RESPONSIBILITY FOR THE FINANCIAL STATEMENTS
II LAPORAN AUDITOR INDEPENDENINDEPENDENT AUDITORS' REPORT i - ii
III LAPORAN KEUANGANFINANCIAL STATEMENTS
- Laporan Posisi Keuangan 1Statements of Financial Position
- Laporan Laba Rugi Komprehensif 2Statements of Comprehensive Income
- Laporan Perubahan Ekuitas 3Statements of Changes in Shareholders' Equity
- Laporan Arus Kas 4Statements of Cash Flows
- Catatan Atas Laporan Keuangan 5 - 32Notes to Financial Statements
DAFTAR ISICONTENTS

Surat Pernyataan KomiSariS Dan DireKSi tentang
tanggung Jawab ataS LaPoran KeuanganuntuK tahun yang beraKhir PaDa
tanggaL-tanggaL 31 DeSember 2013 Dan 2012Pt Panca gLobaL SecuritieS tbk (“entitaS”)
Commissioner’s and direCtor’s statementregarding
the responsibility for the finanCial statementsfor the year ended
deCember 31, 2013 and 2012pt panCa global seCurities tbk (“the entity”)
Kami yang bertanda tangan di bawah ini : We, the undersigned :
1. Nama Alamat Kantor
Alamat Rumah
Nomor TeleponJabatan
::
:
::
Hendra H. KustarjoGd. BEI Tower I Lt. 17, Suite 1706AJl. Jend Sudirman Kav. 52-53, Jakarta 12190Kebon Jeruk Indah E No 10 RT 003 RW 007Srengseng, Kembangan, Jakarta Barat021-5155 456Direktur Utama
1. Name Office Address
Resindential Address
TelephoneTitle
::
:
::
Hendra H. KustarjoGd. BEI Tower I Lt. 17, Suite 1706AJl. Jend Sudirman Kav. 52-53, Jakarta 12190Kebon Jeruk Indah E No 10 RT 003 RW 007Srengseng, Kembangan, Jakarta Barat021-5155 456President Director
2. Nama Alamat Kantor
Alamat Rumah
Nomor TeleponJabatan
::
:
::
Trisno LimantoGd. BEI Tower I Lt. 17, Suite 1706AJl. Jend Sudirman Kav. 52-53, Jakarta 12190Kav. Polri Blok G I /1644, RT 003 RW 006Grogol, Petamburan, Jakarta Barat021-5155 456Direktur
2. Name Office Address
Resindential Address
TelephoneTitle
::
:
::
Trisno LimantoGd. BEI Tower I Lt. 17, Suite 1706AJl. Jend Sudirman Kav. 52-53, Jakarta 12190Kav. Polri Blok G I /1644, RT 003 RW 006Grogol, Petamburan, Jakarta Barat021-5155 456Director
3. Nama Alamat Kantor
Alamat Rumah
Nomor TeleponJabatan
::
:
::
Theresia Yolanda MangundapGd. BEI Tower I Lt. 17, Suite 1706AJl. Jend Sudirman Kav. 52-53, Jakarta 12190Jl. Pulau Anyer I/25 RT 006 RW 009Kembangan, Jakarta Barat021-5155 456Direktur
3. Name Office Address
Resindential Address
TelephoneTitle
::
:
::
Theresia Yolanda MangundapGd. BEI Tower I Lt. 17, Suite 1706AJl. Jend Sudirman Kav. 52-53, Jakarta 12190Jl. Pulau Anyer I/25 RT 006 RW 009Kembangan, Jakarta Barat021-5155 456Director
4. Nama Alamat Kantor
Alamat Rumah
Nomor TeleponJabatan
::
:
::
Chengwy KarlamGd. BEI Tower I Lt. 17, Suite 1706AJl. Jend Sudirman Kav. 52-53, Jakarta 12190TM KB Jeruk Blok C I No. 57 RT 004 RW 009Srengseng, Kembangan, Jakarta Barat021-5155 456Komisaris Utama,mewakili Dewan Komisaris
4. Name Office Address
Resindential Address
TelephoneTitle
::
:
::
Chengwy KarlamGd. BEI Tower I Lt. 17, Suite 1706AJl. Jend Sudirman Kav. 52-53, Jakarta 12190TM KB Jeruk Blok C I No. 57 RT 004 RW 009Srengseng, Kembangan, Jakarta Barat021-5155 456President Commissioner,for and on behalf of the Boardof Commissioners
PANCA GLOBALSECURITIES
Menyatakan bahwa:
1. Kami bertanggung jawab atas penyusunan dan penyajian laporan keuangan Entitas;
2. Laporan keuangan Entitas telah disusun dan disajikan sesuai dengan Standard Akuntansi Keuangan di Indonesia sebagaimana
diterbitkan oleh Ikatan Akuntan Indonesia.
3. a. Semua informasi dalam laporan keuangan Entitas telah dimuat secara lengkap dan benar;
3. b. Laporan keuangan Entitas tidak mengandung informasi atau fakta material yang tidak benar, dan tidak menghilangkan informasi atau fakta material;
4. Kami bertanggung jawab atas sistem pengendalian intern dalam Entitas.
Demikian pernyataan ini dibuat dengan sebenarnya.
Declare that:
1. We are responsible for the preparation and the presentation of the financial statements of the Entity;
2. The Entity’s financial statements have been prepared and presented in accordance with Indonesian Financial Accounting Standards issued by the Indonesian Institute of Accountants.
3. a. All information has been fully and correctly disclose in the Entity’s finacial statements;
3. b. The Entity’s financial statements do not contain false material information or fac ts , nor do they not ommit mater ial information or facts;
4. We are responsible for the Entity’s internal control system.
This is our declaration, which has been made truthfully.

PANCA GLOBALSECURITIES
JAKARTA, 30 Januari 2014 / January 30, 2014ATAS NAMA /ON BEHALF OF
PT PANcA GlobAl SecuRiTieS Tbk
Hendra H. KustarjoDirektur Utama
President Director
Trisno limantoDirekturDirector
Theresia Yolanda MangundapDirekturDirector
chengwy KarlamKomisaris Utama
President Commissioner
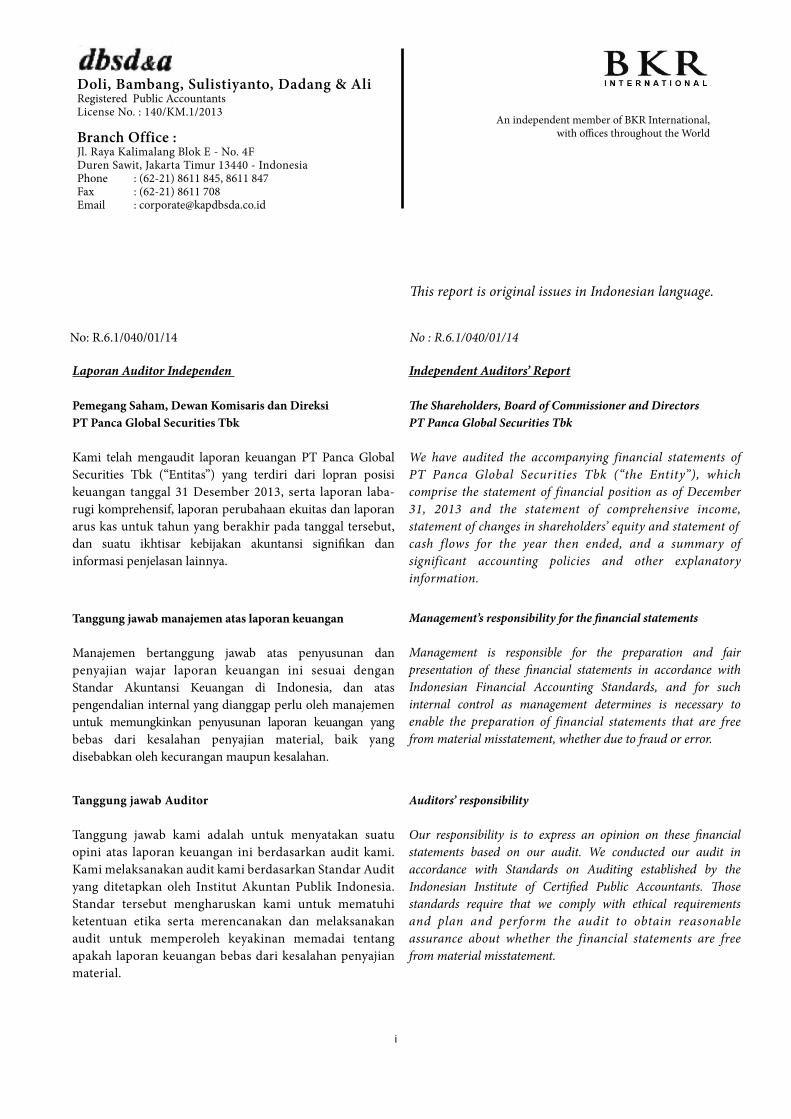
Hendra H. KustarjoDirektur Utama
President Director
Trisno limantoDirekturDirector
Theresia Yolanda MangundapDirekturDirector
Doli, bambang, Sulistiyanto, Dadang & AliRegistered Public AccountantsLicense No. : 140/KM.1/2013
branch office :Jl. Raya Kalimalang Blok E - No. 4FDuren Sawit, Jakarta Timur 13440 - IndonesiaPhone : (62-21) 8611 845, 8611 847Fax : (62-21) 8611 708Email : [email protected]
An independent member of BKR International,with offices throughout the World
laporan auditor independen
Pemegang Saham, Dewan Komisaris dan DireksiPt Panca global Securities tbk
Kami telah mengaudit laporan keuangan PT Panca Global Securities Tbk (“Entitas”) yang terdiri dari lopran posisi keuangan tanggal 31 Desember 2013, serta laporan laba- rugi komprehensif, laporan perubahaan ekuitas dan laporan arus kas untuk tahun yang berakhir pada tanggal tersebut, dan suatu ikhtisar kebijakan akuntansi signifikan dan informasi penjelasan lainnya.
tanggung jawab manajemen atas laporan keuangan
Manajemen bertanggung jawab atas penyusunan dan penyajian wajar laporan keuangan ini sesuai dengan Standar Akuntansi Keuangan di Indonesia, dan atas pengendalian internal yang dianggap perlu oleh manajemen untuk memungkinkan penyusunan laporan keuangan yang bebas dari kesalahan penyajian material, baik yang disebabkan oleh kecurangan maupun kesalahan.
tanggung jawab auditor
Tanggung jawab kami adalah untuk menyatakan suatu opini atas laporan keuangan ini berdasarkan audit kami. Kami melaksanakan audit kami berdasarkan Standar Audit yang ditetapkan oleh Institut Akuntan Publik Indonesia. Standar tersebut mengharuskan kami untuk mematuhi ketentuan etika serta merencanakan dan melaksanakan audit untuk memperoleh keyakinan memadai tentang apakah laporan keuangan bebas dari kesalahan penyajian material.
independent auditors’ report
The shareholders, board of Commissioner and directorspt panca global securities tbk
We have audited the accompanying financial statements of PT Panca Global Securities Tbk (“the Entity”), which comprise the statement of financial position as of December 31, 2013 and the statement of comprehensive income, statement of changes in shareholders’ equity and statement of cash flows for the year then ended, and a summary of significant accounting policies and other explanatory information.
management’s responsibility for the financial statements
Management is responsible for the preparation and fair presentation of these financial statements in accordance with Indonesian Financial Accounting Standards, and for such internal control as management determines is necessary to enable the preparation of financial statements that are free from material misstatement, whether due to fraud or error.
auditors’ responsibility
Our responsibility is to express an opinion on these financial statements based on our audit. We conducted our audit in accordance with Standards on Auditing established by the Indonesian Institute of Certified Public Accountants. Those standards require that we comply with ethical requirements and plan and perform the audit to obtain reasonable assurance about whether the financial statements are free from material misstatement.
This report is original issues in Indonesian language.
No: R.6.1/040/01/14 No : R.6.1/040/01/14
i

Suatu audit melibatkan pelaksanaan prosedur untuk memperoleh bukti audit tentang angka-angka dan pengungkapan dalam laporan keuangan. Prosedur yang dipilih bergantung pada pertimbangan auditor, termasuk penilaian atas risiko kesalahan penyajian meterial dalam laporan keuangan, baik yang disebabkan oleh kecurangan maupun kesalahan. Dalam melakukan penilaian risiko tersebut, auditor mempertimbangkan pengendalian internal yang relevan dengan penyusunan dan penyajian wajar laporan keuangan entitas untuk merancang prosedur audit yang tepat sesuai dengan kondisinya, tetapi bukan untuk tujuan menyatakan opini atas keefektivitasan pengendalian internal entitas. Suatu audit juga mencakup pengevaluasian atas ketepatan kebijakan akuntansi yang digunakan dan kewajaran estimasi akuntansi yang dibuat oleh manajemen serta pengevaluasian atas penyajian laporan keuangan secara keseluruhan.Kami yakin bahwa bukti audit yang telah kami peroleh adalah cukup dan tepat untuk menyediakan suatu basis bagi opini audit kami.
opini
Menurut opini kami, laporan keuangan terlampir menyajikan secara wajar, dalam semua hal yang material, posisi keuangan PT Panca Global Securities Tbk tanggal 31 Desember 2013, kinerja keuangan, perubahan ekuitas, serta arus kas untuk tahun yang berakhir pada tanggal tersebut, sesuai dengan Standar Akuntansi Keuangan di Indonesia.
opinion
In our opinion, the accompanying financial statements present fairly, in all material respects, the financial position of PT Panca Global Securities Tbk as of December 31, 2013 the financial performance, its changes in shareholders’ equity and its cash f lows for the year then ended, in accordance with Indonesian Financial Accounting Standards.
An audit involves performing procedures to obtain audit evidence about the amounts and disclosures in the financial statements. The procedures selected depend on the auditors’ judgement, including the assessment of the risks of material misstatement of the financial statements, whether due to fraud or error. In making those risk assessments, the auditor considers internal control relevant to the entity’s preparation and fair presentation of the financial statements in order to design audit procedures that are appropriate in the circumstances, but not for the purpose of expressing an opinion on the effectiveness of the entity’s internal control. An audit also includes evaluating the appropriateness of accounting policies used and the reasonablesness of accounting estimates made by management, as well as evaluating the overall presentation of the f inancial statements.
We believe that the audit evidence we have obtained is sufficient and appropriate to provide a basis for our audit opinion.
30 Januari 2014/January 30, 2014
Surat Ijin Akuntan Publik No. AP.0413/License of Public Accountant No. AP.0413
The accompanying financial statements are not intended to present the financial position, results of operations, changes in shareholders’ equity and cash flows in accordance with Financial Accounting Standards in countr ies and jur i sdic t ions other than Indonesia . The standards, procedures and practices to audit such financial statements are those in comformity with Indonesian Financial Accounting Standards.
ii
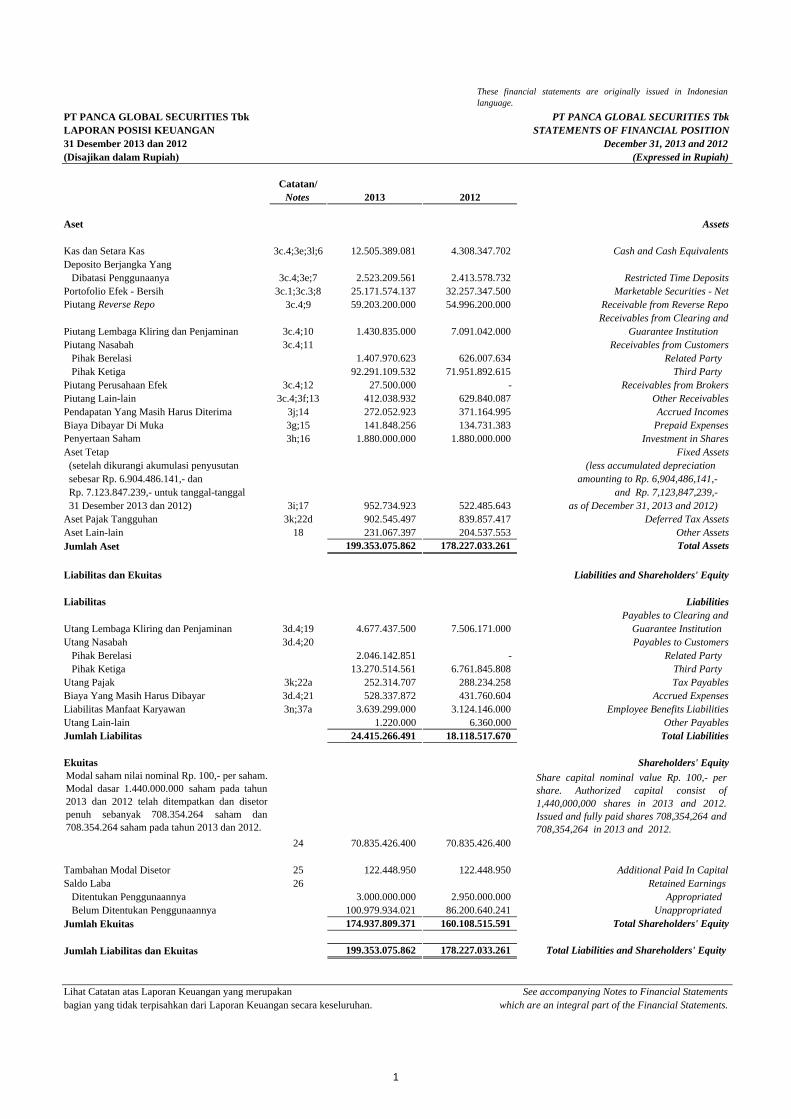
1
PT PANCA GLOBAL SECURITIES Tbk PT PANCA GLOBAL SECURITIES TbkLAPORAN POSISI KEUANGAN STATEMENTS OF FINANCIAL POSITION31 Desember 2013 dan 2012 December 31, 2013 and 2012(Disajikan dalam Rupiah) (Expressed in Rupiah)
Catatan/Notes 2013 2012
Aset Assets
Kas dan Setara Kas 3c.4;3e;3l;6 12.505.389.081 4.308.347.702 Cash and Cash EquivalentsDeposito Berjangka Yang
Dibatasi Penggunaanya 3c.4;3e;7 2.523.209.561 2.413.578.732 Restricted Time DepositsPortofolio Efek - Bersih 3c.1;3c.3;8 25.171.574.137 32.257.347.500 Marketable Securities - NetPiutang Reverse Repo 3c.4;9 59.203.200.000 54.996.200.000 Receivable from Reverse Repo
Receivables from Clearing andPiutang Lembaga Kliring dan Penjaminan 3c.4;10 1.430.835.000 7.091.042.000 Guarantee InstitutionPiutang Nasabah 3c.4;11 Receivables from Customers
Pihak Berelasi 1.407.970.623 626.007.634 Related PartyPihak Ketiga 92.291.109.532 71.951.892.615 Third Party
Piutang Perusahaan Efek 3c.4;12 27.500.000 - Receivables from BrokersPiutang Lain-lain 3c.4;3f;13 412.038.932 629.840.087 Other ReceivablesPendapatan Yang Masih Harus Diterima 3j;14 272.052.923 371.164.995 Accrued IncomesBiaya Dibayar Di Muka 3g;15 141.848.256 134.731.383 Prepaid ExpensesPenyertaan Saham 3h;16 1.880.000.000 1.880.000.000 Investment in SharesAset Tetap Fixed Assets (setelah dikurangi akumulasi penyusutan (less accumulated depreciation sebesar Rp. 6.904.486.141,- dan amounting to Rp. 6,904,486,141,- Rp. 7.123.847.239,- untuk tanggal-tanggal and Rp. 7,123,847,239,- 31 Desember 2013 dan 2012) 3i;17 952.734.923 522.485.643 as of December 31, 2013 and 2012)Aset Pajak Tangguhan 3k;22d 902.545.497 839.857.417 Deferred Tax AssetsAset Lain-lain 18 231.067.397 204.537.553 Other AssetsJumlah Aset 199.353.075.862 178.227.033.261 Total Assets
Liabilitas dan Ekuitas Liabilities and Shareholders' Equity
Liabilitas LiabilitiesPayables to Clearing and
Utang Lembaga Kliring dan Penjaminan 3d.4;19 4.677.437.500 7.506.171.000 Guarantee InstitutionUtang Nasabah 3d.4;20 Payables to Customers
Pihak Berelasi 2.046.142.851 - Related PartyPihak Ketiga 13.270.514.561 6.761.845.808 Third Party
Utang Pajak 3k;22a 252.314.707 288.234.258 Tax PayablesBiaya Yang Masih Harus Dibayar 3d.4;21 528.337.872 431.760.604 Accrued ExpensesLiabilitas Manfaat Karyawan 3n;37a 3.639.299.000 3.124.146.000 Employee Benefits LiabilitiesUtang Lain-lain 1.220.000 6.360.000 Other PayablesJumlah Liabilitas 24.415.266.491 18.118.517.670 Total Liabilities
Ekuitas Shareholders' Equity
24 70.835.426.400 70.835.426.400
Tambahan Modal Disetor 25 122.448.950 122.448.950 Additional Paid In CapitalSaldo Laba 26 Retained Earnings
Ditentukan Penggunaannya 3.000.000.000 2.950.000.000 AppropriatedBelum Ditentukan Penggunaannya 100.979.934.021 86.200.640.241 Unappropriated
Jumlah Ekuitas 174.937.809.371 160.108.515.591 Total Shareholders' Equity
Jumlah Liabilitas dan Ekuitas 199.353.075.862 178.227.033.261 Total Liabilities and Shareholders' Equity
Lihat Catatan atas Laporan Keuangan yang merupakan See accompanying Notes to Financial Statementsbagian yang tidak terpisahkan dari Laporan Keuangan secara keseluruhan. which are an integral part of the Financial Statements.
These financial statements are originally issued in Indonesianlanguage.
Modal saham nilai nominal Rp. 100,- per saham.Modal dasar 1.440.000.000 saham pada tahun2013 dan 2012 telah ditempatkan dan disetorpenuh sebanyak 708.354.264 saham dan708.354.264 saham pada tahun 2013 dan 2012.
Share capital nominal value Rp. 100,- pershare. Authorized capital consist of1,440,000,000 shares in 2013 and 2012.Issued and fully paid shares 708,354,264 and708,354,264 in 2013 and 2012.
1

2
PT PANCA GLOBAL SECURITIES Tbk PT PANCA GLOBAL SECURITIES TbkLAPORAN LABA RUGI KOMPREHENSIF STATEMENTS OF COMPREHENSIVE INCOMEUntuk Tahun Yang Berakhir Pada Tanggal-Tanggal 31 Desember 2013 dan 2012 For The Years Ended December 31, 2013 and 2012(Disajikan dalam Rupiah) (Expressed in Rupiah)
Catatan/Notes 2013 2012
Pendapatan Usaha RevenuesKomisi dari Transaksi Perantara Pedagang Efek 3j;27 8.211.405.030 14.747.568.913 Brokerage CommissionsPendapatan Bunga atas Pembiayaan Nasabah 3j;28 3.915.758.074 6.903.377.174 Interest Income from Margin TradingLaba Bersih atas Perdagangan Realized Gain on Trading of
Efek Yang Terealisasi 3j;29 11.715.832.210 7.846.780.339 Marketable Securities - Net Laba (Rugi) Bersih atas Portofolio Efek Unrealized Gain (Loss) on
Yang Belum Terealisasi 3j;30 (946.428.987) (1.084.070.451) Marketable Securities - Net Jasa Agen Penjualan 3j;31 450.876.499 486.834.865 Selling Agent FeesJasa Manajemen Investasi 3f;3j;32 - 249.278.555 Investment Management FeesJasa Penjamin Emisi Efek 3j;33 34.821.126 311.244.750 Underwriting FeesJasa Penasehat Keuangan 3j;34 500.000.000 300.000.000 Investment Advisory FeesDividen 6.635.665 6.144.547 DividendJumlah Pendapatan Usaha 23.888.899.617 29.767.158.692 Total Revenues
Beban Usaha Operating ExpensesTransaksi Efek 2.846.753.651 7.345.731.969 Marketable Securities TransactionGaji dan Tunjangan 3.660.239.754 4.042.924.484 Salaries and AllowancesAdministrasi dan Umum 3j;35 1.508.463.511 1.412.854.067 General and AdministrativePenyusutan Aset Tetap 3i;17 648.138.902 539.409.760 Depreciation of Fixed AssetsSewa dan Pemeliharaan Gedung 639.226.167 559.643.284 Building Rent and MaintenancesJumlah Beban Usaha 9.302.821.985 13.900.563.564 Total Operating Expenses
Laba Usaha 14.586.077.632 15.866.595.128 Operating Income
Pendapatan (Beban) Lain-Lain Other Incomes (Expenses)Pendapatan Bunga 4.599.315.368 4.080.183.793 Interest IncomesLaba Selisih Kurs 35.223.856 16.211.185 Gain on Foreign ExchangeBeban Bunga - (43.855.325) Interest ExpensesLaba atas Penjualan Aset Tetap 540.000.000 600.000.000 Gain on Sale of Fixed AssetsLain-lain 4.005.517.883 1.177.665.083 OthersJumlah Pendapatan Lain-lain- Bersih 9.180.057.107 5.830.204.736 Total Other Incomes - Net
Laba Sebelum Pajak Penghasilan 23.766.134.739 21.696.799.864 Income Before Income Tax
Manfaat (Beban) Pajak Penghasilan Income Tax Benefit (Expenses)Pajak Kini 3k;22b;22c (1.915.986.400) (2.375.360.200) Current TaxPajak Tangguhan 3k;22b;22d 62.688.080 64.045.298 Deferred TaxJumlah Beban Pajak Penghasilan (1.853.298.320) (2.311.314.902) Total Income Tax Expenses
Laba Bersih 21.912.836.419 19.385.484.961 Net Income
Pendapatan Komprehensif Lain: Other Comprehensive Income :Aset Keuangan Tersedia Untuk Dijual - - Financial Assets, Available-for-SaleJumlah Laba Komprehensif Tahun Berjalan 21.912.836.419 19.385.484.961 Total Comprehensive Income For The Years
Laba Yang Dapat Diatribusikan Kepada : Net Income Attributable to :Pemilik Entitas Induk 21.912.836.419 19.385.484.961 Owner of The EntityKepentingan Non Pengendali - - Non Controlling InterestJumlah 21.912.836.419 19.385.484.961 Total
Jumlah Laba Komprehensif Yang Dapat Diatribusikan Kepada: Total Comprehensive Income Attributable to:
Pemilik Entitas Induk 21.912.836.419 19.385.484.961 Owner of The EntityKepetingan Non Pengendali - - Non Controlling InterestJumlah 21.912.836.419 19.385.484.961 Total
Laba Usaha Per Saham 3o 20,59 22,40 Operating Income Per Share
Laba Bersih Per Saham 3o 30,93 27,37 Net Income Per Share
Lihat Catatan atas Laporan Keuangan yang merupakan See accompanying Notes to Financial Statementsbagian yang tidak terpisahkan dari Laporan Keuangan secara keseluruhan. which are an integral part of the Financial Statements.
These financial statements are originally issued in Indonesianlanguage.
2
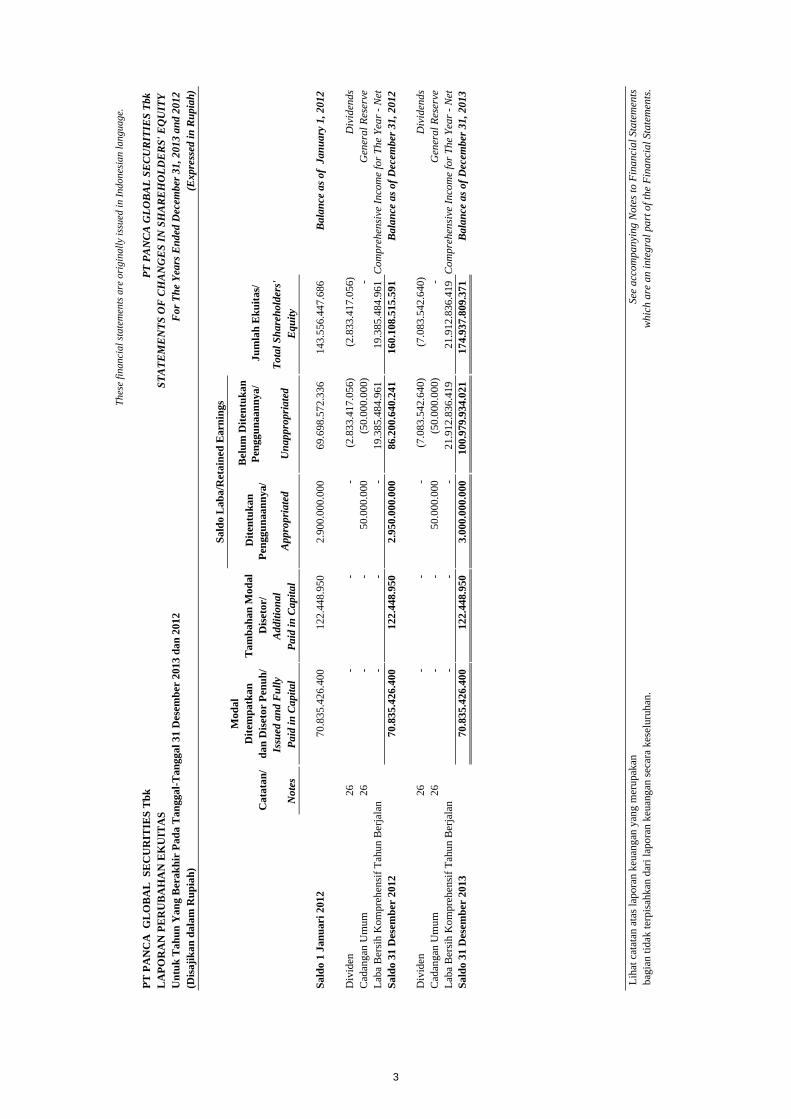
3
PT P
AN
CA
GL
OB
AL
SE
CU
RIT
IES
Tbk
PT P
AN
CA
GLO
BA
L SE
CU
RIT
IES
Tbk
LA
POR
AN
PE
RU
BA
HA
N E
KU
ITA
SST
ATE
ME
NTS
OF
CH
AN
GE
S IN
SH
AR
EH
OLD
ER
S' E
QU
ITY
Unt
uk T
ahun
Yan
g B
erak
hir
Pada
Tan
ggal
-Tan
ggal
31
Des
embe
r 20
13 d
an 2
012
For
The
Yea
rs E
nded
Dec
embe
r 31,
201
3 an
d 20
12(D
isaj
ikan
dal
am R
upia
h)(E
xpre
ssed
in R
upia
h)
Mod
alD
item
patk
anT
amba
han
Mod
alC
atat
an/
dan
Dis
etor
Pen
uh/
Dis
etor
/ Is
sued
and
Ful
ly
Add
ition
alTo
tal S
hare
hold
ers'
Not
esPa
id in
Cap
ital
Pai
d in
Cap
ital
Equ
ity
Sald
o 1
Janu
ari 2
012
70.8
35.4
26.4
00
122.
448.
950
2.90
0.00
0.00
0
69.6
98.5
72.3
36
143.
556.
447.
686
Bal
ance
as o
f Ja
nuar
y 1,
201
2
Div
iden
26-
-
-
(2
.833
.417
.056
)
(2.8
33.4
17.0
56)
D
ivid
ends
Cad
anga
n U
mum
26-
-
50.0
00.0
00
(50.
000.
000)
-
G
ener
al R
eser
veLa
ba B
ersi
h K
ompr
ehen
sif T
ahun
Ber
jala
n-
-
-
19
.385
.484
.961
19
.385
.484
.961
C
ompr
ehen
sive
Inco
me
for T
he Y
ear -
Net
Sald
o 31
Des
embe
r 20
1270
.835
.426
.400
12
2.44
8.95
0
2.
950.
000.
000
86
.200
.640
.241
16
0.10
8.51
5.59
1
B
alan
ce a
s of D
ecem
ber 3
1, 2
012
Div
iden
26-
-
-
(7
.083
.542
.640
)
(7.0
83.5
42.6
40)
D
ivid
ends
Cad
anga
n U
mum
26-
-
50.0
00.0
00
(50.
000.
000)
-
G
ener
al R
eser
veLa
ba B
ersi
h K
ompr
ehen
sif T
ahun
Ber
jala
n-
-
-
21
.912
.836
.419
21
.912
.836
.419
C
ompr
ehen
sive
Inco
me
for T
he Y
ear -
Net
Sald
o 31
Des
embe
r 20
1370
.835
.426
.400
12
2.44
8.95
0
3.
000.
000.
000
10
0.97
9.93
4.02
1
17
4.93
7.80
9.37
1
B
alan
ce a
s of D
ecem
ber 3
1, 2
013
Liha
t cat
atan
ata
s lap
oran
keu
anga
n ya
ng m
erup
akan
See
acco
mpa
nyin
g N
otes
to F
inan
cial
Sta
tem
ents
bagi
an ti
dak
terp
isah
kan
dari
lapo
ran
keua
ngan
seca
ra k
esel
uruh
an.
whi
ch a
re a
n in
tegr
al p
art o
f the
Fin
anci
al S
tate
men
ts.
Sald
o L
aba/
Ret
aine
d E
arni
ngs
Dite
ntuk
an
Peng
guna
anny
a/
App
ropr
iate
d
Jum
lah
Eku
itas/
Una
ppro
pria
ted
Bel
um D
itent
ukan
Pe
nggu
naan
nya/
Thes
e fin
anci
al st
atem
ents
are
ori
gina
lly is
sued
in In
done
sian
lang
uage
.
3

4
PT PANCA GLOBAL SECURITIES Tbk PT PANCA GLOBAL SECURITIES TbkLAPORAN ARUS KAS STATEMENTS OF CASH FLOWSUntuk Tahun Yang Berakhir Pada Tanggal-Tanggal 31 Desember 2013 dan 2012 For The Years Ended December 31, 2013 and 2012(Disajikan dalam Rupiah) (Expressed in Rupiah)
2013 2012
Arus Kas dari Aktivitas Operasi Cash Flows from Operating ActivitiesPenerimaan Komisi Perantara Pedagang Efek 8.211.405.030 14.747.568.913 Receipts from Brokerage CommissionsPenerimaan Bunga, Bersih 8.602.582.864 11.199.782.021 Receipts from Interest, NetPenerimaan dari (Pembayaran kepada) Receipts from (Payments to) Clearing and
Lembaga Kliring dan Penjaminan 2.831.473.500 (6.165.066.000) Guarantee InstitutionsPenerimaan dari (Pembayaran kepada) Receipts from (Payment to)
Efek Diperdagangkan 13.648.176.586 (55.632.337.612) Marketable SecuritiesPenerimaan Jasa Manajemen Investasi 962.479.149 1.083.046.081 Receipts from Investment Managemet FeesPenerimaan Jasa Penjaminan Emisi 34.821.126 311.244.750 Receipts from Underwriting FeesPenerimaan Dividen 6.635.665 6.144.547 Receipts from DividendPembayaran kepada Nasabah, Bersih (12.566.368.302) (35.832.963.027) Payment to Customers, NetPembayaran kepada Karyawan dan Pemasok (8.048.092.815) (12.902.942.326) Payments to Employees and SuppliersPembayaran kepada Perusahaan Efek, Bersih (27.500.000) - Payment to Brokers, NetPenerimaan Lainnya, Bersih 4.271.828.975 982.750.595 Other Receipts, NetPembayaran Pajak Penghasilan (1.972.308.904) (2.370.064.582) Income Tax Payments
Net Cash Flows from (in)Arus Kas Bersih dari (untuk) Aktivitas Operasi 15.955.132.874 (84.572.836.640) Operating Activities
Arus Kas dari Aktivitas Investasi Cash Flows from Investing ActivitiesPenambahan Aset Lain-lain (26.529.844) (7.535.120) Additional in Other AssetsDeposito Berjangka Yang Dibatasi Penggunaanya (109.630.829) (105.132.241) Restricted Time DepositsPerolehan Aset Tetap (1.078.388.182) (42.984.000) Acquisition of Fixed AssetsHasil dari Penjualan Aset Tetap 540.000.000 600.000.000 Proceeds from Sale of Fixed Assets
Net Cash Flows from (in)Arus Kas Bersih dari (untuk) Aktivitas Investasi (674.548.855) 444.348.639 Investing Activities
Arus Kas dari Aktivitas Pendanaan Cash Flows from Financing ActivitiesPembayaran Dividen (7.083.542.640) (2.833.417.056) Dividend PaymentsArus Kas Bersih untuk Aktivitas Pendanaan (7.083.542.640) (2.833.417.056) Net Cash Flows in Financing Activities
Increase (Decrease) inKenaikan (Penurunan) Kas dan Setara Kas 8.197.041.379 (86.961.905.057) Cash and Cash Equivalents
Cash and Cash Equivalents -Kas dan Setara Kas Awal Tahun 4.308.347.702 91.270.252.759 at Beginning of The Year
Cash and Cash Equivalent -Kas dan Setara Kas Akhir Tahun 12.505.389.081 4.308.347.702 at The End of The Year
Lihat Catatan atas Laporan Keuangan yang merupakan See accompanying Notes to Financial Statementsbagian yang tidak terpisahkan dari Laporan Keuangan secara keseluruhan. which are an integral part of the Financial Statements.
These financial statements are originally issued in indonesianlanguage.
4
PT PANCA GLOBAL SECURITIES Tbk PT PANCA GLOBAL SECURITIES TbkCATATAN ATAS LAPORAN KEUANGAN NOTES TO FINANCIAL STATEMENTSUntuk Tahun Yang Berakhir Pada Tanggal-Tanggal 31 Desember 2013 dan 2012 For The Years Ended December 31, 2013 and 2012(Disajikan dalam Rupiah) (Expressed in Rupiah)
1. Umum 1. General
a. Pendirian dan Informasi Umum a. Establishment and General Information
Komisaris Utama (Independen) : : President Commissioner (Independent)Komisaris : : CommissionerKomisaris (Independen) : : Commissioner (Independent)
Direktur Utama : : President DirectorDirektur : : DirectorDirektur (Independen) : : Director (Independent)
Komite Audit Audit CommitteeKetua : : ChairmanAnggota : : MembersAnggota : : Members
Tn. Chengwy KarlamNy. Farida Eva Riyanti Hutapea
Tn. Sulianto
Tn. Hendra Hasan KustarjoTn. Trisno Limanto
Nn. Theresia Yolanda Mangundap
Tn. Chengwy KarlamNy. Unikasari Setio
Ny. Arriany Simanjuntak
PT Panca Global Securities Tbk ("Entitas") didirikan berdasarkan Akta No.20 tanggal 13 Agustus 1999 oleh notaris Fathiah Helmi SH., notaris diJakarta. Akta tersebut telah disahkan Menteri Kehakiman Republik Indonesiamelalui Surat Keputusan No. C-16336.HT.01.01.Th. 99 tanggal 13 September1999 dan telah diumumkan dalam Berita Negara Republik Indonesia No. 36tanggal 4 Mei 2001, Tambahan No. 2871. Perubahan akta Anggaran DasarEntitas adalah berdasarkan Rapat Umum Pemegang Saham Luar Biasa PTPanca Global Securities Tbk tertuang dalam akta No. 6 tanggal 5 Mei 2008yang dibuat di hadapan notaris Fathiah Helmi, SH., di Jakarta yang telahmendapat persetujuan dari Menteri Kehakiman dan Hak Asasi Manusiadengan Surat Keputusan Nomor. AHU-39828.A.H.01.02 Tahun 2008 tanggal10 Juli 2008, mengenai perubahan seluruh Anggaran Dasar Entitas antara lainpenyesuaian dengan Undang-Undang Nomor 40 tahun 2007 tentangPerseroan Terbatas.
PT Panca Global Securities Tbk ("The Entity") was established based onnotarial deed No. 20 dated August 13, 1999 of Fathiah Helmi, SH., notary inJakarta. The deed was approved by the Minister of Justice of the Republicof Indonesia in decision letter No. C-16336.HT.01.01.Th. 99 datedSeptember 13, 1999 and was published in the State Gazette of the Republicof Indonesia No. 36 dated May 4, 2001, Supplement No. 2871. The Entity'sArticles of Association have been amended several times, most recentlybased on Extraordinary Shareholders General Meeting PT Panca GlobalSecurities Tbk which is stated in the deed No. 6 dated May 5, 2008 ofFathiah Helmi, SH., notary in Jakarta which has approved by Minister ofjustice and Human Rights of the Republic of Indonesia in his Decision letterNo. AHU-39828.A.H.01.02 dated July 10, 2008, regarding amendment ofthe article of Association in connection with the adjustment of Law number40, year 2007 regarding Limited Liability Entity.
These financial statements are originally issued in Indonesian language.
Sesuai dengan pasal 3 dari Anggaran Dasar Entitas, ruang lingkup kegiatanEntitas adalah menjalankan usaha selaku Perantara Pedagang Efek. Entitasmenjadi anggota Bursa Efek Jakarta dan mendapatkan ijin dari BadanPengawas Pasar Modal untuk melakukan kegiatan sebagai PerantaraPedagang Efek No. KEP.01/PM/PPE/2000 tanggal 31 Maret 2000 dan padatanggal 30 Desember 2003 Entitas telah memperoleh izin fasilitasperdagangan margin dengan No. S-1414/BEJ-ANG/12-2003 dari Direksi PTBursa Efek Jakarta. Entitas juga telah mendapatkan ijin untuk melakukanpenjamin emisi efek dengan No. KEP-05/PM/PEE/2005 tanggal 12 September2005.
Entitas mulai beroperasi secara komersil pada tanggal 1 Agustus 2000.Entitas berdomisili di Gedung Bursa Efek Indonesia, Tower I Suite 1706 A,Jl. Jend. Sudirman Kav 52-53, Jakarta 12190, Indonesia.
In accordance with article 3 of the Entity's Article of Association, the scopeof the Entity's activities consist of brokerage and securities trading. TheEntity was granted securities firm license from the Capital MarketSupervisory Agency (BAPEPAM) through decision letters No.KEP.01/PM/PPE/2000 dated March 31, 2000 and subsequently became amember of Jakarta Stock Exchange. On December 30, 2003 the Entity hasobtained margin transaction facility license through decision letters No. S-1414/BEJ-ANG/12-2003 from Director of PT Bursa Efek Jakarta. Base onthe decision letter No. KEP-05/PM/PEE/2005 dated September 12, 2005 theEntity obtained underwriting license from the Chairman of Capital MarketSupervisory Agency.
The Entity started to operate commercially in Agust 1,2000. The Entity isdomiciled in Indonesia Stock Exchange Building, Tower I Suite 1706 A, Jl.Jend. Sudirman Kav 52-53, Jakarta 12190, Indonesia.
Berdasarkan Berita Acara Rapat Umum Pemegang Saham Luar Biasa tanggal21 Juni 2010, sebagaimana termaktub dalam akta No. 56 tanggal 21 Juni2010 yang dibuat di hadapan Fathiah Helmi, SH., Notaris di Jakarta, parapemegang saham menyetujui perubahan susunan pengurus Entitas. Adapunsusunan pengurus Entitas tahun 2013 dan 2012 sebagai berikut :
Based on the Extraordinary Shareholder General Meeting dated June 21,2010 as stated on notarial deed No. 56 dated June 21, 2010 of FathiahHelmi, SH, notary in Jakarta, the shareholders approved the changes of theEntity management. The composition of the Entity management of 2013 and2012 are as follows :
Perubahan terakhir Anggaran Dasar Entitas adalah berdasarkan Rapat UmumPemegang Saham Luar Biasa PT Panca Global Securities Tbk tertuang dalamakta No. 56 tanggal 14 Desember 2011 yang dibuat di hadapan notarisFathiah Helmi, SH., notaris di Jakarta mengenai perubahan kegiatan usahaEntitas dan peningkatan modal Entitas. Anggaran Dasar ini telah memperolehpersetujuan dari Kementerian Hukum dan Hak Asasi Manusia RepublikIndonesia dengan Keputusannya No. AHU-00194.AH.01.02 Th. 2012 tanggal3 Januari 2012 dan Penerimaan Pemberitahuan Perubahan Anggaran Dasartelah diterima dan dicatat dalam database Sisminbakum Menteri Hukum danHak Asasi Manusia No. AHU-AH.01.10.02105 tanggal 20 Januari 2012.
The latest amendment of Entity's Article of Association based onExtraordinary Shareholders General Meeting based on notarial deed No. 56dated December 14, 2011 of Fathiah Helmi, SH., notary in Jakarta,regarding changes in Entity business activities and capital increased. Thelatest amendment above has approved by Minister of Justice and HumanRight of the Republic of Indonesia in his Decision letter No. AHU-00194.AH.01.02 Th. 2012 dated January 3, 2012 and the acceptance of itsamendment received and recorded in Legal Entity Administration Systemdatabase of Minister of Justice and Human Right No. AHU-AH.01.10.02105dated January 20, 2012.
5

5
PT PANCA GLOBAL SECURITIES Tbk PT PANCA GLOBAL SECURITIES TbkCATATAN ATAS LAPORAN KEUANGAN NOTES TO FINANCIAL STATEMENTSUntuk Tahun Yang Berakhir Pada Tanggal-Tanggal 31 Desember 2013 dan 2012 For The Years Ended December 31, 2013 and 2012(Disajikan dalam Rupiah) (Expressed in Rupiah)
1. Umum 1. General
a. Pendirian dan Informasi Umum a. Establishment and General Information
Komisaris Utama (Independen) : : President Commissioner (Independent)Komisaris : : CommissionerKomisaris (Independen) : : Commissioner (Independent)
Direktur Utama : : President DirectorDirektur : : DirectorDirektur (Independen) : : Director (Independent)
Komite Audit Audit CommitteeKetua : : ChairmanAnggota : : MembersAnggota : : Members
Tn. Chengwy KarlamNy. Farida Eva Riyanti Hutapea
Tn. Sulianto
Tn. Hendra Hasan KustarjoTn. Trisno Limanto
Nn. Theresia Yolanda Mangundap
Tn. Chengwy KarlamNy. Unikasari Setio
Ny. Arriany Simanjuntak
PT Panca Global Securities Tbk ("Entitas") didirikan berdasarkan Akta No.20 tanggal 13 Agustus 1999 oleh notaris Fathiah Helmi SH., notaris diJakarta. Akta tersebut telah disahkan Menteri Kehakiman Republik Indonesiamelalui Surat Keputusan No. C-16336.HT.01.01.Th. 99 tanggal 13 September1999 dan telah diumumkan dalam Berita Negara Republik Indonesia No. 36tanggal 4 Mei 2001, Tambahan No. 2871. Perubahan akta Anggaran DasarEntitas adalah berdasarkan Rapat Umum Pemegang Saham Luar Biasa PTPanca Global Securities Tbk tertuang dalam akta No. 6 tanggal 5 Mei 2008yang dibuat di hadapan notaris Fathiah Helmi, SH., di Jakarta yang telahmendapat persetujuan dari Menteri Kehakiman dan Hak Asasi Manusiadengan Surat Keputusan Nomor. AHU-39828.A.H.01.02 Tahun 2008 tanggal10 Juli 2008, mengenai perubahan seluruh Anggaran Dasar Entitas antara lainpenyesuaian dengan Undang-Undang Nomor 40 tahun 2007 tentangPerseroan Terbatas.
PT Panca Global Securities Tbk ("The Entity") was established based onnotarial deed No. 20 dated August 13, 1999 of Fathiah Helmi, SH., notary inJakarta. The deed was approved by the Minister of Justice of the Republicof Indonesia in decision letter No. C-16336.HT.01.01.Th. 99 datedSeptember 13, 1999 and was published in the State Gazette of the Republicof Indonesia No. 36 dated May 4, 2001, Supplement No. 2871. The Entity'sArticles of Association have been amended several times, most recentlybased on Extraordinary Shareholders General Meeting PT Panca GlobalSecurities Tbk which is stated in the deed No. 6 dated May 5, 2008 ofFathiah Helmi, SH., notary in Jakarta which has approved by Minister ofjustice and Human Rights of the Republic of Indonesia in his Decision letterNo. AHU-39828.A.H.01.02 dated July 10, 2008, regarding amendment ofthe article of Association in connection with the adjustment of Law number40, year 2007 regarding Limited Liability Entity.
These financial statements are originally issued in Indonesian language.
Sesuai dengan pasal 3 dari Anggaran Dasar Entitas, ruang lingkup kegiatanEntitas adalah menjalankan usaha selaku Perantara Pedagang Efek. Entitasmenjadi anggota Bursa Efek Jakarta dan mendapatkan ijin dari BadanPengawas Pasar Modal untuk melakukan kegiatan sebagai PerantaraPedagang Efek No. KEP.01/PM/PPE/2000 tanggal 31 Maret 2000 dan padatanggal 30 Desember 2003 Entitas telah memperoleh izin fasilitasperdagangan margin dengan No. S-1414/BEJ-ANG/12-2003 dari Direksi PTBursa Efek Jakarta. Entitas juga telah mendapatkan ijin untuk melakukanpenjamin emisi efek dengan No. KEP-05/PM/PEE/2005 tanggal 12 September2005.
Entitas mulai beroperasi secara komersil pada tanggal 1 Agustus 2000.Entitas berdomisili di Gedung Bursa Efek Indonesia, Tower I Suite 1706 A,Jl. Jend. Sudirman Kav 52-53, Jakarta 12190, Indonesia.
In accordance with article 3 of the Entity's Article of Association, the scopeof the Entity's activities consist of brokerage and securities trading. TheEntity was granted securities firm license from the Capital MarketSupervisory Agency (BAPEPAM) through decision letters No.KEP.01/PM/PPE/2000 dated March 31, 2000 and subsequently became amember of Jakarta Stock Exchange. On December 30, 2003 the Entity hasobtained margin transaction facility license through decision letters No. S-1414/BEJ-ANG/12-2003 from Director of PT Bursa Efek Jakarta. Base onthe decision letter No. KEP-05/PM/PEE/2005 dated September 12, 2005 theEntity obtained underwriting license from the Chairman of Capital MarketSupervisory Agency.
The Entity started to operate commercially in Agust 1,2000. The Entity isdomiciled in Indonesia Stock Exchange Building, Tower I Suite 1706 A, Jl.Jend. Sudirman Kav 52-53, Jakarta 12190, Indonesia.
Berdasarkan Berita Acara Rapat Umum Pemegang Saham Luar Biasa tanggal21 Juni 2010, sebagaimana termaktub dalam akta No. 56 tanggal 21 Juni2010 yang dibuat di hadapan Fathiah Helmi, SH., Notaris di Jakarta, parapemegang saham menyetujui perubahan susunan pengurus Entitas. Adapunsusunan pengurus Entitas tahun 2013 dan 2012 sebagai berikut :
Based on the Extraordinary Shareholder General Meeting dated June 21,2010 as stated on notarial deed No. 56 dated June 21, 2010 of FathiahHelmi, SH, notary in Jakarta, the shareholders approved the changes of theEntity management. The composition of the Entity management of 2013 and2012 are as follows :
Perubahan terakhir Anggaran Dasar Entitas adalah berdasarkan Rapat UmumPemegang Saham Luar Biasa PT Panca Global Securities Tbk tertuang dalamakta No. 56 tanggal 14 Desember 2011 yang dibuat di hadapan notarisFathiah Helmi, SH., notaris di Jakarta mengenai perubahan kegiatan usahaEntitas dan peningkatan modal Entitas. Anggaran Dasar ini telah memperolehpersetujuan dari Kementerian Hukum dan Hak Asasi Manusia RepublikIndonesia dengan Keputusannya No. AHU-00194.AH.01.02 Th. 2012 tanggal3 Januari 2012 dan Penerimaan Pemberitahuan Perubahan Anggaran Dasartelah diterima dan dicatat dalam database Sisminbakum Menteri Hukum danHak Asasi Manusia No. AHU-AH.01.10.02105 tanggal 20 Januari 2012.
The latest amendment of Entity's Article of Association based onExtraordinary Shareholders General Meeting based on notarial deed No. 56dated December 14, 2011 of Fathiah Helmi, SH., notary in Jakarta,regarding changes in Entity business activities and capital increased. Thelatest amendment above has approved by Minister of Justice and HumanRight of the Republic of Indonesia in his Decision letter No. AHU-00194.AH.01.02 Th. 2012 dated January 3, 2012 and the acceptance of itsamendment received and recorded in Legal Entity Administration Systemdatabase of Minister of Justice and Human Right No. AHU-AH.01.10.02105dated January 20, 2012.
5

6
PT PANCA GLOBAL SECURITIES Tbk PT PANCA GLOBAL SECURITIES TbkCATATAN ATAS LAPORAN KEUANGAN NOTES TO FINANCIAL STATEMENTSUntuk Tahun Yang Berakhir Pada Tanggal-Tanggal 31 Desember 2013 dan 2012 For The Years Ended December 31, 2013 and 2012(Disajikan dalam Rupiah) (Expressed in Rupiah)
These financial statements are originally issued in Indonesian language.
1. Umum - lanjutan 1. General - continued
a. Pendirian dan Informasi Umum - lanjutan a. Establishment and General Information - continued
Imbalan Kerja Jangka Pendek Short Term Employee BenefitsImbalan Kerja Jangka Panjang Long Term Employee BenefitsJumlah Total
b. Penawaran Umum Efek Entitas b. Public Offering of The Entity's Shares
2. Penerapan Pernyataan Standar Akuntansi Keuangan Baru 2. Adoption of Revised Statements Financial Accounting Standards
• •
• •
3. Iktisar Kebijakan Akuntansi 3. Summary of Significant Accounting Policies
a. Dasar Penyusunan Laporan Keuangan a. Basic of Preparation Financial Statements
1.460.425.659 1.495.602.2641.708.875.000
3.587.196.659 3.204.477.264
2013 2012
2.126.771.000
Laporan keuangan disajikan sesuai dengan Standar Akuntansi Keuangan diIndonesia sebagaimana diterbitkan oleh Ikatan Akuntan Indonesia.
The financial statements have been prepared in accordance with IndonesianFinancial Accounting Standards issued by the Indonesian Institute ofAccountants.
Besarnya kompensasi yang diberikan kepada Dewan Komisaris dan Direksiuntuk tahun 2013 dan 2012 adalah sebagai berikut :
Total compensation paid to the Board of Commissioners and Directors forthe years 2013 and 2012 are as follows :
Pada tanggal 10 Juni 2005, Entitas memperoleh pernyataan efektif dari KetuaBadan Pengawas Pasar Modal (BAPEPAM) dengan suratnya No. S-1504/PM/2005 untuk melakukan penawaran umum atas 190.000.000 sahamdengan nominal Rp. 100,- per saham dengan harga penawaran Rp. 105,- persaham disertai penerbitan Waran Seri I sejumlah 125.400.000 yang diberikansecara cuma-cuma. Pada tanggal 24 Juni 2005, saham tersebut telahdicatatkan pada Bursa Efek Jakarta.
On June 10, 2005, BAPEPAM through decision letter No. S-1504/PM/2005approved the Entity's public offering of 190,000,000 shares with a par valueof Rp. 100,- per share at the offering price of Rp. 105,- per share includingissued Warrant Seri I amount 125,400,000 will be awarded. On June 24,2005 all of the Company shares were listed on Jakarta Stock Exchange.
Laporan keuangan disajikan dalam Rupiah kecuali dinyatakan lain, telahdisusun berdasarkan konsep akuntansi biaya historis dan dasar akrual, kecualiuntuk laporan arus kas dan beberapa akun tertentu yang disajikanberdasarkan penilaian lain seperti dijelaskan dalam kebijakan akuntansimasing-masing akun yang bersangkutan.
The financial statements presented in Rupiah unless otherwise stated, havebeen prepared on accrual basis using the historical cost concept, except forstatements of cash flow and certain accounts, which are presented based onother valuation as explained in each accounting policy.
Efektif tanggal 1 Januari 2011, entitas telah menerapkan PSAK 1 (Revisi 2009)"Penyajian Laporan Keuangan". Entitas dapat memilih untuk menyajikan satulaporan kinerja (laporan laba rugi komprehensif) atau dua laporan (laporan labarugi dan laporan laba rugi komprehensif). Entitas memilih untuk menyajikandalam bentuk satu laporan. Laporan keuangan telah disusun menggunakanpengungkapan yang disyaratkan.
Effective January 1, 2011 the entity has applied SFAS 1 (Revised 2009)"Presentation of Financial Statements". The Entity can choose whether topresent one performance statement (the statement of comprehensive income) ortwo statements (the income statement and statement of comprehensive income).The Entity has elected to present one statement. The financial statements havebeen prepared under the revised disclosure requirements.
Berikut adalah standar baru, perubahan atas standar dan interprestasi standaryang wajib diterapkan untuk pertama kalinya untuk tahun buku yang dimulai 1Januari 2013, namun tidak berdampak material terhadap entitas.
The following new standards, amendments to standards and interpretations aremandatory for the first time for the financial year beginning January 1, 2013,but are not have material impact for the entity.
Selain standar dan interprestasi tersebut diatas, keputusan ketua BadanPengawasan Pasar Modal dan Lembaga Keuangan (BAPEPAM-LK) No.KEP689/BL/2011 tanggal 30 Desember 2011 tentang "Pedoman AkuntansiPerusahaan Efek" (PAPE) juga berlaku untuk periode yang dimulai pada atausetelah 1 Januari 2012.
Other than those standards and interprestations mentioned above, the decisionof the Capital Market Supervisory Board and Financial Institution (BAPEPAM-LK) No. KEP 689/BL/2011 dated December 30, 2011 regarding "Guidance onAccounting for Securities Companies" (PAPE) is also effective for periodsbeginning on or after January 1, 2012.
PSAK 38 (revisi 2012), kombinasi bisnis Entitas sepengendali
ISAK 21, perjanjian kontrak real estat
SFAS 38 (revised 2012), business combination of Entities under commoncontrol
ISAK 21, agreements for the constructions of real estate
6
PT PANCA GLOBAL SECURITIES Tbk PT PANCA GLOBAL SECURITIES TbkCATATAN ATAS LAPORAN KEUANGAN NOTES TO FINANCIAL STATEMENTSUntuk Tahun Yang Berakhir Pada Tanggal-Tanggal 31 Desember 2013 dan 2012 For The Years Ended December 31, 2013 and 2012(Disajikan dalam Rupiah) (Expressed in Rupiah)
These financial statements are originally issued in Indonesian language.
3. Iktisar Kebijakan Akuntansi - lanjutan 3. Summary of Significant Accounting Policies - continued
b. Laporan Arus Kas b. The Statement of Cash Flows
1) 1)
2) 2)
c. Aset Keuangan c. Financial Assets
c.1 Aset Keuangan Diukur Pada Nilai Wajar Melalui Laporan c.1 Financial Assets at Fair Value Through Profit or Loss (FVTPL)Laba Rugi (FVTPL)
• •
• •
• •
• •
• •
Laporan arus kas disusun dengan menggunakan metode langsung. Laporanarus kas tersebut dikelompokkan dalam aktivitas operasi, investasi danpendanaan serta disajikan secara terpisah antara kelompok utama penerimaankas bruto dan pengeluaran kas bruto, kecuali transaksi yang memenuhikriteria seperti disebutkan dibawah ini disajikan menurut kas bersih :
Penerimaan dan pengeluaran kas untuk kepentingan para pelanggan, aruskas lebih mencerminkan aktivitas pelanggan daripada aktivitas Entitas,dan
Penerimaan dan pengeluaran kas untuk pos-pos dengan perputaran cepat,dengan volume transaksi yang besar, dan dengan jangka waktu singkat(short maturity).
The statements of cash flows are presented using the direct method, withclassifications of cash flows into operating, investing and financingactivities separately showing major classes of gross cash receipts and grosscash payments, except for cash flows arising from the following activitieswhich are reported on a net basis :
Cash receipts and payments on behalf of customers when the cash flowsreflect the activities of the customers rather than those of the Entity,and
Cash receipts and payments for item in which the turnover is high, theamounts are large and the maturities are short.
Seluruh aset keuangan diakui dan dihentikan pengakuannya pada tanggaldiperdagangkan dimana pembelian dan penjualan aset keuangan berdasarkankontrak yang mensyaratkan penyerahan aset dalam kurun waktu yangditetapkan oleh kebiasaan pasar yang berlaku, dan awalnya diukur sebesarnilai wajar ditambah biaya transaksi, kecuali untuk aset keuangan yang diukurpada nilai wajar melalui laporan laba rugi, yang awalnya diukur sebesar nilaiwajar.
All financial assets are recognized and derecognized on trade date wherethe purchase or sale of a financial asset is under a contract whose termsrequire delivery of the financial asset within the timeframe established bythe market concerned, and are initially measured at fair value plustransaction costs, except for those financial assets classified as at fair valuethrough profit or loss, which are initially measured at fair value.
Aset keuangan diklasifikasi dalam kategori aset keuangan yang diukur "padanilai wajar melalui laporan laba rugi" (FVTPL), "investasi hingga jatuhtempo" (HTM), aset keuangan "tersedia untuk dijual" (AFS) dan pinjamanyang diberikan dan piutang. Pengklasifikasian ini tergantung pada sifat dantujuan aset keuangan dan ditetapkan pada saat pengakuan awal.
Financial assets are classified into categories of financial assets as "at fairvalue through profit or loss" (FVTPL), "held-to-maturity" (HTM),"available-for-sale" (AFS) financial assets and "loans and receivables". Theclassification depends on the nature and purpose of financial assets and isdetermined at the time of initial recognition.
Aset keuangan diklasifikasi dalam FVTPL, jika aset keuangan sebagaikelompok diperdagangkan atau pada saat pengakuan awal ditetapkanuntuk diukur pada FVTPL.
Financial assets are classified as at FVTPL where the financial asset iseither held for trading or it is designated as at FVTPL.
Aset keuangan diklasifikasi sebagai kelompok, diperdagangkan, jika: A financial asset is classified as held for trading if:
Diperoleh atau dimiliki terutama untuk tujuan dijual kembali dalamwaktu dekat; atau
Merupakan bagian dari portofolio instrumen keuangan tertentu yangdikelola bersama dan terdapat bukti mengenai pola ambil untungdalam jangka pendek yang terkini; atau
Merupakan derivatif yang tidak ditetapkan dan tidak efektif sebagaiinstrumen lindung nilai.
It has been acquired principally for the purpose of selling in the nearfuture; or
It is a part of an identified portfolio of financial instruments that theentity manages together and has a recent actual pattern of short-termprofit-taking; or
It is a derivative that is not designated and effective as a hedginginstrument.
Aset keuangan selain aset keuangan sebagai kelompok diperdagangkan,dapat ditetapkan sebagai FVTPL pada pengakuan awal, jika:
A financial asset other than a financial asset held for trading may bedesignated as at FVTPL upon initial recognition if:
Penetapan tersebut mengeliminasi atau mengurangi secara signifikanketidakkonsistenan pengukuran dan pengakuan yang dapat timbul;atau
Such designation eliminates or significantly reduces a measurementor recognition inconsistency that would otherwise arise;or
Aset keuangan merupakan bagian dari kelompok aset keuangan atauliabilitas atau keduanya, yang dikelola dan kinerjanya berdasarkannilai wajar, sesuai dengan dokumentasi manajemen risiko atau strategiinvestasi Entitas, dan informasi tentang kelompok tersebut disediakansecara internal kepada manajemen kunci; atau
The financial asset forms part of a group of financial assets orfinancial liabililies or both, which is managed and its performance isevaluated on a fair value basis, in accordance with the Company'sdocumented risk management or investment strategy, andinformation about the grouping is provided internally on that basis;or
7

7
PT PANCA GLOBAL SECURITIES Tbk PT PANCA GLOBAL SECURITIES TbkCATATAN ATAS LAPORAN KEUANGAN NOTES TO FINANCIAL STATEMENTSUntuk Tahun Yang Berakhir Pada Tanggal-Tanggal 31 Desember 2013 dan 2012 For The Years Ended December 31, 2013 and 2012(Disajikan dalam Rupiah) (Expressed in Rupiah)
These financial statements are originally issued in Indonesian language.
1. Umum - lanjutan 1. General - continued
a. Pendirian dan Informasi Umum - lanjutan a. Establishment and General Information - continued
Imbalan Kerja Jangka Pendek Short Term Employee BenefitsImbalan Kerja Jangka Panjang Long Term Employee BenefitsJumlah Total
b. Penawaran Umum Efek Entitas b. Public Offering of The Entity's Shares
2. Penerapan Pernyataan Standar Akuntansi Keuangan Baru 2. Adoption of Revised Statements Financial Accounting Standards
• •
• •
3. Iktisar Kebijakan Akuntansi 3. Summary of Significant Accounting Policies
a. Dasar Penyusunan Laporan Keuangan a. Basic of Preparation Financial Statements
1.460.425.659 1.495.602.2641.708.875.000
3.587.196.659 3.204.477.264
2013 2012
2.126.771.000
Laporan keuangan disajikan sesuai dengan Standar Akuntansi Keuangan diIndonesia sebagaimana diterbitkan oleh Ikatan Akuntan Indonesia.
The financial statements have been prepared in accordance with IndonesianFinancial Accounting Standards issued by the Indonesian Institute ofAccountants.
Besarnya kompensasi yang diberikan kepada Dewan Komisaris dan Direksiuntuk tahun 2013 dan 2012 adalah sebagai berikut :
Total compensation paid to the Board of Commissioners and Directors forthe years 2013 and 2012 are as follows :
Pada tanggal 10 Juni 2005, Entitas memperoleh pernyataan efektif dari KetuaBadan Pengawas Pasar Modal (BAPEPAM) dengan suratnya No. S-1504/PM/2005 untuk melakukan penawaran umum atas 190.000.000 sahamdengan nominal Rp. 100,- per saham dengan harga penawaran Rp. 105,- persaham disertai penerbitan Waran Seri I sejumlah 125.400.000 yang diberikansecara cuma-cuma. Pada tanggal 24 Juni 2005, saham tersebut telahdicatatkan pada Bursa Efek Jakarta.
On June 10, 2005, BAPEPAM through decision letter No. S-1504/PM/2005approved the Entity's public offering of 190,000,000 shares with a par valueof Rp. 100,- per share at the offering price of Rp. 105,- per share includingissued Warrant Seri I amount 125,400,000 will be awarded. On June 24,2005 all of the Company shares were listed on Jakarta Stock Exchange.
Laporan keuangan disajikan dalam Rupiah kecuali dinyatakan lain, telahdisusun berdasarkan konsep akuntansi biaya historis dan dasar akrual, kecualiuntuk laporan arus kas dan beberapa akun tertentu yang disajikanberdasarkan penilaian lain seperti dijelaskan dalam kebijakan akuntansimasing-masing akun yang bersangkutan.
The financial statements presented in Rupiah unless otherwise stated, havebeen prepared on accrual basis using the historical cost concept, except forstatements of cash flow and certain accounts, which are presented based onother valuation as explained in each accounting policy.
Efektif tanggal 1 Januari 2011, entitas telah menerapkan PSAK 1 (Revisi 2009)"Penyajian Laporan Keuangan". Entitas dapat memilih untuk menyajikan satulaporan kinerja (laporan laba rugi komprehensif) atau dua laporan (laporan labarugi dan laporan laba rugi komprehensif). Entitas memilih untuk menyajikandalam bentuk satu laporan. Laporan keuangan telah disusun menggunakanpengungkapan yang disyaratkan.
Effective January 1, 2011 the entity has applied SFAS 1 (Revised 2009)"Presentation of Financial Statements". The Entity can choose whether topresent one performance statement (the statement of comprehensive income) ortwo statements (the income statement and statement of comprehensive income).The Entity has elected to present one statement. The financial statements havebeen prepared under the revised disclosure requirements.
Berikut adalah standar baru, perubahan atas standar dan interprestasi standaryang wajib diterapkan untuk pertama kalinya untuk tahun buku yang dimulai 1Januari 2013, namun tidak berdampak material terhadap entitas.
The following new standards, amendments to standards and interpretations aremandatory for the first time for the financial year beginning January 1, 2013,but are not have material impact for the entity.
Selain standar dan interprestasi tersebut diatas, keputusan ketua BadanPengawasan Pasar Modal dan Lembaga Keuangan (BAPEPAM-LK) No.KEP689/BL/2011 tanggal 30 Desember 2011 tentang "Pedoman AkuntansiPerusahaan Efek" (PAPE) juga berlaku untuk periode yang dimulai pada atausetelah 1 Januari 2012.
Other than those standards and interprestations mentioned above, the decisionof the Capital Market Supervisory Board and Financial Institution (BAPEPAM-LK) No. KEP 689/BL/2011 dated December 30, 2011 regarding "Guidance onAccounting for Securities Companies" (PAPE) is also effective for periodsbeginning on or after January 1, 2012.
PSAK 38 (revisi 2012), kombinasi bisnis Entitas sepengendali
ISAK 21, perjanjian kontrak real estat
SFAS 38 (revised 2012), business combination of Entities under commoncontrol
ISAK 21, agreements for the constructions of real estate
6
PT PANCA GLOBAL SECURITIES Tbk PT PANCA GLOBAL SECURITIES TbkCATATAN ATAS LAPORAN KEUANGAN NOTES TO FINANCIAL STATEMENTSUntuk Tahun Yang Berakhir Pada Tanggal-Tanggal 31 Desember 2013 dan 2012 For The Years Ended December 31, 2013 and 2012(Disajikan dalam Rupiah) (Expressed in Rupiah)
These financial statements are originally issued in Indonesian language.
3. Iktisar Kebijakan Akuntansi - lanjutan 3. Summary of Significant Accounting Policies - continued
b. Laporan Arus Kas b. The Statement of Cash Flows
1) 1)
2) 2)
c. Aset Keuangan c. Financial Assets
c.1 Aset Keuangan Diukur Pada Nilai Wajar Melalui Laporan c.1 Financial Assets at Fair Value Through Profit or Loss (FVTPL)Laba Rugi (FVTPL)
• •
• •
• •
• •
• •
Laporan arus kas disusun dengan menggunakan metode langsung. Laporanarus kas tersebut dikelompokkan dalam aktivitas operasi, investasi danpendanaan serta disajikan secara terpisah antara kelompok utama penerimaankas bruto dan pengeluaran kas bruto, kecuali transaksi yang memenuhikriteria seperti disebutkan dibawah ini disajikan menurut kas bersih :
Penerimaan dan pengeluaran kas untuk kepentingan para pelanggan, aruskas lebih mencerminkan aktivitas pelanggan daripada aktivitas Entitas,dan
Penerimaan dan pengeluaran kas untuk pos-pos dengan perputaran cepat,dengan volume transaksi yang besar, dan dengan jangka waktu singkat(short maturity).
The statements of cash flows are presented using the direct method, withclassifications of cash flows into operating, investing and financingactivities separately showing major classes of gross cash receipts and grosscash payments, except for cash flows arising from the following activitieswhich are reported on a net basis :
Cash receipts and payments on behalf of customers when the cash flowsreflect the activities of the customers rather than those of the Entity,and
Cash receipts and payments for item in which the turnover is high, theamounts are large and the maturities are short.
Seluruh aset keuangan diakui dan dihentikan pengakuannya pada tanggaldiperdagangkan dimana pembelian dan penjualan aset keuangan berdasarkankontrak yang mensyaratkan penyerahan aset dalam kurun waktu yangditetapkan oleh kebiasaan pasar yang berlaku, dan awalnya diukur sebesarnilai wajar ditambah biaya transaksi, kecuali untuk aset keuangan yang diukurpada nilai wajar melalui laporan laba rugi, yang awalnya diukur sebesar nilaiwajar.
All financial assets are recognized and derecognized on trade date wherethe purchase or sale of a financial asset is under a contract whose termsrequire delivery of the financial asset within the timeframe established bythe market concerned, and are initially measured at fair value plustransaction costs, except for those financial assets classified as at fair valuethrough profit or loss, which are initially measured at fair value.
Aset keuangan diklasifikasi dalam kategori aset keuangan yang diukur "padanilai wajar melalui laporan laba rugi" (FVTPL), "investasi hingga jatuhtempo" (HTM), aset keuangan "tersedia untuk dijual" (AFS) dan pinjamanyang diberikan dan piutang. Pengklasifikasian ini tergantung pada sifat dantujuan aset keuangan dan ditetapkan pada saat pengakuan awal.
Financial assets are classified into categories of financial assets as "at fairvalue through profit or loss" (FVTPL), "held-to-maturity" (HTM),"available-for-sale" (AFS) financial assets and "loans and receivables". Theclassification depends on the nature and purpose of financial assets and isdetermined at the time of initial recognition.
Aset keuangan diklasifikasi dalam FVTPL, jika aset keuangan sebagaikelompok diperdagangkan atau pada saat pengakuan awal ditetapkanuntuk diukur pada FVTPL.
Financial assets are classified as at FVTPL where the financial asset iseither held for trading or it is designated as at FVTPL.
Aset keuangan diklasifikasi sebagai kelompok, diperdagangkan, jika: A financial asset is classified as held for trading if:
Diperoleh atau dimiliki terutama untuk tujuan dijual kembali dalamwaktu dekat; atau
Merupakan bagian dari portofolio instrumen keuangan tertentu yangdikelola bersama dan terdapat bukti mengenai pola ambil untungdalam jangka pendek yang terkini; atau
Merupakan derivatif yang tidak ditetapkan dan tidak efektif sebagaiinstrumen lindung nilai.
It has been acquired principally for the purpose of selling in the nearfuture; or
It is a part of an identified portfolio of financial instruments that theentity manages together and has a recent actual pattern of short-termprofit-taking; or
It is a derivative that is not designated and effective as a hedginginstrument.
Aset keuangan selain aset keuangan sebagai kelompok diperdagangkan,dapat ditetapkan sebagai FVTPL pada pengakuan awal, jika:
A financial asset other than a financial asset held for trading may bedesignated as at FVTPL upon initial recognition if:
Penetapan tersebut mengeliminasi atau mengurangi secara signifikanketidakkonsistenan pengukuran dan pengakuan yang dapat timbul;atau
Such designation eliminates or significantly reduces a measurementor recognition inconsistency that would otherwise arise;or
Aset keuangan merupakan bagian dari kelompok aset keuangan atauliabilitas atau keduanya, yang dikelola dan kinerjanya berdasarkannilai wajar, sesuai dengan dokumentasi manajemen risiko atau strategiinvestasi Entitas, dan informasi tentang kelompok tersebut disediakansecara internal kepada manajemen kunci; atau
The financial asset forms part of a group of financial assets orfinancial liabililies or both, which is managed and its performance isevaluated on a fair value basis, in accordance with the Company'sdocumented risk management or investment strategy, andinformation about the grouping is provided internally on that basis;or
7
8
PT PANCA GLOBAL SECURITIES Tbk PT PANCA GLOBAL SECURITIES TbkCATATAN ATAS LAPORAN KEUANGAN NOTES TO FINANCIAL STATEMENTSUntuk Tahun Yang Berakhir Pada Tanggal-Tanggal 31 Desember 2013 dan 2012 For The Years Ended December 31, 2013 and 2012(Disajikan dalam Rupiah) (Expressed in Rupiah)
These financial statements are originally issued in Indonesian language.
3. Iktisar Kebijakan Akuntansi - lanjutan 3. Summary of Significant Accounting Policies - continued
c. Aset Keuangan - lanjutan c. Financial Assets - continued
c.1 Aset Keuangan Diukur Pada Nilai Wajar Melalui Laporan c.1 Financial Assets at Fair Value Through Profit or Loss (FVTPL)Laba Rugi (FVTPL) - lanjutan - lanjutan
• •
c.2 Investasi Dimiliki Hingga Jatuh Tempo c.2 Held- to-Maturity (HTM) Investment
c.3 Aset Keuangan Tersedia Untuk Dijual (AFS) c.3 Available-for-Sale Financial Assets (AFS)
c.4 Pinjaman Yang Diberikan dan Piutang c.4 Loans and Receivables
Merupakan bagian dari kontrak yang mengandung satu atau lebihderivatif rnelekat, dan PSAK 55 (revisi 2011) memperbolehkankontrak gabungan (aset atau liabilitas) ditetapkan sebagai FVTPL.
It forms part of a contract containing one or more embeddedderivatives, and PSAK 55 (revised 2011) permits the entire combinedcontract (asset or liabilily) to be designated as at FVTPL.
Aset keuangan FVTPL disajikan sebesar nilai wajar, keuntungan ataukerugian yang timbul diakui dalam laporan laba rugi komprehensif.Keuntungan atau kerugian bersih yang diakui dalam laporan laba rugikomprehensif mencakup dividen atau bunga yang diperoleh dari asetkeuangan. Nilai wajar ditentukan dengan cara seperti dijelaskan padaCatatan 4b.
Financial assets at FVTPL are stated at fair value, with any resultantgain or loss recognized in statements of comprehensive income. The netgain or loss recognized in statements of comprehensive incomeincorporates any dividend or interest earned on the financial asset. Fairvalue is determined in the manner described in Note 4b.
Efek utang, saham dan reksadana milik Entitas yang diperdagangkanpada pasar aktif dan diklasifikasi sebagai AFS dinyatakan pada nilaiwajar. Nilai wajar ditentukan dengan cara seperti dijelaskan pada Catatan4b.
Listed shares and bonds and mutual funds held by the Entity that aretraded in an active market are classified as being AFS are stated at fairvalue. Fair value is determined in the manner described in Note 4b.
Keuntungan atau kerugian yang timbul dari perubahan nilai wajar diakuipada ekuitas kecuali untuk kerugian penurunan nilai, bunga yang dihitungdengan metode suku bunga efektif dan laba rugi selisih kurs atas asetmoneter yang diakui pada laporan laba rugi komprehensif. Jika asetkeuangan dilepas atau mengalami penurunan nilai, akumulasi laba ataurugi yang sebelumnya diakui di ekuitas, direklas ke laporan laba rugikomprehensif.
Gains and losses arising from changes in fair value are recognised inthe equity with the exception of impairment losses, interest calculatedusing the effective interest method, and foreign exchange gains andlosses on monetary assets, which are recognised in statements ofcomprehensive income. Where the investment is disposed of or isdetermined to be impaired, the cumulative gain or loss previouslyaccumulated in the equity is reclassified to statements of comprehensiveincome.
Dividen atas instrumen ekuitas AFS, jika ada, diakui pada laporan labarugi komprehensif pada saat hak Entitas untuk memperoleh pembayarandividen ditetapkan.
Dividends on AFS equity instruments, if any, are recognised instatements of comprehensive income when the Entity's right to receivethe dividends is established.
Deposito berjangka, piutang marjin, piutang lembaga kliring danpenjaminan, piutang entitas efek, piutang nasabah dan piutang lain-laindengan pembayaran tetap atau telah ditentukan dan tidak mempunyaikuotasi di pasar aktif diklasifikasi sebagai "pinjaman yang diberikan danpiutang", yang diukur pada biaya perolehan diamortisasi denganmenggunakan metode suku bunga efektif dikurangi penurunan nilai.Bunga diakui dengan menggunakan metode suku bunga efektif, kecualipiutang jangka pendek dimana pengakuan bunga tidak material.
Time deposits, margin receivable, receivable from clearing andguarantee institution, receivable from broker, receivable from customerand other receivables that have fixed or determinable payments that arenot quoted in an active market are classified as "loans and receivables".Loans and receivables are measured at amortized cost using theeffective interest method less impairment. Interest is recognised byapplying the effective interest rate method, except for short-termreceivables when the recognition of interest would be immaterial.
Transaksi efek yang dipinjamkan dilaporkan sebagai pembiayaan yangdijamin kecuali jika terdapat letters of credit atau jaminan lain yangdiperlakukan sebagai jaminan. Sehubungan dengan efek yangdipinjamkan, Entitas menerima jaminan dalam bentuk uang tunai ataujaminan lainnya.
Securities loaned transactions are reported as collateralized financingsexcept where letters of credit or other securities are used as collateral.With respect to securities loaned, the Entity receives collateral in theform of cash or other collateral.
Aset keuangan non derivatif dengan pembayaran tetap atau telahditentukan dan jatuh temponya telah ditetapkan diklasifikasikan sebagaiHTM ketika Entitas memiliki intensi positif dan kemampuan untukmemiliki aset keuangan tersebut hingga jatuh tempo. Setelah pengukuranawal, investasi HTM diukur pada biaya perolehan diamortisasi denganmenggunakan metode suku bunga efektif. Metode ini menggunakan sukubunga efektif yang secara tepat mendiskontokan estimasi penerimaan kasdi masa datang selama perkiraan umur dari aset keuangan ke nilaitercatat bersih (net carrying amount ) dari aset keuangan. Keuntungandan kerugian diakui dalam laporan laba rugi pada saat investasi tersebutdihentikan pengakuannya atau mengalami penurunan nilai, serta melaluiproses amortisasi.
Non-derivative financial assets with fixed or determinable payments andfixed maturities are classified as HTM when the Entity has the positiveintention and ability to hold them to maturity. After initial measurement,HTM investments are measured at amortized cost using the effectiveinterest method. This method uses an effective interest rate that exactlydiscounts estimated future cash receipts through the expected life of thefinancial asset to the net carrying amount of the financial asset. Gainsand losses are recognized in the statement of income when theinvestments are derecognized or impaired, as well as through theamortization process.
8
PT PANCA GLOBAL SECURITIES Tbk PT PANCA GLOBAL SECURITIES TbkCATATAN ATAS LAPORAN KEUANGAN NOTES TO FINANCIAL STATEMENTSUntuk Tahun Yang Berakhir Pada Tanggal-Tanggal 31 Desember 2013 dan 2012 For The Years Ended December 31, 2013 and 2012(Disajikan dalam Rupiah) (Expressed in Rupiah)
These financial statements are originally issued in Indonesian language.
3. Iktisar Kebijakan Akuntansi - lanjutan 3. Summary of Significant Accounting Policies - continued
c. Aset Keuangan - lanjutan c. Financial Assets - continued
c.5 Metode Suku Bunga Efektif c.5 Effective Interest Method
c.6 Penurunan Nilai Aset Keuangan c.6 Impairment of Financial Assets
• •
• •
• •
Metode suku bunga efektif adalah metode yang digunakan untukmenghitung biaya perolehan diamortisasi dari instrumen keuangan danmetode untuk mengalokasikan pendapatan bunga selama periode yangrelevan. Suku bunga efektif adalah suku bunga yang secara tepatmendiskontokan estimasi penerimaan kas di masa datang (mencakupseluruh komisi dan bentuk lain yang dibayarkan dan diterima oleh parapihak dalam kontrak yang merupakan bagian yang tak terpisahkan darisuku bunga efektif, biaya transaksi dan premium dan diskonto lainnya)selama perkiraan umur instrumen keuangan, atau, jika lebih tepat,digunakan periode yang lebih singkat untuk memperoleh nilai tercatatbersih dari aset keuangan pada saat pengakuan awal.
The effective interest method is a method of calculating the amortizedcost of a financial instrument and of allocating interest income over therelevant period. The effective interest rate is the rate that exactlydiscounts estimated future cash receipts (including all fees on pointspaid or received that form an integral part of the effective interest rate,transaction costs and other premiums or discounts) through theexpected life of the financial instrument, or, where appropriate, ashorter period to the net carrying amount on initial recognition.
Aset keuangan, selain aset keuangan FVTPL, dievaluasi terhadapindikator penurunan nilai pada setiap tanggal laporan posisi keuangan.Aset keuangan diturunkan nilainya bila terdapat bukti objektif, sebagaiakibat dari satu atau lebih peristiwa yang terjadi setelah pengakuan awalaset keuangan, dan peristiwa yang merugikan tersebut berdampak padaestimasi arus kas masa depan atas aset keuangan yang dapat diestimasisecara handal.
Financial assets, other than those at FVTPL, are assessed for indicatorsof impairment at each statements of financial position date. Financialassets are impaired where there is objective evidence that, as a result ofone or more events that occurred after the initial recognition of thefinancial asset, the estimated future cash flows of the investment havebeen impacted.
Untuk investasi ekuitas AFS yang tercatat dan tidak tercatat di bursa,penurunan yang signifikan atau jangka panjang pada nilai wajar dariinvestasi ekuitas di bawah biaya perolehannya dianggap sebagai buktiobyektif penurunan nilai.
For listed and unlisted equity investments classified as AFS, asignificant or prolonged decline in the fair value of the security belowits cost is considered to be objective evidence of impairment.
Untuk aset keuangan lainnya, bukti obyektif penurunan nilai termasuksebagai berikut:
For all other financial assets, objective evidence of impairment couldinclude:
Kesulitan keuangan signifikan yang dialami penerbit atau pihakpeminjam; atau
Significant financial difficulty of the issuer or counterparty; or
Pelanggaran kontrak, seperti terjadinya wanprestasi atau tunggakanpembayaran pokok atau bunga; atau
Default or delinquency in interest or principal payments; or
Terdapat kemungkinan bahwa pihak peminjam akan dinyatakan pailitatau melakukan reorganisasi keuangan.
It becoming probable that the borrower will enter bankruptcy orfinancial reorganization.
Untuk kelompok aset keuangan tertentu, seperti piutang, penurunan nilaiaset dievaluasi secara individual. Bukti objektif dari penurunan nilaiportofolio piutang dapat termasuk pengalaman Entitas atas tertagihnyapiutang di masa lalu, peningkatan keterlambatan penerimaan pembayaranpiutang dari rata-rata periode kredit, dan juga pengamatan atas perubahankondisi ekonomi nasional atau lokal yang berkorelasi dengan default ataspiutang.
For certain categories of financial asset, such as receivables, theimpairment value of assets are assessed individually. Objective evidenceof impairment for a portfolio of receivables could include the Entity'spast experience of collecting payments, an increase in the number ofdelayed payments in the portfolio past the average credit period, as wellas observable changes in national or local economic conditions thatcorrelate with default on receivables.
Untuk aset keuangan yang diukur pada biaya perolehan yangdiamortisasi, jumlah kerugian penurunan nilai merupakan selisih antaranilai tercatat aset keuangan dengan nilai kini dari estimasi arus kas masadatang yang didiskontokan menggunakan tingkat suku bunga efektif awaldari aset keuangan.
For financial assets carried at amortized cost, the amount of theimpairment is the difference between the asset's carrying amount andthe present value of estimated future, cash flows, discounted at thefinancial asset's original effective interest rate.
Nilai tercatat aset keuangan tersebut dikurangi dengan kerugianpenurunan nilai secara langsung atas aset keuangan, kecuali piutang yangnilai tercatatnya dikurangi melalui penggunaan akun penyisihan piutang.Jika piutang tidak tertagih, piutang tersebut dihapuskan melalui akunpenyisihan piutang. Pemulihan kemudian dari jumlah yang sebelumnyatelah dihapuskan dikreditkan terhadap akun penyisihan. Perubahan nilaitercatat akun penyisihan piutang diakui dalam laporan laba rugikomprehensif.
The carrying amount of the financial asset is reduced by the impairmentloss directly for all financial assets with the exception of receivables,where the carrying amount is reduced through the use of an allowanceaccount. When a receivable is considered uncollectible, it is written offagainst the allowance account. Subsequent recoveries of amountspreviously written off are credited against the allowance account.Changes in the carrying amount of the allowance account arerecognized in statements of comprehensive income.
9

9
PT PANCA GLOBAL SECURITIES Tbk PT PANCA GLOBAL SECURITIES TbkCATATAN ATAS LAPORAN KEUANGAN NOTES TO FINANCIAL STATEMENTSUntuk Tahun Yang Berakhir Pada Tanggal-Tanggal 31 Desember 2013 dan 2012 For The Years Ended December 31, 2013 and 2012(Disajikan dalam Rupiah) (Expressed in Rupiah)
These financial statements are originally issued in Indonesian language.
3. Iktisar Kebijakan Akuntansi - lanjutan 3. Summary of Significant Accounting Policies - continued
c. Aset Keuangan - lanjutan c. Financial Assets - continued
c.1 Aset Keuangan Diukur Pada Nilai Wajar Melalui Laporan c.1 Financial Assets at Fair Value Through Profit or Loss (FVTPL)Laba Rugi (FVTPL) - lanjutan - lanjutan
• •
c.2 Investasi Dimiliki Hingga Jatuh Tempo c.2 Held- to-Maturity (HTM) Investment
c.3 Aset Keuangan Tersedia Untuk Dijual (AFS) c.3 Available-for-Sale Financial Assets (AFS)
c.4 Pinjaman Yang Diberikan dan Piutang c.4 Loans and Receivables
Merupakan bagian dari kontrak yang mengandung satu atau lebihderivatif rnelekat, dan PSAK 55 (revisi 2011) memperbolehkankontrak gabungan (aset atau liabilitas) ditetapkan sebagai FVTPL.
It forms part of a contract containing one or more embeddedderivatives, and PSAK 55 (revised 2011) permits the entire combinedcontract (asset or liabilily) to be designated as at FVTPL.
Aset keuangan FVTPL disajikan sebesar nilai wajar, keuntungan ataukerugian yang timbul diakui dalam laporan laba rugi komprehensif.Keuntungan atau kerugian bersih yang diakui dalam laporan laba rugikomprehensif mencakup dividen atau bunga yang diperoleh dari asetkeuangan. Nilai wajar ditentukan dengan cara seperti dijelaskan padaCatatan 4b.
Financial assets at FVTPL are stated at fair value, with any resultantgain or loss recognized in statements of comprehensive income. The netgain or loss recognized in statements of comprehensive incomeincorporates any dividend or interest earned on the financial asset. Fairvalue is determined in the manner described in Note 4b.
Efek utang, saham dan reksadana milik Entitas yang diperdagangkanpada pasar aktif dan diklasifikasi sebagai AFS dinyatakan pada nilaiwajar. Nilai wajar ditentukan dengan cara seperti dijelaskan pada Catatan4b.
Listed shares and bonds and mutual funds held by the Entity that aretraded in an active market are classified as being AFS are stated at fairvalue. Fair value is determined in the manner described in Note 4b.
Keuntungan atau kerugian yang timbul dari perubahan nilai wajar diakuipada ekuitas kecuali untuk kerugian penurunan nilai, bunga yang dihitungdengan metode suku bunga efektif dan laba rugi selisih kurs atas asetmoneter yang diakui pada laporan laba rugi komprehensif. Jika asetkeuangan dilepas atau mengalami penurunan nilai, akumulasi laba ataurugi yang sebelumnya diakui di ekuitas, direklas ke laporan laba rugikomprehensif.
Gains and losses arising from changes in fair value are recognised inthe equity with the exception of impairment losses, interest calculatedusing the effective interest method, and foreign exchange gains andlosses on monetary assets, which are recognised in statements ofcomprehensive income. Where the investment is disposed of or isdetermined to be impaired, the cumulative gain or loss previouslyaccumulated in the equity is reclassified to statements of comprehensiveincome.
Dividen atas instrumen ekuitas AFS, jika ada, diakui pada laporan labarugi komprehensif pada saat hak Entitas untuk memperoleh pembayarandividen ditetapkan.
Dividends on AFS equity instruments, if any, are recognised instatements of comprehensive income when the Entity's right to receivethe dividends is established.
Deposito berjangka, piutang marjin, piutang lembaga kliring danpenjaminan, piutang entitas efek, piutang nasabah dan piutang lain-laindengan pembayaran tetap atau telah ditentukan dan tidak mempunyaikuotasi di pasar aktif diklasifikasi sebagai "pinjaman yang diberikan danpiutang", yang diukur pada biaya perolehan diamortisasi denganmenggunakan metode suku bunga efektif dikurangi penurunan nilai.Bunga diakui dengan menggunakan metode suku bunga efektif, kecualipiutang jangka pendek dimana pengakuan bunga tidak material.
Time deposits, margin receivable, receivable from clearing andguarantee institution, receivable from broker, receivable from customerand other receivables that have fixed or determinable payments that arenot quoted in an active market are classified as "loans and receivables".Loans and receivables are measured at amortized cost using theeffective interest method less impairment. Interest is recognised byapplying the effective interest rate method, except for short-termreceivables when the recognition of interest would be immaterial.
Transaksi efek yang dipinjamkan dilaporkan sebagai pembiayaan yangdijamin kecuali jika terdapat letters of credit atau jaminan lain yangdiperlakukan sebagai jaminan. Sehubungan dengan efek yangdipinjamkan, Entitas menerima jaminan dalam bentuk uang tunai ataujaminan lainnya.
Securities loaned transactions are reported as collateralized financingsexcept where letters of credit or other securities are used as collateral.With respect to securities loaned, the Entity receives collateral in theform of cash or other collateral.
Aset keuangan non derivatif dengan pembayaran tetap atau telahditentukan dan jatuh temponya telah ditetapkan diklasifikasikan sebagaiHTM ketika Entitas memiliki intensi positif dan kemampuan untukmemiliki aset keuangan tersebut hingga jatuh tempo. Setelah pengukuranawal, investasi HTM diukur pada biaya perolehan diamortisasi denganmenggunakan metode suku bunga efektif. Metode ini menggunakan sukubunga efektif yang secara tepat mendiskontokan estimasi penerimaan kasdi masa datang selama perkiraan umur dari aset keuangan ke nilaitercatat bersih (net carrying amount ) dari aset keuangan. Keuntungandan kerugian diakui dalam laporan laba rugi pada saat investasi tersebutdihentikan pengakuannya atau mengalami penurunan nilai, serta melaluiproses amortisasi.
Non-derivative financial assets with fixed or determinable payments andfixed maturities are classified as HTM when the Entity has the positiveintention and ability to hold them to maturity. After initial measurement,HTM investments are measured at amortized cost using the effectiveinterest method. This method uses an effective interest rate that exactlydiscounts estimated future cash receipts through the expected life of thefinancial asset to the net carrying amount of the financial asset. Gainsand losses are recognized in the statement of income when theinvestments are derecognized or impaired, as well as through theamortization process.
8
PT PANCA GLOBAL SECURITIES Tbk PT PANCA GLOBAL SECURITIES TbkCATATAN ATAS LAPORAN KEUANGAN NOTES TO FINANCIAL STATEMENTSUntuk Tahun Yang Berakhir Pada Tanggal-Tanggal 31 Desember 2013 dan 2012 For The Years Ended December 31, 2013 and 2012(Disajikan dalam Rupiah) (Expressed in Rupiah)
These financial statements are originally issued in Indonesian language.
3. Iktisar Kebijakan Akuntansi - lanjutan 3. Summary of Significant Accounting Policies - continued
c. Aset Keuangan - lanjutan c. Financial Assets - continued
c.5 Metode Suku Bunga Efektif c.5 Effective Interest Method
c.6 Penurunan Nilai Aset Keuangan c.6 Impairment of Financial Assets
• •
• •
• •
Metode suku bunga efektif adalah metode yang digunakan untukmenghitung biaya perolehan diamortisasi dari instrumen keuangan danmetode untuk mengalokasikan pendapatan bunga selama periode yangrelevan. Suku bunga efektif adalah suku bunga yang secara tepatmendiskontokan estimasi penerimaan kas di masa datang (mencakupseluruh komisi dan bentuk lain yang dibayarkan dan diterima oleh parapihak dalam kontrak yang merupakan bagian yang tak terpisahkan darisuku bunga efektif, biaya transaksi dan premium dan diskonto lainnya)selama perkiraan umur instrumen keuangan, atau, jika lebih tepat,digunakan periode yang lebih singkat untuk memperoleh nilai tercatatbersih dari aset keuangan pada saat pengakuan awal.
The effective interest method is a method of calculating the amortizedcost of a financial instrument and of allocating interest income over therelevant period. The effective interest rate is the rate that exactlydiscounts estimated future cash receipts (including all fees on pointspaid or received that form an integral part of the effective interest rate,transaction costs and other premiums or discounts) through theexpected life of the financial instrument, or, where appropriate, ashorter period to the net carrying amount on initial recognition.
Aset keuangan, selain aset keuangan FVTPL, dievaluasi terhadapindikator penurunan nilai pada setiap tanggal laporan posisi keuangan.Aset keuangan diturunkan nilainya bila terdapat bukti objektif, sebagaiakibat dari satu atau lebih peristiwa yang terjadi setelah pengakuan awalaset keuangan, dan peristiwa yang merugikan tersebut berdampak padaestimasi arus kas masa depan atas aset keuangan yang dapat diestimasisecara handal.
Financial assets, other than those at FVTPL, are assessed for indicatorsof impairment at each statements of financial position date. Financialassets are impaired where there is objective evidence that, as a result ofone or more events that occurred after the initial recognition of thefinancial asset, the estimated future cash flows of the investment havebeen impacted.
Untuk investasi ekuitas AFS yang tercatat dan tidak tercatat di bursa,penurunan yang signifikan atau jangka panjang pada nilai wajar dariinvestasi ekuitas di bawah biaya perolehannya dianggap sebagai buktiobyektif penurunan nilai.
For listed and unlisted equity investments classified as AFS, asignificant or prolonged decline in the fair value of the security belowits cost is considered to be objective evidence of impairment.
Untuk aset keuangan lainnya, bukti obyektif penurunan nilai termasuksebagai berikut:
For all other financial assets, objective evidence of impairment couldinclude:
Kesulitan keuangan signifikan yang dialami penerbit atau pihakpeminjam; atau
Significant financial difficulty of the issuer or counterparty; or
Pelanggaran kontrak, seperti terjadinya wanprestasi atau tunggakanpembayaran pokok atau bunga; atau
Default or delinquency in interest or principal payments; or
Terdapat kemungkinan bahwa pihak peminjam akan dinyatakan pailitatau melakukan reorganisasi keuangan.
It becoming probable that the borrower will enter bankruptcy orfinancial reorganization.
Untuk kelompok aset keuangan tertentu, seperti piutang, penurunan nilaiaset dievaluasi secara individual. Bukti objektif dari penurunan nilaiportofolio piutang dapat termasuk pengalaman Entitas atas tertagihnyapiutang di masa lalu, peningkatan keterlambatan penerimaan pembayaranpiutang dari rata-rata periode kredit, dan juga pengamatan atas perubahankondisi ekonomi nasional atau lokal yang berkorelasi dengan default ataspiutang.
For certain categories of financial asset, such as receivables, theimpairment value of assets are assessed individually. Objective evidenceof impairment for a portfolio of receivables could include the Entity'spast experience of collecting payments, an increase in the number ofdelayed payments in the portfolio past the average credit period, as wellas observable changes in national or local economic conditions thatcorrelate with default on receivables.
Untuk aset keuangan yang diukur pada biaya perolehan yangdiamortisasi, jumlah kerugian penurunan nilai merupakan selisih antaranilai tercatat aset keuangan dengan nilai kini dari estimasi arus kas masadatang yang didiskontokan menggunakan tingkat suku bunga efektif awaldari aset keuangan.
For financial assets carried at amortized cost, the amount of theimpairment is the difference between the asset's carrying amount andthe present value of estimated future, cash flows, discounted at thefinancial asset's original effective interest rate.
Nilai tercatat aset keuangan tersebut dikurangi dengan kerugianpenurunan nilai secara langsung atas aset keuangan, kecuali piutang yangnilai tercatatnya dikurangi melalui penggunaan akun penyisihan piutang.Jika piutang tidak tertagih, piutang tersebut dihapuskan melalui akunpenyisihan piutang. Pemulihan kemudian dari jumlah yang sebelumnyatelah dihapuskan dikreditkan terhadap akun penyisihan. Perubahan nilaitercatat akun penyisihan piutang diakui dalam laporan laba rugikomprehensif.
The carrying amount of the financial asset is reduced by the impairmentloss directly for all financial assets with the exception of receivables,where the carrying amount is reduced through the use of an allowanceaccount. When a receivable is considered uncollectible, it is written offagainst the allowance account. Subsequent recoveries of amountspreviously written off are credited against the allowance account.Changes in the carrying amount of the allowance account arerecognized in statements of comprehensive income.
9

10
PT PANCA GLOBAL SECURITIES Tbk PT PANCA GLOBAL SECURITIES TbkCATATAN ATAS LAPORAN KEUANGAN NOTES TO FINANCIAL STATEMENTSUntuk Tahun Yang Berakhir Pada Tanggal-Tanggal 31 Desember 2013 dan 2012 For The Years Ended December 31, 2013 and 2012(Disajikan dalam Rupiah) (Expressed in Rupiah)
These financial statements are originally issued in Indonesian language.
3. Iktisar Kebijakan Akuntansi - lanjutan 3. Summary of Significant Accounting Policies - continued
c. Aset Keuangan - lanjutan c. Financial Assets - continued
c.6 Penurunan Nilai Aset Keuangan - lanjutan c.6 Impairment of Financial Assets - continued
c.7 Reklasifikasi Aset Keuangan c.7 Reclassification of Financial Assets
c.8 Penghentian Pengakuan Aset Keuangan c.8 Derecognition of Financial Assets
d. Liabilitas Keuangan dan Instrumen Ekuitas d. Financial Liabilities and Equity Instruments
d.1 Klasifikasi Sebagai Liabilitas atau Ekuitas d.1 Classification as Debt or Equity
d.2 Instrumen Ekuitas d.2 Equity Instruments
Jika aset keuangan AFS dianggap menurun nilainya, keuntungan ataukerugian kumulatif yang sebelumnya telah diakui dalam ekuitasdireklasifikasi ke laporan laba rugi komprehensif dalam periode yangbersangkutan.
When an AFS financial asset is considered to be impaired, cumulativegains or losses previously recognized in equity are reclassified tostatements of comprehensive income in the period.
Pengecualian dari instrumen ekuitas AFS, jika, pada periode berikutnya,jumlah penurunan nilai berkurang dan penurunan dapat dikaitkan secaraobyektif dengan sebuah peristiwa yang terjadi setelah penurunan nilaitersebut diakui, kerugian penurunan nilai yang sebelumnya diakuidipulihkan melalui laporan laba rugi komprehensif hingga nilai tercatatinvestasi pada tanggal pemulihan penurunan nilai tidak melebihi biayaperolehan diamortisasi sebelum pengakuan kerugian penurunan nilaidilakukan.
With the exception of AFS equity instruments, if, in a subsequent period,the amount of the impairment loss decreases and the decrease can berelated objectively to an event occurring after the impairment wasrecognized, the previously recognized impairment loss is reversedthrough statement of comprehensive income to the extent that thecarrying amount of the investment at the date the impairment is reversed does not exceed what the amortized cost would have been had theimpairment not been recognized.
Dalam hal efek ekuitas AFS, kerugian penurunan nilai yang sebelumnyadiakui dalam laporan laba rugi komprehensif tidak boleh dipulihkanmelalui laporan laba rugi komprehensif. Setiap kenaikan nilai wajarsetelah penurunan nilai diakui secara langsung ke ekuitas.
In respect of AFS equity securities, impairment losses previouslyrecognized in statements of comprehensive income are not reversedthrough statements of comprehensive income. Any increase in fair valuesubsequent to an impairment loss is recognized directly in equity.
Reklasifikasi hanya diperkenankan dalam situasi yang jarang terjadi dandimana aset tidak lagi dimiliki untuk tujuan dijual dalam jangka pendek.Dalam semua hal, reklasifikasi aset keuangan hanya terbatas padainstrumen utang. Reklasifikasi dicatat sebesar nilai wajar aset keuanganpada tanggal reklasifikasi.
Reclassification is only permitted in rare circumstances and where theasset is no longer held for the purpose of selling in the short-term. In allcases, reclassifications of financial assets are limited to debtinstruments. Reclassifications are accounted for at the fair value of thefinancial asset at the date of reclassification.
Entitas menghentikan pengakuan aset keuangan jika dan hanya jika hakkontraktual atas arus kas yang berasal dari aset berakhir, atau Entitasmentransfer aset keuangan dan secara substansial mentransfer seluruhrisiko dan manfaat atas kepemilikan aset kepada entitas lain. Jika Entitastidak mentransfer serta tidak memiliki secara substansial atas seluruhrisiko dan manfaat kepemilikan serta masih mengendalikan aset yangditransfer, maka Entitas mengakui keterlibatan berkelanjutan atas asetyang ditransfer dan liabilitas terkait sebesar jumlah yang mungkin harusdibayar. Jika Entitas memiliki secara substansial seluruh risiko danmanfaat kepemilikan aset keuangan yang ditransfer, Entitas masihmengakui aset keuangan dan juga mengakui pinjaman yang dijaminsebesar pinjaman yang diterima.
The Entity derecognizes a financial asset only when the contractualrights to the cash flows from the asset expire, or when it transfers thefinancial asset and substantially all the risks and rewards of ownershipof the asset to another entity. If the Entity neither transfers nor retainssubstantially all the risks and rewards of ownership and continues tocontrol the transferred asset, the Entity recognizes its retained interestin the asset and an associated liability for amounts it may have to pay. Ifthe Entity retains substantially all the risks and rewards of ownership ofa transferred financial asset, the Entity continues to recognize thefinancial asset and also recognizes a collateralised borrowing for theproceeds received.
Liabilitas keuangan dan instrumen ekuitas yang diterbitkan oleh Entitasdiklasifikasi sesuai dengan substansi perjanjian kontraktual dan definisiliabilitas keuangan dan instrumen ekuitas.
Financial liabilities and equity instruments issued by the Entity areclassified according to the substance of the contractual arrangementsentered into and the definitions of a financial liability and an equityinstrument.
Instrumen ekuitas adalah setiap kontrak yang memberikan hak residualatas aset Entitas setelah dikurangi dengan seluruh liabilitasnya. Instrumenekuitas dicatat sebesar hasil penerimaan bersih setelah dikurangi biayapenerbitan langsung.
An equity instrument is any contract that evidences a residual interestin the assets of the Entity after deducting all of its liabilities. Equityinstruments are recorded at the proceeds received, net of direct issuecosts.
Perolehan kembali modal saham yang telah diterbitkan oleh Entitasdicatat dengan menggunakan metode biaya. Saham yang dibeli kembalidicatat sesuai dengan harga perolehan kembali dan disajikan sebagaipengurang modal saham.
Reacquisition of the Entity's previously issued stock is accounted usingthe cost method. Treasury stock is recorded at acquisition cosf andpresented as a deduction from the capital stock account.
10
PT PANCA GLOBAL SECURITIES Tbk PT PANCA GLOBAL SECURITIES TbkCATATAN ATAS LAPORAN KEUANGAN NOTES TO FINANCIAL STATEMENTSUntuk Tahun Yang Berakhir Pada Tanggal-Tanggal 31 Desember 2013 dan 2012 For The Years Ended December 31, 2013 and 2012(Disajikan dalam Rupiah) (Expressed in Rupiah)
These financial statements are originally issued in Indonesian language.
3. Iktisar Kebijakan Akuntansi - lanjutan 3. Summary of Significant Accounting Policies - continued
d. Liabilitas Keuangan dan Instrumen Ekuitas - lanjutan d. Financial Liabilities and Equity Instruments - continued
d.3 Liabilitas Keuangan d.3 Financial Liabilities
• •
• •
• •
• •
• •
• •
d.4 Liabilitas Keuangan Lainnya d.4 Other Payables
d.5 Metode Suku Bunga Efektif d.5 Effective Interest Method
Liabilitas keuangan diklasifikasi sebagai liabilitas keuangan diukur padaFVTPL atau liabilitas keuangan lainnya.
Financial liabilities are classified as either financial liabilities atFVTPL or other financial liabilities.
Liabilitas keuangan diklasifikasi dalam kelompok diperdagangkan jika: A financial liability is classified as held for trading if:
Diterbitkan terutama untuk tujuan dibeli kembali dalam waktu dekat;atau
It has been incurred principally for the purpose of repurchasing inthe near future; or
Merupakan bagian dari portofolio instrumen keuangan tertentu yangdikelola bersama-sama dan atas bagian tersebut terdapat bukti adanyapola ambil untung jangka pendek terkini; atau
It is a part of an identified portfolio of financial instruments that theCompany manages together and has a recent actual pattern of short-term profit-taking; or
Merupakan derivatif liabilitas yang tidak ditetapkan dan tidak efektifsebagai instrumen lindung nilai.
It is a derivative that is not designated and effective as a hedginginstrument.
Liabilitas keuangan selain dari liabilitas keuangan kelompokdiperdagangkan dapat ditetapkan sebagai FVTPL pada saat pengakuanawal jika:
A financial liability other than a financial liability held for trading maybe designated as at FVTPL upon initial recognition if:
Penetapan tersebut mengeliminasi atau mengurangi secara signifikanketidakkonsistenan pengukuran dan pengakuan yang dapat timbul; atau
Such designation eliminates or significantly reduces a measurementor recognition inconsistency that would otherwise arise; or
Liabilitas keuangan merupakan bagian dari kelompok aset keuanganatau liabilitas atau keduanya, yang dikelola dan kinerjanya berdasarkannilai wajar, sesuai dengan dokumentasi manajemen risiko atau strategiinvestasi Entitas, dan informasi tentang kelompok tersebut disediakansecara internal kepada manajemen kunci; atau
The financial liability forms part of a group of financial assets orfinancial liabilities or both, which is managed and its performanceis evaluated on a fair value basis, in accordance with the Entity'sdocumented risk management or investment strategy, andinformation about the grouping is provided internally on that basis;or
Merupakan bagian dari kontrak yang mengandung satu atau lebihderivatif melekat, dan PSAK 55 (revisi 2011) memperbolehkankontrak gabungan (aset atau liabilitas) ditetapkan sebagai FVTPL.
It forms part of a contract containing one or more embeddedderivatives, and PSAK 55 (revised 2011) permits the entirecombined contract (asset or liability) to be designated as at FVTPL.
Liabilitas keuangan sebagai FVTPL dinyatakan sebesar nilai wajar,dengan laba atau rugi yang timbul diakui dalam laporan laba rugikomprehensif. Keuntungan atau kerugian bersih yang diakui dalamlaporan laba rugi komprehensif mencakup setiap bunga yang dibayaratas liabilitas keuangan. Nilai wajar ditentukan dengan cara yangdijelaskan dalam catatan 4b.
Financial liabilities at FVTPL are stated at fair value, with anyresultant gain or loss recognized in statements of comprehensiveincome. The net gain or loss recognized in statements of comprehensiveincome incorporates any interest paid on the financial liability. Fairvalue is determined in the manner described in note 4b.
Utang pada lembaga kliring dan penjaminan, utang nasabah, utangmarjin, pinjaman diterima dan utang lainnya pada awalnya diukur padanilai wajar, setelah dikurangi biaya transaksi, dan selanjutnya diukurdalam biaya perolehan diamortisasi dengan menggunakan metode sukubunga efektif, dengan beban bunga diakui berdasarkan metode sukubunga efektif, kecuali utang jangka pendek dimana pengakuan bungatidak material.
Payable to clearing and guarantee institution, payable to customer,margin payable, other financial liabilities, including trade and otherpayables and borrowings are initially measured at fair value, net oftransaction costs, and are subsequently measured at amortized cost,using the effective interest rate method, with interest expenserecognized on an effective yield basis, except for short-term payableswhen the recognition of interest would be immaterial.
Selisih antara hasil emisi (setelah dikurangi biaya transaksi) danpenyelesaian atau pelunasan pinjaman diakui selama jangka waktupinjaman.
Any difference between the proceeds (net of transaction costs) and thesettlement or redemption of borrowings is recognized over the term ofthe borrowings.
Metode suku bunga efektif adalah metode yang digunakan untukmenghitung biaya perolehan diamortisasi dari liabilitas keuangan danmetode untuk mengalokasikan beban bunga selama periode yangrelevan. Suku bunga efektif adalah suku bunga yang secara tepatmendiskontokan estimasi pembayaran kas di masa datang selamaperkiraan umur liabilitas keuangan, atau, jika lebih tepat, digunakanperiode yang lebih singkat untuk memperoleh nilai tercatat bersih dariliabilitas keuangan pada saat pengakuan awal.
The effective interest method is a method of calculating the amortizedcost of a financial liability and of allocating interest expense over therelevant period. The effective interest rate is the rate that exactlydiscounts estimated future cash payments through the expected life ofthe financial liability, or, where appropriate, a shorter period to the netcarrying amount on initial recognition.
11
11
PT PANCA GLOBAL SECURITIES Tbk PT PANCA GLOBAL SECURITIES TbkCATATAN ATAS LAPORAN KEUANGAN NOTES TO FINANCIAL STATEMENTSUntuk Tahun Yang Berakhir Pada Tanggal-Tanggal 31 Desember 2013 dan 2012 For The Years Ended December 31, 2013 and 2012(Disajikan dalam Rupiah) (Expressed in Rupiah)
These financial statements are originally issued in Indonesian language.
3. Iktisar Kebijakan Akuntansi - lanjutan 3. Summary of Significant Accounting Policies - continued
c. Aset Keuangan - lanjutan c. Financial Assets - continued
c.6 Penurunan Nilai Aset Keuangan - lanjutan c.6 Impairment of Financial Assets - continued
c.7 Reklasifikasi Aset Keuangan c.7 Reclassification of Financial Assets
c.8 Penghentian Pengakuan Aset Keuangan c.8 Derecognition of Financial Assets
d. Liabilitas Keuangan dan Instrumen Ekuitas d. Financial Liabilities and Equity Instruments
d.1 Klasifikasi Sebagai Liabilitas atau Ekuitas d.1 Classification as Debt or Equity
d.2 Instrumen Ekuitas d.2 Equity Instruments
Jika aset keuangan AFS dianggap menurun nilainya, keuntungan ataukerugian kumulatif yang sebelumnya telah diakui dalam ekuitasdireklasifikasi ke laporan laba rugi komprehensif dalam periode yangbersangkutan.
When an AFS financial asset is considered to be impaired, cumulativegains or losses previously recognized in equity are reclassified tostatements of comprehensive income in the period.
Pengecualian dari instrumen ekuitas AFS, jika, pada periode berikutnya,jumlah penurunan nilai berkurang dan penurunan dapat dikaitkan secaraobyektif dengan sebuah peristiwa yang terjadi setelah penurunan nilaitersebut diakui, kerugian penurunan nilai yang sebelumnya diakuidipulihkan melalui laporan laba rugi komprehensif hingga nilai tercatatinvestasi pada tanggal pemulihan penurunan nilai tidak melebihi biayaperolehan diamortisasi sebelum pengakuan kerugian penurunan nilaidilakukan.
With the exception of AFS equity instruments, if, in a subsequent period,the amount of the impairment loss decreases and the decrease can berelated objectively to an event occurring after the impairment wasrecognized, the previously recognized impairment loss is reversedthrough statement of comprehensive income to the extent that thecarrying amount of the investment at the date the impairment is reversed does not exceed what the amortized cost would have been had theimpairment not been recognized.
Dalam hal efek ekuitas AFS, kerugian penurunan nilai yang sebelumnyadiakui dalam laporan laba rugi komprehensif tidak boleh dipulihkanmelalui laporan laba rugi komprehensif. Setiap kenaikan nilai wajarsetelah penurunan nilai diakui secara langsung ke ekuitas.
In respect of AFS equity securities, impairment losses previouslyrecognized in statements of comprehensive income are not reversedthrough statements of comprehensive income. Any increase in fair valuesubsequent to an impairment loss is recognized directly in equity.
Reklasifikasi hanya diperkenankan dalam situasi yang jarang terjadi dandimana aset tidak lagi dimiliki untuk tujuan dijual dalam jangka pendek.Dalam semua hal, reklasifikasi aset keuangan hanya terbatas padainstrumen utang. Reklasifikasi dicatat sebesar nilai wajar aset keuanganpada tanggal reklasifikasi.
Reclassification is only permitted in rare circumstances and where theasset is no longer held for the purpose of selling in the short-term. In allcases, reclassifications of financial assets are limited to debtinstruments. Reclassifications are accounted for at the fair value of thefinancial asset at the date of reclassification.
Entitas menghentikan pengakuan aset keuangan jika dan hanya jika hakkontraktual atas arus kas yang berasal dari aset berakhir, atau Entitasmentransfer aset keuangan dan secara substansial mentransfer seluruhrisiko dan manfaat atas kepemilikan aset kepada entitas lain. Jika Entitastidak mentransfer serta tidak memiliki secara substansial atas seluruhrisiko dan manfaat kepemilikan serta masih mengendalikan aset yangditransfer, maka Entitas mengakui keterlibatan berkelanjutan atas asetyang ditransfer dan liabilitas terkait sebesar jumlah yang mungkin harusdibayar. Jika Entitas memiliki secara substansial seluruh risiko danmanfaat kepemilikan aset keuangan yang ditransfer, Entitas masihmengakui aset keuangan dan juga mengakui pinjaman yang dijaminsebesar pinjaman yang diterima.
The Entity derecognizes a financial asset only when the contractualrights to the cash flows from the asset expire, or when it transfers thefinancial asset and substantially all the risks and rewards of ownershipof the asset to another entity. If the Entity neither transfers nor retainssubstantially all the risks and rewards of ownership and continues tocontrol the transferred asset, the Entity recognizes its retained interestin the asset and an associated liability for amounts it may have to pay. Ifthe Entity retains substantially all the risks and rewards of ownership ofa transferred financial asset, the Entity continues to recognize thefinancial asset and also recognizes a collateralised borrowing for theproceeds received.
Liabilitas keuangan dan instrumen ekuitas yang diterbitkan oleh Entitasdiklasifikasi sesuai dengan substansi perjanjian kontraktual dan definisiliabilitas keuangan dan instrumen ekuitas.
Financial liabilities and equity instruments issued by the Entity areclassified according to the substance of the contractual arrangementsentered into and the definitions of a financial liability and an equityinstrument.
Instrumen ekuitas adalah setiap kontrak yang memberikan hak residualatas aset Entitas setelah dikurangi dengan seluruh liabilitasnya. Instrumenekuitas dicatat sebesar hasil penerimaan bersih setelah dikurangi biayapenerbitan langsung.
An equity instrument is any contract that evidences a residual interestin the assets of the Entity after deducting all of its liabilities. Equityinstruments are recorded at the proceeds received, net of direct issuecosts.
Perolehan kembali modal saham yang telah diterbitkan oleh Entitasdicatat dengan menggunakan metode biaya. Saham yang dibeli kembalidicatat sesuai dengan harga perolehan kembali dan disajikan sebagaipengurang modal saham.
Reacquisition of the Entity's previously issued stock is accounted usingthe cost method. Treasury stock is recorded at acquisition cosf andpresented as a deduction from the capital stock account.
10
PT PANCA GLOBAL SECURITIES Tbk PT PANCA GLOBAL SECURITIES TbkCATATAN ATAS LAPORAN KEUANGAN NOTES TO FINANCIAL STATEMENTSUntuk Tahun Yang Berakhir Pada Tanggal-Tanggal 31 Desember 2013 dan 2012 For The Years Ended December 31, 2013 and 2012(Disajikan dalam Rupiah) (Expressed in Rupiah)
These financial statements are originally issued in Indonesian language.
3. Iktisar Kebijakan Akuntansi - lanjutan 3. Summary of Significant Accounting Policies - continued
d. Liabilitas Keuangan dan Instrumen Ekuitas - lanjutan d. Financial Liabilities and Equity Instruments - continued
d.3 Liabilitas Keuangan d.3 Financial Liabilities
• •
• •
• •
• •
• •
• •
d.4 Liabilitas Keuangan Lainnya d.4 Other Payables
d.5 Metode Suku Bunga Efektif d.5 Effective Interest Method
Liabilitas keuangan diklasifikasi sebagai liabilitas keuangan diukur padaFVTPL atau liabilitas keuangan lainnya.
Financial liabilities are classified as either financial liabilities atFVTPL or other financial liabilities.
Liabilitas keuangan diklasifikasi dalam kelompok diperdagangkan jika: A financial liability is classified as held for trading if:
Diterbitkan terutama untuk tujuan dibeli kembali dalam waktu dekat;atau
It has been incurred principally for the purpose of repurchasing inthe near future; or
Merupakan bagian dari portofolio instrumen keuangan tertentu yangdikelola bersama-sama dan atas bagian tersebut terdapat bukti adanyapola ambil untung jangka pendek terkini; atau
It is a part of an identified portfolio of financial instruments that theCompany manages together and has a recent actual pattern of short-term profit-taking; or
Merupakan derivatif liabilitas yang tidak ditetapkan dan tidak efektifsebagai instrumen lindung nilai.
It is a derivative that is not designated and effective as a hedginginstrument.
Liabilitas keuangan selain dari liabilitas keuangan kelompokdiperdagangkan dapat ditetapkan sebagai FVTPL pada saat pengakuanawal jika:
A financial liability other than a financial liability held for trading maybe designated as at FVTPL upon initial recognition if:
Penetapan tersebut mengeliminasi atau mengurangi secara signifikanketidakkonsistenan pengukuran dan pengakuan yang dapat timbul; atau
Such designation eliminates or significantly reduces a measurementor recognition inconsistency that would otherwise arise; or
Liabilitas keuangan merupakan bagian dari kelompok aset keuanganatau liabilitas atau keduanya, yang dikelola dan kinerjanya berdasarkannilai wajar, sesuai dengan dokumentasi manajemen risiko atau strategiinvestasi Entitas, dan informasi tentang kelompok tersebut disediakansecara internal kepada manajemen kunci; atau
The financial liability forms part of a group of financial assets orfinancial liabilities or both, which is managed and its performanceis evaluated on a fair value basis, in accordance with the Entity'sdocumented risk management or investment strategy, andinformation about the grouping is provided internally on that basis;or
Merupakan bagian dari kontrak yang mengandung satu atau lebihderivatif melekat, dan PSAK 55 (revisi 2011) memperbolehkankontrak gabungan (aset atau liabilitas) ditetapkan sebagai FVTPL.
It forms part of a contract containing one or more embeddedderivatives, and PSAK 55 (revised 2011) permits the entirecombined contract (asset or liability) to be designated as at FVTPL.
Liabilitas keuangan sebagai FVTPL dinyatakan sebesar nilai wajar,dengan laba atau rugi yang timbul diakui dalam laporan laba rugikomprehensif. Keuntungan atau kerugian bersih yang diakui dalamlaporan laba rugi komprehensif mencakup setiap bunga yang dibayaratas liabilitas keuangan. Nilai wajar ditentukan dengan cara yangdijelaskan dalam catatan 4b.
Financial liabilities at FVTPL are stated at fair value, with anyresultant gain or loss recognized in statements of comprehensiveincome. The net gain or loss recognized in statements of comprehensiveincome incorporates any interest paid on the financial liability. Fairvalue is determined in the manner described in note 4b.
Utang pada lembaga kliring dan penjaminan, utang nasabah, utangmarjin, pinjaman diterima dan utang lainnya pada awalnya diukur padanilai wajar, setelah dikurangi biaya transaksi, dan selanjutnya diukurdalam biaya perolehan diamortisasi dengan menggunakan metode sukubunga efektif, dengan beban bunga diakui berdasarkan metode sukubunga efektif, kecuali utang jangka pendek dimana pengakuan bungatidak material.
Payable to clearing and guarantee institution, payable to customer,margin payable, other financial liabilities, including trade and otherpayables and borrowings are initially measured at fair value, net oftransaction costs, and are subsequently measured at amortized cost,using the effective interest rate method, with interest expenserecognized on an effective yield basis, except for short-term payableswhen the recognition of interest would be immaterial.
Selisih antara hasil emisi (setelah dikurangi biaya transaksi) danpenyelesaian atau pelunasan pinjaman diakui selama jangka waktupinjaman.
Any difference between the proceeds (net of transaction costs) and thesettlement or redemption of borrowings is recognized over the term ofthe borrowings.
Metode suku bunga efektif adalah metode yang digunakan untukmenghitung biaya perolehan diamortisasi dari liabilitas keuangan danmetode untuk mengalokasikan beban bunga selama periode yangrelevan. Suku bunga efektif adalah suku bunga yang secara tepatmendiskontokan estimasi pembayaran kas di masa datang selamaperkiraan umur liabilitas keuangan, atau, jika lebih tepat, digunakanperiode yang lebih singkat untuk memperoleh nilai tercatat bersih dariliabilitas keuangan pada saat pengakuan awal.
The effective interest method is a method of calculating the amortizedcost of a financial liability and of allocating interest expense over therelevant period. The effective interest rate is the rate that exactlydiscounts estimated future cash payments through the expected life ofthe financial liability, or, where appropriate, a shorter period to the netcarrying amount on initial recognition.
11

12
PT PANCA GLOBAL SECURITIES Tbk PT PANCA GLOBAL SECURITIES TbkCATATAN ATAS LAPORAN KEUANGAN NOTES TO FINANCIAL STATEMENTSUntuk Tahun Yang Berakhir Pada Tanggal-Tanggal 31 Desember 2013 dan 2012 For The Years Ended December 31, 2013 and 2012(Disajikan dalam Rupiah) (Expressed in Rupiah)
These financial statements are originally issued in Indonesian language.
3. Iktisar Kebijakan Akuntansi - lanjutan 3. Summary of Significant Accounting Policies - continued
d. Liabilitas Keuangan dan Instrumen Ekuitas - lanjutan d. Financial Liabilities and Equity Instruments - continued
d.6 Penghentian Pengakuan Liabilitas Keuangan d.6 Derecognises Financial Liabilities
e. Kas dan Setara Kas e. Cash and Cash Equivalents
f. Transaksi dengan Pihak-pihak Berelasi f. Transaction With Related Parties
f.1 f.1
i) i)
ii) ii)
iii) iii)
f.2 f.2
i) i)
ii) ii)
iii) iii)
iv) iv)
v) v)
vi) vi)
vii) vii)
g. Biaya Dibayar Di Muka g. Prepaid Expenses
Kas dan setara kas terdiri dari saldo kas, bank dan deposito berjangka yangjatuh tempo dalam waktu tiga bulan atau kurang dari tanggal penempatannyadan yang tidak dijaminkan serta tidak ada pembatasan dalam pencairannya.
Cash and cash equivalents consist of cash on hand and in banks and allunpledged and unrestricted time deposits with maturities of three months orless from the date of placement.
Biaya dibayar di muka diamortisir selama masa manfaat masing-masingbiaya dengan menggunakan metode garis lurus.
Prepaid expenses are amortized over their beneficial period using thestraight-line method.
Entitas menghentikan pengakuan liabilitas keuangan, jika dan hanyajika, liabilitas Entitas telah dilepaskan, dibatalkan atau kadaluarsa.
The Entity derecognizes financial liabilities when, and only when, theEntity's obligations are discharged, cancelled or they expire.
Pihak berelasi adalah orang atau entitas yang terkait dengan entitas yangmenyiapkan laporan keuangannya.
Orang atau anggota keluarga terdekat mempunyai relasi dengan entitaspelapor jika orang tersebut:
A related party is a person or entity that is related to the entity that ispreparing its financial statements.
A person or a close member of that person’s family is related to areporting entity if that person:
Memiliki pengendalian atau pengendalian bersama atas entitaspelapor
Has control or joint control over the reporting entity;
Memiliki pengaruh signifikan atas entitas pelapor; atau Has significant influence over the reporting entity; or
Personil manajemen kunci entitas pelapor atau entitas induk entitaspelapor.
Is a member of the key management personnel of the reporting entityor of a parent of the reporting entity.
Suatu entitas berelasi dengan entitas pelapor jika memenuhi salah satu halberikut:
An entity is related to a reporting entity if any of the followingconditions applies:
Entitas dan entitas pelapor adalah anggota dari kelompok usaha yangsama (artinya entitas induk, entitas anak, dan entitas anak berikutnyaterkait dengan entitas lain).
The Entity and the reporting entity are members of the same group(which means that each parent, subsidiary and fellow subsidiary isrelated to the others).
Satu entitas adalah entitas asosiasi atau ventura bersama dari entitaslain (atau entitas asosiasi atau ventura bersama yang merupakananggota suatu kelompok usaha, yang mana entitas lain tersebutadalah anggotanya).
One entity is an associate or joint venture of the other entity (or anassociate or joint venture of a member of a group of which the otherentity is a member)
Kedua entitas tersebut adalah ventura bersama dari pihak ketiga yangsama
Both entities are joint ventures of the same third party.
Satu entitas adalah ventura bersama dari entitas ketiga dan entitasyang lain adalah entitas asosiasi dari entitas ketiga.
One entity is a joint venture of a third entity and the other entity isan associate of the third entity.
Entitas tersebut adalah suatu program imbalan pascakerja untukimbalan kerja dari salah satu entitas pelapor atau entitas yang terkaitdengan entitas pelapor. Jika entitas pelapor adalah entitas yangmenyelenggarakan program tersebut, maka entitas sponsor jugaberelasi dengan entitas pelapor.
The Entity is a post-employment benefit plan for the benefit ofemployees of either the reporting entity or an entity related to thereporting entity. If the reporting entity is itself such a plan, thesponsoring employers are also related to the reporting entity.
Entitas yang dikendalikan atau dikendalikan bersama oleh orang yangdiidentifikasi dalam huruf (f.1).
The Entity is controlled or jointly controlled by a person identified in(f.1).
Orang yang diidentifikasi dalam huruf (f.1) (i) memiliki pengaruhsignifikan atas entitas atau personil manajemen kunci entitas (atauentitas induk dari entitas).
A person identified in (f.1)(i) has significant influence over the entityor is a member of the key management personnel of the entity (or ofa parent of the entity).
Semua transaksi dengan pihak-pihak berelasi, baik yang dilakukan denganatau tidak dengan suku bunga atau harga, persyaratan dan kondisi yang samasebagaimana dilakukan dengan pihak ketiga, diungkapkan dalam laporankeuangan.
All transactions with related parties, whether or not made at similar termsand conditions as those done with third parties, are disclosed in thefinancial statements.
12
PT PANCA GLOBAL SECURITIES Tbk PT PANCA GLOBAL SECURITIES TbkCATATAN ATAS LAPORAN KEUANGAN NOTES TO FINANCIAL STATEMENTSUntuk Tahun Yang Berakhir Pada Tanggal-Tanggal 31 Desember 2013 dan 2012 For The Years Ended December 31, 2013 and 2012(Disajikan dalam Rupiah) (Expressed in Rupiah)
These financial statements are originally issued in Indonesian language.
3. Iktisar Kebijakan Akuntansi - lanjutan 3. Summary of Significant Accounting Policies - continued
h. Penyertaan Saham h. Investments in Shares
i. Aset Tetap i. Fixed Assets
Kendaraan VehiclesPeralatan Kantor Office EquipmentKomputer ComputerPerabot Kantor Furniture
j. Pengakuan Pendapatan dan Beban j. Revenue and Expense Recognition
k. Perpajakan k. Taxes
Tahun/Years
4424
Aset tetap dicatat sebesar biaya perolehan, sedangkan penyusutanmenggunakan metode garis lurus (straightline method) berdasarkan taksiranmasa manfaat ekonomis aset tetap sebagai berikut :
Beban pemeliharaan dan perbaikan aset tetap dibebankan pada laporan labarugi komprehensif pada saat terjadinya. Penambahan dalam jumlah besardikapitalisasi apabila menambah umur ekonomis. Aset yang sudah tidakdipergunakan atau dijual dikeluarkan dari kelompok aset tetap dan laba ataurugi yang timbul diperhitungkan pada laporan laba rugi komprehensif padatahun bersangkutan.
Fixed assets are recorded at cost, while depreciation is computed usingstraightline method based on the estimated useful lives of assets as follows:
The cost of maintenance and repairs is charged to statement ofcomprehensive income as incurred; expenditures which extend the useful lifeof the assets or result in increased future economic benefits are capitalized.When assets are retired or otherwise disposed of, their carrying values andthe related accumulated depreciation are removed from the accounts andany resulting gain or loss is reflected in the current years statement ofcomprehensive income.
Pendapatan komisi dan jasa lainnya yang berkaitan dengan transaksiperantara pedagang efek diakui pada saat transaksi terjadi. Pendapatan darijasa manajemen investasi dan penasihat investasi diakui pada saat jasadiberikan sesuai dengan ketentuan dalam kontrak.
Biaya yang terjadi sehubungan dengan kegiatan pengelolaan investasi danpenasehat investasi dibebankan pada saat terjadinya. Beban lainnya diakuisesuai dengan manfaatnya pada periode yang bersangkutan (accrual basis ).
Commision income from brokerage and other services is recognized at thetransaction date. Fees from Investment management and advisory servicesare recognized when the services are rendered based on the terms of thecontracts.
Seluruh perbedaan temporer antara jumlah yang tercatat aset dan liabilitasdengan dasar pengenaan pajaknya diakui sebagai pajak tangguhan denganmetode kewajiban (liability ). Pajak tangguhan diukur dengan tarif pajak yangberlaku saat ini.
Deferred income tax is provided using the liability method for all temporarydifferences arising between the tax bases of assets and liablities and theircarrying value for financial reporting purposes. Deferred income tax isdetermined by currently enacted tax rates.
Investments in shares with ownership interests of less than 20% that do nothave readily determinable fair values and are intended for long-terminvestments are stated at cost less an allowance for permanent decline invalue, if any, based on management judgement.
Penyertaan saham dengan kepemilikan kurang dari 20% yang nilai wajarnyatidak tersedia serta dimaksudkan untuk investasi jangka panjang dinyatakanberdasarkan biaya perolehan dikurangi penyisihan atas penurunan nilai yangpermanen, jika ada, yang merupakan taksiran manajemen.
Keuntungan (kerugian) dari perdagangan efek meliputi keuntungan(kerugian) yang timbul dari penjualan efek dan keuntungan (kerugian) yangbelum direalisasi akibat kenaikan (penurunan) nilai wajar portofolio efek.
Expenses relating to investment management and advisory services arerecognized when incured. Other expenses are recognized based on theaccrual basis.
Gain (losses) on tranding of securities consist of gains (losses) on securitiessold and unrealized gains (losses) as a result of increases (decreases) in thefair value of portfolio of securities owned.
Saldo rugi fiskal yang dapat dikompensasikan diakui sebagai aset pajaktangguhan apabila besar kemungkinan bahwa jumlah laba fiskal di masamendatang akan memadai untuk dikompensasi.
Koreksi terhadap liabilitas perpajakan diakui saat surat ketetapan pajakditerima atau jika mengajukan keberatan, pada saat keputusan atas keberatantersebut telah ditetapkan.
Deferred tax assets relating to the carry forward of unused tax losses arerecognized to the extent that it is probable that future taxable profit will beavailable against which the unused tax losses can be utilized.
Amendments to taxation obligations are recorded when an assessment isreceived or, if appealed against, when the result of the appeal aredetermined.
Beban pajak kini ditetapkan berdasarkan taksiran laba kena pajak periodeberjalan. Aset dan liabilitas pajak tangguhan diakui atas perbedaantemporer antara aset dan liabilitas untuk tujuan komersial dan untuk tujuanperpajakan setiap tanggal pelaporan. Manfaat pajak di masa mendatang,seperti saldo rugi fiskal yang belum digunakan, diakui sejauh besarkemungkinan realisasi atas manfaat pajak tersebut.
Current tax expense is provided based on the estimated taxable income forthe period. Deferred tax assets and liabilities are recognized for temporarydifferences between the financial and the tax bases of assets and liabilities ateach reporting date. Future tax benefits, such as the carry-forward of unusedtax losses, are also recognized to the extent that realization of such benefitsis probable.
13

13
PT PANCA GLOBAL SECURITIES Tbk PT PANCA GLOBAL SECURITIES TbkCATATAN ATAS LAPORAN KEUANGAN NOTES TO FINANCIAL STATEMENTSUntuk Tahun Yang Berakhir Pada Tanggal-Tanggal 31 Desember 2013 dan 2012 For The Years Ended December 31, 2013 and 2012(Disajikan dalam Rupiah) (Expressed in Rupiah)
These financial statements are originally issued in Indonesian language.
3. Iktisar Kebijakan Akuntansi - lanjutan 3. Summary of Significant Accounting Policies - continued
d. Liabilitas Keuangan dan Instrumen Ekuitas - lanjutan d. Financial Liabilities and Equity Instruments - continued
d.6 Penghentian Pengakuan Liabilitas Keuangan d.6 Derecognises Financial Liabilities
e. Kas dan Setara Kas e. Cash and Cash Equivalents
f. Transaksi dengan Pihak-pihak Berelasi f. Transaction With Related Parties
f.1 f.1
i) i)
ii) ii)
iii) iii)
f.2 f.2
i) i)
ii) ii)
iii) iii)
iv) iv)
v) v)
vi) vi)
vii) vii)
g. Biaya Dibayar Di Muka g. Prepaid Expenses
Kas dan setara kas terdiri dari saldo kas, bank dan deposito berjangka yangjatuh tempo dalam waktu tiga bulan atau kurang dari tanggal penempatannyadan yang tidak dijaminkan serta tidak ada pembatasan dalam pencairannya.
Cash and cash equivalents consist of cash on hand and in banks and allunpledged and unrestricted time deposits with maturities of three months orless from the date of placement.
Biaya dibayar di muka diamortisir selama masa manfaat masing-masingbiaya dengan menggunakan metode garis lurus.
Prepaid expenses are amortized over their beneficial period using thestraight-line method.
Entitas menghentikan pengakuan liabilitas keuangan, jika dan hanyajika, liabilitas Entitas telah dilepaskan, dibatalkan atau kadaluarsa.
The Entity derecognizes financial liabilities when, and only when, theEntity's obligations are discharged, cancelled or they expire.
Pihak berelasi adalah orang atau entitas yang terkait dengan entitas yangmenyiapkan laporan keuangannya.
Orang atau anggota keluarga terdekat mempunyai relasi dengan entitaspelapor jika orang tersebut:
A related party is a person or entity that is related to the entity that ispreparing its financial statements.
A person or a close member of that person’s family is related to areporting entity if that person:
Memiliki pengendalian atau pengendalian bersama atas entitaspelapor
Has control or joint control over the reporting entity;
Memiliki pengaruh signifikan atas entitas pelapor; atau Has significant influence over the reporting entity; or
Personil manajemen kunci entitas pelapor atau entitas induk entitaspelapor.
Is a member of the key management personnel of the reporting entityor of a parent of the reporting entity.
Suatu entitas berelasi dengan entitas pelapor jika memenuhi salah satu halberikut:
An entity is related to a reporting entity if any of the followingconditions applies:
Entitas dan entitas pelapor adalah anggota dari kelompok usaha yangsama (artinya entitas induk, entitas anak, dan entitas anak berikutnyaterkait dengan entitas lain).
The Entity and the reporting entity are members of the same group(which means that each parent, subsidiary and fellow subsidiary isrelated to the others).
Satu entitas adalah entitas asosiasi atau ventura bersama dari entitaslain (atau entitas asosiasi atau ventura bersama yang merupakananggota suatu kelompok usaha, yang mana entitas lain tersebutadalah anggotanya).
One entity is an associate or joint venture of the other entity (or anassociate or joint venture of a member of a group of which the otherentity is a member)
Kedua entitas tersebut adalah ventura bersama dari pihak ketiga yangsama
Both entities are joint ventures of the same third party.
Satu entitas adalah ventura bersama dari entitas ketiga dan entitasyang lain adalah entitas asosiasi dari entitas ketiga.
One entity is a joint venture of a third entity and the other entity isan associate of the third entity.
Entitas tersebut adalah suatu program imbalan pascakerja untukimbalan kerja dari salah satu entitas pelapor atau entitas yang terkaitdengan entitas pelapor. Jika entitas pelapor adalah entitas yangmenyelenggarakan program tersebut, maka entitas sponsor jugaberelasi dengan entitas pelapor.
The Entity is a post-employment benefit plan for the benefit ofemployees of either the reporting entity or an entity related to thereporting entity. If the reporting entity is itself such a plan, thesponsoring employers are also related to the reporting entity.
Entitas yang dikendalikan atau dikendalikan bersama oleh orang yangdiidentifikasi dalam huruf (f.1).
The Entity is controlled or jointly controlled by a person identified in(f.1).
Orang yang diidentifikasi dalam huruf (f.1) (i) memiliki pengaruhsignifikan atas entitas atau personil manajemen kunci entitas (atauentitas induk dari entitas).
A person identified in (f.1)(i) has significant influence over the entityor is a member of the key management personnel of the entity (or ofa parent of the entity).
Semua transaksi dengan pihak-pihak berelasi, baik yang dilakukan denganatau tidak dengan suku bunga atau harga, persyaratan dan kondisi yang samasebagaimana dilakukan dengan pihak ketiga, diungkapkan dalam laporankeuangan.
All transactions with related parties, whether or not made at similar termsand conditions as those done with third parties, are disclosed in thefinancial statements.
12
PT PANCA GLOBAL SECURITIES Tbk PT PANCA GLOBAL SECURITIES TbkCATATAN ATAS LAPORAN KEUANGAN NOTES TO FINANCIAL STATEMENTSUntuk Tahun Yang Berakhir Pada Tanggal-Tanggal 31 Desember 2013 dan 2012 For The Years Ended December 31, 2013 and 2012(Disajikan dalam Rupiah) (Expressed in Rupiah)
These financial statements are originally issued in Indonesian language.
3. Iktisar Kebijakan Akuntansi - lanjutan 3. Summary of Significant Accounting Policies - continued
h. Penyertaan Saham h. Investments in Shares
i. Aset Tetap i. Fixed Assets
Kendaraan VehiclesPeralatan Kantor Office EquipmentKomputer ComputerPerabot Kantor Furniture
j. Pengakuan Pendapatan dan Beban j. Revenue and Expense Recognition
k. Perpajakan k. Taxes
Tahun/Years
4424
Aset tetap dicatat sebesar biaya perolehan, sedangkan penyusutanmenggunakan metode garis lurus (straightline method) berdasarkan taksiranmasa manfaat ekonomis aset tetap sebagai berikut :
Beban pemeliharaan dan perbaikan aset tetap dibebankan pada laporan labarugi komprehensif pada saat terjadinya. Penambahan dalam jumlah besardikapitalisasi apabila menambah umur ekonomis. Aset yang sudah tidakdipergunakan atau dijual dikeluarkan dari kelompok aset tetap dan laba ataurugi yang timbul diperhitungkan pada laporan laba rugi komprehensif padatahun bersangkutan.
Fixed assets are recorded at cost, while depreciation is computed usingstraightline method based on the estimated useful lives of assets as follows:
The cost of maintenance and repairs is charged to statement ofcomprehensive income as incurred; expenditures which extend the useful lifeof the assets or result in increased future economic benefits are capitalized.When assets are retired or otherwise disposed of, their carrying values andthe related accumulated depreciation are removed from the accounts andany resulting gain or loss is reflected in the current years statement ofcomprehensive income.
Pendapatan komisi dan jasa lainnya yang berkaitan dengan transaksiperantara pedagang efek diakui pada saat transaksi terjadi. Pendapatan darijasa manajemen investasi dan penasihat investasi diakui pada saat jasadiberikan sesuai dengan ketentuan dalam kontrak.
Biaya yang terjadi sehubungan dengan kegiatan pengelolaan investasi danpenasehat investasi dibebankan pada saat terjadinya. Beban lainnya diakuisesuai dengan manfaatnya pada periode yang bersangkutan (accrual basis ).
Commision income from brokerage and other services is recognized at thetransaction date. Fees from Investment management and advisory servicesare recognized when the services are rendered based on the terms of thecontracts.
Seluruh perbedaan temporer antara jumlah yang tercatat aset dan liabilitasdengan dasar pengenaan pajaknya diakui sebagai pajak tangguhan denganmetode kewajiban (liability ). Pajak tangguhan diukur dengan tarif pajak yangberlaku saat ini.
Deferred income tax is provided using the liability method for all temporarydifferences arising between the tax bases of assets and liablities and theircarrying value for financial reporting purposes. Deferred income tax isdetermined by currently enacted tax rates.
Investments in shares with ownership interests of less than 20% that do nothave readily determinable fair values and are intended for long-terminvestments are stated at cost less an allowance for permanent decline invalue, if any, based on management judgement.
Penyertaan saham dengan kepemilikan kurang dari 20% yang nilai wajarnyatidak tersedia serta dimaksudkan untuk investasi jangka panjang dinyatakanberdasarkan biaya perolehan dikurangi penyisihan atas penurunan nilai yangpermanen, jika ada, yang merupakan taksiran manajemen.
Keuntungan (kerugian) dari perdagangan efek meliputi keuntungan(kerugian) yang timbul dari penjualan efek dan keuntungan (kerugian) yangbelum direalisasi akibat kenaikan (penurunan) nilai wajar portofolio efek.
Expenses relating to investment management and advisory services arerecognized when incured. Other expenses are recognized based on theaccrual basis.
Gain (losses) on tranding of securities consist of gains (losses) on securitiessold and unrealized gains (losses) as a result of increases (decreases) in thefair value of portfolio of securities owned.
Saldo rugi fiskal yang dapat dikompensasikan diakui sebagai aset pajaktangguhan apabila besar kemungkinan bahwa jumlah laba fiskal di masamendatang akan memadai untuk dikompensasi.
Koreksi terhadap liabilitas perpajakan diakui saat surat ketetapan pajakditerima atau jika mengajukan keberatan, pada saat keputusan atas keberatantersebut telah ditetapkan.
Deferred tax assets relating to the carry forward of unused tax losses arerecognized to the extent that it is probable that future taxable profit will beavailable against which the unused tax losses can be utilized.
Amendments to taxation obligations are recorded when an assessment isreceived or, if appealed against, when the result of the appeal aredetermined.
Beban pajak kini ditetapkan berdasarkan taksiran laba kena pajak periodeberjalan. Aset dan liabilitas pajak tangguhan diakui atas perbedaantemporer antara aset dan liabilitas untuk tujuan komersial dan untuk tujuanperpajakan setiap tanggal pelaporan. Manfaat pajak di masa mendatang,seperti saldo rugi fiskal yang belum digunakan, diakui sejauh besarkemungkinan realisasi atas manfaat pajak tersebut.
Current tax expense is provided based on the estimated taxable income forthe period. Deferred tax assets and liabilities are recognized for temporarydifferences between the financial and the tax bases of assets and liabilities ateach reporting date. Future tax benefits, such as the carry-forward of unusedtax losses, are also recognized to the extent that realization of such benefitsis probable.
13
14
PT PANCA GLOBAL SECURITIES Tbk PT PANCA GLOBAL SECURITIES TbkCATATAN ATAS LAPORAN KEUANGAN NOTES TO FINANCIAL STATEMENTSUntuk Tahun Yang Berakhir Pada Tanggal-Tanggal 31 Desember 2013 dan 2012 For The Years Ended December 31, 2013 and 2012(Disajikan dalam Rupiah) (Expressed in Rupiah)
These financial statements are originally issued in Indonesian language.
3. Iktisar Kebijakan Akuntansi - lanjutan 3. Summary of Significant Accounting Policies - continued
l. Transaksi dan Saldo Dalam Mata Uang Asing l. Foreign Currency Transactions and Balances
m. Beban Emisi Saham m. Share Issuance Cost
n. Manfaat Karyawan n. Employee Benefits
o. Laba Per Saham o. Net Income Per Share
p. Rekening Efek p. Securities account
q. Penggunaan Estimasi q. Use of Estimates
Entitas menyelenggarakan pembukuannya dalam mata uang rupiah. Transaksitransaksi dalam mata uang asing dijabarkan ke dalam mata uang Rupiahdengan menggunakan kurs yang berlaku pada saat terjadinya transaksi yangbersangkutan. Pada tanggal laporan posisi keuangan, aset dan liabilitasmoneter dalam mata uang asing dijabarkan kedalam mata uang Rupiahdengan menggunakan kurs tengah yang dikeluarkan oleh Bank Indonesiayang berlaku pada tanggal tersebut.
Berdasarkan Surat Keputusan Ketua Bapepam No. Kep-06/PM/2000 tanggal13 Maret 2000 tentang Perubahan Peraturan No.VIII.G.7 mengenai PedomanPenyajian Laporan Keuangan yang antara lain menyatakan bahwa biaya yangterjadi sehubungan penawaran saham kepada masyarakat disajikan sebagaibagian dari tambahan modal disetor - agio saham.
Entitas mengakui liabilitas manfaat karyawan yang tidak didanai berdasarkanUndang-Undang Tenaga Kerja No. 13/2003 tanggal 25 Maret 2003. Biayajasa lalu atas penerapan pertama kali kebijakan ini diamortisasi selama rata-rata sisa masa kerja karyawan. Koreksi dan dampak perubahan asumsiaktuaria berikutnya, diamortisasi selama rata - rata masa kerja karyawan.Perhitungan manfaat karyawan dihitung dengan menggunakan metodeProjected Unit Credit yang mencerminkan jasa karyawan pada saat penilaian
The Entity recognized an unfunded employee benefits liability inaccordance with Labor Law No.13/2003 dated March 25, 2003. Pastservice cost relating to the initial implementation of these policies isamortized over the estimated average remaining working lives ofemployees. Further actuarial adjustments and effects of changes inactuarial assumtions are amortized over the estimated average remainingworking lives of employees. The method used by the actuary for actuarialcalculations is the projected unit credit method which reflects the servicesrendered by employees up to the valuation date.
The Entity maintains their accounting records in Rupiah currency.Transactions in currencies other than Rupiah are recorded at theprevailing rate of exchange in effect on the date of the transactions. Atstatements of financial position dates, all monetary assets and liabilitiesdenominated in foreign currencies have been translated at the approximateprevailing exchange rate as issued by Bank Indonesia at the date.
Based on the Decree of Chairman of Capital Market Supervisory Board No.Kep-06PM/2000 dated March 13, 2000 concerning the change of Rule No.VIII.G.7 regarding the Guidelines of Financial Statement Presentations,share issuance cost in respect of public offering should be represented aspart of additional paid in capital.
Laba usaha per saham dan laba bersih per saham dihitung dengan membagilaba usaha dan laba bersih dengan jumlah rata-rata tertimbang dari jumlahsaham entitas yang beredar pada tahun yang bersangkutan. Jumlah sahamyang beredar yang digunakan untuk perhitungan laba usaha per saham danlaba bersih per saham untuk tahun yang berakhir pada tanggal-tanggal 31Desember 2013 dan 2012 masing-masing sebesar 708.354.264 saham.
Basic earnings per share is computed by dividing net income by theweighted average number of shares outstanding during the year. Theoutstanding shares used in calculating operating income and net incomeper share for the years ended December 31, 2013, and 2012 amountedto708,354,264 share, respectively.
Beban emisi saham yang dikeluarkan sebelum Penawaran Umum Perdanasaham-saham Entitas efektif ditangguhkan dan tidak diamortisasi. Segerasetelah proses Penawaran Umum Perdana menjadi efektif, biaya emisi sahamakan dipindahkan sebagai pengurang hasil emisi saham dalam kelompokekuitas.
Deferred share issuance cost incurred before the Entity's Initial PublicOffering became effective, is presented as other assets component and arenot amortized. As soon as the process of Initial Public Offering becameeffective, share issuance cost will be transferred as deduction to proceedsfrom share issuance in the equity component.
Penyajian laporan keuangan sesuai dengan Standar Akuntansi Keuangan diIndonesia mengharuskan manajemen membuat estimasi dan asumsi yangmempengaruhi angka yang dilaporkan. Sesuai dengan sifat bawaannya,estimasi yang dibuat mengandung adanya unsur ketidakpastian, sehinggajumlah sebenarnya yang dilaporkan di periode yang akan datang dapatberbeda dengan estimasi tersebut.
The preparation of financial statements in conformity with IndonesianFinancial Accounting Standards requires management to make estimationsand assumptions that affect amounts reported therein. Due to the inherentuncertainty in making estimates, actual results reported in future periodsmay be based on amounts which differ from those estimates.
Rekening efek adalah rekening yang dimiliki oleh nasabah dari entitassehubungan dengan transaksi efek oleh nasabah , melalui entitas. Rekeningefek nasabah tidak diklasifikasikan sebagai aset keuangan oleh entitas dantidak dapat diakui dalam laporan posisi keuangan entitas, namun diakui offbalance sheet dan dicatat dalam buku pembantu dana dan buku pembantuefek.
Securities account is an account owned by clients of the entity in connectionwith securities transactions by clients, trough the entity. Client's securitiesaccount are not classified as financial assets by the enttity and can not berecognized in the financial position of the entity, but recognized off balancesheet and recognized at fund ledger and sub ledger securities.
14
PT PANCA GLOBAL SECURITIES Tbk PT PANCA GLOBAL SECURITIES TbkCATATAN ATAS LAPORAN KEUANGAN NOTES TO FINANCIAL STATEMENTSUntuk Tahun Yang Berakhir Pada Tanggal-Tanggal 31 Desember 2013 dan 2012 For The Years Ended December 31, 2013 and 2012(Disajikan dalam Rupiah) (Expressed in Rupiah)
These financial statements are originally issued in Indonesian language.
4. Instrumen Keuangan 4. Financial Instruments
a. Klasifikasi Instrumen Keuangan a. Categories of Financial Instruments
Cash andKas dan Setara Kas Cash EquivalentsDeposito Berjangka
yang Dibatasi RestrictedPenggunaannya Time Deposits
Portofolio Efek Marketable SecuritiesPiutang Reverse Receivables from
Repo Reverse RepoReceivables from
Piutang Lembaga Clearing andKliring dan GuaranteePenjaminan Institution
Receivables fromPiutang Nasabah CustomersPendapatan Yang
Masih HarusDiterima Accrued Incomes
Penyertaan Saham Investment in SharesPiutang Lain-lain Other ReceivablesAset Lain-lain Other AssetsJumlah Total
-
Pinjaman yangQuoted Market
Price in an
Value Can Not Jumlah/
59.203.200.000
-
412.038.932
-
- -
Diberikan danActive Market and
12.505.389.081
2.523.209.561
The Fair Piutang/Loans and
ReceivablesReliably Measured
-
-
-
Do Not Have a
Pasar Aktif danKuotasi Harga diTidak Memiliki
Nilai Wajarnya
Dengan Andal/Pada Nilai Wajar Melalui Laba Rugi/
Pada Nilai Wajar/
-
Fair Value
3.943.900.000
-
Ditetapkan
1.430.835.000
21.227.674.137
-
-
Held for Trading
3.943.900.000 -
- -
-
-
Fair Value Through Profit or Loss
Tidak Dapat Diukur
272.052.923
93.699.080.155
170.276.873.049
-
231.067.397
- 1.880.000.000
Total
12.505.389.081
2.523.209.561
59.203.200.000
25.171.574.137
1.880.000.000 412.038.932 231.067.397
93.699.080.155
1.430.835.000
272.052.923
197.328.447.186
-
Designed as
untuk DiukurKelompok
-
Diperdagangkan/
-
-
-
21.227.674.137
-
-
- -
1.880.000.000 -
Rincian kebijakan akuntansi penting dan metode yang diterapkan (termasukkriteria untuk pengakuan, dasar pengukuran, dan dasar pengakuan pendapatandan beban) untuk setiap klasifikasi aset keuangan, liabilitas dan instrumenekuitas diungkapkan dalam catatan 3.
Klasifikasi aset keuangan pada tanggal 31 Desember 2013 adalah sebagaiberikut:
Details of the significant accounting policies and methods adopted(including the criteria for recognition, the bases of measurement, and thebases for recognition of income and expenses) for each class of financialasset, liability and equity instrument are disclosed in note 3.
Classification of financial assets as of December 31, 2013 is as follows:
Biaya dan pajak dibayar di muka tidak diklasifikasi sebagai aset keuanganberdasarkan PSAK 55 (revisi 2011).
Prepaid expenses and prepaid tax are not classified as financial assets underPSAK 55 (revised 2011).
15
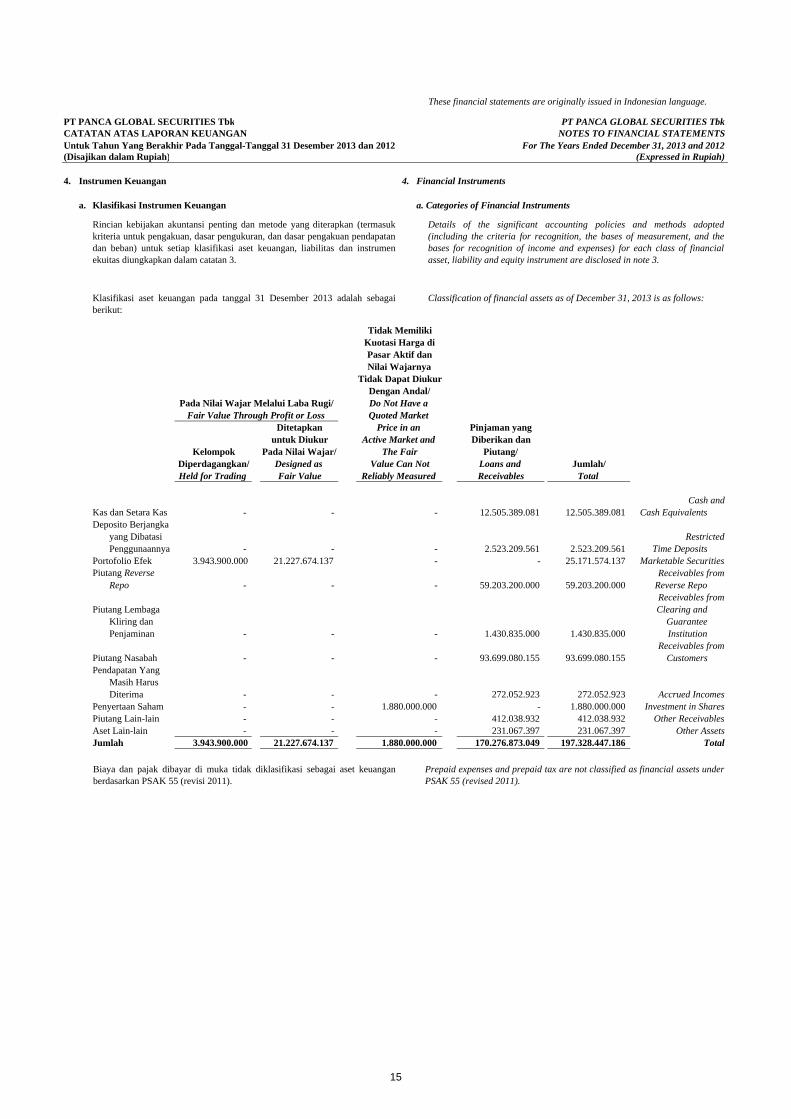
15
PT PANCA GLOBAL SECURITIES Tbk PT PANCA GLOBAL SECURITIES TbkCATATAN ATAS LAPORAN KEUANGAN NOTES TO FINANCIAL STATEMENTSUntuk Tahun Yang Berakhir Pada Tanggal-Tanggal 31 Desember 2013 dan 2012 For The Years Ended December 31, 2013 and 2012(Disajikan dalam Rupiah) (Expressed in Rupiah)
These financial statements are originally issued in Indonesian language.
3. Iktisar Kebijakan Akuntansi - lanjutan 3. Summary of Significant Accounting Policies - continued
l. Transaksi dan Saldo Dalam Mata Uang Asing l. Foreign Currency Transactions and Balances
m. Beban Emisi Saham m. Share Issuance Cost
n. Manfaat Karyawan n. Employee Benefits
o. Laba Per Saham o. Net Income Per Share
p. Rekening Efek p. Securities account
q. Penggunaan Estimasi q. Use of Estimates
Entitas menyelenggarakan pembukuannya dalam mata uang rupiah. Transaksitransaksi dalam mata uang asing dijabarkan ke dalam mata uang Rupiahdengan menggunakan kurs yang berlaku pada saat terjadinya transaksi yangbersangkutan. Pada tanggal laporan posisi keuangan, aset dan liabilitasmoneter dalam mata uang asing dijabarkan kedalam mata uang Rupiahdengan menggunakan kurs tengah yang dikeluarkan oleh Bank Indonesiayang berlaku pada tanggal tersebut.
Berdasarkan Surat Keputusan Ketua Bapepam No. Kep-06/PM/2000 tanggal13 Maret 2000 tentang Perubahan Peraturan No.VIII.G.7 mengenai PedomanPenyajian Laporan Keuangan yang antara lain menyatakan bahwa biaya yangterjadi sehubungan penawaran saham kepada masyarakat disajikan sebagaibagian dari tambahan modal disetor - agio saham.
Entitas mengakui liabilitas manfaat karyawan yang tidak didanai berdasarkanUndang-Undang Tenaga Kerja No. 13/2003 tanggal 25 Maret 2003. Biayajasa lalu atas penerapan pertama kali kebijakan ini diamortisasi selama rata-rata sisa masa kerja karyawan. Koreksi dan dampak perubahan asumsiaktuaria berikutnya, diamortisasi selama rata - rata masa kerja karyawan.Perhitungan manfaat karyawan dihitung dengan menggunakan metodeProjected Unit Credit yang mencerminkan jasa karyawan pada saat penilaian
The Entity recognized an unfunded employee benefits liability inaccordance with Labor Law No.13/2003 dated March 25, 2003. Pastservice cost relating to the initial implementation of these policies isamortized over the estimated average remaining working lives ofemployees. Further actuarial adjustments and effects of changes inactuarial assumtions are amortized over the estimated average remainingworking lives of employees. The method used by the actuary for actuarialcalculations is the projected unit credit method which reflects the servicesrendered by employees up to the valuation date.
The Entity maintains their accounting records in Rupiah currency.Transactions in currencies other than Rupiah are recorded at theprevailing rate of exchange in effect on the date of the transactions. Atstatements of financial position dates, all monetary assets and liabilitiesdenominated in foreign currencies have been translated at the approximateprevailing exchange rate as issued by Bank Indonesia at the date.
Based on the Decree of Chairman of Capital Market Supervisory Board No.Kep-06PM/2000 dated March 13, 2000 concerning the change of Rule No.VIII.G.7 regarding the Guidelines of Financial Statement Presentations,share issuance cost in respect of public offering should be represented aspart of additional paid in capital.
Laba usaha per saham dan laba bersih per saham dihitung dengan membagilaba usaha dan laba bersih dengan jumlah rata-rata tertimbang dari jumlahsaham entitas yang beredar pada tahun yang bersangkutan. Jumlah sahamyang beredar yang digunakan untuk perhitungan laba usaha per saham danlaba bersih per saham untuk tahun yang berakhir pada tanggal-tanggal 31Desember 2013 dan 2012 masing-masing sebesar 708.354.264 saham.
Basic earnings per share is computed by dividing net income by theweighted average number of shares outstanding during the year. Theoutstanding shares used in calculating operating income and net incomeper share for the years ended December 31, 2013, and 2012 amountedto708,354,264 share, respectively.
Beban emisi saham yang dikeluarkan sebelum Penawaran Umum Perdanasaham-saham Entitas efektif ditangguhkan dan tidak diamortisasi. Segerasetelah proses Penawaran Umum Perdana menjadi efektif, biaya emisi sahamakan dipindahkan sebagai pengurang hasil emisi saham dalam kelompokekuitas.
Deferred share issuance cost incurred before the Entity's Initial PublicOffering became effective, is presented as other assets component and arenot amortized. As soon as the process of Initial Public Offering becameeffective, share issuance cost will be transferred as deduction to proceedsfrom share issuance in the equity component.
Penyajian laporan keuangan sesuai dengan Standar Akuntansi Keuangan diIndonesia mengharuskan manajemen membuat estimasi dan asumsi yangmempengaruhi angka yang dilaporkan. Sesuai dengan sifat bawaannya,estimasi yang dibuat mengandung adanya unsur ketidakpastian, sehinggajumlah sebenarnya yang dilaporkan di periode yang akan datang dapatberbeda dengan estimasi tersebut.
The preparation of financial statements in conformity with IndonesianFinancial Accounting Standards requires management to make estimationsand assumptions that affect amounts reported therein. Due to the inherentuncertainty in making estimates, actual results reported in future periodsmay be based on amounts which differ from those estimates.
Rekening efek adalah rekening yang dimiliki oleh nasabah dari entitassehubungan dengan transaksi efek oleh nasabah , melalui entitas. Rekeningefek nasabah tidak diklasifikasikan sebagai aset keuangan oleh entitas dantidak dapat diakui dalam laporan posisi keuangan entitas, namun diakui offbalance sheet dan dicatat dalam buku pembantu dana dan buku pembantuefek.
Securities account is an account owned by clients of the entity in connectionwith securities transactions by clients, trough the entity. Client's securitiesaccount are not classified as financial assets by the enttity and can not berecognized in the financial position of the entity, but recognized off balancesheet and recognized at fund ledger and sub ledger securities.
14
PT PANCA GLOBAL SECURITIES Tbk PT PANCA GLOBAL SECURITIES TbkCATATAN ATAS LAPORAN KEUANGAN NOTES TO FINANCIAL STATEMENTSUntuk Tahun Yang Berakhir Pada Tanggal-Tanggal 31 Desember 2013 dan 2012 For The Years Ended December 31, 2013 and 2012(Disajikan dalam Rupiah) (Expressed in Rupiah)
These financial statements are originally issued in Indonesian language.
4. Instrumen Keuangan 4. Financial Instruments
a. Klasifikasi Instrumen Keuangan a. Categories of Financial Instruments
Cash andKas dan Setara Kas Cash EquivalentsDeposito Berjangka
yang Dibatasi RestrictedPenggunaannya Time Deposits
Portofolio Efek Marketable SecuritiesPiutang Reverse Receivables from
Repo Reverse RepoReceivables from
Piutang Lembaga Clearing andKliring dan GuaranteePenjaminan Institution
Receivables fromPiutang Nasabah CustomersPendapatan Yang
Masih HarusDiterima Accrued Incomes
Penyertaan Saham Investment in SharesPiutang Lain-lain Other ReceivablesAset Lain-lain Other AssetsJumlah Total
-
Pinjaman yangQuoted Market
Price in an
Value Can Not Jumlah/
59.203.200.000
-
412.038.932
-
- -
Diberikan danActive Market and
12.505.389.081
2.523.209.561
The Fair Piutang/Loans and
ReceivablesReliably Measured
-
-
-
Do Not Have a
Pasar Aktif danKuotasi Harga diTidak Memiliki
Nilai Wajarnya
Dengan Andal/Pada Nilai Wajar Melalui Laba Rugi/
Pada Nilai Wajar/
-
Fair Value
3.943.900.000
-
Ditetapkan
1.430.835.000
21.227.674.137
-
-
Held for Trading
3.943.900.000 -
- -
-
-
Fair Value Through Profit or Loss
Tidak Dapat Diukur
272.052.923
93.699.080.155
170.276.873.049
-
231.067.397
- 1.880.000.000
Total
12.505.389.081
2.523.209.561
59.203.200.000
25.171.574.137
1.880.000.000 412.038.932 231.067.397
93.699.080.155
1.430.835.000
272.052.923
197.328.447.186
-
Designed as
untuk DiukurKelompok
-
Diperdagangkan/
-
-
-
21.227.674.137
-
-
- -
1.880.000.000 -
Rincian kebijakan akuntansi penting dan metode yang diterapkan (termasukkriteria untuk pengakuan, dasar pengukuran, dan dasar pengakuan pendapatandan beban) untuk setiap klasifikasi aset keuangan, liabilitas dan instrumenekuitas diungkapkan dalam catatan 3.
Klasifikasi aset keuangan pada tanggal 31 Desember 2013 adalah sebagaiberikut:
Details of the significant accounting policies and methods adopted(including the criteria for recognition, the bases of measurement, and thebases for recognition of income and expenses) for each class of financialasset, liability and equity instrument are disclosed in note 3.
Classification of financial assets as of December 31, 2013 is as follows:
Biaya dan pajak dibayar di muka tidak diklasifikasi sebagai aset keuanganberdasarkan PSAK 55 (revisi 2011).
Prepaid expenses and prepaid tax are not classified as financial assets underPSAK 55 (revised 2011).
15

16
PT PANCA GLOBAL SECURITIES Tbk PT PANCA GLOBAL SECURITIES TbkCATATAN ATAS LAPORAN KEUANGAN NOTES TO FINANCIAL STATEMENTSUntuk Tahun Yang Berakhir Pada Tanggal-Tanggal 31 Desember 2013 dan 2012 For The Years Ended December 31, 2013 and 2012(Disajikan dalam Rupiah) (Expressed in Rupiah)
These financial statements are originally issued in Indonesian language.
4. Instrumen Keuangan - lanjutan 4. Financial Instruments - continued
a. Klasifikasi Instrumen Keuangan - lanjutan a. Categories of Financial Instruments - continued
Cash andKas dan Setara Kas Cash EquivalentsDeposito Berjangka
yang Dibatasi RestrictedPenggunaannya Time Deposits
Portofolio Efek Marketable SecuritiesPiutang Reverse Receivables from
Repo Reverse RepoReceivables from
Piutang Lembaga Clearing andKliring dan GuaranteePenjaminan Institution
Receivables fromPiutang Nasabah CustomersPendapatan Yang
Masih HarusDiterima Accrued Incomes
Penyertaan Saham Investment in SharesPiutang Lain-lain Other ReceivablesAset Lain-lain Other AssetsJumlah Total
Utang Lembaga Kliring Payables to Clearing and dan Penjaminan Guarantee Institution
Utang Nasabah Payables to CustomersBiayaYang Masih Harus Dibayar Accrued ExpensesUtang Lain-lain Other PayablesJumlah Total
31.016.000.000 1.880.000.000 142.592.611.318
- - - 629.840.087 - - - 204.537.553
- - 1.880.000.000 - - - -
-
- - -
Kelompok
-
- -
Diperdagangkan/ Designed as Value Can Not
-
4.308.347.702 -
Held for Trading Fair Value
1.241.347.500
-
- - 7.091.042.000
Active Market and
Quoted Market
- 31.016.000.000
Reliably Measured
- 54.996.200.000
Loans and Receivables
- -
15.316.657.412
-
-
-
Fair Value Through Profit or LossDitetapkan
untuk Diukur
2.413.578.732
54.996.200.000
72.577.900.249
7.091.042.000
72.577.900.249
176.729.958.818
629.840.087
371.164.995 371.164.995 1.880.000.000
Total
Nilai Wajarnya
Total
Pinjaman yang
2.413.578.732 32.257.347.500
4.308.347.702
Piutang/Diberikan dan
Jumlah/
204.537.553
4.677.437.500
Jumlah/
1.220.000528.337.872
Kuotasi Harga diPasar Aktif dan
Tidak Memiliki
Profit or LossFair Value ThroughLaporan Laba Rugi/
Pada Nilai Wajar Melalui Laba Rugi/
1.241.347.500
--
Nilai Wajar Melalui
Tidak Dapat Diukur
Do Not Have a
Price in an
The Fair
Dengan Andal/
Pada Nilai Wajar/
Amortised Cost
-
20.523.652.7841.220.000
4.677.437.500
20.523.652.784
528.337.87215.316.657.412
yang Diamortisasi/Biaya Perolehan
Klasifikasi liabilitas keuangan pada tanggal 31 Desember 2013 adalah sebagaiberikut:
Classification of financial liabilities as of December 31, 2013 is as follows:
Utang pajak dan liabilitas diestimasi tidak diklasifikasi sebagai liabilitaskeuangan berdasarkan PSAK 55 (revisi 2011).
Taxes payable and provisions are not classified as financial liabilities underPSAK 55 (revised 2011).
Klasifikasi aset keuangan pada tanggal 31 Desember 2012 adalah sebagaiberikut:
Classification of financial assets as of December 31, 2012 is as follows:
Pada tanggal-tanggal 31 Desember 2013 dan 2012, nilai wajar aset keuangantidak berbeda material dengan nilai tercatatnya.
Biaya dan pajak dibayar di muka tidak diklasifikasi sebagai aset keuanganberdasarkan PSAK 55 (revisi 2011).
As of December 31, 2013 and 2012, the fair value of financial assets are notmaterially different from their carrying amounts.
Prepaid expenses and prepaid tax are not classified as financial assets underPSAK 55 (revised 2011).
16
PT PANCA GLOBAL SECURITIES Tbk PT PANCA GLOBAL SECURITIES TbkCATATAN ATAS LAPORAN KEUANGAN NOTES TO FINANCIAL STATEMENTSUntuk Tahun Yang Berakhir Pada Tanggal-Tanggal 31 Desember 2013 dan 2012 For The Years Ended December 31, 2013 and 2012(Disajikan dalam Rupiah) (Expressed in Rupiah)
These financial statements are originally issued in Indonesian language.
4. Instrumen Keuangan - lanjutan 4. Financial Instruments - continued
a. Klasifikasi Instrumen Keuangan - lanjutan a. Categories of Financial Instruments - continued
Utang Lembaga Kliring Payables to Clearing and dan Penjaminan Guarantee Institution
Utang Nasabah Payables to CustomersBiayaYang Masih Harus Dibayar Accrued ExpensesUtang Lain-lain Other PayablesJumlah Total
b. Nilai Wajar Instrumen Keuangan b. Fair Value of Financial Instruments
• •
• •
• •
• •
c. Saling Hapus Dari Instrumen Keuangan c. Offsetting of Financial Instruments
5. Kebijakan dan Tujuan Manajemen Risiko Keuangan 5. Financial Risk Management Policies and Objectives
6.360.000
yang Diamortisasi/Laporan Laba Rugi/
6.360.00014.583.677.016
Total
-309.300.208
- 14.583.677.016
Fair Value Through
--
7.506.171.0007.506.171.000-
Amortized Cost
Biaya PerolehanJumlah/
6.761.845.808
Profit or Loss
6.761.845.808
Nilai Wajar Melalui
309.300.208
Aset dan liabilitas keuangan dari transaksi efek saling hapus buku dan nilaibersihnya disajikan dalam laporan posisi keuangan jika memiliki hak yangberkekuatan hukum untuk melakukan saling hapus buku atas jumlah yangtelah diakui tersebut dan berniat untuk menyelesaikan secara neto atau untukmerealisasikan aset dan menyelesaikan liabilitasnya secara simultan.
Financial assets and liabilities from securities transactions are offset andthe net amount is reported in the statement of financial position when thereis a legally enforceabte right to offset the recognized amounts and there isan intention to settle on a net basis or realize the asset and settle the liabilitysimultaneously.
Entitas telah mendokumentasikan kebijakan manajemen risiko keuangannya.Kebijakan yang ditetapkan merupakan strategi bisnis secara menyeluruh danfilosofi manajemen risiko. Keseluruhan strategi manajemen risiko Entitasditujukan untuk meminimalkan pengaruh ketidakpastian yang dihadapi dalampasar terhadap kinerja keuangan Entitas.
Entitas beroperasi di dalam negeri dan menghadapi berbagai risiko keuangantermasuk manajemen modal, risiko harga pasar, suku bunga, kredit, dan likuiditas.
The Entity has documented its financial risk management policies. Thesepolicies set out the Entity's overall business strategies and its risk managementphilosophy. The Entity 's overall risk management strategy seeks to minimiseadverse effects from the unpredictability of financial markets on the Entity'sfinancial performance.
The Entity operates locally and is exposed to a variety of financial risksincluding capital management, market price risk, interest rate, credit, andliquidity.
Nilai wajar aset dan liabilitas keuangan ditentukan dengan menggunakanteknik penilaian dan asumsi sebagai berikut:
The fair values of financial assets and liabilities are determined usingvaluation techniques and assumptions as follows:
Nilai wajar aset dan liabilitas keuangan dengan syarat dan kondisi standardan diperdagangkan di pasar aktif ditentukan dengan mengacu pada hargakuotasi pasar. Untuk aset keuangan, nilai wajar digunakan hargapenawaran, sedangkan untuk liabilitas keuangan digunakan hargapermintaan.
The fair values of financial assets and liabilities with standard terms andconditions and traded on active liquid markets are determined withreference to quoted market prices. Fair value based financial assets areusing bid price while financial liabilities are using asked price.
Nilai wajar aset dan liabilitas keuangan lainnya ditentukan sesuai denganmodel penentuan harga yang berlaku umum berdasarkan analisis arus kasyang didiskontokan dengan menggunakan harga transaksi pasar kini yangdiobservasi dan kuotasi dealer untuk instrumen serupa.
The fair values of other financial assets and liabilities are determined inaccordance with generally accepted pricing models based on discountedcash flow analysis using prices from observable current markettransactions and dealer quotes for similar instruments.
Jika harga tersebut diatas tidak tersedia, analisis arus kas yangdidiskontokan bisa dilakukan dengan menggunakan tingkat bungapengembalian sesuai dengan durasi instrumen keuangan.
Where such prices are not available, a discounted cash flow analysis isperformed using the applicable yield curve for the duration of thefinancial instruments.
Instrumen ekuitas yang tidak memiliki kuotasi harga di pasar aktif dan nilai wajarnya tidak dapat diukur dengan andal, diukur pada biaya perolehan.
Equity instruments that do not have a quoted market price in an activemarket and the fair value can not reliably measured, are stated at cost.
Klasifikasi liabilitas keuangan pada tanggal 31 Desember 2012 adalah sebagaiberikut:
Classification of financial liabilities as of December 31, 2012 is as follows:
Pada tanggal-tanggal 31 Desember 2013 dan 2012, nilai wajar liabilitaskeuangan tidak material berbeda dengan nilai tercatatnya.
Utang pajak dan liabilitas diestimasi tidak diklasifikasi sebagai liabilitaskeuangan berdasarkan PSAK 55 (revisi 2011).
As of December 31, 2013 and 2012, the fair value of financial liabilities arenot materially different from their carrying amounts.
Taxes payable and provisions are not classified as financial liabilities underPSAK 55 (revised 2011).
17
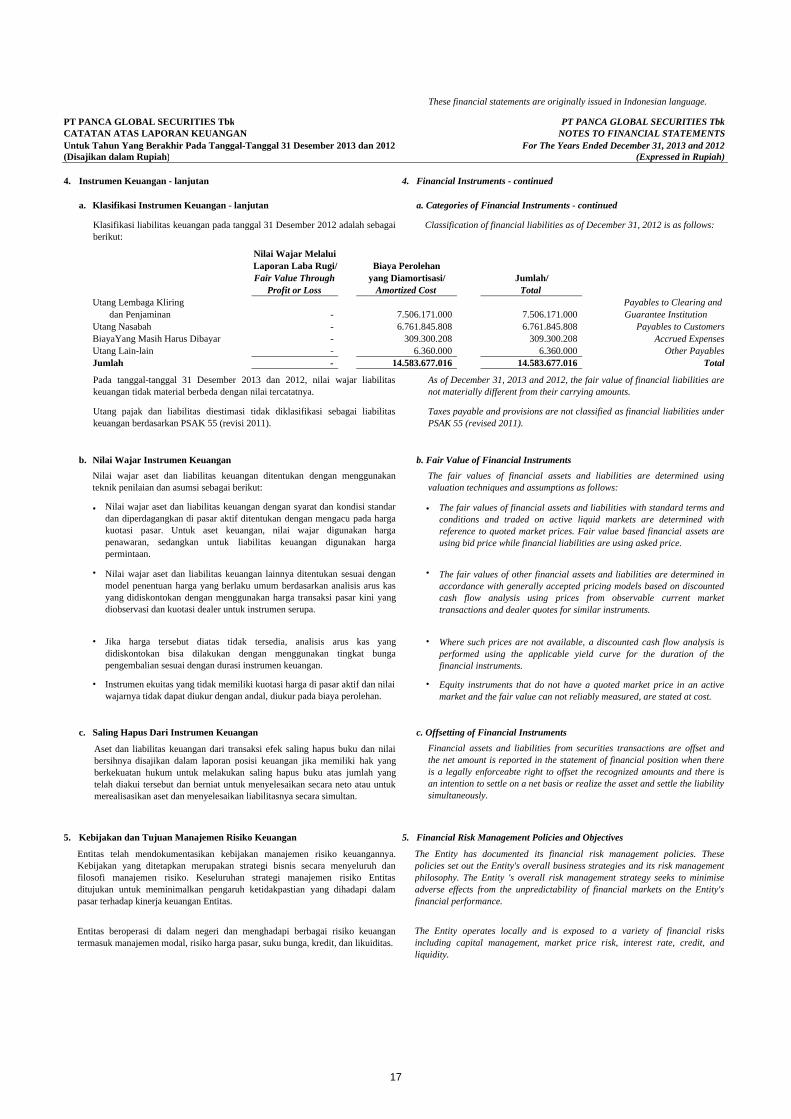
17
PT PANCA GLOBAL SECURITIES Tbk PT PANCA GLOBAL SECURITIES TbkCATATAN ATAS LAPORAN KEUANGAN NOTES TO FINANCIAL STATEMENTSUntuk Tahun Yang Berakhir Pada Tanggal-Tanggal 31 Desember 2013 dan 2012 For The Years Ended December 31, 2013 and 2012(Disajikan dalam Rupiah) (Expressed in Rupiah)
These financial statements are originally issued in Indonesian language.
4. Instrumen Keuangan - lanjutan 4. Financial Instruments - continued
a. Klasifikasi Instrumen Keuangan - lanjutan a. Categories of Financial Instruments - continued
Cash andKas dan Setara Kas Cash EquivalentsDeposito Berjangka
yang Dibatasi RestrictedPenggunaannya Time Deposits
Portofolio Efek Marketable SecuritiesPiutang Reverse Receivables from
Repo Reverse RepoReceivables from
Piutang Lembaga Clearing andKliring dan GuaranteePenjaminan Institution
Receivables fromPiutang Nasabah CustomersPendapatan Yang
Masih HarusDiterima Accrued Incomes
Penyertaan Saham Investment in SharesPiutang Lain-lain Other ReceivablesAset Lain-lain Other AssetsJumlah Total
Utang Lembaga Kliring Payables to Clearing and dan Penjaminan Guarantee Institution
Utang Nasabah Payables to CustomersBiayaYang Masih Harus Dibayar Accrued ExpensesUtang Lain-lain Other PayablesJumlah Total
31.016.000.000 1.880.000.000 142.592.611.318
- - - 629.840.087 - - - 204.537.553
- - 1.880.000.000 - - - -
-
- - -
Kelompok
-
- -
Diperdagangkan/ Designed as Value Can Not
-
4.308.347.702 -
Held for Trading Fair Value
1.241.347.500
-
- - 7.091.042.000
Active Market and
Quoted Market
- 31.016.000.000
Reliably Measured
- 54.996.200.000
Loans and Receivables
- -
15.316.657.412
-
-
-
Fair Value Through Profit or LossDitetapkan
untuk Diukur
2.413.578.732
54.996.200.000
72.577.900.249
7.091.042.000
72.577.900.249
176.729.958.818
629.840.087
371.164.995 371.164.995 1.880.000.000
Total
Nilai Wajarnya
Total
Pinjaman yang
2.413.578.732 32.257.347.500
4.308.347.702
Piutang/Diberikan dan
Jumlah/
204.537.553
4.677.437.500
Jumlah/
1.220.000528.337.872
Kuotasi Harga diPasar Aktif dan
Tidak Memiliki
Profit or LossFair Value ThroughLaporan Laba Rugi/
Pada Nilai Wajar Melalui Laba Rugi/
1.241.347.500
--
Nilai Wajar Melalui
Tidak Dapat Diukur
Do Not Have a
Price in an
The Fair
Dengan Andal/
Pada Nilai Wajar/
Amortised Cost
-
20.523.652.7841.220.000
4.677.437.500
20.523.652.784
528.337.87215.316.657.412
yang Diamortisasi/Biaya Perolehan
Klasifikasi liabilitas keuangan pada tanggal 31 Desember 2013 adalah sebagaiberikut:
Classification of financial liabilities as of December 31, 2013 is as follows:
Utang pajak dan liabilitas diestimasi tidak diklasifikasi sebagai liabilitaskeuangan berdasarkan PSAK 55 (revisi 2011).
Taxes payable and provisions are not classified as financial liabilities underPSAK 55 (revised 2011).
Klasifikasi aset keuangan pada tanggal 31 Desember 2012 adalah sebagaiberikut:
Classification of financial assets as of December 31, 2012 is as follows:
Pada tanggal-tanggal 31 Desember 2013 dan 2012, nilai wajar aset keuangantidak berbeda material dengan nilai tercatatnya.
Biaya dan pajak dibayar di muka tidak diklasifikasi sebagai aset keuanganberdasarkan PSAK 55 (revisi 2011).
As of December 31, 2013 and 2012, the fair value of financial assets are notmaterially different from their carrying amounts.
Prepaid expenses and prepaid tax are not classified as financial assets underPSAK 55 (revised 2011).
16
PT PANCA GLOBAL SECURITIES Tbk PT PANCA GLOBAL SECURITIES TbkCATATAN ATAS LAPORAN KEUANGAN NOTES TO FINANCIAL STATEMENTSUntuk Tahun Yang Berakhir Pada Tanggal-Tanggal 31 Desember 2013 dan 2012 For The Years Ended December 31, 2013 and 2012(Disajikan dalam Rupiah) (Expressed in Rupiah)
These financial statements are originally issued in Indonesian language.
4. Instrumen Keuangan - lanjutan 4. Financial Instruments - continued
a. Klasifikasi Instrumen Keuangan - lanjutan a. Categories of Financial Instruments - continued
Utang Lembaga Kliring Payables to Clearing and dan Penjaminan Guarantee Institution
Utang Nasabah Payables to CustomersBiayaYang Masih Harus Dibayar Accrued ExpensesUtang Lain-lain Other PayablesJumlah Total
b. Nilai Wajar Instrumen Keuangan b. Fair Value of Financial Instruments
• •
• •
• •
• •
c. Saling Hapus Dari Instrumen Keuangan c. Offsetting of Financial Instruments
5. Kebijakan dan Tujuan Manajemen Risiko Keuangan 5. Financial Risk Management Policies and Objectives
6.360.000
yang Diamortisasi/Laporan Laba Rugi/
6.360.00014.583.677.016
Total
-309.300.208
- 14.583.677.016
Fair Value Through
--
7.506.171.0007.506.171.000-
Amortized Cost
Biaya PerolehanJumlah/
6.761.845.808
Profit or Loss
6.761.845.808
Nilai Wajar Melalui
309.300.208
Aset dan liabilitas keuangan dari transaksi efek saling hapus buku dan nilaibersihnya disajikan dalam laporan posisi keuangan jika memiliki hak yangberkekuatan hukum untuk melakukan saling hapus buku atas jumlah yangtelah diakui tersebut dan berniat untuk menyelesaikan secara neto atau untukmerealisasikan aset dan menyelesaikan liabilitasnya secara simultan.
Financial assets and liabilities from securities transactions are offset andthe net amount is reported in the statement of financial position when thereis a legally enforceabte right to offset the recognized amounts and there isan intention to settle on a net basis or realize the asset and settle the liabilitysimultaneously.
Entitas telah mendokumentasikan kebijakan manajemen risiko keuangannya.Kebijakan yang ditetapkan merupakan strategi bisnis secara menyeluruh danfilosofi manajemen risiko. Keseluruhan strategi manajemen risiko Entitasditujukan untuk meminimalkan pengaruh ketidakpastian yang dihadapi dalampasar terhadap kinerja keuangan Entitas.
Entitas beroperasi di dalam negeri dan menghadapi berbagai risiko keuangantermasuk manajemen modal, risiko harga pasar, suku bunga, kredit, dan likuiditas.
The Entity has documented its financial risk management policies. Thesepolicies set out the Entity's overall business strategies and its risk managementphilosophy. The Entity 's overall risk management strategy seeks to minimiseadverse effects from the unpredictability of financial markets on the Entity'sfinancial performance.
The Entity operates locally and is exposed to a variety of financial risksincluding capital management, market price risk, interest rate, credit, andliquidity.
Nilai wajar aset dan liabilitas keuangan ditentukan dengan menggunakanteknik penilaian dan asumsi sebagai berikut:
The fair values of financial assets and liabilities are determined usingvaluation techniques and assumptions as follows:
Nilai wajar aset dan liabilitas keuangan dengan syarat dan kondisi standardan diperdagangkan di pasar aktif ditentukan dengan mengacu pada hargakuotasi pasar. Untuk aset keuangan, nilai wajar digunakan hargapenawaran, sedangkan untuk liabilitas keuangan digunakan hargapermintaan.
The fair values of financial assets and liabilities with standard terms andconditions and traded on active liquid markets are determined withreference to quoted market prices. Fair value based financial assets areusing bid price while financial liabilities are using asked price.
Nilai wajar aset dan liabilitas keuangan lainnya ditentukan sesuai denganmodel penentuan harga yang berlaku umum berdasarkan analisis arus kasyang didiskontokan dengan menggunakan harga transaksi pasar kini yangdiobservasi dan kuotasi dealer untuk instrumen serupa.
The fair values of other financial assets and liabilities are determined inaccordance with generally accepted pricing models based on discountedcash flow analysis using prices from observable current markettransactions and dealer quotes for similar instruments.
Jika harga tersebut diatas tidak tersedia, analisis arus kas yangdidiskontokan bisa dilakukan dengan menggunakan tingkat bungapengembalian sesuai dengan durasi instrumen keuangan.
Where such prices are not available, a discounted cash flow analysis isperformed using the applicable yield curve for the duration of thefinancial instruments.
Instrumen ekuitas yang tidak memiliki kuotasi harga di pasar aktif dan nilai wajarnya tidak dapat diukur dengan andal, diukur pada biaya perolehan.
Equity instruments that do not have a quoted market price in an activemarket and the fair value can not reliably measured, are stated at cost.
Klasifikasi liabilitas keuangan pada tanggal 31 Desember 2012 adalah sebagaiberikut:
Classification of financial liabilities as of December 31, 2012 is as follows:
Pada tanggal-tanggal 31 Desember 2013 dan 2012, nilai wajar liabilitaskeuangan tidak material berbeda dengan nilai tercatatnya.
Utang pajak dan liabilitas diestimasi tidak diklasifikasi sebagai liabilitaskeuangan berdasarkan PSAK 55 (revisi 2011).
As of December 31, 2013 and 2012, the fair value of financial liabilities arenot materially different from their carrying amounts.
Taxes payable and provisions are not classified as financial liabilities underPSAK 55 (revised 2011).
17

18
PT PANCA GLOBAL SECURITIES Tbk PT PANCA GLOBAL SECURITIES TbkCATATAN ATAS LAPORAN KEUANGAN NOTES TO FINANCIAL STATEMENTSUntuk Tahun Yang Berakhir Pada Tanggal-Tanggal 31 Desember 2013 dan 2012 For The Years Ended December 31, 2013 and 2012(Disajikan dalam Rupiah) (Expressed in Rupiah)
These financial statements are originally issued in Indonesian language.
5. Kebijakan dan Tujuan Manajemen Risiko Keuangan - lanjutan 5. Financial Risk Management Policies and Objectives - continued
a. Manajemen Dana Kelolaan a. Capital Management
b. Risiko Harga Pasar b. Market Price Risk
c. Risiko Suku Bunga c. Interest Rate Risk
Entitas mengelola modal ditujukan untuk memastikan kemampuan Entitasmelanjutkan usaha secara berkelanjutan dan memaksimumkan imbal hasilkepada pemegang saham melalui optimalisasi saldo hutang dan ekuitas. Untukmemelihara atau mencapai struktur modal yang optimal, Entitas dapatmenyesuaikan jumlah pembayaran dividen, pengurangan modal, penerbitansaham baru atau membeli kembali saham beredar, mendapatkan pinjamanbaru atau menjual aset untuk mengurangi pinjaman aman.
Entitas juga diwajibkan untuk memelihara persyaratan minimum modal kerjabersih seperti yang disebutkan dalam peraturan BAPEPAM-LK No.V.D.5,yang antara lain, menentukan Modal Kerja Bersih Disesuaikan untuk Entitasefek yang beroperasi sebagai perantara perdagangan efek, manajer investasidan penjamin emisi sebesar Rp. 25.000.000.000,- atau 6,25% (enam koma duapuluh lima perseratus) dari total liabilitas tanpa utang sub-ordinasi dan utangdalam rangka penawaran umum / penawaran terbatas ditambah rankingliabilities, mana yang lebih tinggi. Untuk mengatasi risiko ini, Entitas terusmengevaluasi tingkat kebutuhan modal kerja berdasarkan peraturan danmemantau perkembangan peraturan tentang modal kerja bersih yangdisyaratkan dan mempersiapkan peningkatan batas minimum yang diperlukansesuai peraturan yang mungkin terjadi dari waktu ke waktu di masa datang.
Entitas telah memenuhi persyaratan Modal Kerja Bersih Disesuaikan padatanggal-tanggal 31 Desember 2013 dan 2012.
Entitas juga diwajibkan untuk mempunyai modal disetor di atas ketentuanyang ditetapkan oleh Keputusan Menteri Keuangan No.153/PMK.010/2010tentang kepemilikan saham dan permodalan Entitas efek.
Pada tanggal-tanggal 31 Desember 2013 dan 2012, Entitas telah memenuhipersyaratan tersebut.
The Entity manages its capital to ensure that it will be able to continue asgoing concern while maximising the return to stakeholders through theoptimisation of the debt and equity balance. In order to maintain or achievean optimal capital structure, the Entity may adjust the amount of dividendpayment, return capital to shareholders, issue new shares or buy back issuedshares, obtain new borrowings or sell assets to reduce borrowings.
The Entity is also required to maintain minimum net working capitalrequirements as imposed by BAPEPAM-LK regulation No.V.D.5, amongothers, determine the Adjusted Net Working Capital for securities entitiesthat operate as brokerage dealer, investment manager and underwriteramounting to Rp. 25,000,000,000.- or 6.25% (six point twenty five percent)of the total liabilities wihtout sub-ordinated loan and debt in generaloffering / limited plus ranking liabilities, which is higher. To address therisk, the Entity continuously evaluates the levels of regulatory capitalrequirements and monitors regulatory developments regarding net workingcapital requirements and prepare for increases in the required minimumlevels of regulatory capital that may occur from time to time in the future.
The Entity has complied with the requirement of the Adjusted Net WorkingCapital as of December 31, 2013 and 2012.
The Entity is also required to have paid-up capital with the minimumrequirement by the Ministry of Finance decision letter No.153/PMK.010/2010 concerning to shares ownership and equity of securitiescompanies.
As of December 31, 2013 and 2012, the Entity complied with suchrequirements.
Eksposur Entitas terhadap risiko harga pasar terutama muncul daricounterparty yang gagal memenuhi kewajibannya atau melalui kesalahanperdagangan dan kesalahan lainnya. Dalam transaksi perdagangan di bursa,Entitas bertindak sebagai prinsipal dan kemudian menovasi kontrak tersebutke nasabah. Kegagalan nasabah menerima perdagangan akan menyebabkanEntitas terkena risiko harga pasar.
Entitas tidak memiliki eksposur risiko konsentrasi yang signifikan untuk setiap investasi.
The Entity's exposure to market price risk primarily arises fromcounterparties who fail to fulfill their obligations or through trademismatches and other errors in exchange traded transactions, the Entityexecutes the trade as principal and then novates the contract to its client. Afailure by the client to accept the trade would result in the exposure of theEntity to market price risk.
The Entity does not have any significant concentration of risk exposure toany single counterparty.
Risiko suku bunga arus kas adalah risiko arus kas di masa datang atasinstrumen keuangan akan berfluktuasi karena perubahan suku bunga pasar.Nilai wajar risiko suku bunga adalah risiko nilai wajar instrumen keuanganakan berfluktuasi karena perubahan suku bunga pasar. Entitas dihadapkanpada berbagai risiko terkait dengan fluktuasi suku bunga pasar.
Aset dan liabilitas keuangan yang berpotensi terpengaruh risiko suku bungaterutama terdiri dari deposito berjangka, piutang dan utang marjin,perdagangan utang jatuh tempo dan pinjaman dari lembaga keuangan. Entitasmemonitor perubahan suku bunga pasar untuk memastikan suku bunga Entitassesuai dengan pasar. Entitas belum melakukan lindung nilai yang efektif untukpinjaman yang suku bunganya mengambang.
Cash flow interest rate risk is the risk that the future cash flows of afinancial instrument will fluctuate because of changes in market interestrates. Fair value interest rate risk is the risk that the fair value of a financialinstrument will fluctuate due to changes in market interest rates. TheCompany is exposed to various risks associated with fluctuations in marketinterest rates.
The financial assets and liabilities that potentially subject the Entity tointerest rate risk consist mainly of time deposits, margin debts andreceivables, overdue trade debts and borrowings from financial institutions.Changes in market interest rates are closely monitored to ensure that theEntity's interest rates are in line with the market. The Entity has not yetentered into effective hedges for borrowings with variable interest rates.
18
PT PANCA GLOBAL SECURITIES Tbk PT PANCA GLOBAL SECURITIES TbkCATATAN ATAS LAPORAN KEUANGAN NOTES TO FINANCIAL STATEMENTSUntuk Tahun Yang Berakhir Pada Tanggal-Tanggal 31 Desember 2013 dan 2012 For The Years Ended December 31, 2013 and 2012(Disajikan dalam Rupiah) (Expressed in Rupiah)
These financial statements are originally issued in Indonesian language.
5. Kebijakan dan Tujuan Manajemen Risiko Keuangan - lanjutan 5. Financial Risk Management Policies and Objectives - continued
d. Risiko Kredit d. Credit Risk
e. Risiko Likuiditas e. Liquidity Risk
Kas dan Setara Kas Cash and Cash EquivalentsDeposito Berjangka yang Dibatasi Penggunaannya Restricted Time DepositsPortofolio Efek Marketable Securities
Receivables fromPiutang Reverse Repo Reverse Repo
Receivables fromPiutang Lembaga Kliring Clearing and dan Penjaminan Guarantee InstitutionPiutang Nasabah Receivables from CostumersPendapatan Yang Masih Harus Diterima Accrued IncomesPiutang Lain-lain Other ReceivablesPenyertaan Saham Investment In SharesAset Lain-lain Other AssetsJumlah Total
Utang Lembaga Kliring Payable to Clearingdan Penjaminan Guarantee Institution
Utang Nasabah Payable to CostumersBiaya Yang Masih Harus Dibayar Accrued ExpensesUtang Lain-lain Other PayablesJumlah Total
-
1.220.000
12.505.389.081
-
Three Months
-
Tiga Bulan/
59.203.200.000 -
412.038.932
Less Than
93.699.080.155
Three Months
-
12.505.389.081
2.523.209.561
1.430.835.000
25.171.574.137
-
More Than
-
-
Jumlah/
-
-
Sampai Dengan
59.203.200.000
272.052.923-
-
-
20.523.652.784
2.111.067.397
-528.337.872 528.337.872
Three Months
1.880.000.000412.038.932
231.067.397
93.699.080.155
-
Total
-
Lebih DariSatu Tahun/
Kurang Dari
-
2.523.209.561
173.989.705.652
4.677.437.500
Less Than
Kurang Dari
21.227.674.137
15.316.657.412
1.220.000
Satu Tahun/
One Year TotalTo One Year
Tiga Bulan
4.677.437.500
-
-
3.943.900.000
1.430.835.000
272.052.923 -
21.227.674.137
Tiga Bulan/
1.880.000.000-
231.067.397
Jumlah/
-
Three Months
20.523.652.784
To One Year
-15.316.657.412
Tiga Bulan
197.328.447.186
Sampai DenganSatu Tahun/
-
Risiko kredit timbul dari risiko kegagalan dari counterparty atas liabilitaskontraktual yang mengakibatkan kerugian keuangan kepada Entitas. Entitastidak memiliki risiko konsentrasi kredit yang signifikan. Entitas memilikikebijakan untuk memastikan bahwa perdagangan dengan nasabah yangmempunyai catatan kredit yang baik. Divisi kredit menetapkan batas kreditdan tingkat jaminan untuk klien.
Eksposur risiko kredit Entitas berkaitan dengan kegiatan broker sahamterasosiasi pada posisi kontraktual nasabah yang muncul pada saatperdagangan. Dengan demikian, Entitas memerlukan jaminan untukmengurangi risiko tersebut. Jenis instrumen diterima Entitas atas jaminantersebut dapat berupa kas dan efek yang tercatat di bursa.
Credit risk arises from the risk that counterparty will default on itscontractual obligations resulting in financial loss to the Entity. The Entityhas no significant concentration of credit risk. The Entity has policies inplace to ensure that it trades with clients with appropriate credit history. Thecredit division sets trading limits and collateral levels for clients.
The Entity's exposure to credit risk relating to its stock broking activities isassociated with its clients' contractual positions that arise on trading. Assuch, the Entity requires its stock broking clients to post collaterals tomitigate such risks. The types of acceptable instruments that the Entity mayaccept from clients are cash and listed securities.
Manajemen telah membentuk kerangka kerja manajemen risiko likuiditasuntuk pengelolaan dana jangka pendek, menengah dan jangka panjang danpersyaratan manajemen likuiditas. Entitas mengelola risiko likuiditas denganmempertahankan cadangan yang memadai, fasilitas perbankan dan fasilitaspinjaman, dengan terus memantau rencana dan realisasi arus kas dengan carapencocokkan profil jatuh tempo aset dan liabilitas keuangan.
The management has established an appropriate liquidity risk managementframework for the management of the Entity's short, medium and long-termfunding and liquidity management requirements. The Entity managesliquidity risk by maintaining adequate reserves, banking facilities andreserve borrowing facilities, by continuously monitoring forecast and actualcash flows, and by matching the maturity profiles of financial assets andliabilities.
Pada tanggal 31 Desember 2013 analisis aset dan liabilitas keuangan Entitasberdasarkan jatuh tempo dari tanggal laporan posisi keuangan sampai dengantanggal jatuh tempo diungkapkan dalam tabel adalah arus kas kontraktualyang tidak didiskontokan sebagai berikut:
As of December 31, 2013 analysis of the Entity's financial assets andliabilites based on maturity groupings from the statements of financialposition date to the contractual maturity date disclosed in the table are thecontractual undiscounted cash flows as follows:
19

19
PT PANCA GLOBAL SECURITIES Tbk PT PANCA GLOBAL SECURITIES TbkCATATAN ATAS LAPORAN KEUANGAN NOTES TO FINANCIAL STATEMENTSUntuk Tahun Yang Berakhir Pada Tanggal-Tanggal 31 Desember 2013 dan 2012 For The Years Ended December 31, 2013 and 2012(Disajikan dalam Rupiah) (Expressed in Rupiah)
These financial statements are originally issued in Indonesian language.
5. Kebijakan dan Tujuan Manajemen Risiko Keuangan - lanjutan 5. Financial Risk Management Policies and Objectives - continued
a. Manajemen Dana Kelolaan a. Capital Management
b. Risiko Harga Pasar b. Market Price Risk
c. Risiko Suku Bunga c. Interest Rate Risk
Entitas mengelola modal ditujukan untuk memastikan kemampuan Entitasmelanjutkan usaha secara berkelanjutan dan memaksimumkan imbal hasilkepada pemegang saham melalui optimalisasi saldo hutang dan ekuitas. Untukmemelihara atau mencapai struktur modal yang optimal, Entitas dapatmenyesuaikan jumlah pembayaran dividen, pengurangan modal, penerbitansaham baru atau membeli kembali saham beredar, mendapatkan pinjamanbaru atau menjual aset untuk mengurangi pinjaman aman.
Entitas juga diwajibkan untuk memelihara persyaratan minimum modal kerjabersih seperti yang disebutkan dalam peraturan BAPEPAM-LK No.V.D.5,yang antara lain, menentukan Modal Kerja Bersih Disesuaikan untuk Entitasefek yang beroperasi sebagai perantara perdagangan efek, manajer investasidan penjamin emisi sebesar Rp. 25.000.000.000,- atau 6,25% (enam koma duapuluh lima perseratus) dari total liabilitas tanpa utang sub-ordinasi dan utangdalam rangka penawaran umum / penawaran terbatas ditambah rankingliabilities, mana yang lebih tinggi. Untuk mengatasi risiko ini, Entitas terusmengevaluasi tingkat kebutuhan modal kerja berdasarkan peraturan danmemantau perkembangan peraturan tentang modal kerja bersih yangdisyaratkan dan mempersiapkan peningkatan batas minimum yang diperlukansesuai peraturan yang mungkin terjadi dari waktu ke waktu di masa datang.
Entitas telah memenuhi persyaratan Modal Kerja Bersih Disesuaikan padatanggal-tanggal 31 Desember 2013 dan 2012.
Entitas juga diwajibkan untuk mempunyai modal disetor di atas ketentuanyang ditetapkan oleh Keputusan Menteri Keuangan No.153/PMK.010/2010tentang kepemilikan saham dan permodalan Entitas efek.
Pada tanggal-tanggal 31 Desember 2013 dan 2012, Entitas telah memenuhipersyaratan tersebut.
The Entity manages its capital to ensure that it will be able to continue asgoing concern while maximising the return to stakeholders through theoptimisation of the debt and equity balance. In order to maintain or achievean optimal capital structure, the Entity may adjust the amount of dividendpayment, return capital to shareholders, issue new shares or buy back issuedshares, obtain new borrowings or sell assets to reduce borrowings.
The Entity is also required to maintain minimum net working capitalrequirements as imposed by BAPEPAM-LK regulation No.V.D.5, amongothers, determine the Adjusted Net Working Capital for securities entitiesthat operate as brokerage dealer, investment manager and underwriteramounting to Rp. 25,000,000,000.- or 6.25% (six point twenty five percent)of the total liabilities wihtout sub-ordinated loan and debt in generaloffering / limited plus ranking liabilities, which is higher. To address therisk, the Entity continuously evaluates the levels of regulatory capitalrequirements and monitors regulatory developments regarding net workingcapital requirements and prepare for increases in the required minimumlevels of regulatory capital that may occur from time to time in the future.
The Entity has complied with the requirement of the Adjusted Net WorkingCapital as of December 31, 2013 and 2012.
The Entity is also required to have paid-up capital with the minimumrequirement by the Ministry of Finance decision letter No.153/PMK.010/2010 concerning to shares ownership and equity of securitiescompanies.
As of December 31, 2013 and 2012, the Entity complied with suchrequirements.
Eksposur Entitas terhadap risiko harga pasar terutama muncul daricounterparty yang gagal memenuhi kewajibannya atau melalui kesalahanperdagangan dan kesalahan lainnya. Dalam transaksi perdagangan di bursa,Entitas bertindak sebagai prinsipal dan kemudian menovasi kontrak tersebutke nasabah. Kegagalan nasabah menerima perdagangan akan menyebabkanEntitas terkena risiko harga pasar.
Entitas tidak memiliki eksposur risiko konsentrasi yang signifikan untuk setiap investasi.
The Entity's exposure to market price risk primarily arises fromcounterparties who fail to fulfill their obligations or through trademismatches and other errors in exchange traded transactions, the Entityexecutes the trade as principal and then novates the contract to its client. Afailure by the client to accept the trade would result in the exposure of theEntity to market price risk.
The Entity does not have any significant concentration of risk exposure toany single counterparty.
Risiko suku bunga arus kas adalah risiko arus kas di masa datang atasinstrumen keuangan akan berfluktuasi karena perubahan suku bunga pasar.Nilai wajar risiko suku bunga adalah risiko nilai wajar instrumen keuanganakan berfluktuasi karena perubahan suku bunga pasar. Entitas dihadapkanpada berbagai risiko terkait dengan fluktuasi suku bunga pasar.
Aset dan liabilitas keuangan yang berpotensi terpengaruh risiko suku bungaterutama terdiri dari deposito berjangka, piutang dan utang marjin,perdagangan utang jatuh tempo dan pinjaman dari lembaga keuangan. Entitasmemonitor perubahan suku bunga pasar untuk memastikan suku bunga Entitassesuai dengan pasar. Entitas belum melakukan lindung nilai yang efektif untukpinjaman yang suku bunganya mengambang.
Cash flow interest rate risk is the risk that the future cash flows of afinancial instrument will fluctuate because of changes in market interestrates. Fair value interest rate risk is the risk that the fair value of a financialinstrument will fluctuate due to changes in market interest rates. TheCompany is exposed to various risks associated with fluctuations in marketinterest rates.
The financial assets and liabilities that potentially subject the Entity tointerest rate risk consist mainly of time deposits, margin debts andreceivables, overdue trade debts and borrowings from financial institutions.Changes in market interest rates are closely monitored to ensure that theEntity's interest rates are in line with the market. The Entity has not yetentered into effective hedges for borrowings with variable interest rates.
18
PT PANCA GLOBAL SECURITIES Tbk PT PANCA GLOBAL SECURITIES TbkCATATAN ATAS LAPORAN KEUANGAN NOTES TO FINANCIAL STATEMENTSUntuk Tahun Yang Berakhir Pada Tanggal-Tanggal 31 Desember 2013 dan 2012 For The Years Ended December 31, 2013 and 2012(Disajikan dalam Rupiah) (Expressed in Rupiah)
These financial statements are originally issued in Indonesian language.
5. Kebijakan dan Tujuan Manajemen Risiko Keuangan - lanjutan 5. Financial Risk Management Policies and Objectives - continued
d. Risiko Kredit d. Credit Risk
e. Risiko Likuiditas e. Liquidity Risk
Kas dan Setara Kas Cash and Cash EquivalentsDeposito Berjangka yang Dibatasi Penggunaannya Restricted Time DepositsPortofolio Efek Marketable Securities
Receivables fromPiutang Reverse Repo Reverse Repo
Receivables fromPiutang Lembaga Kliring Clearing and dan Penjaminan Guarantee InstitutionPiutang Nasabah Receivables from CostumersPendapatan Yang Masih Harus Diterima Accrued IncomesPiutang Lain-lain Other ReceivablesPenyertaan Saham Investment In SharesAset Lain-lain Other AssetsJumlah Total
Utang Lembaga Kliring Payable to Clearingdan Penjaminan Guarantee Institution
Utang Nasabah Payable to CostumersBiaya Yang Masih Harus Dibayar Accrued ExpensesUtang Lain-lain Other PayablesJumlah Total
-
1.220.000
12.505.389.081
-
Three Months
-
Tiga Bulan/
59.203.200.000 -
412.038.932
Less Than
93.699.080.155
Three Months
-
12.505.389.081
2.523.209.561
1.430.835.000
25.171.574.137
-
More Than
-
-
Jumlah/
-
-
Sampai Dengan
59.203.200.000
272.052.923-
-
-
20.523.652.784
2.111.067.397
-528.337.872 528.337.872
Three Months
1.880.000.000412.038.932
231.067.397
93.699.080.155
-
Total
-
Lebih DariSatu Tahun/
Kurang Dari
-
2.523.209.561
173.989.705.652
4.677.437.500
Less Than
Kurang Dari
21.227.674.137
15.316.657.412
1.220.000
Satu Tahun/
One Year TotalTo One Year
Tiga Bulan
4.677.437.500
-
-
3.943.900.000
1.430.835.000
272.052.923 -
21.227.674.137
Tiga Bulan/
1.880.000.000-
231.067.397
Jumlah/
-
Three Months
20.523.652.784
To One Year
-15.316.657.412
Tiga Bulan
197.328.447.186
Sampai DenganSatu Tahun/
-
Risiko kredit timbul dari risiko kegagalan dari counterparty atas liabilitaskontraktual yang mengakibatkan kerugian keuangan kepada Entitas. Entitastidak memiliki risiko konsentrasi kredit yang signifikan. Entitas memilikikebijakan untuk memastikan bahwa perdagangan dengan nasabah yangmempunyai catatan kredit yang baik. Divisi kredit menetapkan batas kreditdan tingkat jaminan untuk klien.
Eksposur risiko kredit Entitas berkaitan dengan kegiatan broker sahamterasosiasi pada posisi kontraktual nasabah yang muncul pada saatperdagangan. Dengan demikian, Entitas memerlukan jaminan untukmengurangi risiko tersebut. Jenis instrumen diterima Entitas atas jaminantersebut dapat berupa kas dan efek yang tercatat di bursa.
Credit risk arises from the risk that counterparty will default on itscontractual obligations resulting in financial loss to the Entity. The Entityhas no significant concentration of credit risk. The Entity has policies inplace to ensure that it trades with clients with appropriate credit history. Thecredit division sets trading limits and collateral levels for clients.
The Entity's exposure to credit risk relating to its stock broking activities isassociated with its clients' contractual positions that arise on trading. Assuch, the Entity requires its stock broking clients to post collaterals tomitigate such risks. The types of acceptable instruments that the Entity mayaccept from clients are cash and listed securities.
Manajemen telah membentuk kerangka kerja manajemen risiko likuiditasuntuk pengelolaan dana jangka pendek, menengah dan jangka panjang danpersyaratan manajemen likuiditas. Entitas mengelola risiko likuiditas denganmempertahankan cadangan yang memadai, fasilitas perbankan dan fasilitaspinjaman, dengan terus memantau rencana dan realisasi arus kas dengan carapencocokkan profil jatuh tempo aset dan liabilitas keuangan.
The management has established an appropriate liquidity risk managementframework for the management of the Entity's short, medium and long-termfunding and liquidity management requirements. The Entity managesliquidity risk by maintaining adequate reserves, banking facilities andreserve borrowing facilities, by continuously monitoring forecast and actualcash flows, and by matching the maturity profiles of financial assets andliabilities.
Pada tanggal 31 Desember 2013 analisis aset dan liabilitas keuangan Entitasberdasarkan jatuh tempo dari tanggal laporan posisi keuangan sampai dengantanggal jatuh tempo diungkapkan dalam tabel adalah arus kas kontraktualyang tidak didiskontokan sebagai berikut:
As of December 31, 2013 analysis of the Entity's financial assets andliabilites based on maturity groupings from the statements of financialposition date to the contractual maturity date disclosed in the table are thecontractual undiscounted cash flows as follows:
19

20
PT PANCA GLOBAL SECURITIES Tbk PT PANCA GLOBAL SECURITIES TbkCATATAN ATAS LAPORAN KEUANGAN NOTES TO FINANCIAL STATEMENTSUntuk Tahun Yang Berakhir Pada Tanggal-Tanggal 31 Desember 2013 dan 2012 For The Years Ended December 31, 2013 and 2012(Disajikan dalam Rupiah) (Expressed in Rupiah)
These financial statements are originally issued in Indonesian language.
5. Kebijakan dan Tujuan Manajemen Risiko Keuangan - lanjutan 5. Financial Risk Management Policies and Objectives - continued
e. Risiko Likuiditas - lanjutan e. Liquidity Risk - continued
Kas dan Setara Kas Cash and Cash EquivalentsDeposito Berjangka yang Dibatasi Penggunaannya Restricted Time DepositsPortofolio Efek Marketable Securities
Receivables fromPiutang Reverse Repo Reverse Repo
Receivables fromPiutang Lembaga Kliring Clearing and dan Penjaminan Guarantee InstitutionPiutang Nasabah Receivables from CostumersPendapatan Yang Masih Harus Diterima Accrued IncomesPiutang Lain-lain Other ReceivablesPenyertaan Saham Investment In SharesAset Lain-lain Other AssetsJumlah Total
Utang Lembaga Kliring Payable to Clearingdan Penjaminan Guarantee Institution
Utang Nasabah Payable to CostumersBiaya Yang Masih Harus Dibayar Accrued ExpensesUtang Lain-lain Other PayablesJumlah Total
6. Kas dan Setara Kas 6. Cash and Cash Equivalents
Kas Cash
Bank : Bank :Rupiah RupiahPT Bank Victoria International Tbk PT Bank Victoria International TbkPT Bank Mandiri (Persero) Tbk PT Bank Mandiri (Persero) TbkPT Bank Central Asia Tbk PT Bank Central Asia TbkPT Bank Pan Indonesia Tbk PT Bank Pan Indonesia TbkPT Bank Windu Kentjana International Tbk PT Bank Windu Kentjana International Tbk
Dolar Amerika Serikat United States DollarPT Bank Central Asia Tbk PT Bank Central Asia TbkJumlah Total
- - 1.880.000.000
-
2.413.578.732
- -
7.091.042.000
Sampai DenganTiga Bulan
72.577.900.249
24.705.309
758.726.546
72.577.900.249 -
143.629.421.265 31.016.000.000
371.164.995629.840.087 -
-
Kurang Dari
-
1.241.347.500
54.996.200.000
31.016.000.000
131.920.7514.308.347.702
176.729.958.818
5.988.339
- 629.840.087
2.084.537.553
-
1.880.000.000204.537.553 204.537.553
- 7.091.042.000
54.996.200.000
371.164.995
More ThanLess Than Three Months
- -
Satu Tahun/Tiga Bulan/
-12.505.389.081
7.506.171.000
-
6.761.845.808309.300.208
- 7.506.171.0006.761.845.808 -
6.360.000
4.308.347.702Three Months One Year
2.413.578.732---
-
5.859.86327.693.736
-
2012
6.360.00014.583.677.016
835.553.121
14.583.677.016
11.592.595.904
2013
Less Than
495.272
Jumlah/
To One Year
-
Three Months
Kurang DariTiga Bulan/ Satu Tahun/
Sampai Dengan
2.575.837.356
To One Year Total
Lebih Dari
4.308.347.702Total
32.257.347.500
949.222
810.220.179
Tiga Bulan
Jumlah/Satu Tahun/
-
309.300.208
Three Months
43.191.185
Pada tanggal 31 Desember 2012 analisis aset dan liabilitas keuangan Entitasberdasarkan jatuh tempo dari tanggal laporan posisi keuangan sampai dengantanggal jatuh tempo diungkapkan dalam tabel adalah arus kas kontraktualyang tidak didiskontokan sebagai berikut:
As of December 31, 2012 analysis of the Entity's financial assets andliabilites based on maturity groupings from the statements of financialposition date to the contractual maturity date disclosed in the table are thecontractual undiscounted cash flows as follows:
20
PT PANCA GLOBAL SECURITIES Tbk PT PANCA GLOBAL SECURITIES TbkCATATAN ATAS LAPORAN KEUANGAN NOTES TO FINANCIAL STATEMENTSUntuk Tahun Yang Berakhir Pada Tanggal-Tanggal 31 Desember 2013 dan 2012 For The Years Ended December 31, 2013 and 2012(Disajikan dalam Rupiah) (Expressed in Rupiah)
These financial statements are originally issued in Indonesian language.
7. Deposito Berjangka Yang Dibatasi Penggunaanya 7. Restricted Time Deposits
8. Portofolio Efek 8. Marketable Securities
Pada Nilai Wajar Melalui Laba Rugi Fair Value through Profit or Loss- Kelompok Diperdagangkan Held for Trading -
Efek Ekuitas Equity SecuritiesPT Medco Enerdy Corporation Tbk PT Medco Enerdy Corporation TbkPT Bumi Resources Tbk PT Bumi Resources TbkPT Bakrieland Development Tbk PT Bakrieland Development TbkPT Bumi Resources Minerals Tbk PT Bumi Resources Minerals TbkPT Visi Media Asia Tbk PT Visi Media Asia TbkPT Berau Coal Energy Tbk PT Berau Coal Energy TbkPT J Resouces Asia Pasifik Tbk PT J Resouces Asia Pasifik TbkPT Energi Mega Persada Tbk PT Energi Mega Persada TbkRugi Yang Belum Direalisasi Unrealized Loss
- Efek Ditetapkan Untuk Diukur Pada Nilai Wajar Designed as Fair Value -Efek Utang Marketable SecuritiesSubordinasi Bank Panin III Tahun 2010 Subordinasi Bank Panin III Tahun 2010Laba Yang Belum Direalisasi Unrealized Gain
Clipan Finance Indonesia IIIClipan Finance Indonesia III Tahun 2011 Seri B Tahun 2011 Seri BLaba Yang Belum Direalisasi Unrealized Gain
Moderenland Realty IIModerenland Realty II Tahun 2012 Seri A Tahun 2012 Seri ALaba Yang Belum Direalisasi Unrealized GainMedium Term Notes Medium Term NotesPT Celebes Artha Ventura Seri I Tahun 2012 PT Celebes Artha Ventura Seri I Tahun 2012Laba Yang Belum Direalisasi Unrealized Gain
Jumlah Total
9. Piutang Reverse Repo 9. Receivable from Reverse Repo
Rincian Piutang Reverse Repo Details Receivable from Reverse Repo are as follows:
PT Modernland Realty TbkPT Modernland Realty TbkPT Steel Pipe Industry of Indonesia Tbk
PT Modernland Realty TbkPT Bukit Uluwatu Villa TbkPT Pan Brothers TbkPT Pembangunan Jaya Ancol TbkPT Bank Permata Tbk
259.933.668 2.840.364.181 140.364.181 5.259.933.668
1.985.423.955 2.209.172.140
6.000.000 03-Okt-12 03-Jan-13 2.700.000.000 3.000.000 03-Okt-12 03-Jan-13 2.100.000.000 109.172.140
56.981.623.955
Selisih Nilai Beli dengan Nilai Jual
Kembali/ Tanggal Jatuh
Tempo/ Transaction date
Nilai Beli/ Nilai Jual Kembali/ Maturity date Acquisition Cost Relase Value
Relase Value Nilai Jual Kembali/
-
16.000.000
Tanggal Transaksi/ Tanggal Jatuh
Tempo/ Transaction date Maturity date Total Shares
Jumlah Saham/
364.500.000
-
2012
520.000.000
-
797.500.370
2013
1.548.163.1931.616.534.972
25.000.000
185.720.000 03-Jan-1344.800.000
Total Shares
Tanggal Transaksi/ Jumlah
Saham/
03-Okt-12
80.000.000 30-Des-1330-Des-1330-Des-1383.400.000
58.000.000
376.875.000370.000.000
-
28-Mar-14
2013
Capital Gain
Selisih Nilai Beli dengan Nilai Jual
Kembali/Acquisition Cost
38.476.200.000
234.854.400 28-Mar-14
03-Okt-12
28-Mar-14
03-Jan-13
23.200.000.000
32.257.347.50025.171.574.137
-
862.606.292
-
4.661.850
298.750.000
32.000.000.000
Nilai Beli/
5.000.000.000-
03-Okt-12 03-Jan-13
(491.570.451)
-
520.000.000
(1.649.673.535)
51.561.659
54.996.200.000
6.720.000.000
5.000.000.000
5.000.000.00011.000.000.000
-
5.000.000.000
20.000.000.000
-
17.249.950
1.000.000.000
205.762.337
39.602.803.117 7.069.350.849
1.645.190.123 1.192.762.840
4.238.054.400
33.645.190.123 24.392.762.840
2012
4.003.200.000 3.072.807.363 62.276.007.363 59.203.200.000
Capital Gain
1.126.603.117 349.350.849
5.000.000.000
Akun ini merupakan deposito berjangka pada PT Kliring Penjaminan EfekIndonesia ("KPEI") Tbk yang digunakan sebagai jaminan penyelesaian transaksiharian Kepada PT Kliring Penjaminan Efek Indonesia ("KPEI") sehubungandengan perdagangan efek melalui BEI, dengan tingkat bunga per tahun sebesar6,50% dan 5,25% per 31 Desember 2013 dan 2012.
This account represents time deposits on PT Kliring Penjaminan EfekIndonesia (“KPEI”) Tbk which were used as collateral for settlement of dailytransaction to PT Kliring Penjaminan Efek Indonesia (“KPEI”) in relation tosecurities trading through BEI, with interest rate at 6,50% and 5,25% as ofDecember 31, 2013 and 2012.
21
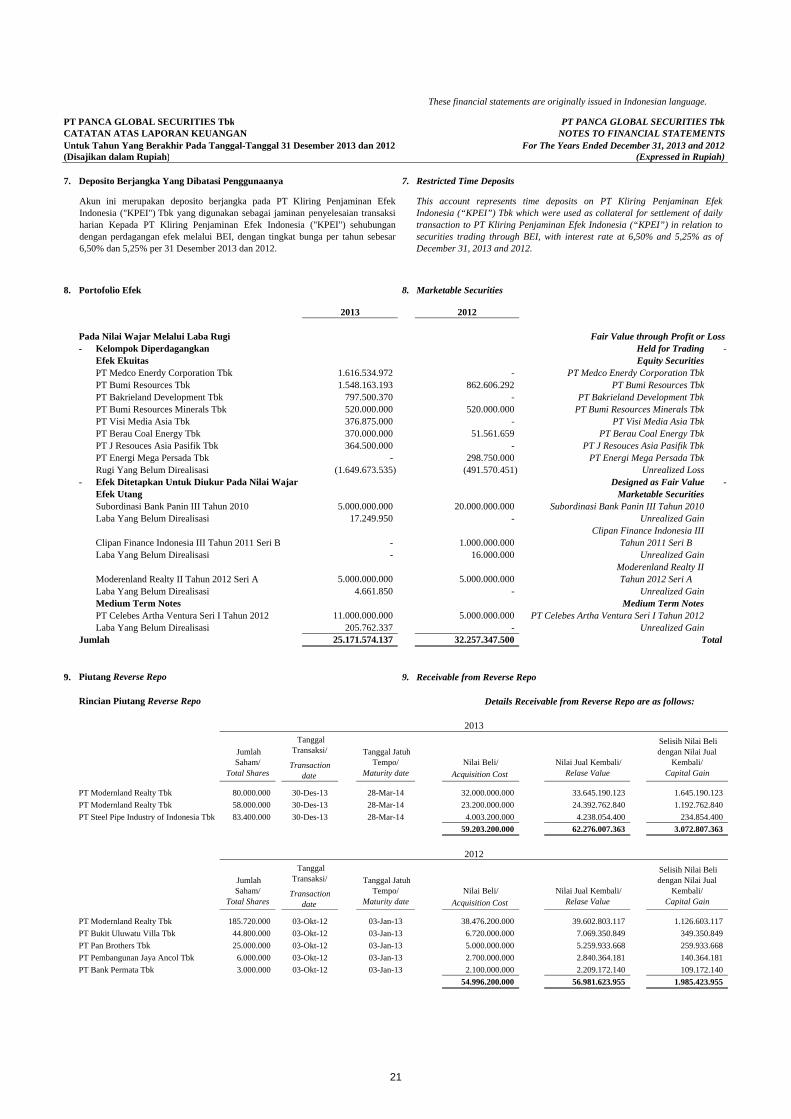
21
PT PANCA GLOBAL SECURITIES Tbk PT PANCA GLOBAL SECURITIES TbkCATATAN ATAS LAPORAN KEUANGAN NOTES TO FINANCIAL STATEMENTSUntuk Tahun Yang Berakhir Pada Tanggal-Tanggal 31 Desember 2013 dan 2012 For The Years Ended December 31, 2013 and 2012(Disajikan dalam Rupiah) (Expressed in Rupiah)
These financial statements are originally issued in Indonesian language.
5. Kebijakan dan Tujuan Manajemen Risiko Keuangan - lanjutan 5. Financial Risk Management Policies and Objectives - continued
e. Risiko Likuiditas - lanjutan e. Liquidity Risk - continued
Kas dan Setara Kas Cash and Cash EquivalentsDeposito Berjangka yang Dibatasi Penggunaannya Restricted Time DepositsPortofolio Efek Marketable Securities
Receivables fromPiutang Reverse Repo Reverse Repo
Receivables fromPiutang Lembaga Kliring Clearing and dan Penjaminan Guarantee InstitutionPiutang Nasabah Receivables from CostumersPendapatan Yang Masih Harus Diterima Accrued IncomesPiutang Lain-lain Other ReceivablesPenyertaan Saham Investment In SharesAset Lain-lain Other AssetsJumlah Total
Utang Lembaga Kliring Payable to Clearingdan Penjaminan Guarantee Institution
Utang Nasabah Payable to CostumersBiaya Yang Masih Harus Dibayar Accrued ExpensesUtang Lain-lain Other PayablesJumlah Total
6. Kas dan Setara Kas 6. Cash and Cash Equivalents
Kas Cash
Bank : Bank :Rupiah RupiahPT Bank Victoria International Tbk PT Bank Victoria International TbkPT Bank Mandiri (Persero) Tbk PT Bank Mandiri (Persero) TbkPT Bank Central Asia Tbk PT Bank Central Asia TbkPT Bank Pan Indonesia Tbk PT Bank Pan Indonesia TbkPT Bank Windu Kentjana International Tbk PT Bank Windu Kentjana International Tbk
Dolar Amerika Serikat United States DollarPT Bank Central Asia Tbk PT Bank Central Asia TbkJumlah Total
- - 1.880.000.000
-
2.413.578.732
- -
7.091.042.000
Sampai DenganTiga Bulan
72.577.900.249
24.705.309
758.726.546
72.577.900.249 -
143.629.421.265 31.016.000.000
371.164.995629.840.087 -
-
Kurang Dari
-
1.241.347.500
54.996.200.000
31.016.000.000
131.920.7514.308.347.702
176.729.958.818
5.988.339
- 629.840.087
2.084.537.553
-
1.880.000.000204.537.553 204.537.553
- 7.091.042.000
54.996.200.000
371.164.995
More ThanLess Than Three Months
- -
Satu Tahun/Tiga Bulan/
-12.505.389.081
7.506.171.000
-
6.761.845.808309.300.208
- 7.506.171.0006.761.845.808 -
6.360.000
4.308.347.702Three Months One Year
2.413.578.732---
-
5.859.86327.693.736
-
2012
6.360.00014.583.677.016
835.553.121
14.583.677.016
11.592.595.904
2013
Less Than
495.272
Jumlah/
To One Year
-
Three Months
Kurang DariTiga Bulan/ Satu Tahun/
Sampai Dengan
2.575.837.356
To One Year Total
Lebih Dari
4.308.347.702Total
32.257.347.500
949.222
810.220.179
Tiga Bulan
Jumlah/Satu Tahun/
-
309.300.208
Three Months
43.191.185
Pada tanggal 31 Desember 2012 analisis aset dan liabilitas keuangan Entitasberdasarkan jatuh tempo dari tanggal laporan posisi keuangan sampai dengantanggal jatuh tempo diungkapkan dalam tabel adalah arus kas kontraktualyang tidak didiskontokan sebagai berikut:
As of December 31, 2012 analysis of the Entity's financial assets andliabilites based on maturity groupings from the statements of financialposition date to the contractual maturity date disclosed in the table are thecontractual undiscounted cash flows as follows:
20
PT PANCA GLOBAL SECURITIES Tbk PT PANCA GLOBAL SECURITIES TbkCATATAN ATAS LAPORAN KEUANGAN NOTES TO FINANCIAL STATEMENTSUntuk Tahun Yang Berakhir Pada Tanggal-Tanggal 31 Desember 2013 dan 2012 For The Years Ended December 31, 2013 and 2012(Disajikan dalam Rupiah) (Expressed in Rupiah)
These financial statements are originally issued in Indonesian language.
7. Deposito Berjangka Yang Dibatasi Penggunaanya 7. Restricted Time Deposits
8. Portofolio Efek 8. Marketable Securities
Pada Nilai Wajar Melalui Laba Rugi Fair Value through Profit or Loss- Kelompok Diperdagangkan Held for Trading -
Efek Ekuitas Equity SecuritiesPT Medco Enerdy Corporation Tbk PT Medco Enerdy Corporation TbkPT Bumi Resources Tbk PT Bumi Resources TbkPT Bakrieland Development Tbk PT Bakrieland Development TbkPT Bumi Resources Minerals Tbk PT Bumi Resources Minerals TbkPT Visi Media Asia Tbk PT Visi Media Asia TbkPT Berau Coal Energy Tbk PT Berau Coal Energy TbkPT J Resouces Asia Pasifik Tbk PT J Resouces Asia Pasifik TbkPT Energi Mega Persada Tbk PT Energi Mega Persada TbkRugi Yang Belum Direalisasi Unrealized Loss
- Efek Ditetapkan Untuk Diukur Pada Nilai Wajar Designed as Fair Value -Efek Utang Marketable SecuritiesSubordinasi Bank Panin III Tahun 2010 Subordinasi Bank Panin III Tahun 2010Laba Yang Belum Direalisasi Unrealized Gain
Clipan Finance Indonesia IIIClipan Finance Indonesia III Tahun 2011 Seri B Tahun 2011 Seri BLaba Yang Belum Direalisasi Unrealized Gain
Moderenland Realty IIModerenland Realty II Tahun 2012 Seri A Tahun 2012 Seri ALaba Yang Belum Direalisasi Unrealized GainMedium Term Notes Medium Term NotesPT Celebes Artha Ventura Seri I Tahun 2012 PT Celebes Artha Ventura Seri I Tahun 2012Laba Yang Belum Direalisasi Unrealized Gain
Jumlah Total
9. Piutang Reverse Repo 9. Receivable from Reverse Repo
Rincian Piutang Reverse Repo Details Receivable from Reverse Repo are as follows:
PT Modernland Realty TbkPT Modernland Realty TbkPT Steel Pipe Industry of Indonesia Tbk
PT Modernland Realty TbkPT Bukit Uluwatu Villa TbkPT Pan Brothers TbkPT Pembangunan Jaya Ancol TbkPT Bank Permata Tbk
259.933.668 2.840.364.181 140.364.181 5.259.933.668
1.985.423.955 2.209.172.140
6.000.000 03-Okt-12 03-Jan-13 2.700.000.000 3.000.000 03-Okt-12 03-Jan-13 2.100.000.000 109.172.140
56.981.623.955
Selisih Nilai Beli dengan Nilai Jual
Kembali/ Tanggal Jatuh
Tempo/ Transaction date
Nilai Beli/ Nilai Jual Kembali/ Maturity date Acquisition Cost Relase Value
Relase Value Nilai Jual Kembali/
-
16.000.000
Tanggal Transaksi/ Tanggal Jatuh
Tempo/ Transaction date Maturity date Total Shares
Jumlah Saham/
364.500.000
-
2012
520.000.000
-
797.500.370
2013
1.548.163.1931.616.534.972
25.000.000
185.720.000 03-Jan-1344.800.000
Total Shares
Tanggal Transaksi/ Jumlah
Saham/
03-Okt-12
80.000.000 30-Des-1330-Des-1330-Des-1383.400.000
58.000.000
376.875.000370.000.000
-
28-Mar-14
2013
Capital Gain
Selisih Nilai Beli dengan Nilai Jual
Kembali/Acquisition Cost
38.476.200.000
234.854.400 28-Mar-14
03-Okt-12
28-Mar-14
03-Jan-13
23.200.000.000
32.257.347.50025.171.574.137
-
862.606.292
-
4.661.850
298.750.000
32.000.000.000
Nilai Beli/
5.000.000.000-
03-Okt-12 03-Jan-13
(491.570.451)
-
520.000.000
(1.649.673.535)
51.561.659
54.996.200.000
6.720.000.000
5.000.000.000
5.000.000.00011.000.000.000
-
5.000.000.000
20.000.000.000
-
17.249.950
1.000.000.000
205.762.337
39.602.803.117 7.069.350.849
1.645.190.123 1.192.762.840
4.238.054.400
33.645.190.123 24.392.762.840
2012
4.003.200.000 3.072.807.363 62.276.007.363 59.203.200.000
Capital Gain
1.126.603.117 349.350.849
5.000.000.000
Akun ini merupakan deposito berjangka pada PT Kliring Penjaminan EfekIndonesia ("KPEI") Tbk yang digunakan sebagai jaminan penyelesaian transaksiharian Kepada PT Kliring Penjaminan Efek Indonesia ("KPEI") sehubungandengan perdagangan efek melalui BEI, dengan tingkat bunga per tahun sebesar6,50% dan 5,25% per 31 Desember 2013 dan 2012.
This account represents time deposits on PT Kliring Penjaminan EfekIndonesia (“KPEI”) Tbk which were used as collateral for settlement of dailytransaction to PT Kliring Penjaminan Efek Indonesia (“KPEI”) in relation tosecurities trading through BEI, with interest rate at 6,50% and 5,25% as ofDecember 31, 2013 and 2012.
21

22
PT PANCA GLOBAL SECURITIES Tbk PT PANCA GLOBAL SECURITIES TbkCATATAN ATAS LAPORAN KEUANGAN NOTES TO FINANCIAL STATEMENTSUntuk Tahun Yang Berakhir Pada Tanggal-Tanggal 31 Desember 2013 dan 2012 For The Years Ended December 31, 2013 and 2012(Disajikan dalam Rupiah) (Expressed in Rupiah)
These financial statements are originally issued in Indonesian language.
10. Piutang Lembaga Kliring dan Penjaminan 10. Receivable from Clearing Fund and Guarantee Institution
11. Piutang Nasabah 11. Receivables from Customers
Pihak Berelasi Related PartySaldo masing-masing lebih atau Each more than or sama dengan 5% dari jumlah equal to 5% of total
Saldo masing-masing kurang dari 5% dari jumlah Each below 5% of total
Sub-Jumlah Sub-Total
Pihak Ketiga Third PartySaldo masing-masing lebih atau Each more than or sama dengan 5% dari jumlah equal to 5% of total
Saldo masing-masing kurang dari 5% dari jumlah Each below 5% of total
Sub-Jumlah Sub-Total
Jumlah Total
Piutang berdasarkan jenis fasilitas: Receivables classified by type of facility:Regular RegularMarjin MarginJumlah Total
12. Piutang Perusahaan Efek 12. Receivables from Brokers
Akun ini terdiri dari : This account consists of :PT Reliance Securities Tbk PT Reliance Securities TbkPT Yulie Sekurindo Tbk PT Yulie Sekurindo TbkJumlah Total
13. Piutang Lain-lain 13. Other Receivables
Akun ini terdiri dari : This account consists of :Pihak Berelasi Related PartyJumlah Total
1.407.970.623
629.840.087629.840.087
93.699.080.155
25.000.000
19.025.080.520
-
-
626.007.634626.007.634
72.577.900.249
72.577.900.249
5.071.102.93667.506.797.313
-
26.317.947
2.500.000
31.126.451.36192.291.109.532
93.699.080.155
2013
1.221.744.243
1.381.652.676
2013 2012
27.500.000 -
412.038.932
2012
61.164.658.171 52.926.812.095
2013
71.951.892.615
2013 2012
2012
412.038.932
92.477.335.912
Akun ini merupakan tagihan Entitas kepada pihak PT Kliring Penjaminan EfekIndonesia sebesar Rp. 13.360.022.500,- dan Rp. 7.091.042.000,-per 31 Desember2013 dan 2012, akibat dari perhitungan penyelesaian transaksi jual efek yangdilakukan Entitas.
Akun ini merupakan piutang terhadap nasabah atas transaksi beli efek yangdilakukan melalui Entitas. Perinciannya sebagai berikut :
This accounts represents receivable from customers as a result of securitiesbuy transactions through the Entity. The detail are as follows :
This account represents receivables from PT Kliring Penjaminan EfekIndonesia of Rp. 13,360,022,500,- and Rp. 7,091,042,000,- as of December 31,2013 and 2012, arising from settlement of securities sale transactions done bythe Entity.
Akun ini merupakan piutang kepada Direksi dan Karyawan. Piutang tersebutdikompensasi dengan penghasilan yang diterima Direksi dan Karyawan tersebutsetiap bulannya. Piutang tersebut dikenakan bunga 5% per tahun.
This account represents receivables from Director and Employee. Thesereceivables are compensated with their salaries every month and chargedinterest at 5% per annum.
Entitas tidak membentuk penyisihan piutang ragu-ragu karena pihak manajemenberkeyakinan bahwa piutang nasabah dapat tertagih.
The Entity did not provide an allowance for doubtful accounts, as managementbelieves that receivables from customers are fully collectible.
22
PT PANCA GLOBAL SECURITIES Tbk PT PANCA GLOBAL SECURITIES TbkCATATAN ATAS LAPORAN KEUANGAN NOTES TO FINANCIAL STATEMENTSUntuk Tahun Yang Berakhir Pada Tanggal-Tanggal 31 Desember 2013 dan 2012 For The Years Ended December 31, 2013 and 2012(Disajikan dalam Rupiah) (Expressed in Rupiah)
These financial statements are originally issued in Indonesian language.
14. Pendapatan Yang Masih Harus Diterima 14. Accrued Incomes
Akun ini terdiri dari : This account consists of :Bunga Obligasi Bond InterestsBunga Medium Term Notes Medium Term Notes InterestAgen Penjualan Selling AgentBunga Deposito Berjangka Time Deposit InterestJumlah Total
15. Biaya Dibayar Di Muka 15. Prepaid Expenses
Akun ini terdiri dari : This account consists of :Sewa Kantor Office RentBAE dan SRO BAE and SROLain-lain OthersJumlah Total
16. Penyertaan Saham 16. Investments in Shares
PT PG Asset Management *) PT PG Asset Management *)PT Bursa Efek Indonesia **) PT Bursa Efek Indonesia **)PT Pefindo ***) PT Pefindo***)Jumlah Total
*) *)
**) **)
***) ***)
17. Aset Tetap 17. Fixed Assets
Harga Perolehan : Cost :Kepemilikan Langsung Direct OwnershipKendaraan VehiclesPerlengkapan Kantor Office EquipmentsKomputer ComputersPerabot Kantor FurnituresJumlah Total
Akumulasi Penyusutan : Accumulated Depreciation :Kepemilikan Langsung Direct OwnershipKendaraan VehiclesPerlengkapan Kantor Office EquipmentsKomputer ComputersPerabot Kantor FurnituresJumlah TotalNilai Buku Net Book Value
2013
Ending Balance
787.356.150
522.485.642
40.200.648
Deductions
776.758.068
952.734.923
375.144.507
867.500.000
867.500.000
2.868.636.316
7.857.221.064
2.904.955.302
Saldo Akhir/
371.164.9958.609.533
26.883.610
2.840.284.402371.890.280
787.356.157867.500.000 6.904.486.141
-
-
-
272.052.923
1.042.318.182
625.000.0005.000.000
3.826.084.091
4.083.350
-
90.447.385
2012
38.486.26016.592.466
2012
2012
10.598.089
Pengurangan/
-
-
-
867.500.000
608.901.513
11.143.599
109.222.613
32.298.630
4.083.362
2013
36.070.000
12.494.589
1.078.388.182
16.144.711
7.123.847.240
2.832.566.316787.356.150
7.646.332.882
2.824.139.691359.395.691
3.163.553.789
375.144.507
Saldo Awal/Additions
3.651.265.909
Beginning BalancePenambahan/
-
1.250.000.000
141.848.25628.542.281
1.880.000.0001.880.000.0005.000.000
1.250.000.000
2013
625.000.000
134.731.383
2013
201.727.084 307.476.736
648.138.902
Akun ini merupakan penyertaan 1 lembar saham pada PT Bursa EfekIndonesia yang merupakan persyaratan sebagai anggota bursa dan dicatatsebesar harga perolehan.
Akun ini merupakan penyertaan 5 lembar saham pada PT Pefindo dengannilai nominal Rp. 1.000.000,- per lembar.
This account represents an investment of 1 share at PT Bursa EfekIndonesia (IDX), which is an requirement as a member of the stockexchange and stated at cost.
This account represents an investment of 5 shares at PT Pefindo withpar value of Rp. 1,000,000,- per share.
Akun ini merupakan penyertaan 1.250.000 lembar saham pada PT PG AssetManagement dengan nilai nominal Rp. 1.000,- per lembar atau setara 5%dari modal disetor.
This account represents investment of 1,250,000 shares at PT PG AssetManagement with par value of Rp. 1,000,- per share or equivalent to5% from paid up capital.
23

23
PT PANCA GLOBAL SECURITIES Tbk PT PANCA GLOBAL SECURITIES TbkCATATAN ATAS LAPORAN KEUANGAN NOTES TO FINANCIAL STATEMENTSUntuk Tahun Yang Berakhir Pada Tanggal-Tanggal 31 Desember 2013 dan 2012 For The Years Ended December 31, 2013 and 2012(Disajikan dalam Rupiah) (Expressed in Rupiah)
These financial statements are originally issued in Indonesian language.
10. Piutang Lembaga Kliring dan Penjaminan 10. Receivable from Clearing Fund and Guarantee Institution
11. Piutang Nasabah 11. Receivables from Customers
Pihak Berelasi Related PartySaldo masing-masing lebih atau Each more than or sama dengan 5% dari jumlah equal to 5% of total
Saldo masing-masing kurang dari 5% dari jumlah Each below 5% of total
Sub-Jumlah Sub-Total
Pihak Ketiga Third PartySaldo masing-masing lebih atau Each more than or sama dengan 5% dari jumlah equal to 5% of total
Saldo masing-masing kurang dari 5% dari jumlah Each below 5% of total
Sub-Jumlah Sub-Total
Jumlah Total
Piutang berdasarkan jenis fasilitas: Receivables classified by type of facility:Regular RegularMarjin MarginJumlah Total
12. Piutang Perusahaan Efek 12. Receivables from Brokers
Akun ini terdiri dari : This account consists of :PT Reliance Securities Tbk PT Reliance Securities TbkPT Yulie Sekurindo Tbk PT Yulie Sekurindo TbkJumlah Total
13. Piutang Lain-lain 13. Other Receivables
Akun ini terdiri dari : This account consists of :Pihak Berelasi Related PartyJumlah Total
1.407.970.623
629.840.087629.840.087
93.699.080.155
25.000.000
19.025.080.520
-
-
626.007.634626.007.634
72.577.900.249
72.577.900.249
5.071.102.93667.506.797.313
-
26.317.947
2.500.000
31.126.451.36192.291.109.532
93.699.080.155
2013
1.221.744.243
1.381.652.676
2013 2012
27.500.000 -
412.038.932
2012
61.164.658.171 52.926.812.095
2013
71.951.892.615
2013 2012
2012
412.038.932
92.477.335.912
Akun ini merupakan tagihan Entitas kepada pihak PT Kliring Penjaminan EfekIndonesia sebesar Rp. 13.360.022.500,- dan Rp. 7.091.042.000,-per 31 Desember2013 dan 2012, akibat dari perhitungan penyelesaian transaksi jual efek yangdilakukan Entitas.
Akun ini merupakan piutang terhadap nasabah atas transaksi beli efek yangdilakukan melalui Entitas. Perinciannya sebagai berikut :
This accounts represents receivable from customers as a result of securitiesbuy transactions through the Entity. The detail are as follows :
This account represents receivables from PT Kliring Penjaminan EfekIndonesia of Rp. 13,360,022,500,- and Rp. 7,091,042,000,- as of December 31,2013 and 2012, arising from settlement of securities sale transactions done bythe Entity.
Akun ini merupakan piutang kepada Direksi dan Karyawan. Piutang tersebutdikompensasi dengan penghasilan yang diterima Direksi dan Karyawan tersebutsetiap bulannya. Piutang tersebut dikenakan bunga 5% per tahun.
This account represents receivables from Director and Employee. Thesereceivables are compensated with their salaries every month and chargedinterest at 5% per annum.
Entitas tidak membentuk penyisihan piutang ragu-ragu karena pihak manajemenberkeyakinan bahwa piutang nasabah dapat tertagih.
The Entity did not provide an allowance for doubtful accounts, as managementbelieves that receivables from customers are fully collectible.
22
PT PANCA GLOBAL SECURITIES Tbk PT PANCA GLOBAL SECURITIES TbkCATATAN ATAS LAPORAN KEUANGAN NOTES TO FINANCIAL STATEMENTSUntuk Tahun Yang Berakhir Pada Tanggal-Tanggal 31 Desember 2013 dan 2012 For The Years Ended December 31, 2013 and 2012(Disajikan dalam Rupiah) (Expressed in Rupiah)
These financial statements are originally issued in Indonesian language.
14. Pendapatan Yang Masih Harus Diterima 14. Accrued Incomes
Akun ini terdiri dari : This account consists of :Bunga Obligasi Bond InterestsBunga Medium Term Notes Medium Term Notes InterestAgen Penjualan Selling AgentBunga Deposito Berjangka Time Deposit InterestJumlah Total
15. Biaya Dibayar Di Muka 15. Prepaid Expenses
Akun ini terdiri dari : This account consists of :Sewa Kantor Office RentBAE dan SRO BAE and SROLain-lain OthersJumlah Total
16. Penyertaan Saham 16. Investments in Shares
PT PG Asset Management *) PT PG Asset Management *)PT Bursa Efek Indonesia **) PT Bursa Efek Indonesia **)PT Pefindo ***) PT Pefindo***)Jumlah Total
*) *)
**) **)
***) ***)
17. Aset Tetap 17. Fixed Assets
Harga Perolehan : Cost :Kepemilikan Langsung Direct OwnershipKendaraan VehiclesPerlengkapan Kantor Office EquipmentsKomputer ComputersPerabot Kantor FurnituresJumlah Total
Akumulasi Penyusutan : Accumulated Depreciation :Kepemilikan Langsung Direct OwnershipKendaraan VehiclesPerlengkapan Kantor Office EquipmentsKomputer ComputersPerabot Kantor FurnituresJumlah TotalNilai Buku Net Book Value
2013
Ending Balance
787.356.150
522.485.642
40.200.648
Deductions
776.758.068
952.734.923
375.144.507
867.500.000
867.500.000
2.868.636.316
7.857.221.064
2.904.955.302
Saldo Akhir/
371.164.9958.609.533
26.883.610
2.840.284.402371.890.280
787.356.157867.500.000 6.904.486.141
-
-
-
272.052.923
1.042.318.182
625.000.0005.000.000
3.826.084.091
4.083.350
-
90.447.385
2012
38.486.26016.592.466
2012
2012
10.598.089
Pengurangan/
-
-
-
867.500.000
608.901.513
11.143.599
109.222.613
32.298.630
4.083.362
2013
36.070.000
12.494.589
1.078.388.182
16.144.711
7.123.847.240
2.832.566.316787.356.150
7.646.332.882
2.824.139.691359.395.691
3.163.553.789
375.144.507
Saldo Awal/Additions
3.651.265.909
Beginning BalancePenambahan/
-
1.250.000.000
141.848.25628.542.281
1.880.000.0001.880.000.0005.000.000
1.250.000.000
2013
625.000.000
134.731.383
2013
201.727.084 307.476.736
648.138.902
Akun ini merupakan penyertaan 1 lembar saham pada PT Bursa EfekIndonesia yang merupakan persyaratan sebagai anggota bursa dan dicatatsebesar harga perolehan.
Akun ini merupakan penyertaan 5 lembar saham pada PT Pefindo dengannilai nominal Rp. 1.000.000,- per lembar.
This account represents an investment of 1 share at PT Bursa EfekIndonesia (IDX), which is an requirement as a member of the stockexchange and stated at cost.
This account represents an investment of 5 shares at PT Pefindo withpar value of Rp. 1,000,000,- per share.
Akun ini merupakan penyertaan 1.250.000 lembar saham pada PT PG AssetManagement dengan nilai nominal Rp. 1.000,- per lembar atau setara 5%dari modal disetor.
This account represents investment of 1,250,000 shares at PT PG AssetManagement with par value of Rp. 1,000,- per share or equivalent to5% from paid up capital.
23
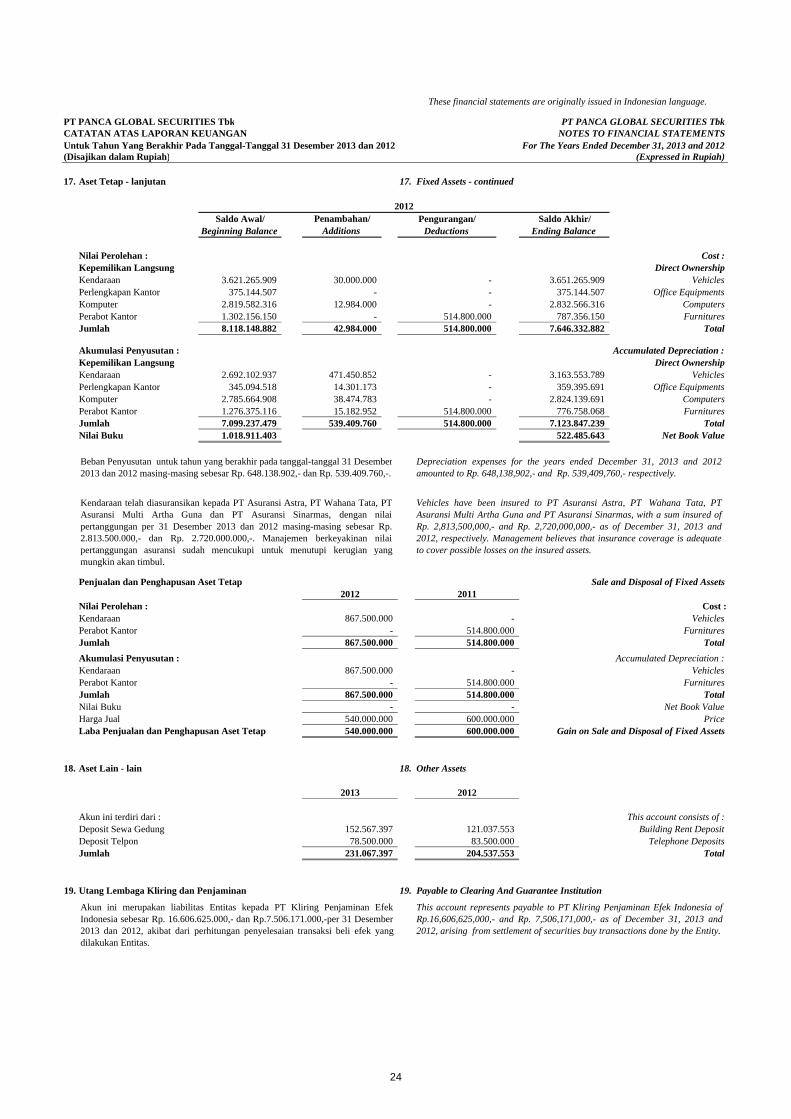
24
PT PANCA GLOBAL SECURITIES Tbk PT PANCA GLOBAL SECURITIES TbkCATATAN ATAS LAPORAN KEUANGAN NOTES TO FINANCIAL STATEMENTSUntuk Tahun Yang Berakhir Pada Tanggal-Tanggal 31 Desember 2013 dan 2012 For The Years Ended December 31, 2013 and 2012(Disajikan dalam Rupiah) (Expressed in Rupiah)
These financial statements are originally issued in Indonesian language.
17. Aset Tetap - lanjutan 17. Fixed Assets - continued
Nilai Perolehan : Cost :Kepemilikan Langsung Direct OwnershipKendaraan VehiclesPerlengkapan Kantor Office EquipmentsKomputer ComputersPerabot Kantor FurnituresJumlah Total
Akumulasi Penyusutan : Accumulated Depreciation :Kepemilikan Langsung Direct OwnershipKendaraan VehiclesPerlengkapan Kantor Office EquipmentsKomputer ComputersPerabot Kantor FurnituresJumlah TotalNilai Buku Net Book Value
Penjualan dan Penghapusan Aset Tetap Sale and Disposal of Fixed Assets
Nilai Perolehan : Cost :Kendaraan VehiclesPerabot Kantor FurnituresJumlah TotalAkumulasi Penyusutan : Accumulated Depreciation :Kendaraan VehiclesPerabot Kantor FurnituresJumlah TotalNilai Buku Net Book ValueHarga Jual PriceLaba Penjualan dan Penghapusan Aset Tetap Gain on Sale and Disposal of Fixed Assets
18. Aset Lain - lain 18. Other Assets
Akun ini terdiri dari : This account consists of :Deposit Sewa Gedung Building Rent DepositDeposit Telpon Telephone DepositsJumlah Total
19. Utang Lembaga Kliring dan Penjaminan 19. Payable to Clearing And Guarantee Institution
78.500.000231.067.397
2013
152.567.397 121.037.553
-
2012
600.000.000600.000.000
514.800.000514.800.000
-
514.800.000
2011
-
1.018.911.403
30.000.000
2.692.102.937
3.621.265.909375.144.507 -
-
-
-
Pengurangan/
2.785.664.908
-
7.646.332.882
83.500.000204.537.553
522.485.643514.800.000
-
776.758.0682.824.139.691
7.123.847.239
787.356.150
359.395.6913.163.553.789
3.651.265.909375.144.507
Ending BalanceSaldo Akhir/
540.000.000
-12.984.000
-
514.800.000
514.800.000
Deductions
514.800.000
540.000.000
-
-
867.500.000
539.409.760
867.500.000-
471.450.85214.301.173
Penambahan/
867.500.000
2012
7.099.237.479
1.302.156.150
1.276.375.116
345.094.518
2.832.566.316
Beginning Balance
8.118.148.882 42.984.000
2.819.582.316
AdditionsSaldo Awal/
867.500.000
38.474.78315.182.952
2012
514.800.000
Akun ini merupakan liabilitas Entitas kepada PT Kliring Penjaminan EfekIndonesia sebesar Rp. 16.606.625.000,- dan Rp.7.506.171.000,-per 31 Desember2013 dan 2012, akibat dari perhitungan penyelesaian transaksi beli efek yangdilakukan Entitas.
This account represents payable to PT Kliring Penjaminan Efek Indonesia ofRp.16,606,625,000,- and Rp. 7,506,171,000,- as of December 31, 2013 and2012, arising from settlement of securities buy transactions done by the Entity.
Beban Penyusutan untuk tahun yang berakhir pada tanggal-tanggal 31 Desember2013 dan 2012 masing-masing sebesar Rp. 648.138.902,- dan Rp. 539.409.760,-.
Depreciation expenses for the years ended December 31, 2013 and 2012amounted to Rp. 648,138,902,- and Rp. 539,409,760,- respectively.
Kendaraan telah diasuransikan kepada PT Asuransi Astra, PT Wahana Tata, PTAsuransi Multi Artha Guna dan PT Asuransi Sinarmas, dengan nilaipertanggungan per 31 Desember 2013 dan 2012 masing-masing sebesar Rp.2.813.500.000,- dan Rp. 2.720.000.000,-. Manajemen berkeyakinan nilaipertanggungan asuransi sudah mencukupi untuk menutupi kerugian yangmungkin akan timbul.
Vehicles have been insured to PT Asuransi Astra, PT Wahana Tata, PTAsuransi Multi Artha Guna and PT Asuransi Sinarmas, with a sum insured ofRp. 2,813,500,000,- and Rp. 2,720,000,000,- as of December 31, 2013 and2012, respectively. Management believes that insurance coverage is adequateto cover possible losses on the insured assets.
24
PT PANCA GLOBAL SECURITIES Tbk PT PANCA GLOBAL SECURITIES TbkCATATAN ATAS LAPORAN KEUANGAN NOTES TO FINANCIAL STATEMENTSUntuk Tahun Yang Berakhir Pada Tanggal-Tanggal 31 Desember 2013 dan 2012 For The Years Ended December 31, 2013 and 2012(Disajikan dalam Rupiah) (Expressed in Rupiah)
These financial statements are originally issued in Indonesian language.
20. Utang Nasabah 20. Payable to Customers
Pihak Berelasi Related PartySaldo masing-masing lebih atau Each more than or sama dengan 5% dari jumlah equal to 5% of total
Saldo masing-masing kurang dari 5% dari jumlah Each below 5% of total
Sub-Jumlah Sub-Total
Pihak Ketiga Third PartySaldo masing-masing lebih atau Each more than or sama dengan 5% dari jumlah equal to 5% of total
Saldo masing-masing kurang dari 5% dari jumlah Each below 5% of total
Sub-Jumlah Sub-Total
Jumlah
Utang berdasarkan jenis fasilitas: Payables classified by type of facility:Regular RegularMarjin MarginJumlah Total
21. Biaya Yang Masih Harus Dibayar 21. Accrued Expenses
Akun ini terdiri dari : This account consists of :Pajak Penghasilan Atas Penjualan Saham Income Tax on Securities TradingBeban Transaksi Transaction ExpensesBeban Gaji dan Tunjangan Salaries and Allowances ExpensesLain-lain OthersJumlah Total
22. Perpajakan 22. Taxes
a. Utang Pajak a. Tax Payables
Akun ini terdiri dari : This account consists of :Pajak Penghasilan Pasal 4 ayat 2 Income Tax Article 4 (2)Pajak Penghasilan Pasal 21 Income Tax Article 21Pajak Penghasilan Pasal 23 Income Tax Article 23Pajak Penghasilan Pasal 25 Income Tax Article 25Pajak Penghasilan Pasal 29 Income Tax Article 29Pajak Pertambahan Nilai Value Added TaxJumlah Total
b. Taksiran Pajak Penghasilan b. Estimated Income Tax
Akun ini terdiri dari : This account consists of :Pajak Kini Current TaxPajak Tangguhan Deferred TaxJumlah Total
81.439.3512.046.142.851
11.732.663.573
5.987
5.622.466
(62.688.080)1.915.986.400
252.314.707 288.234.258
70.253.2506.761.845.808
1.853.298.320
2013
2013
2013
1.964.703.500
-15.316.657.412
15.316.657.412
2013
1.537.850.988
-
2012
20126.691.592.558
5.339.485.623
6.761.845.808
1.422.360.185
2.311.314.902
2012
2.375.360.200
6.174.195431.760.604
5.295.618183.304.727
(64.045.298)
50.272.556
35.589.910298.062
218.537.84184.588.172
2012
13.473.385
122.460.396
-
6.761.845.808
2012
-
50.612.066
-203.388.980302.055.456
69.335.770
22.893.436
2013
83.043
528.337.872
126.655.375
13.270.514.561
15.316.657.412
Akun ini merupakan utang kepada nasabah atas transaksi jual efek yangdilakukan melalui Entitas. Perinciannya sebagai berikut :
This account represents payable to customers as a result of securities saletransactions through the Entity. The detail are as follows :
25

25
PT PANCA GLOBAL SECURITIES Tbk PT PANCA GLOBAL SECURITIES TbkCATATAN ATAS LAPORAN KEUANGAN NOTES TO FINANCIAL STATEMENTSUntuk Tahun Yang Berakhir Pada Tanggal-Tanggal 31 Desember 2013 dan 2012 For The Years Ended December 31, 2013 and 2012(Disajikan dalam Rupiah) (Expressed in Rupiah)
These financial statements are originally issued in Indonesian language.
17. Aset Tetap - lanjutan 17. Fixed Assets - continued
Nilai Perolehan : Cost :Kepemilikan Langsung Direct OwnershipKendaraan VehiclesPerlengkapan Kantor Office EquipmentsKomputer ComputersPerabot Kantor FurnituresJumlah Total
Akumulasi Penyusutan : Accumulated Depreciation :Kepemilikan Langsung Direct OwnershipKendaraan VehiclesPerlengkapan Kantor Office EquipmentsKomputer ComputersPerabot Kantor FurnituresJumlah TotalNilai Buku Net Book Value
Penjualan dan Penghapusan Aset Tetap Sale and Disposal of Fixed Assets
Nilai Perolehan : Cost :Kendaraan VehiclesPerabot Kantor FurnituresJumlah TotalAkumulasi Penyusutan : Accumulated Depreciation :Kendaraan VehiclesPerabot Kantor FurnituresJumlah TotalNilai Buku Net Book ValueHarga Jual PriceLaba Penjualan dan Penghapusan Aset Tetap Gain on Sale and Disposal of Fixed Assets
18. Aset Lain - lain 18. Other Assets
Akun ini terdiri dari : This account consists of :Deposit Sewa Gedung Building Rent DepositDeposit Telpon Telephone DepositsJumlah Total
19. Utang Lembaga Kliring dan Penjaminan 19. Payable to Clearing And Guarantee Institution
78.500.000231.067.397
2013
152.567.397 121.037.553
-
2012
600.000.000600.000.000
514.800.000514.800.000
-
514.800.000
2011
-
1.018.911.403
30.000.000
2.692.102.937
3.621.265.909375.144.507 -
-
-
-
Pengurangan/
2.785.664.908
-
7.646.332.882
83.500.000204.537.553
522.485.643514.800.000
-
776.758.0682.824.139.691
7.123.847.239
787.356.150
359.395.6913.163.553.789
3.651.265.909375.144.507
Ending BalanceSaldo Akhir/
540.000.000
-12.984.000
-
514.800.000
514.800.000
Deductions
514.800.000
540.000.000
-
-
867.500.000
539.409.760
867.500.000-
471.450.85214.301.173
Penambahan/
867.500.000
2012
7.099.237.479
1.302.156.150
1.276.375.116
345.094.518
2.832.566.316
Beginning Balance
8.118.148.882 42.984.000
2.819.582.316
AdditionsSaldo Awal/
867.500.000
38.474.78315.182.952
2012
514.800.000
Akun ini merupakan liabilitas Entitas kepada PT Kliring Penjaminan EfekIndonesia sebesar Rp. 16.606.625.000,- dan Rp.7.506.171.000,-per 31 Desember2013 dan 2012, akibat dari perhitungan penyelesaian transaksi beli efek yangdilakukan Entitas.
This account represents payable to PT Kliring Penjaminan Efek Indonesia ofRp.16,606,625,000,- and Rp. 7,506,171,000,- as of December 31, 2013 and2012, arising from settlement of securities buy transactions done by the Entity.
Beban Penyusutan untuk tahun yang berakhir pada tanggal-tanggal 31 Desember2013 dan 2012 masing-masing sebesar Rp. 648.138.902,- dan Rp. 539.409.760,-.
Depreciation expenses for the years ended December 31, 2013 and 2012amounted to Rp. 648,138,902,- and Rp. 539,409,760,- respectively.
Kendaraan telah diasuransikan kepada PT Asuransi Astra, PT Wahana Tata, PTAsuransi Multi Artha Guna dan PT Asuransi Sinarmas, dengan nilaipertanggungan per 31 Desember 2013 dan 2012 masing-masing sebesar Rp.2.813.500.000,- dan Rp. 2.720.000.000,-. Manajemen berkeyakinan nilaipertanggungan asuransi sudah mencukupi untuk menutupi kerugian yangmungkin akan timbul.
Vehicles have been insured to PT Asuransi Astra, PT Wahana Tata, PTAsuransi Multi Artha Guna and PT Asuransi Sinarmas, with a sum insured ofRp. 2,813,500,000,- and Rp. 2,720,000,000,- as of December 31, 2013 and2012, respectively. Management believes that insurance coverage is adequateto cover possible losses on the insured assets.
24
PT PANCA GLOBAL SECURITIES Tbk PT PANCA GLOBAL SECURITIES TbkCATATAN ATAS LAPORAN KEUANGAN NOTES TO FINANCIAL STATEMENTSUntuk Tahun Yang Berakhir Pada Tanggal-Tanggal 31 Desember 2013 dan 2012 For The Years Ended December 31, 2013 and 2012(Disajikan dalam Rupiah) (Expressed in Rupiah)
These financial statements are originally issued in Indonesian language.
20. Utang Nasabah 20. Payable to Customers
Pihak Berelasi Related PartySaldo masing-masing lebih atau Each more than or sama dengan 5% dari jumlah equal to 5% of total
Saldo masing-masing kurang dari 5% dari jumlah Each below 5% of total
Sub-Jumlah Sub-Total
Pihak Ketiga Third PartySaldo masing-masing lebih atau Each more than or sama dengan 5% dari jumlah equal to 5% of total
Saldo masing-masing kurang dari 5% dari jumlah Each below 5% of total
Sub-Jumlah Sub-Total
Jumlah
Utang berdasarkan jenis fasilitas: Payables classified by type of facility:Regular RegularMarjin MarginJumlah Total
21. Biaya Yang Masih Harus Dibayar 21. Accrued Expenses
Akun ini terdiri dari : This account consists of :Pajak Penghasilan Atas Penjualan Saham Income Tax on Securities TradingBeban Transaksi Transaction ExpensesBeban Gaji dan Tunjangan Salaries and Allowances ExpensesLain-lain OthersJumlah Total
22. Perpajakan 22. Taxes
a. Utang Pajak a. Tax Payables
Akun ini terdiri dari : This account consists of :Pajak Penghasilan Pasal 4 ayat 2 Income Tax Article 4 (2)Pajak Penghasilan Pasal 21 Income Tax Article 21Pajak Penghasilan Pasal 23 Income Tax Article 23Pajak Penghasilan Pasal 25 Income Tax Article 25Pajak Penghasilan Pasal 29 Income Tax Article 29Pajak Pertambahan Nilai Value Added TaxJumlah Total
b. Taksiran Pajak Penghasilan b. Estimated Income Tax
Akun ini terdiri dari : This account consists of :Pajak Kini Current TaxPajak Tangguhan Deferred TaxJumlah Total
81.439.3512.046.142.851
11.732.663.573
5.987
5.622.466
(62.688.080)1.915.986.400
252.314.707 288.234.258
70.253.2506.761.845.808
1.853.298.320
2013
2013
2013
1.964.703.500
-15.316.657.412
15.316.657.412
2013
1.537.850.988
-
2012
20126.691.592.558
5.339.485.623
6.761.845.808
1.422.360.185
2.311.314.902
2012
2.375.360.200
6.174.195431.760.604
5.295.618183.304.727
(64.045.298)
50.272.556
35.589.910298.062
218.537.84184.588.172
2012
13.473.385
122.460.396
-
6.761.845.808
2012
-
50.612.066
-203.388.980302.055.456
69.335.770
22.893.436
2013
83.043
528.337.872
126.655.375
13.270.514.561
15.316.657.412
Akun ini merupakan utang kepada nasabah atas transaksi jual efek yangdilakukan melalui Entitas. Perinciannya sebagai berikut :
This account represents payable to customers as a result of securities saletransactions through the Entity. The detail are as follows :
25
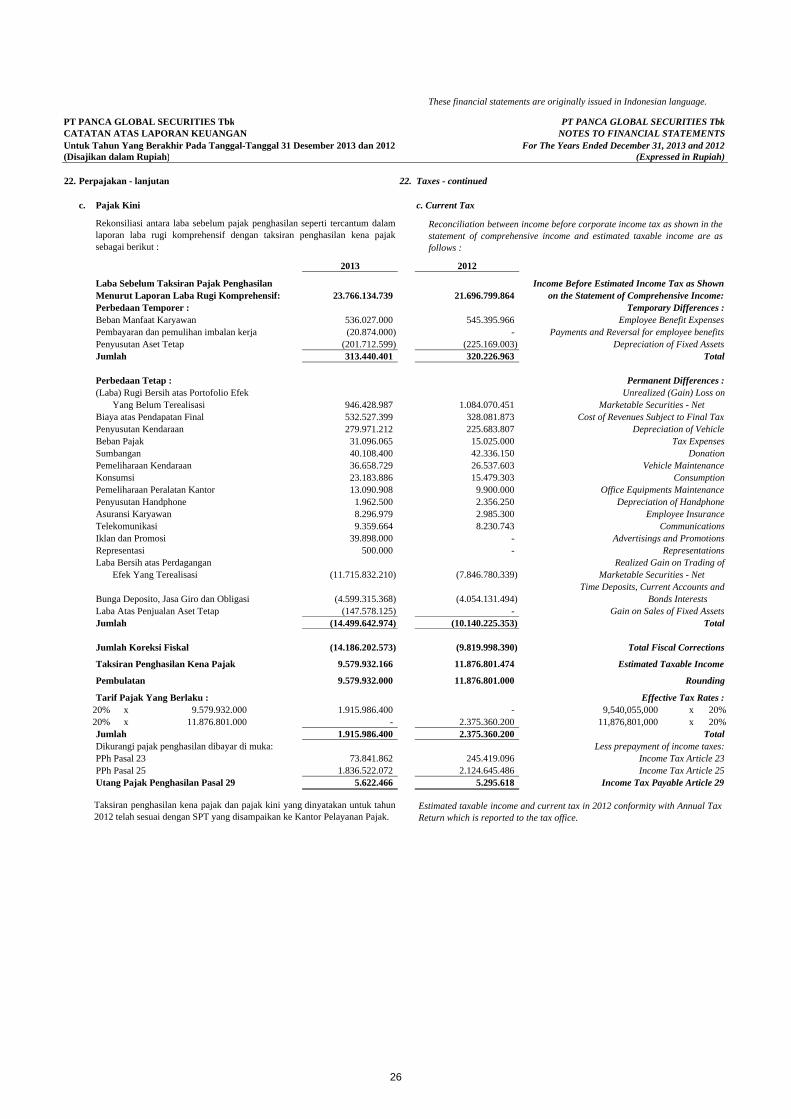
26
PT PANCA GLOBAL SECURITIES Tbk PT PANCA GLOBAL SECURITIES TbkCATATAN ATAS LAPORAN KEUANGAN NOTES TO FINANCIAL STATEMENTSUntuk Tahun Yang Berakhir Pada Tanggal-Tanggal 31 Desember 2013 dan 2012 For The Years Ended December 31, 2013 and 2012(Disajikan dalam Rupiah) (Expressed in Rupiah)
These financial statements are originally issued in Indonesian language.
22. Perpajakan - lanjutan 22. Taxes - continued
c. Pajak Kini c. Current Tax
Laba Sebelum Taksiran Pajak Penghasilan Income Before Estimated Income Tax as ShownMenurut Laporan Laba Rugi Komprehensif: on the Statement of Comprehensive Income:Perbedaan Temporer : Temporary Differences :Beban Manfaat Karyawan Employee Benefit ExpensesPembayaran dan pemulihan imbalan kerja Payments and Reversal for employee benefitsPenyusutan Aset Tetap Depreciation of Fixed AssetsJumlah Total
Perbedaan Tetap : Permanent Differences :(Laba) Rugi Bersih atas Portofolio Efek Unrealized (Gain) Loss on
Yang Belum Terealisasi Marketable Securities - Net Biaya atas Pendapatan Final Cost of Revenues Subject to Final TaxPenyusutan Kendaraan Depreciation of VehicleBeban Pajak Tax ExpensesSumbangan DonationPemeliharaan Kendaraan Vehicle MaintenanceKonsumsi ConsumptionPemeliharaan Peralatan Kantor Office Equipments MaintenancePenyusutan Handphone Depreciation of HandphoneAsuransi Karyawan Employee InsuranceTelekomunikasi CommunicationsIklan dan Promosi Advertisings and PromotionsRepresentasi RepresentationsLaba Bersih atas Perdagangan Realized Gain on Trading of
Efek Yang Terealisasi Marketable Securities - Net Time Deposits, Current Accounts and
Bunga Deposito, Jasa Giro dan Obligasi Bonds InterestsLaba Atas Penjualan Aset Tetap Gain on Sales of Fixed AssetsJumlah Total
Jumlah Koreksi Fiskal Total Fiscal Corrections
Taksiran Penghasilan Kena Pajak Estimated Taxable Income
Pembulatan Rounding
Tarif Pajak Yang Berlaku : Effective Tax Rates :20% x 9,540,055,000 x 20%20% x 11,876,801,000 x 20%Jumlah TotalDikurangi pajak penghasilan dibayar di muka: Less prepayment of income taxes:PPh Pasal 23 Income Tax Article 23PPh Pasal 25 Income Tax Article 25Utang Pajak Penghasilan Pasal 29 Income Tax Payable Article 29
500.000
(20.874.000)
8.296.979
23.183.88636.658.729
536.027.000
11.876.801.000
31.096.065
-
(10.140.225.353)
40.108.400
(201.712.599)
(4.054.131.494)
532.527.399279.971.212
2013
23.766.134.739
946.428.987
313.440.401
(14.499.642.974)(147.578.125)
(4.599.315.368)
39.898.000
(11.715.832.210)
2.375.360.200
9.579.932.166
(14.186.202.573)
13.090.9081.962.500
9.359.664
5.295.618
-
5.622.466
9.579.932.000
1.915.986.400
73.841.862
1.915.986.400
1.836.522.072
-9.579.932.000
11.876.801.000
11.876.801.474
1.084.070.451
225.683.807328.081.873
-
26.537.603
-
245.419.096
42.336.150
(7.846.780.339)
2.124.645.486
2.375.360.200
(9.819.998.390)
8.230.743
2.356.2509.900.000
15.479.303
2.985.300
15.025.000
(225.169.003)
2012
545.395.966
21.696.799.864
320.226.963
-
Rekonsiliasi antara laba sebelum pajak penghasilan seperti tercantum dalamlaporan laba rugi komprehensif dengan taksiran penghasilan kena pajaksebagai berikut :
Reconciliation between income before corporate income tax as shown in thestatement of comprehensive income and estimated taxable income are asfollows :
Taksiran penghasilan kena pajak dan pajak kini yang dinyatakan untuk tahun2012 telah sesuai dengan SPT yang disampaikan ke Kantor Pelayanan Pajak.
Estimated taxable income and current tax in 2012 conformity with Annual TaxReturn which is reported to the tax office.
26
PT PANCA GLOBAL SECURITIES Tbk PT PANCA GLOBAL SECURITIES TbkCATATAN ATAS LAPORAN KEUANGAN NOTES TO FINANCIAL STATEMENTSUntuk Tahun Yang Berakhir Pada Tanggal-Tanggal 31 Desember 2013 dan 2012 For The Years Ended December 31, 2013 and 2012(Disajikan dalam Rupiah) (Expressed in Rupiah)
These financial statements are originally issued in Indonesian language.
22. Perpajakan - lanjutan 22. Taxes - continued
d. Pajak Tangguhan d. Deferred Taxes
Aset Pajak Tangguhan Deferred Tax Assets
Penyusutan Depreciation of Aset Tetap Fixed AssetsLiabilitas Manfaat Employee Benefits Karyawan LiabilityBeban Penyisihan Allowance For Piutang Doubtful Account Ragu-RaguJumlah Total
Rekonsiliasi antara beban pajak The reconciliation between income tax expensepenghasilan yang dihitung menggunakan which is computed using the applicabletarif pajak yang berlaku dan laba sebelum tax rate and income before incomepajak penghasilan adalah sebagai berikut: tax of the Entity is as follow:Laba Sebelum Taksiran Pajak Penghasilan Income Before Estimated Income Tax as ShownMenurut Laporan Laba Rugi Komprehensif: on the Statement of Comprehensive Income:
Tarif Pajak Yang Berlaku : Effective Tax rates :20% x 23,766,134,739 x 20%20% x 21,696,799,864 x 20%Jumlah Total
Dampak pajak atas beban dan (penghasilan) Tax effects of non deductible expensesyang tidak dapat dikurangi menurut Fiskal : and non taxable (income):Perbedaan Tetap : Permanent Differences :(Laba) Rugi Bersih atas Portofolio Efek Unrealized (Gain) Loss on
Yang Belum Terealisasi Marketable Securities - Net Biaya atas Pendapatan Final Cost of Revenues Subject to Final TaxPenyusutan Kendaraan Depreciation of VehicleBeban Pajak Tax ExpensesSumbangan DonationPemeliharaan Kendaraan Vehicle MaintenanceKonsumsi ConsumptionPemeliharaan Peralatan Kantor Office Equipments MaintenancePenyusutan Handphone Depreciation of HandphoneAsuransi Karyawan Employee InsuranceTelekomunikasi CommunicationsIklan dan Promosi Advertisings and PromotionsRepresentasi RepresentationsLaba Bersih atas Perdagangan Realized Gain on Trading of
Efek Yang Terealisasi Marketable Securities - Net Time Deposits, Currents Accounts and
Bunga Deposito, Jasa Giro dan Obligasi Bonds InterestsLaba Atas Penjualan Aset Tetap Gain on Sales of Fixed AssetsJumlah TotalBeban Pajak Penghasilan Income Tax Expenses
(45.033.895)
Komprehensif/
Dikreditkan
-
-
-
Laba Rugi
21.696.799.86423.766.134.739
-
21.696.799.864
(2.435.736)775.812.119
4.753.226.915
839.857.41764.045.298
1 Januari 2012/
262.497.848
Ke Laporan
ComprehensiveIncome
103.030.600
December 31, 2012
(40.342.520)217.463.953
1.646.149
62.688.080(2.435.736)
65.616.375
4.339.359.973
3.095.861
2012
23.766.134.739
2013
(29.515.625) -(810.826.299)
(2.028.045.071)
(1.569.356.068)
(919.863.074)
(2.899.928.595)
2.618.182
597.060
7.979.600 -
1.853.298.320 2.311.314.902
4.636.777
(2.343.166.442)
392.500 471.2501.980.000
100.000 -
1.871.933
4.753.226.915
Laba Rugi
to Statement ofCredited
624.829.200109.079.193515.750.007
January 1, 2012
Ke Laporan
December 31, 2013Komprehensif/
Dikreditkan 31 Desember 2013/
Credited
31 Desember 2012/
ComprehensiveIncome
to Statement of
727.859.800
177.121.433
902.545.497(2.435.736)
189.285.797 216.814.090
7.331.7468.021.680
5.307.521
6.219.21355.994.242
106.505.480
3.005.000
4.339.359.973
1.659.396
45.136.761
8.467.230
Pajak tangguhan dihitung berdasarkan pengaruh dari perbedaan temporerantara jumlah tercatat aset dan liabilitas menurut laporan keuangan dengandasar pengenaan pajak aset dan liabilitas. Rincian dari aset dan liabilitaspajak tangguhan Entitas adalah sebagai berikut :
Deferred tax is computed based on the effect of the temporary differencesbetween the financial statement carrying amounts of assets and liabilitiesand their respective tax bases. The details of the Entity's deferred tax assetsand liabilities are as follows :
27

27
PT PANCA GLOBAL SECURITIES Tbk PT PANCA GLOBAL SECURITIES TbkCATATAN ATAS LAPORAN KEUANGAN NOTES TO FINANCIAL STATEMENTSUntuk Tahun Yang Berakhir Pada Tanggal-Tanggal 31 Desember 2013 dan 2012 For The Years Ended December 31, 2013 and 2012(Disajikan dalam Rupiah) (Expressed in Rupiah)
These financial statements are originally issued in Indonesian language.
22. Perpajakan - lanjutan 22. Taxes - continued
c. Pajak Kini c. Current Tax
Laba Sebelum Taksiran Pajak Penghasilan Income Before Estimated Income Tax as ShownMenurut Laporan Laba Rugi Komprehensif: on the Statement of Comprehensive Income:Perbedaan Temporer : Temporary Differences :Beban Manfaat Karyawan Employee Benefit ExpensesPembayaran dan pemulihan imbalan kerja Payments and Reversal for employee benefitsPenyusutan Aset Tetap Depreciation of Fixed AssetsJumlah Total
Perbedaan Tetap : Permanent Differences :(Laba) Rugi Bersih atas Portofolio Efek Unrealized (Gain) Loss on
Yang Belum Terealisasi Marketable Securities - Net Biaya atas Pendapatan Final Cost of Revenues Subject to Final TaxPenyusutan Kendaraan Depreciation of VehicleBeban Pajak Tax ExpensesSumbangan DonationPemeliharaan Kendaraan Vehicle MaintenanceKonsumsi ConsumptionPemeliharaan Peralatan Kantor Office Equipments MaintenancePenyusutan Handphone Depreciation of HandphoneAsuransi Karyawan Employee InsuranceTelekomunikasi CommunicationsIklan dan Promosi Advertisings and PromotionsRepresentasi RepresentationsLaba Bersih atas Perdagangan Realized Gain on Trading of
Efek Yang Terealisasi Marketable Securities - Net Time Deposits, Current Accounts and
Bunga Deposito, Jasa Giro dan Obligasi Bonds InterestsLaba Atas Penjualan Aset Tetap Gain on Sales of Fixed AssetsJumlah Total
Jumlah Koreksi Fiskal Total Fiscal Corrections
Taksiran Penghasilan Kena Pajak Estimated Taxable Income
Pembulatan Rounding
Tarif Pajak Yang Berlaku : Effective Tax Rates :20% x 9,540,055,000 x 20%20% x 11,876,801,000 x 20%Jumlah TotalDikurangi pajak penghasilan dibayar di muka: Less prepayment of income taxes:PPh Pasal 23 Income Tax Article 23PPh Pasal 25 Income Tax Article 25Utang Pajak Penghasilan Pasal 29 Income Tax Payable Article 29
500.000
(20.874.000)
8.296.979
23.183.88636.658.729
536.027.000
11.876.801.000
31.096.065
-
(10.140.225.353)
40.108.400
(201.712.599)
(4.054.131.494)
532.527.399279.971.212
2013
23.766.134.739
946.428.987
313.440.401
(14.499.642.974)(147.578.125)
(4.599.315.368)
39.898.000
(11.715.832.210)
2.375.360.200
9.579.932.166
(14.186.202.573)
13.090.9081.962.500
9.359.664
5.295.618
-
5.622.466
9.579.932.000
1.915.986.400
73.841.862
1.915.986.400
1.836.522.072
-9.579.932.000
11.876.801.000
11.876.801.474
1.084.070.451
225.683.807328.081.873
-
26.537.603
-
245.419.096
42.336.150
(7.846.780.339)
2.124.645.486
2.375.360.200
(9.819.998.390)
8.230.743
2.356.2509.900.000
15.479.303
2.985.300
15.025.000
(225.169.003)
2012
545.395.966
21.696.799.864
320.226.963
-
Rekonsiliasi antara laba sebelum pajak penghasilan seperti tercantum dalamlaporan laba rugi komprehensif dengan taksiran penghasilan kena pajaksebagai berikut :
Reconciliation between income before corporate income tax as shown in thestatement of comprehensive income and estimated taxable income are asfollows :
Taksiran penghasilan kena pajak dan pajak kini yang dinyatakan untuk tahun2012 telah sesuai dengan SPT yang disampaikan ke Kantor Pelayanan Pajak.
Estimated taxable income and current tax in 2012 conformity with Annual TaxReturn which is reported to the tax office.
26
PT PANCA GLOBAL SECURITIES Tbk PT PANCA GLOBAL SECURITIES TbkCATATAN ATAS LAPORAN KEUANGAN NOTES TO FINANCIAL STATEMENTSUntuk Tahun Yang Berakhir Pada Tanggal-Tanggal 31 Desember 2013 dan 2012 For The Years Ended December 31, 2013 and 2012(Disajikan dalam Rupiah) (Expressed in Rupiah)
These financial statements are originally issued in Indonesian language.
22. Perpajakan - lanjutan 22. Taxes - continued
d. Pajak Tangguhan d. Deferred Taxes
Aset Pajak Tangguhan Deferred Tax Assets
Penyusutan Depreciation of Aset Tetap Fixed AssetsLiabilitas Manfaat Employee Benefits Karyawan LiabilityBeban Penyisihan Allowance For Piutang Doubtful Account Ragu-RaguJumlah Total
Rekonsiliasi antara beban pajak The reconciliation between income tax expensepenghasilan yang dihitung menggunakan which is computed using the applicabletarif pajak yang berlaku dan laba sebelum tax rate and income before incomepajak penghasilan adalah sebagai berikut: tax of the Entity is as follow:Laba Sebelum Taksiran Pajak Penghasilan Income Before Estimated Income Tax as ShownMenurut Laporan Laba Rugi Komprehensif: on the Statement of Comprehensive Income:
Tarif Pajak Yang Berlaku : Effective Tax rates :20% x 23,766,134,739 x 20%20% x 21,696,799,864 x 20%Jumlah Total
Dampak pajak atas beban dan (penghasilan) Tax effects of non deductible expensesyang tidak dapat dikurangi menurut Fiskal : and non taxable (income):Perbedaan Tetap : Permanent Differences :(Laba) Rugi Bersih atas Portofolio Efek Unrealized (Gain) Loss on
Yang Belum Terealisasi Marketable Securities - Net Biaya atas Pendapatan Final Cost of Revenues Subject to Final TaxPenyusutan Kendaraan Depreciation of VehicleBeban Pajak Tax ExpensesSumbangan DonationPemeliharaan Kendaraan Vehicle MaintenanceKonsumsi ConsumptionPemeliharaan Peralatan Kantor Office Equipments MaintenancePenyusutan Handphone Depreciation of HandphoneAsuransi Karyawan Employee InsuranceTelekomunikasi CommunicationsIklan dan Promosi Advertisings and PromotionsRepresentasi RepresentationsLaba Bersih atas Perdagangan Realized Gain on Trading of
Efek Yang Terealisasi Marketable Securities - Net Time Deposits, Currents Accounts and
Bunga Deposito, Jasa Giro dan Obligasi Bonds InterestsLaba Atas Penjualan Aset Tetap Gain on Sales of Fixed AssetsJumlah TotalBeban Pajak Penghasilan Income Tax Expenses
(45.033.895)
Komprehensif/
Dikreditkan
-
-
-
Laba Rugi
21.696.799.86423.766.134.739
-
21.696.799.864
(2.435.736)775.812.119
4.753.226.915
839.857.41764.045.298
1 Januari 2012/
262.497.848
Ke Laporan
ComprehensiveIncome
103.030.600
December 31, 2012
(40.342.520)217.463.953
1.646.149
62.688.080(2.435.736)
65.616.375
4.339.359.973
3.095.861
2012
23.766.134.739
2013
(29.515.625) -(810.826.299)
(2.028.045.071)
(1.569.356.068)
(919.863.074)
(2.899.928.595)
2.618.182
597.060
7.979.600 -
1.853.298.320 2.311.314.902
4.636.777
(2.343.166.442)
392.500 471.2501.980.000
100.000 -
1.871.933
4.753.226.915
Laba Rugi
to Statement ofCredited
624.829.200109.079.193515.750.007
January 1, 2012
Ke Laporan
December 31, 2013Komprehensif/
Dikreditkan 31 Desember 2013/
Credited
31 Desember 2012/
ComprehensiveIncome
to Statement of
727.859.800
177.121.433
902.545.497(2.435.736)
189.285.797 216.814.090
7.331.7468.021.680
5.307.521
6.219.21355.994.242
106.505.480
3.005.000
4.339.359.973
1.659.396
45.136.761
8.467.230
Pajak tangguhan dihitung berdasarkan pengaruh dari perbedaan temporerantara jumlah tercatat aset dan liabilitas menurut laporan keuangan dengandasar pengenaan pajak aset dan liabilitas. Rincian dari aset dan liabilitaspajak tangguhan Entitas adalah sebagai berikut :
Deferred tax is computed based on the effect of the temporary differencesbetween the financial statement carrying amounts of assets and liabilitiesand their respective tax bases. The details of the Entity's deferred tax assetsand liabilities are as follows :
27

28
PT PANCA GLOBAL SECURITIES Tbk PT PANCA GLOBAL SECURITIES TbkCATATAN ATAS LAPORAN KEUANGAN NOTES TO FINANCIAL STATEMENTSUntuk Tahun Yang Berakhir Pada Tanggal-Tanggal 31 Desember 2013 dan 2012 For The Years Ended December 31, 2013 and 2012(Disajikan dalam Rupiah) (Expressed in Rupiah)
These financial statements are originally issued in Indonesian language.
22. Perpajakan - lanjutan 22. Taxes - continued
d. Pajak Tangguhan - lanjutan d. Deferred Taxes - continued
23. Modal Kerja Bersih Disesuaikan 23. Adjusted Net Working Capital
24. Modal Saham 24. Share Capital
Per 31 Desember 2013 dan 2012 As of December 31, 2013 and 2012Nama Pemegang Saham Name of Shareholders
Tn. Hendra H. Kustarjo Mr. Hendra H. KustarjoUBS AG Singapore UBS AG SingaporeTn. Trisno Limanto Mr. Trisno LimantoNy. Farida Eva R. Hutapea Ny. Farida Eva R. HutapeaMasyarakat PublicJumlah Total
25. Tambahan Modal Disetor 25. Additional Paid In Capital
Akun ini terdiri dari : This account consists of :Agio Saham - Bersih Agio - NetPenerbitan Saham Bonus Inssuance Bonus SharesBeban Emisi Saham Share Issuance CostJumlah Total
(570.013.400)122.448.950
Percentage
50,83%360.032.514
15.828.750.000
4,82%34.125.000
158.287.500
100%
2012
4.065.577.750
(570.013.400)(3.373.115.400)
4.065.577.750
22,35%
70.835.426.40036.003.251.400
10.340.925.000
Jumlah/Total Shares
Jumlah Saham
122.448.950
(3.373.115.400)
2013
708.354.264
14,60%7,41%
103.409.25052.500.000
3.412.500.0005.250.000.000
TotalPersentase/
Entitas berkewajiban untuk memenuhi persyaratan Modal Kerja BersihDisesuaikan (MKBD) berdasarkan Peraturan Badan Pengawas Pasar Modal danLembaga Keuangan (BAPEPAM-LK) No. Kep-566/BL/2011 tanggal 31 Oktober2011. Berdasarkan peraturan tersebut, entitas efek yang menjadi anggotalembaga keliring dan penjamin, memberikan fasilitas pembiayaan baginasabahnya atau mengadministrasikan rekening efek nasabah dan menjalankankegiatan usaha sebagai penjamin emisi efek dan perantara pedagang efek wajibmemiliki Modal Kerja Bersih Disesuaikan sekurang-kurangnya sebesar Rp.25.000.000.000,- atau 6,25% (enam koma dua puluh lima perseratus) dari totalliabilitas tanpa utang sub-ordinasi dan utang dalam rangka penawaran umum /penawaran terbatas ditambah ranking liabilities, mana yang lebih tinggi.
The Entity is required to meet the Adjusted Net Working Capital (MKBD)determined in accordance with the Capital Market Supervisory Board andFinancial Institution (BAPEPAM-LK) Regulation No. Kep-566/BL/2011 datedOctober 31, 2011. Under this regulation, securities entities with activities asunderwriter and securities broker should maintan the Adjusted Net WorkingCapital (ANWC) equal to or above the minimum balance of Rp.25,000,000,000.- or 6.25% (six point twenty five percent) of the total liabilitieswihtout sub-ordinated loan and debt in general offering / limited plus rankingliabilities, which is higher.
Pada tanggal-tanggal 30 Desember 2013 dan 28 Desember 2012, Entias memilikiMKBD masing-masing sebesar Rp. 75.583.238.076,- dan Rp. 82.068.562.425,-yang mana jumlah masing-masing tersebut melebihi ketentuan yang ditetapkanperaturan di atas.
As of December 30, 2013 and December 28, 2012, the Entity had ANWCamounted to Rp. 75,583,238,076,- and Rp. 82,068,562,425,- which exceed theminimum balance required by the above regulation.
In September 2008, Law No. 7 Year 1983 regarding “Income Tax” has beenrevised for the fourth time with Law No. 36 Year 2008. The revised Lawstipulates changes in corporate tax rate from progressive tax rates to a singlerate of 28% for fiscal year 2009 and 25% for fiscal year 2010 onwards. Basedon The decision letter of the Minister of Financial No. 238/PMK.03/2008, theEntity which has listed in the Indonesian Stock Exchange (IDX) obtaineddiscount rate facility of 5% so the rate of 23% for fiscal year 2009 and 20% forfiscal year 2010 onwards.
Pada September 2008, Undang-Undang No. 7 Tahun 1983 mengenai “PajakPenghasilan” diubah untuk keempat kalinya dengan Undang-Undang No. 36Tahun 2008. Perubahan tersebut juga mencakup perubahan tarif pajakpenghasilan badan dari sebelumnya menggunakan tarif pajak bertingkat menjaditarif tunggal yaitu 28% untuk tahun fiskal 2009 dan 25% untuk tahun fiskal 2010dan seterusnya. Berdasarkan Peraturan Menteri Keuangan No.238/PMK.03/2008, Entitas yang terdaftar di Bursa Efek Indonesia mendapatkantarif pengurangan pajak 5% sehingga tahun 2009 tarifnya 23% dan tahun 2010tarifnya 20% dan seterusnya.
Jumlah saham tercatat di Bursa Efek Indonesia pada tanggal-tanggal 31Desember 2013 dan 2012 masing-masing sebesar 708.354.264 saham.
The total paid-up shares listed on the Indonesia Stock Exchange as ofDecember 31, 2013 and 2012 was 708,354,264 shares.
28
PT PANCA GLOBAL SECURITIES Tbk PT PANCA GLOBAL SECURITIES TbkCATATAN ATAS LAPORAN KEUANGAN NOTES TO FINANCIAL STATEMENTSUntuk Tahun Yang Berakhir Pada Tanggal-Tanggal 31 Desember 2013 dan 2012 For The Years Ended December 31, 2013 and 2012(Disajikan dalam Rupiah) (Expressed in Rupiah)
These financial statements are originally issued in Indonesian language.
26. Saldo Laba 26. Retained Earnings
Akun ini terdiri dari : This account consists of :Ditentukan Penggunaannya *) AppropriatedBelum Ditentukan Penggunaannya **) UnappropriatedJumlah Total
*) *)
**) **)
27. Komisi dari Transaksi Perantara Pedagang Efek 27. Brokerage Commission
28. Pendapatan Bunga atas Pembiayaan Nasabah 28. Interest Income From Margin Trading
29. Laba Bersih atas Perdagangan Efek Yang Terealisasi 29. Realized Net Gain on Trading of Marketable Securities
30. Laba (Rugi) Bersih atas Portofolio Efek Yang Belum Terealisasi 30. Unrealized Net Gain (Loss) on Marketable Securities
31. Jasa Agen Penjualan 31. Selling Fee Agents
32. Jasa Manager Investasi 32. Investment Management Fee
33. Jasa Penjamin Emisi Efek 33. Underwriting Fee
34. Jasa Penasehat Keuangan 34. Investment Advisory Fee
20122013
100.979.934.02189.150.640.24186.200.640.241
3.000.000.000 2.950.000.000
103.979.934.021
This account represents commission from brokerage trading of marketingsecurities.
Akun ini merupakan komisi yang diperoleh dari aktivitas perantara pedagangefek.
This account represents realized gain (loss) on trading of marketablesecurities, net.
Akun ini merupakan keuntungan (kerugian) bersih dari perdagangan portofolioefek yang telah direalisasi.
Akun ini merupakan keuntungan (kerugian) bersih yang belum direalisasi akibatkenaikan (penurunan) nilai wajar portofolio efek.
This account represents unrealized gain (loss) due to increase (decrease) infair value of securities, net.
Akun ini merupakan imbalan jasa yang diperoleh Entitas dari pengelolaaninvestasi reksa dana. (pihak berelasi).
This account represents fees obtained by the Entity as investment manager ofthe entity's mutual fund (related parties).
Akun ini merupakan imbalan atas jasa manajemen yang diperoleh Entitas darinasabahnya yang akan melakukan investasi.
This account represents fees from clients in relation to the Entity's activities asinvestment advisory.
Akun ini merupakan imbalan jasa sebagai penjamin emisi efek untuk penawaranumum perdana saham dan obligasi serta penawaran umum terbatas dengan hakmemesan terlebih dahulu (right issues ) atas saham.
This account represents fees obtained by the Entity from underwritingactivities for public offerings and rights issues of share.
Akun ini merupakan imbalan jasa yang diperoleh Entitas sebagai agen penjualanuntuk penawaran umum saham dan obligasi serta penawaran umum terbatasdengan hak memesan efek terlebih dahulu (right issues ) atas saham.
This account represents fee as selling agent to initial public offering share,obligation and rights issue.
Akun ini merupakan pendapatan bunga yang diperoleh sehubungan denganpemberian fasilitas pembiayaan nasabah untuk melakukan transaksi jual beli efek(transaksi margin) dengan tingkat bunga 12% - 18% dari saldo harian pinjaman(lihat catatan 11).
This account represents interest income in relation to provide customersfinancing facility for securities transaction (Margin Trading) with interest raterange at 12% - 18% from balance loan account per day (see notes 11).
Berdasarkan Keputusan Rapat Umum Pemegang Saham Tahunan sepertidinyatakan dalam akta No. 31 tanggal 10 Mei 2013 yang dibuat di hadapanFathiah Helmi, SH., Notaris di Jakarta, pemegang saham menyetujuipembagian dividen tunai untuk tahun buku 2012 sebesar Rp. 7.083.542.640,-atau Rp. 10,- per saham dan menetapkan dana cadangan sebesar Rp.50.000.000,-.
Based on decision of the General Meeting of the Shareholder annually asstated in deed No. 31 dated May 10, 2013 of Fathiah Helmi, SH., notary inJakarta, The shareholders approved the distribution of cash dividends forthe year 2012 amounted to Rp. 7,083,542,640,- or Rp. 10,- per share, anddetermine amounted to Rp. 50,000,000,- as a general reserve.
Akun ini merupakan akumulasi saldo laba yang belum ditentukanpenggunaannya sampai dengan 31 Desember 2013 dan 2012.
This account represents the accumulated unappropriated retained earningsas of December 31, 2013 and 2012.
Berdasarkan Keputusan Rapat Umum Pemegang Saham Tahunan sepertidinyatakan dalam akta No. 64 tanggal 24 Mei 2012 yang dibuat di hadapanFathiah Helmi, SH., Notaris di Jakarta, pemegang saham menyetujuipembagian dividen tunai untuk tahun buku 2011 sebesar Rp. 2.833.417.056,-atau Rp. 4,- per saham dan menetapkan dana cadangan sebesar Rp.50.000.000,-.
Based on decision of the General Meeting of the Shareholder annually asstated in deed No. 64 dated May 24, 2012 of Fathiah Helmi, SH., notary inJakarta, The shareholders approved the distribution of cash dividends forthe year 2011 amounted to Rp. 2,833,417,056,- or Rp. 4,- per share, anddetermine amounted to Rp. 50.000.000,- as a general reserve.
29
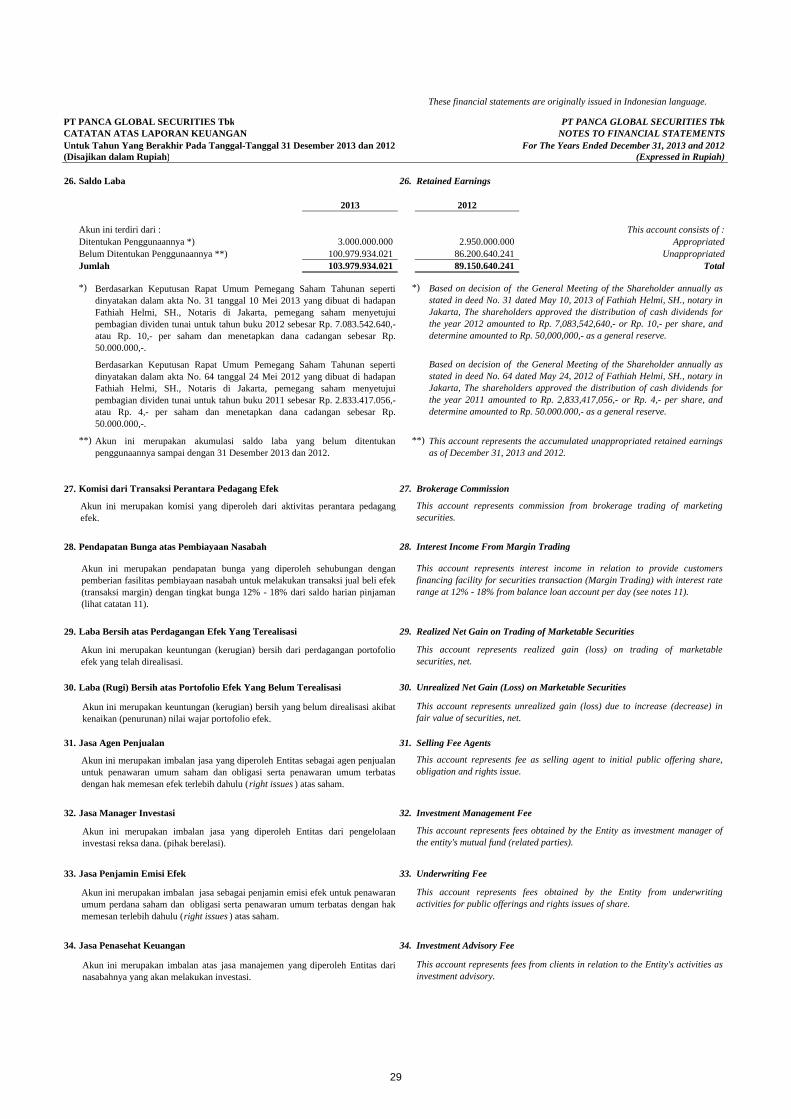
29
PT PANCA GLOBAL SECURITIES Tbk PT PANCA GLOBAL SECURITIES TbkCATATAN ATAS LAPORAN KEUANGAN NOTES TO FINANCIAL STATEMENTSUntuk Tahun Yang Berakhir Pada Tanggal-Tanggal 31 Desember 2013 dan 2012 For The Years Ended December 31, 2013 and 2012(Disajikan dalam Rupiah) (Expressed in Rupiah)
These financial statements are originally issued in Indonesian language.
22. Perpajakan - lanjutan 22. Taxes - continued
d. Pajak Tangguhan - lanjutan d. Deferred Taxes - continued
23. Modal Kerja Bersih Disesuaikan 23. Adjusted Net Working Capital
24. Modal Saham 24. Share Capital
Per 31 Desember 2013 dan 2012 As of December 31, 2013 and 2012Nama Pemegang Saham Name of Shareholders
Tn. Hendra H. Kustarjo Mr. Hendra H. KustarjoUBS AG Singapore UBS AG SingaporeTn. Trisno Limanto Mr. Trisno LimantoNy. Farida Eva R. Hutapea Ny. Farida Eva R. HutapeaMasyarakat PublicJumlah Total
25. Tambahan Modal Disetor 25. Additional Paid In Capital
Akun ini terdiri dari : This account consists of :Agio Saham - Bersih Agio - NetPenerbitan Saham Bonus Inssuance Bonus SharesBeban Emisi Saham Share Issuance CostJumlah Total
(570.013.400)122.448.950
Percentage
50,83%360.032.514
15.828.750.000
4,82%34.125.000
158.287.500
100%
2012
4.065.577.750
(570.013.400)(3.373.115.400)
4.065.577.750
22,35%
70.835.426.40036.003.251.400
10.340.925.000
Jumlah/Total Shares
Jumlah Saham
122.448.950
(3.373.115.400)
2013
708.354.264
14,60%7,41%
103.409.25052.500.000
3.412.500.0005.250.000.000
TotalPersentase/
Entitas berkewajiban untuk memenuhi persyaratan Modal Kerja BersihDisesuaikan (MKBD) berdasarkan Peraturan Badan Pengawas Pasar Modal danLembaga Keuangan (BAPEPAM-LK) No. Kep-566/BL/2011 tanggal 31 Oktober2011. Berdasarkan peraturan tersebut, entitas efek yang menjadi anggotalembaga keliring dan penjamin, memberikan fasilitas pembiayaan baginasabahnya atau mengadministrasikan rekening efek nasabah dan menjalankankegiatan usaha sebagai penjamin emisi efek dan perantara pedagang efek wajibmemiliki Modal Kerja Bersih Disesuaikan sekurang-kurangnya sebesar Rp.25.000.000.000,- atau 6,25% (enam koma dua puluh lima perseratus) dari totalliabilitas tanpa utang sub-ordinasi dan utang dalam rangka penawaran umum /penawaran terbatas ditambah ranking liabilities, mana yang lebih tinggi.
The Entity is required to meet the Adjusted Net Working Capital (MKBD)determined in accordance with the Capital Market Supervisory Board andFinancial Institution (BAPEPAM-LK) Regulation No. Kep-566/BL/2011 datedOctober 31, 2011. Under this regulation, securities entities with activities asunderwriter and securities broker should maintan the Adjusted Net WorkingCapital (ANWC) equal to or above the minimum balance of Rp.25,000,000,000.- or 6.25% (six point twenty five percent) of the total liabilitieswihtout sub-ordinated loan and debt in general offering / limited plus rankingliabilities, which is higher.
Pada tanggal-tanggal 30 Desember 2013 dan 28 Desember 2012, Entias memilikiMKBD masing-masing sebesar Rp. 75.583.238.076,- dan Rp. 82.068.562.425,-yang mana jumlah masing-masing tersebut melebihi ketentuan yang ditetapkanperaturan di atas.
As of December 30, 2013 and December 28, 2012, the Entity had ANWCamounted to Rp. 75,583,238,076,- and Rp. 82,068,562,425,- which exceed theminimum balance required by the above regulation.
In September 2008, Law No. 7 Year 1983 regarding “Income Tax” has beenrevised for the fourth time with Law No. 36 Year 2008. The revised Lawstipulates changes in corporate tax rate from progressive tax rates to a singlerate of 28% for fiscal year 2009 and 25% for fiscal year 2010 onwards. Basedon The decision letter of the Minister of Financial No. 238/PMK.03/2008, theEntity which has listed in the Indonesian Stock Exchange (IDX) obtaineddiscount rate facility of 5% so the rate of 23% for fiscal year 2009 and 20% forfiscal year 2010 onwards.
Pada September 2008, Undang-Undang No. 7 Tahun 1983 mengenai “PajakPenghasilan” diubah untuk keempat kalinya dengan Undang-Undang No. 36Tahun 2008. Perubahan tersebut juga mencakup perubahan tarif pajakpenghasilan badan dari sebelumnya menggunakan tarif pajak bertingkat menjaditarif tunggal yaitu 28% untuk tahun fiskal 2009 dan 25% untuk tahun fiskal 2010dan seterusnya. Berdasarkan Peraturan Menteri Keuangan No.238/PMK.03/2008, Entitas yang terdaftar di Bursa Efek Indonesia mendapatkantarif pengurangan pajak 5% sehingga tahun 2009 tarifnya 23% dan tahun 2010tarifnya 20% dan seterusnya.
Jumlah saham tercatat di Bursa Efek Indonesia pada tanggal-tanggal 31Desember 2013 dan 2012 masing-masing sebesar 708.354.264 saham.
The total paid-up shares listed on the Indonesia Stock Exchange as ofDecember 31, 2013 and 2012 was 708,354,264 shares.
28
PT PANCA GLOBAL SECURITIES Tbk PT PANCA GLOBAL SECURITIES TbkCATATAN ATAS LAPORAN KEUANGAN NOTES TO FINANCIAL STATEMENTSUntuk Tahun Yang Berakhir Pada Tanggal-Tanggal 31 Desember 2013 dan 2012 For The Years Ended December 31, 2013 and 2012(Disajikan dalam Rupiah) (Expressed in Rupiah)
These financial statements are originally issued in Indonesian language.
26. Saldo Laba 26. Retained Earnings
Akun ini terdiri dari : This account consists of :Ditentukan Penggunaannya *) AppropriatedBelum Ditentukan Penggunaannya **) UnappropriatedJumlah Total
*) *)
**) **)
27. Komisi dari Transaksi Perantara Pedagang Efek 27. Brokerage Commission
28. Pendapatan Bunga atas Pembiayaan Nasabah 28. Interest Income From Margin Trading
29. Laba Bersih atas Perdagangan Efek Yang Terealisasi 29. Realized Net Gain on Trading of Marketable Securities
30. Laba (Rugi) Bersih atas Portofolio Efek Yang Belum Terealisasi 30. Unrealized Net Gain (Loss) on Marketable Securities
31. Jasa Agen Penjualan 31. Selling Fee Agents
32. Jasa Manager Investasi 32. Investment Management Fee
33. Jasa Penjamin Emisi Efek 33. Underwriting Fee
34. Jasa Penasehat Keuangan 34. Investment Advisory Fee
20122013
100.979.934.02189.150.640.24186.200.640.241
3.000.000.000 2.950.000.000
103.979.934.021
This account represents commission from brokerage trading of marketingsecurities.
Akun ini merupakan komisi yang diperoleh dari aktivitas perantara pedagangefek.
This account represents realized gain (loss) on trading of marketablesecurities, net.
Akun ini merupakan keuntungan (kerugian) bersih dari perdagangan portofolioefek yang telah direalisasi.
Akun ini merupakan keuntungan (kerugian) bersih yang belum direalisasi akibatkenaikan (penurunan) nilai wajar portofolio efek.
This account represents unrealized gain (loss) due to increase (decrease) infair value of securities, net.
Akun ini merupakan imbalan jasa yang diperoleh Entitas dari pengelolaaninvestasi reksa dana. (pihak berelasi).
This account represents fees obtained by the Entity as investment manager ofthe entity's mutual fund (related parties).
Akun ini merupakan imbalan atas jasa manajemen yang diperoleh Entitas darinasabahnya yang akan melakukan investasi.
This account represents fees from clients in relation to the Entity's activities asinvestment advisory.
Akun ini merupakan imbalan jasa sebagai penjamin emisi efek untuk penawaranumum perdana saham dan obligasi serta penawaran umum terbatas dengan hakmemesan terlebih dahulu (right issues ) atas saham.
This account represents fees obtained by the Entity from underwritingactivities for public offerings and rights issues of share.
Akun ini merupakan imbalan jasa yang diperoleh Entitas sebagai agen penjualanuntuk penawaran umum saham dan obligasi serta penawaran umum terbatasdengan hak memesan efek terlebih dahulu (right issues ) atas saham.
This account represents fee as selling agent to initial public offering share,obligation and rights issue.
Akun ini merupakan pendapatan bunga yang diperoleh sehubungan denganpemberian fasilitas pembiayaan nasabah untuk melakukan transaksi jual beli efek(transaksi margin) dengan tingkat bunga 12% - 18% dari saldo harian pinjaman(lihat catatan 11).
This account represents interest income in relation to provide customersfinancing facility for securities transaction (Margin Trading) with interest raterange at 12% - 18% from balance loan account per day (see notes 11).
Berdasarkan Keputusan Rapat Umum Pemegang Saham Tahunan sepertidinyatakan dalam akta No. 31 tanggal 10 Mei 2013 yang dibuat di hadapanFathiah Helmi, SH., Notaris di Jakarta, pemegang saham menyetujuipembagian dividen tunai untuk tahun buku 2012 sebesar Rp. 7.083.542.640,-atau Rp. 10,- per saham dan menetapkan dana cadangan sebesar Rp.50.000.000,-.
Based on decision of the General Meeting of the Shareholder annually asstated in deed No. 31 dated May 10, 2013 of Fathiah Helmi, SH., notary inJakarta, The shareholders approved the distribution of cash dividends forthe year 2012 amounted to Rp. 7,083,542,640,- or Rp. 10,- per share, anddetermine amounted to Rp. 50,000,000,- as a general reserve.
Akun ini merupakan akumulasi saldo laba yang belum ditentukanpenggunaannya sampai dengan 31 Desember 2013 dan 2012.
This account represents the accumulated unappropriated retained earningsas of December 31, 2013 and 2012.
Berdasarkan Keputusan Rapat Umum Pemegang Saham Tahunan sepertidinyatakan dalam akta No. 64 tanggal 24 Mei 2012 yang dibuat di hadapanFathiah Helmi, SH., Notaris di Jakarta, pemegang saham menyetujuipembagian dividen tunai untuk tahun buku 2011 sebesar Rp. 2.833.417.056,-atau Rp. 4,- per saham dan menetapkan dana cadangan sebesar Rp.50.000.000,-.
Based on decision of the General Meeting of the Shareholder annually asstated in deed No. 64 dated May 24, 2012 of Fathiah Helmi, SH., notary inJakarta, The shareholders approved the distribution of cash dividends forthe year 2011 amounted to Rp. 2,833,417,056,- or Rp. 4,- per share, anddetermine amounted to Rp. 50.000.000,- as a general reserve.
29

30
PT PANCA GLOBAL SECURITIES Tbk PT PANCA GLOBAL SECURITIES TbkCATATAN ATAS LAPORAN KEUANGAN NOTES TO FINANCIAL STATEMENTSUntuk Tahun Yang Berakhir Pada Tanggal-Tanggal 31 Desember 2013 dan 2012 For The Years Ended December 31, 2013 and 2012(Disajikan dalam Rupiah) (Expressed in Rupiah)
These financial statements are originally issued in Indonesian language.
35. Administrasi dan Umum 35. General and Administrative
Akun ini terdiri dari : This account consists of :Manfaat Karyawan Employee BenefitInfo Teknologi Informations TechnologyPemeliharaan Peralatan Kantor Office Equipments MaintenancePemeliharaan Kendaraan Vehicle MaintenancePendidikan dan Pelatihan TrainingTelekomunikasi CommunicationsJasa Profesional Professional FeesBAE dan SRO BAE and SROSumbangan DonationIklan dan Promosi Advertising and PromotionAsuransi InsuranceAlat Tulis Kantor dan Administrasi Stationary and AdministrationBeban Pajak Tax ExpensesJamuan EntertaintTransportasi dan Perjalanan Dinas Transportation and TravellingKonsumsi ConsumptionBeban Administrasi Bank Bank ChargesSurat Kabar, Majalah dan Buku Newspaper, Magazine and BookKeanggotaan MembershipKesehatan MedicalPerlengkapan Dapur Pantry UtilitiesRepresentasi RepresentationsLain-lain OthersJumlah Total
36. Rekening Efek 36. Securities Account
37. Manfaat Karyawan 37. Employee Benefits
a. Liabilitas Manfaat Karyawan a. Employee Benefits Liability
Nilai Kini Liabilitas Manfaat Karyawan Present Value of Employee Benefits ObligationBiaya Jasa Lalu yang Belum Diakui - Belum Menjadi H Unrecognized Past Service Cost - Non VestedKerugian Aktuarial yang Belum Diakui Unrecognized Actuarial LossLiabilitas Manfaat Karyawan Total Employee Benefits Liability
b. Beban Manfaat Karyawan b. Employee Benefits Expenses
Biaya Jasa Kini Current Service CostBiaya Bunga Interest CostAmortisasi Biaya Jasa Lalu yang Belum Diakui Amortization of Past Service CostKerugian Aktuarial yang Belum Diakui Unrecognized Actuarial LossBeban Manfaat Karyawan Total Benefits Expenses
Saldo Awal Beginning BalancePembayaran imbalan kerja Benefit paid directly by companyBeban Manfaat Karyawan Employee Benefits ExpenseSaldo Akhir Ending Balance
66.600.000
2013
73.150.482
15.025.000
536.027.000 545.395.966
2012
67.225.680
227.757.901168.309.427118.703.408
93.218.816 74.809.616-85.166.800
80.026.201
68.400.000
15.479.303
29.937.021
40.108.400
38.893.107
39.134.86745.873.50034.231.850
52.333.32253.499.988
16.513.895
31.096.065
23.183.886
37.858.804
42.336.150
20122013
39.898.000
18.067.319
29.878.800
5.703.372
10.148.640
39.939.000
1.412.854.067
8.502.4146.000.000
14.573.251
1.508.463.511
8.296.979
3.527.193
2.565.045
5.500.0002.985.300
4.935.810
241.376.0003.639.299.000
3.402.733.000 2.984.771.000(5.144.000)
144.519.0003.124.146.000
(4.810.000)
343.039.000
2013 2012
371.961.000
545.395.966536.027.000
2.578.750.034
192.654.000 173.101.000334.000
- (34)334.000
545.395.966536.027.000
3.124.146.000-(20.874.000)
3.124.146.0003.639.299.000
500.000 -
Entitas memberikan manfaat karyawan kepada karyawan yang mencapai usiapensiun 55 tahun didasarkan atas Undang-Undang Tenaga Kerja No. 13/2003tanggal 25 Maret 2003. Entitas mencatat penyisihan untuk kesejahteraankaryawan sesuai yang ditentukan pada Undang-Undang tersebut sebesar Rp.536.027.000,- dan Rp. 545.395.966,- masing-masing untuk tahun yang berakhirpada tanggal 31 Desember 2013 dan 2012. Manajemen berkeyakinan bahwaperhitungan penyisihan atas uang penghargaan karyawan tersebut memadai untukmemenuhi pembayaran manfaat karyawan dimasa yang akan datang sesuai yangdipersyaratkan Undang - Undang tersebut.
The Entity provides post-employment benefits for its employees who achievedthe retirement age of 55 based on the provisions of Labor Law No. 13/2003dated March 25, 2003. The Entity has recorded allowance for employee benefitaccordance with this regulation amounted to Rp. 536,027,000,- and Rp.545,395,966,- as of December 31, 2013 and 2012, respectively. Managementbelieves that the calculation of allowance for employee benefit is adequate tocover benefit payment in the future are reasonable based on the regulation.
Pada tanggal 31 Desember 2013 dan 2012, entitas mengelola efek dan dananasabah dalam rekening efek sebesar Rp. 1.328.866.906.666,- dan Rp.989.195.763.016,-. Jumlah ini dan liabilitas kepada nasabah yang terkait tidakdiakui dalam laporan posisi keuangan entitas.
As of December 31, 2013 and 2012 the entity manages clients funds andsecurities in securities account amounted to Rp. 1,328,866,906,666,- and Rp.989,195,763,016,- .This amount and liabilities related to the client is notrecognized in the statement of financial position of the entity.
30
PT PANCA GLOBAL SECURITIES Tbk PT PANCA GLOBAL SECURITIES TbkCATATAN ATAS LAPORAN KEUANGAN NOTES TO FINANCIAL STATEMENTSUntuk Tahun Yang Berakhir Pada Tanggal-Tanggal 31 Desember 2013 dan 2012 For The Years Ended December 31, 2013 and 2012(Disajikan dalam Rupiah) (Expressed in Rupiah)
These financial statements are originally issued in Indonesian language.
37. Manfaat Karyawan - lanjutan 37. Employee Benefits - continued
Tingkat Diskonto : : Discount RateTingkat Kenaikan Gaji Tahunan : : Annual Salary Increase RateTingkat Mortalitas : : Mortality RateUmur Pensiun : : Retirement Age
38. Sifat dan Transaksi Pihak - Pihak Berelasi 38. Nature and Transactions with Related Parties
Sifat Pihak - Pihak Berelasi Nature of Relationship
a. a.
b. b.
c. c.
Transaksi Pihak - Pihak Berelasi Transactions with Related Parties
Piutang NasabahPiutang Lain-lain Other ReceivablesPersentase Terhadap Jumlah Aset Percentage of Total Assets
Utang Nasabah Payables to CustomersPersentase Terhadap Jumlah Liabilitas Percentage of Total Liabilities
39. Aset Moneter Dalam Mata Uang Asing 39. Monetary Assets In Foreign Currency
Aset AssetsPT Bank Central Asia Tbk PT Bank Central Asia TbkDeposit Sewa Gedung Building Rent Deposit
Aset AssetsPT Bank Central Asia Tbk PT Bank Central Asia TbkDeposit Sewa Gedung Building Rent Deposit
1 US$ 1 US$
Rupiah Equivalent
-152.567.397
55 Tahun/Years
Rupiah EquivalentEkuivalen Rp / Ekuivalen Rp /
13.642,2712.516,81
-12.516,81
12.189
20122013
121.037.553
Mata Uang Asing /
9.670
131.920.751
6,50%7%
2013 2012
2013
7%TMI II 1999
55 Tahun/YearsTMI II 1999
20122013Mata Uang Asing /
0,70%0,91%412.038.932
2012
Foreign CurrencyForeign Currency
7,5%
629.840.087
8,38% 0,00%
626.007.6341.407.970.623
2.046.142.851 -
Pada tanggal-tanggal 31 Desember 2013 dan 2012 Entitas mempunyai asetmoneter dalam mata uang asing sebagai berikut :
Pada tanggal-tanggal 31 Desember 2013 dan 2012 kurs konversi yang digunakanEntitas sebagai berikut :
The Entity's monetary assets in foreign currency as of December 31, 2013 and2012 are as follows :
The exchange rate used as of December 31, 2013 and 2012 are as follows :
The Entity provided loan to its employees in relation to the Entity'sshares ownership.
The Employees which obtain loan from the Entity are the key personnel.
One of founder (sponsor) Reksa PG Sejahtera (Mutual Fund) is keypersonnel and shareholders of the Entity.
Asumsi-asumsi utama yang digunakan untuk menentukan liabilitas manfaatkaryawan pada tanggal 31 Desember 2013 dan 2012 adalah sebagai berikut :
The principal assumptions used to determine employee benefit liability as ofDecember 31, 2013 and 2012 are as follows :
Karyawan yang memperoleh pinjaman dari Entitas merupakan karyawankunci.
Salah satu sponsor dari Reksa PG Sejahtera merupakan karyawan kunci danpemegang saham dari Entitas.
Entitas memberikan kepemilikan saham Entitas kepada karyawan.
31
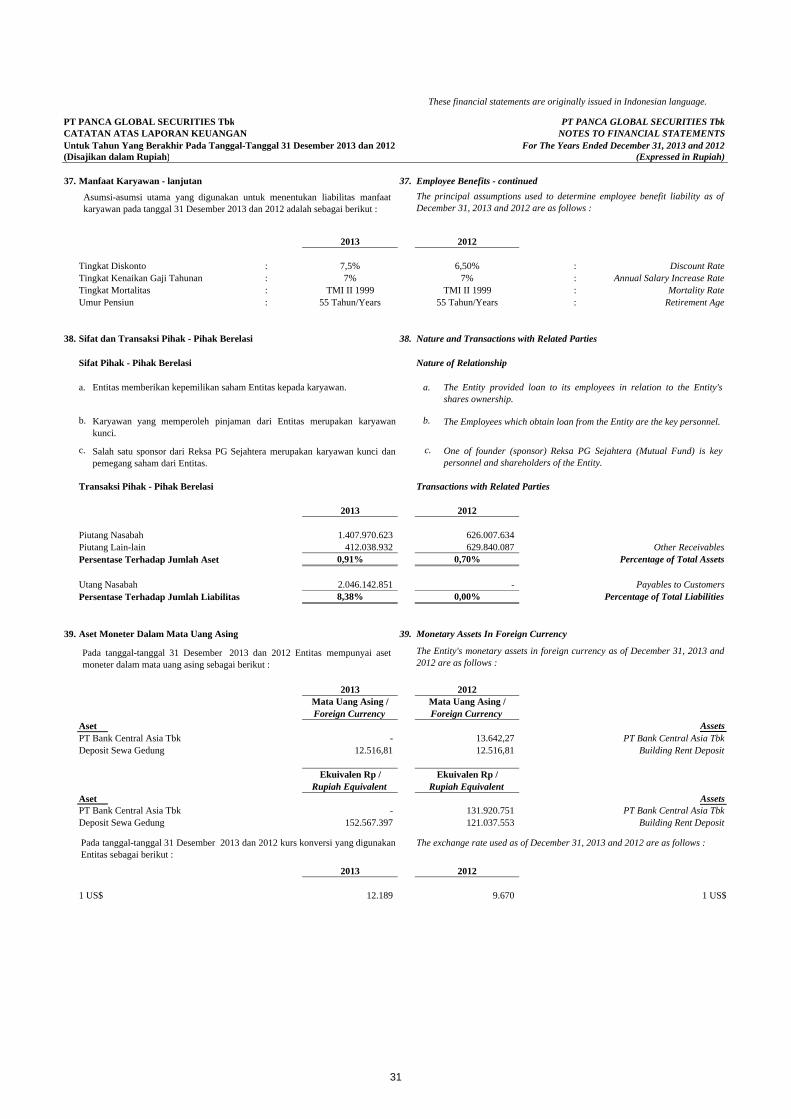
31
PT PANCA GLOBAL SECURITIES Tbk PT PANCA GLOBAL SECURITIES TbkCATATAN ATAS LAPORAN KEUANGAN NOTES TO FINANCIAL STATEMENTSUntuk Tahun Yang Berakhir Pada Tanggal-Tanggal 31 Desember 2013 dan 2012 For The Years Ended December 31, 2013 and 2012(Disajikan dalam Rupiah) (Expressed in Rupiah)
These financial statements are originally issued in Indonesian language.
35. Administrasi dan Umum 35. General and Administrative
Akun ini terdiri dari : This account consists of :Manfaat Karyawan Employee BenefitInfo Teknologi Informations TechnologyPemeliharaan Peralatan Kantor Office Equipments MaintenancePemeliharaan Kendaraan Vehicle MaintenancePendidikan dan Pelatihan TrainingTelekomunikasi CommunicationsJasa Profesional Professional FeesBAE dan SRO BAE and SROSumbangan DonationIklan dan Promosi Advertising and PromotionAsuransi InsuranceAlat Tulis Kantor dan Administrasi Stationary and AdministrationBeban Pajak Tax ExpensesJamuan EntertaintTransportasi dan Perjalanan Dinas Transportation and TravellingKonsumsi ConsumptionBeban Administrasi Bank Bank ChargesSurat Kabar, Majalah dan Buku Newspaper, Magazine and BookKeanggotaan MembershipKesehatan MedicalPerlengkapan Dapur Pantry UtilitiesRepresentasi RepresentationsLain-lain OthersJumlah Total
36. Rekening Efek 36. Securities Account
37. Manfaat Karyawan 37. Employee Benefits
a. Liabilitas Manfaat Karyawan a. Employee Benefits Liability
Nilai Kini Liabilitas Manfaat Karyawan Present Value of Employee Benefits ObligationBiaya Jasa Lalu yang Belum Diakui - Belum Menjadi H Unrecognized Past Service Cost - Non VestedKerugian Aktuarial yang Belum Diakui Unrecognized Actuarial LossLiabilitas Manfaat Karyawan Total Employee Benefits Liability
b. Beban Manfaat Karyawan b. Employee Benefits Expenses
Biaya Jasa Kini Current Service CostBiaya Bunga Interest CostAmortisasi Biaya Jasa Lalu yang Belum Diakui Amortization of Past Service CostKerugian Aktuarial yang Belum Diakui Unrecognized Actuarial LossBeban Manfaat Karyawan Total Benefits Expenses
Saldo Awal Beginning BalancePembayaran imbalan kerja Benefit paid directly by companyBeban Manfaat Karyawan Employee Benefits ExpenseSaldo Akhir Ending Balance
66.600.000
2013
73.150.482
15.025.000
536.027.000 545.395.966
2012
67.225.680
227.757.901168.309.427118.703.408
93.218.816 74.809.616-85.166.800
80.026.201
68.400.000
15.479.303
29.937.021
40.108.400
38.893.107
39.134.86745.873.50034.231.850
52.333.32253.499.988
16.513.895
31.096.065
23.183.886
37.858.804
42.336.150
20122013
39.898.000
18.067.319
29.878.800
5.703.372
10.148.640
39.939.000
1.412.854.067
8.502.4146.000.000
14.573.251
1.508.463.511
8.296.979
3.527.193
2.565.045
5.500.0002.985.300
4.935.810
241.376.0003.639.299.000
3.402.733.000 2.984.771.000(5.144.000)
144.519.0003.124.146.000
(4.810.000)
343.039.000
2013 2012
371.961.000
545.395.966536.027.000
2.578.750.034
192.654.000 173.101.000334.000
- (34)334.000
545.395.966536.027.000
3.124.146.000-(20.874.000)
3.124.146.0003.639.299.000
500.000 -
Entitas memberikan manfaat karyawan kepada karyawan yang mencapai usiapensiun 55 tahun didasarkan atas Undang-Undang Tenaga Kerja No. 13/2003tanggal 25 Maret 2003. Entitas mencatat penyisihan untuk kesejahteraankaryawan sesuai yang ditentukan pada Undang-Undang tersebut sebesar Rp.536.027.000,- dan Rp. 545.395.966,- masing-masing untuk tahun yang berakhirpada tanggal 31 Desember 2013 dan 2012. Manajemen berkeyakinan bahwaperhitungan penyisihan atas uang penghargaan karyawan tersebut memadai untukmemenuhi pembayaran manfaat karyawan dimasa yang akan datang sesuai yangdipersyaratkan Undang - Undang tersebut.
The Entity provides post-employment benefits for its employees who achievedthe retirement age of 55 based on the provisions of Labor Law No. 13/2003dated March 25, 2003. The Entity has recorded allowance for employee benefitaccordance with this regulation amounted to Rp. 536,027,000,- and Rp.545,395,966,- as of December 31, 2013 and 2012, respectively. Managementbelieves that the calculation of allowance for employee benefit is adequate tocover benefit payment in the future are reasonable based on the regulation.
Pada tanggal 31 Desember 2013 dan 2012, entitas mengelola efek dan dananasabah dalam rekening efek sebesar Rp. 1.328.866.906.666,- dan Rp.989.195.763.016,-. Jumlah ini dan liabilitas kepada nasabah yang terkait tidakdiakui dalam laporan posisi keuangan entitas.
As of December 31, 2013 and 2012 the entity manages clients funds andsecurities in securities account amounted to Rp. 1,328,866,906,666,- and Rp.989,195,763,016,- .This amount and liabilities related to the client is notrecognized in the statement of financial position of the entity.
30
PT PANCA GLOBAL SECURITIES Tbk PT PANCA GLOBAL SECURITIES TbkCATATAN ATAS LAPORAN KEUANGAN NOTES TO FINANCIAL STATEMENTSUntuk Tahun Yang Berakhir Pada Tanggal-Tanggal 31 Desember 2013 dan 2012 For The Years Ended December 31, 2013 and 2012(Disajikan dalam Rupiah) (Expressed in Rupiah)
These financial statements are originally issued in Indonesian language.
37. Manfaat Karyawan - lanjutan 37. Employee Benefits - continued
Tingkat Diskonto : : Discount RateTingkat Kenaikan Gaji Tahunan : : Annual Salary Increase RateTingkat Mortalitas : : Mortality RateUmur Pensiun : : Retirement Age
38. Sifat dan Transaksi Pihak - Pihak Berelasi 38. Nature and Transactions with Related Parties
Sifat Pihak - Pihak Berelasi Nature of Relationship
a. a.
b. b.
c. c.
Transaksi Pihak - Pihak Berelasi Transactions with Related Parties
Piutang NasabahPiutang Lain-lain Other ReceivablesPersentase Terhadap Jumlah Aset Percentage of Total Assets
Utang Nasabah Payables to CustomersPersentase Terhadap Jumlah Liabilitas Percentage of Total Liabilities
39. Aset Moneter Dalam Mata Uang Asing 39. Monetary Assets In Foreign Currency
Aset AssetsPT Bank Central Asia Tbk PT Bank Central Asia TbkDeposit Sewa Gedung Building Rent Deposit
Aset AssetsPT Bank Central Asia Tbk PT Bank Central Asia TbkDeposit Sewa Gedung Building Rent Deposit
1 US$ 1 US$
Rupiah Equivalent
-152.567.397
55 Tahun/Years
Rupiah EquivalentEkuivalen Rp / Ekuivalen Rp /
13.642,2712.516,81
-12.516,81
12.189
20122013
121.037.553
Mata Uang Asing /
9.670
131.920.751
6,50%7%
2013 2012
2013
7%TMI II 1999
55 Tahun/YearsTMI II 1999
20122013Mata Uang Asing /
0,70%0,91%412.038.932
2012
Foreign CurrencyForeign Currency
7,5%
629.840.087
8,38% 0,00%
626.007.6341.407.970.623
2.046.142.851 -
Pada tanggal-tanggal 31 Desember 2013 dan 2012 Entitas mempunyai asetmoneter dalam mata uang asing sebagai berikut :
Pada tanggal-tanggal 31 Desember 2013 dan 2012 kurs konversi yang digunakanEntitas sebagai berikut :
The Entity's monetary assets in foreign currency as of December 31, 2013 and2012 are as follows :
The exchange rate used as of December 31, 2013 and 2012 are as follows :
The Entity provided loan to its employees in relation to the Entity'sshares ownership.
The Employees which obtain loan from the Entity are the key personnel.
One of founder (sponsor) Reksa PG Sejahtera (Mutual Fund) is keypersonnel and shareholders of the Entity.
Asumsi-asumsi utama yang digunakan untuk menentukan liabilitas manfaatkaryawan pada tanggal 31 Desember 2013 dan 2012 adalah sebagai berikut :
The principal assumptions used to determine employee benefit liability as ofDecember 31, 2013 and 2012 are as follows :
Karyawan yang memperoleh pinjaman dari Entitas merupakan karyawankunci.
Salah satu sponsor dari Reksa PG Sejahtera merupakan karyawan kunci danpemegang saham dari Entitas.
Entitas memberikan kepemilikan saham Entitas kepada karyawan.
31

32
PT PANCA GLOBAL SECURITIES Tbk PT PANCA GLOBAL SECURITIES TbkCATATAN ATAS LAPORAN KEUANGAN NOTES TO FINANCIAL STATEMENTSUntuk Tahun Yang Berakhir Pada Tanggal-Tanggal 31 Desember 2013 dan 2012 For The Years Ended December 31, 2013 and 2012(Disajikan dalam Rupiah) (Expressed in Rupiah)
These financial statements are originally issued in Indonesian language.
40. Reklasifikasi Akun 40. Reclassification Of Accounts
Utang Pajak TaxationBiaya Yang Masih Harus Dibayar Accrued Expenses
41. Tanggung Jawab Manajemen atas Laporan Keuangan 41. The Management's Responsibility on The Financial Statements
After Reclassification Before Reclassification
Sesudah
719.994.862 719.994.862
410.694.654309.300.208
288.234.258431.760.604
SebelumReklasifikasi/ Reklasifikasi/
Manajemen Entitas bertanggung jawab atas penyajian laporan keuangan yangtelah diselesaikan pada tanggal 30 Januari 2014.
The management of the Entity is responsible for the preparation of thisfinancial statement that was completed on January 30, 2014.
Beberapa akun tertentu dalam laporan keuangan tahun 2012 telah direklasifikasiagar sesuai dengan penyajian laporan keuangan tahun 2013.
Certain accounts in 2012 financial statements have been reclassified toconform with the presentation of accounts in the 2013 financial statements.
Berikut disajikan pos-pos penting dalam laporan keuangan tahun 2012 sesudahdan sebelum direklasifikasi:
The following is a summary of significant accounts in 2012 financial statementsbefore and after reclassifications:
32
Pt Panca global Securities tbk
Indonesia Stock Exchange Building, Tower I Suite 1706AJl. Jend. Sudirman Kav. 52-53, Jakarta 12190Phone. (62 21) 515 5456, Fax. (62 21) 515 5466Email : [email protected]