bulelengkab.go.id · KATA PENGANTAR Publikasi INDIKATOR EKONOMI merupakan publikasi bul anan Badan...
177
KATA PENGANTAR Publikasi INDIKATOR EKONOMI merupakan publikasi bulanan Badan Pusat Statistik (BPS) yang terbit sejak bulan Januari 1970, yang terus mengalami penyempurnaan secara bertahap. Publikasi ini berisi tabel-tabel yang memuat statistik ekonomi yang dibutuhkan para pemakai data untuk berbagai keperluan pengamatan dan analisa ekonomi. Data statistik yang disajikan dalam INDIKATOR EKONOMI dihimpun dan disiapkan oleh unit kerja-unit kerja yang ada di BPS, namun beberapa statistik diperoleh dari instansi lain, seperti Bank Indonesia, Badan Koordinasi Penanaman Modal (BKPM), dan lain-lain. Setelah mulai edisi Maret 1993, INDIKATOR EKONOMI dilengkapi dengan ulasan singkat tentang beberapa indikator ekonomi yang dianggap cukup menonjol, maka mulai edisi Januari 2006, ulasan singkat sudah mencakup hampir seluruh sub bab yang ada. Akhirnya, penghargaan dan ucapan terima kasih disampaikan kepada semua pihak yang telah memungkinkan tersusunnya publikasi INDIKATOR EKONOMI. Kepada para pemakai publikasi ini diharapkan kritik dan saran yang bersifat konstruktif untuk penyempurnaan publikasi INDIKATOR EKONOMI, agar lebih memudahkan para pemakai data untuk memperoleh gambaran umum mengenai perkembangan ekonomi Indonesia. KEPALA BADAN PUSAT STATISTIK i https://www.bps.go.id
Transcript of bulelengkab.go.id · KATA PENGANTAR Publikasi INDIKATOR EKONOMI merupakan publikasi bul anan Badan...

KATA PENGANTAR
Publikasi INDIKATOR EKONOMI merupakan publikasi bulanan Badan Pusat Statistik (BPS) yang terbit sejak bulan Januari 1970, yang terus mengalami penyempurnaan secara bertahap. Publikasi ini berisi tabel-tabel yang memuat statistik ekonomi yang dibutuhkan para pemakai data untuk berbagai keperluan pengamatan dan analisa ekonomi.
Data statistik yang disajikan dalam INDIKATOR EKONOMI dihimpun dan disiapkan oleh unit kerja-unit kerja yang ada di BPS, namun beberapa statistik diperoleh dari instansi lain, seperti Bank Indonesia, Badan Koordinasi Penanaman Modal (BKPM), dan lain-lain.
Setelah mulai edisi Maret 1993, INDIKATOR EKONOMI dilengkapi dengan ulasan singkat tentang beberapa indikator ekonomi yang dianggap cukup menonjol, maka mulai edisi Januari 2006, ulasan singkat sudah mencakup hampir seluruh sub bab yang ada.
Akhirnya, penghargaan dan ucapan terima kasih disampaikan kepada semua pihak yang telah memungkinkan tersusunnya publikasi INDIKATOR EKONOMI.
Kepada para pemakai publikasi ini diharapkan kritik dan saran yang bersifat konstruktif untuk penyempurnaan publikasi
INDIKATOR EKONOMI, agar lebih memudahkan para pemakai data untuk memperoleh gambaran umum mengenai perkembangan ekonomi Indonesia.
KEPALA BADAN PUSAT STATISTIK
i
https:
//www.b
ps.go.id

P R E F A C E
ECONOMIC INDICATORS is a monthly publication issued by BPS – Statistics Indonesia since 1970, which has undergone gradual improvement. This publication contains statistical economic data in the form of tables needed for economic observations and analyses.
ECONOMIC INDICATORS presents the statistical economic data collected and prepared by several divisions at BPS and other institutions such as Bank Indonesia and the Capital Investment Coordinating Board (BKPM).
Since the March 1993 edition, ECONOMIC INDICATORS has been completed with highlights for several important indicators. And then, starting with the January 2006 edition, the highlights have covered almost all indicators presented.
Finally, appreciation and thanks are conveyed to all parties involved in preparing this publication.
Constructive critiques and suggestions are welcomed to improve this publication, in order for users to be able to get a general picture of the development of the Indonesian economy easily.
The Director General of BPS – Statistics Indonesia
ii
https:
//www.b
ps.go.id
iii
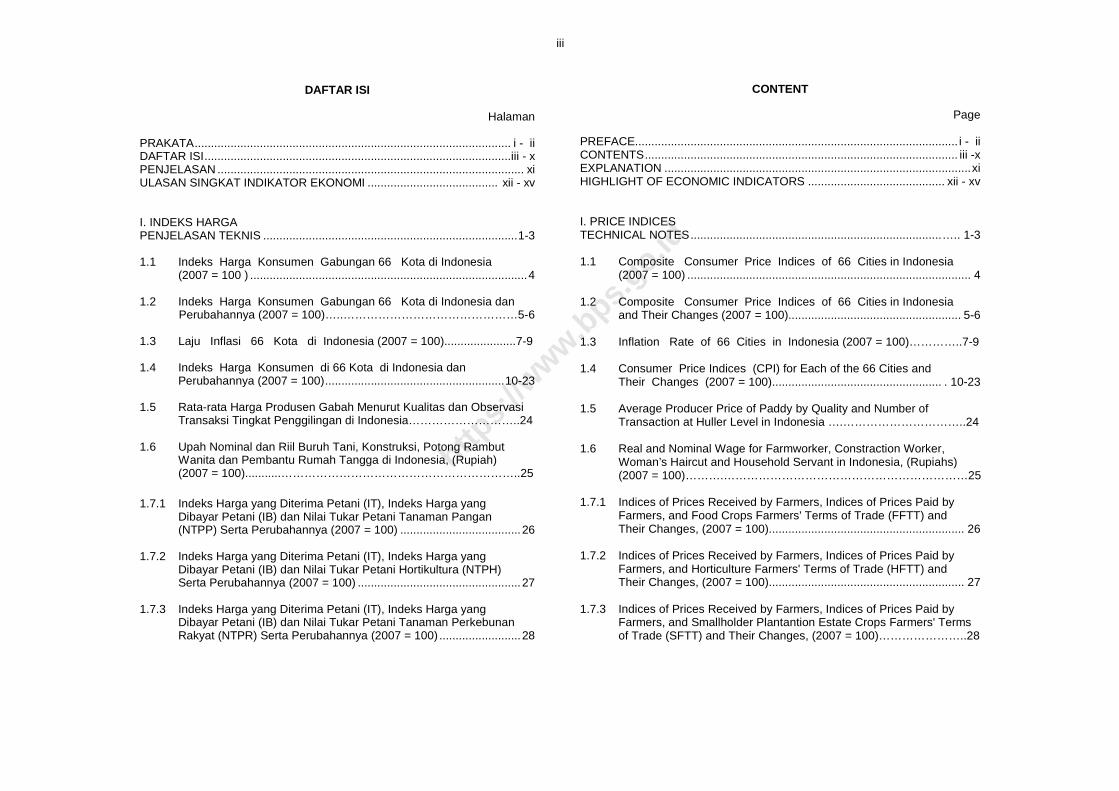
DAFTAR ISI Halaman PRAKATA................................................................................................. i - ii DAFTAR ISI..............................................................................................iii - x PENJELASAN .............................................................................................. xi ULASAN SINGKAT INDIKATOR EKONOMI ........................................ xii - xv I. INDEKS HARGA PENJELASAN TEKNIS ..............................................................................1-3 1.1 Indeks Harga Konsumen Gabungan 66 Kota di Indonesia
(2007 = 100 ) .....................................................................................4 1.2 Indeks Harga Konsumen Gabungan 66 Kota di Indonesia dan Perubahannya (2007 = 100)…..………………………………………5-6 1.3 Laju Inflasi 66 Kota di Indonesia (2007 = 100)......................7-9 1.4 Indeks Harga Konsumen di 66 Kota di Indonesia dan
Perubahannya (2007 = 100).......................................................10-23
1.5 Rata-rata Harga Produsen Gabah Menurut Kualitas dan Observasi Transaksi Tingkat Penggilingan di Indonesia………………………..24
1.6 Upah Nominal dan Riil Buruh Tani, Konstruksi, Potong Rambut
Wanita dan Pembantu Rumah Tangga di Indonesia, (Rupiah) (2007 = 100)...........……………………………………………………..25
1.7.1 Indeks Harga yang Diterima Petani (IT), Indeks Harga yang Dibayar Petani (IB) dan Nilai Tukar Petani Tanaman Pangan (NTPP) Serta Perubahannya (2007 = 100) .....................................26
1.7.2 Indeks Harga yang Diterima Petani (IT), Indeks Harga yang
Dibayar Petani (IB) dan Nilai Tukar Petani Hortikultura (NTPH) Serta Perubahannya (2007 = 100) ..................................................27
1.7.3 Indeks Harga yang Diterima Petani (IT), Indeks Harga yang
Dibayar Petani (IB) dan Nilai Tukar Petani Tanaman Perkebunan Rakyat (NTPR) Serta Perubahannya (2007 = 100) .........................28
CONTENT Page PREFACE................................................................................................... i - ii CONTENTS................................................................................................ iii -x EXPLANATION ..............................................................................................xi HIGHLIGHT OF ECONOMIC INDICATORS .......................................... xii - xv I. PRICE INDICES TECHNICAL NOTES.............................................................................….. 1-3 1.1 Composite Consumer Price Indices of 66 Cities in Indonesia
(2007 = 100) ....................................................................................... 4 1.2 Composite Consumer Price Indices of 66 Cities in Indonesia
and Their Changes (2007 = 100)..................................................... 5-6 1.3 Inflation Rate of 66 Cities in Indonesia (2007 = 100)…………..7-9 1.4 Consumer Price Indices (CPI) for Each of the 66 Cities and
Their Changes (2007 = 100).................................................... . 10-23
1.5 Average Producer Price of Paddy by Quality and Number of Transaction at Huller Level in Indonesia ….…………………………..24
1.6 Real and Nominal Wage for Farmworker, Constraction Worker,
Woman’s Haircut and Household Servant in Indonesia, (Rupiahs) (2007 = 100)……….………………………………………………………25 1.7.1 Indices of Prices Received by Farmers, Indices of Prices Paid by
Farmers, and Food Crops Farmers' Terms of Trade (FFTT) and Their Changes, (2007 = 100)............................................................ 26
1.7.2 Indices of Prices Received by Farmers, Indices of Prices Paid by
Farmers, and Horticulture Farmers' Terms of Trade (HFTT) and Their Changes, (2007 = 100)............................................................ 27
1.7.3 Indices of Prices Received by Farmers, Indices of Prices Paid by
Farmers, and Smallholder Plantantion Estate Crops Farmers' Terms of Trade (SFTT) and Their Changes, (2007 = 100)…………………..28
https:
//www.b
ps.go.id

iv
1.7.4 Indeks Harga yang Diterima Petani (IT), Indeks Harga yang Dibayar Petani (IB) dan Nilai Tukar Petani Peternakan (NTPT) Serta Perubahannya (2007 = 100) ..................................................29
1.7.5 Indeks Harga yang Diterima Petani (IT), Indeks Harga yang
Dibayar Petani (IB) dan Nilai Tukar Nelayan (NTN) Serta Perubahannya (2007 = 100) ..................................................30
1.7.6 Indeks Harga yang Diterima Petani (IT), Indeks Harga yang
Dibayar Petani (IB) dan Nilai Tukar Petani (NTP) Serta Perubahannya (2007 = 100) ..................................................31
1.8.1 Indeks Harga yang Diterima Petani (IT), Indeks Harga yang Dibayar Petani (IB) dan Nilai Tukar Petani Tanaman Pangan (NTPP) Menurut Provinsi (2007 = 100) ...........................................32
1.8.2 Indeks Harga yang Diterima Petani (IT), Indeks Harga yang
Dibayar Petani (IB) dan Nilai Tukar Petani Hortikultura (NTPH) Menurut Provinsi (2007 = 100) .......................................................33
1.8.3 Indeks Harga yang Diterima Petani (IT), Indeks Harga yang
Dibayar Petani (IB) dan Nilai Tukar Petani Tanaman Perkebunan Rakyat (NTPR) Menurut Provinsi (2007 = 100) ..............................34
1.8.4 Indeks Harga yang Diterima Petani (IT), Indeks Harga yang Dibayar Petani (IB) dan Nilai Tukar Petani Peternakan (NTPT) Menurut Provinsi (2007 = 100) ........................................................35
1.8.5 Indeks Harga yang Diterima Petani (IT), Indeks Harga yang
Dibayar Petani (IB) dan Nilai Tukar Nelayan (NTN) Menurut Provinsi (2007 = 100) .......................................................36
1.8.6 Indeks Harga yang Diterima Petani (IT), Indeks Harga yang
Dibayar Petani (IB) dan Nilai Tukar Petani (NTP) Menurut Provinsi (2007 = 100) .......................................................37
1.9 Indeks Harga Perdagangan Besar, Sektor Pertanian, Pertambangan dan Penggalian (2005=100) ……………………..38 1.10 Indeks Harga Perdagangan Besar, Sektor Industri,
(2005=100) .................................................................................39-40
1.7.4 Indices of Prices Received by Farmers, Indices of Prices Paid by Farmers, and Animal Husbandry Farmers' Terms of Trade (AFTT) and Their Changes, (2007 = 100)..................................................... 29
1.7.5 Indices of Prices Received by Fishermen, Indices of Prices Paid by
Fishermen and Fisherman’ Terms of Trade (FTT) and Their Changes, (2007 = 100)............................................................ 30
1.7.6 Indices of Prices Received by Farmers, Indices of Prices Paid by
Farmers, and Farmers' Terms of Trade (FTT) and Their Changes, (2007 = 100)............................................................ 31
1.8.1 Indices of Prices Received by Farmers, Indices of Prices Paid by
Farmers, and Food Crops Farmers' Terms of Trade (FFTT) by Province, (2007 = 100) ................................................................ 32
1.8.2 Indices of Prices Received by Farmers, Indices of Prices Paid by
Farmers, and Horticulture Farmers' Terms of Trade (HFTT) by Province, (2007 = 100) ................................................................ 33
1.8.3 Indices of Prices Received by Farmers, Indices of Prices Paid by
Farmers, and Smallholder Plantantion Estate Crops Farmers' Terms of Trade (SFTT) by Province, (2007 = 100)………………...…………34
1.8.4 Indices of Prices Received by Farmers, Indices of Prices Paid by
Farmers, and Animal Husbandry Farmers' Terms of Trade (AFTT) by Province, (2007 = 100) ................................................................ 35
1.8.5 Indices of Prices Received by Fishermen, Indices of Prices Paid by
Fishermen and Fisherman’ Terms of Trade (FTT) by Province, (2007 = 100) ................................................................ 36
1.8.6 Indices of Prices Received by Farmers, Indices of Prices Paid by
Farmers, and Farmers' Terms of Trade (FTT) by Province, (2007 = 100) ................................................................ 37
1.9 Wholesale Price Indices, of Agricultural, Mining and Quarrying Sectors (2005=100) ......................................................................... 38 1.10 Wholesale Price Indices of Manufactured Sector
(2005=100) .................................................................................. 39-40
https:
//www.b
ps.go.id

v
1.11 Indeks Harga Perdagangan Besar, Sektor Impor, (2005=100) ......................................................................................41
1.12 Indeks Harga Perdagangan Besar, Sektor Ekspor
(2005=100) .................................................................................42-43 1.13 Indeks Harga Perdagangan Besar Indonesia (2005=100) .............44 1.14 Indeks Harga Perdagangan Besar Bahan Bangunan/Konstruksi Menurut Jenis Konstruksi/Bangunan, (2005=100) ........................45 1.15 Indeks Harga Perdagangan Besar Bahan Bangunan/Konstruksi
Indonesia Menurut Kelompok Jenis Barang (2005=100) ...........46-47 1.16 Perkembangan Harga Rata-rata Valuta Asing dan Emas
di Pasaran Jakarta...........................................................................48 1.17 Perdagangan Saham di Bursa Efek Indonesia................................49 II. KEUANGAN PENJELASAN TEKNIS ...............................................................................50 2.1 Realisasi Penerimaan Negara.........................................................51 2.2 Realisasi Pengeluaran Negara.......................................................52 III. PERBANKAN PENJELASAN TEKNIS ..........................................................................53-54 3.1 Uang Beredar ..................................................................................55 3.2 Posisi Kredit Perbankan dalam Rupiah dan Valuta Asing
Menurut Sektor Ekonomi ............................................................56-57 3.3 Pemberian Kredit oleh Bank Kredit Desa dan Pegadaian
Negara.............................................................................................58
3.4 Suku Bunga Kredit Rupiah Menurut Kelompok Bank......................59 3.5 Posisi Kredit Investasi Perbankan dalam Rupiah dan Valuta
Asing Menurut Sektor Ekonomi .......................................................60 3.6 Suku Bunga Deposito Berjangka Bank Umum................................61
1.11 Wholesale Price Indices of Import Sector (2005=100) ....................................................................................... 41
1.12 Wholesale Price Indices of Export Sector
(2005=100) .................................................................................. 42-43 1.13 Wholesale Price Indices of Indonesia, (2005=100) .......................... 44 1.14 Wholesale Price Indices of Construction Materials by Type of
Construction, (2005=100)................................................................. 45 1.15 Wholesale Price Indices of Construction Materials of Indonesia
By Group of Commodities, (2005=100) ....................................... 46-47 1.16 Average Prices of Foreign Currencies and Gold in
Jakarta Market.................................................................................. 48 1.17 Share Trading at the Indonesia Stock Exchange ............................ 49 II. FINANCE TECHNICAL NOTES.................................................................................... 50 2.1 Actual Government Revenues.......................................................... 51 2.2 Actual Government Expenditures..................................................... 52 III. BANKING TECHNICAL NOTES............................................................................... 53-54 3.1 Money Supply................................................................................... 55 3.2 Outstanding Bank Credits in Rupiah and Foreign
Exchange by Economic Sectors .................................................. 56-57 3.3 Outstanding Credits by Village Credit Institution
and Government Pawnshops ........................................................... 58
3.4 Rupiah Credit Interest Rates By Group of Banks ............................. 59 3.5 Banks' Outstanding Investment Credits in Rupiah and
Foreign Exchange by Economic Sectors.......................................... 60 3.6 Commercial Banks'Interest Rates on Time Deposit ......................... 61
https:
//www.b
ps.go.id

vi
IV. PENANAMAN MODAL PENJELASAN TEKNIS ...............................................................................62 4.1.1 Perkembangan Realisasi Investasi Penanaman Modal Dalam
Negeri Menurut Sektor Ekonomi......................................................63 4.1.2 Perkembangan Realisasi Investasi Penanaman Modal Dalam
Menurut Lokasi................................................................................64 4.2.1 Perkembangan Realisasi Investasi Penanaman Modal Luar
Negeri Menurut Sektor Ekonomi .....................................................65 4.2.2 Perkembangan Realisasi Investasi Penanaman Modal Luar
Negeri Menurut Lokasi.....................................................................66 4.2.3 Perkembangan Realisasi Investasi Penanaman Modal Luar
Negeri Menurut Negara ...................................................................67
V. PRODUKSI PENJELASAN TEKNIS ..........................................................................68-70 5.1 Produksi Tanaman Bahan Makanan ................................................71
5.2 Produksi dan Persediaan Tanaman Perkebunan Besar ..................72 5.3.A Indeks Produksi Bulanan Industri Besar dan Sedang (2000=100) ……………………………………….........……………………73 5.3.B Indeks Produksi Triwulanan dari Kelompok Industri Besar dan Sedang (2000=100) ………………………………………….…...74-75 5.4.1 Produksi Bulanan 8 Bahan Tambang di Indonesia ..........................76 5.4.2 Indeks Produksi Bulanan 8 Bahan Tambang di Indonesia (2000=100)......................................................................................77 5.5 Produksi Minyak Mentah (Termasuk Kondensat) dan Gas .…........78
IV. INVESTMENT TECHNICAL NOTES.................................................................................... 62 4.1.1 Statistic of Domestic Direct Investment Realization by Economic
Sector ……………………………………………………………………..63 4.1.2 Statistic of Domestic Direct Investment Realization by Location ...... 64 4.2.1 Statistic of Foreign Direct Investment Realization by Economic
Sector ............................................................................................... 65 4.2.2 Statistic of Foreign Direct Investment Realization by Location......... 66 4.2.3 Statistic of Foreign Direct Investment Realization by Country………67 V. PRODUCTION TECHNICAL NOTES............................................................................... 68-70 5.1 Production of Food Crops ..................................................................71 5.2 Production and Stocks of Estate Crops..............................................72 5.3.A Monthly Production Indices of Large and Medium Manufacturing
Industry (2000=100)……….………………………..………….…………73 5.3.B Quarterly Production Indices of Large and Medium Manufacturing Industry (2000=100)………………….……………….….……….…. 74-75 5.4.1 Monthly Production of 8 Minerals in Indonesia...................................76 5.4.2 Monthly Production Indices of 8 Minerals in Indonesia
(2000=100).........................................................................................77 5.5 Crude Petroleum (Including Condensate) and Gas Production….....78
https:
//www.b
ps.go.id
vii
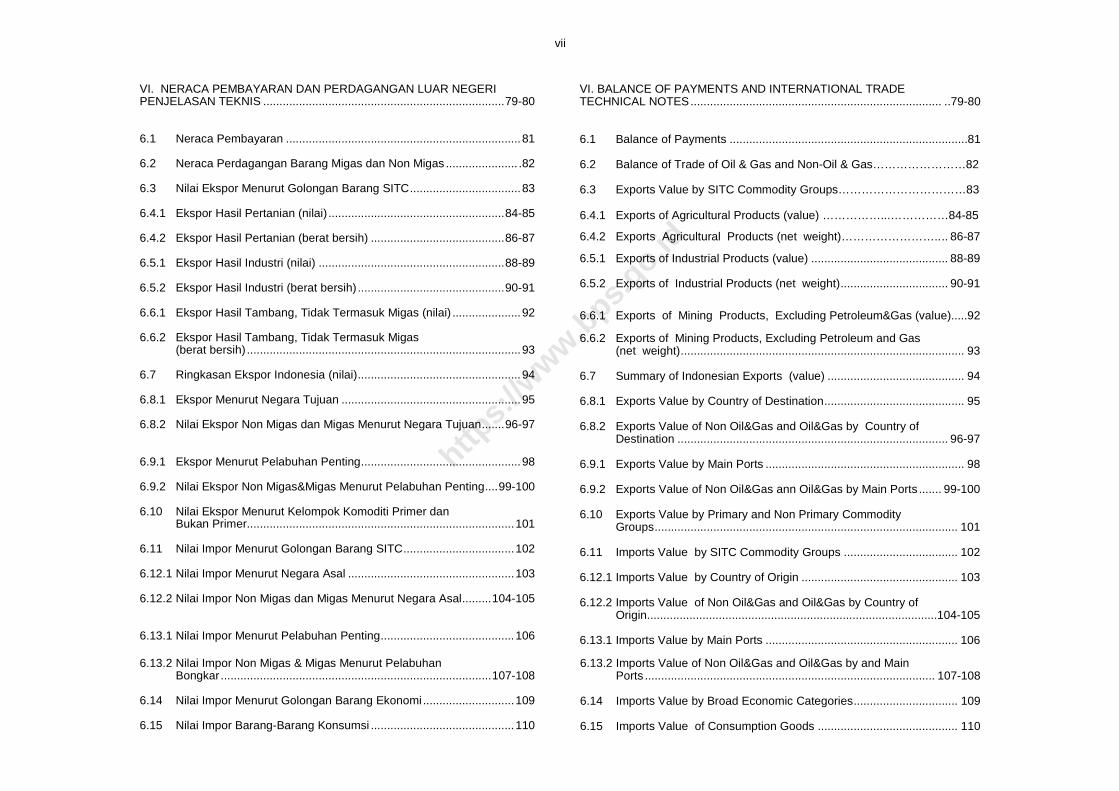
VI. NERACA PEMBAYARAN DAN PERDAGANGAN LUAR NEGERI PENJELASAN TEKNIS ..........................................................................79-80 6.1 Neraca Pembayaran ........................................................................81 6.2 Neraca Perdagangan Barang Migas dan Non Migas ...................... .82 6.3 Nilai Ekspor Menurut Golongan Barang SITC..................................83 6.4.1 Ekspor Hasil Pertanian (nilai) ......................................................84-85 6.4.2 Ekspor Hasil Pertanian (berat bersih) .........................................86-87 6.5.1 Ekspor Hasil Industri (nilai) .........................................................88-89 6.5.2 Ekspor Hasil Industri (berat bersih) .............................................90-91 6.6.1 Ekspor Hasil Tambang, Tidak Termasuk Migas (nilai) .....................92 6.6.2 Ekspor Hasil Tambang, Tidak Termasuk Migas
(berat bersih) ....................................................................................93 6.7 Ringkasan Ekspor Indonesia (nilai)..................................................94 6.8.1 Ekspor Menurut Negara Tujuan .......................................................95 6.8.2 Nilai Ekspor Non Migas dan Migas Menurut Negara Tujuan.......96-97 6.9.1 Ekspor Menurut Pelabuhan Penting.................................................98 6.9.2 Nilai Ekspor Non Migas&Migas Menurut Pelabuhan Penting....99-100 6.10 Nilai Ekspor Menurut Kelompok Komoditi Primer dan
Bukan Primer..................................................................................101 6.11 Nilai Impor Menurut Golongan Barang SITC..................................102 6.12.1 Nilai Impor Menurut Negara Asal ...................................................103 6.12.2 Nilai Impor Non Migas dan Migas Menurut Negara Asal.........104-105 6.13.1 Nilai Impor Menurut Pelabuhan Penting.........................................106
VI. BALANCE OF PAYMENTS AND INTERNATIONAL TRADE TECHNICAL NOTES............................................................................. ..79-80 6.1 Balance of Payments .........................................................................81 6.2 Balance of Trade of Oil & Gas and Non-Oil & Gas……………………82 6.3 Exports Value by SITC Commodity Groups……………………………83 6.4.1 Exports of Agricultural Products (value) ……………...……………84-85
6.4.2 Exports Agricultural Products (net weight)…………………….... 86-87 6.5.1 Exports of Industrial Products (value) .......................................... 88-89 6.5.2 Exports of Industrial Products (net weight)................................. 90-91 6.6.1 Exports of Mining Products, Excluding Petroleum&Gas (value).....92
6.6.2 Exports of Mining Products, Excluding Petroleum and Gas
(net weight)....................................................................................... 93 6.7 Summary of Indonesian Exports (value) .......................................... 94 6.8.1 Exports Value by Country of Destination........................................... 95 6.8.2 Exports Value of Non Oil&Gas and Oil&Gas by Country of
Destination ................................................................................... 96-97 6.9.1 Exports Value by Main Ports ............................................................. 98 6.9.2 Exports Value of Non Oil&Gas ann Oil&Gas by Main Ports ....... 99-100 6.10 Exports Value by Primary and Non Primary Commodity
Groups............................................................................................. 101 6.11 Imports Value by SITC Commodity Groups ................................... 102 6.12.1 Imports Value by Country of Origin ................................................ 103 6.12.2 Imports Value of Non Oil&Gas and Oil&Gas by Country of
Origin.........................................................................................104-105 6.13.1 Imports Value by Main Ports ........................................................... 106
6.13.2 Nilai Impor Non Migas & Migas Menurut Pelabuhan Bongkar...................................................................................107-108 6.14 Nilai Impor Menurut Golongan Barang Ekonomi............................109 6.15 Nilai Impor Barang-Barang Konsumsi ............................................110
6.13.2 Imports Value of Non Oil&Gas and Oil&Gas by and Main Ports ......................................................................................... 107-108 6.14 Imports Value by Broad Economic Categories................................ 109 6.15 Imports Value of Consumption Goods ........................................... 110
https:
//www.b
ps.go.id

viii
6.16 Nilai Impor Bahan Baku dan Penolong ..........................................111 6.17 Nilai Impor Barang-Barang Modal ..................................................112 VII. PERHUBUNGAN PENJELASAN TEKNIS ......................................................................113-114 7.1.1 Bongkar/Muat Barang Angkutan Antar Pulau di 4
Pelabuhan Utama...........................................................................115 7.1.2 Bongkar/Muat Barang Angkutan Luar Negeri di 4
Pelabuhan Utama...........................................................................116
7.2.1 Lalu Lintas Penumpang Angkutan Udara Dalam Negeri di 5 Pelabuhan Udara Utama.........................................................117
7.2.2 Bongkar/Muat Barang Angkutan Udara Dalam Negeri
di 5 Pelabuhan Udara Utama.........................................................118 7.2.3 Lalu Lintas Penumpang Angkutan Udara Luar Negeri
di 4 Pelabuhan Udara Utama.........................................................119 7.2.4 Bongkar/Muat Barang Angkutan Udara Luar Negeri
di 4 Pelabuhan Udara Utama.........................................................120 7.2.5 Lalu Lintas Udara Penerbangan Dalam Negeri..............................121 7.2.6 Lalu Lintas Udara Penerbangan Luar Negeri.................................122 7.3 Produksi Angkutan Kereta Api ....................................................123 7.4 Jumlah Penumpang dan Barang yang Diangkut Menurut Jenis Angkutan Dalam Negeri........................................................124
VIII. HOTEL DAN PARIWISATA PENJELASAN TEKNIS .............................................................................125 8.1.1 Tingkat Penghunian Kamar pada Hotel Berbintang
di 17 Provinsi Daerah Tujuan Wisata, ...........................................126 8.1.2 Tingkat Penghunian Kamar pada Hotel Berbintang
di Provinsi Lainnya .........................................................................127 8.1.3 Tingkat Penghunian Kamar pada Hotel Tidak Berbintang……….128
8.2.1 Rata-rata Lama Menginap Tamu Asing dan Tamu Dalam Negeri
pada Hotel Berbintang di 17 Provinsi Daerah Tujuan Wisata, ..........................................................................................129
6.16 Imports Value of Raw Materials and Auxiliary Goods ................... 111 6.17 Imports Value of Capital Goods ...................................................... 112 VII. TRANSPORTATION TECHNICAL NOTES........................................................................... 113-114 7.1.1 Volume of Inter-Island Cargo Loaded/Unloaded at 4 Main
Sea Ports......................................................................................... 115 7.1.2 Volume of International Cargo Loaded/Unloaded at 4 Main
Sea Ports......................................................................................... 116
7.2.1 Domestic Aircraft Passengers Traffic at 5 Main Airports .............. 117
7.2.2 Volume of Domestic Aircraft Cargo Loaded/Unloaded at 5 Main Airports ........................................................................................... 118
7.2.3 International Aircraft Passengers Traffic at 4 Main
Airports ............................................................................................ 119 7.2.4 Volume of International Aircraft Loaded/Unloaded at 4 Main
Airports ............................................................................................ 120 7.2.5 Domestic Aircraft Traffic .................................................................. 121 7.2.6 International Aircraft Traffic ............................................................. 122 7.3 Production of Railways.................................................................... 123 7.4 Number of Passenger and Freigth by Domestic Cargo................... 124
VIII. HOTEL AND TOURISM TECHNICAL NOTES.................................................................................. 125 8.1.1 Room Occupancy Rate of Classified Hotels in 17 Provinces of Main Tourist Destination , ……...……………………………………126 8.1.2 Room Occupancy Rate of Classified Hotels in
Other Provinces............................................................................... 127 8.1.3 Room Occupancy Rate of Non Classified Hotels......................... 128 8.2.1 Average Length of Stay of Foreign and Domestic Guest at
Classified Hotels in 17 Provinces of Main Tourist Destination, ................................................................................... 129
https:
//www.b
ps.go.id
ix
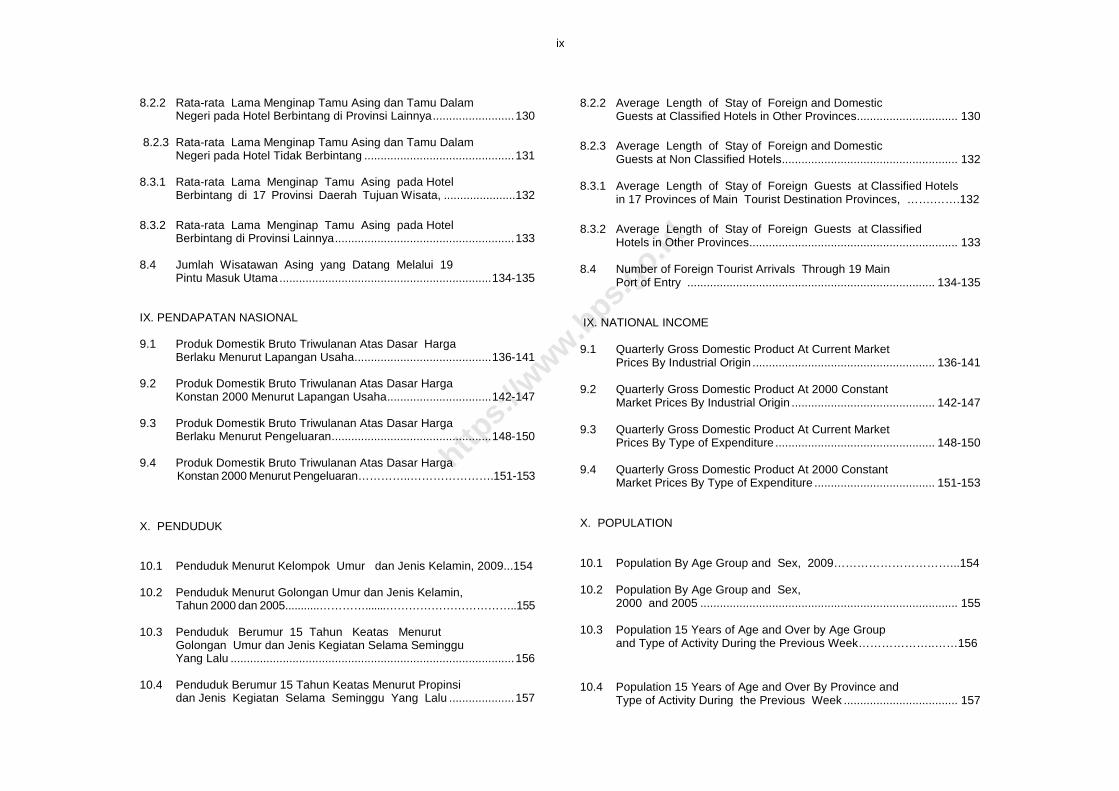
8.2.2 Rata-rata Lama Menginap Tamu Asing dan Tamu Dalam
Negeri pada Hotel Berbintang di Provinsi Lainnya.........................130
8.2.3 Rata-rata Lama Menginap Tamu Asing dan Tamu Dalam Negeri pada Hotel Tidak Berbintang ..............................................131
8.3.1 Rata-rata Lama Menginap Tamu Asing pada Hotel Berbintang di 17 Provinsi Daerah Tujuan Wisata, ......................132
8.3.2 Rata-rata Lama Menginap Tamu Asing pada Hotel Berbintang di Provinsi Lainnya.......................................................133
8.4 Jumlah Wisatawan Asing yang Datang Melalui 19
Pintu Masuk Utama.................................................................134-135 IX. PENDAPATAN NASIONAL 9.1 Produk Domestik Bruto Triwulanan Atas Dasar Harga
Berlaku Menurut Lapangan Usaha..........................................136-141
9.2 Produk Domestik Bruto Triwulanan Atas Dasar Harga Konstan 2000 Menurut Lapangan Usaha................................142-147
9.3 Produk Domestik Bruto Triwulanan Atas Dasar Harga
Berlaku Menurut Pengeluaran.................................................148-150 9.4 Produk Domestik Bruto Triwulanan Atas Dasar Harga Konstan 2000 Menurut Pengeluaran…………..………………….151-153
X. PENDUDUK 10.1 Penduduk Menurut Kelompok Umur dan Jenis Kelamin, 2009...154 10.2 Penduduk Menurut Golongan Umur dan Jenis Kelamin, Tahun 2000 dan 2005...........………….......……………………………..155 10.3 Penduduk Berumur 15 Tahun Keatas Menurut Golongan Umur dan Jenis Kegiatan Selama Seminggu Yang Lalu .......................................................................................156 10.4 Penduduk Berumur 15 Tahun Keatas Menurut Propinsi dan Jenis Kegiatan Selama Seminggu Yang Lalu ....................157
8.2.2 Average Length of Stay of Foreign and Domestic
Guests at Classified Hotels in Other Provinces............................... 130
8.2.3 Average Length of Stay of Foreign and Domestic Guests at Non Classified Hotels...................................................... 132
8.3.1 Average Length of Stay of Foreign Guests at Classified Hotels
in 17 Provinces of Main Tourist Destination Provinces, …….…….132
8.3.2 Average Length of Stay of Foreign Guests at Classified Hotels in Other Provinces................................................................ 133
8.4 Number of Foreign Tourist Arrivals Through 19 Main
Port of Entry ............................................................................ 134-135 IX. NATIONAL INCOME 9.1 Quarterly Gross Domestic Product At Current Market
Prices By Industrial Origin ........................................................ 136-141 9.2 Quarterly Gross Domestic Product At 2000 Constant
Market Prices By Industrial Origin ............................................ 142-147 9.3 Quarterly Gross Domestic Product At Current Market
Prices By Type of Expenditure ................................................. 148-150 9.4 Quarterly Gross Domestic Product At 2000 Constant
Market Prices By Type of Expenditure ..................................... 151-153 X. POPULATION 10.1 Population By Age Group and Sex, 2009…………………………...154 10.2 Population By Age Group and Sex,
2000 and 2005 ............................................................................... 155 10.3 Population 15 Years of Age and Over by Age Group and Type of Activity During the Previous Week………………..……156
10.4 Population 15 Years of Age and Over By Province and Type of Activity During the Previous Week ................................... 157
https:
//www.b
ps.go.id
x
10.5 Penduduk Berumur 15 Tahun Keatas Yang Bekerja Selama Seminggu Yang Lalu Menurut Propinsi dan Lapangan Pekerjaan Utama...........................................................158 10.6 Penduduk Berumur 15 Tahun Keatas Yang Bekerja Selama Seminggu Yang Lalu Menurut Propinsi dan Status Pekerjaan Utama ................................................................159 10.7 Penduduk Berumur 15 Tahun Keatas yang Bekerja Selama Seminggu Yang Lalu Menurut Jumlah Jam pada Pekerjaan Utama dan Lapangan Pekerjaan Utama.......................160 10.8 Penduduk Berumur 15 Tahun Keatas yang Bekerja Selama Seminggu Yang Lalu Menurut Jenis Pekerjaan Utama dan Pendidikan Tertinggi yang ditamatkan ……………………………….161
10.5 Population 15 Years of Age and Over Who Worked During The Previous Week By Province and Main Industry............................................................................................ 158 10.6 Population 15 Years of Age and Over Who Worked During The Previous Week By Province, and Main
Employment Status ......................................................................... 159 10.7 Population 15 Years of Age and Over Who Worked During The Previous Week By Total Working Hour on Main Job and Main Industry ........................................................... 160 10.8 Population 15 Yearsof Age and Over Who Worked During The Previous Week By Main Occupation and Educational Attainment…………………………………………………161
https:
//www.b
ps.go.id

PENJELASAN TANDA :
... Data belum tersedia - Data tidak tersedia
0 Data dapat diabaikan , Tanda desimal x) Angka sementara xx) Angka sangat sementara xxx) Angka sangat-sangat sementara r) Angka diperbaiki e) Angka perkiraan
SATUAN :
Bal = 1250 m = 180 kg Barel = 158,99 liter 1 = ──────── m3 6,2898 Bata = 500 gram Batang (untuk sabun : 400 gram) Botol = 700 cc Buah Bungkus Butir Helai Kilogram (kg) Lembar Liter = 0,80 kg (untuk beras) Long ton = 1016,05 kg Lusin 1 mcf = ────── m3 35,3 Meter (m) Metrik ton = 0,98421 long ton = 1000 kg Ounce (oz) = 28,31 gr Pasang Pound (lb) = 0,454 kg Set Ton = 1000 kg Zak = 40 kg; 50 kg (untuk semen)
LAIN-LAIN :
FOB = Harga untuk Ekspor CIF = Harga untuk Impor
EXPLANATION SYMBOLS :
... Data not yet available - Data not available 0 Data negligible , Decimal point x) Preliminary figures xx) Very preliminary figures xxx) Extremely preliminary figures r) Revised figures e) Estimated figures
UNIT :
Bales = 1250 m = 180 kg Barrel = 158.99 litre 1 = ------------ m3 6.2898 Briquette = 500 gram Piece (= bar for soap : 400 gram) Bottle = 700 cc Piece Pack Piece Sheet Kilogram (kg) Sheet Litre = 0.80 kg (for rice) Long ton = 1016.05 kg Dozen 1 mcf = ---------- m3 35.3 Metre (m) Metric ton = 0.98421 long ton = 1000 kg Ounce (oz) = 28.31 gr Pair Pound (lb) = 0.454 kg Set Ton = 1000 kg Sack = 40; 50 kg (for Cement)
OTHERS :
Export Prices = FOB Import Prices = CIF
xi
https:
//www.b
ps.go.id

https:
//www.b
ps.go.id

xii
ULASAN SINGKA T INDIKATOR EKONOMI, APRIL 2010
Pada April 2010 terjadi inflasi sebesar 0,15 persen. Sementara padaApril 2009 terjadi deflasi sebesar 0,31 persen. Inflasi pada bulan inidisebabkan oleh meningkatnya harga pada semua kelompok. Inflasitertinggi terjadi pada Kelompok Bahan Makanan (0,33 persen), dan inflasiterendah terjadi pada Kelompok Pendidikan, Rekreasi dan Olahraga(0,01 persen), sedangkan kelompok lainnya mengalami inflasi sekitar0,04 - 0,24 persen.
Uang yang beredar pada bulanApril 2010 mencapai Rp 490,93 triliundengan komposisi 42 persen uangkartal dan 58 persen uang giral.Jumlah tersebut mengalamipenurunan sebesar 0,71 persendibanding jumlah uang beredar padabulan sebelumnya yang disebabkanoleh menurunnya jumlah uang giral.Sementara jika dibandingkan April2009, jumlah uang yang beredarmengalami kenaikan sebesar 8,39persen akibat naiknya uang kartal danuang giral sebesar 9,33 persen dan7,70 persen.
Indeks Nilai Tukar Petani (NTP) sebagai perbandingan antara IndeksHarga yang Diterima Petani dengan Indeks Harga yang Dibayar Petanipada April 2010, dari 32 provinsi yang disurvei tercatat sebanyak 16 provinsimengalami peningkatan antara 0,09 - 1,27 persen dibanding indeks NTPbulan sebelumnya sebagai akibat kenaikan Indeks Harga yang DiterimaPetani relatif lebih besar dari kenaikan Indeks Harga yang Dibayar Petani.Sementara itu, ada sebanyak 15 provinsi mengalami penurunan NTPdengan kisaran antara 0,19 - 1,12 persen. Sementara itu, pada April 2010provinsi yang memiliki NTP di bawah angka 100 dan di atas angka 100jumlahnya masing-masing 8 dan 24 provinsi.
ECONOMIC INDICATOR HIGHLIGHTS, APRIL 2010
In April 2010 recorded inflation at 0.15 percent. Meanwhile in April2009, recorded deflation at 0.31 percent. Inflation that month was due to theincrease of price in all group. The greatest inflation recorded at FoodstuffGroup (0.33 percent) and the lowest inflation recorded at Education,Recreation and Sports Group (0.01 percent). Meanwhile, other goods andservices groups recorded inflation at 0.04 – 0.24 percent.
The money supply in April2010 reached Rp 490.93 trillion, ofwhich 42 percent was in currencyoutside banks and 58 percent indemand deposits. That amountdecreased by 0.71 percent comparedwith the total money supply in previousmonth, caused by the decrease ofdemand deposits. Meanwhile,compared to April 2009, the moneysupply experienced an increaseof 8.39 percent as a result of theincrease both of currency outsidebanks and demand deposits, 9.33percent and 7.70 percent, respectively.
The Farmers’ Terms of Trade (FTT) indices, is the comparison betweenthe indices of Producer Prices Received by Farmers to the Consumer PricesPaid by Farmers. In April 2010, the FTT indices of 16 provinces,experienced an increased by 0.09 - 1.27 percent compared with the FTTindices of previous month. This was a result of the increase in the ProducerPrices Received by Farmers indices being relatively higger than that of theConsumer Prices Paid by Farmers indices. While, the FTT indices of 15provinces decreased by 0.19 - 1.21 percent. Meanwhile, on April 2010,the provinces with the FTT indices below and over than 100 was 8 provinceand 24 province, respectively.
-0.4
-0.2
0.0
0.2
0.4
0.6
0.8
1.0
1.2
Apr '09Mei '09
Jun '09Jul '09
Agt '09Sep '09
Okt '09Nov '09
Des '09Jan '10
Feb '10Mar '10
Apr '10
Grafik 1. Laju Inflasi di Indonesia Inflation Rate in Indonesia
(2007 = 100) Inflation Rate in Indonesia
(2007 = 100) Inflation Rate in Indonesia
(2007 = 100) Inflation Rate in Indonesia
(2007 = 100) Inflation Rate in Indonesia
(2007 = 100) Inflation Rate in Indonesia
(2007 = 100) Inflation Rate in Indonesia
(2007 = 100) Inflation Rate in Indonesia
(2007 = 100) Inflation Rate in Indonesia
(2007 = 100)
https:
//www.b
ps.go.id

xiii
Pada Triwulan I-2010 ada 150 Proyek Penanaman Modal Dalam Negeri(PMDN) yang telah direalisasikan dengan nilai investasi Rp 6,69 triliun.Investasi PMDN tersebut terutama pada Sektor Transpor, Pergudangandan Komunikasi (28,62 persen). Sementara itu pada periode yang sama,proyek Penanaman Modal Asing (PMA) yang direalisasikan berjumlah 424proyek dengan nilai investasi 3,77 miliar US dolar. Investasi PMA tersebutpaling banyak berasal dari Singapura, dengan total proyek 62 senilai676,8 juta US dollar. Jika dilihat secara sektoral, PMA tersebut didominasioleh Sektor Transpor, Pergudangan dan Komunikasi (24,97 persen),kemudian diikuti oleh tiga sektor lainnya, yaitu Sektor Pertambangan danPenggalian, Sektor Perindustrian danSektor Listrik, Gas dan Air, masing-masing mempunyai kontribusi sekitar18 persen.
Produksi padi pada subround I2010 diperkirakan mencapai 28,82 jutaton, dengan komposisi 90,23 persenpadi sawah dan 9,77 persen padiladang. Jika dibandingkan periode yangsama pada tahun sebelumnya, produksipadi pada subround I 2010 turun sekitar2,27 persen. Sementara produksi padiselama tahun 2010 diperkirakansebesar 64,90 juta ton atau sedikit lebihtinggi dibanding produksi padi selamatahun 2009 sebesar 64,33 juta ton.
Indeks Produksi Bulanan IndustriBesar dan Sedang pada Maret 2010 diperkirakan naik 0,92 persen dariindeks bulan sebelumnya menjadi 131,17. Jika dibanding Indeks produksipada Maret 2009, indeks tersebut naik sebesar 4,83 persen. SementaraIndeks Produksi Industri Besar dan Sedang pada triwulan I 2010diperkirakan turun 1,62 persen dibanding triwulan sebelumnya. Hal inidisebabkah oleh menurunnya kinerja hampir setiap subsektor, terutamaSubsektor Peralatan Kedokteran, Alat-Alat Ukur, Peralatan Navigasi,Peralatan Optik, Jam dan Lonceng, yaitu menurun 11,87 persen.
In first quarter 2010 there were 150 Domestic Investment Projects(DIP) realizations with an investment value of Rp 6.69 trillion.This investment was mostly in the Transport, Storages and CommunicationSector (28.62 percent). Meanwhile, in the same periode Foreign InvestmentProjects (FIP) realizations were 424 projects with an investment value of3.77 billion USD. This investment mostly funded by Singapore atotalling 62 projects with an investment value of 676.8 million USD.This investment totally dominated by the Transport, Storages andCommunication Sector (24.97 percent), than followed by other sectorsthat attained to 18 percent respectively, there are Mining and Quarrying
Sector, Manufacturing Sector and
Electricity, Gas and Water Sector.
Paddy production in subroundI-2010, was estimated at 28.82million tons, with composition 90.23percent is wetland paddy and 9.77percent is dryland paddy. Comparedto subround I-2009, paddyproduction in subround I-2010decreased 2.27 percent. Meanwhile,paddy production during 2010 wasestimated 64.90 million tons or alittle high than paddy production in2009, which was 64.33 million tons.
The monthly Production Indexof Large and Medium Manufacturing Industry in March 2010 is estimated tohave increased by 0.92 percent from the month before to become 131.17.Meanwhile, this index increased by 4.83 percent compared to the monthlyproduction index in March 2009. While, the quarterly Production Index ofLarge and Medium Manufacturing Industry in first quarter 2010 is estimatedto have decreased by 1.62 percent compared witht the previous quarter.This was caused by the decrease in the efficiency of most subsectors,especially of Medical, Precision, Navigation, and Optical Instruments,Watches and Clocks Subsector that decrease highest at 11.87 percent.
0
4000000
8000000
12000000
16000000
20000000
24000000
28000000
32000000
Padi Jagung Kedelai Kacang Tanah Ubi Kayu Ubi Jalar
Jan - Apr 2010 Mei - Agt 2010 Sep - Des 2010
Production of Food Crop(ton)
Production of Food Crop(ton)
Production of Food Crop(ton)
Production of Food Crop(ton)
Production of Food Crop(ton)
Production of Food Crop(ton)
Production of Food Crop(ton)
Production of Food Crop(ton)
Production of Food Crop(ton)
RiceRiceRiceRiceRiceRiceRice MaizeRiceRice MaizeMaizeMaizeMaizeMaizeMaizeMaizeMaizeMaizeMaizeMaizeMaizeMaize CassavaCassavaCassavaMaizeMaizeMaizeMaizeMaizeMaizeMaizeMaizeMaizeMaizeMaizeMaize CassavaMaizeMaize CassavaMaize CassavaCassavaCassavaCassavaCassavaCassava Sweet PotatoesSweet PotatoesRice Maize Cassava Sweet Potatoes Peanuts Soyabeans
Catatan: Data merupakan Angka Ramalan INote : The figures was first forecastCatatan: Data merupakan Angka Ramalan INote : The figures was first forecast
Grafik 2. Produksi Tanaman Bahan Makanan Grafik 2. Produksi Tanaman Bahan Makanan Grafik 2. Produksi Tanaman Bahan Makanan Grafik 2. Produksi Tanaman Bahan Makanan Grafik 2. Produksi Tanaman Bahan Makanan Grafik 2. Produksi Tanaman Bahan Makanan Grafik 2. Produksi Tanaman Bahan Makanan Grafik 2. Produksi Tanaman Bahan Makanan Grafik 2. Produksi Tanaman Bahan Makanan
https:
//www.b
ps.go.id

xiv
Ekspor termasuk migas dan tanpa migas Maret 2010 masing-masingbernilai 12,77 miliar US dolar dan 10,61 miliar US dolar, sedangkan impormasing-masing bernilai 10,97 miliar US dolar dan 8,72 miliar US dolar(Grafik 3). Dengan demikian neraca perdagangan luar negeri Maret 2010termasuk migas mengalami surplus 1,80 miliar US dolar sedangkan yangtanpa migas surplus 1,89 miliar US dolar. Dibanding nilai ekspor Maret2009, nilai ekspor dengan migas naik 48,28 persen. Demikian halnyadengan ekspor tanpa migas yangmengalami peningkatan sekitar44,63 persen. Peningkatan nilaiekspor tersebut terjadi pada semuakelompok komoditi, terutama hasilminyak yang mengalamipeningkatan cukup signifikanhingga mencapai 224,24 persen.Berdasarkan negara tujuan, negarautama tujuan ekspor non migaspada Bulan Maret 2010 adalahJepang (1,33 miliar US dolar), Cinadan Amerika Serikat (masing-masing 1,09 miliar US dolar).Sementara itu, nilai impor termasukmigas dan tanpa migas pada Maret2010 masing-masing naik sekitar67,42 persen dan 55,06 persendibanding Maret 2009. Impor Maret2010 ini masih didominasi olehimpor bahan baku senilai 7,90 miliar US dolar atau meningkat sekitar74,79 persen dibanding impor barang yang sama pada Maret 2009 senilai4,52 miliar US dolar.
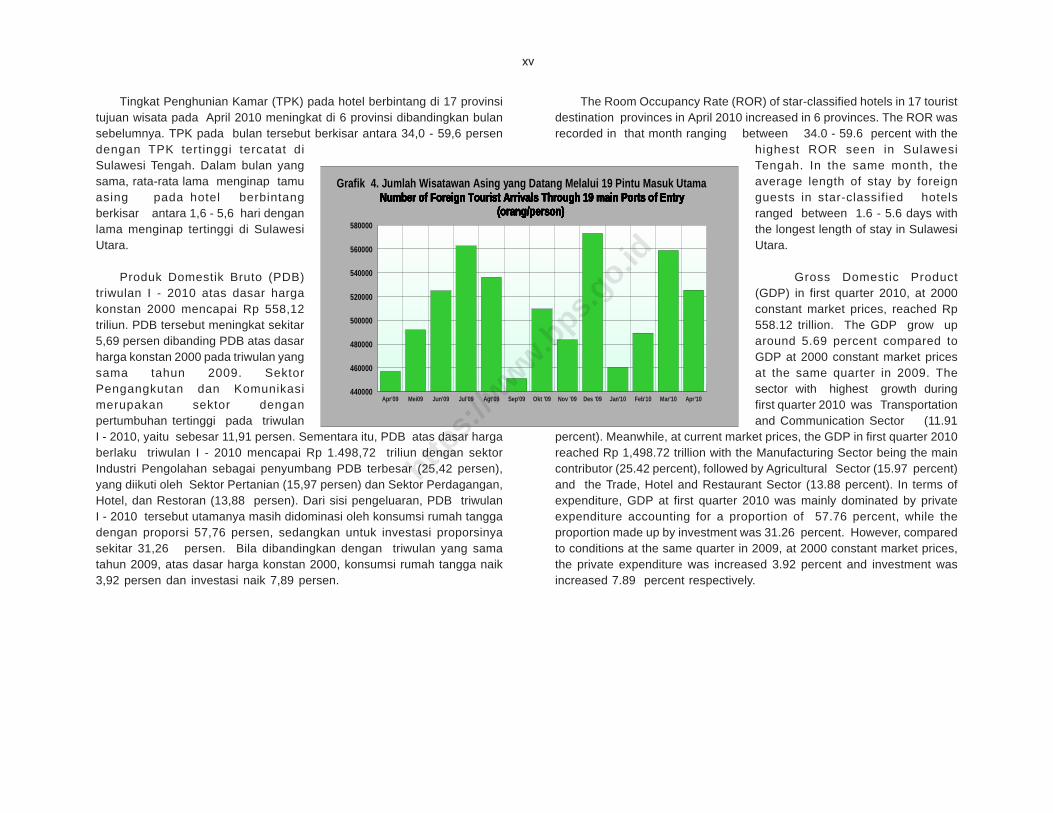
Wisatawan mancanegara (wisman) yang datang melalui 19 pintumasuk utama pada April 2010 berjumlah 525.223 orang. Jumlah inimengalami penurunan dari wisman yang masuk pada bulan sebelumnyayang berjumlah 558.819 orang (Grafik 4). Penurunan jumlah wismantersebut terjadi di 17 pintu masuk utama. Sementara itu, jika dibandingkandengan jumlah wisman yang masuk pada April 2009, terjadi peningkatansekitar 14,94 persen.
Exports in March 2010, including and excluding petroleum and gaswas 12.77 billion US dollars and 10.61 billion US dollars respectively, whilethe respective import figures were 10.97 billion US dollars and 8.72billion US dollars (Chart 3). Therefore, the Balance of trade for March 2010including petroleum and gas experienced a surplus of 1.80 billion USdollars, where as without petroleum and gas it was a surplus of 1.89 billionUS dollars. Compared with the value of exports in March 2009, the value of
these exports with petroleum and gasincreased by 48.28 percent and exportswithout petroleum and gas is alsoincreased by 44.63 percent. Theincrease of value exports caused by theincreases in all group of commodities,especially petroleum product thatincrease significantly about 224.24percent. The main countries of exportwithout petroleom and gas destination inMarch 2010 were Japan (1.33 billionUS dollars), China and USA, about 1.09bill ion US dollars, respectively.Meanwhile, the value of imports includingpetroleum and gas in March 2010increased 67.42 percent, and withoutpetroleum and gas it also increased55.06 percent compared with the valueimport in March 2009. Imports in March2010 were sti l l dominated by raw
materials to the value of 7.90 billion US dollars, increased 74.79 percentcompared with the import of the same goods in March 2009, which was 4.52billion US dollars.
International tourists arrived via 19 main entry ports In April 2010 were525,223 people. This total decreased from the total entering during thepreceding month, which was 558,819 people (Chart 4). The decrease ininternational tourists who entered in that month compared with the previousmonth occurred at 17 main ports of entry. While, compared with the totalentering international tourists in April 2009, this total tourists increased14.94 percent.
6000
7000
8000
9000
10000
11000
12000
13000
14000
Mar '09 Apr '09 Mei '09 Jun '09 Jul '09 Agt '09 Sep '09 Ok t '09 Nov '09 Des '09 Jan '10 Feb '10 Mar '10
Impor Ekspor
Grafik 3. Perkembangan Ekspor dan Impor Indonesia Trend of Indonesian Exports and Imports
(000 000 US $) Trend of Indonesian Exports and Imports
(000 000 US $) Trend of Indonesian Exports and Imports
(000 000 US $) Trend of Indonesian Exports and Imports
(000 000 US $) Trend of Indonesian Exports and Imports
(000 000 US $) Trend of Indonesian Exports and Imports
(000 000 US $) Trend of Indonesian Exports and Imports
(000 000 US $) Trend of Indonesian Exports and Imports
(000 000 US $) Trend of Indonesian Exports and Imports
(000 000 US $)
https:
//www.b
ps.go.id
xv
Tingkat Penghunian Kamar (TPK) pada hotel berbintang di 17 provinsitujuan wisata pada April 2010 meningkat di 6 provinsi dibandingkan bulansebelumnya. TPK pada bulan tersebut berkisar antara 34,0 - 59,6 persendengan TPK tertinggi tercatat diSulawesi Tengah. Dalam bulan yangsama, rata-rata lama menginap tamuasing pada hotel berbintangberkisar antara 1,6 - 5,6 hari denganlama menginap tertinggi di SulawesiUtara.
Produk Domestik Bruto (PDB)triwulan I - 2010 atas dasar hargakonstan 2000 mencapai Rp 558,12triliun. PDB tersebut meningkat sekitar5,69 persen dibanding PDB atas dasarharga konstan 2000 pada triwulan yangsama tahun 2009. SektorPengangkutan dan Komunikasimerupakan sektor denganpertumbuhan tertinggi pada triwulanI - 2010, yaitu sebesar 11,91 persen. Sementara itu, PDB atas dasar hargaberlaku triwulan I - 2010 mencapai Rp 1.498,72 triliun dengan sektorIndustri Pengolahan sebagai penyumbang PDB terbesar (25,42 persen),yang diikuti oleh Sektor Pertanian (15,97 persen) dan Sektor Perdagangan,Hotel, dan Restoran (13,88 persen). Dari sisi pengeluaran, PDB triwulanI - 2010 tersebut utamanya masih didominasi oleh konsumsi rumah tanggadengan proporsi 57,76 persen, sedangkan untuk investasi proporsinyasekitar 31,26 persen. Bila dibandingkan dengan triwulan yang samatahun 2009, atas dasar harga konstan 2000, konsumsi rumah tangga naik3,92 persen dan investasi naik 7,89 persen.
The Room Occupancy Rate (ROR) of star-classified hotels in 17 touristdestination provinces in April 2010 increased in 6 provinces. The ROR wasrecorded in that month ranging between 34.0 - 59.6 percent with the
highest ROR seen in SulawesiTengah. In the same month, theaverage length of stay by foreignguests in star-classified hotelsranged between 1.6 - 5.6 days withthe longest length of stay in SulawesiUtara.
Gross Domestic Product(GDP) in first quarter 2010, at 2000constant market prices, reached Rp558.12 trillion. The GDP grow uparound 5.69 percent compared toGDP at 2000 constant market pricesat the same quarter in 2009. Thesector with highest growth duringfirst quarter 2010 was Transportationand Communication Sector (11.91
percent). Meanwhile, at current market prices, the GDP in first quarter 2010reached Rp 1,498.72 trillion with the Manufacturing Sector being the maincontributor (25.42 percent), followed by Agricultural Sector (15.97 percent)and the Trade, Hotel and Restaurant Sector (13.88 percent). In terms ofexpenditure, GDP at first quarter 2010 was mainly dominated by privateexpenditure accounting for a proportion of 57.76 percent, while theproportion made up by investment was 31.26 percent. However, comparedto conditions at the same quarter in 2009, at 2000 constant market prices,the private expenditure was increased 3.92 percent and investment wasincreased 7.89 percent respectively.
440000
460000
480000
500000
520000
540000
560000
580000
Apr'09 Mei09 Jun'09 Jul'09 Agt'09 Sep'09 Okt '09 Nov '09 De s '09 Jan'10 Feb'10 Mar'10 Apr'10
Grafik 4. Jumlah Wisatawan Asing yang Datang Melal ui 19 Pintu Masuk Utama Number of Foreign Tourist Arrivals Through 19 main Ports of Entry
(orang /person) Number of Foreign Tourist Arrivals Through 19 main Ports of Entry
(orang /person) Number of Foreign Tourist Arrivals Through 19 main Ports of Entry
(orang /person) Number of Foreign Tourist Arrivals Through 19 main Ports of Entry
(orang /person) Number of Foreign Tourist Arrivals Through 19 main Ports of Entry
(orang /person) Number of Foreign Tourist Arrivals Through 19 main Ports of Entry
(orang /person) Number of Foreign Tourist Arrivals Through 19 main Ports of Entry
(orang /person) Number of Foreign Tourist Arrivals Through 19 main Ports of Entry
(orang /person) Number of Foreign Tourist Arrivals Through 19 main Ports of Entry
(orang /person)
https:
//www.b
ps.go.id

1
INDEKS HARGA PRICE INDICES
PENJELASAN TEKNIS
1. Mulai bulan Juni 2008, Indeks Harga Konsumen (IHK) yang mencakup
sekitar 284-441 komoditas dihitung berdasarkan pola konsumsi hasil Survei Biaya Hidup (SBH) di 66 kota tahun 2007.
2. Sedangkan IHK dan laju inflasi sebelum bulan Juni 2008 masih
mencakup 283-397 komoditas dengan menggunakan pola konsumsi hasil SBH di 45 ibukota provinsi tahun 2002.
3. IHK gabungan 66 kota merupakan hasil penghitungan dari gabungan
indeks masing-masing kota yang ditimbang dengan banyaknya rumahtangga di kota bersangkutan.
4. Dalam penyajian IHK pada metode baru jenis barang/jasa tersebut
dikelompokkan menjadi 7 kelompok yaitu - Bahan makanan - Kesehatan - Makanan jadi, minuman, - Pendidikan,rekreasi dan rokok dan tembakau olahraga
- Perumahan - Transpor dan komunikasi - Sandang
5. a. Persentase (%) perubahan IHK (Laju inflasi/Deflasi) bulanan diperoleh
dari : In - In-1 ─────── x 100 In-1 dimana : I n = Indeks bulan n I n-1 = Indeks bulan n-1
b. Persentase (%) perubahan IHK/IBP dalam satu tahun dihitung dengan menggunakan metode point to point yang sebelumnya menggunakan metode kumulatif bulanan.
TECHNICAL NOTES
1. Since June 2008, the calculation of the Consumer Price Index (CPI) has
been based on a consumption pattern obtained from the 2007 Cost of Living Survey (CLS) in 66 cities, covering 284-441 commodities.
2. Before June 2008, the calculation of the CPI and inflation rate covered
283-397 commodities, and was based on a consumption pattern obtained from the 2002 CLS in 45 provincial capital cities.
3. The CPI of Indonesia is a weighted composite index of the calculated CPI's
in 66 cities, using the total number of households in each city as the weighting factor.
4. In the new method of CPI, commodities divided into 7 groups as follows :
- Foodstuff - Health - Prepared food, beverage, - Education, recreation & cigarette & tobacco sports - Housing - Transportation &
- Clothing Communication 5. a. The percentage change of the monthly CPI (Inflation rate) is obtained
from : In - In-1 ─────── x 100 In-1
where: In = Index in month n I n-1 = Index in month n-1
b. The percentage change of yearly CPI /WPI is calculate using pont to ponit method, but before April 1998 using a monthly cumulative method.
https:
//www.b
ps.go.id

2
INDEKS HARGA PRICE INDICES
6. Indeks Harga yang dibayar petani disusun berdasarkan data hasil survei
bulanan statistik harga konsumen di pasar pedesaan dengan memakai daftar HPI.
7. Indeks harga yang diterima petani sumbernya adalah dari hasil survei
harga produsen/farmgate yang dilaksanakan setiap bulan dengan memakai daftar HP2.1 dan HP2.2.
8. Sejak Januari 2008, Indeks Harga yang diterima dan dibayar petani serta
nilai tukarnya menggunakan tahun dasar 2007. 9. Indeks harga yang diterima petani (IT) dan indeks yang dibayar petani
(IB) dihitung menggunakan formula Laspeyres yang dikembangkan. 10. Nilai tukar petani adalah merupakan ratio antara Indeks Harga yang
diterima (IT) dengan yang dibayar petani (IB) yang dinyatakan dalam persentase.
11. Data Harga Perdagangan Besar (HPB) dikumpulkan setiap bulan oleh
BPS dari sekitar 150 kota yaitu ibukota propinsi dan beberapa ibukota kabupaten yang ada kegiatan Perdagangan Besar.
12. Penyajian hanya berupa angka nasional tanpa angka Propinsi atau
Kabupaten. 13. Indeks umum harga Perdagangan Besar dikelompokkan atas 5 sektor
yaitu : Pertanian, Pertambangan dan Penggalian, Industri, Impor dan Ekspor. Masing-masing sektor terdiri dari sub sektor. Jumlah komoditas dari setiap sub sektor dinyatakan dengan jumlah keseluruhannya 314 komoditas.
6. The index of price paid by farmers are compiled based on data obtained
from the monthly survey of consumer price statistics in rural markets using the HPI form.
7. The indices of prices received by farmers are calculated from the
producer/farmgate price survey conducted every month using the HP2.1 and HP2.2 forms.
8. Since January 2008, 2007 has been used as the base year for calculating
the indices of prices received, the prices paid by farmers, and the farmers' terms of trade.
9. A modified Laspeyres formula has been used to calculate the index of
prices received by farmers (IT) and the index of prices paid by farmers (IB). 10. The terms of trade for farmers is computed as the ratio of the index of
prices received by farmers (IT) and the index of prices paid by farmers (IB) multiplied by 100 %.
11. Wholesale price data are collected through a monthly survey conducted by
the BPS Statistics Indonesia in 150 cities consisting of provincial capital cities and several regency capital cities where wholesale trade activities are found.
12. The data in this specific chapter pertain only to national figures, and does
not cover provincial or regency figures. 13. The Wholesale Price Index (WPI) is disaggregated into five sectors:
Agriculture, Manufacturing, Mining, and Quarrying, Imports, and Exports, where each sector consists of subsectors. The number of commodities in each sector is presented in brackets. The total number of commodities is 314.
https:
//www.b
ps.go.id

3
INDEKS HARGA PRICE INDICES
14. IHK, IBP dan IHPB dihitung menggunakan formula Laspeyres yang
dikembangkan, yaitu : Pn Σ ──── Pn-1 Qo Pn-1 In = ────────────── x 100 Σ Po Qo
Dimana : In = Indeks bulan n (bulan penelitian) Pn = Harga pada bulan ke n (bulan penelitian) Pn-1 = Harga pada bulan ke n-1 (bulan sebelumnya) Pn-1 Qo = Nilai konsumsi bulan n-1 (bulan sebelumnya) Po Qo = Nilai Konsumsi Tahun Dasar 15. Indeks Harga Perdagangan Besar (IHPB) bahan bangunan/konstruksi
didasarkan atas perubahan harga 25 kelompok barang tertentu. 16. Penghitungan IHPB masing-masing jenis bahan bangunan serta indeks
umumnya menggunakan perubahan harga dari sejumlah kelompok barang yang dinyatakan dengan angka dalam kurung.
17. Kurs Valuta Asing dikumpulkan setiap hari Selasa dan Kamis dari tempat
penukaran mata uang terpilih. 18. Harga emas juga dikumpulkan setiap hari Selasa dan Kamis dari toko
penjual emas terpilih. Harga emas yang dicatat adalah harga emas perhiasan tanpa ongkos pembuatan.
19. Perdagangan saham :
a. Saham yang diperdagangkan adalah saham yang terdaftar pada Badan Pelaksana Pasar Modal (Bapepam) dan tercatat pada Bursa Efek Indonesia, dikurangi dengan jumlah saham masing-masing perusahaan yang dijadikan jaminan untuk menerbitkan sertifikat PT. Danareksa.
b. Volume perdagangan saham adalah jumlah transaksi saham yang
terjadi setiap hari bursa di Bursa Efek Indonesia.
c. Rata-rata perdagangan saham adalah jumlah saham di perdagangkan dibagi dengan hari bursa (Senin s/d Jum'at kecuali hari libur).
14. The CPI, IEC (Index of Essential Commodities), and WPI are calculated
using a modified Laspeyres formula : Pn Σ ──── Pn-1 Qo Pn-1 In = ─────────────────── x 100 Σ Po Qo where : In = Index nth month (survey month)
Pn = Price in nth month (survey month) Pn-1 = Price in (n-1)th month Pn-1 Qo = Quantity in (n-1)th month P o Qo = Quantity in the base year
15. The Wholesale Price Index for Construction materials is based on price
changes of 25 groups of selected goods. 16. The WPI, for each type of Construction materials and the general index are
calculated based on price changes of several groups of goods indicated by the number in bracket.
17. Foreign exchange rate data are collected every Tuesday and Thursday
from selected money changers. 18. Gold price data are collected every Tuesday and Thursday from selected
gold traders. The price of gold recorded is the price of golden ornament excluding the cost of production.
19. Share Trade :
a. Shares traded are registered shares at the Capital Market Supervisory Agency (Bapepam) and recorded at Indonesian stock exchange, excluding shares withhold as guarantee for the issuance of PT.Danareksa Certificates.
b. The volume of shares trade is the volume of daily transaction at the Indonesian stock exchange.
c. The average volume of shares trade is the total number of shares
traded divided by the number of transaction days (Monday through Friday except holiday).
https:
//www.b
ps.go.id

INDEKS HARGAPRICE INDICES
TABEL 1.1
TABLE
2007 April 146,30 143,12 151,43 131,23 129,20 148,18 167,79 148,43
Mei 145,73 143,79 151,96 131,51 129,43 148,19 168,00 148,58Juni 146,42 144,27 152,16 130,94 129,71 148,24 168,19 148,92Juli 148,39 144,84 152,64 131,74 130,16 152,52 168,27 149,99Agustus 149,56 145,53 153,82 132,39 130,47 157,37 168,33 151,11September 152,27 146,19 154,09 134,01 131,04 160,05 168,44 152,32Oktober 155,11 146,93 154,42 136,76 131,63 160,38 169,23 153,53November 155,17 147,56 154,60 139,03 131,97 160,55 168,78 153,81Desember 159,01 148,90 155,58 140,41 132,51 160,74 169,15 155,50
2008 Januari 163,41 151,91 158,38 143,66 133,47 160,75 169,55 158,26Februari 166,01 153,24 158,36 144,75 135,55 160,82 169,59 159,29Maret 168,40 154,89 159,92 146,45 136,49 160,97 169,77 160,81April 169,32 156,22 162,51 146,05 139,06 161,18 167,77 161,73Mei 172,23 157,57 165,07 145,82 140,02 161,78 171,51 164,01Juni 116,44 109,38 108,03 108,61 106,20 104,99 109,50 110,08Juli 118,59 110,55 109,97 109,49 106,95 106,82 110,28 111,59Agustus 119,70 111,20 110,55 108,91 107,55 108,27 110,27 112,16September 121,97 112,25 111,90 109,45 107,94 108,95 110,51 113,25Oktober 122,83 113,11 112,17 110,23 108,50 109,38 110,62 113,76November 122,01 114,39 112,43 111,02 108,90 109,66 110,28 113,90Desember 122,70 114,98 113,02 112,27 109,13 109,84 107,26 113,86
2009 Januari 123,63 116,07 112,95 112,89 109,53 109,97 104,55 113,78Februari 124,80 117,13 113,27 116,11 109,72 110,01 102,01 114,02Maret 124,47 117,74 113,50 117,30 110,52 110,08 102,26 114,27April 122,81 118,21 113,64 115,33 110,90 110,14 102,33 113,92Mei 122,50 118,78 113,74 114,76 111,59 110,22 102,33 113,97Juni 122,28 119,13 113,79 115,10 111,85 110,32 102,59 114,10Juli 123,68 119,48 113,88 114,84 111,99 111,66 102,88 114,61Agustus 125,28 120,35 114,12 114,85 112,38 113,07 102,86 115,25September 128,32 121,65 114,32 116,32 112,71 113,56 103,78 116,46Oktober 128,69 122,50 114,60 116,75 112,94 113,95 103,04 116,68November 127,62 122,82 114,77 117,89 113,15 114,10 102,96 116,65Desember 127,46 123,96 115,09 119,01 113,38 114,11 103,32 117,03
2010 Januari 129,66 126,35 115,48 118,77 113,55 114,22 103,49 118,01Februari 130,78 126,85 115,71 118,21 113,76 114,30 103,60 118,36Maret 129,59 127,21 115,86 118,22 114,04 114,32 103,67 118,19April 130,02 127,52 115,98 118,38 114,23 114,33 103,71 118,37
Catatan : 1) Sebelum Juni 2008 merupakan laju inflasi 45 kota (2002=100) Note : 1) Prior to June 2008, the inflation rate in 45 cities (2002=100)
Indeks umumGeneral index
[9][6] [7]
Year and month
Transpor, komunikasi dan jasa keuangan
ClothingKesehatan
Pendidikan, rekreasi dan olahragaSandang
[8]
Transportation, communication and financial services
Education, recreation and sport
[2] [5]
Prepared food, beverage, cigarette and tobacco
COMPOSITE CONSUMER PRICE INDICES 1) OF 66 CITIES IN INDONESIA
INDEKS HARGA KONSUMEN1) GABUNGAN 66 KOTA DI INDONESIA
(2007 = 100)
Bahan makanan
4
[1] [3]
Perumahan, air, listrik, gas dan bahan bakar
Housing, water, electricity, gas and fuel
[4]
Tahun dan bulanFoodstuff Health
Makanan jadi, minuman, rokok dan tembakau
https:
//www.b
ps.go.id

1) Prior to June 2008, the inflation rate in 45 cities (2002=100)
Indeks umumGeneral index
https:
//www.b
ps.go.id

INDEKS HARGAPRICE INDICES
INDEKS UMUM / GENERAL INDEX 118,37 0,15 0,05 1,15 3,91
I. BAHAN MAKANAN / FOODSTUFF 130,02 0,33 0,09 2,01 5,87
A. Padi-padian, umbi-umbian dan hasilnya / Cereals, roots, and their products 124,77 - 1,17 1,97 5,65 10,17
B. Daging dan hasil-hasilnya / Meat and its products 129,21 - 1,13 1,11 -0,42 2,65
C. Ikan segar / Fresh fish 129,19 - 1,36 1,70 -1,27 -2,04
D. Ikan diawetkan / Preserved fish 134,12 - 0,12 1,60 0,32 1,82
E. Telur, susu dan hasil-hasilnya / Eggs, milk and their products 125,16 0,51 -0,22 0,51 0,90
F. Sayur-sayuran / Vegetables 140,43 4,01 -2,11 8,31 12,41
G. Kacang - kacangan / Beans and nuts 156,28 - 0,18 0,11 0,43 -0,48
H. Buah - buahan / Fruits 133,91 1,79 1,66 2,14 10,76
I. Bumbu - bumbuan / Spices 137,70 5,80 -6,46 0,63 23,68
J. Lemak dan minyak / Fats and oils 120,21 - 0,62 -0,51 0,23 -2,81
K. Bahan makanan lainnya / Other food items 114,50 0,59 2,28 1,26 2,18
II. MAKANAN JADI, MINUMAN, ROKOK DAN TEMBAKAU 127,52 0,24 2,81 2,87 7,88
PREPARED FOOD, BEVERAGE, CIGARETTE AND TOBACCO
A. Makanan jadi / Prepared food 128,02 0,22 1,99 2,92 6,57
B. Minuman yang tidak beralkohol / Non-alcoholic beverages 128,70 - 0,73 5,89 2,11 12,33
C. Tembakau dan minuman beralkohol / Tobacco products and alcoholic beverages 125,10 1,21 2,80 3,04 7,88
III. PERUMAHAN, AIR, LISTRIK, GAS DAN BAHAN BAKAR 115,98 0,10 0,55 0,77 2,06
HOUSING, WATER, ELECTRICITY, GAS AND FUEL
A. Biaya tempat tinggal / Cost of housing 114,68 0,17 1,03 1,00 2,34
B. Bahan bakar, penerangan dan air / Fuel, electricity and water 124,81 - 0,06 -1,30 0,45 1,96
C. Perlengkapan rumahtangga / Household equipment 110,66 0,22 1,13 0,53 2,45
D. Penyelenggaraan rumahtangga / Household operation 113,45 0,08 1,41 0,70 0,86
April 2010 thd Desember 2009 / April 2010 to December 2009
April 2010 thd April 2009 / April 2010 to April 2009
5
TABEL 1.2 INDEKS HARGA KONSUMEN GABUNGAN 66 KOTA DI INDONESIA DAN PERUBAHANNYA
TABLE COMPOSITE CONSUMER PRICE INDICES OF 66 CITIES IN INDONESIA AND THEIR CHANGES
(2007 = 100)
Kelompok / Group
April / April 2010Persentase Perubahan / Percentage Changes
Tahun Kalender / Calender Year Tahun ke Tahun / Year on Year
[4] [5] [6][1]
Perubahan Change (%)
[2]
Indeks / Index
[3]
April 2009 thd Desember 2008 / April 2009 to December 2008
https:
//www.b
ps.go.id

INDEKS HARGAPRICE INDICES
IV. SANDANG / CLOTHING 118,38 0,14 2,73 -0,53 2,66
A. Sandang laki-laki / Men's clothing 112,33 0,35 0,63 1,37 4,69
B. Sandang wanita / Women's clothing 108,26 0,14 0,53 0,58 2,53
C. Sandang anak-anak / Children's clothing 109,53 0,32 0,32 1,01 3,41
D. Barang pribadi dan sandang lainnya / Personal effects 140,25 - 0,13 7,73 -3,01 1,26
V. KESEHATAN / HEALTH 114,23 0,17 1,62 0,75 3,00
A. Jasa kesehatan / Health services 114,04 0,14 2,07 0,66 3,51
B. Obat-obatan / Medicines 114,42 0,12 1,54 0,78 3,09
C. Jasa perawatan jasmani / Personal care services 115,42 0,21 1,54 1,05 4,44
D. Perawatan jasmani dan kosmetika / Personal care and cosmetics 114,21 0,18 1,18 0,76 2,27
VI. PENDIDIKAN, REKREASI, DAN OLAHRAGA 114,33 0,01 0,27 0,19 3,80
EDUCATION, RECREATION AND SPORTS
A. Pendidikan / Education 121,39 0,00 0,06 0,03 5,59
B. Kursus-kursus/pelatihan / Course and training 111,19 0,01 0,67 0,78 3,22
C. Perlengkapan/peralatan pendidikan / Educational equipment 105,84 0,04 0,30 0,34 1,51
D. Rekreasi / Recreation 109,10 0,01 0,68 0,38 1,78
E. Olahraga / Sports 107,29 0,07 0,66 0,93 2,41
VII. TRANSPORTASI, KOMUNIKASI & JASA KEUANGAN 103,71 0,04 -4,60 0,38 1,35
TRANSPORTATION,COMMUNICATION & FINANCIAL SERVICES
A. Transpor / Transportation 108,40 0,03 -6,83 0,53 1,92
B. Komunikasi dan pengiriman / Communication and delivery services 88,02 - 0,02 -0,15 -0,42 - 1,19
C. Sarana dan penunjang transpor / Transport equipment and support 113,29 0,25 1,48 1,21 3,43
D. Jasa keuangan / Financial services 109,14 0,00 0,00 0,00 0,65
Note :
1) Prior to June 2008, the inflation rate in 45 cities (2002=100)
[1]
Kelompok / Group
[2]
April / April 2010
[3]
Indeks / IndexPerubahan Change (%)
Persentase Perubahan / Percentage Changes
Tahun Kalender / Calender Year
[4] [5] [6]
Tahun ke Tahun / Year on Year
TABEL 1.2 INDEKS HARGA KONSUMEN GABUNGAN 66 KOTA DI INDONESIA DAN PERUBAHANNYA
TABLE COMPOSITE CONSUMER PRICE INDICES OF 66 CITIES IN INDONESIA AND THEIR CHANGES
(2007 = 100)
6
April 2009 thd Desember 2008 / April 2009 to December 2008
April 2010 thd Desember 2009 / April 2010 to December 2009
April 2010 thd April 2009 / April 2010 to April 2009
https:
//www.b
ps.go.id

April 2010 thd April 2009 / April 2010 to April 2009
Year on Year
Year on Year
April 2010 thd April 2009 / April 2010 to April 2009
https:
//www.b
ps.go.id

1) Prior to June 2008, the inflation rate in 45 cities (2002=100)
https:
//www.b
ps.go.id

INDEKS HARGAPRICE INDICES
TABEL 1.3 LAJU INFLASI 66 KOTA 1) DI INDONESIA
TABLE INFLATION RATE OF 66 CITIES IN INDONESIA
1. Banda Aceh 9,54 11,00 10,27 3,50 -0,12 -0,12
2. Lhokseumawe 11,47 4,18 13,78 3,96 -0,58 -0,83
3. Sibolga 5,03 7,13 12,36 1,59 -0,99 2,01
4. Pematang Siantar 6,06 8,37 10,16 2,72 -0,35 1,47
5. Medan 5,97 6,42 10,63 2,69 -1,27 0,97
6. Padang Sidempuan 10,02 5,87 12,34 1,87 -1,26 0,97
7. Padang 8,05 6,90 12,68 2,05 -0,72 1,29
8. Pekanbaru 6,32 7,53 9,02 1,94 -0,06 0,93
9. Dumai - - 14,30 0,80 -1,48 0,78
10. Jambi 10,66 7,42 11,57 2,49 -1,01 1,51
11. Palembang 8,44 8,21 11,15 1,85 -0,34 0,58
12. Bengkulu 6,52 5,00 13,44 2,88 -0,65 1,58
13. Bandar Lampung 6,03 6,58 14,82 4,18 -0,35 1,01
14. Pangkal Pinang 6,42 2,64 18,40 2,17 -1,66 1,32
15. Batam 4,58 4,84 8,39 1,88 0,01 1,74
16. Tanjung Pinang - - 11,90 1,43 -0,43 0,88
17. Jakarta 6,03 6,04 11,11 2,34 -0,28 1,15
18. Bogor - - 14,20 2,16 0,32 1,76
19. Sukabumi - - 11,39 3,49 2,04 0,71
20. Bandung 5,33 5,25 10,23 2,11 0,07 0,98
21. Cirebon 6,31 7,87 14,14 4,11 0,79 0,43
22. Bekasi - - 10,10 1,93 -0,52 1,33
23. Depok - - 11,70 1,30 -1,09 1,06
[7]
20092)
7
[1]
Kota / Cities 2007
[3][2]
2008 20103)2009
[4] [5]
2006
[6]
( 2007 = 100 )
https:
//www.b
ps.go.id

INDEKS HARGAPRICE INDICES
TABEL 1.3 LAJU INFLASI 66 KOTA 1) DI INDONESIA
TABLE INFLATION RATE OF 66 CITIES IN INDONESIA
24. Tasikmalaya 8,44 7,72 12,07 4,17 1,76 1,36
25. Purwokerto 8,45 6,15 12,06 2,83 0,56 1,16
26. Surakarta 6,18 3,28 6,96 2,63 0,77 0,87
27. Semarang 6,08 6,75 10,34 3,19 0,55 1,38
28. Tegal 7,73 8,89 8,52 5,83 1,20 0,71
29. Yogyakarta 10,40 7,99 9,88 2,93 0,25 1,25
30. Jember 6,84 7,25 10,63 3,66 0,15 0,33
31. Sumenep - - 10,20 2,73 -0,35 0,61
32. Kediri 7,77 6,85 9,52 3,60 0,41 0,89
33. Malang 5,92 5,93 10,49 3,39 1,07 1,14
34. Probolinggo - - 10,89 3,55 0,10 0,74
35. Madiun - - 13,27 3,40 0,54 1,07
36. Surabaya 6,71 6,27 8,73 3,39 0,62 0,78
37. Serang - - 13,91 4,57 1,13 0,34
38. Tangerang - - 10,75 2,49 0,05 0,84
39. Cilegon - - 12,96 3,11 -0,01 1,21
40. Denpasar 4,30 5,91 9,25 4,37 1,52 1,23
41. Mataram 4,17 8,76 r) 13,01 r) 3,14 0,85 1,99
42. Bima - - 14,36 4,09 2,03 1,96
43. Maumere - - 16,17 5,22 1,09 2,21
44. Kupang 9,72 8,44 10,90 6,49 1,10 4,22
45. Pontianak 6,32 8,56 11,19 4,91 1,47 2,61
46. Singkawang - - 12,66 1,15 0,09 3,47
[7]
Lanjutan/Continuation
2007
[3]
2009
[5] [6]
20092)Kota / Cities
( 2007 = 100 )
8
20082006 20103)
[4][1] [2]
https:
//www.b
ps.go.id

INDEKS HARGAPRICE INDICES
TABEL 1.3 LAJU INFLASI 66 KOTA 1) DI INDONESIA
TABLE INFLATION RATE OF 66 CITIES IN INDONESIA
47. Sampit 7,75 7,57 8,89 2,85 0,43 1,43
48. Palangka Raya 7,72 7,96 11,65 1,39 -0,25 1,63
49. Banjarmasin 11,03 7,78 11,62 3,86 0,10 2,60
50. Balikpapan 5,52 7,27 11,30 3,60 0,16 2,82
51. Samarinda 6,50 9,18 12,69 4,06 1,75 2,25
52. Tarakan - - 19,85 7,21 0,62 0,75
53. Manado 5,09 10,13 9,71 2,31 -0,16 0,64
54. Palu 8,69 8,13 10,40 5,73 0,92 -0,77
55. Watampone - - 14,22 6,84 1,88 1,10
56. Makassar 7,21 5,71 11,79 3,24 0,40 0,51
57. Parepare - - 13,34 1,40 0,05 -0,33
58. Palopo - - 17,58 4,18 2,14 0,31
59. Kendari 10,57 7,53 15,28 4,60 3,95 0,11
60. Gorontalo 7,54 7,02 9,20 4,35 2,28 0,70
61. Mamuju - - 11,66 1,78 -0,23 -0,31
62. Ambon 4,80 5,85 9,34 6,48 2,66 2,32
63. Ternate 5,12 10,43 r) 11,25 r) 3,88 2,16 0,57
64. Manokwari - - 20,51 7,52 3,59 1,59
65. Sorong - - 19,56 2,61 -0,01 2,35
66. Jayapura 9,52 10,35 12,55 1,92 -0,10 0,79
6,60 6,59r) 11,06 2,78 0,05 1,15
Catatan : Note :
1) Sebelum tahun 2008 merupakan laju inflasi 45 kota (2002=100) 1) Prior to 2008, the inflation rate in 45 cities (2002=100)
2) Laju inflasi sampai dengan bulan April 2009 berdasarkan perubahan 2) The inflation rate until April 2009 was counted based on the changing of consumer price indices
IHK bulan April 2009 terhadap IHK bulan Desember 2008 in April 2009 to consumer price indices in December 2008
3) Laju inflasi sampai dengan bulan April 2010 berdasarkan persentase perubahan 3) The inflation rate until April 2010 was counted based on the changing of consumer price indices
IHK bulan April 2010 terhadap IHK bulan Desember 2009 in April 2010 to consumer price indices in December 2009
[4] [5]
NASIONAL
[1] [2] [3] [6] [7]
9
Lanjutan/Continuation
Kota / Cities 2006 2007 2008 2009 20092) 20103)
( 2007 = 100 )
https:
//www.b
ps.go.id

INDEKS HARGAPRICE INDICES
INDEKS UMUM / GENERAL INDEX 117,44 -0,56 118,84 -0,74 119,75 0,79 117,90 0,43 117,95 -0,08
I. BAHAN MAKANAN / FOODSTUFF 123,18 -2,13 122,99 -2,60 125,34 2,08 125,48 1,08 125,37 -0,05A. Padi-padian, umbi-umbian dan hasilnya / Cereals, roots, and their products 115,01 -1,10 106,54 -1,41 121,82 -2,89 117,43 -0,74 122,01 -1,79B. Daging dan hasil-hasilnya / Meat and its products 124,15 -1,05 133,50 -7,45 117,44 0,00 132,34 -6,66 122,82 -3,87C. Ikan segar / Fresh fish 115,84 -8,00 118,62 -11,96 124,23 8,71 128,90 2,42 128,71 -0,79D. Ikan diawetkan / Preserved fish 128,82 -1,89 135,10 -1,24 120,57 0,00 113,68 0,00 110,81 -0,23E. Telur, susu dan hasil-hasilnya / Eggs, milk and their products 114,36 -0,14 111,29 -0,38 132,95 0,19 127,07 -1,31 136,32 -0,12F. Sayur-sayuran / Vegetables 136,77 -2,83 120,09 0,27 140,06 1,20 142,22 7,21 126,73 2,58G. Kacang - kacangan / Beans and nuts 107,70 0,91 154,00 -0,12 133,76 0,00 112,80 0,12 161,29 0,54H. Buah - buahan / Fruits 130,95 0,99 117,88 0,55 134,74 0,00 128,71 6,26 131,07 0,01I. Bumbu - bumbuan / Spices 138,86 12,90 167,87 19,37 115,71 12,21 112,90 9,51 126,81 8,65J. Lemak dan minyak / Fats and oils 135,23 -1,84 115,71 -0,38 131,46 0,00 141,48 -0,79 110,38 -0,33K. Bahan makanan lainnya / Other food items 212,73 1,22 120,26 3,25 107,19 0,00 146,78 0,00 113,21 4,10
II. MAKANAN JADI, MINUMAN, ROKOK DAN TEMBAKAU 123,06 -0,31 123,42 -0,16 129,26 0,12 129,78 -0,24 123,98 0,01
PREPARED FOOD, BEVERAGE, CIGARETTE AND TOBACCOA. Makanan jadi / Prepared food 126,04 0,06 127,40 0,00 125,14 0,09 123,93 0,00 123,95 0,10B. Minuman yang tidak beralkohol / Non-alcoholic beverages 118,85 -1,64 129,81 -0,63 141,35 0,65 144,51 -1,34 141,90 -0,25C. Tembakau dan minuman beralkohol / Tobacco products and alcoholic beverages 120,00 0,00 110,61 0,00 131,76 0,00 131,77 0,00 112,76 0,00
III. PERUMAHAN, AIR, LISTRIK, GAS DAN BAHAN BAKAR 114,52 0,17 121,28 -0,10 116,29 0,05 110,63 0,22 115,16 -0,42
HOUSING, WATER, ELECTRICITY, GAS AND FUELA. Biaya tempat tinggal / Cost of housing 112,60 0,27 122,38 -0,32 110,33 0,00 108,61 0,40 110,33 -0,05B. Bahan bakar, penerangan dan air / Fuel, electricity and water 107,53 0,13 123,95 0,00 116,92 0,02 107,70 0,00 126,61 -1,83C. Perlengkapan rumahtangga / Household equipment 144,55 -0,06 119,64 0,89 138,73 0,63 106,76 0,00 113,83 0,34D. Penyelenggaraan rumahtangga / Household operation 110,89 -0,51 111,06 0,00 125,89 0,00 128,28 0,11 114,76 0,10
IV. SANDANG / CLOTHING 139,07 0,53 120,71 1,45 130,40 1,37 110,76 0,16 125,70 1,79A. Sandang laki-laki / Men's clothing 123,84 1,17 112,94 0,24 108,44 0,08 104,42 0,00 108,75 3,73B. Sandang wanita / Women's clothing 131,33 0,00 109,08 -0,16 124,87 -0,18 104,97 0,00 112,76 1,36C. Sandang anak-anak / Children's clothing 146,50 0,00 119,92 1,00 113,67 0,00 103,73 0,00 114,02 4,51D. Barang pribadi dan sandang lainnya / Personal effects 153,38 0,74 144,84 4,52 184,31 4,82 137,48 0,70 153,73 0,12
V. KESEHATAN / HEALTH 130,21 0,07 111,00 0,00 107,64 0,01 113,38 2,53 112,10 -0,03A. Jasa kesehatan / Health services 117,21 0,00 104,76 0,00 98,99 0,00 108,35 7,35 112,26 0,00B. Obat-obatan / Medicines 109,04 0,00 99,05 0,00 107,98 0,00 104,94 0,31 108,01 0,00C. Jasa perawatan jasmani / Personal care services 148,22 0,00 129,80 0,00 115,17 0,00 117,15 0,00 101,08 0,98D. Perawatan jasmani dan kosmetika / Personal care and cosmetics 141,41 0,13 113,67 0,00 110,89 0,02 119,92 0,79 115,79 -0,22
VI. PENDIDIKAN, REKREASI & OLAHRAGA / EDUCATION, RECREATION & SPORTS 111,01 0,00 114,83 -0,09 110,54 0,05 125,37 -0,04 123,48 -0,02A. Pendidikan / Education 105,95 0,00 132,35 0,00 106,72 0,00 127,44 0,00 136,68 0,00B. Kursus-kursus/pelatihan / Course and training 141,54 0,00 122,00 0,00 110,37 0,00 117,60 0,00 97,25 0,00C. Perlengkapan/peralatan pendidikan / Educational equipment 106,72 0,00 96,95 0,00 117,95 0,25 103,60 -0,35 106,76 -0,17D. Rekreasi / Recreation 115,48 0,00 108,48 0,00 110,57 0,00 136,07 0,00 107,06 -0,02E. Olahraga / Sports 105,63 0,00 122,77 -3,36 125,69 0,00 143,35 0,00 109,13 0,00
VII. TRANSPOR, KOMUNIKASI DAN JASA KEUANGAN 96,33 -0,17 96,62 0,05 101,33 0,00 100,75 -0,07 103,87 -0,51
TRANSPORTATION, COMMUNICATION AND FINANCIAL SERVICESA. Transpor / Transportation 100,24 -0,28 107,09 0,00 107,62 0,00 108,03 -0,09 108,94 -0,71B. Komunikasi dan pengiriman / Communication and delivery services 83,62 0,00 78,79 0,00 82,86 0,00 78,93 0,00 88,82 0,00C. Sarana dan penunjang transpor / Transport equipment and support 117,42 0,00 111,16 0,78 111,99 0,00 111,21 0,00 103,99 -0,05D. Jasa keuangan / Financial services 118,90 0,00 124,84 0,00 106,76 0,00 112,32 0,00 110,91 0,00
Index Change (%) Index[11][10]
Change (%)
SibolgaPerubahan
Lhokseumawe Pematang Siantar MedanIndeks PerubahanIndeks Perubahan
10
TABEL 1.4 INDEKS HARGA KONSUMEN DI 66 KOTA DAN PERUBAHANNYA
TABLE CONSUMER PRICE INDICES FOR EACH OF THE 66 CITIES AND THEIR CHANGES
IndeksIndeksKelompok / GroupChange (%)
Banda AcehPerubahan
APRIL / APRIL 2010 (2007 = 100)
Indeks
[6] [7][2]
PerubahanIndexChange (%) Change (%)IndexIndex
[9][1] [3] [4] [5] [8]
https:
//www.b
ps.go.id
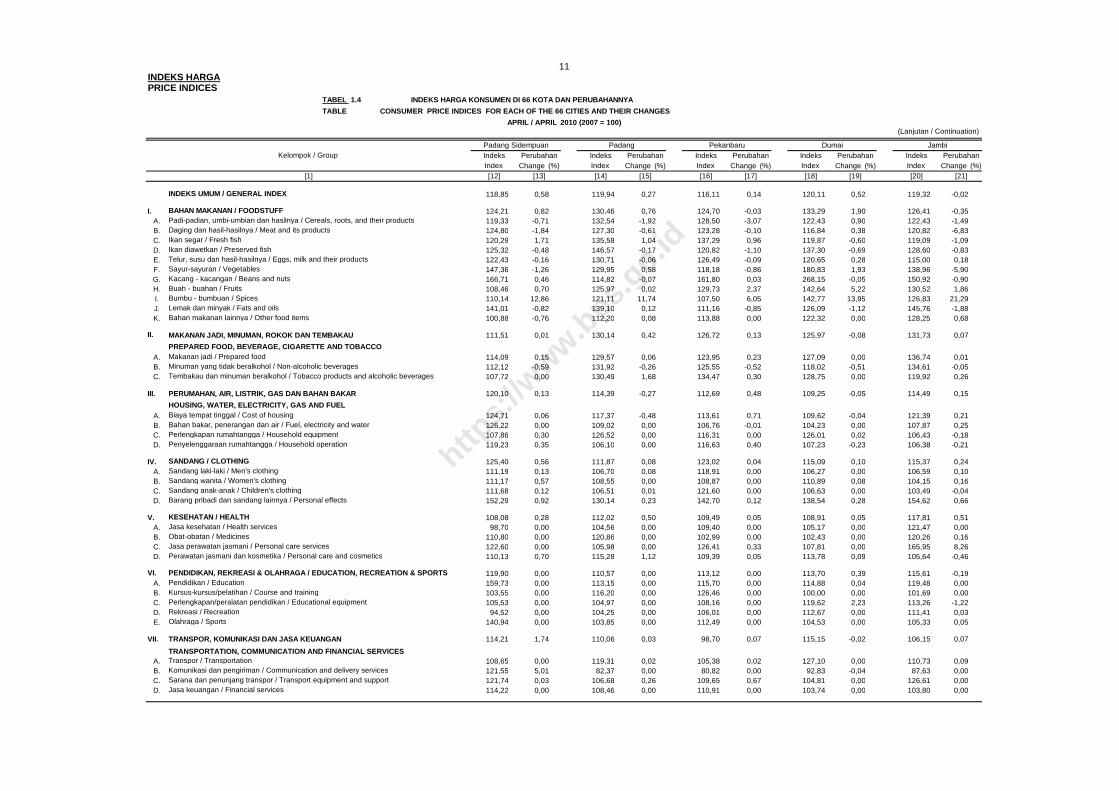
INDEKS HARGAPRICE INDICES
(Lanjutan / Continuation)
INDEKS UMUM / GENERAL INDEX 118,85 0,58 119,94 0,27 116,11 0,14 120,11 0,52 119,32 -0,02
I. BAHAN MAKANAN / FOODSTUFF 124,21 0,82 130,46 0,76 124,70 -0,03 133,29 1,90 126,41 -0,35A. Padi-padian, umbi-umbian dan hasilnya / Cereals, roots, and their products 119,33 -0,71 132,54 -1,92 128,50 -3,07 122,43 0,90 122,43 -1,49B. Daging dan hasil-hasilnya / Meat and its products 124,80 -1,84 127,30 -0,61 123,28 -0,10 116,84 0,38 120,82 -6,83C. Ikan segar / Fresh fish 120,29 1,71 135,58 1,04 137,29 0,96 119,87 -0,60 119,09 -1,09D. Ikan diawetkan / Preserved fish 125,32 -0,48 146,57 -0,17 120,82 -1,10 137,30 -0,69 128,60 -0,83E. Telur, susu dan hasil-hasilnya / Eggs, milk and their products 122,43 -0,16 130,71 -0,06 126,49 -0,09 120,65 0,28 115,00 0,18F. Sayur-sayuran / Vegetables 147,36 -1,26 129,95 0,58 118,18 -0,86 180,83 1,93 138,96 -5,90G. Kacang - kacangan / Beans and nuts 166,71 0,46 114,82 -0,07 161,80 0,03 268,15 -0,05 150,92 -0,90H. Buah - buahan / Fruits 108,46 0,70 125,97 0,02 129,73 2,37 142,64 5,22 130,52 1,86I. Bumbu - bumbuan / Spices 110,14 12,86 121,11 11,74 107,50 6,05 142,77 13,95 126,83 21,29J. Lemak dan minyak / Fats and oils 141,01 -0,82 139,10 0,12 111,16 -0,85 126,09 -1,12 145,76 -1,88K. Bahan makanan lainnya / Other food items 100,88 -0,76 112,20 0,08 113,88 0,00 122,32 0,00 128,25 0,68
II. MAKANAN JADI, MINUMAN, ROKOK DAN TEMBAKAU 111,51 0,01 130,14 0,42 126,72 0,13 125,97 -0,08 131,73 0,07
PREPARED FOOD, BEVERAGE, CIGARETTE AND TOBACCOA. Makanan jadi / Prepared food 114,09 0,15 129,57 0,06 123,95 0,23 127,09 0,00 136,74 0,01B. Minuman yang tidak beralkohol / Non-alcoholic beverages 112,12 -0,59 131,92 -0,26 125,55 -0,52 118,02 -0,51 134,61 -0,05C. Tembakau dan minuman beralkohol / Tobacco products and alcoholic beverages 107,72 0,00 130,49 1,68 134,47 0,30 128,75 0,00 119,92 0,26
III. PERUMAHAN, AIR, LISTRIK, GAS DAN BAHAN BAKAR 120,10 0,13 114,39 -0,27 112,69 0,48 109,25 -0,05 114,49 0,15
HOUSING, WATER, ELECTRICITY, GAS AND FUELA. Biaya tempat tinggal / Cost of housing 124,71 0,06 117,37 -0,48 113,61 0,71 109,62 -0,04 121,39 0,21B. Bahan bakar, penerangan dan air / Fuel, electricity and water 126,22 0,00 109,02 0,00 106,76 -0,01 104,23 0,00 107,87 0,25C. Perlengkapan rumahtangga / Household equipment 107,86 0,30 126,52 0,00 116,31 0,00 126,01 0,02 106,43 -0,18D. Penyelenggaraan rumahtangga / Household operation 119,23 0,35 106,10 0,00 116,63 0,40 107,23 -0,23 106,38 -0,21
IV. SANDANG / CLOTHING 125,40 0,56 111,87 0,08 123,02 0,04 115,09 0,10 115,37 0,24A. Sandang laki-laki / Men's clothing 111,19 0,13 106,70 0,08 118,91 0,00 106,27 0,00 106,59 0,10B. Sandang wanita / Women's clothing 111,17 0,57 108,55 0,00 108,87 0,00 110,89 0,08 104,15 0,16C. Sandang anak-anak / Children's clothing 111,68 0,12 106,51 0,01 121,60 0,00 106,63 0,00 103,49 -0,04D. Barang pribadi dan sandang lainnya / Personal effects 152,29 0,92 130,14 0,23 142,70 0,12 138,54 0,28 154,62 0,66
V. KESEHATAN / HEALTH 108,08 0,28 112,02 0,50 109,49 0,05 108,91 0,05 117,81 0,51A. Jasa kesehatan / Health services 98,70 0,00 104,56 0,00 109,40 0,00 105,17 0,00 121,47 0,00B. Obat-obatan / Medicines 110,80 0,00 120,86 0,00 102,99 0,00 102,43 0,00 120,26 0,16C. Jasa perawatan jasmani / Personal care services 122,60 0,00 105,98 0,00 126,41 0,33 107,81 0,00 165,95 8,26D. Perawatan jasmani dan kosmetika / Personal care and cosmetics 110,13 0,70 115,28 1,12 109,39 0,05 113,78 0,09 105,64 -0,46
VI. PENDIDIKAN, REKREASI & OLAHRAGA / EDUCATION, RECREATION & SPORTS 119,90 0,00 110,57 0,00 113,12 0,00 113,70 0,39 115,61 -0,19A. Pendidikan / Education 159,73 0,00 113,15 0,00 115,70 0,00 114,88 0,04 119,48 0,00B. Kursus-kursus/pelatihan / Course and training 103,55 0,00 116,20 0,00 126,46 0,00 100,00 0,00 101,69 0,00C. Perlengkapan/peralatan pendidikan / Educational equipment 105,53 0,00 104,97 0,00 108,16 0,00 119,62 2,23 113,26 -1,22D. Rekreasi / Recreation 94,52 0,00 104,25 0,00 106,01 0,00 112,67 0,00 111,41 0,03E. Olahraga / Sports 140,94 0,00 103,85 0,00 112,49 0,00 104,53 0,00 105,33 0,05
VII. TRANSPOR, KOMUNIKASI DAN JASA KEUANGAN 114,21 1,74 110,06 0,03 98,70 0,07 115,15 -0,02 106,15 0,07
TRANSPORTATION, COMMUNICATION AND FINANCIAL SERVICESA. Transpor / Transportation 108,65 0,00 119,31 0,02 105,38 0,02 127,10 0,00 110,73 0,09B. Komunikasi dan pengiriman / Communication and delivery services 121,55 5,01 82,37 0,00 80,82 0,00 92,83 -0,04 87,63 0,00C. Sarana dan penunjang transpor / Transport equipment and support 121,74 0,03 106,68 0,26 109,65 0,67 104,81 0,00 126,61 0,00D. Jasa keuangan / Financial services 114,22 0,00 108,46 0,00 110,91 0,00 103,74 0,00 103,80 0,00
Perubahan Indeks PerubahanJambi
Indeks Perubahan Indeks PerubahanDumai
Indeks Perubahan
APRIL / APRIL 2010 (2007 = 100)
Indeks
[1] [12] [13]Index Change (%)
11
[20][15]
Kelompok / GroupPadang Sidempuan Padang Pekanbaru
TABEL 1.4 INDEKS HARGA KONSUMEN DI 66 KOTA DAN PERUBAHANNYA
TABLE CONSUMER PRICE INDICES FOR EACH OF THE 66 CITIES AND THEIR CHANGES
Change (%) Index Change (%)Index Change (%) Index Change (%) Index[14] [18] [19] [21][16] [17]
https:
//www.b
ps.go.id

INDEKS HARGAPRICE INDICES
(Lanjutan / Continuation)
INDEKS UMUM / GENERAL INDEX 118,76 0,01 121,90 0,23 124,49 0,86 123,25 -0,06 114,39 0,03
I. BAHAN MAKANAN / FOODSTUFF 130,85 0,35 134,22 0,37 132,26 1,54 125,10 -0,58 121,70 -0,73A. Padi-padian, umbi-umbian dan hasilnya / Cereals, roots, and their products 124,39 -2,11 118,93 -5,30 120,99 -3,29 109,84 -6,43 116,51 -3,01B. Daging dan hasil-hasilnya / Meat and its products 117,79 -0,68 134,27 -1,76 110,60 1,50 134,66 1,83 118,63 -0,13C. Ikan segar / Fresh fish 117,11 -2,88 139,12 -0,22 127,19 -4,61 121,59 1,54 125,14 -0,78D. Ikan diawetkan / Preserved fish 130,28 -1,30 143,30 0,28 120,71 3,34 131,75 -0,98 136,04 0,03E. Telur, susu dan hasil-hasilnya / Eggs, milk and their products 124,79 0,28 125,62 -0,10 115,07 2,70 114,35 0,50 115,93 0,17F. Sayur-sayuran / Vegetables 154,39 3,71 187,57 4,49 138,26 10,65 138,84 1,13 115,03 -3,31G. Kacang - kacangan / Beans and nuts 220,45 0,06 148,87 0,00 269,68 -0,42 175,05 0,00 139,47 0,00H. Buah - buahan / Fruits 125,50 1,31 125,13 5,10 134,74 5,59 106,74 -1,14 137,52 0,76I. Bumbu - bumbuan / Spices 155,44 15,16 134,32 12,78 147,70 16,88 169,63 -0,46 115,70 2,92J. Lemak dan minyak / Fats and oils 121,82 -2,90 132,53 -0,46 110,51 1,53 112,82 3,38 131,96 -0,11K. Bahan makanan lainnya / Other food items 129,14 0,00 124,28 0,73 117,87 3,02 114,66 0,00 113,75 0,00
II. MAKANAN JADI, MINUMAN, ROKOK DAN TEMBAKAU 126,28 -0,81 132,12 -0,29 140,87 1,99 146,44 -0,14 123,16 0,72
PREPARED FOOD, BEVERAGE, CIGARETTE AND TOBACCOA. Makanan jadi / Prepared food 126,75 0,00 137,35 0,07 122,76 0,43 163,84 0,00 122,59 0,51B. Minuman yang tidak beralkohol / Non-alcoholic beverages 135,31 -4,07 134,06 -2,37 137,78 -2,01 141,25 -0,81 124,85 0,53C. Tembakau dan minuman beralkohol / Tobacco products and alcoholic beverages 118,79 0,00 120,86 0,02 176,25 6,05 119,88 0,00 123,16 1,42
III. PERUMAHAN, AIR, LISTRIK, GAS DAN BAHAN BAKAR 118,63 0,10 123,19 0,15 127,01 0,16 120,09 0,07 111,62 0,16
HOUSING, WATER, ELECTRICITY, GAS AND FUELA. Biaya tempat tinggal / Cost of housing 117,85 0,25 130,26 0,09 128,16 0,02 129,81 0,08 108,12 0,26B. Bahan bakar, penerangan dan air / Fuel, electricity and water 128,54 0,00 114,35 0,00 128,71 0,21 99,79 0,37 117,48 0,00C. Perlengkapan rumahtangga / Household equipment 110,72 0,00 112,51 0,25 123,39 0,90 128,09 0,01 112,72 0,00D. Penyelenggaraan rumahtangga / Household operation 111,28 0,00 122,20 0,77 120,25 0,21 108,79 -0,68 115,50 0,15
IV. SANDANG / CLOTHING 125,69 0,10 120,93 -0,48 121,42 -0,21 121,84 0,15 132,79 0,41A. Sandang laki-laki / Men's clothing 112,17 0,00 107,27 0,00 124,88 0,46 111,22 0,00 122,28 0,00B. Sandang wanita / Women's clothing 107,21 0,00 113,17 0,02 107,14 0,22 110,58 0,00 122,59 0,42C. Sandang anak-anak / Children's clothing 112,22 0,00 117,33 0,00 104,27 0,00 114,66 0,00 128,60 0,00D. Barang pribadi dan sandang lainnya / Personal effects 154,79 0,23 150,26 -1,65 145,51 -1,32 165,23 0,57 154,43 0,95
V. KESEHATAN / HEALTH 114,07 0,00 113,96 0,21 113,22 0,43 122,47 -0,14 112,56 0,13A. Jasa kesehatan / Health services 112,00 0,00 105,42 0,00 108,14 0,00 121,76 0,18 115,19 0,00B. Obat-obatan / Medicines 118,18 0,00 118,98 0,76 112,57 1,52 111,99 0,00 105,91 0,28C. Jasa perawatan jasmani / Personal care services 127,34 0,00 112,92 0,00 134,46 0,00 199,78 0,00 117,35 0,00D. Perawatan jasmani dan kosmetika / Personal care and cosmetics 110,95 0,00 118,53 0,12 114,39 0,42 114,35 -0,40 112,56 0,20
VI. PENDIDIKAN, REKREASI & OLAHRAGA / EDUCATION, RECREATION & SPORTS 110,72 0,00 115,25 0,09 120,45 0,22 118,23 0,00 107,67 0,01A. Pendidikan / Education 116,61 0,00 120,68 0,02 128,53 0,00 124,83 0,00 113,61 0,00B. Kursus-kursus/pelatihan / Course and training 100,00 0,00 126,29 0,00 109,42 0,00 121,51 0,00 100,00 0,00C. Perlengkapan/peralatan pendidikan / Educational equipment 100,87 0,00 109,52 0,24 111,77 0,00 111,03 0,00 106,17 0,08D. Rekreasi / Recreation 111,16 0,00 105,20 0,10 110,61 1,09 107,29 0,00 103,98 0,00E. Olahraga / Sports 105,56 0,00 125,29 0,00 117,30 0,00 103,04 0,00 100,00 0,00
VII. TRANSPOR, KOMUNIKASI DAN JASA KEUANGAN 100,55 0,00 102,38 1,03 99,14 0,07 101,40 1,04 99,83 0,00
TRANSPORTATION, COMMUNICATION AND FINANCIAL SERVICESA. Transpor / Transportation 105,85 0,01 105,90 1,37 102,73 0,10 106,70 1,59 107,26 -0,01B. Komunikasi dan pengiriman / Communication and delivery services 87,39 0,00 80,10 0,00 85,22 0,00 87,24 0,00 78,65 0,00C. Sarana dan penunjang transpor / Transport equipment and support 110,48 0,00 131,90 0,44 105,75 0,00 109,57 0,00 100,53 0,00D. Jasa keuangan / Financial services 102,21 0,00 108,67 0,00 103,63 0,00 106,24 0,00 109,28 0,00
[24] [25] [26] [27] [28]Change (%)
[1] [22] [23] [29] [30] [31]IndexChange (%) Index Change (%)IndexIndex Change (%) Index Change (%)
PerubahanIndeks Perubahan Indeks Perubahan IndeksIndeks Perubahan Perubahan Indeks
12
TABLE CONSUMER PRICE INDICES FOR EACH OF THE 66 CITIES AND THEIR CHANGES
TABEL 1.4 INDEKS HARGA KONSUMEN DI 66 KOTA DAN PERUBAHANNYA
APRIL / APRIL 2010 (2007 = 100)
Kelompok / GroupPalembang Bengkulu Bandar Lampung Pangkal Pinang Batam
https:
//www.b
ps.go.id

INDEKS HARGAPRICE INDICES
(Lanjutan / Continuation)
INDEKS UMUM / GENERAL INDEX 119,43 0,08 117,06 0,22 120,59 0,65 119,15 0,10 116,21 0,14
I. BAHAN MAKANAN / FOODSTUFF 129,48 -0,02 131,27 0,93 132,51 1,42 124,92 0,29 125,01 0,16A. Padi-padian, umbi-umbian dan hasilnya / Cereals, roots, and their products 133,52 0,00 131,82 -0,05 122,36 -0,64 108,38 -1,21 120,08 -1,06B. Daging dan hasil-hasilnya / Meat and its products 133,41 0,00 131,38 -0,24 135,59 -0,46 140,87 0,62 123,68 -0,67C. Ikan segar / Fresh fish 124,82 -1,69 134,52 -1,07 75,06 0,41 127,28 -0,41 125,80 -1,22D. Ikan diawetkan / Preserved fish 154,04 -0,24 130,88 0,05 125,12 1,12 140,88 0,78 138,41 -0,44E. Telur, susu dan hasil-hasilnya / Eggs, milk and their products 116,53 0,27 123,66 0,82 134,33 0,34 133,39 1,19 124,39 0,93F. Sayur-sayuran / Vegetables 87,71 3,66 149,87 4,24 119,71 13,20 110,56 2,86 123,17 6,28G. Kacang - kacangan / Beans and nuts 115,83 0,00 124,85 0,20 258,50 -0,02 152,65 -0,01 138,55 0,00H. Buah - buahan / Fruits 136,62 0,15 133,19 2,38 139,14 7,74 140,17 1,46 118,24 0,14I. Bumbu - bumbuan / Spices 163,63 -0,35 139,65 5,19 124,13 5,76 120,46 0,39 134,07 1,12J. Lemak dan minyak / Fats and oils 136,22 0,77 112,68 -0,55 141,70 -0,69 116,80 -0,44 130,30 0,09K. Bahan makanan lainnya / Other food items 129,32 0,00 112,36 0,21 104,89 0,00 127,95 -0,13 109,32 0,00
II. MAKANAN JADI, MINUMAN, ROKOK DAN TEMBAKAU 131,84 0,17 130,53 0,47 126,13 1,39 126,94 0,01 124,02 0,12
PREPARED FOOD, BEVERAGE, CIGARETTE AND TOBACCOA. Makanan jadi / Prepared food 133,27 0,17 133,35 0,00 124,56 0,00 120,67 0,11 124,77 0,30B. Minuman yang tidak beralkohol / Non-alcoholic beverages 134,05 -0,03 120,52 0,07 136,37 -1,87 132,80 -0,67 127,53 -0,41C. Tembakau dan minuman beralkohol / Tobacco products and alcoholic beverages 127,01 0,27 128,97 2,79 123,05 6,74 136,38 0,19 119,84 0,00
III. PERUMAHAN, AIR, LISTRIK, GAS DAN BAHAN BAKAR 107,17 0,01 116,61 0,05 115,23 0,01 123,87 0,17 111,89 0,26
HOUSING, WATER, ELECTRICITY, GAS AND FUELA. Biaya tempat tinggal / Cost of housing 107,56 0,00 109,34 0,07 118,01 0,00 113,13 0,35 112,10 0,42B. Bahan bakar, penerangan dan air / Fuel, electricity and water 104,13 0,01 152,46 0,01 112,04 0,00 152,95 0,01 110,81 0,00C. Perlengkapan rumahtangga / Household equipment 108,24 -0,12 102,90 0,17 110,40 -0,22 109,59 0,01 103,36 0,00D. Penyelenggaraan rumahtangga / Household operation 113,58 0,26 110,51 -0,06 110,76 0,12 114,98 0,02 115,62 0,01
IV. SANDANG / CLOTHING 118,76 0,86 116,55 -0,27 111,37 -0,04 114,93 0,17 110,37 -0,03A. Sandang laki-laki / Men's clothing 105,73 0,00 113,55 0,02 109,09 0,00 105,05 0,14 103,54 0,06B. Sandang wanita / Women's clothing 104,48 0,00 104,84 0,03 108,65 0,00 101,13 0,17 100,61 0,00C. Sandang anak-anak / Children's clothing 106,04 0,03 105,95 0,00 114,79 0,06 117,15 -0,32 101,01 0,00D. Barang pribadi dan sandang lainnya / Personal effects 158,08 2,56 126,56 -0,55 116,44 -0,33 143,37 0,54 139,96 -0,15
V. KESEHATAN / HEALTH 110,99 0,36 112,77 0,06 117,02 0,56 113,90 -0,86 122,25 0,00A. Jasa kesehatan / Health services 101,59 0,00 111,99 0,00 134,52 0,00 110,15 0,00 141,89 0,00B. Obat-obatan / Medicines 119,06 -0,28 114,20 0,13 105,59 0,19 116,43 -3,18 112,62 0,00C. Jasa perawatan jasmani / Personal care services 102,42 0,00 102,55 0,00 108,19 0,00 112,05 0,00 121,36 0,00D. Perawatan jasmani dan kosmetika / Personal care and cosmetics 116,59 0,81 115,39 0,12 111,20 1,19 116,38 -0,49 106,94 0,00
VI. PENDIDIKAN, REKREASI & OLAHRAGA / EDUCATION, RECREATION & SPORTS 111,01 -0,04 110,34 0,00 122,28 -0,16 103,64 -0,04 118,67 -0,01A. Pendidikan / Education 113,11 0,00 120,34 0,00 133,25 0,00 105,35 0,00 119,07 0,00B. Kursus-kursus/pelatihan / Course and training 108,92 0,00 99,89 0,00 116,49 0,00 107,12 0,00 181,70 0,00C. Perlengkapan/peralatan pendidikan / Educational equipment 115,92 0,00 102,77 0,00 104,30 0,00 98,62 -0,28 107,64 -0,02D. Rekreasi / Recreation 105,12 -0,18 106,88 0,00 111,09 -0,81 102,45 0,04 116,49 -0,02E. Olahraga / Sports 104,38 0,00 100,20 0,00 103,15 0,00 99,64 0,00 115,83 0,00
VII. TRANSPOR, KOMUNIKASI DAN JASA KEUANGAN 111,27 -0,13 101,62 0,02 105,97 -0,06 102,33 0,06 103,97 0,06
TRANSPORTATION, COMMUNICATION AND FINANCIAL SERVICESA. Transpor / Transportation 117,38 0,02 105,66 0,04 109,20 0,00 103,11 0,01 108,35 0,08B. Komunikasi dan pengiriman / Communication and delivery services 98,51 -0,50 86,04 0,00 93,54 -0,32 99,36 0,14 89,37 0,00C. Sarana dan penunjang transpor / Transport equipment and support 113,48 0,00 112,45 0,00 118,60 0,00 105,43 0,30 108,01 0,00D. Jasa keuangan / Financial services 109,73 0,00 108,49 0,00 103,60 0,00 102,35 0,00 103,41 0,00
Change (%)[1] [32] [33] [34] [35] [36] [39] [40] [41]
Indeks Perubahan
[37] [38]
Perubahan Indeks PerubahanIndex Change (%) Index Change (%) Index
BandungBogor
APRIL / APRIL 2010 (2007 = 100)
Kelompok / GroupTanjung Pinang
Indeks PerubahanChange (%) Index
Sukabumi
Change (%) Index
JakartaIndeks Perubahan Indeks
TABEL 1.4 INDEKS HARGA KONSUMEN DI 66 KOTA DAN PERUBAHANNYA
TABLE CONSUMER PRICE INDICES FOR EACH OF THE 66 CITIES AND THEIR CHANGES
13
https:
//www.b
ps.go.id

INDEKS HARGAPRICE INDICES
(Lanjutan / Continuation)
INDEKS UMUM / GENERAL INDEX 122,53 0,07 116,41 0,07 116,61 0,30 121,50 0,02 118,11 0,05
I. BAHAN MAKANAN / FOODSTUFF 127,67 -0,89 127,96 0,08 131,49 1,01 128,14 -0,45 124,51 -0,30A. Padi-padian, umbi-umbian dan hasilnya / Cereals, roots, and their products 115,20 -5,09 123,14 -1,28 123,37 -1,13 120,62 -2,91 105,27 -3,43B. Daging dan hasil-hasilnya / Meat and its products 116,72 0,59 120,57 -5,02 140,62 0,83 128,65 -1,78 138,08 0,00C. Ikan segar / Fresh fish 145,26 -1,20 125,70 -1,33 131,09 -0,73 135,67 -1,49 119,16 -1,15D. Ikan diawetkan / Preserved fish 137,12 3,00 204,85 -1,00 139,63 0,54 122,59 0,09 125,88 -0,23E. Telur, susu dan hasil-hasilnya / Eggs, milk and their products 138,78 1,25 125,63 0,53 128,44 0,18 125,23 0,76 126,00 0,66F. Sayur-sayuran / Vegetables 132,51 11,22 106,89 1,94 152,50 4,65 134,49 8,32 130,45 4,55G. Kacang - kacangan / Beans and nuts 137,54 -13,48 160,75 -1,05 119,23 0,00 162,26 0,40 140,48 0,01H. Buah - buahan / Fruits 125,60 0,00 134,02 7,65 124,81 3,12 142,89 3,34 141,58 -1,36I. Bumbu - bumbuan / Spices 156,68 12,43 130,87 5,94 140,35 6,21 137,74 0,82 126,07 3,29J. Lemak dan minyak / Fats and oils 129,17 -2,45 129,11 -0,93 121,60 -0,82 119,18 0,04 134,83 -0,14K. Bahan makanan lainnya / Other food items 114,24 0,07 111,10 3,38 109,83 1,85 115,86 1,05 141,05 0,94
II. MAKANAN JADI, MINUMAN, ROKOK DAN TEMBAKAU 127,65 0,41 118,18 -0,34 131,62 -0,03 125,56 -0,02 121,83 0,12
PREPARED FOOD, BEVERAGE, CIGARETTE AND TOBACCOA. Makanan jadi / Prepared food 124,50 0,04 115,98 0,10 135,89 0,05 128,75 0,02 118,16 0,30B. Minuman yang tidak beralkohol / Non-alcoholic beverages 129,14 -0,91 119,75 -2,08 135,15 -0,47 115,05 -0,43 130,39 -1,20C. Tembakau dan minuman beralkohol / Tobacco products and alcoholic beverages 137,16 2,30 124,05 0,00 115,44 0,09 120,86 0,07 125,64 0,75
III. PERUMAHAN, AIR, LISTRIK, GAS DAN BAHAN BAKAR 119,33 0,46 107,66 0,30 108,71 0,20 128,01 0,39 119,73 0,17
HOUSING, WATER, ELECTRICITY, GAS AND FUELA. Biaya tempat tinggal / Cost of housing 125,24 0,70 106,47 0,15 109,81 0,26 119,01 0,59 121,57 0,30B. Bahan bakar, penerangan dan air / Fuel, electricity and water 111,58 0,01 111,31 0,62 107,10 0,00 151,81 0,00 114,10 0,00C. Perlengkapan rumahtangga / Household equipment 116,08 0,00 109,30 1,34 111,17 0,97 120,89 1,28 111,00 -0,21D. Penyelenggaraan rumahtangga / Household operation 111,09 0,51 105,53 0,07 105,52 -0,01 117,23 0,06 127,31 0,20
IV. SANDANG / CLOTHING 121,91 -0,56 121,52 0,40 111,83 0,03 112,33 0,21 109,33 0,02A. Sandang laki-laki / Men's clothing 113,96 0,18 123,09 1,62 107,37 0,00 101,14 0,02 112,65 0,12B. Sandang wanita / Women's clothing 104,85 0,00 113,62 0,74 104,58 0,00 99,73 0,00 110,00 0,05C. Sandang anak-anak / Children's clothing 106,84 0,00 118,69 0,14 104,30 0,00 104,96 0,00 101,06 0,00D. Barang pribadi dan sandang lainnya / Personal effects 161,80 -1,81 140,72 -2,05 143,65 0,13 143,87 0,65 114,35 -0,13
V. KESEHATAN / HEALTH 133,49 0,57 118,54 0,51 108,84 0,08 109,04 -0,02 124,42 0,14A. Jasa kesehatan / Health services 160,45 0,00 112,77 0,61 102,69 0,00 117,04 0,00 145,83 0,00B. Obat-obatan / Medicines 143,95 0,24 116,52 0,01 116,73 -0,06 119,45 0,00 102,07 0,10C. Jasa perawatan jasmani / Personal care services 117,79 3,02 109,32 0,00 118,34 0,00 112,64 0,00 104,91 0,00D. Perawatan jasmani dan kosmetika / Personal care and cosmetics 116,85 0,91 124,92 0,61 112,01 0,27 99,68 -0,04 116,39 0,32
VI. PENDIDIKAN, REKREASI & OLAHRAGA / EDUCATION, RECREATION & SPORTS 138,23 -0,01 111,63 0,02 114,54 0,05 118,00 -0,01 113,98 0,27A. Pendidikan / Education 154,96 0,00 115,14 0,00 116,99 0,00 119,16 0,00 119,59 0,00B. Kursus-kursus/pelatihan / Course and training 117,95 0,00 93,16 0,00 104,61 0,00 148,93 0,00 116,66 0,00C. Perlengkapan/peralatan pendidikan / Educational equipment 111,33 -0,11 105,66 0,02 100,68 0,00 106,70 -0,06 106,94 0,44D. Rekreasi / Recreation 121,57 0,00 107,89 0,00 118,96 0,26 121,80 0,00 100,45 1,37E. Olahraga / Sports 127,77 0,00 108,42 0,78 121,65 0,00 109,65 0,00 113,05 0,00
VII. TRANSPOR, KOMUNIKASI DAN JASA KEUANGAN 105,73 0,42 111,82 0,03 104,09 0,02 103,88 0,08 102,59 0,24
TRANSPORTATION, COMMUNICATION AND FINANCIAL SERVICESA. Transpor / Transportation 107,21 0,59 115,41 0,03 106,87 0,03 108,09 0,08 110,08 0,39B. Komunikasi dan pengiriman / Communication and delivery services 93,75 0,18 100,60 0,00 94,31 0,00 77,99 0,00 88,22 0,00C. Sarana dan penunjang transpor / Transport equipment and support 126,89 0,00 123,09 0,00 102,33 0,00 145,16 0,21 96,69 0,01D. Jasa keuangan / Financial services 125,64 0,00 101,12 0,00 123,94 0,00 106,50 0,00 115,37 0,00
[44] [45] [46] [47] [48]Change (%)
[1] [42] [43] [49] [50] [51]IndexChange (%) Index Change (%)IndexIndex Change (%) Index Change (%)
Perubahan Indeks PerubahanIndeks Perubahan Indeks Perubahan Indeks
TABLE CONSUMER PRICE INDICES FOR EACH OF THE 66 CITIES AND THEIR CHANGES
APRIL / APRIL 2010 (2007 = 100)
Kelompok / GroupCirebon Bekasi Depok Tasikmalaya Purwokerto
Indeks Perubahan
TABEL 1.4 INDEKS HARGA KONSUMEN DI 66 KOTA DAN PERUBAHANNYA
14
https:
//www.b
ps.go.id

INDEKS HARGAPRICE INDICES
(Lanjutan / Continuation)
INDEKS UMUM / GENERAL INDEX 112,26 0,19 117,86 0,37 119,79 0,09 118,10 0,25 118,92 0,35
I. BAHAN MAKANAN / FOODSTUFF 122,03 0,56 125,14 1,18 125,52 -0,18 131,02 0,85 132,35 0,67A. Padi-padian, umbi-umbian dan hasilnya / Cereals, roots, and their products 118,57 -3,16 122,65 -2,28 119,81 -2,87 115,47 -3,92 113,38 -2,28B. Daging dan hasil-hasilnya / Meat and its products 132,31 -0,94 138,23 -1,08 135,61 -2,77 127,45 0,23 122,72 -0,21C. Ikan segar / Fresh fish 124,56 0,01 117,67 -0,81 129,98 -0,59 125,65 -0,75 125,78 -2,02D. Ikan diawetkan / Preserved fish 103,47 0,20 134,95 9,73 131,88 -0,30 137,31 -0,07 104,12 -0,34E. Telur, susu dan hasil-hasilnya / Eggs, milk and their products 121,96 0,08 121,91 1,55 128,33 0,36 129,59 0,53 126,10 0,89F. Sayur-sayuran / Vegetables 137,92 11,68 128,07 7,48 125,46 5,21 157,76 8,71 151,37 12,30G. Kacang - kacangan / Beans and nuts 133,85 0,30 123,91 0,02 126,74 -0,21 172,30 0,43 173,89 0,51H. Buah - buahan / Fruits 103,03 -2,32 120,23 1,19 115,72 -0,16 140,65 3,93 156,53 6,15I. Bumbu - bumbuan / Spices 128,22 12,26 130,65 13,41 140,73 7,18 156,64 10,02 171,63 -0,29J. Lemak dan minyak / Fats and oils 116,11 -0,47 119,28 -1,63 123,50 3,18 109,99 -1,97 141,49 -0,32K. Bahan makanan lainnya / Other food items 103,50 0,43 107,16 0,13 117,38 0,25 105,95 1,88 120,37 0,00
II. MAKANAN JADI, MINUMAN, ROKOK DAN TEMBAKAU 111,53 0,24 126,34 0,52 138,29 0,14 122,65 0,16 126,80 -0,06
PREPARED FOOD, BEVERAGE, CIGARETTE AND TOBACCOA. Makanan jadi / Prepared food 102,47 0,12 126,40 0,55 137,08 -0,04 121,04 0,01 133,44 0,01B. Minuman yang tidak beralkohol / Non-alcoholic beverages 128,36 -0,26 124,13 -0,05 138,59 -0,79 130,92 -0,22 129,09 -0,29C. Tembakau dan minuman beralkohol / Tobacco products and alcoholic beverages 127,95 1,28 128,55 0,99 141,63 1,29 121,35 1,40 111,03 0,00
III. PERUMAHAN, AIR, LISTRIK, GAS DAN BAHAN BAKAR 117,05 0,02 119,17 0,05 114,03 0,32 119,52 0,13 120,23 0,86
HOUSING, WATER, ELECTRICITY, GAS AND FUELA. Biaya tempat tinggal / Cost of housing 112,52 0,05 123,81 0,11 111,75 0,57 118,32 0,20 128,75 1,74B. Bahan bakar, penerangan dan air / Fuel, electricity and water 127,56 0,00 116,70 -0,02 120,53 -0,02 130,96 0,00 114,39 0,00C. Perlengkapan rumahtangga / Household equipment 109,54 0,09 109,86 0,05 115,23 0,25 116,56 -0,03 111,63 0,00D. Penyelenggaraan rumahtangga / Household operation 111,91 -0,07 111,96 -0,04 106,69 0,14 108,52 0,01 112,33 0,34
IV. SANDANG / CLOTHING 105,60 0,01 122,09 -0,02 111,79 0,01 118,49 0,09 115,62 0,06A. Sandang laki-laki / Men's clothing 103,32 0,04 117,46 0,04 105,11 0,10 105,25 0,17 103,24 0,00B. Sandang wanita / Women's clothing 102,42 0,00 114,82 0,21 104,51 0,00 108,99 0,02 102,85 0,00C. Sandang anak-anak / Children's clothing 101,01 0,04 116,62 0,18 106,89 0,00 109,61 0,24 102,15 0,00D. Barang pribadi dan sandang lainnya / Personal effects 122,62 -0,06 151,45 -0,66 128,77 -0,04 148,05 0,03 153,41 0,18
V. KESEHATAN / HEALTH 110,06 0,17 111,53 -0,11 107,70 0,10 112,78 0,31 110,35 0,03A. Jasa kesehatan / Health services 111,10 0,00 106,39 0,00 102,46 0,00 108,57 0,66 112,64 0,00B. Obat-obatan / Medicines 105,78 0,15 132,45 0,14 102,11 0,05 125,38 -0,01 113,93 0,20C. Jasa perawatan jasmani / Personal care services 102,98 0,00 110,88 0,09 113,42 0,00 114,75 0,11 111,39 0,00D. Perawatan jasmani dan kosmetika / Personal care and cosmetics 112,03 0,33 109,02 -0,34 114,11 0,22 110,62 0,05 106,22 -0,03
VI. PENDIDIKAN, REKREASI & OLAHRAGA / EDUCATION, RECREATION & SPORTS 104,87 0,00 111,40 -0,04 117,44 0,02 114,29 -0,04 109,84 0,00A. Pendidikan / Education 106,09 0,00 112,69 0,00 130,51 0,00 118,60 0,00 121,09 0,00B. Kursus-kursus/pelatihan / Course and training 98,92 0,00 102,67 0,00 105,93 0,00 111,22 0,00 120,13 0,00C. Perlengkapan/peralatan pendidikan / Educational equipment 104,31 0,00 104,68 0,11 104,60 0,11 111,59 0,00 102,25 0,00D. Rekreasi / Recreation 103,05 0,00 113,65 -0,22 103,50 0,00 103,38 -0,25 97,79 0,00E. Olahraga / Sports 99,86 0,00 104,58 0,18 98,60 0,00 105,79 0,28 104,84 0,00
VII. TRANSPOR, KOMUNIKASI DAN JASA KEUANGAN 100,31 0,00 101,41 0,03 100,84 0,03 102,78 0,10 103,28 -0,10
TRANSPORTATION, COMMUNICATION AND FINANCIAL SERVICESA. Transpor / Transportation 104,88 0,01 107,88 0,04 106,16 0,04 108,87 0,02 110,83 0,02B. Komunikasi dan pengiriman / Communication and delivery services 87,90 0,00 85,22 0,00 80,26 0,00 76,39 -0,05 82,18 -0,48C. Sarana dan penunjang transpor / Transport equipment and support 99,87 0,01 101,64 0,14 112,03 0,00 135,96 0,79 107,09 0,00D. Jasa keuangan / Financial services 109,15 0,00 119,83 0,00 101,26 0,00 108,99 0,00 117,12 0,00
Change (%)[1] [52] [53] [54] [55] [56] [59] [60] [61]
Indeks Perubahan
[57] [58]
Perubahan Indeks PerubahanIndex Change (%) Index Change (%) Index
JemberTegal
APRIL / APRIL 2010 (2007 = 100)
Kelompok / GroupSurakarta
Indeks PerubahanChange (%) Index
Yogyakarta
Change (%) Index
SemarangIndeks Perubahan Indeks
TABEL 1.4 INDEKS HARGA KONSUMEN DI 66 KOTA DAN PERUBAHANNYA
TABLE CONSUMER PRICE INDICES FOR EACH OF THE 66 CITIES AND THEIR CHANGES
15
https:
//www.b
ps.go.id

INDEKS HARGAPRICE INDICES
(Lanjutan / Continuation)
INDEKS UMUM / GENERAL INDEX 114,90 0,10 117,28 0,26 118,34 0,14 120,80 0,02 122,37 0,23
I. BAHAN MAKANAN / FOODSTUFF 127,07 0,55 124,90 0,91 132,63 0,38 121,44 -0,41 129,49 0,65A. Padi-padian, umbi-umbian dan hasilnya / Cereals, roots, and their products 107,08 -4,37 116,92 -0,86 119,89 -4,95 111,99 -2,84 124,55 -4,51B. Daging dan hasil-hasilnya / Meat and its products 139,27 -0,36 133,74 -0,69 128,47 -1,55 134,82 0,55 103,26 0,44C. Ikan segar / Fresh fish 123,05 4,63 142,38 -0,44 127,88 -2,42 135,48 -1,30 126,69 -0,16D. Ikan diawetkan / Preserved fish 120,25 7,14 170,03 0,00 111,79 -0,02 90,53 -3,93 142,88 2,87E. Telur, susu dan hasil-hasilnya / Eggs, milk and their products 138,22 1,06 132,34 0,62 126,27 -0,62 125,29 -0,20 124,55 1,09F. Sayur-sayuran / Vegetables 178,96 12,84 158,81 10,98 156,32 13,18 121,22 6,54 146,28 15,30G. Kacang - kacangan / Beans and nuts 211,43 -0,17 111,17 0,08 193,36 0,00 143,48 0,11 168,01 0,01H. Buah - buahan / Fruits 115,90 -0,97 116,27 -0,79 144,83 2,71 111,14 -0,32 109,41 0,31I. Bumbu - bumbuan / Spices 102,58 1,19 109,37 3,87 143,82 9,36 141,09 3,58 181,88 7,71J. Lemak dan minyak / Fats and oils 121,04 -0,62 119,94 -0,37 109,70 -0,02 107,19 -0,19 118,65 -1,43K. Bahan makanan lainnya / Other food items 119,17 0,00 106,62 0,11 108,76 0,08 105,94 0,00 125,82 0,81
II. MAKANAN JADI, MINUMAN, ROKOK DAN TEMBAKAU 118,09 -0,54 122,77 -0,29 124,91 -0,10 126,09 0,11 133,22 0,01
PREPARED FOOD, BEVERAGE, CIGARETTE AND TOBACCOA. Makanan jadi / Prepared food 109,83 0,00 118,65 0,00 127,75 0,00 120,84 0,35 142,17 0,00B. Minuman yang tidak beralkohol / Non-alcoholic beverages 124,84 -2,47 132,96 -1,39 130,19 -0,53 141,24 -0,56 125,52 0,04C. Tembakau dan minuman beralkohol / Tobacco products and alcoholic beverages 131,23 0,00 125,28 0,00 109,46 0,00 125,70 0,22 117,34 0,00
III. PERUMAHAN, AIR, LISTRIK, GAS DAN BAHAN BAKAR 112,02 0,01 118,63 0,14 113,77 0,12 124,69 0,30 123,88 0,36
HOUSING, WATER, ELECTRICITY, GAS AND FUELA. Biaya tempat tinggal / Cost of housing 113,95 0,01 115,91 0,33 118,46 0,26 128,51 0,64 123,95 0,59B. Bahan bakar, penerangan dan air / Fuel, electricity and water 107,58 0,00 125,90 0,00 104,52 0,00 124,42 0,04 128,72 0,00C. Perlengkapan rumahtangga / Household equipment 116,54 0,00 114,37 0,04 114,14 0,12 129,00 0,21 113,17 0,09D. Penyelenggaraan rumahtangga / Household operation 108,78 0,01 114,12 -0,11 116,47 -0,11 111,07 -0,22 117,96 0,55
IV. SANDANG / CLOTHING 115,15 0,24 118,01 0,36 120,17 0,31 123,53 0,37 117,05 0,09A. Sandang laki-laki / Men's clothing 106,48 0,00 112,08 0,30 117,53 0,23 110,84 0,11 108,66 0,00B. Sandang wanita / Women's clothing 106,09 0,00 107,95 0,36 113,03 0,26 111,20 0,08 116,77 0,03C. Sandang anak-anak / Children's clothing 106,07 0,00 111,79 0,14 113,82 0,39 118,90 0,13 113,35 0,00D. Barang pribadi dan sandang lainnya / Personal effects 137,78 0,69 142,50 0,59 137,93 0,37 151,70 0,92 129,53 0,32
V. KESEHATAN / HEALTH 109,68 0,00 112,80 0,05 113,53 0,01 117,41 0,20 118,32 0,08A. Jasa kesehatan / Health services 106,67 0,00 102,85 0,00 106,86 0,00 112,97 0,19 117,42 0,00B. Obat-obatan / Medicines 101,59 0,00 116,36 0,00 124,99 0,05 116,20 -0,03 126,57 0,02C. Jasa perawatan jasmani / Personal care services 110,08 0,00 138,38 0,00 106,16 0,00 123,14 0,93 108,74 0,00D. Perawatan jasmani dan kosmetika / Personal care and cosmetics 114,86 0,00 112,91 0,12 114,53 0,00 120,69 0,20 116,80 0,22
VI. PENDIDIKAN, REKREASI & OLAHRAGA / EDUCATION, RECREATION & SPORTS 112,86 0,10 122,91 0,04 112,91 0,03 118,64 0,00 115,02 0,00A. Pendidikan / Education 121,70 0,00 132,70 0,00 116,70 0,00 123,31 0,00 119,52 0,00B. Kursus-kursus/pelatihan / Course and training 119,31 0,00 126,43 0,00 102,10 0,00 112,98 0,00 120,48 0,00C. Perlengkapan/peralatan pendidikan / Educational equipment 109,35 0,00 106,25 0,20 109,05 0,00 107,85 0,00 114,19 0,00D. Rekreasi / Recreation 108,80 0,08 110,69 0,07 110,61 0,14 115,96 0,00 106,07 0,00E. Olahraga / Sports 102,19 1,25 120,72 0,00 106,51 0,00 108,75 0,00 103,34 0,00
VII. TRANSPOR, KOMUNIKASI DAN JASA KEUANGAN 100,58 0,00 102,54 0,22 105,38 0,09 109,86 0,01 109,13 0,00
TRANSPORTATION, COMMUNICATION AND FINANCIAL SERVICESA. Transpor / Transportation 101,79 0,00 105,65 0,03 111,78 0,04 105,55 0,03 112,87 0,00B. Komunikasi dan pengiriman / Communication and delivery services 94,93 0,00 85,73 0,00 85,62 0,00 95,28 0,00 100,49 0,00C. Sarana dan penunjang transpor / Transport equipment and support 103,94 0,00 125,83 1,59 112,81 0,55 181,31 0,00 109,97 0,00D. Jasa keuangan / Financial services 107,35 0,00 114,53 0,00 114,50 0,00 129,56 0,00 111,68 0,00
[64] [65] [66] [67] [68]Change (%)
[1] [62] [63] [69] [70] [71]IndexChange (%) Index Change (%)IndexIndex Change (%) Index Change (%)
Perubahan Indeks PerubahanIndeks Perubahan Indeks Perubahan Indeks
TABLE CONSUMER PRICE INDICES FOR EACH OF THE 66 CITIES AND THEIR CHANGES
APRIL / APRIL 2010 (2007 = 100)
Kelompok / GroupSumenep Kediri Malang Probolinggo Madiun
Indeks Perubahan
TABEL 1.4 INDEKS HARGA KONSUMEN DI 66 KOTA DAN PERUBAHANNYA
16
https:
//www.b
ps.go.id

INDEKS HARGAPRICE INDICES
(Lanjutan / Continuation)
INDEKS UMUM / GENERAL INDEX 115,99 0,15 122,71 0,03 119,51 0,10 120,08 0,34 117,76 -0,19
I. BAHAN MAKANAN / FOODSTUFF 129,26 0,29 128,54 0,22 128,19 -0,11 126,25 1,07 134,24 -0,94A. Padi-padian, umbi-umbian dan hasilnya / Cereals, roots, and their products 126,34 -2,05 117,04 -2,39 113,87 -1,71 107,73 -1,96 122,60 -2,52B. Daging dan hasil-hasilnya / Meat and its products 118,12 -1,05 126,61 -1,46 130,95 -0,49 122,29 0,18 119,96 -1,36C. Ikan segar / Fresh fish 131,94 -0,74 124,80 -2,19 126,23 -1,68 114,23 -1,92 129,18 -4,24D. Ikan diawetkan / Preserved fish 112,70 -1,68 117,72 0,11 103,96 0,43 134,99 -0,15 161,13 0,00E. Telur, susu dan hasil-hasilnya / Eggs, milk and their products 122,48 0,99 127,12 0,53 120,69 0,68 130,74 1,23 133,41 0,29F. Sayur-sayuran / Vegetables 153,07 8,70 154,61 3,71 126,38 0,99 171,05 9,75 154,74 -3,79G. Kacang - kacangan / Beans and nuts 167,67 0,63 155,42 0,07 243,16 -0,06 117,48 0,05 140,68 0,06H. Buah - buahan / Fruits 131,81 0,27 144,54 2,74 158,98 2,77 130,76 -1,51 142,51 -1,47I. Bumbu - bumbuan / Spices 136,71 4,34 155,01 9,72 115,96 3,10 166,16 8,69 159,61 7,76J. Lemak dan minyak / Fats and oils 119,60 -1,25 98,73 -3,22 108,53 -0,39 127,39 -0,23 138,88 -1,01K. Bahan makanan lainnya / Other food items 110,43 0,03 113,46 -0,13 116,50 0,00 137,57 0,27 152,63 0,00
II. MAKANAN JADI, MINUMAN, ROKOK DAN TEMBAKAU 123,19 0,09 127,57 -0,03 132,89 0,54 130,11 0,02 126,03 -0,05
PREPARED FOOD, BEVERAGE, CIGARETTE AND TOBACCOA. Makanan jadi / Prepared food 122,45 0,28 130,70 0,07 132,71 0,02 144,27 0,17 127,56 0,15B. Minuman yang tidak beralkohol / Non-alcoholic beverages 126,78 -1,05 123,29 -0,52 149,57 2,14 119,70 -0,42 117,09 -0,67C. Tembakau dan minuman beralkohol / Tobacco products and alcoholic beverages 121,99 0,73 123,21 0,09 119,27 0,48 111,32 0,00 133,66 0,00
III. PERUMAHAN, AIR, LISTRIK, GAS DAN BAHAN BAKAR 111,27 0,13 128,41 -0,08 115,77 -0,01 121,38 0,15 116,48 0,01
HOUSING, WATER, ELECTRICITY, GAS AND FUELA. Biaya tempat tinggal / Cost of housing 115,73 0,19 127,82 -0,11 107,34 0,00 116,63 0,17 116,10 0,06B. Bahan bakar, penerangan dan air / Fuel, electricity and water 104,10 0,00 144,16 -0,01 126,84 -0,24 132,81 0,00 119,58 0,00C. Perlengkapan rumahtangga / Household equipment 108,59 0,43 122,35 -0,06 118,54 0,15 110,48 0,87 108,94 -1,65D. Penyelenggaraan rumahtangga / Household operation 113,59 0,00 105,90 -0,14 131,49 0,38 121,86 0,05 115,30 0,34
IV. SANDANG / CLOTHING 119,75 0,33 126,97 0,04 121,05 0,02 111,94 0,09 110,65 1,11A. Sandang laki-laki / Men's clothing 104,49 0,00 110,82 -0,05 123,82 0,54 100,84 -0,19 103,94 0,63B. Sandang wanita / Women's clothing 103,46 -0,01 106,34 0,09 111,74 -0,92 103,69 0,10 105,17 2,20C. Sandang anak-anak / Children's clothing 106,56 0,03 102,49 -0,02 109,19 0,02 104,71 0,00 103,44 2,07D. Barang pribadi dan sandang lainnya / Personal effects 147,06 0,75 180,91 0,09 150,32 0,80 146,13 0,41 136,58 -0,49
V. KESEHATAN / HEALTH 108,75 0,04 117,86 0,17 118,08 0,62 108,07 0,00 119,51 0,13A. Jasa kesehatan / Health services 101,65 0,00 116,64 0,00 118,02 1,15 104,21 0,00 146,52 0,00B. Obat-obatan / Medicines 113,51 0,11 121,87 -0,08 115,71 0,23 106,34 0,00 102,71 0,12C. Jasa perawatan jasmani / Personal care services 112,09 0,00 121,24 0,00 115,92 0,00 123,71 0,00 100,13 0,00D. Perawatan jasmani dan kosmetika / Personal care and cosmetics 112,34 0,04 116,61 0,47 119,27 0,40 110,38 0,00 106,80 0,31
VI. PENDIDIKAN, REKREASI & OLAHRAGA / EDUCATION, RECREATION & SPORTS 116,34 -0,03 117,65 -0,06 113,98 0,05 105,29 0,37 106,98 0,06A. Pendidikan / Education 127,13 0,00 117,88 0,00 115,62 0,00 101,45 0,00 107,92 0,00B. Kursus-kursus/pelatihan / Course and training 101,32 0,00 193,25 0,00 118,15 0,00 131,43 0,00 109,80 0,00C. Perlengkapan/peralatan pendidikan / Educational equipment 102,90 0,00 121,50 -0,05 112,13 0,50 106,69 -0,06 104,54 0,62D. Rekreasi / Recreation 109,03 -0,14 106,00 -0,21 108,55 -0,11 105,71 1,79 105,46 -0,21E. Olahraga / Sports 105,22 0,00 103,72 0,00 116,32 0,14 107,08 0,00 99,33 0,00
VII. TRANSPOR, KOMUNIKASI DAN JASA KEUANGAN 104,85 0,11 103,36 -0,02 106,20 -0,02 107,93 0,02 104,09 -0,12
TRANSPORTATION, COMMUNICATION AND FINANCIAL SERVICESA. Transpor / Transportation 111,14 0,02 110,74 0,01 106,01 -0,01 111,22 0,04 109,67 0,00B. Komunikasi dan pengiriman / Communication and delivery services 86,65 0,00 79,11 -0,13 100,17 -0,10 101,34 0,00 78,25 -0,66C. Sarana dan penunjang transpor / Transport equipment and support 111,34 0,96 120,34 0,01 128,49 0,10 108,93 0,00 133,91 0,00D. Jasa keuangan / Financial services 114,90 0,00 107,36 0,00 106,74 0,00 104,92 0,00 110,14 0,00
Change (%)[1] [72] [73] [74] [75] [76] [79] [80] [81]
Indeks Perubahan
[77] [78]
Perubahan Indeks PerubahanIndex Change (%) Index Change (%) Index
DenpasarTangerang
APRIL / APRIL 2010 (2007 = 100)
Kelompok / GroupSurabaya
Indeks PerubahanChange (%) Index
Cilegon
Change (%) Index
SerangIndeks Perubahan Indeks
TABEL 1.4 INDEKS HARGA KONSUMEN DI 66 KOTA DAN PERUBAHANNYA
TABLE CONSUMER PRICE INDICES FOR EACH OF THE 66 CITIES AND THEIR CHANGES
17
https:
//www.b
ps.go.id

INDEKS HARGAPRICE INDICES
(Lanjutan / Continuation)
INDEKS UMUM / GENERAL INDEX 121,89 -0,33 126,19 0,42 128,80 0,10 125,71 0,94 123,69 0,11
I. BAHAN MAKANAN / FOODSTUFF 138,45 -1,68 130,66 0,34 141,08 -0,08 148,73 1,63 138,73 0,13A. Padi-padian, umbi-umbian dan hasilnya / Cereals, roots, and their products 120,56 -2,48 126,99 -2,31 129,85 -0,41 126,11 -0,06 127,98 -1,01B. Daging dan hasil-hasilnya / Meat and its products 137,99 -0,20 136,68 0,00 145,34 -0,02 129,70 -0,28 139,39 3,03C. Ikan segar / Fresh fish 137,61 2,38 111,13 0,76 117,00 0,53 170,41 -0,28 158,67 3,64D. Ikan diawetkan / Preserved fish 239,35 3,03 125,17 -11,04 144,12 -4,16 154,46 0,00 147,57 1,92E. Telur, susu dan hasil-hasilnya / Eggs, milk and their products 127,62 -0,48 135,14 -0,18 156,98 0,06 122,41 0,07 127,31 -1,93F. Sayur-sayuran / Vegetables 148,17 -6,26 117,95 2,55 155,11 1,02 206,13 1,41 151,96 -1,31G. Kacang - kacangan / Beans and nuts 157,76 -0,13 103,65 0,00 112,42 0,19 115,11 1,39 134,27 1,11H. Buah - buahan / Fruits 144,67 -3,19 191,18 7,78 203,53 0,06 218,30 8,32 136,64 -2,20I. Bumbu - bumbuan / Spices 161,57 -6,73 185,26 8,02 214,53 -1,01 199,57 15,07 136,90 -5,20J. Lemak dan minyak / Fats and oils 120,32 -1,10 121,23 -1,12 133,66 -0,02 99,08 -1,47 131,22 -1,15K. Bahan makanan lainnya / Other food items 114,30 0,00 118,57 0,00 118,94 0,00 115,23 0,00 127,75 0,32
II. MAKANAN JADI, MINUMAN, ROKOK DAN TEMBAKAU 123,28 -0,44 142,73 1,59 128,60 0,72 134,09 0,42 125,59 0,06
PREPARED FOOD, BEVERAGE, CIGARETTE AND TOBACCOA. Makanan jadi / Prepared food 123,00 0,00 158,70 2,86 133,01 1,26 140,79 0,16 118,77 0,00B. Minuman yang tidak beralkohol / Non-alcoholic beverages 125,65 -2,21 144,48 -0,22 118,08 0,12 131,42 0,00 151,81 -0,11C. Tembakau dan minuman beralkohol / Tobacco products and alcoholic beverages 122,04 0,00 114,63 0,00 131,21 0,22 122,25 1,53 125,69 0,42
III. PERUMAHAN, AIR, LISTRIK, GAS DAN BAHAN BAKAR 124,64 0,67 121,21 -0,02 129,62 -0,16 117,68 -0,12 123,65 0,34
HOUSING, WATER, ELECTRICITY, GAS AND FUELA. Biaya tempat tinggal / Cost of housing 129,12 1,04 131,34 0,01 139,26 -0,19 120,71 -0,13 128,72 0,52B. Bahan bakar, penerangan dan air / Fuel, electricity and water 119,33 0,03 100,39 0,00 111,88 -0,02 109,76 -0,22 118,80 0,20C. Perlengkapan rumahtangga / Household equipment 112,23 0,04 132,20 -0,17 120,18 -0,06 118,88 0,00 111,96 0,04D. Penyelenggaraan rumahtangga / Household operation 121,24 0,40 109,66 0,00 129,65 -0,25 114,03 0,17 121,26 0,04
IV. SANDANG / CLOTHING 114,79 0,01 140,10 -0,01 116,66 0,32 117,74 -0,31 120,81 1,21A. Sandang laki-laki / Men's clothing 105,86 0,04 140,11 0,00 117,91 -0,08 125,18 -2,26 121,94 3,26B. Sandang wanita / Women's clothing 109,90 0,21 123,13 0,00 112,43 0,56 105,15 1,21 106,99 -0,62C. Sandang anak-anak / Children's clothing 112,42 0,13 123,42 0,00 113,78 1,16 111,80 0,00 107,26 1,22D. Barang pribadi dan sandang lainnya / Personal effects 134,49 -0,33 175,10 -0,02 131,53 -0,58 133,61 0,73 149,94 0,91
V. KESEHATAN / HEALTH 113,60 0,72 120,66 0,00 114,34 0,35 111,17 0,28 115,43 0,22A. Jasa kesehatan / Health services 112,68 0,00 104,21 0,00 115,20 1,27 100,72 0,00 116,45 0,16B. Obat-obatan / Medicines 112,88 -1,07 124,25 0,00 109,02 -0,10 103,70 1,42 104,75 0,27C. Jasa perawatan jasmani / Personal care services 110,20 0,12 122,66 0,00 123,46 0,00 131,54 0,00 128,38 0,00D. Perawatan jasmani dan kosmetika / Personal care and cosmetics 114,68 1,77 127,15 0,00 114,41 0,00 115,48 0,11 117,04 0,26
VI. PENDIDIKAN, REKREASI & OLAHRAGA / EDUCATION, RECREATION & SPORTS 111,63 0,01 109,82 0,06 115,03 0,47 111,62 0,02 136,02 0,01A. Pendidikan / Education 114,37 0,00 100,29 0,00 114,00 0,00 110,97 0,00 157,36 0,00B. Kursus-kursus/pelatihan / Course and training 118,53 0,00 166,41 0,00 123,05 0,00 99,97 0,00 125,79 0,00C. Perlengkapan/peralatan pendidikan / Educational equipment 106,64 0,00 114,97 0,00 118,95 0,04 108,82 0,00 112,17 0,00D. Rekreasi / Recreation 110,06 0,04 122,14 0,21 115,10 2,46 119,10 0,15 105,72 0,06E. Olahraga / Sports 101,75 0,00 109,63 0,00 113,24 0,00 97,82 -1,29 124,68 0,00
VII. TRANSPOR, KOMUNIKASI DAN JASA KEUANGAN 102,07 0,22 108,25 0,00 103,49 0,06 108,37 2,73 101,37 -0,67
TRANSPORTATION, COMMUNICATION AND FINANCIAL SERVICESA. Transpor / Transportation 106,44 0,31 108,89 0,00 106,29 0,00 112,04 3,90 110,65 -1,04B. Komunikasi dan pengiriman / Communication and delivery services 87,74 0,00 102,37 0,00 97,92 -0,43 98,63 0,00 77,03 0,00C. Sarana dan penunjang transpor / Transport equipment and support 104,29 0,00 125,95 0,00 114,37 3,41 107,71 0,00 117,80 0,14D. Jasa keuangan / Financial services 109,80 0,00 101,70 0,00 102,37 0,00 106,84 0,00 104,87 0,00
[91]Index Change (%)Change (%)
[89] [90][85][1] [82] [83] [84]Index Change (%) Index Change (%) Index Change (%) Index
[86] [87] [88]
Indeks PerubahanIndeks Perubahan Indeks Perubahan Indeks Perubahan
TABLE CONSUMER PRICE INDICES FOR EACH OF THE 66 CITIES AND THEIR CHANGES
APRIL / APRIL 2010 (2007 = 100)
Kelompok / GroupMataram Bima Maumere Kupang Pontianak
Indeks Perubahan
TABEL 1.4 INDEKS HARGA KONSUMEN DI 66 KOTA DAN PERUBAHANNYA
18
https:
//www.b
ps.go.id

INDEKS HARGAPRICE INDICES
(Lanjutan / Continuation)
INDEKS UMUM / GENERAL INDEX 121,98 -0,08 117,38 -0,19 119,72 0,30 122,51 1,09 121,89 0,26
I. BAHAN MAKANAN / FOODSTUFF 131,16 -1,94 127,91 -1,07 140,54 1,22 137,40 2,25 134,92 -0,03A. Padi-padian, umbi-umbian dan hasilnya / Cereals, roots, and their products 120,06 -1,01 111,74 -1,61 132,72 8,30 138,34 15,26 137,11 -1,53B. Daging dan hasil-hasilnya / Meat and its products 137,15 -5,70 133,73 -5,85 142,36 -3,61 171,79 -3,35 145,23 -4,82C. Ikan segar / Fresh fish 118,88 -0,12 121,93 -1,49 140,58 -4,01 134,15 -7,85 142,37 0,08D. Ikan diawetkan / Preserved fish 122,22 0,78 112,00 -1,91 142,42 -6,57 137,34 1,58 119,46 -0,11E. Telur, susu dan hasil-hasilnya / Eggs, milk and their products 117,73 -2,18 135,33 0,04 125,28 0,43 120,52 0,83 125,29 0,37F. Sayur-sayuran / Vegetables 162,41 -4,03 134,15 2,07 140,91 5,56 128,66 4,25 145,06 7,37G. Kacang - kacangan / Beans and nuts 173,31 0,18 240,43 0,21 228,20 0,14 126,68 -3,31 140,19 0,82H. Buah - buahan / Fruits 149,67 -0,11 127,39 1,14 153,48 -0,34 124,56 0,00 123,43 1,97I. Bumbu - bumbuan / Spices 146,39 -1,26 129,94 1,10 147,36 2,50 176,77 1,81 140,08 1,34J. Lemak dan minyak / Fats and oils 133,87 -0,90 133,63 -1,26 128,79 3,94 111,84 -0,07 103,16 0,00K. Bahan makanan lainnya / Other food items 115,40 0,64 112,79 -0,20 122,65 0,68 96,49 0,00 107,18 0,41
II. MAKANAN JADI, MINUMAN, ROKOK DAN TEMBAKAU 121,55 -0,45 127,54 0,39 131,72 -0,46 130,38 1,99 123,84 1,05
PREPARED FOOD, BEVERAGE, CIGARETTE AND TOBACCOA. Makanan jadi / Prepared food 122,85 0,00 122,18 0,32 135,99 0,00 128,32 3,49 122,39 2,20B. Minuman yang tidak beralkohol / Non-alcoholic beverages 130,83 -3,99 140,66 1,11 127,56 -3,41 136,33 -2,10 123,26 -2,52C. Tembakau dan minuman beralkohol / Tobacco products and alcoholic beverages 113,77 1,24 128,13 0,00 121,59 0,42 133,12 0,29 129,45 0,84
III. PERUMAHAN, AIR, LISTRIK, GAS DAN BAHAN BAKAR 118,31 -0,08 113,29 0,05 108,09 0,12 117,46 0,04 121,74 0,24
HOUSING, WATER, ELECTRICITY, GAS AND FUELA. Biaya tempat tinggal / Cost of housing 119,37 -0,14 120,97 0,18 114,46 0,11 107,86 0,08 123,04 0,38B. Bahan bakar, penerangan dan air / Fuel, electricity and water 118,81 0,03 104,71 0,00 96,21 0,00 135,74 0,01 124,61 0,00C. Perlengkapan rumahtangga / Household equipment 124,69 -0,12 104,84 -0,17 108,07 0,15 114,53 0,00 110,66 0,14D. Penyelenggaraan rumahtangga / Household operation 103,15 0,10 122,63 0,00 113,16 0,54 109,69 0,00 112,08 0,00
IV. SANDANG / CLOTHING 110,05 0,08 127,27 0,18 126,71 0,01 117,91 0,05 108,49 0,04A. Sandang laki-laki / Men's clothing 111,73 0,00 105,00 0,00 108,66 0,25 114,14 0,00 107,34 0,00B. Sandang wanita / Women's clothing 106,35 0,00 105,08 0,00 112,65 0,00 116,26 0,00 116,40 0,22C. Sandang anak-anak / Children's clothing 109,16 0,00 105,53 0,00 114,80 0,00 113,02 0,00 109,78 0,34D. Barang pribadi dan sandang lainnya / Personal effects 115,16 0,48 147,90 0,31 153,77 -0,10 123,13 0,14 97,40 -0,58
V. KESEHATAN / HEALTH 119,18 0,15 105,85 0,17 111,65 0,38 114,39 0,00 108,88 0,07A. Jasa kesehatan / Health services 116,37 0,00 104,13 0,00 103,10 0,00 107,09 0,00 101,29 0,07B. Obat-obatan / Medicines 134,34 0,10 104,13 1,00 107,33 0,00 116,10 0,00 112,23 0,11C. Jasa perawatan jasmani / Personal care services 136,45 1,38 99,97 0,00 121,79 0,00 182,73 0,00 118,14 0,00D. Perawatan jasmani dan kosmetika / Personal care and cosmetics 110,53 0,15 109,70 0,00 115,81 0,73 106,20 0,00 111,16 0,06
VI. PENDIDIKAN, REKREASI & OLAHRAGA / EDUCATION, RECREATION & SPORTS 108,59 -0,45 107,27 -0,01 106,20 0,17 115,92 0,00 152,18 0,01A. Pendidikan / Education 106,98 0,00 106,43 0,00 104,52 0,00 121,19 0,00 197,86 0,00B. Kursus-kursus/pelatihan / Course and training 105,06 0,00 184,52 0,00 98,05 1,57 123,70 0,00 108,02 0,00C. Perlengkapan/peralatan pendidikan / Educational equipment 115,16 0,00 110,45 0,83 101,88 0,00 115,06 0,00 104,66 0,00D. Rekreasi / Recreation 107,46 -1,58 103,46 -0,37 113,05 0,00 107,46 0,00 129,19 0,05E. Olahraga / Sports 111,19 0,00 101,24 0,00 117,10 7,56 105,91 0,00 111,26 0,00
VII. TRANSPOR, KOMUNIKASI DAN JASA KEUANGAN 122,19 3,33 99,45 0,16 99,75 0,03 105,59 0,37 100,70 0,03
TRANSPORTATION, COMMUNICATION AND FINANCIAL SERVICESA. Transpor / Transportation 129,61 5,25 103,81 0,20 101,92 0,01 110,89 0,01 104,56 0,04B. Komunikasi dan pengiriman / Communication and delivery services 101,28 0,00 84,98 0,00 92,99 0,00 85,14 0,00 90,36 0,00C. Sarana dan penunjang transpor / Transport equipment and support 133,73 0,00 104,14 0,16 104,06 0,37 121,64 4,56 111,52 0,00D. Jasa keuangan / Financial services 113,57 0,00 118,82 0,00 104,76 0,00 106,37 0,00 103,69 0,00
TABLE CONSUMER PRICE INDICES FOR EACH OF THE 66 CITIES AND THEIR CHANGES
APRIL / APRIL 2010 (2007 = 100)
Kelompok / Group
19
TABEL 1.4 INDEKS HARGA KONSUMEN DI 66 KOTA DAN PERUBAHANNYA
Singkawang Banjarmasin BalikpapanIndeks Perubahan Indeks Perubahan
SampitIndeks PerubahanIndeks Perubahan
Index Change (%)
PalangkarayaIndeks Perubahan
Index Change (%) Change (%)[95] [96] [97] [98]
Index Change (%)[101]
Index Change (%)[1] [92] [93] [94] [99] [100]
Index
https:
//www.b
ps.go.id

INDEKS HARGAPRICE INDICES
(Lanjutan / Continuation)
INDEKS UMUM / GENERAL INDEX 124,34 0,18 132,38 -2,08 118,62 -0,08 120,03 -0,13
I. BAHAN MAKANAN / FOODSTUFF 140,55 0,45 156,93 -6,54 136,73 -0,16 134,59 -0,80A. Padi-padian, umbi-umbian dan hasilnya / Cereals, roots, and their products 132,15 -0,39 133,94 1,06 141,09 -1,04 133,55 -3,72B. Daging dan hasil-hasilnya / Meat and its products 141,94 -1,57 154,76 -2,30 123,29 -0,06 134,96 0,22C. Ikan segar / Fresh fish 142,33 1,80 147,60 -27,07 122,46 0,43 134,86 -0,96D. Ikan diawetkan / Preserved fish 133,02 -4,06 163,03 -4,20 154,49 -0,62 127,48 -6,70E. Telur, susu dan hasil-hasilnya / Eggs, milk and their products 133,63 -0,04 117,32 -0,77 123,64 1,60 124,87 0,13F. Sayur-sayuran / Vegetables 167,77 1,55 272,38 -1,77 150,28 -3,99 127,12 -0,91G. Kacang - kacangan / Beans and nuts 203,64 0,07 191,63 0,30 127,94 -5,06 188,01 -0,44H. Buah - buahan / Fruits 136,95 1,74 162,66 2,57 143,01 -0,47 127,70 10,88I. Bumbu - bumbuan / Spices 133,75 1,18 166,03 -1,79 150,01 4,89 138,85 1,54J. Lemak dan minyak / Fats and oils 108,52 1,52 132,20 0,00 146,85 0,23 137,58 0,07K. Bahan makanan lainnya / Other food items 118,12 -2,87 109,15 0,00 114,35 0,00 107,00 -0,38
II. MAKANAN JADI, MINUMAN, ROKOK DAN TEMBAKAU 134,33 -0,26 138,91 0,12 117,68 -0,86 133,06 0,48
PREPARED FOOD, BEVERAGE, CIGARETTE AND TOBACCOA. Makanan jadi / Prepared food 140,54 -0,01 141,05 0,23 113,44 0,04 129,26 1,10B. Minuman yang tidak beralkohol / Non-alcoholic beverages 134,40 -1,37 149,15 0,00 139,54 -4,00 140,64 -1,02C. Tembakau dan minuman beralkohol / Tobacco products and alcoholic beverages 117,17 0,00 122,19 0,00 111,36 0,00 137,96 0,00
III. PERUMAHAN, AIR, LISTRIK, GAS DAN BAHAN BAKAR 125,04 0,33 125,07 0,13 115,22 0,11 116,22 -0,45
HOUSING, WATER, ELECTRICITY, GAS AND FUELA. Biaya tempat tinggal / Cost of housing 124,43 0,39 126,30 0,05 115,52 0,16 124,59 -0,76B. Bahan bakar, penerangan dan air / Fuel, electricity and water 128,72 0,12 120,87 0,02 113,21 0,04 101,53 0,00C. Perlengkapan rumahtangga / Household equipment 117,66 -0,10 127,90 0,16 128,40 0,02 108,69 -0,03D. Penyelenggaraan rumahtangga / Household operation 124,99 1,15 130,37 1,09 108,45 -0,05 113,00 0,04
IV. SANDANG / CLOTHING 127,40 0,01 122,50 -0,04 118,71 0,27 116,71 -0,03A. Sandang laki-laki / Men's clothing 118,25 0,03 111,80 0,00 119,35 0,16 105,49 0,00B. Sandang wanita / Women's clothing 122,29 -0,11 120,97 0,55 110,29 0,05 115,72 0,00C. Sandang anak-anak / Children's clothing 111,12 0,79 108,49 0,13 104,24 0,24 109,91 0,00D. Barang pribadi dan sandang lainnya / Personal effects 150,94 -0,31 168,19 -1,13 148,87 0,79 151,12 -0,11
V. KESEHATAN / HEALTH 122,66 0,26 121,67 0,78 121,96 -0,04 115,16 0,90A. Jasa kesehatan / Health services 118,32 0,00 119,46 2,29 119,34 0,00 111,93 0,00B. Obat-obatan / Medicines 127,88 0,17 120,29 0,86 105,95 0,00 118,69 4,39C. Jasa perawatan jasmani / Personal care services 129,65 0,00 109,34 0,00 178,74 0,00 116,33 0,00D. Perawatan jasmani dan kosmetika / Personal care and cosmetics 123,47 0,56 125,81 0,03 118,64 -0,08 115,45 0,04
VI. PENDIDIKAN, REKREASI & OLAHRAGA / EDUCATION, RECREATION & SPORTS 113,64 -0,01 105,58 -0,20 105,76 0,02 119,53 0,00A. Pendidikan / Education 122,97 0,00 101,33 0,00 100,00 0,00 129,29 0,00B. Kursus-kursus/pelatihan / Course and training 96,90 0,00 102,61 0,00 111,73 0,00 119,94 0,00C. Perlengkapan/peralatan pendidikan / Educational equipment 109,43 -0,16 103,55 1,59 113,02 0,00 105,59 0,00D. Rekreasi / Recreation 104,65 0,08 111,40 -1,07 109,64 0,05 109,15 0,00E. Olahraga / Sports 101,59 0,00 111,24 -0,63 120,23 0,00 104,90 0,00
VII. TRANSPOR, KOMUNIKASI DAN JASA KEUANGAN 100,24 0,08 105,24 0,02 102,64 0,49 99,97 0,14
TRANSPORTATION, COMMUNICATION AND FINANCIAL SERVICESA. Transpor / Transportation 105,50 0,14 107,14 0,07 111,22 0,67 104,59 0,21B. Komunikasi dan pengiriman / Communication and delivery services 82,64 0,00 99,26 -0,13 83,74 0,00 80,91 0,00C. Sarana dan penunjang transpor / Transport equipment and support 117,46 0,00 123,56 0,32 106,05 0,60 114,76 0,00D. Jasa keuangan / Financial services 105,49 0,00 103,29 0,00 107,49 0,00 112,39 0,00
[109][1] [102] [103] [104] [105] [106] [107] [108]Index Change (%)
PerubahanIndex Change (%)Indeks Perubahan
PaluIndeksIndeks Perubahan Indeks Perubahan
Manado
20
TABEL 1.4 INDEKS HARGA KONSUMEN DI 66 KOTA DAN PERUBAHANNYA
TABLE CONSUMER PRICE INDICES FOR EACH OF THE 66 CITIES AND THEIR CHANGES
APRIL / APRIL 2010 (2007 = 100)
Kelompok / GroupSamarinda Tarakan
Index Change (%) Index Change (%)
https:
//www.b
ps.go.id

INDEKS HARGAPRICE INDICES
(Lanjutan / Continuation)
INDEKS UMUM / GENERAL INDEX 130,85 -0,32 118,01 -0,49 120,76 -0,80 127,50 -0,44
I. BAHAN MAKANAN / FOODSTUFF 141,08 -1,00 128,63 -1,70 125,21 -3,18 135,09 -2,02A. Padi-padian, umbi-umbian dan hasilnya / Cereals, roots, and their products 145,44 -0,02 127,48 0,01 111,75 -3,44 133,11 -3,59B. Daging dan hasil-hasilnya / Meat and its products 138,48 4,57 138,03 -3,51 130,73 -1,77 138,15 -1,03C. Ikan segar / Fresh fish 132,38 -5,71 119,99 -2,80 130,71 -2,35 134,78 -0,69D. Ikan diawetkan / Preserved fish 167,94 0,11 137,81 -3,37 118,67 -4,87 109,26 -0,06E. Telur, susu dan hasil-hasilnya / Eggs, milk and their products 130,41 1,06 120,06 -1,68 134,91 -2,13 117,68 0,16F. Sayur-sayuran / Vegetables 135,82 2,37 123,86 -3,83 119,87 -5,43 186,61 -6,53G. Kacang - kacangan / Beans and nuts 164,30 0,58 197,36 -0,76 129,33 0,00 108,15 -0,26H. Buah - buahan / Fruits 123,78 -2,53 148,84 -0,56 179,19 -12,28 125,89 -0,25I. Bumbu - bumbuan / Spices 129,03 2,85 132,30 -1,18 122,56 -0,15 152,23 0,91J. Lemak dan minyak / Fats and oils 187,46 -0,79 122,65 -1,01 113,53 -0,49 95,29 0,09K. Bahan makanan lainnya / Other food items 139,69 0,00 115,46 -0,06 122,89 0,00 109,87 -1,06
II. MAKANAN JADI, MINUMAN, ROKOK DAN TEMBAKAU 144,61 0,41 124,20 -0,52 129,91 -0,06 145,47 0,36
PREPARED FOOD, BEVERAGE, CIGARETTE AND TOBACCOA. Makanan jadi / Prepared food 151,17 0,00 126,06 0,09 138,27 0,00 164,42 0,41B. Minuman yang tidak beralkohol / Non-alcoholic beverages 145,44 0,45 118,28 -3,61 117,96 -0,41 122,91 -1,33C. Tembakau dan minuman beralkohol / Tobacco products and alcoholic beverages 133,32 1,16 123,30 0,00 115,71 0,00 122,27 1,45
III. PERUMAHAN, AIR, LISTRIK, GAS DAN BAHAN BAKAR 129,59 -0,25 116,75 0,23 117,45 0,07 130,66 0,16
HOUSING, WATER, ELECTRICITY, GAS AND FUELA. Biaya tempat tinggal / Cost of housing 126,59 0,00 118,46 0,27 126,84 0,05 133,68 0,25B. Bahan bakar, penerangan dan air / Fuel, electricity and water 135,58 -1,45 115,29 0,00 98,84 0,00 136,07 0,00C. Perlengkapan rumahtangga / Household equipment 128,54 0,97 111,17 0,07 120,13 0,02 118,52 0,25D. Penyelenggaraan rumahtangga / Household operation 127,95 0,00 117,50 0,70 122,86 0,48 113,73 0,03
IV. SANDANG / CLOTHING 156,84 -0,18 122,79 -0,43 134,28 0,40 125,17 -0,02A. Sandang laki-laki / Men's clothing 122,26 -1,07 116,63 0,03 129,51 0,00 114,77 0,10B. Sandang wanita / Women's clothing 121,16 -0,40 111,30 0,00 122,04 -0,02 118,64 0,11C. Sandang anak-anak / Children's clothing 124,74 0,23 115,27 0,39 141,77 0,62 127,15 -0,03D. Barang pribadi dan sandang lainnya / Personal effects 239,04 0,18 148,42 -1,60 149,67 1,08 144,72 -0,26
V. KESEHATAN / HEALTH 129,53 -0,43 116,06 0,09 117,66 0,02 120,64 0,13A. Jasa kesehatan / Health services 125,51 0,00 123,82 0,00 119,82 0,00 128,20 0,00B. Obat-obatan / Medicines 130,22 -0,33 109,66 0,00 105,77 0,00 104,87 0,00C. Jasa perawatan jasmani / Personal care services 134,76 0,00 131,83 0,45 168,72 0,29 124,31 0,00D. Perawatan jasmani dan kosmetika / Personal care and cosmetics 130,15 -0,72 111,52 0,08 117,25 0,00 121,73 0,30
VI. PENDIDIKAN, REKREASI & OLAHRAGA / EDUCATION, RECREATION & SPORTS 111,73 0,04 115,61 0,02 115,62 0,10 112,67 0,01A. Pendidikan / Education 110,10 0,00 130,54 0,00 118,87 0,00 119,60 0,00B. Kursus-kursus/pelatihan / Course and training 101,35 0,00 103,97 0,00 122,50 3,37 108,28 0,00C. Perlengkapan/peralatan pendidikan / Educational equipment 110,72 0,00 103,85 0,07 115,96 0,00 105,56 -0,04D. Rekreasi / Recreation 116,25 0,12 103,04 0,00 111,28 -0,04 111,09 0,11E. Olahraga / Sports 101,21 0,00 104,27 0,00 111,30 0,00 111,43 0,00
VII. TRANSPOR, KOMUNIKASI DAN JASA KEUANGAN 103,97 -0,17 102,45 0,01 106,23 -0,10 107,57 -0,02
TRANSPORTATION, COMMUNICATION AND FINANCIAL SERVICESA. Transpor / Transportation 109,57 0,00 106,92 0,01 111,90 0,05 113,82 0,00B. Komunikasi dan pengiriman / Communication and delivery services 79,61 -0,99 85,02 0,00 85,42 -0,74 88,52 -0,10C. Sarana dan penunjang transpor / Transport equipment and support 128,20 0,00 115,27 0,00 122,33 0,00 104,58 0,11D. Jasa keuangan / Financial services 114,99 0,00 106,04 0,00 106,46 0,00 108,98 0,00
[117]Change (%)
[115][113] [114] [116]Index Change (%) Index
[1] [110] [111] [112]Index Change (%) Index
21
PalopoIndeks PerubahanPerubahan Indeks Perubahan Indeks Indeks Perubahan
Watampone Parepare
TABEL 1.4 INDEKS HARGA KONSUMEN DI 66 KOTA DAN PERUBAHANNYA
TABLE CONSUMER PRICE INDICES FOR EACH OF THE 66 CITIES AND THEIR CHANGES
APRIL / APRIL 2010 (2007 = 100)
Kelompok / GroupMakassar
Change (%)
https:
//www.b
ps.go.id

INDEKS HARGAPRICE INDICES
(Lanjutan / Continuation)
INDEKS UMUM / GENERAL INDEX 122,98 0,31 119,15 -0,87 120,99 -1,14 120,60 -0,51
I. BAHAN MAKANAN / FOODSTUFF 141,64 0,34 131,00 -2,62 133,19 -3,92 139,25 0,22A. Padi-padian, umbi-umbian dan hasilnya / Cereals, roots, and their products 141,25 -4,71 117,77 -3,59 133,61 -5,43 128,35 0,45B. Daging dan hasil-hasilnya / Meat and its products 147,02 0,65 113,39 -0,20 124,05 -1,92 126,46 0,05C. Ikan segar / Fresh fish 149,32 1,68 160,93 -2,06 116,20 -7,73 170,67 -2,54D. Ikan diawetkan / Preserved fish 119,80 2,59 116,75 -4,65 160,76 0,78 200,44 -1,40E. Telur, susu dan hasil-hasilnya / Eggs, milk and their products 120,19 -0,73 118,31 -0,27 110,63 -1,98 118,29 0,41F. Sayur-sayuran / Vegetables 143,29 8,48 105,32 -3,68 197,45 1,42 134,88 3,59G. Kacang - kacangan / Beans and nuts 142,04 -6,63 165,85 -0,56 148,87 -1,61 151,54 1,38H. Buah - buahan / Fruits 192,11 2,88 214,66 -12,65 139,22 -1,27 102,54 0,89I. Bumbu - bumbuan / Spices 137,54 5,61 116,34 4,87 153,02 -0,31 142,92 4,06J. Lemak dan minyak / Fats and oils 103,47 0,01 104,29 -3,52 129,23 -5,01 118,91 -0,19K. Bahan makanan lainnya / Other food items 114,46 1,61 104,52 0,00 108,74 0,74 110,24 0,00
II. MAKANAN JADI, MINUMAN, ROKOK DAN TEMBAKAU 135,72 -0,24 126,70 -0,32 138,91 -0,47 120,01 0,17
PREPARED FOOD, BEVERAGE, CIGARETTE AND TOBACCOA. Makanan jadi / Prepared food 141,58 0,22 106,43 0,01 146,04 0,00 116,87 0,00B. Minuman yang tidak beralkohol / Non-alcoholic beverages 133,98 -3,54 120,73 -1,76 121,42 -3,73 134,45 0,84C. Tembakau dan minuman beralkohol / Tobacco products and alcoholic beverages 123,25 0,97 156,55 0,00 136,75 0,53 117,14 0,00
III. PERUMAHAN, AIR, LISTRIK, GAS DAN BAHAN BAKAR 126,73 -0,18 118,47 0,07 114,25 -0,10 114,71 0,08
HOUSING, WATER, ELECTRICITY, GAS AND FUELA. Biaya tempat tinggal / Cost of housing 139,99 -0,41 127,80 0,24 116,62 -0,03 118,26 0,05B. Bahan bakar, penerangan dan air / Fuel, electricity and water 110,97 0,08 108,53 0,00 98,74 -0,28 107,10 -0,01C. Perlengkapan rumahtangga / Household equipment 119,18 0,03 104,26 0,00 129,67 0,04 112,31 0,36D. Penyelenggaraan rumahtangga / Household operation 125,49 -0,10 105,96 -0,62 109,14 -0,58 115,97 -0,05
IV. SANDANG / CLOTHING 118,53 0,36 107,03 0,01 122,54 0,18 106,22 0,02A. Sandang laki-laki / Men's clothing 102,56 -0,25 100,14 0,00 119,92 0,15 102,89 0,00B. Sandang wanita / Women's clothing 103,04 0,00 100,98 0,00 127,72 0,31 103,71 0,00C. Sandang anak-anak / Children's clothing 104,51 0,00 104,36 0,00 102,91 0,00 103,29 0,00D. Barang pribadi dan sandang lainnya / Personal effects 150,25 1,00 140,03 0,02 134,36 0,16 116,14 0,07
V. KESEHATAN / HEALTH 121,57 0,09 115,77 -0,04 111,82 -0,19 104,36 0,15A. Jasa kesehatan / Health services 102,07 0,67 134,09 0,00 100,00 0,00 106,86 0,00B. Obat-obatan / Medicines 137,40 0,56 120,58 0,05 121,62 -0,05 103,23 0,00C. Jasa perawatan jasmani / Personal care services 133,72 0,00 120,30 0,00 115,51 0,00 103,05 1,08D. Perawatan jasmani dan kosmetika / Personal care and cosmetics 120,55 -0,39 107,58 -0,12 111,88 -0,33 104,25 0,00
VI. PENDIDIKAN, REKREASI & OLAHRAGA / EDUCATION, RECREATION & SPORTS 108,45 0,32 109,07 -0,06 104,60 0,04 108,56 -0,01A. Pendidikan / Education 116,41 0,00 113,86 0,00 100,90 0,00 122,18 0,00B. Kursus-kursus/pelatihan / Course and training 124,75 0,00 147,68 0,00 102,69 0,00 98,07 0,00C. Perlengkapan/peralatan pendidikan / Educational equipment 100,76 0,98 103,47 -0,43 109,24 0,23 102,98 0,00D. Rekreasi / Recreation 104,88 0,29 103,21 0,00 105,42 0,00 96,59 -0,04E. Olahraga / Sports 98,15 0,00 99,54 0,00 109,80 -0,17 112,69 0,00
VII. TRANSPOR, KOMUNIKASI DAN JASA KEUANGAN 102,65 1,20 101,26 0,00 106,30 0,01 122,88 -2,82
TRANSPORTATION, COMMUNICATION AND FINANCIAL SERVICESA. Transpor / Transportation 109,85 2,02 107,73 0,00 109,30 0,00 138,93 -3,71B. Komunikasi dan pengiriman / Communication and delivery services 78,81 -1,25 83,70 0,00 97,20 0,00 88,56 0,00C. Sarana dan penunjang transpor / Transport equipment and support 120,25 0,00 100,80 0,00 109,10 0,17 104,20 0,00D. Jasa keuangan / Financial services 108,11 0,00 103,09 0,00 102,07 0,00 112,86 0,00
[125][1] [118] [119] [120] [121]
PerubahanIndeks Perubahan
[122] [123] [124]Index Change (%)Index Change (%)
Ambon
TABLE CONSUMER PRICE INDICES FOR EACH OF THE 66 CITIES AND THEIR CHANGES
APRIL / APRIL 2010 (2007 = 100)
Kelompok / GroupKendari Gorontalo
IndexIndeks Perubahan
Change (%) Change (%)IndexIndeks
22
TABEL 1.4 INDEKS HARGA KONSUMEN DI 66 KOTA DAN PERUBAHANNYA
PerubahanIndeksMamuju
https:
//www.b
ps.go.id

INDEKS HARGAPRICE INDICES
(Lanjutan / Continuation)
INDEKS UMUM / GENERAL INDEX 121,07 -1,19 134,03 2,04 136,99 0,99 118,46 -0,51
I. BAHAN MAKANAN / FOODSTUFF 139,43 -3,46 146,48 7,37 157,17 1,97 127,12 -3,09A. Padi-padian, umbi-umbian dan hasilnya / Cereals, roots, and their products 123,07 1,37 119,11 2,07 116,73 3,89 106,09 -0,09B. Daging dan hasil-hasilnya / Meat and its products 137,52 -0,27 157,41 1,17 105,45 -2,33 143,79 1,14C. Ikan segar / Fresh fish 153,00 -9,92 157,61 28,98 154,48 -0,64 107,30 -17,32D. Ikan diawetkan / Preserved fish 131,13 -8,47 132,04 6,44 179,78 -6,60 128,92 -12,00E. Telur, susu dan hasil-hasilnya / Eggs, milk and their products 121,66 -0,44 175,44 2,57 147,99 4,23 121,65 2,88F. Sayur-sayuran / Vegetables 170,45 -2,21 150,38 0,74 198,04 4,17 176,97 -2,20G. Kacang - kacangan / Beans and nuts 155,04 0,06 125,03 0,89 235,60 -0,76 169,30 -0,09H. Buah - buahan / Fruits 146,07 -0,81 137,20 3,10 209,60 -2,62 121,57 -0,61I. Bumbu - bumbuan / Spices 126,87 0,19 190,66 4,35 226,73 4,36 137,23 14,94J. Lemak dan minyak / Fats and oils 130,99 -0,02 129,28 -3,30 136,57 1,24 137,74 -0,20K. Bahan makanan lainnya / Other food items 109,09 -0,13 158,44 4,88 127,54 2,50 139,02 0,53
II. MAKANAN JADI, MINUMAN, ROKOK DAN TEMBAKAU 121,61 0,26 143,70 0,20 165,07 0,65 133,93 1,55
PREPARED FOOD, BEVERAGE, CIGARETTE AND TOBACCOA. Makanan jadi / Prepared food 121,79 -0,01 156,99 0,18 181,62 1,63 143,98 2,08B. Minuman yang tidak beralkohol / Non-alcoholic beverages 130,62 0,97 143,39 0,20 148,14 -0,55 128,27 0,94C. Tembakau dan minuman beralkohol / Tobacco products and alcoholic beverages 117,07 0,28 123,32 0,25 157,47 0,11 115,57 0,64
III. PERUMAHAN, AIR, LISTRIK, GAS DAN BAHAN BAKAR 121,23 -0,65 139,72 0,01 123,76 0,11 110,39 0,02
HOUSING, WATER, ELECTRICITY, GAS AND FUELA. Biaya tempat tinggal / Cost of housing 123,84 -1,12 155,54 0,08 126,65 0,02 115,03 0,02B. Bahan bakar, penerangan dan air / Fuel, electricity and water 117,23 0,00 107,53 -0,32 118,74 0,74 102,24 0,02C. Perlengkapan rumahtangga / Household equipment 115,75 0,97 117,52 0,03 109,75 0,27 98,27 0,56D. Penyelenggaraan rumahtangga / Household operation 114,54 0,09 117,97 0,14 127,82 -1,06 107,94 -0,42
IV. SANDANG / CLOTHING 112,18 -0,13 121,96 -0,13 112,34 0,19 114,65 0,33A. Sandang laki-laki / Men's clothing 108,66 0,00 119,88 -0,31 104,22 -0,02 105,93 0,43B. Sandang wanita / Women's clothing 107,21 0,00 117,29 0,21 111,23 0,00 108,17 -0,04C. Sandang anak-anak / Children's clothing 111,23 0,00 113,39 -0,38 100,87 0,00 102,35 0,00D. Barang pribadi dan sandang lainnya / Personal effects 127,59 -0,63 140,99 0,05 157,25 1,07 152,83 0,86
V. KESEHATAN / HEALTH 107,17 -0,06 130,26 0,03 124,73 0,74 112,35 0,14A. Jasa kesehatan / Health services 105,37 0,00 141,33 0,00 104,89 0,38 115,89 0,38B. Obat-obatan / Medicines 104,34 0,18 133,18 0,00 124,18 1,54 104,41 0,38C. Jasa perawatan jasmani / Personal care services 99,06 0,00 162,90 0,00 121,83 0,99 123,67 0,15D. Perawatan jasmani dan kosmetika / Personal care and cosmetics 111,90 -0,24 115,43 0,10 135,75 0,52 113,54 -0,14
VI. PENDIDIKAN, REKREASI & OLAHRAGA / EDUCATION, RECREATION & SPORTS 124,58 0,00 118,19 0,00 110,67 0,02 108,05 0,15A. Pendidikan / Education 143,56 0,00 130,37 0,00 109,86 0,00 109,11 0,00B. Kursus-kursus/pelatihan / Course and training 107,00 0,00 115,44 0,00 127,41 0,00 104,59 0,00C. Perlengkapan/peralatan pendidikan / Educational equipment 107,27 0,00 107,68 0,00 115,69 0,14 104,45 0,97D. Rekreasi / Recreation 108,83 0,00 105,33 0,00 108,00 0,00 108,14 0,00E. Olahraga / Sports 91,91 0,00 116,55 0,00 119,53 -0,01 111,32 0,00
VII. TRANSPOR, KOMUNIKASI DAN JASA KEUANGAN 100,69 -0,31 112,09 -0,80 106,92 0,48 113,17 0,45
TRANSPORTATION, COMMUNICATION AND FINANCIAL SERVICESA. Transpor / Transportation 105,78 -0,45 116,29 -1,06 108,97 0,00 128,85 0,59B. Komunikasi dan pengiriman / Communication and delivery services 88,03 0,00 90,68 0,00 97,33 0,00 73,11 0,00C. Sarana dan penunjang transpor / Transport equipment and support 115,35 0,00 160,86 -0,35 133,84 10,64 111,62 0,00D. Jasa keuangan / Financial services 105,51 0,00 118,86 0,00 105,57 0,00 108,03 0,00
[129] [130]Index Index Change (%)
[1] [126] [127] [128] [133][132][131]Change (%)
JayapuraIndeks Perubahan Indeks PerubahanKelompok / Group
Ternate Manokwari Sorong
Index Change (%) Index Change (%)Perubahan Indeks
23
APRIL / APRIL 2010 (2007 = 100)
Indeks
TABEL 1.4 INDEKS HARGA KONSUMEN DI 66 KOTA DAN PERUBAHANNYA
TABLE CONSUMER PRICE INDICES FOR EACH OF THE 66 CITIES AND THEIR CHANGES
Perubahan
https:
//www.b
ps.go.id

INDEKS HARGAPRICE INDICES
TABEL 1.5 RATA-RATA HARGA PRODUSEN GABAH MENURUT KUALITAS DAN OBSERVASI
TABLE TRANSAKSI TINGKAT PENGGILINGAN DI INDONESIA
AVERAGE PRODUCER PRICE OF PADDY BY QUALITY AND NUMBER OF TRANSACTION AT HULLER LEVEL IN INDONESIA
2008 r) April 2 572,95 2 204,88 1 980,20 1 430,00 3 800,00 2 408 719 440
Mei 2 744,54 2 480,52 2 240,90 1 800,00 3 950,00 1 172 246 117
Juni 2 851,00 2 610,37 2 400,87 1 940,00 3 950,00 1 034 68 103
Juli 2 931,76 2 569,46 2 372,93 2 000,00 3 800,00 1 425 43 1 207
Agustus 2 880,82 2 567,38 2 385,21 2 000,00 3 384,61 1 615 101 180
September 2 887,89 2 623,15 2 426,19 1 360,00 3 695,00 1 139 34 117
Oktober 2 952,07 2 644,77 2 366,44 2 000,00 3 433,33 1 073 23 94
November 2 954,23 2 637,64 2 347,47 2 000,00 3 450,00 1 203 78 153
Desember 3 024,19 2 706,32 2 331,53 2 000,00 4 500,00 991 31 104
2009 Januari 3 023,57 2 801,47 2 311,26 1 875,00 3 590,00 549 87 77
Februari 3 219,09 2 839,18 2 290,11 1 850,00 3 860,00 864 70 202
Maret 3 180,44 2 597,68 2 305,55 1 800,00 3 777,80 1 593 350 498
April 2 694,60 2 662,39 2 363,19 1 800,00 3 590,00 1 404 225 253
Mei 3 139,06 2 732,34 2 400,87 1 950,00 3 650,00 791 44 148
Juni 3 016,46 2 738,30 2 291,60 1 925,00 3 650,00 984 92 194
Juli 3 039,16 2 699,57 2 428,65 2 000,00 3 900,00 978 130 187
Agustus 3 021,82 2 711,18 2 454,56 2 050,00 3 800,00 777 51 116
September 3 041,64 2 793,62 2 550,83 1 950,00 3 500,00 791 39 145
Oktober 3 221,40 2 838,41 2 626,43 2 200,00 4 900,00 942 18 133
November 3 086,00 2 861,98 2 594,55 2 100,00 3 433,00 848 17 76
Desember 3 123,60 2 926,32 2 670,20 2 200,00 3 690,00 709 26 75
2010 Januari 3 532,17 3 210,46 2 814,31 2 300,00 4 200,00 676 23 122
Februari 3 776,78 3 235,96 2 756,03 2 350,00 4 700,00 686 11 149
Maret 3 419,94 2 922,26 2 556,77 2 050,00 4 550,00 1 091 167 325
April 3 355,85 2 866,98 2 463,20 2 050,00 5 300,00 886 151 237
Catatan : 1) HPP = Harga Pembelian Pemerintah Tingkat Penggilingan Note : 1) Guideline Purchasing Price
Kelompok Kualitas HPP 22 April 2008 HPP 1 Januari 2009 HPP 1 Januari 2010
GKG = Gabah Kering Giling 2.800 3.000 3.300
GKP = Gabah Kering Panen 2.240 2.440 2.685
Ciherang (Kualitas Rendah) Ciredek dan Cisokan (GKP)
Ciherang & IR-64 (kualitas rendah) Siam Unus (GKP)
Ciherang (Kualitas rendah) Cibogo (GKP)
Ciherang (Kualitas Rendah) IR-42 (GKG)
IR-64 (Kualitas rendah) Ciherang (GKG)
Ciherang & IR-64 (Kualitas rendah) Anak Daro (GKP)
Ciherang (GKP) Cisokan (GKP)
Ciherang & Midun (Kualitas Rendah) Ciherang (GKG)
[8] [10]
Ciherang (GKP)
Ciherang (kualitas rendah) Siam Unus (GKP)
[11][9]
Kualitas rendah
Tahun dan bulan
GKG GKP
Average producer price of paddy by quality
Kualitas rendah
Lowest quality (Rp/Kg) Lowest qualityUnder HPP1)TotalVariety (Rp/Kg) Variety
24
Year and month
Rata-rata harga gabah menurut kualitas (Rp/Kg)
Jumlah transaksi
Total of transaction
Di bawahJumlah
[1] [2] [4][3]
Harga / Price Harga / Price VarietasVarietas
Harga terendah Harga tertinggi
Highest PriceLowest Price
[5] [6] [7]
Siam U (GKP)
IR-64 C (kualitas rendah) Lokal (GKP)
IR-64 (GKP) Dara Putih & Ciherang (GKP)
IR-64 (kualitas rendah)
Siam Unus (GKP)
Bondowoso (GKP) Ciherang (GKP)
Ciherang (GKP) IR-64 & Ciherang (GKP & GKG)
Rojolele (Kualitas Rendah) Siam Unus (GKP)
Ciherang (Kualitas Rendah) Ciherang (GKP)
Ciherang (GKP) Siam Unus (GKP)
Ciherang (Kualitas Rendah) Ciherang (GKP)
Ciherang & IR-64 (GKP) IR-42 (GKG)
Ciherang (Kualitas Rendah) IR-42 (GKP)
Ciherang (Kualitas Rendah) Siam Unus (GKP)
Ciherang (Kualitas Rendah) IR-42 (GKP)
Ciherang (Kualitas Rendah) Siam Unus (GKP)
Cigeulis (GKP) Cisokan (GKG)
https:
//www.b
ps.go.id

INDEKS HARGAPRICE INDICES
TABEL 1.6TABLE
2008 April 16 658,34 2 611,37 37 639,93 8 876,50 8 135,67 1 918,60 178 959,07 42 203,30Mei 1)
28 986,32 26 999,18 38 127,38 8 866,46 8 145,46 1 894,21 179 616,20 41 769,43Juni 2)
34 907,68 30 820,84 47 198,00 42 861,00 14 572,00 13 233,00 237 978,00 216 108,00
Juli 35 225,34 30 583,45 47 399,96 42 476,89 14 606,09 13 089,06 239 558,44 214 677,33
Agustus 35 348,00 30 520,00 47 575,58 42 417,60 14 806,35 13 201,09 240 025,89 214 003,11
September 35 455,19 30 358,20 48 305,00 42 653,00 14 818,00 13 084,00 241 190,00 212 971,00
Oktober 35 544,00 30 259,00 52 440,00 46 097,00 15 519,00 13 642,00 260 059,00 228 603,00
November 35 704,00 30 404,00 53 362,00 46 850,00 15 615,00 13 710,00 261 788,00 229 840,00
Desember 35 842,00 30 393,00 53 527,00 47 011,00 15 615,00 13 714,00 261 788,00 229 921,00
2009 Januari 36 190,00 30 551,00 53 667,00 47 167,00 15 749,00 13 841,00 263 042,00 231 185,00
Februari 36 392,00 30 438,00 53 934,00 47 303,00 15 795,00 13 853,00 264 603,00 232 067,00
Maret 36 526,00 30 449,00 54 878,00 48 025,00 15 802,00 13 829,00 266 263,00 233 013,00
April 36 632,00 30 633,00 55 025,00 48 301,00 15 819,00 13 886,00 267 953,00 235 211,00
Mei 36 742,00 30 718,00 55 059,00 48 310,00 15 829,00 13 889,00 268 488,00 235 578,00
Juni 36 827,00 30 680,00 55 090,00 48 282,00 15 916,00 13 949,00 268 524,00 235 341,00
Juli 36 908,00 30 747,00 55 258,00 48 214,00 15 927,00 13 897,00 269 724,00 235 341,00
Agustus 37 002,00 30 521,00 55 424,00 48 090,00 16 009,00 13 890,00 270 575,00 234 772,00
September 37 065,00 30 292,00 55 736,00 47 859,00 16 044,00 13 777,00 270 823,00 232 546,00
Oktober 37 105,00 30 115,00 56 049,00 48 036,00 16 083,00 13 784,00 271 465,00 232 658,00
November 37 230,00 30 301,00 56 111,00 48 102,00 16 085,00 13 789,00 271 902,00 233 092,00
Desember 37 305,00 30 233,00 56 406,00 48 198,00 16 085,00 13 745,00 272 181,00 232 574,00
2010 Januari 37 426,00 29 997,00 56 570,00 47 936,00 16 109,00 13 650,00 273 620,00 231 862,00
Februari 37 637,00 29 987,00 56 864,00 48 043,00 16 300,00 13 771,00 275 028,00 232 366,00
Maret 37 721,00 30 093,00 56 998,00 48 226,00 16 411,00 13 885,00 275 396,00 233 011,00
April 37 844,00 30 138,00 57 217,00 48 338,00 16 430,00 13 880,00 275 566,00 232 801,00
Catatan : 1) Sebelum Mei 2008 Upah Buruh Tani menggunakan tahun dasar 1996=100 Notes : 1) Before May 2008, wages of farmwoker using 1996 as a base year (1996=100)
2) Sebelum Juni 2008 Upah Buruh Non Pertanian menggunakan tahun dasar 1996=100 2) Before June 2008, wages of non agricultural labour using 1996 as a base year (1996=100)
UPAH NOMINAL DAN RIIL BURUH TANI, KONSTRUKSI, POTONG RAMBUT WANITA DAN PEMBANTU RUMAH TANGGA DI INDONESIA (RUPIAH)
REAL AND NOMINAL WAGE FOR FARMWORKER, CONSTRUCTION WORKER,
Tahun dan bulan (Harian / Daily ) (Harian / Daily )
25
Buruh tani / Farmworker Buruh konstruksi / Contraction worker Potong rambut wanita / Women's haircut Pembantu rumah tangga / Household servant
(2007=100)
[5] [6] [7]
Year and month Nominal / Nominal Riil / Real
[1] [2] [3] [4] [8]
(Bulanan / Monthly )(Per kepala / Per head )
Nominal / Nominal Riil / Real
[9]
WOMEN'S HAIRCUT AND HOUSEHOLD SERVANT IN INDONESIA (RUPIAHS)
Nominal / Nominal Riil / Real Nominal / Nominal Riil / Real
https:
//www.b
ps.go.id
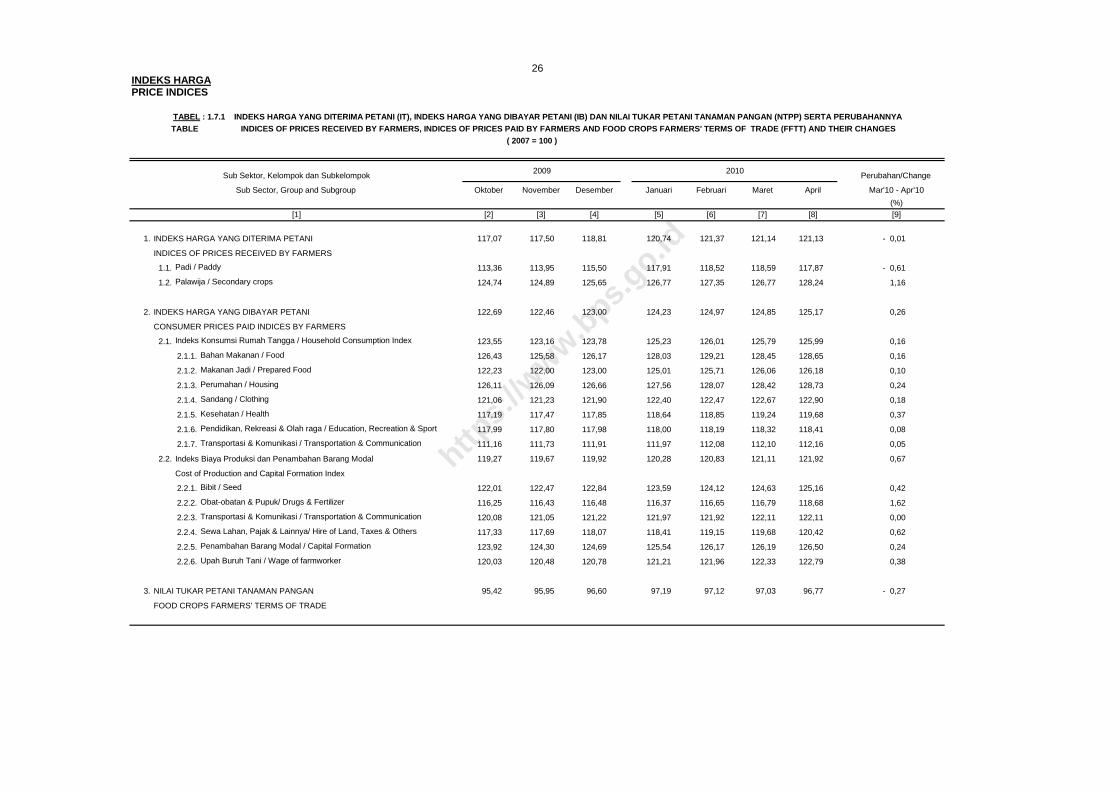
INDEKS HARGAPRICE INDICES
1. INDEKS HARGA YANG DITERIMA PETANI 117,07 117,50 118,81 120,74 121,37 121,14 121,13 - 0,01
INDICES OF PRICES RECEIVED BY FARMERS
1.1. Padi / Paddy 113,36 113,95 115,50 117,91 118,52 118,59 117,87 - 0,61
1.2. Palawija / Secondary crops 124,74 124,89 125,65 126,77 127,35 126,77 128,24 1,16
2. INDEKS HARGA YANG DIBAYAR PETANI 122,69 122,46 123,00 124,23 124,97 124,85 125,17 0,26
CONSUMER PRICES PAID INDICES BY FARMERS
2.1. Indeks Konsumsi Rumah Tangga / Household Consumption Index 123,55 123,16 123,78 125,23 126,01 125,79 125,99 0,16
2.1.1. Bahan Makanan / Food 126,43 125,58 126,17 128,03 129,21 128,45 128,65 0,16
2.1.2. Makanan Jadi / Prepared Food 122,23 122,00 123,00 125,01 125,71 126,06 126,18 0,10
2.1.3. Perumahan / Housing 126,11 126,09 126,66 127,56 128,07 128,42 128,73 0,24
2.1.4. Sandang / Clothing 121,06 121,23 121,90 122,40 122,47 122,67 122,90 0,18
2.1.5. Kesehatan / Health 117,19 117,47 117,85 118,64 118,85 119,24 119,68 0,37
2.1.6. Pendidikan, Rekreasi & Olah raga / Education, Recreation & Sport 117,99 117,80 117,98 118,00 118,19 118,32 118,41 0,08
2.1.7. Transportasi & Komunikasi / Transportation & Communication 111,16 111,73 111,91 111,97 112,08 112,10 112,16 0,05
2.2. Indeks Biaya Produksi dan Penambahan Barang Modal 119,27 119,67 119,92 120,28 120,83 121,11 121,92 0,67
Cost of Production and Capital Formation Index
2.2.1. Bibit / Seed 122,01 122,47 122,84 123,59 124,12 124,63 125,16 0,42
2.2.2. Obat-obatan & Pupuk/ Drugs & Fertilizer 116,25 116,43 116,48 116,37 116,65 116,79 118,68 1,62
2.2.3. Transportasi & Komunikasi / Transportation & Communication 120,08 121,05 121,22 121,97 121,92 122,11 122,11 0,00
2.2.4. Sewa Lahan, Pajak & Lainnya/ Hire of Land, Taxes & Others 117,33 117,69 118,07 118,41 119,15 119,68 120,42 0,62
2.2.5. Penambahan Barang Modal / Capital Formation 123,92 124,30 124,69 125,54 126,17 126,19 126,50 0,24
2.2.6. Upah Buruh Tani / Wage of farmworker 120,03 120,48 120,78 121,21 121,96 122,33 122,79 0,38
3. NILAI TUKAR PETANI TANAMAN PANGAN 95,42 95,95 96,60 97,19 97,12 97,03 96,77 - 0,27
FOOD CROPS FARMERS' TERMS OF TRADE
Januari
[5]
Februari
[6]
26
TABEL : 1.7.1 INDEKS HARGA YANG DITERIMA PETANI (IT), INDEKS HARGA YANG DIBAYAR PETANI (IB) DAN NILAI TUKAR PETANI TANAMAN PANGAN (NTPP) SERTA PERUBAHANNYA TABLE INDICES OF PRICES REC EIVED BY FARMERS, INDICES OF PRICES PAID BY FARMERS AND FOOD CROPS FARMERS' TERMS OF TRADE (FFTT) AND THEIR CHANGES
( 2007 = 100 )
Perubahan/Change
Mar'10 - Apr'10
(%)
Oktober November
Sub Sektor, Kelompok dan Subkelompok
Sub Sector, Group and Subgroup
2009
[1] [9]
Desember
[2] [4][3]
2010
April
[8]
Maret
[7]
https:
//www.b
ps.go.id

INDEKS HARGAPRICE INDICES
1. INDEKS HARGA YANG DITERIMA PETANI 129,53 129,35 128,72 129,65 130,34 130,79 131,97 0,90
INDICES OF PRICES RECEIVED BY FARMERS
1.1. Sayur-sayuran / Vegetables 128,86 130,04 128,70 130,08 131,68 131,52 132,75 0,94
1.2. Buah-buahan / Fruits 130,14 129,38 129,24 129,79 129,96 130,80 131,89 0,83
2. INDEKS HARGA YANG DIBAYAR PETANI 122,03 121,76 122,22 123,42 124,15 124,03 124,33 0,25
CONSUMER PRICES PAID INDICES BY FARMERS
2.1. Indeks Konsumsi Rumah Tangga / Household Consumption Index 123,09 122,68 123,21 124,58 125,37 125,16 125,37 0,17
2.1.1. Bahan Makanan / Food 126,04 125,18 125,63 127,36 128,54 127,81 128,02 0,17
2.1.2. Makanan Jadi / Prepared Food 121,90 121,65 122,59 124,56 125,31 125,68 125,82 0,11
2.1.3. Perumahan / Housing 125,87 125,79 126,31 127,12 127,58 127,89 128,19 0,23
2.1.4. Sandang / Clothing 120,49 120,70 121,37 121,84 121,92 122,15 122,37 0,18
2.1.5. Kesehatan / Health 116,99 117,11 117,45 118,22 118,43 118,83 119,25 0,35
2.1.6. Pendidikan, Rekreasi & Olah raga / Education, Recreation & Sport 116,86 116,70 116,87 116,94 117,16 117,28 117,38 0,08
2.1.7. Transportasi & Komunikasi / Transportation & Communication 109,85 110,34 110,52 110,61 110,72 110,77 110,83 0,05
2.2. Indeks Biaya Produksi dan Penambahan Barang Modal 117,57 117,80 117,98 118,37 118,83 119,06 119,73 0,56
Cost of Production and Capital Formation Index
2.2.1. Bibit / Seed 112,98 113,21 113,23 113,40 113,65 113,71 113,67 - 0,03
2.2.2. Obat-obatan & Pupuk/ Drugs & Fertilizer 116,63 116,72 116,80 117,03 117,19 117,36 118,76 1,20
2.2.3. Transportasi & Komunikasi / Transportation & Communication 116,29 116,48 116,51 116,86 117,06 117,19 117,24 0,04
2.2.4. Sewa Lahan, Pajak & Lainnya / Hire of Land, Taxes & Others 116,99 117,38 117,70 118,64 119,32 119,59 120,49 0,76
2.2.5. Penambahan Barang Modal / Capital Formation 119,88 120,29 120,64 121,23 122,03 122,35 122,78 0,35
2.2.6. Upah Buruh Tani / Wage of farmworker 119,92 120,20 120,52 121,04 121,87 122,22 122,69 0,39
3. NILAI TUKAR PETANI HORTIKULTURA 106,14 106,24 105,32 105,05 104,99 105,45 106,14 0,65
HORTICULTURE FARMERS' TERMS OF TRADE
27
Januari
[5]
Februari
[6]
Sub Sector, Group and Subgroup
TABLE INDICES OF PRICES RECEIVED BY FARMERS, INDICES OF PRICES PAID BY FARM ERS AND HORTICULTURE FARMERS' TERMS OF TRADE (HFTT) AND THEIR CHANGES ( 2007 = 100 )
Sub Sektor, Kelompok dan Subkelompok Perubahan/Change
TABEL : 1.7.2 INDEKS HARGA YANG DITERIMA PETANI (IT), INDEKS HARGA YANG DIBAYAR PETANI (IB) DAN NILAI TUKAR PETANI HORTIKULTURA (NTPH) SERTA PERUBAHANNYA
Mar'10 - Apr'10
[9](%)
[1]
Desember
[4]
November
2009
Oktober
[3]
2010
April
[8]
Maret
[7][2]
https:
//www.b
ps.go.id

INDEKS HARGAPRICE INDICES
1. INDEKS HARGA YANG DITERIMA PETANI 128,18 128,00 128,36 128,48 128,64 128,88 129,06 0,14
INDICES OF PRICES RECEIVED BY FARMERS
Tanaman Perkebunan Rakyat / Smallhollder Plantation Estate Crops 128,18 128,00 128,36 128,48 128,64 128,88 129,06 0,14
2. INDEKS HARGA YANG DIBAYAR PETANI 121,50 121,39 121,61 122,63 123,12 123,13 123,51 0,31
CONSUMER PRICES PAID INDICES BY FARMERS
2.1. Indeks Konsumsi Rumah Tangga / Household Consumption Index 123,00 122,82 123,05 124,27 124,83 124,78 125,09 0,24
2.1.1. Bahan Makanan / Food 126,91 126,58 126,58 128,10 128,81 128,46 128,79 0,26
2.1.2. Makanan Jadi / Prepared Food 120,82 120,55 121,39 123,28 124,06 124,40 124,77 0,30
2.1.3. Perumahan / Housing 123,96 123,57 123,97 124,72 125,13 125,37 125,71 0,27
2.1.4. Sandang / Clothing 120,40 120,47 121,12 121,50 121,66 121,89 122,05 0,14
2.1.5. Kesehatan / Health 117,43 117,52 117,81 118,37 118,55 118,88 119,21 0,28
2.1.6. Pendidikan, Rekreasi & Olah raga / Education, Recreation & Sport 115,34 115,43 115,55 115,82 115,91 116,02 116,11 0,08
2.1.7. Transportasi & Komunikasi / Transportation & Communication 109,60 109,95 109,80 109,84 109,97 110,05 110,08 0,03
2.2. Indeks Biaya Produksi dan Penambahan Barang Modal 116,65 116,80 117,01 117,35 117,61 117,82 118,46 0,54
Cost of Production and Capital Formation Index
2.2.1. Bibit / Seed 122,92 123,11 123,51 123,42 123,40 123,60 124,02 0,34
2.2.2. Obat-obatan & Pupuk/ Drugs & Fertilizer 114,87 114,69 114,95 115,09 115,13 115,29 116,64 1,17
2.2.3. Transportasi & Komunikasi / Transportation & Communication 113,97 114,16 114,19 114,43 114,55 114,60 114,86 0,23
2.2.4. Sewa Lahan, Pajak & Lainnya / Hire of Land, Taxes & Others 108,53 108,53 108,77 108,98 109,33 109,44 109,46 0,02
2.2.5. Penambahan Barang Modal / Capital Formation 117,14 117,43 117,64 118,31 118,68 119,13 119,50 0,31
2.2.6. Upah Buruh Tani / Wage of farmworker 120,05 120,41 120,61 121,10 121,59 121,81 122,32 0,42
3. NILAI TUKAR PETANI TANAMAN PERKEBUNAN RAKYAT 105,49 105,44 105,55 104,77 104,48 104,67 104,49 - 0,17
SMALLHOLDER PLANTATION ESTATE CROPS FARMERS' TERMS OF TRADE
[6]
Januari
[5]
Februari
[1] [9][3] [8]
( 2007 = 100 )
Sub Sektor, Kelompok dan Subkelompok Perubahan/Change
TABLE INDICES OF PRICES RECEIVED BY FARMERS, IND ICES OF PRICES PAID BY FARMERS AND SMALLHOLDER PLAN TATION ESTATE CROPS FARMERS' TERMS OF TRADE (SFTT) AND THEIR CHANGES
(%)
Mar'10 - Apr'10Sub Sector, Group and Subgroup DesemberNovember
[4]
2009 2010
April
28
Maret
[7]
TABEL : 1.7.3 INDEKS HARGA YANG DITERIMA PETANI (IT), INDEKS HARGA YANG DIBAYAR PETANI (IB) DAN NILAI TUKAR PETANI TANAMAN PERKEBUNAN RAKYAT (NTPR) SERTA PERUBAHANNYA
Oktober
[2]
https:
//www.b
ps.go.id
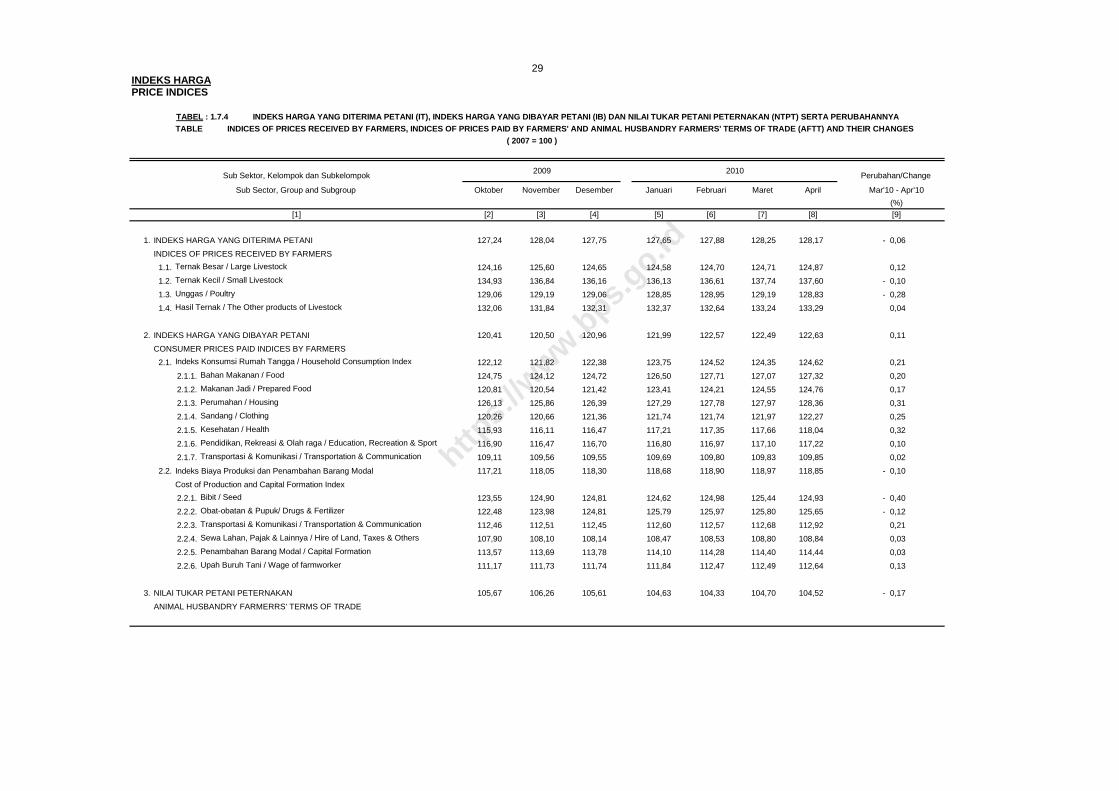
INDEKS HARGAPRICE INDICES
1. INDEKS HARGA YANG DITERIMA PETANI 127,24 128,04 127,75 127,65 127,88 128,25 128,17 - 0,06
INDICES OF PRICES RECEIVED BY FARMERS
1.1. Ternak Besar / Large Livestock 124,16 125,60 124,65 124,58 124,70 124,71 124,87 0,12
1.2. Ternak Kecil / Small Livestock 134,93 136,84 136,16 136,13 136,61 137,74 137,60 - 0,10
1.3. Unggas / Poultry 129,06 129,19 129,06 128,85 128,95 129,19 128,83 - 0,28
1.4. Hasil Ternak / The Other products of Livestock 132,06 131,84 132,31 132,37 132,64 133,24 133,29 0,04
2. INDEKS HARGA YANG DIBAYAR PETANI 120,41 120,50 120,96 121,99 122,57 122,49 122,63 0,11
CONSUMER PRICES PAID INDICES BY FARMERS
2.1. Indeks Konsumsi Rumah Tangga / Household Consumption Index 122,12 121,82 122,38 123,75 124,52 124,35 124,62 0,21
2.1.1. Bahan Makanan / Food 124,75 124,12 124,72 126,50 127,71 127,07 127,32 0,20
2.1.2. Makanan Jadi / Prepared Food 120,81 120,54 121,42 123,41 124,21 124,55 124,76 0,17
2.1.3. Perumahan / Housing 126,13 125,86 126,39 127,29 127,78 127,97 128,36 0,31
2.1.4. Sandang / Clothing 120,26 120,66 121,36 121,74 121,74 121,97 122,27 0,25
2.1.5. Kesehatan / Health 115,93 116,11 116,47 117,21 117,35 117,66 118,04 0,32
2.1.6. Pendidikan, Rekreasi & Olah raga / Education, Recreation & Sport 116,90 116,47 116,70 116,80 116,97 117,10 117,22 0,10
2.1.7. Transportasi & Komunikasi / Transportation & Communication 109,11 109,56 109,55 109,69 109,80 109,83 109,85 0,02
2.2. Indeks Biaya Produksi dan Penambahan Barang Modal 117,21 118,05 118,30 118,68 118,90 118,97 118,85 - 0,10
Cost of Production and Capital Formation Index
2.2.1. Bibit / Seed 123,55 124,90 124,81 124,62 124,98 125,44 124,93 - 0,40
2.2.2. Obat-obatan & Pupuk/ Drugs & Fertilizer 122,48 123,98 124,81 125,79 125,97 125,80 125,65 - 0,12
2.2.3. Transportasi & Komunikasi / Transportation & Communication 112,46 112,51 112,45 112,60 112,57 112,68 112,92 0,21
2.2.4. Sewa Lahan, Pajak & Lainnya / Hire of Land, Taxes & Others 107,90 108,10 108,14 108,47 108,53 108,80 108,84 0,03
2.2.5. Penambahan Barang Modal / Capital Formation 113,57 113,69 113,78 114,10 114,28 114,40 114,44 0,03
2.2.6. Upah Buruh Tani / Wage of farmworker 111,17 111,73 111,74 111,84 112,47 112,49 112,64 0,13
3. NILAI TUKAR PETANI PETERNAKAN 105,67 106,26 105,61 104,63 104,33 104,70 104,52 - 0,17
ANIMAL HUSBANDRY FARMERRS' TERMS OF TRADE
TABLE INDICES OF PRICES RECEIVED B Y FARMERS, INDICES OF PRICES PAID BY FARMERS' AND A NIMAL HUSBANDRY FARMERS' TERMS OF TRADE (AFTT) AND THEIR CHANGES
Januari
[5]
TABEL : 1.7.4 INDEKS HARGA YANG DITERIMA PETANI (IT), INDEKS HARGA YANG DIBAYAR PETANI (IB) DAN NILAI TUKAR PETANI PETERNAKAN (NTPT) SERTA PERUBAHANNYA
Sub Sektor, Kelompok dan Subkelompok
(%)
Mar'10 - Apr'10Februari
[6]
29
Sub Sector, Group and Subgroup
2009
November April
Perubahan/Change
( 2007 = 100 )
Desember
2010
[1] [9][8]
Maret
[7][2] [3]
Oktober
[4]
https:
//www.b
ps.go.id

INDEKS HARGAPRICE INDICES
1. INDEKS HARGA YANG DITERIMA PETANI 126,35 126,20 126,20 126,87 127,69 127,87 128,17 0,24
INDICES OF PRICES RECEIVED BY FARMERS
1.1. Penangkapan / Capture Fishery 128,29 127,52 128,08 129,15 129,85 130,08 130,18 0,07
1.2. Budidaya / Aquaculture 116,88 117,02 116,57 116,31 117,26 117,43 117,79 0,30
2. INDEKS HARGA YANG DIBAYAR PETANI 119,70 119,51 119,87 120,77 121,26 121,29 121,49 0,16
CONSUMER PRICES PAID INDICES BY FARMERS
2.1. Indeks Konsumsi Rumah Tangga / Household Consumption Index 123,47 123,13 123,56 124,83 125,55 125,54 125,75 0,17
2.1.1. Bahan Makanan / Food 127,11 126,37 126,74 128,36 129,38 129,02 129,22 0,16
2.1.2. Makanan Jadi / Prepared Food 120,79 120,59 121,32 123,12 123,95 124,42 124,70 0,23
2.1.3. Perumahan / Housing 126,41 126,39 126,86 127,68 128,16 128,43 128,63 0,16
2.1.4. Sandang / Clothing 119,58 119,56 120,14 120,52 120,67 120,90 121,13 0,19
2.1.5. Kesehatan / Health 116,67 117,08 117,30 118,07 118,31 118,65 119,12 0,40
2.1.6. Pendidikan, Rekreasi & Olah raga / Education, Recreation & Sport 114,59 114,35 114,48 114,59 114,82 114,96 115,02 0,05
2.1.7. Transportasi & Komunikasi / Transportation & Communication 111,05 111,35 111,38 111,66 111,73 111,78 111,80 0,02
2.2. Indeks Biaya Produksi dan Penambahan Barang Modal 113,47 113,54 113,78 114,07 114,22 114,33 114,48 0,13
Cost of Production and Capital Formation Index
2.2.1. Bibit / Seed 103,96 103,41 103,72 103,49 103,64 103,73 103,90 0,16
2.2.2. Obat-obatan & Pupuk/ Drugs & Fertilizer 111,28 111,55 111,79 112,27 112,32 112,29 112,71 0,37
2.2.3. Transportasi & Komunikasi / Transportation & Communication 109,75 109,88 109,88 109,90 109,87 109,97 109,99 0,01
2.2.4. Sewa Lahan, Pajak & Lainnya / Hire of Land, Taxes & Others 119,26 119,52 119,81 120,44 120,63 120,80 121,14 0,28
2.2.5. Penambahan Barang Modal / Capital Formation 112,09 112,39 112,79 113,16 113,39 113,49 113,61 0,11
2.2.6. Upah Buruh Tani / Wage of farmworker 107,11 107,12 107,30 107,44 107,70 107,72 107,76 0,03
3. NILAI TUKAR NELAYAN 105,56 105,59 105,29 105,05 105,30 105,42 105,50 0,08
FISHERMAN TERMS OF TRADE
Februari
[6]
Sub Sector, Group and Subgroup Januari
Perubahan/Change
Oktober
[9][4]
TABEL : 1.7.5 INDEKS HARGA YANG DITERIMA PETANI (IT), INDEKS HARGA YANG DIBAYAR PETANI (IB) DAN NILAI TUKAR NELAYAN (NTN) SERTA PERUBAHANNYA TABLE INDICES OF PRICE S RECEIVED BY FISHERMEN, INDICES OF PRICES PAID BY FISHERMEN AND FISHERMAN' TERMS OF TRADE (FTT) AND THEIR CHANGES
( 2007 = 100 )
November
Sub Sektor, Kelompok dan Subkelompok
(%)
Mar'10 - Apr'10
[1]
30
[5]
2009
[2] [3]
Desember April
[8]
2010
[7]
Maret
https:
//www.b
ps.go.id
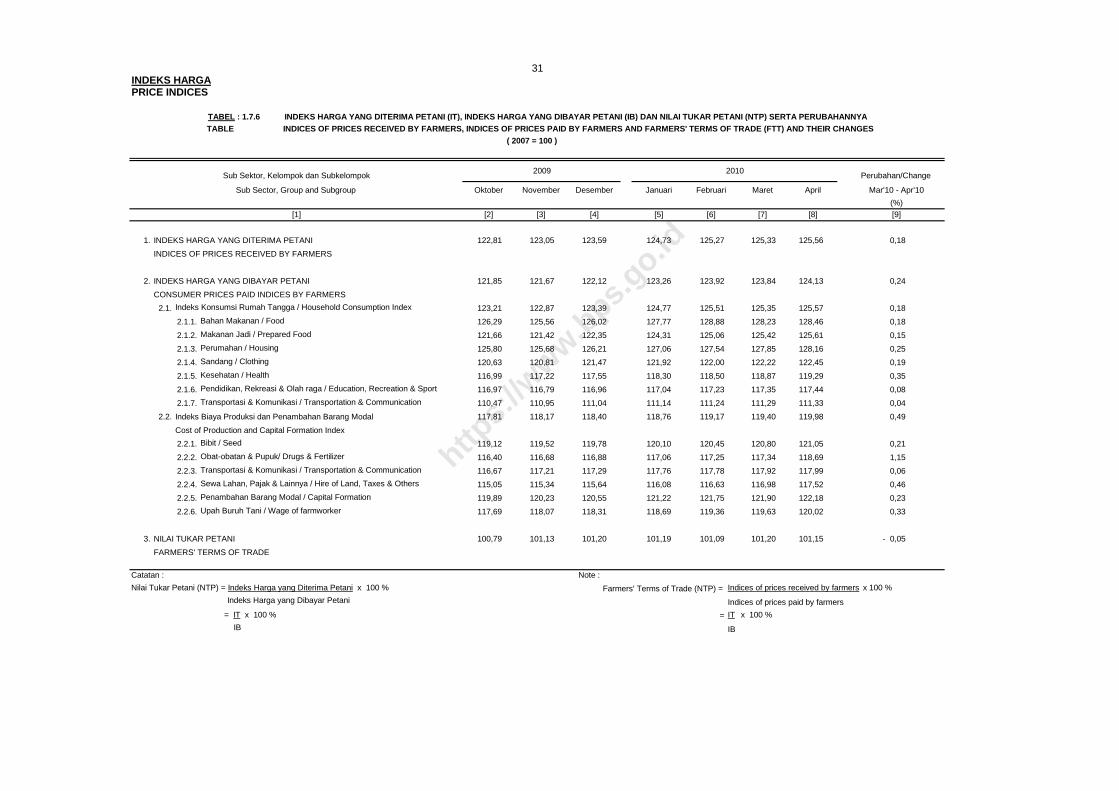
INDEKS HARGAPRICE INDICES
1. INDEKS HARGA YANG DITERIMA PETANI 122,81 123,05 123,59 124,73 125,27 125,33 125,56 0,18
INDICES OF PRICES RECEIVED BY FARMERS
2. INDEKS HARGA YANG DIBAYAR PETANI 121,85 121,67 122,12 123,26 123,92 123,84 124,13 0,24
CONSUMER PRICES PAID INDICES BY FARMERS
2.1. Indeks Konsumsi Rumah Tangga / Household Consumption Index 123,21 122,87 123,39 124,77 125,51 125,35 125,57 0,18
2.1.1. Bahan Makanan / Food 126,29 125,56 126,02 127,77 128,88 128,23 128,46 0,18
2.1.2. Makanan Jadi / Prepared Food 121,66 121,42 122,35 124,31 125,06 125,42 125,61 0,15
2.1.3. Perumahan / Housing 125,80 125,68 126,21 127,06 127,54 127,85 128,16 0,25
2.1.4. Sandang / Clothing 120,63 120,81 121,47 121,92 122,00 122,22 122,45 0,19
2.1.5. Kesehatan / Health 116,99 117,22 117,55 118,30 118,50 118,87 119,29 0,35
2.1.6. Pendidikan, Rekreasi & Olah raga / Education, Recreation & Sport 116,97 116,79 116,96 117,04 117,23 117,35 117,44 0,08
2.1.7. Transportasi & Komunikasi / Transportation & Communication 110,47 110,95 111,04 111,14 111,24 111,29 111,33 0,04
2.2. Indeks Biaya Produksi dan Penambahan Barang Modal 117,81 118,17 118,40 118,76 119,17 119,40 119,98 0,49
Cost of Production and Capital Formation Index
2.2.1. Bibit / Seed 119,12 119,52 119,78 120,10 120,45 120,80 121,05 0,21
2.2.2. Obat-obatan & Pupuk/ Drugs & Fertilizer 116,40 116,68 116,88 117,06 117,25 117,34 118,69 1,15
2.2.3. Transportasi & Komunikasi / Transportation & Communication 116,67 117,21 117,29 117,76 117,78 117,92 117,99 0,06
2.2.4. Sewa Lahan, Pajak & Lainnya / Hire of Land, Taxes & Others 115,05 115,34 115,64 116,08 116,63 116,98 117,52 0,46
2.2.5. Penambahan Barang Modal / Capital Formation 119,89 120,23 120,55 121,22 121,75 121,90 122,18 0,23
2.2.6. Upah Buruh Tani / Wage of farmworker 117,69 118,07 118,31 118,69 119,36 119,63 120,02 0,33
3. NILAI TUKAR PETANI 100,79 101,13 101,20 101,19 101,09 101,20 101,15 - 0,05
FARMERS' TERMS OF TRADE
Catatan : Note :
Nilai Tukar Petani (NTP) = Indeks Harga yang Diterima Petani x 100 % Farmers' Terms of Trade (NTP) = Indices of prices received by farmers x 100 %
Indeks Harga yang Dibayar Petani Indices of prices paid by farmers
= IT x 100 % = IT x 100 %
IB IB
Januari
[5]
TABLE INDICES OF PRICES REC EIVED BY FARMERS, INDICES OF PRICES PAID BY FARMERS AND FARMERS' TERMS OF TRADE (FTT) AND THEIR CHANGE S
Februari
[6][4]
Oktober
( 2007 = 100 )
Sub Sektor, Kelompok dan Subkelompok Perubahan/Change 2009
TABEL : 1.7.6 INDEKS HARGA YANG DITERIMA PETANI (IT), INDEKS HARGA YANG DIBAYAR PETANI (IB) DAN NILAI TUKAR PETANI (NTP) SERTA PERUBAHANNYA
November Desember
[1](%)
31
Sub Sector, Group and Subgroup Mar'10 - Apr'10
[9]
2010
[3] [8][2]
AprilMaret
[7]
https:
//www.b
ps.go.id

INDEKS HARGAPRICE INDICES
Nangroe Aceh Darussalam 121,6 120,4 101,0 122,4 120,5 101,6 123,9 120,3 103,0 126,3 121,0 104,4 129,0 121,6 106,1 129,9 121,1 107,2 127,9 122,0 104,9
Sumatera Utara 118,1 125,4 94,2 118,8 124,0 95,8 121,1 124,1 97,6 123,1 125,1 98,4 123,1 125,1 98,4 123,8 124,8 99,2 124,5 125,7 99,1
Sumatera Barat 118,0 124,2 95,0 120,8 122,9 98,2 122,0 122,6 99,5 123,9 124,0 99,9 124,4 125,1 99,4 125,0 124,5 100,4 123,5 124,9 98,9
Riau 119,8 116,8 102,6 122,0 116,2 105,0 122,5 115,9 105,7 122,5 115,4 106,1 126,0 115,7 108,9 129,0 116,1 111,1 128,7 116,2 110,8
Jambi 112,3 118,9 94,5 114,4 118,2 96,7 114,2 118,1 96,7 115,6 119,2 97,0 117,6 119,7 98,2 119,3 119,8 99,6 118,8 120,1 99,0
Sumatera Selatan 128,9 118,1 109,1 129,1 118,2 109,2 131,7 118,1 111,6 133,3 119,8 111,2 137,5 120,5 114,1 137,6 120,0 114,7 136,3 120,2 113,4
Bengkulu 143,6 129,4 110,9 144,2 129,8 111,1 144,3 129,8 111,2 146,2 130,9 111,7 147,7 131,5 112,3 148,7 131,4 113,2 145,0 131,3 110,4
Lampung 139,7 120,2 116,2 142,6 120,5 118,3 142,5 120,1 118,6 143,4 120,8 118,7 143,7 121,4 118,4 144,1 121,1 119,0 145,6 121,3 120,1
Kep.Bangka Belitung 99,1 115,4 85,8 99,7 115,5 86,3 99,7 116,1 85,9 99,5 116,9 85,1 99,5 116,7 85,3 99,8 116,6 85,6 98,1 116,8 84,0
Kepulauan Riau 76,6 118,7 64,6 75,6 119,3 63,4 75,7 119,0 63,6 76,9 120,5 63,8 77,1 120,7 63,9 77,4 120,8 64,1 77,1 121,4 63,5
Jawa Barat 114,8 125,4 91,6 114,1 125,5 90,9 114,6 126,1 90,9 116,5 127,2 91,6 117,3 128,6 91,2 117,3 128,8 91,1 114,9 129,3 88,9
Jawa Tengah 110,4 119,6 92,3 111,0 119,0 93,2 113,0 119,7 94,4 115,7 120,6 95,9 115,6 121,3 95,3 115,2 121,2 95,0 115,6 121,4 95,2
DI. Yogyakarta 126,5 118,3 107,0 125,9 118,0 106,7 127,0 118,6 107,1 130,4 119,2 109,5 130,2 119,7 108,8 131,2 119,7 109,6 132,5 119,6 110,8
Jawa Timur 115,2 123,8 93,0 115,2 123,4 93,3 117,4 124,8 94,1 119,5 126,5 94,5 119,8 127,2 94,2 118,2 126,8 93,3 119,3 127,2 93,8
Banten 116,2 125,2 92,8 118,9 124,2 95,7 119,3 124,5 95,8 121,9 125,1 97,4 124,0 125,9 98,5 123,6 125,7 98,3 123,8 125,9 98,3
Bali 114,8 121,0 94,9 115,5 119,7 96,4 115,6 119,8 96,5 115,3 121,0 95,3 116,0 122,1 95,0 115,6 122,5 94,4 116,6 122,3 95,3
Nusa Tanggara Barat 115,8 125,1 92,6 114,9 125,1 91,9 115,0 125,2 91,8 117,4 127,2 92,3 117,0 127,5 91,8 117,0 127,0 92,1 117,9 127,1 92,8
Nusa Tenggara Timur 122,2 124,7 98,0 124,7 125,4 99,5 125,0 126,0 99,2 126,1 127,9 98,6 128,5 128,9 99,7 127,3 129,4 98,4 126,3 130,0 97,2
Kalimantan Barat 114,2 119,1 95,9 114,1 119,2 95,7 115,4 120,0 96,2 115,9 120,7 96,0 115,1 121,0 95,1 114,9 121,5 94,6 115,3 121,3 95,1
Kalimantan Tengah 126,5 120,8 104,7 126,5 121,2 104,3 127,0 121,2 104,8 129,1 122,0 105,9 130,4 122,4 106,5 132,0 122,6 107,7 132,0 123,4 106,9
Kalimantan Selatan 120,8 121,0 99,9 121,0 121,2 99,9 122,5 121,3 101,0 123,9 122,5 101,2 126,6 122,7 103,2 126,7 123,0 103,0 127,9 123,7 103,4
Kalimantan Timur 111,9 122,2 91,6 111,8 122,0 91,6 111,8 121,7 91,8 111,5 122,1 91,3 112,5 122,8 91,6 112,1 122,6 91,4 111,9 122,8 91,1
Sulawesi Utara 116,8 120,5 96,9 115,8 120,8 95,8 116,4 120,8 96,4 117,8 121,4 97,0 117,4 122,0 96,2 117,6 122,3 96,2 116,5 122,2 95,3
Sulawesi Tengah 111,9 128,7 86,9 112,1 129,2 86,8 112,3 129,6 86,6 112,8 130,3 86,6 112,9 130,3 86,7 112,4 130,5 86,1 112,3 129,7 86,6
Sulawesi Selatan 120,8 125,4 96,3 120,6 125,8 95,9 120,9 125,7 96,2 123,0 127,3 96,6 125,1 128,1 97,6 127,7 128,3 99,5 126,5 128,2 98,7
Sulawesi Tenggara 108,6 123,6 87,8 108,2 124,4 87,0 108,5 124,3 87,3 109,5 125,2 87,5 109,7 125,4 87,5 110,9 125,5 88,3 110,9 125,3 88,5
Gorontalo 102,0 121,1 84,2 101,5 119,8 84,7 101,2 119,0 85,0 102,1 119,0 85,8 102,0 118,7 85,9 102,9 118,8 86,7 103,0 119,1 86,4
Sulawesi Barat 116,3 123,1 94,5 116,7 122,7 95,2 116,8 123,3 94,8 116,8 124,1 94,1 117,1 124,7 93,9 117,1 124,7 93,8 117,0 124,5 94,0
Maluku 117,6 127,4 92,4 117,5 127,5 92,1 118,0 128,9 91,5 120,1 130,1 92,3 119,3 130,9 91,1 119,7 131,4 91,1 120,0 131,2 91,5
Maluku Utara 115,5 123,3 93,7 115,5 123,6 93,5 116,7 124,5 93,7 116,7 125,2 93,2 117,3 126,2 93,0 116,9 126,1 92,7 116,8 127,1 91,9
Papua Barat 113,4 124,2 91,3 113,6 125,7 90,4 113,6 125,3 90,7 113,5 126,5 89,7 113,3 127,4 89,0 114,1 127,9 89,2 114,1 128,0 89,1
Papua 123,5 122,5 100,8 125,0 122,9 101,7 126,0 123,6 101,9 126,0 124,3 101,4 126,0 124,9 100,9 126,0 125,0 100,8 126,0 125,4 100,5
Januari '10
IT IB NTPP
[11] [12] [13]
IT
[20][2] [7]
IT IB NTPP NTPPIB NTPP IT IB
[21][3] [4] [8] [9] [10] [22]
ProvinceProvinsi
32
MENURUT PROVINSI / BY PROVINCE ( 2007 = 100 )
Oktober '09 April '10
TABLE INDICES OF PRICES REC EIVED BY FARMERS, INDICES OF PRICES PAID BY FARMERS AND FOOD CROPS FARMERS' TERMS OF TRADE (FFTT) TABEL : 1.8.1 INDEKS HARGA YANG DITERIMA PETANI (IT), INDEKS HARGA YANG DIBAYAR PETANI (IB) DAN NILAI TUKAR PETANI TANAMAN PANGAN (NTPP)
[6][1] [5] [14] [15] [16]
November '09
IT IB NTPP
Desember '09 Februari '10
IT IB NTPP
[17] [18] [19]
Maret '10
IT IB NTPP
https:
//www.b
ps.go.id

INDEKS HARGAPRICE INDICES
NTPH NTPH NTPH NTPH NTPH NTPH NTPH
Nangroe Aceh Darussalam 119,5 120,3 99,4 121,6 120,4 100,9 120,5 120,2 100,2 120,4 120,8 99,7 121,8 121,3 100,4 123,1 120,8 101,9 124,6 121,5 102,5
Sumatera Utara 142,8 124,6 114,7 142,8 123,2 115,9 141,8 123,2 115,0 140,3 124,2 112,9 135,9 124,1 109,5 135,0 123,8 109,0 135,6 124,6 108,8
Sumatera Barat 126,4 124,0 101,9 123,8 123,0 100,7 122,7 122,6 100,1 123,3 123,8 99,6 125,8 124,7 100,9 124,3 124,1 100,2 127,0 124,3 102,2
Riau 129,1 117,2 110,1 131,8 116,3 113,3 131,5 116,1 113,3 129,6 115,6 112,1 128,5 115,9 110,9 131,0 116,2 112,7 130,5 116,3 112,2
Jambi 115,1 118,4 97,2 111,5 117,9 94,6 109,5 117,7 93,0 111,6 118,9 93,8 111,6 119,3 93,5 111,6 119,3 93,5 112,7 119,4 94,4
Sumatera Selatan 129,6 116,8 111,0 129,6 116,7 111,0 127,1 116,7 109,0 129,7 118,2 109,8 133,0 118,8 112,0 133,6 118,4 112,8 136,8 118,5 115,5
Bengkulu 150,2 127,9 117,4 147,1 128,3 114,7 145,7 128,3 113,6 147,2 129,2 113,9 148,4 129,9 114,2 145,1 129,8 111,8 145,4 129,7 112,1
Lampung 113,8 119,4 95,3 112,9 119,6 94,3 112,7 119,2 94,5 116,1 119,8 96,9 120,1 120,4 99,8 120,2 120,3 100,0 120,8 120,4 100,3
Kep.Bangka Belitung 102,8 112,8 91,1 104,5 112,9 92,6 104,3 113,4 92,0 104,1 114,4 91,0 104,6 114,2 91,7 104,2 114,0 91,4 104,4 114,0 91,6
Kepulauan Riau 123,4 119,4 103,4 128,0 120,0 106,7 127,1 119,7 106,2 127,0 121,2 104,8 129,2 121,5 106,4 128,6 121,7 105,7 131,3 122,1 107,5
Jawa Barat 130,5 124,1 105,1 132,2 124,2 106,4 132,1 124,7 106,0 135,4 125,9 107,6 136,3 127,3 107,1 138,6 127,5 108,7 141,0 128,0 110,1
Jawa Tengah 119,7 119,5 100,1 118,1 118,9 99,4 116,8 119,5 97,8 117,9 120,5 97,9 118,6 121,2 97,9 119,3 121,1 98,6 119,8 121,3 98,7
DI. Yogyakarta 144,6 117,5 123,1 140,8 117,2 120,1 137,9 117,7 117,1 139,2 118,4 117,6 141,1 118,9 118,7 142,2 118,8 119,7 146,7 118,8 123,5
Jawa Timur 137,4 123,5 111,3 137,3 123,0 111,6 137,0 124,4 110,1 136,3 126,2 107,9 137,4 127,1 108,2 138,3 126,5 109,3 139,4 126,8 109,9
Banten 131,2 123,9 105,8 129,5 122,9 105,4 129,1 123,2 104,8 129,9 123,9 104,8 127,8 124,4 102,7 127,4 124,2 102,6 129,8 124,4 104,4
Bali 155,3 120,1 129,3 150,2 118,8 126,4 147,3 118,9 123,9 150,6 120,0 125,5 148,0 121,1 122,3 152,4 121,4 125,5 154,9 121,1 127,9
Nusa Tanggara Barat 117,5 125,1 93,9 118,5 125,1 94,8 119,0 125,2 95,1 121,6 127,1 95,7 121,2 127,3 95,1 118,9 126,8 93,8 119,3 126,8 94,1
Nusa Tenggara Timur 119,0 122,4 97,2 120,2 123,1 97,6 121,1 123,8 97,8 123,9 125,8 98,5 125,1 126,8 98,6 124,1 127,4 97,4 125,5 128,0 98,1
Kalimantan Barat 126,6 119,7 105,7 123,6 119,9 103,1 120,9 120,4 100,4 120,5 121,1 99,5 123,3 121,4 101,5 125,2 122,1 102,5 124,8 122,2 102,1
Kalimantan Tengah 127,5 121,2 105,2 127,6 121,7 104,8 127,7 121,7 104,9 128,9 122,4 105,3 129,8 123,0 105,5 130,0 123,3 105,4 131,1 124,2 105,5
Kalimantan Selatan 142,2 119,5 119,0 145,7 119,7 121,7 145,3 119,8 121,3 145,0 120,9 119,9 147,1 120,9 121,7 147,9 121,2 122,0 150,6 122,1 123,3
Kalimantan Timur 140,4 121,3 115,7 139,3 121,1 115,0 139,3 120,7 115,4 140,2 120,8 116,1 142,9 121,5 117,6 141,7 121,6 116,5 138,9 121,7 114,2
Sulawesi Utara 123,8 121,1 102,2 126,2 121,1 104,3 125,0 121,2 103,2 123,6 121,9 101,5 123,0 122,5 100,4 123,0 122,8 100,2 123,9 122,4 101,2
Sulawesi Tengah 130,9 126,5 103,5 130,6 126,6 103,1 130,6 127,0 102,9 128,7 127,5 100,9 125,7 128,0 98,2 123,5 128,2 96,3 125,2 127,6 98,1
Sulawesi Selatan 123,6 125,4 98,6 125,0 125,7 99,4 125,3 125,5 99,8 124,9 127,2 98,2 124,7 128,1 97,4 122,4 128,2 95,4 121,8 128,1 95,1
Sulawesi Tenggara 153,1 121,7 125,8 153,5 122,3 125,5 153,6 122,3 125,6 155,5 123,5 126,0 154,0 123,2 125,0 153,0 123,4 124,0 152,7 123,7 123,5
Gorontalo 133,2 115,6 115,2 136,6 116,1 117,6 136,3 116,8 116,6 132,7 117,3 113,2 131,0 117,2 111,8 130,5 117,1 111,4 132,5 117,7 112,5
Sulawesi Barat 107,9 123,2 87,6 107,1 123,2 86,9 108,0 124,0 87,1 107,3 124,5 86,2 108,0 125,2 86,3 108,8 125,0 87,0 105,8 124,9 84,7
Maluku 139,6 123,1 113,4 140,2 123,0 114,0 140,9 124,4 113,3 139,4 125,4 111,1 140,5 126,3 111,3 140,3 126,7 110,7 143,0 126,7 112,8
Maluku Utara 120,2 124,3 96,6 120,2 124,5 96,5 122,0 125,5 97,2 121,1 126,2 96,0 119,0 127,2 93,6 118,5 127,1 93,2 116,6 128,1 91,1
Papua Barat 134,0 118,9 112,7 134,4 119,5 112,5 134,1 120,3 111,5 133,1 120,8 110,2 133,5 121,0 110,3 134,0 121,6 110,2 134,0 121,7 110,1
Papua 148,8 124,8 119,2 151,5 125,3 120,9 151,5 125,8 120,4 153,8 126,4 121,7 156,5 127,4 122,9 157,5 127,0 124,0 158,9 127,3 124,8
IT IB
[10]
IT IB
[11] [12] [13]
Desember '09 Januari '10 Maret '10
33
Province IT IBIT IB
[21][20]
IB
[14]
IT IB
[8] [16]
Provinsi Oktober '09 November '09
TABLE INDICES OF PRICES R ECEIVED BY FARMERS, INDICES OF PRICES PAID BY FARME RS AND HORTICULTURE FARMERS' TERMS OF TRADE (HFTT)
Februari '10 April '10
[3] [7][4][2] [9]
TABEL : 1.8.2 INDEKS HARGA YANG DITERIMA PETANI (IT), INDEKS HARGA YANG DIBAYAR PETANI (IB) DAN NILAI TUKAR PETANI HORTIKULTURA (NTPH)
MENURUT PROVINSI / BY PROVINCE ( 2007 = 100 )
[5]
IT
[1] [6] [22]
ITIB
[15] [17] [18] [19]
https:
//www.b
ps.go.id

INDEKS HARGAPRICE INDICES
NTPR NTPR NTPR NTPR NTPR NTPR NTPR
Nangroe Aceh Darussalam 131,3 123,1 106,7 133,0 123,3 107,9 133,7 123,0 108,7 135,6 123,5 109,8 139,4 124,1 112,3 140,5 123,6 113,6 145,9 124,1 117,5
Sumatera Utara 127,5 123,1 103,6 126,4 121,6 103,9 128,1 121,8 105,1 128,8 122,6 105,1 129,8 122,5 106,0 130,9 122,3 107,1 130,9 123,0 106,5
Sumatera Barat 147,5 122,8 120,1 149,9 121,7 123,2 151,6 121,3 125,0 155,6 122,7 126,8 157,1 123,4 127,3 154,6 122,9 125,8 158,2 123,0 128,6
Riau 113,3 119,2 95,0 114,6 118,8 96,5 115,6 118,7 97,4 117,0 118,2 99,0 118,3 118,4 99,9 118,6 118,6 100,0 120,5 118,9 101,4
Jambi 108,0 119,1 90,6 109,9 118,7 92,6 110,7 118,5 93,4 111,5 119,9 93,0 112,2 120,5 93,2 113,6 120,4 94,4 117,3 120,9 97,1
Sumatera Selatan 104,0 119,1 87,3 102,8 119,3 86,2 102,8 119,1 86,4 102,0 120,4 84,7 103,4 121,0 85,5 103,6 120,7 85,8 104,4 120,8 86,4
Bengkulu 104,7 125,5 83,4 104,5 125,8 83,0 105,9 125,8 84,2 106,4 126,6 84,1 108,7 127,2 85,5 108,8 127,0 85,7 109,5 127,0 86,2
Lampung 133,1 121,6 109,5 134,2 121,9 110,1 137,2 121,7 112,7 136,8 122,0 112,1 136,9 122,6 111,7 135,9 122,6 110,9 134,6 123,5 109,0
Kep.Bangka Belitung 115,0 110,3 104,2 115,0 110,6 104,0 115,2 111,1 103,7 115,0 111,8 102,8 114,6 111,5 102,8 114,6 111,2 103,1 117,4 111,5 105,3
Kepulauan Riau 138,5 118,0 117,4 138,5 119,1 116,4 138,5 119,0 116,4 138,7 120,3 115,3 136,9 120,3 113,8 138,8 120,5 115,1 139,0 120,9 115,0
Jawa Barat 139,3 124,8 111,6 137,4 124,9 110,0 139,4 125,4 111,2 140,5 126,4 111,1 141,1 127,7 110,4 145,2 128,1 113,3 145,6 129,0 112,9
Jawa Tengah 145,3 119,2 121,9 144,8 118,5 122,1 144,7 119,1 121,5 144,0 120,0 119,9 143,0 120,6 118,6 142,6 120,5 118,3 142,7 120,7 118,3
DI. Yogyakarta 133,1 118,0 112,9 133,5 117,9 113,3 136,8 118,3 115,6 138,2 119,3 115,9 137,7 119,7 115,0 140,5 119,8 117,3 142,9 119,9 119,2
Jawa Timur 122,7 123,7 99,2 121,5 123,1 98,7 119,9 123,9 96,7 120,0 125,5 95,6 120,3 126,2 95,3 119,4 125,8 94,9 119,5 126,3 94,6
Banten 129,6 123,7 104,8 129,5 123,0 105,3 129,0 123,4 104,5 128,3 124,2 103,3 127,5 124,5 102,4 127,3 124,3 102,4 125,2 124,3 100,7
Bali 131,2 120,8 108,6 131,2 119,3 110,0 132,1 119,5 110,5 133,7 120,7 110,7 135,0 121,5 111,1 136,3 121,7 112,0 134,4 121,5 110,6
Nusa Tanggara Barat 115,9 121,9 95,1 113,6 121,8 93,2 113,9 122,1 93,3 113,9 123,9 92,0 114,5 124,3 92,1 114,2 123,7 92,4 115,2 123,8 93,1
Nusa Tenggara Timur 128,9 125,7 102,6 129,7 126,4 102,6 129,4 126,9 101,9 129,1 128,8 100,2 128,2 129,5 99,0 129,3 129,9 99,5 129,6 130,7 99,1
Kalimantan Barat 134,7 118,0 114,1 136,9 118,2 115,9 138,1 118,6 116,4 138,8 119,4 116,2 138,0 119,6 115,4 139,2 120,3 115,8 141,4 121,2 116,7
Kalimantan Tengah 103,5 118,8 87,1 103,6 119,7 86,5 104,8 119,8 87,5 105,4 120,3 87,6 106,6 121,1 88,0 106,8 121,3 88,0 106,5 122,0 87,3
Kalimantan Selatan 122,4 118,4 103,4 125,2 118,2 105,9 124,5 118,5 105,1 124,4 119,7 103,9 123,8 119,6 103,5 124,4 119,8 103,9 123,2 120,6 102,2
Kalimantan Timur 125,3 119,2 105,1 125,3 118,8 105,5 127,2 118,7 107,2 125,6 119,2 105,4 126,3 119,8 105,5 125,1 119,6 104,6 124,9 120,0 104,1
Sulawesi Utara 134,6 119,3 112,8 135,6 119,7 113,3 135,5 119,7 113,1 135,0 120,1 112,4 133,3 120,9 110,3 134,6 121,2 111,1 133,5 121,0 110,3
Sulawesi Tengah 124,9 126,1 99,0 124,5 126,6 98,4 127,3 127,1 100,2 125,8 127,6 98,6 123,8 127,8 96,9 123,4 127,9 96,4 122,3 127,1 96,2
Sulawesi Selatan 139,9 123,0 113,8 137,0 123,9 110,6 135,4 123,7 109,5 135,1 125,3 107,8 134,1 126,2 106,3 134,3 126,6 106,1 131,9 126,9 104,0
Sulawesi Tenggara 162,0 120,3 134,6 163,1 121,1 134,7 163,1 121,0 134,9 162,7 122,0 133,3 162,7 121,6 133,8 162,3 121,7 133,3 158,8 122,1 130,1
Gorontalo 145,4 119,5 121,7 146,7 117,9 124,4 145,3 116,8 124,4 144,1 117,4 122,8 147,4 117,4 125,5 148,0 117,5 126,0 146,4 117,5 124,7
Sulawesi Barat 171,7 127,9 134,2 172,1 127,7 134,8 170,8 128,1 133,4 168,5 129,1 130,6 168,3 129,7 129,8 169,2 129,8 130,4 166,5 129,6 128,5
Maluku 112,3 117,0 95,9 111,6 117,0 95,4 110,9 117,7 94,2 111,4 118,6 93,9 111,4 118,9 93,7 111,2 119,7 92,8 113,9 120,1 94,8
Maluku Utara 137,4 121,0 113,5 137,4 121,6 113,0 137,4 122,4 112,2 137,5 122,7 112,0 137,3 122,8 111,8 137,3 123,3 111,4 137,2 123,6 111,0
Papua Barat 147,8 118,2 125,0 144,2 118,8 121,4 145,4 119,4 121,8 146,0 120,1 121,6 146,0 120,2 121,5 145,5 120,7 120,5 145,3 120,9 120,1
Papua 106,3 121,1 87,8 107,8 121,7 88,6 109,5 122,3 89,6 109,4 122,1 89,6 111,4 122,0 91,3 111,2 121,6 91,5 110,3 121,7 90,7
[12] [13]
Desember '09
TABEL : 1.8.3 INDEKS HARGA YANG DITERIMA PETANI (IT), INDEKS HARGA YANG DIBAYAR PETANI (IB) DAN NILAI TUKAR PETANI TANAMAN PERKEBUNAN RAKYAT (NTPR)
Province IT
Provinsi
34
November '09Oktober '09 April '10Januari '10
IT IB ITIT IBIB
[5] [21][1] [9] [10] [11][6] [8] [22][2] [3]
MENURUT PROVINSI / BY PROVINCE
[20]
( 2007 = 100 )
[7][4]
Februari '10
IT IB
[14] [15] [16]
Maret '10
IT IB
TABLE INDICES OF PRICES RECEIVED BY FARMERS, INDICES OF PRICES PAID BY FARM ERS AND SMALLHOLDER PLANTATION ESTATE CROPS FARMERS ' TERMS OF TRADE (SFTT)
IT IBIB
[17] [18] [19]
https:
//www.b
ps.go.id

INDEKS HARGAPRICE INDICES
Nangroe Aceh Darussalam 118,8 118,6 100,2 119,7 118,6 101,0 118,7 118,5 100,2 118,5 118,9 99,7 119,0 119,2 99,8 119,3 119,1 100,2 119,5 119,7 99,8
Sumatera Utara 122,1 120,5 101,3 123,1 119,7 102,8 123,8 119,8 103,4 123,3 120,1 102,7 122,7 120,0 102,2 122,4 119,7 102,2 123,3 120,5 102,3
Sumatera Barat 113,7 116,9 97,2 114,2 116,8 97,8 114,2 116,7 97,9 115,6 117,6 98,3 115,3 118,3 97,4 116,3 118,2 98,5 115,8 118,3 97,9
Riau 127,3 123,5 103,1 127,7 123,8 103,2 128,5 123,6 103,9 128,5 123,3 104,2 128,7 123,5 104,2 128,5 124,3 103,4 128,4 124,3 103,3
Jambi 114,0 116,2 98,1 115,2 116,2 99,1 114,9 116,3 98,8 114,6 117,5 97,5 116,0 118,3 98,1 117,2 118,6 98,8 117,4 118,6 99,0
Sumatera Selatan 120,3 114,5 105,1 121,0 114,6 105,5 121,0 114,5 105,6 121,2 115,5 105,0 121,3 115,9 104,6 121,5 115,6 105,1 122,2 115,9 105,5
Bengkulu 130,6 121,5 107,5 134,9 121,6 110,9 134,7 121,6 110,8 135,3 122,2 110,7 134,8 122,3 110,2 134,4 122,1 110,0 135,3 121,9 111,0
Lampung 121,3 114,7 105,7 121,7 114,7 106,1 120,9 114,6 105,5 120,4 115,1 104,6 120,2 115,4 104,1 121,4 115,2 105,4 122,5 115,2 106,3
Kep.Bangka Belitung 101,1 106,8 94,7 101,1 106,7 94,7 100,9 107,0 94,3 101,8 107,8 94,5 102,2 107,4 95,1 103,0 107,3 96,0 102,9 107,4 95,8
Kepulauan Riau 105,3 111,9 94,1 105,5 113,0 93,3 105,7 112,9 93,6 105,7 113,7 93,0 105,3 113,7 92,7 105,3 114,2 92,2 105,3 114,5 92,0
Jawa Barat 126,3 124,4 101,5 126,7 124,6 101,7 126,0 125,0 100,9 126,0 126,1 99,9 126,9 127,4 99,6 128,0 127,6 100,4 127,2 127,9 99,5
Jawa Tengah 136,2 119,6 113,9 137,6 119,0 115,7 136,9 119,7 114,3 136,5 121,0 112,8 137,2 121,9 112,6 137,9 121,7 113,3 136,8 121,7 112,4
DI. Yogyakarta 129,4 121,2 106,7 129,6 121,4 106,8 130,2 122,0 106,7 130,3 122,7 106,2 129,9 122,9 105,7 130,4 122,8 106,2 129,9 122,6 106,0
Jawa Timur 134,3 124,1 108,2 134,8 124,5 108,3 133,9 125,4 106,8 133,4 126,6 105,4 133,3 127,1 104,9 133,5 126,7 105,4 133,5 126,7 105,3
Banten 129,1 120,9 106,7 130,8 120,2 108,8 129,3 120,4 107,4 128,6 121,3 106,0 127,8 121,7 105,1 128,0 121,6 105,3 127,3 121,6 104,7
Bali 115,7 122,5 94,5 115,6 122,2 94,6 115,4 122,5 94,2 115,8 123,5 93,8 115,8 124,3 93,2 115,7 124,5 92,9 115,6 124,4 92,9
Nusa Tanggara Barat 140,1 119,8 117,0 140,2 120,2 116,6 141,1 120,1 117,5 142,1 121,6 116,8 140,9 122,0 115,5 140,7 121,9 115,5 141,8 122,1 116,2
Nusa Tenggara Timur 129,6 115,7 112,0 131,9 116,2 113,5 133,3 116,7 114,2 134,7 118,5 113,6 135,6 119,2 113,7 135,9 119,6 113,6 137,3 120,2 114,2
Kalimantan Barat 104,9 115,9 90,5 105,0 116,0 90,6 103,9 116,6 89,2 103,7 117,4 88,3 104,0 117,7 88,3 103,4 117,9 87,7 103,5 118,1 87,6
Kalimantan Tengah 109,9 114,9 95,6 111,2 115,5 96,2 114,2 115,7 98,7 113,6 116,1 97,9 113,1 117,0 96,7 113,2 117,3 96,5 114,4 118,0 97,0
Kalimantan Selatan 120,0 114,8 104,5 120,8 115,1 104,9 120,8 115,3 104,7 119,9 116,3 103,1 121,4 116,2 104,5 121,3 116,4 104,2 121,6 117,0 103,9
Kalimantan Timur 137,5 115,2 119,3 137,7 115,2 119,6 137,7 114,9 119,9 137,6 115,1 119,5 136,6 115,7 118,1 135,9 115,7 117,5 135,9 115,6 117,5
Sulawesi Utara 119,2 120,7 98,8 119,3 120,8 98,7 119,3 120,7 98,8 120,3 121,3 99,1 121,3 122,0 99,5 121,3 122,2 99,3 121,3 121,8 99,6
Sulawesi Tengah 116,2 123,0 94,5 117,3 123,3 95,1 117,7 123,6 95,3 117,3 124,2 94,5 118,0 124,5 94,8 120,4 125,2 96,2 120,9 124,5 97,1
Sulawesi Selatan 116,6 120,0 97,2 117,8 120,4 97,8 118,3 120,5 98,2 118,1 121,8 96,9 119,2 122,8 97,1 119,7 122,9 97,4 119,7 122,9 97,4
Sulawesi Tenggara 113,9 120,2 94,8 115,5 120,7 95,7 116,8 120,7 96,7 116,8 121,6 96,1 116,8 121,6 96,1 117,0 122,1 95,9 116,0 122,5 94,7
Gorontalo 113,0 120,8 93,5 115,4 119,8 96,3 114,8 119,1 96,4 114,4 119,2 96,0 114,4 119,2 95,9 113,0 119,5 94,6 113,4 119,5 94,9
Sulawesi Barat 134,2 123,3 108,8 135,6 123,0 110,3 135,4 123,4 109,7 136,3 124,0 110,0 138,6 124,5 111,4 138,2 124,4 111,1 138,8 124,3 111,7
Maluku 108,3 118,1 91,7 108,7 118,4 91,9 108,0 119,3 90,5 108,3 120,4 89,9 107,3 120,6 89,0 108,1 121,3 89,1 108,1 121,6 88,9
Maluku Utara 110,8 113,6 97,5 110,8 113,8 97,3 110,8 114,6 96,6 111,0 115,0 96,6 110,8 115,0 96,3 110,5 115,1 96,0 110,5 115,8 95,4
Papua Barat 130,5 115,2 113,3 129,0 116,0 111,2 130,7 116,4 112,3 131,7 116,7 112,8 131,2 116,7 112,5 132,0 117,0 112,8 131,8 117,3 112,4
Papua 114,2 114,6 99,6 115,4 115,3 100,1 116,7 115,8 100,7 117,5 116,5 100,9 117,5 116,6 100,8 116,3 116,6 99,8 115,3 116,9 98,7
Januari '10
IT IB NTPT
[12] [13]
NTPT
[1]
Provinsi
MENURUT PROVINSI / BY PROVINCE
TABEL : 1.8.4 INDEKS HARGA YANG DITERIMA PETANI (IT), INDEKS HARGA YANG DIBAYAR PETANI (IB) DAN NILAI TUKAR PETANI PETERNAKAN (NTPT) TABLE INDICES OF PRICES RECEI VED BY FARMERS, INDICES OF PRICES PAID BY FARMERS A ND ANIMAL HUSBANDRY FARMERS' TERMS OF TRADE (AFTT)
April '10Oktober '09 November '09
IT IB NTPT
Desember '09
IT IB NTPT
[20][8] [9] [10] [11] [19][18]
IT IBIT NTPTIB
[2] [3] [7][6] [22][21][5][4] [17]
35
[15] [16]
( 2007 = 100 )
Province
Februari '10
IT IB NTPT
[14]
Maret '10
IT IB NTPT
https:
//www.b
ps.go.id

INDEKS HARGAPRICE INDICES
NTN NTN NTN NTN NTN NTN NTN
Nangroe Aceh Darussalam 117,6 118,2 99,5 118,0 118,8 99,4 117,9 118,6 99,4 119,5 119,2 100,2 120,2 119,4 100,7 119,9 118,9 100,9 120,3 118,9 101,2
Sumatera Utara 119,3 118,9 100,3 118,3 117,9 100,3 118,8 118,3 100,5 119,4 118,8 100,5 118,5 118,7 99,9 118,4 118,4 100,0 119,2 119,1 100,1
Sumatera Barat 140,5 122,7 114,5 141,1 121,8 115,9 138,8 121,4 114,3 138,2 122,5 112,9 138,7 123,1 112,6 139,9 123,0 113,8 139,7 123,1 113,5
Riau 108,0 116,5 92,7 108,4 116,0 93,4 107,9 115,9 93,1 108,0 115,5 93,5 108,3 115,8 93,6 108,5 116,0 93,5 108,7 116,1 93,6
Jambi 106,7 116,5 91,6 106,7 115,7 92,2 107,6 115,7 92,9 107,7 117,2 91,9 107,6 117,7 91,3 107,9 117,6 91,7 107,9 117,5 91,8
Sumatera Selatan 134,3 117,3 114,5 134,6 117,4 114,7 134,6 117,1 114,9 134,5 118,7 113,3 135,1 119,4 113,1 135,1 118,9 113,6 135,4 118,9 113,8
Bengkulu 135,9 122,0 111,4 138,4 122,3 113,2 137,2 122,1 112,3 137,7 122,9 112,0 138,3 123,4 112,1 138,4 123,2 112,4 138,4 123,0 112,5
Lampung 132,6 115,1 115,3 134,0 115,2 116,4 133,2 115,6 115,3 133,4 116,1 114,9 134,3 116,8 114,9 134,4 116,8 115,1 134,9 116,5 115,8
Kep.Bangka Belitung 93,2 106,1 87,9 94,2 106,4 88,5 94,6 106,3 89,0 94,9 107,3 88,5 94,5 107,2 88,1 93,8 107,1 87,6 93,5 107,2 87,3
Kepulauan Riau 121,1 112,6 107,5 121,1 113,7 106,5 120,9 113,8 106,3 121,7 115,2 105,6 123,9 115,3 107,4 122,9 115,5 106,4 122,0 115,9 105,3
Jawa Barat 134,4 122,8 109,5 134,2 122,7 109,4 133,3 122,8 108,5 133,3 123,6 107,8 135,4 124,4 108,8 136,3 124,6 109,4 137,2 125,0 109,8
Jawa Tengah 129,0 119,5 107,9 128,4 119,0 107,9 129,3 119,5 108,1 130,6 120,7 108,2 132,7 121,1 109,5 131,5 120,9 108,7 132,1 121,0 109,2
DI. Yogyakarta 126,3 113,8 111,0 126,6 113,7 111,3 128,1 114,1 112,2 128,7 114,6 112,3 127,9 114,7 111,5 128,3 114,7 111,8 129,0 114,6 112,6
Jawa Timur 121,9 119,5 102,0 120,4 119,3 100,9 121,2 120,3 100,7 123,0 121,6 101,1 123,2 122,2 100,8 123,4 122,0 101,1 123,2 122,5 100,6
Banten 125,5 127,1 98,7 124,4 126,1 98,7 123,1 127,2 96,8 124,0 127,8 97,1 123,8 128,3 96,5 123,3 128,1 96,2 123,6 128,1 96,5
Bali 112,3 121,2 92,6 111,3 119,7 93,0 112,1 120,1 93,4 112,6 121,1 93,0 113,1 121,9 92,8 113,4 122,2 92,8 113,6 122,3 92,9
Nusa Tanggara Barat 116,4 121,4 95,8 116,1 121,5 95,6 116,0 121,3 95,6 116,3 123,0 94,6 115,3 123,0 93,7 115,4 122,7 94,0 115,5 122,8 94,1
Nusa Tenggara Timur 152,6 121,0 126,2 151,5 121,4 124,8 151,4 121,9 124,2 151,1 123,3 122,5 151,3 124,1 121,9 152,3 124,4 122,4 152,1 125,3 121,4
Kalimantan Barat 124,5 115,2 108,0 124,2 115,4 107,6 125,4 115,9 108,2 126,1 116,4 108,3 126,9 116,7 108,8 126,3 117,1 107,9 126,1 117,5 107,4
Kalimantan Tengah 120,5 114,4 105,3 121,1 114,3 105,9 118,9 114,3 104,0 120,8 115,1 104,9 122,0 115,4 105,7 122,1 115,7 105,6 123,8 116,4 106,4
Kalimantan Selatan 104,7 114,6 91,4 104,4 114,4 91,3 103,0 114,6 89,8 103,2 115,8 89,1 103,6 115,6 89,6 104,0 115,8 89,8 103,9 116,3 89,4
Kalimantan Timur 108,4 118,7 91,3 108,4 118,5 91,5 109,3 118,3 92,4 109,7 118,4 92,7 110,4 118,8 92,9 110,5 118,7 93,0 110,5 118,9 92,9
Sulawesi Utara 113,2 118,5 95,5 113,2 118,8 95,3 114,4 118,8 96,3 115,5 119,3 96,8 116,2 120,0 96,8 116,7 120,4 96,9 116,9 120,2 97,2
Sulawesi Tengah 135,1 120,9 111,7 135,7 121,0 112,1 137,4 121,4 113,2 139,0 121,8 114,1 137,1 122,2 112,2 137,9 122,5 112,6 137,7 122,2 112,7
Sulawesi Selatan 134,4 120,0 111,9 135,6 119,6 113,4 135,6 119,7 113,3 135,7 121,0 112,1 136,4 122,0 111,8 137,1 122,5 111,9 137,1 122,5 111,9
Sulawesi Tenggara 122,0 118,4 103,0 122,9 118,8 103,4 122,6 118,6 103,4 124,0 119,5 103,8 127,2 119,2 106,6 127,1 119,2 106,7 127,6 119,3 106,9
Gorontalo 128,6 119,5 107,7 127,7 118,5 107,8 127,6 117,2 108,9 126,3 117,5 107,5 127,2 117,9 107,9 127,0 117,2 108,4 126,8 117,3 108,1
Sulawesi Barat 130,0 119,6 108,7 130,1 119,3 109,1 129,3 120,2 107,6 128,6 120,9 106,4 129,9 121,6 106,9 129,3 121,2 106,7 129,6 121,2 106,9
Maluku 151,5 120,1 126,1 152,3 119,9 127,0 151,4 121,2 124,9 151,6 122,2 124,1 151,9 122,9 123,6 151,6 123,7 122,5 153,2 123,3 124,2
Maluku Utara 115,2 122,0 94,4 114,3 122,2 93,6 114,2 123,0 92,8 114,6 123,5 92,8 115,2 123,7 93,2 115,8 123,7 93,6 115,5 124,4 92,9
Papua Barat 137,2 120,2 114,1 137,9 121,0 113,9 137,9 121,2 113,7 138,9 122,3 113,6 138,8 122,8 113,1 140,0 123,3 113,5 139,7 123,2 113,4
Papua 100,5 117,2 85,8 102,0 117,5 86,8 102,1 118,0 86,5 102,6 118,6 86,5 103,2 118,7 86,9 103,2 118,7 87,0 103,2 118,7 87,0
[11] [12] [13][10]
Desember '09 Januari '10
[1]
IBProvince ITIT IB IT IB IT IB
36
Provinsi Oktober '09 April '10Februari '10
[6] [7] [8] [9]
MENURUT PROVINSI / BY PROVINCE ( 2007 = 100 )
[21] [22][2] [3]
TABEL : 1.8.5 INDEKS HARGA YANG DITERIMA PETANI (IT), INDEKS HARGA YANG DIBAYAR PETANI (IB) DAN NILAI TUKAR NELAYAN (NTN) TABLE INDICES OF PRICES REC EIVED BY FISHERMEN, INDICES OF PRICES PAID BY FISH ERMEN AND FISHERMEN' TERMS OF TRADE (FTT)
[4] [20]
November '09
IT IB
[5]
IT IB
[14] [15] [16]
Maret '10
IT IB
[17] [18] [19]
https:
//www.b
ps.go.id

INDEKS HARGAPRICE INDICES
NTP NTP NTP NTP NTP NTP NTP
Nangroe Aceh Darussalam 121,1 119,9 101,0 122,2 120,1 101,8 122,1 119,9 101,9 123,1 120,4 102,3 124,8 120,9 103,2 125,4 120,5 104,1 126,1 121,1 104,1
Sumatera Utara 124,7 123,9 100,7 124,7 122,5 101,8 126,1 122,6 102,8 126,9 123,5 102,8 126,5 123,4 102,4 126,9 123,2 103,0 127,4 124,0 102,8
Sumatera Barat 127,0 123,3 103,0 128,3 122,2 105,0 128,7 121,8 105,6 130,3 123,1 105,8 131,3 124,0 105,9 131,1 123,5 106,1 131,5 123,8 106,2
Riau 118,0 118,4 99,7 119,5 117,9 101,4 119,8 117,7 101,8 120,0 117,3 102,3 121,0 117,5 103,0 122,2 117,8 103,7 122,7 118,0 104,0
Jambi 111,0 118,5 93,7 111,9 118,1 94,8 111,8 117,9 94,8 112,9 119,2 94,7 113,9 119,7 95,1 115,1 119,8 96,1 116,7 120,1 97,2
Sumatera Selatan 120,3 117,8 102,1 120,1 117,9 101,9 120,7 117,8 102,5 121,5 119,3 101,9 124,1 119,9 103,5 124,3 119,5 104,0 124,7 119,6 104,2
Bengkulu 133,0 126,7 105,0 133,3 127,0 104,9 133,3 127,0 105,0 134,5 127,9 105,2 135,9 128,5 105,8 135,6 128,3 105,7 134,6 128,2 104,9
Lampung 131,3 119,4 110,0 132,8 119,6 111,1 133,1 119,3 111,5 134,0 119,9 111,8 135,0 120,5 112,0 135,2 120,3 112,4 135,9 120,5 112,8
Kep.Bangka Belitung 104,2 109,9 94,8 104,7 110,1 95,1 104,9 110,4 95,0 104,9 111,3 94,2 104,7 111,0 94,3 104,6 110,9 94,3 105,3 111,0 94,9
Kepulauan Riau 116,1 115,8 100,3 116,6 116,7 99,9 116,4 116,6 99,8 116,9 118,0 99,1 117,4 118,1 99,4 117,5 118,3 99,4 117,6 118,7 99,1
Jawa Barat 122,5 124,7 98,2 122,3 124,8 98,0 122,5 125,2 97,8 124,2 126,3 98,3 125,1 127,6 98,0 126,0 127,8 98,6 125,2 128,3 97,5
Jawa Tengah 118,6 119,5 99,2 118,7 119,0 99,8 119,6 119,6 100,0 121,4 120,6 100,6 121,6 121,3 100,2 121,4 121,2 100,2 121,7 121,4 100,3
DI. Yogyakarta 129,5 118,4 109,4 128,7 118,3 108,8 129,4 118,8 108,9 131,7 119,5 110,3 131,7 119,9 109,8 132,7 119,9 110,7 134,1 119,8 112,0
Jawa Timur 122,7 123,5 99,4 122,5 123,2 99,5 123,5 124,4 99,2 124,5 126,0 98,8 124,9 126,8 98,5 124,2 126,3 98,3 124,9 126,7 98,6
Banten 122,5 124,5 98,4 123,6 123,5 100,1 123,5 123,9 99,7 125,0 124,6 100,3 125,5 125,2 100,2 125,1 125,0 100,1 125,5 125,1 100,3
Bali 126,1 121,2 104,0 125,1 120,1 104,1 124,6 120,3 103,6 125,6 121,4 103,4 125,5 122,4 102,6 126,5 122,7 103,1 127,0 122,5 103,7
Nusa Tanggara Barat 119,9 123,6 97,0 119,4 123,6 96,5 119,6 123,7 96,7 121,4 125,5 96,7 120,9 125,8 96,0 120,5 125,4 96,1 121,3 125,5 96,7
Nusa Tenggara Timur 125,7 123,0 102,2 127,5 123,6 103,1 127,9 124,2 103,0 129,0 126,1 102,3 130,4 127,0 102,7 129,9 127,5 101,9 129,9 128,1 101,4
Kalimantan Barat 120,6 118,3 101,9 120,8 118,5 102,0 121,4 119,1 101,9 121,8 119,8 101,6 121,6 120,1 101,2 121,9 120,6 101,1 122,6 120,8 101,5
Kalimantan Tengah 120,1 119,6 100,5 120,3 120,1 100,2 121,0 120,1 100,7 122,4 120,8 101,3 123,4 121,4 101,6 124,2 121,6 102,1 124,6 122,4 101,7
Kalimantan Selatan 123,6 119,3 103,6 124,8 119,4 104,5 125,2 119,6 104,8 125,9 120,7 104,2 127,7 120,8 105,7 128,0 121,1 105,7 129,0 121,8 105,9
Kalimantan Timur 121,3 120,3 100,9 121,1 120,0 100,9 121,5 119,8 101,5 121,4 120,1 101,1 122,4 120,7 101,5 121,9 120,6 101,1 121,2 120,7 100,4
Sulawesi Utara 121,9 119,9 101,7 122,2 120,2 101,7 122,4 120,2 101,9 122,8 120,7 101,8 122,4 121,4 100,8 122,9 121,7 101,0 122,5 121,5 100,8
Sulawesi Tengah 123,4 125,5 98,3 123,6 125,9 98,1 124,9 126,3 98,9 124,6 126,9 98,2 123,3 127,1 97,0 123,1 127,3 96,7 122,9 126,6 97,1
Sulawesi Selatan 126,9 123,6 102,6 126,6 124,0 102,0 126,4 123,9 102,0 127,1 125,5 101,3 127,9 126,4 101,2 128,8 126,6 101,7 127,7 126,6 100,8
Sulawesi Tenggara 132,6 120,8 109,7 133,3 121,5 109,7 133,4 121,4 109,9 134,2 122,3 109,7 134,8 122,2 110,3 134,9 122,3 110,3 133,9 122,5 109,4
Gorontalo 118,9 119,8 99,2 119,3 118,8 100,4 118,9 118,0 100,7 118,3 118,2 100,1 118,7 118,2 100,4 118,9 118,1 100,7 119,0 118,4 100,5
Sulawesi Barat 132,0 123,6 106,8 132,5 123,3 107,5 132,3 123,9 106,8 131,9 124,6 105,8 132,7 125,2 106,0 132,8 125,2 106,1 132,1 125,0 105,7
Maluku 127,9 121,6 105,2 128,0 121,6 105,3 127,8 122,8 104,1 128,3 123,8 103,7 128,3 124,4 103,1 128,3 125,1 102,6 129,9 125,0 103,9
Maluku Utara 122,3 122,1 100,2 122,1 122,4 99,8 122,7 123,3 99,5 122,7 123,8 99,1 122,6 124,2 98,7 122,5 124,4 98,5 122,1 125,1 97,6
Papua Barat 126,9 119,8 105,9 126,5 120,8 104,7 127,0 121,0 105,0 127,2 121,7 104,5 127,1 122,1 104,1 127,8 122,6 104,2 127,7 122,8 104,0
Papua 121,9 120,5 101,2 123,6 121,0 102,2 124,4 121,5 102,4 125,1 122,2 102,4 125,8 122,6 102,6 125,7 122,5 102,6 125,7 122,8 102,4
Januari '10
[1]
ProvinceProvinsi April '10Oktober '09
IT
November '09
IT IB
Februari '10Desember '09
IT IBIT IB
[8] [9] [10]
IB
[11] [12] [13][3] [4][2]
MENURUT PROVINSI / BY PROVINCE ( 2007 = 100 )
[22][20] [21]
IB IT
[5] [6] [7]
TABEL : 1.8.6 INDEKS HARGA YANG DITERIMA PETANI (IT), INDEKS HARGA YANG DIBAYAR PETANI (IB) DAN NILAI TUKAR PETANI (NTP) TABLE INDICES OF PRICES RECEI VED BY FARMERS, INDICES OF PRICES PAID BY FARMERS A ND FARMERS' TERMS OF TRADE (FTT)
37
[14] [15] [16]
IT IB
Maret '10
IT IB
[17] [18] [19]
https:
//www.b
ps.go.id

INDEKS HARGAPRICE INDICES
TABEL 1.9 INDEKS HARGA PERDAGANGAN BESAR SEKTOR PERTANIAN, PERTAMBANGAN DAN PENGGALIAN TABLE WHOLESALE PRICE INDICES OF AGRICULTURAL, MINING AND QUARRYING SECTORS
A. PERTANIAN / AGRICULTURE
1. Tanaman pangan / Food crops (10) 139 150 175 223 282 217 208 227 231 232
2. Tanaman perkebunan / Estate crops (12) 143 158 176 226 297 182 173 203 212 212
3. Peternakan dan hasilnya / Livestock and by products (9) 129 135 153 180 249 227 223 236 240 240
4. Perkayuan & hasil-hasil hutan / Forest woods & by products (3) 119 134 180 216 243 148 149 149 152 152
5. Perikanan / Fishery (3) 146 154 173 210 276 218 211 227 228 228
Indeks umum sektor pertanian 137 148 172 214 275 209 202 220 224 225
General index of agricultural sector (37)
B. PERTAMBANGAN DAN PENGGALIAN
MINING AND QUARRYING
1. Pertambangan / Mining (1) 126 132 142 148 165 202 209 198 198 198
2. Penggalian / Quarrying (5) 149 171 211 251 317 208 205 213 215 215
3. Garam / Salt (1) 113 120 158 184 272 257 251 265 271 270
Indeks umum sektor pertambangan dan penggalian 135 147 169 187 223 206 207 209 211 211
General index of mining and quarrying sector (7)Catatan : Note :
Angka dalam tanda kurung ( ) pada kolom subsektor menunjukkan Figure within brackets ( ) under subsector column indicate
banyaknya jenis barang yang mewakili di dalamnya number of items represented in that subsector1) IHPB 2004-2008 menggunakan tahun dasar 2000 (2000=100), mulai 1) Wholesale price indices in 2004-2008 using 2000 as base year (2000=100),
2009 IHPB menggunakan tahun dasar 2005 (2005=100) starting 2009 wholesale price indices using 2005 as base year (2005=100)
Tahun / Year
2009
[7]
Des Mar
[4] [5]
2010
2006 2007Subsektor / subsector
2009
[9][6]
2008
[11][8]
Apr Apr
[10]
2004 2005
[2] [3][1]
38
( 2005 = 100 ) 1)
https:
//www.b
ps.go.id

INDEKS HARGAPRICE INDICES
TABEL 1.10 INDEKS HARGA PERDAGANGAN BESAR SEKTOR INDUSTRI TABLE WHOLESALE PRICE INDICES OF MANUFACTURED SECTOR
1. Industri pengolahan dan pengawetan daging, ikan, & minyak makan/ 135 139 153 196 264 185 185 186 190 190
Processed and preserved meat, fish, and food oil industry (14)
2. Industri susu dan makanan dari susu/ 119 128 143 173 220 181 180 182 185 185
Milk products and by industry (5)
3. Industri penggilingan padi & biji-bijian, tepung, makanan hewan / 119 135 162 190 222 168 167 171 183 180
Ground sheed, flour, fodder industry (8)
4. Industri makanan lainnya/ 124 135 156 178 221 174 172 180 183 182
Others food industry (17)
5. Industri minuman dan pengolahan tembakau/ 148 155 173 200 227 156 155 161 165 166
Beverages and tobacco processing industry (7)
6. Industri pemintalan, pertenunan tekstil dan lainnya/ 106 112 123 140 170 134 134 137 140 140
Miling, woven textile and other industry (6)
7. Industri pakaian jadi, barang dari kulit dan alas kaki / 121 133 152 160 182 157 156 160 161 161
Clothing, goods of leather and foot wear industry (12)
8. Industri kayu gergajian dan olahan / 124 144 185 236 288 190 189 191 192 193
Sawn wood and processed wood industry (3)
9 Industri bahan bangunan dari kayu dan barang-barang anyaman/ - - - - - 253 247 262 266 266Construction material of woods and plaited industry (2)
10 Industri kertas, barang dari kertas, dan barang cetakan / 124 134 156 171 203 154 152 156 157 158
Paper, paper products and printed goods industry (9)
11 Industri pengilangan minyak bumi / 278 439 702 716 936 201 198 207 209 209
Oil refinery products industry ( 10)
Catatan : Note :
Angka dalam tanda kurung ( ) pada kolom subsektor menunjukkan Figure within brackets ( ) under subsector column indicate
banyaknya jenis barang yang mewakili di dalamnya number of items represented in that subsector1) IHPB 2004-2008 menggunakan tahun dasar 2000 (2000=100), mulai 1) Wholesale price indices in 2004-2008 using 2000 as base year (2000=100),
2009 IHPB menggunakan tahun dasar 2005 (2005=100) starting 2009 wholesale price indices using 2005 as base year (2005=100)
2010
[9]
Tahun / Year
[11]
2009 AprMar
[10][7][6]
20062005
[2] [3] [4] [5]
2007
39
Subsektor / subsector
[8]
DesApr 2004
2009
2008
( 2005 = 100 ) 1)
[1]
https:
//www.b
ps.go.id

INDEKS HARGAPRICE INDICES
TABEL 1.10 INDEKS HARGA PERDAGANGAN BESAR SEKTOR INDUSTRI TABLE WHOLESALE PRICE INDICES OF MANUFACTURED SECTOR
12 Industri bahan kimia dan barang-barang dari bahan kimia / 118 128 151 168 214 169 168 168 169 171
Chemical industry and by products (19)
13 Industri karet, plastik dan hasil-hasilnya / 127 141 171 190 238 185 182 192 196 198
Rubber and plastics goods industry (9)
14 Industri barang galian bukan logam / 124 139 166 179 219 172 171 174 175 175
Non metallic mineral industry (12)
15 Industri logam dasar / Basic metal industry (10) 172 200 201 219 302 161 160 162 161 163
16 Industri peralatan dan bahan bangunan siap pasang dari logam dan lainnya / 142 174 197 223 302 182 180 183 183 184
Tools and construction material of metal industry and others (8)
17 Industri mesin pembangkit, motor listrik dan lainnya/ - - - - - 120 119 121 123 123Generator, electrical motor and other industry (3)
18 Alat-alat berat dan mesin-mesin industri / 113 122 131 138 153 133 133 134 134 134
Heavy tools & industrial machines (2)
19 Industri perlengkapan listrik, barang elektronik dan komunikasi / 119 127 146 171 213 148 146 149 149 149
Electrical tools, electronics & communications goods industry (10)
20 Industri alat-alat angkutan / 118 127 140 153 169 137 136 139 141 141
Transport equipment industry (6)
21 Industri furnitur dari kayu dan rotan / 139 158 184 220 287 205 202 210 212 212
Wooden and Rattan furniture industry (2)
22 Industri lainnya / Others industry (2) - - - - - 131 129 134 135 134
Indeks umum / General index (176) 136 158 195 218 273 165 163 168 170 170
Catatan : Note :
Angka dalam tanda kurung ( ) pada kolom subsektor menunjukkan Figure within brackets ( ) under subsector column indicate
banyaknya jenis barang yang mewakili di dalamnya number of items represented in that subsector1) IHPB 2004-2008 menggunakan tahun dasar 2000 (2000=100), mulai 1) Wholesale price indices in 2004-2008 using 2000 as base year (2000=100),
2009 IHPB menggunakan tahun dasar 2005 (2005=100) starting 2009 wholesale price indices using 2005 as base year (2005=100)
Mar
[10]
2010
Apr
( 2005 = 100 ) 1)
40
2004 2005
Tahun / Year
[9][2] [3] [11][4] [5] [7]
Subsektor / subsector
[1]
(Lanjutan / Continuation )
2006 2007
[6] [8]
2009
2009
Apr 2008 Des
https:
//www.b
ps.go.id
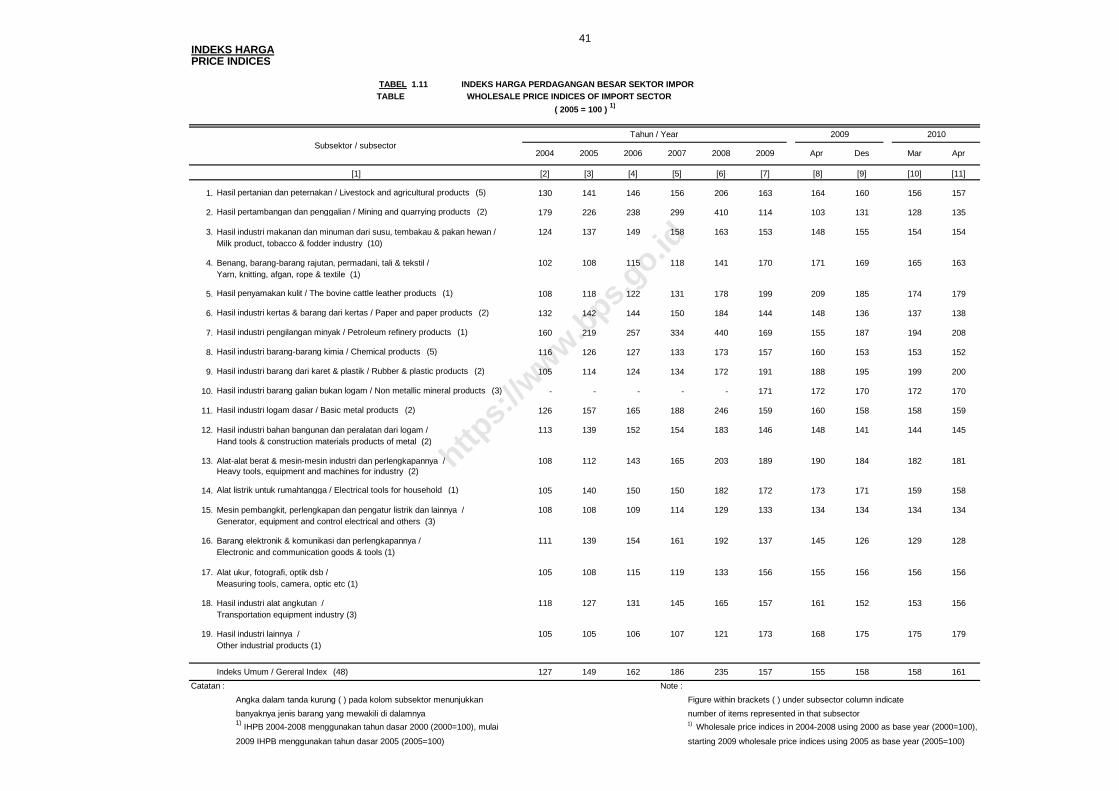
INDEKS HARGAPRICE INDICES
TABEL 1.11 INDEKS HARGA PERDAGANGAN BESAR SEKTOR IMPOR TABLE WHOLESALE PRICE INDICES OF IMPORT SECTOR
1. Hasil pertanian dan peternakan / Livestock and agricultural products (5) 130 141 146 156 206 163 164 160 156 157
2. Hasil pertambangan dan penggalian / Mining and quarrying products (2) 179 226 238 299 410 114 103 131 128 135
3. Hasil industri makanan dan minuman dari susu, tembakau & pakan hewan / 124 137 149 158 163 153 148 155 154 154Milk product, tobacco & fodder industry (10)
4. Benang, barang-barang rajutan, permadani, tali & tekstil / 102 108 115 118 141 170 171 169 165 163Yarn, knitting, afgan, rope & textile (1)
5. Hasil penyamakan kulit / The bovine cattle leather products (1) 108 118 122 131 178 199 209 185 174 179
6. Hasil industri kertas & barang dari kertas / Paper and paper products (2) 132 142 144 150 184 144 148 136 137 138
7. Hasil industri pengilangan minyak / Petroleum refinery products (1) 160 219 257 334 440 169 155 187 194 208
8. Hasil industri barang-barang kimia / Chemical products (5) 116 126 127 133 173 157 160 153 153 152
9. Hasil industri barang dari karet & plastik / Rubber & plastic products (2) 105 114 124 134 172 191 188 195 199 200
10. Hasil industri barang galian bukan logam / Non metallic mineral products (3) - - - - - 171 172 170 172 170
11. Hasil industri logam dasar / Basic metal products (2) 126 157 165 188 246 159 160 158 158 159
12. Hasil industri bahan bangunan dan peralatan dari logam / 113 139 152 154 183 146 148 141 144 145Hand tools & construction materials products of metal (2)
13. Alat-alat berat & mesin-mesin industri dan perlengkapannya / 108 112 143 165 203 189 190 184 182 181Heavy tools, equipment and machines for industry (2)
14. Alat listrik untuk rumahtangga / Electrical tools for household (1) 105 140 150 150 182 172 173 171 159 158
15. Mesin pembangkit, perlengkapan dan pengatur listrik dan lainnya / 108 108 109 114 129 133 134 134 134 134Generator, equipment and control electrical and others (3)
16. Barang elektronik & komunikasi dan perlengkapannya / 111 139 154 161 192 137 145 126 129 128Electronic and communication goods & tools (1)
17. Alat ukur, fotografi, optik dsb / 105 108 115 119 133 156 155 156 156 156Measuring tools, camera, optic etc (1)
18. Hasil industri alat angkutan / 118 127 131 145 165 157 161 152 153 156Transportation equipment industry (3)
19. Hasil industri lainnya / 105 105 106 107 121 173 168 175 175 179Other industrial products (1)
Indeks Umum / Gereral Index (48) 127 149 162 186 235 157 155 158 158 161
Catatan : Note :
Angka dalam tanda kurung ( ) pada kolom subsektor menunjukkan Figure within brackets ( ) under subsector column indicate
banyaknya jenis barang yang mewakili di dalamnya number of items represented in that subsector1) IHPB 2004-2008 menggunakan tahun dasar 2000 (2000=100), mulai 1) Wholesale price indices in 2004-2008 using 2000 as base year (2000=100),
2009 IHPB menggunakan tahun dasar 2005 (2005=100) starting 2009 wholesale price indices using 2005 as base year (2005=100)
2010
[2]
Tahun / Year
2009
[7]
Mar
[3] [9] [10] [11][4] [5]
2007
41
2004Subsektor / subsector
[8][6]
( 2005 = 100 ) 1)
2008 Apr Des
2009
20062005 Apr
[1]
https:
//www.b
ps.go.id

https:
//www.b
ps.go.id

INDEKS HARGAPRICE INDICES
TABEL 1.12 INDEKS HARGA PERDAGANGAN BESAR SEKTOR EKSPOR TABLE WHOLESALE PRICE INDICES OF EXPORT SECTOR
1. Hasil tanaman perkebunan / Estate crops products (4) 140 143 146 162 204 154 155 155 152 151
2. Kayu dan hasil hutan lainnya / Forest wood and by products (1) - - - - - 179 195 163 163 163
3. Hasil perikanan / Fishing products (1) 135 142 166 174 192 147 153 143 141 144
4. Hasil pertambangan dan penggalian / Mining and quarrying products (5) 128 177 202 223 291 135 129 144 144 150
5. Hasil industri minyak nabati, pengolahan dan pengawetan ikan dan lainnya / 115 122 121 152 176 132 135 136 140 143Processed and preserved fish, vegetable oils and other products (3)
6. Hasil industri rokok / Cigarettes products (1) - - - - - 92 96 83 80 80
7. Hasil industri tekstil, pakaian jadi, alas kaki dan lainnya / 117 127 132 139 154 129 134 126 130 132Textile, clothing, footwear and other products (4)
8. Hasil industri barang-barang dari kayu, bambu, & rotan / 117 133 143 155 172 137 144 126 126 125Wood, bamboo, rattan, and by products (3)
9. Hasil industri kertas dan barang dari kertas / Papers and paper products (3) 103 114 108 121 146 146 151 135 137 139
10. Hasil industri pengilangan minyak / Petroleum refinery products (1) 167 225 237 247 359 99 89 117 109 114
11. Hasil industri kimia & barang-barang dari bahan kimia / 105 118 116 131 157 168 159 172 170 170Chemical industry and by products (4)
12. Hasil industri karet, plastik & hasil-hasilnya / 111 126 120 126 164 125 125 123 125 127Rubber, plastics and by products (3)
Catatan : Note :
Angka dalam tanda kurung ( ) pada kolom subsektor menunjukkan Figure within brackets ( ) under subsector column indicate
banyaknya jenis barang yang mewakili di dalamnya number of items represented in that subsector1) IHPB 2004-2008 menggunakan tahun dasar 2000 (2000=100), mulai 1) Wholesale price indices in 2004-2008 using 2000 as base year (2000=100),
2009 IHPB menggunakan tahun dasar 2005 (2005=100) starting 2009 wholesale price indices using 2005 as base year (2005=100)
Mar
[10]
2010
[11]
42
( 2005 = 100 ) 1)
Subsektor / subsectorTahun / Year
2009 Apr
[9]
2008 Des
2009
2004 2005 2006 2007 Apr
[7][1] [2] [3] [4] [5] [6] [8]
https:
//www.b
ps.go.id

INDEKS HARGAPRICE INDICES
TABEL 1.12 INDEKS HARGA PERDAGANGAN BESAR SEKTOR EKSPOR TABLE WHOLESALE PRICE INDICES OF EXPORT SECTOR
13. Hasil industri kaca dan barang-barang dari kaca / Glass and by products (1) 132 153 164 170 203 144 146 143 146 144
14. Hasil industri semen / Cement products (1) - - - - - 163 166 152 163 161
15. Hasil industri logam dasar / Basic mettalic products (2) 113 145 177 234 323 151 155 137 135 135
16. Hasil industri peralatan dan bahan bangunan dari logam / 101 114 109 115 139 188 196 174 177 177Equipment and construction material of metal (1)
17. Hasil industri mesin-mesin dan perlengkapannya / 102 112 105 109 122 126 135 112 115 114Machines and spare parts products (1)
18. Mesin pembangkit listrik dan pengatur listrik / - - - - - 126 132 118 123 124Generator and electronical control (1)
19. Hasil industri barang elektronik, komunikasi dan perlengkapan listrik dan lainnya / 102 115 117 124 142 138 145 127 131 133Electronic and communication goods and tools and other products (3)
20. Hasil industri alat ukur, fotografi, optik, dan lainnya / 113 115 119 131 145 154 153 156 156 156Measuring tools, camera, optic, and others products (1)
21. Hasil industri kendaraan bermotor dan suku cadang / 120 127 141 149 162 158 163 160 154 152Motor vehicle and spare parts producst (1)
22. Hasil industri lainnya / Other industrial products (1) 104 114 109 111 120 132 134 127 123 117
Indeks umum / General index (46) 121 145 154 167 209 134 134 135 135 138
Indeks umum tanpa minyak bumi dan gasGeneral index excl. petroleum & gas (44)Indeks umum minyak bumi & gas /General index of petroleum and gas (2)
Catatan : Note :
Angka dalam tanda kurung ( ) pada kolom subsektor menunjukkan Figure within brackets ( ) under subsector column indicate
banyaknya jenis barang yang mewakili di dalamnya number of items represented in that subsector1) IHPB 2004-2008 menggunakan tahun dasar 2000 (2000=100), mulai 1) Wholesale price indices in 2004-2008 using 2000 as base year (2000=100),
2009 IHPB menggunakan tahun dasar 2005 (2005=100) starting 2009 wholesale price indices using 2005 as base year (2005=100)
[10]
139
121
2010
Apr
[11]
Tahun / Year
[7]
142
108 12995241
166125112 143
345
138 140146
125
[2] [3] [9][4] [5]
MarDes2004 2005 2006 2007
[6] [8]
Apr
130
149 210 229
Subsektor / subsector
[1]
2008 2009
43
( 2005 = 100 ) 1)
(Lanjutan / Continuation)
2009
https:
//www.b
ps.go.id

INDEKS HARGAPRICE INDICES
TABEL 1.13 INDEKS HARGA PERDAGANGAN BESAR INDONESIA TABLE WHOLESALE PRICE INDICES OF INDONESIA
1. Pertanian/Agriculture (37) 137 148 172 214 275 209 202 220 224 225
2. Pertambangan & Penggalian 135 147 169 187 223 206 207 209 211 211Mining & Quarrying (7)
3. Industri/Manufacturing (176) 136 158 195 218 273 165 163 168 170 170
4. Impor/Imports (48) 127 149 162 186 235 157 155 158 158 161
5. a. Ekspor seluruhnya/ Total exports (46) 121 145 154 167 209 134 134 135 135 138
b. Ekspor tanpa minyak bumi & Gas 112 125 130 143 166 142 146 138 139 140Exports excluding petr.& Gas (44)
c. Ekspor minyak bumi & Gas 149 210 229 241 345 108 95 125 121 129Exports of petroleum & Gas (2)
Indeks Umum/General Index (314) 131 151 172 195 246 163 161 166 168 169
Indeks Umum tanpa ekspor minyakbumi & Gas/General Index excl. 129 147 167 192 238 166 165 168 170 171exports of petr.& Gas (312)
Indeks Umum tanpa Sektor EksporGeneral Index excl. exports (268)
Indeks Umum tanpa Sektor ImporGeneral Index excl. Imports (266)
Indeks Umum tanpa Impor & tanpaEkspor Minyak Bumi & Gas/Gen.Index 130 147 169 193 239 168 167 171 173 173excl.Imports & excl.Exp.of Petr. & Gas (264)
Indeks Umum tanpa Sektor Impor& Ekspor / General Index excl. 136 155 186 215 271 175 173 180 183 183Imports & Exports (220)
Catatan : Note :
Angka dalam tanda kurung ( ) pada kolom subsektor menunjukkan Figure within brackets ( ) under subsector column indicate
banyaknya jenis barang yang mewakili di dalamnya number of items represented in that subsector1) IHPB 2004-2008 menggunakan tahun dasar 2000 (2000=100), mulai 1) Wholesale price indices in 2004-2008 using 2000 as base year (2000=100),
2009 IHPB menggunakan tahun dasar 2005 (2005=100) starting 2009 wholesale price indices using 2005 as base year (2005=100)
[10]
177
170
Tahun / Year
152 174 197 248
261
162131
134 154 179 207
164
2009
167
169
171
175 178
2009
( 2005 = 100 ) 1)
171
[11]
Apr
[8][7]
Mar
2010
Des
[9][3] [4] [5] [6]
2004 2005 2007 2008 Apr 2006
[2][1]
Subsektor / subsector
44
https:
//www.b
ps.go.id

INDEKS HARGAPRICE INDICES
TABEL 1.14 INDEKS HARGA PERDAGANGAN BESAR BAHAN BANGUNAN/KONSTRUKSI MENURUT JENIS KONSTRUKSI/BANGUNAN
TABLE WHOLESALE PRICE INDICES OF CONSTRUCTION MATERIALS BY TYPE OF CONSTRUCTION
1. Bangunan Tempat Tinggal dan Bukan Tempat Tinggal / 135 158 192 219 269 182 180 183 184 185
Residential and non residential buildings (24)
2. Pekerjaan Umum untuk Pertanian / Public works in agriculture (23) 143 170 216 241 298 196 194 199 200 201
3. Pekerjaan Umum untuk Jalan, jembatan dan Pelabuhan / 148 176 222 251 317 194 192 196 197 198
Public works on roads, bridges and ports (24)
4. Bangunan dan Instalasi Listrik, Gas, Air Minum dan Komunikasi / 129 152 182 204 254 177 176 179 180 181
Construction of electricity, gas, drinking water and communication (25)
5. Bangunan Lainnya / Other buildings (25) 139 165 202 230 284 187 185 189 190 191
Umum / General (25) 140 166 205 232 289 186 185 189 190 191
Catatan : Note :
Angka dalam tanda kurung ( ) pada kolom subsektor menunjukkan Figure within brackets ( ) under subsector column indicate
banyaknya jenis barang yang mewakili di dalamnya number of items represented in that subsector1) IHPB 2004-2008 menggunakan tahun dasar 2000 (2000=100), mulai 1) Wholesale price indices in 2004-2008 using 2000 as base year (2000=100),
2009 IHPB menggunakan tahun dasar 2005 (2005=100) starting 2009 wholesale price indices using 2005 as base year (2005=100)
Mar
2010
Apr2009
[7]
( 2005 = 100 ) 1)
[10] [11]
45
Tahun / Year
2008 Apr
2009
2007Jenis Bangunan / Type of Construction
[5] [8] [9]
2004 2005 2006
[2] [3] [4] [6]
Des
[1]
https:
//www.b
ps.go.id

INDEKS HARGAPRICE INDICES
Kelompok Jenis Barang / Group of Commodities
1. Kayu Gelondongan / Log Wood (1) 120 135 184 220 245 208 206 213 215 215
2. Barang Galian Segala Jenis / All Kind Quarrying Product (4) 151 174 214 226 324 215 213 221 222 223
3. Kayu Gergajian dan Awetan / Sawn Wood & Preserved Woods (1) 127 152 201 276 364 283 281 287 291 291
4. Kayu Lapis dan Sejenisnya / Plywood etc. (1) 121 136 166 191 203 149 150 149 149 149
5. Bahan Bangunan dari Kayu / Construction Material of Wood (1) 140 159 196 252 356 266 264 274 277 278
6 Kertas dan Sejenisnya/ Paper etc. (2) - - - - - 171 168 175 175 176
7. Cat, Vernis, dan Lak / Paint, Varnish, Laquers (3) 117 130 147 168 199 168 167 169 170 170
8. Aspal / Asphalt (2) 143 152 234 258 340 276 271 285 286 286
9. Hasil Kilang Minyak Lainnya / Other Oil Refinery Products (4) 233 333 627 633 730 192 191 195 198 199
10. Barang-Barang dari Karet / Rubber Products (1) - - - - - 211 204 216 217 219
11. Barang-barang dari Plastik / Plastic Products (2) 125 130 140 150 180 148 148 149 150 150
Catatan : Note :
Angka dalam tanda kurung ( ) pada kolom subsektor menunjukkan Figure within brackets ( ) under subsector column indicate
banyaknya jenis barang yang mewakili di dalamnya number of items represented in that subsector1) IHPB 2004-2008 menggunakan tahun dasar 2000 (2000=100), mulai 1) Wholesale price indices in 2004-2008 using 2000 as base year (2000=100),
2009 IHPB menggunakan tahun dasar 2005 (2005=100) starting 2009 wholesale price indices using 2005 as base year (2005=100)
[10]
2010
Apr
[11]
2009 Mar
Tahun / Year
Apr Des
2009
( 2005 = 100 ) 1)
[6] [8] [9][1] [2] [7]
46
TABEL 1.15 INDEKS HARGA PERDAGANGAN BESAR BAHAN BANGUNAN/KONSTRUKSI INDONESIA MENURUT KELOMPOK JENIS BARANG
TABLE WHOLESALE PRICE INDICES OF CONSTRUCTION MATERIALS OF INDONESIA BY GROUP OF COMMODITIES
2008
[3] [4] [5]
2004 2005 2006 2007
https:
//www.b
ps.go.id
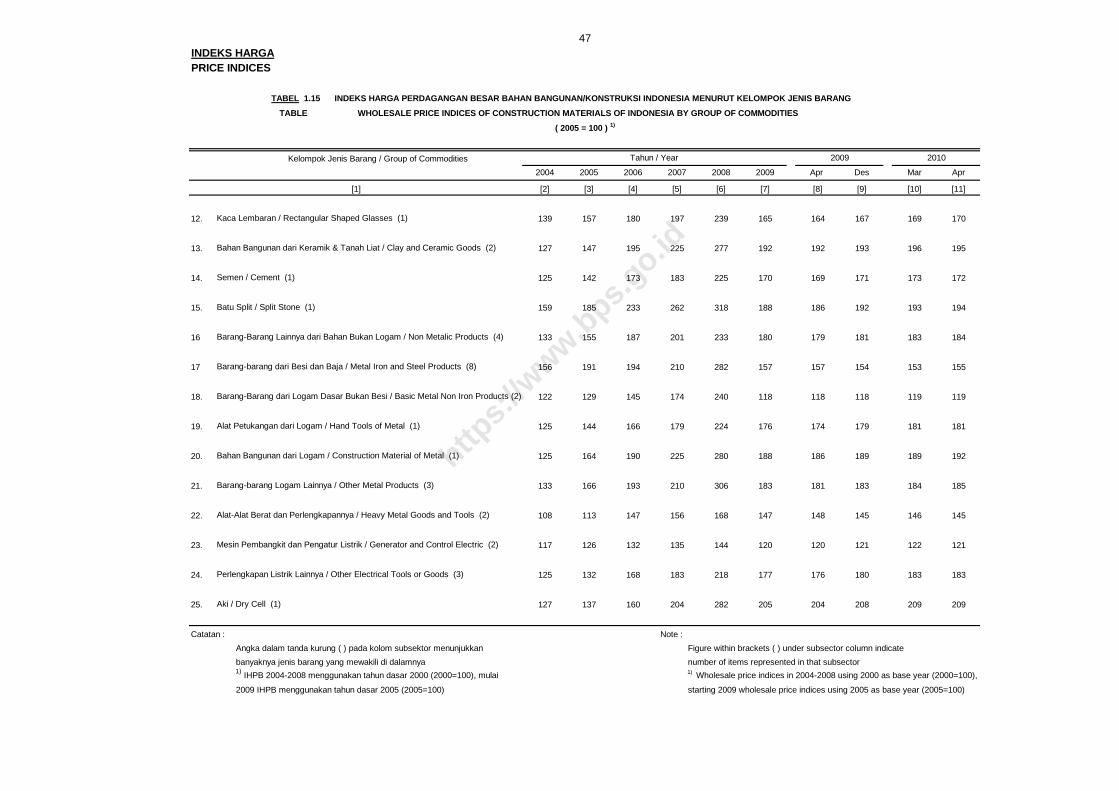
INDEKS HARGAPRICE INDICES
Kelompok Jenis Barang / Group of Commodities
12. Kaca Lembaran / Rectangular Shaped Glasses (1) 139 157 180 197 239 165 164 167 169 170
13. Bahan Bangunan dari Keramik & Tanah Liat / Clay and Ceramic Goods (2) 127 147 195 225 277 192 192 193 196 195
14. Semen / Cement (1) 125 142 173 183 225 170 169 171 173 172
15. Batu Split / Split Stone (1) 159 185 233 262 318 188 186 192 193 194
16 Barang-Barang Lainnya dari Bahan Bukan Logam / Non Metalic Products (4) 133 155 187 201 233 180 179 181 183 184
17 Barang-barang dari Besi dan Baja / Metal Iron and Steel Products (8) 156 191 194 210 282 157 157 154 153 155
18. Barang-Barang dari Logam Dasar Bukan Besi / Basic Metal Non Iron Products (2) 122 129 145 174 240 118 118 118 119 119
19. Alat Petukangan dari Logam / Hand Tools of Metal (1) 125 144 166 179 224 176 174 179 181 181
20. Bahan Bangunan dari Logam / Construction Material of Metal (1) 125 164 190 225 280 188 186 189 189 192
21. Barang-barang Logam Lainnya / Other Metal Products (3) 133 166 193 210 306 183 181 183 184 185
22. Alat-Alat Berat dan Perlengkapannya / Heavy Metal Goods and Tools (2) 108 113 147 156 168 147 148 145 146 145
23. Mesin Pembangkit dan Pengatur Listrik / Generator and Control Electric (2) 117 126 132 135 144 120 120 121 122 121
24. Perlengkapan Listrik Lainnya / Other Electrical Tools or Goods (3) 125 132 168 183 218 177 176 180 183 183
25. Aki / Dry Cell (1) 127 137 160 204 282 205 204 208 209 209
Catatan : Note :
Angka dalam tanda kurung ( ) pada kolom subsektor menunjukkan Figure within brackets ( ) under subsector column indicate
banyaknya jenis barang yang mewakili di dalamnya number of items represented in that subsector1) IHPB 2004-2008 menggunakan tahun dasar 2000 (2000=100), mulai 1) Wholesale price indices in 2004-2008 using 2000 as base year (2000=100),
2009 IHPB menggunakan tahun dasar 2005 (2005=100) starting 2009 wholesale price indices using 2005 as base year (2005=100)
Mar
[10]
2010
[11][7]
Apr 2004 2005 2006 20082007
[8] [9][2]
TABEL 1.15 INDEKS HARGA PERDAGANGAN BESAR BAHAN BANGUNAN/KONSTRUKSI INDONESIA MENURUT KELOMPOK JENIS BARANG
TABLE WHOLESALE PRICE INDICES OF CONSTRUCTION MATERIALS OF INDONESIA BY GROUP OF COMMODITIES
[1] [5] [6][3] [4]
2009
47
Des Apr
( 2005 = 100 ) 1)
Tahun / Year
2009
https:
//www.b
ps.go.id
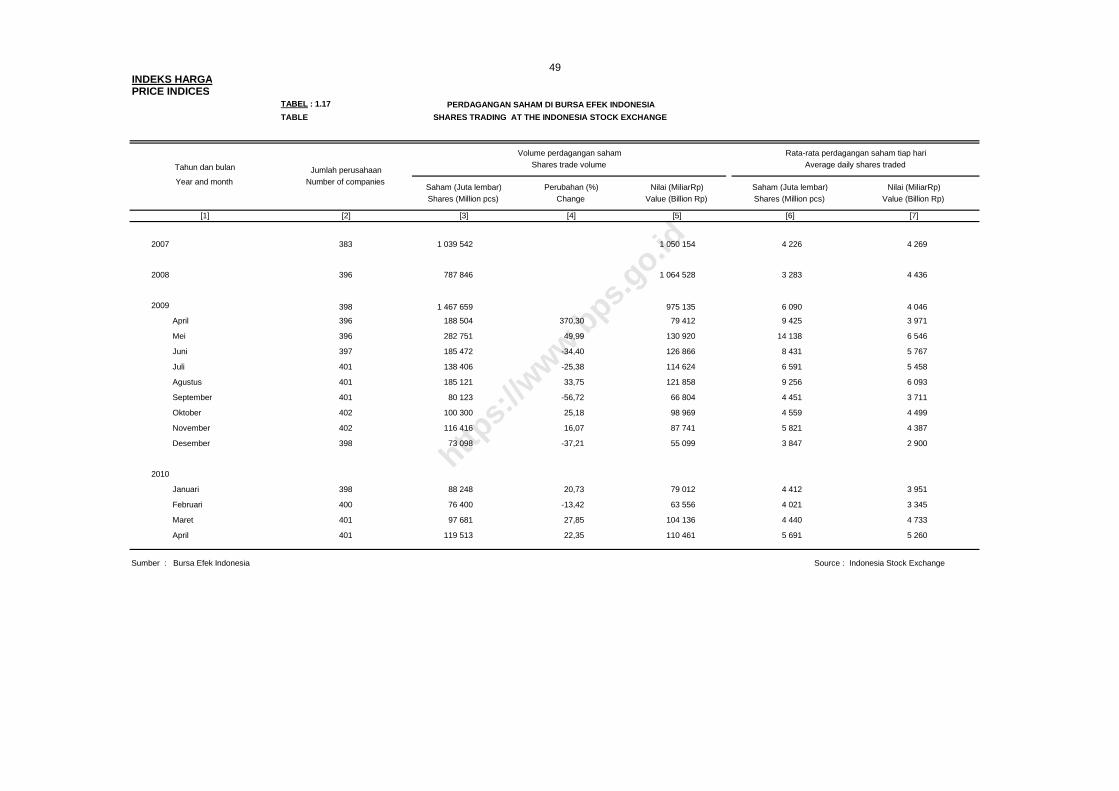
INDEKS HARGAPRICE INDICES
TABEL : 1.17 PERDAGANGAN SAHAM DI BURSA EFEK INDONESIA
TABLE SHARES TRADING AT THE INDONESIA STOCK EXCHANGE
2007 383 1 039 542 1 050 154 4 226 4 269
2008 396 787 846 1 064 528 3 283 4 436
2009 398 1 467 659 975 135 6 090 4 046
April 396 188 504 370,30 79 412 9 425 3 971
Mei 396 282 751 49,99 130 920 14 138 6 546
Juni 397 185 472 -34,40 126 866 8 431 5 767
Juli 401 138 406 -25,38 114 624 6 591 5 458
Agustus 401 185 121 33,75 121 858 9 256 6 093
September 401 80 123 -56,72 66 804 4 451 3 711
Oktober 402 100 300 25,18 98 969 4 559 4 499
November 402 116 416 16,07 87 741 5 821 4 387
Desember 398 73 098 -37,21 55 099 3 847 2 900
2010
Januari 398 88 248 20,73 79 012 4 412 3 951
Februari 400 76 400 -13,42 63 556 4 021 3 345
Maret 401 97 681 27,85 104 136 4 440 4 733
April 401 119 513 22,35 110 461 5 691 5 260
Sumber : Bursa Efek Indonesia Source : Indonesia Stock Exchange
49
Tahun dan bulan Shares trade volume Average daily shares tradedJumlah perusahaan
Volume perdagangan saham Rata-rata perdagangan saham tiap hari
Nilai (MiliarRp) Saham (Juta lembar) Nilai (MiliarRp)Year and month Number of companies
Saham (Juta lembar) Perubahan (%)
[5] [6] [7]
Shares (Million pcs) Change Value (Billion Rp) Shares (Million pcs) Value (Billion Rp)
[1] [2] [3] [4]
https:
//www.b
ps.go.id

KEUANGAN FINANCE
PENJELASAN TEKNIS 1. Statistik Keuangan Pemerintah dibedakan atas a. Keuangan Pemerintah Pusat b. Keuangan Pemerintah Daerah Tk. I c. Keuangan Pemerintah Daerah Tk. II d. Keuangan Pemerintah Desa 2. Pemerintah Pusat meliputi : Departemen, Lembaga dan Badan-badan
yang keuangannya diatur melalui Anggaran Pendapatan dan Belanja Negara (APBN).
3. Pemerintah Daerah (Tk I, Tk II dan Desa) keuangannya disusun dan
diatur berdasarkan penyusunan Anggaran Pendapatan dan Belanja Daerah (APBD).
4. Realisasi penerimaan dan pengeluaran Pemerintah Pusat diperoleh dari
Departemen Keuangan. 5. Penerimaan Dalam Negeri terdiri dari penerimaan minyak bumi dan gas
alam, dan penerimaan diluar minyak bumi. 6. Pajak penghasilan terdiri dari pajak pendapatan, pajak perseroan, MPO
dan pajak atas bunga dividen dan royalti (PBDN). Penggabungan ini berlaku sejak semester I 1984/1985.
7. Pajak perseroan minyak sejak semester I 1984/1985 menjadi penerimaan
minyak bumi dan gas alam. 8. Penerimaan lain-lain dari pajak langsung sejak semester I 1984/1985
digabung dengan penerimaan lain-lain dari pajak tidak langsung. 9. Pajak penjualan dan pajak penjualan impor sejak semester I 1985/1986
digabung menjadi pajak pertambahan nilai.
TECHNICAL NOTES 1. Government financial statistics consists of :
a. Central Government Financial Statistics b. Provincial Government Financial Statistics c. District-Level Government Financial Statistics d. Village-Level Government Financial Statistics
2. The central government covers departments and other institutions financed
through the state budget (APBN). 3. The provincial, district-level, and village-level governments are financed
through regional budgets (APBD). 4. Data on actual government revenues and expenditures are obtained from
the Department of Finance. 5. Domestic revenues consist of oil and gas revenues, and non-oil and gas
revenues. 6. Taxes on income consist of income tax, corporate tax, withholding tax, and
taxes on dividend, interest and royalty. Since the first semester of 1984/1985 these taxes have been aggregated into the tax on income.
7. Since the first semester of 1984/1985 the term "corporate tax on oil" has
been changed to "oil and gas revenues". 8. Since the first semester of 1984/1985, other revenues from direct taxes
were combined with other revenues from indirect taxes. 9. Since the first semester of 1985/1986, sales tax and sales tax on imports
have been included in value-added tax.
50
https:
//www.b
ps.go.id
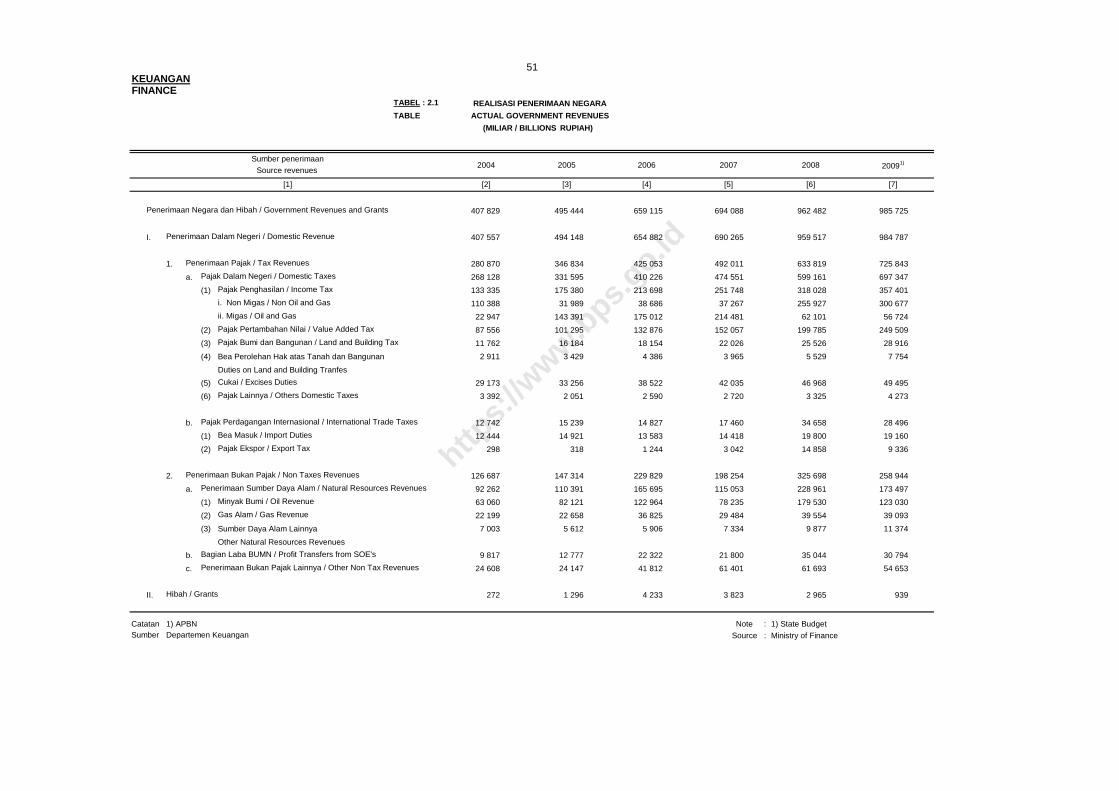
KEUANGANFINANCE
TABEL : 2.1 REALISASI PENERIMAAN NEGARA
TABLE ACTUAL GOVERNMENT REVENUES
Penerimaan Negara dan Hibah / Government Revenues and Grants 407 829 495 444 659 115 694 088 962 482 985 725
I. Penerimaan Dalam Negeri / Domestic Revenue 407 557 494 148 654 882 690 265 959 517 984 787
1. Penerimaan Pajak / Tax Revenues 280 870 346 834 425 053 492 011 633 819 725 843
a. Pajak Dalam Negeri / Domestic Taxes 268 128 331 595 410 226 474 551 599 161 697 347
(1) Pajak Penghasilan / Income Tax 133 335 175 380 213 698 251 748 318 028 357 401
i. Non Migas / Non Oil and Gas 110 388 31 989 38 686 37 267 255 927 300 677
ii. Migas / Oil and Gas 22 947 143 391 175 012 214 481 62 101 56 724
(2) Pajak Pertambahan Nilai / Value Added Tax 87 556 101 295 132 876 152 057 199 785 249 509
(3) Pajak Bumi dan Bangunan / Land and Building Tax 11 762 16 184 18 154 22 026 25 526 28 916
(4) Bea Perolehan Hak atas Tanah dan Bangunan 2 911 3 429 4 386 3 965 5 529 7 754
Duties on Land and Building Tranfes
(5) Cukai / Excises Duties 29 173 33 256 38 522 42 035 46 968 49 495
(6) Pajak Lainnya / Others Domestic Taxes 3 392 2 051 2 590 2 720 3 325 4 273
b. Pajak Perdagangan Internasional / International Trade Taxes 12 742 15 239 14 827 17 460 34 658 28 496
(1) Bea Masuk / Import Duties 12 444 14 921 13 583 14 418 19 800 19 160
(2) Pajak Ekspor / Export Tax 298 318 1 244 3 042 14 858 9 336
2. Penerimaan Bukan Pajak / Non Taxes Revenues 126 687 147 314 229 829 198 254 325 698 258 944
a. Penerimaan Sumber Daya Alam / Natural Resources Revenues 92 262 110 391 165 695 115 053 228 961 173 497
(1) Minyak Bumi / Oil Revenue 63 060 82 121 122 964 78 235 179 530 123 030
(2) Gas Alam / Gas Revenue 22 199 22 658 36 825 29 484 39 554 39 093
(3) Sumber Daya Alam Lainnya 7 003 5 612 5 906 7 334 9 877 11 374
Other Natural Resources Revenues
b. Bagian Laba BUMN / Profit Transfers from SOE's 9 817 12 777 22 322 21 800 35 044 30 794
c. Penerimaan Bukan Pajak Lainnya / Other Non Tax Revenues 24 608 24 147 41 812 61 401 61 693 54 653
II. Hibah / Grants 272 1 296 4 233 3 823 2 965 939
Catatan :1) APBN Note : 1) State BudgetSumber :Departemen Keuangan Source : Ministry of Finance
[1]
2006
[4]
2007
[2] [3] [7][5]
2004 2005 2008
[6]
51
20091)Sumber penerimaanSource revenues
(MILIAR / BILLIONS RUPIAH)
https:
//www.b
ps.go.id

KEUANGANFINANCE
TABEL : 2.2 REALISASI PENGELUARAN NEGARA
TABLE ACTUAL GOVERNMENT EXPENDITURES
Pengeluaran Negara / Government Expenditures 435 677 509 419 699 099 752 373 1 022 621 1 037 067
I. Pengeluaran Pemerintah Pusat / Central Government Expenditures 306 070 358 903 478 249 498 172 729 066 716 376
1. Belanja Pegawai / Personnel Expenditure 54 069 55 589 79 075 97 983 122 924 140 198
2. Belanja Barang / Goods and Services Expenditure 16 565 33 060 55 992 61 824 57 422 91 731
3. Pembayaran Bunga Hutang / Interest Payment 62 361 57 651 82 495 83 555 95 457 101 658
a. Hutang Dalam Negeri / Domestic Interest 39 554 43 496 58 155 58 803 64 864 69 340
b. Hutang Luar Negeri / External Interest 22 808 14 155 24 340 24 752 30 593 32 318
4. Subsidi / Subsidies 85 461 120 708 107 627 105 073 281 706 166 702
a. Subsidi BBM / Oil Subsidies 69 025 95 661 64 212 55 604 222 616 103 569
b. Subsidi Non BBM / Non Oil Subsidies 16 437 25 047 43 415 49 469 59 090 63 133
5. Belanja modal / Capital expenditures - - 69 780 69 216 71 213 71 992
6. Bantuan sosial / Social expenditures - - 41 018 49 663 54 032 78 973
7. Pengeluaran Pembangunan / Development Expenditures 68 381 61 101 - - - -
8. Pengeluaran Lainnya / Other Expenditures 19 233 30 794 42 262 30 858 46 312 65 124
II. Pengeluaran untuk Daerah / Region Expenditures 129 607 150 516 220 850 254 201 293 555 320 691
1. Dana Perimbangan / Balanced Funds 122 799 143 301 216 798 244 608 279 568 296 952
a. Dana Bagi Hasil / Revenues Sharing Fund 36 634 49 829 59 564 62 726 78 859 85 719
b. Dana Alokasi Umum / General Allocation Fund 82 076 88 742 145 664 164 788 179 507 186 414
c. Dana Alokasi Khusus / Special Allocation Fund 4 089 4 730 11 570 17 094 21 202 24 820
2. Dana Otonomi Khusus dan Penyeimbang / Special Autonomy 6 808 7 215 4 052 9 593 13 987 23 739
Catatan : 1) APBN Note : 1) State BudgetSumber : Departemen Keuangan Source : Ministry of Finance
2006Jenis pengeluaran
[2] [3][1]
2004 2005 20091)
[7]
52
Kind of expenditures
[4] [5] [6]
(MILIAR / BILLIONS RUPIAH)
2007 2008
https:
//www.b
ps.go.id

PERBANKAN BANKING Catatan : 1. Posisi pinjaman adalah Baki debet atau penggunaan Netto oleh nasabah yaitu pinjaman setelah dikurangi dengan N o t e pembayaran kembali. Termasuk pinjaman investasi, Kredit Investasi Kecil (KIK) dan Kredit Modal Kerja Permanen (KMKP). Tidak termasuk pinjaman
antar bank, pinjaman kepada Pemerintah Pusat dan bukan penduduk, serta nilai lawan valuta asing pinjaman investasi dalam rangka bantuan Proyek. Outstanding credits are defined as credits extended by banks (minus the amount of credits that has been repaid), including Small Scale Investment Credits (KIK), and Permanent Working Capital Credits (KMKP), but excluding inter-banks credits, credits to Central Government and to non-residents, and foreign exchange components of Project Aid.
2. Kredit untuk pengolahan barang-barang sektor pertanian dimasukkan ke sektor perindustrian sesuai dengan International Standard Industrial
Classification (ISIC) 1968. Kredit untuk Jasa Konstruksi yang semula termasuk sektor perindustrian dimasukkan ke sektor jasa-jasa. Credits for the processing of agricultural commodities are classified as credits for manufacturing industries according to the 1968 International Standard Industrial Classification (ISIC). Credits for construction previously included in the "manufacturing industry" are now included in the service sector.
3. Termasuk kredit kepada Pertamina dalam rangka pembayaran hutang luar negeri perusahaan tersebut.
Includes credits to Pertamina for foreign debt repayments.
4. Termasuk kredit untuk pengadaan pangan dan perhotelan. Includes credits for food procurements and hotel projects.
5. Kredit untuk listrik, gas dan air dimasukkan ke sektor jasa-jasa.
Credits for the sector electricity, gas and water supply are included in the service sector.
Sumber : Bank Indonesia. Source Bank Indonesia
57
https:
//www.b
ps.go.id

PERBANKAN BANKING
PENJELASAN TEKNIS 1. Uang beredar (Tabel 3.1) terdiri dari : a. Uang kartal yang beredar di luar Bank Indonesia, Bank-bank Pencipta
Uang Giral (BPUG) dan Kantor Bendahara Negara. b. Uang giral yaitu saldo rekening koran pada bank-bank komersil dan
bank-bank yang dapat dipersamakan dengan bank-bank komersil, yang setiap saat dapat diambil sebesar nilai nominalnya dan tidak dikenakan pinalty. Tidak termasuk disini adalah saldo rekening koran bank-bank pencipta uang giral, pemerintah dan bukan penduduk.
2. Uang Kuasi terdiri dari Deposito Berjangka, Tabungan dalam rupiah dan
valuta asing, dan giro dalam valuta asing. 3. a. Kredit Perbankan dalam rupiah dan valuta asing (Tabel 3.2)
merupakan tagihan perbankan pada sektor swasta domestik karena pemberian pinjaman kepadanya. Tidak termasuk didalamnya adalah kredit antar bank. Kredit kepada pemerintah pusat, kredit kepada bukan penduduk, nilai lawan valuta asing, dan pinjaman investasi dalam rangka bantuan proyek.
TECHNICAL NOTES 1. Money Supply (Table 3.1) is composed of :
a. Currency outside of Bank Indonesia and deposit money Banks, and outside of Government Payment Office.
b. Demand deposit, is the balance in the current account of commercial banks and other Banks of similar nature, which can be drawn any time at the same nominal value without penalty. It does not include demand deposit of deposit money banks, the government and non-residents.
2. Quasi-money is composed of time deposits, savings deposits, both in
foreign currency and rupiah, and demand deposits in foreign currency. 3. a. Bank credits (Table 3.2), both in rupiah and foreign exchange, consist
of claims on private domestic sectors on account of loans. The total excludes inter-bank credits, credits to central government, credits to non-residents, and foreign exchange components of investment credits for foreign aid projects.
b. Kredit untuk pengolahan barang-barang pertanian dimasukkan
kedalam sektor perindustrian.
c. Kredit sektor pertambangan mencakup kredit kepada pertanian untuk
pembayaran utang luar negeri Pertamina.
d. Kredit untuk jasa konstruksi, Listrik, Gas dan Air dimasukkan
kedalam sektor jasa-jasa.
e. Kredit untuk pengadaan pangan dan perhotelan dimasukkan kedalam
sektor perdagangan.
b. Credits for processing of agricultural products are covered under credits for the manufacturing industry sector.
c. Credits for the mining sector cover credits to the agricultural sector for Pertamina's foreign debt repayments.
d. Credits for construction services, electricity, gas and water supply are covered under credits for the service sector.
e. Credits for food procurements and hotel are covered under credits for the trade sector
53
https:
//www.b
ps.go.id

PERBANKAN BANKING
4. a. Mulai edisi Februari 1995, tabel yang menyajikan data Kredit
Investasi Kecil (KIK) dan Kredit Modal Kerja Permanen (KMKP) diganti dengan tabel yang menyajikan Suku Bunga Kredit Menurut Kelompok Bank (Tabel 3.4).
b. Suku bunga dihitung berdasarkan suku bunga rata-rata tertimbang
dan yang disajikan hanya untuk kredit non prioritas. Suku bunga kredit menurut kelompok Bank terdiri dari Bank Umum Pemerintah, Bank Umum Devisa Swasta Nasional, Bank Umum Swasta Nasional bukan Devisa, Bank Pembangunan Daerah, Bank Asing dan Campuran serta Bank Pencipta Uang Giral.
5. a. Kredit investasi (Tabel 3.5) merupakan kredit jangka
menengah/panjang yang digunakan untuk keperluan rehabilitasi, modernisasi, perluasan dan pendirian proyek-proyek baru.
b. Dana Kredit Investasi berasal dari kredit liquiditas Bank Indonesia
dan bank-bank pelaksana. c. Plafond pinjaman adalah jumlah maksimum yang disetujui oleh bank,
tidak termasuk plafond pinjaman yang telah jatuh waktu dan telah dilunasi seluruhnya.
d. Dalam plafond pinjaman tidak termasuk plafond KIK dan KI kepada
Pemerintah Pusat dan nilai lawan valuta asing pinjaman investasi dalam rangka bantuan proyek, tetapi termasuk pembiayaan rupiah kredit investasi dalam rangka bantuan proyek.
6. Data terakhir Suku bunga deposito berjangka rupiah bulanan terakhir
disajikan sampai bulan Desember 1994. Mulai Indikator Ekonomi edisi Pebruari 1995, data yang disajikan berupa Suku Bunga Deposito Berjangka Bank Pencipta Uang Giral (Tabel 3.6).
4. a. Starting with February 1995 edition, the table con-taining data on small
investment credits and permanent working ca-pital credits, has been changed into a table contain-ing loan interest rate, by group of banks (Table 3.4).
b. The interest rates are calculated based on weighted average rates and
provided only for non-priority credits. Loan interest rates are classified according to the following groups of banks: State Foreign Exchange Banks, Private National Foreign Exchange Banks, Private National Non-Foreign Exchange Banks, Regional Development Banks, Foreign and Joint-Venture Banks, and Deposit Money Banks.
5. a. Investment credits (Table 3.5) are medium or long term credits used
to establish new projects, or to rehabilitate expand and modernize existing projects.
b. The fund for investment credits comes from liquidity credits extended
by Bank Indonesia and other lending banks. c. The credit ceiling is the maximum amount of loans approved by banks,
but excludes those loans which are due and already completely repaid.
d. The credit ceiling excludes the ceiling for small investment credits, investment credits extended to central gevernment, and the foreign exchange component of investment credits for aid projects, however, it includes the Rupiah component of aid projects.
6. Monthly data on Interest rates of Rupiah time deposits were provided only
until December 1994. Since the February 1995 edition of Economic Indicators, these have been replaced by data on time deposit Interest Rates at Deposit Money Banks (Table 3.6).
54
https:
//www.b
ps.go.id
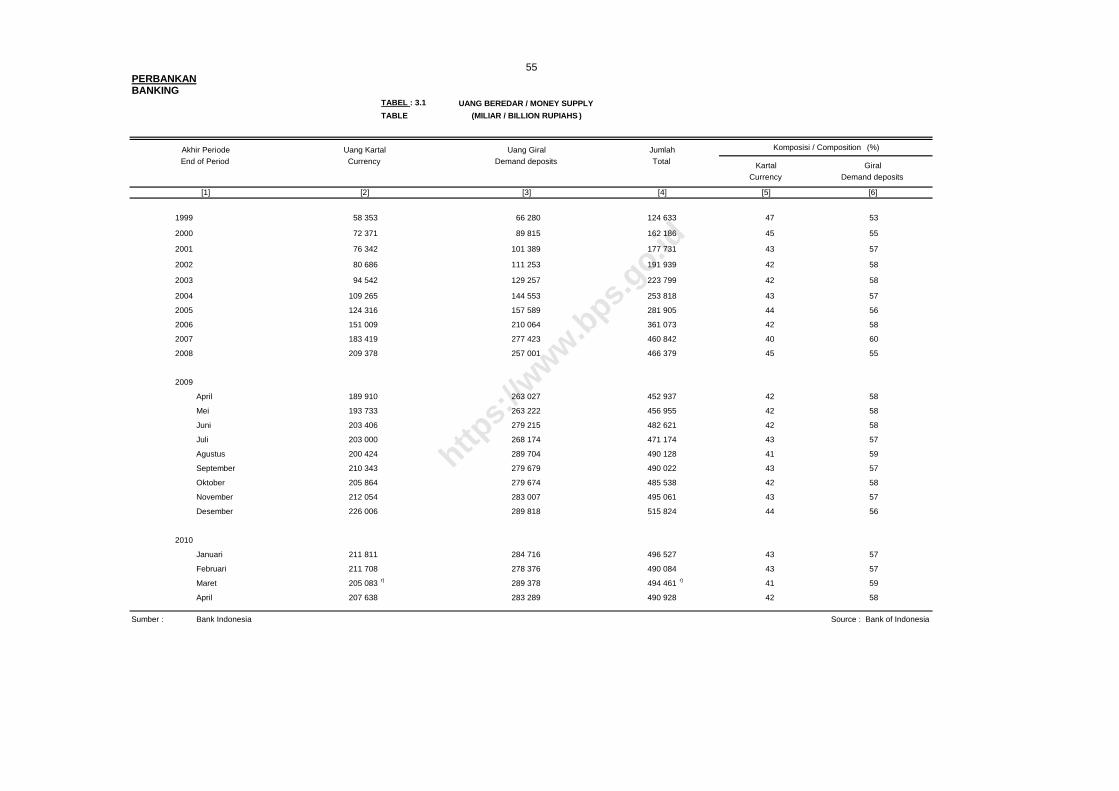
PERBANKANBANKING
TABEL : 3.1
TABLE
1999 58 353 66 280 124 633 47 53
2000 72 371 89 815 162 186 45 55
2001 76 342 101 389 177 731 43 57
2002 80 686 111 253 191 939 42 58
2003 94 542 129 257 223 799 42 58
2004 109 265 144 553 253 818 43 57
2005 124 316 157 589 281 905 44 56
2006 151 009 210 064 361 073 42 58
2007 183 419 277 423 460 842 40 60
2008 209 378 257 001 466 379 45 55
2009
April 189 910 263 027 452 937 42 58
Mei 193 733 263 222 456 955 42 58
Juni 203 406 279 215 482 621 42 58
Juli 203 000 268 174 471 174 43 57
Agustus 200 424 289 704 490 128 41 59
September 210 343 279 679 490 022 43 57
Oktober 205 864 279 674 485 538 42 58
November 212 054 283 007 495 061 43 57
Desember 226 006 289 818 515 824 44 56
2010
Januari 211 811 284 716 496 527 43 57
Februari 211 708 278 376 490 084 43 57
Maret 205 083 r) 289 378 494 461 r) 41 59
April 207 638 283 289 490 928 42 58
Sumber : Bank Indonesia
55
KartalCurrency
Demand depositsJumlahTotal
UANG BEREDAR / MONEY SUPPLY
Source : Bank of Indonesia
[3]
Akhir PeriodeEnd of Period
[1]
Uang KartalCurrency Giral
Demand deposits
[6][2] [4] [5]
(MILIAR / BILLION RUPIAHS )
Uang Giral Komposisi / Composition (%)
https:
//www.b
ps.go.id

PERBANKANBANKING
TABEL: 3.2 POSISI KREDIT PERBANKAN DALAM RUPIAH DAN VALUTA ASING MENURUT SEKTOR EKONOMI 1)
TABLE OUTSTANDING BANK CREDITS IN RUPIAH AND FOREIGN EXCHANGE BY ECONOMIC SECTOR 1)
(MILIAR / BILLION RUPIAHS )
valuta asing
1999 21 139 2 638 879 2 818 35 561 48 698 29 687 13 601 26 332 16 829 26 929 22 140 527 84 606
2000 15 028 4 475 2 879 3 801 35 697 71 085 30 601 13 498 23 784 20 532 44 493 3 127 152 482 116 518
2001 16 851 4 012 3 676 3 764 50 434 66 091 38 491 9 959 30 696 18 365 62 470 2 785 202 618 104 976
2002 19 121 3 211 2 441 3 654 64 986 56 049 56 854 9 124 44 581 16 402 83 868 5 119 271 851 93 559
2003 20 760 3 547 1 546 3 515 67 323 55 802 74 787 9 470 68 007 21 122 109 603 2 460 342 026 95 916
2004 26 604 5 772 1 468 6 262 77 299 66 304 97 988 13 047 86 046 21 812 149 475 1 471 438 880 114 668
2005 29 438 7 240 2 246 5 627 98 096 71 582 121 216 12 892 110 100 24 843 205 348 1 041 566 444 123 225
2006 34 931 10 072 2 658 11 238 104 456 77 976 145 872 16 524 126 325 31 313 224 910 861 639 152 147 984
2007 41 122 14 783 2 789 22 551 115 172 88 636 186 882 28 788 165 965 46 476 281 256 691 793 186 201 925
2008 53 826 12 334 4 386 26 155 159 486 109 666 230 809 27 196 242 791 67 168 365 785 577 1057 083 243 096
2009
April 57 175 11 724 5 952 21 571 157 759 95 015 236 695 24 824 236 729 59 568 390 020 549 1 084 330 213 251
Mei 59 034 11 978 5 884 18 892 157 595 89 143 240 800 24 230 240 590 57 542 395 332 2 176 1 099 235 203 961
Juni 61 131 12 136 6 205 20 515 158 879 88 253 247 711 24 347 249 460 57 512 402 117 2 825 1 125 503 205 588
Juli 60 994 12 430 6 639 21 378 158 316 84 959 249 139 22 700 254 784 57 775 407 797 3 959 1 137 669 203 201
Agustus 60 901 11 327 9 965 23 049 157 077 88 003 254 410 23 917 259 246 57 560 419 211 3 519 1 160 810 207 375
September 62 377 9 266 10 473 21 443 158 499 81 111 259 044 22 493 265 050 54 814 422 227 2 696 1 177 670 191 823
Oktober 63 886 9 007 10 570 21 625 158 706 79 281 263 185 21 763 266 591 54 804 429 065 3 399 1 192 003 189 879
November 65 614 9 458 10 832 22 209 162 903 79 508 268 901 20 919 269 444 53 318 437 211 3 478 1 214 905 188 890
Desember 68 183 9 211 11 462 30 097 167 011 79 177 280 626 21 257 272 121 57 181 446 674 3 808 1 246 077 200 731
2010
Januari 54 628 8 368 11 612 26 447 160 803 76 078 215 442 18 102 257 603 50 879 523 916 10 385 1 224 005 190 259
Februari 57 416 8 467 11 779 28 111 162 695 77 149 219 820 17 999 264 311 47 454 531 369 9 778 1 247 390 188 957
Maret 60 386 9 338 12 370 29 476 164 842 75 056 245 431 18 180 273 185 47 379 519 268 8 242 1 275 482 187 671
April 62 897 10 039 11 958 31 132 169 180 75 350 246 293 19 979 281 172 48 188 528 124 7 973 1 299 624 192 660
Sumber : Bank Indonesia Source : Bank of Indonesia
MiningPertanian Pertambangan 3) Perindustrian 2)
Agriculture Manufacturing industry Trade Service rendering industry Others TotalPerdagangan 4) Jasa-jasa 5) Lainnya Jumlah
Dalam DalamAkhir Periode Dalam Dalam Dalam Dalam DalamEnd of Period Dalam Dalam valuta asing
In ForeignDalam valuta asing Dalam valuta asingDalam valuta asing Dalam valuta asing
In rupiah
Dalam valuta asingrupiah In Foreign rupiah In Foreign rupiah In Foreign rupiah In Foreignrupiah In Foreign rupiah In Foreign rupiah
56
exchangeIn rupiah exchange In rupiah exchangeIn rupiah exchange In rupiah exchange[12] [13]
exchange[1] [2] [3]
In rupiahIn rupiah exchange[15][4] [5] [6] [7] [8] [9] [14][10] [11]
https:
//www.b
ps.go.id

PERBANKANBANKING
TABEL : 3.3 TABLE
1999 141 055,17 793 655,91 934 711,08
2000 156 719,02 973 380,39 1 130 099,41
2001 178 884,76 1 355 099,41 1 533 984,17
2002 181 524,15 1 907 828,50 2 089 352,65
2003 192 607,84 2 084 027,69 2 276 635,53
2004 200 989,21 2 592 233,64 2 793 222,85
2005 211 613,47 3 543 524,29 3 755 137,76
2006 223 189,35 4 576 987,21 4 800 176,56
2007 235 534,52 5 572 644,32 5 808 178,84
2008 255 502,78 8 090 339,70 8 345 842,48
2009
April 265 230,75 10 043 795,44 10 309 026,19
Mei 269 729,89 10 437 702,85 10 707 432,74
Juni 275 353,30 10 815 390,43 11 090 743,73
Juli 278 087,18 11 191 362,53 11 469 449,71
Agustus 281 762,10 11 444 404,19 11 726 166,29
September - 11 016 028,67 11 016 028,67
Oktober 279 910,93 11 491 853,07 11 771 764,00
November 281 686,38 11 667 966,35 11 949 652,73
Desember 284 753,65 11 865 337,09 12 150 090,74
2010
Januari 284 373,14 3 951 731,78 r) 4 236 104,92 r)
Februari 289 539,51 3 879 013,22 r) 4 168 552,73 r)
Maret - 4 499 084,37 4 499 084,37
April - 4 260 813,70 4 260 813,70
Catatan: Mulai bulan Februari 1992, data kredit yang diterbitkan Note : Since February 1992, Credits Outstanding of village Bank Lumbung Desa di gabung dengan Bank desa menjadi BKD (Bank Kredit Desa) and Rural Bank, are aggregated became village credit institution (BKD)Sumber : Bank Rakyat Indonesia dan Pegadaian Negara Source : Bank Rakyat Indonesia and Government Pawnshops Bank Desa dan Lumbung Desa Jawa Madura Village and Rural Paddy Bank of Java Madura
Jumlah Besar dengan Uang Grand Total in Money Terms
PEMBERIAN KREDIT OLEH BANK KREDIT DESA DAN PEGADAIAN NEGARAOUTSTANDING CREDITS BY VILLAGE CREDIT INSTITUTION AND GOVERNMENT PAWNSHOPS
(JUTA / MILLION RUPIAHS )
58
Akhir PeriodeEnd of Period
Jumlah Kredit yang Diberikan / Total Outstanding CreditsPegadaian Negara / Government PawnshopsBank Kredit Desa / Village Credit Institution
[4][2] [3][1]
https:
//www.b
ps.go.id

PERBANKANBANKING
TABEL : 3.4 SUKU BUNGA KREDIT RUPIAH MENURUT KELOMPOK BANK
TABLE RUPIAH CREDIT INTEREST RATES BY GROUP OF BANKS(PERSEN PER TAHUN / PERCENT PER ANNUM )
1999 26,22 20,97 24,08 14,86 32,58 32,93 29,59 34,12 28,89 22,93
2000 19,55 16,35 20,53 16,23 17,76 18,04 15,95 15,62 18,43 16,59
2001 19,15 17,11 20,48 17,76 19,16 19,02 19,09 18,55 19,19 17,90
2002 18,85 17,50 19,93 17,89 18,21 18,30 15,71 16,09 18,25 17,82
2003 16,18 15,54 19,08 17,20 14,66 15,75 11,02 12,60 15,07 15,68
2004 14,32 14,10 17,54 16,24 13,13 13,91 9,33 11,44 13,41 14,05
2005 15,59 14,94 16,81 15,64 16,58 15,76 13,88 16,18 15,92 15,43
2006 15,36 14,98 16,60 15,28 15,41 15,42 11,42 13,21 15,07 15,10
2007 13,47 12,93 15,33 14,61 12,96 13,11 10,23 10,56 13,00 13,01
2008 14,61 13,85 14,43 13,52 15,90 14,85 14,58 15,00 15,22 14,40
2009
April 14,38 13,51 14,21 13,29 15,48 14,58 13,73 14,24 14,82 14,05
Mei 14,28 13,39 14,16 13,25 15,32 14,52 13,45 13,74 14,68 13,94
Juni 14,16 13,28 14,16 13,20 15,15 14,33 13,27 13,53 14,52 13,78
Juli 14,17 13,18 14,16 13,13 15,07 14,14 12,90 12,74 14,45 13,58
Agustus 14,08 13,21 14,14 12,81 14,89 13,94 12,57 12,58 14,30 13,48
September 14,03 12,78 14,10 12,76 14,67 13,80 12,34 12,27 14,17 13,20
Oktober 14,00 12,66 14,07 12,66 14,56 13,70 12,20 12,51 14,09 13,12
November 13,90 12,58 14,02 12,59 14,38 13,62 12,17 12,34 13,96 13,03
Desember 13,63 12,56 13,91 12,54 14,09 13,51 11,73 12,22 13,69 12,96
2010
Januari 13,05 12,04 13,79 12,74 14,95 14,58 11,34 12,52 13,75 13,24
Februari 13,02 11,99 13,79 12,82 14,88 14,54 11,04 12,37 13,68 13,21
Maret 13,63 12,11 13,67 12,79 13,98 13,38 11,02 12,21 13,54 12,72
April 13,52 11,97 13,70 12,79 13,84 13,34 10,82 12,07 13,42 12,62
Catatan : Suku bunga rata-rata tertimbang untuk kredit non prioritas Note : Weighted average interest rates on credits to non-priority sector
Sumber : Bank Indonesia Source : Bank of Indonesia
InvestasiInvestment
Private National Banks
59
Bank Persero Bank Pemerintah Daerah Bank Swasta NasionalCommercial BanksState Banks Regional Government Banks
[2][1]
Modal kerjaWorking
capital
Akhir PeriodeEnd of Period
capital
InvestasiInvestment
Modal kerja
capital
WorkingModal kerja
Working
Bank UmumBank Asing dan CampuranForeign and Joint Banks
Modal kerja InvestasiModal kerja Investasi
capital capital
WorkingInvestasi
Investment Working Investment Investment
[3] [4] [11][7] [8] [9] [10][5] [6]
https:
//www.b
ps.go.id

PERBANKANBANKING
TABEL : 3.5 POSISI KREDIT INVESTASI PERBANKAN DALAM RUPIAH DAN VALUTA ASING MENURUT SEKTOR EKONOMI TABLE BANKS OUTSTANDING INVESTMENT CREDITS IN RUPIAH AND FOREIGN EXCHANGE BY ECONOMIC SECTOR
valuta asing valuta asing valuta asing valuta asing valuta asing valuta asing valuta asing
1999 10 678 937 162 1 167 9 193 13 788 3 035 4 072 8 112 6 547 - - 31 180 26 511
2000 8 684 2 126 1861 1 023 7 324 18 886 3 492 4 289 7 536 10 055 - - 28 897 36 379
2001 9 682 2 433 3 042 3 200 10 784 17 533 4 717 3 373 9 831 8 871 - - 38 056 35 410
2002 10 016 1 980 1 639 1 959 15 194 16 286 6 845 3 329 16 260 9 416 - - 49 954 32 970
2003 10 354 2 250 596 1 514 15 142 15 938 10 245 3 865 23 483 10 929 - - 59 820 34 496
2004 10 984 2 504 633 3 522 17 440 19 214 15 360 4 126 30 792 12 289 - - 75 209 41 655
2005 12 668 2 995 850 2 785 20 992 18 311 18 515 3 521 38 677 13 149 - - 91 702 40 761
2006 15 622 3 577 977 4 415 23 382 17 380 20 856 4 438 43 793 14 431 - - 104 630 44 241
2007 17 982 6 000 1 092 9 555 24 629 20 061 24 809 5 236 54 817 19 583 - - 123 329 60 435
2008 23 894 5 733 1 567 9 898 31 006 25 017 30 722 7 683 87 067 31 834 - - 174 256 80 165
2009
April 26 481 5 227 1 913 9 034 33 970 21 954 32 753 7 083 92 214 29 162 271 - 187 602 72 460
Mei 27 839 5 104 1 860 8 379 33 201 21 369 32 938 6 861 95 258 28 884 283 - 191 379 70 597
Juni 30 482 5 204 2 087 8 235 34 369 21 464 33 678 6 581 97 678 28 372 291 - 198 585 69 856
Juli 30 419 5 047 2 122 7 983 35 152 20 676 34 267 6 292 104 494 27 123 317 - 206 771 67 121
Agustus 30 724 4 686 3 462 9 777 35 569 21 889 34 854 6 280 105 315 26 941 339 - 210 263 69 573
September 30 652 4 630 3 486 9 114 34 540 20 366 r) 36 396 5 778 107 743 25 116 294 - 213 111 65 004
Oktober 31 867 4 686 3 493 9 165 35 012 20 042 37 685 5 755 108 759 24 095 297 - 217 113 63 743
November 32 450 5 084 3 475 9 009 36 928 20 034 38 606 5 167 111 314 24 415 299 - 223 072 63 709
Desember 35 009 4 733 3 502 11 882 37 992 20 017 39 028 4 966 114 730 25 316 311 - 230 572 66 914
2010
Januari 32 050 4 830 3 628 9 728 38 454 18 714 38 481 3 974 112 211 20 631 5 897 377 230 720 58 256
Februari 33 846 5 096 3 738 12 264 38 689 19 222 39 254 4 033 116 275 21 650 5 798 391 237 599 62 658
Maret 33 621 4 223 3 786 11 203 36 986 18 155 37 662 3 841 119 301 20 374 6 410 379 237 765 58 177
April 35 869 4 839 3 708 11 582 39 828 19 271 37 611 4 272 120 566 22 446 6 391 366 243 974 62 776
Sumber : Bank Indonesia Source : Bank of Indonesia Source : Bank of Indonesia
Dalamrupiah
DalamIn Foreignrupiah
[3] [4] [5]
rupiah In Foreign rupiahIn rupiahIn rupiah exchange In rupiah In rupiah
Dalam
[10] [11]
In Foreignexchange
DalamDalam
In Foreignexchange
In ForeignDalamrupiah
exchangeIn rupiah exchangeIn Foreign rupiah
In rupiah
Total
[6] [7] [8]exchange
Dalam
[15][9] [14]
DalamDalamDalamAkhir Periode Dalam
AgricultureDalam
Service rendering industryManufacturing industry TradeDalam
OthersMiningPertanian Jumlah
60
Jasa-jasaPerindustrian Perdagangan Lainnya
(MILIAR / BILLION RUPIAHS )
Pertambangan
End of Period Dalam
[12] [13]
rupiah In ForeignIn rupiah exchange
[1] [2]
https:
//www.b
ps.go.id

PERBANKANBANKING
TABEL : 3.6 SUKU BUNGA DEPOSITO BERJANGKA BANK UMUMTABLE COMMERCIAL BANKS INTEREST RATES ON TIME DEPOSIT
(PERSEN PERTAHUN / PERCENT PER ANNUM )
1999 23,97 25,31 21,50 27,60 17,62
2000 11,16 12,54 12,74 16,15 14,29
2001 14,54 15,50 14,94 14,23 17,00
2002 14,41 15,55 15,28 15,95 18,10
2003 9,70 10,74 11,35 12,64 17,15
2004 6,20 6,43 6,85 8,21 11,33
2005 8,36 8,16 7,65 8,22 8,75
2006 8,96 9,71 10,70 11,63 11,84
2007 7,19 7,42 7,65 8,24 10,83
2008 10,75 11,16 10,34 10,43 8,62
2009
April 9,04 10,09 10,30 11,35 8,34
Mei 8,77 9,68 10,04 11,41 8,80
Juni 8,52 9,25 9,75 11,37 9,03
Juli 8,31 8,99 9,45 11,34 9,03
Agustus 7,94 8,73 9,11 11,24 9,14
September 7,43 8,35 8,71 10,80 9,14
Oktober 7,38 7,97 8,47 10,60 9,04
November 7,16 7,68 8,22 10,41 9,06
Desember 6,87 7,48 7,87 9,55 9,10
2010
Januari 7,09 7,31 7,59 9,12 7,68
Februari 6,93 7,08 7,37 8,82 7,49
Maret 6,77 6,99 7,31 8,49 8,48 r)
April 6,89 6,98 7,14 8,24 8,33
Sumber : Bank Indonesia Source : Bank of Indonesia
[6]
6 Month
[1]
Bank Umum / Commercial Banks
24 Bulan1 Month 3 Month 12 Month
[3][2] [4] [5]
61
12 BulanEnd of PeriodAkhir Periode
24 Month6 Bulan3 Bulan1 Bulan
https:
//www.b
ps.go.id

PENANAMAN MODAL INVESTMENT
PENJELASAN TEKNIS 1. Kebijaksanaan tentang penanaman modal, ditetapkan oleh pemerintah
melalui UU no. 1 tahun 1967 tentang Penanaman Modal Asing (PMA) dan UU no. 6 tahun 1968 Tentang Penanaman Modal Dalam Negeri (PMDN). Kemudian disempurnakan dengan berlakunya masing-masing UU no. 11 dan no. 12 tahun 1970.
2. Proyek-proyek PMA dan PMDN adalah proyek-proyek yang disetujui
pemerintah. 3. Proyek-proyek PMDN merupakan penjumlahan proyek-proyek baru
ditambah dengan proyek PMA yang beralih status menjadi PMDN, dikurangi proyek PMDN yang dicabut izin usahanya.
4. Proyek-proyek PMA merupakan penjumlahan-penjumlahan proyek-
proyek baru, dikurangi proyek PMA yang beralih status menjadi PMDN dan proyek PMA yang dicabut izin usahanya
TECHNICAL NOTES 1. Through Act No. 1 of 1967 and Act No. 6 of 1968 the government set
policies on Foreign Direct Investment and Domestic Direct Investment, respectively. These two Acts were later improved subsequently by Acts No. 11 and No. 12 of 1970.
2. Foreign and domestic direct investment projects are all projects approved
by the government. 3. Domestic Direct Investment (PMDN) projects are composed of new PMDN
projects and Foreign Direct Investment (PMA) projects which have been re-classified as PMDN projects, excluding all PMDN projects which approvals have been revoked.
4. PMA projects are composed of new PMA projects, excluding PMA projects
which have been re-classified as PMDN projects and PMA projects which approvals have been revoked.
62
https:
//www.b
ps.go.id

PENANAMAN MODALINVESTMENT
TABEL : 4.1.1 PERKEMBANGAN REALISASI INVESTASI PENANAMAN MODAL DALAM NEGERI MENURUT SEKTOR EKONOMI
TABLE STATISTIC OF DOMESTIC DIRECT INVESTMENT REALIZATION BY ECONOMIC SECTOR
(MILIAR/ BILLION RUPIAHS)
1 Jan s/d 31 Des 2009
1. Pertanian, Perburuan,Kehutanan dan Perikanan 3 100,8 1 12,5 2 468,9 2 107,6 3 328,4 25 2.622,0 57 443,8
Agriculture, Hunting, Forestry and Fisheries
a. Pertanian / Agriculture 3 100,8 1 12,5 2 468,9 2 107,6 3 328,4 23 2.597,3 57 443,8
b. Kehutanan / Forestry - - - - - - - - - - - -
c. Perikanan / Fisheries - - - - - - - - - - 2 24,7 - -
2. Pertambangan dan Penggalian / Mining and Quarrying - - - - - - - - 1 208,9 7 1.793,9 3 3,7
3. Perindustrian / Manufacturing 15 1.051,3 12 523,3 8 583,8 8 964,9 14 1.920,6 158 19.434,3 55 1.056,5
4. Listrik, Gas dan Air / Electricity, Gas and Water - - - - 1 3.255,0 - - - - 4 3.442,7 12 1.234,0
5. Konstruksi / Construction - - 2,0 876,5 - - - - 1 394,1 8 2.765,8 - -
6. Perdagangan Besar dan Eceran, Restoran dan Hotel 2 91,0 1 28,8 1 2,5 - - 4 1.306,1 26 1.799,1 12 1.286,9
Wholesale and Retail Trade, Restaurants and Hotels
7. Transpor, Pergudangan dan Komunikasi - - 2 34,7 2 29,3 - - 1 7,8 10 809,2 7 1.914,9
Transport, Storages and Communication
8. Lembaga Keuangan, Perasuransian, Real Estate - - - - - - - - - - 1 122,8 2 - dan Jasa Perusahaan / Financing, Insurance,
Real Estate and Business Services
9. Jasa Masyarakat, sosial dan perorangan 3,0 4.877,4 - - 1 1,0 1 86,1 1 6,7 9 5.010,1 2 750,8
Community, Social and Personal Services
23 6.120,5 18 1.475,8 15 4.340,5 11 1.158,6 25 4.172,6 248 37.799,9 150 6.690,6
Catatan : 0 Angka tahunan adalah jumlah Proyek Baru serta nilai investasi proyek baru dan perluasan0 Jika ada Angka proyek tanpa investasi berarti proyek pertambangan (Kontrak karya), sebaliknya jika ada angka investasi tanpa proyek berarti proyek perluasan
Sumber : Badan Koordinasi Penanaman Modal
2009 Triwulan I - 2010
Jan 1st up to Dec 31st
2009
1st Quarter 2010
63
InvestasiProyek Investasi ProyekInvestasi Investasi
[12] [13]
Proyek
Project Investment Investment[15]
Project[9] [14]
Investment[10] [11]
Project
Investasi
Sektor Ekonomi Agustus September Oktober NovemberEconomic Sector
ProyekProyek
Desember
[8]Project Project
Investasi
InvestmentInvestment[1] [4]
Investasi
Project[3]
ProyekProyek
Project[2] [5] [7][6]
J U M L A H / T O T A L
Investment Investment
https:
//www.b
ps.go.id

PENANAMAN MODALINVESTMENT
TABEL : 4.1.2 PERKEMBANGAN REALISASI INVESTASI PENANAMAN MODAL DALAM NEGERI MENURUT LOKASI
TABLE STATISTIC OF DOMESTIC DIRECT INVESTMENT REALIZATION BY LOCATION
(MILIAR/BILLION RUPIAHS)
1 Jan s/d 31 Des 2009
SUMATERA 5 514,2 - - 2 3.308,0 2 221,4 1 208,9 39 7.819,7 24 1.206,8 Nanggroe Aceh Darussalam - - - - - - - - - - 1 79,7 - - Sumatera Utara 1 14,8 - - - - 1 104,7 - - 11 2.060,7 5 202,0 Sumatera Barat 1 345,9 - - - - - - - - 2 459,0 - - R i a u - - - - 1 3.255,0 - - - - 4 3.386,6 5 29,4 J a m b i - - - - - - - - - - 3 213,9 1 - Sumatera Selatan 1 26,8 - - - - - 89,5 1 208,9 4 580,3 6 783,8 Bengkulu - - - - - - - - - - - - 1 7,1 Lampung 1 69,0 - - 1 53,0 1 27,1 - - 5 549,9 5 184,5 Bangka Belitung 1 57,6 - - - - - - - - 3 249,3 - - Kepulauan Riau - - - - - - - - - - 6 240,0 1 -
JAWA 16 5.550,5 12 533,1 10 354,9 9 937,2 19 3.495,6 174 25.766,5 59 4.291,5 DKI Jakarta 3 4.871,9 - - 2 8,0 2 135,1 2 400,8 35 9.693,8 19 1.725,6 Jawa Barat 7 374,9 7 290,9 2 150,4 3 614,9 7 1.270,7 58 4.724,9 14 872,6 Jawa Tengah 2 101,3 - - - - - - 3 72,4 8 2.642,6 3 86,6 DI. Yogyakarta - - - - 1 0,4 - - - - 2 33,4 - - JawaTimur 3 181,6 3 218,0 4 193,7 2 133,9 6 1.737,5 48 4.290,6 18 474,9 Banten 1 20,8 2 24,1 1 2,5 2 53,4 1 14,2 23 4.381,7 5 1.131,8
BALI DAN NUSA TENGGARA - - - - - - - - 1 13,8 5 50,8 6 0,2 Bali - - - - - - - - 1 13,8 5 50,8 4 0,2 Nusa Tenggara Barat - - - - - - - - - - - - 1 - Nusa Tenggara Timur - - - - - - - - - - - - 1 -
KALIMANTAN 1 10,7 2 31,5 3 677,6 - - 3 408,2 22 2.934,5 54 1.190,5 Kalimantan Barat 1 10,7 - - 1 91,6 - - 1 160,4 5 517,1 28 341,0 Kalimantan Tengah - - - - 1 574,7 - - - - 7 1.464,8 9 13,0 Kalimantan Selatan - - 1 23,1 - - - - 1 216,5 4 870,9 7 477,6 Kalimantan Timur - - 1 8,4 1 11,3 - - 1 31,3 6 82,2 10 358,9
SULAWESI 1 45,1 4 911,2 - - - - 1 46,0 7 1.187,4 7 1,7 Sulawesi Utara - 3,5 - - - - - - 1 46,0 1 49,5 2 - Sulawesi Tengah - - - - - - - - - - - 1 0,1 Sulawesi Selatan 1 41,5 4 911,2 - - - - - - 6 1.137,8 1 - Sulawesi Tenggara - - - - - - - - - - - - 2 1,6 Gorontalo - - - - - - - - - - - - - - Sulawesi Barat - - - - - - - - - - - - 1 -
MALUKU DAN PAPUA - - - - - - - - - - 1 41,1 - - Maluku - - - - - - - - - - - - - - Maluku Utara - - - - - - - - - - - - - - Papua - - - - - - - - - - 1 41,1 - - Irian Jaya Barat - - - - - - - - - - - - - -
23 6.120,5 18 1.475,8 15 4.340,5 11 1.158,5 25 4.172,6 248 37.799,8 150 6.690,7
Catatan : 0 Angka tahunan adalah jumlah Proyek Baru serta nilai investasi proyek baru dan perluasan0 Jika ada Angka proyek tanpa investasi berarti proyek pertambangan (Kontrak karya), sebaliknya jika ada angka investasi tanpa proyek berarti proyek perluasan
Sumber : Badan Koordinasi Penanaman Modal
2009 Triwulan I - 2010
64
[12] [13] [14] [15]
Proyek ProyekInvestasi
Jan 1st up to Dec 31st
Project Investment Project InvestmentInvestasi
1st Quarter 2010 Desember
2009Investasi
[6][4] [9]Project
[7] [10]
Proyek
[1] [2] [3]
Investasi
Agustus
Investasi InvestasiProyekProject Investment
LokasiSeptember
LocationOktober November
ProyekInvestment ProjectProject
J U M L A H / T O T A L
[5]Investment
[8]Project Investment
InvestasiProyek
[11]Investment
Proyek
https:
//www.b
ps.go.id

PENANAMAN MODALINVESTMENT
TABEL : 4.2.1 PERKEMBANGAN REALISASI INVESTASI PENANAMAN MODAL LUAR NEGERI MENURUT SEKTOR EKONOMI
TABLE STATISTIC OF FOREIGN DIRECT INVESTMENT REALIZATION BY ECONOMIC SECTOR
(JUTA/MILLION US $)
1 Jan s/d 31 Des 2009
1. Pertanian, Perburuan,Kehutanan dan Perikanan - - - - 1 3,5 3 66,8 3 21,6 22 156,5 33 73,0
Agriculture, Hunting, Forestry and Fisheries
a. Pertanian / Agriculture - - - - - - 2 66,5 2 21,3 11 123,7 31 71,6
b. Kehutanan / Forestry - - - - - - - - - - 8 27,7 1 0,1
c. Perikanan / Fisheries - - - - 1 3,5 1 0,3 1 0,3 3 5,1 1 1,3
2. Pertambangan dan Penggalian / Mining and Quarrying 3 5,4 3 3,1 1 0,5 1 5,0 2 3,5 27 304,5 39 711,2
3. Perindustrian / Manufacturing 21 117,0 45 323,2 36 473,0 40 325,8 42 218,9 474 3.831,1 117 705,8
4. Listrik, Gas dan Air / Electricity, Gas and Water 2 0,7 1 18,3 - - - - - 23,2 6 349,2 9 681,6
5. Konstruksi / Construction - 12,3 1 5,7 - - 2 10,1 1 8,9 15 520,4 8 43,5
6. Perdagangan Besar dan Eceran, Restoran dan Hotel 36 102,7 54 120,3 39 104,3 37 37,6 48 102,5 466 1.012,5 120 162,0
Wholesale and Retail Trade, Restaurants and Hotels
7. Transpor, Pergudangan dan Komunikasi 3 4,1 4 2.949,5 3 0,8 2 2,3 5 2,5 50 4.170,4 23 941,5
Transport, Storages and Communication
8. Lembaga Keuangan, Perasuransian, Real Estate 2 14,9 2 22,4 2 18,6 4 7,9 4 26,7 33 309,5 20 406,1 dan Jasa Perusahaan / Financing, Insurance,
Real Estate and Business Services
9. Jasa Masyarakat, sosial dan perorangan 21 8,4 11 3,4 13 3,9 11 24,4 8 5,3 128 161,2 55 45,5
Community, Social and Personal Services
88 265,5 121 3.445,9 95 604,6 100 479,9 113 413,1 1.221 10.815,3 424 3.770,2
Catatan : 0 Angka tahunan adalah jumlah Proyek Baru serta nilai investasi proyek baru dan perluasan0 Jika ada Angka proyek tanpa investasi berarti proyek pertambangan (Kontrak karya), sebaliknya jika ada angka investasi tanpa proyek berarti proyek perluasan
Sumber : Badan Koordinasi Penanaman Modal
1st Quarter 2010
2009
Investment
2009
Investment Project
Investasi
[15][13]
65
Proyek
Triwulan I - 2010
Jan 1st up to Dec 31st
Project
Investasi
[4][2]
Proyek
[12] [14]
Proyek
Investment
Economic Sector Proyek
[6] [7]
Investasi Proyek
Investment
Desember
[11]
OktoberSeptemberAgustus
[3]Investment
[5]
Investasi
ProjectProject
J U M L A H / T O T A L
Proyek Investasi Proyek
[1]
NovemberSektor Ekonomi
Investasi
[8] [9] [10]Project InvestmentProject
Investasi
Project Investment
https:
//www.b
ps.go.id

PENANAMAN MODALINVESTMENT
TABEL : 4.2.2 PERKEMBANGAN REALISASI INVESTASI PENANAMAN MODAL LUAR NEGERI MENURUT LOKASI
TABLE STATISTIC OF FOREIGN DIRECT INVESTMENT REALIZATION BY LOCATION
(JUTA/MILLION US $)
1 Jan s/d 31 Des 2009
SUMATERA 4 27,6 6 91,3 12 180,7 11 107,1 9 92,5 123 776,1 39 70,3 Nanggroe Aceh Darussalam 1 0,3 - - - - - - - - 2 0,4 3 - Sumatera Utara - 0,3 1 36,4 - - 3 19,6 3 29,6 13 139,8 5 23,5 Sumatera Barat - - - - - - - - - - 1 0,2 1 - R i a u - - 1 31,2 1 5,8 2 71,8 1 40,6 8 251,5 4 - J a m b i - - - - - - - - 1 18,3 2 40,5 2 10,0 Sumatera Selatan - - 1 1,0 1 48,4 - - - - 4 56,8 10 20,0 Bengkulu - - - - - - - - - - 1 1,1 - - Lampung - 0,3 2 22,1 - - 1 9,7 - 0,6 3 32,7 2 0,6 Bangka Belitung - - - - - - - - - - 2 22,4 2 2,5 Kepulauan Riau 3 26,8 1 0,6 10 126,5 5 5,9 4 3,5 87 230,7 10 13,7
JAWA 68 154,6 99 3.307,3 74 354,8 81 333,5 85 268,7 946 9.370,5 264 2.453,9 DKI Jakarta 38 49,0 42 3.027,1 41 128,8 36 113,5 44 35,4 459 5.510,8 154 1.373,4 Jawa Barat 19 63,2 39 192,2 24 213,8 35 114,2 27 193,0 293 1.934,4 59 551,5 Jawa Tengah - - 4 5,6 2 0,7 1 15,2 4 4,1 30 83,0 5 13,6 DI. Yogyakarta 1 5,9 - - - - - - - - 5 8,1 9 - JawaTimur 3 19,7 7 60,7 3 3,8 6 41,3 5 12,4 67 422,1 14 458,4 Banten 7 16,8 7 21,6 4 7,6 3 49,3 5 23,8 92 1.411,9 23 57,0
- - BALI DAN NUSA TENGGARA 13 77,7 14 32,9 6 67,1 6 2,1 13 25,4 100 233,9 49 18,5
Bali 12 77,4 14 32,9 5 63,6 5 1,8 12 25,1 92 227,2 32 17,1 Nusa Tenggara Barat 1 0,3 - - - - 1 0,3 - - 5 2,9 17 1,4 Nusa Tenggara Timur - - - - 1 3,5 - - 1 0,3 3 4,0 - -
- - KALIMANTAN 1 2,3 1 1,0 1 0,4 2 5,7 3 13,7 31 284,3 54 695,3
Kalimantan Barat - - - - - - - - 1 0,3 4 27,7 10 1,7 Kalimantan Tengah - - - - - - - - - 1,3 4 4,9 13 51,3 Kalimantan Selatan - 0,8 - - - - - - 1 2,9 5 171,8 10 124,3 Kalimantan Timur 1 1,6 1 1,0 1 0,4 2 5,7 1 9,2 19 80,0 21 518,0
- - SULAWESI 1 2,2 1 13,5 2 1,8 - 31,5 3 12,8 16 141,6 11 230,0
Sulawesi Utara - - 1 13,5 1 1,0 - 29,0 - - 6 57,8 4 32,1 Sulawesi Tengah - - - - - - - 2,5 1 0,8 1 3,3 2 51,6 Sulawesi Selatan - - - - 1 0,8 - - 2 12,0 6 77,0 4 144,0 Sulawesi Tenggara 1 2,2 - - - - - - - - 3 3,6 1 2,3 Gorontalo - - - - - - - - - - - - - - Sulawesi Barat - - - - - - - - - - - - - -
- - MALUKU DAN PAPUA 1 1,0 - - - - - - - - 5 8,7 7 302,2
Maluku - - - - - - - - - - - - 1 0,7 Maluku Utara - - - - - - - - - - 2 5,9 1 134,5 Papua 1 1,0 - - - - - - - - 3 2,8 5 167,0 Papua Barat - - - - - - - - - - - - - -
88 265,4 121 3.446,0 95 604,7 100 479,9 113 413,1 1.221 10.815,3 424 3.770,2
Catatan : 0 Angka tahunan adalah jumlah Proyek Baru serta nilai investasi proyek baru dan perluasan0 Jika ada Angka proyek tanpa investasi berarti proyek pertambangan (Kontrak karya), sebaliknya jika ada angka investasi tanpa proyek berarti proyek perluasan
Sumber : Badan Koordinasi Penanaman Modal
Project Investment Project
Triwulan I - 2010 Jan 1st up to Dec 31st 1st Quarter 2010
[12] [13] [14] [15]
Investasi Proyek Investasi
2009
66
InvestmentProyek
J U M L A H / T O T A L
2009Proyek
Investment Investment
Desember
ProyekInvestasi InvestasiInvestment
Investasi
September
[2]Project Investment
[3]
Proyek
Agustus Oktober
ProjectInvestasi
[7] [8]Project
LokasiLocation
[1] [4] [9]Investment
[5]
Proyek
[6]
Investasi
[10] [11]
Proyek
November
Project Project
https:
//www.b
ps.go.id
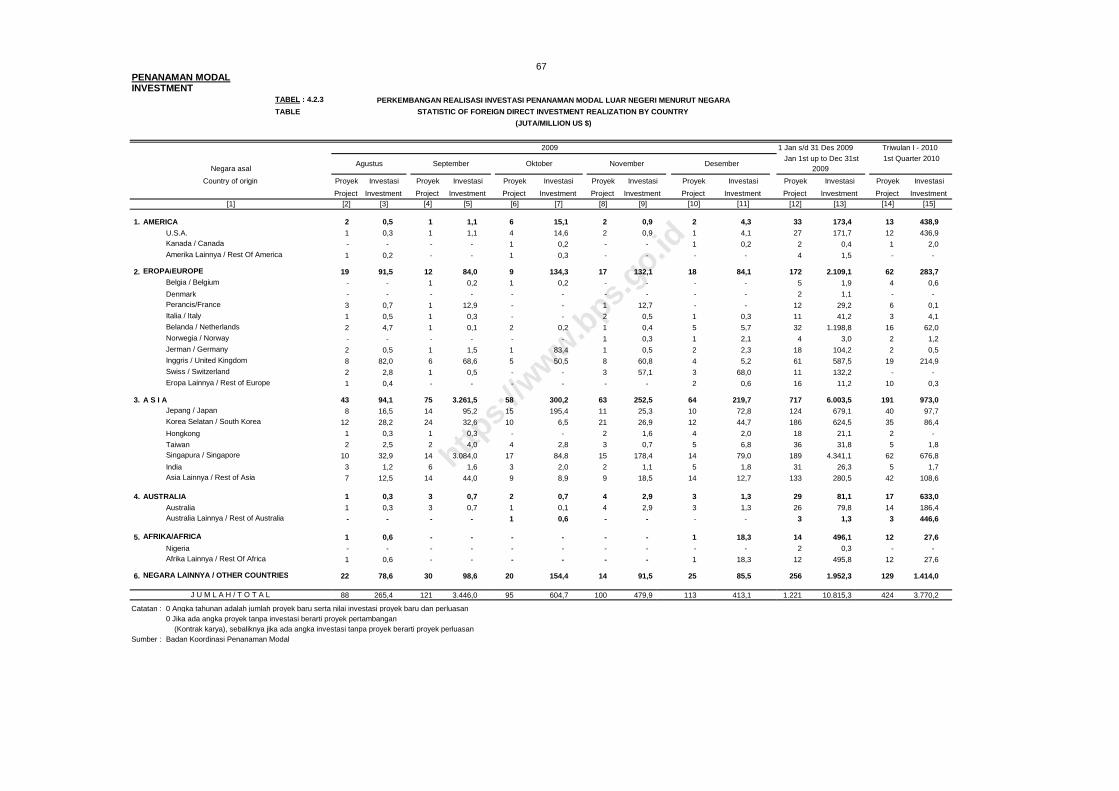
PENANAMAN MODALINVESTMENT
TABEL : 4.2.3 PERKEMBANGAN REALISASI INVESTASI PENANAMAN MODAL LUAR NEGERI MENURUT NEGARA
TABLE STATISTIC OF FOREIGN DIRECT INVESTMENT REALIZATION BY COUNTRY
(JUTA/MILLION US $)
1 Jan s/d 31 Des 2009
1. AMERICA 2 0,5 1 1,1 6 15,1 2 0,9 2 4,3 33 173,4 13 438,9
U.S.A. 1 0,3 1 1,1 4 14,6 2 0,9 1 4,1 27 171,7 12 436,9 Kanada / Canada - - - - 1 0,2 - - 1 0,2 2 0,4 1 2,0 Amerika Lainnya / Rest Of America 1 0,2 - - 1 0,3 - - - - 4 1,5 - -
2. EROPA/EUROPE 19 91,5 12 84,0 9 134,3 17 132,1 18 84,1 172 2.109,1 62 283,7 Belgia / Belgium - - 1 0,2 1 0,2 - - - - 5 1,9 4 0,6
Denmark - - - - - - - - - - 2 1,1 - - Perancis/France 3 0,7 1 12,9 - - 1 12,7 - - 12 29,2 6 0,1 Italia / Italy 1 0,5 1 0,3 - - 2 0,5 1 0,3 11 41,2 3 4,1 Belanda / Netherlands 2 4,7 1 0,1 2 0,2 1 0,4 5 5,7 32 1.198,8 16 62,0 Norwegia / Norway - - - - - - 1 0,3 1 2,1 4 3,0 2 1,2 Jerman / Germany 2 0,5 1 1,5 1 83,4 1 0,5 2 2,3 18 104,2 2 0,5 Inggris / United Kingdom 8 82,0 6 68,6 5 50,5 8 60,8 4 5,2 61 587,5 19 214,9 Swiss / Switzerland 2 2,8 1 0,5 - - 3 57,1 3 68,0 11 132,2 - - Eropa Lainnya / Rest of Europe 1 0,4 - - - - - - 2 0,6 16 11,2 10 0,3
3. A S I A 43 94,1 75 3.261,5 58 300,2 63 252,5 64 219,7 717 6.003,5 191 973,0 Jepang / Japan 8 16,5 14 95,2 15 195,4 11 25,3 10 72,8 124 679,1 40 97,7 Korea Selatan / South Korea 12 28,2 24 32,6 10 6,5 21 26,9 12 44,7 186 624,5 35 86,4
Hongkong 1 0,3 1 0,3 - - 2 1,6 4 2,0 18 21,1 2 -
Taiwan 2 2,5 2 4,0 4 2,8 3 0,7 5 6,8 36 31,8 5 1,8 Singapura / Singapore 10 32,9 14 3.084,0 17 84,8 15 178,4 14 79,0 189 4.341,1 62 676,8
India 3 1,2 6 1,6 3 2,0 2 1,1 5 1,8 31 26,3 5 1,7 Asia Lainnya / Rest of Asia 7 12,5 14 44,0 9 8,9 9 18,5 14 12,7 133 280,5 42 108,6
4. AUSTRALIA 1 0,3 3 0,7 2 0,7 4 2,9 3 1,3 29 81,1 17 633,0
Australia 1 0,3 3 0,7 1 0,1 4 2,9 3 1,3 26 79,8 14 186,4 Australia Lainnya / Rest of Australia - - - - 1 0,6 - - - - 3 1,3 3 446,6
5. AFRIKA/AFRICA 1 0,6 - - - - - - 1 18,3 14 496,1 12 27,6
Nigeria - - - - - - - - - - 2 0,3 - - Afrika Lainnya / Rest Of Africa 1 0,6 - - - - - - 1 18,3 12 495,8 12 27,6
6. NEGARA LAINNYA / OTHER COUNTRIES 22 78,6 30 98,6 20 154,4 14 91,5 25 85,5 256 1.952,3 129 1.414,0
88 265,4 121 3.446,0 95 604,7 100 479,9 113 413,1 1.221 10.815,3 424 3.770,2
Catatan : 0 Angka tahunan adalah jumlah proyek baru serta nilai investasi proyek baru dan perluasan0 Jika ada angka proyek tanpa investasi berarti proyek pertambangan (Kontrak karya), sebaliknya jika ada angka investasi tanpa proyek berarti proyek perluasan
Sumber : Badan Koordinasi Penanaman Modal
Agustus Desember
Triwulan I - 2010
Jan 1st up to Dec 31st 1st Quarter 2010 2009
Investasi
Project Investment Project Investment[12] [13] [14] [15]
InvestasiProyek
67
ProyekInvestasi
2009
[9]Project Investment
[8][2] [5][3] [4]
Investasi
[6] [11]Project Investment
Country of origin
Negara asal
J U M L A H / T O T A L
[1]
Proyek
Project
September
[10]
Oktober November
Investment
Proyek Investasi
[7]Investment InvestmentProject Project
ProyekProyek ProyekInvestasi Investasi
https:
//www.b
ps.go.id

PRODUKSI PRODUCTION
PENJELASAN TEKNIS
A. PERTANIAN
1. Produksi padi palawija merupakan hasil perkalian antara luas panen dan rata-rata produksi per hektar. Luas panen diperoleh dari laporan bulanan Mantri Tani setiap kecamatan di seluruh Indonesia. Sedangkan rata-rata produksi per hektar didasarkan atas hasil ubinan tanaman padi dan palawija yang dilakukan oleh Mantri Tani dan Mantri Statistik setiap saat panenan padi periode Januari-April, Mei-Agustus dan September-Desember.
2. a. Produksi dan luas tanaman perkebunan besar dikumpulkan secara
lengkap setiap bulan dengan sistem pos ke perusahaan perkebunan yang aktif yang berjumlah sekitar 1 442 buah.
b. Data luas tanaman perkebunan besar yang disajikan adalah keadaan
akhir semester I, kecuali tanaman tebu adalah jumlah luas tebang setiap bulan.
c. Untuk tebu rakyat yang dimaksud dengan luas adalah luas tebang
yang produksinya dijual ke pabrik gula.
B. INDEKS PRODUKSI INDUSTRI
1. Data runtun indeks produksi industri besar dan sedang bulanan dan triwulanan yang disajikan dalam publikasi ini merupakan hasil pengolahan dari “Survei Industri Besar dan Sedang Bulanan” yang dilakukan oleh Badan Pusat Statistik.
2. Mulai tahun 2002, indeks produksi industri besar dan sedang
menggunakan kerangka sampel tahun 2000. Sesuai dengan kerangka sampel, maka indeks hanya dapat disajikan maksimal dalam 2 digit dan 1 digit ISIC revisi 3.
3. Perubahan kerangka sampel tahun 1990 dilakukan dengan
pertimbangan bahwa kerangka sampel tersebut dipandang sudah tidak representatif lagi. Selain itu dengan penggantian kerangka sampel yang baru, diharapkan “panel bias“ yang terjadi dapat dikurangi.
4. Metodologi penarikan sampel masih sama dengan yang lama, yaitu
menggunakan "Cut Off Point “ dan PPS.
TECHNICAL NOTES
A. AGRICULTURE
1. Production figures for paddy and other food crops are obtained by multiplying the total harvested area with the average yield per hectare. Data for harvested area are obtained from monthly reports of agricultural extension service officer in every districts of Indonesia. Data for average yield per hectare are based on the results of crop cutting survey for paddy and other food crops conducted by statistical officer at subdistrict level and agricultural extension service officer every harvest periods in January-April, May-August, and September-December.
2. a. Data for production and planted area of estate trees are collected
every month by complete enumeration through questionnaires mailed to about 1,442 estate enterprises which shill are functioning.
b. The published data for planted area cover agricultural production up to
the end of the harvest semester I, except for sugarcane which its production data pertain to area of canes felled every month.
c. In the case of sugarcane production from small- holders estate,
planted area, means the felled area, the sugarcanes of which are then sold to sugar factories.
B. MANUFACTURING PRODUCTION INDEX
1. The series data of the monthly and quarterly indices of industrial production for large and medium manufacturing presented in this publication is based on “Monthly Large and Medium Manufacturing Industry Survey” conducted by BPS-Statistics Indonesia.
2. Since 2002, the industrial production indices of large and medium
manufacturing have been using the 2000 sampling frame. In accordance with the sample design, the indices can be published maximally only in 2-digit and 1-digit ISIC revised 3.
3. The changes of 1990 sampling frame was done by consideration that
the sampling frame was not representative anymore. More over, with the new sampling frame, it’s hoped that “the panel bias” occurred could be reduced.
4. Methodology of the sample selection is still the same as the old one, i.e.
“Cut Off Point” and PPS.
68
https:
//www.b
ps.go.id

PRODUKSI PRODUCTION
5. Metode penghitungan indeks produksi bulanan tetap menggunakan “Metode Divisia“.
6. Formula
Penghitungan indeks produksi bulanan mengikuti langkah-langkah sebagai berikut:
a. Rasio komoditi.
1
2
ijk
ijkijk Q
QR =
(a)
b. Rasio perusahaan.
( )
∑∑
=k
ijk
kijk
ijkR
V
V
ij eR
lnx
(b)
c. Rasio 2-digit ISIC.
( )
∑∑
=ij
ijadjij
ijadjijR
VW
VW
eRlnx
2 (c)
d. Rasio 1-digit ISIC.
( )
∑∑
=i
i
iii
ii RVW
VW
tot eR
222
22 lnx
(d)
e. Indeks produksi.
ttt RxII 1−= ………… (e)
f. Indeks produksi triwulanan dihitung berdasarkan rata-rata indeks
selama tiga bulan pada triwulan yang bersangkutan.
5. The methodology of calculation for the monthly production indices is still
using “Divisia Method”. 6. Formula
Computation of the monthly production indices follow these steps:
a. Commodity ratio.
1
2
ijk
ijkijk Q
QR =
(a)
b. Establishment ratio.
( )
∑∑
=k
ijk
kijk
ijkR
V
V
ij eR
lnx
(b)
c. 2-digit ISIC ratio.
( )
∑∑
=ij
ijadjij
ijadjijR
VW
VW
eRlnx
2 (c)
d 1-digit ISIC ratio.
( )
∑∑
=i
i
iii
ii RVW
VW
tot eR
222
22 lnx
(d)
e. Production indices.
ttt RxII 1−= …. …(e)
f. Quarterly production indices are calculated by averaging the three
month indices of the concerned quarter.
69
https:
//www.b
ps.go.id

PRODUKSI PRODUCTION Dimana :
a. Rijk adalah rasio komoditi-k untuk perusahaan-j dalam ISIC i pada
bulan ke-2 terhadap bulan ke-1. Qijk2 adalah produksi dari komoditi k untuk perusahaan j dalam ISIC
i pada bulan ke 2.
Qijk1 adalah produksi komoditi k untuk perusahaan j dalam ISIC i
pada bulan ke 1.
b. Rij adalah rasio perusahaan j dalam ISIC i pada bulan ke-2 terhadap bulan ke-1.
Vijk nilai produksi dari komoditi k untuk perusahaan j dalam ISIC i selama periode dua bulan.
c. R2 adalah rasio 2-digit ISIC pada bulan ke-2 terhadap bulan ke-1. Vij nilai output yang diproduksi oleh perusahaan j dalam ISIC i
selama periode dua bulan, dimana:
∑=k
ijkij VV
Vi2 total nilai produksi dari seluruh perusahaan untuk 2 digit ISIC i selama periode dua bulan, dimana:
∑=j
iji VV 2
Wi2 adalah total penimbang sampling dari seluruh perusahaan dalam 2 digit ISIC i selama periode dua bulan, dimana:
∑=j
ijiji VWWadj2
Wij adj adalah penimbang sampling yang disesuaikan untuk perusahaan j dalam 2 digit ISIC i.
d. Rtot adalah rasio total produksi pada bulan ke-2 terhadap bulan
ke-1.
e. It adalah indeks produksi total setiap ISIC pada bulan ke t.
It-1 adalah indeks produksi total pada bulan ke t-1.
Rt adalah rasio untuk setiap ISIC pada bulan ke t
Where:
a. Rijk is the ratio of commodity k for establishment j in ISIC i of the 2nd months to the 1st month.
Qijk2 is the production of commodity k for establishment j in
ISIC i at the 2nd month.
Qijk1 is the production of commodity k for establishment j in ISIC i at
the 1st month. b. Rij is the ratio of establishment j in ISIC i of the 2nd month to the 1st
month.
Vijk is the production value of commodity k for establishment j in ISIC i
during the two-month period. c. R2 is the 2-digit ISIC ratio of the 2nd month to the 1st month.
Vij is the production value of establishment j in ISIC i during the two-
month period, where:
∑=k
ijkij VV
Vi2 is the total of production value for all establishments in 2-digit ISIC i
during the two-month period, where:
∑=j
iji VV 2
Wi2 is the total of sampling weight for all establishments in 2-digit ISIC i during the two-month period, where:
∑=j
ijiji VWWadj2
Wij adj is the sampling weight adjusted for establishment j in 2-digit ISIC i.
d. Rtot is the ratio of production total of the 2nd month to the 1st month.
e. It is the index of total production in the t-th month.
It-1 is the index of total production in the t-1 month.
Rt is the ratio for each ISIC in the t-th month.
70
https:
//www.b
ps.go.id
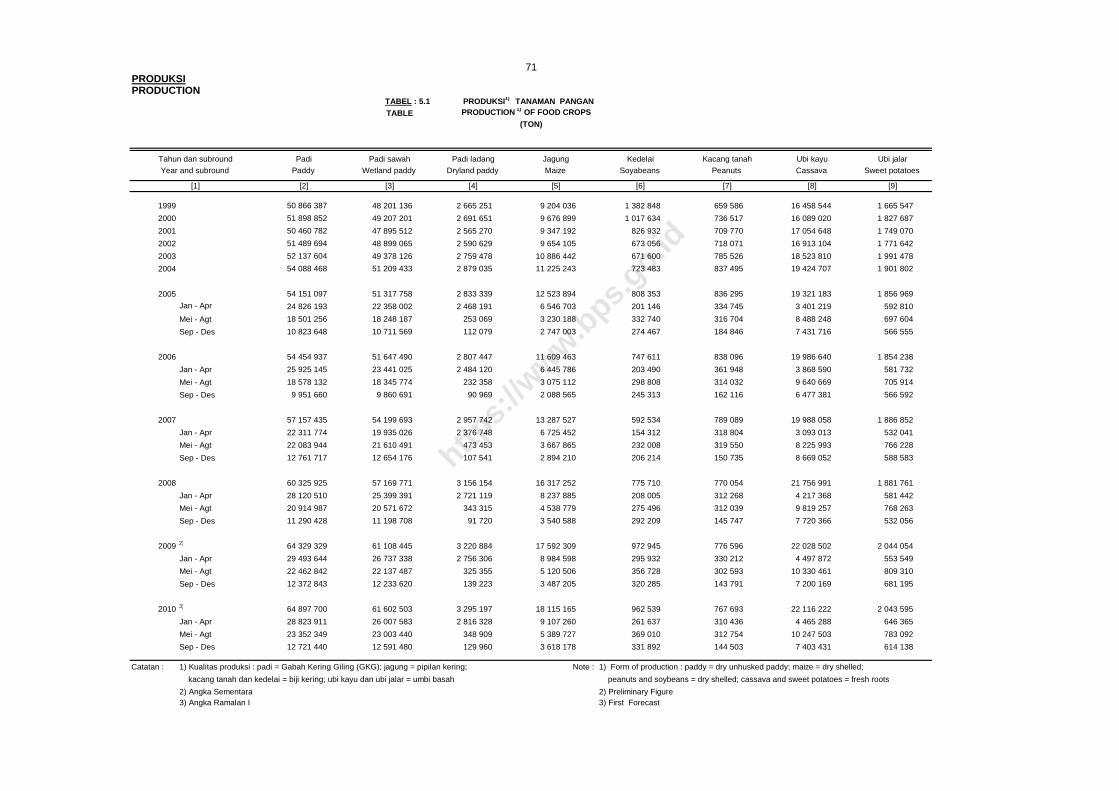
TABEL : 5.1 PRODUKSI1) TANAMAN PANGANTABLE PRODUCTION 1) OF FOOD CROPS
1999 50 866 387 48 201 136 2 665 251 9 204 036 1 382 848 659 586 16 458 544 1 665 547
2000 51 898 852 49 207 201 2 691 651 9 676 899 1 017 634 736 517 16 089 020 1 827 687
2001 50 460 782 47 895 512 2 565 270 9 347 192 826 932 709 770 17 054 648 1 749 070
2002 51 489 694 48 899 065 2 590 629 9 654 105 673 056 718 071 16 913 104 1 771 642
2003 52 137 604 49 378 126 2 759 478 10 886 442 671 600 785 526 18 523 810 1 991 478
2004 54 088 468 51 209 433 2 879 035 11 225 243 723 483 837 495 19 424 707 1 901 802
2005 54 151 097 51 317 758 2 833 339 12 523 894 808 353 836 295 19 321 183 1 856 969
Jan - Apr 24 826 193 22 358 002 2 468 191 6 546 703 201 146 334 745 3 401 219 592 810
Mei - Agt 18 501 256 18 248 187 253 069 3 230 188 332 740 316 704 8 488 248 697 604
Sep - Des 10 823 648 10 711 569 112 079 2 747 003 274 467 184 846 7 431 716 566 555
2006 54 454 937 51 647 490 2 807 447 11 609 463 747 611 838 096 19 986 640 1 854 238
Jan - Apr 25 925 145 23 441 025 2 484 120 6 445 786 203 490 361 948 3 868 590 581 732
Mei - Agt 18 578 132 18 345 774 232 358 3 075 112 298 808 314 032 9 640 669 705 914
Sep - Des 9 951 660 9 860 691 90 969 2 088 565 245 313 162 116 6 477 381 566 592
2007 57 157 435 54 199 693 2 957 742 13 287 527 592 534 789 089 19 988 058 1 886 852
Jan - Apr 22 311 774 19 935 026 2 376 748 6 725 452 154 312 318 804 3 093 013 532 041
Mei - Agt 22 083 944 21 610 491 473 453 3 667 865 232 008 319 550 8 225 993 766 228
Sep - Des 12 761 717 12 654 176 107 541 2 894 210 206 214 150 735 8 669 052 588 583
2008 60 325 925 57 169 771 3 156 154 16 317 252 775 710 770 054 21 756 991 1 881 761
Jan - Apr 28 120 510 25 399 391 2 721 119 8 237 885 208 005 312 268 4 217 368 581 442
Mei - Agt 20 914 987 20 571 672 343 315 4 538 779 275 496 312 039 9 819 257 768 263
Sep - Des 11 290 428 11 198 708 91 720 3 540 588 292 209 145 747 7 720 366 532 056
2009 2) 64 329 329 61 108 445 3 220 884 17 592 309 972 945 776 596 22 028 502 2 044 054
Jan - Apr 29 493 644 26 737 338 2 756 306 8 984 598 295 932 330 212 4 497 872 553 549
Mei - Agt 22 462 842 22 137 487 325 355 5 120 506 356 728 302 593 10 330 461 809 310
Sep - Des 12 372 843 12 233 620 139 223 3 487 205 320 285 143 791 7 200 169 681 195
2010 3) 64 897 700 61 602 503 3 295 197 18 115 165 962 539 767 693 22 116 222 2 043 595
Jan - Apr 28 823 911 26 007 583 2 816 328 9 107 260 261 637 310 436 4 465 288 646 365
Mei - Agt 23 352 349 23 003 440 348 909 5 389 727 369 010 312 754 10 247 503 783 092
Sep - Des 12 721 440 12 591 480 129 960 3 618 178 331 892 144 503 7 403 431 614 138
Catatan : 1) Kualitas produksi : padi = Gabah Kering Giling (GKG); jagung = pipilan kering; 1) Form of production : paddy = dry unhusked paddy; maize = dry shelled;
kacang tanah dan kedelai = biji kering; ubi kayu dan ubi jalar = umbi basah peanuts and soybeans = dry shelled; cassava and sweet potatoes = fresh roots
2) Angka Sementara 2) Preliminary Figure3) Angka Ramalan I 3) First Forecast
Note :
71PRODUKSIPRODUCTION
Ubi jalarJagung KedelaiPadi ladang
(TON)
Sweet potatoes
[9]
Kacang tanahPeanuts
[7]
Ubi kayuCassavaDryland paddy
[4] [8][5]
Maize Soyabeans
[6]
Year and subround
[1]
Tahun dan subround Padi sawahPadiPaddy
[2]
Wetland paddy
[3]
https:
//www.b
ps.go.id

PRODUKSIPRODUCTION
TABEL : 5.2 PRODUKSI DAN PERSEDIAAN 1) TANAMAN PERKEBUNAN BESAR
TABLE PRODUCTION AND STOCKS 1) OF ESTATE CROPS
1999 293,7 17,8 4 454,5 107,8 1 012,4 32,7 58,9 6,1 27,5 2,9 126,4 11,7 0,9 0,0 1 801,4 378,9 5,8 1,02000 375,8 22,8 4 574,5 111,1 1 039,7 35,1 57,7 5,1 28,3 5,1 123,1 11,9 0,8 0,0 1 780,1 360,5 6,1 0,12001 397,7 22,3 5 016,4 134,6 1 137,9 44,4 57,9 5,5 27,0 4,9 126,7 13,5 0,7 0,0 1 824,6 259,5 5,5 0,42002 403,7 22,3 6 195,6 140,9 1 209,7 48,2 48,2 4,6 26,7 4,0 120,4 10,2 0,6 0,0 1 901,3 288,7 5,3 0,32003 396,1 24,3 6 923,5 159,6 1 529,2 49,1 56,6 4,3 29,4 2,4 126,2 13,1 0,8 0,0 1 991,6 295,5 5,2 0,52004 403,8 19,6 8 479,3 139,3 1 862,0 44,3 54,9 5,1 29,2 5,5 125,5 12,9 0,7 0,0 2 051,6 177,9 2,7 0,12005 432,2 22,2 10 119,0 156,5 2 155,9 42,6 55,1 4,2 24,8 2,9 128,2 13,7 0,8 0,0 2 241,7 176,2 4,0 0,12006 554,6 22,6 10 961,8 174,4 2 363,1 44,8 67,2 3,8 28,9 2,7 115,4 14,3 0,8 0,0 2 307,0 225,1 4,2 0,2
2007 578,5 30,0 11 438,0 181,2 2 593,2 57,9 68,6 4,4 24,1 2,4 116,5 14,1 0,5 0,0 2 623,8 251,6 3,1 0,2
2008 x) 613,5 22,5 11 623,8 195,2 2 646,6 68,1 71,3 3,2 25,6 2,0 114,9 15,8 0,4 0,0 2 800,9 212,7 3,2 0,2Januari 59,7 27,3 1 049,7 98,2 239,0 32,8 5,2 3,6 0,1 1,3 10,4 12,4 0,0 0,0 2,9 73,3 0,1 0,1Februari 53,6 20,0 876,4 75,2 199,5 23,6 4,2 2,3 0,1 0,9 8,6 11,9 0,0 0,0 15,9 52,6 0,1 0,2Maret 45,6 22,3 973,3 109,0 221,6 86,2 5,1 2,2 0,2 0,6 8,1 12,3 0,0 0,0 22,3 27,2 0,1 0,2April 43,8 21,5 916,4 112,6 208,7 80,5 6,6 3,0 0,4 0,6 10,3 12,7 0,0 0,0 75,5 21,3 0,3 0,2Mei 55,0 22,2 977,2 116,7 222,5 104,7 7,7 3,9 1,7 1,0 12,5 11,4 0,0 0,0 238,5 138,6 0,3 0,2Juni 49,7 21,0 1 004,2 121,5 228,6 98,8 6,0 3,7 4,6 2,2 8,6 10,4 0,1 0,0 487,9 305,5 0,4 0,2Juli 53,6 21,1 1 053,2 128,4 239,8 86,4 5,6 3,7 6,6 4,3 8,2 11,7 0,1 0,0 545,4 210,1 0,4 0,2Agustus 49,7 20,1 1 005,5 117,3 229,0 82,5 4,4 3,8 7,2 7,7 7,7 10,8 0,1 0,0 677,5 368,9 0,5 0,2September 46,3 14,3 855,1 150,1 194,7 104,0 6,9 4,6 2,1 7,5 8,4 10,9 0,1 0,0 360,5 336,9 0,4 0,2Oktober 45,0 12,3 1 009,9 204,3 229,9 118,5 7,4 4,9 1,2 6,4 11,2 11,4 0,0 0,0 243,2 381,6 0,3 0,3November 47,0 16,5 979,4 202,7 223,0 118,9 6,0 4,5 1,1 5,6 10,1 11,8 0,0 0,0 105,7 334,3 0,2 0,2Desember 64,5 22,5 923,5 195,2 210,3 68,1 6,2 3,2 0,3 2,0 10,8 15,8 0,0 0,0 25,6 212,7 0,1 0,2
2009 xx) 513,6 16,3 12 618,9 168,9 2 784,9 110,9 67,1 3,7 26,6 5,2 121,8 11,8 0,6 0,0 2 590,5 258,7 3,2 0,2Januari 43,1 24,2 884,9 113,8 177,2 36,0 4,5 3,2 0,2 1,1 10,9 13,3 0,0 0,0 2,1 62,0 0,1 0,1Februari 38,7 18,8 814,6 82,0 163,6 22,3 3,7 2,3 0,1 0,8 9,0 12,2 0,0 0,0 12,2 45,3 0,2 0,2Maret 34,5 25,2 967,1 109,6 192,1 73,8 4,3 2,3 0,3 0,6 10,8 11,9 0,0 0,0 18,7 24,7 0,2 0,2April 34,9 23,1 1 032,7 120,5 238,5 76,5 6,1 3,4 0,4 0,6 11,8 12,4 0,0 0,0 66,9 22,2 0,3 0,2Mei 44,7 24,3 1 116,8 115,7 256,9 103,8 6,8 4,4 1,6 1,0 11,4 10,9 0,1 0,1 184,7 134,3 0,3 0,2Juni 42,7 19,6 1 158,0 138,1 266,3 109,7 5,6 3,7 4,8 2,3 10,3 11,0 0,1 0,0 477,3 298,3 0,3 0,2Juli 45,8 18,5 1 125,9 137,0 223,7 85,1 5,5 3,6 7,9 5,0 9,0 12,6 0,1 0,0 533,9 205,5 0,4 0,2
Agustus 42,5 17,3 1 150,9 133,2 268,2 92,5 4,1 3,6 7,5 8,4 8,5 11,8 0,1 0,0 594,2 332,3 0,4 0,2September 45,7 12,7 1 121,7 193,7 263,6 133,6 6,7 4,5 1,7 7,7 9,2 11,9 0,1 0,0 380,5 329,3 0,3 0,2Oktober 44,5 12,2 1 077,3 221,0 238,7 126,4 7,1 4,2 1,0 7,4 9,5 10,8 0,1 0,0 204,6 368,9 0,2 0,2November 41,4 14,9 1 098,0 225,9 258,0 133,8 6,3 4,3 0,8 6,1 10,2 11,5 0,0 0,0 89,3 314,3 0,2 0,2Desember 55,1 16,3 1 071,0 168,9 238,1 110,9 6,4 3,7 0,3 5,2 11,2 11,8 0,0 0,0 26,1 258,7 0,3 0,2
2010 xx)
Januari 44,3 22,6 967,1 121,7 229,4 68,7 4,8 3,4 0,2 2,5 10,2 12,7 0,0633 0,0 2,5 65,7 0,1 0,1Februari 41,3 16,3 938,1 94,3 210,8 62,0 4,4 2,3 0,1 2,3 9,0 11,9 0,0628 0,0 13,0 48,8 0,2 0,2Maret 37,3 20,7 1 048,3 125,0 227,4 123,7 5,0 2,2 0,2 2,3 10,4 12,0 0,0641 0,0 18,1 26,6 0,1 0,2April 36,7 19,2 1 095,8 132,1 231,5 100,4 6,4 3,1 0,4 1,6 11,2 12,6 0,0603 0,0 58,6 20,7 0,3 0,2
Catatan :1) Persediaan pada akhir bulan yang siap jual, bukan cadangan penyangga Note : 1) Marketable stock at the end of the month, does not include the buffer stock2) Termasuk produksi yang bahan mentahnya dari perkebunan rakyat 2) Including production which uses raw materials from smallholders
Prod Stock Prod Stock Prod Stock Prod Stock[2]
Prod Stock Prod[6][5][4][3] [10][9][8][7][1] [19][18][17][16][15][14][13][12][11]
StockYear and month Stock Prod Stock Prod Stock Prod
72
CoklatBiji sawit Minyak sawit Karet kering Tembakau 2)Gula tebu 2)
( 000 TON)
Palm oilDry rubber Cocoa TobaccoCane sugarTahun dan bulan Palm kernel Cinchona barkTeaCoffee
Kopi Teh Kulit kina
https:
//www.b
ps.go.id

PRODUKSIPRODUCTION
TABEL : 5.4.1 PRODUKSI BULANAN 8 BAHAN TAMBANG DI INDONESIA
TABLE MONTHLY PRODUCTION OF 8 MINERALS IN INDONESIA
2001 490 145 61 862 3 289 499 3 635 351 1 275 634 90 351 844 166 091 348 332
2002 474 884 88 142 3 786 695 4 366 235 1 283 485 103 060 426 142 238 288 806
2003 420 995 71 695 3 238 306 4 395 429 1 262 595 114 610 123 141 019 285 205
2004 438 455 70 338 2 810 333 4 118 980 1 330 827 126 850 806 92 444 262 932
2005 387 698 78 404 3 553 808 3 706 998 1 419 666 152 722 438 142 894 326 993
2006 366 993 80 933 2 938 009 4 353 833 1 501 937 181 060 907 93 176 270 153
2007 357 143 66 137 2 814 952 7 118 436 1 251 147 174 832 673 117 851 268 967
2008 357 501 47 626 2 340 100 6 557 103 1 594 196 181 569 985 62 695 302 292
2009 x)
Februari 27 080 2 789 259 548 325 754 97 568 14 437 772 7 733 21 140
Maret 29 728 1 947 316 193 285 361 66 088 15 727 199 10 613 33 400
April 28 127 624 286 632 620 466 108 703 15 928 769 9 866 25 018
Mei 29 083 2 485 340 953 557 811 122 616 16 716 497 11 874 29 899
Juni 28 437 4 181 298 093 598 798 101 977 17 615 020 12 238 28 612
Juli 29 344 5 133 308 401 518 175 106 345 18 280 884 13 417 30 292
Agustus 29 056 5 268 276 930 584 875 112 554 19 039 454 11 460 24 799
September 28 388 7 209 266 888 641 323 144 623 17 707 311 10 714 28 449
Oktober 29 346 5 609 284 789 450 214 130 975 20 519 170 10 571 23 221
November 28 437 3 804 287 177 321 854 86 509 18 625 631 10 514 23 814
Desember 29 531 3 425 283 291 455 021 96 524 19 820 872 10 972 30 336
2010 xx)
Januari 29 298 4 710 286 399 352 783 88 657 14 706 979 11 244 28 106
Februari 29 171 5 725 285 996 468 742 109 493 19 325 963 12 182 28 067
Catatan : 1) Termasuk Kondensat Note : 1) Including Condensate `2) Since 1983, data on gold and silver produced by private enterprises have been included
Sumber : Departemen Pertambangan & Energi Source: Department of Mining & Energy
2) Mulai tahun 1983, produksi emas dan perak termasuk produksi perusahaan swasta
[1] [2] [3] [4] [5]
Perak 2)
(metric ton)
concentrate
Tahun dan bulan
Year and month
Minyak bumi 1)
Crude petroleum
(000 barrels) (metric ton)
Konsentrat
timah
Tin ore
76
Batu bara
Coal
Konsentrat
bijih tembaga
SilverCopper ore
Bijih nikel Emas 2)
Gold
Bauxite
Nickel ore
(metric ton)
[9]
(Kg)
(metric ton)
concentrate
[8]
(Kg)(metric ton)
[7][6]
https:
//www.b
ps.go.id
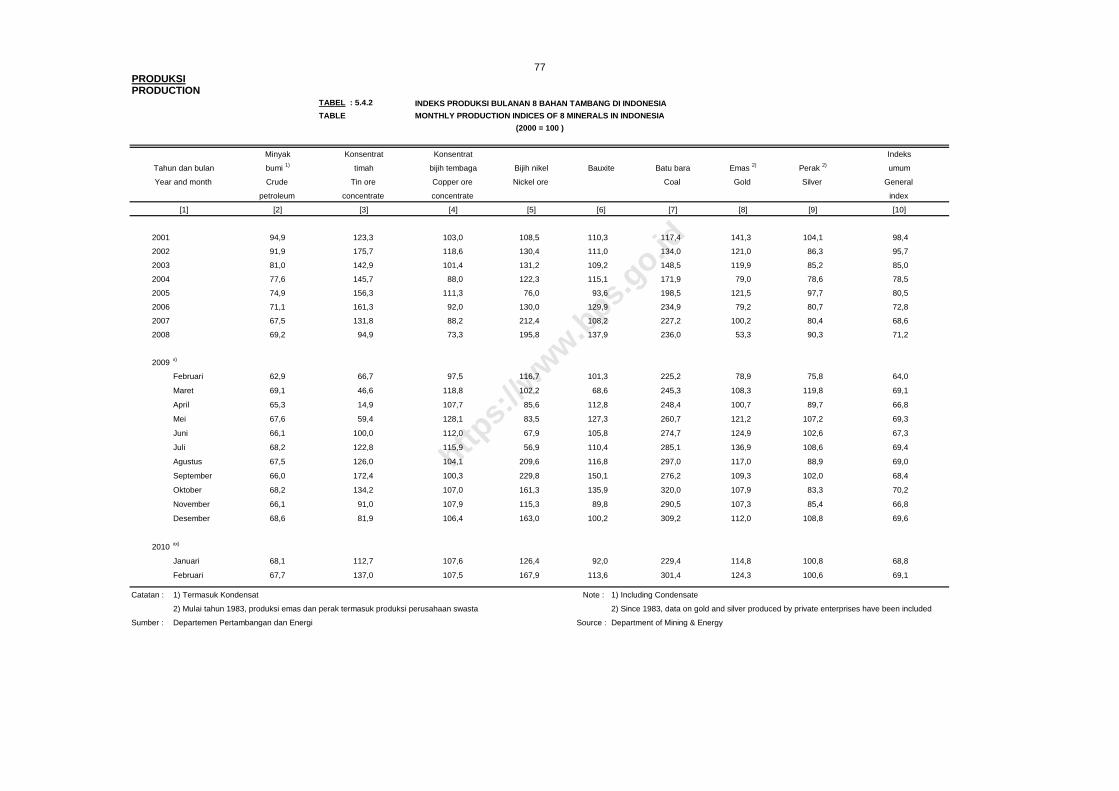
PRODUKSIPRODUCTION
TABEL : 5.4.2 INDEKS PRODUKSI BULANAN 8 BAHAN TAMBANG DI INDONESIA
TABLE MONTHLY PRODUCTION INDICES OF 8 MINERALS IN INDONESIA
2001 94,9 123,3 103,0 108,5 110,3 117,4 141,3 104,1 98,4
2002 91,9 175,7 118,6 130,4 111,0 134,0 121,0 86,3 95,7
2003 81,0 142,9 101,4 131,2 109,2 148,5 119,9 85,2 85,0
2004 77,6 145,7 88,0 122,3 115,1 171,9 79,0 78,6 78,5
2005 74,9 156,3 111,3 76,0 93,6 198,5 121,5 97,7 80,5
2006 71,1 161,3 92,0 130,0 129,9 234,9 79,2 80,7 72,8
2007 67,5 131,8 88,2 212,4 108,2 227,2 100,2 80,4 68,6
2008 69,2 94,9 73,3 195,8 137,9 236,0 53,3 90,3 71,2
2009 x)
Februari 62,9 66,7 97,5 116,7 101,3 225,2 78,9 75,8 64,0
Maret 69,1 46,6 118,8 102,2 68,6 245,3 108,3 119,8 69,1
April 65,3 14,9 107,7 85,6 112,8 248,4 100,7 89,7 66,8
Mei 67,6 59,4 128,1 83,5 127,3 260,7 121,2 107,2 69,3
Juni 66,1 100,0 112,0 67,9 105,8 274,7 124,9 102,6 67,3
Juli 68,2 122,8 115,9 56,9 110,4 285,1 136,9 108,6 69,4
Agustus 67,5 126,0 104,1 209,6 116,8 297,0 117,0 88,9 69,0
September 66,0 172,4 100,3 229,8 150,1 276,2 109,3 102,0 68,4
Oktober 68,2 134,2 107,0 161,3 135,9 320,0 107,9 83,3 70,2
November 66,1 91,0 107,9 115,3 89,8 290,5 107,3 85,4 66,8
Desember 68,6 81,9 106,4 163,0 100,2 309,2 112,0 108,8 69,6
2010 xx)
Januari 68,1 112,7 107,6 126,4 92,0 229,4 114,8 100,8 68,8
Februari 67,7 137,0 107,5 167,9 113,6 301,4 124,3 100,6 69,1
Catatan : Note : 1) Including Condensate
2) Mulai tahun 1983, produksi emas dan perak termasuk produksi perusahaan swasta 2) Since 1983, data on gold and silver produced by private enterprises have been included
Sumber : Source : Department of Mining & Energy
[5]
Bauxite
[8] [9]
Perak 2)
Silver
77
[1] [2] [3] [4]
Copper ore
[6] [7] [10]
Indeks
index
Gold
Emas 2)
concentrate
Nickel ore
Bijih nikel umum
General
(2000 = 100 )
concentrate
Konsentrat
timah
Tin ore
Konsentrat
bijih tembaga Batu bara
Coal
Minyak
Departemen Pertambangan dan Energi
1) Termasuk Kondensat
Tahun dan bulan
petroleum
Year and month
bumi 1)
Crude
https:
//www.b
ps.go.id

PRODUKSIPRODUCTION
TABEL : 5.5
TABLE
2001 46 436 443 710 490 145 2 803 034 1 257 446 2 190 120
2002 61 071 413 813 474 884 3 031 028 1 352 878 1 792 575
2003 44 006 376 989 420 995 3 142 605 1 347 349 1 921 757
2004 43 337 395 119 438 455 3 113 338 1 390 466 1 677 619
2005 41 626 346 073 387 698 3 036 195 1 338 782 1 581 727
2006 42 256 324 737 366 993 3 178 278 1 159 770 1 238 572
2007 41 024 316 119 357 143 2 949 506 1 258 951 1 671 715
2008 42 069 315 432 357 501 2 893 415 1 093 435 1 690 511
2009 x)
Februari 3 310 23 770 27 080 234 415 80 465 134 301
Maret 3 705 26 023 29 728 254 112 81 558 141 395
April 3 577 24 550 28 127 244 535 81 651 147 502
Mei 3 816 25 267 29 083 249 708 83 302 126 613
Juni 3 794 24 643 28 437 255 507 81 298 126 497
Juli 3 943 25 401 29 344 250 803 78 637 125 015
Agustus 4 044 25 012 29 056 256 614 78 048 121 603
September 3 964 24 424 28 388 248 403 76 752 123 530
Oktober 4 047 25 299 29 346 260 303 82 678 126 145
November 3 937 24 500 28 437 258 592 77 595 129 578
Desember 3 996 25 535 29 531 260 026 76 756 130 063
2010 xx)
Januari 4 549 24 749 29 298 263 965 76 032 130 487
Februari 4 326 24 845 29 171 263 301 74 998 125 001
CRUDE PETROLEUM (INCLUDING CONDENSATE) AND GAS PRODUCTION
(000 BARRELS )
[6][3]
Pertamina Kontrak produksi bagi hasil
[4]
Jumlah
[5] [7]
78
Gas / GasMinyak / Petroleum (000 barrels)
G A S (000 MSCF) L N G (000 MMBTU) L P G (MT)Year and monthTahun dan bulan
PRODUKSI MINYAK MENTAH (TERMASUK KONDENSAT) DAN GAS
[1] [2]
Production sharing contract Total
https:
//www.b
ps.go.id

NERACA PEMBAYARAN DAN PERDAGANGAN LUAR NEGERI BALANCE OF PAYMENTS AND INTERNATIONAL TRADE
PENJELASAN TEKNIS A. NERACA PEMBAYARAN 1. Data Neraca Pembayaran dikutip dari Statistik Ekonomi Keuangan
Bank Indonesia. Perhitungan dilakukan oleh Bank Indonesia. 2. Angka nilai ekspor dan impor pada neraca pembayaran berbeda dengan
angka dari Badan Pusat Statistik karena : a. Perbedaan konsep pencatatan antara Badan Pusat Statistik dan
Bank Indonesia. b. Pencatatan Statistik Ekspor/Impor oleh BPS hanya bersumber dari
dokumen PEB/PIB. Ekspor/Impor yang dilakukan dengan tidak menggunakan dokumen PEB/PIB tidak dicatat oleh BPS.
B. PERDAGANGAN LUAR NEGERI 1. Pencatatan Statistik Ekspor berdasarkan dokumen Pemberitahuan
Ekspor Barang (PEB) dan Pemberitahuan Ekspor Barang Tertentu (PEBT), dan pencatatan Statistik Impor berdasarkan dokumen Pemberitahuan Impor Barang (PIB), yang diterima BPS dari Kantor-kantor Bea dan Cukai.
2. Pencatatan Statistik Ekspor dan Impor meliputi seluruh wilayah
pabean Indonesia, termasuk barang yang masuk dalam Kawasan Berikat Nusantara dan Pulau Batam.
3. Barang-barang yang tidak termasuk dalam pencatatan adalah :
a. Barang-barang yang di ekspor/impor tidak menggunakan PEB/PIB. b. Pakaian dan barang-barang perhiasan penumpang untuk pakai
sendiri. c. Barang-barang Korps Diplomatik.
TECHNICAL NOTES A. BALANCE OF PAYMENTS 1. Data for Balance of Payments are obtained from the Indonesian Financial
and Economic Statistics, which data have been compiled by Bank Indonesia.
2. The Statistics on export and import values in the Balance of Payments
are different from the statistics of export and import values compiled by BPS Statistics Indonesia because of the following reasons:
a. Differences in the concepts used for recording data. b. The export/import statistics of the BPS Statistics Indonesia are
derived only from PEB/PIB documents. Export/Import statistics derived from non-PEB/PIB documents are not recorded by the BPS Statistics Indonesia.
B. FOREIGN TRADE 1. Export Statistics are compiled based on the PEB documents (notification
of export of goods) and PEBT (natification of export of certain goods), and Import Statistics are compiled based on the PIB documents, received by the BPS- Statistics Indonesia from Coustom Offices.
2. The recording of exports and imports statistics covers all Indonesian
customs areas, included goods entering through the Bonded Zone and Batam island.
3. Goods which are not recorded are :
a. Exported/Imported goods without PEB/PIB documents. b. Clothing and accessories for passengers personal use. c. Goods under Diplomatic carriers.
79
https:
//www.b
ps.go.id

NERACA PEMBAYARAN DAN PERDAGANGAN LUAR NEGERI BALANCE OF PAYMENTS AND INTERNATIONAL TRADE
d. Barang-barang eksebisi/pameran dan promosi. e. Barang-barang untuk contoh. f. Pembungkus/peti kemas untuk diisi kembali.
4. Sistem pengolahan adalah Carry over. Dokumen dari satu bulan tertentu
penerimaannya ditutup setelah satu bulan pada bulan berikutnya. Dokumen yang datang sesudah tanggal penutupan dianggap sebagai transaksi bulan berikutnya.
5. Klasifikasi jenis/kelompok barang yang digunakan adalah:
a. Harmonized System (HS), untuk keperluan pengenaan tarif b. Standard International Trade Clasification (SITC), penyusunannya
ditekankan untuk keperluan Statistik Ekonomi (lihat tabel 6.3 dan 6.11, 1 digit SITC)
c. International Standard Industrial Classification (ISIC), untuk mengelompokkan lapangan usaha yang ada dalam kegiatan ekonomi atau asal lapangan usaha suatu komoditi dihasilkan. (lihat tabel 6.4 sampai dengan 6.7).
d. Broad Economic Category (BEC), untuk mengetahui penggunaan akhir dari suatu barang yaitu barang konsumsi, bahan baku dan penolong, dan barang modal. Lihat tabel 6.14 sampai dengan 6.17
e. General Agreement on Tarrifs and Trade (GATT), untuk mengetahui barang primer yaitu SITC kepala 1, 2, 3, 4 dan 68, dan barang bukan primer yaitu SITC kepala 5, 6, kecuali 68, 7 dan 8. Lihat tabel 6.10.
6. Angka tahunan dari nilai ekspor dan impor merupakan angka yang sudah
diperbaiki pada bulan-bulan tahun yang bersangkutan.
d. Goods for exhibition and promotion. e. Sample goods. f. Containers which are to be used again.
4. All documents are processed using a carry-over system. The deadline for
accepting documents is one month after the reference month. Documents received after the deadline are considered as to relate to transaction in the following month.
5. Goods Classification is based on :
a. Harmonized System (HS), for tariff purposes. b. Standard International Trade Clasification (SITC), mainly for economic
statistics compilation purpose (refer to Table 6.3 and 6.11 with 1 digit SITC code).
c. International Standard Industrial Classification (ISIC), for grouping by industries of origin. (refer to Table 6.4 to 6.7).
d. Broad Economic Category (BEC), is meant to group commoditis by type of final uses such as different final use of consumption goods, raw material and auxiliary goods, and capital goods, (refer to Tables 6.14 to 6.17).
e. General Agreement on Tarrifs and Trade (GATT), for distinguishing primary goods, (with SITC first codes 1, 2, 3, 4 and 68) for non-primary goods (with SITC first codes 5, 6, 7, 8. Refer to Table 6.10).
6. The annual export and import figures are the total of the revised monthly
figures in the related year.
80
https:
//www.b
ps.go.id

TABEL : 6.1 NERACA PEMBAYARAN
TABLE BALANCE OF PAYMENTS
I. Transaksi Berjalan / Current Account 7 822 8 106 1 564 278 10 859 10 492 2 742 -1 013 - 967 r) - 637 2 509 r) 2 481 r) 2 150 r) 3 442
A. 23 513 24 562 20 152 17 534 29 660 32 754 7 536 5 443 5 771 4 166 6 886 r) 8 367 r) 8 491 r) 11 454
a. 59 165 64 109 70 767 86 995 103 528 118 014 34 412 37 345 38 081 29 768 24 179 r) 28 130 r) 31 273 r) 35 932
i. 46 307 48 875 54 482 66 752 80 578 93 142 26 405 27 879 28 796 24 805 20 530 23 751 25 603 r) 29 178
ii. 12 858 15 234 16 285 20 242 22 950 24 872 8 007 9 466 9 284 4 963 3 648 r) 4 378 r) 5 670 r) 6 754
b. - 35 652 -39 546 -50 615 -69 463 -73 868 -85 260 -26 876 -31 902 -32 309 - 25 603 -17 293 r) -19 763 r) -22 781 r) -24 478
i. - 28 990 -31 723 -39 456 -53 431 -57 703 -66 058 -21 345 -23 725 -25 044 - 22 641 -15 196 -17 315 -18 956 r) -20 736
ii. - 6 662 -7 823 -11 159 -16 031 -16 165 -19 202 -5 531 -8 177 -7 265 - 2 962 -2 098 r) -2 448 r) -3 826 r) -3 742
B. - 9 902 -11 728 -8 811 -9 122 -9 874 -11 841 -3 071 r) -3 387 -3 313 - 3 227 -2 743 r) -3 310 r) -3 517 r) -4 585
1. - 4 092 -3 968 -3 195 -4 608 -6 079 -7 294 -2 600 -2 973 -2 972 - 2 549 -2 002 r) -2 238 r) -2 522 r) -2 888
2. 1 995 955 1 291 938 418 442 354 r) 440 617 r) 412 405 r) 400 r) 389 r) - 41
3. Jasa-jasa Lainnya, bersih / Other Services, net - 7 805 -8 714 -6 907 -5 451 -4 213 -4 989 - 825 - 854 - 959 - 1 090 -1 146 r) -1 472 r) -1 384 r) -1 656
C. Pendapatan, bersih / Income, net - 7 048 -6 217 -10 917 -12 927 -13 790 -15 525 -3 093 -4 425 -4 756 - 2 881 -2 742 r) -3 776 r) -4 072 r) -4 742
D. Transfer Berjalan, bersih / Current Tranfers, net 1 259 1 489 1 139 4 793 4 863 5 104 1 371 r) 1 356 1 331 1 305 1 109 r) 1 200 1 247 r) 1 315
II. Transaksi Modal dan Finansial - 1 102 - 949 1 852 345 3 025 3 591 - 529 2 105 2 370 - 5 822 1 502 r) -1 757 r) 2 523 r) 1 405
Capital and Financial Account
A. Transaksi Modal / Capital Account - - - 333 350 546 17 62 187 29 19 29 34 14
B. Transaksi Finansial / Financial Account - 1 102 - 949 1 852 12 2 675 3 045 - 546 2 043 2 184 - 5 850 1 483 r) -1 785 r) 2 489 r) 1 390
1. Investasi Langsung / Direct Investment 145 - 507 r) -1 512 5 271 2 188 2 253 630 197 1 871 720 453 r) 400 r) 472 r) 988
2. Investasi Portofolio / Portfolio Investment 1 222 2 251 4 409 4 190 4 277 5 566 1 984 4 188 - 74 - 4 377 1 859 1 959 2 988 r) 3 298
3. Investasi Lainnya / Other Investment - 2 469 -2 694 r) -1 045 -9 449 -3 791 -4 775 -3 160 -2 342 387 - 2 194 - 829 r) -4 144 r) - 970 r) -2 896
III. Jumlah / Total (I + II) 6 720 7 157 3 415 623 13 884 14 083 2 213 1 092 1 404 - 6 459 4 011 r) 724 r) 4 673 r) 4 847
IV. Selisih Perhitungan / Errors and Omissions - 1 691 -3 503 -3 106 - 179 625 -1 368 -1 181 r) 233 -1 493 2 246 - 56 r) 328 r) -1 127 r) - 893
V. Neraca Keseluruhan / Overall Balance (III + IV) 5 029 3 654 309 444 14 510 12 715 1 032 1 325 - 89 - 4 212 3 955 1 052 3 546 3 954
VI. Lalu Lintas Moneter / Monetary Movements 1)- 5 029 -3 654 - 309 - 444 -14 510 -12 715 -1 032 -1 324 r) 89 4 212 -3 955 -1 052 -3 546 -3 954
Sumber : Bank IndonesiaCatatan : 1) Negatif berarti surplus dan positif berarti defisit
81
I[2] [3] [4] [8]
IV[15]
(JUTA / MILLION U$)
2009
[12][11][10]III
[14][13]II
[5] [6] [7] [9]
20072002Uraian / Items 2004 2005 20062008
II IVIIII
NERACA PEMBAYARAN DAN
BALANCE OF PAYMENTS ANDINTERNATIONAL TRADE
Barang, bersih (neraca perdagangan) / Goods net
[1]
PERDAGANGAN LUAR NEGERI
2003
Perjalanan, bersih / Travel net
Transportasi, bersih / Transportation net
Ekspor, f.o.b / Exports, f.o.b.
Jasa-jasa (bersih) / Services, net
Migas / Oil and gas
Impor, fob / Imports, fob
Non-migas / Non-Oil and gas
Migas / Oil and gas
Non-migas / Non-Oil and gas
https:
//www.b
ps.go.id

NERACA PEMBAYARAN DANPERDAGANGAN LUAR NEGERIBALANCE OF PAYMENTS ANDINTERNATIONAL TRADE
TABEL : 6.2 NERACA PERDAGANGAN BARANG MIGAS DAN NON MIGAS
TABLE BALANCE OF TRADE OF OIL & GAS AND NON-OIL & GAS
2000 62 124,0 33 514,8 47 757,4 27 495,3
2001 56 320,9 30 962,1 43 684,6 25 490,3
2002 57 158,8 31 288,9 45 046,1 24 763,1
2003 61 058,3 32 550,7 47 406,6 24 939,8
2004 71 584,6 46 524,5 55 939,3 34 792,5
2005 85 660,0 57 700,7 66 428,5 40 243,3
2006 100 798,6 61 065,5 79 589,1 42 102,6
2007 114 100,9 74 473,4 92 012,3 52 540,6
2008 137 020,4 129 197,3 107 894,1 98 644,4
2009 116 510,0 96 829,2 97 491,7 77 848,5
Maret 8 614,8 6 554,1 7 333,1 5 624,1
Triw/Qrt I 23 029,1 19 093,7 19 697,4 15 917,8
April 8 453,9 6 706,8 7 200,0 5 474,5
Mei 9 208,8 7 641,3 8 072,1 6 081,1
Juni 9 381,5 7 935,5 7 929,4 6 493,7
Triw/Qrt II 27 044,2 22 283,6 23 201,5 18 049,3
Juli 9 684,1 8 683,3 8 195,2 6 846,5
Agustus 10 543,8 9 707,3 8 890,2 8 187,4
September 9 842,6 8 516,6 8 092,9 6 145,3
Triw/Qrt III 30 070,5 26 907,2 25 178,3 21 179,2
Oktober 12 242,6 9 430,1 10 131,2 7 514,0
November 10 775,4 8 814,7 8 438,0 6 983,8
Desember 13 348,2 10 299,9 10 845,3 8 204,4Triw/Qrt IV 36 366,2 28 544,7 29 414,5 22 702,2
2010
Januari 11 595,9 9 490,5 9 251,0 7 553,6
Februari 11 166,5 9 498,1 8 991,2 7 452,6 r)
Maret 12 774,4 10 972,6 10 605,8 8 720,6
Triw/Qrt I 35 536,8 29 961,2 28 848,0 23 726,8
[2]
Tidak termasuk minyak bumi dan gas
EksporImports
Excluding petroleum and gas
Exports
82
[1] [5][4][3]
Impor
(JUTA / MILLION US $)
ImportsYear and month
Termasuk minyak bumi dan gas
EksporExports
Including petroleum and gasTahun dan bulan
Impor
https:
//www.b
ps.go.id

TABEL : 6.3
TABLE
2000 3 502 234 4 318 15 682 1 772 3 165 12 340 10 770 9 949 392 62 124
2001 3 254 292 4 188 14 273 1 446 2 835 11 200 9 105 9 289 439 56 321
2002 3 606 265 4 522 13 910 2 657 2 969 10 926 9 789 8 193 322 57 159
2003 3 665 223 5 318 15 710 3 012 3 386 11 177 9 772 8 485 310 61 058
2004 3 968 279 6 433 18 561 4 493 4 016 12 866 11 523 9 197 249 71 585
2005 4 575 342 9 018 23 717 5 027 4 493 14 401 13 603 10 274 210 85 660
2006 5 124 360 13 057 27 619 6 191 5 135 17 190 14 120 11 454 549 100 799
2007 5 881 448 14 985 29 210 9 999 6 740 18 915 15 227 12 001 696 114 102
2008 7 916 550 14 844 39 780 15 062 7 454 20 464 17 343 12 768 839 137 020
2009 7 011 631 11 908 32 946 11 946 6 192 17 076 16 096 11 773 931 116 510
Maret 496 55 1 149 2 246 744 496 1 301 1 115 905 108 8 615
Triw/Qrt I 1 477 149 2 361 5 564 2 042 1 223 3 695 3 245 2 908 365 23 029
April 512 51 465 2 451 746 483 1 318 1 486 910 32 8 454
Mei 530 59 977 2 160 1 198 540 1 367 1 317 1 005 56 9 209
Juni 670 53 941 2 364 805 562 1 431 1 421 1 068 66 9 381
Triw/Qrt II 1 712 163 2 383 6 975 2 749 1 585 4 116 4 224 2 983 154 27 044Juli 572 44 1 121 2 923 681 479 1 349 1 381 1 097 37 9 684Agustus 670 43 907 3 113 1 405 454 1 498 1 429 970 55 10 544
September 517 45 1 105 3 096 1 027 501 1 321 1 376 791 64 9 843
Triw/Qrt III 1 759 132 3 133 9 132 3 113 1 434 4 168 4 186 2 858 156 30 071
Oktober 718 69 1 591 3 678 957 737 1 794 1 657 965 77 12 243
November 649 55 1 012 3 582 1 002 566 1 501 1 369 928 111 10 775
Desember 696 63 1 428 4 015 2 083 647 1 802 1 415 1 131 68 13 348Triw/Qrt IV 2 063 187 4 031 11 275 4 042 1 950 5 097 4 441 3 024 256 36 366
2010
Januari 581 61 1 260 4 096 814 599 1 599 1 321 1 207 58 11 596
Februari 518 59 1 532 3 468 907 577 1 611 1 423 1 016 56 11 167
Maret 629 71 1 800 3 874 869 680 1 888 1 772 1 099 92 12 774
Triw/Qrt I 1 728 191 4 592 11 438 2 590 1 856 5 098 4 516 3 322 206 35 537
Catatan : N o t e : 0) Food and Live Animals1) Beverages and Tobacco2) Raw Materials, Inedible3) Fuels, Lubricants etc4) Animal & Vegetables Oil and Fats5) Chemical6) Manufactured goods7) Machinery & Transport Equipments8) Misc. Manufactured Articles9) Commodities & other Special Transactions
Jumlah eksporTotal exports
[6] [7] [8]
Kelompok komoditi SITC / SITC Commodity groups
87
[11][10]
9
Tahun dan bulanYear and month
[1] [2]
0 6
[12]
1
[3]
2
[4]
3
[5]
4
[9]
5
83
8) Hasil Industri Lainnya9) Barang dan Transaksi Khusus Lainnya
4) Minyak/Lemak Nabati dan Hewani
NERACA PEMBAYARAN DANPERDAGANGAN LUAR NEGERIBALANCE OF PAYMENTS ANDINTERNATIONAL TRADE
NILAI EKSPOR MENURUT GOLONGAN BARANG SITC
EXPORTS VALUE BY SITC COMMODITY GROUPS
F.O.B (JUTA / MILLION US $)
5) Bahan Kimia
7) Mesin dan Alat Pengangkutan
0) Bahan Makanan dan Binatang Hidup1) Minuman dan Tembakau2) Bahan Mentah3) Bahan Bakar, Bahan Penyemir dan sebagainya
6) Hasil Industri menurut Bahan
https:
//www.b
ps.go.id

TABEL : 6.4.1
TABLE
2000 7,8 311,7 1 003,1 108,3 314,5 63,5 235,7 359,2 7,5
2001 7,5 182,5 940,1 94,6 174,2 80,8 276,5 358,8 5,2
2002 6,8 218,8 840,4 98,1 186,1 66,5 521,3 377,6 9,7
2003 12,3 251,0 852,7 91,8 186,3 44,5 410,4 424,1 11,8
2004 14,7 281,5 824,0 64,8 153,7 45,6 370,2 470,7 23,2
2005 6,4 497,7 846,9 48,0 138,0 62,9 468,2 480,5 31,1
2006 14,3 583,2 980,2 51,1 188,6 57,3 620,3 479,8 37,3
2007 12,3 633,7 920,5 73,2 258,5 56,6 623,1 578,0 35,8
2008 16,3 989,0 979,8 125,1 283,7 73,7 856,2 703,7 26,9
2009 12,8 822,1 790,9 144,3 239,6 93,7 1 088,2 636,1 26,0
Maret 1,1 42,1 75,8 11,5 16,2 16,0 48,3 53,1 1,7
Triw/Qrt I 2,9 144,9 212,6 30,9 46,8 29,4 182,8 143,0 4,5
April 1,8 54,5 60,8 11,6 22,5 9,4 55,0 53,8 0,8
Mei 0,5 78,8 57,2 12,0 17,6 9,3 55,6 53,7 1,4
Juni 1,9 110,8 61,1 12,6 19,2 10,9 94,3 58,6 1,0
Triw/Qrt II 4,2 244,1 179,1 36,2 59,3 29,6 204,9 166,1 3,2
Juli 1,0 88,1 56,0 14,6 19,9 5,0 107,1 49,9 2,2
Agustus 1,1 96,1 69,9 12,7 22,0 5,5 142,1 47,1 3,3
September 0,8 64,5 56,4 10,0 19,2 4,4 76,2 42,4 3,0
Triw/Qrt III 2,9 248,7 182,3 37,3 61,1 14,9 325,4 139,4 8,5
Oktober 1,4 83,7 85,9 14,2 28,4 5,2 102,7 63,6 3,0
November 0,5 52,0 63,9 11,2 22,4 7,6 123,2 58,7 4,3
Desember 0,9 48,7 67,1 14,5 21,6 7,0 149,2 65,3 2,5
Triw/Qrt IV 2,8 184,4 216,9 39,9 72,4 19,8 375,1 187,6 9,8
2010
Januari 1,1 36,3 56,3 11,9 18,4 6,4 125,9 56,1 3,3
Februari 1,7 36,9 62,0 11,7 16,6 4,8 68,8 53,7 2,1
Maret 2,7 39,5 68,3 14,2 24,5 8,1 114,5 65 1,6
Triw/Qrt I 5,5 112,7 186,6 37,8 59,5 19,3 309,2 174,8 7,0
[10]
Seeds
84NERACA PEMBAYARAN DANPERDAGANGAN LUAR NEGERIBALANCE OF PAYMENTS AND
Tembakau Biji-bijianRempah-rempah Biji coklat IkanShrimps (fresh.frozen) FishTobacco Cocoa beansSpices
Tahun dan bulan Udang (segar, beku) T e hYear and month Rubber Coffee T e a
(JUTA / MILLION US $)
INTERNATIONAL TRADE
EXPORTS OF AGRICULTURAL PRODUCTS (VALUE)
EKSPOR HASIL PERTANIAN (NILAI)
Getah karet Kopi
[3] [7][1] [2] [4] [9][6][5] [8]
https:
//www.b
ps.go.id
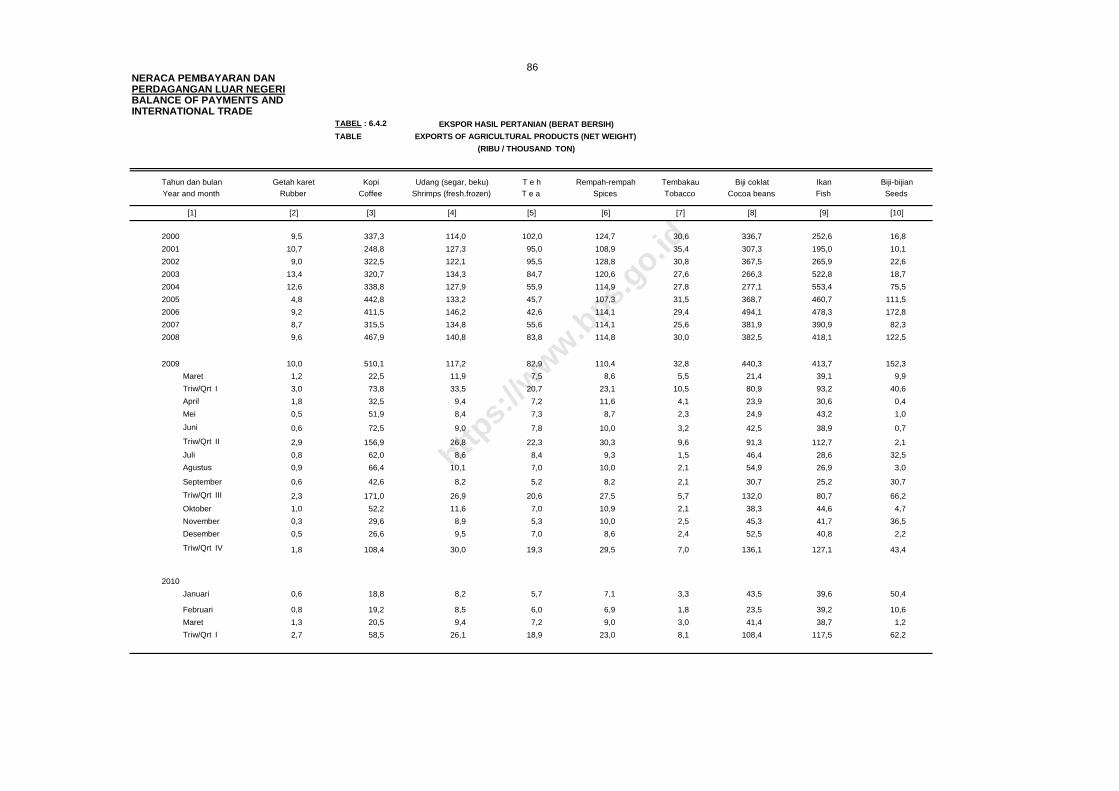
TABEL : 6.4.2
TABLE
2000 9,5 337,3 114,0 102,0 124,7 30,6 336,7 252,6 16,8
2001 10,7 248,8 127,3 95,0 108,9 35,4 307,3 195,0 10,1
2002 9,0 322,5 122,1 95,5 128,8 30,8 367,5 265,9 22,6
2003 13,4 320,7 134,3 84,7 120,6 27,6 266,3 522,8 18,7
2004 12,6 338,8 127,9 55,9 114,9 27,8 277,1 553,4 75,5
2005 4,8 442,8 133,2 45,7 107,3 31,5 368,7 460,7 111,5
2006 9,2 411,5 146,2 42,6 114,1 29,4 494,1 478,3 172,8
2007 8,7 315,5 134,8 55,6 114,1 25,6 381,9 390,9 82,3
2008 9,6 467,9 140,8 83,8 114,8 30,0 382,5 418,1 122,5
2009 10,0 510,1 117,2 82,9 110,4 32,8 440,3 413,7 152,3
Maret 1,2 22,5 11,9 7,5 8,6 5,5 21,4 39,1 9,9
Triw/Qrt I 3,0 73,8 33,5 20,7 23,1 10,5 80,9 93,2 40,6
April 1,8 32,5 9,4 7,2 11,6 4,1 23,9 30,6 0,4
Mei 0,5 51,9 8,4 7,3 8,7 2,3 24,9 43,2 1,0
Juni 0,6 72,5 9,0 7,8 10,0 3,2 42,5 38,9 0,7
Triw/Qrt II 2,9 156,9 26,8 22,3 30,3 9,6 91,3 112,7 2,1
Juli 0,8 62,0 8,6 8,4 9,3 1,5 46,4 28,6 32,5
Agustus 0,9 66,4 10,1 7,0 10,0 2,1 54,9 26,9 3,0
September 0,6 42,6 8,2 5,2 8,2 2,1 30,7 25,2 30,7
Triw/Qrt III 2,3 171,0 26,9 20,6 27,5 5,7 132,0 80,7 66,2
Oktober 1,0 52,2 11,6 7,0 10,9 2,1 38,3 44,6 4,7
November 0,3 29,6 8,9 5,3 10,0 2,5 45,3 41,7 36,5
Desember 0,5 26,6 9,5 7,0 8,6 2,4 52,5 40,8 2,2
Triw/Qrt IV 1,8 108,4 30,0 19,3 29,5 7,0 136,1 127,1 43,4
2010
Januari 0,6 18,8 8,2 5,7 7,1 3,3 43,5 39,6 50,4
Februari 0,8 19,2 8,5 6,0 6,9 1,8 23,5 39,2 10,6
Maret 1,3 20,5 9,4 7,2 9,0 3,0 41,4 38,7 1,2
Triw/Qrt I 2,7 58,5 26,1 18,9 23,0 8,1 108,4 117,5 62,2
T e h Rempah-rempah TembakauTahun dan bulan Getah karet
86
(RIBU / THOUSAND TON)
EXPORTS OF AGRICULTURAL PRODUCTS (NET WEIGHT)
EKSPOR HASIL PERTANIAN (BERAT BERSIH)
NERACA PEMBAYARAN DANPERDAGANGAN LUAR NEGERIBALANCE OF PAYMENTS ANDINTERNATIONAL TRADE
Biji-bijianT e a Spices
KopiTobacco
Udang (segar, beku)Year and month Rubber Coffee Shrimps (fresh.frozen) Cocoa beans Fish Seeds
IkanBiji coklat
[1] [2] [3] [4] [9] [10][5] [6] [7] [8]
https:
//www.b
ps.go.id

TABEL : 6.4.1
TABLE
2000 25,5 25,0 27,5 56,3 163,5 2 709,1
2001 25,1 17,9 29,9 31,7 213,7 2 438,5
2002 11,4 22,5 33,2 45,8 130,1 2 568,3
2003 17,2 20,8 33,2 54,1 116,0 2 526,2
2004 5,9 16,8 29,9 61,4 133,7 2 496,2
2005 11,0 16,7 35,9 73,8 163,2 2 880,3
2006 13,4 33,0 42,9 96,9 166,7 3 364,9
2007 13,2 37,2 40,1 113,1 262,5 3 657,8
2008 14,2 32,1 45,4 125,3 313,2 4 584,6
2009 22,3 42,4 67,9 104,1 262,4 4 352,8
Maret 0,8 3,5 2,6 11,0 24,2 307,9
Triw/Qrt I 2,0 6,3 7,1 31,9 63,8 908,9
April 1,8 3,6 3,9 9,0 19,2 307,7
Mei 2,3 3,5 2,8 8,1 19,5 322,3
Juni 1,2 5,1 2,7 9,8 24,0 413,2
Triw/Qrt II 5,3 12,2 9,4 26,9 62,7 1 043,2
Juli 0,8 3,3 2,5 9,3 19,3 379,0
Agustus 2,2 3,2 7,0 7,1 24,1 443,4
September 2,3 4,0 9,2 5,8 18,5 316,7
Triw/Qrt III 5,3 10,5 18,7 22,2 61,9 1 139,1
Oktober 3,4 5,7 14,6 7,0 25,0 443,8
November 0,7 4,2 9,7 7,4 23,1 388,9
Desember 5,6 3,5 8,4 8,7 25,9 428,9
Triw/Qrt IV 9,7 13,4 32,7 23,1 74,0 1261,6
2010
Januari 2,4 3,1 5,2 15,1 23,2 364,7
Februari 16,0 3,0 2,7 11,3 6,5 297,8
Maret 0,3 3,7 3,0 10,0 26,3 381,7
Triw/Qrt I 18,7 9,8 10,9 36,4 56,0 1 044,2
85
Total
[11]
NERACA PEMBAYARAN DANPERDAGANGAN LUAR NEGERIBALANCE OF PAYMENTS AND
Tahun dan bulanYear and month
INTERNATIONAL TRADE
JumlahMutiaraPearl
Damar
[13] [14][12]
Damar
[15]
Fruit
[16][1]
EKSPOR HASIL PERTANIAN (NILAI)
EXPORTS OF AGRICULTURAL PRODUCTS (VALUE)
(JUTA / MILLION US $)
Lainnya
(Lanjutan / Continuation )
OtherVegetablesSayur-sayuran Buah-buahan
https:
//www.b
ps.go.id

TABEL : 6.4.2
TABLE
2000 1 988 57,5 101,4 87,9 409,0 1 982,0
2001 1 806 43,6 115,7 87,9 774,8 2 162,3
2002 1 177 53,6 133,0 93,8 233,8 1 880,1
2003 597 53,0 107,4 110,3 204,4 1 984,8
2004 1 514 40,6 87,4 141,5 227,9 2 082,8
2005 1 266 31,9 95,4 164,0 275,0 2 273,8
2006 1 756 37,3 173,8 183,9 341,9 2 637,0
2007 2 022 51,4 111,8 207,3 554,4 2 436,3
2008 1 632 38,2 106,0 213,9 486,4 2 616,1
2009 5 021 50,9 129,8 216,0 423,5 2 694,9
Maret 104 4,2 4,6 22,2 46,2 204,9
Triw/Qrt I 562 7,3 13,3 64,0 106,2 570,7
April 226 4,4 6,5 19,3 42,9 194,8
Mei 622 4,3 6,7 17,9 29,2 206,9
Juni 168 6,1 5,4 21,0 37,4 255,3
Triw/Qrt II 1 016 14,8 18,6 58,2 109,5 657,0
Juli 180 4,0 5,4 20,9 36,0 264,6
Agustus 910 3,8 18,3 14,7 36,8 255,8
September 311 4,9 22,6 11,5 25,3 218,1
Triw/Qrt III 1 401 12,7 46,3 47,1 98,1 738,5
Oktober 424 6,9 26,9 14,4 38,8 259,8
November 114 5,1 14,1 15,6 30,9 245,9
Desember 1 504 4,1 10,6 16,7 40,0 223,0
Triw/Qrt IV 2 042 16,1 51,6 46,7 109,7 728,7
2010
Januari 670 3,4 8,7 26,1 51,3 267,4
Februari 284 3,1 5,4 19,1 33,0 177,4
Maret 69 3,8 4,7 18,4 45,9 204,6
Triw/Qrt I 1 023,0 10,3 18,8 63,6 130,2 649,4
Catatan : 1) Berat Bersih dalam kg
Lainnya JumlahTahun dan bulan
(Lanjutan / Continuation )
Pearl Damar Mutiara 1)
(RIBU / THOUSAND TON)
Damar Sayur-sayuran Buah-buahan
Note : 1) Net Weight in kgs
[11]
Vegetables Fruit Other
[16]
Total
[15][12]
Year and month
EXPORTS OF AGRICULTURAL PRODUCTS (NET WEIGHT)
BALANCE OF PAYMENTS AND
[13] [14][1]
NERACA PEMBAYARAN DAN
EKSPOR HASIL PERTANIAN (BERAT BERSIH)
87
INTERNATIONAL TRADE
PERDAGANGAN LUAR NEGERI
https:
//www.b
ps.go.id

TABEL : 6.5.1
TABLE
2000 1 988,8 331,2 1 240,8 233,4 452,3 267,7 4 702,6 3 634,1 1 319,8 93,0 114,4 1 087,3
2001 1 838,0 301,3 1 125,9 192,8 407,3 160,3 4 476,7 3 198,9 1 207,5 81,7 132,5 1 080,8
2002 1 748,4 371,2 1 131,9 224,5 369,5 3,3 3 887,2 3 075,9 1 560,6 106,6 145,2 2 092,4
2003 1 662,9 302,5 1 196,1 295,9 372,8 195,3 4 037,9 3 064,6 2 089,6 120,2 155,7 2 454,7
2004 1 576,7 311,0 1 360,0 617,9 490,9 725,3 4 351,9 3 354,6 2 954,2 152,1 188,8 3 441,8
2005 1 374,7 281,6 1 430,2 920,7 612,9 927,2 4 967,0 3 704,0 3 545,6 147,0 205,0 3 756,3
2006 1 506,6 414,8 1 403,4 926,6 862,5 1 266,2 5 608,1 3 908,6 5 465,3 170,1 212,1 4 817,4
2007 1 524,7 144,1 1 409,0 1 034,2 868,2 2 355,4 5 712,9 4 178,0 6 179,7 322,6 284,8 7 868,7
2008 1 527,2 55,6 1 238,2 1 993,5 865,3 1 429,5 6 092,2 4 127,9 7 579,6 432,2 367,5 12 375,3
2009 1 189,5 36,7 1 048,8 1 268,0 527,0 584,0 5 735,6 3 602,8 4 870,5 247,1 340,3 10 367,7
Maret 88,6 3,2 81,4 87,2 54,7 52,2 421,6 286,4 348,9 17,8 27,8 624,5
Triw/Qrt I 224,9 9,0 228,8 275,7 116,9 70,5 1 397,6 782,2 925,3 55,7 77,0 1 724,7
April 110,6 4,1 82,9 64,9 30,6 0,2 416,2 288,5 337,0 16,1 26,1 644,0
Mei 94,6 3,4 84,0 135,7 45,8 51,3 488,8 296,2 387,1 23,1 27,7 1 046,5
Juni 101,7 3,2 86,4 122,1 35,9 0,2 536,9 300,9 394,1 25,0 29,0 673,4
Triw/Qrt II 306,9 10,7 253,3 322,7 112,3 51,7 1 441,9 885,6 1 118,2 64,2 82,8 2 363,9
Juli 99,6 2,7 75,4 115,1 32,1 0,4 586,1 312,8 460,8 15,2 31,4 609,1
Agustus 108,3 2,3 90,4 117,9 51,8 0,4 509,4 319,9 419,0 23,7 27,6 1 246,1
September 92,9 2,2 70,3 102,4 21,9 0,3 403,0 271,2 393,9 26,5 25,7 885,1
Triw/Qrt III 300,8 7,2 236,1 335,4 105,8 1,1 1 498,5 903,9 1 273,7 65,4 84,7 2 740,3
Oktober 124,8 3,5 111,4 93,9 38,5 460,3 419,2 349,6 514,6 15,6 35,1 825,5
November 113,4 3,1 86,2 116,8 29,6 0,3 430,4 309,0 467,7 15,8 30,4 856,5
Desember 118,7 3,2 133,0 123,5 123,9 0,1 548,0 372,5 571,0 30,4 30,3 1 856,8
Triw/Qrt IV 356,9 9,8 330,6 334,2 192,0 460,7 1 397,6 1 031,1 1 553,3 61,8 95,8 3 538,8
2010
Januari 123,7 2,2 93,1 102,9 52,6 249,5 508,5 340,5 516,6 16,6 30,7 691,1
Februari 126,5 2,4 88,9 97,7 57,9 86,6 487,2 334,1 649,2 26,1 33,7 789,9
Maret 139,9 2,4 109,2 98,6 36,5 92,3 523,1 399,8 789,4 15,4 37,7 767,7
Triw/Qrt I 390,1 7,0 291,2 299,2 147,0 428,4 1 518,8 1 074,4 1 955,2 58,1 102,1 2 248,7
Tahun dan bulan Processed wood
Year and month Aluminium
EXPORTS OF INDUSTRIAL PRODUCTS (VALUE)
(JUTA / MILLION US $)
NERACA PEMBAYARAN DANPERDAGANGAN LUAR NEGERIBALANCE OF PAYMENTS ANDINTERNATIONAL TRADE
sawitMakanan ternak atsiri
ProcessedNikelLainnya Palm oil
[10] [11] [12]
Pakaian jadi Tekstil lain Karet olahan
[13]
Minyak kelapaMinyak
Other Assential
EKSPOR HASIL INDUSTRI (NILAI)
rubber
Cattle
[7][1]oils
88
Barang dari logam
fodder
Kayu olahan
[8]
Articles of basic metal
T i n Aluminium
Gergajian Timah
[5][4]Sawnwood Others
[3]Plywood Nickel
Lapis
[2] [6]
Garments
[9]textile
https:
//www.b
ps.go.id

TABEL : 6.5.2 EKSPOR HASIL INDUSTRI (BERAT BERSIH)
TABLE EXPORTS OF INDUSTRIAL PRODUCTS (NET WEIGHT)
2000 3 759,5 450,4 1 829,8 45,9 247,9 48,0 370,3 1 365,1 1 612,2 1 682,6 40,1 4 110,1
2001 3 898,4 527,3 1 766,8 44,8 225,8 36,1 473,8 1 269,5 1 669,5 1 508,6 37,9 4 903,3
2002 3 584,3 747,3 1 959,4 57,4 214,9 1,1 333,1 1 425,9 1 760,1 1 607,5 43,6 6 333,7
2003 3 306,4 518,5 2 033,0 67,2 204,4 33,0 339,9 1 307,5 1 942,5 1 641,5 55,2 6 386,5
2004 2 603,1 431,8 2 183,3 91,6 247,7 104,4 327,3 1 300,4 2 247,5 2 066,6 58,1 8 661,6
2005 2 214,8 371,7 2 143,5 144,7 280,7 104,6 369,5 1 427,3 2 419,8 2 434,6 55,6 10 376,2
2006 1 979,1 474,5 1 926,2 121,1 315,0 98,4 399,6 1 477,8 2 701,6 2 665,4 51,6 12 101,0
2007 1 754,2 151,0 1 713,0 78,9 293,4 119,0 399,8 1 473,6 2 867,9 2 806,6 59,7 11 875,4
2008 1 659,3 51,1 1 059,3 112,9 282,5 104,7 417,6 1 312,2 2 730,7 3 158,1 66,0 14 290,7
2009 1 430,4 36,4 1 201,4 101,3 257,9 69,3 393,4 1 369,6 2 494,3 3 282,2 72,8 16 829,0
Maret 112,6 2,8 57,8 9,0 34,6 7,4 28,8 117,8 214,8 221,7 5,8 1 207,7
Triw/Qrt I 273,0 8,3 171,9 26,4 64,4 10,5 90,2 314,5 527,2 754,6 16,2 3 441,0
April 144,2 3,2 75,7 6,2 16,3 0,0 27,3 115,2 205,9 184,9 5,4 1 127,2
Mei 122,9 3,5 91,3 10,5 26,1 7,9 33,5 116,0 226,4 316,6 6,0 1 584,8
Juni 123,9 3,0 123,1 8,6 17,5 0,1 36,7 114,6 214,8 301,2 6,4 961,2
Triw/Qrt II 391,0 9,7 290,1 25,3 59,9 8,0 97,5 345,8 647,1 802,7 17,8 3 673,2
Juli 123,2 3,0 106,6 9,2 15,5 0,1 41,2 114,2 250,0 180,2 7,0 928,0
Agustus 128,7 2,8 72,2 8,5 25,8 0,1 37,3 118,6 220,5 288,8 5,8 1 962,5
September 108,9 2,3 52,5 7,7 7,7 0,0 30,6 100,4 200,5 349,3 5,7 1 406,2
Triw/Qrt III 360,8 8,1 231,3 25,4 49,0 0,2 109,1 333,2 671,0 818,3 18,5 4 296,7
Oktober 140,5 3,9 183,1 6,9 13,9 50,5 30,5 129,1 235,8 201,1 7,4 1 314,0
November 131,3 3,2 141,4 8,5 10,4 0,1 29,3 112,3 193,8 223,1 6,4 1 335,7
Desember 133,8 3,2 183,6 8,8 60,3 0,0 36,8 134,7 219,4 482,4 6,5 2 768,4
Triw/Qrt IV 405,6 10,3 508,1 24,2 84,6 50,6 96,6 376,1 649,0 906,6 20,3 5 418,1
2010
Januari 141,5 2,2 164,3 6,8 20,8 23,1 33,5 120,3 181,6 217,1 6,7 973,3
Februari 147,7 2,5 83,7 6,7 22,0 7,6 34,1 115,2 216,6 334,6 6,1 1097,6
Maret 158,5 2,5 149,4 6,6 12,8 7,9 35,0 139,2 254,6 150,2 7,4 1050,6
Triw/Qrt I 447,7 7,2 397,4 20,1 55,6 38,6 102,6 374,7 652,8 701,9 20,2 3 121,5
INTERNATIONAL TRADE
atsiri
[13]
Palm oil
[5] [6] [7] [11][1] [2] [3] [4] [8] [9] [12]
Assentialfodder oils
[10]textile
CattleNickel
Makanan ternakLapis Gergajian
Others T i nLainnya
Plywood Sawnwood
Processed wood Articles of basic metal Pakaian jadiMinyak
OtherTekstil lain
Timah Aluminium Nikel GarmentsTahun dan bulan
Minyak kelapasawit
(RIBU / THOUSAND TON)
Year and month
90NERACA PEMBAYARAN DAN
Kayu olahan
BALANCE OF PAYMENTS AND
Processed
Barang dari logam
rubber
Karet olahan
Aluminium
PERDAGANGAN LUAR NEGERI
https:
//www.b
ps.go.id

TABEL : 6.5.1 EKSPOR HASIL INDUSTRI (NILAI)
TABLE EXPORTS OF INDUSTRIAL PRODUCTS (VALUE)
2000 158,7 3 162,0 955,3 142,6 71,9 1 287,2 211,6 111,5 2 291,2 18 145,6 42 003,0
2001 122,6 2 605,0 1 042,4 160,9 76,9 1 238,4 130,1 100,2 2 034,3 15 956,6 37 671,1
2002 145,7 2 700,1 1 184,1 111,8 78,2 1 272,3 134,5 80,5 2 097,4 16 208,3 38 729,6
2003 147,7 3 120,5 1 241,6 89,4 72,3 1 535,1 187,8 88,7 2 007,3 16 441,4 40 880,0
2004 298,5 3 486,1 1 518,6 102,5 71,8 1 946,6 87,7 106,5 2 228,9 19 304,9 48 677,3
2005 316,7 4 364,1 1 806,3 115,8 64,8 2 080,1 171,7 130,4 2 324,8 22 346,8 55 593,7
2006 354,4 4 448,7 1 965,6 219,8 70,6 2 697,5 19,7 177,6 2 859,3 25 649,2 65 023,9
2007 496,3 4 835,9 2 263,9 195,4 66,2 3 402,5 219,3 226,9 3 374,8 29 497,3 76 460,8
2008 734,5 5 253,8 2 997,3 155,7 56,7 2 754,4 162,7 226,8 3 796,9 34 170,6 88 393,4
2009 545,4 4 580,2 2 960,8 153,6 41,2 2 155,4 222,6 174,7 3 404,9 29 379,0 73 435,8
Maret 43,9 284,6 215,8 9,8 4,1 146,0 21,0 12,2 258,0 2 283,7 5 373,4
Triw/Qrt I 102,7 896,8 629,8 23,9 11,0 358,7 35,1 39,9 766,7 6 620,5 15 373,4
April 42,1 341,6 227,4 14,0 3,5 143,5 0,9 12,6 267,9 2 539,7 5 614,4
Mei 50,4 375,4 233,5 20,2 3,5 186,5 17,3 13,5 276,3 2 359,7 6 220,5
Juni 47,3 393,5 279,8 7,5 3,6 166,9 58,4 13,9 307,6 2 494,2 6 081,5Triw/Qrt II 139,8 1 110,5 740,7 41,7 10,6 496,9 76,6 40,0 851,8 7 393,6 17 916,4
Juli 37,8 400,7 224,7 15,6 2,9 165,1 9,5 12,8 261,7 2 248,7 5 720,2
Agustus 43,2 424,9 246,3 18,2 3,0 125,9 5,7 14,8 291,2 2 466,2 6 556,2
September 48,3 372,2 218,5 17,5 2,5 225,8 8,6 14,7 267,4 2 302,1 5 773,0
Triw/Qrt III 129,3 1 197,8 689,5 51,3 8,4 516,8 23,8 42,3 820,3 7 017,0 18 049,4
Oktober 59,1 492,4 318,6 19,2 3,7 328,6 27,2 19,2 368,9 2 962,9 7 591,8
November 46,1 439,4 285,7 10,6 3,6 205,0 26,2 16,2 288,0 2 560,5 6 340,5
Desember 68,4 443,3 296,5 6,9 3,9 249,4 33,7 17,1 309,2 2 824,5 8 164,3
Triw/Qrt IV 173,6 1 375,1 900,8 36,7 11,2 783,0 87,1 52,5 966,1 8 347,9 22 096,6
2010
Januari 43,7 436,5 258,6 3,1 3,7 275,6 14,6 13,8 283,9 2 650,7 6 712,2
Februari 60,8 456,6 249,2 2,7 3,3 227,9 7,0 13,5 309,0 2 580,3 6 690,5
Maret 54,8 512,3 296,0 6,4 4,5 266,6 7,1 17,7 360,7 3 164,3 7 702,4
Triw/Qrt I 159,3 1 405,4 803,8 12,2 11,5 770,1 28,7 45,0 953,6 8 395,3 21 105,1
BALANCE OF PAYMENTS AND
NERACA PEMBAYARAN DANPERDAGANGAN LUAR NEGERI
Asam
INTERNATIONAL TRADE
Alat-alat
(JUTA / MILLION US $)
Tahun dan bulan listrik
[1]
berlemak
FattyYear and month
[14]
Electrical
acids
anyaman Lainnya
Kertas & barangBarang
dari kertas
Makanan
olahan Semen
(Lanjutan / Continuation )
Kulit & barang
Jumlah
Bahan
kimia Pupuk dari kulit
[20][18] [19] [22] [24]leather goods
[17]
Processed
[21]
Paper & paperCement Others TotalChemicals Fertilizer
goodsfood[23][16]
Apparatus
89
articles
Leather andPlained
[15]
https:
//www.b
ps.go.id
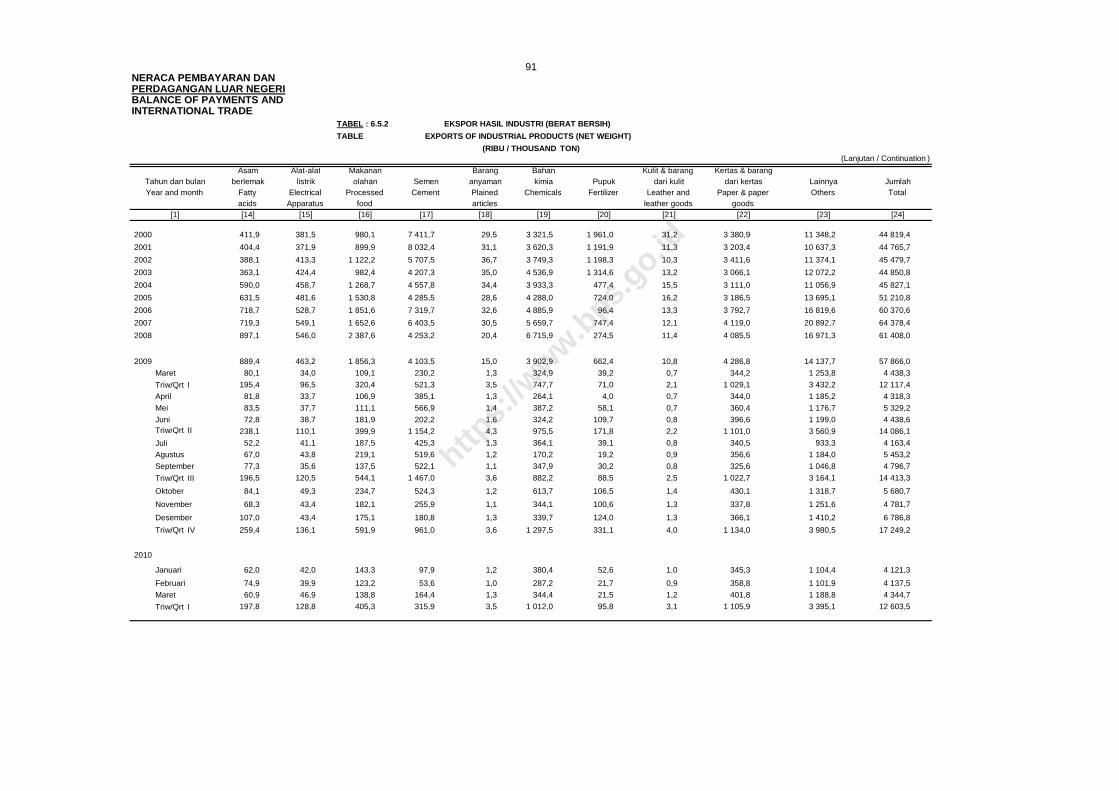
EKSPOR HASIL INDUSTRI (BERAT BERSIH)
EXPORTS OF INDUSTRIAL PRODUCTS (NET WEIGHT)
2000 411,9 381,5 980,1 7 411,7 29,5 3 321,5 1 961,0 31,2 3 380,9 11 348,2 44 819,4
2001 404,4 371,9 899,9 8 032,4 31,1 3 620,3 1 191,9 11,3 3 203,4 10 637,3 44 765,7
2002 388,1 413,3 1 122,2 5 707,5 36,7 3 749,3 1 198,3 10,3 3 411,6 11 374,1 45 479,7
2003 363,1 424,4 982,4 4 207,3 35,0 4 536,9 1 314,6 13,2 3 066,1 12 072,2 44 850,8
2004 590,0 458,7 1 268,7 4 557,8 34,4 3 933,3 477,4 15,5 3 111,0 11 056,9 45 827,1
2005 631,5 481,6 1 530,8 4 285,5 28,6 4 288,0 724,0 16,2 3 186,5 13 695,1 51 210,8
2006 718,7 528,7 1 851,6 7 319,7 32,6 4 885,9 96,4 13,3 3 792,7 16 819,6 60 370,6
2007 719,3 549,1 1 652,6 6 403,5 30,5 5 659,7 747,4 12,1 4 119,0 20 892,7 64 378,4
2008 897,1 546,0 2 387,6 4 253,2 20,4 6 715,9 274,5 11,4 4 085,5 16 971,3 61 408,0
2009 889,4 463,2 1 856,3 4 103,5 15,0 3 902,9 662,4 10,8 4 286,8 14 137,7 57 866,0
Maret 80,1 34,0 109,1 230,2 1,3 324,9 39,2 0,7 344,2 1 253,8 4 438,3
Triw/Qrt I 195,4 96,5 320,4 521,3 3,5 747,7 71,0 2,1 1 029,1 3 432,2 12 117,4
April 81,8 33,7 106,9 385,1 1,3 264,1 4,0 0,7 344,0 1 185,2 4 318,3
Mei 83,5 37,7 111,1 566,9 1,4 387,2 58,1 0,7 360,4 1 176,7 5 329,2
Juni 72,8 38,7 181,9 202,2 1,6 324,2 109,7 0,8 396,6 1 199,0 4 438,6Triw/Qrt II 238,1 110,1 399,9 1 154,2 4,3 975,5 171,8 2,2 1 101,0 3 560,9 14 086,1
Juli 52,2 41,1 187,5 425,3 1,3 364,1 39,1 0,8 340,5 933,3 4 163,4
Agustus 67,0 43,8 219,1 519,6 1,2 170,2 19,2 0,9 356,6 1 184,0 5 453,2
September 77,3 35,6 137,5 522,1 1,1 347,9 30,2 0,8 325,6 1 046,8 4 796,7
Triw/Qrt III 196,5 120,5 544,1 1 467,0 3,6 882,2 88,5 2,5 1 022,7 3 164,1 14 413,3
Oktober 84,1 49,3 234,7 524,3 1,2 613,7 106,5 1,4 430,1 1 318,7 5 680,7
November 68,3 43,4 182,1 255,9 1,1 344,1 100,6 1,3 337,8 1 251,6 4 781,7
Desember 107,0 43,4 175,1 180,8 1,3 339,7 124,0 1,3 366,1 1 410,2 6 786,8
Triw/Qrt IV 259,4 136,1 591,9 961,0 3,6 1 297,5 331,1 4,0 1 134,0 3 980,5 17 249,2
2010
Januari 62,0 42,0 143,3 97,9 1,2 380,4 52,6 1,0 345,3 1 104,4 4 121,3
Februari 74,9 39,9 123,2 53,6 1,0 287,2 21,7 0,9 358,8 1 101,9 4 137,5
Maret 60,9 46,9 138,8 164,4 1,3 344,4 21,5 1,2 401,8 1 188,8 4 344,7
Triw/Qrt I 197,8 128,8 405,3 315,9 3,5 1 012,0 95,8 3,1 1 105,9 3 395,1 12 603,5
Jumlahanyaman
(RIBU / THOUSAND TON)
INTERNATIONAL TRADE
BahanBarang Kulit & barang
TABEL : 6.5.2
Asam Alat-alat Makanan
Plained Chemicals FertilizerPupuk
Fatty Electrical
PERDAGANGAN LUAR NEGERIBALANCE OF PAYMENTS AND
Total
[23] [24]leather goods goods
Paper & paperLeather and Others
(Lanjutan / Continuation )
Kertas & barangLainnya
articles
kimia dari kulit dari kertas
[20] [21] [22][19][18][17]acids Apparatus
[16][1] [14]
olahanYear and monthTahun dan bulan berlemak listrik
food[15]
SemenCementProcessed
91
TABLE
NERACA PEMBAYARAN DAN
https:
//www.b
ps.go.id

TABEL : 6.6.1TABLE
2000 1 621,0 42,2 12,5 1 276,4 88,7 3 040,8
2001 1 585,3 55,3 12,4 1 617,5 299,1 3 569,6
2002 1 755,5 50,7 20,9 1 762,4 154,1 3 743,6
2003 1 854,7 59,6 19,0 1 980,1 82,3 3 995,7
2004 1 802,4 108,4 17,2 2 748,8 84,6 4 761,4
2005 3 311,1 140,0 23,6 4 354,0 118,2 7 946,9
2006 4 646,2 217,8 58,1 6 085,7 183,7 11 191,4
2007 4 212,8 608,7 105,5 6 681,5 276,5 11 885,0
2008 3 344,6 524,3 216,3 10 485,1 335,9 14 906,2
2009 5 100,2 277,6 249,7 13 817,3 247,5 19 692,3
Maret 644,3 10,9 11,9 964,6 18,9 1 650,6
Triw/Qrt I 1 055,5 40,6 33,3 2 225,8 57,0 3 412,2
April 49,4 10,5 18,5 1 189,6 9,3 1 277,3
Mei 460,0 21,0 18,2 1 015,2 14,2 1 528,6
Juni 483,6 13,5 27,0 898,5 11,4 1 434,0
Triw/Qrt II 993,0 45,0 63,7 3 103,3 34,9 4 239,9
Juli 595,9 32,4 24,5 1 423,9 18,6 2 095,3
Agustus 388,3 12,3 24,7 1 444,0 20,7 1 890,0
September 575,9 43,0 19,6 1 335,9 27,7 2 002,1
Triw/Qrt III 1 560,1 87,7 68,8 4 203,8 67,0 5 987,4
Oktober 447,1 35,9 29,1 1 556,5 25,5 2 094,1
November 376,6 40,4 27,2 1 234,4 28,9 1 707,5
Desember 667,9 28,0 27,6 1 493,5 34,2 2 251,2
Triw/Qrt IV 1 491,6 104,3 83,9 4 284,4 88,6 6 052,8
2010
Januari 338,2 48,6 29,9 1 740,0 16,9 2 173,6
Februari 665,0 23,6 23,0 1267,9 22,6 2 002,1
Maret 713,4 47,7 39,4 1694,2 26,1 2 520,8
Triw/Qrt I 1 716,6 119,9 92,3 4 702,1 65,6 6 696,5
92
JumlahTotal
Tahun dan bulanYear and month C o a l
Lainnya
EXPORTS OF MINING PRODUCTS, EXCLUDING PETROLEUM & GAS (VALUE)EKSPOR HASIL TAMBANG, TIDAK TERMASUK MIGAS (NILAI)
BauksitBauxite
[4] [5]
(JUTA / MILLION US $)
Bijih Tembaga Batu baraBijih NikelNickel ore
[2] [3] [7]
NERACA PEMBAYARAN DANPERDAGANGAN LUAR NEGERIBALANCE OF PAYMENTS ANDINTERNATIONAL TRADE
[1]
Others
[6]
Copper ore
https:
//www.b
ps.go.id

TABEL : 6.6.2TABLE
2000 2 580,2 1 444,4 879,3 57 152,4 50 615,5 112 671,8
2001 2 511,1 2 245,0 876,2 66 505,4 91 288,3 163 426,0
2002 2 875,7 2 640,1 1 048,7 73 124,9 31 972,7 111 662,1
2003 2 381,4 2 525,8 1 007,7 89 021,8 16 234,8 111 171,5
2004 1 807,6 3 259,0 1 112,1 105 629,9 14 734,0 126 542,6
2005 2 383,0 3 700,5 2 434,6 129 044,1 15 753,6 153 315,8
2006 2 330,9 4 394,1 7 270,0 184 008,9 17 866,5 215 870,3
2007 1 726,6 9 027,0 11 663,2 195 785,8 12 042,6 230 245,2
2008 1 626,9 10 592,8 16 791,4 201 021,7 16 193,5 246 226,3
2009 2 330,3 10 437,2 14 720,3 234 793,1 10 081,8 272 362,7
Maret 345,7 486,9 736,5 15 363,9 957,6 17 890,6
Triw/Qrt I 641,2 1 362,0 2 143,6 34 718,8 3 141,9 42 007,5
April 44,4 558,3 1 214,1 18 638,1 127,6 20 582,5
Mei 226,9 807,3 1 146,3 16 796,5 521,3 19 498,3
Juni 216,3 566,7 1 334,4 15 326,4 229,4 17 673,2
Triw/Qrt II 487,6 1 932,3 3 694,8 50 761,0 878,3 57 754,0
Juli 272,7 1 042,7 1 193,4 24 525,5 566,8 27 601,1
Agustus 148,6 817,0 1 492,4 25 329,5 725,4 28 512,9
September 217,7 1 244,0 1 050,9 22 798,8 1 169,3 26 480,7
Triw/Qrt III 639,0 3 103,7 3 736,7 72 653,8 2 461,5 82 594,7
Oktober 177,4 1 373,1 1 741,7 27 485,8 686,3 31 464,3
November 145,2 1 539,9 1 755,4 22 545,5 1 583,6 27 569,6
Desember 239,9 1 126,2 1 648,1 26 628,2 1 330,2 30 972,6
Triw/Qrt IV 562,5 4 039,2 5 145,2 76 659,5 3 600,1 90 006,5
2010
Januari 122,1 1 492,0 1 568,7 31 004,1 682,4 34 869,3
Februari 266,2 966,4 1378,5 22368,4 880,0 25 859,5Maret 313,4 1531,6 2225,1 28973,9 1060,2 34 104,2
Triw/Qrt I 701,7 3 990,0 5 172,3 82 346,4 2 622,6 94 833,0
C o a l Others TotalTahun dan bulan Bijih TembagaYear and month Copper ore Nickel ore Bauxite
Bijih Nikel
[7][6]
Bauksit Lainnya
(RIBU / THOUSAND TON)EXPORTS OF MINING PRODUCTS, EXCLUDING PETROLEUM & GAS (NET WEIGHT)
EKSPOR HASIL TAMBANG, TIDAK TERMASUK MIGAS (BERAT BERSIH)
JumlahBatu bara
INTERNATIONAL TRADE
93NERACA PEMBAYARAN DAN
[1] [5][2] [3] [4]
PERDAGANGAN LUAR NEGERIBALANCE OF PAYMENTS AND
https:
//www.b
ps.go.id

TABEL : 6.7 RINGKASAN EKSPOR INDONESIA (NILAI)TABLE SUMMARY OF INDONESIAN EXPORTS (VALUE)
(JUTA / MILLION US $)
2000 2 709,1 42 003,0 3 040,8 4,5 47 757,4 6 090,1 1 651,6 6 624,9 14 366,6 62 124,0
2001 2 438,5 37 671,1 3 569,6 5,4 43 684,6 5 714,7 1 189,4 5 732,2 12 636,3 56 320,9
2002 2 568,3 38 729,6 3 743,7 4,5 45 046,1 5 227,6 1 307,4 5 577,7 12 112,7 57 158,8
2003 2 526,2 40 880,0 3 995,7 4,7 47 406,6 5 621,0 1 553,8 6 476,9 13 651,7 61 058,3
2004 2 496,2 48 677,3 4 761,4 4,4 55 939,3 6 241,4 1 654,4 7 749,6 15 645,3 71 584,6
2005 2 880,3 55 593,7 7 946,9 7,6 66 428,5 8 145,8 1 932,0 9 153,7 19 231,5 85 660,0
2006 3 364,9 65 023,9 11 191,4 8,9 79 589,1 8 168,8 2 843,7 10 197,0 21 209,5 100 798,6
2007 3 657,8 76 460,8 11 885,0 8,8 92 012,3 9 226,0 2 878,8 9 983,8 22 088,6 114 100,9
2008 4 584,6 88 393,4 14 906,2 9,9 107 894,1 12 418,8 3 547,0 13 160,5 29 126,3 137 020,4
2009 4 352,8 73 435,8 19 692,3 10,8 97 491,7 7 820,3 2 262,3 8 935,7 19 018,3 116 510,0
Maret 307,9 5 373,4 1 650,6 1,2 7 333,1 602,7 132,4 546,6 1 281,7 8 614,8
Triw/Qrt I 908,9 15 373,4 3 412,2 2,9 19 697,4 1 426,9 421,8 1 483,0 3 331,7 23 029,1
April 307,7 5 614,4 1 277,3 0,6 7 200,0 659,6 125,2 469,1 1 253,9 8 453,9
Mei 322,3 6 220,5 1 528,6 0,7 8 072,1 525,0 136,5 475,2 1 136,7 9 208,8Juni 413,2 6 081,5 1 434,0 0,7 7 929,4 660,8 187,5 603,8 1 452,1 9 381,5Triw/Qrt II 1 043,2 17 916,4 4 239,9 2,0 23 201,5 1 845,4 449,2 1 548,1 3 842,7 27 044,2
Juli 379,0 5 720,2 2 095,3 0,7 8 195,2 568,8 234,4 685,7 1 488,9 9 684,1
Agustus 443,4 6 556,2 1 890,0 0,6 8 890,2 747,9 178,6 727,1 1 653,6 10 543,8
September 316,7 5 773,0 2 002,1 1,1 8 092,9 713,1 265,8 770,8 1 749,7 9 842,6Triw/Qrt III 1 139,1 18 049,4 5 987,4 2,4 25 178,3 2 029,8 678,8 2 183,6 4 892,2 30 070,5
Oktober 443,8 7 591,8 2 094,1 1,5 10 131,2 819,3 168,7 1 123,4 2 111,4 12 242,6
November 388,9 6 340,5 1 707,5 1,1 8 438,0 743,1 246,2 1 348,1 2 337,4 10 775,4
Desember 428,9 8 164,3 2 251,2 0,9 10 845,3 955,8 297,6 1 249,5 2 502,9 13 348,2
Triw/Qrt IV 1 261,6 22 096,6 6 052,8 3,5 29 414,5 2 518,2 712,5 3 721,0 6 951,7 36 366,2
2010
Januari 364,7 6 712,2 2 173,6 0,5 9 251,0 667,1 315,9 1 361,9 2 344,9 11 595,9
Februari 297,8 6 690,5 2 002,1 0,8 8 991,2 786,1 328,7 1 060,5 2 175,3 11 166,5Maret 381,7 7 702,4 2 520,8 0,9 10 605,8 818,9 429,3 920,4 2 168,6 12 774,4
Triw/Qrt I 1 044,2 21 105,1 6 696,5 2,2 28 848,0 2 272,1 1 073,9 3 342,8 6 688,8 35 536,8
Catatan : 1) Gas termasuk gas alam (LNG) & LPG Note : 1) Gas includes natural gas (LNG) & LPG
[2]
INTERNATIONAL TRADE
[1]
Products ofthe mining
Tahun dan bulan Hasil sektorHasil sektorpertanian
Products of
Hasil sektorindustri
Products of lain
Productsof other
Totalmentahtambang
94NERACA PEMBAYARAN DANPERDAGANGAN LUAR NEGERIBALANCE OF PAYMENTS AND
Hasil sektorTidak termasuk minyak bumi & gas / Excluding petroleum & gas Minyak bumi dan gas / Petroleum and gas
Year and month
product[11]
Sub Jumlah
Sub Total Crude
[7]
Minyak
petroleum[6] [8] [9] [10]
JumlahSub JumlahG a s 1)Hasil Ekspor
ExportsPetroleumminyak
G a s 1) Sub Totalthe industrialsector sector
[3] [4] [5]
the agriculturalsectorsector
https:
//www.b
ps.go.id

NERACA PEMBAYARAN DANPERDAGANGAN LUAR NEGERIBALANCE OF PAYMENTS ANDINTERNATIONAL TRADE
TABEL : 6.8.1 EKSPOR MENURUT NEGARA TUJUAN
TABLE EXPORTS VALUE BY COUNTRY OF DESTINATION
ASEAN 10 725,5 12 997,5 15 824,9 18 483,1 22 292,1 27 170,8 24 624,0 Malaysia 2 363,6 3 016,0 3 431,3 4 110,8 5 096,1 6 432,6 6 811,8 Thailand 1 392,7 1 976,2 2 246,5 2 701,5 3 054,3 3 661,2 3 233,8 Philipina / Philippines 944,7 1 237,6 1 419,1 1 405,7 1 853,7 2 053,6 2 405,9 Singapura / Singapore 5 399,8 6 001,2 7 836,6 8 929,8 10 501,6 12 862,0 10 262,7 Brunei Darussalam 30,4 31,8 39,3 37,6 43,4 59,7 74,9 Vietnam 468,3 601,0 678,4 1 052,0 1 355,1 1 672,9 1 454,2
Kamboja / Cambodia 2) 80,0 71,8 93,9 103,6 121,8 174,0 201,2
Laos 0,3 1,6 1,8 4,3 3,7 4,0 4,7 Myanmar 45,8 60,3 78,0 137,7 262,4 250,8 174,8Jepang / Japan 13 603,4 15 962,1 18 049,1 21 732,1 23 632,8 27 743,9 18 574,7Cina/China 3 802,5 4 604,7 6 662,4 8 343,6 9 675,5 11 636,5 11 499,3Asia Lainnya / Rest of Asia 12 288,1 14 617,6 18 226,2 20 709,7 23 492,5 29 369,3 27 150,9Afrika / Africa 1 250,3 1 359,4 1 669,0 1 985,6 2 510,7 3 281,3 2 753,5Amerika Serikat / U.S.A. 7 373,7 8 767,3 9 868,5 11 232,1 11 614,2 13 036,9 10 850,0Kanada / Canada 382,1 436,5 464,3 551,0 550,6 645,5 512,5Amerika lainnya / Rest of America 864,2 1 131,0 1 330,4 1 723,0 1 984,0 2 398,4 2 101,1Australia 1 791,5 1 887,4 2 227,6 2 771,3 3 394,6 4 111,0 3 264,2Oceania lainnya / Rest of Oceania 247,0 257,2 360,9 416,5 435,8 709,2 592,5
UNI EROPA / European Union 1)7 956,7 9 005,6 10 238,4 11 963,0 13 133,8 15 454,5 13 568,2
Inggris / United Kingdom 1 135,9 1 295,3 1 291,5 1 432,4 1 454,2 1 546,9 1 459,3 Belanda / Netherlands 1 401,6 1 797,5 2 233,5 2 518,4 2 749,5 3 926,4 2 909,1 Perancis / France 652,8 659,8 624,0 724,4 802,9 938,5 870,2 Jerman / Germany 1 416,7 1 654,6 1 781,6 2 025,7 2 316,0 2 465,2 2 326,7 Austria 26,1 22,6 24,1 24,4 24,1 34,9 41,2 Belgia & Luksemburg 912,1 926,1 1 006,7 1 150,3 1 332,5 1 357,3 1 058,7 Belgium & Luxembourg Denmark 95,9 112,2 127,2 142,8 140,8 170,9 168,8 Swedia / Sweden 110,2 115,2 108,1 135,4 109,8 134,1 144,3 Finlandia / Finland 132,1 148,3 183,5 176,6 121,3 108,4 61,2 Irlandia / Ireland 61,6 55,4 93,0 103,1 78,0 89,8 41,2 Italia / Italy 844,0 922,6 1 007,2 1 213,0 1 380,0 1 900,7 1 651,1 Yunani / Greece 95,0 92,5 104,8 125,8 233,5 214,3 165,7 Portugal / Portugis 50,3 73,3 88,8 114,1 95,1 100,8 102,3 Spanyol / Spain 1 022,3 837,5 1 205,5 1 641,1 1 906,2 1 665,3 1 830,5 Uni Eropa lainnya / Rest of European Union - 292,7 358,9 435,5 389,9 801,0 738,0
Eropa lainnya / Rest of Europe 773,2 558,3 738,3 887,7 1 384,3 1 463,1 1 019,1
61 058,3 71 584,6 85 660,0 100 798,6 114 100,9 137 020,4 116 510,0
Catatan : 1) Masyarakat Ekonomi Eropa (MEE) diganti dengan UNI EROPA Notes : 1) European Economic Community (EEC) has changed to European Union 2) Kamboja masuk Asean sejak Mei 1999 2) Cambodia joint to Asean since May 1999
95
(JUTA / MILLION US $)
2007
[5]
2008
[7]
2004
[3] [8]
2005 2006
[4] [6]
2009
[2]
2003
[1]
JUMLAH / TOTAL
Negara / Country
https:
//www.b
ps.go.id

NERACA PEMBAYARAN DANPERDAGANGAN LUAR NEGERIBALANCE OF PAYMENTS ANDINTERNATIONAL TRADE
TABEL : 6.9.1 EKSPOR MENURUT PELABUHAN PENTING
TABLE EXPORTS VALUE BY MAIN PORTS
JAWA DAN MADURA 29 671,6 34 705,7 38 425,5 43 586,1 49 194,9 52 749,5 48 265,0Tanjung Priok 17 999,4 21 696,6 24 074,3 26 076,1 28 010,7 31 693,2 28 165,4Surabaya / Tj. Perak 5 282,4 5 974,3 6 925,5 8 145,8 10 038,8 10 513,0 9 702,0SeMeiang 1 768,3 2 001,3 2 371,9 2 839,2 3 095,8 3 160,3 2 850,8Cirebon 1,1 1,0 0,2 0,0 0,0 0,3 0,7Lainnya / Others 4 620,4 5 032,5 5 053,6 6 525,0 8 049,6 7 382,7 7 546,1
SUMATERA 17 217,2 19 926,3 24 332,2 29 302,7 35 150,0 46 184,5 34 666,9Belawan 2 217,3 3 648,2 3 845,5 4 580,4 5 931,9 7 873,3 5 369,0Pakanbaru / Dumai 4 012,9 4 542,0 63,8 6 624,1 9 008,8 12 474,6 9 021,2Pk.Brandan / Pk.Susu - 0,1 0,0 - 0,0 0,0 -Palembang 164,1 163,2 28,2 991,1 649,6 821,0 436,7Panjang 739,9 667,8 1 083,0 1 520,9 1 540,5 2 743,7 2 258,7Tanjung Pinang 69,9 68,2 72,1 75,2 145,8 72,9 90,7Lainnya / Others 10 013,1 10 836,8 19 239,6 15 511,0 17 873,4 22 199,0 17 490,6
KALIMANTAN 10 753,1 13 148,9 17 067,0 19 642,4 20 306,1 29 428,3 25 325,7Pontianak 372,1 414,3 398,9 540,6 604,2 727,3 393,8Banjarmasin 703,3 808,9 977,9 1 295,1 1 566,4 2 284,8 3 117,9Balikpapan 1 089,3 1 408,4 1 804,3 2 114,7 2 241,1 2 917,2 2 177,8Tarakan 81,4 102,6 88,1 110,2 103,0 135,2 125,5Lainnya / Others 8 507,0 10 414,7 13 797,8 15 581,8 15 791,4 23 363,8 19 510,7
SULAWESI 997,0 1 542,9 2 024,7 2 632,6 3 928,1 3 703,6 2 410,2Ujung Pandang 332,8 319,1 450,9 604,4 591,4 709,7 713,2Bitung 174,1 205,7 335,9 182,6 501,7 645,3 396,0Lainnya / Others 490,1 1 018,1 1 237,9 1 845,6 2 835,0 2 348,6 1 301,0
BALI DAN NUSA 699,8 1 083,3 1 135,2 1 530,0 1 360,0 1 021,5 1 527,3
TENGGARABenoa 5,4 18,9 28,5 34,5 39,9 26,9 22,9Kupang 0,1 - 0,0 - 0,0 0,1 0,0Lainnya / Others 694,3 1 064,4 1 106,7 1 495,5 1 320,1 994,5 1 504,5
MALUKU DAN IRIAN JAYA 1 719,6 1 177,5 2 675,3 4 104,8 4 161,8 3 933,0 4 314,9Ambon 28,6 38,9 23,0 47,3 91,7 106,4 69,5Amamapare 1 342,7 853,5 2 304,4 3 429,9 3 109,2 2 584,1 3 857,4Lainnya / Others 348,3 285,1 347,9 627,6 960,9 1 242,5 388,0
61 058,3 71 584,6 85 660,0 100 798,6 114 100,9 137 020,4 116 510,0
[7][6]
2007
[3]
20052004 2006
[5]
98
(JUTA / MILLION US $)
2009
[8][4]
2008
[2]
JUMLAH / TOTAL
[1]
Pelabuhan / Ports 2003
https:
//www.b
ps.go.id

NERACA PEMBAYARAN DANPERDAGANGAN LUAR NEGERIBALANCE OF PAYMENTS ANDINTERNATIONAL TRADE
TABEL : 6.8.2 NILAI EKSPOR NON MIGAS DAN MIGAS MENURUT NEGARA TUJUAN
TABLE EXPORTS VALUE OF NON OIL&GAS AND OIL&GAS BY COUNTRY OF DESTINATION
NON MIGAS 6 109 859,7 7 333 128,1 19 697 556,0 8 991 189,0 10 605 802,3 28 847 989,6ASEAN 1 453 017,0 1 479 970,1 4 195 742,5 1 819 930,2 2 348 457,2 6 083 902,7
Thailand 147 026,4 182 254,0 477 214,1 273 447,9 323 194,7 892 998,0Singapura / Singapore 731 811,6 599 860,1 1 912 335,2 711 855,3 914 158,6 2 281 101,7Filipina / Philippines 128 048,9 208 558,5 488 626,3 234 291,4 298 669,4 728 209,5Malaysia 318 270,6 331 158,7 931 127,0 438 109,9 625 437,5 1 661 275,7Myanmar 12 644,8 11 147,1 35 971,8 29 099,0 31 347,8 88 336,0Kamboja / Cambodia 13 088,8 15 690,3 42 723,2 14 961,3 19 182,2 51 762,5Brunei Darussalam 3 520,3 3 272,9 11 376,8 3 300,8 5 239,8 13 462,7Laos 66,1 158,5 350,5 110,3 228,2 608,4Vietnam 98 539,5 127 870,0 296 017,7 114 754,4 130 999,1 366 148,2
Jepang / Japan 721 572,3 912 071,7 2 425 364,2 1 056 841,3 1 330 948,1 3 683 025,3Cina/China 377 620,1 607 151,6 1 447 644,8 982 224,7 1 094 961,3 3 088 113,5
Asia lainnya / Rest of Asia 1 288 982,8 1 904 862,8 4 542 472,3 2 036 234,1 2 383 029,8 6 575 317,5
Afrika / Africa 200 929,0 197 718,7 582 146,4 268 736,4 288 206,8 765 000,7
Amerika Serikat / U.S.A 790 023,0 761 389,6 2 331 240,4 910 258,6 1 094 769,1 2 996 120,9Kanada / Canada 35 664,8 33 835,5 106 511,2 47 213,1 72 880,9 167 901,0
Amerika lainnya / Rest of America 141 584,9 149 121,6 418 980,1 193 633,9 240 861,9 616 361,9
Australia 155 676,2 126 641,8 404 660,1 136 461,0 169 214,3 465 488,1
Oseania lainnya / Rest of Oceania 28 089,2 35 367,3 119 743,8 40 350,2 38 175,3 116 631,3
UNI EROPA / European Union 840 985,6 1 058 800,7 2 937 584,9 1 413 231,6 1 409 774,6 3 993 931,2Inggris / United Kingdom 105 134,9 112 872,4 325 673,9 127 743,1 137 315,3 435 476,6Belanda / Netherlands 155 811,3 237 230,2 625 733,2 210 814,0 216 111,2 628 689,6Perancis / France 64 909,7 59 002,8 191 890,8 76 590,1 91 859,0 330 660,4Jerman / Germany 149 693,4 158 357,4 464 592,9 244 116,0 231 959,4 678 117,9Austria 4 009,5 3 763,3 10 769,1 3 294,0 4 004,3 11 301,7Belgia / Belgium 79 662,5 78 081,0 237 215,8 104 678,5 114 911,3 315 675,3Luksemburg / Luxembourg 221,2 787,1 1 600,2 2 796,5 1 374,5 5 920,7Denmark 14 843,6 7 888,3 34 301,1 11 093,0 16 824,5 44 568,9Swedia / Sweden 11 436,2 8 561,9 31 914,8 10 167,0 12 523,4 35 073,2Finlandia / Finland 6 054,0 4 653,9 14 545,5 5 924,8 9 632,6 22 408,1Irlandia / Ireland 4 108,6 3 412,2 11 597,9 3 920,6 4 571,7 11 630,2Italia / Italy 98 598,8 113 914,9 363 780,6 197 706,4 185 151,7 532 337,5Spanyol / Spain 62 889,8 195 110,2 386 644,6 331 385,5 283 602,4 685 751,2Portugal / Portugis 5 779,6 6 667,9 20 822,2 8 048,1 10 271,9 24 566,6Yunani / Greece 8 579,4 15 554,0 40 153,3 11 102,3 12 544,7 35 399,6Uni Eropa lainnya / Rest of European Union 69 253,4 52 942,9 176 349,1 63 851,7 77 116,8 196 353,7
Rusia 16 253,1 18 115,4 46 744,2 49 481,6 42 844,4 127 104,7
Eropa lainnya / Rest of Europe 59 461,9 48 081,3 138 721,1 36 592,3 91 678,5 169 090,6
Februari Januari-Maret
[7]
96
(RIBU / THOUSAND US $)
Golongan barang & negara 2009 2010
Commodity group & country Februari Januari-Maret
[1] [2] [4] [5]
Maret
[3]
Maret
[6]
https:
//www.b
ps.go.id

NERACA PEMBAYARAN DANPERDAGANGAN LUAR NEGERIBALANCE OF PAYMENTS ANDINTERNATIONAL TRADE
TABEL : 6.8.2 NILAI EKSPOR NON MIGAS DAN MIGAS MENURUT NEGARA TUJUAN
TABLE EXPORTS VALUE OF NON OIL&GAS AND OIL&GAS BY COUNTRY OF DESTINATION
(Lanjutan/Continuation )
MIGAS 1 024 459,5 1 281 597,8 3 331 598,7 2 175 261,4 2 168 563,6 6 688 693,9ASEAN 99 238,9 123 537,1 357 757,4 581 380,4 494 715,1 2 017 747,0
Thailand 25 746,9 28 281,6 59 551,7 64 106,4 103 019,9 227 542,6Singapura / Singapore 49 082,7 58 042,1 211 648,8 420 648,2 280 920,0 1 374 667,8Filipina / Philippines 218,2 197,3 498,5 214,8 7 368,6 37 600,8Malaysia 24 172,0 36 957,9 85 981,1 96 411,0 103 406,6 377 935,7Myanmar 19,2 21,2 40,4 - - -Vietnam - 36,9 36,9 - - -
Jepang / Japan 418 123,1 424 870,1 1 326 163,8 732 833,6 676 048,2 2 060 387,6Cina/China 139 603,9 273 921,2 531 513,1 86 914,1 90 532,1 243 190,5
Asia lainnya / Rest of Asia 268 604,3 252 008,9 693 868,6 540 259,4 607 657,8 1 647 298,2
Afrika / Africa - - - 19,9 63 686,9 63 706,8
Amerika Serikat / U.S.A 20 789,7 35 466,7 74 812,5 72 592,3 85 593,8 247 163,6Kanada / Canada - - - - - -
Amerika lainnya / Rest of U.S.A 22 950,5 - 22 950,5 - - -
Australia 46 838,4 168 006,0 312 279,9 159 439,4 137 365,6 392 867,0
Oseania lainnya / Rest of Oceania 8 262,2 3 695,4 12 063,2 1 737,2 9 541,2 12 695,8
UNI EROPA / European Union - 10,0 10,0 - 3 370,8 3 500,2Inggris / United Kingdom - - - - - -Belanda / Netherlands - 10,0 10,0 - 3 125,0 3 125,0Perancis / France - - - - - -Jerman / Germany - - - - 245,8 375,1Belgia / Belgium - - - - - -Denmark - - - - - -Italia / Italy - - - - - -Portugal / Portugis - - - - - -
Rusia 48,7 82,4 179,8 - - -
Eropa lainnya / Rest of Europe - - - 85,1 52,1 137,2
JUMLAH / TOTAL 7 134 319,2 8 614 725,9 23 029 154,7 11 166 450,4 12 774 365,9 35 536 683,5
97
[7]
(RIBU / THOUSAND US $)
Golongan barang & negara 2009 2010
Commodity group & country Februari Januari-Maret Februari Januari-Maret
[1] [2] [4] [5]
Maret
[2]
Maret
[6]
https:
//www.b
ps.go.id
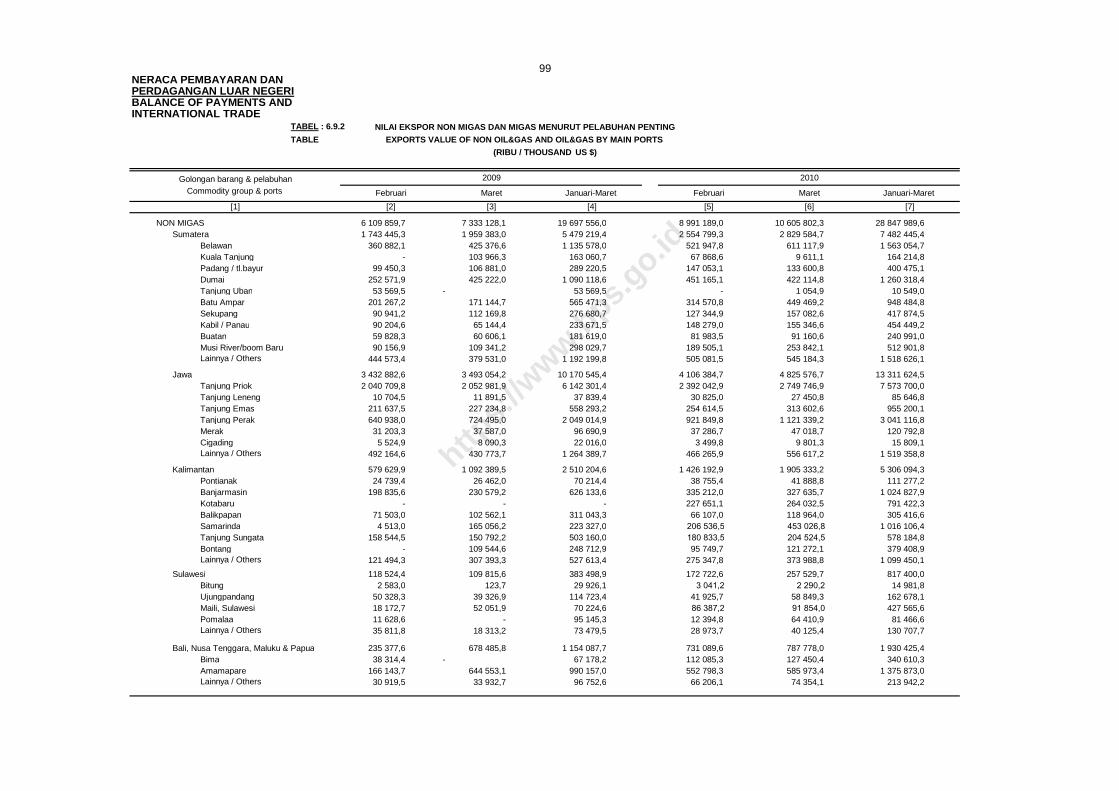
NERACA PEMBAYARAN DANPERDAGANGAN LUAR NEGERIBALANCE OF PAYMENTS ANDINTERNATIONAL TRADE
TABEL : 6.9.2 NILAI EKSPOR NON MIGAS DAN MIGAS MENURUT PELABUHAN PENTING
TABLE EXPORTS VALUE OF NON OIL&GAS AND OIL&GAS BY MAIN PORTS
NON MIGAS 6 109 859,7 7 333 128,1 19 697 556,0 8 991 189,0 10 605 802,3 28 847 989,6Sumatera 1 743 445,3 1 959 383,0 5 479 219,4 2 554 799,3 2 829 584,7 7 482 445,4
Belawan 360 882,1 425 376,6 1 135 578,0 521 947,8 611 117,9 1 563 054,7Kuala Tanjung - 103 966,3 163 060,7 67 868,6 9 611,1 164 214,8Padang / tl.bayur 99 450,3 106 881,0 289 220,5 147 053,1 133 600,8 400 475,1Dumai 252 571,9 425 222,0 1 090 118,6 451 165,1 422 114,8 1 260 318,4Tanjung Uban 53 569,5 - 53 569,5 - 1 054,9 10 549,0Batu Ampar 201 267,2 171 144,7 565 471,3 314 570,8 449 469,2 948 484,8Sekupang 90 941,2 112 169,8 276 680,7 127 344,9 157 082,6 417 874,5Kabil / Panau 90 204,6 65 144,4 233 671,5 148 279,0 155 346,6 454 449,2Buatan 59 828,3 60 606,1 181 619,0 81 983,5 91 160,6 240 991,0Musi River/boom Baru 90 156,9 109 341,2 298 029,7 189 505,1 253 842,1 512 901,8Lainnya / Others 444 573,4 379 531,0 1 192 199,8 505 081,5 545 184,3 1 518 626,1
Jawa 3 432 882,6 3 493 054,2 10 170 545,4 4 106 384,7 4 825 576,7 13 311 624,5Tanjung Priok 2 040 709,8 2 052 981,9 6 142 301,4 2 392 042,9 2 749 746,9 7 573 700,0Tanjung Leneng 10 704,5 11 891,5 37 839,4 30 825,0 27 450,8 85 646,8Tanjung Emas 211 637,5 227 234,8 558 293,2 254 614,5 313 602,6 955 200,1Tanjung Perak 640 938,0 724 495,0 2 049 014,9 921 849,8 1 121 339,2 3 041 116,8Merak 31 203,3 37 587,0 96 690,9 37 286,7 47 018,7 120 792,8Cigading 5 524,9 8 090,3 22 016,0 3 499,8 9 801,3 15 809,1Lainnya / Others 492 164,6 430 773,7 1 264 389,7 466 265,9 556 617,2 1 519 358,8
Kalimantan 579 629,9 1 092 389,5 2 510 204,6 1 426 192,9 1 905 333,2 5 306 094,3Pontianak 24 739,4 26 462,0 70 214,4 38 755,4 41 888,8 111 277,2Banjarmasin 198 835,6 230 579,2 626 133,6 335 212,0 327 635,7 1 024 827,9Kotabaru - - - 227 651,1 264 032,5 791 422,3Balikpapan 71 503,0 102 562,1 311 043,3 66 107,0 118 964,0 305 416,6Samarinda 4 513,0 165 056,2 223 327,0 206 536,5 453 026,8 1 016 106,4Tanjung Sungata 158 544,5 150 792,2 503 160,0 180 833,5 204 524,5 578 184,8Bontang - 109 544,6 248 712,9 95 749,7 121 272,1 379 408,9Lainnya / Others 121 494,3 307 393,3 527 613,4 275 347,8 373 988,8 1 099 450,1
Sulawesi 118 524,4 109 815,6 383 498,9 172 722,6 257 529,7 817 400,0Bitung 2 583,0 123,7 29 926,1 3 041,2 2 290,2 14 981,8Ujungpandang 50 328,3 39 326,9 114 723,4 41 925,7 58 849,3 162 678,1Maili, Sulawesi 18 172,7 52 051,9 70 224,6 86 387,2 91 854,0 427 565,6Pomalaa 11 628,6 - 95 145,3 12 394,8 64 410,9 81 466,6Lainnya / Others 35 811,8 18 313,2 73 479,5 28 973,7 40 125,4 130 707,7
Bali, Nusa Tenggara, Maluku & Papua 235 377,6 678 485,8 1 154 087,7 731 089,6 787 778,0 1 930 425,4Bima 38 314,4 - 67 178,2 112 085,3 127 450,4 340 610,3Amamapare 166 143,7 644 553,1 990 157,0 552 798,3 585 973,4 1 375 873,0Lainnya / Others 30 919,5 33 932,7 96 752,6 66 206,1 74 354,1 213 942,2
Februari Januari-Maret
[7]
99
(RIBU / THOUSAND US $)
Golongan barang & pelabuhan 2009 2010
Commodity group & ports Februari Januari-Maret
[1] [2] [4] [5]
Maret
[3]
Maret
[6]
https:
//www.b
ps.go.id

NERACA PEMBAYARAN DANPERDAGANGAN LUAR NEGERIBALANCE OF PAYMENTS ANDINTERNATIONAL TRADE
TABEL : 6.9.2 NILAI EKSPOR NON MIGAS DAN MIGAS MENURUT PELABUHAN PENTING
TABLE EXPORTS VALUE OF NON OIL&GAS AND OIL&GAS BY MAIN PORTS
(Lanjutan/Continuation )
MIGAS 1 024 459,5 1 281 597,8 3 331 598,7 2 175 261,4 2 168 563,6 6 688 693,9
Sumatera 340 030,3 345 920,3 1 015 803,6 1 043 201,4 785 014,7 3 070 934,2
Blang Lancang (arun) 105 977,3 84 417,6 241 341,7 137 215,6 128 366,9 343 833,2
Dumai 173 164,2 203 935,3 591 606,7 457 550,8 345 632,2 1 199 911,2Sungai Pakning - - 2 995,4 11 843,4 - 11 843,4
Muara Sabak 25 697,6 12 770,1 38 467,7 28 266,7 24 749,2 53 016,0
Palembang-Plaju 16 818,6 32 123,3 95 471,2 18 737,1 23 841,8 111 589,0Lainnya / Others 18 372,6 12 673,9 45 920,9 389 587,8 262 424,6 1 350 741,4
Jawa 78 297,0 163 738,9 277 882,6 248 314,7 464 559,7 948 338,0
Tanjung Priok 42 455,4 97 534,8 161 498,3 1 119,7 1 049,0 2 490,0
Balongan - - - - 16 218,4 32 675,4
Tanjung Leneng 1 061,6 - 2 187,9 20 461,5 22 380,5 58 971,1
Cilacap - 11 607,0 11 607,0 59 544,9 33 054,1 92 599,0
Tuban 4 628,5 - 4 628,5 78 385,5 166 224,2 322 423,4
Gresik - 19 060,4 19 060,4 43 413,1 32 154,8 91 671,8Lainnya / Others 30 151,5 35 536,7 78 900,5 45 390,0 193 478,8 347 507,3
Kalimantan 606 084,9 771 884,6 2 037 734,6 878 009,0 917 427,4 2 654 743,8
Balikpapan 120 325,3 81 029,6 277 924,2 151 600,8 105 702,3 341 475,3
Tanjung Santan 111 206,2 155 656,6 346 019,3 49 157,1 76 783,3 157 727,5
Bontang 326 901,1 472 545,3 1 249 866,3 607 607,3 661 475,1 1 950 684,1
Senipah 47 652,3 62 653,1 163 924,8 69 643,8 73 466,7 204 856,9Lainnya / Others - 0,0 0,1 - - -
Sulawesi - - - - - -
Talise - - - - - -Lainnya / Others - - - - - -
Bali, Nusa Tenggara, Maluku & Papua 47,4 54,0 177,9 5 736,3 1 561,7 14 677,9
Teluk Kasim / Salawati - - - 4 147,1 - 4 147,1Lainnya / Others 47,4 54,0 177,9 1 589,2 1 561,7 10 530,7
7 134 319,2 8 614 725,9 23 029 154,7 11 166 450,4 12 774 365,9 35 536 683,5
100
[7]
JUMLAH / TOTAL
2009 2010
Commodity group & ports Februari Januari-Maret Februari Januari-Maret
[1] [2] [4] [5][3] [6]
Maret Maret
(RIBU / THOUSAND US $)
Golongan barang & pelabuhan
https:
//www.b
ps.go.id
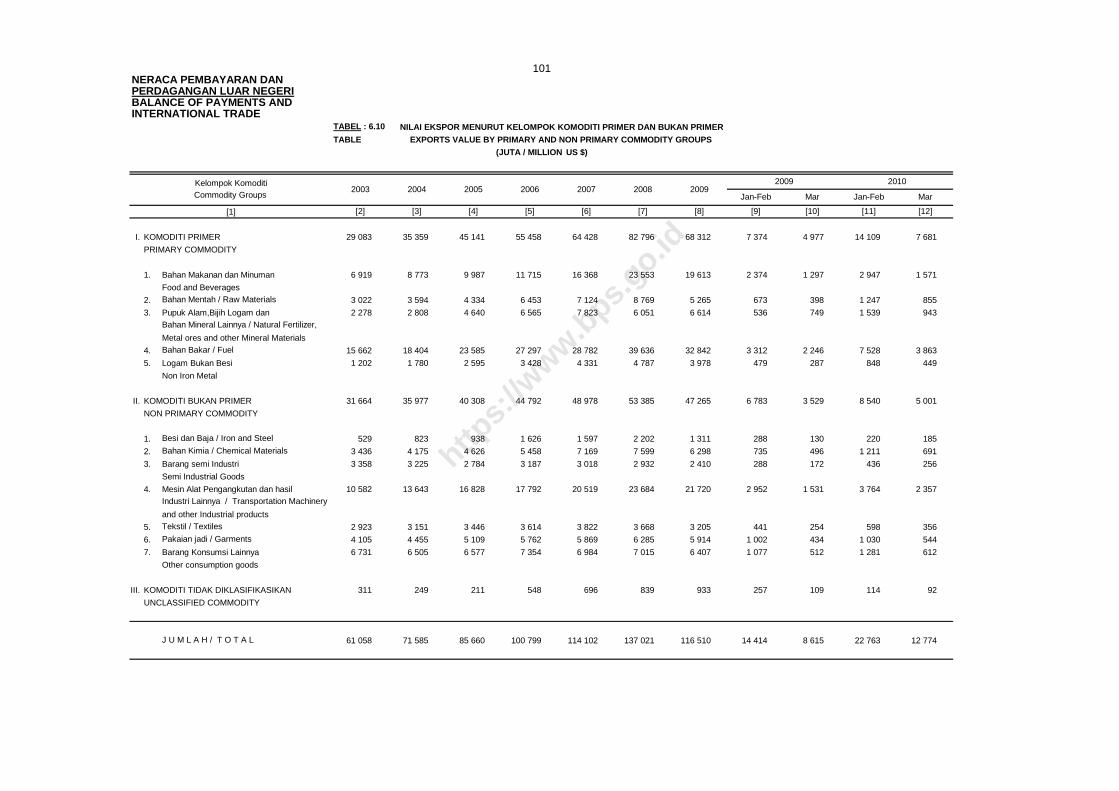
TABEL : 6.10 NILAI EKSPOR MENURUT KELOMPOK KOMODITI PRIMER DAN BUKAN PRIMER
TABLE EXPORTS VALUE BY PRIMARY AND NON PRIMARY COMMODITY GROUPS
I. 29 083 35 359 45 141 55 458 64 428 82 796 68 312 7 374 4 977 14 109 7 681
1. Bahan Makanan dan Minuman 6 919 8 773 9 987 11 715 16 368 23 553 19 613 2 374 1 297 2 947 1 571
Food and Beverages
2. Bahan Mentah / Raw Materials 3 022 3 594 4 334 6 453 7 124 8 769 5 265 673 398 1 247 855
3. Pupuk Alam,Bijih Logam dan 2 278 2 808 4 640 6 565 7 823 6 051 6 614 536 749 1 539 943Bahan Mineral Lainnya / Natural Fertilizer,
Metal ores and other Mineral Materials
4. Bahan Bakar / Fuel 15 662 18 404 23 585 27 297 28 782 39 636 32 842 3 312 2 246 7 528 3 863
5. Logam Bukan Besi 1 202 1 780 2 595 3 428 4 331 4 787 3 978 479 287 848 449
Non Iron Metal
II. 31 664 35 977 40 308 44 792 48 978 53 385 47 265 6 783 3 529 8 540 5 001
1. Besi dan Baja / Iron and Steel 529 823 938 1 626 1 597 2 202 1 311 288 130 220 185
2. Bahan Kimia / Chemical Materials 3 436 4 175 4 626 5 458 7 169 7 599 6 298 735 496 1 211 691
3. Barang semi Industri 3 358 3 225 2 784 3 187 3 018 2 932 2 410 288 172 436 256
Semi Industrial Goods
4. Mesin Alat Pengangkutan dan hasil 10 582 13 643 16 828 17 792 20 519 23 684 21 720 2 952 1 531 3 764 2 357Industri Lainnya / Transportation Machinery
and other Industrial products
5. Tekstil / Textiles 2 923 3 151 3 446 3 614 3 822 3 668 3 205 441 254 598 356
6. Pakaian jadi / Garments 4 105 4 455 5 109 5 762 5 869 6 285 5 914 1 002 434 1 030 544
7. Barang Konsumsi Lainnya 6 731 6 505 6 577 7 354 6 984 7 015 6 407 1 077 512 1 281 612
Other consumption goods
III. 311 249 211 548 696 839 933 257 109 114 92
J U M L A H / T O T A L 61 058 71 585 85 660 100 799 114 102 137 021 116 510 14 414 8 615 22 763 12 774
INTERNATIONAL TRADE
NERACA PEMBAYARAN DAN
[8]
2008
PERDAGANGAN LUAR NEGERIBALANCE OF PAYMENTS AND
20062004
[9] [11]
2007 2009Kelompok KomoditiCommodity Groups
2003 2005
KOMODITI PRIMER
[7][2]
UNCLASSIFIED COMMODITY
PRIMARY COMMODITY
KOMODITI BUKAN PRIMER
NON PRIMARY COMMODITY
KOMODITI TIDAK DIKLASIFIKASIKAN
[4] [6][1] [5][3]
101
(JUTA / MILLION US $)
Mar
[10]
Mar
[12]
Jan-Feb
2009 2010
Jan-Feb
https:
//www.b
ps.go.id

TABEL : 6.11 NILAI IMPOR MENURUT GOLONGAN BARANG SITCTABLE IMPORTS VALUE BY SITC COMMODITY GROUPS
2000 2 782 180 3 304 6 071 48 5 893 5 041 9 212 977 7 33 515
2001 2 497 235 3 179 5 523 40 5 400 4 250 9 050 779 9 30 962
2002 2 852 211 2 668 6 558 53 5 276 4 243 8 606 815 7 31 289
2003 3 121 168 2 596 7 664 51 5 317 4 159 8 567 899 9 32 551
2004 3 786 195 3 506 11 798 71 7 614 6 203 12 175 1 176 0 46 524
2005 4 012 208 3 397 17 512 73 8 076 7 813 15 262 1 344 4 57 701
2006 4 709 232 3 613 19 028 86 8 724 7 702 15 411 1 557 3 61 065
2007 6 884 331 4 469 21 994 83 10 065 9 611 19 038 1 990 8 74 473
2008 7 920 479 7 382 30 652 127 15 988 20 158 42 726 3 729 36 129 197
2009 7 270 424 4 980 19 066 115 11 804 14 125 35 716 3 304 25 96 829
Maret 476 30 341 941 13 858 1 025 2 650 218 2 6 554
Triw/Qrt I 1 386 91 928 3 203 26 2 164 3 120 7 521 650 5 19 094
April 523 34 393 1 238 7 942 977 2 349 241 2 6 706
Mei 594 25 366 1 566 9 939 1 061 2 814 265 2 7 641
Juni 771 21 528 1 447 9 1 011 1 108 2 751 288 2 7 936
Triw/Qrt II 1 888 80 1 287 4 251 25 2 892 3 146 7 914 794 6 22 283
Juli 570 36 388 1 844 7 1 102 1 138 3 285 311 2 8 683
Agustus 824 53 482 1 525 12 1 253 1 205 4 042 310 1 9 707
September 661 28 377 2 378 15 930 1 145 2 723 258 2 8 517
Triw/Qrt III 2 055 117 1 247 5 747 34 3 285 3 488 10 050 879 5 26 907
Oktober 794 54 484 1 922 12 1 254 1 484 3 121 303 2 9 430
November 523 38 452 1 837 10 1 053 1 408 3 153 337 4 8 815
Desember 624 44 582 2 106 8 1 156 1 479 3 957 341 3 10 300
Triw/Qrt IV 1 941 136 1 518 5 865 30 3 463 4 371 10 231 981 9 28 545
2010
Januari 621 36 505 1 942 15 1 223 1 523 3 281 341 3 9 490
Februari 648 37 445 2 050 16 1 129 1 478 3 421 269 5 9 498
Maret 887 49 580 2 259 11 1 419 1 509 3 886 367 6 10 973
Triw/Qrt I 2 156 122 1 530 6 251 42 3 771 4 510 10 588 977 14 29 961
Catatan : N o t e : 0) Food and Live Animals1) Beverages and Tobacco2) Raw Materials, Inedible3) Fuels, Lubricants etc4) Animal & Vegetables Oil and Fats5) Chemical6) Manufactured goods7) Machinery & Transport Equipments8) Misc. Manufactured Articles9) Commodities & other Special Transactions
1) Minuman dan Tembakau0) Bahan Makanan dan Binatang Hidup
[12]Total imports5
[5] [6]
102
PERDAGANGAN LUAR NEGERIBALANCE OF PAYMENTS AND
[10] [11][1] [2]
INTERNATIONAL TRADE
C.I.F. (JUTA / MILLION US $)
[3]
Kelompok komoditi SITC / SITC Commodity groups
8[9]
9[4]
6[7] [8]
NERACA PEMBAYARAN DAN
Jumlah impor
Year and month 0 1 2 3 4
Tahun dan bulan
7
4) Minyak/Lemak Nabati dan Hewani
2) Bahan Mentah
9) Barang dan Transaksi Khusus Lainnya
7) Mesin dan Alat Pengangkutan8) Hasil Industri Lainnya
5) Bahan Kimia6) Hasil Industri menurut Bahan
3) Bahan Bakar, Bahan Penyemir dan sebagainya
https:
//www.b
ps.go.id

NERACA PEMBAYARAN DANPERDAGANGAN LUAR NEGERIBALANCE OF PAYMENTS ANDINTERNATIONAL TRADE
TABEL : 6.12.1 NILAI IMPOR MENURUT NEGARA ASAL
TABLE IMPORTS VALUE BY COUNTRY OF ORIGIN
ASEAN 7 729,9 11 494,4 17 039,9 18 970,6 23 792,2 40 967,8 27 722,0 Thailand 1 701,7 2 771,6 3 447,0 2 983,5 4 287,1 6 334,3 4 612,9 Singapura / Singapore 4 155,1 6 082,8 9 470,7 10 034,5 9 839,8 21 789,5 15 550,4 Filipina / Philippines 182,6 228,6 322,2 284,6 359,9 755,5 544,0 Malaysia 1 138,2 1 681,9 2 148,5 3 193,3 6 411,9 8 922,3 5 688,4 Myanmar 14,9 17,4 14,2 19,7 30,4 29,7 29,1 Kamboja / Cambodia 2) 1,5 1,1 0,7 1,1 1,3 2,0 3,4 Brunei Darussalam 117,0 295,2 1 197,5 1 606,9 1 864,7 2 416,6 639,6 Laos 3,3 0,0 0,1 0,2 2,9 0,2 0,4 Vietnam 415,6 415,8 439,0 846,8 994,2 717,7 653,8Jepang / Japan 4 228,3 6 081,6 6 906,3 5 515,8 6 526,7 15 128,0 9 843,7Cina / China 2 957,5 4 101,3 5 842,9 6 636,9 8 557,9 15 247,2 14 002,2Asia lainnya / Rest of Asia 6 367,3 8 631,3 10 646,6 12 159,0 13 094,7 24 654,2 17 671,9Afrika / Africa 1 590,5 2 340,7 1 606,6 1 189,6 2 314,2 2 241,9 2 047,4Australia 1 648,4 2 214,9 2 567,1 2 986,3 3 004,0 3 997,5 3 436,0Oceania lainnya / Rest of Oceania 193,2 233,8 290,0 351,0 530,0 760,6 710,8Amerika Serikat / U.S.A. 2 694,8 3 225,4 3 878,9 4 056,5 4 787,2 7 880,1 7 083,9Kanada / Canada 321,8 551,7 698,0 666,5 1 055,6 1 871,5 992,5Amerika lainnya / Rest of America 566,0 1 022,4 1 157,3 1 254,1 1 551,8 2 644,0 2 421,8
UNI EROPA / European Union 1) 3 618,0 5 320,5 5 826,8 6 023,7 7 679,9 10 560,0 8 679,9 Inggris / United Kingdom 463,7 703,2 645,3 553,0 654,0 1 067,6 844,6 Belanda / Netherlands 369,6 474,6 369,1 515,4 504,0 602,7 554,1 Perancis / France 453,2 544,2 706,6 949,9 1 443,7 1 689,7 1 633,1 Jerman / Germany 1 181,2 1 734,0 1 780,8 1 456,6 1 982,0 3 068,8 2 373,5 Austria 66,1 77,9 106,6 89,1 127,7 358,5 259,3 Belgia / Belgium 189,4 264,2 316,9 305,5 338,4 620,2 434,3 Luksemburg / Luxembourg 1,8 1,6 8,0 8,9 36,3 7,3 6,6 Denmark 41,2 73,8 74,3 80,9 101,3 102,6 116,6 Swedia / Sweden 191,4 380,4 499,7 646,1 773,2 1 031,0 712,3 Finlandia / Finland 89,0 210,9 329,0 372,9 326,9 359,7 227,0 Irlandia / Ireland 44,7 107,0 81,1 148,1 170,9 126,4 185,6 Italia / Italy 323,7 473,3 568,9 551,4 667,5 999,3 726,1 Spanyol / Spain 121,0 182,9 214,1 206,6 286,4 251,8 254,0 Portugal / Portugis 2,0 2,4 4,8 7,7 10,2 10,3 12,6 Yunani / Greece 16,3 21,6 28,4 27,8 29,3 28,0 32,8 Uni Eropa lainnya / Rest of European Union 63,7 68,5 93,2 103,8 228,1 236,1 307,4
Eropa lainnya / Rest of Europe 635,0 1 306,5 1 240,5 1 255,5 1 579,2 3 244,5 2 217,1
JUMLAH / TOTAL 32 550,7 46 524,5 57 700,9 61 065,5 74 473,4 129 197,3 96 829,2
Catatan : 1) - Masyarakat Ekonomi Eropa (MEE) diganti dengan UNI EROPA Notes : 1) - European Economic Community (EEC) has changed to European Union - Uni Eropa sejak Januari 2005 menjadi 25 negara - Since January 2005, European Union become 25 country 2) Kamboja masuk Asean Sejak Mei 1999 2) Cambodia Joint to Asean Since May 1999
2003
[1]
2009
[8]
2008
[7]
2006
[6]
20052004 2007
[5]
103
[2] [4]
(JUTA / MILLION US $)
Negara / Country
[3]
https:
//www.b
ps.go.id

NERACA PEMBAYARAN DANPERDAGANGAN LUAR NEGERIBALANCE OF PAYMENTS ANDINTERNATIONAL TRADE
TABEL : 6.12.2 NILAI IMPOR NON MIGAS DAN MIGAS MENURUT NEGARA ASAL
TABLE IMPORS VALUE OF NON OIL&GAS AND OIL&GAS BY COUNTRY OF ORIGIN
NON MIGAS 4 974 620,7 5 624 051,9 15 917 751,3 7 452 671,4 8 720 559,4 23 726 795,0ASEAN 1 133 557,7 1 219 982,8 3 560 442,6 1 727 761,6 2 263 742,3 5 684 833,1
Thailand 283 731,5 285 633,5 860 443,2 554 287,8 743 966,9 1 780 160,4Singapura / Singapore 581 563,0 654 718,7 1 887 787,4 734 962,7 996 133,7 2 509 915,4Filipina / Philippines 27 223,4 29 173,3 80 708,5 41 500,9 64 221,0 144 979,1Malaysia 215 702,3 208 478,1 636 823,2 336 989,8 362 998,8 1 030 388,0Myanmar 1 884,2 5 554,0 8 864,4 3 195,6 6 069,2 9 869,3Kamboja / Cambodia 187,3 377,1 904,0 157,4 176,8 511,1Brunei Darussalam 761,2 0,0 770,6 172,5 321,8 781,8Laos 1,6 116,5 159,8 159,5 43,6 216,8Vietnam 22 503,2 35 931,6 83 981,5 56 335,4 89 810,5 208 011,2
Jepang / Japan 666 274,6 695 851,2 2 123 290,7 1 103 078,2 1 348 977,0 3 515 492,4Cina / China 760 772,4 1 053 632,4 2 850 135,5 1 380 704,1 1 340 236,0 4 126 985,4Asia lainnya / Rest of Asia 676 098,5 876 894,5 2 290 319,0 1 010 088,9 1 199 029,0 3 377 740,6
Afrika / Africa 39 447,0 38 644,8 99 769,0 56 681,8 85 159,9 222 755,7
Australia 190 166,0 214 753,6 655 731,8 268 688,9 330 320,9 913 738,5Oceania lainnya / Rest of Oceania 39 881,1 48 644,2 126 902,5 60 555,4 75 082,4 207 275,2
Amerika Serikat / U.S.A 562 595,9 609 710,2 1 583 187,6 781 851,0 868 038,8 2 243 145,3Kanada / Canada 74 326,6 39 221,1 192 105,9 40 779,8 68 687,8 210 040,7Amerika lainnya / Rest of America 94 492,2 119 592,5 332 868,5 161 863,1 201 906,7 526 407,3
UNI EROPA / European Union 656 479,5 644 128,3 1 879 713,6 624 161,6 749 702,0 2 048 375,5Inggris / United Kingdom 68 015,8 64 617,4 176 731,0 64 954,3 70 263,1 195 576,2Belanda / Netherlands 31 407,9 39 164,1 123 863,9 42 974,2 60 841,3 157 932,6Perancis / France 102 576,4 126 876,8 289 616,4 67 644,4 71 463,1 207 010,3Jerman / Germany 209 732,4 170 129,4 531 203,8 202 429,1 249 850,4 655 808,7Austria 25 991,3 18 893,0 69 719,9 21 366,4 21 339,9 67 548,9Belgia / Belgium 37 206,1 27 331,9 98 564,2 38 700,1 43 970,0 116 868,9Luksemburg / Luxembourg 93,5 300,1 622,6 206,3 374,5 1 432,5Denmark 10 532,2 8 580,3 29 833,6 9 131,9 10 543,6 32 060,2Swedia / Sweden 37 749,2 82 675,2 185 599,0 33 318,6 38 310,3 129 451,5Finlandia / Finland 42 223,4 15 580,5 78 989,6 17 690,8 22 652,2 58 843,7Irlandia / Ireland 2 596,4 4 294,2 27 250,2 6 942,5 7 348,1 22 674,7Italia / Italy 59 218,7 49 722,2 172 550,8 68 063,7 70 335,4 211 962,6Spanyol / Spain 13 964,9 14 719,8 42 653,7 24 605,2 27 562,1 83 991,6Portugal / Portugis 909,0 662,2 2 306,3 679,4 994,6 2 599,9Yunani / Greece 1 502,6 1 470,2 3 868,4 8 577,9 6 874,5 19 480,1Uni Eropa lainnya / Rest of European Union 12 759,5 19 111,0 46 340,2 16 876,8 46 978,9 85 133,1
Eropa lainnya / Rest of Europe 80 529,2 62 996,3 223 284,6 236 457,0 189 676,6 650 005,3
Februari Januari-MaretMaret
[3]
Maret
[6] [7]
104
C.I.F.(RIBU/THOUSAND US $)
Golongan barang & negara 2009 2010
Commodity group and country Februari Januari-Maret
[1] [2] [4] [5]
https:
//www.b
ps.go.id

NERACA PEMBAYARAN DANPERDAGANGAN LUAR NEGERIBALANCE OF PAYMENTS ANDINTERNATIONAL TRADE
TABEL : 6.12.2 NILAI IMPOR NON MIGAS DAN MIGAS MENURUT NEGARA ASALTABLE IMPORS VALUE OF NON OIL&GAS AND OIL&GAS BY COUNTRY OF ORIGIN
MIGAS 964 422,6 930 077,3 3 175 990,4 2 045 468,0 2 252 082,0 6 234 444,7ASEAN 508 942,7 403 641,4 1 556 130,6 1 363 506,8 1 481 410,2 3 898 607,9
Thailand 5 722,9 1 379,8 9 075,2 1 093,9 5 062,5 9 260,5Singapura / Singapore 351 737,5 334 620,4 1 140 911,6 739 925,5 927 214,3 2 346 122,3Filipina / Philippines 110,5 25,6 1 268,7 169,1 240,7 677,5Malaysia 115 016,4 37 993,3 285 198,2 558 996,0 504 291,8 1 296 719,2Myanmar 0,0 0,0 0,0 0,0 0,0 0,0Kamboja / Cambodia 0,0 0,0 0,0 0,0 0,0 0,7Brunei Darussalam 31 941,2 29 622,3 90 816,2 63 236,0 44 381,1 245 010,4Vietnam 4 414,2 0,0 28 860,7 86,3 219,8 817,3
Jepang / Japan 2 152,3 548,9 7 233,1 1 625,5 4 395,2 10 288,8Cina / China 834,4 22 227,7 56 059,1 35 782,7 40 608,0 113 344,7Asia lainnya / Rest of Asia 280 707,1 346 857,2 1 135 672,3 436 508,5 464 098,4 1 495 139,0
Afrika / Africa 168 216,9 153 992,7 370 504,4 145 206,8 119 441,3 373 380,3
Australia 509,3 1 061,1 1 987,5 1 308,6 437,7 2 566,4Oceania lainnya / Rest of Oceania 0,0 1,6 1,6 0,0 0,0 0,0
Amerika Serikat / U.S.A 1 122,7 834,3 2 838,4 1 032,8 14 909,5 20 183,2Kanada / Canada 0,0 0,0 2,6 0,0 2,0 7,0Amerika lainnya / Rest of America 209,7 0,0 210,2 0,0 0,0 0,0
UNI EROPA / European Union 1 711,4 860,5 4 183,8 1 991,6 31 176,5 40 027,2Inggris / United Kingdom 21,7 10,7 229,2 64,0 252,5 380,5Belanda / Netherlands 0,0 27,3 206,1 186,0 26 635,3 28 552,0Perancis / France 1 017,5 141,9 1 824,3 139,8 1 568,8 4 675,2Jerman / Germany 618,6 531,8 1 619,4 1 212,7 1 429,1 4 500,8Belgia / Belgium 25,7 30,9 94,4 43,4 158,2 218,8Swedia / Sweden 0,0 41,3 48,9 233,5 833,4 1 240,3Finlandia / Finland 0,0 0,0 0,0 0,0 0,0 0,0Italia / Italy 8,5 7,0 49,3 0,6 39,2 48,3Spanyol 19,4 0,0 42,5 76,0 79,4 193,4Uni Eropa lainnya / Rest of European Union 0,0 69,6 69,7 35,6 180,6 217,9
Eropa lainnya / Rest of Europe 16,1 51,9 41 166,8 58 504,7 95 603,2 280 900,2
5 939 043,3 6 554 129,2 19 093 741,7 9 498 139,4 10 972 641,4 29 961 239,7
Maret
[6]
C.I.F.(RIBU/THOUSAND US $)
Golongan barang & negara
105
[7]
JUMLAH / TOTAL
2009 2010
Commodity group and country Februari Januari-Maret Februari Januari-MaretMaret
[1] [2] [4] [5][3]
https:
//www.b
ps.go.id

NERACA PEMBAYARAN DANPERDAGANGAN LUAR NEGERIBALANCE OF PAYMENTS ANDINTERNATIONAL TRADE
TABEL : 6.13.1 NILAI IMPOR MENURUT PELABUHAN-PELABUHAN PENTING
TABLE IMPORTS VALUE BY MAIN PORTS
JAWA DAN MADURA 26 649,0 39 146,9 44 797,5 46 838,1 60 202,8 100 329,4 73 551,5
Tanjung Priok 14 668,4 22 141,2 24 226,5 24 267,4 30 899,0 54 388,6 40 917,0
Merak 1 337,0 2 518,6 2 199,0 2 970,3 3 015,7 5 017,2 3 719,7
Tanjung Emas 778,6 998,0 997,6 992,8 1 521,8 2 758,2 2 704,6
Tanjung Perak 3 710,1 4 882,4 5 649,3 6 089,4 7 995,4 12 676,3 9 309,3Lainnya / Others 6 154,9 8 606,7 11 725,1 12 518,2 16 770,9 25 489,1 16 900,9
SUMATERA 2 750,9 3 591,0 7 645,2 7 275,3 7 402,4 19 917,7 14 821,2
Belawan 584,0 832,7 1 000,0 1 200,5 1 821,8 3 250,4 2 484,2
Padang/Teluk Bayur 30,8 15,6 0,0 36,3 95,6 476,3 346,2
Pakanbaru/Rumbai 22,1 1,0 1,3 1,3 5,9 15,2 29,0
Jambi 35,0 10,0 55,0 21,7 29,9 45,6 37,9
Palembang-Kertapati 0,0 1,6 0,0 0,4 0,0 0,0 0,0
Panjang 72,7 137,9 230,4 332,3 414,3 1 045,4 712,5Lainnya / Others 2 006,3 2 592,2 6 358,5 5 682,8 5 034,9 15 084,8 11 211,4
KALIMANTAN 2 364,0 2 896,4 3 763,1 5 203,1 4 683,1 5 698,8 5 959,6
Banjarmasin 80,5 99,0 102,3 411,8 169,8 247,8 287,8
Pontianak 54,0 37,0 50,1 66,1 85,2 94,9 85,6
Balikpapan 1 835,5 2 488,4 2 942,0 3 428,9 3 868,6 4 239,2 3 908,8Lainnya / Others 394,0 272,0 668,7 1 296,3 559,5 1 116,9 1 677,4
SULAWESI 115,9 322,2 469,4 539,8 554,4 901,3 689,3
Ujung Pandang 82,5 134,6 166,8 179,7 277,6 501,0 422,8
Bitung 17,8 3,2 6,3 8,5 6,1 9,1 19,5Lainnya / Others 15,6 184,4 296,3 351,6 270,7 391,2 247,0
NUSA TENGGARA, MALUKU
& PAPUA 670,9 568,0 1 025,7 1 209,2 1 630,7 2 350,1 1 807,6
Amamapare 456,3 413,9 690,0 867,8 832,2 1 206,0 793,8Lainnya / Others 214,6 154,1 335,7 341,4 798,5 1 144,1 1 013,8
JUMLAH / TOTAL 32 550,7 46 524,5 57 700,9 61 065,5 74 473,4 129 197,3 96 829,2
[8]
2004 2005
[5]
106
20092006 2007 2008
(JUTA / MILLION US $)
[1]
Pelabuhan / Ports
[6][2] [3]
2003
[4] [7]
https:
//www.b
ps.go.id

NERACA PEMBAYARAN DANPERDAGANGAN LUAR NEGERIBALANCE OF PAYMENTS ANDINTERNATIONAL TRADE
TABEL : 6.13.2 NILAI IMPOR NON MIGAS DAN MIGAS MENURUT PELABUHAN BONGKAR
TABLE IMPORS VALUE OF NON OIL&GAS AND OIL&GAS BY MAIN PORTS
NON MIGAS 4 974 620,7 5 624 051,9 15 917 751,3 7 452 671,4 8 720 559,4 23 726 795,0Sumatera 741 678,1 997 759,4 2 575 497,9 964 814,8 1 180 297,8 3 302 050,4
Belawan 89 319,7 150 571,2 382 109,4 155 155,3 209 708,8 547 893,5Dumai 10 994,9 14 568,1 42 160,0 18 812,9 21 510,4 102 075,5Pekan Baru 3 092,9 4 687,2 12 500,3 3 255,1 3 385,7 8 079,0Perawang, Sumatra 15 354,4 37 775,3 71 025,8 11 990,0 12 193,0 67 182,7Musi River / Boom Baru 8 654,9 6 396,0 27 610,1 18 655,0 22 041,6 49 170,1Tanjung Pandan 0,0 0,0 0,0 0,0 0,0 0,0Panjang 23 219,9 47 781,5 113 619,5 37 046,9 54 455,2 150 169,3Lainnya / Others 591 041,4 735 980,1 1 926 472,8 719 899,6 857 003,1 2 377 480,3
Jawa 3 920 985,9 4 399 343,3 12 434 540,6 6 152 771,2 7 060 003,7 19 276 438,2Tanjung Priok 2 648 069,0 2 829 798,4 8 146 442,9 3 917 455,9 4 518 236,5 12 220 433,2Kalibaru 9 292,5 10 003,7 19 332,0 8 501,9 21 894,7 45 277,5Sukarno Hatta (u) 414 139,0 534 534,9 1 338 648,0 602 559,9 741 492,8 1 946 386,7Tanjung Emas 101 624,0 140 096,7 395 815,1 290 956,9 325 090,6 969 756,4Tanjung Perak 470 762,5 533 640,3 1 542 001,2 780 586,2 964 250,9 2 568 941,8Merak 141 085,7 227 760,7 536 044,9 186 204,9 263 800,3 679 884,9Cigading 84 481,9 63 121,9 229 235,6 265 875,4 168 934,0 542 381,1Lainnya / Others 51 531,3 60 386,7 227 020,9 100 630,1 56 303,9 303 376,6
Kalimantan 206 525,3 141 592,4 616 297,8 180 270,3 230 659,3 552 443,1Pontianak 2 435,6 7 032,7 12 778,9 8 808,8 4 760,4 21 147,2Banjarmasin 51 350,7 44 016,7 159 563,3 29 145,9 31 265,8 93 821,6Kotabaru 0,0 0,0 57 436,1 0,0 2 205,6 2 486,7Balikpapan 116 727,1 41 620,2 220 135,5 46 060,6 53 926,8 131 528,2Samarinda 0,0 12 359,3 26 174,3 19 421,7 20 958,0 68 802,9Lainnya / Others 36 011,9 36 563,5 140 209,7 76 833,3 117 542,7 234 656,5
Sulawesi 54 346,8 22 946,9 100 769,7 40 563,4 69 396,0 162 883,6Bitung 0,0 0,0 60,5 15 146,6 0,0 15 643,3Ujungpandang 19 285,6 17 659,3 60 353,4 24 575,0 39 784,7 101 348,1Malili, Sulawesi 7 394,0 5 203,8 12 597,8 0,0 11 481,0 25 777,2Lainnya / Others 27 667,2 83,8 27 758,0 841,8 18 130,3 20 115,0
Nusa Tenggara, Maluku & Papua 51 084,6 62 409,9 190 645,3 114 251,7 180 202,6 432 979,7Amamapare 29 858,2 39 380,3 121 499,9 70 620,3 60 124,5 181 005,8Lainnya / Others 21 226,4 23 029,6 69 145,4 43 631,4 120 078,1 251 973,9
Februari Januari-MaretMaret
[3]
Maret
[6] [7]
107
C.I.F.(RIBU/THOUSAND US $)
Golongan barang & pelabuhan 2009 2010
Commodity group and ports Februari Januari-Maret
[1] [2] [4] [5]
https:
//www.b
ps.go.id

NERACA PEMBAYARAN DANPERDAGANGAN LUAR NEGERIBALANCE OF PAYMENTS ANDINTERNATIONAL TRADE
TABEL : 6.13.2 NILAI IMPOR NON MIGAS DAN MIGAS MENURUT PELABUHAN BONGKAR
TABLE IMPORS VALUE OF NON OIL&GAS AND OIL&GAS BY MAIN PORTS
MIGAS 964 422,6 930 077,3 3 175 990,4 2 045 468,0 2 252 082,0 6 234 444,7Sumatera 248 154,6 119 235,4 527 469,2 321 168,2 315 666,7 945 751,6
Belawan 46 768,4 21 485,0 98 993,5 90 909,4 75 048,5 222 632,7Dumai 4 169,1 0,0 8 857,9 0,0 6 981,1 27 085,6Pulau Sambu 0,0 0,0 0,0 43 201,5 0,0 81 995,0Tanjung Uban 22 887,2 1 958,2 45 781,6 91 897,6 84 093,2 211 200,1Musi River / Boom Baru 0,0 430,3 430,3 12,8 1 176,0 2 783,9Kota Agung 127 969,4 43 307,7 234 385,9 34 151,4 64 437,9 180 918,7Pangkal Balam 200,0 11,7 211,7 0,6 353,0 353,7Lainnya / Others 46 160,5 52 042,5 138 808,3 60 994,9 83 577,0 218 781,9
Jawa 514 913,1 605 695,4 1 880 587,9 1 110 391,1 1 242 824,5 3 552 539,2Tanjung Priok 87 769,3 138 108,8 366 087,0 148 253,0 193 218,2 458 080,8Cilacap 78 732,4 117 945,8 423 246,2 295 433,2 404 643,3 1 196 432,7Tanjung Perak 118 471,7 83 255,3 275 047,4 109 846,3 157 992,4 368 799,5Merak 56 419,4 41 555,1 154 236,6 150 084,4 180 676,1 498 992,1Cigading 0,0 0,0 2 336,8 0,0 13 831,1 13 831,1Lainnya / Others 173 520,3 224 830,4 659 633,9 406 774,2 292 463,4 1 016 403,0
Kalimantan 165 610,4 144 339,9 594 031,2 443 700,6 541 354,5 1 302 257,1Pontianak 1 690,4 1 521,4 3 240,8 1 918,4 3 887,5 8 007,6Balikpapan 163 078,4 141 905,9 499 897,0 382 288,4 405 803,3 1 015 253,6Lainnya / Others 841,6 912,6 90 893,4 59 493,8 131 663,7 278 995,9
Sulawesi 2 744,0 6 190,1 40 740,9 25 070,3 53 444,7 120 247,4Ujungpandang 300,3 1 211,2 3 769,4 22 649,8 30 485,7 61 702,5Malili, Sulawesi 198,8 4 978,8 5 177,7 0,0 18 384,3 51 544,7Lainnya / Others 2 244,9 0,1 31 793,8 2 420,5 4 574,7 7 000,2
Nusa Tenggara, Maluku & Papua 33 000,5 54 616,5 133 161,2 145 137,8 98 791,6 313 649,4Amamapare 12 013,0 13 844,3 46 602,4 38 639,2 19 833,7 84 448,1Lainnya / Others 20 987,5 40 772,2 86 558,8 106 498,6 78 957,9 229 201,3
5 939 043,3 6 554 129,2 19 093 741,7 9 498 139,4 10 972 641,4 29 961 239,7
Maret
[6]
C.I.F.(RIBU/THOUSAND US $)
Golongan barang & pelabuhan
108
[7]
JUMLAH / TOTAL
2009 2010
Commodity group and ports Februari Januari-Maret Februari Januari-MaretMaret
[1] [2] [4] [5][3]
https:
//www.b
ps.go.id

TABEL : 6.14
TABLE
2000 2 718,7 26 018,7 4 777,4 33 514,8
2001 2 251,2 23 879,4 4 831,5 30 962,1
2002 2 650,5 24 227,5 4 410,9 31 288,9
2003 2 862,8 25 496,3 4 191,5 32 550,7
2004 3 786,5 36 204,2 6 533,8 46 524,5
2005 4 620,5 44 792,0 8 288,4 57 700,9
2006 4 738,2 47 171,4 9 155,9 61 065,5
2007 6 539,1 56 484,7 11 449,6 74 473,4
2008 8 303,7 99 492,7 21 400,9 129 197,3
2009 6 752,6 69 638,1 20 438,5 96 829,2
Maret 493,9 4 518,0 1 542,2 6 554,1
Triw/Qrt I 1 333,2 13 494,8 4 265,7 19 093,7
April 499,6 4 861,3 1 345,9 6 706,8
Mei 505,6 5 439,5 1 696,2 7 641,3
Juni 548,5 5 853,6 1 533,4 7 935,5
Triw/Qrt II 1 553,7 16 154,4 4 575,5 22 283,6
Juli 738,0 6 151,1 1 794,2 8 683,3
Agustus 638,5 6 431,8 2 637,0 9 707,3
September 557,2 6 508,2 1 451,2 8 516,6
Triw/Qrt III 1 933,7 19 091,1 5 882,4 26 907,2
Oktober 639,2 7 148,4 1 642,5 9 430,1
November 639,1 6 494,0 1 681,6 8 814,7
Desember 653,7 7 255,4 2 390,8 10 299,9
Triw/Qrt IV 1 932,0 20 897,8 5 714,9 28 544,7
2010
Januari 625,4 7 047,6 1 817,5 9 490,5
Februari 683,2 6 891,1 1 923,8 9 498,1
Maret 868,8 7 897,0 2 206,8 10 972,6
Triw/Qrt I 2 177,4 21 835,7 5 948,1 29 961,2
(JUTA / MILLION US $)
Raw materials
[3][1]
Year and month Consumer goods T o t a l
[2] [5][4]
109
Tahun dan bulan
NERACA PEMBAYARAN DANPERDAGANGAN LUAR NEGERIBALANCE OF PAYMENTS ANDINTERNATIONAL TRADE
J u m l a hBahan baku
NILAI IMPOR MENURUT GOLONGAN BARANG EKONOMI
IMPORTS VALUE BY BROAD ECONOMIC CATEGORIES
Barang konsumsi Barang modalCapital goods
https:
//www.b
ps.go.id

TABEL : 6.15 NILAI IMPOR BARANG-BARANG KONSUMSI
TABLE IMPORTS VALUE OF CONSUMPTION GOODS(JUTA / MILLION US $)
2000 2 718,7 332,7 680,0 611,6 73,7 212,8 315,5 365,2 127,2
2001 2 251,2 320,6 502,3 457,0 34,7 171,8 214,0 422,8 128,0
2002 2 650,5 364,5 719,4 499,7 79,5 211,7 266,6 468,9 40,2
2003 2 862,8 345,1 797,7 432,6 167,3 256,6 312,3 472,2 79,02004 3 786,5 451,7 827,6 757,0 333,6 314,7 357,7 673,7 70,5
2005 4 620,5 419,3 1 085,7 1 294,9 337,3 342,1 395,8 727,1 18,3
2006 4 738,2 600,3 1 215,7 836,4 311,6 351,4 591,9 812,3 18,6
2007 6 539,1 764,7 1 950,5 1 197,8 484,5 463,8 677,5 864,5 135,8
2008 8 303,7 797,4 1 903,1 1 617,2 727,7 822,1 1 134,7 1 229,2 72,3
2009 6 752,6 955,6 1 367,3 591,2 679,5 818,3 941,0 1 189,4 210,3
Maret 493,9 108,4 116,0 24,0 20,4 45,0 61,4 95,2 23,5
Triw/Qrt I 1 333,2 251,4 311,3 99,9 63,7 139,1 176,3 263,7 27,8
April 499,6 79,5 112,5 26,8 36,5 61,3 66,3 109,9 6,8
Mei 505,6 75,7 101,2 49,4 35,9 62,7 80,2 95,6 4,9
Juni 548,5 76,5 110,2 46,9 46,9 76,7 81,0 96,1 14,2Triw/Qrt II 1 553,7 231,7 323,9 123,1 119,3 200,7 227,5 301,6 25,9
Juli 738,0 66,2 116,2 57,1 179,8 119,2 86,9 102,4 10,2
Agustus 638,5 109,3 132,5 35,1 58,8 85,0 93,1 113,7 11,0
September 557,2 78,4 104,7 88,3 55,9 57,5 74,6 85,4 12,4Triw/Qrt III 1 933,7 253,9 353,4 180,5 294,5 261,7 254,6 301,5 33,6
Oktober 639,2 75,6 128,9 74,5 67,8 70,9 93,2 113,5 14,8
November 639,1 56,3 106,2 56,6 66,1 67,8 83,1 102,8 100,2
Desember 653,7 86,7 143,6 56,6 68,1 78,1 106,3 106,3 8,0Triw/Qrt IV 1 932,0 218,6 378,7 187,7 202,0 216,8 282,6 322,6 123,0
2010
Januari 625,4 71,8 143,6 42,1 60,7 77,4 101,8 98,9 29,1
Februari 683,2 74,9 173,3 79,4 84,3 74,2 81,6 97,6 17,9
Maret 868,8 95,7 308,5 79,0 101,2 78,4 82,5 112,7 10,8
Triw/Qrt I 2 177,4 242,4 625,4 200,5 246,2 230,0 265,9 309,2 57,8
INTERNATIONAL TRADE
Tahun dan bulan
Makanan dan minuman untuk
rumah tangga
Alat angkutan
Lainnya
Bahan bakar
olahan
[9]
110NERACA PEMBAYARAN DANPERDAGANGAN LUAR NEGERIBALANCE OF PAYMENTS AND
[10]
Barang konsumsi yang tidak diklasifikasikan
Unclassified consumption goods
Tahan lama
Olahan / Processed[2]
Jumlah barang
Others
[3]
Processed Fuel
Transport
Equipment not
Non durable[1]
Food and beverages mainly
for household
Utama / Primary
Total
konsumsi
[4]
Year and month
bukan untuk industri
and lubricants
dan pelumas
lama
Tidak tahan
Semi durable
for industry
Durable
1/2 tahan lama
[8][7][6][5]
https:
//www.b
ps.go.id
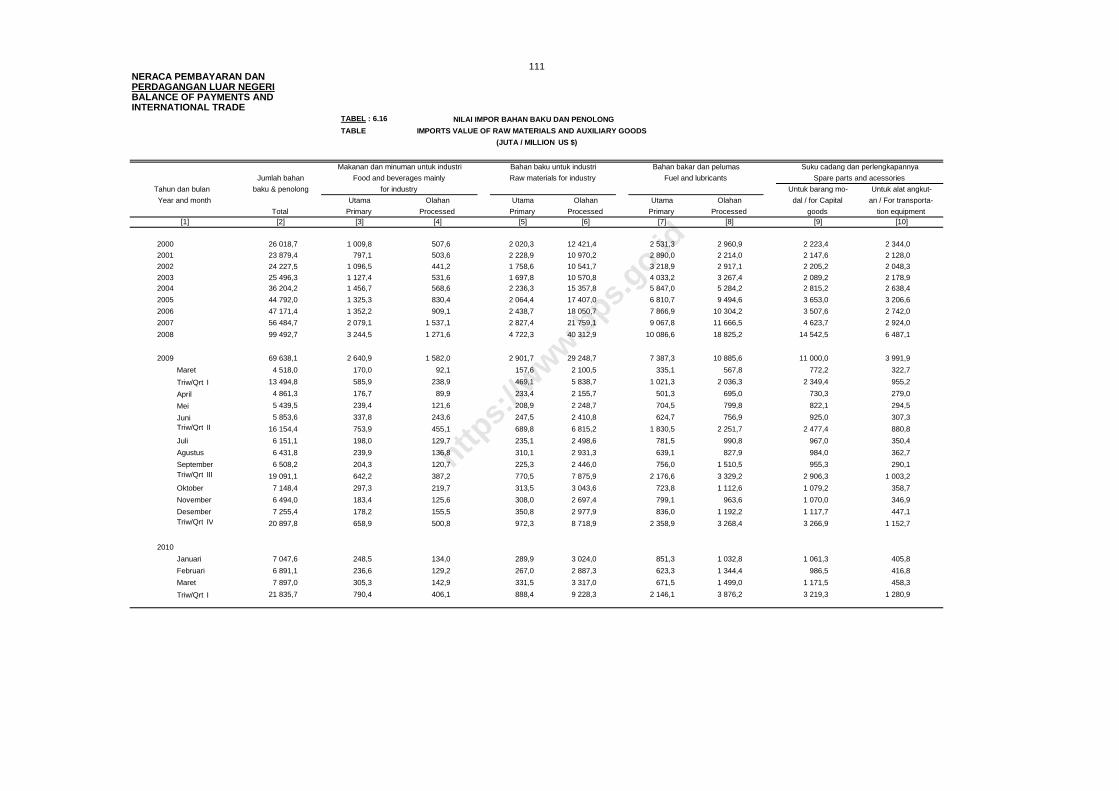
TABEL : 6.16 NILAI IMPOR BAHAN BAKU DAN PENOLONG
TABLE IMPORTS VALUE OF RAW MATERIALS AND AUXILIARY GOODS
2000 26 018,7 1 009,8 507,6 2 020,3 12 421,4 2 531,3 2 960,9 2 223,4 2 344,0
2001 23 879,4 797,1 503,6 2 228,9 10 970,2 2 890,0 2 214,0 2 147,6 2 128,0
2002 24 227,5 1 096,5 441,2 1 758,6 10 541,7 3 218,9 2 917,1 2 205,2 2 048,3
2003 25 496,3 1 127,4 531,6 1 697,8 10 570,8 4 033,2 3 267,4 2 089,2 2 178,92004 36 204,2 1 456,7 568,6 2 236,3 15 357,8 5 847,0 5 284,2 2 815,2 2 638,4
2005 44 792,0 1 325,3 830,4 2 064,4 17 407,0 6 810,7 9 494,6 3 653,0 3 206,6
2006 47 171,4 1 352,2 909,1 2 438,7 18 050,7 7 866,9 10 304,2 3 507,6 2 742,0
2007 56 484,7 2 079,1 1 537,1 2 827,4 21 759,1 9 067,8 11 666,5 4 623,7 2 924,0
2008 99 492,7 3 244,5 1 271,6 4 722,3 40 312,9 10 086,6 18 825,2 14 542,5 6 487,1
2009 69 638,1 2 640,9 1 582,0 2 901,7 29 248,7 7 387,3 10 885,6 11 000,0 3 991,9
Maret 4 518,0 170,0 92,1 157,6 2 100,5 335,1 567,8 772,2 322,7
Triw/Qrt I 13 494,8 585,9 238,9 469,1 5 838,7 1 021,3 2 036,3 2 349,4 955,2
April 4 861,3 176,7 89,9 233,4 2 155,7 501,3 695,0 730,3 279,0
Mei 5 439,5 239,4 121,6 208,9 2 248,7 704,5 799,8 822,1 294,5
Juni 5 853,6 337,8 243,6 247,5 2 410,8 624,7 756,9 925,0 307,3Triw/Qrt II 16 154,4 753,9 455,1 689,8 6 815,2 1 830,5 2 251,7 2 477,4 880,8
Juli 6 151,1 198,0 129,7 235,1 2 498,6 781,5 990,8 967,0 350,4
Agustus 6 431,8 239,9 136,8 310,1 2 931,3 639,1 827,9 984,0 362,7
September 6 508,2 204,3 120,7 225,3 2 446,0 756,0 1 510,5 955,3 290,1Triw/Qrt III 19 091,1 642,2 387,2 770,5 7 875,9 2 176,6 3 329,2 2 906,3 1 003,2
Oktober 7 148,4 297,3 219,7 313,5 3 043,6 723,8 1 112,6 1 079,2 358,7
November 6 494,0 183,4 125,6 308,0 2 697,4 799,1 963,6 1 070,0 346,9
Desember 7 255,4 178,2 155,5 350,8 2 977,9 836,0 1 192,2 1 117,7 447,1Triw/Qrt IV 20 897,8 658,9 500,8 972,3 8 718,9 2 358,9 3 268,4 3 266,9 1 152,7
2010
Januari 7 047,6 248,5 134,0 289,9 3 024,0 851,3 1 032,8 1 061,3 405,8
Februari 6 891,1 236,6 129,2 267,0 2 887,3 623,3 1 344,4 986,5 416,8
Maret 7 897,0 305,3 142,9 331,5 3 317,0 671,5 1 499,0 1 171,5 458,3
Triw/Qrt I 21 835,7 790,4 406,1 888,4 9 228,3 2 146,1 3 876,2 3 219,3 1 280,9
NERACA PEMBAYARAN DANPERDAGANGAN LUAR NEGERIBALANCE OF PAYMENTS ANDINTERNATIONAL TRADE
Raw materials for industryJumlah bahan
(JUTA / MILLION US $)
Makanan dan minuman untuk industri
baku & penolong for industry
Food and beverages mainly
Primary[10][8]
an / For transporta-
[5][4] [6]
Olahan
Untuk barang mo- Untuk alat angkut-
UtamaUtama Olahan Utama Olahan
[9]
Spare parts and acessories
dal / for Capital
PrimaryTotal Processed[7][3]
Processed[2][1]
Primary
111
Processed goods tion equipment
Suku cadang dan perlengkapannyaBahan bakar dan pelumas
Year and month
Tahun dan bulan
Bahan baku untuk industri
Fuel and lubricants
https:
//www.b
ps.go.id
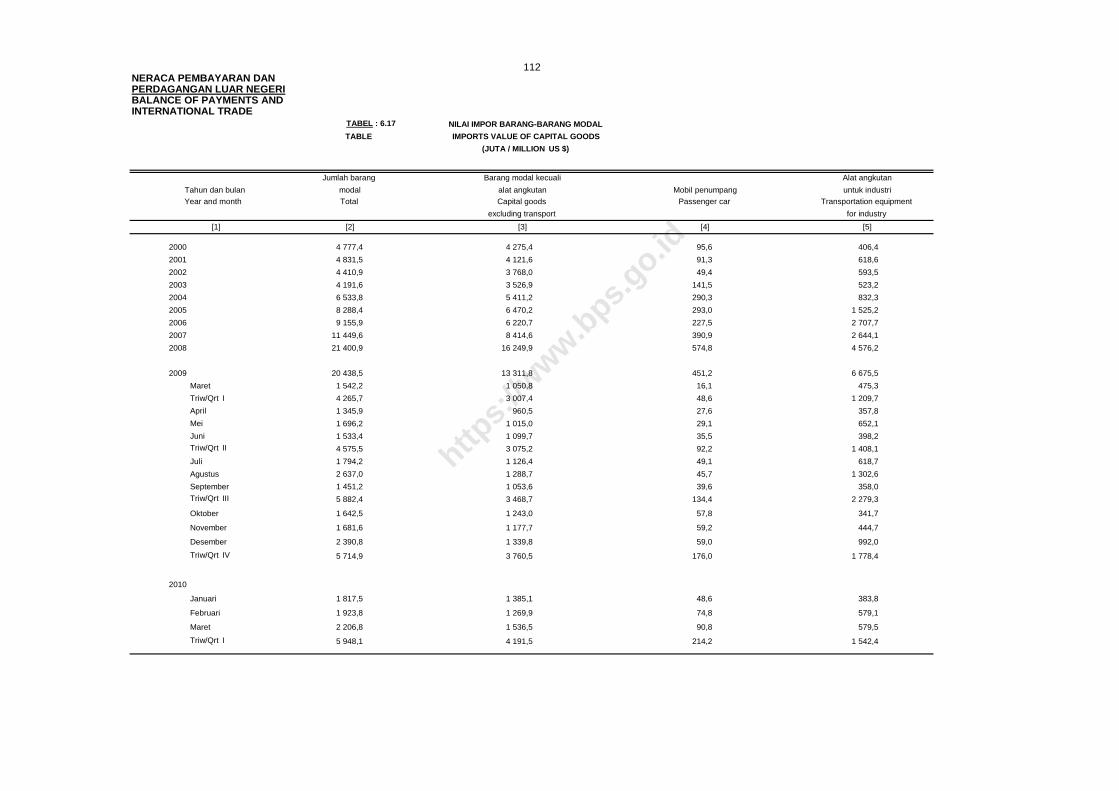
TABEL : 6.17
TABLE
2000 4 777,4 4 275,4 95,6 406,4
2001 4 831,5 4 121,6 91,3 618,6
2002 4 410,9 3 768,0 49,4 593,5
2003 4 191,6 3 526,9 141,5 523,2
2004 6 533,8 5 411,2 290,3 832,3
2005 8 288,4 6 470,2 293,0 1 525,2
2006 9 155,9 6 220,7 227,5 2 707,7
2007 11 449,6 8 414,6 390,9 2 644,1
2008 21 400,9 16 249,9 574,8 4 576,2
2009 20 438,5 13 311,8 451,2 6 675,5
Maret 1 542,2 1 050,8 16,1 475,3
Triw/Qrt I 4 265,7 3 007,4 48,6 1 209,7
April 1 345,9 960,5 27,6 357,8
Mei 1 696,2 1 015,0 29,1 652,1
Juni 1 533,4 1 099,7 35,5 398,2
Triw/Qrt II 4 575,5 3 075,2 92,2 1 408,1
Juli 1 794,2 1 126,4 49,1 618,7
Agustus 2 637,0 1 288,7 45,7 1 302,6
September 1 451,2 1 053,6 39,6 358,0
Triw/Qrt III 5 882,4 3 468,7 134,4 2 279,3
Oktober 1 642,5 1 243,0 57,8 341,7
November 1 681,6 1 177,7 59,2 444,7
Desember 2 390,8 1 339,8 59,0 992,0
Triw/Qrt IV 5 714,9 3 760,5 176,0 1 778,4
2010
Januari 1 817,5 1 385,1 48,6 383,8
Februari 1 923,8 1 269,9 74,8 579,1
Maret 2 206,8 1 536,5 90,8 579,5
Triw/Qrt I 5 948,1 4 191,5 214,2 1 542,4
NILAI IMPOR BARANG-BARANG MODAL
PERDAGANGAN LUAR NEGERINERACA PEMBAYARAN DAN
112
Year and month Tahun dan bulan
[5]
alat angkutan Mobil penumpang untuk industriCapital goods Passenger car Transportation equipment
[1] [2] [3] [4]
INTERNATIONAL TRADEBALANCE OF PAYMENTS AND
Alat angkutan
excluding transport for industry
modal
Jumlah barang Barang modal kecuali
Total
(JUTA / MILLION US $)
IMPORTS VALUE OF CAPITAL GOODS
https:
//www.b
ps.go.id

PERHUBUNGAN TRANSPORTATION
PENJELASAN TEKNIS 1. Kegiatan perhubungan mencakup angkutan darat, angkutan laut,
angkutan udara, jasa penunjang angkutan dan komunikasi. 2. Data statistik perhubungan dikumpulkan oleh BPS Pusat dan
Perwakilannya di daerah dari berbagai instansi terkait. 3. Bongkar barang angkutan laut/udara adalah barang yang dibongkar di
suatu pelabuhan laut/udara di dalam negeri dari kapal/pesawat yang berasal dari pelabuhan laut/udara lainnya di dalam negeri dan atau luar negeri.
4. Muat barang angkutan laut/udara adalah barang yang dimuat di suatu
pelabuhan laut/udara di dalam negeri ke kapal/ pesawat untuk diangkut ke pelabuhan laut/udara di dalam negeri dan atau di luar negeri.
5. Penumpang tiba adalah penumpang yang tiba di suatu pelabuhan
laut/udara di dalam negeri dari pelabuhan laut/udara asal di dalam negeri dan atau di luar negeri.
6. Penumpang berangkat adalah penumpang yang berangkat dari suatu
pelabuhan laut/udara di dalam negeri ke pelabuhan laut/udara tujuan di dalam negeri dan atau luar negeri.
7. Penumpang transit adalah penumpang yang tiba di suatu pelabuhan
laut/udara dari pelabuhan laut/udara asal di dalam dan atau di luar negeri untuk kemudian melanjutkan perjalanannya ke pelabuhan laut/udara tujuan di dalam dan atau di luar negeri.
8. Kilometer-ton adalah produksi kilometer-ton dari seluruh barang yang
diangkut 9. Rata-rata jarak angkutan per-ton untuk kereta api adalah kilometer-ton
dibagi jumlah barang kiriman biasa.
TECHNICAL NOTES 1. Transportation and Communication cover land trans-portation, sea
transportation, air transportation, supporting transportation services, and communication facilities.
2. Transportation and Communication statistics are collected by the BPS
Statistics Indonesia and its local statistical offices from various related institutions
3. Sea/air transportation cargo unloading is the number of cargo unloadings
out of ships/aircrafts coming from domestic or foreign seaports/airports. 4. Sea/air transportation cargo loading is the number of cargo loadings into
ships/aircrafts leaving for domestic or foreign seaport/airports. 5. Number of arrivals is the number of passengers arriving at domestic
seaports/airports from other domestic or foreign ports/airports. 6. Number of departures is the number of passengers departing from
domestic seaports/airports to other domestic or foreign seaports/airports. 7. Number of transit passengers is the number of passe-ngers in transit at
domestic seaports/airports from other domestic or foreign seaports/airports.
8. Ton-Kilometer is the total weight of the loaded cargo. 9. Average haul per ton for railway freight traffic is the number of ton-
kilometers of loaded cargo divided by the number of tons loaded.
113
https:
//www.b
ps.go.id

PERHUBUNGAN TRANSPORTATION
10. kilometer penumpang kereta api adalah banyaknya kilometer dari semua
penumpang yang berangkat. 11. Rata-rata jaraknya perjalanan penumpang kereta api adalah kilometer
penumpang dibagi penumpang yang diangkut.
10. Passenger-kilometer for railway passenger traffic is the number of
kilometers travelled by all passengers. 11. The average journey per passengers is calculated as the total passenger-
kilometer travelled divided by the number of passengers.
114
https:
//www.b
ps.go.id

TABEL : 7.1.1 BONGKAR/MUAT BARANG ANGKUTAN ANTAR PULAU DI 4 PELABUHAN UTAMA
TABLE VOLUME OF INTER - ISLAND CARGO LOADED/UNLOADED AT 4 MAIN SEA PORTS
1999 918 381 4 305 001 4 192 882 12 049 280 3 492 933 11 231 938 396 966 989 671
2000 644 924 5 471 535 2 788 284 10 631 489 3 367 447 11 868 163 644 754 1 125 804
2001 678 926 6 739 174 5 547 628 14 722 628 3 870 535 12 039 205 1 331 984 2 217 253
2002 619 135 6 320 880 6 566 408 16 450 799 5 795 277 14 030 368 1 603 857 2 391 813
2003 598 636 6 791 319 5 157 169 16 207 475 9 156 853 16 841 808 2 316 691 3 223 550
2004 616 309 6 932 082 6 370 303 16 158 105 9 582 370 15 171 520 2 147 129 2 993 307
2005 884 832 7 346 894 7 512 656 15 830 356 10 530 932 14 845 098 2 399 927 3 168 497
2006 538 602 6 959 975 7 547 744 16 153 544 10 488 356 10 656 007 2 552 862 3 183 440
2007 974 286 7 242 472 8 573 847 17 349 672 13 610 296 11 803 339 2 707 219 3 461 109
2008 1 186 819 8 269 358 9 830 225 18 376 070 9 463 008 8 446 983 3 294 072 4 992 781
2009 1 216 190 7 527 212 10 329 810 16 408 050 8 829 194 7 765 622 3 711 557 6 673 336
April 110 095 599 856 719 534 1 325 288 671 532 656 223 384 973 553 207
Mei 108 411 659 214 914 144 1 312 422 731 522 554 658 342 793 536 354
Juni 137 001 726 314 926 541 1 255 153 675 006 761 679 433 309 667 623
Juli 115 150 729 262 1 007 410 1 464 575 742 259 713 008 323 581 644 814
Agustus 113 442 693 100 994 270 1 402 636 821 684 775 614 351 601 604 863
September 87 855 608 994 610 880 1 308 169 694 381 688 544 253 758 558 691
Oktober 94 923 644 785 886 871 1 312 302 702 620 575 137 320 436 615 696
November 91 505 584 260 978 973 1 292 735 842 479 729 832 260 740 608 597
Desember 114 369 627 014 1 090 317 1 477 523 729 688 579 961 346 254 636 886
2010 325 133 2 210 736 3 765 492 5 186 842 2 757 813 2 836 191 1 533 857 2 849 201
Januari 96 055 475 286 938 175 1 210 748 720 058 645 139 271 428 595 879
Februari 86 820 572 788 889 809 1 167 681 724 038 847 066 438 321 966 994
Maret 75 879 610 228 945 972 1 343 708 639 466 632 112 392 669 644 276
April 66 379 552 434 991 536 1 464 705 674 251 711 874 431 439 642 052
Note : 1) Including Sunda Kelapa and Kalibaru
Loaded[2] [3]
Catatan : 1) Termasuk Sunda Kelapa dan Kalibaru
[5] [6] [7][1] [4]
Tanjung Perak M a k a s s a r
Bongkar Muat BongkarMuatBongkar Muat
[9][8]Unloaded Loaded UnloadedUnloaded Loaded Unloaded Loaded
B e l a w a n Tanjung Priok 1)
Bongkar
115PERHUBUNGAN TRANSPORTATION
( TON )
Tahun dan bulan
Year and month Muat
https:
//www.b
ps.go.id
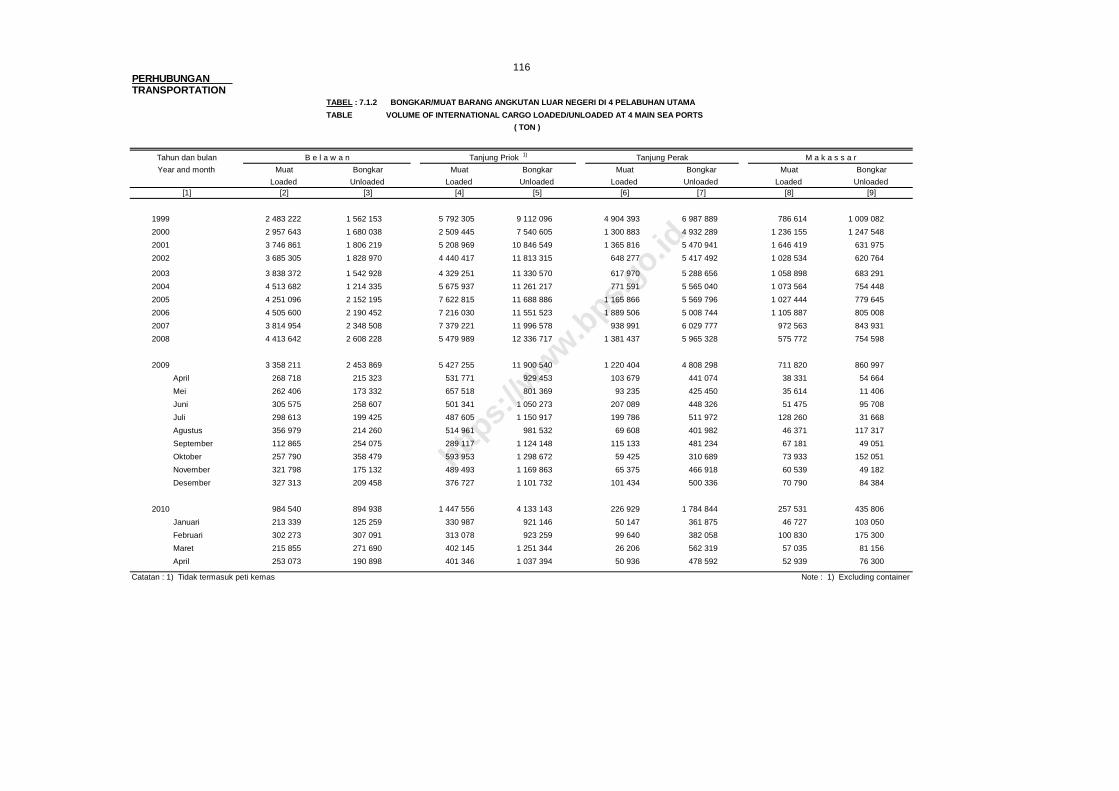
TABEL : 7.1.2 BONGKAR/MUAT BARANG ANGKUTAN LUAR NEGERI DI 4 PELABUHAN UTAMA
TABLE VOLUME OF INTERNATIONAL CARGO LOADED/UNLOADED AT 4 MAIN SEA PORTS
1999 2 483 222 1 562 153 5 792 305 9 112 096 4 904 393 6 987 889 786 614 1 009 082
2000 2 957 643 1 680 038 2 509 445 7 540 605 1 300 883 4 932 289 1 236 155 1 247 548
2001 3 746 861 1 806 219 5 208 969 10 846 549 1 365 816 5 470 941 1 646 419 631 975
2002 3 685 305 1 828 970 4 440 417 11 813 315 648 277 5 417 492 1 028 534 620 764
2003 3 838 372 1 542 928 4 329 251 11 330 570 617 970 5 288 656 1 058 898 683 291
2004 4 513 682 1 214 335 5 675 937 11 261 217 771 591 5 565 040 1 073 564 754 448
2005 4 251 096 2 152 195 7 622 815 11 688 886 1 165 866 5 569 796 1 027 444 779 645
2006 4 505 600 2 190 452 7 216 030 11 551 523 1 889 506 5 008 744 1 105 887 805 008
2007 3 814 954 2 348 508 7 379 221 11 996 578 938 991 6 029 777 972 563 843 931
2008 4 413 642 2 608 228 5 479 989 12 336 717 1 381 437 5 965 328 575 772 754 598
2009 3 358 211 2 453 869 5 427 255 11 900 540 1 220 404 4 808 298 711 820 860 997
April 268 718 215 323 531 771 929 453 103 679 441 074 38 331 54 664
Mei 262 406 173 332 657 518 801 369 93 235 425 450 35 614 11 406
Juni 305 575 258 607 501 341 1 050 273 207 089 448 326 51 475 95 708
Juli 298 613 199 425 487 605 1 150 917 199 786 511 972 128 260 31 668
Agustus 356 979 214 260 514 961 981 532 69 608 401 982 46 371 117 317
September 112 865 254 075 289 117 1 124 148 115 133 481 234 67 181 49 051
Oktober 257 790 358 479 593 953 1 298 672 59 425 310 689 73 933 152 051
November 321 798 175 132 489 493 1 169 863 65 375 466 918 60 539 49 182
Desember 327 313 209 458 376 727 1 101 732 101 434 500 336 70 790 84 384
2010 984 540 894 938 1 447 556 4 133 143 226 929 1 784 844 257 531 435 806
Januari 213 339 125 259 330 987 921 146 50 147 361 875 46 727 103 050
Februari 302 273 307 091 313 078 923 259 99 640 382 058 100 830 175 300
Maret 215 855 271 690 402 145 1 251 344 26 206 562 319 57 035 81 156
April 253 073 190 898 401 346 1 037 394 50 936 478 592 52 939 76 300
Note : 1) Excluding container
[9]
Catatan : 1) Tidak termasuk peti kemas
[5] [6] [7] [8][1] [2] [3] [4]
Bongkar
Loaded Unloaded Loaded Unloaded Loaded Unloaded Loaded Unloaded
Bongkar
Tanjung Perak M a k a s s a r
( TON )
PERHUBUNGAN TRANSPORTATION
Year and month Muat Bongkar Muat MuatMuat Bongkar
116
Tahun dan bulan B e l a w a n Tanjung Priok 1)
https:
//www.b
ps.go.id

TABEL : 7.2.1 LALU LINTAS PENUMPANG ANGKUTAN UDARA DALAM NEGERI DI 5 PELABUHAN UDARA UTAMA
TABLE DOMESTIC AIRCRAFT PASSENGER TRAFFIC AT 5 MAIN AIRPORTS
Transit Transit Transit Transit
1999 335 445 349 178 9 611 2 119 943 2 387 872 163 707 772 453 789 898 136 118 269 628 314 711 289 492 507 765 503 405 28 837
2000 388 556 401 444 15 502 2 462 164 2 938 039 373 051 1 046 438 1 058 365 154 813 323 379 387 246 308 512 665 285 714 420 85 206
2001 494 028 487 606 21 302 3 101 642 3 406 009 388 619 1 261 020 1 276 084 219 952 425 240 499 651 364 118 786 024 746 617 52 226
2002 740 160 740 385 22 611 4 361 534 4 779 124 479 265 1 754 509 1 896 189 443 786 611 411 667 557 456 896 940 035 950 837 96 254
2003 1 065 908 1 056 888 31 186 6 484 701 7 344 468 951 346 2 483 270 2 507 843 627 226 928 706 991 196 653 971 1 120 795 1 099 756 102 449
2004 1 501 952 1 505 563 38 338 8 767 315 9 984 351 1 253 209 3 343 230 3 839 197 823 402 1 216 752 1 246 631 875 403 1 481 262 1 439 669 91 641
2005 1 521 999 1 523 690 92 273 9 752 645 10 921 703 1 305 342 3 263 646 3 466 754 537 549 1 246 230 1 342 336 947 925 1 672 960 1 653 281 135 593
2006 1 847 895 1 749 114 130 817 10 879 797 12 086 984 1 701 370 3 552 187 3 833 075 531 404 1 413 051 1 501 261 1 039 452 1 659 321 1 691 304 73 024
2007 2 057 534 1 905 364 181 967 11 898 291 12 528 419 1 312 207 3 571 074 3 909 717 490 375 1 589 880 1 652 451 1 277 315 1 942 224 1 961 463 58 025
2008 1 954 697 1 776 223 152 002 11 890 190 11 740 079 1 381 375 3 539 582 3 765 862 543 680 1 575 558 1 748 583 1 302 217 2 053 411 2 092 740 91 636
2009 2 026 636 1 824 252 183 694 13 394 279 13 941 713 1 695 389 4 306 382 4 422 472 581 870 1 777 082 1 859 571 1 275 272 2 252 411 2 302 839 92 856
April 159 213 131 383 15 522 966 568 1 093 293 130 687 311 808 332 520 47 231 135 680 139 362 90 468 157 008 166 454 8 337
Mei 154 947 170 956 18 095 1 178 594 1 074 410 130 229 337 949 345 461 59 399 151 062 154 311 108 088 191 972 189 328 4 798
Juni 174 902 150 082 17 018 1 164 179 1 295 202 149 105 356 683 392 981 56 981 150 541 156 440 111 468 193 138 202 631 6 536
Juli 190 562 160 366 18 285 1 249 817 1 352 328 167 423 391 103 416 390 57 625 163 200 171 821 114 914 225 442 228 512 8 603
Agustus 140 257 172 291 14 120 1 127 694 1 230 204 142 799 381 083 402 553 53 250 157 696 160 293 114 547 212 774 204 898 7 355
September 157 384 137 260 13 558 1 042 837 1 118 929 150 659 308 402 337 176 36 651 148 946 162 764 97 565 183 247 190 977 7 123
Oktober 194 955 152 354 13 143 1 244 928 1 352 675 159 988 433 271 347 387 49 721 178 119 178 903 125 141 202 924 208 177 7 278
November 171 558 141 521 11 837 1 175 310 1 252 713 139 094 427 065 416 127 49 224 160 807 171 838 114 094 199 246 202 542 7 996
Desember 186 619 185 122 14 732 1 293 066 1 327 506 146 416 417 994 415 590 40 489 115 750 122 962 81 703 211 199 233 114 8 701
2010 763 548 704 930 43 443 4 709 227 5 149 006 625 774 1 592 571 1 616 754 171 194 706 387 734 693 470 056 778 386 765 967 22 336
Januari 208 514 174 334 12 784 1 176 478 1 279 936 130 218 388 819 388 394 43 923 174 885 170 413 113 277 207 334 191 484 6 930
Februari 160 198 171 722 9 959 1 100 169 1 185 283 139 774 349 148 378 753 46 659 160 367 161 604 107 062 177 417 181 979 6 429
Maret 196 749 183 165 11 571 1 225 671 1 334 486 175 774 449 341 450 212 45 400 188 925 199 761 123 751 189 838 193 614 6 145
April 198 087 175 709 9 129 1 206 909 # 1 349 301 180 008 405 263 399 395 35 212 182 210 202 915 125 966 203 797 198 890 2 832
[13] [14]
Source : Report of five main airports
[15]Departure
Datang
Arrival
Sumber : Laporan dari 5 pelabuhan udara
[9] [10] [11] [12][1]
Berangkat Datang
PERHUBUNGAN TRANSPORTATION
Polonia - Medan
Departure
Berangkat Datang
[2] [3] [4]Arrival
[5] [16]DepartureArrival
[6] [7] [8]Arrival Departure ArrivalDeparture
117
Datang DatangYear / month
Tahun / bulan
Transit
Ngurah Rai - Bali
BerangkatBerangkat Berangkat
Soekarno Hatta - Jakarta Juanda - Surabaya Hasanudin - Ujung Pandang
https:
//www.b
ps.go.id

TABEL : 7.2.2 BONGKAR/MUAT BARANG ANGKUTAN UDARA DALAM NEGERI DI 5 PELABUHAN UDARA UTAMA
TABLE VOLUME OF DOMESTIC AIRCRAFT CARGO LOADED/UNLOADED AT 5 MAIN AIRPORTS
1999 5 915 7 650 60 755 32 676 12 377 11 285 17 352 9 355 6 458 6 190
2000 5 408 8 280 66 790 32 039 11 652 9 509 16 770 10 401 8 157 8 731
2001 5 470 10 316 68 300 33 974 11 434 12 019 18 698 11 217 8 045 8 520
2002 6 604 11 518 73 403 40 878 14 914 13 178 11 717 10 014 8 330 7 238
2003 6 012 13 525 90 787 43 705 21 698 21 028 13 492 12 288 7 472 7 789
2004 8 095 16 329 105 669 49 286 34 830 36 518 21 439 14 080 7 831 9 508
2005 10 690 18 608 115 832 60 464 35 467 33 892 24 771 15 303 7 543 12 855
2006 10 344 17 098 120 458 65 196 23 195 22 366 24 834 16 283 4 159 10 795
2007 10 809 19 257 133 663 70 372 23 441 20 196 27 375 17 265 5 144 12 158
2008 11 385 22 619 152 303 67 793 22 425 21 156 22 522 17 924 6 362 21 382
2009 12 096 19 068 146 134 67 570 27 276 23 203 21 815 17 630 6 433 15 989
April 856 1 662 11 000 5 232 2 179 1 508 1 085 1 228 462 1 104
Mei 811 1 647 11 918 5 398 2 170 2 024 2 021 1 399 576 1 308
Juni 929 1 746 12 364 5 482 2 235 1 782 2 196 1 473 515 1 385
Juli 1 098 1 768 12 723 5 561 2 542 2 082 1 215 1 567 584 1 548
Agustus 1 755 932 13 397 5 618 1 525 1 610 2 124 1 724 591 1 649
September 888 1 442 10 987 4 748 2 237 2 413 1 784 1 520 503 1 290
Oktober 828 1 532 13 687 6 215 2 201 1 734 1 238 1 769 597 1 557
November 759 1 518 9 044 7 252 2 120 1 852 2 346 1 642 614 1 573
Desember 1 028 1 719 14 871 6 576 3 569 3 101 1 861 1 296 652 1 455
2010 3 989 5 734 51 893 23 471 9 941 7 246 6 149 6 847 2 324 5 009
Januari 1 012 1 834 13 439 6 134 2 602 1 777 1 286 1 728 646 1 256
Februari 1 417 881 11 992 5 688 2 242 1 759 1 257 1 374 513 1 173
Maret 795 1 565 13 256 5 885 2 582 1 970 1 465 1 688 600 1 208
April 765 1 454 13 206 5 764 2 515 1 740 2 141 2 057 565 1 372
Bongkar
[5] [7] [9]Unloaded UnloadedLoaded
Sumber : Laporan dari 5 pelabuhan udara Source : Report of five main airports
[8] [10] [11][1] [2] [4] [6][3]Unloaded
M u a t Bongkar
Loaded
Bongkar
Unloaded
M u a t M u a t
Loaded
Bongkar
Loaded Loaded
Ngurah Rai - Bali
PERHUBUNGAN TRANSPORTATION
Year and month M u a t M u a tBongkar
Unloaded
118
Tahun dan bulan Polonia - Medan Juanda - Surabaya Hasanudin - Ujung PandangSoekarno Hatta - Jakarta
(TON)
https:
//www.b
ps.go.id

TABEL : 7.2.3 LALU LINTAS PENUMPANG ANGKUTAN UDARA LUAR NEGERI DI 4 PELABUHAN UDARA UTAMA
TABLE INTERNATIONAL AIRCRAFT PASSENGER TRAFFIC AT 4 MAIN AIRPORTS
Transit Transit Transit Transit
[13]
1999 177 144 176 926 - 1 959 161 1 914 124 89 197 228 861 216 168 - 1 420 811 1 364 818 41 418
2000 227 004 227 199 - 2 383 861 2 297 920 353 066 254 826 255 084 - 1 551 988 1 367 431 89 578
2001 252 135 249 497 - 2 207 957 2 195 309 202 164 302 126 304 060 2 117 1 458 076 1 466 946 40 016
2002 291 176 296 186 - 2 515 985 2 509 468 170 527 312 037 344 546 8 781 1 463 112 1 411 638 30 858
2003 294 657 287 693 - 2 403 096 2 379 212 139 682 282 411 302 698 - 1 090 040 1 084 915 44 485
2004 376 609 388 871 - 2 785 462 2 711 954 202 971 370 830 402 934 7 911 1 497 323 1 501 670 15 283
2005 403 324 384 910 - 2 909 043 2 890 018 168 731 362 937 416 445 23 324 1 522 668 1 513 894 15 813
2006 435 532 431 557 - 3 072 070 2 977 042 151 844 416 022 381 859 14 674 1 395 487 1 427 252 43 871
2007 451 449 444 905 - 3 375 003 3 304 999 142 322 463 693 474 317 18 479 1 803 579 1 811 571 26 709
2008 470 548 463 381 - 3 583 052 3 455 931 135 376 461 721 544 725 25 726 2 110 340 2 094 480 33 254
2009 464 477 470 856 0 3 828 285 3 744 577 65 875 502 424 567 387 21 218 2 468 775 2 477 283 41 099
April 32 938 34 034 - 289 584 284 401 11 593 35 404 36 065 2 404 184 259 193 109 2 942
Mei 37 016 35 506 - 299 300 289 509 1 513 37 981 39 427 1 780 202 755 201 024 2 994
Juni 45 350 40 875 - 347 772 321 593 1 665 44 522 48 475 2 354 201 122 211 478 3 423
Juli 40 757 45 009 - 334 206 374 403 1 615 41 238 45 195 2 311 234 265 248 990 2 714
Agustus 36 632 37 488 - 344 401 295 464 1 883 36 308 48 795 1 971 262 053 238 113 1 742
September 41 066 42 521 - 321 928 307 524 1 169 41 714 45 802 1 035 220 070 227 941 2 473
Oktober 44 230 39 913 - 336 722 324 444 1 405 52 822 40 929 1 188 244 039 225 039 2 576
November 40 520 39 987 - 373 774 315 875 2 929 47 911 50 966 1 374 200 779 192 315 2 666
Desember 51 164 51 701 - 392 488 409 276 3 146 54 584 85 593 1 179 202 289 230 838 5 897
2010 173 781 180 400 0 1 391 115 1 422 832 14 924 166 272 173 687 3 921 857 606 843 140 21 706
Januari 44 732 49 189 - 317 858 371 581 3 332 45 980 45 879 715 224 869 199 101 5 224
Februari 39 230 40 730 - 308 345 298 359 4 129 36 094 37 854 1 289 209 431 213 650 5 252
Maret 45 294 46 798 - 400 223 383 427 3 623 44 399 47 400 1 252 207 938 217 640 5 948
April 44 525 43 683 - 364 689 369 465 3 840 39 799 42 554 665 215 368 212 749 5 282
Ngurah Rai - Bali
Source : Report of four main airports
[1] [9]
Arrival[2] [3] [12][5]
DatangDatang Berangkat Datang Berangkat Datang Berangkat
Sumber : Laporan dari 4 pelabuhan udara
Departure Arrival Departure Arrival[4] [6]
DepartureDeparture[7] [8] [11][10]
Arrival
Soekarno Hatta - Jakarta
TRANSPORTATION PERHUBUNGAN
Year and month Berangkat
Tahun dan bulan Polonia - Medan
119
Juanda - Surabaya
https:
//www.b
ps.go.id

TABEL : 7.2.4 BONGKAR/MUAT BARANG ANGKUTAN UDARA LUAR NEGERI DI 4 PELABUHAN UDARA UTAMA
TABLE VOLUME OF INTERNATIONAL AIRCRAFT CARGO LOADED/UNLOADED AT 4 MAIN AIRPORTS
1999 4 670 1 220 109 834 69 871 8 819 6 003 34 482 3 023
2000 3 254 1 468 97 291 82 987 8 972 3 276 34 855 7 977
2001 3 641 1 488 95 030 78 490 7 861 5 535 35 574 5 067
2002 3 355 1 855 102 168 89 807 9 078 8 083 36 736 5 391
2003 2 634 1 318 88 476 87 161 5 569 5 339 32 574 5 608
2004 3 174 1 063 83 436 80 525 4 596 4 829 32 474 6 439
2005 2 730 1 739 85 060 74 075 4 111 5 253 30 514 7 759
2006 2 366 1 356 100 033 92 363 6 597 5 250 25 177 4 859
2007 1 888 1 575 106 132 85 550 7 455 6 476 26 784 7 250
2008 3 353 1 413 118 379 123 383 7 790 6 892 27 195 10 321
2009 2 308 1 364 110 467 97 229 8 150 10 242 28 839 15 352
April 123 105 8 419 8 697 726 643 2 968 1 216
Mei 109 84 8 991 10 324 763 864 2 674 1 378
Juni 126 82 8 510 9 863 809 870 2 485 1 345
Juli 181 141 7 643 8 173 660 814 2 406 1 508
Agustus 168 91 6 822 5 582 581 830 2 124 1 379
September 301 127 8 214 6 250 741 649 2 254 994
Oktober 241 100 11 959 7 969 739 1 064 2 305 1 413
November 139 62 9 044 7 252 936 1 124 2 479 1 542
Desember 153 47 11 528 10 518 664 1 981 2 826 2 834
2010 421 140 44 942 44 863 2 872 3 219 11 401 6 512
Januari 123 43 10 789 11 041 635 890 3 379 2 514
Februari 89 29 11 992 10 345 664 659 2 491 1 041
Maret 108 42 11 928 12 193 893 1 135 2 818 1 416
April 101 26 10 233 11 284 680 535 2 713 1 541
Source : Report of four main airports
[9][5] [6] [7] [8]
Bongkar
Loaded Unloaded Loaded[1] [2] [3] [4]
Loaded Unloaded Loaded Unloaded
Polonia - Medan Soekarno Hatta - Jakarta
Muat
Juanda - Surabaya
Unloaded
Bongkar Muat Bongkar Muat
Sumber : Laporan dari 4 pelabuhan udara
PERHUBUNGAN TRANSPORTATION
120
( TON )
Ngurah Rai - Bali
Year and month Bongkar Muat
Tahun dan bulan
https:
//www.b
ps.go.id

TABEL 7.2.5
TABLE
1999 7 045 786 10 893 879 1 160 827 161 033 131 845
2000 8 654 154 9 001 376 1 473 095 161 201 118 072
2001 10 394 330 10 414 613 1 891 111 164 135 138 063
2002 12 192 952 12 010 460 1 678 759 142 455 116 879
2003 17 459 523 18 059 995 2 446 684 159 723 136 685
2004 23 029 676 21 945 109 2 742 690 171 141 142 565
2005 25 329 828 24 053 222 3 149 777 203 356 154 313
2006 29 167 100 27 184 367 3 307 276 192 303 149 699
2007 31 168 400 27 963 707 3 394 424 202 966 162 527
2008 31 911 400 28 312 958 3 498 423 238 166 156 301
2009 35 659 207 34 320 813 4 213 375 230 544 159 330
April 2 586 200 2 437 178 296 660 14 674 12 582
Mei 2 902 000 2 834 466 380 609 19 133 14 086
Juni 3 040 000 2 797 336 391 108 20 239 13 868
Juli 3 301 600 3 318 600 370 000 21 125 9 724
Agustus 3 037 900 2 870 239 332 071 19 392 11 533
September 2 804 700 2 647 106 305 556 18 399 11 413
Oktober 3 394 800 3 372 660 435 271 19 851 13 007
November 3 210 907 3 218 741 382 245 18 883 14 237
Desember 3 406 500 3 284 294 392 041 22 181 14 347
2010 12 914 800 11 132 438 1 599 152 85 708 69 725
Januari 3 264 400 3 337 880 465 022 21 985 16 729
Februari 2 957 600 2 807 110 418 342 18 221 13 875
Maret 3 371 800 2 361 238 362 641 23 210 20 534
April 3 321 000 2 626 210 353 147 22 292 18 587
Muat
[5]
Loaded
[6]
BongkarUnloaded
121
Year and month
[1]
Tahun dan bulan Penumpang / Passenger
LALU LINTAS UDARA PENERBANGAN DALAM NEGERI
DOMESTIC AIRCRAFT TRAFFIC
Barang / Freigth (Ton)
Sumber : Laporan dari pelabuhan udara Source : Report from airports
PERHUBUNGAN TRANSPORTATION
DatangBerangkatDeparture
[2] [3]
Transit
[4]
Arrival
https:
//www.b
ps.go.id

TABEL : 7.2.6
TABLE
1999 3 924 275 3 877 617 119 427 165 600 82 216
2000 4 728 403 4 243 327 450 511 146 340 96 128
2001 4 516 412 4 409 698 291 007 147 008 95 451
2002 4 744 946 4 648 242 219 203 142 854 98 616
2003 4 275 334 4 242 926 188 866 130 207 102 886
2004 5 290 940 5 352 525 212 387 138 449 90 366
2005 5 528 934 5 642 926 269 525 139 108 94 874
2006 5 706 540 5 531 303 230 727 136 444 103 114
2007 6 435 353 6 141 606 182 778 155 298 110 750
2008 7 134 948 6 828 585 204 943 176 818 162 385
2009 7 969 548 7 786 625 215 610 167 317 136 149
April 589 900 523 537 54 448 16 083 14 442
Mei 629 200 605 895 7 287 17 052 14 615
Juni 702 900 699 421 9 442 15 930 14 160
Juli 714 300 760 900 6 840 8 375 8 348
Agustus 735 400 699 860 5 596 9 695 7 882
September 680 400 623 788 4 677 11 510 8 020
Oktober 754 300 663 325 5 169 15 244 10 546
November 728 523 699 143 6 969 13 598 10 280
Desember 787 825 779 408 10 222 15 371 15 480
2010 2 800 981 2 780 739 41 044 63 736 61 090
Januari 708 300 744 430 10 367 15 926 15 488
Februari 660 600 672 593 10 067 16 236 14 074
Maret 767 700 695 265 10 823 15 747 15 942
April 664 381 668 451 9 787 15 827 15 586
Sumber : Laporan dari pelabuhan udara Source : Report from airports
Loaded Unloaded
[1] [2] [3] [4] [5] [6]
Tahun dan bulan Penumpang - Passenger Barang / Freigth (Ton)
Departure Arrival
Year and month Berangkat Datang Transit Muat Bongkar
INTERNATIONAL AIRCRAFT TRAFFIC
122PERHUBUNGAN TRANSPORTATION
LALU LINTAS UDARA PENERBANGAN LUAR NEGERI
https:
//www.b
ps.go.id

TABEL : 7.3 PRODUKSI ANGKUTAN KERETA API
TABLE PRODUCTION OF RAILWAYS
1999 19 302 5 035 261 187 253 18 585 99
2000 19 545 4 997 256 191 617 19 210 100
2001 18 701 4 859 260 188 000 18 628 99
2002 17 099 4 449 260 175 715 16 329 93
2003 16 293 4 355 267 154 722 15 031 97
2004 17 592 4 698 267 152 655 15 078 99
2005 17 340 4 432 256 151 492 14 344 95
2006 17 275 4 474 259 159 422 15 580 98
2007 17 077 4 428 259 175 338 15 874 91
2008 19 444 5 282 272 194 077 17 937 92
2009 18 925 5 642 298 207 014 18 961 92
April 1 495 561 375 16 775 1 535 92
Mei 1 542 459 298 17 823 1 605 90
Juni 1 673 654 391 18 143 1 790 99
Juli 1 733 496 286 18 386 1 833 100
Agustus 1 815 526 290 17 527 1 686 96
September 1 442 383 266 17 281 1 751 101
Oktober 1 543 435 282 17 751 1 713 97
November 1 505 406 270 16 778 1 600 95
Desember 1 660 449 270 17 581 1 836 104
2010 5 765 1 917 333 66 454 7 022 106
Januari 1 489 469 315 17 423 1 746 100
Februari 1 340 512 382 15 207 1 799 118
Maret 1 466 435 297 16 992 1 830 108
April 1 470 501 341 16 832 1 647 98
PERHUBUNGAN 123
TRANSPORTATION
Tahun dan bulan Barang dimuat Kilometer - TonCargo loaded
(000 Ton)
Ton - Kilometer Average haul per Ton
(000 000) (Km)
Rata-rata jarak per Ton Rata-rata jarak perjalanan per penumpangPenumpang diangkut Kilometer - PenumpangPassenger carried Passenger - Kilometers
[7][6]
(000) (000 000)
[2]
Sumber : PT. ( Persero) Kereta Api Source : Indonesian State Railways
Year and month Average journey per passenger
(Km)
[1] [3] [4] [5]
https:
//www.b
ps.go.id

TABEL : 7.4 JUMLAH PENUMPANG DAN BARANG YANG DIANGKUT MENURUT JENIS ANGKUTAN DALAM NEGERI
TABLE NUMBER OF PASSENGER AND FREIGTH BY DOMESTIC CARGO
2002 175 715 17 099 16 620 137 949 12 193 142 455
2003 154 722 16 293 14 388 158 455 17 460 159 723
2004 152 655 17 591 12 853 166 434 23 030 171 1412005 151 492 17 340 14 064 180 446 25 330 203 356
2006 159 422 17 275 12 186 174 810 29 167 192 303
2007 175 338 17 077 6 108 172 528 31 169 202 966
2008 194 076 19 444 6 158 162 562 31 912 238 166
April 15 711 1 567 465 14 323 2 524 19 634
Mei 16 363 1 695 467 13 776 2 567 19 556
Juni 17 010 1 622 512 12 780 2 592 19 691
Juli 17 887 1 692 562 14 022 2 839 19 751
Agustus 17 108 1 911 515 12 878 2 789 21 394
September 15 879 1 559 506 12 950 2 077 21 138
Oktober 17 337 1 633 705 12 657 2 812 20 034
November 15 973 1 497 504 13 598 2 588 18 752
Desember 15 332 1 620 506 13 222 2 826 19 678
2009 207 014 18 925 5 947 146 923 35 661 230 544
Januari 16 847 1 526 489 12 332 2 720 19 756
Februari 14 991 1 419 441 12 390 2 433 17 753
Maret 17 131 1 573 448 12 863 2 822 19 158
April 16 775 1 495 437 13 446 2 586 14 674
Mei 17 823 1 542 440 13 190 2 902 19 133
Juni 18 143 1 673 482 12 779 3 040 20 239
Juli 18 386 1 733 542 13 301 3 302 21 125
Agustus 17 527 1 814 439 15 539 3 038 19 392
September 17 281 1 442 649 10 746 2 805 18 399
Oktober 17 751 1 543 665 10 248 3 395 19 851
November 16 778 1 505 416 10 461 3 211 18 883
Desember 17 581 1 660 499 9 628 3 407 22 181
2010 66 454 5 765 1 998 34 646 12 915 85 708
Januari 17 423 1 489 532 8 784 3 264 21 985 r)
Februari 15 207 1 340 444 7 935 2 958 18 221
Maret 16 992 1 466 505 8 712 3 372 23 210
April 16 832 1 470 517 9 215 3 321 22 292
Penumpang / Passenger Barang / Freigth
(Ton)
[2] [3] [4] [6] [7][5]
(000 Orang)
[1]
Barang / Freigth
(000 Orang) (000 Ton) (000 Ton)(000 Orang)
Year and month Penumpang / Passenger Barang / Freigth Penumpang / Passenger
Tahun dan bulan
PERHUBUNGAN TRANSPORTATION
124
Angkutan kereta api / Railways Angkutan antar pulau / Sea port Angkutan udara / Aircraft
https:
//www.b
ps.go.id
HOTEL DAN PARIWISATA HOTEL AND TOURISM
PENJELASAN TEKNIS 1. Data Statistik Perhotelan dikumpulkan oleh BPS melalui survey bulanan
VHT-S yang sebelumnya disebut HT-1 ke pengusaha hotel. Untuk hotel berbintang pencacahannya dilakukan secara lengkap, sedangkan untuk hotel non bintang dilakukan secara sampel.
2. Data Statistik Wisatawan Asing diperoleh dari Direktorat Jendral Imigrasi
berdasarkan hasil kompilasi kartu E/D. Kartu ini diisi oleh setiap tamu asing yang datang ke Indonesia.
3. Tamu Asing adalah setiap pengunjung yang mengunjungi suatu negara di
luar tempat tinggalnya, didorong oleh suatu atau beberapa keperluan tanpa bermaksud memperoleh panghasilan di tempat yang dikunjungi. Definisi ini mengacu pada definisi yang dipakai World Tourism Organization, (WTO).
4. Tingkat penghunian kamar hotel ialah banyaknya malam kamar yang
dihuni dibagi dengan banyaknya malam kamar yang tersedia dikalikan 100 %.
5. Tingkat penghunian tempat tidur ialah banyaknya malam tempat tidur
yang dipakai dibagi dengan banyaknya malam tempat tidur yang tersedia dikalikan 100 %.
6. Rata-rata lamanya tamu menginap ialah banyaknya malam tempat tidur
yang dipakai dibagi dengan banyaknya tamu yang datang menginap ke akomodasi. Rata-rata lamanya tamu menginap ini bisa dibedakan antara tamu asing dan tamu dalam negeri.
7. Rata-rata lamanya tamu asing menginap ialah banyaknya malam tempat
tidur oleh tamu asing dibagi dengan banyaknya tamu asing yang datang. 8. Rata-rata lamanya tamu dalam negeri menginap ialah banyaknya malam
tempat tidur oleh tamu dalam negeri dibagi dengan banyaknya tamu dalam negeri yang datang.
TECHNICAL NOTES 1. Hotel Statistics are collected by the BPS Statistics Indonesia through
monthly surveys (VHT-S) which before that known as (HT-1) questionairs of hotel enterprises. For classified hotels, complete enumeration is undertaken, while for unclassified hotels samples are taken for.
2. Foreign tourists statistics are obtained from the Directorate General of
Immigration, based on E/D card compilation. This card is filled out by every foreign visitor coming to Indonesia.
3. A foreign visitor is any person visiting other countries outside his/her usual
place of residence for any reason, without intending to earn any income in the visited countryies. This definition follows the standard definition from the World Tourism Organization (WTO).
4. Room occupancy rate is the number of room-nights occupied divided by
the number of room-nights available, multiplied by 100 %. 5. Bed-occupancy rate is the number of bed-nights occupied divided by the
number of bed-nights available, multiplied by 100 %. 6. Average length of stay is the number of bed-nights used divided by the
number of guests coming to stay at the accommodation. This average length of stay is distinguished between foreign and domestic guests.
7. The average foreign guests length of stay is the number of bed-nights
used by foreign guests divided by the total number of foreign guests. 8. The average domestic guest length of stay is the number of bed-nights
used by domestic guests divided by the total number of domestic guests.
125
https:
//www.b
ps.go.id

HOTEL DAN PARIWISATAHOTELS AND TOURISM
1. Sumatera Utara 49,2 44,4 42,8 47,2 49,3 47,4 26,6 23,2 25,8 25,9 39,8 38,4
2. Sumatera Barat - - 49,5 46,9 41,6 46,0 65,2 65,3 33,2 37,8 44,4 46,4
3. Riau 29,1 25,1 60,9 26,8 39,9 41,2 38,3 36,3 31,4 27,6 40,1 34,3
4. Kepulauan Riau 23,4 24,0 48,3 31,8 33,5 29,9 36,0 41,8 41,3 48,1 39,2 34,0
5. DKI. Jakarta 56,5 52,9 51,0 65,5 52,8 53,7 54,9 63,7 50,9 58,8 53,6 57,9
6. Jawa Barat 49,0 37,9 72,3 56,6 44,3 46,2 37,4 44,1 24,7 41,5 49,5 48,4
7. Jawa Tengah 57,3 55,1 47,1 47,7 43,2 44,9 27,4 28,1 30,3 27,6 40,1 40,2
8. DI. Yogyakarta 43,0 52,6 61,3 61,8 57,7 62,1 29,9 30,9 37,2 34,8 51,8 55,0
9. Jawa Timur 55,3 62,8 55,9 58,7 43,5 42,3 48,5 39,7 28,9 40,7 47,7 49,0
10. B a l i 64,8 63,1 64,5 62,0 50,3 55,7 56,7 50,4 41,4 51,9 59,3 59,2
11. Nusa Tenggara Barat 48,9 39,9 51,0 49,1 39,9 38,6 26,6 25,2 54,1 53,0 45,4 42,6
12. Kalimantan Timur 33,2 31,0 57,5 23,5 50,9 74,5 36,0 29,8 62,5 48,5 49,7 43,9
13. Sulawesi Utara 37,3 28,0 36,7 38,7 56,3 58,3 42,4 40,3 46,4 54,8 44,8 44,8
14. Sulawesi Selatan 61,2 52,7 37,9 42,8 49,6 46,6 42,3 57,0 27,1 26,9 43,0 42,9
15. Lampung - - 76,9 47,3 45,9 47,9 - - 50,6 51,4 53,4 48,4
16. Jambi - - 52,5 48,4 52,3 58,6 36,5 30,4 61,5 64,7 52,5 53,9
17. Sulawesi Tengah - - 95,5 92,1 41,8 39,0 - - - - 62,5 59,6
Apr '10Mar '09 Mar '09Mar '09 Mar '09 Apr '10Apr '10
[1] [12] [13][9] [10][5]
Bintang 4 / 4 Stars Bintang 3 / 3 Stars Bintang 2 / 2 Stars
[11][4] [8]
Mar '09 Apr '10Apr '10 Apr '10
Bintang 5 / 5 Stars
[3]
126
TABEL 8.1.1 TINGKAT PENGHUNIAN KAMAR PADA HOTEL BERBINTANG DI 17 PROVINSI DAERAH TUJUAN WISATA
TABLE ROOM OCCUPANCY RATE OF CLASSIFIED HOTELS IN 17 PROVINCES OF MAIN TOURIST DESTINATION
(PERSENTASE / PERCENTAGE )
Seluruhnya
All classesBintang 1 / 1 StarsProvinsi / Provinces
Mar '09
[6] [7][2]
https:
//www.b
ps.go.id
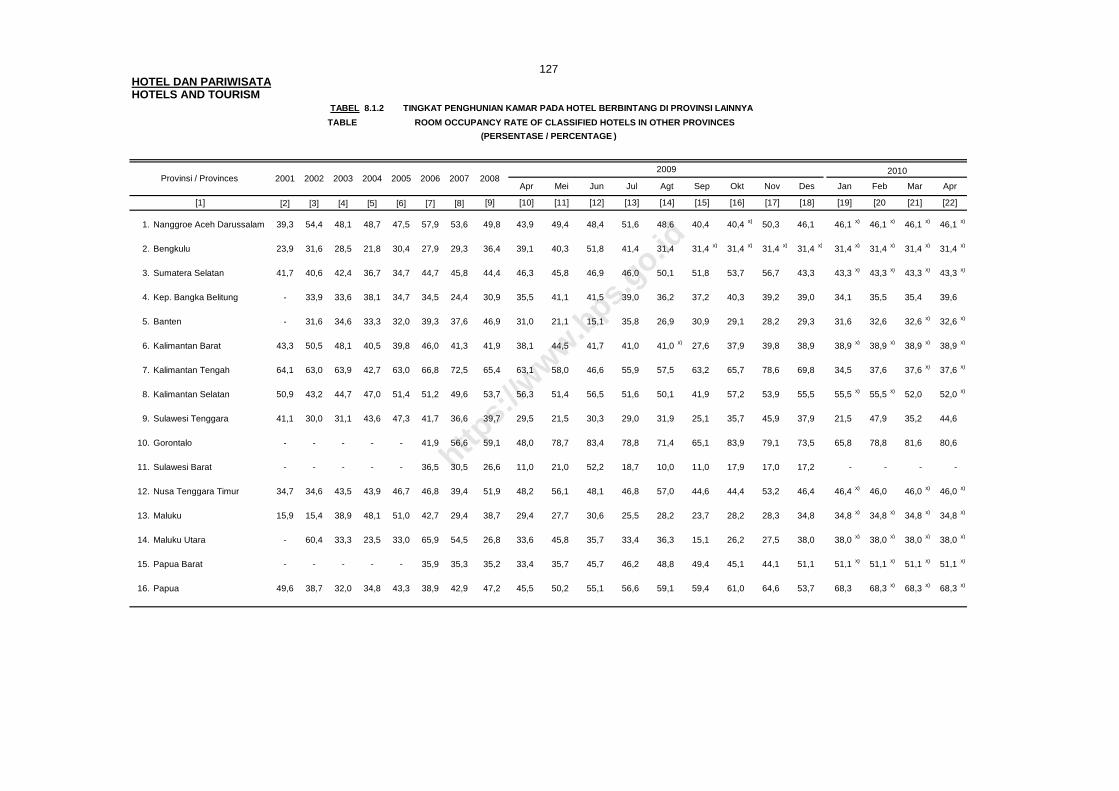
HOTEL DAN PARIWISATAHOTELS AND TOURISM
TABEL 8.1.2 TINGKAT PENGHUNIAN KAMAR PADA HOTEL BERBINTANG DI PROVINSI LAINNYA
TABLE ROOM OCCUPANCY RATE OF CLASSIFIED HOTELS IN OTHER PROVINCES
[2] [3] [4] [5] [6] [7] [8]
1. Nanggroe Aceh Darussalam 39,3 54,4 48,1 48,7 47,5 57,9 53,6 49,8 43,9 49,4 48,4 51,6 48,6 40,4 40,4 x) 50,3 46,1 46,1 x) 46,1 x) 46,1 x) 46,1 x)
2. Bengkulu 23,9 31,6 28,5 21,8 30,4 27,9 29,3 36,4 39,1 40,3 51,8 41,4 31,4 31,4 x) 31,4 x) 31,4 x) 31,4 x) 31,4 x) 31,4 x) 31,4 x) 31,4 x)
3. Sumatera Selatan 41,7 40,6 42,4 36,7 34,7 44,7 45,8 44,4 46,3 45,8 46,9 46,0 50,1 51,8 53,7 56,7 43,3 43,3 x) 43,3 x) 43,3 x) 43,3 x)
4. Kep. Bangka Belitung - 33,9 33,6 38,1 34,7 34,5 24,4 30,9 35,5 41,1 41,5 39,0 36,2 37,2 40,3 39,2 39,0 34,1 35,5 35,4 39,6
5. Banten - 31,6 34,6 33,3 32,0 39,3 37,6 46,9 31,0 21,1 15,1 35,8 26,9 30,9 29,1 28,2 29,3 31,6 32,6 32,6 x) 32,6 x)
6. Kalimantan Barat 43,3 50,5 48,1 40,5 39,8 46,0 41,3 41,9 38,1 44,5 41,7 41,0 41,0 x) 27,6 37,9 39,8 38,9 38,9 x) 38,9 x) 38,9 x) 38,9 x)
7. Kalimantan Tengah 64,1 63,0 63,9 42,7 63,0 66,8 72,5 65,4 63,1 58,0 46,6 55,9 57,5 63,2 65,7 78,6 69,8 34,5 37,6 37,6 x) 37,6 x)
8. Kalimantan Selatan 50,9 43,2 44,7 47,0 51,4 51,2 49,6 53,7 56,3 51,4 56,5 51,6 50,1 41,9 57,2 53,9 55,5 55,5 x) 55,5 x) 52,0 52,0 x)
9. Sulawesi Tenggara 41,1 30,0 31,1 43,6 47,3 41,7 36,6 39,7 29,5 21,5 30,3 29,0 31,9 25,1 35,7 45,9 37,9 21,5 47,9 35,2 44,6
10. Gorontalo - - - - - 41,9 56,6 59,1 48,0 78,7 83,4 78,8 71,4 65,1 83,9 79,1 73,5 65,8 78,8 81,6 80,6
11. Sulawesi Barat - - - - - 36,5 30,5 26,6 11,0 21,0 52,2 18,7 10,0 11,0 17,9 17,0 17,2 - - - -
12. Nusa Tenggara Timur 34,7 34,6 43,5 43,9 46,7 46,8 39,4 51,9 48,2 56,1 48,1 46,8 57,0 44,6 44,4 53,2 46,4 46,4 x) 46,0 46,0 x) 46,0 x)
13. Maluku 15,9 15,4 38,9 48,1 51,0 42,7 29,4 38,7 29,4 27,7 30,6 25,5 28,2 23,7 28,2 28,3 34,8 34,8 x) 34,8 x) 34,8 x) 34,8 x)
14. Maluku Utara - 60,4 33,3 23,5 33,0 65,9 54,5 26,8 33,6 45,8 35,7 33,4 36,3 15,1 26,2 27,5 38,0 38,0 x) 38,0 x) 38,0 x) 38,0 x)
15. Papua Barat - - - - - 35,9 35,3 35,2 33,4 35,7 45,7 46,2 48,8 49,4 45,1 44,1 51,1 51,1 x) 51,1 x) 51,1 x) 51,1 x)
16. Papua 49,6 38,7 32,0 34,8 43,3 38,9 42,9 47,2 45,5 50,2 55,1 56,6 59,1 59,4 61,0 64,6 53,7 68,3 68,3 x) 68,3 x) 68,3 x)
Feb
[20
2010
Jan
[19]
Apr
[22]
2009
MeiApr
[13]
Jun
[12]
Des
[18]
Agt
[14]
Jul
[15]
NovSep Okt
[16][1]
2005 2006 20082007Provinsi / Provinces 20032002 20042001
[9] [11][10]
127
(PERSENTASE / PERCENTAGE )
[17]
Mar
[21]
https:
//www.b
ps.go.id
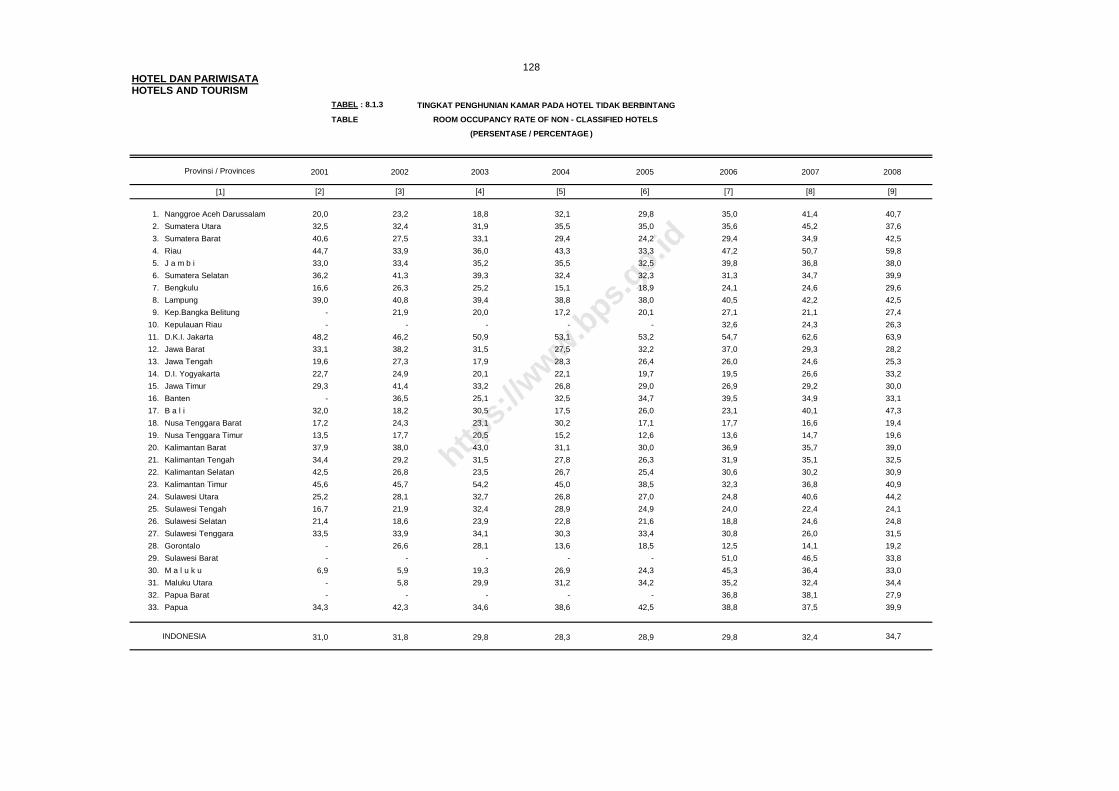
HOTEL DAN PARIWISATAHOTELS AND TOURISM
TABEL : 8.1.3 TINGKAT PENGHUNIAN KAMAR PADA HOTEL TIDAK BERBINTANG
TABLE ROOM OCCUPANCY RATE OF NON - CLASSIFIED HOTELS
Provinsi / Provinces
[1]
1. Nanggroe Aceh Darussalam 20,0 23,2 18,8 32,1 29,8 35,0 41,4 40,7
2. Sumatera Utara 32,5 32,4 31,9 35,5 35,0 35,6 45,2 37,6
3. Sumatera Barat 40,6 27,5 33,1 29,4 24,2 29,4 34,9 42,5
4. Riau 44,7 33,9 36,0 43,3 33,3 47,2 50,7 59,8
5. J a m b i 33,0 33,4 35,2 35,5 32,5 39,8 36,8 38,0
6. Sumatera Selatan 36,2 41,3 39,3 32,4 32,3 31,3 34,7 39,9
7. Bengkulu 16,6 26,3 25,2 15,1 18,9 24,1 24,6 29,6
8. Lampung 39,0 40,8 39,4 38,8 38,0 40,5 42,2 42,5
9. Kep.Bangka Belitung - 21,9 20,0 17,2 20,1 27,1 21,1 27,4
10. Kepulauan Riau - - - - - 32,6 24,3 26,3
11. D.K.I. Jakarta 48,2 46,2 50,9 53,1 53,2 54,7 62,6 63,9
12. Jawa Barat 33,1 38,2 31,5 27,5 32,2 37,0 29,3 28,2
13. Jawa Tengah 19,6 27,3 17,9 28,3 26,4 26,0 24,6 25,3
14. D.I. Yogyakarta 22,7 24,9 20,1 22,1 19,7 19,5 26,6 33,2
15. Jawa Timur 29,3 41,4 33,2 26,8 29,0 26,9 29,2 30,0
16. Banten - 36,5 25,1 32,5 34,7 39,5 34,9 33,1
17. B a l i 32,0 18,2 30,5 17,5 26,0 23,1 40,1 47,3
18. Nusa Tenggara Barat 17,2 24,3 23,1 30,2 17,1 17,7 16,6 19,4
19. Nusa Tenggara Timur 13,5 17,7 20,5 15,2 12,6 13,6 14,7 19,6
20. Kalimantan Barat 37,9 38,0 43,0 31,1 30,0 36,9 35,7 39,0
21. Kalimantan Tengah 34,4 29,2 31,5 27,8 26,3 31,9 35,1 32,5
22. Kalimantan Selatan 42,5 26,8 23,5 26,7 25,4 30,6 30,2 30,9
23. Kalimantan Timur 45,6 45,7 54,2 45,0 38,5 32,3 36,8 40,9
24. Sulawesi Utara 25,2 28,1 32,7 26,8 27,0 24,8 40,6 44,2
25. Sulawesi Tengah 16,7 21,9 32,4 28,9 24,9 24,0 22,4 24,1
26. Sulawesi Selatan 21,4 18,6 23,9 22,8 21,6 18,8 24,6 24,8
27. Sulawesi Tenggara 33,5 33,9 34,1 30,3 33,4 30,8 26,0 31,5
28. Gorontalo - 26,6 28,1 13,6 18,5 12,5 14,1 19,2
29. Sulawesi Barat - - - - - 51,0 46,5 33,8
30. M a l u k u 6,9 5,9 19,3 26,9 24,3 45,3 36,4 33,0
31. Maluku Utara - 5,8 29,9 31,2 34,2 35,2 32,4 34,4
32. Papua Barat - - - - - 36,8 38,1 27,9
33. Papua 34,3 42,3 34,6 38,6 42,5 38,8 37,5 39,9
INDONESIA 31,0 31,8 29,8 28,3 28,9 29,8 32,4 34,7
200720062005
[2] [8][3] [4] [5] [7]
(PERSENTASE / PERCENTAGE )
128
2008
[9]
2001 2002 2003 2004
[6]
https:
//www.b
ps.go.id

HOTEL DAN PARIWISATAHOTELS AND TOURISM
1. Sumatera Utara 1,7 1,4 1,5 1,5 1,6 1,6 1,3 1,4 1,1 1,2 1,5 1,4
2. Sumatera Barat - - 1,5 1,4 1,5 1,8 1,5 1,7 1,3 1,3 1,4 1,5
3. Riau 1,5 1,4 1,8 1,5 1,5 1,8 1,1 1,7 1,3 1,3 1,5 1,6
4. Kepulauan Riau 1,4 1,3 2,0 1,9 1,5 1,4 1,4 1,8 1,9 2,0 1,7 1,7
5. DKI. Jakarta 1,6 1,7 2,5 2,4 2,0 1,9 1,4 1,7 1,6 1,5 2,0 1,9
6. Jawa Barat 1,6 1,7 3,1 1,8 3,8 1,5 1,3 1,3 1,3 1,2 2,5 1,6
7. Jawa Tengah 1,7 2,1 1,3 1,5 1,5 1,8 1,4 1,2 1,2 1,2 1,4 1,6
8. DI. Yogyakarta 1,7 1,8 1,9 1,8 1,6 1,6 1,5 1,5 2,0 1,6 1,7 1,8
9. Jawa Timur 2,4 1,9 1,6 1,6 1,6 1,5 1,8 1,6 1,5 1,6 1,7 1,6
10. B a l i 4,2 3,9 3,2 3,8 3,8 3,4 3,3 3,4 4,8 4,0 3,8 3,7
11. Nusa Tenggara Barat 3,6 5,6 2,5 2,5 3,9 5,6 2,4 2,2 2,7 2,2 2,8 3,1
12. Kalimantan Timur 2,6 2,5 2,2 3,5 2,8 1,6 1,8 1,5 1,2 1,2 2,2 1,8
13. Sulawesi Utara 2,5 2,9 3,4 3,0 1,6 1,7 2,5 2,1 1,5 1,4 2,1 2,1
14. Sulawesi Selatan 1,7 1,8 1,7 1,9 1,7 2,0 2,2 3,1 1,6 1,6 1,7 2,0
15. Lampung - - 2,4 1,8 2,3 1,8 - - 1,6 1,7 2,2 1,8
16. Jambi - - 1,9 1,7 1,3 1,4 1,5 2,5 2,2 2,0 1,6 1,6
17. Sulawesi Tengah - - 1,2 1,1 2,2 1,8 - - - - 1,5 1,3
Apr '10
Bintang 1 / 1 Stars
Mar '09 Mar '09
Seluruhnya
All classes
Apr '10
( DALAM HARI / IN DAYS )
129
Mar '09 Mar '09 Apr '10 Apr '10
[4] [11][10]
Mar '09
[1] [2] [3]
Mar '09
Bintang 2 / 2 Stars
Apr '10 Apr '10
[6] [8]
Bintang 5 / 5 Stars Bintang 4 / 4 Stars
TABLE AVERAGE LENGTH OF STAY OF FOREIGN AND DOMESTIC GUESTS AT CLASSIFIED HOTEL IN 17 PROVINCES OF MAIN TOURIST DESTINATION
[13][12][7][5]
Bintang 3 / 3 Stars
TABEL 8.2.1 RATA-RATA LAMA MENGINAP TAMU ASING DAN TAMU DALAM NEGERI PADA HOTEL BERBINTANG DI 17 PROVINSI DAERAH TUJUAN WISATA
Provinsi / Provinces
[9]
https:
//www.b
ps.go.id

HOTEL DAN PARIWISATAHOTELS AND TOURISM
TABEL : 8.2.2 RATA-RATA LAMA MENGINAP TAMU ASING DAN TAMU DALAM NEGERI PADA HOTEL BERBINTANG DI PROVINSI LAINNYA
TABLE AVERAGE LENGTH OF STAY OF FOREIGN AND DOMESTIC GUESTS AT CLASSIFIED HOTEL IN OTHER PROVINCES
[2] [3] [4] [5] [6] [7] [8]
1. Nanggroe Aceh Darussalam 2,7 3,1 2,8 2,5 2,2 2,1 2,1 2,2 2,4 2,0 2,0 2,1 2,2 2,7 2,7 x) 2,2 2,0 2,0 x) 2,0 x) 2,0 x) 2,0 x)
2. Bengkulu 1,8 2,9 2,2 1,7 1,6 1,8 1,8 2,1 2,0 1,7 1,9 1,9 1,6 1,6 x) 1,6 x) 1,6 x) 1,6 x) 1,6 x) 1,6 x) 1,6 x) 1,6 x)
3. Sumatera Selatan 1,9 1,8 2,0 1,8 1,8 2,0 1,7 1,6 1,7 1,5 1,4 1,6 1,6 1,6 1,7 1,6 1,4 1,4 x) 1,4 x) 1,4 x) 1,4 x)
4. Kep. Bangka Belitung - 1,6 1,5 1,9 1,9 2,1 1,9 1,7 1,8 1,8 1,8 1,8 1,9 1,9 1,5 1,7 1,7 2,0 1,7 1,7 1,8
5. Banten - 1,1 1,3 1,4 1,3 1,4 1,7 1,4 1,6 1,7 1,6 1,5 1,6 1,7 1,5 1,5 1,3 1,7 1,7 1,7 x) 1,7 x)
6. Kalimantan Barat 1,6 1,8 1,8 1,8 1,8 2,0 1,9 1,8 1,7 2,0 1,6 1,8 1,8 x) 1,8 1,9 2,2 2,1 2,1 x) 2,1 x) 2,1 x) 2,1 x)
7. Kalimantan Tengah 2,6 2,4 2,2 2,4 2,3 2,0 1,9 1,8 2,0 1,6 1,8 2,0 2,0 2,7 1,7 1,5 2,0 2,2 1,3 1,3 x) 1,3 x)
8. Kalimantan Selatan 2,0 1,8 1,7 1,8 1,8 2,1 1,8 1,7 1,8 1,4 1,7 1,7 1,7 1,8 1,6 1,7 1,6 1,6 x) 1,6 x) 1,7 1,7 x)
9. Sulawesi Tenggara 2,5 1,8 1,6 1,7 1,9 1,6 1,5 1,6 1,6 1,3 1,8 1,9 2,0 2,1 1,5 2,2 2,1 1,5 2,2 2,3 1,8
10. Gorontalo - - - - - 1,7 1,9 1,9 1,8 1,9 2,4 2,2 2,2 2,3 2,2 2,1 2,2 2,1 2,2 2,7 2,0
11. Sulawesi Barat - - - - - 2,5 1,6 1,8 1,6 1,5 3,5 2,5 2,4 1,8 1,6 1,7 1,7 - - - -
12. Nusa Tenggara Timur 2,9 2,5 3,0 2,1 2,0 2,1 1,9 2,2 2,2 2,1 2,1 2,0 2,1 2,1 1,7 2,1 1,9 1,9 x) 2,1 2,1 x) 2,1 x)
13. Maluku 3,6 2,6 3,3 3,5 4,1 3,8 2,7 2,4 2,1 1,7 1,9 1,7 2,0 1,9 1,9 1,7 2,0 2,0 x) 2,0 x) 2,0 x) 2,0 x)
14. Maluku Utara - 4,5 1,8 2,3 2,6 3,6 2,6 2,4 2,1 2,7 1,9 1,6 2,4 1,7 1,8 1,7 1,8 1,8 x) 1,8 x) 1,8 x) 1,8 x)
15. Papua Barat - - - - - 2,5 2,5 2,4 2,3 2,5 3,0 3,0 3,0 3,1 2,5 2,8 2,8 2,8 x) 2,8 x) 2,8 x) 2,8 x)
16. Papua 2,8 2,6 2,3 2,3 3,2 2,9 2,2 2,0 2,3 2,8 2,6 2,9 2,9 2,9 2,6 2,9 3,1 2,0 2,0 x) 2,0 x) 2,0 x)
Feb
[20
2010
Jan
[19]
Des
[18]
Apr
[22]
2009
Jul
[13]
Mei Sep
[15] [16]
Okt
[10] [11]
2006Agt
[9] [14]
200820072004 20052002Provinsi / Provinces 2001 2003
[1]
Apr
[17]
Jun
[12]
130
( DALAM HARI / IN DAYS )
Nov Mar
[21]
https:
//www.b
ps.go.id

HOTEL DAN PARIWISATAHOTELS AND TOURISM
TABEL : 8.2.3 RATA-RATA LAMA MENGINAP TAMU ASING DAN TAMU DALAM NEGERI PADA HOTEL TIDAK BERBINTANG
TABLE AVERAGE LENGTH OF STAY OF FOREIGN AND DOMESTIC GUESTS AT NON CLASSIFIED HOTELS
Provinsi / Provinces
[1]
1. Nanggroe Aceh Darussalam 2,31 2,88 1,62 1,86 1,52 2,53 1,79 2,17
2. Sumatera Utara 1,53 1,46 1,42 1,47 1,53 1,44 1,94 1,35
3. Sumatera Barat 1,40 1,44 1,68 1,69 1,99 2,39 1,53 1,57
4. Riau 1,87 1,86 1,05 1,38 3,03 2,14 1,47 1,55
5. J a m b i 1,27 1,42 1,52 1,56 1,48 2,07 2,09 1,79
6. Sumatera Selatan 2,13 1,84 2,19 1,76 1,39 1,35 1,71 1,70
7. Bengkulu 1,65 3,01 2,23 1,39 1,36 1,56 1,75 1,64
8. Lampung 1,27 1,24 1,37 1,42 1,33 1,42 1,35 1,32
9. Kep.Bangka Belitung - 1,93 1,83 1,59 1,79 2,66 2,33 2,07
10. Kepulauan Riau - - - - - 3,57 1,90 1,83
11. D.K.I. Jakarta 1,18 1,28 1,29 1,19 1,16 1,33 1,44 1,42
12. Jawa Barat 1,22 1,34 1,11 1,13 1,21 1,36 1,39 1,30
13. Jawa Tengah 1,11 1,33 1,07 1,20 1,09 1,11 1,08 1,10
14. D.I. Yogyakarta 2,34 1,81 1,24 1,12 1,33 1,17 1,42 1,29
15. Jawa Timur 1,14 1,42 1,33 1,23 1,40 1,29 1,36 1,32
16. Banten - 1,06 1,15 1,20 1,08 1,16 1,19 1,12
17. B a l i 3,55 3,20 3,70 2,65 3,16 3,34 3,41 3,58
18. Nusa Tenggara Barat 2,70 2,30 2,29 1,31 1,57 1,73 1,52 2,00
19. Nusa Tenggara Timur 2,07 3,61 2,23 1,63 1,62 1,94 2,01 2,57
20. Kalimantan Barat 1,47 1,75 1,57 1,54 1,51 1,74 1,44 1,47
21. Kalimantan Tengah 1,51 1,34 1,41 1,32 1,57 2,44 1,95 2,01
22. Kalimantan Selatan 1,84 1,51 1,46 1,57 1,79 2,09 1,44 1,70
23. Kalimantan Timur 1,90 1,84 2,08 1,36 1,49 1,69 1,67 1,92
24. Sulawesi Utara 2,69 3,72 2,52 1,56 1,38 1,77 1,56 2,01
25. Sulawesi Tengah 2,33 1,74 1,44 1,44 2,36 1,54 2,13 1,87
26. Sulawesi Selatan 1,65 1,56 1,31 1,72 1,35 1,34 1,34 1,39
27. Sulawesi Tenggara 2,49 2,86 2,26 1,82 1,67 1,89 1,67 1,53
28. Gorontalo - 1,80 1,83 1,42 1,74 1,43 1,46 1,50
29. Sulawesi Barat - - - - - 2,68 1,95 1,51
30. M a l u k u 1,55 1,78 1,82 2,00 2,26 3,75 3,03 2,54
31. Maluku Utara - 1,42 2,58 2,54 2,55 2,43 2,00 1,82
32. Papua Barat - - - - - 2,91 3,33 2,76
33. Papua 3,22 2,68 3,74 2,97 3,11 2,82 2,49 2,97
INDONESIA 1,55 1,56 1,41 1,36 1,50 1,56 1,57 1,60
2002 2003 2004
[2] [8]
2006
[3] [4]
2001 2008
[9]
( DALAM HARI / IN DAYS )
2007
[7][6][5]
2005
131
https:
//www.b
ps.go.id
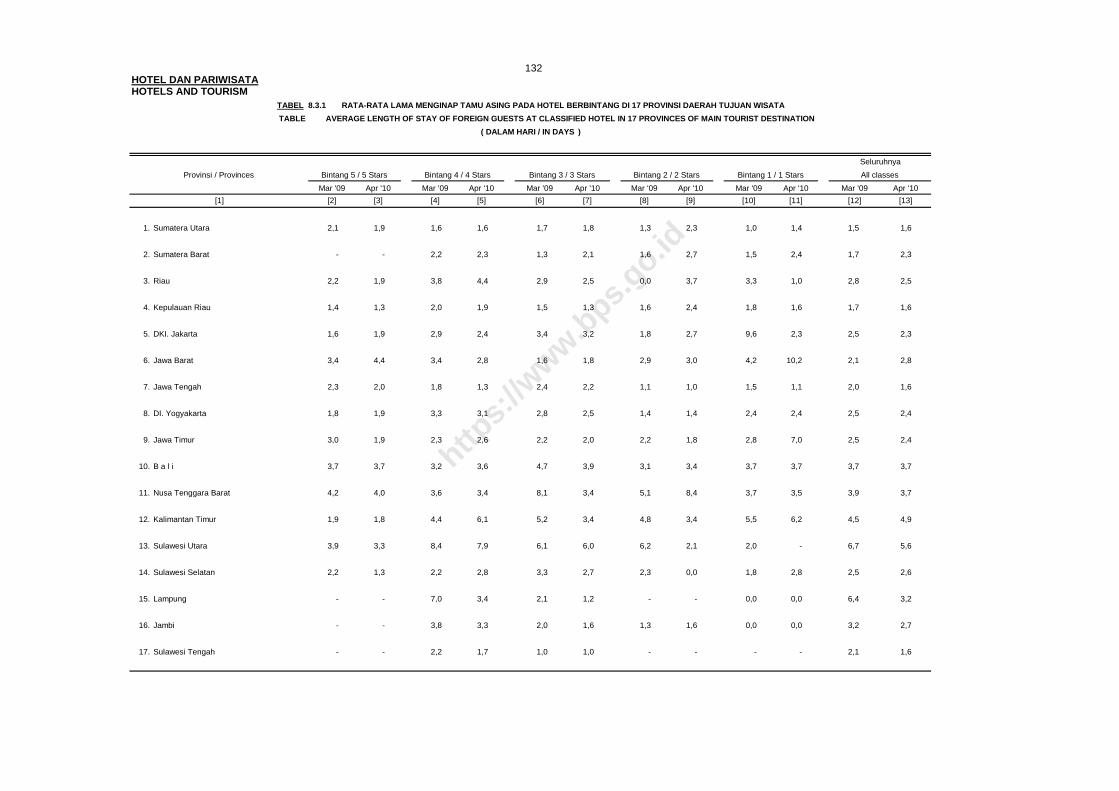
HOTEL DAN PARIWISATAHOTELS AND TOURISM
1. Sumatera Utara 2,1 1,9 1,6 1,6 1,7 1,8 1,3 2,3 1,0 1,4 1,5 1,6
2. Sumatera Barat - - 2,2 2,3 1,3 2,1 1,6 2,7 1,5 2,4 1,7 2,3
3. Riau 2,2 1,9 3,8 4,4 2,9 2,5 0,0 3,7 3,3 1,0 2,8 2,5
4. Kepulauan Riau 1,4 1,3 2,0 1,9 1,5 1,3 1,6 2,4 1,8 1,6 1,7 1,6
5. DKI. Jakarta 1,6 1,9 2,9 2,4 3,4 3,2 1,8 2,7 9,6 2,3 2,5 2,3
6. Jawa Barat 3,4 4,4 3,4 2,8 1,6 1,8 2,9 3,0 4,2 10,2 2,1 2,8
7. Jawa Tengah 2,3 2,0 1,8 1,3 2,4 2,2 1,1 1,0 1,5 1,1 2,0 1,6
8. DI. Yogyakarta 1,8 1,9 3,3 3,1 2,8 2,5 1,4 1,4 2,4 2,4 2,5 2,4
9. Jawa Timur 3,0 1,9 2,3 2,6 2,2 2,0 2,2 1,8 2,8 7,0 2,5 2,4
10. B a l i 3,7 3,7 3,2 3,6 4,7 3,9 3,1 3,4 3,7 3,7 3,7 3,7
11. Nusa Tenggara Barat 4,2 4,0 3,6 3,4 8,1 3,4 5,1 8,4 3,7 3,5 3,9 3,7
12. Kalimantan Timur 1,9 1,8 4,4 6,1 5,2 3,4 4,8 3,4 5,5 6,2 4,5 4,9
13. Sulawesi Utara 3,9 3,3 8,4 7,9 6,1 6,0 6,2 2,1 2,0 - 6,7 5,6
14. Sulawesi Selatan 2,2 1,3 2,2 2,8 3,3 2,7 2,3 0,0 1,8 2,8 2,5 2,6
15. Lampung - - 7,0 3,4 2,1 1,2 - - 0,0 0,0 6,4 3,2
16. Jambi - - 3,8 3,3 2,0 1,6 1,3 1,6 0,0 0,0 3,2 2,7
17. Sulawesi Tengah - - 2,2 1,7 1,0 1,0 - - - - 2,1 1,6
Mar '09
Bintang 1 / 1 StarsBintang 4 / 4 Stars
Apr '10Apr '10
( DALAM HARI / IN DAYS )
TABEL 8.3.1 RATA-RATA LAMA MENGINAP TAMU ASING PADA HOTEL BERBINTANG DI 17 PROVINSI DAERAH TUJUAN WISATA
132
Apr '10Apr '10
Bintang 5 / 5 Stars Bintang 2 / 2 StarsProvinsi / Provinces All classes
TABLE AVERAGE LENGTH OF STAY OF FOREIGN GUESTS AT CLASSIFIED HOTEL IN 17 PROVINCES OF MAIN TOURIST DESTINATION
Seluruhnya
Mar '09
[12][11]
Mar '09Apr '10Apr '10Mar '09
[1] [2] [3] [4] [13]
Mar '09
[5] [6] [7] [9][8] [10]
Mar '09
Bintang 3 / 3 Stars
https:
//www.b
ps.go.id

HOTEL DAN PARIWISATAHOTELS AND TOURISM
TABEL : 8.3.2 RATA-RATA LAMA MENGINAP TAMU ASING PADA HOTEL BERBINTANG DI PROVINSI LAINNYA
TABLE AVERAGE LENGTH OF STAY OF FOREIGN GUESTS AT CLASSIFIED HOTEL IN OTHER PROVINCES
[2] [3] [4] [5] [6] [7] [8]
1. Nanggroe Aceh Darussalam 2,4 3,0 3,3 1,7 4,1 3,5 2,4 4,7 2,0 2,5 2,8 3,3 4,4 5,4 5,4 x) 5,6 2,2 2,2 x) 2,2 x) 2,2 x) 2,2 x)
2. Bengkulu 2,7 2,4 4,1 2,8 3,8 3,2 1,2 2,1 3,0 1,0 10,0 3,3 1,3 1,3 x) 1,3 x) 1,3 x) 1,3 x) 1,3 x) 1,3 x) 1,3 x) 1,3 x)
3. Sumatera Selatan 2,6 2,8 2,5 2,7 4,2 4,4 5,2 4,0 4,2 6,4 4,9 4,0 4,0 2,8 2,8 3,2 2,4 2,4 x) 2,4 x) 2,4 x) 2,4 x)
4. Kep. Bangka Belitung - 4,6 2,7 4,3 4,0 5,3 4,6 2,8 3,5 2,0 2,0 2,6 2,1 2,5 2,8 2,2 2,6 1,8 3,3 2,1 2,1
5. Banten - 1,2 1,2 2,0 1,2 1,5 1,9 1,5 2,6 2,3 1,9 1,9 1,5 1,5 1,9 1,8 1,4 3,1 2,2 2,2 x) 2,2 x)
6. Kalimantan Barat 2,5 1,9 4,2 3,0 3,1 3,6 2,9 3,0 3,4 3,6 2,8 2,4 2,4 x) 2,8 3,5 4,0 2,5 2,5 x) 2,5 x) 2,5 x) 2,5 x)
7. Kalimantan Tengah 2,5 5,2 6,8 8,8 3,0 1,7 2,5 3,3 1,7 2,0 1,7 2,4 3,2 7,4 1,2 9,6 1,7 1,2 1,1 1,1 x) 1,1 x)
8. Kalimantan Selatan 3,5 3,5 3,4 5,2 3,1 4,0 4,1 2,1 1,8 2,1 2,8 2,1 1,8 1,7 1,7 2,1 1,9 1,9 x) 1,9 x) 1,8 1,8 x)
9. Sulawesi Tenggara 4,7 3,0 2,6 1,7 9,9 1,5 - 2,2 1,2 1,3 1,6 1,7 2,0 1,6 1,4 1,6 3,1 1,7 1,0 0,0 0,0
10. Gorontalo - - - - - 2,3 1,9 2,7 3,4 6,6 3,5 2,5 2,6 7,6 6,5 2,3 5,0 2,3 2,2 2,1 2,7
11. Sulawesi Barat - - - - - 1,8 1,6 1,8 0,0 2,4 0,0 1,8 1,1 1,0 2,0 0,0 0,0 - - - -
12. Nusa Tenggara Timur 3,7 3,3 5,8 3,0 2,9 3,0 2,6 3,6 2,5 3,0 2,4 1,9 2,0 2,5 1,6 1,5 1,7 1,7 x) 1,9 1,9 x) 1,9 x)
13. Maluku 6,0 2,4 3,5 1,8 2,6 7,2 3,1 3,1 2,2 2,3 2,2 2,3 2,5 2,4 2,2 2,0 2,0 2,0 x) 2,0 x) 2,0 x) 2,0 x)
14. Maluku Utara - 1,4 - 3,0 3,5 4,2 1,3 3,6 4,1 0,0 3,5 0,0 0,0 0,0 3,0 2,1 1,4 1,4 x) 1,4 x) 1,4 x) 1,4 x)
15. Papua Barat - - - - - 2,7 4,1 5,2 4,9 4,5 7,0 4,2 6,8 7,5 4,5 6,6 5,2 5,2 x) 5,2 x) 5,2 x) 5,2 x)
16. Papua 2,4 2,4 2,6 2,4 3,6 6,0 3,1 4,1 1,9 2,7 3,3 3,4 2,8 5,0 4,0 3,5 5,0 2,5 2,5 x) 2,5 x) 2,5 x)
Feb
[20[19]
2010
[22]
Des Jan Apr
[18]
2009
[9]
2006200520032001
[11][1]
Provinsi / Provinces 2008
[10]
Sep2002 2004 2007
OktMei JunApr Jul Agt Nov
[17][16][12] [15][13] [14]
Mar
[21]
133
( DALAM HARI / IN DAYS )
https:
//www.b
ps.go.id

HOTEL DAN PARIWISATAHOTELS AND TOURISM
2001 1 049 471 1 422 714 94 211 1 145 578 12 679 112 513 29 534 4 870 6 630 62 174 221 255
2002 1 095 507 1 351 176 97 870 1 101 048 10 999 112 241 25 378 5 388 4 104 59 122 198 380
2003 921 737 1 054 143 74 776 1 285 394 12 069 67 627 19 863 2 948 4 495 56 707 173 616
2004 1 005 072 1 525 994 97 087 1 527 132 16 930 75 802 16 914 4 042 12 677 58 838 176 357
2005 1 105 202 1 454 804 109 034 1 024 758 15 839 81 409 21 301 4 736 17 708 62 743 143 587
2006 1 147 250 1 328 929 110 405 1 012 711 17 745 83 439 14 540 13 834 24 910 66 679 129 769
2007 1 153 006 1 741 935 116 614 1 077 306 19 274 140 438 18 220 18 628 26 974 68 735 119 574
2008 1 464 717 2 081 786 130 211 1 061 390 21 795 156 726 19 989 19 022 40 911 67 886 123 505
2009 1 390 440 r) 2 384 819 r) 148 193 r) 951 384 r) 29 715 r) 158 076 r) 21 190 r) 16 489 r) 51 002 r) 59 212 r) 102 487 r)
April 96 709 188 189 11 481 77 788 2 538 11 582 1 497 1 192 4 450 5 212 8 428
Mei 119 231 190 697 13 031 79 969 2 543 13 448 1 814 1 444 5 776 5 567 9 001
Juni 125 111 200 503 14 166 84 521 2 393 14 879 1 820 1 611 6 224 5 444 10 241
Juli 150 924 235 042 13 886 70 864 2 970 14 810 1 451 1 713 6 872 4 791 7 159
Agustus 123 405 232 164 12 043 78 422 3 559 15 661 1 578 1 391 1 932 4 583 8 025
September 87 047 218 245 9 702 66 105 2 633 10 381 2 192 1 211 1 965 4 959 8 407
Oktober 117 911 225 606 11 861 72 195 2 675 12 630 1 314 1 777 4 140 4 746 7 598
November 127 299 184 622 12 042 78 764 1 923 16 413 1 855 1 239 3 037 3 011 7 864
Desember 130 983 221 604 15 983 105 037 2 270 14 630 3 054 1 601 3 641 4 920 9 382
2010 596 504 745 075 50 316 319 436 7 196 53 146 7 105 6 103 7 975 21 011 30 394
Januari 117 422 178 358 11 365 79 560 1 841 13 889 1 262 1 033 1 714 5 535 6 173
Februari 121 727 191 362 12 625 80 966 2 308 12 241 2 432 1 163 2 005 5 260 8 548
Maret 183 449 191 125 14 000 81 732 1 602 14 455 1 873 2 117 2 350 5 271 7 731
April 173 906 184 230 12 326 77 178 1 445 12 561 1 538 1 790 1 906 4 945 7 942
Catatan : 1) Sebelum Januari 2009 wisatawan asing datang melalui 11 pintu masuk utama Note : 1) Before January 2009, foreign tourist arrivals through 11 main ports of entry
Ratulangi
[7]
Sumarmo
[8]
EntikongAdi
[1] [2] [3] [4]
(ORANG / PERSON )
TABLE NUMBER OF FOREIGN TOURIST ARRIVALS THROUGH 19 MAIN PORTS OF ENTRY 1)
Year and month Hatta kabau PriokNgurah Rai
TanjungBatam
Sam
134
TABEL : 8.4 JUMLAH WISATAWAN ASING YANG DATANG MELALUI 19 PINTU MASUK UTAMA 1)
Polonia JuandaTahun dan bulan Sukarno-
[5] [6] [9] [10] [11] [12]
PinangMinang Tanjung
https:
//www.b
ps.go.id

HOTEL DAN PARIWISATAHOTELS AND TOURISM
(Lanjutan/Continuation )
2001 - - - - - - - - 991 991 5 153 620
2002 - - - - - - - - 972 187 5 033 400
2003 - - - - - - - - 793 646 4 467 021
2004 - - - - - - - - 804 320 5 321 165
2005 - - - - - - - - 960 980 5 002 101
2006 - - - - - - - - 921 140 4 871 351
2007 - - - - - - - - 1 005 055 5 505 759
2008 - - - - - - - - 1 046 559 6 234 497
2009 13 908 20 222 9 985 18 996 45 883 78 998 296 229 101 632 424 870 6 323 730
April 1 161 709 850 1 265 4 280 6 915 23 816 8 906 30 153 487 121
Mei 983 777 772 1 593 4 566 8 288 23 431 8 978 29 826 521 735
Juni 1 270 772 822 2 308 4 592 9 728 28 918 9 462 25 797 550 582
Juli 1 590 957 950 1 286 4 512 8 911 25 722 8 028 30 977 593 415
Agustus 1 311 951 1 005 1 335 4 332 7 079 29 542 7 845 30 634 566 797
September 1 121 797 815 1 796 2 540 3 491 21 729 5 920 42 743 493 799
Oktober 1 200 2 465 848 1 285 3 907 5 661 24 265 7 429 37 646 547 159
November 1 129 4 380 782 1 533 3 713 6 334 20 829 6 728 48 172 531 669
Desember 1 206 5 013 565 1 741 4 894 7 484 29 810 9 332 52 269 625 419
2010 4 313 5 963 3 462 4 877 15 878 27 293 94 703 33 638 132 703 2 167 091
Januari 727 1 913 615 1 056 3 672 r) 6 444 21 604 6 912 32 704 493 799 r)
Februari 974 2 045 694 1 268 4 006 6 809 23 718 9 100 33 884 523 135
Maret 1 293 1 080 1 254 1 319 4 467 7 155 27 100 9 446 35 423 594 242
April 1 319 925 899 1 234 3 733 6 885 22 281 8 180 30 692 555 915
Catatan : 1) Sebelum Januari 2009 wisatawan asing datang melalui 11 pintu masuk utama Note : 1) Before January 2009, foreign tourist arrivals through 11 main ports of entry
TABEL : 8.4 JUMLAH WISATAWAN ASING YANG DATANG MELALUI 19 PINTU MASUK UTAMA 1)
TABLE NUMBER OF FOREIGN TOURIST ARRIVALS THROUGH 19 MAIN PORTS OF ENTRY 1)
(ORANG / PERSON )
Tahun dan bulan Selaparang
[1]
135
[20][16] [17]
BalaiYear and month
Simpang
Mataram
[21] [22][13] [14] [15]
IndonesiaTotal
Makasar SepingganAdi
LainnyaTiga Sastranegara UbanSucipto Karimun
Husein Tanjung
[18] [19]
https:
//www.b
ps.go.id
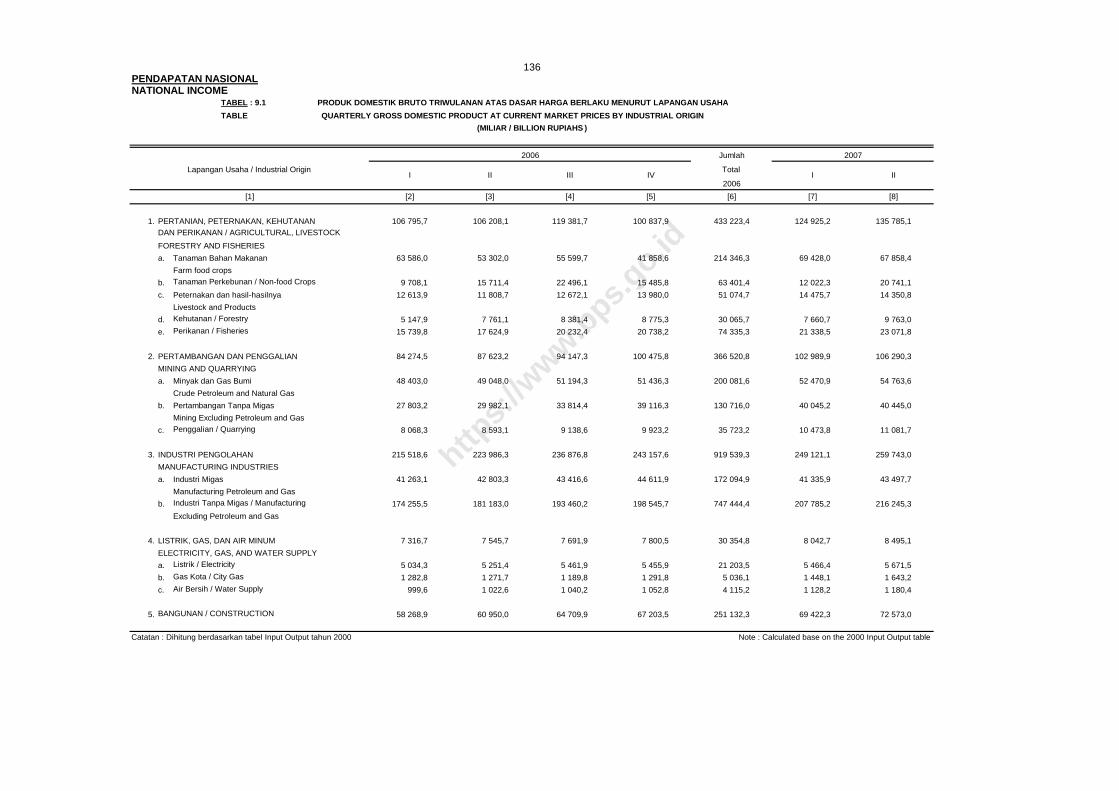
PENDAPATAN NASIONALNATIONAL INCOME
TABEL : 9.1 PRODUK DOMESTIK BRUTO TRIWULANAN ATAS DASAR HARGA BERLAKU MENURUT LAPANGAN USAHA
TABLE QUARTERLY GROSS DOMESTIC PRODUCT AT CURRENT MARKET PRICES BY INDUSTRIAL ORIGIN
1. PERTANIAN, PETERNAKAN, KEHUTANAN 106 795,7 106 208,1 119 381,7 100 837,9 433 223,4 124 925,2 135 785,1DAN PERIKANAN / AGRICULTURAL, LIVESTOCK
FORESTRY AND FISHERIES
a. Tanaman Bahan Makanan 63 586,0 53 302,0 55 599,7 41 858,6 214 346,3 69 428,0 67 858,4
Farm food crops
b. Tanaman Perkebunan / Non-food Crops 9 708,1 15 711,4 22 496,1 15 485,8 63 401,4 12 022,3 20 741,1
c. Peternakan dan hasil-hasilnya 12 613,9 11 808,7 12 672,1 13 980,0 51 074,7 14 475,7 14 350,8
Livestock and Products
d. Kehutanan / Forestry 5 147,9 7 761,1 8 381,4 8 775,3 30 065,7 7 660,7 9 763,0
e. Perikanan / Fisheries 15 739,8 17 624,9 20 232,4 20 738,2 74 335,3 21 338,5 23 071,8
2. PERTAMBANGAN DAN PENGGALIAN 84 274,5 87 623,2 94 147,3 100 475,8 366 520,8 102 989,9 106 290,3
MINING AND QUARRYING
a. Minyak dan Gas Bumi 48 403,0 49 048,0 51 194,3 51 436,3 200 081,6 52 470,9 54 763,6
Crude Petroleum and Natural Gas
b. Pertambangan Tanpa Migas 27 803,2 29 982,1 33 814,4 39 116,3 130 716,0 40 045,2 40 445,0
Mining Excluding Petroleum and Gas
c. Penggalian / Quarrying 8 068,3 8 593,1 9 138,6 9 923,2 35 723,2 10 473,8 11 081,7
3. INDUSTRI PENGOLAHAN 215 518,6 223 986,3 236 876,8 243 157,6 919 539,3 249 121,1 259 743,0
MANUFACTURING INDUSTRIES
a. Industri Migas 41 263,1 42 803,3 43 416,6 44 611,9 172 094,9 41 335,9 43 497,7
Manufacturing Petroleum and Gas
b. Industri Tanpa Migas / Manufacturing 174 255,5 181 183,0 193 460,2 198 545,7 747 444,4 207 785,2 216 245,3
Excluding Petroleum and Gas
4. LISTRIK, GAS, DAN AIR MINUM 7 316,7 7 545,7 7 691,9 7 800,5 30 354,8 8 042,7 8 495,1
ELECTRICITY, GAS, AND WATER SUPPLY
a. Listrik / Electricity 5 034,3 5 251,4 5 461,9 5 455,9 21 203,5 5 466,4 5 671,5
b. Gas Kota / City Gas 1 282,8 1 271,7 1 189,8 1 291,8 5 036,1 1 448,1 1 643,2
c. Air Bersih / Water Supply 999,6 1 022,6 1 040,2 1 052,8 4 115,2 1 128,2 1 180,4
5. BANGUNAN / CONSTRUCTION 58 268,9 60 950,0 64 709,9 67 203,5 251 132,3 69 422,3 72 573,0
Catatan : Dihitung berdasarkan tabel Input Output tahun 2000 Note : Calculated base on the 2000 Input Output table
2006 2007
I
Jumlah
Total
2006
(MILIAR / BILLION RUPIAHS )
136
II
[7] [8]
I
[1] [4] [6][3]
Lapangan Usaha / Industrial OriginIVIIIII
[2] [5]
https:
//www.b
ps.go.id

PENDAPATAN NASIONALNATIONAL INCOME
TABEL : 9.1 PRODUK DOMESTIK BRUTO TRIWULANAN ATAS DASAR HARGA BERLAKU MENURUT LAPANGAN USAHA
TABLE QUARTERLY GROSS DOMESTIC PRODUCT AT CURRENT MARKET PRICES BY INDUSTRIAL ORIGIN
(Lanjutan/Continuation )
6. PERDAGANGAN, HOTEL DAN RESTORAN 115 743,9 123 480,3 131 075,3 131 242,9 501 542,4 137 876,4 144 069,9
TRADE, HOTEL AND RESTAURANT
a. Perdagangan Besar dan Eceran 90 529,2 96 765,5 103 386,2 102 366,5 393 047,4 108 453,6 113 559,2
Wholesale and Retail Trade
b. Hotel / Hotel 3 812,1 4 004,1 4 119,3 4 138,7 16 074,2 4 185,4 4 317,7
c. Restoran / Restaurant 21 402,6 22 710,7 23 569,8 24 737,7 92 420,8 25 237,4 26 193,0
7. PENGANGKUTAN DAN KOMUNIKASI 54 055,9 56 297,1 59 197,9 61 972,6 231 523,5 61 139,1 64 028,6
TRANSPORTATION AND COMMUNICATION
a. Pengangkutan / Transportation 33 975,2 35 201,7 36 488,7 37 104,4 142 770,0 34 859,5 36 336,2
b. Komunikasi / Communication 20 080,7 21 095,4 22 709,2 24 868,2 88 753,5 26 279,6 27 692,4
8. KEUANGAN, PERSEWAAN & JASA PERUSAHAAN 64 102,4 66 239,2 68 288,4 70 491,4 269 121,4 73 002,2 74 348,7
FINANCIAL, OWNERSHIP AND BUSINESS
a. Bank / Bank 22 853,6 23 728,9 24 412,2 24 713,7 95 708,4 25 543,1 26 104,7
b. Lembaga Keuangan Tanpa Bank 6 297,8 6 609,5 6 896,2 6 975,4 26 778,9 7 437,4 7 856,5
Non Bank Financial Institution
c. Jasa Penunjang Keuangan 469,7 502,9 507,1 531,4 2 011,1 553,9 619,0
Service Allied to Financial
d. Sewa Bangunan / Building Rental 23 319,1 23 852,6 24 560,8 25 664,4 97 396,9 26 501,8 26 744,8
e. Jasa Perusahaan / Business Services 11 162,2 11 545,3 11 912,1 12 606,5 47 226,1 12 966,0 13 023,7
9. JASA - JASA / SERVICES 76 676,3 80 411,2 88 950,6 90 220,8 336 258,9 93 684,2 98 528,8
a. Pemerintahan Umum / General Government 37 098,1 39 772,3 45 768,4 45 160,9 167 799,7 47 738,0 52 244,3
b. Swasta / Private 39 578,2 40 638,9 43 182,2 45 059,9 168 459,2 45 946,2 46 284,5
PRODUK DOMESTIK BRUTO 782 752,9 812 741,1 870 319,8 873 403,0 3 339 216,8 920 203,1 963 862,5
GROSS DOMESTIC PRODUCT
PRODUK DOMESTIK BRUTO TANPA MIGAS 693 086,8 720 889,8 775 708,9 777 354,8 2 967 040,3 826 396,3 865 601,2
GROSS DOMESTIC PRODUCT (EXCLUDING
PETROLEUM AND GAS)
Jumlah 2007
ITotal
I2006
139
(MILIAR / BILLION RUPIAHS )
[8]
II
[7][2] [3]
II IV
2006
IIILapangan Usaha / Industrial Origin
[6][5][4][1]
https:
//www.b
ps.go.id

PENDAPATAN NASIONALNATIONAL INCOME
TABEL : 9.2 PRODUK DOMESTIK BRUTO TRIWULANAN ATAS DASAR HARGA KONSTAN 2000 MENURUT LAPANGAN USAHA
TABLE QUARTERLY GROSS DOMESTIC PRODUCT AT 2000 CONSTANT MARKET PRICES BY INDUSTRIAL ORIGIN
1. PERTANIAN, PETERNAKAN, KEHUTANAN 66 940,8 66 939,8 71 221,8 57 300,4 262 402,8 65 518,4 70 697,6DAN PERIKANAN / AGRICULTURAL, LIVESTOCK
FORESTRY AND FISHERIES
a. Tanaman Bahan Makanan 39 110,1 33 211,9 33 061,5 24 165,1 129 548,6 36 262,9 36 065,5
Farm food crops
b. Tanaman Perkebunan / Non-food Crops 6 269,0 10 919,0 14 626,9 9 503,1 41 318,0 6 852,7 11 206,8
c. Peternakan dan hasil-hasilnya 8 517,5 8 119,3 8 314,9 8 478,5 33 430,2 8 708,5 8 264,8
Livestock and Products
d. Kehutanan / Forestry 3 567,6 4 488,6 4 317,2 4 313,5 16 686,9 3 581,7 4 453,0
e. Perikanan / Fisheries 9 476,6 10 201,0 10 901,3 10 840,2 41 419,1 10 112,6 10 707,5
2. PERTAMBANGAN DAN PENGGALIAN 40 626,7 41 609,4 42 247,6 43 548,0 168 031,7 43 109,1 42 935,8
MINING AND QUARRYING
a. Minyak dan Gas Bumi 23 944,8 24 136,4 23 847,6 23 924,3 95 853,1 23 758,2 23 484,5
Crude Petroleum and Natural Gas
b. Pertambangan Tanpa Migas 12 627,6 13 297,9 14 094,1 15 222,8 55 242,4 14 959,8 14 961,3
Mining Excluding Petroleum and Gas
c. Penggalian / Quarrying 4 054,3 4 175,1 4 305,9 4 400,9 16 936,2 4 391,1 4 490,0
- 1,1
3. INDUSTRI PENGOLAHAN 124 591,1 126 544,7 131 119,6 131 844,9 514 100,3 131 088,8 133 034,1
MANUFACTURING INDUSTRIES
a. Industri Migas 11 841,7 11 729,5 11 736,2 12 543,8 47 851,2 11 773,8 11 787,2
Manufacturing Petroleum and Gas
b. Industri Tanpa Migas / Manufacturing 112 749,4 114 815,2 119 383,4 119 301,1 466 249,1 119 315,0 121 246,9
Excluding Petroleum and Gas
4. LISTRIK, GAS, DAN AIR MINUM 2 947,1 3 034,3 3 111,3 3 158,3 12 251,0 3 187,5 3 343,8
ELECTRICITY, GAS, AND WATER SUPPLY
a. Listrik / Electricity 1 995,1 2 086,3 2 193,9 2 199,4 8 474,7 2 173,8 2 261,7
b. Gas Kota / City Gas 471,2 466,2 432,1 469,4 1 838,9 519,0 584,9
c. Air Bersih / Water Supply 480,8 481,8 485,3 489,5 1 937,4 494,7 497,2
5. BANGUNAN / CONSTRUCTION 26 870,0 27 668,6 28 530,3 29 164,7 112 233,6 29 100,8 29 755,3
Catatan : Dihitung berdasarkan tabel Input Output tahun 2000 Note : Calculated base on the 2000 Input Output table
Jumlah 2007
ITotal
I2006
142
(MILIAR / BILLION RUPIAHS )
II
[7] [8]
Lapangan Usaha / Industrial OriginIVIIIII
2006
[4][3][1] [2] [6][5]
https:
//www.b
ps.go.id

PENDAPATAN NASIONALNATIONAL INCOME
TABEL : 9.2 PRODUK DOMESTIK BRUTO TRIWULANAN ATAS DASAR HARGA KONSTAN 2000 MENURUT LAPANGAN USAHA
TABLE QUARTERLY GROSS DOMESTIC PRODUCT AT 2000 CONSTANT MARKET PRICES BY INDUSTRIAL ORIGIN
(Lanjutan/Continuation )
6. PERDAGANGAN, HOTEL DAN RESTORAN 74 548,8 77 184,1 80 608,7 80 177,1 312 518,7 81 650,5 83 695,9
TRADE, HOTEL AND RESTAURANT
a. Perdagangan Besar dan Eceran 61 241,8 63 677,1 66 824,4 66 101,7 257 845,0 67 440,7 69 279,5
Wholesale and Retail Trade
b. Hotel / Hotel 3 152,5 3 213,2 3 294,2 3 290,6 12 950,5 3 307,9 3 411,4
c. Restoran / Restaurant 10 154,5 10 293,8 10 490,1 10 784,8 41 723,2 10 901,9 11 005,0
7. PENGANGKUTAN DAN KOMUNIKASI 29 054,7 30 367,1 31 930,1 33 457,0 124 808,9 32 820,4 34 538,0
TRANSPORTATION AND COMMUNICATION
a. Pengangkutan / Transportation 16 834,9 17 529,1 18 110,3 18 321,7 70 796,0 16 827,2 17 688,4
b. Komunikasi / Communication 12 219,8 12 838,0 13 819,8 15 135,3 54 012,9 15 993,2 16 849,6
8. KEUANGAN, PERSEWAAN & JASA PERUSAHAAN 41 371,6 42 065,8 42 869,0 43 767,9 170 074,3 44 733,7 45 255,2
FINANCIAL, OWNERSHIP AND BUSINESS
a. Bank / Bank 17 703,4 17 994,4 18 313,6 18 463,0 72 474,4 19 065,1 19 463,2
b. Lembaga Keuangan Tanpa Bank 3 418,4 3 467,5 3 529,3 3 594,0 14 009,2 3 689,9 3 744,9
Non Bank Financial Institution
c. Jasa Penunjang Keuangan 293,1 304,2 300,2 316,0 1 213,5 316,8 339,3
Service Allied to Financial
d. Sewa Bangunan / Building Rental 12 581,5 12 737,2 13 012,6 13 424,0 51 755,3 13 616,6 13 640,5
e. Jasa Perusahaan / Business Services 7 375,2 7 562,5 7 713,3 7 970,9 30 621,9 8 045,3 8 067,3
9. JASA - JASA / SERVICES 41 534,5 42 223,0 43 265,1 43 682,8 170 705,4 44 432,5 45 165,4
a. Pemerintahan Umum / General Government 18 751,3 19 010,4 19 590,4 19 266,3 76 618,4 19 780,9 20 410,2
b. Swasta / Private 22 783,2 23 212,6 23 674,7 24 416,5 94 087,0 24 651,6 24 755,2
PRODUK DOMESTIK BRUTO 448 485,3 457 636,8 474 903,5 466 101,1 1 847 126,7 475 641,7 488 421,1
GROSS DOMESTIC PRODUCT
PRODUK DOMESTIK BRUTO TANPA MIGAS 412 698,8 421 770,9 439 319,7 429 633,0 1 703 422,4 440 109,7 453 149,4
GROSS DOMESTIC PRODUCT (EXCLUDING
PETROLEUM AND GAS)
2006 Jumlah 2007
ITotal
I2006
IV
[7] [8]
(MILIAR / BILLION RUPIAHS )
Lapangan Usaha / Industrial OriginII
145
[5] [6]
II
[1] [2] [3] [4]
III
https:
//www.b
ps.go.id

PENDAPATAN NASIONALNATIONAL INCOME
TABEL : 9.1 PRODUK DOMESTIK BRUTO TRIWULANAN ATAS DASAR HARGA BERLAKU MENURUT LAPANGAN USAHA
TABLE QUARTERLY GROSS DOMESTIC PRODUCT AT CURRENT MARKET PRICES BY INDUSTRIAL ORIGIN
(Lanjutan/Continuation )
1. PERTANIAN, PETERNAKAN, KEHUTANAN 155 196,3 126 024,9 541 931,5 162 050,6 179 055,9 208 301,0 166 657,8DAN PERIKANAN / AGRICULTURAL, LIVESTOCK
FORESTRY AND FISHERIES
a. Tanaman Bahan Makanan 75 256,8 52 547,7 265 090,9 91 614,4 90 933,7 99 493,5 67 753,4
Farm food crops
b. Tanaman Perkebunan / Non-food Crops 28 838,0 20 062,6 81 664,0 16 180,7 28 156,7 38 387,3 23 244,6
c. Peternakan dan hasil-hasilnya 15 462,5 17 036,2 61 325,2 18 076,4 18 496,5 21 545,4 24 558,1
Livestock and Products
d. Kehutanan / Forestry 9 503,9 9 226,5 36 154,1 7 937,2 10 028,0 11 206,9 11 203,0
e. Perikanan / Fisheries 26 135,1 27 151,9 97 697,3 28 241,9 31 441,0 37 667,9 39 898,7
2. PERTAMBANGAN DAN PENGGALIAN 113 564,0 117 765,4 440 609,6 122 566,9 137 708,0 141 590,1 138 740,3
MINING AND QUARRYING
a. Minyak dan Gas Bumi 62 633,4 64 294,5 234 162,4 66 060,0 75 664,4 74 060,7 66 335,3
Crude Petroleum and Natural Gas
b. Pertambangan Tanpa Migas 39 141,2 40 635,7 160 267,1 43 047,1 47 166,4 50 484,0 54 961,6
Mining Excluding Petroleum and Gas
c. Penggalian / Quarrying 11 789,4 12 835,2 46 180,1 13 459,8 14 877,2 17 045,4 17 443,4
3. INDUSTRI PENGOLAHAN 276 026,0 283 763,8 1 068 653,9 304 200,7 335 153,6 372 018,1 369 340,7
MANUFACTURING INDUSTRIES
a. Industri Migas 47 685,8 49 804,9 182 324,3 52 600,3 59 285,7 64 395,8 65 761,2
Manufacturing Petroleum and Gas
b. Industri Tanpa Migas / Manufacturing 228 340,2 233 958,9 886 329,6 251 600,4 275 867,9 307 622,3 303 579,5
Excluding Petroleum and Gas
4. LISTRIK, GAS, DAN AIR MINUM 8 976,8 9 209,2 34 723,8 9 503,9 10 181,8 10 513,6 10 646,8
ELECTRICITY, GAS, AND WATER SUPPLY
a. Listrik / Electricity 5 950,0 5 963,6 23 051,5 6 015,3 6 457,7 6 638,3 6 663,1
b. Gas Kota / City Gas 1 820,1 2 000,6 6 912,0 2 227,5 2 434,4 2 563,0 2 656,9
c. Air Bersih / Water Supply 1 206,7 1 245,0 4 760,3 1 261,1 1 289,7 1 312,3 1 326,8
5. BANGUNAN / CONSTRUCTION 78 044,5 84 957,0 304 996,8 89 344,3 100 796,1 113 416,6 116 085,4
2008x)
I IV
2007 JumlahTotal2007
(MILIAR / BILLION RUPIAHS )
[14] [15]
137
IIIIV
[13][12]
IILapangan Usaha / Industrial Origin
[1] [11]
III
[10][9]
https:
//www.b
ps.go.id

PENDAPATAN NASIONALNATIONAL INCOME
TABEL : 9.1 PRODUK DOMESTIK BRUTO TRIWULANAN ATAS DASAR HARGA BERLAKU MENURUT LAPANGAN USAHA
TABLE QUARTERLY GROSS DOMESTIC PRODUCT AT CURRENT MARKET PRICES BY INDUSTRIAL ORIGIN
(Lanjutan/Continuation )
6. PERDAGANGAN, HOTEL DAN RESTORAN 154 628,8 155 729,0 592 304,1 156 505,3 168 593,4 184 130,8 182 265,2
TRADE, HOTEL AND RESTAURANT
a. Perdagangan Besar dan Eceran 123 409,8 123 311,7 468 734,3 123 235,5 134 311,8 148 386,7 145 416,9
Wholesale and Retail Trade
b. Hotel / Hotel 4 387,6 4 429,7 17 320,4 4 534,4 4 730,1 4 792,5 4 843,3
c. Restoran / Restaurant 26 831,4 27 987,6 106 249,4 28 735,4 29 551,5 30 951,6 32 005,0
7. PENGANGKUTAN DAN KOMUNIKASI 67 860,3 71 235,3 264 263,3 72 166,0 73 778,6 81 200,4 85 045,2
TRANSPORTATION AND COMMUNICATION
a. Pengangkutan / Transportation 38 774,6 40 003,2 149 973,5 38 882,5 40 539,6 45 324,5 46 500,2
b. Komunikasi / Communication 29 085,7 31 232,1 114 289,8 33 283,5 33 239,0 35 875,9 38 545,0
8. KEUANGAN, PERSEWAAN & JASA PERUSAHAAN 76 890,3 80 972,3 305 213,5 85 726,0 90 480,5 94 527,8 97 395,4
FINANCIAL, OWNERSHIP AND BUSINESS
a. Bank / Bank 26 867,4 27 021,6 105 536,8 29 566,4 31 269,5 31 834,7 32 844,8
b. Lembaga Keuangan Tanpa Bank 8 300,3 8 987,3 32 581,5 9 544,5 10 016,7 10 947,2 11 244,8
Non Bank Financial Institution
c. Jasa Penunjang Keuangan 644,2 673,0 2 490,1 694,3 726,4 687,9 698,5
Service Allied to Financial
d. Sewa Bangunan / Building Rental 27 437,6 29 555,7 110 239,9 30 592,7 32 409,8 34 115,9 34 905,2
e. Jasa Perusahaan / Business Services 13 640,8 14 734,7 54 365,2 15 328,1 16 058,1 16 942,1 17 702,1
9. JASA - JASA / SERVICES 100 221,7 105 762,0 398 196,7 108 790,6 125 619,6 122 373,0 124 886,7
a. Pemerintahan Umum / General Government 51 240,6 54 121,0 205 343,9 56 126,1 71 221,4 64 921,6 65 278,6
b. Swasta / Private 48 981,1 51 641,0 192 852,8 52 664,5 54 398,2 57 451,4 59 608,1
PRODUK DOMESTIK BRUTO 1 031 408,7 1 035 418,9 3 950 893,2 1 110 854,3 1 221 367,5 1 328 071,4 1 291 063,5
GROSS DOMESTIC PRODUCT
PRODUK DOMESTIK BRUTO TANPA MIGAS 921 089,5 921 319,5 3 534 406,5 992 194,0 1 086 417,4 1 189 614,9 1 158 967,0
GROSS DOMESTIC PRODUCT (EXCLUDING
PETROLEUM AND GAS)
I2007
IV
2007 Jumlah 2008x)
(MILIAR / BILLION RUPIAHS )
IV III
[13]
140
II
[14] [15][12]
Lapangan Usaha / Industrial Origin
[9]
Total
[11][1]
III
[10]
https:
//www.b
ps.go.id
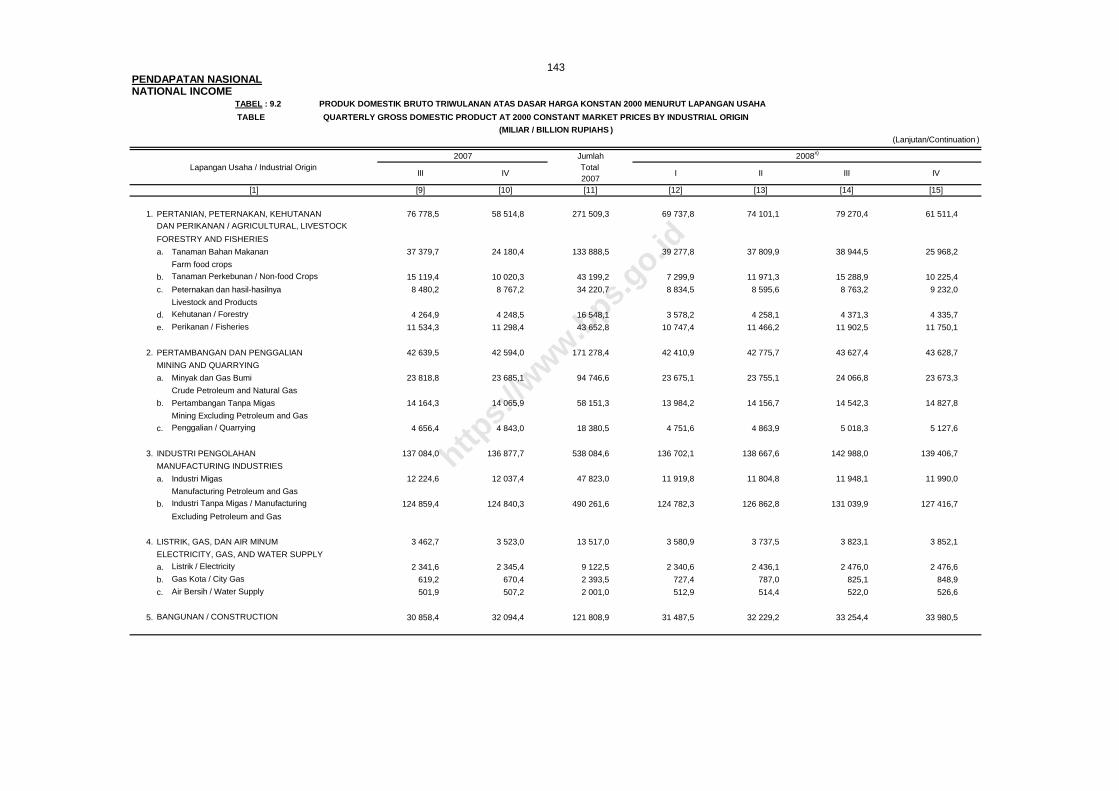
PENDAPATAN NASIONALNATIONAL INCOME
TABEL : 9.2 PRODUK DOMESTIK BRUTO TRIWULANAN ATAS DASAR HARGA KONSTAN 2000 MENURUT LAPANGAN USAHA
TABLE QUARTERLY GROSS DOMESTIC PRODUCT AT 2000 CONSTANT MARKET PRICES BY INDUSTRIAL ORIGIN
(Lanjutan/Continuation )
1. PERTANIAN, PETERNAKAN, KEHUTANAN 76 778,5 58 514,8 271 509,3 69 737,8 74 101,1 79 270,4 61 511,4DAN PERIKANAN / AGRICULTURAL, LIVESTOCK
FORESTRY AND FISHERIES
a. Tanaman Bahan Makanan 37 379,7 24 180,4 133 888,5 39 277,8 37 809,9 38 944,5 25 968,2
Farm food crops
b. Tanaman Perkebunan / Non-food Crops 15 119,4 10 020,3 43 199,2 7 299,9 11 971,3 15 288,9 10 225,4
c. Peternakan dan hasil-hasilnya 8 480,2 8 767,2 34 220,7 8 834,5 8 595,6 8 763,2 9 232,0
Livestock and Products
d. Kehutanan / Forestry 4 264,9 4 248,5 16 548,1 3 578,2 4 258,1 4 371,3 4 335,7
e. Perikanan / Fisheries 11 534,3 11 298,4 43 652,8 10 747,4 11 466,2 11 902,5 11 750,1
2. PERTAMBANGAN DAN PENGGALIAN 42 639,5 42 594,0 171 278,4 42 410,9 42 775,7 43 627,4 43 628,7
MINING AND QUARRYING
a. Minyak dan Gas Bumi 23 818,8 23 685,1 94 746,6 23 675,1 23 755,1 24 066,8 23 673,3
Crude Petroleum and Natural Gas
b. Pertambangan Tanpa Migas 14 164,3 14 065,9 58 151,3 13 984,2 14 156,7 14 542,3 14 827,8
Mining Excluding Petroleum and Gas
c. Penggalian / Quarrying 4 656,4 4 843,0 18 380,5 4 751,6 4 863,9 5 018,3 5 127,6
3. INDUSTRI PENGOLAHAN 137 084,0 136 877,7 538 084,6 136 702,1 138 667,6 142 988,0 139 406,7
MANUFACTURING INDUSTRIES
a. Industri Migas 12 224,6 12 037,4 47 823,0 11 919,8 11 804,8 11 948,1 11 990,0
Manufacturing Petroleum and Gas
b. Industri Tanpa Migas / Manufacturing 124 859,4 124 840,3 490 261,6 124 782,3 126 862,8 131 039,9 127 416,7
Excluding Petroleum and Gas
4. LISTRIK, GAS, DAN AIR MINUM 3 462,7 3 523,0 13 517,0 3 580,9 3 737,5 3 823,1 3 852,1
ELECTRICITY, GAS, AND WATER SUPPLY
a. Listrik / Electricity 2 341,6 2 345,4 9 122,5 2 340,6 2 436,1 2 476,0 2 476,6
b. Gas Kota / City Gas 619,2 670,4 2 393,5 727,4 787,0 825,1 848,9
c. Air Bersih / Water Supply 501,9 507,2 2 001,0 512,9 514,4 522,0 526,6
5. BANGUNAN / CONSTRUCTION 30 858,4 32 094,4 121 808,9 31 487,5 32 229,2 33 254,4 33 980,5
Jumlah 2008x)
TotalI
2007
(MILIAR / BILLION RUPIAHS )
[10]
143
[14] [15]
III IV
[12]
II
[13][1] [9] [11]
IVIIILapangan Usaha / Industrial Origin
2007
https:
//www.b
ps.go.id

PENDAPATAN NASIONALNATIONAL INCOME
TABEL : 9.2 PRODUK DOMESTIK BRUTO TRIWULANAN ATAS DASAR HARGA KONSTAN 2000 MENURUT LAPANGAN USAHA
TABLE QUARTERLY GROSS DOMESTIC PRODUCT AT 2000 CONSTANT MARKET PRICES BY INDUSTRIAL ORIGIN
(Lanjutan/Continuation )
6. PERDAGANGAN, HOTEL DAN RESTORAN 87 890,9 87 199,8 340 437,1 87 159,9 90 120,1 94 560,0 91 973,5
TRADE, HOTEL AND RESTAURANT
a. Perdagangan Besar dan Eceran 73 197,8 72 197,8 282 115,8 72 067,8 74 860,3 78 920,7 76 087,8
Wholesale and Retail Trade
b. Hotel / Hotel 3 464,9 3 461,4 13 645,6 3 483,5 3 568,9 3 610,3 3 598,8
c. Restoran / Restaurant 11 228,2 11 540,6 44 675,7 11 608,6 11 690,9 12 029,0 12 286,9
7. PENGANGKUTAN DAN KOMUNIKASI 36 652,7 38 315,6 142 326,7 38 767,5 40 261,0 42 385,4 44 491,6
TRANSPORTATION AND COMMUNICATION
a. Pengangkutan / Transportation 18 959,8 19 315,7 72 791,1 18 518,0 18 378,2 18 762,0 19 128,7
b. Komunikasi / Communication 17 692,9 18 999,9 69 535,6 20 249,5 21 882,8 23 623,4 25 362,9
8. KEUANGAN, PERSEWAAN & JASA PERUSAHAAN 46 116,7 47 553,7 183 659,3 48 465,8 49 172,3 50 080,9 51 080,6
FINANCIAL, OWNERSHIP AND BUSINESS
a. Bank / Bank 19 879,5 19 833,2 78 241,0 20 498,2 20 848,5 21 185,0 21 507,8
b. Lembaga Keuangan Tanpa Bank 3 816,4 3 898,6 15 149,8 3 988,4 4 062,5 4 177,0 4 290,2
Non Bank Financial Institution
c. Jasa Penunjang Keuangan 340,3 334,6 1 331,0 331,9 359,1 339,4 345,9
Service Allied to Financial
d. Sewa Bangunan / Building Rental 13 818,4 14 743,6 55 819,1 14 848,1 15 075,8 15 325,3 15 526,2
e. Jasa Perusahaan / Business Services 8 262,1 8 743,7 33 118,4 8 799,2 8 826,4 9 054,2 9 410,5
9. JASA - JASA / SERVICES 45 449,6 46 658,5 181 706,0 46 886,0 48 105,3 48 609,4 49 423,6
a. Pemerintahan Umum / General Government 20 270,0 20 317,1 80 778,2 20 442,9 21 390,6 21 185,4 21 359,0
b. Swasta / Private 25 179,6 26 341,4 100 927,8 26 443,1 26 714,7 27 424,0 28 064,6
PRODUK DOMESTIK BRUTO 506 933,0 493 331,5 1 964 327,3 505 198,4 519 169,8 538 599,0 519 348,7
GROSS DOMESTIC PRODUCT
PRODUK DOMESTIK BRUTO TANPA MIGAS 470 889,6 457 609,0 1 821 757,7 469 603,5 483 609,9 502 584,1 483 685,4
GROSS DOMESTIC PRODUCT (EXCLUDING
PETROLEUM AND GAS)
2008x)
(MILIAR / BILLION RUPIAHS )
146
[15][13][12]
I
Jumlah
[14]
Total2007
II III IV
[10]
Lapangan Usaha / Industrial Origin
[11][1]
IV
[9]
III
2007
https:
//www.b
ps.go.id

PENDAPATAN NASIONALNATIONAL INCOME
TABEL : 9.1 PRODUK DOMESTIK BRUTO TRIWULANAN ATAS DASAR HARGA BERLAKU MENURUT LAPANGAN USAHA
TABLE QUARTERLY GROSS DOMESTIC PRODUCT AT CURRENT MARKET PRICES BY INDUSTRIAL ORIGIN
(Lanjutan/Continuation )
1. PERTANIAN, PETERNAKAN, KEHUTANAN 716 065,3 205 104,6 215 711,6 238 827,9 198 607,9 858 252,0 239 386,8DAN PERIKANAN / AGRICULTURAL, LIVESTOCK
FORESTRY AND FISHERIES
a. Tanaman Bahan Makanan 349 795,0 113 349,3 106 042,2 115 858,0 83 714,4 418 963,9 132 073,6
Farm food crops
b. Tanaman Perkebunan / Non-food Crops 105 969,3 17 563,1 29 312,6 38 132,0 27 514,4 112 522,1 22 891,9
c. Peternakan dan hasil-hasilnya 82 676,4 24 218,0 24 950,2 26 422,2 28 449,6 104 040,0 27 908,5
Livestock and Products
d. Kehutanan / Forestry 40 375,1 9 583,2 11 653,0 11 832,9 11 883,0 44 952,1 10 068,2
e. Perikanan / Fisheries 137 249,5 40 391,0 43 753,6 46 582,8 47 046,5 177 773,9 46 444,6
2. PERTAMBANGAN DAN PENGGALIAN 540 605,3 131 216,9 141 965,7 155 013,3 163 335,8 591 531,7 168 102,7
MINING AND QUARRYING
a. Minyak dan Gas Bumi 282 120,4 55 222,4 60 186,8 66 879,5 70 934,4 253 223,1 69 256,2
Crude Petroleum and Natural Gas
b. Pertambangan Tanpa Migas 195 659,1 56 882,6 61 397,9 66 398,3 70 085,3 254 764,1 76 312,3
Mining Excluding Petroleum and Gas
c. Penggalian / Quarrying 62 825,8 19 111,9 20 381,0 21 735,5 22 316,1 83 544,5 22 534,2
3. INDUSTRI PENGOLAHAN 1 380 713,1 355 313,4 363 124,1 380 084,7 382 383,2 1 480 905,4 380 956,7
MANUFACTURING INDUSTRIES
a. Industri Migas 242 043,0 50 724,6 50 926,2 56 501,2 55 554,5 213 706,5 54 233,1
Manufacturing Petroleum and Gas
b. Industri Tanpa Migas / Manufacturing 1 138 670,1 304 588,8 312 197,9 323 583,5 326 828,7 1 267 198,9 326 723,6
Excluding Petroleum and Gas
4. LISTRIK, GAS, DAN AIR MINUM 40 846,1 11 183,5 11 785,6 11 861,5 11 992,5 46 823,1 11 710,4
ELECTRICITY, GAS, AND WATER SUPPLY
a. Listrik / Electricity 25 774,4 6 621,6 7 118,8 7 171,2 7 172,9 28 084,5 6 654,9
b. Gas Kota / City Gas 9 881,8 3 194,5 3 269,7 3 283,6 3 382,3 13 130,1 3 598,3
c. Air Bersih / Water Supply 5 189,9 1 367,4 1 397,1 1 406,7 1 437,3 5 608,5 1 457,2
5. BANGUNAN / CONSTRUCTION 419 642,4 126 918,1 135 361,6 144 069,4 148 633,1 554 982,2 150 428,5
2009xx)
II
(MILIAR / BILLION RUPIAHS )
II
Jumlah
Total
2009xx)
Total
138
2010xxx)
[21] [22]
Jumlah
IV
[16]
III
[19] [20]2008x)
Lapangan Usaha / Industrial Origin
[1] [18][17]
https:
//www.b
ps.go.id

PENDAPATAN NASIONALNATIONAL INCOME
TABEL : 9.1 PRODUK DOMESTIK BRUTO TRIWULANAN ATAS DASAR HARGA BERLAKU MENURUT LAPANGAN USAHA
TABLE QUARTERLY GROSS DOMESTIC PRODUCT AT CURRENT MARKET PRICES BY INDUSTRIAL ORIGIN
(Lanjutan/Continuation )
6. PERDAGANGAN, HOTEL DAN RESTORAN 691 494,7 175 698,0 180 657,0 192 111,9 202 138,1 750 605,0 207 982,1
TRADE, HOTEL AND RESTAURANT
a. Perdagangan Besar dan Eceran 551 350,9 137 148,9 141 561,5 152 465,1 161 702,1 592 877,6 166 677,7
Wholesale and Retail Trade
b. Hotel / Hotel 18 900,3 4 944,6 5 047,5 5 094,7 5 112,2 20 199,0 5 060,6
c. Restoran / Restaurant 121 243,5 33 604,5 34 048,0 34 552,1 35 323,8 137 528,4 36 243,8
7. PENGANGKUTAN DAN KOMUNIKASI 312 190,2 83 818,4 86 049,1 90 642,2 91 897,5 352 407,2 93 391,7
TRANSPORTATION AND COMMUNICATION
a. Pengangkutan / Transportation 171 246,8 43 717,0 44 026,2 46 489,2 47 384,0 181 616,4 46 881,7
b. Komunikasi / Communication 140 943,4 40 101,4 42 022,9 44 153,0 44 513,5 170 790,8 46 510,0
8. KEUANGAN, PERSEWAAN & JASA PERUSAHAAN 368 129,7 98 742,8 99 747,0 102 050,5 103 576,1 404 116,4 107 600,2
FINANCIAL, OWNERSHIP AND BUSINESS
a. Bank / Bank 125 515,4 32 889,5 32 753,6 33 085,3 33 457,6 132 186,0 36 379,1
b. Lembaga Keuangan Tanpa Bank 41 753,2 11 560,2 11 849,4 12 171,2 12 378,4 47 959,2 12 701,2
Non Bank Financial Institution
c. Jasa Penunjang Keuangan 2 807,1 712,5 814,9 826,5 876,8 3 230,7 884,6
Service Allied to Financial
d. Sewa Bangunan / Building Rental 132 023,6 35 101,6 35 763,0 36 815,7 37 580,4 145 260,7 37 958,7
e. Jasa Perusahaan / Business Services 66 030,4 18 479,0 18 566,1 19 151,8 19 282,9 75 479,8 19 676,6
9. JASA - JASA / SERVICES 481 669,9 129 123,9 151 303,3 145 140,9 148 250,6 573 818,7 139 163,9
a. Pemerintahan Umum / General Government 257 547,7 67 849,7 89 200,8 79 968,6 81 561,7 318 580,8 70 438,1
b. Swasta / Private 224 122,2 61 274,2 62 102,5 65 172,3 66 688,9 255 237,9 68 725,8
PRODUK DOMESTIK BRUTO 4 951 356,7 1 317 119,6 1 385 705,0 1 459 802,3 1 450 814,8 5 613 441,7 1 498 723,0
GROSS DOMESTIC PRODUCT
PRODUK DOMESTIK BRUTO TANPA MIGAS 4 427 193,3 1 211 172,6 1 274 592,0 1 336 421,6 1 324 325,9 5 146 512,1 1 375 233,7
GROSS DOMESTIC PRODUCT (EXCLUDING
PETROLEUM AND GAS)
2009xx) Jumlah 2010xxx)
TotalI
2009xx)
(MILIAR / BILLION RUPIAHS )
II
141
[21] [22]
Lapangan Usaha / Industrial Origin
[1] [16] [17] [18] [20][19]
IVIIITotal
I
Jumlah
2008x)
https:
//www.b
ps.go.id

PENDAPATAN NASIONALNATIONAL INCOME
TABEL : 9.2 PRODUK DOMESTIK BRUTO TRIWULANAN ATAS DASAR HARGA KONSTAN 2000 MENURUT LAPANGAN USAHA
TABLE QUARTERLY GROSS DOMESTIC PRODUCT AT 2000 CONSTANT MARKET PRICES BY INDUSTRIAL ORIGIN
(Lanjutan/Continuation )
1. PERTANIAN, PETERNAKAN, KEHUTANAN 284 620,7 73 858,7 76 285,1 81 876,2 64 349,3 296 369,3 75 992,8DAN PERIKANAN / AGRICULTURAL, LIVESTOCK
FORESTRY AND FISHERIES
a. Tanaman Bahan Makanan 142 000,4 42 249,9 38 459,8 40 277,9 27 704,0 148 691,6 42 931,2
Farm food crops
b. Tanaman Perkebunan / Non-food Crops 44 785,5 7 651,2 12 279,5 15 511,0 10 445,4 45 887,1 8 067,6
c. Peternakan dan hasil-hasilnya 35 425,3 8 968,5 9 018,9 9 209,5 9 546,7 36 743,6 9 266,1
Livestock and Products
d. Kehutanan / Forestry 16 543,3 3 619,3 4 345,5 4 432,5 4 396,5 16 793,8 3 677,8
e. Perikanan / Fisheries 45 866,2 11 369,8 12 181,4 12 445,3 12 256,7 48 253,2 12 050,1
2. PERTAMBANGAN DAN PENGGALIAN 172 442,7 43 515,8 44 218,9 46 332,4 45 907,8 179 974,9 45 054,7
MINING AND QUARRYING
a. Minyak dan Gas Bumi 95 170,3 23 667,7 23 561,6 24 006,7 24 003,2 95 239,2 23 624,7
Crude Petroleum and Natural Gas
b. Pertambangan Tanpa Migas 57 511,0 14 800,1 15 498,3 16 896,7 16 388,4 63 583,5 16 037,2
Mining Excluding Petroleum and Gas
c. Penggalian / Quarrying 19 761,4 5 048,0 5 159,0 5 429,0 5 516,2 21 152,2 5 392,8
3. INDUSTRI PENGOLAHAN 557 764,4 138 749,7 140 787,6 144 812,7 145 200,8 569 550,8 143 728,0
MANUFACTURING INDUSTRIES
a. Industri Migas 47 662,7 11 658,1 11 624,7 11 751,9 11 576,5 46 611,2 11 541,8
Manufacturing Petroleum and Gas
b. Industri Tanpa Migas / Manufacturing 510 101,7 127 091,6 129 162,9 133 060,8 133 624,3 522 939,6 132 186,2
Excluding Petroleum and Gas
4. LISTRIK, GAS, DAN AIR MINUM 14 993,6 3 983,6 4 308,8 4 376,4 4 391,0 17 059,8 4 270,3
ELECTRICITY, GAS, AND WATER SUPPLY
a. Listrik / Electricity 9 729,3 2 446,5 2 653,0 2 664,8 2 641,8 10 406,1 2 536,4
b. Gas Kota / City Gas 3 188,4 1 003,9 1 120,1 1 170,3 1 202,3 4 496,6 1 180,7
c. Air Bersih / Water Supply 2 075,9 533,2 535,7 541,3 546,9 2 157,1 553,2
5. BANGUNAN / CONSTRUCTION 130 951,6 33 455,3 34 192,3 35 825,9 36 710,7 140 184,2 35 886,8
2008x) 2009xx)
[22]
Jumlah
TotalI
(MILIAR / BILLION RUPIAHS )
2010xxx)
144
[21][1] [16]
Jumlah
[18] [19]
II
[17]
IIII IV
[20]
Lapangan Usaha / Industrial Origin
2009xx)
Total
https:
//www.b
ps.go.id

PENDAPATAN NASIONALNATIONAL INCOME
TABEL : 9.2 PRODUK DOMESTIK BRUTO TRIWULANAN ATAS DASAR HARGA KONSTAN 2000 MENURUT LAPANGAN USAHA
TABLE QUARTERLY GROSS DOMESTIC PRODUCT AT 2000 CONSTANT MARKET PRICES BY INDUSTRIAL ORIGIN
(Lanjutan/Continuation )
6. PERDAGANGAN, HOTEL DAN RESTORAN 363 813,5 87 705,7 90 098,3 94 343,4 95 811,4 367 958,8 95 855,2
TRADE, HOTEL AND RESTAURANT
a. Perdagangan Besar dan Eceran 301 936,6 71 451,7 73 658,1 77 725,9 79 147,8 301 983,5 79 167,5
Wholesale and Retail Trade
b. Hotel / Hotel 14 261,5 3 610,9 3 690,6 3 732,8 3 740,6 14 774,9 3 734,7
c. Restoran / Restaurant 47 615,4 12 643,1 12 749,6 12 884,7 12 923,0 51 200,4 12 953,0
7. PENGANGKUTAN DAN KOMUNIKASI 165 905,5 45 271,6 47 118,3 49 356,6 49 927,5 191 674,0 50 664,8
TRANSPORTATION AND COMMUNICATION
a. Pengangkutan / Transportation 74 786,9 18 891,5 19 418,3 20 144,2 20 418,9 78 872,9 19 792,9
b. Komunikasi / Communication 91 118,6 26 380,1 27 700,0 29 212,4 29 508,6 112 801,1 30 871,9
8. KEUANGAN, PERSEWAAN & JASA PERUSAHAAN 198 799,6 51 498,8 51 791,4 52 534,4 53 007,6 208 832,2 54 327,4
FINANCIAL, OWNERSHIP AND BUSINESS
a. Bank / Bank 84 039,5 21 474,6 21 353,1 21 521,0 21 708,8 86 057,5 22 793,5
b. Lembaga Keuangan Tanpa Bank 16 518,1 4 342,3 4 409,1 4 488,9 4 534,8 17 775,1 4 612,3
Non Bank Financial Institution
c. Jasa Penunjang Keuangan 1 376,3 345,4 377,3 378,1 371,9 1 472,7 371,7
Service Allied to Financial
d. Sewa Bangunan / Building Rental 60 775,4 15 548,2 15 801,7 16 190,7 16 417,0 63 957,6 16 471,9
e. Jasa Perusahaan / Business Services 36 090,3 9 788,3 9 850,2 9 955,7 9 975,1 39 569,3 10 078,0
9. JASA - JASA / SERVICES 193 024,3 50 026,5 51 562,8 51 545,0 52 237,2 205 371,5 52 336,8
a. Pemerintahan Umum / General Government 84 377,9 21 480,5 22 748,2 22 053,6 22 400,9 88 683,2 21 926,2
b. Swasta / Private 108 646,4 28 546,0 28 814,6 29 491,4 29 836,3 116 688,3 30 410,6
PRODUK DOMESTIK BRUTO 2 082 315,9 528 065,7 540 363,5 561 003,0 547 543,3 2 176 975,5 558 116,8
GROSS DOMESTIC PRODUCT
PRODUK DOMESTIK BRUTO TANPA MIGAS 1 939 482,9 492 739,9 505 177,2 525 244,4 511 963,6 2 035 125,1 522 950,3
GROSS DOMESTIC PRODUCT (EXCLUDING
PETROLEUM AND GAS)
TotalI
2008x) 2009xx)II III
2009xx) Jumlah
[21] [22]
147
IV
(MILIAR / BILLION RUPIAHS )
2010xxx)Jumlah
[20][16] [17][1]
Lapangan Usaha / Industrial Origin
[18] [19]
TotalI
https:
//www.b
ps.go.id
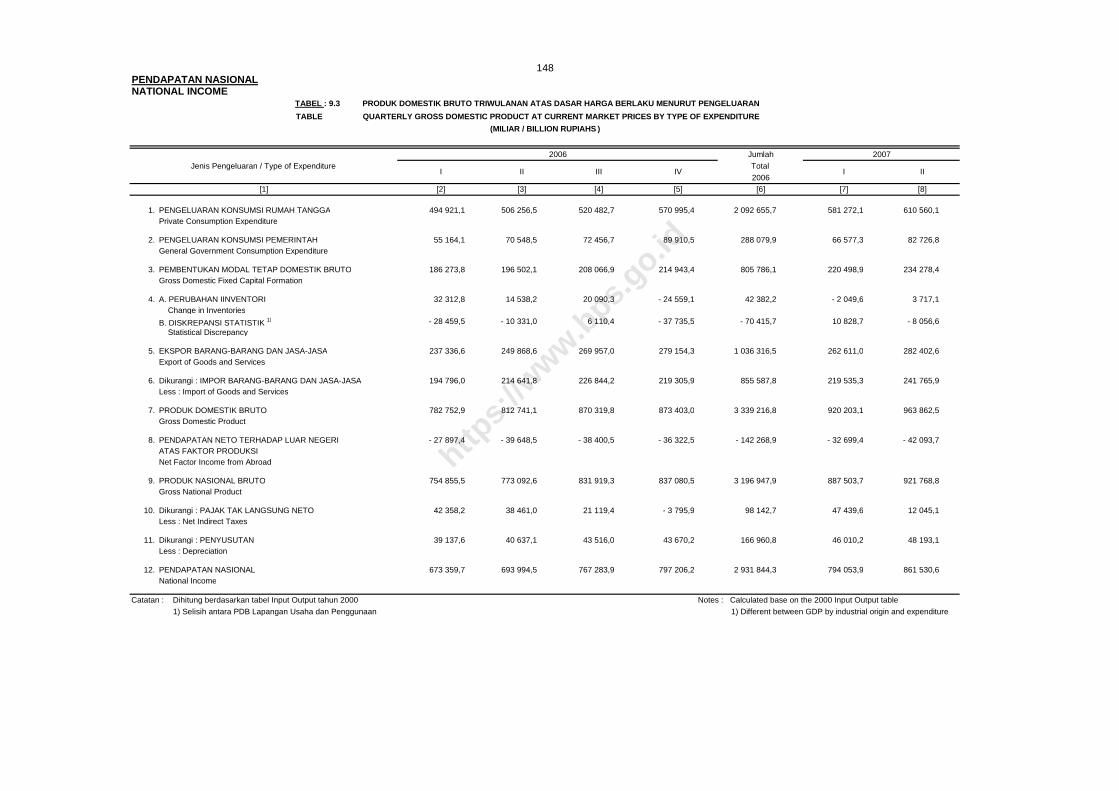
PENDAPATAN NASIONALNATIONAL INCOME
TABEL : 9.3 PRODUK DOMESTIK BRUTO TRIWULANAN ATAS DASAR HARGA BERLAKU MENURUT PENGELUARAN
TABLE QUARTERLY GROSS DOMESTIC PRODUCT AT CURRENT MARKET PRICES BY TYPE OF EXPENDITURE
1. PENGELUARAN KONSUMSI RUMAH TANGGA 494 921,1 506 256,5 520 482,7 570 995,4 2 092 655,7 581 272,1 610 560,1Private Consumption Expenditure
2. PENGELUARAN KONSUMSI PEMERINTAH 55 164,1 70 548,5 72 456,7 89 910,5 288 079,9 66 577,3 82 726,8General Government Consumption Expenditure
3. PEMBENTUKAN MODAL TETAP DOMESTIK BRUTO 186 273,8 196 502,1 208 066,9 214 943,4 805 786,1 220 498,9 234 278,4Gross Domestic Fixed Capital Formation
4. A. PERUBAHAN IINVENTORI 32 312,8 14 538,2 20 090,3 - 24 559,1 42 382,2 - 2 049,6 3 717,1 Change in Inventories
B. DISKREPANSI STATISTIK 1) - 28 459,5 - 10 331,0 6 110,4 - 37 735,5 - 70 415,7 10 828,7 - 8 056,6 Statistical Discrepancy
5. EKSPOR BARANG-BARANG DAN JASA-JASA 237 336,6 249 868,6 269 957,0 279 154,3 1 036 316,5 262 611,0 282 402,6
Export of Goods and Services
6. Dikurangi : IMPOR BARANG-BARANG DAN JASA-JASA 194 796,0 214 641,8 226 844,2 219 305,9 855 587,8 219 535,3 241 765,9Less : Import of Goods and Services
7. PRODUK DOMESTIK BRUTO 782 752,9 812 741,1 870 319,8 873 403,0 3 339 216,8 920 203,1 963 862,5Gross Domestic Product
8. PENDAPATAN NETO TERHADAP LUAR NEGERI - 27 897,4 - 39 648,5 - 38 400,5 - 36 322,5 - 142 268,9 - 32 699,4 - 42 093,7ATAS FAKTOR PRODUKSINet Factor Income from Abroad
9. PRODUK NASIONAL BRUTO 754 855,5 773 092,6 831 919,3 837 080,5 3 196 947,9 887 503,7 921 768,8Gross National Product
10. Dikurangi : PAJAK TAK LANGSUNG NETO 42 358,2 38 461,0 21 119,4 - 3 795,9 98 142,7 47 439,6 12 045,1Less : Net Indirect Taxes
11. Dikurangi : PENYUSUTAN 39 137,6 40 637,1 43 516,0 43 670,2 166 960,8 46 010,2 48 193,1Less : Depreciation
12. PENDAPATAN NASIONAL 673 359,7 693 994,5 767 283,9 797 206,2 2 931 844,3 794 053,9 861 530,6National Income
Catatan : Dihitung berdasarkan tabel Input Output tahun 2000 Notes : Calculated base on the 2000 Input Output table
1) Selisih antara PDB Lapangan Usaha dan Penggunaan 1) Different between GDP by industrial origin and expenditure
[8]
II II
[7]
I2006
[3] [6]
148
2006
(MILIAR / BILLION RUPIAHS )
Jumlah 2007
ITotalJenis Pengeluaran / Type of Expenditure
[5]
IVIII
[1] [2] [4]
https:
//www.b
ps.go.id

PENDAPATAN NASIONALNATIONAL INCOME
TABEL : 9.4 PRODUK DOMESTIK BRUTO TRIWULANAN ATAS DASAR HARGA KONSTAN 2000 MENURUT PENGELUARAN
TABLE QUARTERLY GROSS DOMESTIC PRODUCT AT 2000 CONSTANT MARKET PRICES BY TYPE OF EXPENDITURE
1. PENGELUARAN KONSUMSI RUMAH TANGGA 262 953,4 266 693,0 271 122,6 276 159,1 1 076 928,1 275 220,1 279 248,4Private Consumption Expenditure
2. PENGELUARAN KONSUMSI PEMERINTAH 29 909,8 37 102,5 35 237,2 45 314,2 147 563,7 31 021,7 38 522,1General Government Consumption Expenditure
3. PEMBENTUKAN MODAL TETAP DOMESTIK BRUTO 95 674,2 100 265,3 103 351,4 104 428,3 403 719,2 102 896,7 107 789,4Gross Domestic Fixed Capital Formation
4. A. PERUBAHAN IINVENTORI 22 178,0 9 451,7 12 973,8 - 15 576,8 29 026,7 - 1 132,5 1 990,6 Change in Inventories
B. DISKREPANSI STATISTIK 1) - 7 771,8 5 951,7 13 940,0 4 118,0 16 237,9 17 979,9 12 062,8 Statistical Discrepancy
5. EKSPOR BARANG-BARANG DAN JASA-JASA 206 730,1 212 898,2 221 837,2 226 790,9 868 256,5 224 553,5 234 934,5
Export of Goods and Services
6. Dikurangi : IMPOR BARANG-BARANG DAN JASA-JASA 161 188,5 174 725,6 183 558,7 175 132,6 694 605,3 174 897,7 186 126,7Less : Import of Goods and Services
7. PRODUK DOMESTIK BRUTO 448 485,3 457 636,8 474 903,5 466 101,1 1 847 126,7 475 641,7 488 421,1Gross Domestic Product
8. PENDAPATAN NETO TERHADAP LUAR NEGERI - 22 260,0 - 31 490,0 - 30 585,5 - 29 522,0 - 113 857,5 - 26 053,8 - 31 860,9ATAS FAKTOR PRODUKSINet Factor Income from Abroad
9. PRODUK NASIONAL BRUTO 426 225,3 426 146,8 444 318,0 436 579,1 1 733 269,2 449 587,9 456 560,2Gross National Product
10. Dikurangi : PAJAK TAK LANGSUNG NETO 24 269,5 21 656,6 11 524,1 - 2 025,7 55 424,5 24 521,0 6 103,7Less : Net Indirect Taxes
11. Dikurangi : PENYUSUTAN 22 424,3 22 881,8 23 745,2 23 305,1 92 356,3 23 782,1 24 421,1Less : Depreciation
12. PENDAPATAN NASIONAL 379 531,5 381 608,5 409 048,7 415 299,8 1 585 488,4 401 284,8 426 035,4National Income
Catatan : Dihitung berdasarkan tabel Input Output tahun 2000 Notes : Calculated base on the 2000 Input Output table
1) Selisih antara PDB Lapangan Usaha dan Penggunaan 1) Different between GDP by industrial origin and expenditure
2006
151
(MILIAR / BILLION RUPIAHS )
IV II
2006 Jumlah 2007
I
[3]
III
[7] [8]
IITotal
I
[1]
Jenis Pengeluaran / Type of Expenditure
[5][2] [4] [6]
https:
//www.b
ps.go.id

PENDAPATAN NASIONALNATIONAL INCOME
TABEL : 9.3 PRODUK DOMESTIK BRUTO TRIWULANAN ATAS DASAR HARGA BERLAKU MENURUT PENGELUARAN
TABLE QUARTERLY GROSS DOMESTIC PRODUCT AT CURRENT MARKET PRICES BY TYPE OF EXPENDITURE
(Lanjutan/Continuation )
1. PENGELUARAN KONSUMSI RUMAH TANGGA 637 456,6 681 215,0 2 510 503,8 700 227,7 734 874,0 772 060,9 792 794,3Private Consumption Expenditure
2. PENGELUARAN KONSUMSI PEMERINTAH 80 581,2 99 874,8 329 760,1 76 724,1 104 994,5 106 037,6 129 110,4General Government Consumption Expenditure
3. PEMBENTUKAN MODAL TETAP DOMESTIK BRUTO 254 265,4 276 584,5 985 627,1 291 389,9 327 660,0 369 263,4 382 321,2Gross Domestic Fixed Capital Formation
4. A. PERUBAHAN IINVENTORI 8 736,5 - 11 457,3 - 1 053,3 7 490,3 1 978,7 4 012,2 - 7 658,9 Change in Inventories
B. DISKREPANSI STATISTIK 1) 16 515,2 - 52 934,3 - 33 647,0 - 2 801,2 45 578,1 81 165,1 - 18 082,6 Statistical Discrepancy
5. EKSPOR BARANG-BARANG DAN JASA-JASA 299 651,4 318 308,8 1 162 973,8 346 596,2 377 603,3 384 468,2 366 451,4
Export of Goods and Services
6. Dikurangi : IMPOR BARANG-BARANG DAN JASA-JASA 265 797,6 276 172,5 1 003 271,3 308 772,7 371 321,1 388 936,0 353 872,3Less : Import of Goods and Services
7. PRODUK DOMESTIK BRUTO 1 031 408,7 1 035 418,9 3 950 893,2 1 110 854,3 1 221 367,5 1 328 071,4 1 291 063,5Gross Domestic Product
8. PENDAPATAN NETO TERHADAP LUAR NEGERI - 42 463,8 - 45 227,8 - 162 484,7 - 41 563,2 - 41 012,7 - 41 503,5 - 51 785,9ATAS FAKTOR PRODUKSINet Factor Income from Abroad
9. PRODUK NASIONAL BRUTO 988 944,9 990 191,1 3 788 408,5 1 069 291,2 1 180 354,8 1 286 567,9 1 239 277,7Gross National Product
10. Dikurangi : PAJAK TAK LANGSUNG NETO 44 031,1 8 672,9 112 188,8 67 353,2 - 7 718,5 9 678,6 332,7Less : Net Indirect Taxes
11. Dikurangi : PENYUSUTAN 51 570,4 51 770,9 197 544,7 55 542,7 61 068,4 66 403,6 64 553,2Less : Depreciation
12. PENDAPATAN NASIONAL 893 343,3 929 747,2 3 478 675,0 946 395,3 1 127 004,9 1 210 485,7 1 174 391,8National Income
Catatan : Dihitung berdasarkan tabel Input Output tahun 2000 Notes : Calculated base on the 2000 Input Output table
1) Selisih antara PDB Lapangan Usaha dan Penggunaan 1) Different between GDP by industrial origin and expenditure
2007 Jumlah 2008x)
TotalI
2007
(MILIAR / BILLION RUPIAHS )
149
[15]
Jenis Pengeluaran / Type of Expenditure
[1]
III IVII III
[14]
IV
[12][9] [10] [13][11]
https:
//www.b
ps.go.id
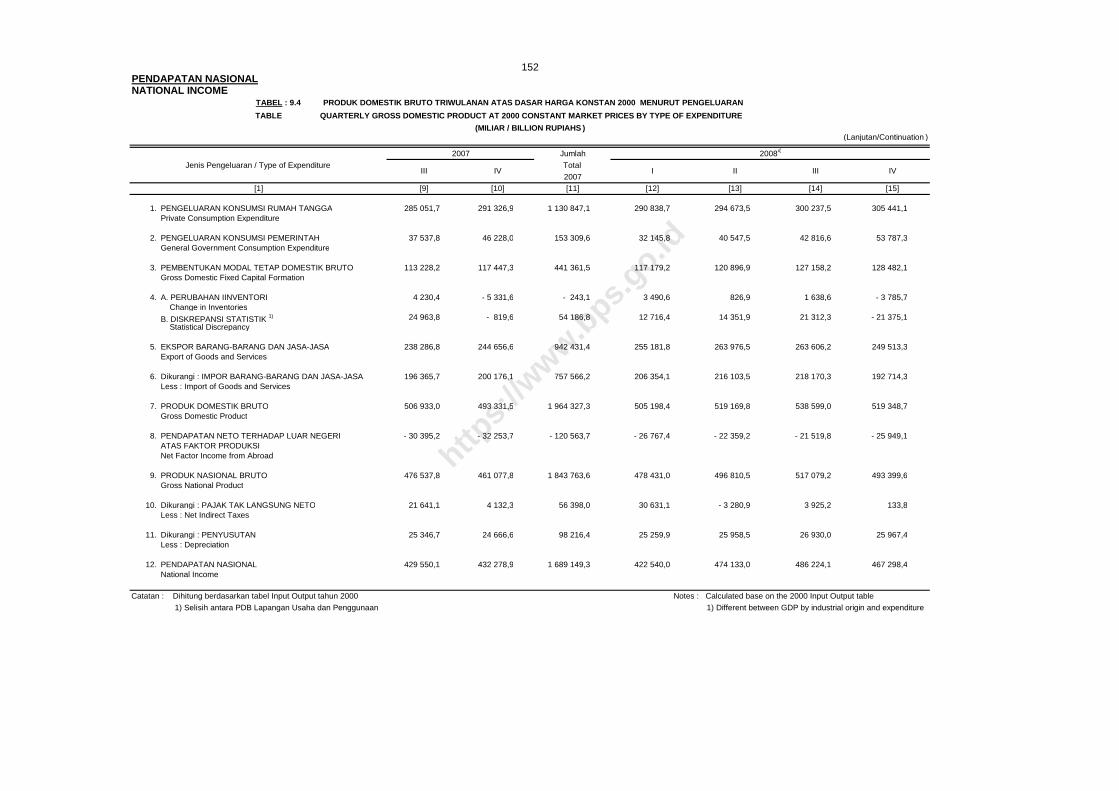
PENDAPATAN NASIONALNATIONAL INCOME
TABEL : 9.4 PRODUK DOMESTIK BRUTO TRIWULANAN ATAS DASAR HARGA KONSTAN 2000 MENURUT PENGELUARAN
TABLE QUARTERLY GROSS DOMESTIC PRODUCT AT 2000 CONSTANT MARKET PRICES BY TYPE OF EXPENDITURE
(Lanjutan/Continuation )
1. PENGELUARAN KONSUMSI RUMAH TANGGA 285 051,7 291 326,9 1 130 847,1 290 838,7 294 673,5 300 237,5 305 441,1Private Consumption Expenditure
2. PENGELUARAN KONSUMSI PEMERINTAH 37 537,8 46 228,0 153 309,6 32 145,8 40 547,5 42 816,6 53 787,3General Government Consumption Expenditure
3. PEMBENTUKAN MODAL TETAP DOMESTIK BRUTO 113 228,2 117 447,3 441 361,5 117 179,2 120 896,9 127 158,2 128 482,1Gross Domestic Fixed Capital Formation
4. A. PERUBAHAN IINVENTORI 4 230,4 - 5 331,6 - 243,1 3 490,6 826,9 1 638,6 - 3 785,7 Change in Inventories
B. DISKREPANSI STATISTIK 1) 24 963,8 - 819,6 54 186,8 12 716,4 14 351,9 21 312,3 - 21 375,1 Statistical Discrepancy
5. EKSPOR BARANG-BARANG DAN JASA-JASA 238 286,8 244 656,6 942 431,4 255 181,8 263 976,5 263 606,2 249 513,3
Export of Goods and Services
6. Dikurangi : IMPOR BARANG-BARANG DAN JASA-JASA 196 365,7 200 176,1 757 566,2 206 354,1 216 103,5 218 170,3 192 714,3Less : Import of Goods and Services
7. PRODUK DOMESTIK BRUTO 506 933,0 493 331,5 1 964 327,3 505 198,4 519 169,8 538 599,0 519 348,7Gross Domestic Product
8. PENDAPATAN NETO TERHADAP LUAR NEGERI - 30 395,2 - 32 253,7 - 120 563,7 - 26 767,4 - 22 359,2 - 21 519,8 - 25 949,1ATAS FAKTOR PRODUKSINet Factor Income from Abroad
9. PRODUK NASIONAL BRUTO 476 537,8 461 077,8 1 843 763,6 478 431,0 496 810,5 517 079,2 493 399,6Gross National Product
10. Dikurangi : PAJAK TAK LANGSUNG NETO 21 641,1 4 132,3 56 398,0 30 631,1 - 3 280,9 3 925,2 133,8Less : Net Indirect Taxes
11. Dikurangi : PENYUSUTAN 25 346,7 24 666,6 98 216,4 25 259,9 25 958,5 26 930,0 25 967,4Less : Depreciation
12. PENDAPATAN NASIONAL 429 550,1 432 278,9 1 689 149,3 422 540,0 474 133,0 486 224,1 467 298,4National Income
Catatan : Dihitung berdasarkan tabel Input Output tahun 2000 Notes : Calculated base on the 2000 Input Output table
1) Selisih antara PDB Lapangan Usaha dan Penggunaan 1) Different between GDP by industrial origin and expenditure
2007IV III
152
(MILIAR / BILLION RUPIAHS )
[15]
II
2008x)
IJenis Pengeluaran / Type of Expenditure
[9] [14]
III
2007 Jumlah
Total
[1] [10] [11] [12] [13]
IV
https:
//www.b
ps.go.id
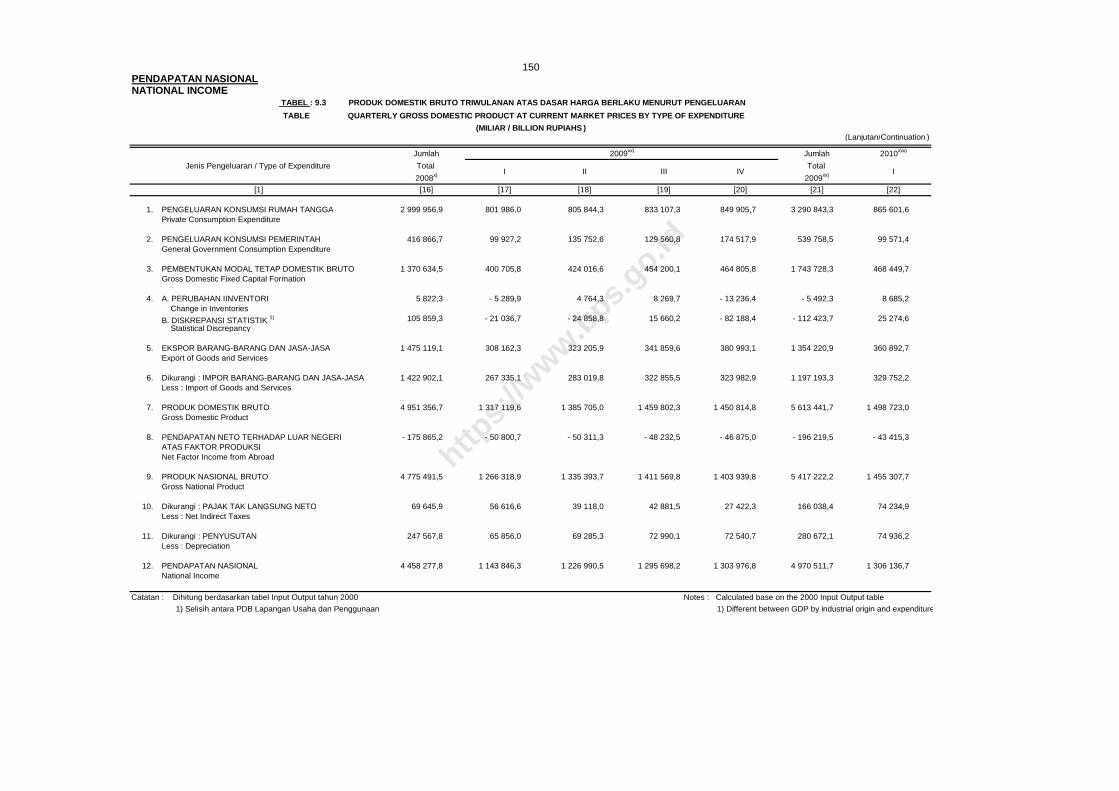
PENDAPATAN NASIONALNATIONAL INCOME
TABEL : 9.3 PRODUK DOMESTIK BRUTO TRIWULANAN ATAS DASAR HARGA BERLAKU MENURUT PENGELUARAN
TABLE QUARTERLY GROSS DOMESTIC PRODUCT AT CURRENT MARKET PRICES BY TYPE OF EXPENDITURE
(Lanjutan/Continuation )
1. PENGELUARAN KONSUMSI RUMAH TANGGA 2 999 956,9 801 986,0 805 844,3 833 107,3 849 905,7 3 290 843,3 865 601,6Private Consumption Expenditure
2. PENGELUARAN KONSUMSI PEMERINTAH 416 866,7 99 927,2 135 752,6 129 560,8 174 517,9 539 758,5 99 571,4General Government Consumption Expenditure
3. PEMBENTUKAN MODAL TETAP DOMESTIK BRUTO 1 370 634,5 400 705,8 424 016,6 454 200,1 464 805,8 1 743 728,3 468 449,7Gross Domestic Fixed Capital Formation
4. A. PERUBAHAN IINVENTORI 5 822,3 - 5 289,9 4 764,3 8 269,7 - 13 236,4 - 5 492,3 8 685,2 Change in Inventories
B. DISKREPANSI STATISTIK 1) 105 859,3 - 21 036,7 - 24 858,8 15 660,2 - 82 188,4 - 112 423,7 25 274,6 Statistical Discrepancy
5. EKSPOR BARANG-BARANG DAN JASA-JASA 1 475 119,1 308 162,3 323 205,9 341 859,6 380 993,1 1 354 220,9 360 892,7
Export of Goods and Services
6. Dikurangi : IMPOR BARANG-BARANG DAN JASA-JASA 1 422 902,1 267 335,1 283 019,8 322 855,5 323 982,9 1 197 193,3 329 752,2Less : Import of Goods and Services
7. PRODUK DOMESTIK BRUTO 4 951 356,7 1 317 119,6 1 385 705,0 1 459 802,3 1 450 814,8 5 613 441,7 1 498 723,0Gross Domestic Product
8. PENDAPATAN NETO TERHADAP LUAR NEGERI - 175 865,2 - 50 800,7 - 50 311,3 - 48 232,5 - 46 875,0 - 196 219,5 - 43 415,3ATAS FAKTOR PRODUKSINet Factor Income from Abroad
9. PRODUK NASIONAL BRUTO 4 775 491,5 1 266 318,9 1 335 393,7 1 411 569,8 1 403 939,8 5 417 222,2 1 455 307,7Gross National Product
10. Dikurangi : PAJAK TAK LANGSUNG NETO 69 645,9 56 616,6 39 118,0 42 881,5 27 422,3 166 038,4 74 234,9Less : Net Indirect Taxes
11. Dikurangi : PENYUSUTAN 247 567,8 65 856,0 69 285,3 72 990,1 72 540,7 280 672,1 74 936,2Less : Depreciation
12. PENDAPATAN NASIONAL 4 458 277,8 1 143 846,3 1 226 990,5 1 295 698,2 1 303 976,8 4 970 511,7 1 306 136,7National Income
Catatan : Dihitung berdasarkan tabel Input Output tahun 2000 Notes : Calculated base on the 2000 Input Output table
1) Selisih antara PDB Lapangan Usaha dan Penggunaan 1) Different between GDP by industrial origin and expenditure
Jumlah
150
(MILIAR / BILLION RUPIAHS )
2010xxx)
[21] [22]
2009xx) Jumlah
TotalIV
[19]
IIIITotal
I2008x) 2009xx)
Jenis Pengeluaran / Type of Expenditure
[1] [17] [20][18][16]
II
https:
//www.b
ps.go.id

PENDAPATAN NASIONALNATIONAL INCOME
TABEL : 9.4 PRODUK DOMESTIK BRUTO TRIWULANAN ATAS DASAR HARGA KONSTAN 2000 MENURUT PENGELUARAN
TABLE QUARTERLY GROSS DOMESTIC PRODUCT AT 2000 CONSTANT MARKET PRICES BY TYPE OF EXPENDITURE
(Lanjutan/Continuation )
1. PENGELUARAN KONSUMSI RUMAH TANGGA 1 191 190,8 308 155,3 308 811,7 314 497,3 317 546,9 1 249 011,2 320 249,6Private Consumption Expenditure
2. PENGELUARAN KONSUMSI PEMERINTAH 169 297,2 38 332,3 47 428,5 47 233,6 62 913,3 195 907,7 34 956,8General Government Consumption Expenditure
3. PEMBENTUKAN MODAL TETAP DOMESTIK BRUTO 493 716,5 121 231,8 123 763,0 131 273,9 133 849,4 510 118,1 130 794,7Gross Domestic Fixed Capital Formation
4. A. PERUBAHAN IINVENTORI 2 170,4 - 1 678,1 1 629,6 3 123,7 - 3 549,5 - 474,3 3 898,4 Change in Inventories
B. DISKREPANSI STATISTIK 1) 27 005,5 10 589,7 6 367,3 7 970,9 - 26 052,0 - 1 124,2 11 511,3 Statistical Discrepancy
5. EKSPOR BARANG-BARANG DAN JASA-JASA 1 032 277,8 207 387,5 223 004,3 243 064,7 258 667,1 932 123,6 247 936,4
Export of Goods and Services
6. Dikurangi : IMPOR BARANG-BARANG DAN JASA-JASA 833 342,2 155 952,8 170 640,9 186 160,9 195 832,0 708 586,6 191 230,3Less : Import of Goods and Services
7. PRODUK DOMESTIK BRUTO 2 082 315,9 528 065,7 540 363,5 561 003,0 547 543,3 2 176 975,5 558 116,8Gross Domestic Product
8. PENDAPATAN NETO TERHADAP LUAR NEGERI - 96 595,5 - 28 798,2 - 29 315,9 - 25 392,9 - 26 312,3 - 109 819,3 - 23 040,8ATAS FAKTOR PRODUKSINet Factor Income from Abroad
9. PRODUK NASIONAL BRUTO 1 985 720,4 499 267,5 511 047,6 535 610,1 521 231,0 2 067 156,2 535 076,1Gross National Product
10. Dikurangi : PAJAK TAK LANGSUNG NETO 31 409,2 22 699,0 15 254,3 16 479,4 10 349,3 64 782,0 27 644,7Less : Net Indirect Taxes
11. Dikurangi : PENYUSUTAN 104 115,8 26 403,3 27 018,2 28 050,1 27 377,2 108 848,8 27 905,8Less : Depreciation
12. PENDAPATAN NASIONAL 1 850 195,4 450 165,2 468 775,1 491 080,6 483 504,6 1 893 525,5 479 525,5National Income
Catatan : Dihitung berdasarkan tabel Input Output tahun 2000 Notes : Calculated base on the 2000 Input Output table
1) Selisih antara PDB Lapangan Usaha dan Penggunaan 1) Different between GDP by industrial origin and expenditure
TotalI
2008x) 2009xx)III
2009xx) Jumlah
[20][19][17]
(MILIAR / BILLION RUPIAHS )
[21] [22]
IVTotal
I
2010xxx)Jumlah
153
[1] [18]
Jenis Pengeluaran / Type of ExpenditureII
[16]
https:
//www.b
ps.go.id
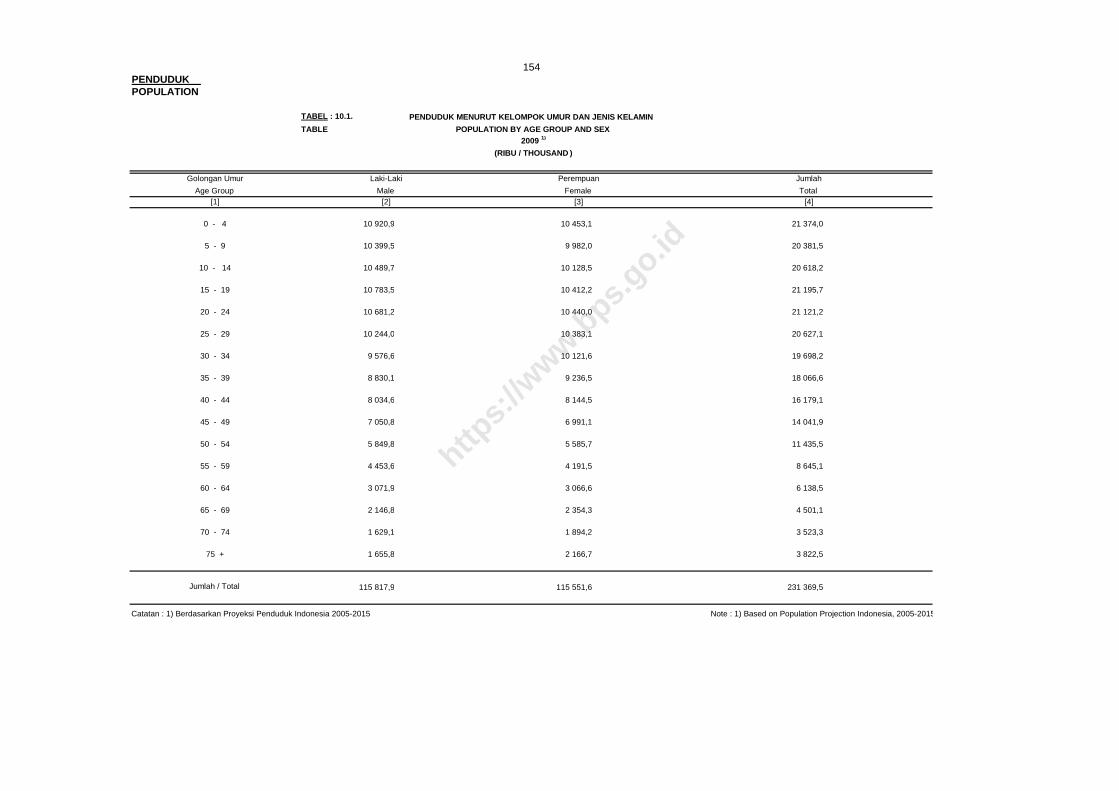
PENDUDUK POPULATION
TABEL : 10.1. PENDUDUK MENURUT KELOMPOK UMUR DAN JENIS KELAMIN
TABLE POPULATION BY AGE GROUP AND SEX2009 1)
(RIBU / THOUSAND )
Golongan Umur
Age Group[1]
0 - 4 10 920,9 10 453,1 21 374,0
5 - 9 10 399,5 9 982,0 20 381,5
10 - 14 10 489,7 10 128,5 20 618,2
15 - 19 10 783,5 10 412,2 21 195,7
20 - 24 10 681,2 10 440,0 21 121,2
25 - 29 10 244,0 10 383,1 20 627,1
30 - 34 9 576,6 10 121,6 19 698,2
35 - 39 8 830,1 9 236,5 18 066,6
40 - 44 8 034,6 8 144,5 16 179,1
45 - 49 7 050,8 6 991,1 14 041,9
50 - 54 5 849,8 5 585,7 11 435,5
55 - 59 4 453,6 4 191,5 8 645,1
60 - 64 3 071,9 3 066,6 6 138,5
65 - 69 2 146,8 2 354,3 4 501,1
70 - 74 1 629,1 1 894,2 3 523,3
75 + 1 655,8 2 166,7 3 822,5
Jumlah / Total 115 817,9 115 551,6 231 369,5
Catatan : 1) Berdasarkan Proyeksi Penduduk Indonesia 2005-2015 Note : 1) Based on Population Projection Indonesia, 2005-2015
[2] [3] [4]TotalMale Female
154
JumlahLaki-Laki Perempuan
https:
//www.b
ps.go.id

PENDUDUK POPULATION
TABEL : 10.2 PENDUDUK MENURUT GOLONGAN UMUR DAN JENIS KELAMIN
TABLE POPULATION BY AGE GROUP AND SEX
2000 & 2005
Golongan Umur
Age Group
[1]
0 - 4 10 153,4 9 798,6 19 952,0 10 496,8 10 079,6 20 576,4
5 - 9 11 117,1 10 749,3 21 866,4 10 410,9 10 029,6 20 440,5
10 - 14 10 780,6 10 370,0 21 150,6 11 080,6 10 586,9 21 667,5
15 - 19 10 609,4 10 567,9 21 177,3 10 741,6 10 457,1 21 198,7
20 - 24 9 722,8 10 295,1 20 017,9 10 579,2 10 536,0 21 115,2
25 - 29 9 103,9 9 563,9 18 667,8 9 701,2 10 275,2 19 976,4
30 - 34 8 427,8 8 479,4 16 907,2 9 018,5 9 506,4 18 524,9
35 - 39 7 512,7 7 430,0 14 942,7 8 322,8 8 412,6 16 735,4
40 - 44 6 473,5 6 123,8 12 597,3 7 406,6 7 344,5 14 751,1
45 - 49 5 153,5 4 675,8 9 829,3 6 328,0 6 014,2 12 342,2
50 - 54 3 869,2 3 615,5 7 484,7 4 959,1 4 558,0 9 517,1
55 - 59 2 987,1 2 933,8 5 920,9 3 595,2 3 455,1 7 050,3
60 - 64 2 474,4 2 585,6 5 060,0 2 509,0 2 706,1 5 215,1
65 - 69 1 805,7 2 007,1 3 812,8 2 012,3 2 226,6 4 238,9
70 - 74 1 264,8 1 389,3 2 654,1 1 433,8 1 685,7 3 119,5
75 + 1 366,5 1 724,5 3 091,0 1 496,8 1 886,0 3 382,8
Tak Terjawab / Not Stated - - - - - -
Jumlah / Total 102 822,4 102 309,6 205 132,0 110 092,4 109 759,6 219 852,0
Catatan : 1) Berdasarkan Sensus Penduduk 2000 Note : 1) Based on 2000 Population Census
2) Berdasarkan Survei Penduduk Antar Sensus 2005 2) Based on 2005 Intercental Population Survey
155
2005 2) (ribu / thousand )2000 1) (ribu / thousand )
Laki-Laki Perempuan
Male MaleFemale Total[2] [3] [4] [5]
Total
Jumlah
[6] [7]Female
Laki-Laki Perempuan Jumlah
https:
//www.b
ps.go.id

PENDUDUK POPULATION
Perkotaan + Perdesaan / Urban + Rural Laki-laki + Perempuan / Male + Female
Golongan Umur Jumlah
Age Group Angkatan
Kerja
Total Eco-
nomically
Active
[1] [6] [11]
15 - 19 6 059 032 297 705 2 004 927 2 302 632 8 361 664 11 888 864 1 948 921 1 467 460 15 305 245 23 666 909 72,46 35,33
20 - 24 10 843 451 856 548 1 662 589 2 519 137 13 362 588 1 738 258 3 694 795 698 137 6 131 190 19 493 778 81,15 68,55
25 - 29 13 835 799 739 214 798 451 1 537 665 15 373 464 165 213 4 871 619 349 536 5 386 368 20 759 832 90,00 74,05
30 - 34 14 305 550 481 395 344 277 825 672 15 131 222 15 504 4 608 762 235 214 4 859 480 19 990 702 94,54 75,69
35 - 39 13 384 767 312 632 244 498 557 130 13 941 897 1 066 3 827 665 148 806 3 977 537 17 919 434 96,00 77,80
40 - 44 12 655 528 232 179 200 512 432 691 13 088 219 1 616 3 058 199 156 372 3 216 187 16 304 406 96,69 80,27
45 - 49 10 652 153 170 651 162 416 333 067 10 985 220 325 2 502 044 177 852 2 680 221 13 665 441 96,97 80,39
50 - 54 8 761 781 128 040 103 624 231 664 8 993 445 - 2 102 140 285 189 2 387 329 11 380 774 97,42 79,02
55 - 59 5 855 884 91 672 57 616 149 288 6 005 172 - 1 728 508 460 642 2 189 150 8 194 322 97,51 73,28
60+ 8 516 718 51 496 22 175 73 671 8 590 389 - 5 004 297 4 357 924 9 362 221 17 952 610 99,14 47,85
Jumlah/Total 104 870 663 3 361 532 5 601 085 8 962 617 113 833 280 13 810 846 33 346 950 8 337 132 55 494 928 169 328 208 92,13 67,23
Catatan : Note :
1) 1. Mencari Pekerjaan 1) 1. Looking for Work
2. Mempersiapkan Usaha 2. Establishing a New Business / Firm
3. Merasa Tidak Mungkin Mendapat Pekerjaan 3. Hopeless of Job
4. Sudah Punya Pekerjaan Tetapi Belum Mulai Bekerja 4. Have a Job in Future Start
[13]
Population
[2] [3] [4] [5] [7] [8] [9] [10] [12]
cally mically Active To
Active Active Working age
Total Not % Working % Econo-
Worked Worked Keeping Economi- To Econo- mically
Ever Never Total House
duduk Usia
Bekerja Bekerja Jumlah School Tangga Kerja Total Kerja
hadap Pen-
Working Pernah Tdk Pernah Attending Rumah Others Angkatan Jumlah Kerja
Lainnya Bukan AngkatanBekerja Unemployment Sekolah Mengurus
Pengangguran Terbuka 1) Jumlah Terhadap Kerja Ter-
Angkatan Kerja/Economically Active Bukan Angkatan Kerja/Not Economically Active % Bekerja % Angkatan
156
TABEL : 10.3 PENDUDUK BERUMUR 15 TAHUN KE ATAS MENURUT GOLONGAN UMUR DAN KEGIATAN SELAMA SEMINGGU YANG LALU
TABLE POPULATION 15 YEARS OF AGE AND OVER BY AGE GROUP AND TYPE OF ACTIVITY DURING THE PREVIOUS WEEK
( AGUSTUS / AUGUST 2009)
https:
//www.b
ps.go.id

PENDUDUK POPULATION
TABEL : 10.4
TABLE
Perkotaan + Perdesaan / Urban + Rural Laki-laki + Perempuan / Male + Female
Jumlah JumlahProvinsi Angkatan TotalProvince Kerja
Total Eco-nomically
Active
[1] [6]
Nanggroe Aceh Darussalam 1 732 561 29 016 136 345 165 361 1 897 922 410 625 572 622 155 590 1 138 837 3 036 759 91,29 62,50Sumatera Utara 5 765 643 147 816 384 611 532 427 6 298 070 902 971 1 465 429 442 268 2 810 668 9 108 738 91,55 69,14Sumatera Barat 1 998 922 45 705 127 375 173 080 2 172 002 388 676 600 768 222 011 1 211 455 3 383 457 92,03 64,19Riau 2 067 357 55 734 137 771 193 505 2 260 862 350 240 893 019 137 756 1 381 015 3 641 877 91,44 62,08Jambi 1 260 592 20 018 53 886 73 904 1 334 496 186 312 390 743 90 806 667 861 2 002 357 94,46 66,65Sumatera Selatan 3 196 894 77 458 186 013 263 471 3 460 365 446 846 945 561 212 970 1 605 377 5 065 742 92,39 68,31Bengkulu 787 308 10 726 31 415 42 141 829 449 113 936 194 784 43 782 352 502 1 181 951 94,92 70,18Lampung 3 387 175 80 593 159 387 239 980 3 627 155 414 144 1 098 117 212 519 1 724 780 5 351 935 93,38 67,77Bangka Belitung 506 284 14 436 18 690 33 126 539 410 56 109 194 103 39 481 289 693 829 103 93,86 65,06Kepulauan Riau 626 456 32 105 23 208 55 313 681 769 81 229 257 476 35 297 374 002 1 055 771 91,89 64,58DKI Jakarta 4 118 390 276 643 292 694 569 337 4 687 727 563 905 1 453 809 333 640 2 351 354 7 039 081 87,85 66,60Jawa Barat 16 901 430 820 352 1 259 478 2 079 830 18 981 260 2 360 499 7 168 646 1 671 784 11 200 929 30 182 189 89,04 62,89Jawa Tengah 15 835 382 531 177 721 090 1 252 267 17 087 649 1 879 303 4 271 035 1 431 538 7 581 876 24 669 525 92,67 69,27DI Yogyakarta 1 895 648 74 516 46 530 121 046 2 016 694 308 401 461 014 85 610 855 025 2 871 719 94,00 70,23Jawa Timur 19 305 056 419 914 613 598 1 033 512 20 338 568 1 949 264 5 624 245 1 459 055 9 032 564 29 371 132 94,92 69,25Banten 3 704 778 280 701 371 761 652 462 4 357 240 553 724 1 564 666 360 788 2 479 178 6 836 418 85,03 63,74Bali 2 057 118 30 149 36 321 66 470 2 123 588 187 161 319 205 98 793 605 159 2 728 747 96,87 77,82Nusa Tenggara Barat 1 967 380 77 979 53 279 131 258 2 098 638 266 678 547 788 143 507 957 973 3 056 611 93,75 68,66Nusa Tenggara Timur 2 160 733 23 143 66 252 89 395 2 250 128 284 087 453 325 133 882 871 294 3 121 422 96,03 72,09Kalimantan Barat 2 081 211 43 461 76 223 119 684 2 200 895 222 111 480 765 92 825 795 701 2 996 596 94,56 73,45Kalimantan Tengah 998 967 13 596 34 839 48 435 1 047 402 124 739 259 337 39 230 423 306 1 470 708 95,38 71,22Kalimantan Selatan 1 705 905 37 036 78 776 115 812 1 821 717 171 335 452 160 98 638 722 133 2 543 850 93,64 71,61Kalimantan Timur 1 302 772 55 060 103 164 158 224 1 460 996 207 712 512 181 87 341 807 234 2 268 230 89,17 64,41Sulawesi Utara 940 173 25 631 85 326 110 957 1 051 130 141 920 416 048 85 027 642 995 1 694 125 89,44 62,05Sulawesi Tengah 1 149 718 15 741 50 268 66 009 1 215 727 143 581 337 208 58 449 539 238 1 754 965 94,57 69,27Sulawesi Selatan 3 222 256 75 147 239 517 314 664 3 536 920 481 077 1 311 804 330 823 2 123 704 5 660 624 91,10 62,48Sulawesi Tenggara 950 876 12 994 34 325 47 319 998 195 131 279 245 245 43 425 419 949 1 418 144 95,26 70,39Gorontalo 420 962 6 018 20 333 26 351 447 313 62 316 161 296 30 570 254 182 701 495 94,11 63,77Sulawesi Barat 488 080 6 372 16 692 23 064 511 144 56 478 144 461 38 861 239 800 750 944 95,49 68,07Maluku 533 015 6 580 56 435 63 015 596 030 114 349 162 702 37 763 314 814 910 844 89,43 65,44Maluku Utara 393 834 6 089 22 475 28 564 422 398 83 570 123 540 28 497 235 607 658 005 93,24 64,19Papua Barat 325 759 4 358 22 268 26 626 352 385 55 476 89 446 16 986 161 908 514 293 92,44 68,52Papua 1 082 028 5 268 40 740 46 008 1 128 036 110 793 174 402 37 620 322 815 1 450 851 95,92 77,75
Jumlah/Total 104 870 663 3 361 532 5 601 085 8 962 617 113 833 280 13 810 846 33 346 950 8 337 132 55 494 928 169 328 208 92,13 67,23
Catatan : Note :
1) 1. Mencari Pekerjaan 1) 1. Looking for Work
2. Mempersiapkan Usaha 2. Establishing a New Business / Firm
3. Merasa Tidak Mungkin Mendapat Pekerjaan 3. Hopeless of Job
4. Sudah Punya Pekerjaan Tetapi Belum Mulai Bekerja 4. Have a Job in Future Start
[7] [8][2] [3] [4] [5] [10] [11] [12] [13]
mically Working ageActive Active Population
Never
cally
Tangga
[9]
micallyWorked Worked Keeping Economi- To Econo- Active To
Ever Bekerja Bekerja Jumlah School
Total House Total Not % Working
Working Pernah Tdk Pernah AttendingKerja % Econo-
Angkatan Penduduk Usia KerjaAngkatan Kerja
Pengangguran Terbuka 1) Jumlah Terhadap
Rumah Others
% Angkatan
Bekerja Unemployment Sekolah Mengurus Lainnya BukanKerja Terhadap
( AGUSTUS / AUGUST 2009)
Angkatan Kerja/Economically Active Bukan Angkatan Kerja/Not Economically Active % Bekerja
157
PENDUDUK BERUMUR 15 TAHUN KE ATAS MENURUT PROVINSI DAN KEGIATAN SELAMA SEMINGGU YANG LALU POPULATION 15 YEARS OF AGE AND OVER BY PROVINCE AND TYPE OF ACTIVITY DURING THE PREVIOUS WEEK
https:
//www.b
ps.go.id
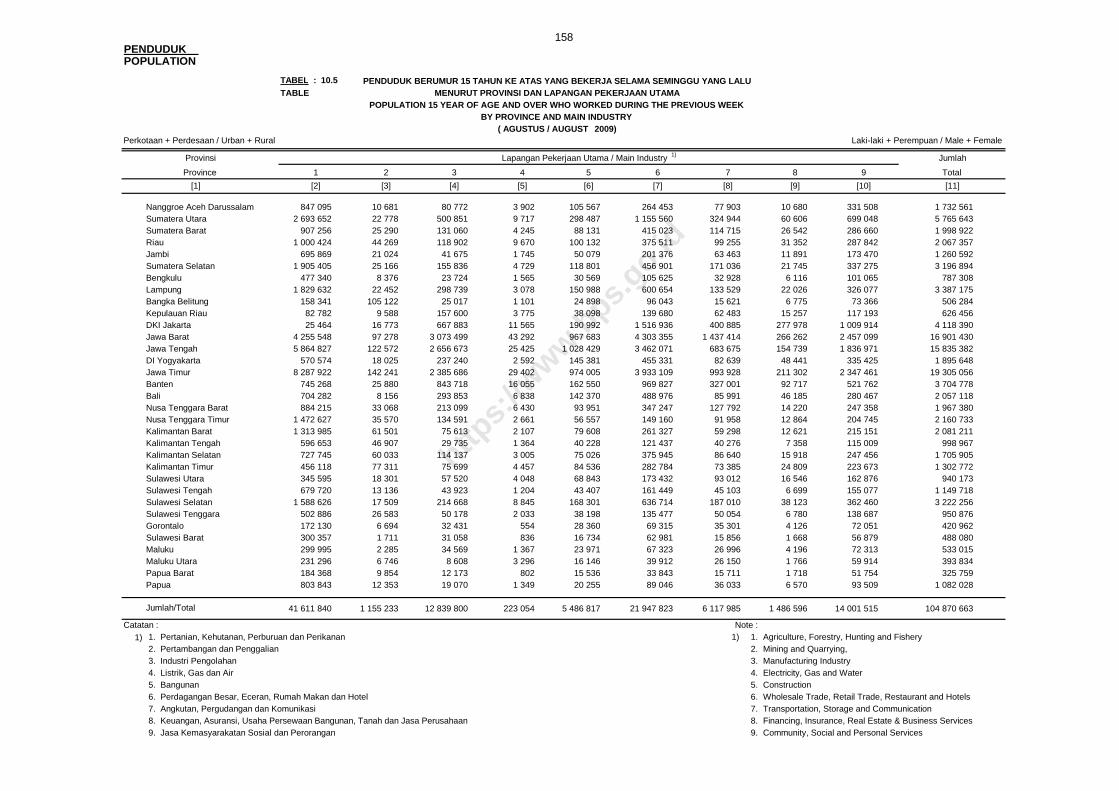
PENDUDUK POPULATION
TABEL : 10.5 TABLE
Perkotaan + Perdesaan / Urban + Rural Laki-laki + Perempuan / Male + Female
Nanggroe Aceh Darussalam 847 095 10 681 80 772 3 902 105 567 264 453 77 903 10 680 331 508 1 732 561Sumatera Utara 2 693 652 22 778 500 851 9 717 298 487 1 155 560 324 944 60 606 699 048 5 765 643Sumatera Barat 907 256 25 290 131 060 4 245 88 131 415 023 114 715 26 542 286 660 1 998 922Riau 1 000 424 44 269 118 902 9 670 100 132 375 511 99 255 31 352 287 842 2 067 357Jambi 695 869 21 024 41 675 1 745 50 079 201 376 63 463 11 891 173 470 1 260 592Sumatera Selatan 1 905 405 25 166 155 836 4 729 118 801 456 901 171 036 21 745 337 275 3 196 894Bengkulu 477 340 8 376 23 724 1 565 30 569 105 625 32 928 6 116 101 065 787 308Lampung 1 829 632 22 452 298 739 3 078 150 988 600 654 133 529 22 026 326 077 3 387 175Bangka Belitung 158 341 105 122 25 017 1 101 24 898 96 043 15 621 6 775 73 366 506 284Kepulauan Riau 82 782 9 588 157 600 3 775 38 098 139 680 62 483 15 257 117 193 626 456DKI Jakarta 25 464 16 773 667 883 11 565 190 992 1 516 936 400 885 277 978 1 009 914 4 118 390Jawa Barat 4 255 548 97 278 3 073 499 43 292 967 683 4 303 355 1 437 414 266 262 2 457 099 16 901 430Jawa Tengah 5 864 827 122 572 2 656 673 25 425 1 028 429 3 462 071 683 675 154 739 1 836 971 15 835 382DI Yogyakarta 570 574 18 025 237 240 2 592 145 381 455 331 82 639 48 441 335 425 1 895 648Jawa Timur 8 287 922 142 241 2 385 686 29 402 974 005 3 933 109 993 928 211 302 2 347 461 19 305 056Banten 745 268 25 880 843 718 16 055 162 550 969 827 327 001 92 717 521 762 3 704 778Bali 704 282 8 156 293 853 6 838 142 370 488 976 85 991 46 185 280 467 2 057 118Nusa Tenggara Barat 884 215 33 068 213 099 6 430 93 951 347 247 127 792 14 220 247 358 1 967 380Nusa Tenggara Timur 1 472 627 35 570 134 591 2 661 56 557 149 160 91 958 12 864 204 745 2 160 733Kalimantan Barat 1 313 985 61 501 75 613 2 107 79 608 261 327 59 298 12 621 215 151 2 081 211Kalimantan Tengah 596 653 46 907 29 735 1 364 40 228 121 437 40 276 7 358 115 009 998 967Kalimantan Selatan 727 745 60 033 114 137 3 005 75 026 375 945 86 640 15 918 247 456 1 705 905Kalimantan Timur 456 118 77 311 75 699 4 457 84 536 282 784 73 385 24 809 223 673 1 302 772Sulawesi Utara 345 595 18 301 57 520 4 048 68 843 173 432 93 012 16 546 162 876 940 173Sulawesi Tengah 679 720 13 136 43 923 1 204 43 407 161 449 45 103 6 699 155 077 1 149 718Sulawesi Selatan 1 588 626 17 509 214 668 8 845 168 301 636 714 187 010 38 123 362 460 3 222 256Sulawesi Tenggara 502 886 26 583 50 178 2 033 38 198 135 477 50 054 6 780 138 687 950 876Gorontalo 172 130 6 694 32 431 554 28 360 69 315 35 301 4 126 72 051 420 962Sulawesi Barat 300 357 1 711 31 058 836 16 734 62 981 15 856 1 668 56 879 488 080Maluku 299 995 2 285 34 569 1 367 23 971 67 323 26 996 4 196 72 313 533 015Maluku Utara 231 296 6 746 8 608 3 296 16 146 39 912 26 150 1 766 59 914 393 834Papua Barat 184 368 9 854 12 173 802 15 536 33 843 15 711 1 718 51 754 325 759Papua 803 843 12 353 19 070 1 349 20 255 89 046 36 033 6 570 93 509 1 082 028
Jumlah/Total 41 611 840 1 155 233 12 839 800 223 054 5 486 817 21 947 823 6 117 985 1 486 596 14 001 515 104 870 663
Catatan : Note :1) 1. Pertanian, Kehutanan, Perburuan dan Perikanan 1) 1. Agriculture, Forestry, Hunting and Fishery
2. Pertambangan dan Penggalian 2. Mining and Quarrying, 3. Industri Pengolahan 3. Manufacturing Industry 4. Listrik, Gas dan Air 4. Electricity, Gas and Water 5. Bangunan 5. Construction 6. Perdagangan Besar, Eceran, Rumah Makan dan Hotel 6. Wholesale Trade, Retail Trade, Restaurant and Hotels 7. Angkutan, Pergudangan dan Komunikasi 7. Transportation, Storage and Communication 8. Keuangan, Asuransi, Usaha Persewaan Bangunan, Tanah dan Jasa Perusahaan 8. Financing, Insurance, Real Estate & Business Services 9. Jasa Kemasyarakatan Sosial dan Perorangan 9. Community, Social and Personal Services
158
Provinsi
Province
[1]
Jumlah
4
[5]
9 Total
[11]
Lapangan Pekerjaan Utama / Main Industry 1)
PENDUDUK BERUMUR 15 TAHUN KE ATAS YANG BEKERJA SELAMA SEMINGGU YANG LALUMENURUT PROVINSI DAN LAPANGAN PEKERJAAN UTAMA
1
POPULATION 15 YEAR OF AGE AND OVER WHO WORKED DURING THE PREVIOUS WEEKBY PROVINCE AND MAIN INDUSTRY
( AGUSTUS / AUGUST 2009)
8
[10]
5
[6] [7]
6
[9][2]
2
[8][3]
3
[4]
7
https:
//www.b
ps.go.id

PENDUDUK POPULATION
TABEL : 10.6TABLE
Perkotaan + Perdesaan / Urban + Rural Laki-laki + Perempuan / Male + Female
Nanggroe Aceh Darussalam 355 858 331 590 71 532 544 760 51 779 45 384 331 658 1 732 561
Sumatera Utara 1 162 671 1 125 109 186 002 1 596 841 275 609 227 583 1 191 828 5 765 643
Sumatera Barat 455 905 425 744 74 472 434 517 156 288 105 315 346 681 1 998 922
Riau 570 503 298 256 87 087 658 603 124 199 61 971 266 738 2 067 357
Jambi 285 543 255 452 45 714 343 149 62 070 33 218 235 446 1 260 592
Sumatera Selatan 633 897 765 032 63 215 726 712 113 776 64 038 830 224 3 196 894
Bengkulu 126 356 206 166 22 110 156 954 36 677 28 629 210 416 787 308
Lampung 583 361 883 418 70 193 616 200 199 710 190 523 843 770 3 387 175
Bangka Belitung 143 353 61 006 28 439 171 118 15 728 34 203 52 437 506 284
Kepulauan Riau 153 101 44 652 18 966 352 501 8 953 21 076 27 207 626 456
DKI Jakarta 980 623 307 503 172 959 2 377 257 1 582 82 957 195 509 4 118 390
Jawa Barat 3 896 255 2 862 708 519 877 5 407 032 1 277 987 1 375 299 1 562 272 16 901 430
Jawa Tengah 2 942 281 3 650 147 405 682 3 745 340 1 045 307 1 304 151 2 742 474 15 835 382
DI Yogyakarta 271 699 451 329 56 174 614 886 54 807 145 312 301 441 1 895 648
Jawa Timur 3 417 637 4 460 269 552 933 4 635 850 1 512 671 1 036 939 3 688 757 19 305 056
Banten 873 186 518 655 103 554 1 592 585 147 755 172 662 296 381 3 704 778
Bali 387 377 439 243 59 588 595 301 71 683 113 610 390 316 2 057 118
Nusa Tenggara Barat 397 404 433 818 53 561 334 507 222 815 167 235 358 040 1 967 380
Nusa Tenggara Timur 290 396 731 527 30 619 298 031 22 557 35 607 751 996 2 160 733
Kalimantan Barat 384 572 533 598 43 399 457 041 40 735 41 292 580 574 2 081 211
Kalimantan Tengah 176 553 244 708 21 904 273 969 21 155 18 573 242 105 998 967
Kalimantan Selatan 389 066 334 611 54 870 457 587 68 324 67 324 334 123 1 705 905
Kalimantan Timur 262 263 218 248 34 899 563 645 21 853 32 181 169 683 1 302 772
Sulawesi Utara 286 716 129 345 42 900 284 798 48 003 55 056 93 355 940 173
Sulawesi Tengah 225 008 314 702 34 023 217 356 50 640 26 222 281 767 1 149 718
Sulawesi Selatan 563 232 846 819 93 464 777 005 141 251 96 673 703 812 3 222 256
Sulawesi Tenggara 171 118 239 841 22 335 207 957 12 402 22 433 274 790 950 876
Gorontalo 108 934 74 306 13 606 106 410 28 754 32 341 56 611 420 962
Sulawesi Barat 98 919 134 864 11 682 99 617 16 722 8 807 117 469 488 080
Maluku 126 753 121 567 11 930 107 872 2 444 6 224 156 225 533 015
Maluku Utara 95 862 93 196 8 581 87 367 11 696 5 323 91 809 393 834
Papua Barat 60 968 85 694 5 679 88 068 4 870 5 555 74 925 325 759
Papua 168 637 310 423 11 271 183 205 8 092 6 993 393 407 1 082 028
Jumlah/Total 21 046 007 21 933 546 3 033 220 29 114 041 5 878 894 5 670 709 18 194 246 104 870 663
Catatan : Note : 1) 1. Berusaha Sendiri 1) 1. Own Account Workers
2. Berusaha Dibantu Buruh Tidak Tetap / Buruh Tidak Dibayar 2. Employed Assisted By Temporary Worker / Unpaid Worker3. Berusaha Dibantu Buruh Tetap / Buruh Dibayar 3. Employer Assisted By Permanent Worker4. Buruh / Karyawan / Pegawai 4. Employee5. Pekerja Bebas di Pertanian 5. Casual Employee in Agriculture6. Pekerja Bebas di Non Pertanian 6. Casual Employee Not in Agriculture7. Pekerja Keluarga Tak Dibayar 7. Unpaid Family Worker
[1]
Provinsi
Province 1
Status Pekerjaan Utama / Main Employment Status 1)
[2] [3]
5
[6]
3
[4] [5]
Jumlah
Total4
[9]
6 7
[7] [8]
2
( AGUSTUS / AUGUST 2009)
159
PENDUDUK BERUMUR 15 TAHUN KE ATAS YANG BEKERJA SELAMA SEMINGGU YANG LALUMENURUT PROVINSI DAN STATUS PEKERJAAN UTAMA
POPULATION 15 YEAR OF AGE AND OVER WHO WORKED DURING THE PREVIOUS WEEKBY PROVINCE AND MAIN EMPLOYMENT STATUS
https:
//www.b
ps.go.id

PENDUDUK POPULATION
TABEL : 10.7 TABLE
Perkotaan + Perdesaan / Urban + Rural Laki-laki + Perempuan / Male + Female
1 236 243 28 424 183 086 2 150 123 065 403 739 128 286 40 816 252 086 2 397 895
242 102 1 448 19 018 247 1 809 55 280 9 760 14 267 79 026 422 957
1 222 637 11 365 122 113 889 22 957 242 062 48 687 24 379 224 028 1 919 117
2 721 399 15 498 219 817 3 512 21 409 508 622 77 975 21 052 369 332 3 958 616
3 194 404 27 450 275 693 3 649 82 683 477 061 106 129 17 484 448 494 4 633 047
5 797 046 62 560 564 290 2 969 155 424 1 051 264 224 238 37 614 847 903 8 743 308
9 338 044 143 325 1 120 738 22 019 343 139 1 933 974 461 022 76 581 2 125 947 15 564 789
10 421 143 288 717 3 498 252 88 937 998 333 4 379 346 1 368 973 547 426 4 623 522 26 214 649
4 656 459 317 044 4 870 084 69 273 2 556 142 4 806 091 1 620 239 498 007 2 524 034 21 917 373
1 364 487 89 951 841 213 11 118 696 284 2 188 061 553 411 62 258 724 685 6 531 468
1 142 361 129 252 929 749 10 857 459 077 3 845 931 1 119 985 108 240 1 206 616 8 952 068
275 515 40 199 195 747 7 434 26 495 2 056 392 399 280 38 472 575 842 3 615 376
41 611 840 1 155 233 12 839 800 223 054 5 486 817 21 947 823 6 117 985 1 486 596 14 001 515 104 870 663
Catatan Note :
1) 1. Pertanian, Kehutanan, Perburuan dan Perikanan 1) 1. Agriculture, Forestry, Hunting and Fishery
2. Pertambangan dan Penggalian 2. Mining and Quarrying
3. Industri Pengolahan 3. Manufacturing Industry
4. Listrik, Gas, dan Air 4. Electricity, Gas and Water
5. Bangunan 5. Construction
6. Perdagangan Besar, Eceran, Rumah Makan dan Hotel 6. Wholesale Trade, Retail Trade, Restaurant and Hotels
7. Angkutan, Pergudangan dan Komunikasi 7. Transportation, Storage and Communication
8. Keuangan, Asuransi, Usaha Persewaan Bangunan, Tanah dan Jasa Perusahaan 8. Financing, Insurance, Real Estate & Business Services9. Jasa Kemasyarakatan Sosial dan Perorangan 9. Community, Social and Personal Services
2) Sementara Tidak Bekerja 2) Temporarily Not Working.
JumlahTotal
[11]
Lapangan Pekerjaan Utama / Main Industry 1)
[9] [10]
8
[7]
3 4
[8][2] [3] [4] [5] [6]
45 - 54
55 - 59
60 - 74
Total working hours on main job
0 2)
20 - 24
25 - 34
35 - 44
160
[1]
97
Jumlah jam kerja pada pekerjaan utama
( AGUSTUS / AUGUST 2009)
POPULATION 15 YEAR OF AGE AND OVER WHO WORKED DURING THE PREVIOUS WEEK
5 6
JAM KERJA PADA PEKERJAAN UTAMA DAN LAPANGAN PEKERJAAN UTAMAPENDUDUK BERUMUR 15 TAHUN KE ATAS YANG BEKERJA SELAMA SEMINGGU YANG LALU MENURUT JUMLAH
BY TOTAL WORKING HOURS ON MAIN JOB AND MAIN INDUSTRY
Jumlah / Total
1 - 4
5 - 9
10 - 14
15 - 19
1 2
75 +
https:
//www.b
ps.go.id

PENDUDUK POPULATION
TABEL : 10.8TABLE
Perkotaan + Perdesaan / Urban + Rural Laki-laki + Perempuan / Male + Female
6 667 14 808 59 115 108 033 747 281 588 995 1 334 394 2 298 175 5 157 468
- 931 68 011 76 157 235 495 115 634 70 633 333 264 900 125
3 737 20 965 178 443 277 483 1 431 850 783 147 460 911 1 070 306 4 226 842
644 687 2 893 216 4 976 995 4 236 701 3 852 079 1 847 375 388 632 424 642 19 264 327
182 235 749 515 1 390 885 1 254 571 1 127 513 612 456 132 247 191 950 5 641 372
4 513 335 11 898 162 14 498 553 6 418 952 2 555 947 1 029 164 131 072 99 716 41 144 901
759 348 3 867 634 8 469 867 6 977 088 4 320 977 3 168 181 253 109 193 626 28 009 830
- 1 748 7 964 41 842 310 988 95 746 17 818 49 692 525 798
6 110 009 19 446 979 29 649 833 19 390 827 14 582 130 8 240 698 2 788 816 4 661 371 104 870 663
Catatan : Note :
0/1. Tenaga Profesional, Teknisi dan yang Sejenis 0/1. Professional, Technical and Related Workers
2. Tenaga Kepemimpinan dan Ketatalaksanaan 2. Administrative and Managerial Workers
3. Tenaga Tata Usaha dan yang Sejenis 3. Clerical and Related Workers
4. Tenaga Usaha Penjualan 4. Sales Workers
5. Tenaga Usaha Jasa 5. Service Workers
6. Tenaga Usaha Pertanian, Kehutanan, Perburuan dan Perikanan 6. Agriculture, Animal Husbandry, Forestry Workers, Fishermen and Hunters
7/8/9. Tenaga Produksi, Operator Alat-Alat Angkutan dan Pekerja Kasar 7/8/9. Production and Related Workers, Transport Equipment Operators and Laborers
X/00 Lainnya X/00 Others
[11] [12]
PENDUDUK BERUMUR 15 TAHUN KE ATAS YANG BEKERJA SELAMA SEMINGGU YANG LALU MENURUT JENIS PEKERJAAN UTAMA DAN PENDIDIKAN TERTINGGI YANG DITAMATKAN
POPULATION 15 YEARS OF AGE AND OVER WHO WORKED DURING THE PREVIOUS WEEKBY MAIN OCCUPATION AND EDUCATIONAL ATTAINMENT
Jumlah
Total
Pendidikan Tertinggi yang Ditamatkan / Educational Attainment
General
Universitas
University
( AGUSTUS / AUGUST 2009)
Diploma
I / II / III
Akademi
Diploma
161
Umum
Vocational
Jumlah / Total
7/8/9
[1]
0/1
5
X/00
6
I / II / III
Academy
Jenis Pekerjaan
Utama
Main Occupation
Tdk/blm
pernah
sekolah
No
Tdk/blm Tamat SD
Did not Complete/
[10]
Not yet Completed
Primary
[7] [8][3]
Kejuruan
S M T A
Senior High SchoolSekolah
Dasar
[5]
4
SchoolSchooling
3
[2] [4]
2
Primary
S L T P
Junior High School
School
https:
//www.b
ps.go.id