


Bahasa
Halaman
Hukum

University of Massachusetts BostonScholarWorks at UMass Boston
Center for Social Policy Publications Center for Social Policy
12-1-2008
Work-Based Social Support in the United States:Limits and New PossibilitiesHeather Boushey
Chris TillyUniversity of Massachusetts - Lowell, [email protected]
This Article is brought to you for free and open access by the Center for Social Policy at ScholarWorks at UMass Boston. It has been accepted forinclusion in Center for Social Policy Publications by an authorized administrator of ScholarWorks at UMass Boston. For more information, pleasecontact [email protected].
Recommended CitationBoushey, Heather and Tilly, Chris, "Work-Based Social Support in the United States: Limits and New Possibilities" (2008). Center forSocial Policy Publications. Paper 21.http://scholarworks.umb.edu/csp_pubs/21
CSP Working Paper # 2009-5
Work-Based Social Support in the United
States: Limits and New
Possibilities
Heather Boushey Chris Tilly
Work-Based Social Support in the United States: Limits and New Possibilities
Heather Boushey Center for American Progress
Chris Tilly Department of Regional Economic and Social Development
University of Massachusetts Lowell and
Institute for Research on Labor and Employment UCLA
Submitted to the Ford Foundation Economic Development Program
December 2008
This article is based in part on Heather Boushey and Chris Tilly, “Avere un lavoro: i limiti del sistema di sostegno sociale contributivo negli Stati Uniti” (“Get a job: The limits of work-based social support in the United States”, Annali della Fondazione di Vittorio (Rome), special issue on “New poverty, new priorities: Rethinking social inclusion,” February 2008 (published in Italian). We would like to thank Fabián Slonimczyk for research assistance. The views expressed in this paper are those of the researchers and do not necessarily reflect those of the Ford Foundation.
1
The U.S. social policy framework has always relied on private employers to fill in the
gaps for workers, rather than the state. U.S. workers have neither a strong social safety net
outside of the labor market, nor an extensive social welfare structure supporting the labor
market. For the most part, adequate provision of social benefits depends critically on employers’
voluntary adoption of support policies. For example, the U.S. has neither a universal health plan
nor a requirement that employers provide health insurance coverage; the U.S. public system of
old-age pensions is work-based, and that public system falls short unless supplemented by
additional (voluntary) employer contributions. This system largely marginalizes low earners,
people of color and immigrant populations, and those unable to work or irregularly attached to
the labor market, but also leaves much of the middle class vulnerable to cut-backs by their
employers.
This model is failing. Over the past generation, employers have increasingly pushed the
burden of economic risks associated with illness, unemployment, or old age onto individuals and
the state has not stepped in to cover those risks, exacerbating social exclusion. This trend has
been offset by only a handful of countervailing factors, which been insufficient to change the
overall course. While employers have maintained generous benefit packages for a privileged
few, they have reduced employment benefits for most. Because of the centrality of employer-
provided benefits and the absence or limited presence of broader government provision, this has
significantly weakened economic security for most.
This paper will start by discussing at some length the U.S. system of work-based social
supports, how it has changed, and the consequences for workers. In the following section we
briefly analyze the political and economic forces that have driven these changes, as well as
counterforces that can help to build a better system of supports. We close with brief reflections
on promising policy directions.
Those particularly interested in policy implications may wish to skip directly to the final
section, “Rebuilding a social support system for workers and their families.” In that section, we
argue that there are several key elements to a program to spread risk and reconstitute social
support: shoring up social insurance programs, enhancing employee voice in the workplace, and
designing policies that emphasize inclusion, connect economic security to other urgent economic
issues, and where appropriate start at the state or even local level to set the stage for broader
reforms.
2
In today’s changed political landscape, the time is ripe to take bold strides in rebuilding
the US social support system, beefing up workplace-based elements as well as developing
socially provided supplements. At the outset, however, we want to emphasize two critical
points. The first is that to deepen inclusion, it is essential to strive for universality, pushing back
against the political pressures to exclude particular groups, such as employees of smaller
businesses. The second is that given many Americans’ by now reflexive distrust of government,
it is necessary to find creative ways to make the case for policies that will indeed expand
government regulatory and transfer activities. Our goal with this paper is to help make that case.
The U.S. system of social protection for workers and how it has changed
The U.S. system does not include a basic government-provided set of supports for
families to help them mitigate the economic risks of illness, unemployment, or change in family
structure (such as divorce or a new child). Because the U.S. does not provide universal health
insurance, nearly one-in-six residents of the country lack health insurance coverage (DeNavas-
Walt, Proctor and Smith 2007). Most of those without coverage are children, but in addition,
nearly one-third of workers who earn less than $20,000 a year have no health insurance coverage
of any kind (Employee Benefit Research Institute 2006, Figure 17). Except in the state of
California, and soon Washington and New Jersey, U.S. workers do not have the right to paid
family leave or sick leave, in no place do workers have the right to vacation time, and part-time
workers are more often than not denied employment-based benefits. In an era when most
families had stay-at-home wives, this was far from ideal, but not a disaster. Now, with families
having little flexibility in terms of someone to provide care, this packs a double punch.
Given that 70 percent of families do not have a stay-at-home parent, another gap with
serious consequences is that the U.S. has no national system of child care. Private child care
costs are high, especially for the care of young children. In 2002, U.S. families in the bottom 40th
percentile or below who paid for formal daycare spent nearly one-fifth of their family total
income on child care, compared to only 6 percent among families in the highest quintile
(Boushey and Wright 2004). There are some government child care subsidies available to low-
income parents but recent research finds that across 10 states, less than 25 percent of eligible
3
children are served by these subsidies (Albelda, et al. 2007). The United States spends less than
one half of one percent of its budget on child care programs.
The countervailing trend is that while the state has pulled back from supporting non-
working poor families, there has been some shift toward supporting the income of the “working
poor,” low-income families with at least one worker. In the mid-1990s, the U.S. Congress passed
and President Clinton signed welfare reform, which effectively eliminated income supports for
non-working, able-bodied adults, even if they have small children at home. Meanwhile, the two
most important policy changes since welfare reform, the expansion of the Earned Income Tax
Credit (EITC) and the introduction of the State Children’s Health Insurance Program (SCHIP),
focus on extending benefits to low-income working families. The end of government-provided
income for low-income parents left some families in desperate straits, but arguably the extension
of other benefits has left many of the poorest families better off than before. However, these
expansions, while important, were limited at best. While some of the poorest working families
gained, most low-income families with a worker remain ineligible for work supports and many
of those eligible do not actually receive benefits (Albelda, et al. 2007).
Simultaneously, social exclusion has advanced through the rapid and sustained increase
in income inequality. Over the past thirty years, even though U.S. families have increased their
hours of labor force participation, average earnings per hour of work have stagnated, and
earnings inequality has grown. As a result, families have experienced slower growth in family
incomes, and widening family income inequality. As a result of slower income growth and
widening inequality, more families feel an economic squeeze. Whereas a generation ago, most
U.S. families could afford to have a stay-at-home parent--most often, the mother--today’s
families cannot afford to have a non-working parent. In 2006, over 70 percent of children grow
up in families without a stay-at-home parent.1
1 Authors’ analysis of U.S. Census Bureau , Current Population Survey, Annual Social and Economic Supplements, Tables F14, F13, F10, and FINC03.
At the same time, costs for basics, like health care,
housing, and child care, have increased far faster than inflation, putting them out of reach for
many families. Thus, while most U.S. families can afford a television or DVD player, which can
easily cost less than $100, many cannot afford the upwards of $300 to $1,000 per month
necessary to pay for health insurance coverage and health care expenses.
www.census.gov
4
But it wasn’t always this way: a comparison of the U.S. social protection system in the
early 1970s and today is enlightening. The most important fact is what has not changed: social
supports were and continue to be primarily employment-based. But there also have been
significant changes in recent decades. Government transfers have been sharply reduced. As
regards employment-based benefits themselves, some elements have been added or strengthened,
but others weakened, leaving a system that is, at best, inadequate and very uneven in its impact.
We start with a general description of the social protection system, emphasizing
components that have not changed over the years. Then we turn to the things that have changed.
It is important to stress that the U.S. system is a federal system, meaning that responsibility for
setting rules, administering programs, and paying for them is shared between the federal
(national) government and the 50 state governments. In some cases, program changes have
shifted responsibilities between levels of government.
Core elements of the worker-protection system The foundation of U.S. employment and social policy was established during the 1930s.
This core set of components was amended—most often enhanced—through the early 1970s, and
has remained fairly similar since then. This core includes a limited set of regulations and a
somewhat more expansive set of public-private benefits. The key labor regulations are minimum
wage and overtime pay provisions first enacted in the Fair Labor Standards Act of 1938, while
the cornerstone of public-private work-based benefits is the Social Security Act of 1935, which
established Old Age, Survivors, and Disability Insurance, commonly as “Social Security.” There
are a small handful of programs to assist workers who cannot work for some reason
(unemployment, illness, or caring for a family member). Other elements of the worker-protection
system, such as health insurance, pensions, and paid time off, are employer-based.
Worker rights
The basic U.S. labor standards are set out in the Fair Labor Standards Act (FLSA),
which when implemented, aimed to improve job quality as well as encourage business to create
more jobs rather than demanding more hours of current employees. Originally, the FLSA
excluded some groups of workers, but was extended from the 1940s through the 1980s to include
almost every worker except for employees of state and local government, small farms, and some
5
domestic workers (U.S. Department of Labor 2007a). Congress initially set the minimum wage
at about half of the median hourly wage. As of 1970, the minimum wage stood at 43 percent of
the median hourly wage (calculated by authors from U.S. Department of Labor 2007b and U.S.
Council of Economic Advisors 2007 Table B-47). The overtime provision pay provision of the
law requires employers to pay employees 150 percent of their normal wage for any hours above
40 worked in one week.
Health insurance
Most employed workers access health insurance through an employer, either theirs or a
family member’s. In 2005, 75 percent of those under age 65 receiving health insurance received
it either from their own employer or a family member’s (calculated by authors from Employee
Benefit Research Institute 2006). However, the U.S. health insurance system does include health
insurance coverage for some workers: 1965 legislation also established Medicaid, which
provides health insurance to very poor families that are viewed as less capable of work (very
poor adults, children, and the disabled). Only 13 percent of the under-65 population received
Medicaid in 2005 (Employee Benefit Research Institute 2006).
Paid time off
Beyond compensation in the case of long-term disability, the U.S. system does not
include a right to paid sick days (except in San Francisco and the District of Columbia), paid
holidays, or paid vacation. Some employers offer these benefits, but like other employer-based
benefits, they are offered primarily to higher-wage workers.
• In 2006, just over half (57 percent) of private sector workers had access to paid sick days
from their employer, about the same as had it in 1979 (U.S. Bureau of Labor Statistics
2006). Higher-paid workers are much more likely to have access to this benefit: in 1999,
38 percent of blue-collar and service employees had access to paid sick days, compared
to 81 percent of professional and technical employees and 59 percent clerical and sales
employees (U.S. Bureau of Labor Statistics 2001).
• If a worker does have paid sick days from their employer, they usually cover only the
worker’s own illness, not that of family members who may need their care: nearly two-
thirds (63 percent) of workers (both full-time and part-time) do not have access to paid
6
sick leave to care for a sick child (Lovell 2004). The share of employees without paid
sick leave for a child’s illness rises to 84 percent in construction and non-durable
manufacturing and 94 percent in accommodations and food services, an industry that
disproportionately employs women.
• In 2006, employers reported providing seventy-six percent of workers with paid holidays,
and 77 percent received paid vacation (U.S. Bureau of Labor Statistics 2007a). Among
those who received these benefits, the average was eight holiday days per year and nine
vacation days per year, rising to 16 days after ten years (U.S. Bureau of Labor Statistics
2007b).
Non-employed workers The most important source of support for non-employed workers is a private benefit: the
private pensions and retirement accounts that support large numbers of retirees. However,
federal and state laws have supplemented this source with a variety of publicly mandated or
provided benefits. The Social Security Act (SSA) is a social insurance program that provides
income in retirement to workers and their dependents and, as of the 1970s, a program for the
disabled. Its primary program is a pension paid out of current workers’ contributions (a “pay-as-
you-go” system), designed to supplement private pensions. Eligibility for the pension depends on
a history of employment and payment into the system by the recipient or his/her spouse. Most
Americans are eligible: in 2006, 93 percent of persons aged 65 and older received Social
Security (Employee Benefit Research Institute 2007, Chapter 7, Table 7.2). The contribution end
of the system is regressive, because the tax only applies to earned income up to a fixed
maximum, but the distribution end is progressive, repaying more to low earners relative to their
contributions (Dollars & Sense 1988). Persons over 65 who are entitled to Social Security
retirement benefits through their work history are also entitled to the Medicare health insurance
program, established in 1965 (U.S. Social Security Administration 2007a). Although much of the
Social Security Act applies to workers and their dependents, in 1972, the federal government
established in addition a Supplementary Security Income (SSI) program targeted to disabled
and blind people regardless of work history (U.S. Social Security Administration 2007b).
7
Some—but by no means most—workers who become unemployed, disabled, either
temporarily or permanently, or caring for a family member may be eligible for state assistance
through one of three programs:.
• Unemployment Insurance, which is administered by the states according to federal
guidelines. This program generally exclude new labor market entrants and people who
have quit or been fired for cause. Currently, about 40 percent of unemployed workers
receive benefits.
• Each state has a mandatory Workers’ Compensation insurance program. These
programs began in the early 1900s (American Association of State Compensation
Insurance Funds 2007).
• Five states also have mandatory Temporary Disability Insurance (TDI) programs. In
two states, California and New Jersey, the TDI program has been expanded to include
family leaves (caring for a new child or ill family member), not just individual disability
and Washington has set up a stand-alone program for paid parental leave.
Like Social Security, these three sets of programs are insurance-like, since workers’ income risks
are pooled and payments into the system (i.e. insurance premia) are made based on expected
benefit. If a worker meets certain eligibility requirements (such as a minimum duration of
employment, sufficient earnings and a qualifying job separation), she is eligible to receive
benefits from these programs regardless of wealth or non-wage income. The structure of these
programs links eligibility to work effort and is reserved for those workers with regular
employment. Finally, the funds for these programs come from specific taxes on employment
ultimately paid by workers, rather than general revenues paid by the whole population. The
unemployment and disability insurance programs aid small subsets of the population: in 2006,
less than three percent of the over-15 population received unemployment insurance, and another
three percent received Workers’ Compensation or SSI (U.S. Census Bureau 2007).
Changes in the work-based core Numerous changes have rocked the U.S. system of social support since the early 1970s.
We group these changes into changes in the core work-based elements, and modifications of
non-work-based support—some of which introduced new work requirements into supports
originally designed for non-working populations.
8
Core work-based supports are generally weaker than they were several decades ago. The
wage floor provided by the minimum wage has fallen (though recent legislation has boosted it).
Employer-provided pensions and health insurance are far less generous than they once were, and
political challenges threaten the public pension (Social Security) and elderly health insurance
(Medicare) systems. Cutting in the other direction is the establishment, for the first time, of a
right to unpaid family leave from work for the birth of a child or the illness of a family member
to about half the labor force. On net, these changes have weakened the core set of work-based
rights and benefits, shifting increased economic risks onto workers and their families.
Here is a breakdown of the major changes to the work-based core since the 1970s:
Fair Labor Standards Act
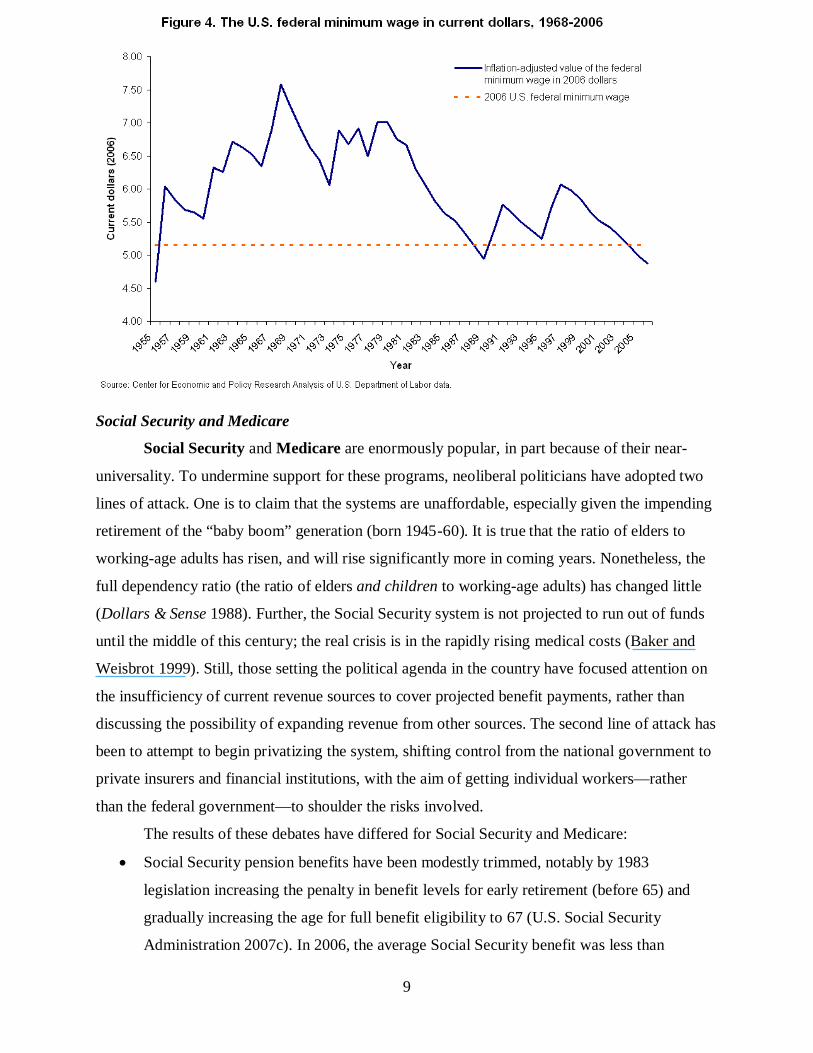
• Because the federal minimum wage is not tied to the inflation rate, it falls in real value
over time unless Congress moves to increase it. Beginning in the 1980s, Congress
stopped moving to increase the nominal minimum wage. In 2006, the purchasing power
of the federal minimum wage stood at 45 percent below its 1968 level, and equivalent to
only 31 percent of the median wage (Figure 1).
• In response to flaws in the federal minimum wage system, most states (and some cities)
have adopted state minimum wage laws: currently 30 states require minimum wages
above the federal level (U.S. Department of Labor 2007c). In 2007, the U.S. Congress
finally passed legislation to raise the federal minimum wage to $7.25 by mid-2009, but
this only partially restores the loss in purchasing power (not shown in Figure 4).
• Federal regulatory changes in 2004 reduced the reach of the overtime pay provisions by
greatly expanding the definition of “executive, administrative, and professional” workers,
who are exempted from the requirement of a 50 percent higher wage for hours worked
beyond 40 in a given week. These changes removed an estimated eight million workers
(about six percent of the total employed workforce) from eligibility for overtime pay
(Eisenbrey and Bernstein 2003; estimate calculated before the changes went into effect).
9
Social Security and Medicare
Social Security and Medicare are enormously popular, in part because of their near-
universality. To undermine support for these programs, neoliberal politicians have adopted two
lines of attack. One is to claim that the systems are unaffordable, especially given the impending
retirement of the “baby boom” generation (born 1945-60). It is true that the ratio of elders to
working-age adults has risen, and will rise significantly more in coming years. Nonetheless, the
full dependency ratio (the ratio of elders and children to working-age adults) has changed little
(Dollars & Sense 1988). Further, the Social Security system is not projected to run out of funds
until the middle of this century; the real crisis is in the rapidly rising medical costs (Baker and
Weisbrot 1999). Still, those setting the political agenda in the country have focused attention on
the insufficiency of current revenue sources to cover projected benefit payments, rather than
discussing the possibility of expanding revenue from other sources. The second line of attack has
been to attempt to begin privatizing the system, shifting control from the national government to
private insurers and financial institutions, with the aim of getting individual workers—rather
than the federal government—to shoulder the risks involved.
The results of these debates have differed for Social Security and Medicare:
• Social Security pension benefits have been modestly trimmed, notably by 1983
legislation increasing the penalty in benefit levels for early retirement (before 65) and
gradually increasing the age for full benefit eligibility to 67 (U.S. Social Security
Administration 2007c). In 2006, the average Social Security benefit was less than
10
$12,000 a year, out of a total average retirement income of close to $27,000 (U.S. Census
Bureau 2007). However, when the George W. Bush administration attempted in 2005 to
introduce and subsidize private individual retirement accounts as an option within the
Social Security system, Congress refused to approve the initiative.
• Medicare has consistently expanded (U.S. Social Security Administration 2007a), but in
2005, a privatizing proposal to incorporate and subsidize private insurers within
Medicare, packaged with an expansion of prescription drug benefits, was adopted by
Congress (Krugman 2005).
Employer-based benefits: pensions and health insurance
Relatively small changes in public pensions and health insurance contrast with sea-
changes in their private counterparts, which push the risks of retirement planning and health care
onto individuals, rather than employers. For the past thirty years, U.S. employers have massively
shifted from defined-benefit to defined-contribution retirement plans. A defined-benefit plan is
one where the employer commits to a set payment for the life of the retiree, which is usually
adjusted annual for inflation. A defined-contribution plan is one where the employer commits to
a certain level of financial contributions to an employee’s retirement saving account. The
employee is then responsible for managing the allocation of that account among stocks, bonds,
and cash. Employees with defined-contribution plans are not entitled to a set payment during
retirement and their benefit payment will not necessarily rise with inflation.
Defined-benefit plans tumbled from covering 84 percent of full-time workers holding
pensions in 1980 to 33 percent in 2003. Thus, employers have essentially shifted the risk of
retirement savings and planning onto workers. At the same time, the overall proportion of U.S.
workers covered by any retirement plan dropped, from 91 percent of full-time employees in 1985
to 65 percent in 2003 (Employee Benefit Research Institute 2007, Chapter 10, Table 10.1a). Due
to a combination of reduced pension coverage and smaller employer contributions, employer
pension contributions as a percentage of total compensation, which had soared from 1 percent in
1948 to 4 percent in 1977, dropped back to 2 percent in 1990, though the percentage has
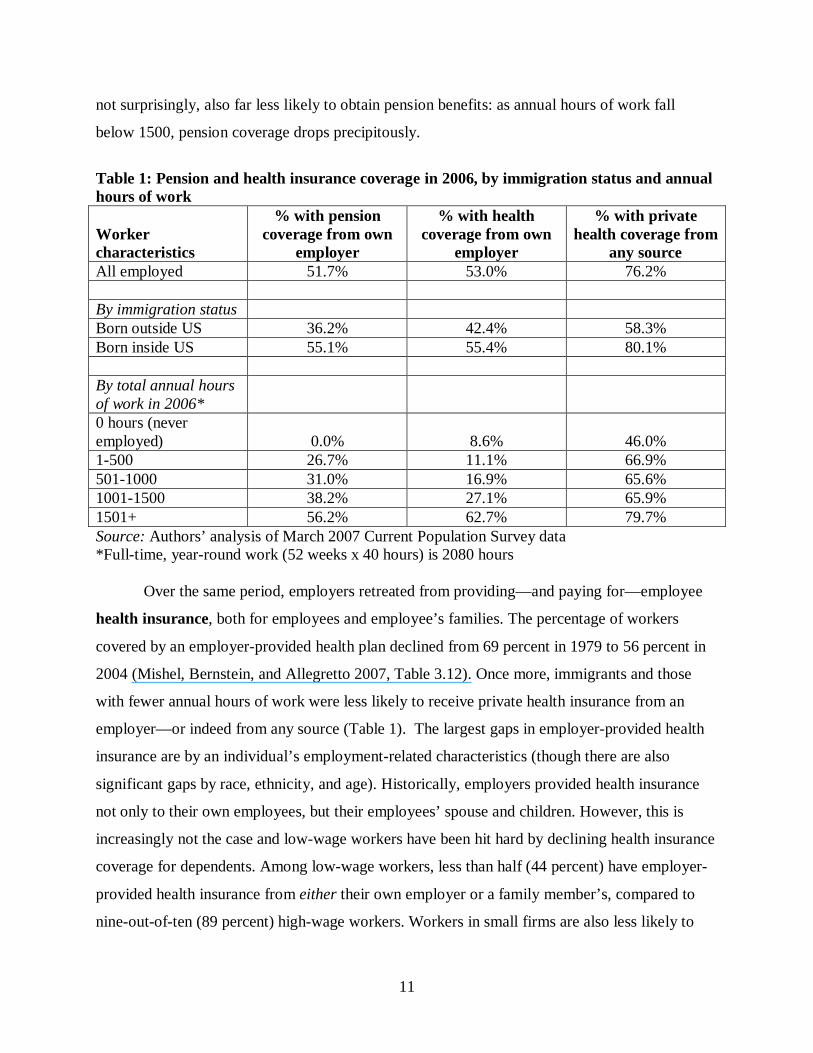
fluctuated since (Price 2005). Specific groups are particularly disadvantaged by these changes.
As shown in Table 1, while over half of native-born workers have access to pension coverage,
little more than one-third of immigrant workers do. Those less attached to the labor force are,
11
not surprisingly, also far less likely to obtain pension benefits: as annual hours of work fall
below 1500, pension coverage drops precipitously.
Table 1: Pension and health insurance coverage in 2006, by immigration status and annual hours of work
Worker characteristics
% with pension coverage from own
employer
% with health coverage from own
employer
% with private health coverage from
any source All employed 51.7% 53.0% 76.2% By immigration status Born outside US 36.2% 42.4% 58.3% Born inside US 55.1% 55.4% 80.1% By total annual hours of work in 2006*
0 hours (never employed) 0.0% 8.6% 46.0% 1-500 26.7% 11.1% 66.9% 501-1000 31.0% 16.9% 65.6% 1001-1500 38.2% 27.1% 65.9% 1501+ 56.2% 62.7% 79.7% Source: Authors’ analysis of March 2007 Current Population Survey data *Full-time, year-round work (52 weeks x 40 hours) is 2080 hours
Over the same period, employers retreated from providing—and paying for—employee
health insurance, both for employees and employee’s families. The percentage of workers
covered by an employer-provided health plan declined from 69 percent in 1979 to 56 percent in
2004 (Mishel, Bernstein, and Allegretto 2007, Table 3.12). Once more, immigrants and those
with fewer annual hours of work were less likely to receive private health insurance from an
employer—or indeed from any source (Table 1). The largest gaps in employer-provided health
insurance are by an individual’s employment-related characteristics (though there are also
significant gaps by race, ethnicity, and age). Historically, employers provided health insurance
not only to their own employees, but their employees’ spouse and children. However, this is
increasingly not the case and low-wage workers have been hit hard by declining health insurance
coverage for dependents. Among low-wage workers, less than half (44 percent) have employer-
provided health insurance from either their own employer or a family member’s, compared to
nine-out-of-ten (89 percent) high-wage workers. Workers in small firms are also less likely to
12
have employer-provided health insurance from either their own employer or a family member’s
(63 percent), compared to workers employed in large firms (76 percent). Thus, many low-wage
workers and those working in small firms who do not get employer-provided health insurance
from their own employer do not make up this lack of coverage by being covered on a family
member’s employer plan (Boushey and Wright 2004). Employers also shifted the cost of health
insurance onto employees. Whereas in the 1970s employers typically paid the full cost of health
insurance premia, by 1985 35 percent of employees contributed to the premium for individual
coverage, and that percentage climbed to 76 percent in 2005 (Employee Benefit Research
Institute 1985, Mishel, Bernstein, and Allegretto 2007 Table 3.13). Again, lower-wage workers,
along with women and racial minorities, were more likely to have to contribute to the premium.
Employers also added deductibles and co-payments that require employees to pay some of the
costs of health care directly rather than relying completely on the insurance.
Family leave
As the government and employers cut back many of the core work-based protections and
benefits, government did add one important new workplace-based benefit. Since 1993, over half
of U.S. workers have had access to unpaid leave under the Family and Medical Leave Act
(FMLA). FMLA provides up to 12 weeks of job-protected leave to workers when they have a
new child or they or a family member has a serious illness. Yet, because this leave is unpaid
(except in California and soon Washington and New Jersey), many who need it cannot afford to
take it. Among those who needed leave, but did not take it, nearly two-thirds reported that the
reason was that they could not afford to take unpaid leave (Commission on Leave 1996).
Although some employers exceed the law by offering paid family leave, their numbers are
shrinking. According to a study by the Work and Families Institute, the percentage of employers
offering paid childbirth leave has fallen from 27 percent in 1998 to 16 percent in 2008, and the
average length of allowed childbirth leaves has decreased (Shellenbarger 2008).
While we focus here on pecuniary benefits, it is worth mentioning here that a number of
other work protections have also eroded over time. Notably, enforcement of occupational safety
and health, anti-discrimination, and labor representation laws have weakened (see Bernhardt,
Boushey, Dresser, and Tilly 2008 for more discussion).
13
Reductions in non-work-based benefits and the addition of new work-based benefits While core work protections and benefits continued to decline over the 1990s, two other
changes complicated the picture. On the one hand, the federal government and states sharply
reduced non-work-based benefits, weakening a critical component of the safety net. On the other
hand, they added or expanded some new government-provided, work-based benefits.
Welfare reform
In 1996, the U.S. Congress passed, and President Clinton signed, the Personal
Responsibility and Work Opportunity Reconciliation Act, commonly known as “welfare
reform.” “Welfare,” in this case, refers to the former Aid to Families with Dependent Children
(AFDC) program, established in 1935, which principally supported single mothers of dependent
children. The landmark 1996 legislation replaced AFDC with a much-reduced Temporary
Assistance to Needy Families (TANF) program, focusing on moving families from welfare into
self-sufficiency as quickly as possible. Building on an accumulation of state work requirements,
time limits, and other restrictions on AFDC benefits, this legislation signaled the end of the
government’s willingness to provide cash assistance to able-bodied adults, regardless of their
status as parents or caretakers. Congress imposed a five-year lifetime limit on the receipt of cash
assistance, a requirement that 50 percent of welfare recipients had to participate in work by 2002,
and a reduction in the ability of welfare recipients to be in school while on welfare. Further,
Congress changed the program from one where everyone who was eligible was guaranteed
assistance to a block grant, which gives more discretion to the states to cap eligibility and
determine how to best spend public assistance funds. During the 1990s, the states also phased out
or greatly reduced General Assistance programs, the income support program of last resort for
able-bodied adults without dependent children.
In a less-noticed change that actually generated most of the savings in the reform,
Congress excluded many legal non-citizen immigrants who have entered the United States after
1996 from federally funded TANF, Medicaid health insurance, Food Stamps, and SSI disability
programs for a five-year period after entry, and empowers states to place further restrictions on
transfers to immigrants after the five-year period (though states may also use their own funds to
aid immigrants and some state restrictions have been pared back since 1996) (Tumlin and
Zimmerman 2003).
14
New work-based benefits
At around the same time, the U.S. Congress also expanded already-existing or new
programs—often known in the U.S. as “work supports”—to increase the benefits going to low-
income, working families:
• In 1996, Congress increased the value of the Earned Income Tax Credit (EITC), a tax
credit for low-income workers with families.
• The 1996 welfare reform legislation consolidated child care assistance and increased
funding for child care under the Child Care and Development Fund (CCDF).
• In 1997, Congress expanded low-income children’s access to health insurance through
Medicaid by implementing the State Child Health Insurance Program (SCHIP).
The end result was that due to the expansion of funding for Medicaid, SCHIP, CCDF, the EITC,
and the Child Tax Credit, low-income families received nine times more assistance in 1999 than
in 1984, as federal spending rose from $5.6 to $51.7 billion (in constant 1999 dollars)
(Congressional Budget Office 1998, Sawhill and Haskins 2002). While this increase is small
compared to the long-term losses in real wage levels experienced by low-wage families, it
represented a significant boost to low-income working families. The key shortcomings of this
policy shift are its failure to extend support to those just above very low-income cutoffs and the
fact that federal and state governments, after increasing spending in the late 1990s, retrenched it
in the 2000s.
The EITC and SCHIP, the largest pieces of this package of supports, merit further
explanation. The EITC is one of the only major work supports specifically designed to support
low-income families with workers. It was established as part of the federal personal income tax
code in 1975. When enacted, federal policy makers recognized that families with low-wage
workers, such as single mothers and families whose adult members are disabled or taking care of
members with disabilities, need some support. Significantly, the EITC provides a refundable tax
credit, meaning that the lowest-income families can receive a credit exceeding their total tax
liability—in essence, cash support from the government. While the EITC provides a fairly
significant tax credit, above $3,000 for families who receive the maximum, and most of those
eligible actually receive the benefit (Albelda, et al. 2007), the credit phases out rather quickly
with increasing income.
15
Medicaid was not designed to provide health insurance coverage to workers, even if they
are not offered (or cannot afford) employment-based health insurance. The goal of the 1997
expansion of Medicaid through SCHIP was to “to provide funds to States to enable them to
initiate and expand the provision of child health assistance to uninsured, low-income children in
an effective and efficient manner that is coordinated with other sources of health benefits
coverage for children.” This program provides health coverage for children of the working poor
(typically families with incomes somewhere between 100 and 200 percent of poverty), but not
their parents. One-in-seven children (14 percent in 2002) and 6 percent of adults under age 65
are covered by Medicaid or the State Child Health Insurance Program (SCHIP) (Boushey and
Wright 2004). However, low income limits for eligibility for the program cause many working
families to be excluded from the program, even though they still may not be able to obtain health
services through employer- or self-provided insurance and recent research finds that many of
those eligible for Medicaid/SCHIP do not actually access benefits (Albelda, et al. 2007).
Income trends and increasing social exclusion The net result of these changes in social supports is the creation of a two-tiered social
policy—which does not meet the needs of a three-tiered workforce. While the social safety net
provides work supports to the very poor and employers provide them for the upper and middle
classes, neither provides for a third tier, the working poor. In short, the way our social policy
system works, most low-wage workers are too rich for public supports, but too poor to afford
these goods and services on their wages. The lack of an adequate safety net for low-wage,
working parents threatens their ability to stay employed and move up the job ladder, as well as
their ability to parent effectively.
The gaps in U.S. social policy would be of less concern if incomes were rising
significantly across the income distribution. In that case, low-income workers would see
increases in their buying power, allowing them to afford to purchase benefits even if they did not
receive them from state or employer. In addition, growing numbers of workers would “graduate”
into the upper tier of jobs with employer-provided benefits.
But in the past three decades, U.S. economic growth has generally benefited only those at
the very top of the income ladder, rather than the broad working class. An analysis by
economists Thomas Piketty and Emmanuel Saez summarizes these harsh income disparities.
16
They found that despite several periods of healthy growth between 1973 and 2005, the average
income of all but the top ten percent of the income ladder—nine out of ten American families—
fell by 11 percent when adjusted for inflation (Piketty and Saez 2007). Yet, the economy—as
measured by gross domestic product (GDP)—has grown by over 160 percent since 1973. This is
only slightly less than the period from 1947 to 1973 when GDP grew by 176 percent. That’s
come as Americans have become much more productive—productivity has grown by over 80
percent since 1973—meaning it now takes fewer workers to produce the same number of
widgets as it did in the past (Baker 2007).
In a healthy economy, that growth is shared between workers and investors and wages
should rise with productivity. This was the case in the decades between World War II and the
early 1970s, when productivity and median wages both increased by an average of two to three
percent every year. But since 1973, productivity has increased sharply, especially since the mid-
1990s, but median wage growth has been flat and inequality has grown. Since 1973, the bottom
fifth of families have seen their income fall by an average of 0.2 percent per year, while the
bottom 40 percent have seen no growth at all. At the same time, the top fifth of families have
seen their income rise by 1.1 percent per year. The growth in inequality abated—but did not
reverse course—during the high employment years of the late 1990s. Since the recession of the
early 2000s, however, inequality has begun to grow again. Since 2000, families in the top fifth of
the economic ladder enjoyed a small income boost of 1 percent—the only families to see any
growth—while those in the bottom fifth lost nearly 5 percent (DeNavas-Walt, et al. 2007).
Trends in health care coverage have followed a similar pattern, even in the years since the
government’s creation of SCHIP and the extension of publicly-provided Medicaid to low
earners. During the most recent economic recovery, inequalities in access to health insurance
continued to grow. The share of the population without health insurance is now at nearly 16
percent, an all-time high (DeNavas-Walt, et al. 2007). For the most part, this is the result of a
continuing decline in employer-provided health insurance. Between 2000 and 2006, the share of
U.S. children and the share of adults with employment-based health insurance both fell by about
6 percent. Since most adults are ineligible for Medicaid, they are now swelling the ranks of the
uninsured, while, mostly because of the SCHIP expansion, the share of children with government
health insurance rose by close to 7 percent between 2000 and 2006. Yet, even with the SCHIP
17
expansion, there are more children without health insurance: From 2005 to 2006, the share of
uninsured children stepped up from 10.9 percent to 11.7 percent (Boushey 2007).
What has driven the changes? We have outlined recent changes in both the U.S. social support system and the overall
distribution of income and work-related benefits. Here we go on to suggest that a set of linked
attacks on the working class underlie both sets of changes. A powerful political coalition, which
ironically has been able to incorporate a large section of the working class, has promoted policies
that intensify these attacks. However, significant counter-forces to this anti-worker offensive are
beginning to build.
A three-part attack on the working class Elites in the United States have, since the 1970s, undertaken a three-fold assault on the
working class. The first prong has been business attempts to drive down (in real terms) private
compensation and shift economic risk from employers to workers. Employers went on the
offensive against unions, with the result that the share of U.S. workers in unions has fallen
sharply over the past half century. In 1948, almost one-in-three workers was in a union; by 2005,
the fraction had fallen to just one-in-eight (Schmitt and Zipperer 2007). Declining unionization
has been particularly acute in the private sector, compared to the public sector. This indicates
that decline in private-sector representation may have more to do with behavior of private-sector
employers than preferences of American workers, and indeed as of 2005 a majority of non-union
workers expressed a preference for union representation (Freeman and Rogers 2006, Exhibit I.6).
The employer behavior in question is concerted, illegal anti-union activity. Recent
research has found that almost one-in-five union organizers or activists can expect to be fired as
a result of their activities in a union election campaign. There has been a steep rise in the 2000s
relative to the last half of the 1990s in illegal firings of pro-union workers. By 2005, pro-union
workers involved in union election campaigns faced about a 1.8 percent chance of being illegally
fired during the course of the (Schmitt and Zipperer 2007). Moreover, employers to threaten to
close all or part of the business in more than half of all union organizing campaigns, and unions
win only 38 percent of representation elections when such threats are made, compared to 51
18
percent in the absence of shutdown threats (Bronfenbrenner 2000). Both firings of union
supporters and threats to close the plant violate the National Labor Relations Act.
With unions on the defensive and reduced to a small corner of the private sector,
employers have had a relatively free hand to contain or even reduce wages and curtail insurance
benefits in non-union settings with little fear of union organizing. As a result, the gap between
union and non-union compensation yawns wide. Full-time workers who are union members earn
30 percent more per week than their non-union counterparts (U.S. Bureau of Labor Statistics
2007c). Seventy percent of union workers have defined-benefit pension plans; only 15 percent of
nonunion workers do (Labor Research Association 2006).
In a second line of attack, businesses pressed elected officials to adopt neoliberal policies,
shifting the state away from support of labor. The restaurant and retail industries led the drive to
reduce the real value of the minimum wage, lowering the floor under private sector wages (Tilly
2005). On the public sector side, the 1975 New York City fiscal crisis marked a turning point:
financial institutions holding city debt demanded and won wage freezes and layoffs of city
employees as well as cutbacks in city services, heralding widespread efforts to undermine the
power of public employees by tough bargaining, subcontracting, and privatization of government
services (Harvey 2007). Beginning with President Reagan in 1981, Republican presidents
making appointments to the National Labor Relations Board, which makes rulings on allowable
labor relations practices by businesses and unions, began to choose board members more
opposed to unions, creating an ever less favorable terrain for union representation (Miller 2006,
Moberg 1998). Even federal training programs evolved, from the Comprehensive Employment
and Training Act of 1973, which paid the unemployed to perform public service jobs in nonprofit
organizations, through the Job Training Partnership Act of 1983, which ended paid public
service jobs and instead funded a variety of training programs for those most in need, to the
Workforce Investment Act of 1998, which, for the most part, reduced workforce development
services to pushing the unemployed to accept any job available (O’Leary, Straits, and Wandner
2004).
Another important aspect of neoliberal policy has been the adoption of “free trade”
agreements—in most cases designed primarily to facilitate capital investment abroad on
advantageous terms—with few protections for labor rights. Most importantly, in 1993, President
Clinton signed into law the North American Free Trade Agreement (NAFTA), which created a
19
trade area between Canada, the United States, and Mexico. Unlike the European Union, NAFTA
does not establish readiness criteria before poorer countries could be admitted, nor did it allow
for meaningful transfer of development funds (Anderson and Cavanagh 2004). This meant that
NAFTA was implemented without any meaningful or enforceable requirements for Mexico to
enforce international labor, social or environmental standards. Moreover, investor rights and
other provisions gave additional incentives for firms to relocate to Mexico to take advantage of a
weaker labor and regulatory environment (Bottari and Wallach 2005). In addition to the loss of
manufacturing jobs associated with the rise in the ballooning U.S. trade deficit with NAFTA
countries (Bivens 2006), NAFTA led to a climate where U.S. firms could increasingly squash
wage and collective bargaining demands and bargaining by invoking the threat of moving abroad
(Bronfenbrenner 1997, 2000). (Meanwhile, Mexican workers and farmers failed to realize
expected economic benefits as U.S. imports ravaged Mexican agriculture and the maquiladora
export assembly plants never developed economic linkages to the broader Mexican economy
[Scott, Salas, and Campbell 2006].) Estimates based on Krugman’s seminal trade work during
the 1980s and 90s show that pre-NAFTA trade liberalization dating from the 1970s accounts for
40 percent or more of the observed increase in U.S. inequality. Krugman now says trade in the
post-NAFTA period is even “a bigger factor than it was” in explaining inequality trends
(Krugman 2007; Baker and Weisbrot 2001; Cline 1997 p.264).
The third wing of the assault on worker’s standard of living came through attempts to
reduce the social wage, which we discussed above. The “welfare reform” of 1996, which
essentially ended government financial support for non-working single mothers, marked the
culmination of a long series of state and federal restrictions and benefit reductions of welfare
programs through the 1980s and early 1990s. Attempts to curtail the Social Security and
Medicare programs providing support for the elderly have so far been less successful.
The alliance behind the attacks, and the counter-forces The coalition driving the anti-working class offensive was led by business associations
and pro-business conservatives allied with anti-government libertarians. Grover Norquist, leader
of Americans for Tax Reform, famously declared, “My goal is to cut government in half in
twenty-five years, to get it down to the size where we can drown it in the bathtub” (Dreyfuss
2001). Of course, the downsizing of government was one-sided, since at the same time that the
20
social role of government was being scaled down, the penal system and the military were
expanded (Western and Beckett 1999).
A coalition of elites is not sufficient to maintain hegemony in a democratic society. The
neoliberal alliance succeeded by drawing in broad sections of the working class via two
rhetorical and strategic devices. The first was to lead with anti-government ideology, harnessing
racism (and the widespread view among whites that “big government” had primarily benefited
racial minorities, including immigrants), resentment by struggling workers of non-workers
receiving government aid, and widespread distrust of government, and contrasting government
with the traditional American value of individual initiative and advancement, exemplified by
George W. Bush’s espousal of an “ownership society” to justify privatization of Social Security
(Block 2006). The second stratagem linked economic liberalism with social conservatism,
mobilizing conservatives with issues such as abortion, undocumented immigration, and
homosexuality (Frank 2005, Tilly 1999). Both strategies, while centered in the Republican Party,
were able to enlist much support from Democrats as well.
The cornerstone of the coalition was tax-cutting (Miller 1997, 2001, 2004). Conservatives
launched the tax-cutting agenda in 1979 with California’s Proposition 13, a voter referendum in
which real estate interests organized home-owners to vote to cut property taxes. As in this case,
Congress from the 1980s through the 2000s repeatedly enacted tax reductions that primarily
benefited the wealthy and large businesses, in the name of tax relief for “ordinary families.”
The “market fundamentalist” agenda always faced opposition, with its core in unions,
big-city populations, and the social democratic wing of the Democratic Party. Pro-working class
forces have been able to win selective victories by attracting broader support on certain issues.
They have tapped widespread support for universal programs for the elderly, such as Social
Security and Medicare. They have also been able to build significant political support for aid to
children, as exemplified by the creation of the SCHIP health insurance program. The U.S. public
believes that workers deserve a decent wage, and campaigns for a higher minimum wage—
locally, at the state level, and nationally—have attracted broad public support as well (Tilly
2005). As conservative columnist Ramesh Ponnoru recently remarked, “The public does not
agree with us on [the minimum wage] issue; never has. Opposition to a higher minimum wage is,
for many people, explicable only in terms of greed and heartlessness” (Ponnoru 2007). The rapid
growth of health care costs has led some businesses to form unaccustomed alliances for reform
21
of the U.S. health care system: in February 2007 Wal-Mart, AT&T, and Kelly Services (the
largest temporary help agency in the country) joined forces with the Service Employees
International Union and the Communication Workers of America in a coalition calling for
affordable health coverage for everybody in the nation (Muy and Russakoff 2007).
Amplifying the impact of these political victories has been outrage at the federal
government’s failure to provide adequate relief after Hurricanes Katrina and Rita struck the Gulf
Coast of the United States in August 2005, and shock at the collapse of a highway bridge in
Minnesota in August 2007 that highlighted the extent to which government has failed to invest in
necessary infrastructure upgrading. As a result, public opinion has swung back toward endorsing
the need for government to support low-wage workers and invest in social spending. In a recent
poll, nearly one-third of Republican voters supported “tax increases on the most affluent
Americans to help reduce the federal deficit and to pay for expanding health care programs to
cover the uninsured” (Hart/Newhouse 2007). These shifts, along with the unpopularity of the war
in Iraq, allowed the Democratic Party to recapture majorities in both houses of Congress in 2006
(Judis and Teixeira 2007).
The summer-fall 2007 debate over the reauthorization of SCHIP, the new State
Children’s Health Insurance Program, provides one window into the state of the debate. As noted
above, the purpose of SCHIP was to fill in the gap in access to health care for the millions of
children living in families where the parents work, but employers have abdicated responsibility
to provide health insurance coverage. The SCHIP bill was immensely popular, but when it had to
be reauthorized in 2007, the President refused to sign into law a bill that expanded SCHIP’s
reach. The U.S. Congress voted to raise SCHIP funding levels both to enable states to sustain
existing children’s enrollment and to cover more low-income children. The agreement provided
financial incentives to states to enroll more uninsured children who are already eligible for
Medicaid or SCHIP. The Congressional Budget Office estimated that by 2012, a total of 3.8
million children who otherwise would be uninsured would have had health care coverage under
this bill (Congressional Budget Office 2007). This bill was supported by a wide range of
healthcare providers, advocates, and state-level policymakers, including the American Medical
Association and governors of both political parties. The bill passed both houses of Congress, but
President Bush vetoed it, denouncing the expansion as a “step toward [the Democrats’] goal of
government-run health care for every American” (Pasternak 2007).
22
The SCHIP confrontation, which pitted President Bush against public sentiment and even
against many members of his own party, illustrates the growing popularity of social spending
and the waning power of anti-”big government” rhetoric to derail social legislation. Nonetheless,
there are significant limits to legislative and public approval for a stronger social safety net and
more robust institutions to support job quality. The progressive coalition has rallied support for a
continued or strengthened social wage for children and the elderly, but has not been able to
extend that support to adults of working age. Ironically, the Earned Income Tax Credit, the most
significant expansion of government-provided cash support to low-income working-age adults in
recent decades, has gained backing in part appearing to be nothing more than a tax cut. Another
key limit is that Americans continue to see unions as a narrow special-interest group. Unless a
pro-working class coalition can challenge such limitations, the U.S. system of social supports is
likely to remain impoverished.
Rebuilding a social support system for workers and their families: What does economic security mean? The U.S. social support system is a failure. The decades since the 1970s have seen
growing divergence of wages, incomes, and access to benefits such as adequate pensions and
health insurance. The American two-tiered system of support provides generous, employer-
provided benefits for the affluent and limited (and sometimes temporary) but important support
for the lowest-wage workers. However, it offers little to the great bulk of low-income workers,
and even “middle class” workers—such as the auto workers at General Motors—who have
traditionally enjoyed adequate employer-provided benefits, are seeing those benefits scaled back
with no alternative source of support in sight. Inequality in incomes, as well as access to benefits,
like health insurance and pensions, has exacerbated social exclusion in the United States.
The principal thrust of changes in employer practices and public policy over the past
decades has been to shift economic risks onto workers (Hacker 2006). The costs of
unemployment, illness, retirement, and raising a family are increasingly dealt with by individual
workers and their families, rather than socialized through insurance schemes. As fewer workers
have access to defined-benefit pensions, most now must take on the risk of designing their own
retirement plan and saving adequate funds. Families who have a child must cope with the full
economic cost of this decision – from having to take unpaid time from work to care for that
23
child, to having to pay the full costs of infant and toddler care, which research shows is less
subsidized and typically more expensive than sending a child to a state university. Workers and
their families have increasingly become responsible for their own health care costs, with the
partial exception of the relatively small slice of families benefiting from SCHIP. Women, people
of color, immigrants, and those less firmly attached to the labor force are most likely to be left
more exposed.
Economic security should include attention to asset development, but the past few years
have shown that there are clear risks to relying on this strategy alone. Over the past decade,
workers who have invested their retirement in the stock market were hard hit by the 2000 stock
market crash, but that will likely pale in comparison to the losses – especially for low-income,
female-headed, minority and immigrant families – in investments in homes. Home prices fell an
average of 14 percent from March 2007 to March 2008, reaching an annualized rate of decline of
25 percent in the first quarter of 2008, and falling prices are affecting lower-cost homes the most
(Baker 2008).
A new social support system must focus on ensuring that illness, childbirth, old age, and
unemployment are not conditions that throw families into destitution. It cannot rely on individual
savings. If we learn anything from the bubbles, financial crises, and inflation in recent years, it
should be that workers cannot control the macro-economy and thus relying on asset development
to smooth economic risk can be a risky strategy.
We do not aim here to lay out a complete new blueprint for economic security. However,
we do wish to point out some of the promising directions where progress toward sharing risk and
broadening economic inclusion seems likely to be possible in the short to medium run.
Strengthening social insurance Insurance schemes are the easiest, most cost effective way to spread risk, both across
individuals, but also across the lifespan. The current political environment offers several
opportunities to expand insurance, reducing working people’s economic vulnerability. In all
cases, these are problems that other developed nations solved decades ago; while U.S. audiences
usually think that what happens in Europe is irrelevant, policymakers and advocates can learn
from the experiences of other countries in thinking through these proposals.
24
• Health insurance. States have already begun to move on this issue, notably
Massachusetts with its adoption of a universal mandate for health insurance—imperfect,
but a step in the right direction. The presidential campaign has highlighted the
widespread desire for a comprehensive, national system of health insurance to replace the
current threadbare patchwork. Both Sen. McCain and Sen. Obama have made access to
health insurance key parts of their platforms and it is likely that the 111th Congress will
look into this issue, so we should be prepared for a national debate.
• Paid family leave. Three states have already passed some form of family leave insurance
by establishing an insurance scheme to cover workers taking leave under the Family and
Medical Leave Act to care for a family member or recover from an illness and many
others are considering such policies. There are bills pending in both the House and the
Senate that would create a national Family Leave Insurance system, and the 110th
Congress will soon vote on paid parental leave for federal workers as a first step.
Supporting these campaigns at the federal and state level is key to helping families cope
with the risks associated with the lack of a stay-at-home parent.
• Pensions. With regard to pensions, there is not the same energy for broad reform as in
the case of health care. However, one promising prospect is to increase pension
portability as Washington and West Virginia are doing, reducing the economic liabilities
associated with job change. While Social Security reform was on the Bush
Administration’s agenda, it’s not likely to be a first priority of either a McCain or Obama
Administration, but retirement security will likely continue to be important at the state
level.
• Paid sick days. Paid sick days are a basic labor standard in nearly every other nation and
are a limited form of insurance against economic costs associated with illness. Proposals
to require a minimum level of paid sick leave are gaining traction in a number of states
and have already passed in San Francisco and the District of Columbia. Legislation is
pending in Congress, as well as a number of states, and this issue is likely to remain on
both the federal and state agenda.
25
Increasing worker voice At the level of the workplace and at the level of society, greater worker voice and
representation weigh on the side of stronger security and expanded inclusion. In the US
institutional environment, the key institutions for such voice are unions. But as noted above,
employers violate the current National Labor Relations Act with impunity, stalling union
organizing and flouting the intention of the law. The Employee Free Choice Act (EFCA) would
remedy this impasse by streamlining the process of gaining union representation (granting unions
representation rights once a majority of employees have indicated their preference for a union,
without requiring the public election campaigns that create opportunities for illegal employer
intimidation). Although this reform would not directly address problems of risk-shifting and
exclusion, the indirect effects could be enormous. EFCA passed the House in 2007, but have not
yet come up for a vote in the Senate. Winning the EFCA will be difficult due to nearly
unanimous business opposition (Weil 2008), but if 2008 brings a continuation of the political
realignment of 2006 and more pro-labor Senators, there will be an opening for change.
Inclusion, linkage, and federalism Achieving significant reforms will depend on designing good programs, but also crafting
compelling political arguments and putting together coalitions strong enough to achieve change.
Three principles that help to do both are inclusion, linkage, and federalism.
• By inclusion, we mean leveling the playing field by extending existing benefits to those
who are currently excluded. One of the great successes of the minimum wage policy is
that it applies to all but a small handful of employers. Many other policies, however,
exclude small businesses. The FMLA, for example, only covers about half of U.S.
workers, with the other 50 percent excluded because their employer is too small (fewer
than 50 employees). While this compromise was the cost of passing the original
legislation in Congress, it perversely cuts out those most in need of protection,
contributing to the multi-tiered nature of employment-based supports (Boushey and
Schmitt, 2007). Other criteria—such as job tenure requirements—also may unnecessarily
exclude low-wage, young, or part-time workers. Inclusion addresses the central problem
head-on. It also undergirds a compelling argument for reform, as demonstrated by the
effectiveness of the “CheneyCare” ad campaign by the California Nurses Association
26
(2008), which characterizes universal care as simply extending the Vice President’s plan
to the rest of the population.
• By linkage, we mean incorporating job quality concerns into other relevant legislation.
Living wage laws have been tremendously successful in linking job quality criteria to
municipal contracting and expenditures of public funds. The current political
environment offers important footholds for linkage. Two current areas of legislation that
afford this opportunity are “green jobs” programs—the point is not just to look at the
number of jobs, but whether they are adequate jobs—and any future attempts at fiscal
stimulus.
• By federalism, we mean keeping a sharp eye out for what levels of government are most
willing and able to move forward on particular issues. Ultimately, the goal should be an
adequate national system of social protection, and the shift of national sentiment toward a
larger federal government role in such protection offers hope for some national-level
reforms. But as the examples listed above highlight, states and in some cases even
localities have moved first on health insurance, pension portability, paid sick days, and
temporary disability insurance and are doing so in ways that incorporate inclusiveness
and linkage. State and local initiatives that incorporate the themes of inclusion and
linkage should be one focus of our work, while at the same time recognizing that winning
national-level reforms will require a separate effort.
In short, there are important opportunities to help insulate working families from
economic risk, while simultaneously expanding social and economic inclusion. This would
require that we focus our efforts on policies that are universal and do not capitulate to carve-outs
for particular groups if this in any way excludes those at the bottom of the economic ladder or
the more needy of that particular program. It also will require creative thinking outside the box to
find ways to push this agenda in after decades of cut-backs by employers. Americans have little
faith that government can solve their problems; the way to change that is to show them what
government does that is good and demonstrate how we can affect economic outcomes. The end
result would be a significantly stronger system of social support—still work-based in many
ways, but far more inclusive. These changes would represent a dramatic step forward for the
most disadvantaged American workers.
27
References
Albelda, Randy, Heather Boushey, Elizabeth Chimienti, Rebecca Ray, and Ben Zipperer. Bridging the Gaps: A Picture of How Work Supports Work in Ten States. Washington, DC: Center for Economic and Policy Research, 2007.
American Association of State Compensation Insurance Funds. 2007. “State funds: Their role in Workers’ Compensation.” http://www.aascif.org . Accessed 26/09/07.
Anderson, Sarah and John Cavanagh. 2004. “Lessons of European Integration for the Americas.” Institute for Policy Studies. http://www.ips-dc.org/EUlessons/index.htm
Baker, Dean. 2008. “Housing price decline accelerates.” Housing Price Monitor, Center for Economic Policy Research, May 28. http://www.cepr.net/index.php/data-bytes/housing-market-monitor/house-price-decline-accelerates/ . Accessed June 18, 2008.
Baker, Dean and Mark Weisbrot. 2001. “Will New Trade Gains Make Us Rich?” Center for Economic and Policy Research (CEPR) Paper, October.
Baker, Dean, and Mark Weisbrot. Social Security: The Phony Crisis. Chicago, IL: University of Chicago Press, 1999.
Baker, Dean. 2007. “The Productivity to Paycheck Gap: What the Data Show.” Washington, DC: Center for Economic and Policy Research. Bernhardt, Annette, Heather Boushey, Laura Dresser, and Chris Tilly. 2008. “An overview of the gloves-off economy: Workplace standards at the bottom of America’s labor market.” Paper for the Ford Foundation Economic Development Program, May 2008.
Bivens, L. Josh. 2006. “Trade Deficits and Manufacturing Job Loss: Correlation and Causality.” Economic Policy Institute Briefing Paper 171, March 14. Block, Fred. “A moral economy.” The Nation. http://www.thenation.com/doc/20060320/block. 20 March. Accessed 7/10/07.
Bottari, Mary and Lori Wallach. 2005. “The Record of NAFTA, Chapter 11: Investor-State Cases 1994-2005.” Public Citizen’s Global Trade Watch. Boushey, Heather. “Bush’s Painful, Lopsided Economic ‘Recovery’ Continues.” Alternet, August 30, 2007. < http://www.alternet.org/workplace/61004/?page=1>
Boushey, Heather and John Schmitt. “Job Tenure and Firm Size Provisions Exclude Many Young Parents from Family and Medical Leave,” Washington, DC: Center for Economic and Policy Research, 2007.
Boushey, Heather, and Joseph Wright. “Access to Employer-Provided Health Insurance as a Dependent on a Family Member’s Plan.” Washington, DC: Center for Economic and Policy Research, 2004.
28
Boushey, Heather, and Joseph Wright. “Health Insurance Coverage in the United States.” Washington, DC: Center for Economic and Policy Research, 2004.
Boushey, Heather. “No Way Out: How Prime-Age Workers Get Trapped in Minimum-Wage Jobs.” WorkingUSA: The Journal of Labor and Society 8, no. 6 (2005): 659-70.
Boushey, Heather. “Working Moms and Child Care.” Washington, DC: Center for Economic and Policy Research, 2004.
Bronfenbrenner, Kate. 1997. “The Effects of Plant Closing or Threat of Plant Closing on the Right of Workers to Organize.” North American Commission for Labor Cooperation, 1997.
California Nurses Association. 2008. “Nurses Launch National CheneyCare Campaign - New Print, Online Ads Jumpstart Petition Drive for Guaranteed Health Care.” Press release. http://www.calnurse.org/media-center/press-releases/2008/january/nurses-launch-national-cheneycare-campaign.html (consulted 6/16/08).
Cline, William. 1997. Trade and Income Distribution. Washington, D.C.: Peterson Institute for International Economics.
Bronfenbrenner, Kate. 2000. Uneasy Terrain: The Impact of Capital Mobility on Workers, Wages, and Union Organizing. Submitted to the U.S. Trade Deficit Review Commission. New York State School of Industrial and Labor Relations, Cornell University. September 6.
Centers for Medicare and Medicaid Services. “2003 Data Compendium.” http://www.cms.hhs.gov/researchers/pubs/datacompendium/current/.
Chapman, Jeff, and Michael Ettlinger. “The Who and Why of the Minimum Wage: Raising the Wage Floor Is an Essential Part of a Strategy to Support Working Families.” Washington, DC: Economic Policy Institute, 2004.
Commission on Leave. “A Workable Balance: Report to Congress on Family and Medical Leave Policies.” Washington, DC, 1996.
Congressional Budget Office, “CBO’s Estimate of Changes in SCHIP and Medicaid Enrollment of Children Under the House Amendments to the Senate Amendments to H.R. 976, the Children’s Health Insurance Program Reauthorization Act of 2007,” September 24, 2007.
Congressional Budget Office. “Policy Changes Affecting Mandatory Spending for Low-Income Families Not Receiving Cash Assistance.” Washington, DC, 1998.
Coven, Martha. 2005. “An Introduction to TANF.” Washington, DC: Center on Budget and Policy Priorities.
DeNavas-Walt, Carmen, Bernadette D. Proctor, and Jessica Smith. “Income, Poverty, and Health Insurance Coverage in the United States: 2006.” Washington, DC: U.S. Department of Commerce, Economics and Statistics Administration, U.S. Census Bureau, 2007.
29
Dollars & Sense. 1988. “Old and enduring: Social security survives conservative attacks.” January/February, 10-12.
Dreyfuss, Robert. 2001. “Grover Norquist: ‘Field Marshal’ of the Bush plan.” The Nation. May 14. http://www.thenation.com/doc/20010514/dreyfuss . Accessed 6/10/07.
Eisenbrey, Ross and Jared Bernstein. 2003. “Eliminating the right to overtime pay.” Briefing Paper. Economic Policy Institute, Washington, DC. June.
Employee Benefit Research Institute. 1986. “Features of employer health plans: Cost containment, plan funding, and coverage continuation.” Issue Brief No. 60. November.
Employee Benefit Research Institute. 1987. “A profile of the nonelderly population without health insurance.” Issue Brief No. 66. May.
Employee Benefit Research Institute. 2006. “Sources of health insurance and characteristic of the uninsured: Analysis of the March 2006 Current Population Survey.” Issue Brief No. 298. October.
Employee Benefit Research Institute. 2007. EBRI Databook on Employee Benefits. http://www.ebri.org/publications/books/index.cfm?fa=databook . Accessed 6/10/07.
Frank, Robert. 2004. What’s the Matter with Kansas: How conservatives won the heart of America. New York: Henry Holt and Company.
Freeman, Richard B. and Joel Rogers. 2006. What Workers Want, 2nd ed. Ithaca, NY: Cornell University Press.
Hacker, Jacob S. 2006 The Great Risk Shift: The Assault on American Jobs, Families, Health Care, and Retirement—And How You Can Fight Back. New York: Oxford University Press.
Hart/Newhouse (polling firm). 2007. “NBC News/Wall Street Journal Poll, September 2007.” Study #6076. http://online.wsj.com/public/resources/documents/WSJ-POLL-20071003.pdf . 4 October. Accessed 10/4/07.
Harvey, David. 2007. “Neoliberalism as creative destruction.” The Annals of the American Academy of Political and Social Science 610: 22-44.
Judis, John B. and Ruy Teixeira. 2007. “Back to the future: The re-emergence of the emerging Democratic majority.” The American Prospect. http://www.prospect.org/cs/articles?article=back_to_the_future061807 . 19 June.
Krugman, Paul. 2005. “A private obsession.” New York Times. 18 November.
Krugman, Paul. 2007. “Divided on trade.” New York Times. 14 May.
Labor Research Association. 2006. “The growing gap in benefits.” LRA Online. http://www.workinglife.org . September 15. Accessed 6/10/07.
30
Lovell, Vicky. “No Time to Be Sick: Who Suffers When Workers Don’t Have Sick Leave.” Washington, DC: Institute for Women’s Policy Research, 2004.
Miller, Congressman George. 2006. President Bush’s National Labor Relations Board
Miller, John. 1997. “Tax cuts: Clinton and Congress feed the wealthy.” Dollars & Sense. November/December.
Miller, John. 2001. “Still a bad idea: The Bush tax cut.” Dollars & Sense. March/April.
Miller, John. 2004. “Ronald Reagan’s legacy.” Dollars & Sense. July/August.
Mishel, Lawrence, Jared Bernstein, and Sylvia Allegretto. 2007. The State of Working America 2006-07. Washington, DC and Ithaca, NY: Economic Policy Institute and Cornell University Press.
Moberg, David. 1998. “Republicans warp the labor board.” The Progressive. May.
Muy, Ylan Q. and Dale Russakoff. “Wal-Mart, union join forces on health care.” Washington Post, 8 February, D1.
O’Leary, Christopher J., Robert A. Straits, and Stephen A. Wandner. 2004. Job Training Policy in the United States. Kalamazoo, MI: Upjohn Institute for Employment Research.
Pasternak, Judith. 2007. “Bush calls for compromise on children’s healthcare.” Los Angeles Times. 7 October. http://www.latimes.com/news/printedition/asection/la-na-children7oct07,1,4439599.story?coll=la-news-a_section . Accessed 7/10/07.
Piketty, Thomas and Emmanuel Saez. 2007. “Income Inequality in the United States, 1913-1998”, Quarterly Journal of Economics, 118(1), 2003, 1-39 (Longer updated version published in A.B. Atkinson and T. Piketty eds., Oxford University Press, 2007) (tables and figures updated to 2005 in Excel format, August 2007).
Ponnoru, Ramesh. 2007. “Woulda, coulda, shoulda: Where the GOP went wrong.” National Review 59 (16): 43, 10 September.
Price, Lee. 2005. “Shifting risk: Workers today near retirement more vulnerable and with lower pensions.” Issue Brief #213. Economic Policy Institute, Washington, DC. July 21.
Rho, Hye Jin, Danilo Pelletiere and Dean Baker. 2008. Ownership, Rental Costs and the Prospects of Building Home Equity: An Analysis of 100 Metropolitan Areas. Washington, DC: Center for Economic Policy Research. May.
Risen, James. 1995. “Fighting For Public Investment Amid a Revolution of Budget Cuts,” Los Angeles Times. July 30. Miller, Representative George. 2006. Workers’ Rights UnderAttack By Bush Administration President Bush’s National Labor Relations Board Rolls Back Labor Protections. Committee on
31
Education and the Workforce, U.S. House of Representatives. http://www.aflcio.org/joinaunion/upload/MillerReportNLRB.pdf . July 13. Accessed 6/10/07.
Ross, Donna Cohen, and Laura Cox. “Out in the Cold: Enrollment Freezes in Six State Children’s Health Insurance Programs Withhold Coverage from Eligible Children.” Washington, DC: Center on Budget and Policy Priorities, 2004.
Sawhill, Isabelle, and Ron Haskins. “Welfare Reform and the Work Support System.” In Welfare Reform and Beyond. Washington, DC: Brookings Institution, 2002.
Scott, Richard E., Carlos Salas, and Bruce Campbell. 2006. “Revisiting NAFTA: Still not working for North America’s workers.” Briefing Paper #173. Economic Policy Institute, Washington, DC. September 28.
Shellenbarger, Sue. 2008. “Downsizing maternity leave: Employers cut pay, time off.” Wall Street Journal, June 11, p.B1.
Terhune, Chad and Laura Meckler. 2007. “A turning point for health care.” Wall Street Journal, 27 September, 1 and 13.
Tilly, Chris. 1999. “Beyond patching the safety net: A welfare and work survival strategy.” Dollars & Sense. January/February 1999.
Tilly, Chris. 2005. “Living wage laws in the United States: The dynamics of a growing movement.” In Maria Kousis and Charles Tilly, eds., Threats and Opportunities in Contentious Politics. Boulder, CO: Paradigm Publishers.
Tumlin, Karen and Wendy Zimmerman. 2003. Immigrants and TANF: A Look at Immigrant Welfare Recipients in Three Cities. Assessing the New Federalism, Occasional Paper 69. Washington, DC: Urban Institute.
U.S. Bureau of Labor Statistics. 2007a. Employment and Compensation Survey data. http://www.bls.gov/ncs/ebs/ . Accessed 6/10/07.
U.S. Bureau of Labor Statistics. 2007b. National Compensation Survey: Employee Benefits in Private Industry in the United States, March 2007. Summary 07-05, August. http://www.bls.gov/ncs/ebs/sp/ebsm0006.pdf . Accessed 6/10/07.
U.S. Bureau of Labor Statistics. 2007c. “Median weekly earnings of full-time wage and salary workers by union affiliation and selected characteristics.” http://stats.bls.gov/news.release/union2.t02.htm . Accessed 6/10/07.
U.S. Bureau of Labor Statistics. “Employee Benefits in Private Industry.” Washington, DC: U.S. Department of Labor, 2006.
U.S. Bureau of Labor Statistics. “Employee Benefits in Private Industry.” Washington, DC: U.S. Department of Labor, 2001.
32
U.S. Census Bureau. 2007. “PINC-08. Source of Income in 2006-People 15 Years Old and Over, By Income of Specified Type in 2006, Age, Race, Hispanic Origin, and Sex.” http://pubdb3.census.gov/macro/032007/perinc/new08_001.htm . Accessed 6/10/07.
U.S. Council of Economic Advisors. 2007. Economic Report of the President. “2007 Report Spreadsheet Tables.” http://www.gpoaccess.gov/eop/tables07.html . Accessed 26/9/07.
U.S. Department of Labor, Employment Standards Administration, Wage and Hour Division. 2007a. “History of changes to the minimum wage law.” http://www.dol.gov/esa/minwage/coverage.htm . Accessed 26/9/07.
U.S. Department of Labor, Employment Standards Administration, Wage and Hour Division. 2007b. “History of federal minimum wage rates under the Fair Labor Standards Act, 1938-2007.” http://www.dol.gov/esa/minwage/chart.htm . Accessed 26/9/07.
U.S. Department of Labor, Employment Standards Administration, Wage and Hour Division. 2007c. “Minimum wage laws in the states: July 24, 2007.” http://www.dol.gov/esa/minwage/america.htm . Accessed 6/10/07.
U.S. Employment and Training Administration. 2007a. Unemployment Insurance Financial Data Handbook. Department of Labor ET Handbook No. 394. http://ows.doleta.gov/dmstree/handboos/394/link70.html#taxre . Accessed 6/10/07.
U.S. Employment and Training Administration. 2007b. “Unemployment Insurance Data Summary.” http://www.workforcesecurity.doleta.gov/unemploy/content/data.asp . Accessed 6/10/07.
U.S. Social Security Administration. 2007a. “Medicare: History of Provisions.” http://www.ssa.gov/history/pdf/hlth_care.pdf . Accessed 26/9/07.
U.S. Social Security Administration. 2007b. “SSI: History of Provisions.” http://www.ssa.gov/history/pdf/ssi.pdf . Accessed 26/9/07.
U.S. Social Security Administration. 2007c. “Summary of P.L. 98-21, (H.R. 1900) – Social Security Amendments of 1983.” http://www.ssa.gov/history/1983amend.html . Accessed 6/10/07.
Waldfogel, Jane. 2001. “Family and Medical Leave: Evidence from the 2000 Surveys.” Monthly Labor Review 124, no. 9: 17-23. Weil, David. 2008. “Mighty monolith or fractured federation? Business opposition and the enactment of workplace legislation.” Forthcoming in Annette Bernhardt, Heather Boushey, Laura Dresser, and Chris Tilly, eds., The Gloves-Off Economy: Workplace Standards at the Bottom of America’s Labor Market (Ithaca, NY: Cornell University Press).
Western, Bruce and Katherine Beckett. 1999. “How unregulated is the U.S. labor market? The penal system as a labor market institution.” American Journal of Sociology 104:1030–1060.
Top Related
Copyright © 2022 FDOKUMEN

