


Bahasa
Halaman
Hukum


VULNERABILITY TO POVERTY IN ITALY
NICOLA AMENDOLA
MARIACRISTINA ROSSI
GIOVANNI VECCHI
Working paper No. 7 - May 2012
DEPARTMENT OF ECONOMICS AND STATISTICS
WORKING PAPER SERIES
Quaderni del Dipartimento di Scienze Economico-Sociali e Matematico-Statistiche
ISSN 2279-7114 Founded in 1404
UNIVERSITÀ DEGLI STUDI
DI TORINO
ALMA UNIVERSITAS TAURINENSIS

1
Vulnerability to Poverty in Italy
Nicola Amendola**
Mariacristina Rossi*
Giovanni Vecchi**
Abstract
The article empirically analyses the phenomenon of vulnerability to poverty – meant
as an individual’s likelihood of becoming poor in the future. On the basis of studies
conducted by the Italian Institute of Statistics on the consumption of Italian
households in the years 1985-2001 and whose data have been rearranged in a pseudo-
panel form, the article estimates the incidence of vulnerability to poverty at national
and regional level. We find that potential poverty concerns an unexpectedly high
percentage of the population – even as much as 50% in some years. Regional
differences are broad, persistent and on the rise: moving from north to south, the risk
of becoming poor in the future triples. Vulnerability analysis turns out to be a useful
tool which should complement the traditional analysis of poverty.
JEL classification: C21, D12, I3, I32, I38.
Keywords: poverty; vulnerability; living conditions; wellbeing.
*Dipartimento di Scienze Economico-Sociali e Matematico-Statistiche, Università di Torino
and CeRP-CCA
**Dipartimento di Economia, Diritto e Istituzioni, Università di Roma “Tor Vergata”.

2
1. Introduction
Today, poverty analysis is a research field which mainly concerns development
economics and is largely applied to economies that have not yet reached the mature
or “balanced” phase of economic development. This is not to say that poverty is
unknown in advanced capitalist societies (Atkinson, 1998), but merely that, in these
societies, and especially in absolute terms, poverty has often been interpreted as a
marginal phenomenon or at least as something of the past and destined to fade away
in the long run. This is all the more true for European economies, which are
traditionally characterised by a robust welfare state.
However, the last few years have witnessed a gradual worsening of the welfare state
in Europe along with the financial crisis of 2007 and the following sovereign debt
crisis. Owing to generalised public debt consolidation policies, these crises are likely
to lead to further contractions or beak-downs of the social safety nets provided by the
State. This new picture leaves little room for excessive optimism and it is reasonable
to believe that the poverty issue will cease to be exclusively associated with
underdeveloped or developing economies. This is particularly true for Italy – a
country which, more than any other in Europe, has suffered from the economic crisis
and from tensions regarding its debt, and that, as some recent works demonstrate, has
experienced increasing income inequality over the last two decades (Amendola,
Brandolini and Vecchi, 2011; Jenkins, Brandolini, Micklewright and Nolan, 2011).
Despite this, absolute poverty in Italy, as in other European economies, remains a
difficult phenomenon to pinpoint (Amendola, Salsano and Vecchi, 2011; ISTAT
2011). It would in fact be more appropriate to adopt a concept of ex-ante poverty in
order to grasp not only, and not so much, poverty that is observed at a given moment
in time, but rather potential future poverty. “Vulnerability to poverty” is a concept
which aims to grasp the dimension of poverty linked to uncertainty. Uncertainty is an
immanent element of an individual’s existence and involves exposure to a set of risks
which, given the institutional context, are never perfectly insurable. When risk
materialises and turns into shock, the consequences can be a (temporary or
permanent) decrease in income and, more generally, a worsening in living conditions.

3
In the light of the aforesaid considerations, this work has a dual purpose. On the one
hand, it aims to enrich the descriptive picture of the dynamics of absolute poverty in
Italy – to extend it so as to include the concept of “vulnerability to poverty”, a term
we use concretely to define the likelihood that an individual may become poor in the
more or less distant future. On the other, the article aims to provide an example of
how using the measurement of vulnerability has important implications both in terms
of the analysis of wellbeing and in terms of policy implications.
The methodologically innovative econometric analysis proposed in this work
produces results that are surprising, in some respects. Starting from the latter half of
the 1980s, an unexpectedly broad section of the Italian population, although not poor
at the time of the survey, presented a high future “poverty risk”. In the period
examined, as many as 20-25 million non-poor individuals presented a higher than
average probability of becoming poor within a year. The regional distribution of the
phenomenon is also striking: a person emigrating from north to south of the country
runs an extra risk of future poverty at least three times greater than the one found in
the individual’s region of origin. These estimates strongly point to the urgent need for
actions to prevent the onset of poverty conditions that are potentially more
widespread than we can imagine.
The rest of the article is organised as follows. Section 2 defines the concept of
“vulnerability to poverty” at a conceptual and operational level, while section 3
illustrates the econometric model adopted to estimate vulnerability. Section 4
presents the main results obtained and then there is a concluding section.
2. Vulnerability to poverty
The term “vulnerability” is catching on in the scientific literature. It is an expression
that has not only spread in the social sciences, but is also found in other disciplines
such as environmental sciences, disaster management, and health and nutrition
sciences [Alwang, Siegel and Jørgensen 2001]. Indeed, because of its very popularity
and interdisciplinary nature, the term has taken on an elusive character over time:
people of different fields use it in different ways. To avoid any ambiguity in
interpretation, it is worth clarifying that in this work we have adopted a definition of
economic vulnerability which is now taking root in the specific field of development
economics and poverty analysis [Dercon 2001].

4
The reason why economists have introduced the concept of “vulnerability to poverty”
lies in the fact that the traditional measurement of poverty focuses on a circumstance
belonging to the past: the poor “are counted”… when they can be considered as such.
In this sense, in its traditional meaning, poverty is a state that can be defined and
measured only ex-post. Although being a fundamentally important measurement, it
seems legitimate and desirable – above all, from a policymaking standpoint – to
attempt to devise also an ex-ante measure: that is, an indicator which can grasp
potential poverty. An indicator of this kind would enable us to distinguish the
temporary poor, i.e., those who are at low risk of future poverty but who are in effect
poor, from the chronically poor, i.e., those who have a high probability of remaining
poor. Moreover, and this is perhaps the most qualifying aspect of the concept of
vulnerability, this kind of measurement would allow us to identify the section of the
population at greater risk of poverty: we are referring to those who, although not poor
today, may become so tomorrow if hit by a negative shock. Basically, it is a matter of
acknowledging the explicit role played by uncertainty along with the imperfections or
incompleteness of the markets which reallocate risk in determining individual well-
being. Therefore, vulnerability to poverty may be defined as “the likelihood of
becoming poor in the future” [Zhang and Wan 2009]1. Vulnerability is thus a
condition associated with potential, or latent, poverty which can affect not just, and
not necessarily, those who are poor today, but also those who have a high probability
of being poor tomorrow2.
As an example, let us consider the case of two households that are identical in
everything except for the head of the household’s occupation; in particular, let us
suppose that one of the two household heads is an employee while the other is self-
employed. Let us assume that the two households have an identical expected future
income for the whole working life of the head of the household. The variability of the
1 According to the definition given in the text, vulnerability is “expected poverty”. Ligon and Shechter
[2003] have defined vulnerability as “expected utility”; others have used the term vulnerability to
mean “exposure to risk” (that is non-insurable): Hoddinot and Quisumbing [2003a] provide a review
of the main approaches put forward in the literature. 2 We must distinguish between the concept of vulnerability to poverty and that of the “risk of poverty
and social exclusion” as defined by the European Union (EU) in its EU2020 strategy for combating
poverty. According to the definition adopted by the EU, an individual is considered at risk of poverty
and social exclusion if his/her family income is below 60% of the equivalent median income (a relative
poverty threshold) or if s/he can be considered deprived on at least 4 of the new set of deprivation
indicators or, finally, if s/he is underemployed (European Commission, 2010). Despite the terms used,
this definition lacks direct connections to the dimension of future poverty.

5
two households’ future incomes will, however, be different in that the income of self-
employed people is more variable than the one of subordinate workers. The
likelihood of experiencing future poverty will thus be different for the two
households: the household whose income is the most variable will have a higher
poverty risk (with expected income and every other household characteristic being
equal) compared to the household whose income is less variable. The conclusion is
that future income variability is an important factor in the determination of poverty
risk.
In more general terms, the concept of variability involves two interrelated aspects: on
the one hand, it explicitly introduces the role of risk and, on the other, the response to
risk. Vulnerability depends on the fact that in an uncertain environment there are
negative events which may arise with a certain probability and by the fact that these
events, when they do occur, cause a loss in household well-being. The vulnerability
of a family thus depends not only on the presence of negative shocks, but also on the
capacity, or incapacity, to respond to risk: the strategy available to the household may
be a preventive one – the household may, for instance, insure itself against risk – or a
reparatory one for the damage caused by the shock, for example, through a
decumulation of savings. It is common knowledge that households have a different
degree of exposure to risk that does not only depend on the environment, but also on
household characteristics and on the workings of, or access to, insurance and credit
markets. For example, a household with more economically active adults will have a
lower risk of becoming poor because it can implement a greater number of strategies
to deal with negative events (such as by increasing the household’s supply of labour).
At the same time, having household assets or not is crucial in facilitating credit access
and thus to guarantee the possibility of maintaining household consumption levels
unchanged also in view of negative income shocks.
By shifting the focus from the condition of actually being poor to the likelihood of
becoming poor in the future, it is possible to integrate the traditional analysis of
poverty by grasping three fundamental aims: a) establishing the typologies of subjects
who are the most vulnerable (those with a greater probability of becoming poor), b)
understanding which mechanisms make them such, and c) stepping in preventively by
devising support policies to prevent subjects from sliding into poverty. As regards
policymaking, it is a matter of changing perspective, much like the idea of shifting
from treatment to prevention.

6
Once the implicit change in perspective in the concept of vulnerability is clear, the
main problem is how to concretely measure the phenomenon. Unlike poverty,
vulnerability is a condition which, by definition, cannot be observed, but only
estimated. It is a kind of probability linked to a condition of future poverty. Various
methods for estimating vulnerability have been put forward in the literature
[Ravallion 1986; Murdoch 1994; Ligon and Schechter 2003; Dercon 2007] which
produce results that are often consistent with the profiles observed [Bourguignon,
Goh and Kim 2004]. Before going into the construction of a method which can be
applied to the Italian historical context (see section 3), it is worth clearing up what we
mean, operationally, by “vulnerability to poverty”.
In the traditional concept of poverty, a household is defined as poor if its level of
well-being – as measured by such things as the level of household expenditure on
consumption, expressed in per capita terms – lies below a minimum threshold, called
poverty line, in the year of reference. The procedure is the same in calculating
vulnerability to poverty, but this time not referring to current consumption, but to the
household’s consumption in the following year. Expected consumption can be
estimated without too many difficulties as long as adequate data are available: if, for
example, there is a sample-based study on household budgets replicated over time, it
is possible to devise a statistical model which stylises the consumer behaviour of
households. It will then also be easy to estimate its parameters on the basis of the data
and to use the results to make forecasts [Devicienti, Gualtieri and Rossi 2010]. Once
forecasts have been obtained from the estimated model, a given household may be
classified as “vulnerable” if it has a higher than average likelihood of falling below
the poverty line in the following year.
There are thus four possible combinations and each household may be classified as:
a) poor and vulnerable, b) poor but not vulnerable, c) not poor but vulnerable, and d)
not poor and not vulnerable. Case d) is the least relevant for constructing a poverty
profile since it concerns relatively “well-to-do” households far removed from a
condition or risk of poverty. Case c) instead defines an extremely relevant
circumstance, the one in which a household, although not poor, has a high (i.e. higher
than average) risk of becoming poor: this kind of household is perhaps the most
interesting one for policymakers because it represents a priority goal of poverty
prevention policies. Case a), the poor and vulnerable household, is also interesting
because it shows the existence of chronic poverty that households are trapped in. In

7
this case, policymakers should devise radically different policies from the ones for
case c): if insurance instruments may be effective with vulnerable but not poor
households, then chronic households require actions which can permanently increase
their income generating capacity. Finally, case b) concerns households that lie in a
condition of poverty which cannot be defined as chronic. Households belonging to
the latter category could be the type a) households who had benefited from effective
income support actions in the past: the increase of this category over time may, for
example, indicate the success of policies combating the spreading of poverty.
The next section illustrates the method for estimating vulnerability, according to
which Italian households are placed within the four aforesaid categories, in order to
follow up the relative dynamics. The estimates concern the years 1985-2001 because
the data suitable for the estimation method adopted here are only available for these
years. It will then be possible to distinguish the different types of poverty – chronic,
temporary, observed and potential poverty.
3. The method for estimating vulnerability
The method used for estimating vulnerability follows the lines put forward by
Bourguignon, Goh and Kim [2004], Chaudhuri [2003], and Christiaensen and
Subbarao [2004]. The first step in the procedure consists of estimating a consumption
model:
(1)
where index i stands for the household, index j is the cohort it belongs to, and index t
is time. Note that the stochastic error term is not homoscedastic. In particular, it
is assumed that:
(2) where
Error variance differs from cohort to cohort, depending on household characteristics
in the previous year. The heteroscedastic component is instead common to all
households belonging to the same cohort for each year.
The specification established by equations (1) and (2) admits the presence of a
differentiated effect of regressors on the mean and variance:

8
(3)
(4)
Let us consider an explicative variable such as wealth. Wealth is positively correlated
with consumption, but it also produces a decrease in the variability of consumption
itself. We may thus expect wealth to positively influence mean consumption (a
positive sign in equation 3) and to negatively influence consumption variability (a
negative sign in equation 4).
Equation (1) may be estimated when there are at least two consecutive waves of
observations for the same household. This is only possible when there are
longitudinal data, while the ISTAT data are cross-sectional. To get over this problem,
we aggregated the households belonging to a similar group as if they represented a
pseudo-household. The groups were established on the basis of date of birth, gender
and residence of the head of the household. This is the same as identifying the
“person” of our panel with a cohort of individuals that the data enable us to follow
over time. This strategy allows turning the available data – which have a very long
temporal dimension – into pseudo-longitudinal data.
The functional form chosen for in (4) is of the exponential type [Chaudhuri
2003]:
(5)
Coefficients and are estimated by means of the three-stage procedure in order to
correct for errors heteroscedasticity [Judge et al. 1988]. In a first step, through a least
squares regression (equation 1) at the cohort level, we obtain the residuals from
which to obtain an estimate of the error variance. Then, we generate consistent
estimates of parameter by regressing on X. The third step consists of
conducting a weighted estimate of (1) in order to account for the heteroscedasticity,
by regressing on . This enables us to
obtain an estimate of the predicted value of consumption (as a logarithm) and its
variance. These estimates allow us to construct a vulnerability index as follows:
(6)
9
where z is the poverty threshold (established at 60% of the median value of household
consumption of the year 1985 and maintained constant – in terms of purchasing
power – over the next years) and is the normal distribution. Once probability v is
estimated for each household in the sample, then in order to identify the vulnerable
households it is necessary to establish a threshold above which the probability of an
individual becoming poor is considered to be high. To this end, we can use the
sample mean of the number of poor people in each year – interpretable as the average
probability of becoming poor. In so doing, an individual is considered vulnerable if
the probability of becoming poor is greater than the sample incidence of poverty.
The peculiar characteristic of the “vulnerability to poverty” concept, as defined in
equation (6), lies in the fact that the measurement of vulnerability simultaneously
accounts for the current level of household incomes and the risk that this level can
decrease in the future owing to the uncertainty of the economic environment.
4. The vulnerability of the Italians
The uncertainty of future incomes is a very worrying thing for the Italians and it thus
restricts their capacity to enjoy the high levels of well-being achieved over the years
since the country’s unification. It is certainly worth understanding to what extent this
worry is just a subjective perception devoid of any actual empirical correlate or
whether it reflects a real phenomenon. The analysis presented in this section allows
us to shed some light on this aspect with regard to the years 1985-2001. By grouping
together the data collected by the study on household consumption carried out by
ISTAT every year, we obtain a sample of over half a million households,
corresponding to 1.4 million individuals, who are surveyed for details on their
consumption expenditure for goods and services as well as on their main socio-
demographic characteristics. Applying the method illustrated in section 3, we
estimated the vulnerability to poverty of the Italian population and then followed the
development over time. The main results are summarised in figure 1.

10
Figure 1. Chronic poverty and poverty risk, Italy 1985-2001
The figure shows the trend over time of the percentage of the Italian population classified as poor
(broken black line), chronically poor (orange line) and temporary poor (dotted line). The figure also
shows the percentage of the population at risk of poverty even if not actually poor (red line).
The first result concerns the trend of the country’s incidence of absolute poverty,
which fell significantly between 1985 and 2001. However, what is more interesting in
this context is the nature of the Italians’ poverty, which is considerably chronic (this
is how we may interpret the proximity of the line of the chronically poor to the line of
the total poor): of the poor households, the number of vulnerable households
fluctuates from 80% in 1985 to 85% in 2001 (see table 1). It is worth stressing here
that chronic poverty is probably the most loathsome form of poverty because the
suffering caused by being poor is aggravated by the lack of hope of getting over this
condition.

11
Table 1. Vulnerability to poverty in Italy, 1985-2001
Source: our estimates based on ISTAT data.
The second result concerns the vulnerability to poverty of the non-poor population –
the value which traditional measurements of poverty are unable to record. The figure
shows that the population currently not classified as poor, but with a higher than
average risk of becoming so, accounts for an unexpectedly high percentage: between
1985 and 2001 this percentage fluctuated stably between 35 and 40 percent. If we
focus our attention on the non-poor population (calculating the incidence only on the
non-poor population), the percentage is even higher.
The overall finding which emerges is that of a latent fragility in the economic health
of Italian households during the period analysed. It is thus not merely subjective
perception on the part of Italian households, but a real empirically proven
phenomenon. Unfortunately, it is not possible to extend the analysis to the most
recent decade owing to the variation in format with which ISTAT disseminates
datasets on household consumption. However, it seems reasonable to assume that
things have got worse rather than better, above all, if we think of the stagnation of
Italy’s GDP over the last ten years, to the effects of the Great Recession of 2008-09,
and to the increase in the inequality of income distribution [Amendola, Brandolini
and Vecchi 2011].
Still more eloquent is the finding on vulnerability to poverty disaggregated on the
basis of geographical region. Figure 2 shows a growing gap between southern Italy,
where vulnerability to poverty has increased dramatically, and the central and
northern regions which instead show a decreasing trend. Statistical analysis of the
vulnerability shows a lacerated country. The north-eastern regions show considerable
success in reducing households’ financial fragility to a greater degree compared to
other areas of the country. Even the north-western regions have managed to reduce
their residents’ vulnerability to poverty, but to a lesser degree. With respect to these
virtuous trends we find a clear worsening in the southern regions, with trends and
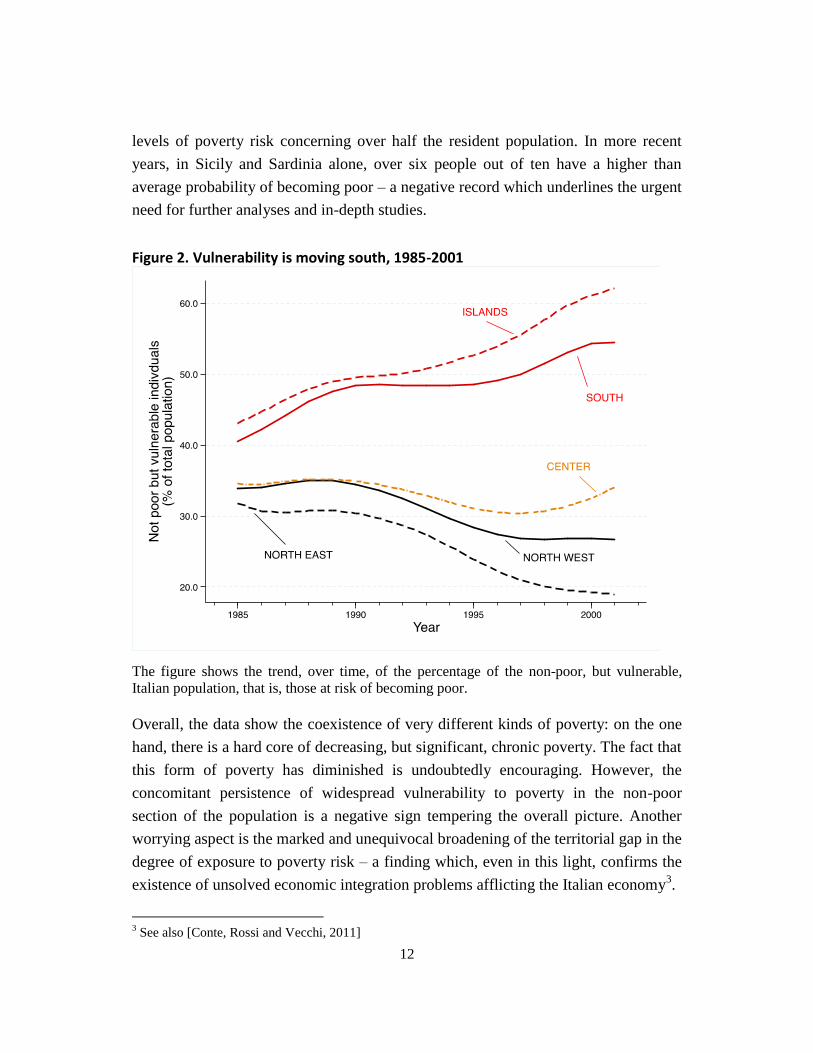
12
levels of poverty risk concerning over half the resident population. In more recent
years, in Sicily and Sardinia alone, over six people out of ten have a higher than
average probability of becoming poor – a negative record which underlines the urgent
need for further analyses and in-depth studies.
Figure 2. Vulnerability is moving south, 1985-2001
The figure shows the trend, over time, of the percentage of the non-poor, but vulnerable,
Italian population, that is, those at risk of becoming poor.
Overall, the data show the coexistence of very different kinds of poverty: on the one
hand, there is a hard core of decreasing, but significant, chronic poverty. The fact that
this form of poverty has diminished is undoubtedly encouraging. However, the
concomitant persistence of widespread vulnerability to poverty in the non-poor
section of the population is a negative sign tempering the overall picture. Another
worrying aspect is the marked and unequivocal broadening of the territorial gap in the
degree of exposure to poverty risk – a finding which, even in this light, confirms the
existence of unsolved economic integration problems afflicting the Italian economy3.
3 See also [Conte, Rossi and Vecchi, 2011]

13
5. Conclusions
This article examined the role of uncertainty in determining the potential poverty of
Italian households. A riskier environment, together with inadequate or non-existent
insurance instruments or social protection networks, make individuals more
vulnerable to negative shocks with regard to income and/or wealth. The method
adopted in this article to estimate poverty risk is well suited to the country’s data
since it exploits the diachronic dimension. Although the analysis carried out has an
experimental feature and is geared to describing, rather than explaining, the
development of the poverty risk of Italian households, the results are encouraging and
suggest that it is a useful tool in order to monitor the development of the phenomenon
and to improve policymaking in the fight against poverty.
However, it is possible and desirable to extend the analysis of vulnerability. One
possible direction for further study consists of establishing a more detailed profile of
poverty risk in order to identify the characteristics of vulnerable households in greater
detail. In this sense, the estimates of vulnerability to poverty presented in this work
are a preliminary to more detailed future analysis and refinement, above all, with a
view to meeting the knowledge needs of poverty prevention policies. The explorative
nature of the analysis carried out in this work has not hindered the identification of
two very different phenomena which are both present throughout the period
examined: on the one hand, a “hard core” of chronic poverty and, on the other, the
broader dimensions of potential poverty, a considerable section of the population
who, although not currently poor, have a significant probability of becoming so in the
future. This is a dimension of poverty of the Italians that has remained largely
unknown and unexplored.
The fact that almost 90 percent of poverty is of a chronic nature means that there is
no turnover among the poor – a result that is in line with the country’s low social
mobility (Piraino, 2007). High chronic poverty and high vulnerability to poverty are
worrying factors because they show the country’s poor resilience with regard to
sudden changes in social protection systems or to cyclical macroeconomic
turbulences.
Risk and uncertainty are unavoidable aspects of life. There are two ways, or a
combination of the two, to deal with them. The first is to resort to private saving for
“a rainy day”, thereby taking resources away from current consumption, as Keynes

14
recalled in 1936. The other, theoretically more efficient, way is to implement a rapid
intervention mechanism to, at least partly, safeguard households from the
consequences of risk (Diamond, 1981). In the latter case, however, the welfare
system must be well-organised to actually reach out to vulnerable households – not
necessarily and not only the ones who are poor from an income standpoint.

15
References
Amendola, N., Brandolini A. and Vecchi G. (2011), “Disuguaglianza”, in G. Vecchi,
In ricchezza e in povertà. Il benessere degli italiani dall’Unità a oggi. Bologna: Il
Mulino.
Atkinson, A.B. (1998), Poverty in Europe, Oxford, Blackwell
Alwang, J., Siegel P.B and Jørgensen S.L (2001), “Vulnerability: A View from
Different Disciplines”, World Bank Social Protection Discussion Paper, no. 115.
Bourgignon F., Chor-ching Goh and Dae Il Kim (2004), “Estimating individual
vulnerability to poverty with pseudo-panel data”, World Bank Policy Research
Working Paper, no. 3375.
Chaudhuri, S. (2003), “Assessing Household Vulnerability to Poverty: Concepts,
Empirical Methods, and Illustrative Examples”, Columbia University, mimeo.
Christiaensen, L. J. and Subbarao, K. (2005) “Towards an understanding of
household vulnerability in rural Kenya”, Journal of African Economies, 14(4), pp.
520–558.
Commissione d’indagine sulla povertà e sull’emarginazione (1997), La spesa
pubblica per l’assistenza in Italia. Roma: Presidenza del Consiglio dei Ministri,
Dipartimento per l’informazione e l’editoria.
Conte L., Vecchi G. and Rossi M. (2011), Vulnerabilità, in G. Vecchi, In ricchezza e
in povertà. Il benessere degli italiani dall’Unità a oggi. Il Mulino.
Dercon, S. (2007), Insurance Against Poverty. Oxford: Oxford University Press.
Devicienti F., Gualtieri V. and Rossi M. (2010) "The Dynamics and Persistence of
Poverty: Evidence from Italy," Carlo Alberto Notebooks, 173.
Diamond P., (1981), Mobility Costs, Frictional Unemployment and Efficiency,
Journal of Political Economy, 89(4), pp.798-812.
European Commission (2010), Europe 2020. A strategy for Smart, Sustainable and
Inclusive Growth, Communication from the Commission, Brussels

16
Hoddinott, J. and Quisumbing A. (2003a), “Methods for microeconometric risk and
vulnerability assessments”, World Bank Social Protection Discussion Papers, no.
324.
Hoddinott, J. and Quisumbing A. (2003b), “Data sources for microeconometric risk
and vulnerability assessments”, World Bank Social Protection Discussion Papers
ISTAT (2011), “La povertà in Italia, anno 2010”, Comunicato stampa
Jenkins, S., Brandolini, A., Mickelwright, J. and Nolan, B. (2011), “The great
recession and the distribution of household income”, Fondazione Rodolfo De
Benedetti
Ligon, E. and Schecther L. (2003), “Measuring Vulnerability”, Economic Journal,
113, 486: 95-110.
Piraino, P. (2007), “Comparable Estimate of Intergenerational Income Mobility in
Italy”, The B.E. Journal of Economic Analysis & Policy, Vol 7, Issue 2, 1-25
Zamagni, V. (1993) The economic history of Italy 1860-1990, Oxford Clarendon
Press
Zhang, Y. and Wan G. (2009), “How Precisely Can We Estimate Vulnerability to
Poverty?”, Oxford Development Studies, 37, 3: 277-87.

DEPARTMENT OF ECONOMICS AND STATISTICS UNIVERSITY OF TORINO
Corso Unione Sovietica 218 bis - 10134 Torino (ITALY) Web page: http://esomas.econ.unito.it/
Top Related
Copyright © 2022 FDOKUMEN

