


Bahasa
Halaman
Hukum

Vulnerability and Risk Assessment Framework and Indicators 1

Vulnerability and Risk Assessment Framework and Indicators2
Vulnerability and Risk Assessment Framework and Indicators 1
Vulnerability and Risk Assessment Framework and Indicators
For National Adaptation Plan (NAP) Formulation Process in Nepal
National Adaptation Plan Formulation ProcessMay 2017
Government of Nepal
Ministry of Population and Environment

Vulnerability and Risk Assessment Framework and Indicators2
Published byGovernment of NepalMinistry of Population and EnvironmentClimate Change Management DivisionNational Adaptation Plan Formulation ProcessSecretariat ComplexSinghdurbar, Kathmandu, Nepal
Phone: (+977-1) 4211855Fax: (+977-1) 4211954 Website: www.napnepal.gov.npE-mail: [email protected]: @nap_nepal
© Government of Nepal, Ministry of Population and Environment (MoPE), 2017
Supported byUK Aid, Action on Climate Today, Oxford Policy Management Limited and Practical Action;
Support to Rural Livelihoods and Climate Change Adaptation in the Himalayas (Himalica), European Union, and International Centre for Integrated Mountain Development (ICIMOD)
ContributorsNAP Expert team: Batu Krishna Uprety, Gyanendra Karki, Kirti Kusum Joshi, Devendra Adhikari, Jony Mainaly, Nirmal Bishwakarma, Thakur Devkota, Shree Bhagwan Thakur, Thakur Pandit, Raju Pandit Chhetri, Basanta Paudel, Karuna Adhikaree
MoPE: Ram Prasad Lamsal, Naresh Sharma
Practical Action: Sunil Acharya, Dinanath Bhandari, Gehendra Gurung, Krity Shrestha, Dipak Bishwokarma
ICIMOD: Bimal Raj Regmi, Giovanna Gioli, Vishwas Chitale, Janita Gurung, Santosh Nepal
Citation: MoPE. 2017. Vulnerability and Risk Assessment Framework and Indicators for National Adaptation Plan (NAP) Formulation Process in Nepal. Ministry of Population and Environment (MoPE), Kathmandu.
Design and Print: Beeline Communications, [email protected]
Vulnerability and Risk Assessment Framework and Indicators 3
FOREWORDThe Government of Nepal (GoN) is committed to respond to climate change risks and impacts through integrated policies and affirmative actions. The GoN as a party to the United Nations Framework Convention on Climate Change (UNFCCC), initiated the National Adaptation Plan (NAP) formulation process with a launching workshop held in Kathmandu in September 2015. The NAP formulation process in Nepal is led by the Ministry of Population and Environment (MoPE). MoPE has engaged seven thematic working groups (TWGs) and two Cross-cutting Working Groups (CWGs), which cover the major climate change sensitive sectors in the NAP formulation process.
The NAP process was established to build on the country’s rich experiences in addressing adaptation through the National Adaptation Programme of Action (NAPA), and through it to address medium and long-term adaptation. The process aims to assist Nepal and other Least Developed Countries (LDCs) to reduce their vulnerability to the impacts of climate change by building adaptive capacity and resilience, and by facilitating the integration of climate change adaptation into development planning.
The framework and indicators on Vulnerability and Risk Assessment (VRA) have been developed by the NAP expert team, with input and feedback from MoPE and experts from Practical Action and International Centre for Integrated Mountain Development (ICIMOD), to support the NAP process. The VRA framework presented here is based on the Fifth Assessment Report (AR5) of the Intergovernmental Panel on Climate Change (IPCC) and the NAP technical guidelines, and has been devised for use in the overall vulnerability and risk assessment that is required for the NAP formulation process.
The VRA framework and indicators offer a range of options to deal with each element of the NAP process and are based on guiding principles of the NAP process. These are not prescriptive, and respective thematic and CWCs can decide on the specific steps for their sectoral assessment process.
On behalf of MoPE, I thank the efforts of Ram Prasad Lamsal (Joint secretary), Naresh Sharma (NAP Coordinator), the NAP team, experts of Practical Action and ICIMOD involved in preparing the document,and members of the thematic and cross-cutting working groups for guiding the process. I also appreciate the funding and technical support of Action on Climate Today (ACT) – a UK Aid funded initiative led by Oxford Policy Management Limited (OPML) and Practical Action; and Support to Rural Livelihoods and Climate Change Adaptation in the Himalayas (Himalica) project led by International Centre for Integrated Mountain Development (ICIMOD).
Bishwa Nath Oli, PhDSecretary
Ministry of Population and Environment
Vulnerability and Risk Assessment Framework and Indicators4
Contents
Page noContents
Foreword i
Acronyms iii
Chapter 1: Introduction 1
Chapter 2: Vulnerability and Risk Assessment Framework 3
2.1. Relevance of Vulnerability and Risk Assessment in Adaptation Planning 3
2.2. Conceptual Framework for Vulnerability and Risk Assessment 4
2.3. Assessment methods and approaches 5
2.4. Key methodological steps for VRA assessment 7
Chapter 3: Indicators for Vulnerability and Risk Assessment 9
3.1. Vulnerability and Risk Assessment Indicators for Agriculture and
Food Security (Nutrition) 10
3.2. Vulnerability and Risk Assessment Indicators for Climate-induced Disasters 14
3.3. Vulnerability and Risk Assessment Indicators for Forest and Biodiversity 18
3.4. Vulnerability and Risk Assessment Indicators for Gender and Marginalised
Group (Social Inclusion) 21
3.5. Vulnerability and Risk Assessment Indicators for Livelihoods and Governance 25
3.6. Vulnerability and Risk Assessment Indicators for Public Health (WASH) 29
3.7. Vulnerability and Risk Assessment Indicators for Tourism, Natural and Cultural
Heritage 33
3.8. Vulnerability and Risk Assessment Indicators for Urban Settlements and
Infrastructure 36
3.9. Vulnerability and Risk Assessment Indicators for Water Resources and Energy 42
Chapter 4: The Way Forward 46
References 48
Vulnerability and Risk Assessment Framework and Indicators 5
ACT Action on Climate Today AEPC Alternative Energy Promotion Centre ANSAB Asia Network for Sustainable Agriculture and Bio-resourcesCAA Civil Aviation Authority of Nepal CBS Central Bureau of StatisticsCCA Climate Change AdaptationCDR Crude Death Rate COP Conference of the Parties DDC District Development CommitteeDDRRC District Disaster Risk Reduction Centre DFO District Forest OfficeDFRS Department of Forest Research and SurveyDHM Department of Hydrology and MeteorologyDNPWC Department of National Parks and Wildlife ConservationDoA Department of ArchaeologyDoED Department of Electric Development DoF Department of Forest DoFish Department of Fisheries DoHS Department of Health Services DoIn Department of Industry DoIr Department of Irrigation DoLIDAR Department of Local Infrastructural Development and Agricultural RoadsDoR Department of RoadDoS Department of SurveyDPR Department of Plant ResourcesDSCWM Department of Soil Conservation and Watershed Management DUDBC Department of Urban Development and Building ConstructionDWIDM Department of Water Induced Disaster Management DWSS Department of Water Supply and Sewerage
Acronyms
iii
Vulnerability and Risk Assessment Framework and Indicators6
EbA Ecosystem Based Adaptation FAO Food and Agriculture OrganisationFC Faecal Coliforms FECOFUN Federation of Community Forestry Users, NepalFNCCI Federation of Nepalese Chambers of Commerce and Industry GCM Global Circulation ModelGDP Gross Domestic ProductGESI Gender Equality and Social Inclusion GLOF Glacier Lake Outburst Flood GPCM Global Precipitation Climatology CentreGWRDC Gujrat Water Resource Development Committee HAN Hotel Association of NepalHKH Hindu Kush Himalayan HSN Heritage Society of Nepal IBN Investment Board Nepal ICIMOD International Centre for Integrated Mountain Development IMNCI Integrated Management of Neonatal and Child IllnessILO International Labour OrganisationIPCC Intergovernmental Panel for Climate ChangeIPPAN Independent Power Producers’ Association, Nepal IUCN- International Union for Conservation of NatureJE Japanese EncephalitisKUKL Kathmandu Upatyaka Khanepaani Limited LDCs Least Developed Countries LDOF Landslide Dam Outburst FloodLEG Least Developed Countries Expert Group LI-BIRD Local Initiatives for Biodiversity, Research and Development LWF Lutheran World FederationMCPM Minimum Compliance Performance Measurement MoAD Ministry of Agricultural Development MoCPA Ministry of Cooperative and Poverty Alleviation MoCTCA Ministry of Culture, Tourism and Civil Aviation MoEd Ministry of Education MoEn Ministry of Energy MoF Ministry of FinanceMoFALD Ministry of Federal Affairs and Local Development MoFSC Ministry of Forests and Soil Conservation MoH Ministry of Health MoHA Ministry of Home AffairsMoIr Ministry of Irrigation MoIC Ministry of Information and CommunicationMoLD Ministry of Livestock Development, MoLE Ministry of Labour and EmploymentMoLRM Ministry of Land Reform and Management MoPE Ministry of Population and Environment MoUD Ministry of Urban Development MoWCSW Ministry of Women, Children and Social Welfare MoWSS Ministry of Water Supply and Sanitation NARA Nepal Association of Rafting AgentsNARC Nepal Agricultural Research CouncilNAST Nepal Academy of Science and Technology,
iv
Vulnerability and Risk Assessment Framework and Indicators 7
NBSAP Nepal Biodiversity Strategies and Action Plans, NCA Nepal Canyoning AssociationNCD Noncommunicable DiseaseNEA Nepal Electricity Authority NHRC Nepal Health Research CouncilNLCDC National Lake Conservation Development CommitteeNLSS Nepal Living Standards Survey NMA Nepal Mountaineering Association NPC National Planning Commission NRB Nepal Rastra BankNTA Nepal Telecommunication AuthorityNTB Nepal Tourism BoardNTFP Non-timber Forest ProductNTNC National Trust for Nature ConservationNWSC Nepal Water Supply Cooperation OPD Outdoor Patient DepartmentOSR Own-source RevenueOPML Oxford Policy Management LimitedPPCR Pilot Programme for Climate Resilience RCP Representative Concentration Pathway REDD Reducing Emissions from Deforestation and Forest Degradation RIC REDD Implementation Centre RoR Run-of-the-RiverRRT Rapid Response TeamRWH Rain Water HarvestingSMART Simple Measurable Attainable Realistic and Time-boundSWC Social Welfare CouncilTAAN Trekking Agents Association of NepalTavg Average TemperatureTmax Maximum TemperatureTmin Minimum TemperatureTSS Total Suspended Solids U5MR Under-five Mortality RateUNDP United Nations Development Programme UNFCCC United Nations Framework Convention on Climate ChangeVBD Vector-borne Disease VPD Vaccine Preventable DiseaseVRA Vulnerability and Risk AssessmentWASH Water, Sanitation and HygieneWBD Water-borne DiseaseWECS Water and Energy Commission SecretariatWFP World Food ProgrammeWUSC Water Users and Sanitation CommitteeWS Water SupplyWT Water Treatment WWF World Wildlife Fund
v

Vulnerability and Risk Assessment Framework and Indicators8
Vulnerability and Risk Assessment Framework and Indicators 1
Chapter 1 Introduction
The Government of Nepal (GoN) has recognised climate change adaptation as fundamental to safeguarding climate vulnerable communities and ecosystems. Nepal is among the leading countries to have made efforts to enhance climate change awareness and to have initiated a government-led process with representation from multi-stakeholders to identify adaptation needs at local and national levels. The country has developed legal policy instruments, devised frameworks and strategies on planning and financing, and implemented a number of projects and programmes to enhance the resilience of people and their livelihoods.
The GoN, as a party to the United Nations Framework Convention on Climate Change (UNFCCC), initiated National Adaptation Plan (NAP) formulation process with a launching workshop held in Kathmandu on 18 September 2015. The NAP formulation process is based on the provisions of Paris Agreement, current country’s 14th Plan (FY 2016/17-2018/19) and Nepal’s Nationally Determined Contribution (NDC).
The 16th session of Conference of the Parties (COP) to UNFCCC, held in Cancun in 2011, agreed to establish a process to enable Least Developed Countries (LDCs) to formulate and implement NAP, building on the experience gained in preparing and implementing National
Adaptation Programmes of Action (NAPA) as a means of identifying medium and long-term adaptation needs. COP 17 held in Durban (2011) laid out the initial guidelines for NAP process, and the LDC Expert Group (LEG) prepared NAP technical guidelines. The agreed overall objectives of NAP process are:
a. reduce vulnerability to the impacts of climate change by building adaptive capacity and resilience; and
b. facilitate the integration of climate change adaptation, in a coherent manner, into relevant new and existing policies, programmes, and activities, in particular development planning processes and strategies, within all relevant sectors and at different levels, as appropriate;
The NAP formulation process in Nepal is led by the Ministry of Population and Environment (MoPE). MoPE has engaged seven Thematic Working Groups (TWGs) and two Cross-cutting Working Groups (CWGs), which cover the major climate change sensitive sectors. The nine concerned ministries coordinate the respective working groups as per the business allocation rules of the GoN 2015. The TWGs are 1) Agriculture and food security (including nutrition); 2) Forests and biodiversity; 3) Water resources and energy; 4) Public health (WASH); 5) Climate-induced disasters; 6) Urban
Vulnerability and Risk Assessment Framework and Indicators2
settlements and infrastructure; and 7) Tourism, natural and cultural heritage; the CWGs are on 1) Gender and marginal groups (social inclusion), and 2) Livelihoods and governance;
The TWGs and CWGs are currently engaged in technical discussions on the methodology and approaches to carryout theme-based assessment and analysis of climate change impact, vulnerability, and risk. Based on the experiences of NAPA and the design of the Local Adaptation Plans for Action (LAPA), MoPE has initiated the process of devising a country-relevant vulnerability and risk assessment framework for the NAP. The methodology and indicators have been agreed by the TWGs and CWGs, including wider stakeholders engaged in the NAP process.
The assessment of impacts, adaptation, and vulnerability in Nepal’s NAP process evaluates how patterns of risk or potential benefit are shifting due to climate change, and considers how impacts and risks related to climate change can be reduced and managed through adaptation. The framework assesses needs, options, opportunities, constraints, resilience, limits, and
other aspects associated with adaptation. This document has been prepared to facilitate the process of developing a common understanding on the ‘Vulnerability and Risk Assessment (VRA)’ methodological framework and tools for Nepal’s NAP formulation process. The VRA framework presented here is based on the Fifth Assessment Report (AR5) of the Intergovernmental Panel on Climate Change (IPCC) and the NAP guidelines, and has been devised for use in the overall vulnerability and risk assessment that is required for NAP formulation process. The methodological process for conducting VRA and the indicators for the thematic sectors and country-specific cross cutting sectors are also presented.
Nepal’s NAP formulation process has received support from Action on Climate Today (ACT), a UKAid funded initiative led by Oxford Policy Management Limited (OPML); Practical Action; Support to Rural Livelihoods and Climate Change Adaptation in the Himalayas (Himalica) and the International Centre for Integrated Mountain Development (ICIMOD); and other relevant stakeholders.
Chapter 1
Vulnerability and Risk Assessment Framework and Indicators 3
Chapter 1
Chapter 2 Vulnerability and Risk Assessment Framework
2.1. Relevance of Vulnerability and Risk Assessment in Adaptation Planning
Human interference with the climate system has been ascending and climate change poses risks for both human and natural systems. VRA has been recognised globally as a critical step in adaptation planning and implementation (IPCC 2014a). Many climate change adaptation efforts aim to address the implications or risks of potential changes in the frequency, intensity, and duration of weather and climate events that affect human and natural systems.
An approach based on risk provides a framework for utilising information on the full range of possible outcomes, including not only the most likely outcomes, but also events with low probability but high consequences. Another new element is the recognition of evidence that the impacts of climate change involve a number of interacting factors, with climate change adding new dimensions and complications. The implication is that understanding the impacts of climate change requires a very broad perspective as risk is not only determined by climate and weather events (hazards) but also by the exposure and vulnerability of the human and natural systems to these events (IPCC 2014a).
In order to reduce risk effectively, it is essential to understand how vulnerability is generated, how it increases, and how it builds up (O’Brien et al. 2004). Vulnerability describes a set of conditions among people that derive from both historical and prevailing cultural, social, environmental, political, and economic contexts. In this sense, vulnerable groups are not only at risk because they are exposed to a hazard, but also as a result of marginality, of everyday patterns of social interaction and organisation, and of access or lack of access to resources (Watts and Bohle 1993; Morrow 1999; Bank off 2004). Thus, the effects of a disaster on any particular household, community, or system result from a complex set of drivers and interacting conditions.
Adaptive capacity is another important element in most conceptual frameworks of vulnerability and risk. It refers to the ability of systems, institutions, humans, and other organisms to adjust to potential damage, to take advantage of opportunities, or to respond to consequences (IPCC 2014). The adaptive capacity of the individual, communities, and the government also matters for reducing impact of climate change (Sharma and Patwardhan 2008).
VRA is an important element in the NAP formulation process. Climate risk analysis will help Nepal
Vulnerability and Risk Assessment Framework and Indicators4
identify adaptation deficits, and will guide the selection of vulnerable and at-risk geographical areas, physiographic regions, populations, and resources. This will facilitate the identification of adaptation options and ultimately guide in compiling the medium and long-term adaptation needs and priorities of the country, while devising strategies for mainstreaming climate change adaptation in development policies and plans.
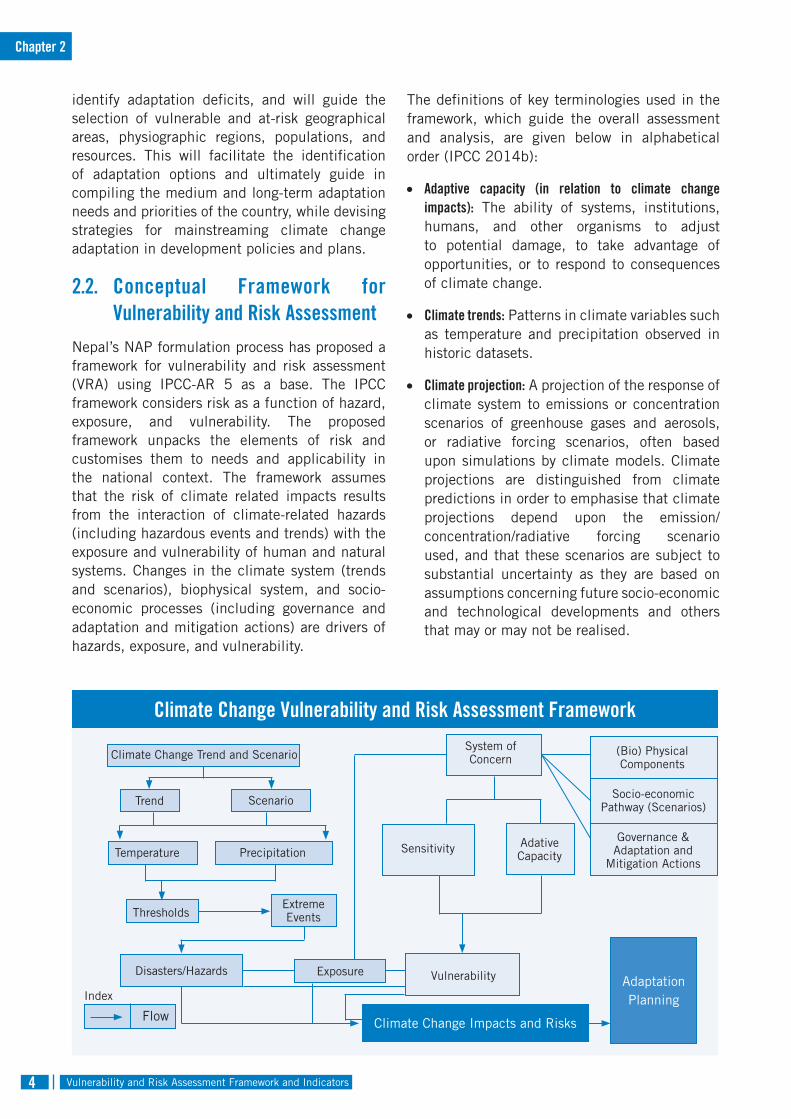
2.2. Conceptual Framework for Vulnerability and Risk Assessment
Nepal’s NAP formulation process has proposed a framework for vulnerability and risk assessment (VRA) using IPCC-AR 5 as a base. The IPCC framework considers risk as a function of hazard, exposure, and vulnerability. The proposed framework unpacks the elements of risk and customises them to needs and applicability in the national context. The framework assumes that the risk of climate related impacts results from the interaction of climate-related hazards (including hazardous events and trends) with the exposure and vulnerability of human and natural systems. Changes in the climate system (trends and scenarios), biophysical system, and socio-economic processes (including governance and adaptation and mitigation actions) are drivers of hazards, exposure, and vulnerability.
The definitions of key terminologies used in the framework, which guide the overall assessment and analysis, are given below in alphabetical order (IPCC 2014b):
• Adaptive capacity (in relation to climate change impacts): The ability of systems, institutions, humans, and other organisms to adjust to potential damage, to take advantage of opportunities, or to respond to consequences of climate change.
• Climate trends: Patterns in climate variables such as temperature and precipitation observed in historic datasets.
• Climate projection: A projection of the response of climate system to emissions or concentration scenarios of greenhouse gases and aerosols, or radiative forcing scenarios, often based upon simulations by climate models. Climate projections are distinguished from climate predictions in order to emphasise that climate projections depend upon the emission/concentration/radiative forcing scenario used, and that these scenarios are subject to substantial uncertainty as they are based on assumptions concerning future socio-economic and technological developments and others that may or may not be realised.
Flow Climate Change Impacts and Risks
Climate Change Trend and Scenario
Trend
Temperature
Thresholds
Disasters/Hazards Exposure
Index
Extreme Events
System of Concern
Sensitivity
Vulnerability
(Bio) Physical Components
Socio-economicPathway (Scenarios)
Governance & Adaptation and
Mitigation Actions
Adative CapacityPrecipitation
Scenario
Adaptation Planning
Climate Change Vulnerability and Risk Assessment Framework
Chapter 2
Vulnerability and Risk Assessment Framework and Indicators 5
• Climate extreme events: The occurrence of a value of a weather or climate variable above (or below) a threshold value near the upper (or lower) end of the observed values of the variable such as high temperatures (e.g., heat waves), or extremely heavy rainfall.
• Disaster: Severe alterations in the normal functioning of a community or a society due to hazardous physical events interacting with vulnerable social conditions, leading to widespread adverse human, material, economic, or environmental effects that require immediate emergency response to satisfy critical human needs and that may require external support for recovery.
• Exposure: The presence of people, livelihoods, species or ecosystems, environmental functions, services, and resources, infrastructure, or economic, social, or cultural assets in places and settings that could be adversely affected.
• Hazard: The potential occurrence of a natural or human-induced physical event or trend or physical impact that may cause loss of life, injury, or other health impacts, as well as damage and loss of property, infrastructure, livelihoods, service provision, ecosystems, and environmental resources. In this report, the term hazard usually refers to climate-related physical events or trends or their physical impacts.
• Impacts: Effects on natural and human systems. In this report, the term impact is used primarily to refer to the effects on natural and human systems of extreme weather and climate events and of climate change. Impacts generally refer to effects on lives, livelihoods, health, ecosystems, economies, societies, cultures, services, and infrastructure due to the interaction between climate changes or hazardous climatic events occurring within a specific time period, and the vulnerability of an exposed society or system. Impacts are also referred to as consequences and outcomes. The impacts of climate change on geophysical systems, including floods, droughts, and sea level rise, are subset of impacts called physical impacts.
• Risk: The potential for consequences where something of value is at stake and where the
outcome is uncertain, recognising the diversity of values. Risk is often represented as the probability of occurrence of hazardous events or trends multiplied by the impacts if these events or trends were to occur. Risk results from the interaction of vulnerability, exposure, and hazard. In this report, the term risk is used primarily to refer to the risk of climate-change impacts.
• Sensitivity: Predisposition of society and ecosystems to suffer harm as a consequence of intrinsic and context conditions making it plausible that such systems once impacted will collapse or experience major harm and damage due to the influence of a hazard event.
• Threshold: A critical limit within the climate system that induces a non-linear response to a given forcing.
• Vulnerability: The propensity or predisposition to be adversely affected. Vulnerability encompasses a variety of concepts including sensitivity or susceptibility to harm and lack of capacity to cope and adapt.
2.3. Assessment Methods and Approaches
Although there are various ways of calculating vulnerability and risk, the framework proposed by Nepal mostly refers to IPCC-AR5. The assessment approach includes both impacts that have already occurred and the risk of future impacts, and especially the way that such risks are anticipated to change with climate change and with investments in adaptation. For both past impact and future risk, a core focus of the assessment depends on characterising vulnerability, disasters/hazards, and exposure. Nepal’s NAP process will use climate scenario analyses, emission scenarios, and socio-economic pathways available from national, regional and international research centres to characterise broad future climate risk and the level of uncertainty.
Characterising current and past climate is an important step in understanding climate change and climate variability. A climate trend analysis for Nepal is being prepared using daily temperature and precipitation data since past 30 years to
Chapter 2
Vulnerability and Risk Assessment Framework and Indicators6
represent baseline climate, and projections to represent future climate scenarios. It will use data collected and managed by the Department of Hydrology and Meteorology (DHM) through various stations across Nepal.
For the baseline, a gridded dataset will be prepared for 0.01 degree (1 km x 1 km) using a suitable methodology specific for mountain conditions for the interpolation of temperature and precipitation data. The assessment will include calculation of a Nepal average, individual district averages, and individual physiographic zone averages for annual and seasonal precipitation, and maximum and minimum temperatures, for each year (1971–2015) using the gridded data. The assessment will also calculate precipitation and temperature trends for annual, seasonal (four seasons), and decadal trends at different spatial resolutions (district, physiographic zone).
The climate scenarios for Nepal to be used in the analysis will be derived from representative climate models for the Hindu Kush Himalayan (HKH) region using the advanced envelope-based selection approach proposed by Lutz et al. (2016). This approach includes 94 General Circulation Models (GCMs) for the Representative Concentration Pathway (RCP) 4.5 and 69 GCMs for RCP 8.5. In the first step, 20 GCMs were selected for each RCP based on changes in mean air temperature and annual precipitation. In the second step, the GCMs were refined based on projected changes in four indices for climate extremes (extreme wet days, consecutive dry days, warm spell duration index, cold spell duration), resulting in the selection of 8 GCMs for each RCP. In the third step, four of these GCMs were selected for each RCP based on the skill of the models in simulating the annual cycle of air temperature and precipitation for the Himalayan region. The reference dataset (1981–2010) for precipitation was taken from Watch Forcing Data ERA-Interim (WFDEI) bias-corrected using Global Precipitation Climatology Centre (GPCC) and observed glacier mass balance data. The temperature data were bias corrected using observed station data from the region. The GCM datasets were downscaled to 10 km resolution using the quantile mapping method. The data cover the period from 2011 to 2100 for precipitation, Tmax, Tmin, and Tavg. The projected data will
be compared with the reference dataset to assess changes in precipitation and temperature. Two future scenarios have been proposed in order to match the changes under future projections with NAP’s medium and long-term periods: medium term (2015–2045) representing 2030, and long-term (2035-–2065) representing 2050. Climate change scenarios in the form of changes in precipitation and temperature will bee estimated for the whole of Nepal, with disaggregated values extracted for districts, development regions, and physiographic zones. In addition to climate scenarios, different socio-economic pathways will be also be used in the scenario analysis.
Disasters and hazards will be assessed by observing past and current impacts of extreme events and potential future occurrences of hazardous events. Exposure will be assessed based on the presence of people, ecosystems, resources, infrastructure, and others in places and settings that are currently impacted or could be affected. Vulnerability is a function of the sensitivity and adaptive capacity of exposed units and systems and will be assessed by looking at how sensitive or susceptible the exposed system is to harm, and the capacity of the system to cope or adapt to the impacts. Risk is often represented as the probability of occurrence of hazardous events or trends multiplied by the impacts if these events or trends were to occur. Risk results from the interaction of vulnerability, exposure, and hazard. All these assessment elements will provide guidance for identifying medium and long-term adaptation options.
The VRA is based on integration and complementarity of science-first (top-down) and policy-first (bottom-up) approaches. No single approach will be entirely adequate and successful and adaptation assessment and planning will require a careful mix of the two approaches. This integrated approach is particularly relevant in the context of Nepal to bridge the gap in information and knowledge on climate change. The top-down approach involves long-term regional climate change modelling and impact projections and identification of adaptation strategies using technological cost-benefit analyses (Kelly and Adger 2000). The bottom-up or community-based approach involves engaging local stakeholders and communities by encouraging self-assessment
Chapter 2
Vulnerability and Risk Assessment Framework and Indicators 7
of climate impacts from experience and practice (Van Aalst et al. 2008). The bottom-up approach mostly relies on local and regional level consultations, field observations, and interactions with climate vulnerable households and communities. Guidelines and toolkits available at national, regional, and global levels will be used to analyse climate change impacts, vulnerability, and risk. The tools will be selected based on the assessment scale (local or national), data needs, outputs, and applicability.
The VRA will be guided by the indicators that have been identified to quantify or qualify hazards, exposure, and vulnerability. Data for the indicators will be acquired from national repositories such as the Central Bureau of Statistics (CBS), specialised organisations, concerned ministries, local development agencies, and others. Data gaps for critical indicators will be filled using different levels of consultation, literature reviews, and field observations. Weightage for indicators will be decided on the basis of international practice, national circumstances and development priorities, and expert judgment. All data will be normalised using standard statistical formulae, and results will be ranked.
The outputs of the VRA, as indicated in the NAP technical guidelines, comprise lists of vulnerability and risk including a description of the context, root causes, trends, and potential assumptions. The factors used to help characterise vulnerability and risk include magnitude, timing, persistence and reversibility, likelihood, distributional aspects, importance of the risk systems, potential for adaptation, and thresholds or trigger points (spatial, temporal, social, cultural, economic, and others). Once identified, the vulnerability and risks will be ranked in terms of threat and impact. The ranking criteria for climate risks include, but are not limited to, the order of magnitude of the potential climate change impacts, probability and level of confidence, reversibility, urgency of action, biophysical sensitivity, type of impact, and other factors such as policy relevance and development priorities. The ranking of climate risks will be carried out in a participatory consultative process. The outputs of the assessment will include individual and composite maps; tables of hazards, exposure, and vulnerability; and a risk index. These will be used to prepare the final NAP document.
2.4. Key methodological steps for VRA assessment The methodological steps used to analyse current climate and future climate change scenarios, assess climate vulnerability and risk, and identify adaptation options at multiple scales, regions, and sectors are as follows:
Step 1
Scoping vulnerability and risk: The scoping task is an important step to set the boundaries for the vulnerability and risk assessment methodology. This process involves stocktaking of existing methodology, approaches, and frameworks for undertaking vulnerability and risk assessment. It also helps in understanding the divergent concepts and terminologies used by the IPCC and UNFCCC reference documents.
Step 2
Developing the VRA framework: The NAP technical guidelines allow countries to develop their own country-specific frameworks for assessing vulnerability and risk. The VRA framework developed by Nepal will be very useful in terms of guiding the assessment and illustrating the logical linkages between hazard, exposure, vulnerability, and risk leading to adaptation planning.
Step 3
Identifying key indicators for hazard, exposure, and vulnerability (sensitivity and adaptive capacity) for different thematic and cross-cutting areas: The main purpose of this step is to outline the most relevant indicators to measure and assess trends in hazards, exposure elements, state of sensitivity, and adaptive capacity of people and systems. The indicators will be used for both quantifying and qualifying the extent, trends, and future scenarios of the assessment units.
Step 4
Exploring data sources, nature, and character: The data sources will determine the availability and quality of data. Daily data from DHM stations will be used for climate trends and scenarios, together with data from several other regional and global
Chapter 2
Vulnerability and Risk Assessment Framework and Indicators8
centres. The major sources for socio-economic data are the CBS and relevant ministries. Sector specific data will be derived from relevant government agencies and institutions.
Step 5
Data collection, tabulation, filtering, and normalisation: This step involves data collection from various sources such as government, regional and global centres, international and national organisations, and other national and local stakeholders. After the data has been collected, it will be tabulated, filtered, and normalised.
Step 6
Weightage and composite value: The data will be given weightage and composite values during the analysis process. The criteria and weightage indices will be developed based on national consultations and expert opinion.
Step 7
Analysis of data: This stage involves analysing the data to identify trends in variables and indices that could be useful to support planning and decision making. This step also involves characterising broad future climate risks and levels of uncertainty through climate and socio-economic scenarios.
Step 8 Identifying climate change impact and risk: The analysis will generate products for climate trends and scenarios, observed and projected impacts, risks, and vulnerability. It will rank climate change impacts and risks at sectoral and national levels. The ranking will be achieved through a consultative process. The identified impacts and risks will help in designing adaptation options for the NAP.
Chapter 2
Vulnerability and Risk Assessment Framework and Indicators 9
Indicators are measurable variables used to represent an associated (but non-measured or non-measurable) factor or quantity. Indicators are also observations or calculations that can be used to track conditions and trends. In the NAP process, indicators refer to the representation of associated elements of analysis such as exposure, sensitivity, and adaptive capacity. The indicators have been chosen so as to achieve the twin objectives of the NAP: (1) to reduce vulnerability to the impacts of climate change by building adaptive capacity and resilience; and (2) to facilitate the integration of climate change adaptation into relevant new and existing policies, programmes, and activities in a coherent manner, in particular into development planning processes and strategies, within all relevant sectors and at different levels, as appropriate.
The overall purpose of selecting indicators for the vulnerability and risk assessment for the NAP is to support systematic assessment of the elements of hazard, exposure, sensitivity, and adaptive capacity. The following process-based individual and collective steps were used to develop Specific, Measurable, Realistic, and Time-bound (SMART) indicators for the VRA:
• Reviewing the IPCC definitions of hazard, exposure, and vulnerability (sensitivity and adaptive capacity), which together form risk.
Chapter 3 Indicators for Vulnerability and Risk Assessment
• Grouping of hazards into (a) climatic extreme events (e.g., consecutive dry, wet, hot, or cold days; extreme rainfall), (b) climate-induced hazards (e.g., flood, GLOF, landslide, heat wave, cold wave, wind storm), and (c) sector-specific hazards (e.g., urban floods).
• Listing of indicators for exposure encompassing the system of concern.
• Listing of indicators for adaptive capacity and sensitivity of the exposed system (or elements) taking into account physical factors (e.g., presence of infrastructure) and socio-economic factors (e.g., age, income, gender).
• Compiling indicators as a ‘long-list’, together with units of measurement and data sources.
• Sharing of indicators with thematic and cross cutting working group members and experts, and preparation of draft shortlist of indicators.
• Finalising the indicators after soliciting feedback from all the thematic and cross-cutting working groups including relevant institutions.
• Agreeing on probable data sources and the process of data collection.
The process of developing indicators engaged all members of the seven thematic working groups and two cross-cutting areas. There were also
Vulnerability and Risk Assessment Framework and Indicators10
several consultations with experts and relevant institutions working on climate change in Nepal. The indicators agreed for each thematic and cross-cutting sector are presented in this report in the following sections.
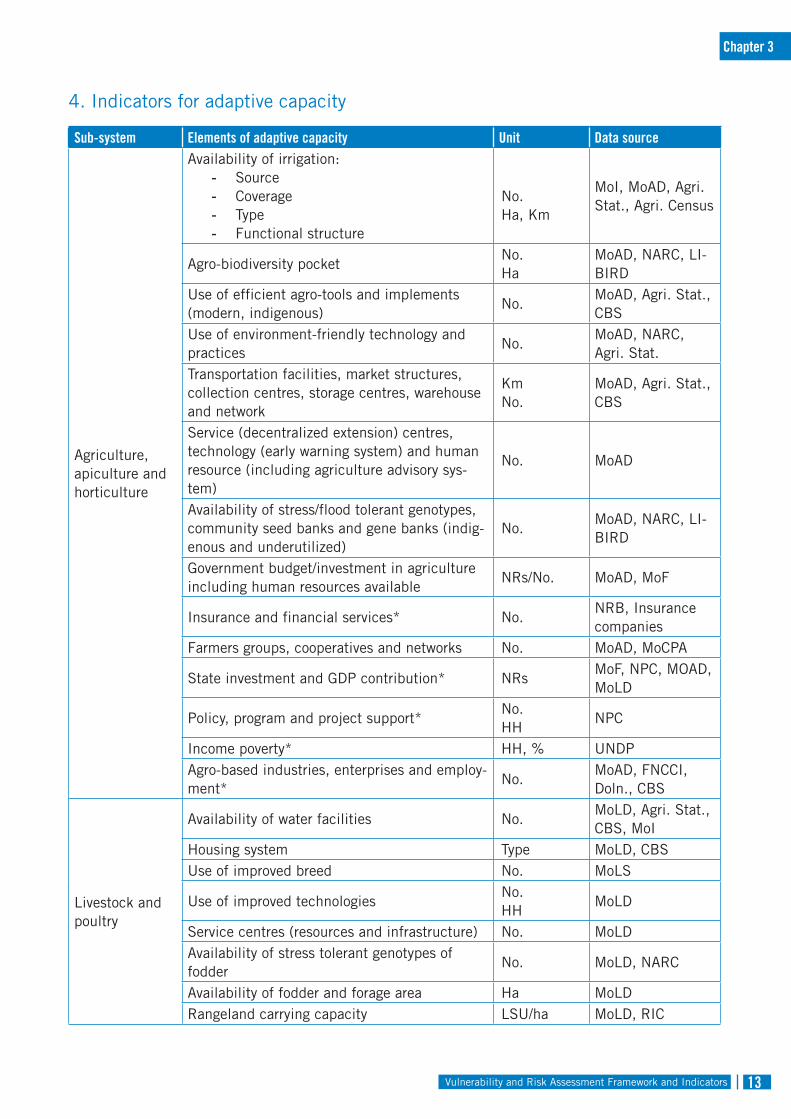
3.1. Vulnerability and Risk Assessment Indicators for Agriculture and Food Security (Nutrition)
The agriculture, fishery, and livestock sectors play a key role in supporting Nepal’s economic growth, local livelihoods, and food security. Agriculture contributes one-third of national Gross Domestic Product (GDP) and supports the livelihoods of two-thirds of the population. Although the majority of the population is engaged in agriculture, the sector is not fully developed. Productivity and competitiveness are low, adoption of improved technology is limited, and even though most cultivated areas are devoted to cereal crops, there is a growing food deficit and malnutrition is high (MoAD 2014). The indicators agreed for assessment of hazard, exposure, sensitivity, and adaptive capacity in the agriculture and food security sector are summarized briefly in the following and listed in the tables below.
The issue of climate change has now joined the existing challenges in the agricultural sector. The evidence on climate change in Nepal indicates increasing temperatures and changing patterns of precipitation. The major hazards and climate extreme events that impact agriculture and food security are extreme hot and cold days, consecutive wet and dry days, extreme weather variability, and climate-induced hazards such as floods, landslides, crop inundation, drought, and hailstorms. These have negative impacts on crop and livestock productivity and food supply systems, which in turn have major implications for the livelihoods of poor and vulnerable households. The increasing trends in temperature and extreme events are high potential hazards for agriculture.The National Adaptation Plan (NAP) has identified agriculture and food security (nutrition) as a major thematic sector for adaptation planning. Within this, there are key focus areas of concern in terms of climate change impacts and adaptation planning. As part of the NAP process, the stocktaking
exercise identified four systems which directly support the livelihoods, food security, and GDP of the nation: agriculture, apiculture, and horticulture; livestock and poultry; fisheries; and food security and nutrition. These systems are highly exposed and sensitive to climate change impacts.
Agricultural resources, infrastructure and services, farming systems, and the population dependent on this sector are exposed to climate change hazards and extreme events. The exposure elements identified in the agriculture and food security thematic sector are farming population dependent on agriculture (field crops, horticulture, apiculture, and livestock rearing); water bodies and surface irrigation schemes; fish farms and ponds; agricultural land area; population of livestock; poultry farms; horticultural area; rangeland area, including grass and fodder; agricultural road and market network; and agricultural labour population.
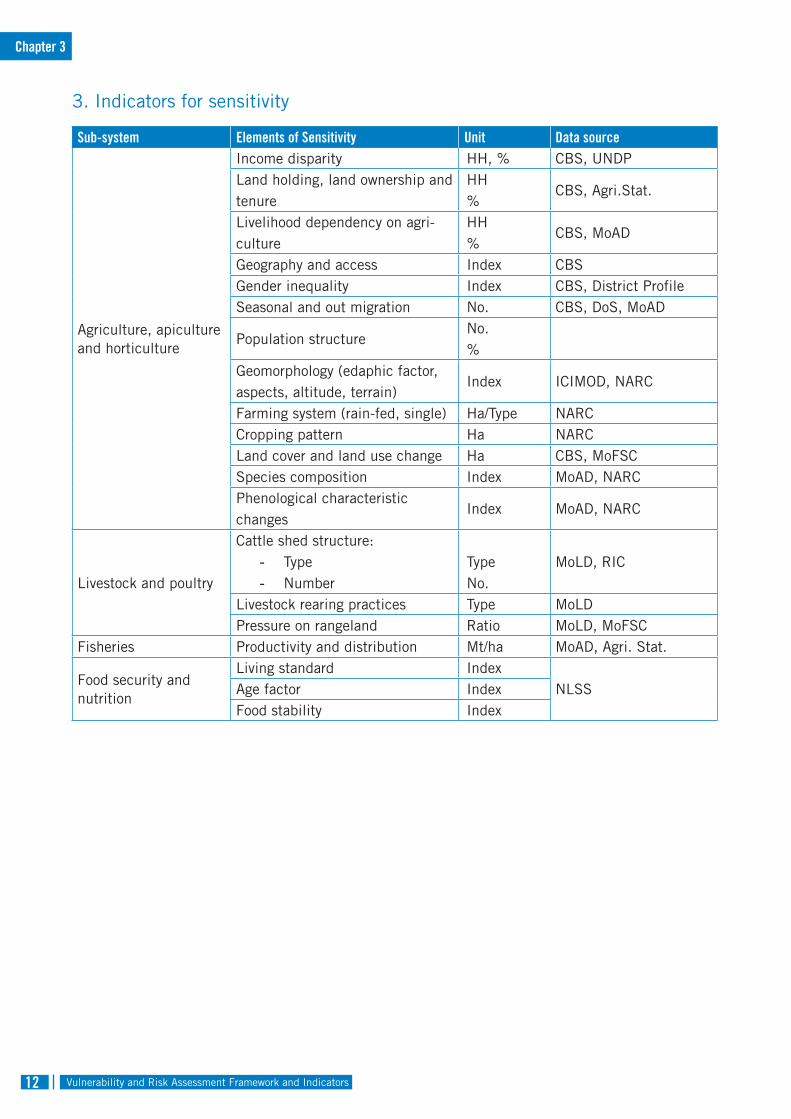
The sensitivity of the agriculture and food security thematic sector rests on a number of factors. The key indicators for sensitivity include income disparity; landholding capacity, land ownership, and tenure; livelihood dependency on agriculture; geography and access; gender inequality; seasonal and out migration; population structure; geomorphology; farming system; cropping pattern; land use and land cover change; productivity and distribution; age factor; and food stability.
The overall adaptive capacity is assessed as an accumulation of determinants such as socio-economy, policies and institutions,technological infrastructure, environment, and financial and governance system. The indicators broadly include the availability of income, assets, and livelihood diversification; improved infrastructure; access to technology and decision-making for a; changed cropping, livestock, and aquaculture practices; new crop and animal varieties/breeds; indigenous, traditional, and local knowledge, technologies, and methods; efficient irrigation; water-saving technologies; conservation agriculture; food storage and preservation facilities; early warning systems; improved policy and agricultural services (decentralized extension system); financial incentives (insurance and financial services); and adaptation projects and programmes.
Chapter 3

Vulnerability and Risk Assessment Framework and Indicators 11
1. Indicators for hazard
Elements of hazard Data sourceClimate extreme events:
- Extreme heat- Consecutive dry days- Consecutive cold days- Heat waves- Cold waves (fog)- Extreme weather variability- Warm, cold, dry and wet spell
DHM
Climate-induced hazards:- Flood- Drought- Landslides- Hailstorm
DHM, ICIMOD, MoHA
Sector specific hazards:- Crop inundation- Seasonal shift/temporal variability- Shifting of temperature is olines- Irrigation sediment- Pests and diseases outbreak
MoAD, DHM, MoIr, MoAD
2. Indicators for exposure
Elements of Exposure Unit Data sourceFarming population (agriculture, horticulture, apiculture, livestock)
HH CBS, Agri. stat.
Irrigation schemes No./Km MoI DoI, ICIMOD Fish farms and ponds:
- Number- Area
No. Ha
MoAD, Agi Stat,
Agricultural land area Ha CBS, Agri. stat.Population of livestock No. CBS, Agri. stat.Poultry farms No. CBS, Agri. stat.Horticulture area Ha CBS, Agri. stat.Rangeland area Ha MoLD, RICAgriculture road and market network:
- Road length- Markets
KmNo.
DoLIDAR
Agriculture labour population No. CBSAgro-eco systems:
- Types- Area
No.Ha
NARC
Chapter 3
Vulnerability and Risk Assessment Framework and Indicators12
3. Indicators for sensitivity
Sub-system Elements of Sensitivity Unit Data source
Agriculture, apiculture and horticulture
Income disparity HH, % CBS, UNDPLand holding, land ownership and tenure
HH%
CBS, Agri.Stat.
Livelihood dependency on agri-culture
HH%
CBS, MoAD
Geography and access Index CBSGender inequality Index CBS, District ProfileSeasonal and out migration No. CBS, DoS, MoAD
Population structureNo.%
Geomorphology (edaphic factor, aspects, altitude, terrain)
Index ICIMOD, NARC
Farming system (rain-fed, single) Ha/Type NARCCropping pattern Ha NARCLand cover and land use change Ha CBS, MoFSCSpecies composition Index MoAD, NARCPhenological characteristic changes
Index MoAD, NARC
Livestock and poultry
Cattle shed structure:- Type- Number
TypeNo.
MoLD, RIC
Livestock rearing practices Type MoLDPressure on rangeland Ratio MoLD, MoFSC
Fisheries Productivity and distribution Mt/ha MoAD, Agri. Stat.
Food security and nutrition
Living standard IndexNLSSAge factor Index
Food stability Index
Chapter 3
Vulnerability and Risk Assessment Framework and Indicators 13
4. Indicators for adaptive capacity
Sub-system Elements of adaptive capacity Unit Data source
Agriculture, apiculture and horticulture
Availability of irrigation:- Source- Coverage- Type- Functional structure
No.Ha, Km
MoI, MoAD, Agri. Stat., Agri. Census
Agro-biodiversity pocketNo.Ha
MoAD, NARC, LI-BIRD
Use of efficient agro-tools and implements (modern, indigenous)
No.MoAD, Agri. Stat., CBS
Use of environment-friendly technology and practices
No.MoAD, NARC, Agri. Stat.
Transportation facilities, market structures, collection centres, storage centres, warehouse and network
KmNo.
MoAD, Agri. Stat., CBS
Service (decentralized extension) centres, technology (early warning system) and human resource (including agriculture advisory sys-tem)
No. MoAD
Availability of stress/flood tolerant genotypes, community seed banks and gene banks (indig-enous and underutilized)
No.MoAD, NARC, LI-BIRD
Government budget/investment in agriculture including human resources available
NRs/No. MoAD, MoF
Insurance and financial services* No.NRB, Insurance companies
Farmers groups, cooperatives and networks No. MoAD, MoCPA
State investment and GDP contribution* NRsMoF, NPC, MOAD, MoLD
Policy, program and project support*No.HH
NPC
Income poverty* HH, % UNDPAgro-based industries, enterprises and employ-ment*
No.MoAD, FNCCI, Doln., CBS
Livestock and poultry
Availability of water facilities No.MoLD, Agri. Stat., CBS, MoI
Housing system Type MoLD, CBSUse of improved breed No. MoLS
Use of improved technologiesNo.HH
MoLD
Service centres (resources and infrastructure) No. MoLDAvailability of stress tolerant genotypes of fodder
No. MoLD, NARC
Availability of fodder and forage area Ha MoLDRangeland carrying capacity LSU/ha MoLD, RIC
Chapter 3
Vulnerability and Risk Assessment Framework and Indicators14
Fisheries
Pond structure No.
DoFish
Water sources Ha, kmInsurance NoMarket networks NoHatchery NoRoad access KmAdaptive breeds No
Food security and nutrition
Food sufficiency
No/Ha/ months
MoH, WFP, FAO, MoAD, NPC, MOF
Nutrition statusStorageDistribution channelFood diversityFood accessibilityHealthFood utilization
* Used for other sub-sectors
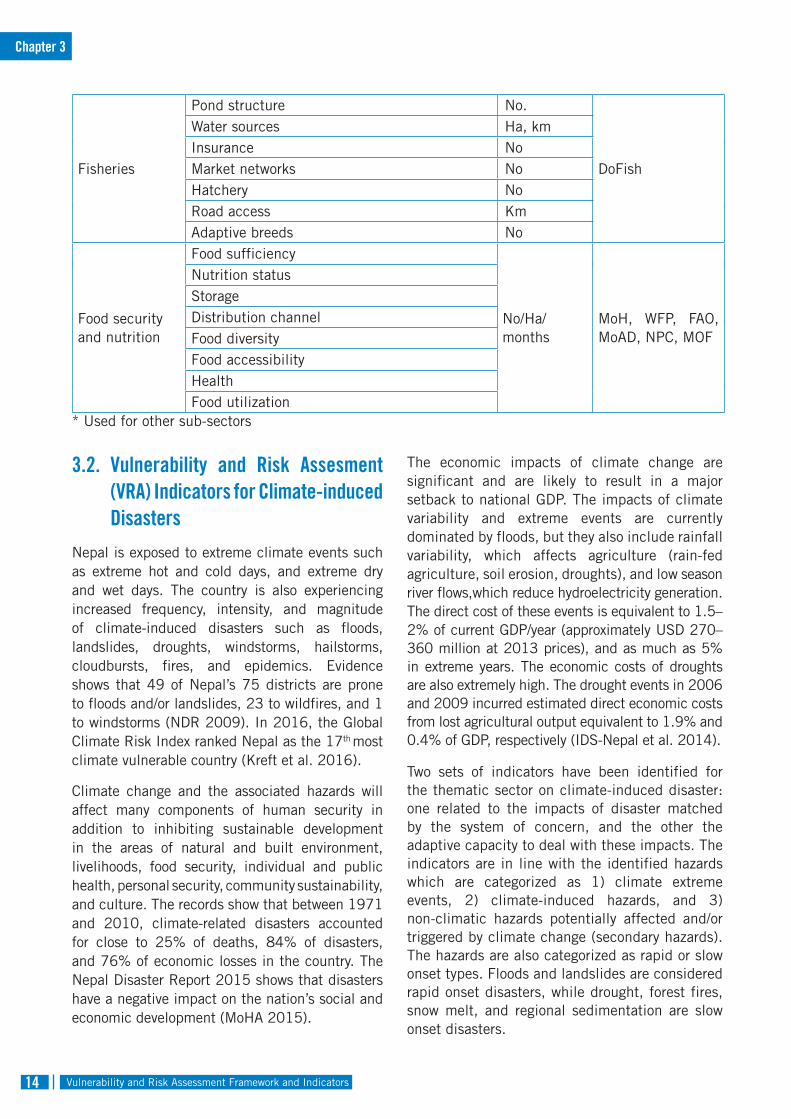
3.2. Vulnerability and Risk Assesment (VRA) Indicators for Climate-induced Disasters
Nepal is exposed to extreme climate events such as extreme hot and cold days, and extreme dry and wet days. The country is also experiencing increased frequency, intensity, and magnitude of climate-induced disasters such as floods, landslides, droughts, windstorms, hailstorms, cloudbursts, fires, and epidemics. Evidence shows that 49 of Nepal’s 75 districts are prone to floods and/or landslides, 23 to wildfires, and 1 to windstorms (NDR 2009). In 2016, the Global Climate Risk Index ranked Nepal as the 17th most climate vulnerable country (Kreft et al. 2016).
Climate change and the associated hazards will affect many components of human security in addition to inhibiting sustainable development in the areas of natural and built environment, livelihoods, food security, individual and public health, personal security, community sustainability, and culture. The records show that between 1971 and 2010, climate-related disasters accounted for close to 25% of deaths, 84% of disasters, and 76% of economic losses in the country. The Nepal Disaster Report 2015 shows that disasters have a negative impact on the nation’s social and economic development (MoHA 2015).
The economic impacts of climate change are significant and are likely to result in a major setback to national GDP. The impacts of climate variability and extreme events are currently dominated by floods, but they also include rainfall variability, which affects agriculture (rain-fed agriculture, soil erosion, droughts), and low season river flows,which reduce hydroelectricity generation. The direct cost of these events is equivalent to 1.5–2% of current GDP/year (approximately USD 270–360 million at 2013 prices), and as much as 5% in extreme years. The economic costs of droughts are also extremely high. The drought events in 2006 and 2009 incurred estimated direct economic costs from lost agricultural output equivalent to 1.9% and 0.4% of GDP, respectively (IDS-Nepal et al. 2014).
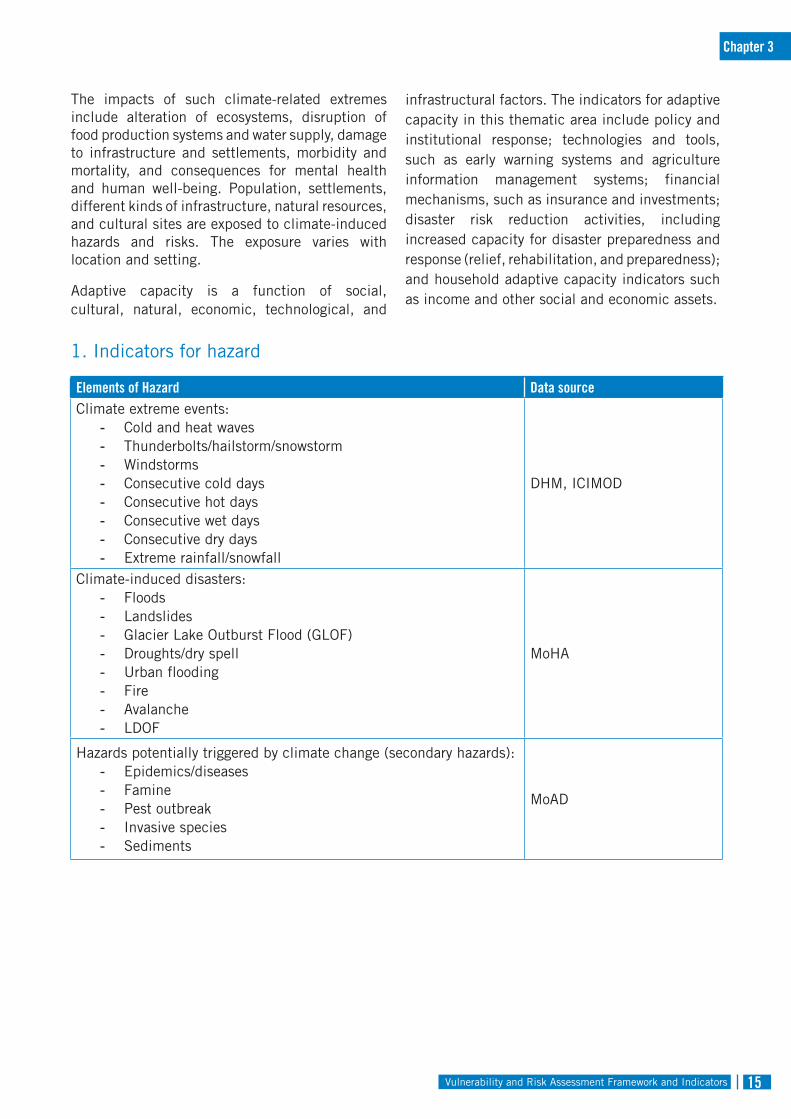
Two sets of indicators have been identified for the thematic sector on climate-induced disaster: one related to the impacts of disaster matched by the system of concern, and the other the adaptive capacity to deal with these impacts. The indicators are in line with the identified hazards which are categorized as 1) climate extreme events, 2) climate-induced hazards, and 3) non-climatic hazards potentially affected and/or triggered by climate change (secondary hazards). The hazards are also categorized as rapid or slow onset types. Floods and landslides are considered rapid onset disasters, while drought, forest fires, snow melt, and regional sedimentation are slow onset disasters.
Chapter 3
Vulnerability and Risk Assessment Framework and Indicators 15
The impacts of such climate-related extremes include alteration of ecosystems, disruption of food production systems and water supply, damage to infrastructure and settlements, morbidity and mortality, and consequences for mental health and human well-being. Population, settlements, different kinds of infrastructure, natural resources, and cultural sites are exposed to climate-induced hazards and risks. The exposure varies with location and setting.
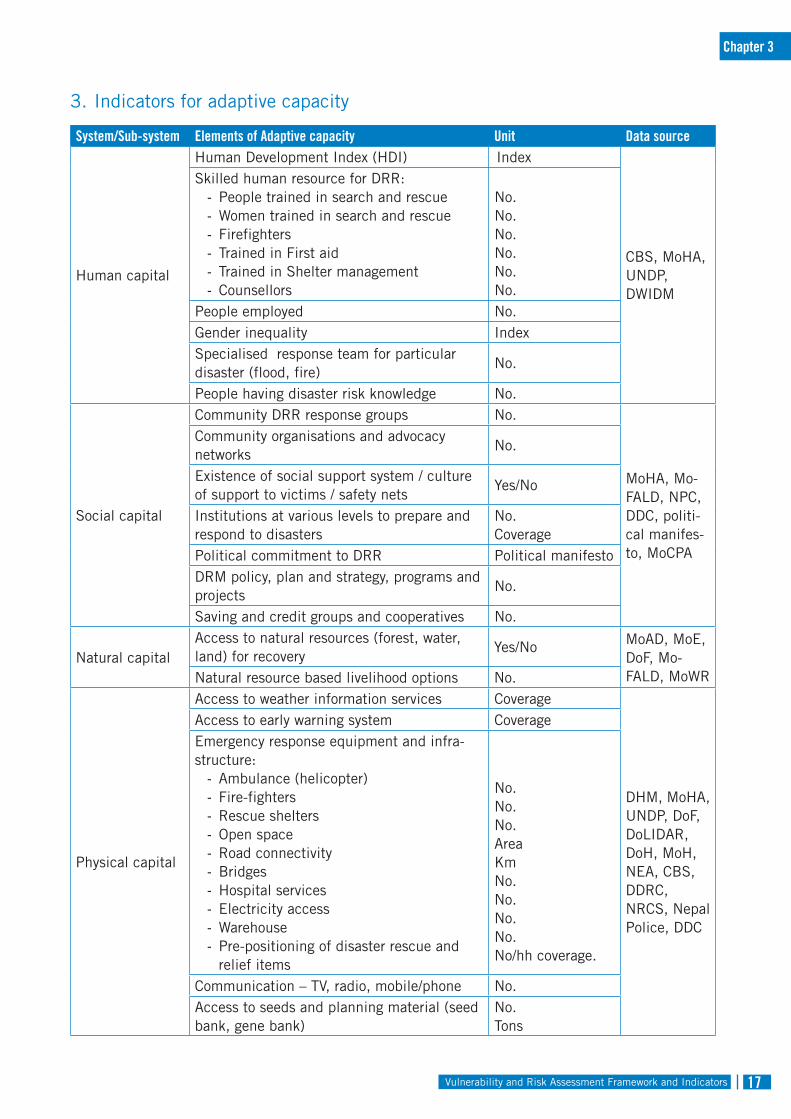
Adaptive capacity is a function of social, cultural, natural, economic, technological, and
infrastructural factors. The indicators for adaptive capacity in this thematic area include policy and institutional response; technologies and tools, such as early warning systems and agriculture information management systems; financial mechanisms, such as insurance and investments; disaster risk reduction activities, including increased capacity for disaster preparedness and response (relief, rehabilitation, and preparedness); and household adaptive capacity indicators such as income and other social and economic assets.
1. Indicators for hazard
Elements of Hazard Data sourceClimate extreme events:
- Cold and heat waves- Thunderbolts/hailstorm/snowstorm - Windstorms- Consecutive cold days- Consecutive hot days- Consecutive wet days- Consecutive dry days- Extreme rainfall/snowfall
DHM, ICIMOD
Climate-induced disasters:- Floods- Landslides- Glacier Lake Outburst Flood (GLOF)- Droughts/dry spell- Urban flooding- Fire- Avalanche- LDOF
MoHA
Hazards potentially triggered by climate change (secondary hazards):- Epidemics/diseases- Famine- Pest outbreak- Invasive species- Sediments
MoAD
Chapter 3

Vulnerability and Risk Assessment Framework and Indicators16
2. Indicators for impact of disasters
System/Sub-system Elements of impact Unit Data source
Human capital
Death No.
MoHA, DWIDM, District offices, CBS
People missing No.
Affected family/population No.
People injured No.
People displaced No.
Displaced family No.
Natural
Forest area loss Ha DoF
Agricultural area loss Ha DoA
Water sources/ springs/ lakes/ ponds/ reservoirs etc.
No.MoAD, MoE, DoF, MoFALD, MoWR
Physical
Government houses fully damaged No.
MoHA, DWIDM, CBSGovernment houses partially damaged No.
Private houses fully damaged No.
Private houses partially damaged No.
Settlements affected No. DWIDM, MoHA, DDC
Community buildings destroyed No. DDC
Roads destroyed Km. DoR, DoLIDAR, CBS
Bridges destroyed No. DoR, CBS
Water supply system affected No. DWSS
Sewerage system damaged No. DWSS
Hospitals damaged No.MoH
Health posts damaged No.
Schools/colleges damaged No. CBS, MoE
Communication towers affected No. MoIC
Irrigation facilities affected No. MoI
Hydropower damaged No. MoE, AEPC
Cultural and religious sites destroyed (temples and monasteries)
No. MoCTCA
Financial
Estimated loss of property NPR
MoHALoss of cattle No.
Loss of crop NPR
Chapter 3
Vulnerability and Risk Assessment Framework and Indicators 17
3. Indicators for adaptive capacity
System/Sub-system Elements of Adaptive capacity Unit Data source
Human capital
Human Development Index (HDI) Index
CBS, MoHA, UNDP, DWIDM
Skilled human resource for DRR:- People trained in search and rescue- Women trained in search and rescue- Firefighters- Trained in First aid- Trained in Shelter management- Counsellors
No.No.No.No.No.No.
People employed No.Gender inequality IndexSpecialised response team for particular disaster (flood, fire)
No.
People having disaster risk knowledge No.
Social capital
Community DRR response groups No.
MoHA, Mo-FALD, NPC, DDC, politi-cal manifes-to, MoCPA
Community organisations and advocacy networks
No.
Existence of social support system / culture of support to victims / safety nets
Yes/No
Institutions at various levels to prepare and respond to disasters
No.Coverage
Political commitment to DRR Political manifestoDRM policy, plan and strategy, programs and projects
No.
Saving and credit groups and cooperatives No.
Natural capitalAccess to natural resources (forest, water, land) for recovery
Yes/No MoAD, MoE, DoF, Mo-FALD, MoWRNatural resource based livelihood options No.
Physical capital
Access to weather information services Coverage
DHM, MoHA, UNDP, DoF, DoLIDAR, DoH, MoH, NEA, CBS, DDRC, NRCS, Nepal Police, DDC
Access to early warning system Coverage Emergency response equipment and infra-structure:
- Ambulance (helicopter)- Fire-fighters- Rescue shelters- Open space- Road connectivity- Bridges- Hospital services- Electricity access- Warehouse- Pre-positioning of disaster rescue and
relief items
No.No.No.AreaKmNo.No.No.No.No/hh coverage.
Communication – TV, radio, mobile/phone No.Access to seeds and planning material (seed bank, gene bank)
No.Tons
Chapter 3
Vulnerability and Risk Assessment Framework and Indicators18
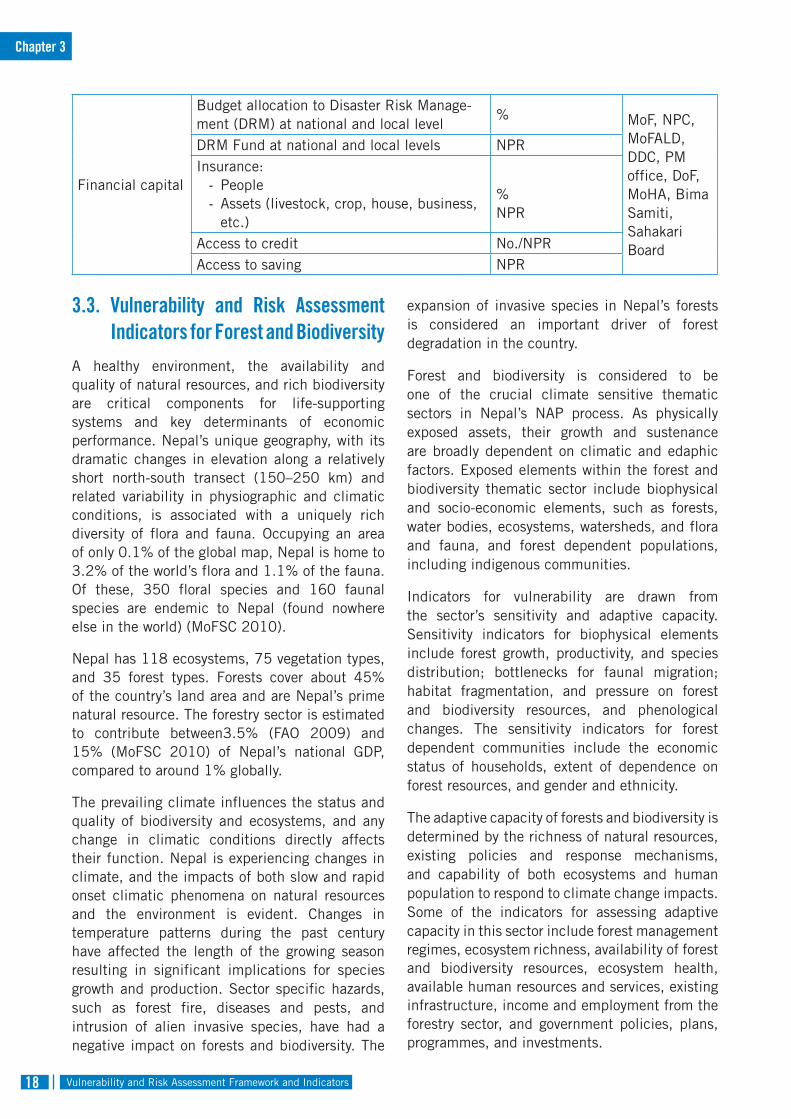
Financial capital
Budget allocation to Disaster Risk Manage-ment (DRM) at national and local level
% MoF, NPC, MoFALD, DDC, PM office, DoF, MoHA, Bima Samiti, Sahakari Board
DRM Fund at national and local levels NPRInsurance:
- People- Assets (livestock, crop, house, business,
etc.)
%NPR
Access to credit No./NPRAccess to saving NPR
3.3. Vulnerability and Risk Assessment Indicators for Forest and Biodiversity
A healthy environment, the availability and quality of natural resources, and rich biodiversity are critical components for life-supporting systems and key determinants of economic performance. Nepal’s unique geography, with its dramatic changes in elevation along a relatively short north-south transect (150–250 km) and related variability in physiographic and climatic conditions, is associated with a uniquely rich diversity of flora and fauna. Occupying an area of only 0.1% of the global map, Nepal is home to 3.2% of the world’s flora and 1.1% of the fauna. Of these, 350 floral species and 160 faunal species are endemic to Nepal (found nowhere else in the world) (MoFSC 2010).
Nepal has 118 ecosystems, 75 vegetation types, and 35 forest types. Forests cover about 45% of the country’s land area and are Nepal’s prime natural resource. The forestry sector is estimated to contribute between3.5% (FAO 2009) and 15% (MoFSC 2010) of Nepal’s national GDP, compared to around 1% globally.
The prevailing climate influences the status and quality of biodiversity and ecosystems, and any change in climatic conditions directly affects their function. Nepal is experiencing changes in climate, and the impacts of both slow and rapid onset climatic phenomena on natural resources and the environment is evident. Changes in temperature patterns during the past century have affected the length of the growing season resulting in significant implications for species growth and production. Sector specific hazards, such as forest fire, diseases and pests, and intrusion of alien invasive species, have had a negative impact on forests and biodiversity. The
expansion of invasive species in Nepal’s forests is considered an important driver of forest degradation in the country.
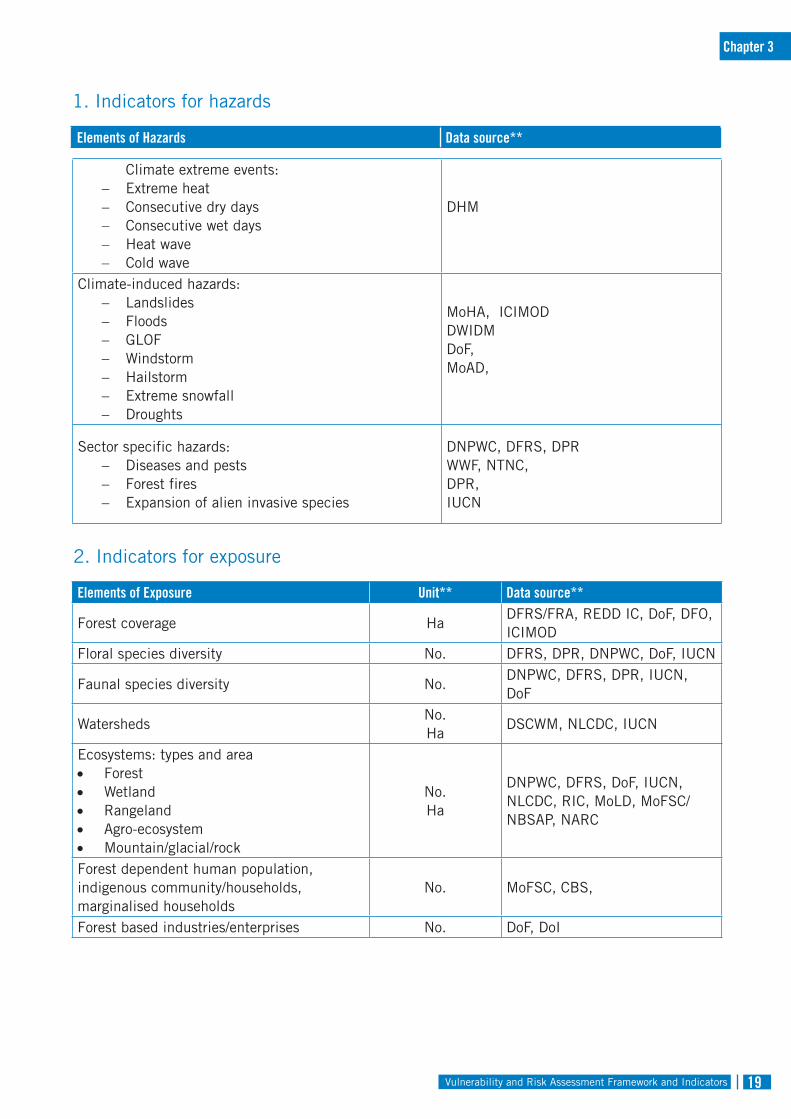
Forest and biodiversity is considered to be one of the crucial climate sensitive thematic sectors in Nepal’s NAP process. As physically exposed assets, their growth and sustenance are broadly dependent on climatic and edaphic factors. Exposed elements within the forest and biodiversity thematic sector include biophysical and socio-economic elements, such as forests, water bodies, ecosystems, watersheds, and flora and fauna, and forest dependent populations, including indigenous communities.
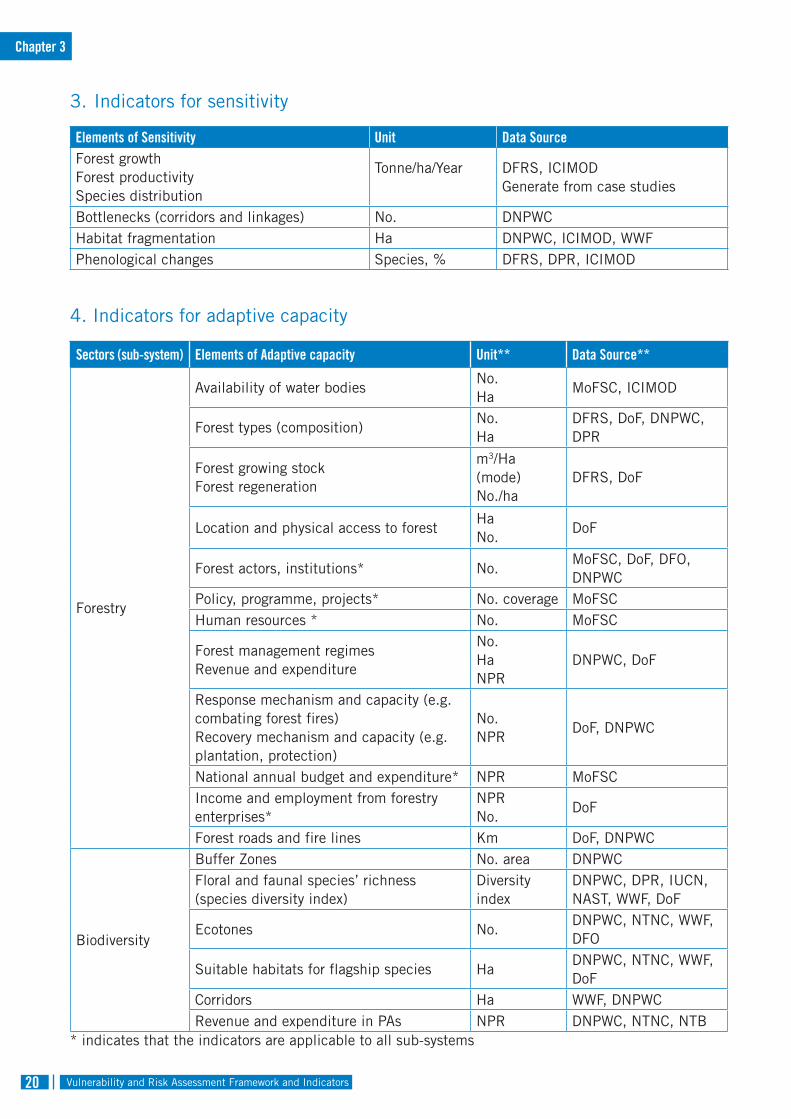
Indicators for vulnerability are drawn from the sector’s sensitivity and adaptive capacity. Sensitivity indicators for biophysical elements include forest growth, productivity, and species distribution; bottlenecks for faunal migration; habitat fragmentation, and pressure on forest and biodiversity resources, and phenological changes. The sensitivity indicators for forest dependent communities include the economic status of households, extent of dependence on forest resources, and gender and ethnicity.
The adaptive capacity of forests and biodiversity is determined by the richness of natural resources, existing policies and response mechanisms, and capability of both ecosystems and human population to respond to climate change impacts. Some of the indicators for assessing adaptive capacity in this sector include forest management regimes, ecosystem richness, availability of forest and biodiversity resources, ecosystem health, available human resources and services, existing infrastructure, income and employment from the forestry sector, and government policies, plans, programmes, and investments.
Chapter 3
Vulnerability and Risk Assessment Framework and Indicators 19
1. Indicators for hazards
Elements of Hazards Data source**
Climate extreme events:− Extreme heat− Consecutive dry days− Consecutive wet days− Heat wave− Cold wave
DHM
Climate-induced hazards:− Landslides− Floods− GLOF− Windstorm− Hailstorm− Extreme snowfall− Droughts
MoHA, ICIMODDWIDMDoF, MoAD,
Sector specific hazards:− Diseases and pests− Forest fires− Expansion of alien invasive species
DNPWC, DFRS, DPRWWF, NTNC, DPR,IUCN
2. Indicators for exposure
Elements of Exposure Unit** Data source**
Forest coverage HaDFRS/FRA, REDD IC, DoF, DFO, ICIMOD
Floral species diversity No. DFRS, DPR, DNPWC, DoF, IUCN
Faunal species diversity No.DNPWC, DFRS, DPR, IUCN, DoF
Watersheds No.Ha
DSCWM, NLCDC, IUCN
Ecosystems: types and area• Forest• Wetland• Rangeland• Agro-ecosystem• Mountain/glacial/rock
No.Ha
DNPWC, DFRS, DoF, IUCN, NLCDC, RIC, MoLD, MoFSC/NBSAP, NARC
Forest dependent human population, indigenous community/households, marginalised households
No. MoFSC, CBS,
Forest based industries/enterprises No. DoF, DoI
Chapter 3
Vulnerability and Risk Assessment Framework and Indicators20
3. Indicators for sensitivity
Elements of Sensitivity Unit Data SourceForest growthForest productivity Species distribution
Tonne/ha/Year DFRS, ICIMODGenerate from case studies
Bottlenecks (corridors and linkages) No. DNPWCHabitat fragmentation Ha DNPWC, ICIMOD, WWFPhenological changes Species, % DFRS, DPR, ICIMOD
4. Indicators for adaptive capacity
Sectors (sub-system) Elements of Adaptive capacity Unit** Data Source**
Forestry
Availability of water bodiesNo. Ha
MoFSC, ICIMOD
Forest types (composition)No. Ha
DFRS, DoF, DNPWC, DPR
Forest growing stock Forest regeneration
m3/Ha(mode)No./ha
DFRS, DoF
Location and physical access to forestHaNo.
DoF
Forest actors, institutions* No.MoFSC, DoF, DFO, DNPWC
Policy, programme, projects* No. coverage MoFSCHuman resources * No. MoFSC
Forest management regimesRevenue and expenditure
No.HaNPR
DNPWC, DoF
Response mechanism and capacity (e.g. combating forest fires)Recovery mechanism and capacity (e.g. plantation, protection)
No.NPR
DoF, DNPWC
National annual budget and expenditure* NPR MoFSCIncome and employment from forestry enterprises*
NPRNo.
DoF
Forest roads and fire lines Km DoF, DNPWC
Biodiversity
Buffer Zones No. area DNPWCFloral and faunal species’ richness (species diversity index)
Diversity index
DNPWC, DPR, IUCN, NAST, WWF, DoF
Ecotones No.DNPWC, NTNC, WWF, DFO
Suitable habitats for flagship species HaDNPWC, NTNC, WWF, DoF
Corridors Ha WWF, DNPWCRevenue and expenditure in PAs NPR DNPWC, NTNC, NTB
* indicates that the indicators are applicable to all sub-systems
Chapter 3
Vulnerability and Risk Assessment Framework and Indicators 21
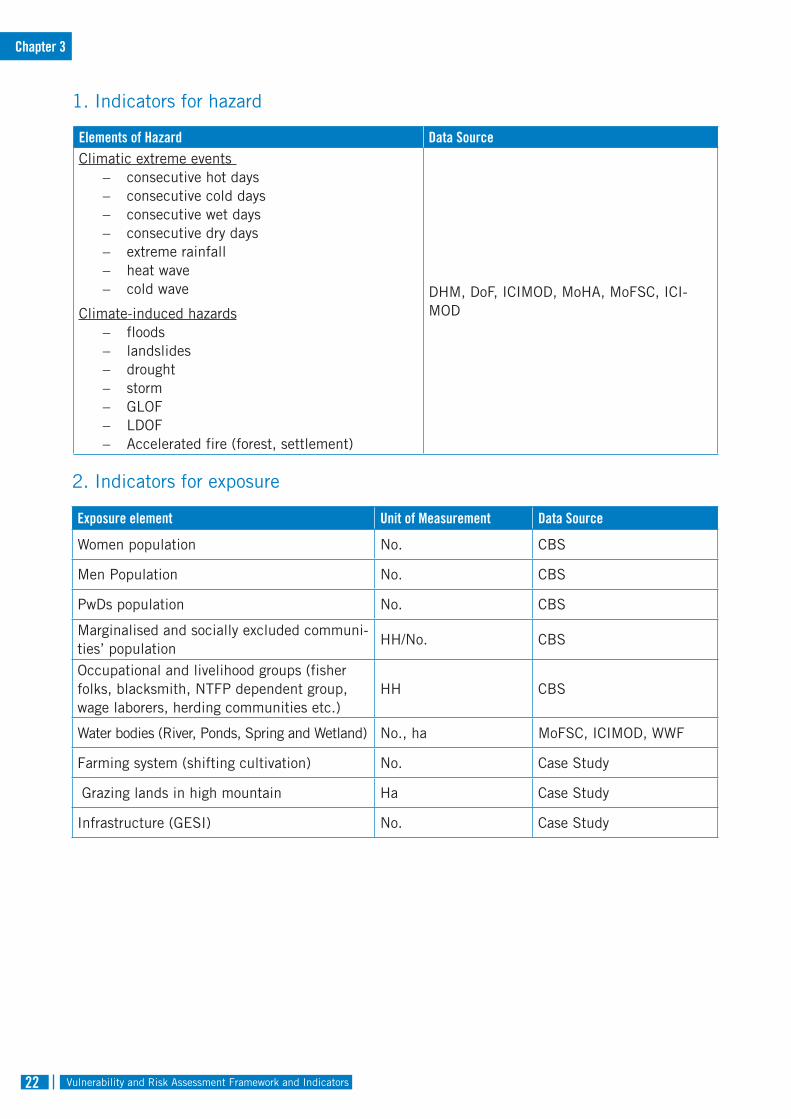
3.4. Vulnerability and Risk Assessment Indicators for Gender and Marginalised Group (Social Inclusion)
The impacts of climate change fall on people differently, with those already suffering from socio-economic disadvantage affected disproportionately. Gender determines social space and the availability or non-availability of opportunities to women and men, thereby influencing both vulnerability and the ability to prepare, respond, and recover in the wake of disaster. Existing vulnerabilities are further complicated by gendered power relations. In other words, existing inequalities compound vulnerability and are exacerbated by disasters. Thus the risk of and vulnerability to the impacts of climate change are higher for socially and geographically marginalised and excluded groups like Dalits, Madhesi, Muslims, Aadibasi, Janajati, and others.
In Nepal, women and men have unequal access to natural resources and land ownership; women have limited opportunities to participate in decision making and limited access to markets, capital, training, and technology. They also largely work as farmers, caretakers, and in informal sectors, and their work is not recognized. During extreme events, women often experience additional duties as caregivers and, due to the high rate of male outmigration, may be responsible for an entire household. Thus they may face particular challenges including psychological and emotional distress, reduced food intake, and adverse mental health outcomes resulting, for example, from displacement (IPCC 2014). Women-headed households now comprise 25.7% of all households in Nepal, and women own 26% of property (GoN/UNDP 2014). Approximately 70% of women are employed in agriculture contributing 60.5% of the agricultural economy (Gurung and Bisht 2014).
The extreme variability in weather and increasing number of climate extreme events and climate-induced disasters, such as extreme rainfall, hot and cold
days, flooding, drought, and landslides, are having a direct impact on farming systems. The impacts of climate change are expected to be greater for those whose livelihoods depend on natural resources, who often belong to marginalised groups. In rural areas, women are also primarily responsible for collecting water and firewood. Hence the drying up of springs and other water sources has particular gendered implications.
Climate change impacts everyone, but its impacts are not distributed equally; the exposed elements in the gender and social inclusion thematic areas of NAP include women, men, marginalised and socially excluded populations,and occupational and livelihood groups such as fisher folks, wage labourers, and herding communities. Climate sensitive natural resources, such as water bodies, forest and agriculture, infrastructure, and services that women and marginalised groups depend on, are also included as exposure units.
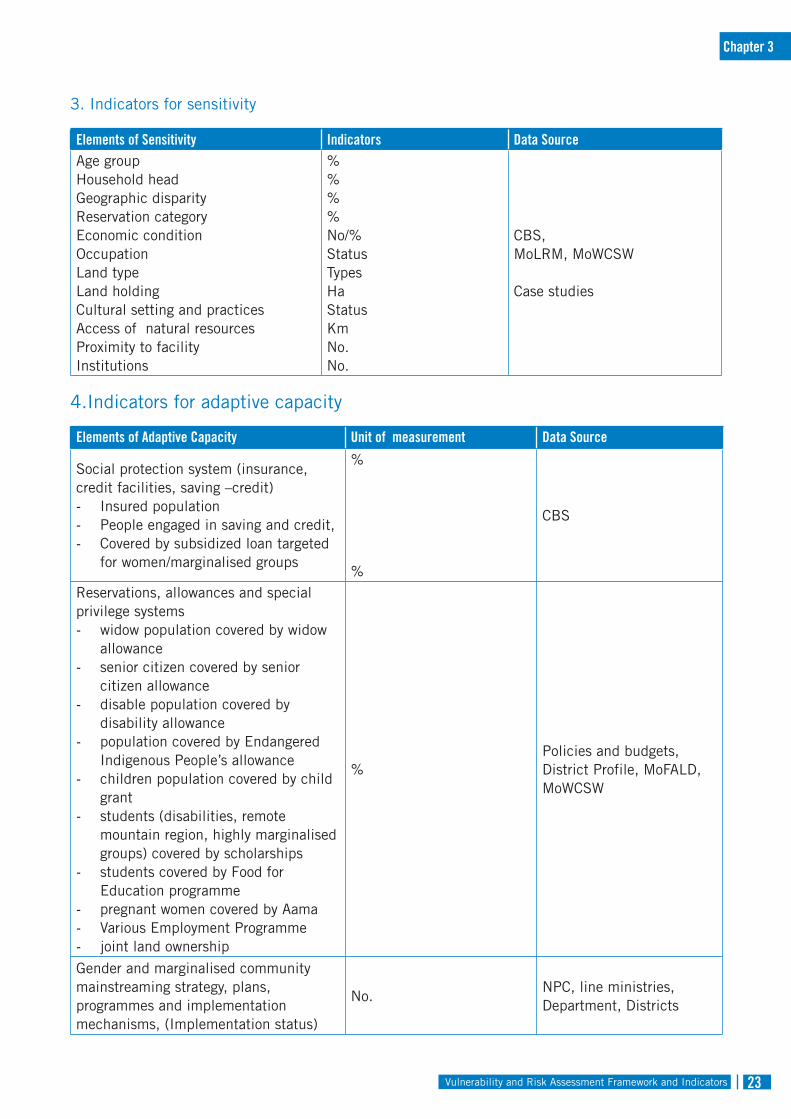
Vulnerability and risk provides information on how ecosystems and populations characterised by social determinants such as gender, ethnicity, caste, and socio-economic class are affected by climate change. This helps to inform adaptation planning and make it more effective. The sensitivity indicators for GESI chosen for the NAP process are characterised by socio-economic, cultural, institutional, and geographic factors such as gender, ethnicity, age, economic condition, landholdings, physical ability, proximity, and dependence on natural resources.
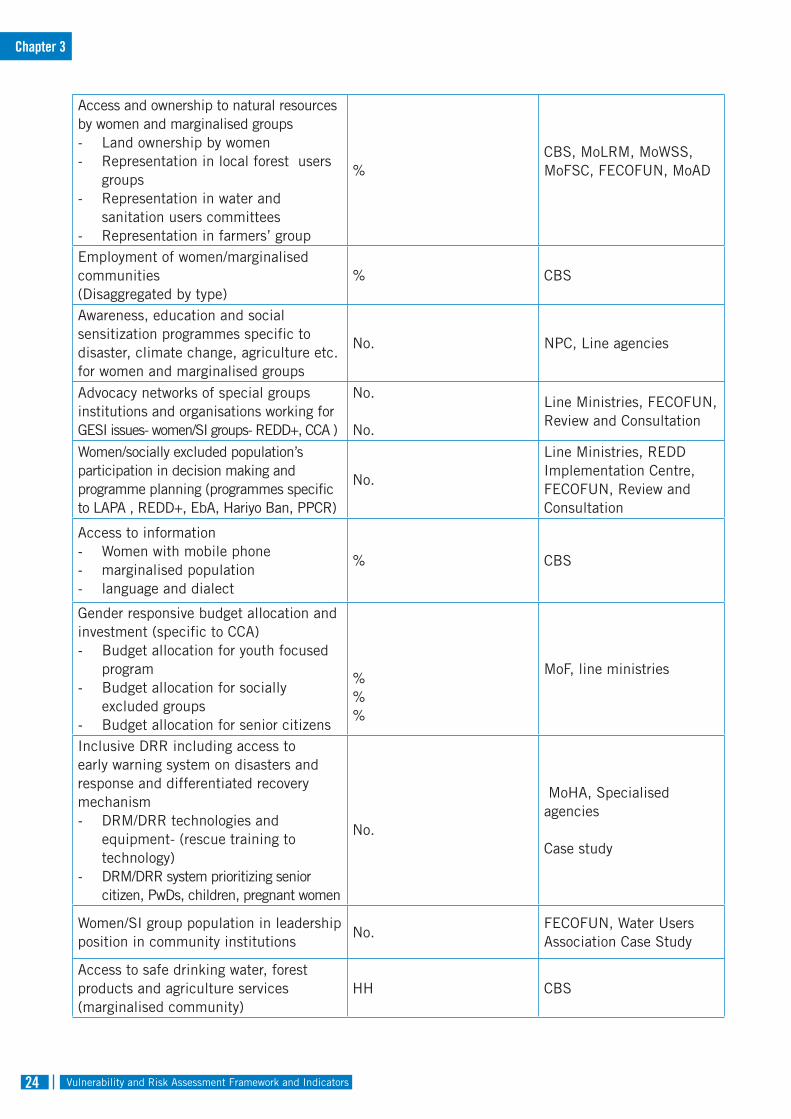
The adaptive capacity indicators include various socio-economic, technological, policy and governance, and socio-cultural elements that help build the adaptive capacity of women and marginalised groups. The indicators cover aspects such as social protection systems (insurance, credit facilities, savings and credit); reservations, allowances and special privilege systems; access to and ownership of natural resources; GESI focused mainstreamed policy, plans, programmes and budgets; participation and decision making; and supportive institutional structures.
Chapter 3
Vulnerability and Risk Assessment Framework and Indicators22
1. Indicators for hazard
Elements of Hazard Data SourceClimatic extreme events
− consecutive hot days− consecutive cold days− consecutive wet days− consecutive dry days− extreme rainfall− heat wave− cold wave
Climate-induced hazards− floods− landslides− drought− storm− GLOF− LDOF− Accelerated fire (forest, settlement)
DHM, DoF, ICIMOD, MoHA, MoFSC, ICI-MOD
2. Indicators for exposure
Exposure element Unit of Measurement Data Source
Women population No. CBS
Men Population No. CBS
PwDs population No. CBS
Marginalised and socially excluded communi-ties’ population
HH/No. CBS
Occupational and livelihood groups (fisher folks, blacksmith, NTFP dependent group, wage laborers, herding communities etc.)
HH CBS
Water bodies (River, Ponds, Spring and Wetland) No., ha MoFSC, ICIMOD, WWF
Farming system (shifting cultivation) No. Case Study
Grazing lands in high mountain Ha Case Study
Infrastructure (GESI) No. Case Study
Chapter 3
Vulnerability and Risk Assessment Framework and Indicators 23
3. Indicators for sensitivity
Elements of Sensitivity Indicators Data SourceAge groupHousehold headGeographic disparityReservation categoryEconomic conditionOccupationLand typeLand holdingCultural setting and practices Access of natural resourcesProximity to facilityInstitutions
%%%%No/%StatusTypesHaStatus KmNo.No.
CBS, MoLRM, MoWCSW
Case studies
4.Indicators for adaptive capacity
Elements of Adaptive Capacity Unit of measurement Data Source
Social protection system (insurance, credit facilities, saving –credit)- Insured population - People engaged in saving and credit, - Covered by subsidized loan targeted
for women/marginalised groups
%
%
CBS
Reservations, allowances and special privilege systems- widow population covered by widow
allowance- senior citizen covered by senior
citizen allowance - disable population covered by
disability allowance- population covered by Endangered
Indigenous People’s allowance- children population covered by child
grant- students (disabilities, remote
mountain region, highly marginalised groups) covered by scholarships
- students covered by Food for Education programme
- pregnant women covered by Aama - Various Employment Programme- joint land ownership
%Policies and budgets, District Profile, MoFALD, MoWCSW
Gender and marginalised community mainstreaming strategy, plans, programmes and implementation mechanisms, (Implementation status)
No.NPC, line ministries, Department, Districts
Chapter 3
Vulnerability and Risk Assessment Framework and Indicators24
Access and ownership to natural resources by women and marginalised groups- Land ownership by women- Representation in local forest users
groups- Representation in water and
sanitation users committees- Representation in farmers’ group
%CBS, MoLRM, MoWSS, MoFSC, FECOFUN, MoAD
Employment of women/marginalised communities(Disaggregated by type)
% CBS
Awareness, education and social sensitization programmes specific to disaster, climate change, agriculture etc. for women and marginalised groups
No. NPC, Line agencies
Advocacy networks of special groupsinstitutions and organisations working for GESI issues- women/SI groups- REDD+, CCA )
No.
No.
Line Ministries, FECOFUN, Review and Consultation
Women/socially excluded population’s participation in decision making and programme planning (programmes specific to LAPA , REDD+, EbA, Hariyo Ban, PPCR)
No.
Line Ministries, REDD Implementation Centre, FECOFUN, Review and Consultation
Access to information- Women with mobile phone- marginalised population- language and dialect
% CBS
Gender responsive budget allocation and investment (specific to CCA)- Budget allocation for youth focused
program- Budget allocation for socially
excluded groups- Budget allocation for senior citizens
%%%
MoF, line ministries
Inclusive DRR including access to early warning system on disasters and response and differentiated recovery mechanism- DRM/DRR technologies and
equipment- (rescue training to technology)
- DRM/DRR system prioritizing senior citizen, PwDs, children, pregnant women
No.
MoHA, Specialised agencies
Case study
Women/SI group population in leadership position in community institutions
No.FECOFUN, Water Users Association Case Study
Access to safe drinking water, forest products and agriculture services (marginalised community)
HH CBS
Chapter 3
Vulnerability and Risk Assessment Framework and Indicators 25
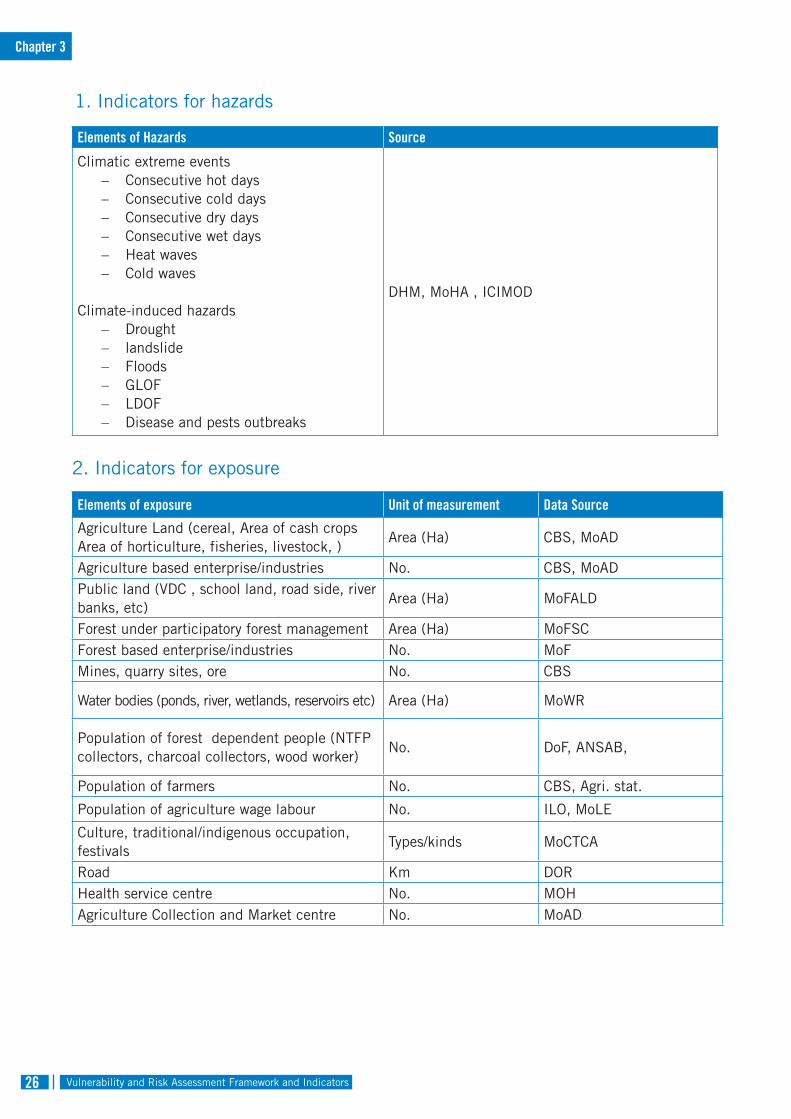
3.5. Vulnerability and Risk Assessment Indicators for Livelihoods and Governance
In Nepal, climate change impacts are expected to exacerbate poverty and increase the inequality and vulnerability of rural and urban households. Nepal ranks 145th of 188 countries in terms of human development; 25.4% of the population lives below the national poverty line (UNDP 2014). Adding to this, Nepal is now ranked among the top 17 nations vulnerable to climate change (as of 2014, Kreft et al. 2016).
Weather events and climate affect natural assets such as rivers, lakes, and fish stocks that form the basis of many livelihoods. Climate change will lead to a decline in agricultural productivity in many areas of Nepal for crops such as rice, which will negatively impact more than 70% of rural livelihoods. The extent of the impact on human health, security, livelihoods, and poverty will vary across Nepal. Greater dependence on agriculture and natural resources makes women highly sensitive to climate variability, extreme climate events, and climate-induced disasters. The existing vulnerabilities in Nepal result from the high prevalence of poverty, isolation, and marginality, together with low human development.
The poor and marginalised populations are more concentrated in rural and remote areas and pockets of urban settlements, which are directly exposed to climate change impacts. The indicators for exposure for the livelihood and governance sector mostly include people and the resources they depend on for their livelihood. For example, poor marginalised farmers who are practising subsistence agriculture are more exposed to the adverse impacts of climate change on agriculture. The destruction and depletion of
water bodies such as wetlands, ponds, and rivers exposes women, and poor and rural households more because of the additional stresses caused by poor accessibility and low availability of water. Livelihood dependent resources, infrastructure, and services are also exposed to climate change. These include major natural resource-based livelihoods and occupations such as agricultural farming, forest enterprise, fishing, and pastoralism.
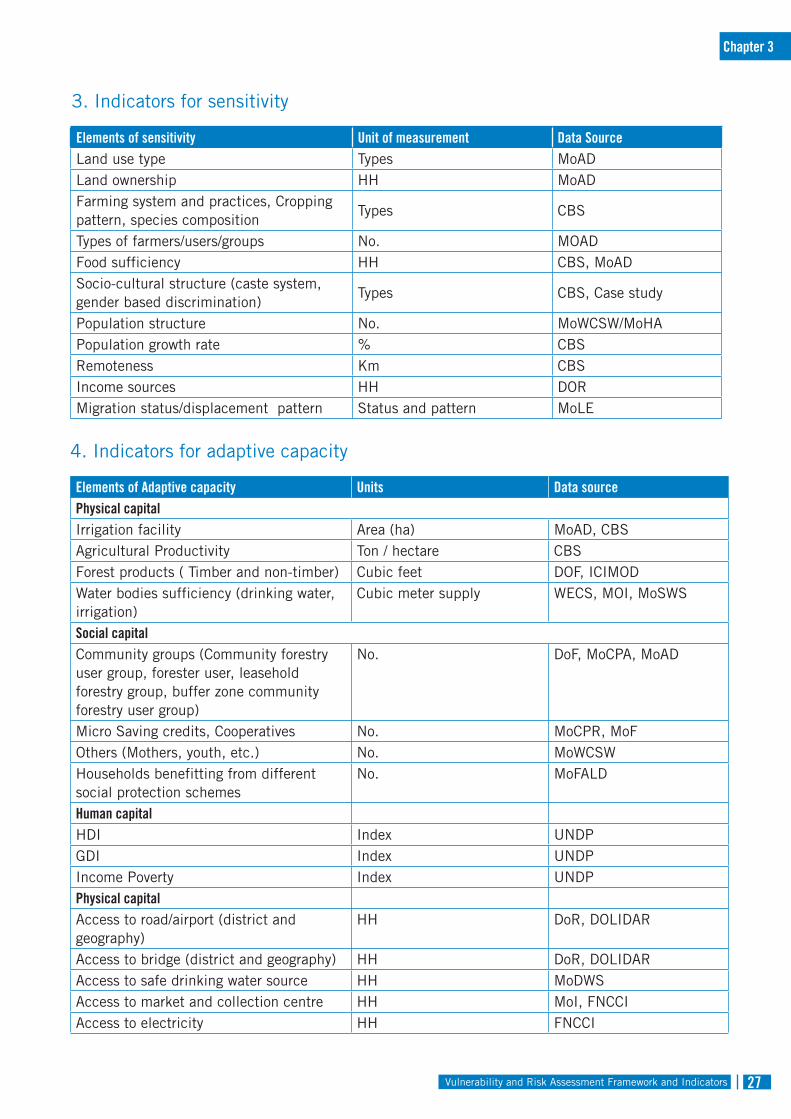
The difference in vulnerability to climate change among people and resources is determined by the degree of sensitivity and adaptive capacity. Sensitivity in this context refers to the way in which people, livelihood systems, and governance are susceptible to the impacts of climate change. The indicators include dimensions of physical assets, such as land use type, ownership, and farming systems; social dimensions such as socio-cultural structures, population structure, and remoteness; and indicators such as income source, migration status, and displacement pattern.
Adaptive capacity in the context of livelihood and governance is the ability of the existing system and structure to respond effectively to climate change. Overall, the adaptive capacity indicators converge around socio-economic, cultural, institutional, and geographical factors. The indicators include income, assets; improved infrastructure; access to technology and decision-making for a; increased decision-making power; changed cropping, livestock, and aquaculture practices; reliance on social networks; improved access to, and control of, the resources on which livelihoods are based; disaster risk reduction; social safety nets and social protection; and access to insurance schemes. In addition, the indicators cover various aspects of governance such as policies and plans, institutions and stakeholders, financial mechanisms and investments, and accountability and transparency mechanisms.
Chapter 3
Vulnerability and Risk Assessment Framework and Indicators26
1. Indicators for hazards
Elements of Hazards Source
Climatic extreme events − Consecutive hot days− Consecutive cold days− Consecutive dry days− Consecutive wet days− Heat waves − Cold waves
Climate-induced hazards − Drought − landslide − Floods − GLOF− LDOF− Disease and pests outbreaks
DHM, MoHA , ICIMOD
2. Indicators for exposure
Elements of exposure Unit of measurement Data Source
Agriculture Land (cereal, Area of cash crops Area of horticulture, fisheries, livestock, )
Area (Ha) CBS, MoAD
Agriculture based enterprise/industries No. CBS, MoADPublic land (VDC , school land, road side, river banks, etc)
Area (Ha) MoFALD
Forest under participatory forest management Area (Ha) MoFSCForest based enterprise/industries No. MoFMines, quarry sites, ore No. CBS
Water bodies (ponds, river, wetlands, reservoirs etc) Area (Ha) MoWR
Population of forest dependent people (NTFP collectors, charcoal collectors, wood worker)
No. DoF, ANSAB,
Population of farmers No. CBS, Agri. stat.
Population of agriculture wage labour No. ILO, MoLE
Culture, traditional/indigenous occupation, festivals
Types/kinds MoCTCA
Road Km DORHealth service centre No. MOHAgriculture Collection and Market centre No. MoAD
Chapter 3
Vulnerability and Risk Assessment Framework and Indicators 27
3. Indicators for sensitivity
Elements of sensitivity Unit of measurement Data Source Land use type Types MoADLand ownership HH MoADFarming system and practices, Cropping pattern, species composition
Types CBS
Types of farmers/users/groups No. MOADFood sufficiency HH CBS, MoADSocio-cultural structure (caste system, gender based discrimination)
Types CBS, Case study
Population structure No. MoWCSW/MoHAPopulation growth rate % CBSRemoteness Km CBSIncome sources HH DORMigration status/displacement pattern Status and pattern MoLE
4. Indicators for adaptive capacity
Elements of Adaptive capacity Units Data source Physical capital Irrigation facility Area (ha) MoAD, CBSAgricultural Productivity Ton / hectare CBSForest products ( Timber and non-timber) Cubic feet DOF, ICIMODWater bodies sufficiency (drinking water, irrigation)
Cubic meter supply WECS, MOI, MoSWS
Social capital Community groups (Community forestry user group, forester user, leasehold forestry group, buffer zone community forestry user group)
No. DoF, MoCPA, MoAD
Micro Saving credits, Cooperatives No. MoCPR, MoFOthers (Mothers, youth, etc.) No. MoWCSWHouseholds benefitting from different social protection schemes
No. MoFALD
Human capital HDI Index UNDPGDI Index UNDPIncome Poverty Index UNDPPhysical capitalAccess to road/airport (district and geography)
HH DoR, DOLIDAR
Access to bridge (district and geography) HH DoR, DOLIDARAccess to safe drinking water source HH MoDWSAccess to market and collection centre HH MoI, FNCCIAccess to electricity HH FNCCI
Chapter 3
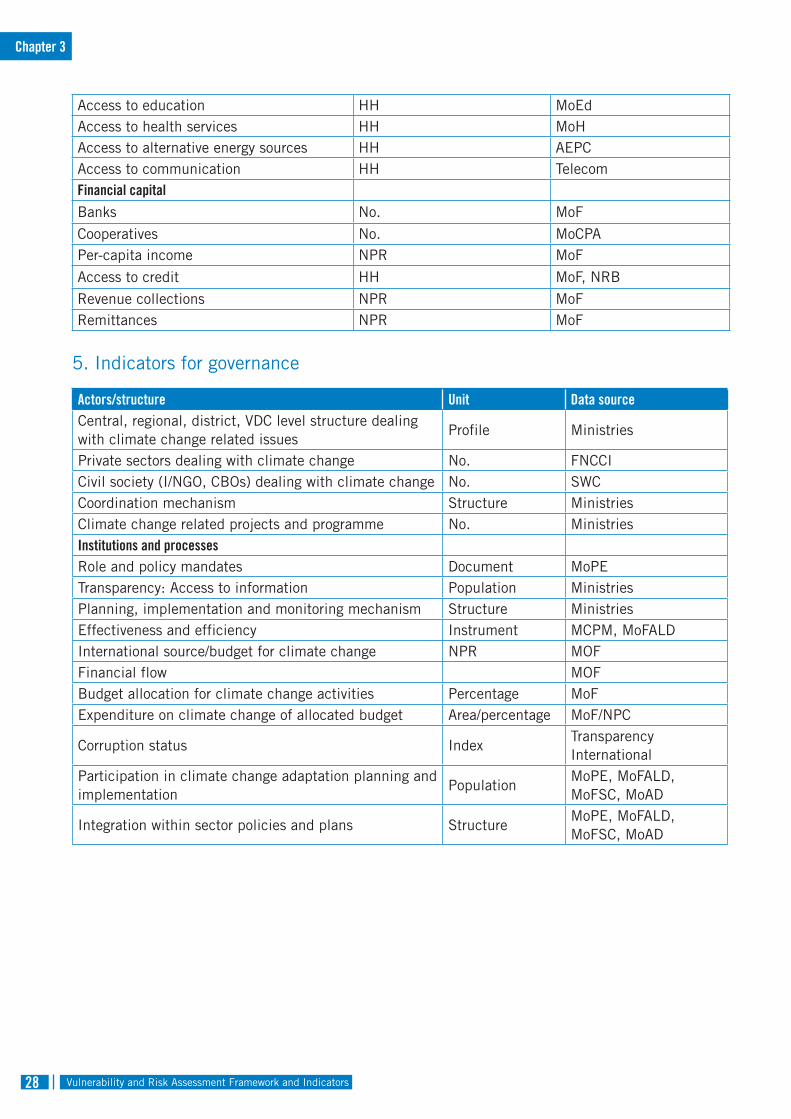
Vulnerability and Risk Assessment Framework and Indicators28
Access to education HH MoEdAccess to health services HH MoHAccess to alternative energy sources HH AEPCAccess to communication HH Telecom Financial capital Banks No. MoF
Cooperatives No. MoCPAPer-capita income NPR MoF
Access to credit HH MoF, NRB
Revenue collections NPR MoFRemittances NPR MoF
5. Indicators for governance
Actors/structure Unit Data sourceCentral, regional, district, VDC level structure dealing with climate change related issues
Profile Ministries
Private sectors dealing with climate change No. FNCCICivil society (I/NGO, CBOs) dealing with climate change No. SWCCoordination mechanism Structure Ministries Climate change related projects and programme No. Ministries Institutions and processes Role and policy mandates Document MoPETransparency: Access to information Population Ministries Planning, implementation and monitoring mechanism Structure Ministries Effectiveness and efficiency Instrument MCPM, MoFALDInternational source/budget for climate change NPR MOFFinancial flow MOFBudget allocation for climate change activities Percentage MoFExpenditure on climate change of allocated budget Area/percentage MoF/NPC
Corruption status Index Transparency International
Participation in climate change adaptation planning and implementation
Population MoPE, MoFALD, MoFSC, MoAD
Integration within sector policies and plans Structure MoPE, MoFALD, MoFSC, MoAD
Chapter 3
Vulnerability and Risk Assessment Framework and Indicators 29
3.6. Vulnerability and Risk Assessment Indicators for Public Health (WASH)
Human health is intimately related to climate. Weather and climate have a wide range of health impacts and play a role in the ecology of many infectious diseases (Patz et al. 2000).
The Fifth Assessment Report of the Intergovernmental Panel on Climate Change (IPCC-AR5) has indicated that climate change impacts on human health will be multi-fold. A number of adverse public health impacts are expected to worsen in climate-related disasters such as storms, floods, landslides, extreme heat, drought, and wildfires (IPCC 2014).
Extreme climate events and climate-induced disasters are expected to become more frequent in Nepal as a result of climate change. There is a strong link between disease outbreaks and climate change (Patz et al. 2000). As of 2000, South Asian countries (including Bangladesh, Bhutan, India, Maldives, and Nepal) had the highest burden of diarrhoea and malnutrition in the world, and this is expected to be exacerbated under future climate scenarios (Ramachandran 2014). A number of recent studies have highlighted the burden of diarrhoeal disease in mountain regions. There is an increasing trend in vector-borne and water-borne diseases in both rural and urban areas in Nepal, often with a shift to higher altitudes (Badu 2013); malaria, kala-zaar, and arboviral diseases are all common and likely to be affected by climate change (Dhimal and Bhusal 2009). In addition to disease, there is also an increasing trend in health-related hazards as a result of the impacts of climate-induced disasters. Nepal is classified as a hot-spot for geophysical and climatic hazards (MoHA 2009). Globally, in the two decades from 1988 to 2007, Nepal was in 23rd position in terms of loss of life due to natural disasters (MoHA and
DPNet 2009). More than 4,000 people died in the last ten years as a result of massive flooding and landslides, including associated outbreaks of water-borne and vector-borne diseases, with an economic loss of USD 5.34 billion. In addition to the economic loss, households experience a high level of physical and mental stress as a result of losing family members (Regmi et al. 2016).
The National Adaptation Plan (NAP) process in Nepal has identified Public Health and Water, Sanitation and Health (WASH) as a key thematic area due to its exposure and vulnerability to climate change. A large proportion of the population in both rural and urban areas depend on climate sensitive sectors, thus they are exposed and vulnerable to climate change. The exposure indicators in this sector include human population, health facilities, infrastructure and services, human resources working in the sector, and, specifically for WASH, water sources, water infrastructure and services, and sanitation infrastructure and services.
Vulnerability in the public health and WASH sector looks at the sensitivity of the exposed population, resources, and services, and their capacity to respond to climate change impact. Sensitivity indicators include population characteristics and features, infrastructure location and condition, access to and quality of services, and population dynamics including socio-economic differences.
The adaptive capacity indicators mostly refer to the existing capacity in terms of human resources, investments (both national and international) in emergency response and preparedness, policy and institutions, technological advances, early warning systems and hazard monitoring, and technological practices, as well as the socio-economic capability of the population in terms of their ability to access and benefit from services.
Chapter 3
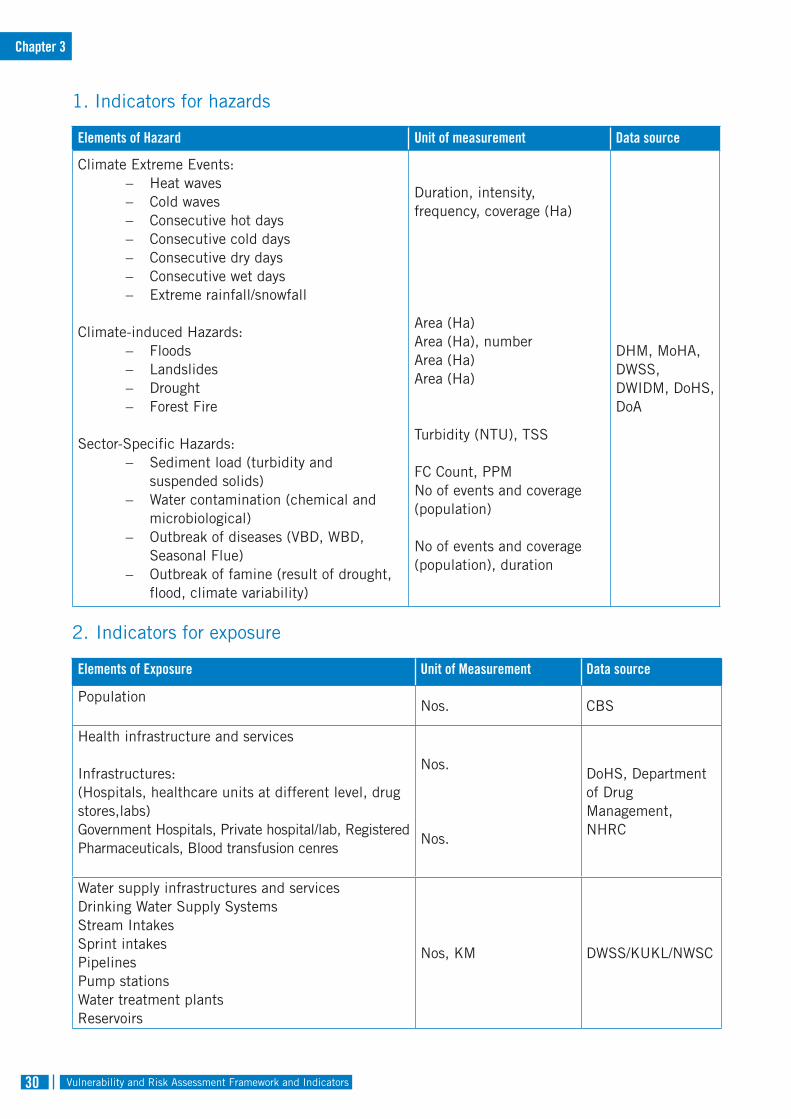
Vulnerability and Risk Assessment Framework and Indicators30
1. Indicators for hazards
Elements of Hazard Unit of measurement Data source
Climate Extreme Events:− Heat waves− Cold waves− Consecutive hot days− Consecutive cold days− Consecutive dry days− Consecutive wet days− Extreme rainfall/snowfall
Climate-induced Hazards:− Floods− Landslides− Drought− Forest Fire
Sector-Specific Hazards:− Sediment load (turbidity and
suspended solids)− Water contamination (chemical and
microbiological)− Outbreak of diseases (VBD, WBD,
Seasonal Flue)− Outbreak of famine (result of drought,
flood, climate variability)
Duration, intensity, frequency, coverage (Ha)
Area (Ha)Area (Ha), numberArea (Ha)Area (Ha)
Turbidity (NTU), TSS
FC Count, PPMNo of events and coverage (population)
No of events and coverage (population), duration
DHM, MoHA, DWSS, DWIDM, DoHS, DoA
2. Indicators for exposure
Elements of Exposure Unit of Measurement Data source
PopulationNos. CBS
Health infrastructure and services
Infrastructures:(Hospitals, healthcare units at different level, drug stores,labs)Government Hospitals, Private hospital/lab, Registered Pharmaceuticals, Blood transfusion cenres
Nos.
Nos.
DoHS, Department of Drug Management, NHRC
Water supply infrastructures and servicesDrinking Water Supply SystemsStream IntakesSprint intakesPipelinesPump stationsWater treatment plantsReservoirs
Nos, KM DWSS/KUKL/NWSC
Chapter 3

Vulnerability and Risk Assessment Framework and Indicators 31
Sanitation infrastructures and services− Sanitation Systems (Sewerage lines, private
toilets, public toilets, septic tanks, water treatment plants Landfill sites)
Nos., KM
DWSS/KUKL/NWSC/MoFALD
Water sources − Ground (deep, shallow)− Surface− Spring− Watersheds
Nos., Yield (l/s), Level (m), Area (hectare)
CBS, GWRDC, DWSS, DOI
3. Indicators for sensitivity
Elements of Sensitivity Unit of measurement
Data Source
Average time required to reach the nearest health center Hours DoHSMobility of population Frequency ConsultationMortality rate (CDR, U5MR) Per 1000 DoHSDisease prevalence and incidence of disease including trend (NCD, Malaria, Dengue, JE, Malnutrition, Psychosocial effect)
Status DoHS
Age, gender (NPC category, wealth quantile and ecological belt) Population, % DoHSRace, ethnicity Population, % CBSPoverty Population, % CBSDisparities (geographic, social) Status ConsultationAccess to care and public health facilities Population, % DoHS
Pre-existing health conditionStatus, Population, %
DoHS,
Infrastructure condition (Example: water supply systems already having functionality problems)
Status, % DoHS, DWSS
Population density (urban and rural) Status, % CBSOccupation type Population, % CBSLocation of infrastructures (Example: Hospitals, WTTPs on the river banks, WASH facilities such as intakes/pipes) etc.)
ProximityConsultation, DoHS, DWSS
Condition of water sources and watersheds Yield, status, % DWSS, MoFSC
Water demand rateLiters per capita per day
DWSS
4. Indicators for adaptive capacity
Elements of Adaptive Capacity Unit of measurement Data SourceAvailability of improved sanitation (toilet) HH Coverage (%) DWSSAdequate water supply (quantity) HH coverage (%) DWSS
Solid waste collection and management Number, coverageMoWSS, MoH, MoFALD
Surveillance system (water supply, disease)Water supply (quality and quantity) VPD Disease: Kalazaar, Malaria, Filariasis, Kalazaar, Malaria, Filariasis, Polio, Measles
Status, No. DoHS
Chapter 3
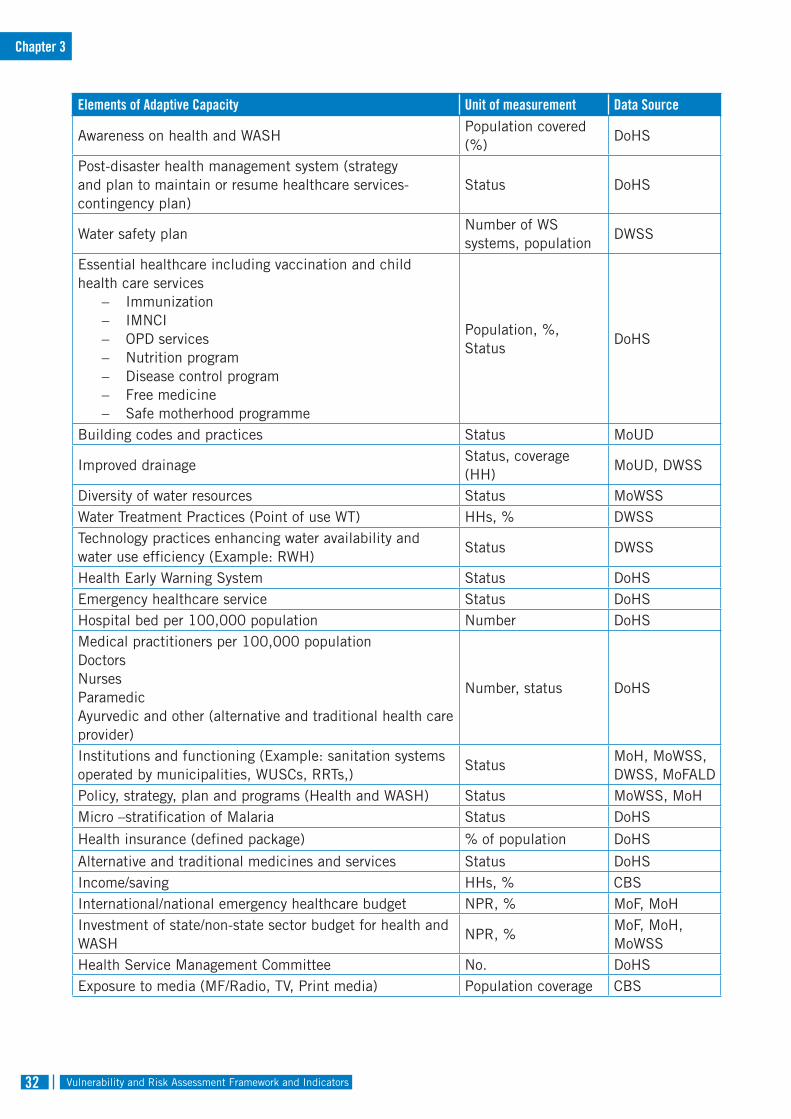
Vulnerability and Risk Assessment Framework and Indicators32
Elements of Adaptive Capacity Unit of measurement Data Source
Awareness on health and WASHPopulation covered (%)
DoHS
Post-disaster health management system (strategy and plan to maintain or resume healthcare services- contingency plan)
Status DoHS
Water safety planNumber of WS systems, population
DWSS
Essential healthcare including vaccination and child health care services
− Immunization− IMNCI− OPD services− Nutrition program− Disease control program− Free medicine − Safe motherhood programme
Population, %, Status
DoHS
Building codes and practices Status MoUD
Improved drainageStatus, coverage (HH)
MoUD, DWSS
Diversity of water resources Status MoWSSWater Treatment Practices (Point of use WT) HHs, % DWSSTechnology practices enhancing water availability and water use efficiency (Example: RWH)
Status DWSS
Health Early Warning System Status DoHSEmergency healthcare service Status DoHSHospital bed per 100,000 population Number DoHSMedical practitioners per 100,000 populationDoctorsNursesParamedic Ayurvedic and other (alternative and traditional health care provider)
Number, status DoHS
Institutions and functioning (Example: sanitation systems operated by municipalities, WUSCs, RRTs,)
StatusMoH, MoWSS, DWSS, MoFALD
Policy, strategy, plan and programs (Health and WASH) Status MoWSS, MoHMicro –stratification of Malaria Status DoHS
Health insurance (defined package) % of population DoHS
Alternative and traditional medicines and services Status DoHSIncome/saving HHs, % CBSInternational/national emergency healthcare budget NPR, % MoF, MoHInvestment of state/non-state sector budget for health and WASH
NPR, %MoF, MoH, MoWSS
Health Service Management Committee No. DoHSExposure to media (MF/Radio, TV, Print media) Population coverage CBS
Chapter 3
Vulnerability and Risk Assessment Framework and Indicators 33
3.7. Vulnerability and Risk Assessment Indicators for Tourism, Natural and Cultural Heritage
Tourism is a vehicle for socio-economic development as a result of its potential to earn foreign exchange, create employment, reduce income and employment disparities, strengthen linkages among economic sectors, control outmigration of local youth, and help alleviate poverty (Kurk 2009). The 2014 tourism employment survey identified a total of 138,148 persons directly engaged in the tourism sector in Nepal (MoCTCA 2014). The World Travel and Tourism Council (WTTC) 2014 report indicated that travel and tourism in Nepal generated 504,000 direct jobs in 2012 (3.2% of total employment), and this figure was expected to grow to 536,000 (3.3% of total employment) in 2014 (MoCTCA 2015).
The climatic condition of destinations plays an important role in the tourism industry. Climate change induced disasters impact the tourism industry both directly and indirectly by damaging tourism-related infrastructure and resources, and disturbing tourism activities, water supply, organic farming, and the well-being of tourism service providers. Receding snow lines, melting glaciers, increased frequency of cloudbursts, floods, and landslides have the potential to change the nature and quality of tourism resources (Sharma 2012). Avalanches in November 1995 killed 43 people (including foreign trekkers) in the Khumbu and Kanchanjunga areas. On 2nd January 1999, five people were swept away by an avalanche in Chunchet Village Development Committee Ward No. 8 in Gorkha district. In November 2014, unseasonal snowfall and avalanches resulting from the effects of Cyclone Hudhud killed at least 43 trekkers and guides between 2005 and 2014, a total of 235 people were killed by inclement weather in the country, including avalanches and snowstorms (MoHA 2015).
Tourism, including that based on natural and cultural heritage, was taken as a major climate
sensitive thematic sector in the preparation process for Nepal’s (NAP). Exposure in this sector refers to the elements in an area in which climate hazard events occur. Exposure indicators include the presence of people at the tourist destination with livelihoods dependent on the system, including natural and cultural heritage sites. It also includes services and resources for the tourism sector such as base camps and campsites; infrastructure such as airports, hotels, trekking trails, and roads; economic, social, and cultural assets, including religious and pilgrimage sites; protected areas; archaeological and historical sites; and sites with aesthetic value.
Nepal’s tourism resources and activities are highly vulnerable to climate change. In the NAP process, vulnerability is understood as the outcome of sensitivity and adaptive capacity. The sensitivity indicators for this thematic sector include the physical predisposition of the population, infrastructure, and environment that can be damaged by a hazard event. Sensitivity is determined by population growth rate, age group, household income, remoteness and migration. The sensitivity indicators include geographical and ecological location, proximity and flow of tourism at a specific location, and quality of communication, services, and infrastructure.
The degree of vulnerability is influenced by limitations in access to and mobilization of human resources and institutions, and the level of capacity to anticipate, adapt, and respond in absorbing socio-ecological and economic impact. The overarching indicators for adaptive capacity include institutional, infrastructural,and environmental capacity and socio-economic components. The adaptive capacity indicators selected for the sector include policies, plans and investments in the sector; socio-economic status of the population engaged in tourism; financial mechanisms such as insurance, investments, and private sector engagement; existing infrastructure and its capabilities; and services such as early warning systems, rescue, and rehabilitation.
Chapter 3
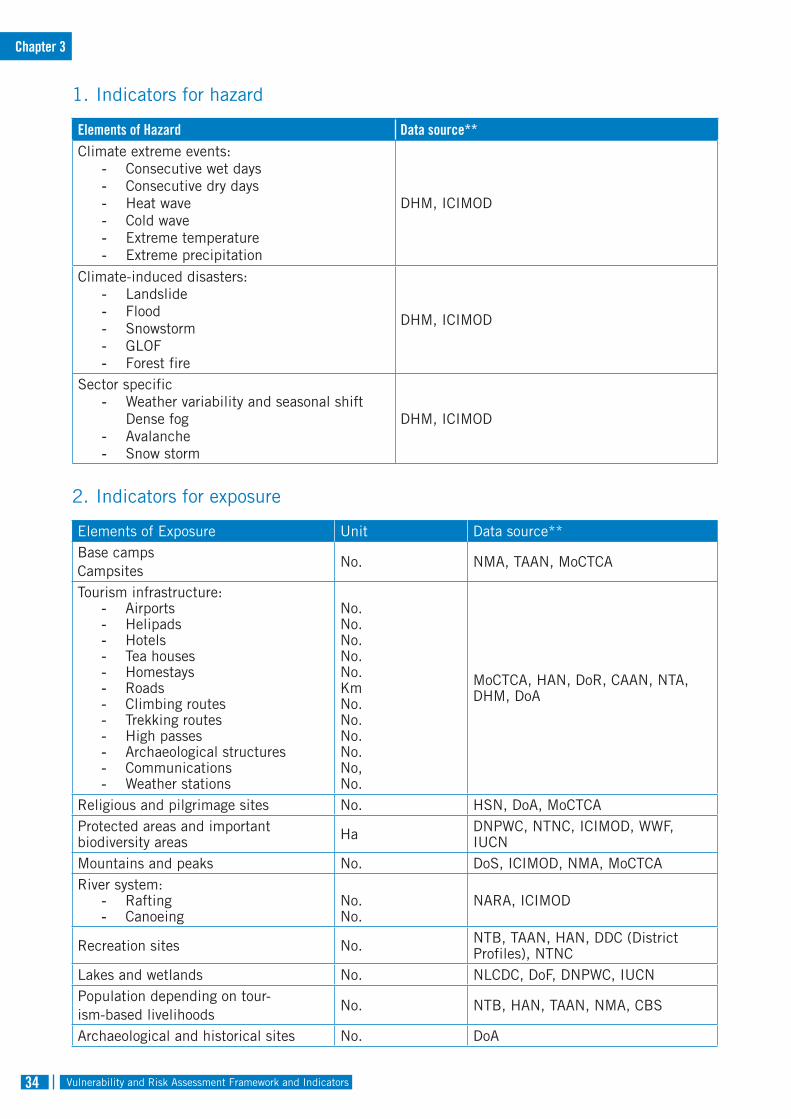
Vulnerability and Risk Assessment Framework and Indicators34
1. Indicators for hazard
Elements of Hazard Data source**Climate extreme events:
- Consecutive wet days- Consecutive dry days- Heat wave- Cold wave- Extreme temperature - Extreme precipitation
DHM, ICIMOD
Climate-induced disasters:- Landslide- Flood- Snowstorm- GLOF- Forest fire
DHM, ICIMOD
Sector specific- Weather variability and seasonal shift
Dense fog- Avalanche- Snow storm
DHM, ICIMOD
2. Indicators for exposure
Elements of Exposure Unit Data source**Base campsCampsites
No. NMA, TAAN, MoCTCA
Tourism infrastructure:- Airports- Helipads- Hotels- Tea houses- Homestays- Roads- Climbing routes- Trekking routes- High passes- Archaeological structures- Communications- Weather stations
No.No.No.No.No.KmNo. No.No.No.No,No.
MoCTCA, HAN, DoR, CAAN, NTA, DHM, DoA
Religious and pilgrimage sites No. HSN, DoA, MoCTCAProtected areas and important biodiversity areas Ha DNPWC, NTNC, ICIMOD, WWF,
IUCNMountains and peaks No. DoS, ICIMOD, NMA, MoCTCARiver system:
- Rafting- Canoeing
No.No.
NARA, ICIMOD
Recreation sites No. NTB, TAAN, HAN, DDC (District Profiles), NTNC
Lakes and wetlands No. NLCDC, DoF, DNPWC, IUCNPopulation depending on tour-ism-based livelihoods
No. NTB, HAN, TAAN, NMA, CBS
Archaeological and historical sites No. DoA
Chapter 3
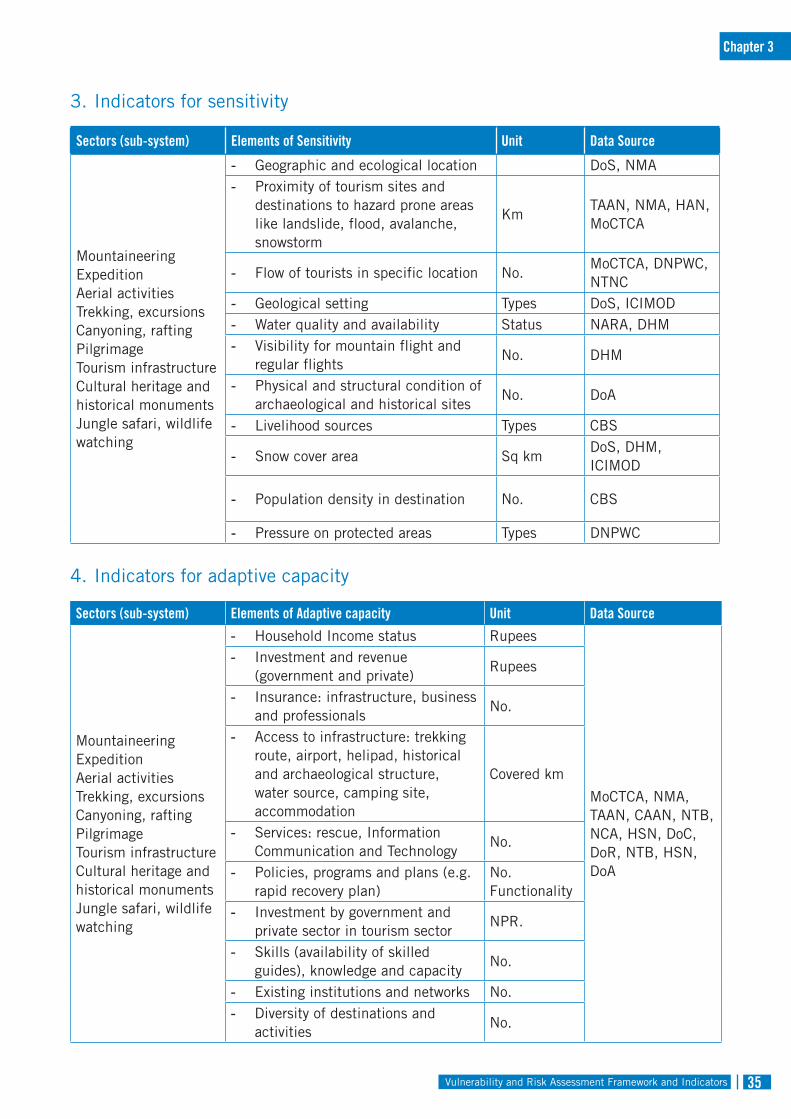
Vulnerability and Risk Assessment Framework and Indicators 35
3. Indicators for sensitivity
Sectors (sub-system) Elements of Sensitivity Unit Data Source
MountaineeringExpeditionAerial activitiesTrekking, excursionsCanyoning, raftingPilgrimageTourism infrastructureCultural heritage and historical monumentsJungle safari, wildlife watching
- Geographic and ecological location DoS, NMA- Proximity of tourism sites and
destinations to hazard prone areas like landslide, flood, avalanche, snowstorm
KmTAAN, NMA, HAN, MoCTCA
- Flow of tourists in specific location No.MoCTCA, DNPWC, NTNC
- Geological setting Types DoS, ICIMOD- Water quality and availability Status NARA, DHM- Visibility for mountain flight and
regular flightsNo. DHM
- Physical and structural condition of archaeological and historical sites
No. DoA
- Livelihood sources Types CBS
- Snow cover area Sq kmDoS, DHM, ICIMOD
- Population density in destination No. CBS
- Pressure on protected areas Types DNPWC
4. Indicators for adaptive capacity
Sectors (sub-system) Elements of Adaptive capacity Unit Data Source
MountaineeringExpeditionAerial activitiesTrekking, excursionsCanyoning, raftingPilgrimageTourism infrastructureCultural heritage and historical monumentsJungle safari, wildlife watching
- Household Income status Rupees
MoCTCA, NMA, TAAN, CAAN, NTB, NCA, HSN, DoC, DoR, NTB, HSN, DoA
- Investment and revenue (government and private)
Rupees
- Insurance: infrastructure, business and professionals
No.
- Access to infrastructure: trekking route, airport, helipad, historical and archaeological structure, water source, camping site, accommodation
Covered km
- Services: rescue, Information Communication and Technology
No.
- Policies, programs and plans (e.g. rapid recovery plan)
No.Functionality
- Investment by government and private sector in tourism sector
NPR.
- Skills (availability of skilled guides), knowledge and capacity
No.
- Existing institutions and networks No.- Diversity of destinations and
activitiesNo.
Chapter 3
Vulnerability and Risk Assessment Framework and Indicators36
3.8. Vulnerability and Risk Assessment Indicators for Urban Settlements and Infrastructure
More than half of the world’s population now live in urban areas. In Nepal, the urban population currently accounts for about 42% of the national population, compared to 17% in 2011 (NPC 2016). This growth, largely fuelled by rural-to-urban migration, has been mostly haphazard and accompanied by inadequate and sub-standard urban infrastructure and services. Urban expansion has also occurred in unsafe and geologically fragile areas such as along riverbanks and on steep slopes prone to landslides. Nepal’s urban growth is primarily characterised by: (1) an increase in the number of municipalities; (2) expansion of urban areas; (3) initially, relatively steady increase in the population of designated urban areas; and (4) rapid increase in population in recent years (Subedi 2014).
Although Nepal’s urbanization process is expected to deliver socio-economic growth and development, it also presents potential risks. Both cities and towns, including rural settlements, are exposed to recurring rapid-onset natural hazards such as floods. Longer term, slower-onset changes, such as increased temperature and changing rainfall patterns, are already having serious impacts, some of which are contributing to rural-urban migration. Intense rainfall will lead to an increasing loss in assets and lives in urban areas as a result of floods, especially in flood-prone areas such as the Terai and places where there is increased water runoff due to the increase in impermeable surfaces. Increasing water shortages may result in higher prices for services, thereby threatening affordability and incomes.
Rapid urbanization and growth in Nepal’s large cities has been accompanied by an increase in the number of highly vulnerable urban communities living in informal settlements. Many such settlements are located on land exposed to extreme weather such as river banks that are prone to flash floods. Moreover, a high proportion of the population, of the built assets (both private property and public infrastructure), and of the economic activities in urban areas are exposed to climate extreme events and climate-induced disasters. The exposed elements include people, assets, and infrastructure. These are mainly related to urban (municipal) settlements and buildings and major district-level infrastructure, in particular roads, water supply, and sewerage systems, and encompass the urban ecosystem and environmental services.
The indicators for sensitivity and adaptive capacity measure the vulnerability of the exposed systems to climate change in the context of urban settlements and infrastructure. These indicators are influenced by physical factors (e.g., presence of roads) and socio-economic factors (e.g., income, age, and gender). The sensitivity of urban settlements and infrastructure is determined by the geographical location of properties (or physical exposure to hazards), their age, materials used in construction, and design considerations related to climate change risks.
The adaptive capacity indicators include population indices such as the Human Development Index (HDI) and Human Poverty Index (HPI); the urban infrastructure system, including availability and access to urban services; urban settlements, including various kinds of building; and urban planning and management.
Chapter 3
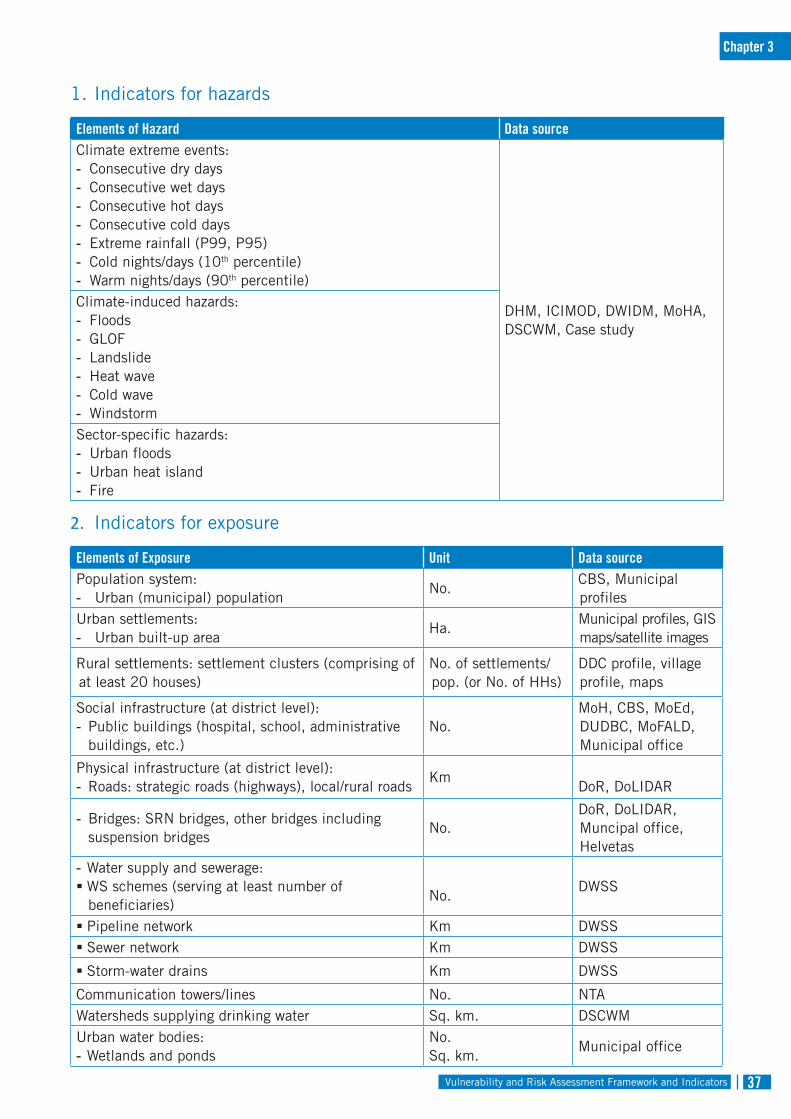
Vulnerability and Risk Assessment Framework and Indicators 37
1. Indicators for hazards
Elements of Hazard Data sourceClimate extreme events:- Consecutive dry days- Consecutive wet days- Consecutive hot days- Consecutive cold days- Extreme rainfall (P99, P95)- Cold nights/days (10th percentile)- Warm nights/days (90th percentile)
DHM, ICIMOD, DWIDM, MoHA, DSCWM, Case study
Climate-induced hazards:- Floods- GLOF- Landslide- Heat wave- Cold wave- WindstormSector-specific hazards:- Urban floods- Urban heat island- Fire
2. Indicators for exposure
Elements of Exposure Unit Data sourcePopulation system:- Urban (municipal) population
No.CBS, Municipal profiles
Urban settlements:- Urban built-up area
Ha.Municipal profiles, GIS maps/satellite images
Rural settlements: settlement clusters (comprising of at least 20 houses)
No. of settlements/ pop. (or No. of HHs)
DDC profile, village profile, maps
Social infrastructure (at district level):- Public buildings (hospital, school, administrative
buildings, etc.)No.
MoH, CBS, MoEd, DUDBC, MoFALD, Municipal office
Physical infrastructure (at district level):- Roads: strategic roads (highways), local/rural roads
KmDoR, DoLIDAR
- Bridges: SRN bridges, other bridges including suspension bridges
No.DoR, DoLIDAR, Muncipal office, Helvetas
- Water supply and sewerage:WS schemes (serving at least number of
beneficiaries)No.
DWSS
Pipeline network Km DWSSSewer network Km DWSS
Storm-water drains Km DWSS
Communication towers/lines No. NTAWatersheds supplying drinking water Sq. km. DSCWMUrban water bodies:- Wetlands and ponds
No.Sq. km.
Municipal office
Chapter 3
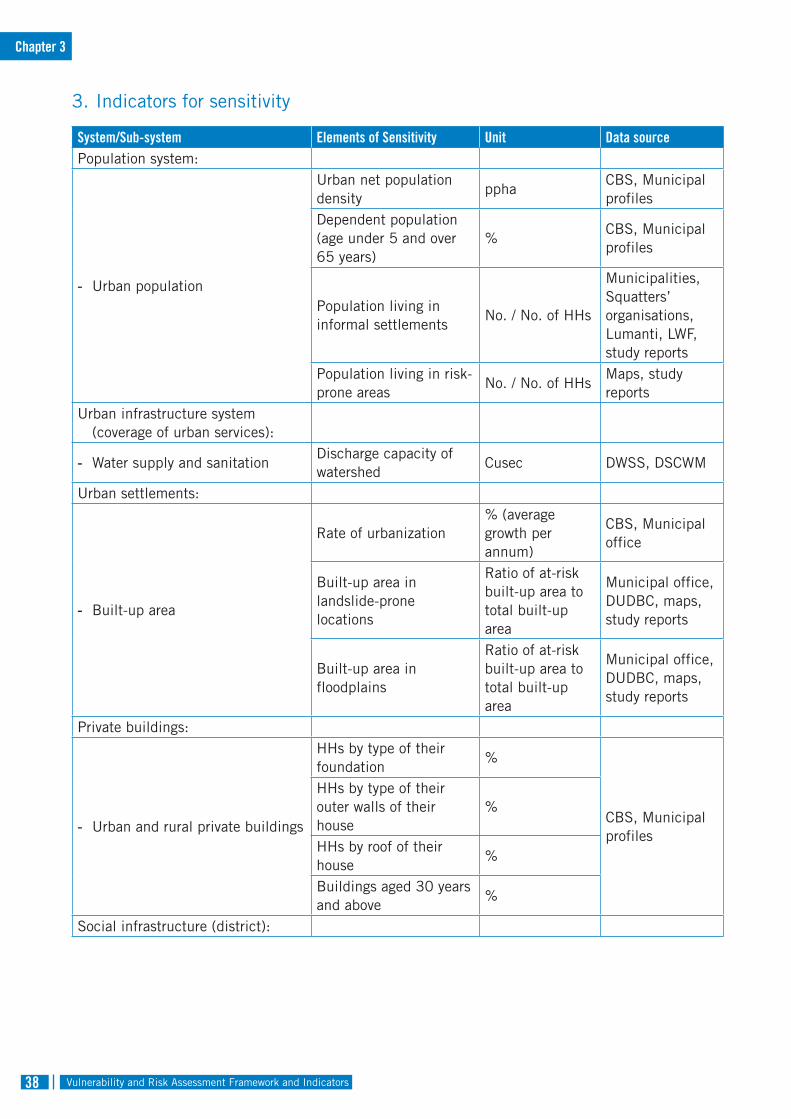
Vulnerability and Risk Assessment Framework and Indicators38
3. Indicators for sensitivity
System/Sub-system Elements of Sensitivity Unit Data sourcePopulation system:
- Urban population
Urban net population density
pphaCBS, Municipal profiles
Dependent population (age under 5 and over 65 years)
%CBS, Municipal profiles
Population living in informal settlements
No. / No. of HHs
Municipalities, Squatters’ organisations, Lumanti, LWF, study reports
Population living in risk-prone areas
No. / No. of HHsMaps, study reports
Urban infrastructure system (coverage of urban services):
- Water supply and sanitationDischarge capacity of watershed
Cusec DWSS, DSCWM
Urban settlements:
- Built-up area
Rate of urbanization% (average growth per annum)
CBS, Municipal office
Built-up area in landslide-prone locations
Ratio of at-risk built-up area to total built-up area
Municipal office, DUDBC, maps, study reports
Built-up area in floodplains
Ratio of at-risk built-up area to total built-up area
Municipal office, DUDBC, maps, study reports
Private buildings:
- Urban and rural private buildings
HHs by type of their foundation
%
CBS, Municipal profiles
HHs by type of their outer walls of their house
%
HHs by roof of their house
%
Buildings aged 30 years and above
%
Social infrastructure (district):
Chapter 3
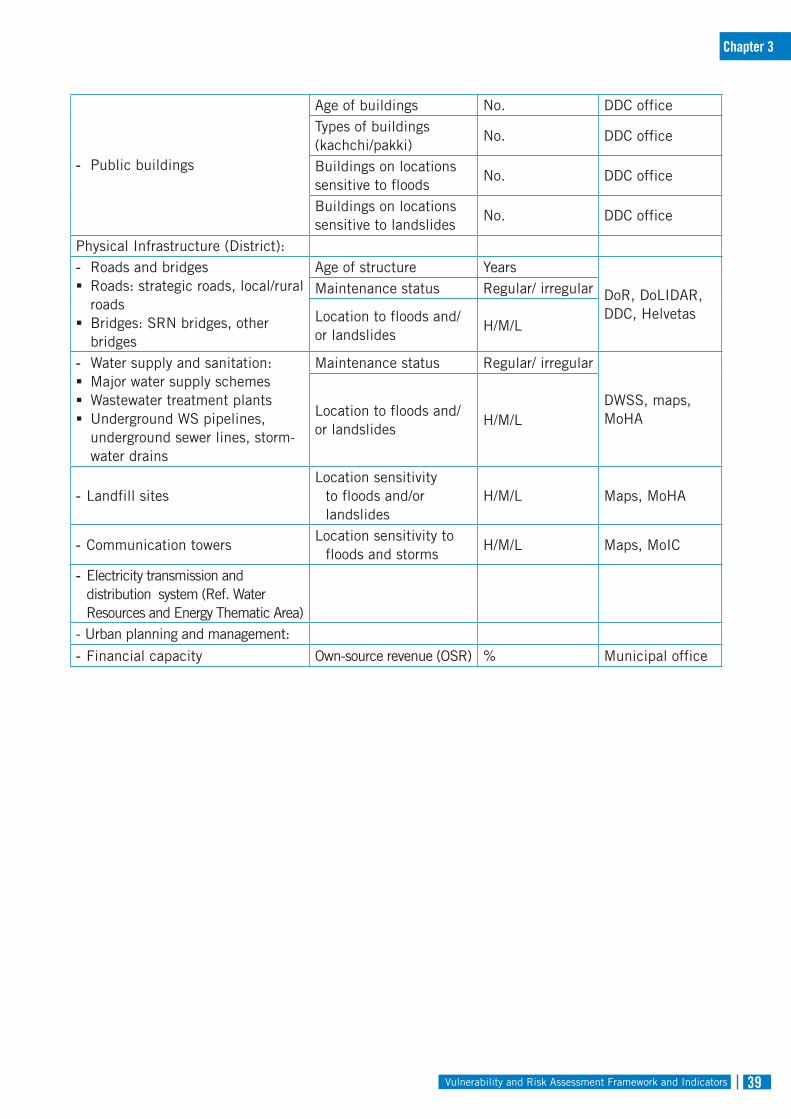
Vulnerability and Risk Assessment Framework and Indicators 39
- Public buildings
Age of buildings No. DDC officeTypes of buildings (kachchi/pakki)
No. DDC office
Buildings on locations sensitive to floods
No. DDC office
Buildings on locations sensitive to landslides
No. DDC office
Physical Infrastructure (District):- Roads and bridgesRoads: strategic roads, local/rural
roadsBridges: SRN bridges, other
bridges
Age of structure Years
DoR, DoLIDAR, DDC, Helvetas
Maintenance status Regular/ irregular
Location to floods and/or landslides
H/M/L
- Water supply and sanitation:Major water supply schemesWastewater treatment plantsUnderground WS pipelines,
underground sewer lines, storm-water drains
Maintenance status Regular/ irregular
DWSS, maps, MoHALocation to floods and/
or landslidesH/M/L
- Landfill sitesLocation sensitivity
to floods and/or landslides
H/M/L Maps, MoHA
- Communication towersLocation sensitivity to
floods and stormsH/M/L Maps, MoIC
- Electricity transmission and distribution system (Ref. Water Resources and Energy Thematic Area)
- Urban planning and management:
- Financial capacity Own-source revenue (OSR) % Municipal office
Chapter 3
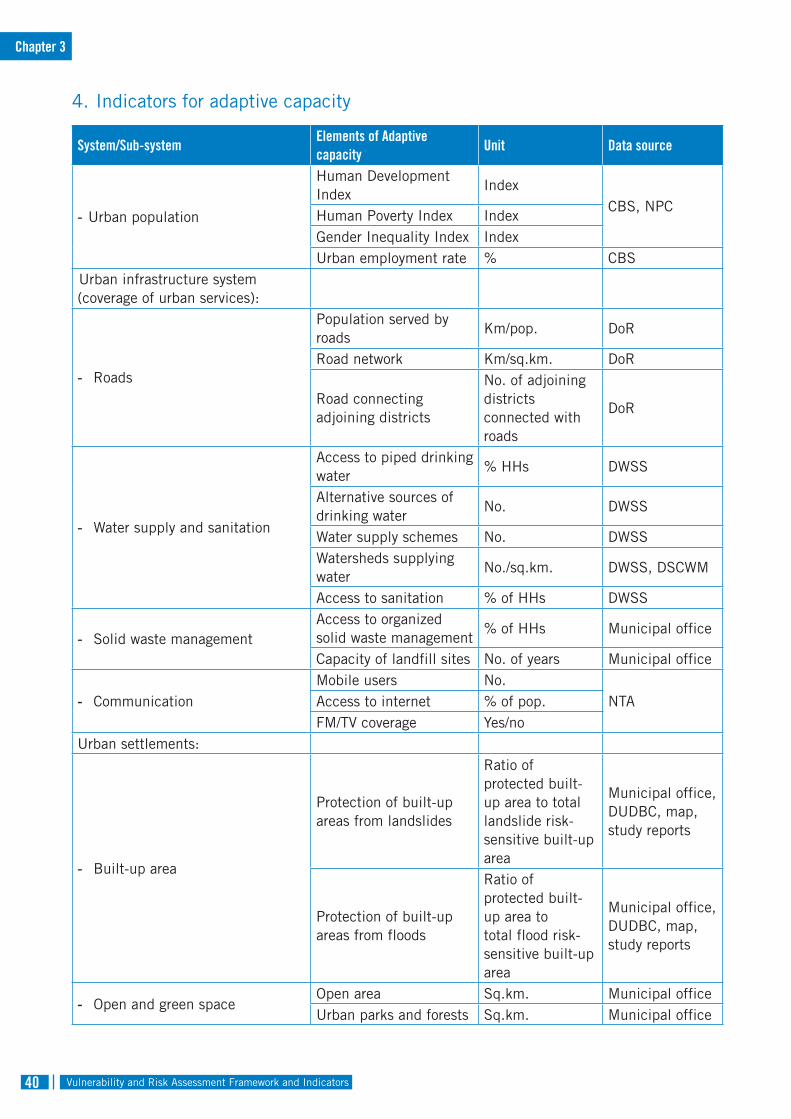
Vulnerability and Risk Assessment Framework and Indicators40
4. Indicators for adaptive capacity
System/Sub-systemElements of Adaptive capacity
Unit Data source
- Urban population
Human Development Index
IndexCBS, NPC
Human Poverty Index IndexGender Inequality Index IndexUrban employment rate % CBS
Urban infrastructure system (coverage of urban services):
- Roads
Population served by roads
Km/pop. DoR
Road network Km/sq.km. DoR
Road connecting adjoining districts
No. of adjoining districts connected with roads
DoR
- Water supply and sanitation
Access to piped drinking water
% HHs DWSS
Alternative sources of drinking water
No. DWSS
Water supply schemes No. DWSSWatersheds supplying water
No./sq.km. DWSS, DSCWM
Access to sanitation % of HHs DWSS
- Solid waste managementAccess to organized solid waste management
% of HHs Municipal office
Capacity of landfill sites No. of years Municipal office
- CommunicationMobile users No.
NTAAccess to internet % of pop.FM/TV coverage Yes/no
Urban settlements:
- Built-up area
Protection of built-up areas from landslides
Ratio of protected built-up area to total landslide risk-sensitive built-up area
Municipal office, DUDBC, map, study reports
Protection of built-up areas from floods
Ratio of protected built-up area to total flood risk-sensitive built-up area
Municipal office, DUDBC, map, study reports
- Open and green spaceOpen area Sq.km. Municipal officeUrban parks and forests Sq.km. Municipal office
Chapter 3
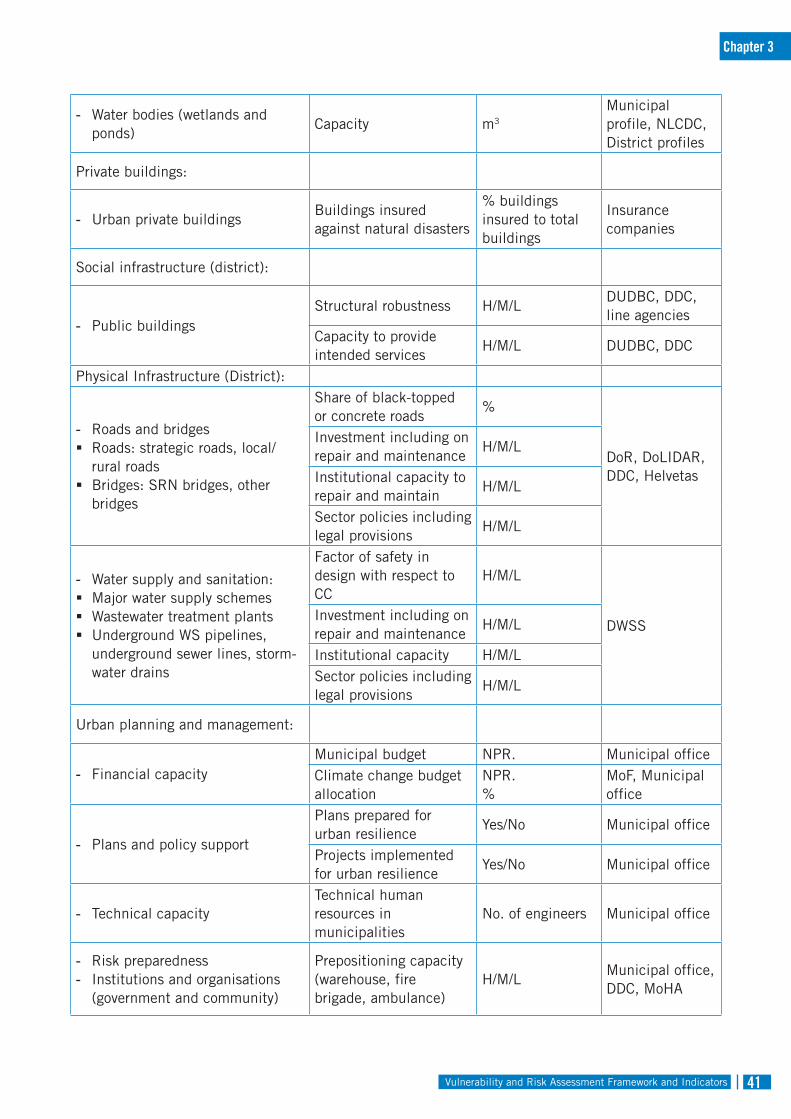
Vulnerability and Risk Assessment Framework and Indicators 41
- Water bodies (wetlands and ponds)
Capacity m3
Municipal profile, NLCDC, District profiles
Private buildings:
- Urban private buildingsBuildings insured against natural disasters
% buildings insured to total buildings
Insurance companies
Social infrastructure (district):
- Public buildingsStructural robustness H/M/L
DUDBC, DDC, line agencies
Capacity to provide intended services
H/M/L DUDBC, DDC
Physical Infrastructure (District):
- Roads and bridgesRoads: strategic roads, local/
rural roadsBridges: SRN bridges, other
bridges
Share of black-topped or concrete roads
%
DoR, DoLIDAR, DDC, Helvetas
Investment including on repair and maintenance
H/M/L
Institutional capacity to repair and maintain
H/M/L
Sector policies including legal provisions
H/M/L
- Water supply and sanitation:Major water supply schemesWastewater treatment plantsUnderground WS pipelines,
underground sewer lines, storm-water drains
Factor of safety in design with respect to CC
H/M/L
DWSSInvestment including on repair and maintenance
H/M/L
Institutional capacity H/M/LSector policies including legal provisions
H/M/L
Urban planning and management:
- Financial capacityMunicipal budget NPR. Municipal officeClimate change budget allocation
NPR.%
MoF, Municipal office
- Plans and policy support
Plans prepared for urban resilience
Yes/No Municipal office
Projects implemented for urban resilience
Yes/No Municipal office
- Technical capacityTechnical human resources in municipalities
No. of engineers Municipal office
- Risk preparedness- Institutions and organisations
(government and community)
Prepositioning capacity (warehouse, fire brigade, ambulance)
H/M/LMunicipal office, DDC, MoHA
Chapter 3
Vulnerability and Risk Assessment Framework and Indicators42
3.9. Vulnerability and Risk Assessment Indicators for Water Resources and Energy
Water resources and energy provide the backbone for Nepal’s social and economic development. These sectors have largely defined economic growth, and they will continue to support the process of economic transformation for decades to come. Nepal has abundant water resources sufficient to support the water and energy demand of the country. However, only a small portion (estimated at 15 billion cubic metres) is utilized for economic and social purposes. The major portion of energy demand and supply is still provided by traditional sources, including fuel wood. Traditional, commercial, and renewable sources of energy provided 55, 42, and 3% respectively of energy consumption in the first eight months of Fiscal Year 2015/16 (MoF 2016).
The resilience of water resources and the energy sector will be key determinants in Nepal’s ability to sustain social and economic development. Destruction of critical infrastructure by floods, including glacial lake outburst floods (GLOFs), and landslides, which are expected to increase in the coming decades,is a threat to the country’s development objectives. The impact of climate change is already evident in the water sector in Nepal. The estimated total direct annual economic cost of water-induced disasters is USD 270 million per year, equivalent to 1.5% of current GDP at 2013 price. However, there is a wide variability over time, and in exceptional years the damage caused by floods can cost as much as 5% of national GDP.
The ability to produce and distribute energy and thus ensure energy security is another key component that may be affected by climate change. Extreme climate events such as heat waves, prolonged periods of drought, and erratic and intense rainfall impact the functioning of
hydro-power production. An analysis of the impact of climate variability on electricity production, and the subsequent impact of planned interruptions, indicates that the economic cost of loss and damage could be equivalent to 0.1% of GDP per year on average, and 0.3% in very dry years (MoSTE 2014).
Climate hazards that may impact the water and energy thematic sector are grouped under three categories: climate extreme events, climate-induced hazards, and sector specific hazards. Climate extreme events include consecutive hot days, dry days, cold days, and wet days; summer maximum and winter minimum temperature; extreme rainfall; and annual maximum and minimum temperature. Climate-induced hazards include landslides, floods (including flash floods), GLOFs and Landslide Dam Outburst Floods (LDOFs), heavy snowfall, and storms. The sector specific hazard is sediment loading.
The exposure elements in the water and energy thematic sector have been grouped into four sub-sectors for the assessment of climate change vulnerability and risk: (1) water systems, (2) hydropower, (3) biomass energy, and (4) energy demand. The main elements exposed to changes in the climatic conditions are snow cover, glaciers, springs, groundwater, rivers, lakes, reservoirs, wetlands, hydropower plants, transmission lines, distribution networks, and the people who depend on different water and energy uses.
Vulnerability in the water and energy sector is measured by looking at the sensitivity of the exposed elements and their adaptive capacity to respond to climate change impacts. The sensitivity indicators relate to the physical, technical, economic, age, and ownership practices of the exposed elements. The indicators for adaptive capacity relate to socio-economic factors, technology, management, institutions, investment, human resources and strategies, and plans and policies.
Chapter 3
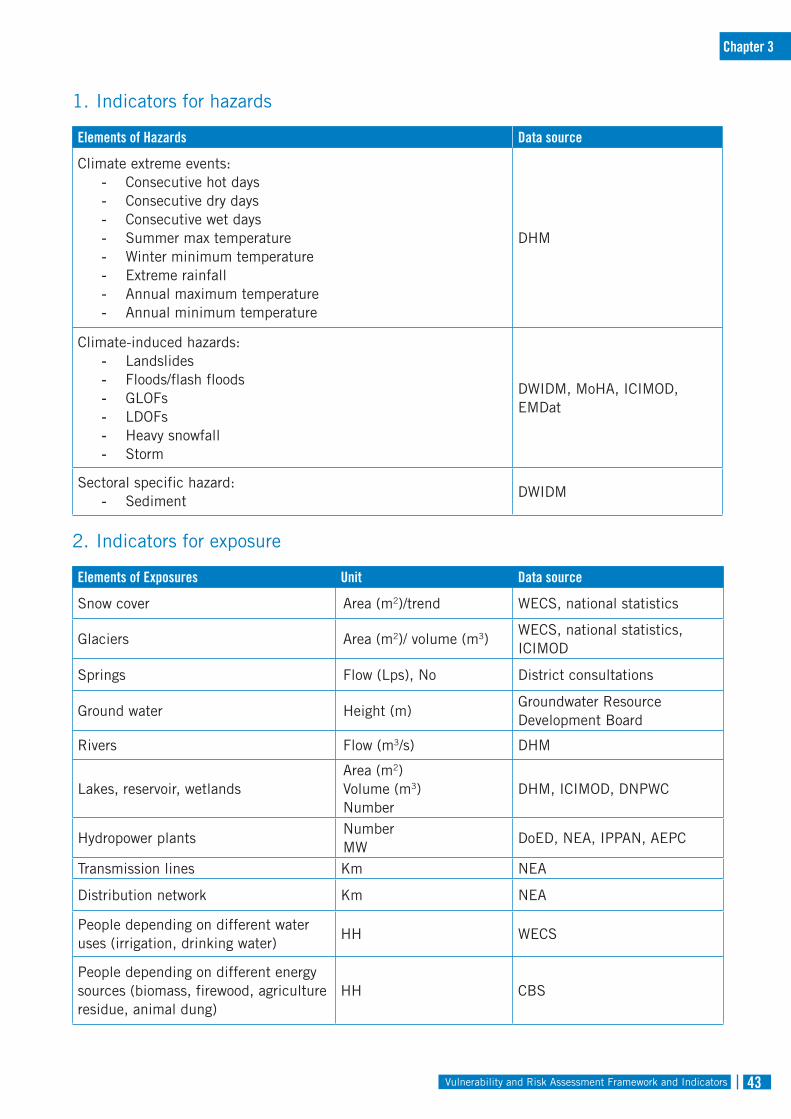
Vulnerability and Risk Assessment Framework and Indicators 43
1. Indicators for hazards
Elements of Hazards Data source
Climate extreme events:- Consecutive hot days- Consecutive dry days- Consecutive wet days- Summer max temperature- Winter minimum temperature- Extreme rainfall- Annual maximum temperature- Annual minimum temperature
DHM
Climate-induced hazards:- Landslides- Floods/flash floods- GLOFs- LDOFs- Heavy snowfall- Storm
DWIDM, MoHA, ICIMOD, EMDat
Sectoral specific hazard:- Sediment
DWIDM
2. Indicators for exposure
Elements of Exposures Unit Data source
Snow cover Area (m2)/trend WECS, national statistics
Glaciers Area (m2)/ volume (m3)WECS, national statistics, ICIMOD
Springs Flow (Lps), No District consultations
Ground water Height (m)Groundwater Resource Development Board
Rivers Flow (m3/s) DHM
Lakes, reservoir, wetlandsArea (m2)Volume (m3)Number
DHM, ICIMOD, DNPWC
Hydropower plantsNumberMW
DoED, NEA, IPPAN, AEPC
Transmission lines Km NEA
Distribution network Km NEA
People depending on different water uses (irrigation, drinking water)
HH WECS
People depending on different energy sources (biomass, firewood, agriculture residue, animal dung)
HH CBS
Chapter 3
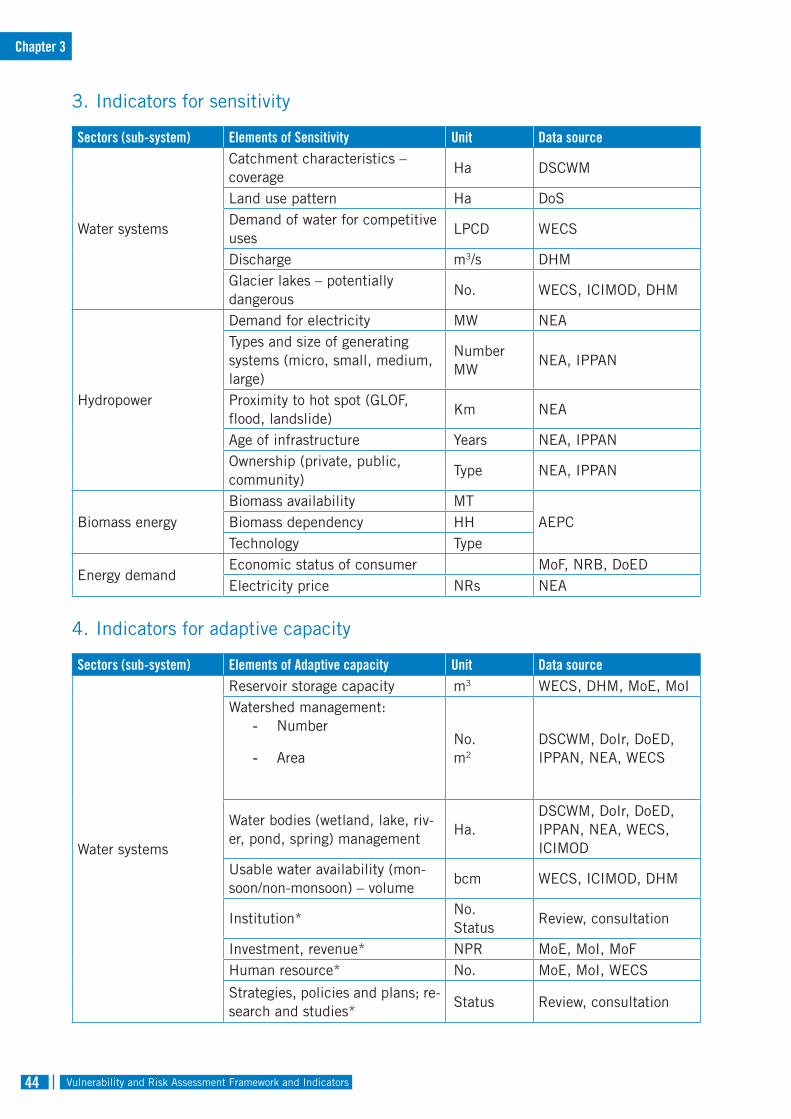
Vulnerability and Risk Assessment Framework and Indicators44
3. Indicators for sensitivity
Sectors (sub-system) Elements of Sensitivity Unit Data source
Water systems
Catchment characteristics – coverage
Ha DSCWM
Land use pattern Ha DoSDemand of water for competitive uses
LPCD WECS
Discharge m3/s DHMGlacier lakes – potentially dangerous
No. WECS, ICIMOD, DHM
Hydropower
Demand for electricity MW NEATypes and size of generating systems (micro, small, medium, large)
NumberMW
NEA, IPPAN
Proximity to hot spot (GLOF, flood, landslide)
Km NEA
Age of infrastructure Years NEA, IPPANOwnership (private, public, community)
Type NEA, IPPAN
Biomass energyBiomass availability MT
AEPCBiomass dependency HHTechnology Type
Energy demandEconomic status of consumer MoF, NRB, DoEDElectricity price NRs NEA
4. Indicators for adaptive capacity
Sectors (sub-system) Elements of Adaptive capacity Unit Data source
Water systems
Reservoir storage capacity m3 WECS, DHM, MoE, MoIWatershed management:
- Number
- AreaNo.m2
DSCWM, DoIr, DoED, IPPAN, NEA, WECS
Water bodies (wetland, lake, riv-er, pond, spring) management
Ha.DSCWM, DoIr, DoED, IPPAN, NEA, WECS, ICIMOD
Usable water availability (mon-soon/non-monsoon) – volume
bcm WECS, ICIMOD, DHM
Institution*No.Status
Review, consultation
Investment, revenue* NPR MoE, MoI, MoFHuman resource* No. MoE, MoI, WECS
Strategies, policies and plans; re-search and studies*
Status Review, consultation
Chapter 3
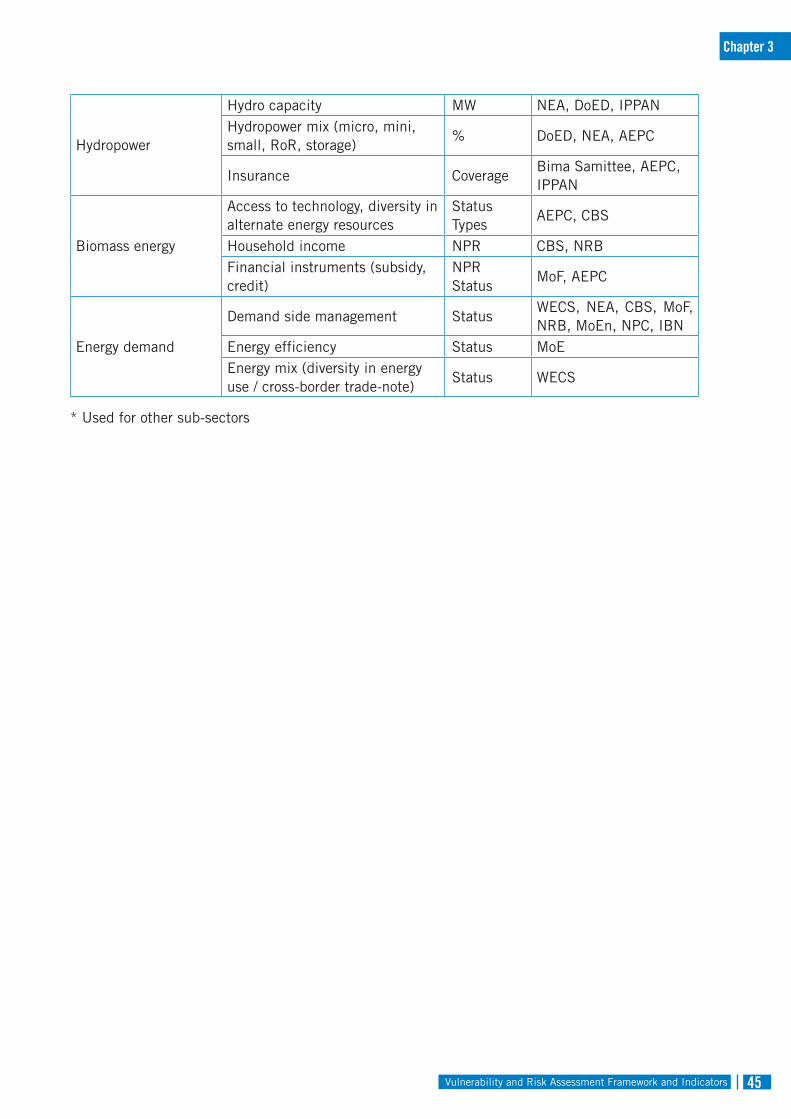
Vulnerability and Risk Assessment Framework and Indicators 45
Hydropower
Hydro capacity MW NEA, DoED, IPPANHydropower mix (micro, mini, small, RoR, storage)
% DoED, NEA, AEPC
Insurance CoverageBima Samittee, AEPC, IPPAN
Biomass energy
Access to technology, diversity in alternate energy resources
StatusTypes
AEPC, CBS
Household income NPR CBS, NRBFinancial instruments (subsidy, credit)
NPRStatus
MoF, AEPC
Energy demand
Demand side management StatusWECS, NEA, CBS, MoF, NRB, MoEn, NPC, IBN
Energy efficiency Status MoEEnergy mix (diversity in energy use / cross-border trade-note)
Status WECS
* Used for other sub-sectors
Chapter 3
Vulnerability and Risk Assessment Framework and Indicators46
The proposed methodology and indicators for vulnerability and risk assessment (VRA) will guide Nepal’s National Adaptation Plan (NAP) process. The methodology and indicators will be further refined and updated based on the consultative process and application during the sectoral assessment and analysis. NAP is a process and learning opportunity for stakeholders and agencies in Nepal, and the methods for VRA will be further customized and aligned with the current capacity of the country to understand and apply them at different levels and in different contexts. The methodological framework and process proposed in this document will not only help in the NAP formulation process, but will also act as a reference document for other countries in the region.
NAP is a country-driven process. The approach for VRA proposed for Nepal’s NAP process uses a complementary approach combining scientific and community-based assessment. There are a number of advantages in using an integrated approach in Nepal, including that it helps fill the gaps in knowledge that exist when a single approach is used. Further, the climate projections and models have marked limitations as a result of the challenges involved in improving the quality of the downscaled climate scenarios, and they do not offer much in terms of understanding local level impact and risk. The bottom-up approach
Chapter 4 The Way Forward
Chapter 2
is thus important for elucidating the real issues that communities are facing and the impact on local resources. Combining the two approaches will make the climate change assessment more rigorous and realistic.
The indicators proposed for Nepal’s NAP formulation process are sector specific and based on past experience, including expert judgment. The indicators mostly represent measurable elements that help in quantifying and qualifying hazards, exposure, sensitivity, and adaptive capacity. Measurement of these indicators appears to be feasible, based on the availability of data. The majority of the indicators can be quantified. However, some indicators still need to be qualified and explained using descriptive information.
The VRA analysis will also depend on the available science, knowledge, and resources within the country. The methods for developing and applying climate change scenarios are the focus of an IPCC task group (the TGCIA), and recommended methods and global scenario data are maintained on the IPCC Data Distribution Centre website. However, due to data and knowledge gaps, it is difficult to rely on global and regional scenarios and models. Thus in addition to scenario analysis, Nepal’s NAP process will use expert judgment and a consultative process to develop a consensus on the criteria and indices for assessing and
Vulnerability and Risk Assessment Framework and Indicators 47
projecting climate risk and impact. The climate data analysis and modelling for Nepal’s NAP will be guided by the sectoral, geographical, administrative, and socio-economic units needed to characterise climate change and thus facilitate different planning approaches.
Nepal has proposed an eight-step methodological process for carrying out the VRA. However, the NAP process is designed to be flexible, with countries able to choose those steps and elements needed to accomplish the planning process. Nepal will follow existing experience at global
and national level when choosing the tools and techniques for VRA. Top-down assessment and bottom-up assessment need different tools and techniques. For example, bottom-up assessment can be carried out through community-based vulnerability analysing tools such as CVCA (climate vulnerability and capacity analysis), participatory vulnerability analysis techniques, and poverty and vulnerability analysis. The tools for top down assessment include climate models and scenarios, hydrological and crop modelling, and risk analysis.
Chapter 4
Vulnerability and Risk Assessment Framework and Indicators48
Badu M. (2013). Assessing the impact of climate change on human health: status and trends of malaria and diarrhea with respect to temperature and rainfall variability in Nepal. Kathmandu University Journal of Science, Engineering and Technology 9(1):96-105.
Bank off, G. (2004). The Historical Geography of Disaster: ‘Vulnerability’ and ‘Local Knowledge’ in Western Discourse. Earthscan, London, UK.
Dhimal M, Bhusal CL. (2009). Impacts of climate change on human health and adaptation strategies for Nepal. Journal of Nepal Health Research Council 7(15):140-141.
FAO (2009). Asia Forestry Outlook 2020: Country Report Nepal. Food and Agriculture Organisation.
GoN/UNDP. (2014). Nepal Human Development Report: Beyond Geography, Unlocking Human Potential. Government of Nepal/ United Nations Development Programme Available at http://hdr.undp.org/sites/default/files/nepal_nhdr_2014-final.pdf
Gurung, D. D., & Bisht, S. (2014). Women’s empowerment at the frontline of adaptation: emerging issues, adaptive practices, and priorities in Nepal. ICIMOD Working Paper, (2014/3)
IDS-Nepal, PAC and GCAP.(2014). Economic Impact Assessment of Climate Change in Key Sectors in Nepal.IDS-Nepal, Kathmandu, Nepal.
IPCC. (2014a). Climate Change 2014: Impacts, Adaptation, and Vulnerability. Part A: Global and Sectoral Aspects. Contribution of Working Group II to the Fifth Assessment Report of the Intergovernmental Panel on Climate Change [Field, C.B., V.R. Barros, D.J. Dokken, K.J. Mach, M.D. Mastrandrea, T.E. Bilir, M. Chatterjee, K.L. Ebi, Y .O. Estrada, R.C. Genova, B. Girma, E.S. Kissel, A.N. Levy, S. MacCracken, P .R. Mastrandrea, and L.L. White (eds.)]. Cambridge University Press, Cambridge, United Kingdom and New York, N , USA, 1132 pp.
References
Vulnerability and Risk Assessment Framework and Indicators 49
IPCC. (2014b). Annex II: Glossary [Mach, K.J., S. Planton and C. von Stechow (eds.)]. In: Climate Change 2014: Synthesis Report. Contribution of Working Groups I, II and III to the Fifth Assessment Report of the Intergovernmental Panel on Climate Change [Core Writing Team, R.K. Pachauri and L.A. Meyer (eds.)]. IPCC, Geneva, Switzerland, pp. 117-130.
Kelly, P. M. and W.N. Adger. (2000). Theory and practice in assessing vulnerability to climate change and Facilitating adaptation. Climatic change, 47(4), 325-352.
Kreft, S., Eckstein, D., Dorsch, L., and Fisher, L. (2016).Global Climate Risk Index 2016: Who Suffers Most From Extreme Weather Events? Weather-related Loss Events in 2014 and 1995 to 2014. Briefing paper.German watch.
Kurk, E. (2009). Tourism in himalaya-Mountains of Opportunities in a Changing Climate, Position Paper. Kathmamndu: ICIMOD.
Lutz, A. F., Ter Maat, H. W., Biemans, H., Shrestha, A. B., Wester, P., & Immerzeel, W. W. (2016). Selecting representative climate models for climate change impact studies: an advanced envelope based selection approach. International Journal of Climatology.
Ministry of Home Affairs (MoHA) and Nepal Disaster Preparedness Network- Nepal (DPNet).(2010). Nepal Disaster Report 2010.The Hazardscape and Vulnerability. Kathmandu: Ministry of Home Affairs, Government of Nepal and Disaster.
MoAD.(2014). Agriculture Development Strategy.Ministry of Agriculture and Development.Government of Nepal.
MoCTCA. (2014). Tourism Employment Survey. Kathmandu: Government of Nepal, Ministry of Culture, Tourism and Civil Aviation.
MoF.(2016). Economic survey Fiscal year 2015/2016.Ministry of Finance, Government of Nepal.Kathmandu.
MOFSC. (2010). Nepal’s REDD Readiness Proposal 2010 – 2013. Ministry of Forests and Soil Conservation.Government of Nepal.
MoHA and DPNet (2009) Nepal Disaster Report 2009. The Hazardscape and Vulnerability. Kathmandu: Ministry of Home Affairs, Government of Nepal and Disaster Preparedness Network – Nepal.
MoHA.(2009). National strategy for disaster risk management in Nepal. Ministry of Home Affair, Kathmandu.
MoHA.(2010). Nepal Disaster Report. Kathmandu: MoHA and DPNet.
MoHA. (2015). Nepal Disaster Report. Kathmandu: MoHA and DPNet.
Morrow, B.H. (1999). Identifying and mapping community vulnerability. Disasters, 23(1), 1-18.
Vulnerability and Risk Assessment Framework and Indicators50
MoSTE. (2014). Economic Assessment of the Climate Change of the Key Sectors in Nepal, Ministry of Science, Technology and Environment, IDS Nepal, PAC and GCAP.
NDR.(2009). National Disaster Report.Ministry of Home Affairs.Government of Nepal, Kathmandu.
NPC. (2016). Fourteenth Plan (Fiscal Year 2073/74-2075/76) Approach Paper (in Nepali). Kathmandu, Nepal National Planning Commission, Government of Nepal.
O’Brien, K, R. Leichenko, U. Kelkar, H. Venema, G. Aandahl, H. Tompkins, A. Javed, S. Bhadwal, S. Barg, L. Nygaard and J. West. (2004). Mapping vulnerability to multiple stressors: climate change and globalization in India. Global Environmental Change, 14, 303-313.
Patz J, Engelberg D, Last J. (2000).The effects of changing weather on public health. Annual Review of Public Health 21:271-307. doi:10.1146/annurev.pubhealth.21.1.271
Ramachandran N. (2014). Persisting under nutrition in India: causes, consequences and possible solutions.Springer India.doi: 10.1007/978-81-322-1832-6_9
Regmi, B. R., Star, C., Pradhan, B., & Pandit, A. (2016).Climate Change and Human Health Impact and Adaptation Responses in Nepal. In Climate Change and Human Health Scenario in South and Southeast Asia (pp. 131-152). Springer International Publishing.
Sharma, P. (2012). Tourism in Nepal 2030. In B. R. Sagar Raj Sharma (Ed.), Nepal 2030: A Vision for Peaceful and Prosperous Nation (p. 100). Kathmandu: South Asia Regional Coordination Office of the Swiss National Centre of Competence in Research (NCCR North-South).
Sharma, U. and A. Patwardhan. (2008). An empirical approach to assessing generic adaptive capacity to tropical cyclone risk in coastal districts of India. Mitigation and Adaptation Strategies to Global Change, 13, 819-831.
Subedi, B. P. (2014). Urbanisation in Nepal: Spatial Pattern, Social Demography and Development. In Population Monograph of Nepal Volume III (Economic Geography) (pp. 95-154). Kathmandu, Nepal: Central Bureau of Statistics.
UNDP. (2014). Human Development Report, Sustaining Human Progress: Reducing Vulnerabilities and Building Resilience. United Nations Development Programme. Available at http://www.undp.org/content/dam/undp/library/corporate/HDR/2014HDR/HDR-2014-English.pdf
Van Aalst, M. K., T. Cannon and I. Burton. (2008). Community level adaptation to climate change: the potential role of participatory community risk assessment. Global environmental change, 18 (1), 165-179.
Watts, M.J. and H.G. Bohle. (1993). The space of vulnerability: the causal structure of hunger and famine. Progress in Human Geography, 17(1), 43-67.

Vulnerability and Risk Assessment Framework and Indicators 51

Vulnerability and Risk Assessment Framework and Indicators52
Top Related
Copyright © 2022 FDOKUMEN

