


Bahasa
Halaman
Hukum


Variation in HLA Class I Antigen-Processing Genesand Susceptibility to Human PapillomavirusType 16–Associated Cervical Cancer
Alina Deshpande,1 Cosette M. Wheeler,3,4 William C. Hunt,3 Cheri L. Peyton,3 P. Scott White,2 Yolanda E. Valdez,2
and John P. Nolan2,5
1Decision Applications Division and 2Bioscience Division, Los Alamos National Laboratory, Los Alamos, and Departments of 3Molecular Geneticsand Microbiology and 3Obstetrics and Gynecology, University of New Mexico Health Sciences Center, Albuquerque, New Mexico; 5La JollaBioengineering Institute, La Jolla, California
Background. Persistent infection with human papillomavirus type 16 (HPV16) is a primary etiological factor forthe development of cervical cancer. Genes involved in antigen processing influence both the repertoire of antigenspresented by HPV16-infected cells and the nature of HPV16-specific immune responses. Genetic variation in thesegenes may affect protein structure and function and, consequently, the ability of an individual to clear HPV infection.
Methods. Thirty-five single-nucleotide polymorphisms (SNPs) in 5 genes (LMP2, TAP1, LMP7, TAP2, and Ta-pasin) were investigated for association with susceptibility to HPV16-associated cervical cancer. Sequencing of thesegenes resulted in the discovery of 15 previously unreported SNPs. Microsphere-array flow cytometry– based geno-typing was conducted on 787 samples from Hispanic and non-Hispanic white women (241 randomly selected controlsubjects, 205 HPV16-positive control subjects, and 341 HPV16-positive case subjects with cervical cancer).
Results. For 9 SNPs, 8 of which had not previously been reported in the context of cervical cancer, there werestatistically significant differences between the genotype distribution in case subjects and that in control subjects.Haplotype analysis of 3 haplotype blocks revealed 3 haplotypes with significant differences in frequency in case-control comparisons. Both HPV16-specific and non–type-specific differences in genotype distribution were seen.
Conclusions. Genes involved in antigen processing for HLA class I presentation may contribute to susceptibilityto cervical cancer.
The primary risk factor for development of cervical can-
cer is persistent infection with specific types of human
papillomavirus (HPV) [1, 2], and almost 100% of all in
situ and invasive cervical carcinoma contain “high-risk”
HPV genomes [3]. An effective host immune response
to HPV infection—that is, one that prevents persistence
of the virus—is presumably an important determinant
of disease outcome.
Many genes of the major histocompatibility complex
(MHC) are involved in immune response. The present
study focused on genes involved in antigen processing
(AP) and loading for HLA class I molecules [4 –9]—
namely, LMP2, TAP1, LMP7, TAP2, and Tapasin. Cyto-
toxic T cell response has been shown to be directed
against HPV-infected cells that present internally pro-
cessed E6, E7, and L1 epitopes on class I molecules [10].
Susceptibility to cervical cancer has a genetic compo-
nent, and associations with HLA alleles have been re-
ported [11–14]. There is evidence that single-nucleotide
polymorphisms (SNPs) in HLA class I AP genes play a
role in susceptibility to diseases involving cell-mediated
immunity and autoimmune disease [15–20]. More re-
cently, TAP1 and TAP2 gene polymorphisms have been
associated with susceptibility to cervical cancer [21].
The present study was undertaken to examine the role
that AP SNPs play in susceptibility to HPV16-associated
cervical cancer. Genotyping was performed on DNA
samples from HPV16-positive case subjects with inva-
Received 29 March 2007; accepted 5 July 2007; electronically published 23January 2008.
Potential conflicts of interest: none reported.Presented in part: XXII Congress of the International Society for Analytical
Cytology, Montpelier, France, 22–27 May 2004 (oral presentation).Financial support: National Institutes of Health (grants RR01315, RR14101, and
EB03824 to J.P.N., grant AI/CA32917 C.M.W., and grant AI07538 to A.D.).Reprints or correspondence: Dr. Cosette M. Wheeler, 1816 Sigma Chi Rd., Bldg. 191,
University of New Mexico, Albuquerque, NM 87131 ([email protected]).
The Journal of Infectious Diseases 2008; 197:371– 81© 2008 by the Infectious Diseases Society of America. All rights reserved.0022-1899/2008/19703-0008$15.00DOI: 10.1086/524300
M A J O R A R T I C L E
AP Genes and Cervical Cancer ● JID 2008:197 (1 February) ● 371
by guest on May 10, 2011
jid.oxfordjournals.orgD
ownloaded from

sive cervical cancer and from control subjects with no past or
current history of cervical disease. Case-control comparisons of
genotype frequencies were performed at the individual-SNP
level and in the context of haplotypes. Separate comparisons
were made for Hispanics and non-Hispanic whites (NHWs).
The results suggest that AP genes for HLA class I should also be
considered in the assessment of genetic susceptibility to cervical
cancer.
SUBJECTS, MATERIALS, AND METHODS
Subjects. In the present study, 1 set of case subjects and 2 sets
of control subjects were randomly selected from the larger case-
control study. The case subjects consisted of 341 (141 Hispanic
and 200 NHW) women with HPV16-positive invasive cervical
cancer. One control subgroup, comprising 241 women (119
Hispanic and 122 NHW), was randomly selected from the entire
group of control subjects. This subgroup was selected to repre-
sent the population from which the cancer cases were derived
and included individuals who, irrespective of HPV status, were
disease free at the time of enrollment. A second control sub-
group, comprising 205 women (122 Hispanic and 83 NHW) and
excluding those selected for the first control subgroup, was ran-
domly selected from the subset of control subjects who were
both positive for HPV16 and disease free at the time of enroll-
ment. Of the case subjects selected for the current study, 41.1%
were 18 – 40 years old and 58.1% were �40 years old; all control
subjects were 18 – 40 years old. The mean and median ages of the
randomly selected control subgroup were 27.8 and 27 years, re-
spectively; those of the HPV16-positive control subgroup were
25.4 and 24 years, respectively. The control subjects completed
informed-consent forms before being enrolled in the study; data
on the case subjects were obtained without identifiers. The In-
stitutional Review Boards at Los Alamos National Laboratory and
the University of New Mexico approved the research protocols.
Materials. Oligonucleotides for polymerase chain reaction
(PCR) amplification, sequencing, and genotyping were synthesized
by Biosource International. Deoxynucleotide triphosphates were
purchased from Promega, dideoxynucleotide triphosphates from
MBI Fermentas, and biotinylated dideoxynucleotide triphosphates
from Perkin Elmer Life Sciences. Reagents for sequencing included
Big-Dye terminator mix (version 2; Applied Biosystems), Half
Term (Genetix), and dimethyl sulfoxide (Sigma Chemicals).
Enzymes for PCR amplification, sequencing, and genotyping were
shrimp alkaline phosphatase (SAP) (USB), exonuclease I (ExoI)
(USB), Amplitaq Gold (Roche Molecular Systems), and Thermo-
sequenase (Amersham Biosciences). Streptavidin-conjugated
phycoerythrin was purchased from Molecular Probes. Car-
boxylated microspheres were purchased from Luminex,
2-[N-morpholino]ethanesulfonic acid from Sigma Chemi-
cals, 1-Ethyl-3-(3dimethylaminopropyl)carbodiimide-HCl from
Pierce Chemical, and N-hydroxysuccinimide from Aldrich.
Software. PCR and sequencing primers were designed by use
of Oligo (version 6.4; Molecular Biology Insights). Genotyping
primers were designed by use of Oligo (version 6.4) and single-base
extension primer [22]. Sequence analysis of the AP genes was con-
ducted by use of Phred (version 0.990722; CodonCode) [23, 24],
Phrap (version 0.990319; CodonCode), and Polyphred (version 3.5
beta; CodonCode) [25]. Polyphred-flagged SNPs were visually con-
firmed by use of Consed (version 8.0; CodonCode).
DNA samples. DNA samples were obtained from women
who participated in a larger case-control study for characteriza-
tion of the risk of cervical cancer associated with specific host
and HPV genetic factors. That larger study included 812 women
(either Hispanic or NHW ethnicity) diagnosed with invasive
cervical cancer between 1980 and 2000 and 3928 Hispanic and
NHW control subjects. Cases of cervical cancer were identified
by use of the New Mexico Tumor Registry. The control subjects
were recruited from women with no past or current history of
cervical disease who, for routine gynecologic care, were visiting
the University of New Mexico Family and Women’s Health clin-
ics and the Lovelace Women’s Health Services clinic.
DNA samples from cases of cervical cancer were extracted
from paraffin-embedded tumor-biopsy samples [26] collected
from pathology departments throughout the state of New Mex-
ico. DNA samples from the control subjects were collected, via
cervical swab, at the time of enrollment in the initial case-control
study. HPV status of case samples and control samples was de-
termined by use of PCR amplification and line-blot hybridiza-
tion using HPV type–specific oligonucleotide probes [27, 28].
The overall prevalence of HPV in the randomly selected control
subgroup was 37% in the Hispanic women and 36.1% in the
NHW women; the prevalence of HPV16 was 14.3% in the His-
panic women and 9% in the NHW women.
Amplification of selected regions of the AP genes. Regions
of the AP genes that included known SNPs were amplified in 15
segments (table 1). PCR amplification of 15 targets was per-
formed separately in 10-�L reactions, as described elsewhere
[29]. Amplification of targets was optimized to enable the spe-
cific amplification, from �100 copies, of each DNA target, to
ensure successful amplification for all cases. The amplicons were
further processed by use of SAP and ExoI [29] and were either
sequenced or minisequenced.
Sequencing for SNP discovery. To confirm known SNPs
and discover unreported ones, 15 PCR-amplified targets of the
AP genes were sequenced from 376 DNA samples (100 from the
randomly selected control subjects and 100 from the randomly
selected case patients, equally distributed between the 2 ethnic
groups, and 176 DNA samples from the National Institutes of
Health–Polymorphism Discovery Resource [NIH-PDR] Coriell
Cell Repository [http://locus.umdnj.edu/nigms/comm/order/
catprice.html]). Each target was sequenced by use of a forward
372 ● JID 2008:197 (1 February) ● Deshpande et al.
by guest on May 10, 2011
jid.oxfordjournals.orgD
ownloaded from

and a reverse primer and the standard Big-Dye terminator
method. Sequence data were analyzed by use of the software
described above. A database of AP SNPs was generated after vi-
sual confirmation of the flagged SNPs.
Genotyping. Genotyping was performed by use of flow cy-
tometry– based minisequencing [29, 30]. A multiplexed assay
was developed to genotype 45 AP SNPs; 5 of these SNPs gave
poor signals and were not included in further analyses. Absence
Table 1. Description of the 40 HLA class I antigen-processing– gene single-nucleotide polymorphisms (SNPs) used in the presentstudy.
SNP
HGVBaseidentification
number Alleles Gene
Nucleotide location inGenBank reference
sequenceIntron/exon
locationAmpliconsize, bp
CodonAmino-acid
changeLocation Change
LMP2-01 G/A LMP2 21346 Exon 3 249 60 CGC-CAC Arg-HisLMP7-01 G/A LMP7 34685 Exon 1b 207 8 GGA-AGA Gly-ArgLMP7-02 T/C LMP7 34792 Exon 1b 207 43 GCT-GCC Ala-AlaLMP7-03 C/A LMP7 34808 Exon 1b 207 49 CAG-AAG Gln-LysLMP7-04 SNP002901692 G/A LMP7 34845 Intron 1b 207TAP1-01 A/G TAP1 27663 Exon 4 242 333 ATC-GTC Ile-ValTAP1-02 C/T TAP1 28201 Exon 5 292 405 GCT-GTT Ala-ValTAP1-03 G/T TAP1 29665 Exon 6 563 458 GTG-TTG Val-LeuTAP1-04 G/T TAP1 29737 Intron 6 563TAP1-05 SNP002901693 C/A TAP1 29774 Intron 6 563TAP1-06 G/A TAP1 29994 Exon 7 563 518 GTC-ATC Val-IleTAP1-07 A/G TAP1 31462 Exon 10 205 637 GAC-GGC Asp-GlyTAP1-08 G/A TAP1 31495 Exon 10 205 648 CGA-CAA Arg-GlnTAP1-09 G/A TAP1 31535 Exon 10 205 661 CCG-CCA Pro-ProTAP1-10 SNP002901694 G/A TAP1 31615 Intron 10 205TAP1-11 SNP002901695 C/A TAP1 31617 Intron 10 205TAP2-01 T/C TAP2 40916 Exon 1 161 163 GTT-GTC Val-ValTAP2-02 G/T TAP2 46214 Exon 6 121 386 GGG-GGT Gly-GlyTAP2-03 SNP002901696 C/T TAP2 47830 Intron 6 121TAP2-04 SNP002901697 A/G TAP2 47840 Intron 6 121TAP2-05 C/T TAP2 47890 Exon 7 317 436 AAC-AAT Asn-AsnTAP2-06 SNP002901698 T/G TAP2 48088 Intron 7 317TAP2-07a T/C TAP2 48562 Intron 8 263TAP2-08 G/A TAP2 48629 Exon 9 263 565 GCT-ACT Ala-ThrTAP2-09 A/G TAP2 48665 Exon 9 263 577 ATG-GTG Met-VaTAP2-10 SNP002901699 A/G TAP2 48691 Exon 9 263 585 GCA-GCG Ala-AlaTAP2-11b SNP002901700 T/C TAP2 48737 Intron 9 263TAP2-12 T/C TAP2 48754 Intron 9 263TAP2-13 A/G TAP2 49141 Exon 10 172 604 GGA-GGG Gly-GlyTAP2-14 A/G TAP2 49687 Exon 11 195 665 ACA-GCA Thr-AlaTapasin-01 SNP002901701 G/T Tapasin 7353 Exon 2 465 58 CCG-CCT Pro-ProTapasin-02 SNP002901702 G/T Tapasin 7354 Exon 2 465 59 GAC-TAC Asp-TyrTapasin-03 SNP002901703 G/A Tapasin 7457 Intron 2 465Tapasin-04 SNP002901704 G/A Tapasin 7566 Intron 2 465Tapasin-05 C/T Tapasin 15707 Exon 4 371 161 GTC-GTT Val-ValTapasin-06 G/C Tapasin 16003 Exon 4 371 260 AGA-ACA Arg-ThrTapasin-07 G/C Tapasin 16019 Exon 4 371 265 CAG-CAC Gln-HisTapasin-08 G/A Tapasin 16887 Exon 6 200 412 GAC-AAC Asp-AsnTapasin-09 SNP002901705 C/T Tapasin 16892 Exon 6 200 413 AGC-AGT Ser-SerTapasin-10 SNP002901706 C/T Tapasin 16905 Exon 6 200 423 CTG-TTG Leu-Leu
NOTE. Description of the 40 SNPs that were considered in this study. Previously unreported SNPs were submitted to HGVBase and are indicated by anHGVBase identification number. The GenBank reference sequence for LMP2, LMP7, TAP1, and TAP2 is X66401.1, GI 34634. The reference sequence for LMP2is the complement of the coding sequence, and therefore the nucleotide position for the SNP in this gene is for its complement. The GenBank reference sequencefor Tapasin is Z97184.1, GI 2648017. HGVBase, Human Genome Variation Database.
a Located 8 bases from the acceptor junction in Intron 8 of TAP2.b Located within 4 bases of the donor junction of intron 9 of TAP2.
AP Genes and Cervical Cancer ● JID 2008:197 (1 February) ● 373
by guest on May 10, 2011
jid.oxfordjournals.orgD
ownloaded from
of allelic bias in the amplification of the targets was confirmed by
using the assays on targets amplified from artificially constructed
heterozygotes for selected SNPs being genotyped.
High-throughput PCR, pooling of PCR products, and SAP/
ExoI processing were performed in 96-well plates (Marsh Bio-
products), and sequencing or minisequencing was performed in
384-well plates. HYDRA-96 (Robbins Scientific) was used for
reagent transfer.
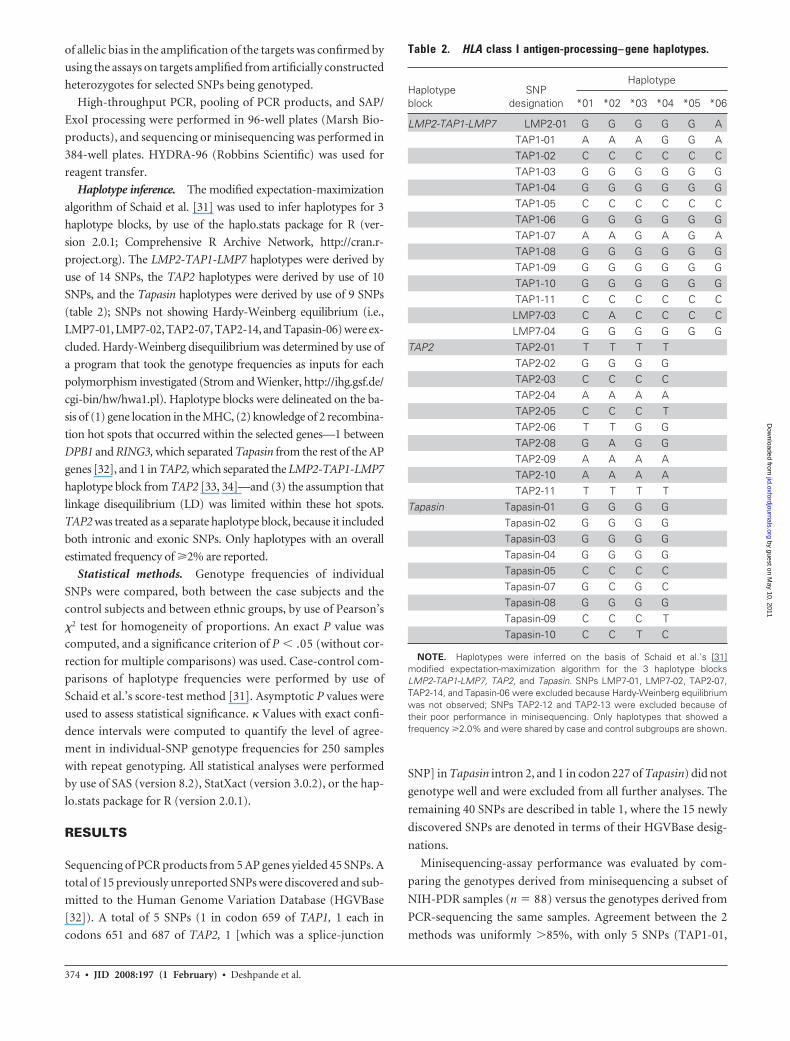
Haplotype inference. The modified expectation-maximization
algorithm of Schaid et al. [31] was used to infer haplotypes for 3
haplotype blocks, by use of the haplo.stats package for R (ver-
sion 2.0.1; Comprehensive R Archive Network, http://cran.r-
project.org). The LMP2-TAP1-LMP7 haplotypes were derived by
use of 14 SNPs, the TAP2 haplotypes were derived by use of 10
SNPs, and the Tapasin haplotypes were derived by use of 9 SNPs
(table 2); SNPs not showing Hardy-Weinberg equilibrium (i.e.,
LMP7-01, LMP7-02, TAP2-07, TAP2-14, and Tapasin-06) were ex-
cluded. Hardy-Weinberg disequilibrium was determined by use of
a program that took the genotype frequencies as inputs for each
polymorphism investigated (Strom and Wienker, http://ihg.gsf.de/
cgi-bin/hw/hwa1.pl). Haplotype blocks were delineated on the ba-
sis of (1) gene location in the MHC, (2) knowledge of 2 recombina-
tion hot spots that occurred within the selected genes—1 between
DPB1 and RING3, which separated Tapasin from the rest of the AP
genes [32], and 1 in TAP2, which separated the LMP2-TAP1-LMP7
haplotype block from TAP2 [33, 34]—and (3) the assumption that
linkage disequilibrium (LD) was limited within these hot spots.
TAP2 was treated as a separate haplotype block, because it included
both intronic and exonic SNPs. Only haplotypes with an overall
estimated frequency of �2% are reported.
Statistical methods. Genotype frequencies of individual
SNPs were compared, both between the case subjects and the
control subjects and between ethnic groups, by use of Pearson’s
�2 test for homogeneity of proportions. An exact P value was
computed, and a significance criterion of P � .05 (without cor-
rection for multiple comparisons) was used. Case-control com-
parisons of haplotype frequencies were performed by use of
Schaid et al.’s score-test method [31]. Asymptotic P values were
used to assess statistical significance. � Values with exact confi-
dence intervals were computed to quantify the level of agree-
ment in individual-SNP genotype frequencies for 250 samples
with repeat genotyping. All statistical analyses were performed
by use of SAS (version 8.2), StatXact (version 3.0.2), or the hap-
lo.stats package for R (version 2.0.1).
RESULTS
Sequencing of PCR products from 5 AP genes yielded 45 SNPs. A
total of 15 previously unreported SNPs were discovered and sub-
mitted to the Human Genome Variation Database (HGVBase
[32]). A total of 5 SNPs (1 in codon 659 of TAP1, 1 each in
codons 651 and 687 of TAP2, 1 [which was a splice-junction
SNP] in Tapasin intron 2, and 1 in codon 227 of Tapasin) did not
genotype well and were excluded from all further analyses. The
remaining 40 SNPs are described in table 1, where the 15 newly
discovered SNPs are denoted in terms of their HGVBase desig-
nations.
Minisequencing-assay performance was evaluated by com-
paring the genotypes derived from minisequencing a subset of
NIH-PDR samples (n � 88) versus the genotypes derived from
PCR-sequencing the same samples. Agreement between the 2
methods was uniformly �85%, with only 5 SNPs (TAP1-01,
Table 2. HLA class I antigen-processing– gene haplotypes.
Haplotypeblock
SNPdesignation
Haplotype
*01 *02 *03 *04 *05 *06
LMP2-TAP1-LMP7 LMP2-01 G G G G G ATAP1-01 A A A G G ATAP1-02 C C C C C CTAP1-03 G G G G G GTAP1-04 G G G G G GTAP1-05 C C C C C CTAP1-06 G G G G G GTAP1-07 A A G A G ATAP1-08 G G G G G GTAP1-09 G G G G G GTAP1-10 G G G G G GTAP1-11 C C C C C CLMP7-03 C A C C C CLMP7-04 G G G G G G
TAP2 TAP2-01 T T T TTAP2-02 G G G GTAP2-03 C C C CTAP2-04 A A A ATAP2-05 C C C TTAP2-06 T T G GTAP2-08 G A G GTAP2-09 A A A ATAP2-10 A A A ATAP2-11 T T T T
Tapasin Tapasin-01 G G G GTapasin-02 G G G GTapasin-03 G G G GTapasin-04 G G G GTapasin-05 C C C CTapasin-07 G C G CTapasin-08 G G G GTapasin-09 C C C TTapasin-10 C C T C
NOTE. Haplotypes were inferred on the basis of Schaid et al.’s [31]modified expectation-maximization algorithm for the 3 haplotype blocksLMP2-TAP1-LMP7, TAP2, and Tapasin. SNPs LMP7-01, LMP7-02, TAP2-07,TAP2-14, and Tapasin-06 were excluded because Hardy-Weinberg equilibriumwas not observed; SNPs TAP2-12 and TAP2-13 were excluded because oftheir poor performance in minisequencing. Only haplotypes that showed afrequency �2.0% and were shared by case and control subgroups are shown.
374 ● JID 2008:197 (1 February) ● Deshpande et al.
by guest on May 10, 2011
jid.oxfordjournals.orgD
ownloaded from

TAP1-04, TAP1-07, TAP1-08, and TAP2-14) having �95%
agreement.
Reproducibility of the minisequencing assay was evaluated by
genotyping 250 case samples twice, in separate assays and during
separate time periods. The observed genotype agreement be-
tween the 2 assay repetitions was high for most SNPs. The me-
dian agreement was 98%, and only 3 SNPs had �50% agree-
ment. � Values (a measure of agreement adjusted for chance
agreement) were calculated for 24 SNPs with a minor-allele fre-
quency sufficiently large to have �95% expected agreement; the
� value was �0.75 in 29% of the samples, 0.50 – 0.74 in 50% of
the samples, and �0.50 in the remaining 21% of the samples,
and the median � value was 0.66.
Five additional SNPs (TAP2-07, TAP2-12, TAP2-13, TAP2-
14, and Tapasin-06) were excluded from further analyses be-
cause they either showed poor agreement between the results of
PCR-sequencing and the results of minisequencing (�95%)
or demonstrated poor reproducibility for minisequencing
(� � 0.3). The genotype frequencies for the remaining 35 SNPs
are reported for both Hispanic and NHW case subjects and con-
trol subjects, in tables 3 and 4, respectively; for only 2 SNPs,
TAP1-03 and TAP1-04, was the genotype distribution statisti-
cally significantly different between these 2 ethnic groups.
In 9 of the 35 SNPs—namely, TAP1-03, -04, -06, and -07;
TAP2-02, -04, and -09; and Tapasin-02 and -03—the genotype
distribution was statistically significantly different between the
case subjects and one or both of the control subgroups. These 9
SNPs are included in tables 3 and 4 and are summarized in table
5; 6 of them showed significant case-control differences in only
the Hispanic women, 2 in only the NHW women, and only 1
(TAP1-06) in both ethnic groups. Of these 9 SNPs, 3 (TAP2-04,
Tapasin-02, and Tapasin-03) had not previously been reported
and were discovered in the present study. In 6 of the 9 SNPs, the
minor-allele prevalence in the control subjects was greater than
that in the case subjects. For the TAP1 and TAP2 SNPs, signifi-
cant case-control differences were more frequent in compari-
sons between the case subjects and the randomly selected control
subjects than in comparisons between the case subjects and the
HPV16-positive control subjects, even though sample sizes for
these 2 control subgroups were comparable; in contrast, the Ta-
pasin SNPs showed significant differences only between the case
subjects and the HPV16-positive control subjects, and only in
the Hispanic women (table 3).
Genotype distribution of the 35 SNPs was also compared be-
tween the subset of case subjects who were 18 – 40 years old and
the Hispanic and NHW subjects, all of whom, as noted above,
were 18 – 40 years old; in this age-matched comparison, 4 of the
9 SNPs showing significant overall case-control differences in
genotype distribution—namely, TAP1-04, -06, and -07 and
TAP2-09 —retained such differences. In addition, 1 SNP in the
Hispanic women (i.e., TAP1-02) and 4 SNPs in the NHW
women (i.e., LMP7-01 and Tapasin-01, -03, and -09) showed
significant case-control differences (data not shown).
Figure 1. Crystal structure of ATPase-binding domain of TAP1 (prepared by use of Protein Explorer, http://molvis.sdsc.edu/protexpl/frntdoor.htm[©2003, by Eric Martz, Protein DataBank Identity 1jj7]). The arrows denote statistically significant differences in genotype distribution in case-controlcomparisons.
AP Genes and Cervical Cancer ● JID 2008:197 (1 February) ● 375
by guest on May 10, 2011
jid.oxfordjournals.orgD
ownloaded from

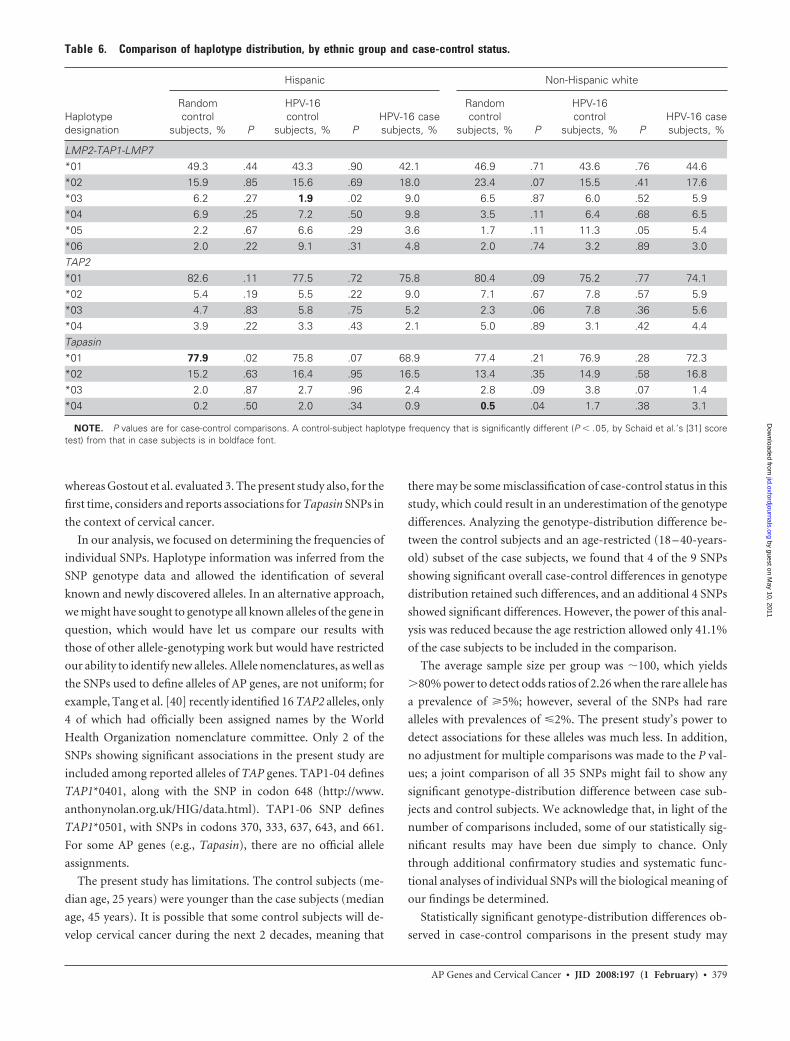
Table 2 lists haplotypes with an observed frequency of �2% in
both the case subjects and the control subjects, and the frequen-
cies of these haplotypes, stratified by ethnic group and case-
control status, are shown in table 6. Haplotypes for the LMP2-
TAP1-LMP7 haplotype block were defined by SNPs LMP2-01,
LMP7-03, TAP1-01, and TAP1-07, of which only TAP1-07
showed statistically significant case-control differences in
individual-SNP analysis. In the NHW women, there was no sig-
nificant case-control difference in haplotype distribution; in the
Hispanic women, however, haplotype *03 showed a significantly
Table 3. Genotype frequency of HLA class I antigen-processing– gene single-nucleotide polymorphisms (SNPs) for the Hispanic ethnicgroup.
SNPdesignation Alleles
Random control subjects HPV-16–positive control subjects HPV-16–positive case subjects
Total,no. 1,1, % 1,2, % 2,2, % P
Total,no. 1,1, % 1,2, % 2,2, % P
Total,no. 1,1, % 1,2, % 2,2, %
LMP201 G/A 105 62.9 32.4 4.7 .42 117 64.1 33.3 2.6 .16 131 67.9 25.2 6.9
LMP701 G/A 108 95.4 3.7 0.9 .70 117 94.0 4.3 1.7 .51 133 92.4 6.8 0.802 T/C 100 81.0 11.0 8.0 .36 110 85.4 8.2 6.4 .77 126 87.3 8.7 4.003 C/A 105 82.9 17.1 0.0 .79 119 79.8 19.3 0.9 .94 134 79.1 20.2 0.704 G/A 106 99.1 0.9 0.0 1.00 119 98.4 0.8 0.8 .74 128 99.2 0.8 0.0
TAP101 A/G 104 71.2 22.1 6.7 .46 114 68.4 24.6 7.0 .68 125 63.2 28.8 8.002 C/T 89 98.9 1.1 0.0 .14 108 94.4 4.6 0.9 .66 125 94.4 5.6 0.003 G/T 85 91.8 8.2 0.0 .01 113 96.5 3.5 0.0 .19 131 99.2 0.8 0.004 G/T 101 91.1 8.9 0.0 .01 121 95.9 4.1 0.0 .26 136 98.5 1.5 0.005 C/A 102 90.2 8.8 1.0 .06 105 93.3 6.7 0.0 .35 122 96.7 3.3 0.006 G/A 105 93.3 6.7 0.0 .03 106 96.2 3.8 0.0 .08 89 93.3 2.2 4.507 A/G 101 64.4 28.7 6.9 .86 109 69.7 27.5 2.8 .48 130 67.6 26.2 6.208 G/A 100 89.0 9.0 2.0 .47 117 88.0 9.4 2.6 .38 127 92.9 4.7 2.409 G/A 105 90.5 9.5 0.0 .25 112 95.5 3.6 0.9 .74 132 93.2 5.3 1.510 G/A 103 100.0 0.0 0.0 1.00 112 100.0 0.0 0.0 1.00 132 100.0 0.0 0.011 C/A 109 92.7 7.3 0.0 .54 116 95.7 4.3 0.0 .46 134 92.5 6.0 1.5
TAP201 T/C 90 98.9 1.1 0.0 .65 115 96.5 3.5 0.0 1.00 139 97.1 2.9 0.002 G/T 109 97.2 2.8 0.0 .05 117 98.3 1.7 0.0 .18 129 98.5 0.0 1.503 C/T 108 99.1 0.9 0.0 .41 114 98.3 1.7 0.0 .32 131 96.9 0.8 2.304 A/G 106 100.0 0.0 0.0 1.00 111 95.5 3.6 0.9 .02 125 100.0 0.0 0.005 C/T 109 89.9 10.1 0.0 .28 117 89.7 10.3 0.0 .25 136 93.4 5.9 0.706 T/G 108 82.4 16.7 0.9 .45 117 81.2 17.9 0.9 .29 136 86.0 11.8 2.208 G/A 109 87.2 12.8 0.0 .07 118 87.2 11.9 0.9 .21 129 84.5 10.9 4.609 A/G 111 100.0 0.0 0.0 .25 120 99.2 0.8 0.0 .62 132 97.7 2.3 0.010 A/G 106 98.1 1.9 0.0 .20 117 98.3 1.7 0.0 .23 129 100.0 0.0 0.011 T/C 111 100.0 0.0 0.0 1.00 120 100.0 0.0 0.0 1.00 137 100.0 0.0 0.0
Tapasin01 G/T 101 99.0 1.0 0.0 1.00 115 98.3 1.7 0.0 1.00 109 99.1 0.9 0.002 G/T 104 100.0 0.0 0.0 .06 112 100.0 0.0 0.0 .01 109 94.4 2.8 2.803 G/A 102 98.0 2.0 0.0 .10 105 99.1 0.9 0.0 .04 126 92.1 6.4 1.504 G/A 103 99.0 1.0 0.0 1.00 111 98.2 0.9 0.9 .78 131 98.5 1.5 0.005 C/T 102 100.0 0.0 0.0 1.00 115 99.1 0.9 0.0 .71 134 99.2 0.0 0.807 G/C 105 65.7 33.3 1.0 .65 109 61.5 38.5 0.0 .59 131 60.3 38.2 1.508 G/A 107 98.1 1.9 0.0 .59 117 100.0 0.0 0.0 1.00 131 99.2 0.8 0.009 C/T 105 97.1 1.9 1.0 .61 120 95.8 3.3 0.8 .90 136 94.1 4.4 1.510 C/T 111 95.5 3.6 0.9 .24 121 94.2 5.8 0.0 .34 131 90.0 9.2 0.8
NOTE. Column labels “1,1,” “1,2,” and “2,2” denote the homozygous dominant, heterozygous, and homozygous recessive genotypes, respectively. P valuesare for Pearson’s �2 test of case-control differences in genotype frequency and were computed by use of exact methods; significant differences are in boldfacefont. Four SNPs in the TAP2 gene—namely, TAP2-07, TAP2-12, TAP2-13 and TAP2-14—were excluded because of either poor (i.e., �95%) agreement betweenpolymerase chain reaction–based sequencing and minisequencing or poor reproducibility for minisequencing (i.e., � � 0.3).
376 ● JID 2008:197 (1 February) ● Deshpande et al.
by guest on May 10, 2011
jid.oxfordjournals.orgD
ownloaded from

lower frequency in the HPV16-positive control subjects than in
the case subjects. This haplotype is defined by the rare allele of
SNP TAP1-07 (codon 637), which, in individual-SNP analysis of
the NHW women, was associated with susceptibility to cervical
cancer.
Haplotypes for the TAP2 block were defined by SNPs TAP2-
05, TAP2-06, and TAP2-08, none of which showed statistically
significant case-control differences in individual-SNP analysis.
There were no significant case-control differences for this hap-
lotype block.
Table 4. Genotype frequency of HLA class I antigen-processing– gene single-nucleotide polymorphisms (SNPs) for the non-Hispanicwhite ethnic group.
SNPdesignation Alleles
Random control subjects HPV-16–positive control subjects HPV-16–positive case subjects
Total,no. 1,1, % 1,2, % 2,2, % P
Total,no. 1,1, % 1,2, % 2,2, % P
Total,no. 1,1, % 1,2, % 2,2, %
LMP201 G/A 114 50.9 42.9 6.2 .09 81 58.0 40.7 1.2 .07 186 62.9 30.7 6.4
LMP701 G/A 116 92.3 6.0 1.7 .20 79 92.4 7.6 0.0 1.00 187 93.1 6.9 0.002 T/C 112 89.3 8.0 2.7 .65 73 87.6 5.5 6.9 .29 186 91.9 5.4 2.703 C/A 114 91.2 8.8 0.0 .07 83 78.3 21.7 0.0 .58 196 82.7 16.8 0.504 G/A 114 98.2 1.8 0.0 1.00 83 100.0 0.0 0.0 .57 189 98.9 1.1 0.0
TAP101 A/G 113 71.6 25.7 2.7 .79 82 70.7 24.4 4.9 .51 178 75.3 22.4 2.302 C/T 96 92.7 5.2 2.1 .75 82 97.6 2.4 0.0 .47 187 94.6 4.3 1.103 G/T 94 96.8 1.1 2.1 .16 81 96.3 2.5 1.2 .30 191 98.4 1.6 0.004 G/T 109 98.2 1.8 0.0 1.00 93 95.2 4.8 0.0 .25 193 97.9 2.1 0.005 C/A 104 95.2 3.9 0.9 .22 77 94.8 5.2 0.0 .20 180 98.3 1.7 0.006 G/A 105 97.1 2.9 0.0 .01 76 97.4 2.6 0.0 .04 164 89.0 3.7 7.307 A/G 113 69.0 26.6 4.4 .02 76 56.6 34.2 9.2 .02 191 68.6 18.3 13.108 G/A 114 88.6 10.5 0.9 .27 79 89.9 10.1 0.0 .22 181 92.3 5.5 2.209 G/A 114 93.0 7.0 0.0 .36 77 92.2 6.5 1.3 1.00 186 91.4 6.5 2.110 G/A 114 100.0 0.0 0.0 1.00 79 100.0 0.0 0.0 1.00 181 100.0 0.0 0.011 C/A 117 95.7 4.3 0.0 1.00 82 93.9 3.7 2.4 .11 191 95.3 4.7 0.0
TAP201 T/C 95 97.9 2.1 0.0 1.00 78 94.9 5.1 0.0 .23 195 97.9 2.1 0.002 G/T 113 97.3 2.7 0.0 .22 78 96.1 3.9 0.0 .14 177 98.3 0.6 1.103 C/T 113 98.2 1.8 0.0 .21 82 97.6 2.4 0.0 .42 184 94.6 2.7 2.704 A/G 113 99.1 0.9 0.0 1.00 80 98.7 1.3 0.0 1.00 177 99.4 0.6 0.005 C/T 114 86.8 13.2 0.0 .28 81 91.4 8.6 0.0 .57 188 88.8 9.6 1.606 T/G 118 82.2 17.8 0.0 .21 83 75.9 24.1 0.0 .23 188 78.2 19.2 2.608 G/A 115 86.1 13.0 0.9 .94 83 86.8 9.6 3.6 .38 186 87.1 11.8 1.109 A/G 120 100.0 0.0 0.0 .04 83 95.2 4.8 0.0 .60 187 95.2 3.2 1.610 A/G 114 98.2 1.8 0.0 .56 83 98.8 1.2 0.0 1.00 189 99.5 0.5 0.011 T/C 119 100.0 0.0 0.0 1.00 83 98.8 1.2 0.0 1.00 192 99.5 0.5 0.0
Tapasin01 G/T 107 99.1 0.9 0.0 .20 76 100.0 0.0 0.0 .26 183 96.2 1.1 2.702 G/T 109 99.1 0.9 0.0 .78 77 100.0 0.0 0.0 .71 184 98.4 0.5 1.103 G/A 111 97.3 2.7 0.0 .18 71 100.0 0.0 0.0 .29 148 95.9 1.4 2.704 G/A 109 98.2 0.9 0.9 .74 76 97.4 2.6 0.0 .59 166 98.8 1.2 0.005 C/T 111 99.1 0.9 0.0 .78 78 98.7 1.3 0.0 .82 188 98.4 0.5 1.107 G/C 115 66.1 32.2 1.7 .35 78 66.7 32.1 1.2 .41 157 62.5 32.5 5.008 G/A 114 99.1 0.9 0.0 .39 82 98.8 1.2 0.0 .31 182 100.0 0.0 0.009 C/T 112 95.5 3.6 0.9 .10 83 95.2 4.8 0.0 .11 177 88.7 6.8 4.510 C/T 117 92.3 7.7 0.0 .23 82 92.7 7.3 0.0 .56 184 95.7 3.8 0.5
NOTE. Column labels “1,1,” “1,2,” and “2,2” denote the homozygous dominant, heterozygous, and homozygous recessive genotypes, respectively. P valuesare for Pearson’s �2 test of case-control differences in genotype frequency and were computed by use of exact methods; significant differences are in boldfacefont. Four SNPs in the TAP2 gene—namely, TAP2-07, TAP2-12, TAP2-13 and TAP2-14—were excluded because of either poor (i.e., �95%) agreement betweenpolymerase chain reaction–based sequencing and minisequencing or poor reproducibility for minisequencing (i.e., � � 0.3).
AP Genes and Cervical Cancer ● JID 2008:197 (1 February) ● 377
by guest on May 10, 2011
jid.oxfordjournals.orgD
ownloaded from
Haplotypes for the Tapasin block were defined by Tapasin-07,
-09, and -10. In the Hispanic women, haplotype *01 had a sig-
nificantly higher frequency in the randomly selected control
subjects than in the case subjects. In the NHW women, haplo-
type *04 had a significantly lower frequency in the randomly
selected control subjects than in the case subjects; this haplotype
is defined by Tapasin-09, a newly discovered synonymous SNP
in codon 413.
DISCUSSION
An individual’s innate and adaptive immunity can affect persis-
tence of HPV and susceptibility to cervical cancer. In the present
study, AP SNPs in TAP1, TAP2, and Tapasin showed statistically
significant case-control differences in genotype distribution, in
both the Hispanic women and the NHW women. The type of
correlation (risk/protective) dependent on minor-allele preva-
lence in the case subjects or control subjects is shown in table 5.
The AP SNPs’ potential role in protein structure and function
may be seen in figure 1, which depicts both the structure of the
C-terminal domain of TAP1 that binds peptides and adenosine
triphosphate [39] and the SNPs that, in the present study,
showed significant case-control differences in genotype distri-
bution. Future functional analyses of individual SNPs may en-
able characterization of the potential biological significance of
the present study’s findings.
The present study used 2 types of control subjects. Randomly
selected control subjects represented (in terms of geographic lo-
cation, ethnicity, and HPV-exposure potential) the population
from which the case subjects were derived and served to repre-
sent general susceptibility to cervical cancer. Because these ran-
domly selected control subjects comprised both disease-free in-
dividuals exposed to HPV16 and other types of HPV and
individuals who were negative for HPV-DNA at the time of en-
rollment in the study, they were not homogenous with respect to
the major risk factor for cervical cancer. The significant associa-
tions between 4 AP SNPs (TAP1-03 and -04 and TAP2-02 and
-09) and susceptibility to cervical cancer, which were observed
only in the comparisons between the case subjects and the ran-
domly selected control subjects, could be due to effects on a
peptide repertoire that allowed for the identification and elimi-
nation of virally infected cells or tumor cells.
In the present study, the HPV16-positive control group was a
better match to the case group, because of the presence of
HPV16 in all individuals in the latter group. Associations with
susceptibility to cervical cancer that were observed in compari-
sons with this control group may be reflective of AP SNPs’ con-
tribution to generation of an HPV16-specific peptide repertoire
that prevents progression of HPV16-infected cells to the cancer-
ous phenotype (e.g., consider the HPV16-specific associations
seen for some of the TAP SNPs [i.e., TAP1-06, TAP1-07, and
TAP2-04] and some of the Tapasin SNPs [i.e., Tapasin-02 and
Tapasin-03]).
Our findings confirm and extend those of the study con-
ducted by Gostout et al. [21], who suggested that TAP1 and
TAP2 alleles are potential risk factors for cervical cancer. How-
ever, our study used individual-SNP analysis and evaluated ad-
ditional SNPs, which were used to create extended haplotypes;
it evaluated a total of 14 LMP2-TAP1-LMP7 SNPs, whereas
Gostout et al. evaluated 3, and it evaluated 10 TAP2 SNPs,
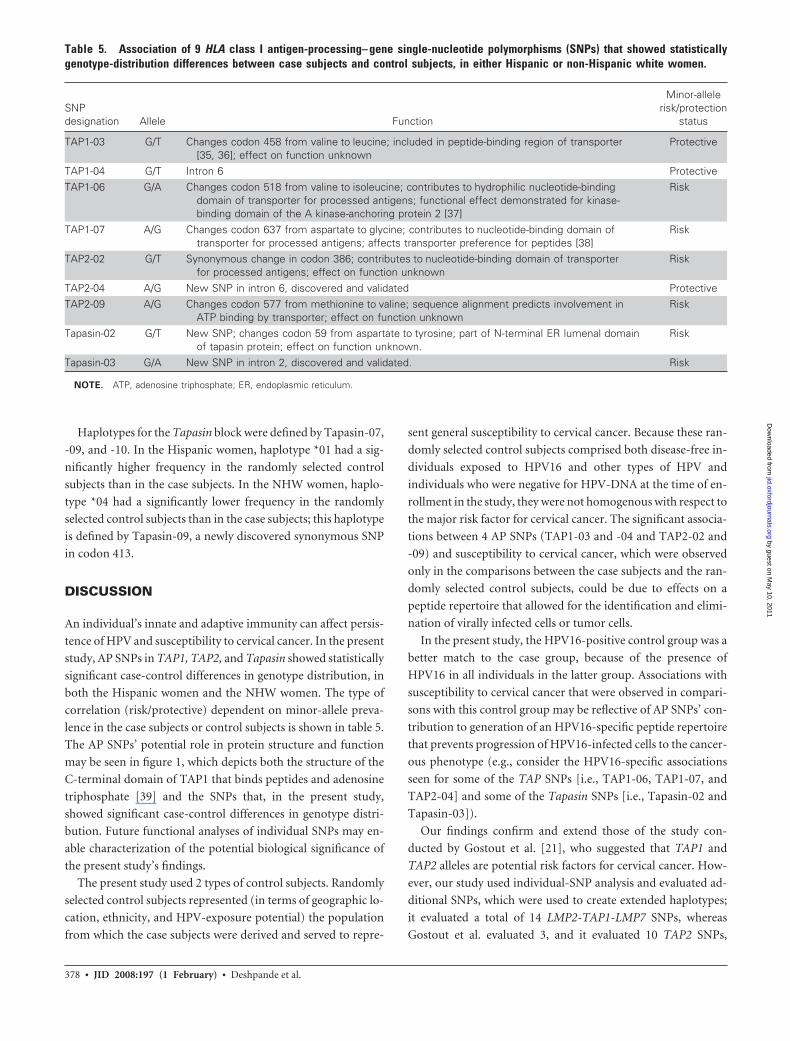
Table 5. Association of 9 HLA class I antigen-processing– gene single-nucleotide polymorphisms (SNPs) that showed statisticallygenotype-distribution differences between case subjects and control subjects, in either Hispanic or non-Hispanic white women.
SNPdesignation Allele Function
Minor-allelerisk/protection
status
TAP1-03 G/T Changes codon 458 from valine to leucine; included in peptide-binding region of transporter[35, 36]; effect on function unknown
Protective
TAP1-04 G/T Intron 6 ProtectiveTAP1-06 G/A Changes codon 518 from valine to isoleucine; contributes to hydrophilic nucleotide-binding
domain of transporter for processed antigens; functional effect demonstrated for kinase-binding domain of the A kinase-anchoring protein 2 [37]
Risk
TAP1-07 A/G Changes codon 637 from aspartate to glycine; contributes to nucleotide-binding domain oftransporter for processed antigens; affects transporter preference for peptides [38]
Risk
TAP2-02 G/T Synonymous change in codon 386; contributes to nucleotide-binding domain of transporterfor processed antigens; effect on function unknown
Risk
TAP2-04 A/G New SNP in intron 6, discovered and validated ProtectiveTAP2-09 A/G Changes codon 577 from methionine to valine; sequence alignment predicts involvement in
ATP binding by transporter; effect on function unknownRisk
Tapasin-02 G/T New SNP; changes codon 59 from aspartate to tyrosine; part of N-terminal ER lumenal domainof tapasin protein; effect on function unknown.
Risk
Tapasin-03 G/A New SNP in intron 2, discovered and validated. Risk
NOTE. ATP, adenosine triphosphate; ER, endoplasmic reticulum.
378 ● JID 2008:197 (1 February) ● Deshpande et al.
by guest on May 10, 2011
jid.oxfordjournals.orgD
ownloaded from
whereas Gostout et al. evaluated 3. The present study also, for the
first time, considers and reports associations for Tapasin SNPs in
the context of cervical cancer.
In our analysis, we focused on determining the frequencies of
individual SNPs. Haplotype information was inferred from the
SNP genotype data and allowed the identification of several
known and newly discovered alleles. In an alternative approach,
we might have sought to genotype all known alleles of the gene in
question, which would have let us compare our results with
those of other allele-genotyping work but would have restricted
our ability to identify new alleles. Allele nomenclatures, as well as
the SNPs used to define alleles of AP genes, are not uniform; for
example, Tang et al. [40] recently identified 16 TAP2 alleles, only
4 of which had officially been assigned names by the World
Health Organization nomenclature committee. Only 2 of the
SNPs showing significant associations in the present study are
included among reported alleles of TAP genes. TAP1-04 defines
TAP1*0401, along with the SNP in codon 648 (http://www.
anthonynolan.org.uk/HIG/data.html). TAP1-06 SNP defines
TAP1*0501, with SNPs in codons 370, 333, 637, 643, and 661.
For some AP genes (e.g., Tapasin), there are no official allele
assignments.
The present study has limitations. The control subjects (me-
dian age, 25 years) were younger than the case subjects (median
age, 45 years). It is possible that some control subjects will de-
velop cervical cancer during the next 2 decades, meaning that
there may be some misclassification of case-control status in this
study, which could result in an underestimation of the genotype
differences. Analyzing the genotype-distribution difference be-
tween the control subjects and an age-restricted (18 – 40-years-
old) subset of the case subjects, we found that 4 of the 9 SNPs
showing significant overall case-control differences in genotype
distribution retained such differences, and an additional 4 SNPs
showed significant differences. However, the power of this anal-
ysis was reduced because the age restriction allowed only 41.1%
of the case subjects to be included in the comparison.
The average sample size per group was �100, which yields
�80% power to detect odds ratios of 2.26 when the rare allele has
a prevalence of �5%; however, several of the SNPs had rare
alleles with prevalences of �2%. The present study’s power to
detect associations for these alleles was much less. In addition,
no adjustment for multiple comparisons was made to the P val-
ues; a joint comparison of all 35 SNPs might fail to show any
significant genotype-distribution difference between case sub-
jects and control subjects. We acknowledge that, in light of the
number of comparisons included, some of our statistically sig-
nificant results may have been due simply to chance. Only
through additional confirmatory studies and systematic func-
tional analyses of individual SNPs will the biological meaning of
our findings be determined.
Statistically significant genotype-distribution differences ob-
served in case-control comparisons in the present study may
Table 6. Comparison of haplotype distribution, by ethnic group and case-control status.
Haplotypedesignation
Hispanic Non-Hispanic white
Randomcontrol
subjects, % P
HPV-16control
subjects, % PHPV-16 casesubjects, %
Randomcontrol
subjects, % P
HPV-16control
subjects, % PHPV-16 casesubjects, %
LMP2-TAP1-LMP7*01 49.3 .44 43.3 .90 42.1 46.9 .71 43.6 .76 44.6*02 15.9 .85 15.6 .69 18.0 23.4 .07 15.5 .41 17.6*03 6.2 .27 1.9 .02 9.0 6.5 .87 6.0 .52 5.9*04 6.9 .25 7.2 .50 9.8 3.5 .11 6.4 .68 6.5*05 2.2 .67 6.6 .29 3.6 1.7 .11 11.3 .05 5.4*06 2.0 .22 9.1 .31 4.8 2.0 .74 3.2 .89 3.0TAP2*01 82.6 .11 77.5 .72 75.8 80.4 .09 75.2 .77 74.1*02 5.4 .19 5.5 .22 9.0 7.1 .67 7.8 .57 5.9*03 4.7 .83 5.8 .75 5.2 2.3 .06 7.8 .36 5.6*04 3.9 .22 3.3 .43 2.1 5.0 .89 3.1 .42 4.4Tapasin*01 77.9 .02 75.8 .07 68.9 77.4 .21 76.9 .28 72.3*02 15.2 .63 16.4 .95 16.5 13.4 .35 14.9 .58 16.8*03 2.0 .87 2.7 .96 2.4 2.8 .09 3.8 .07 1.4*04 0.2 .50 2.0 .34 0.9 0.5 .04 1.7 .38 3.1
NOTE. P values are for case-control comparisons. A control-subject haplotype frequency that is significantly different (P � .05, by Schaid et al.’s [31] scoretest) from that in case subjects is in boldface font.
AP Genes and Cervical Cancer ● JID 2008:197 (1 February) ● 379
by guest on May 10, 2011
jid.oxfordjournals.orgD
ownloaded from

represent linkage between AP SNPs and one or more HLA class
II risk/protective haplotypes that have been identified as being
associated with cervical cancer and that are common to most
ethnic groups [41]. However, recombination hot spots may have
some influence on such linkage. Specifically, the recombination
hot spot in TAP2 intron 2 causes a breakdown in the LD between
TAP1 and TAP2 [42, 43]; thus, although some TAP2 polymor-
phisms may have LD with the HLA DR-DQ genes, there is little
LD between TAP1 and TAP2 [44, 45]. TAP2-09 (codon 577),
which has been shown to be involved in Sjogren syndrome, an
autoimmune disease [46], shows LD with the extended HLA-
DRB1*0803-DQA1*-0103-DQB1*0601 haplotype in the Japa-
nese population [47]. Nonsignificant levels of LD between TAP1
and HLA DR and between DQ and DP have been shown among
family members included in the Centre d’Étude du Polymor-
phisme Humain database [48]. In addition, TAP1 alleles formed
by variations in codons 637 (TAP1-07) and 333 (TAP1-01) have
been shown to have no LD with either TAP2 alleles or HLA class
II alleles [49]. Hence, for TAP1 SNPs, case-control differences in
genotype distribution may not be exclusively a result of LD with
the HLA class II genes. Alleles of both TAP1 and TAP2 have been
shown to be associated with different autoimmune diseases, in-
dependent of HLA DR-DQ alleles’ associations (TAP1 [18] and
TAP2 [50]). The results of the logistic regression model used by
Gostout et al. suggest that alleles of TAP1, TAP2, and HLA-DRB1
contribute independently to the immune response to HPV [21].
In the present study, the number of SNPs showing significant
case-control differences in genotype distribution was greater in
the Hispanic women (n � 7) than in the NHW (n � 3) women,
and only 1 of the 9 cervical cancer–associated SNPs was common
to both ethnic groups. Cervical cancer is a complex, multifacto-
rial disease, and ethnic differences could reflect combinations of
SNP alleles in multiple genes that are involved in various steps in
the immune response. It is possible that future studies may re-
veal that AP SNPs have LD with either common or ethnic-
specific HLA class I/II susceptibility alleles— or even with
ethnic-specific SNPs in other immune-response genes. Our
analysis of HLA class I and II alleles observed in the samples used
in the present study is ongoing, and we plan to apply linkage
analysis to the data.
To summarize, in the present study we have confirmed previ-
ous reports of the involvement of TAP genes in susceptibility to
cervical cancer, have extended these findings to 8 additional
SNPs, and have provided evidence that Tapasin plays a role in
such susceptibility. Thus, the present study also indicates that AP
genes play a role in susceptibility to cervical cancer.
Acknowledgments
We thank Norah Torrez-Martinez for her meticulous help in the prepa-ration of control and case DNA samples and for HPV-type analyses, and wethank Roche Diagnostics for its generous contribution of Amplitaq Gold.
References
1. Bauer HM, Ting Y, Greer CE, et al. Genital human papillomavirus in-fection in female university students as determined by a PCR-basedmethod. JAMA 1991; 265:472–7.
2. Ho GY, Burk RD, Klein S, et al. Persistent genital human papillomavirusinfection as a risk factor for persistent cervical dysplasia. J Natl CancerInst 1995; 87:1365–71.
3. Walboomers JM, Jacobs MV, Manos MM, et al. Human papillomavirusis a necessary cause of invasive cervical cancer worldwide. J Pathol 1999;189:12–9.
4. Groettrup M, Standera S, Stohwasser R, Kloetzel PM. The subunitsMECL-1 and LMP2 are mutually required for incorporation into the20S proteasome. Proc Natl Acad Sci USA 1997; 94:8970 –5.
5. Griffin TA, Nandi D, Cruz M, et al. Immunoproteasome assembly: co-operative incorporation of interferon gamma (IFN-gamma)-induciblesubunits. J Exp Med 1998; 187:97–104.
6. Fruh K, Yang Y. Antigen presentation by MHC class I and its regulationby interferon gamma. Curr Opin Immunol 1999; 11:76 – 81.
7. Androlewicz MJ, Anderson KS, Cresswell P. Evidence that transportersassociated with antigen processing translocate a major histocompatibil-ity complex class I-binding peptide into the endoplasmic reticulum inan ATP-dependent manner. Proc Natl Acad Sci USA 1993; 90:9130 – 4.
8. Neefjes JJ, Momburg F, Hammerling GJ. Selective and ATP-dependenttranslocation of peptides by the MHC-encoded transporter. Science1993; 261:769 –71.
9. Sadasivan B, Lehner PJ, Ortmann B, Spies T, Cresswell P. Roles forcalreticulin and a novel glycoprotein, tapasin, in the interaction of MHCclass I molecules with TAP. Immunity 1996; 5:103–14.
10. Garcia AM, Ortiz-Navarrete VF, Mora-Garcia ML, et al. Identificationof peptides presented by HLA class I molecules on cervical cancer cellswith HPV-18 infection. Immunol Lett 1999; 67:167–77.
11. Wang SS, Wheeler CM, Hildesheim A, et al. Human leukocyte antigenclass I and II alleles and risk of cervical neoplasia: results from apopulation-based study in Costa Rica. J Infect Dis 2001; 184:1310 – 4.
12. Cuzick J, Terry G, Ho L, et al. Association between high-risk HPV types,HLA DRB1* and DQB1* alleles and cervical cancer in British women.Br J Cancer 2000; 82:1348 –52.
13. Maciag PC, Schlecht NF, Souza PSA, Franco EL, Villa LL, Petzl-ErlerML. Major histocompatibility complex class II polymorphisms and riskof cervical cancer and human papillomavirus infection in Brazilianwomen. Cancer Epidemiol Biomarkers Prev 2000; 9:1183–91.
14. Madeleine MM, Brumback B, Cushing-Haugen KL, et al. Human leu-kocyte antigen class II and cervical cancer risk: a population-basedstudy. J Infect Dis 2002; 186:1565–74.
15. Heward JM, Allahabadia A, Sheppard MC, Barnett AH, Franklyn JA,Gough SC. Association of the large multifunctional proteasome (LMP2)gene with Graves’ disease is a result of linkage disequilibrium with theHLA haplotype DRB1*0304-DQB1*02-DQA1*0501. Clin Endocrinol(Oxf) 1999; 51:115– 8.
16. Maksymowych WP, Tao S, Vaile J, Suarez-Almazor M, Ramos-RemusC, Russell AS. LMP2 polymorphism is associated with extraspinal dis-ease in HLA-B27 negative Caucasian and Mexican Mestizo patients withankylosing spondylitis. J Rheumatol 2000; 27:183–9.
17. Martin-Villa JM, Martinez-Laso J, Moreno-Pelayo MA, et al. Differen-tial contribution of HLA-DR, DQ, and TAP2 alleles to systemic lupuserythematosus susceptibility in Spanish patients: role of TAP2*01 allelesin Ro autoantibody production. Ann Rheum Dis 1998; 57:214 –9.
18. Ma L, Penfornis A, Wang X, et al. Evaluation of TAP1 polymorphismswith insulin dependent diabetes mellitus in Finnish diabetic patients.Hum Immunol 1997; 53:159 – 66.
19. Rau H, Nicolay A, Donner H, Usadel KH, Badenhoop K. Polymor-phisms of TAP1 and TAP2 genes in German patients with type 1 diabetesmellitus. Eur J Immunogenet 1997; 24:229 –36.
20. Hjelmstrom P, Giscombe R, Lefvert AK, et al. TAP polymorphisms inSwedish myasthenia gravis patients. Tissue Antigens 1997; 49:176 –9.
21. Gostout BS, Poland GA, Calhoun ES, et al. TAP1, TAP2, and HLA-DR2
380 ● JID 2008:197 (1 February) ● Deshpande et al.
by guest on May 10, 2011
jid.oxfordjournals.orgD
ownloaded from

alleles are predictors of cervical cancer risk. Gynecol Oncol 2003; 88:326 –32.
22. Kaderali L, Deshpande A, Nolan JP, White PS. Primer-design for mul-tiplexed genotyping. Nucleic Acids Res 2003; 31:1796 –1802.
23. Ewing B, Hillier L, Wendl MC, Green P. Base-calling of automated se-quencer traces using Phred. I. Accuracy assessment. Genome Res 1998;8:175– 85.
24. Ewing B, Green P. Base-calling of automated sequencer traces usingPhred. II. Error probabilities. Genome Res 1998; 8:186 –94.
25. Nickerson DA, Tobe VO, Taylor SL. PolyPhred: automating the detec-tion and genotyping of single nucleotide substitutions usingfluorescence-based resequencing. Nucleic Acids Res 1997; 25:2745–51.
26. Greer CE, Wheeler CM, Manos MM. Sample preparation and PCR am-plification from paraffin-embedded tissues. PCR Methods Appl 1994; 3:S113–22.
27. Peyton CL, Gravitt PE, Hunt WC, et al. Determinants of genital humanpapillomavirus detection in a US population. J Infect Dis 2001; 183:1554 – 64.
28. Gravitt PE, Peyton CL, Apple RJ, Wheeler CM. Genotyping of 27 humanpapillomavirus types by using L1 consensus PCR products by a single-hybridization, reverse line blot detection method. J Clin Microbiol 1998;36:3020 –7.
29. Deshpande A, Nolan JP, White PS, et al. TNF-� promoter polymor-phisms and susceptibility to HPV16 –associated cervical cancer. J InfectDis 2005; 191:969 –76.
30. Deshpande A, Valdez Y, Nolan JP. Multiplexed SNP genotyping usingprimer single-base extension (SBE) and microsphere arrays. Unit 13.4in: Robinson JP, Darzynkiewicz Z, Hoffman R, et al., eds. Current pro-tocols in cytometry 2005, supplement 34. New York: John Wiley & Sons,2005.
31. Schaid DJ, Rowland CM, Tines DE, Jacobson RM, Poland GA. Scoretests for association between traits and haplotypes when linkage phase isambiguous. Am J Hum Genet 2002; 70:425–34.
32. Fredman D, Siegfried M, Yuan YP, Bork P, Lehväslaiho H, Brookes AJ.HGVbase: a human sequence variation database emphasizing data qual-ity and a broad spectrum of data sources. Nucleic Acids Res 2002; 30:387–91.
33. Cullen M, Perfetto SP, Klitz W, Nelson G, Carrington M. High-resolution patterns of meiotic recombination across the human majorhistocompatibility complex. Am J Hum Genet 2002; 71:759 –76.
34. Cullen M, Erlich H, Klitz W, Carrington M. Molecular mapping of arecombination hotspot located in the 2nd intron of the human TAP2locus. Am J Hum Genet 1995; 56:1350 – 8.
35. Nijenhuis M, Schmitt S, Armandola EA, Obst R, Brunner J, HammerlingGJ. Identification of a contact region for peptide on the TAP1 chain ofthe transporter associated with antigen processing. J Immunol 1996;156:2186 –95.
36. Nijenhuis M, Hammerling GJ. Multiple regions of the transporter asso-ciated with antigen processing (TAP) contribute to its peptide bindingsite. J Immunol 1996; 157:5467–77.
37. Kammerer S, Burns-Hamuro LL, Ma YL, et al. Amino acid variant in thekinase-binding domain of dual-specific A kinase-anchoring protein 2: adisease susceptibility polymorphism. Proc Natl Acad Sci USA 2003; 100:4066 –71.
38. Quadri SA, Singal DP. Peptide transport in human lymphoblastoid andtumor cells: effect of transporter associated with antigen presentation(TAP) polymorphism. Immunol Lett 1998; 61:25–31.
39. Bouvier M. Accessory proteins and the assembly of human class I MHCmolecules: a molecular and structural perspective. Mol Immunol 2003;39:697–706.
40. Tang J, Freedman DO, Allen S, et al. Genotyping TAP2 variants in NorthAmerican Caucasians, Brazilians and Africans. Genes Immun 2001; 2:32– 40.
41. Hildesheim A, Wang SS. Host and viral genetics and risk of cervicalcancer: a review. Virus Res 2002; 89:229 – 40.
42. Kauppi L, Sajantila A, Jeffreys AJ. Recombination hotspots rather thanpopulation history dominate linkage disequilibrium in the MHC class IIregion. Hum Mol Genet 2003; 12:33– 40.
43. Jeffreys AJ, Kauppi L, Neumann R. Intensely punctate meiotic recom-bination in the class II region of the major histocompatibility complex.Nature Genet 2001; 29:217–22.
44. Van Endert PM, Lopez MT, Patel SD, Monaco JJ, McDevitt HO. Ge-nomic polymorphism, recombination, and linkage disequilibrium inhuman major histocompatibility complex-encoded antigen-processinggenes. Proc Natl Acad Sci USA 1992; 89:11594 –7.
45. Klitz W, Stephens JC, Grote M, Carrington M. Discordant patterns oflinkage disequilibrium of the peptide-transporter loci within the HLAclass II region. Am J Hum Genet 1995; 57:1436 – 44.
46. Kumagai S, Kanagawa S, Morinobu A, et al. Association of a new allele ofthe TAP2 gene, TAP2*BKY2 (Val 577), with susceptibility to Sjogren’ssyndrome. Arthritis Rheum 1997; 40:1685–92.
47. Ishihara M, Ohno S, Ishida T, et al. Analysis of allelic variation of theTAP2 gene in sarcoidosis. Tissue Antigens 1997; 49:107–10.
48. Carrington M, Stephens JC, Klitz W, Begovich AB, Erlich HA, Mann D.Major histocompatibility complex class II haplotypes and linkage dis-equilibrium values observed in the CEPH families. Hum Immunol 1994;41:234 – 40.
49. Djilali-Saiah I, Benini V, Daniel R, Assan J, Bach JF, Caillat-Zucman S.Linkage disequilibrium between HLA class II (DR, DQ, DP) and antigenprocessing (LMP, TAP, DM) genes of the major histocompatibilitycomplex. Tissue Antigens 1996; 48:87–92.
50. Tuokko J, Nejentsev S, Luukkainen R, Toivanen A, Ilonen J. HLA hap-lotype analysis in Finnish patients with rheumatoid arthritis. ArthritisRheum 2001; 44:315–22.
AP Genes and Cervical Cancer ● JID 2008:197 (1 February) ● 381
by guest on May 10, 2011
jid.oxfordjournals.orgD
ownloaded from
Top Related
Copyright © 2022 FDOKUMEN

