


Bahasa
Halaman
Hukum


Using Quality Measures for Quality Improvement: ThePerspective of Hospital StaffAsgar Aghaei Hashjin1,2*, Hamid Ravaghi 2,3 , Dionne S. Kringos1, Uzor C. Ogbu1, Claudia Fischer1,4, Saeid
Reza Azami5, Niek S. Klazinga1
1 Department of Social Medicine, Academic Medical Center (AMC)/University of Amsterdam, Amsterdam, the Netherlands, 2 Department of Health Services Management,
School of Health Management and Information Sciences, Iran University of Medical Sciences, Iranian Ministry of Health and Medical Education, Tehran, Iran, 3 Health
Management and Economic Research Center, School of Health Management and Information Sciences, Iran University of Medical Sciences, Iranian Ministry of Health and
Medical Education, Tehran, Iran, 4 Department of Public Health, Erasmus Medical Center, Rotterdam, the Netherlands, 5 Development and Supervision Management of
Public Affairs, Tehran University of Medical Sciences, Iranian Ministry of Health and Medical Education, Tehran, Iran
Abstract
Research objective: This study examines the perspectives of a range of key hospital staff on the use, importance, scientificbackground, availability of data, feasibility of data collection, cost benefit aspects and availability of professional personnelfor measurement of quality indicators among Iranian hospitals. The study aims to facilitate the use of quality indicators toimprove quality of care in hospitals.
Study design: A cross-sectional study was conducted over the period 2009 to 2010. Staff at Iranian hospitals completed aself-administered questionnaire eliciting their views on organizational, clinical process, and outcome (clinical effectiveness,patient safety and patient centeredness) indicators.
Population studied: 93 hospital frontline staff including hospital/nursing managers, medical doctors, nurses, and qualityimprovement/medical records officers in 48 general and specialized hospitals in Iran.
Principal findings: On average, only 69% of respondents reported using quality indicators in practice at their affiliatedhospitals. Respondents varied significantly in their reported use of organizational, clinical process and outcome qualityindicators. Overall, clinical process and effectiveness indicators were reported to be least used. The reported use ofindicators corresponded with their perceived level of importance. Quality indicators were reported to be used amongclinical staff significantly more than among managerial staff. In total, 74% of the respondents reported to use obligatoryindicators, while this was 68% for voluntary indicators (p,0.05).
Conclusions: There is a general awareness of the importance and usability of quality indicators among hospital staff in Iran,but their use is currently mostly directed towards external accountability purposes. To increase the formative use of qualityindicators, creation of a common culture and feeling of shared ownership, alongside an increased uptake of clinical processand effectiveness indicators is needed to support internal quality improvement processes at hospital level.
Citation: Aghaei Hashjin A, Ravaghi H, Kringos DS, Ogbu UC, Fischer C, et al. (2014) Using Quality Measures for Quality Improvement: The Perspective of HospitalStaff. PLoS ONE 9(1): e86014. doi:10.1371/journal.pone.0086014
Editor: Salomeh Keyhani, University of California, San Francisco, United States of America
Received December 5, 2012; Accepted December 9, 2013; Published January 23, 2014
Copyright: � 2014 Aghaei Hashjin et al. This is an open-access article distributed under the terms of the Creative Commons Attribution License, which permitsunrestricted use, distribution, and reproduction in any medium, provided the original author and source are credited.
Funding: This work was supported by Tehran University of Medical Sciences, Iranian Ministry of Health and Medical Education. The funder had no role in studydesign, data collection and analysis, decision to publish, or preparation of the manuscript.
Competing Interests: The authors have declared that no competing interests exist.
* E-mail: [email protected]
Introduction
Measuring quality of care is a powerful mechanism to drive
health system performance improvement. The availability of
reliable quality information empowers patients to make informed
decisions about where to seek health care, and supports health
care providers to provide better health care. Recently, measuring
quality of care in hospitals has become a main policy priority in
many countries. Numerous health systems are in the process of
developing and instituting requirements for routine measurement
and reporting of quality data at both national and hospital levels
for external and internal purposes [1–4]. Quality indicators can be
used for summative (external) purposes to increase the account-
ability of hospitals towards different stakeholders (such as;
government, patients or health insurers). They can also be used
for formative (internal) purposes by health care organizations and
providers to measure, monitor and improve the provided levels of
quality of care [5,6].
Although quality indicators represent a promising strategy for
improving quality of care and accountability, the implementation
process in hospitals is often faced with problems and challenges at
the ground level [7–13]. Some of the challenges in the
implementation process may originate from the absence of a role
for hospital staff in the development, selection and execution of
quality indicators. Successful development and implementation of
quality indicators in hospitals strongly depends on frontline staff’s
PLOS ONE | www.plosone.org 1 January 2014 | Volume 9 | Issue 1 | e86014

involvement and awareness [14,15]. In addition, the consultation
with key hospital staff and their involvement in quality improve-
ment (QI) activities may increase the effectiveness and likelihood of
success of such efforts. It can provide an avenue for better
communication on relevant insights into the workflow and
potential challenges. It can also provide an increased sense of
accountability of staff, which is positively correlated with the
success of such plans in practice [10,16–20].
In response to the increasing worldwide interest in quality
measures, the Iranian Ministry of Health and Medical Education
(MOHME) developed a set of obligatory quality indicators. These
indicators have been statutorily included in the Iranian National
Hospital Evaluation Program in 2002. The plan aimed to realize
improvement of the quality of hospital care, support informed
decision making by providing health-related information, and
increasing accountability and regulation in hospitals [21]. The
quality indicators in Iran were primarily designed for summative
purposes to increase the accountability of hospitals for the quality
of care they provide. All hospitals were obliged to implement the
quality indicators applying a top-down approach steered by the
MOHME. As a result, the development of the quality indicators
was conducted with little consultation of hospital staff [22].
Despite nationwide efforts to develop and implement the quality
indicators, at present there is no study available about the extent of
application and perspective of hospital staff on such measures.
This study therefore aimed to assess the perspectives of hospital
frontline staff on the seven themes in regards to the selected 27
obligatory and voluntary quality indicators. The indicators are
categorized in organizational, clinical process and outcome
groups. The outcome indicators included clinical effectiveness,
patient safety and patient centeredness issues. The themes that
were assessed in this study, included: use, importance, scientific
soundness, availability of data, feasibility of data collection, cost
benefit aspects and availability of professional personnel for
measurement of quality indicators.
Methods
This is a cross-sectional study conducted over the period 2009 to
2010. Data was collected using a self-administered questionnaire.
The survey was focused on twenty-seven hospital quality
indicators, in each case exploring the perspectives of hospital
frontline staff on seven themes. The indicators and themes
included in the questionnaire were derived from a two-stage
expert panel process. The panel of ten health experts consisted of
two health services academics, two health services researchers, two
hospital managers, a physician, two nurses, and an epidemiologist.
To obtain the views of hospital staff on quality indicators for
hospital care, it was important not to limit the selection of
indicators to the set of obligatory indicators used by the MOHME.
The expert panel was therefore presented with an initial list of
obligatory and voluntary indicators and seven themes. The
indicators and themes were selected from the current Iranian
hospitals’ annual evaluation program [23] and the World Health
Organization Performance Assessment Tool for quality improve-
ment in Hospitals (PATH) project [24]. In addition, the results of a
literature search [25] and expert opinions on quality indicators
were used. The panel was tasked with evaluating the indicators
and themes, and given the opportunity to change, add or remove
indicators and themes from the list.
As a result, twenty-seven quality indicators were selected by the
panel. The indicators consisted of a combination of obligatory
(developed by the MOHME) and voluntary indicators. Imple-
mentation of seven indicators was obligatory under the Iranian
hospitals’ annual evaluation program and the 20 remaining
indicators recommended by the expert panel were voluntary
indicators (see Table 1). The indicators were grouped based on a
triad method in organizational, clinical process, and outcome
indicators related to the clinical effectiveness, patient safety, and
patient centeredness as shown in Table 1. The resulting
questionnaire consisted of 9 organizational, 6 clinical process,
and 12 outcome indicators relating to the clinical effectiveness (6),
patient safety (4) and patient centeredness (2) of hospital care. The
themes that were selected by the panel, included; i) the (areas of)
use, ii) perceived importance of the indicator, iii) assessment of
scientific background, iv) availability of data, v) feasibility of data
collection, vi) cost benefit aspects, and vii) availability of
professional personnel for measurement.
The questionnaire was in Farsi. It was piloted among five health
services experts and ten frontline staff members (including two
hospital managers, a medical doctor, two nurses, two nursing
managers, two QI officers, and one head of medical records
department). A purposive sample of five hospitals (three public
governmental, one Social Security Organization (SSO), and one
private hospital) was selected for piloting, which were not included
in the sample of final survey. The questionnaire was assessed for
face validity and clarity based on the responses received.
The questionnaire was self-administered with the exception of a
few respondents in Tehran, capital city of Iran, whose question-
naires were administered face-to-face. The questionnaires were
sent out and returned by mail with support provided for the
respondents by email and telephone. Participation in the survey
was voluntary and periodic reminders were sent out. Question-
naires received were assessed for completeness and consistency.
Respondents were contacted to address any observed issues.
Questionnaires were excluded if these issues could not be resolved.
In the final questionnaire, the perspectives of hospital frontline
staff were asked on the organizational, clinical process and
outcome quality indicators in relation to the seven themes. We
analyzed the heterogeneity in the responses of staff to the questions
by conducting Pearson’s chi-squared test using SPSS. We explored
whether hospital staff (both total study population, and different
types of professionals) had statistically significant different
perspectives on the seven themes related to the implementation
of specific quality indicators. The average rates of positive answers
to questions on the use, level of importance, scientific background,
data and personnel availability, feasibility of data collection and
cost benefit aspects of quality indicators were used in the analysis
(i.e. whether there is agreement in the responses). Our criterion for
the significance level was p,0.05.
Study populationThe study population consisted of 160 respondents in three
groups; managerial staff (active hospital managers, quality
improvement officers, the heads of medical records department),
clinical staff (medical doctors, nurses and nursing managers), and
other health professionals (e.g. health economists and health
services researchers). They were working in 75 hospitals across
nine regions in Iran during the study period. The 75 hospitals were
selected using a purposive sampling method, representing (around)
10% of hospitals in Iran. The studied hospitals were largely
representative in terms of type (public, private, SSO, and other –
military and charity – hospitals) and geographical distribution.
The response rate of hospital staff was 71.3% (114 respondents
out of 160 sampled in the study) and covered 64% (48) of the (75)
sampled hospitals in the study. Twenty-one questionnaires were
excluded for reasons of incompleteness or inconsistency, resulting
in a final population of 93 respondents. Table 2 shows the
Hospital Staff Perspectives on Quality Indicators
PLOS ONE | www.plosone.org 2 January 2014 | Volume 9 | Issue 1 | e86014

characteristics of the study population, which is representative
both across hospitals and type of professionals.
The study was approved by the Deputy of Research and
Technology of the Tehran (Iran) University of Medical Sciences
(Code: 958/1635996).
Results
Perspectives of hospital staff on quality indicatorsQuality indicators in general. Hospital staff had signifi-
cantly different (heterogeneous) perspectives on the use, level of
importance, scientific background, feasibility of data collection,
and cost benefit aspects of measurement of quality indicators. In
contrast, there was more agreement (homogeneity) in the
perspectives of hospital staff on the availability of data and
professional personnel to measure the indicators. Figure 1
summarizes the overall perspectives of respondents. Organization-
al, clinical process, clinical effectiveness, patient safety, and patient
centeredness indicators were reported to be used by 75%, 57%,
66%, 72%, and 86% of the respondents respectively (p,0.05).
Clinical process indicators had the lowest reported use. This was
also the indicator group with the lowest perceived importance by
hospital staff. The importance given to indicators corresponded
with their use, which was particularly high for outcome indicators
compared to the other type of quality indicators (p,0.05). Despite
the sufficient scientific background reported by respondents, on
average, only 68% of respondents reported using quality indicators
at their affiliated hospitals. Data were thought to be available by
83% of respondents for organizational indicators, and only 75%
and 79% of respondents thought data was available for the clinical
process and outcome indicators respectively. Data collection was
judged to be feasible by 96%, 89%, and 94% of respondents for
organizational, clinical process, and outcome indicators respec-
tively. However, the availability of personnel and cost benefit
aspects of organizational, clinical process, and outcome indicators
was judged to be sufficient by 86%, 80%, 84%, and 92%, 84%,
91% of respondents respectively.
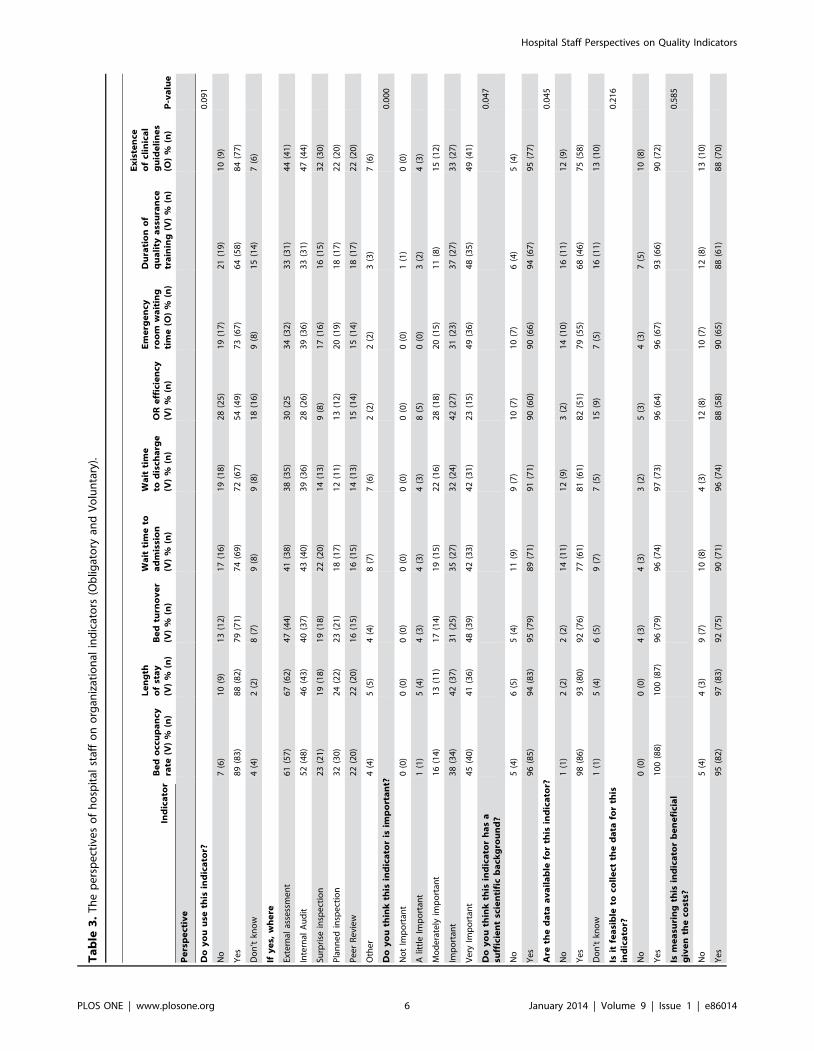
Organizational indicators. Table 3 shows the responses to
the questions related to the organizational indicators. Respondents
had significantly different perspectives on the level of importance,
scientific background, data and professional personnel availability
of the organizational indicators. However, they did not have
significant different perspectives on the use, feasibility of data
collection and cost benefit aspects of these indicators. The most
commonly used measures were the bed occupancy rate, length of
stay and bed turnover (p,0.05). The operating room (OR)
efficiency indicator had a significantly lower reported use in this
group, followed by a measure of the duration of quality assurance
training. Medium scoring (around 73% reported use) indicators in
this group were related to waiting times. Lower use of
organizational indicators seemed to be mostly related to the
perceived importance, availability of data, and available human
resources to collect the data.
Clinical process indicators. Respondents assessed the use,
level of importance, scientific background, data and professional
personnel availability of the clinical process indicators significantly
different. More agreement existed on the feasibility of data
collection and cost benefit aspects of these indicators. Table 4
shows that clinical process indicators were reported to be
significantly less used compared to the organizational and outcome
indicators. In addition, there was also a relatively high level of
unawareness among staff (19%) whether or not the clinical process
indicators were applied in their affiliated hospitals, compared to
the organizational (9%) and outcome (11%) indicators. On the
extreme, only 38% of respondents reported to apply cross match
rates for transfusions (and 26% of respondents were unaware of
the use of this indicator). The indicators were mostly reported to
be used for external assessments and internal audits purposes.
Outcome indicators. Table 5 shows the results for the
questions on outcome indicators related to clinical effectiveness,
patient safety and patient centeredness. Hospital staff had
significantly different perspectives on the use, level of importance,
data and professional personnel availability of the clinical
effectiveness outcome indicators. However, they had relatively
similar opinions on the scientific background, feasibility of data
collection and cost benefit aspect of these indicators. Significant
heterogeneity existed in the responses of hospital staff on the use,
Table 1. Classification of indicators by Organizational, Clinical process, and Outcome (Obligatory and Voluntary).
Indicator type Indicator name (O = Obligatory or V = Voluntary)
Organizational indicators Bed occupancy rate (V) Operating room efficiency (surgical theatre use) (V)
Length of stay (V) Emergency room waiting time (O)
Bed turnover (V) Duration of quality improvement training for personnel (V)
Wait time to admission (V) Existence of clinical guidelines (O)
Wait time to discharge (V)
Clinical process indicators Caesarean section rate (O) Pre-operative antibiotic prophylaxis rate (O)
CPR team response time (V) Cross match rate for transfusions (V)
Use of autologous blood rate (V) Repeat x-ray rate in radiology (V)
Outcomeindicators
Clinicaleffectiveness
Hospital mortality rate (V) ICU readmission (V)
Readmission rate (excl. day surgery) (V) Breast feeding rate at discharge (V)
Readmission rate after day surgery (V) Post-operative complication rate (V)
Patient safety Needle stick injury rate (O) Bedsore rate (V)
Hospital-acquired infection rate (O) Post-discharge wound infection rate (V)
Patientcenteredness
Patient satisfaction rate (O) Complaint rate (V)
doi:10.1371/journal.pone.0086014.t001
Hospital Staff Perspectives on Quality Indicators
PLOS ONE | www.plosone.org 3 January 2014 | Volume 9 | Issue 1 | e86014
level of importance, data and professional personnel availability,
and feasibility of data collection of the patient safety outcome
indicators. More homogenous responses were reported regarding
the scientific background and cost benefit aspect of these
indicators. Hospital staff also significantly differed in their
perspectives on the availability of data and professional personnel
with regard to the patient centeredness outcome indicators. In
contrast, such heterogeneity was not seen regarding the use, level
of importance, scientific background, feasibility of data collection,
and cost benefit aspect of these indicators.
Perspectives of managerial, clinical and other hospitalstaff on different types of quality indicators
Figure 2 shows the perspectives of managerial, clinical and other
staff on organizational, clinical process and outcome indicators.
The corresponding p-values indicate the statistical differences in
perspectives of staff on each indicator. Clinical staff reported
significantly higher utilization rates than managerial staff, i.e.:
organizational indicators (80% versus 71%), clinical process
indicators (64% versus 51%), clinical effectiveness indicators
(75% versus 58%) and patient safety indicators (81% versus
66%). Both groups reported more or less equal use of patient
centeredness indicators. The differences in reported use were
(significantly) higher in case of clinical process, clinical effectiveness
and patient safety indicators, compared to organizational indica-
tors. There were about equally large (significant) differences
among managerial and clinical staff in the level of perceived
importance of indicators. However, both groups rated organiza-
tional and clinical outcome indicators as most important. Both
clinical and managerial staff rated the scientific background of all
indicators relatively high.
Clinical staff rated data availability significantly higher than
managerial staff, i.e.: organizational indicators (87% versus 83%),
clinical process indicators (83% versus 70%), and outcome
indicators (85% versus 77%). The same was true for the
perspectives on the feasibility of data collection and availability
of professional personnel.
Perspectives on obligatory and voluntary indicatorsHospital staff had significantly different perspectives on the use,
level of importance, scientific background, data availability,
feasibility of data collection and professional personnel availability
on the obligatory and voluntary indicators. However, there was no
significant difference in the perspectives of staff on the cost benefit
aspect of the obligatory and voluntary indicators. In total, 74% of
respondents reported using obligatory indicators for different
processes in their hospital. Sixty-eight percent of the respondents
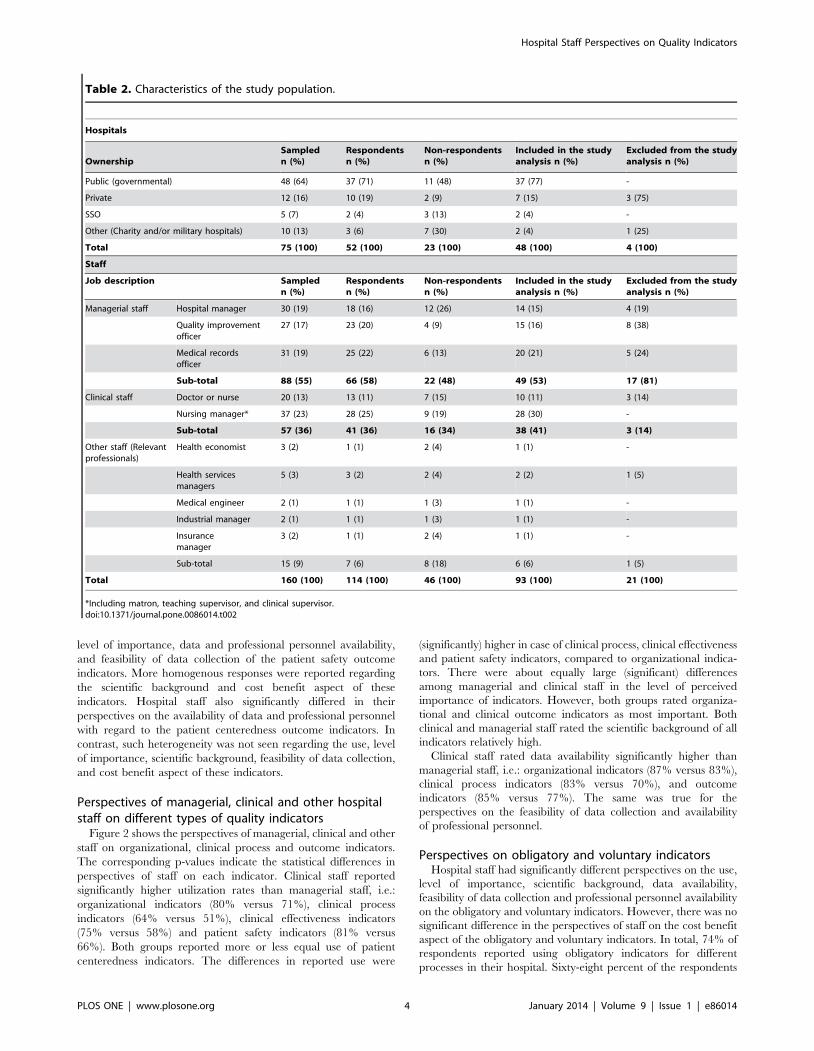
Table 2. Characteristics of the study population.
Hospitals
OwnershipSampledn (%)
Respondentsn (%)
Non-respondentsn (%)
Included in the studyanalysis n (%)
Excluded from the studyanalysis n (%)
Public (governmental) 48 (64) 37 (71) 11 (48) 37 (77) -
Private 12 (16) 10 (19) 2 (9) 7 (15) 3 (75)
SSO 5 (7) 2 (4) 3 (13) 2 (4) -
Other (Charity and/or military hospitals) 10 (13) 3 (6) 7 (30) 2 (4) 1 (25)
Total 75 (100) 52 (100) 23 (100) 48 (100) 4 (100)
Staff
Job description Sampledn (%)
Respondentsn (%)
Non-respondentsn (%)
Included in the studyanalysis n (%)
Excluded from the studyanalysis n (%)
Managerial staff Hospital manager 30 (19) 18 (16) 12 (26) 14 (15) 4 (19)
Quality improvementofficer
27 (17) 23 (20) 4 (9) 15 (16) 8 (38)
Medical recordsofficer
31 (19) 25 (22) 6 (13) 20 (21) 5 (24)
Sub-total 88 (55) 66 (58) 22 (48) 49 (53) 17 (81)
Clinical staff Doctor or nurse 20 (13) 13 (11) 7 (15) 10 (11) 3 (14)
Nursing manager* 37 (23) 28 (25) 9 (19) 28 (30) -
Sub-total 57 (36) 41 (36) 16 (34) 38 (41) 3 (14)
Other staff (Relevantprofessionals)
Health economist 3 (2) 1 (1) 2 (4) 1 (1) -
Health servicesmanagers
5 (3) 3 (2) 2 (4) 2 (2) 1 (5)
Medical engineer 2 (1) 1 (1) 1 (3) 1 (1) -
Industrial manager 2 (1) 1 (1) 1 (3) 1 (1) -
Insurancemanager
3 (2) 1 (1) 2 (4) 1 (1) -
Sub-total 15 (9) 7 (6) 8 (18) 6 (6) 1 (5)
Total 160 (100) 114 (100) 46 (100) 93 (100) 21 (100)
*Including matron, teaching supervisor, and clinical supervisor.doi:10.1371/journal.pone.0086014.t002
Hospital Staff Perspectives on Quality Indicators
PLOS ONE | www.plosone.org 4 January 2014 | Volume 9 | Issue 1 | e86014

reported use of the remaining twenty voluntary indicators.
Although the implementation of seven indicators in our study
was obligatory as part of external evaluation program, only 44% of
respondents reported using these indicators in the hospitals.
Discussion
We studied the perspective of frontline staff on the seven themes
related to the implementation of 27 quality indicators in Iranian
hospitals. This is to our knowledge the first study providing insight
into the perspectives of frontline hospital staff on important aspects
related to the use and implementation of quality indicators in
Iranian hospitals. The comprehensive scope of the included
(consensus-based) quality indicators, representative sample of all
types of hospitals, and breadth of hospital professionals are strong
features of the study design. However, the study has some
limitations. First, the non-response of 28.7% of hospital staff and
exclusion of around 20% of received questionnaires from our
study population due to incompleteness of surveys resulted in a
lower response rate than planned. It is possible that the non-
represented hospitals had a lower awareness of the importance and
usability of quality indicators, leading to a potential (over-
)reporting bias. Furthermore, there was no clear standardized
classification of quality indicators available for our study. This may
be explained by the various definitions of quality indicators used
by different users. However, the classification of indicators studied
in this survey was based on relevant literature, knowledge and the
experience of the authors.
Our survey shows that currently, hospital staff are primarily
applying organizational (75%) and clinical outcome (71%)
indicators. Only 57% of staff reported using the clinical process
indicators which is significantly lower than their reported use of
organizational and outcome indicators. The reported use corre-
sponded with the perceived level of importance of indicators.
There is a significant difference in the responses of hospital staff on
the use, level of importance, feasibility of data collection, scientific
background, and cost benefit aspects of measurement of the
indicators. More agreement existed among hospital staff on the
availability of data and professional personnel to measure the
indicators. Clinical staff reported a significantly higher use of all
types of indicators (except patient centeredness) compared to
managerial staff. There were statistically significant differences in
the reported use of obligatory and voluntary indicators. Not all
obligatory quality indicators were applied by respondents. Only
74% of respondents reported to apply obligatory indicators, while
68% reported to use voluntary indicators.
Figure 1. Overall perspectives of hospital staff on organizational, clinical process, and outcome indicators. Figure 1 shows thereported utilization rates for each of the indicator groups, which were: organizational indicators (75%), clinical process indicators (57%), clinicaleffectiveness indicators (66%), patient safety indicators (72%), and patient centeredness indicators (86%). Around 80% of respondents valued theindicators as (very) important and more than 89% of them reported sufficient scientific background for indicators. Data were reported to be availablefor indicators by at least 75% of respondents. Data collection was judged to be feasible by 96%, 89%, and 94% of respondents for organizational,clinical process and outcome indicators respectively. However, the availability of personnel and cost benefit aspects of indicators was judged to besufficient by more than 80% of respondents. In figure 1: OR = Organizational indicators CP = Clinical process indicators CE = Clinical effectivenessindicators PS = Patient safety indicators PC = Patient centeredness indicatorsdoi:10.1371/journal.pone.0086014.g001
Hospital Staff Perspectives on Quality Indicators
PLOS ONE | www.plosone.org 5 January 2014 | Volume 9 | Issue 1 | e86014
Ta
ble
3.
Th
ep
ers
pe
ctiv
es
of
ho
spit
alst
aff
on
org
aniz
atio
nal
ind
icat
ors
(Ob
ligat
ory
and
Vo
lun
tary
).
Ind
ica
tor
Be
do
ccu
pa
ncy
rate
(V)
%(n
)
Le
ng
tho
fst
ay
(V)
%(n
)B
ed
turn
ov
er
(V)
%(n
)
Wa
itti
me
toa
dm
issi
on
(V)
%(n
)
Wa
itti
me
tod
isch
arg
e(V
)%
(n)
OR
eff
icie
ncy
(V)
%(n
)
Em
erg
en
cyro
om
wa
itin
gti
me
(O)
%(n
)
Du
rati
on
of
qu
ali
tya
ssu
ran
cetr
ain
ing
(V)
%(n
)
Ex
iste
nce
of
clin
ica
lg
uid
eli
ne
s(O
)%
(n)
P-v
alu
e
Pe
rsp
ect
ive
Do
yo
uu
seth
isin
dic
ato
r?0
.09
1
No
7(6
)1
0(9
)1
3(1
2)
17
(16
)1
9(1
8)
28
(25
)1
9(1
7)
21
(19
)1
0(9
)
Ye
s8
9(8
3)
88
(82
)7
9(7
1)
74
(69
)7
2(6
7)
54
(49
)7
3(6
7)
64
(58
)8
4(7
7)
Do
n’t
kno
w4
(4)
2(2
)8
(7)
9(8
)9
(8)
18
(16
)9
(8)
15
(14
)7
(6)
Ify
es,
wh
ere
Exte
rnal
asse
ssm
en
t6
1(5
7)
67
(62
)4
7(4
4)
41
(38
)3
8(3
5)
30
(25
34
(32
)3
3(3
1)
44
(41
)
Inte
rnal
Au
dit
52
(48
)4
6(4
3)
40
(37
)4
3(4
0)
39
(36
)2
8(2
6)
39
(36
)3
3(3
1)
47
(44
)
Surp
rise
insp
ect
ion
23
(21
)1
9(1
8)
19
(18
)2
2(2
0)
14
(13
)9
(8)
17
(16
)1
6(1
5)
32
(30
)
Pla
nn
ed
insp
ect
ion
32
(30
)2
4(2
2)
23
(21
)1
8(1
7)
12
(11
)1
3(1
2)
20
(19
)1
8(1
7)
22
(20
)
Pe
er
Re
vie
w2
2(2
0)
22
(20
)1
6(1
5)
16
(15
)1
4(1
3)
15
(14
)1
5(1
4)
18
(17
)2
2(2
0)
Oth
er
4(4
)5
(5)
4(4
)8
(7)
7(6
)2
(2)
2(2
)3
(3)
7(6
)
Do
yo
uth
ink
this
ind
ica
tor
isim
po
rta
nt?
0.0
00
No
tIm
po
rtan
t0
(0)
0(0
)0
(0)
0(0
)0
(0)
0(0
)0
(0)
1(1
)0
(0)
Alit
tle
Imp
ort
ant
1(1
)5
(4)
4(3
)4
(3)
4(3
)8
(5)
0(0
)3
(2)
4(3
)
Mo
de
rate
lyim
po
rtan
t1
6(1
4)
13
(11
)1
7(1
4)
19
(15
)2
2(1
6)
28
(18
)2
0(1
5)
11
(8)
15
(12
)
Imp
ort
ant
38
(34
)4
2(3
7)
31
(25
)3
5(2
7)
32
(24
)4
2(2
7)
31
(23
)3
7(2
7)
33
(27
)
Ve
ryIm
po
rtan
t4
5(4
0)
41
(36
)4
8(3
9)
42
(33
)4
2(3
1)
23
(15
)4
9(3
6)
48
(35
)4
9(4
1)
Do
yo
uth
ink
this
ind
ica
tor
ha
sa
suff
icie
nt
scie
nti
fic
ba
ckg
rou
nd
?0
.04
7
No
5(4
)6
(5)
5(4
)1
1(9
)9
(7)
10
(7)
10
(7)
6(4
)5
(4)
Ye
s9
6(8
5)
94
(83
)9
5(7
9)
89
(71
)9
1(7
1)
90
(60
)9
0(6
6)
94
(67
)9
5(7
7)
Are
the
da
taa
va
ila
ble
for
this
ind
ica
tor?
0.0
45
No
1(1
)2
(2)
2(2
)1
4(1
1)
12
(9)
3(2
)1
4(1
0)
16
(11
)1
2(9
)
Ye
s9
8(8
6)
93
(80
)9
2(7
6)
77
(61
)8
1(6
1)
82
(51
)7
9(5
5)
68
(46
)7
5(5
8)
Do
n’t
kno
w1
(1)
5(4
)6
(5)
9(7
)7
(5)
15
(9)
7(5
)1
6(1
1)
13
(10
)
Isit
fea
sib
leto
coll
ect
the
da
tafo
rth
isin
dic
ato
r?0
.21
6
No
0(0
)0
(0)
4(3
)4
(3)
3(2
)5
(3)
4(3
)7
(5)
10
(8)
Ye
s1
00
(88
)1
00
(87
)9
6(7
9)
96
(74
)9
7(7
3)
96
(64
)9
6(6
7)
93
(66
)9
0(7
2)
Ism
ea
suri
ng
this
ind
ica
tor
be
ne
fici
al
giv
en
the
cost
s?0
.58
5
No
5(4
)4
(3)
9(7
)1
0(8
)4
(3)
12
(8)
10
(7)
12
(8)
13
(10
)
Ye
s9
5(8
2)
97
(83
)9
2(7
5)
90
(71
)9
6(7
4)
88
(58
)9
0(6
5)
88
(61
)8
8(7
0)
Hospital Staff Perspectives on Quality Indicators
PLOS ONE | www.plosone.org 6 January 2014 | Volume 9 | Issue 1 | e86014

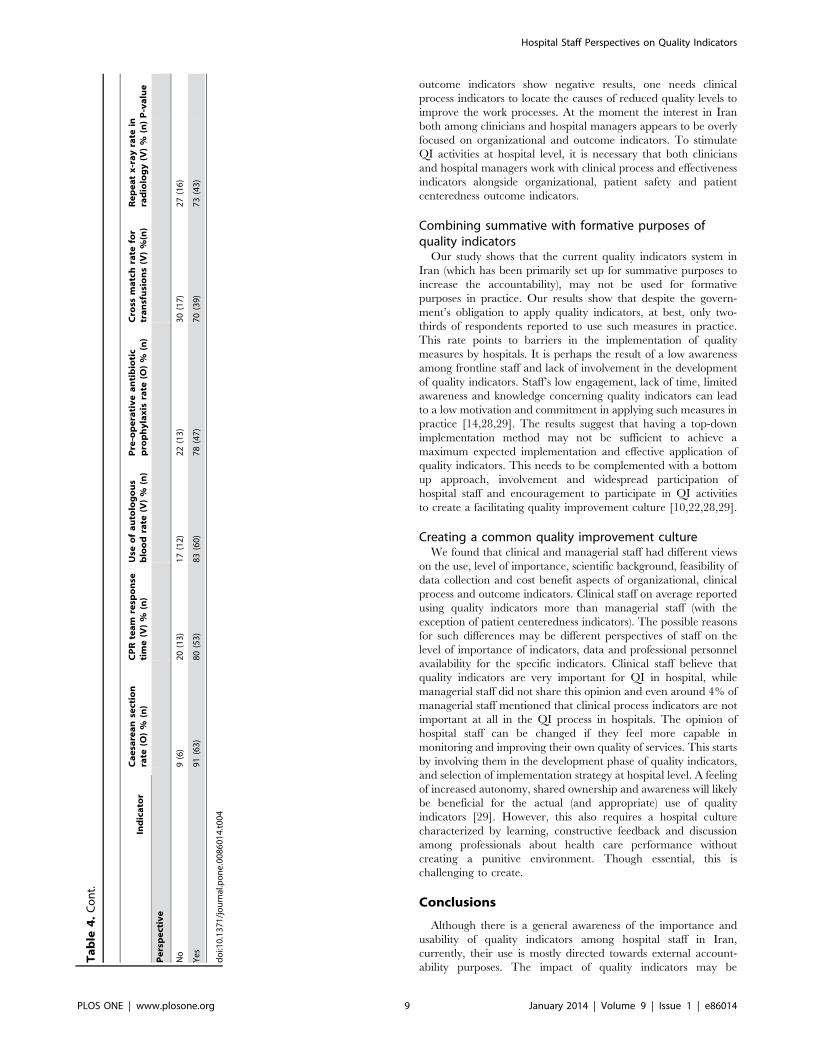
Ensuring availability of dedicated staff for measuringquality indicators
Despite the acknowledgement of the importance and scientific
background of quality indicators, just around two-third of hospital
staff in total reported using quality indicators at practice level in
their hospitals. The overall application rate shows an interest in
the use of quality indicators in Iranian hospitals. However, we
found significant differences between the rate of use in daily
practice and the perceived importance and scientific background
of different quality indicators by hospital staff. The results indicate
a gap between theory and practice in the utilization of quality
indicators by hospital frontline staff. Hospital staff believe that
quality indicators are sufficiently grounded in science and should
play an important role for monitoring quality and quality
improvement (also reported by other studies [26,27]) in hospitals.
However, they experienced a number of problems in the
implementation of quality indicators in practice. The results of
our study show that the availability of dedicated staff for
measuring indicators is one of the major concerns for using
quality indicators from the perspective of hospital frontline staff.
This was also confirmed by related studies in this field [10,16]. For
health care professionals to actually use quality indicators it is
essential to involve hospital staff in the development and
implementation of indicators. Other studies also identified that
the involvement and participation of staff is associated with the
success of quality improvement initiatives and better values of
quality indicators in hospitals [10,28,29].
More attention on clinical process and effectivenessindicators
Our comparison of the overall utilization of different quality
indicators revealed that there is significant difference between
organizational, outcome and clinical process indicators. Although
more than two-thirds of respondents acknowledged using the
organizational and outcome indicators, only around half (57%) of
them reported using the clinical process indicators at their
hospitals. In addition, when looking at the type of outcome
indicators, the results showed that clinical effectiveness indicators
were used significantly less than the patient safety and patient
centeredness indicators. Clinical process and effectiveness indica-
tors seem to provide a current challenge in Iranian hospitals. The
lower application rate of clinical process and effectiveness
indicators in Iranian hospitals can be explained by the insufficient
transparency to staff (including clinicians). Moreover, lower
involvement of staff in the development process and a lack of
awareness of the relevance of clinical process indicators are other
possible factors resulting to a lower implementation rate. Related
studies also identified less utilization of clinical indicators
compared to organizational and outcome indicators in hospitals.
They identified difficulties in developing evidence-based clinical
process and effectiveness indicators and being less transparent to
patients and staff as main barriers in the use of such measures in
hospitals. In addition, they found the fear of punitive measures for
variation in clinical processes and a lack of awareness or familiarity
of staff with quality indicators as other possible problems in the use
of these indicators [13,29,30].
Our study results indicate a limited use of effectiveness
indicators, but also clinical process indicators whose actionability
is important for QI purposes. Where organizational indicators are
helpful to set the right conditions for providing high quality care,
outcome indicators are very attractive for both accountability and
informative purposes. In addition, they can be use to monitor the
achieved levels of quality of care in hospitals. However, when
Ta
ble
3.
Co
nt.
Ind
ica
tor
Be
do
ccu
pa
ncy
rate
(V)
%(n
)
Le
ng
tho
fst
ay
(V)
%(n
)B
ed
turn
ov
er
(V)
%(n
)
Wa
itti
me
toa
dm
issi
on
(V)
%(n
)
Wa
itti
me
tod
isch
arg
e(V
)%
(n)
OR
eff
icie
ncy
(V)
%(n
)
Em
erg
en
cyro
om
wa
itin
gti
me
(O)
%(n
)
Du
rati
on
of
qu
ali
tya
ssu
ran
cetr
ain
ing
(V)
%(n
)
Ex
iste
nce
of
clin
ica
lg
uid
eli
ne
s(O
)%
(n)
P-v
alu
e
Pe
rsp
ect
ive
Are
pro
fess
ion
al
pe
rso
nn
el
av
ail
ab
leto
me
asu
reth
isin
dic
ato
r?0
.00
5
No
5(4
)7
(6)
7(6
)1
7(1
3)
16
(12
)1
6(1
1)
20
(14
)1
7(1
2)
27
(22
)
Ye
s9
5(8
3)
93
(80
)9
3(7
7)
83
(65
)8
4(6
4)
84
(56
)8
0(5
7)
83
(60
)7
3(6
0)
do
i:10
.13
71
/jo
urn
al.p
on
e.0
08
60
14
.t0
03
Hospital Staff Perspectives on Quality Indicators
PLOS ONE | www.plosone.org 7 January 2014 | Volume 9 | Issue 1 | e86014

Ta
ble
4.
Th
ep
ers
pe
ctiv
es
of
ho
spit
alst
aff
on
clin
ical
pro
cess
ind
icat
ors
(Ob
ligat
ory
and
Vo
lun
tary
).
Ind
ica
tor
Ca
esa
rea
nse
ctio
nra
te(O
)%
(n)
CP
Rte
am
resp
on
seti
me
(V)
%(n
)U
seo
fa
uto
log
ou
sb
loo
dra
te(V
)%
(n)
Pre
-op
era
tiv
ea
nti
bio
tic
pro
ph
yla
xis
rate
(O)
%(n
)C
ross
ma
tch
rate
for
tra
nsf
usi
on
s(V
)%
(n)
Re
pe
at
x-r
ay
rate
inra
dio
log
y(V
)%
(n)
P-v
alu
e
Pe
rsp
ect
ive
Do
yo
uu
seth
isin
dic
ato
r?0
.01
0
No
20
(17
)2
4(2
2)
16
(15
)2
5(2
2)
37
(33
)2
4(2
2)
Ye
s6
7(8
3)
55
(82
)7
3(7
1)
53
(69
)3
8(6
7)
58
(53
)
Do
n’t
kno
w1
3(1
1)
21
(19
)1
1(1
0)
23
(20
)2
6(2
3)
19
(17
)
Ify
es,
wh
ere
Exte
rnal
asse
ssm
en
t4
1(3
8)
32
(30
)3
0(2
8)
26
(24
)1
5(1
4)
22
(20
)
Inte
rnal
Au
dit
33
(31
)2
6(2
4)
39
(36
)2
4(2
2)
23
(21
)3
2(3
0)
Surp
rise
insp
ect
ion
15
(14
)1
6(1
5)
25
(23
)9
(8)
8(7
)1
2(1
1)
Pla
nn
ed
insp
ect
ion
19
(18
)1
1(1
0)
16
(15
)1
0(9
)7
(6)
15
(14
)
Pe
er
Re
vie
w1
3(1
2)
11
(10
)1
1(1
0)
14
(13
)8
(7)
20
(19
)
Oth
er
4(4
)4
(4)
4(4
)1
(1)
3(3
)3
(3)
Do
yo
uth
ink
this
ind
ica
tor
isim
po
rta
nt?
0.0
00
No
tIm
po
rtan
t6
(4)
0(0
)0
(0)
2(1
)4
(2)
3(3
)
Alit
tle
Imp
ort
ant
3(2
)3
(2)
1(1
)1
1(7
)1
2(6
)1
0(7
)
Mo
de
rate
lyim
po
rtan
t1
5(1
0)
26
(17
)1
9(1
4)
24
(15
)2
7(1
4)
22
(15
)
Imp
ort
ant
38
(26
)2
9(1
9)
28
(20
)2
3(1
4)
19
(10
)3
1(2
1)
Ve
ryIm
po
rtan
t3
9(2
7)
42
(27
)5
1(3
7)
40
(25
)3
9(2
0)
33
(22
)
Do
yo
uth
ink
this
ind
ica
tor
ha
sa
suff
icie
nt
scie
nti
fic
ba
ckg
rou
nd
?0
.03
5
No
7(5
)8
(5)
7(5
)1
1(7
)9
(5)
6(4
)
Ye
s9
3(6
4)
92
(61
)9
3(6
8)
89
(55
)9
1(5
2)
94
(62
)
Are
the
da
taa
va
ila
ble
for
this
ind
ica
tor?
0.0
04
No
2(1
)7
(5)
13
(9)
17
(10
)1
7(9
)2
4(1
5)
Ye
s9
9(6
6)
71
(49
)7
8(5
4)
72
(42
)6
9(3
7)
60
(38
)
Do
n’t
kno
w0
(0)
22
(15
)9
(6)
10
(6)
15
(8)
16
(10
)
Isit
fea
sib
leto
coll
ect
the
da
tafo
rth
isin
dic
ato
r?0
.14
8
No
3(2
)9
(6)
6(4
)1
1(7
)1
6(9
)2
1(1
3)
Ye
s9
7(6
5)
91
(60
)9
4(6
5)
89
(55
)8
4(4
7)
79
(50
)
Ism
ea
suri
ng
this
ind
ica
tor
be
ne
fici
al
giv
en
the
cost
s?0
.58
4
No
8(5
)1
3(9
)9
(6)
23
(14
)2
4(1
3)
21
(13
)
Ye
s9
2(6
1)
87
(59
)9
2(6
5)
77
(48
)7
6(4
2)
79
(48
)
Are
pro
fess
ion
al
pe
rso
nn
el
av
ail
ab
leto
me
asu
reth
isin
dic
ato
r?0
.00
8
Hospital Staff Perspectives on Quality Indicators
PLOS ONE | www.plosone.org 8 January 2014 | Volume 9 | Issue 1 | e86014
outcome indicators show negative results, one needs clinical
process indicators to locate the causes of reduced quality levels to
improve the work processes. At the moment the interest in Iran
both among clinicians and hospital managers appears to be overly
focused on organizational and outcome indicators. To stimulate
QI activities at hospital level, it is necessary that both clinicians
and hospital managers work with clinical process and effectiveness
indicators alongside organizational, patient safety and patient
centeredness outcome indicators.
Combining summative with formative purposes ofquality indicators
Our study shows that the current quality indicators system in
Iran (which has been primarily set up for summative purposes to
increase the accountability), may not be used for formative
purposes in practice. Our results show that despite the govern-
ment’s obligation to apply quality indicators, at best, only two-
thirds of respondents reported to use such measures in practice.
This rate points to barriers in the implementation of quality
measures by hospitals. It is perhaps the result of a low awareness
among frontline staff and lack of involvement in the development
of quality indicators. Staff’s low engagement, lack of time, limited
awareness and knowledge concerning quality indicators can lead
to a low motivation and commitment in applying such measures in
practice [14,28,29]. The results suggest that having a top-down
implementation method may not be sufficient to achieve a
maximum expected implementation and effective application of
quality indicators. This needs to be complemented with a bottom
up approach, involvement and widespread participation of
hospital staff and encouragement to participate in QI activities
to create a facilitating quality improvement culture [10,22,28,29].
Creating a common quality improvement cultureWe found that clinical and managerial staff had different views
on the use, level of importance, scientific background, feasibility of
data collection and cost benefit aspects of organizational, clinical
process and outcome indicators. Clinical staff on average reported
using quality indicators more than managerial staff (with the
exception of patient centeredness indicators). The possible reasons
for such differences may be different perspectives of staff on the
level of importance of indicators, data and professional personnel
availability for the specific indicators. Clinical staff believe that
quality indicators are very important for QI in hospital, while
managerial staff did not share this opinion and even around 4% of
managerial staff mentioned that clinical process indicators are not
important at all in the QI process in hospitals. The opinion of
hospital staff can be changed if they feel more capable in
monitoring and improving their own quality of services. This starts
by involving them in the development phase of quality indicators,
and selection of implementation strategy at hospital level. A feeling
of increased autonomy, shared ownership and awareness will likely
be beneficial for the actual (and appropriate) use of quality
indicators [29]. However, this also requires a hospital culture
characterized by learning, constructive feedback and discussion
among professionals about health care performance without
creating a punitive environment. Though essential, this is
challenging to create.
Conclusions
Although there is a general awareness of the importance and
usability of quality indicators among hospital staff in Iran,
currently, their use is mostly directed towards external account-
ability purposes. The impact of quality indicators may be
Ta
ble
4.
Co
nt.
Ind
ica
tor
Ca
esa
rea
nse
ctio
nra
te(O
)%
(n)
CP
Rte
am
resp
on
seti
me
(V)
%(n
)U
seo
fa
uto
log
ou
sb
loo
dra
te(V
)%
(n)
Pre
-op
era
tiv
ea
nti
bio
tic
pro
ph
yla
xis
rate
(O)
%(n
)C
ross
ma
tch
rate
for
tra
nsf
usi
on
s(V
)%
(n)
Re
pe
at
x-r
ay
rate
inra
dio
log
y(V
)%
(n)
P-v
alu
e
Pe
rsp
ect
ive
No
9(6
)2
0(1
3)
17
(12
)2
2(1
3)
30
(17
)2
7(1
6)
Ye
s9
1(6
3)
80
(53
)8
3(6
0)
78
(47
)7
0(3
9)
73
(43
)
do
i:10
.13
71
/jo
urn
al.p
on
e.0
08
60
14
.t0
04
Hospital Staff Perspectives on Quality Indicators
PLOS ONE | www.plosone.org 9 January 2014 | Volume 9 | Issue 1 | e86014

Ta
ble
5.
Th
ep
ers
pe
ctiv
es
of
ho
spit
alst
aff
on
ou
tco
me
ind
icat
ors
(re
late
dto
clin
ical
eff
ect
ive
ne
ss,
pat
ien
tsa
fety
and
pat
ien
tce
nte
red
ne
ss;
Ob
ligat
ory
and
Vo
lun
tary
).
Ind
ica
tors
Cli
nic
al
eff
ect
ive
ne
sso
utc
om
ein
dic
ato
rsP
-va
lue
Pa
tie
nt
safe
tyo
utc
om
ein
dic
ato
rsP
-v
alu
e
Pa
tie
nt
cen
tere
dn
ess
ou
tco
me
ind
ica
tors
P-
va
lue
Pe
rsp
ect
ive
Ho
spit
al
mo
rta
lity
rate
(V)
%(n
)
Re
-ad
mis
sio
nra
te(e
xcl
.d
ay
surg
ery
)(V
)%
(n)
Re
-ad
mis
sio
nra
tea
fte
rd
ay
surg
ery
(V)
%(n
)
ICU
re-
ad
mis
sio
nra
te(V
)%
(n)
Bre
ast
fee
din
gra
tea
td
isch
arg
e(V
)%
(n)
Po
st-
op
era
tiv
eco
mp
lica
-ti
on
rate
(V)
%(n
)
Ne
ed
lest
ick
inju
ryra
te(O
)%
(n)
Po
st-
dis
cha
rge
wo
un
din
fect
ion
rate
(V)
%(n
)
Ho
spit
al
acq
uir
ed
infe
ctio
nra
te(O
)%
(n)
Be
d-
sore
rate
(V)
%(n
)
Pa
tie
nt
sati
sfa
ctio
nra
te(O
)%
(n)
Co
mp
lain
tra
te(V
)%
(n)
Do
yo
uu
seth
isin
dic
ato
r?0
.00
10
.01
20
.63
9
No
9(8
)2
1(1
9)
26
(24
)2
5(2
3)
33
(28
)2
1(1
9)
21
(19
)2
4(2
2)
4(4
)1
7(1
5)
9(8
)1
0(9
)
Ye
s9
1(8
5)
63
(58
)5
6(5
1)
55
(50
)5
7(4
8)
71
(64
)6
2(5
7)
60
(55
)9
0(8
4)
75
(68
)8
8(8
2)
84
(78
)
Do
n’t
kno
w0
(0)
16
(15
)1
8(1
6)
20
(18
)1
1(9
)8
(7)
17
(16
)1
5(1
4)
5(5
)9
(8)
3(3
)7
(6)
Ify
es,
wh
ere
Exte
rnal
asse
ssm
en
t6
9(6
4)
33
(31
)3
0(2
8)
25
(23
)2
4(2
2)
34
(32
)3
0(2
8)
29
(27
)6
6(6
1)
31
(29
)5
9(5
5)
46
(43
)
Inte
rnal
Au
dit
50
(46
)3
2(3
0)
24
(22
)2
6(2
4)
31
(29
)3
8(3
5)
32
(30
)3
9(3
6)
61
(57
)4
2(3
9)
52
(48
)5
3(4
9)
Surp
rise
insp
ect
ion
27
(25
)1
4(1
3)
12
(11
)1
3(1
2)
16
(15
)1
6(1
5)
17
(16
)2
2(2
0)
36
(33
)2
3(2
1)
29
(27
)2
8(2
6)
Pla
nn
ed
insp
ect
ion
30
(28
)1
3(1
2)
10
(9)
11
(10
)1
4(1
3)
20
(19
)1
3(1
2)
19
(18
)3
6(3
3)
19
(18
)2
7(2
5)
29
(27
)
Pe
er
Re
vie
w2
2(2
0)
22
(20
)1
5(1
4)
12
(11
)1
6(1
5)
20
(19
)1
1(1
0)
18
(17
)2
7(2
5)
20
(19
)1
9(1
8)
22
(20
)
Oth
er
8(7
)5
(5)
4(4
)7
(6)
3(3
)3
(3)
4(4
)7
(6)
4(4
)3
(3)
3(3
)4
(4)
Do
yo
uth
ink
this
ind
ica
tor
isim
po
rta
nt?
0.0
00
0.0
00
0.2
29
No
tIm
po
rtan
t0
(0)
1(1
)2
(1)
0(0
)3
(2)
0(0
)0
(0)
0(0
)0
(0)
0(0
)0
(0)
0(0
)
Less
Imp
ort
ant
1(1
)4
(3)
6(4
)5
(3)
6(4
)4
(3)
7(5
)8
(5)
2(2
)3
(2)
2(2
)4
(3)
Mo
de
rate
ly1
1(1
0)
11
(8)
22
(14
)2
8(1
7)
20
(13
)1
2(9
)1
3(9
)1
5(1
0)
9(8
)1
5(1
2)
5(4
)1
2(1
0)
Imp
ort
ant
25
(22
)4
1(3
0)
34
(22
)3
1(1
9)
30
(19
)2
9(2
1)
43
(31
)2
8(1
9)
20
(18
)3
0(2
4)
31
(26
)3
3(2
8)
Ve
ryIm
po
rtan
t6
3(5
6)
43
(32
)3
6(2
3)
36
(22
)4
1(2
6)
55
(40
)3
8(2
7)
49
(33
)6
9(6
2)
52
(41
)6
2(5
3)
52
(44
)
Do
yo
uth
ink
this
ind
ica
tor
ha
sa
suff
icie
nt
scie
nti
fic
ba
ckg
rou
nd
?
0.3
36
0.0
57
0.2
99
No
1(1
)6
(4)
5(3
)3
(2)
5(3
)6
(4)
9(6
)9
(6)
0(0
)9
(7)
7(6
)1
4(1
2)
Ye
s9
9(8
9)
95
(69
)9
5(6
1)
97
(61
)9
6(6
3)
94
(67
)9
2(6
5)
91
(61
)1
00
(91
)9
1(7
2)
93
(78
)8
6(7
3)
Are
the
da
taa
va
ila
ble
for
this
ind
ica
tor?
0.0
29
0.0
01
0.0
32
No
3(3
)1
0(7
)8
(5)
10
(6)
9(6
)1
0(7
)1
3(9
)1
5(1
0)
8(7
)9
(7)
12
(10
)7
(6)
Ye
s9
7(8
5)
78
(57
)7
9(5
0)
78
(49
)7
4(4
8)
75
(53
)7
1(5
1)
70
(46
)8
2(7
3)
83
(64
)7
6(6
4)
81
(67
)
Do
n’t
kno
w0
(0)
12
(9)
13
(8)
13
(8)
17
(11
)1
6(1
1)
17
(12
)1
5(1
0)
10
(9)
8(6
)1
2(1
0)
12
(10
)
Isit
fea
sib
leto
coll
ect
the
da
tafo
rth
isin
dic
ato
r?
0.8
01
0.0
40
0.1
06
No
0(0
)8
(6)
3(2
)3
(2)
5(3
)7
(5)
9(6
)1
5(1
0)
9(8
)4
(3)
4(3
)6
(5)
Hospital Staff Perspectives on Quality Indicators
PLOS ONE | www.plosone.org 10 January 2014 | Volume 9 | Issue 1 | e86014

Ta
ble
5.
Co
nt.
Ind
ica
tors
Cli
nic
al
eff
ect
ive
ne
sso
utc
om
ein
dic
ato
rsP
-va
lue
Pa
tie
nt
safe
tyo
utc
om
ein
dic
ato
rsP
-v
alu
e
Pa
tie
nt
cen
tere
dn
ess
ou
tco
me
ind
ica
tors
P-
va
lue
Pe
rsp
ect
ive
Ho
spit
al
mo
rta
lity
rate
(V)
%(n
)
Re
-ad
mis
sio
nra
te(e
xcl
.d
ay
surg
ery
)(V
)%
(n)
Re
-ad
mis
sio
nra
tea
fte
rd
ay
surg
ery
(V)
%(n
)
ICU
re-
ad
mis
sio
nra
te(V
)%
(n)
Bre
ast
fee
din
gra
tea
td
isch
arg
e(V
)%
(n)
Po
st-
op
era
tiv
eco
mp
lica
-ti
on
rate
(V)
%(n
)
Ne
ed
lest
ick
inju
ryra
te(O
)%
(n)
Po
st-
dis
cha
rge
wo
un
din
fect
ion
rate
(V)
%(n
)
Ho
spit
al
acq
uir
ed
infe
ctio
nra
te(O
)%
(n)
Be
d-
sore
rate
(V)
%(n
)
Pa
tie
nt
sati
sfa
ctio
nra
te(O
)%
(n)
Co
mp
lain
tra
te(V
)%
(n)
Ye
s1
00
(89
)9
2(6
7)
97
(61
)9
7(6
1)
95
(62
)9
3(6
5)
92
(65
)8
5(5
7)
91
(81
)9
6(7
2)
96
(80
)9
4(7
9)
Ism
ea
suri
ng
this
ind
ica
tor
be
ne
fici
al
giv
en
the
cost
s?
0.2
60
0.0
57
No
1(1
)8
(6)
7(4
)1
3(8
)1
1(7
)1
3(9
)8
(6)
17
(11
)9
(8)
11
(8)
7(6
)1
2(1
0)
Ye
s9
9(8
8)
92
(66
)9
4(5
8)
87
(54
)8
9(5
7)
87
(62
)9
2(6
6)
83
(55
)9
1(8
2)
90
(68
)9
3(7
7)
88
(74
)
Are
pro
fess
ion
al
pe
rso
nn
el
av
ail
ab
leto
me
asu
reth
isin
dic
ato
r?
0.0
01
0.0
06
0.0
28
No
1(1
)2
9(2
1)
25
(16
)2
1(1
3)
12
(8)
22
(15
)1
3(9
)2
4(1
6)
12
(11
)1
2(9
)1
6(1
3)
19
(16
)
Ye
s9
9(8
7)
71
(51
)7
5(4
7)
79
(50
)8
8(5
9)
78
(54
)8
7(6
2)
76
(50
)8
8(8
0)
88
(67
)8
5(7
1)
81
(69
)
do
i:10
.13
71
/jo
urn
al.p
on
e.0
08
60
14
.t0
05
Hospital Staff Perspectives on Quality Indicators
PLOS ONE | www.plosone.org 11 January 2014 | Volume 9 | Issue 1 | e86014

Figure 2. The perspectives of managerial, clinical and other staff on organizational, clinical process, and outcome qualityindicators. Figure 2 shows that clinical staff reported significantly higher utilization rates than managerial staff, i.e.: organizational indicators (80%versus 71%), clinical process indicators (64% versus 51%), clinical effectiveness indicators (75% versus 58%) and patient safety indicators (81% versus66%). Both groups reported more or less equal use of patient centeredness indicators. There were about equally large (significant) differences amongmanagerial and clinical staff in the level of perceived importance of indicators. However, both groups rated organizational and clinical outcomeindicators as most important. Both clinical and managerial staff rated the scientific background of all indicators relatively high. Clinical staff rated dataavailability for the organizational, clinical process, and outcome indicators significantly higher than managerial staff..Professional personnel formeasuring organizational, clinical process and outcome indicators were thought to be available by 90%, 87% and 90% of clinical staff versus 84%,74% and 80% by managerial staff. In figure(s) 2: M = Managerial staff C = Clinical staff O = Other staffdoi:10.1371/journal.pone.0086014.g002
Hospital Staff Perspectives on Quality Indicators
PLOS ONE | www.plosone.org 12 January 2014 | Volume 9 | Issue 1 | e86014
increased by extending the use of clinical process and effectiveness
indicators in addition to organizational, patient safety and patient
centeredness outcome indicators. It is important to explore options
for increasing the formative use of quality indicators to support
internal quality improvement processes at hospital level. For this,
the indicators will need to become part of the working methods of
hospital staff to create a culture and feeling of shared ownership
for the quality indicator system.
Acknowledgments
The authors are grateful for the experts that participated in the expert
panel process. Gratitude goes to Dr. Jila Manoochehri for facilitating the
data collection for this study. The authors would also like to thank
Professor Dr. Karien Stronks for supporting this research project at the
Department of Social Medicine, Academic Medical Center (AMC) -
University of Amsterdam.
Author Contributions
Conceived and designed the experiments: AAH NSK. Performed the
experiments: AAH HR NSK DSK SRA. Analyzed the data: AAH NSK
DSK UCO CF. Contributed reagents/materials/analysis tools: AAH NSK
HR SRA UCO. Wrote the paper: AAH NSK DSK.
References
1. Hospital Quality Alliance (2011) Website of the Hospital Quality Alliance.
Available: http://www.hospitalqualityalliance.org/hospitalqualityalliance/qualitymeasures/qualitymeasures.html. Accessed 2011 Jul 20.
2. Klazinga N, Fischer C, Ten Absroek A (2011) Health services research related toperformance indicators and benchmarking in Europe, J Health Serv Res Policy
16 Suppl 2.
3. De Vos M, Graafmans W, Kooistra M, Meijboom B, Van Der Voort P, et al.(2009) Using quality indicators to improve hospital care: a review of the
literature. International Journal for Quality in Health Care 21:119–29.4. Mattke S (2004) Monitoring and improving the technical quality of medical care:
A new challenge for policymakers in OECD Countries. In: Towards high
performing health systems. Policy Studies. Paris: OECD.5. Berg M, Meijeerink Y, Gras M, Goossensen A, Schellekens W, et al. (2005)
Feasibility first: developing public performance indicators on patient safety andclinical effectiveness for Dutch hospitals. Health Policy 75:59–73.
6. Delnoij DM, Westert G (2012) Assessing the validity of quality indicators: keepthe context in mind! European Journal of Public Health 22: 452–3.
7. Donabedian A (1980) Explorations in Quality Assessment and Monitoring: The
Definition of Quality and Approaches to Its Assessment. Michigan: HealthAdministration Press.
8. Mainz J (2003) Defining and classifying clinical indicators for qualityimprovement, International Journal for Quality in Health Care 15: 523–530.
9. Øvretveit J (2001) Quality evaluation and indicator comparison in health care,
International Journal of Health Planning and Management 16: 229–241.10. Weiner BJ, Alexander JA, Shortell SM, Baker LC, Becker M, et al. (2006)
Quality improvement implementation and hospital performance on qualityindicators. Health Services Research 41: 307–334.
11. Shortell SM, Bennett CL, Byck GR (1998) Assessing the impact of continuous
quality improvement on clinical practice: What it will take to accelerate progress.Milbank Quarterly 76: 593–624, 510.
12. Agency for Healthcare Research and Quality (AHRQ) (2012) Evaluation of theUse of AHRQ and Other Quality Indicators. Available: http://www.ahrq.gov/
about/evaluations/qualityindicators/qualindch1.htm. Accessed 2012 Jul 15.13. De Vos MLG, Van der Veer SN, Graafmans WC, De Keizer NF, Jager KJ,
et al. (2010) Implementing quality indicators in intensive care units: exploring
barriers to and facilitators of behaviour change. Implementation Science 5:52,doi:10.1186/1748-5908-5-52.
14. Cabana MD, Rand CS, Powe NR, Wu AW, Wilson MH, et al. (1999) Whydon’t physicians follow clinical practice guidelines? A framework for improve-
ment. The Journal of the American Medical Association 282: 1458–1465.
15. Wardhani V, Utarini A, Van Dijk JP, Post D, Groothoof JW (2009)Determi-Determinants of quality management systems implementation in hospitals.
Health Policy 89: 239–251.
16. O’Brien JL, Shortell SM, Hughes EF, Foster RW, Carman JM, et al. (1995) An
integrative model for organization-wide quality improvement: lessons from the
field. Quality Management in Health Care 3: 19–30.
17. Beata K, Mattias E, Jan L (2005) Design and implementation of a performance
measurement system in Swedish health care services. A multiple case study of 6
development teams. Quality Management in Health Care 14: 95–111.
18. Bourne M, Neely A, Platts K, Mills J (2002) The success and failure of
performance measurement initiatives: Perceptions of participating managers.
International Journal of Operations & Production Management 22: 1288–1310.
19. Canadian Ministry of Health (2011) Quality Improvement Plan Guidance
Document. Available: http://www.health.gov.on.ca/en/ms/ecfa/pro/updates/
qualityimprov/qip_guide.pdf. Accessed 2011 Jul 21.
20. Gustafson D (1997) Case studies from the quality improvement support system.
Rockville, MD: Agency for Health Care Policy and Research.
21. MOHME, Vice-chancellor for Treatment, Department of Hospitals Evaluation
(2002) Hospital Quality Evaluation Instruction.
22. Aryankhesal A, Sheldon TA, Mannion R (2012) Role of pay-for-performance in
a hospital performance measurement system: a multiple case study in Iran.
Health Policy and Planning 1–9: doi:10.1093/heapol/czs055.
23. MOHME, Vice-chancellor for Treatment, Department of Hospitals Evaluation
(1996) Instruction for standards & evaluation of general hospitals [in Farsi].
24. World Health Organization (2007) Performance Assessment Tool for Quality
Improvement in Health Care. Copenhagen: WHO Regional Office for Europe.
25. Arah OA, Westert GP, Hurst J, Klazinga NS (2006) A conceptual framework for
the OECD Health Care Quality Indicators Project. International Journal for
Quality in Health Care 18 (Suppl 1): 5–13.
26. Shaller D (2004) Implementing and Using Quality Measures for Children’s
Health Care: Perspectives on the State of the Practice. Pediatrics 113 (Suppl 1):
217–27.
27. Jha AK (2006) Measuring hospital quality, what physicians do? How patients
fare? Or both? JAMA 296: 95–97.
28. Blumenthal D, Edwards JN (1995) Involving physicians in Total Quality
Management: results of a study. In: Blumenthal D, Sheck AC, editors.
Improving Clinical Practice: Total Quality Management and the Physician.San
San Francisco: Jossey-Bass; pp. 229–66.
29. Shortell SM (1995) Physician involvement in quality improvement: issues,
challenges, and recommendations. In: Blumenthal D, Sheck AC, editors.
Improving Clinical Practice: Total Quality Management and the Physician.San
Francisco: Jossey-Bass; pp. 207–17.
30. Peterson ED, Roe MT, Mulgund J, DeLong ER, Lytle BL, et al. (2006)
Association between hospital process performance and outcomes among patients
with acute coronary syndromes. JAMA 296: 1912–1920.
Hospital Staff Perspectives on Quality Indicators
PLOS ONE | www.plosone.org 13 January 2014 | Volume 9 | Issue 1 | e86014
Copyright © 2022 FDOKUMEN

