


Bahasa
Halaman
Hukum


HAL Id: tel-02896406https://tel.archives-ouvertes.fr/tel-02896406
Submitted on 10 Jul 2020
HAL is a multi-disciplinary open accessarchive for the deposit and dissemination of sci-entific research documents, whether they are pub-lished or not. The documents may come fromteaching and research institutions in France orabroad, or from public or private research centers.
L’archive ouverte pluridisciplinaire HAL, estdestinée au dépôt et à la diffusion de documentsscientifiques de niveau recherche, publiés ou non,émanant des établissements d’enseignement et derecherche français ou étrangers, des laboratoirespublics ou privés.
Environmental impacts of current and past petroleumactivities on water quality in Ecuador
Fausto Lopez Medina
To cite this version:Fausto Lopez Medina. Environmental impacts of current and past petroleum activities on waterquality in Ecuador. Hydrology. Université Paul Sabatier - Toulouse III, 2019. English. �NNT :2019TOU30063�. �tel-02896406�


This thesis is dedicated to my father,
…for his words of wisdom, which I discover more certain as my years go by


Acknowledgments
i
Acknowledgments
It's very real the phrase “Choose well who inspires you, and see what they have done with their
lives». I’d like to thank those compatriots who inspired me to continue every day in this
adventure, although these words would never reach their ears: to Inty Gronneberg, Glenda
Morejon, and in my village, to Roberto Guachi for being my main motivation.
My thanks to Laurence Maurice, my thesis director, for all her immense support and for giving
me the great opportunity to meet many wonderful people in France; great researchers,
technicians, friends, and colleagues who always helped me; in particular, Karyn Lemenach and
Hélène Budzinsky (EPOC), Laure Laffont, Sylvana Goix, and Eva Schreck (GET); Remi Freydier
and Léa (Montpellier); Frederic Jullien (ECOLAB), and Emilie Lerigoleur (GEODE); my
acknowledgements to them for teaching me most of the really useful aspects in Research field,
showing me that the things are not as much difficult as others say.
A huge “merci” to all the technicians: Phillipe, Stephanie and Carole (Salle de Chimie);
Jonathan Prunier and Manuel Henry (Salle Blanche); Frederic, Stephane and Christelle (ICP-
MS) every datum in my manuscript has been produced thanks to your diligent labour.
To the great fieldwork team: Jonathan, Gisselle Pazmiño, Daniela Racines, Fiorella (my
officemate), Thibaut, Martín, Sylvia, Valeria and Martine for all your help. Most of the samples
arrived OK, thanks to you.
To Dr. Jeny Ruales for being my mentor, to Dr. Cuong Ha Minh for helping me enormously
with the problems of software and graphic editing; and to Etienne Gondet for its kindness and
for the ateliers de l’OMP. My eternal gratefulness to them for teaching many useful tools and
for their immense support.
To Michel, even if he never understood what I was doing, he always motivated me: Thank you
very much for feeding me the nights I thought I would not eat, and for picking me up from the
labo even after midnight to force me to sleep at least few hours every night; but often with
the phrases:“Ça a l’air aride ce que tu fais sur l’écran même si ça parle de l’eau” and “Tu ne
dors pas assez et tu es toujours excité pour aller au labo”.
To my parents, for their silent and unconditional support. I have always wanted to transcribe
down my dad’s words written for my high school graduation; I’ve re-read them each time I
felt disappointed and discouraged. I’d like to keep them forever here, in my Thesis:
“El objetivo de aprender es entender porque las máquinas y las personas funcionan como lo hacen; cuando entiendas lo primero te sorprenderás de lo fascinante de las soluciones dadas a grandes problemas, entendiendo lo segundo te responderás porqué aún subsisten problemas enormes con

Acknowledgments
ii
soluciones relativamente simples. Entendiendo los dos, conocerás el mundo. Y verás porque aquellos que alimentan al mundo son minimizados y aquellos que usan discursos elocuentes para manipular a sus semejantes se dicen superiores. Verás que una sonrisa no necesariamente es de amistad ni de acogida. Entenderás porqué consideramos siempre más verde el prado ajeno y verás que sólo es un espejismo, y entenderás que la gente que sabe más de biología no necesariamente sabe más de humanidad, y descubrirás con asombro que los derechos humanos son relativos y no absolutos. Aprenderás que no todas las formas de violencia y dominio están necesariamente ligadas a las armas ni a los golpes, que las protestas y revoluciones, también se hacen sin fuego y sin palabras. Que para muchos tener una religión y para otros no tenerla, es sólo cliché social para decirse buenos o más letrados; encontrarás verdades en lo que muchos decían ser falso... y falsedades en lo que se grita como verdad. Descubrirás que quien viaja contigo o te habla de amistad no es que sea un compañero ni un amigo, de ésos cuídate! Quien te habla de salud puede ser que esté muriendo...y no por eso siente que su vida se termina! Quien dice saber,.. talvez ignora más que tú….y verás que las almas pobres son las que se piensan superiores y alimentan su sentido de grandeza subrayando y poniendo en evidencia los defectos y los errores de los otros... y descubrirás con asombro y hasta con repudio como la ambición, los prejuicios y el ego hablan más fuerte que los libros...y aunque hablarás de Tesla, de Gandhi, de Einstein, de Luther King; y aunque recordarás a Fernando Daquilema, Dolores Cacuango, Matilde Hidalgo, José Rodríguez Labandera... también deberás conocer y te verás obligado por deber moral a no olvidar a Edison, Hitler ni Hopenheimer. Pero sobre todo, deberás entender y ver que nada se termina hasta que tú lo decidas, así que continua siempre….”
To my siblings; Vini, Edu, Marti and Bolo, for changing their living plans because of me, thanks
bros; to my Little Mary, you grew up so fast, and I was not with you; and to little Xavi, I knew
you suffered so much after my departure, I’m really sorry; I missed you so much during this
time.
To my friends in my little country (Ecuador): Huguito, Pieri, Santi, Wilo, La Gabi y Fer por los
whatsapps de risotada y sobretodo por esta amistad a distancia que ha podido superar el paso
del tiempo.
To friends I knew in this nice country (France): Joëlle Youego, Janeth Sanabria and Quqin Yuan,
I’ll miss you girls, your friendship was really important to me. To Mr. Delboy for helping me to
discover the magic in France (you are great). To Dr. Cordier in Bordeaux for the therapy against
burn out. And to Mr. Chapuis for sharing its apartment with me during my last months in
France.
In the next lines more than a scientific work, an adventure…. a long adventure that has
witnessed many changes in my life. Enjoy it!

Résumé
iii
Résumé (FR)
L’activité pétrolière en Équateur pose le problème des conditions indispensables au
développement durable du pays dont une partie repose sur l'exploitation des géoressources
tout en préservant l’environnement et le bien-être des populations sans compromettre les
conditions de vie des générations futures, ni la biodiversité. L’Équateur est le 4ème
producteur de pétrole en Amérique du Sud et un des pays possédant la plus grande
biodiversité.
Ce travail de thèse s’insère dans le cadre du programme MONOIL (ANR 2014-2018) dont
l’objectif principal est d’améliorer la compréhension et le suivi des impacts de l'exploitation
pétrolière sur l'environnement et la société, en termes de dommages et de vulnérabilités.
Plusieurs campagnes d’échantillonnage d’eaux (de pluie, de surface et souterraine) et de
sédiments ont été réalisées dans des bassins versants situés dans des zones d’exploitation
pétrolière (Amazonie) et de raffinage (côte Pacifique); pour contrôle, d’autres prélèvements
ont été effectués en amont de ces zones exploitées ainsi qu’en aval, jusqu’à la frontière
péruvienne.
Des HAPs (hydrocarbures aromatiques polycycliques) et BTEX (benzène, toluène,
éthylbenzène et xylènes) ont été analysés par Gas Chromatography Mass Spectrometry (GC-
MS), des métaux associés aux activités pétrolières (Ni, V, Cd, As, Mn, Pb) ont été déterminées
par Inductively Coupled Plasma Mass Spectrometry (ICP-MS); la spectrométrie de
fluorescence atomique (AFS) a été utilisée pour le Hg. Un comptage microbiologique et une
analyse sociale ont été réalisés. Le logiciel ©Rstudio 3.5.1 a été utilisé pour l'analyse
statistique (normalité, corrélation, analyse en composantes principales-PCA et analyse de
cluster hiérarchique-HCA). Des valeurs toxicologiques de référence (TRV) ont été utilisées afin
de déterminer la qualité environnementale et celle de l’eau de consommation, ainsi que le
HCA et le PCA pour tracer les sources de contamination. Une évaluation des risques pour la
santé humaine par ingestion et contact dermique a été effectuée sur les sources d'eau
potable.
Les résultats montrent que les eaux de surface des bassins versants présentent des niveaux
de HAPs en conformité avec les TRV et sont caractérisées par des molécules organiques de
faible masse molaire. Les alkyl-naphtalènes représentent 70 à 96 % de la charge aromatique
totale dissoute dans 90 % des échantillons. Les molécules alkylées représentent plus de 50%
de la charge aromatique total (TAC) dans 91% des sédiments.

Résumé
iv
Le traçage des sources indique que le diméthyl et le triméthyl-phénanthrène ainsi que le
méthyl-chrysène caractérisent la TAC. Sur la côte Pacifique, les effluents de la raffinerie
montrent une nature similaire aux fosses de déchets non restaurés. Les sédiments des rivières
Napo et Aguarico dans la zone d'exploitation pétrolière présentent certaines valeurs de HAPs
correspondant à une empreinte similaire à celle des sables bitumineux et de certaines fosses
de déchets pétroliers.
Dans l'eau de consommation des populations locales, les concentrations d'ions majeurs,
d’éléments trace, de HAPs et de BTEX sont conformes aux recommandations nationales et
internationales, sauf pour le Mn, le Zn et l'Al. Les concentrations de toluène analysées dans
des puits profonds près des camps pétroliers étaient plus élevées que le fond naturel.
L'analyse microbiologique a révélé un niveau élevé de coliformes représentant des risques
importants pour la santé.
L'évaluation des risques sanitaires a montré que l'ingestion représente 99 % des voies
d'exposition aux éléments cancérigènes et non cancérigènes chez les adultes et les enfants,
tandis que 20 à 49 % de l'index de risque sanitaire est causé par l'arsenic. Cependant, l'indice
de risque sanitaire (HI) indique des effets chroniques acceptables. La plupart (72 %) des
familles interrogées connaissent les risques sanitaires, cependant un écart a été observé entre
leurs connaissances et leurs actions pour faire face à ces risques.

Abstract
v
Abstract (EN)
Oil industry activities in Ecuador face up the problem of necessary conditions for a sustainable
development that permits the exploitation of resources and preserves the environment and
the wellbeing of people, without compromising the living conditions of future generations, or
the biodiversity. Ecuador is the 4th largest oil producer in South America, and the country with
the highest biodiversity.
This thesis work is part of the MONOIL program (ANR 2014-2018) which main objective is to
improve the understanding and monitoring of oil impacts on society and environment in terms
of damage and vulnerabilities.
Several water (rain, surface and underground) and sediment sampling campaigns were
conducted in dry and wet seasons in watersheds located in oil-extracting (Amazon) and
refining (Pacific coast) areas; for control, other samples were taken upstream of these
exploited areas as well as downstream until the Peruvian border.
Analyses of PAHs (polycyclic aromatic hydrocarbons) and BTEX (benzene, toluene,
ethylbenzene and xylenes) as well as heavy metals associated with oil activities (Ni, V, Cd, As,
Mn, Pb and Hg) were carried out. PAHs were analyzed by Gas Chromatography Mass
Spectrometry (GC-MS); Atomic fluorescence spectrometry (AFS) was used for Hg analyses
while other heavy metals were analyzed by Inductively Coupled Plasma Mass Spectrometry
(ICP-MS). Carbon, Sulphur and sediment particle size were determined; a microbiological
count and social analysis were applied.
The software ©Rstudio 3.5.1 was used for the statistical analysis; various tests (normality,
correlation, principal component analysis-PCA and hierarchical cluster analysis-HCA) were
performed. Toxicological reference values (TRVs) were used to determine the environmental
and drinking-water quality, as well as HCA and PCA were used to trace sources of
contamination. A human health risk assessment by ingestion and dermal contact was
conducted on drinking water sources.
The results show that the studied watersheds have PAH levels in compliance with TRVs and
that the aquatic environment is characterized by molecules of low molecular weight. Alkyl-
naphthalenes accounted for 70 to 96% of the total dissolved aromatic load in 90% of the
samples. Alkylated molecules represent more than 50% of the total aromatic charge (TAC) in
91% of sediments.
Source tracing indicates that dimethyl and trimethylphenanthrene as well as methyl-chrysene

Abstract
vi
characterize the TAC. On the Pacific coast, the refinery effluent showed a similar nature to
ancient-oil waste pools. The Napo and Aguarico River basins had points with a fingerprint
similar to the oil sands and waste pits, with only two points related to crude oil.
In drinking water; the concentrations of major ions, trace elements, PAHs and BTEX were in
compliance with national and international guidelines, except for Mn, Zn and Al. Toluene
concentrations from deep wells near oil camps were higher than the natural background.
Microbiological analysis revealed a high level of coliforms representing significant health risks.
Human health risk assessment showed that ingestion represents 99% exposure to carcinogens
and non-carcinogens (e. g. zinc) in adults and children, while 20-49% of THI was caused by
arsenic. The hazard index (HI) indicates acceptable chronic effects. Most (72%) of interviewed
families knew sanitary risks, but a discrepancy was observed between knowledge and action.

Resúmen
vii
Resúmen (ES)
La actividad petrolera en Ecuador plantea la el problema de las condiciones adecuadas para
un desarrollo sostenible que permita la explotación de recursos con una adecuada
preservación del medio y el bienestar de las poblaciones, sin comprometer las condiciones de
vida de las generaciones futuras ni la biodiversidad. Ecuador es el cuarto mayor productor de
petróleo de Sudamérica y el país con mayor biodiversidad.
Este trabajo de tesis se enmarca dentro del programa MONOIL (ANR 2014-2018) cuyo objetivo
principal es mejorar la comprensión y el seguimiento de los impactos de la industria petrolera
en la sociedad y el medio ambiente en términos de daños y vulnerabilidad.
Se realizaron varias campañas de muestreo de aguas (pluviales, superficiales y subterráneas)
y sedimentos en cuencas de captación ubicadas en áreas petroleras (Amazonas) y de
refinación (costa del Pacífico); para fines de control, se tomaron otras muestras aguas arriba
de estas áreas explotadas, así como aguas abajo hasta la frontera con Perú.
Se realizaron análisis de HAPs (hidrocarburos aromáticos policíclicos) y BTEX (benceno,
tolueno, etilbenceno y xilenos), así como de metales pesados asociados a actividades
petroleras (Ni, V, Cd, As, Mn, Pb y Hg). Los HAPs se analizaron mediante espectrometría de
masas-cromatografía de gases (GC-MS). Se utilizó la espectrometría de fluorescencia atómica
para los análisis de Hg, mientras que los otros metales pesados se analizaron mediante ICP-
MS (espectrometría de masas- plasma de acoplamiento inductivo). Se determinaron el
carbono, azufre y la granulometría de sedimentos. También se realizaron un recuento
microbiológico y un análisis social.
Para el análisis estadístico se utilizó el software ©Rstudio 3.5.1. Se realizaron varias pruebas
(normalidad, correlación, análisis de componentes principales-PCA y análisis de
conglomerados-HCA). Se utilizaron valores toxicológicos de referencia (TRVs) para determinar
la calidad ambiental y la calidad del agua potable, así como HCA y PCA para rastrear las fuentes
de contaminación. Se realizó una evaluación del riesgo para la salud humana por ingestión y
contacto dérmico en fuentes de agua potable.
Los resultados muestran que las cuencas hidrográficas tienen niveles de HAP que cumplen con
los TRVs y que el medio acuático se caracteriza por moléculas de bajo peso molecular. Los
alquilnaftalenos representaron entre el 70 y el 96% de la carga aromática total disuelta en el
90% de las muestras. Las moléculas alquiladas representan más del 50% de la carga aromática
total (TAC) en el 91% de los sedimentos.

Resúmen
viii
El análisis de las fuentes de HAPs indica que el di y trimetilfenantreno, así como el
metilcriseno, caracterizan la TAC. En la costa del Pacífico, el efluente de la refinería mostró
una naturaleza similar a la de los pozos de desechos no reparados. Las cuencas de los ríos
Napo y Aguarico mostraron sitios con una huella similar a las arenas bituminosas y los
residuos una piscina desechos, y sólo dos puntos mostraron conexión con el petróleo crudo.
En el agua potable, las concentraciones de los principales iones, elementos trazas, HAP y BTEX
cumplen las directrices nacionales e internacionales, excepto en el caso de Mn, Zn y Al. Las
concentraciones de tolueno de los pozos profundos cerca de los campos petroleros fueron
más altas que las del fondo natural. Los análisis microbiológicos revelaron un alto nivel de
coliformes que representa riesgos significativos para la salud.
La evaluación de riesgos para la salud mostró que la ingestión representa el 99% de la
exposición a agentes carcinógenos y no carcinógenos (por ejemplo, el zinc) en adultos y niños,
mientras que el 20-49% del THI fue causado por el arsénico. El índice de peligrosidad (HI) indica
efectos crónicos aceptables. La mayoría (72%) de las familias encuestadas eran conscientes
de los riesgos para la salud, pero se observó una discrepancia entre el conocimiento y la
acción.

Abbreviations
ix
Abbreviations
A: Anthracene Ac: Acenaphthylene Ace: Acenaphthene AG: 5 de Agosto BaA: Benzo[a]anthracene BaP: benzo(a)pyrene BaP: Benzo[a]pyrene BB: Bomboiza BbjkF: Benzo[bjk]fluoranthene BeP: Benzo[e]pyrene BPe: Benzo[ghi]perylene BTEX: Benzene, toluene, ethylbenzene, xylenes CC: Carlos Concha CFU: Colony-forming Units Ch: Chrysene+Triphenylene DBA: Dibenzo[ah]anthracene DBT: Dibenzothiophene DU: Dureno DY: Dayuma EF: Enrichment Factor ERL: Effect Range Low ERM: Effect Range Median Fa: Fluoranthene Fl: Fluorene GC-MS: Gas Chromatography–Mass Spectrometry HCA: Hierarchical Cluster Analysis HIing: Ingestion Hazard Index HI: Hazard Index HMW: High Molecular Weight HRA: Health Risk Assessment (i): Interferences ICP-MS: Induced Coupled Plasma-Mass Spectrometry IP: Indeno[123-cd]pyrene JS: Joya de los Sachas LD:Limit of Detection LI: Limoncocha LM: Lumbaqui LMW: Low Molecular Weight LOEL: Lowest Observed Effect Level LQ: Limit of Quantification MA: 2-Methylanthracene MAE: Ecuadorian Ministry of the Environment MCh: ΣMethylchrysene MDBT: Methyldibenzothiophene MPhMA: 1Methylanthracene+[9,4]Methylphenanthrene+[45]Methylenephenanthrene mSQGQ: Mean-SQG-Quotient N : Naphthalene NEAR: Northern Ecuadorian Amazon Region

Abbreviations
x
NEPC: Northern Ecuadorian Pacific Coast NOEL: No Observed Effect Level NR: Nuevo Rocafuerte PAHs: Polycyclic Aromatic Hydrocarbons PCA: Principal Component Analysis PEL: Probable Effect Level Ph: Phenanthrene PK: Pacayacu PN: Puerto Napo PO: Puerto Francisco de Orellana Py: Pyrene RAOHE: Reglamento Ambiental de las Operaciones hidrocarburiferas del Ecuador REE: Esmeraldas Refinery S: Santiago SC: San Sebastian del Coca SEAR: Southern Ecuadorian Amazon Region SEPC: Southern Ecuadorian Pacific Coast SF: Shushufindi SJ: San José SOTE: Sistema de Oleoducto Transecuatoriano (Trans-Ecuadorian Oil Pipeline System) SQG: Sediment Quality Guidelines SR: San Roque TAC: Total Aromatic Charge TEF: Toxic Equivalent Factor TEL: Threshold Effect Level TEQ: Toxic Equivalent Quantity THI: Total Hazard Index TI: Tiputini TM: Trace metal(oid)s TOC: Total Organic Carbon TRV: Toxicity Reference Values TU: Toxic Units TUA: Toxic Units Accumulated TULSMA: Texto Unico de Legislación Secundaria del Ministerio del Ambiente US EPA: Unites States Environmental Protection Agency VL: Vuelta Larga WHO: World Health Organization WQG: Water Quality Guidelines 1MN: 1-Methylnaphthalene 1MPh: 1-Methylphenanthrene 1-OHP: 1-hydroxypyrene 2MN: 2-Methylnaphthalene 2MPh: 2-Methylphenanthrene 3MPh: 3-Methylphenanthrene ∑DMPh: Sum of dimethylphenanthrene ∑TMPh: Sum of trimethylphenanthrene

Table of contents
xi
Table of contents
Acknowledgments ............................................................................................................................... i
Résumé (FR) ...................................................................................................................................... iii
Abstract (EN) ...................................................................................................................................... v
Resúmen (ES).................................................................................................................................... vii
Abbreviations .................................................................................................................................... ix
Table of contents ............................................................................................................................... xi
List of Figures .................................................................................................................................. xiii
List of Tables .................................................................................................................................... xv
INTRODUCTION (VERSION FRANÇAISE) ......................................................................................... 1
I.1. CONTEXTE DU PROJET .................................................................................................................. 1
I.1.1. Production et raffinage du pétrole en Équateur : contexte historique, économique et législatif ......................................................................................................................................... 1
I.1.2. Contexte social et sanitaire dans les zones d'activités pétrolières en Équateur ................... 6
I.1.3. Contexte socio-scientifique du projet MONOIL .................................................................... 9
I.2. ZONE D'ETUDE ........................................................................................................................... 10
I.2.1 Les spécificités de la région amazonienne ........................................................................... 10
I.2.2 Les spécificités de la côte Pacifique ..................................................................................... 12
I.3. OBJECTIF GENERAL DE LA THESE ................................................................................................ 13
I.4. OBJECTIFS SPECIFIQUES ............................................................................................................. 13
INTRODUCTION (ENGLISH VERSION) ........................................................................................... 15
I.1. PROJECT CONTEXT ..................................................................................................................... 15
I.1.1. Oil production and refining in Ecuador: Historic, economic and legislative context ........... 15
I.1.2. Social and health context in oil activities zones in Ecuador ................................................ 20
I.1.3. Socio-scientific context of the MONOIL project .................................................................. 22
I.2. STUDY AREA ............................................................................................................................... 23
I.2.1 Amazon Region: specificities ............................................................................................... 23
I.2.2 Pacific Coast: specificities .................................................................................................... 25
I.3. GENERAL OBJECTIVE .................................................................................................................. 26
I.4. SPECIFIC OBJECTIVES .................................................................................................................. 26
CHAPTER 1. Tracing oil activities sources by PAHs distribution in surface water and sediments of the Amazonian and coastal regions of Ecuador.................................................................................. 29
Forewords ........................................................................................................................................ 29
Polycyclic aromatic hydrocarbons (PAHs) in surface water and sediments at oil exploration and refining sites in Ecuador: concentrations and source distribution ................................................... 33
Abstract ............................................................................................................................................ 34
1. Introduction ................................................................................................................................. 35
2. Materials and methods ................................................................................................................ 37
2.1 Study Area ............................................................................................................................. 37
2.2 Sample Collection .................................................................................................................. 37
2.3 Chemical analysis ................................................................................................................... 38
2.4 Statistical analysis .................................................................................................................. 40
2.5 Environmental and human risk assessment........................................................................... 40
2.6 Identification of PAHs sources ............................................................................................... 42
3. Results and discussion .................................................................................................................. 43
3.1 Distribution of PAHs concentrations in surface freshwater ................................................... 43
3.2 Concentrations of PAHs in bottom sediments ....................................................................... 49
3.3 Oil activities tracing (source tracing)...................................................................................... 56
4. Conclusions .................................................................................................................................. 57
Acknowledgements .......................................................................................................................... 60
References ....................................................................................................................................... 60

Table of contents
xii
Supplementary Information 1 .......................................................................................................... 65
CHAPTER 2. Oil pollution hazards and health quality of drinking waters in Ecuador ...................... 81
Forewords ........................................................................................................................................ 81
Drinking water quality in areas impacted by oil activities in Ecuador: associated health risks and social perception of human exposure .............................................................................................. 86
Abstract ............................................................................................................................................ 87
1. Introduction ................................................................................................................................. 88
2. Materials and Methods ................................................................................................................ 91
2.1 Study area .............................................................................................................................. 91
2.2 Water sample collection ........................................................................................................ 92
2.3 Analytical methods ................................................................................................................ 92
2.4 Sociological methods ............................................................................................................. 94
2.5 Health risk assessment .......................................................................................................... 95
2.6 Statistical analysis .................................................................................................................. 95
3. Results.......................................................................................................................................... 96
3.1 Physico-chemical parameters ............................................................................................... 96
3.2 Major and TME concentrations ............................................................................................. 96
3.3 PAHs concentrations ............................................................................................................ 102
3.4 Bacteriological results .......................................................................................................... 102
3.5 Human health risks assessment ........................................................................................... 102
4. Discussion .................................................................................................................................. 104
4.1 Impacts of oil activities on drinking water quality ............................................................... 104
4.2 Drinking water risks due to low mineralization ................................................................... 106
4.3 Limits of Ecuadorian Regulations ......................................................................................... 108
4.4 Social perception of the risk and human exposure .............................................................. 110
5. Conclusion and recommendations ............................................................................................. 113
Acknowledgements ........................................................................................................................ 114
References ..................................................................................................................................... 115
Supplementary Information 2 ........................................................................................................ 120
CONCLUSIONS, RECOMMANDATIONS ET PERSPECTIVES (FR) ......................................................129
Conclusion Générale ...................................................................................................................... 129
Recommandations et perspectives ................................................................................................ 133
CONCLUSIONS, RECOMMENDATIONS AND PERSPECTIVES (EN).....................................................136
General Conclusion ........................................................................................................................ 136
Recommendations and perspectives ............................................................................................. 140
LIMITATIONS .............................................................................................................................142
BIBLIOGRAPHIE .........................................................................................................................143
ANNEX A: Composition of Ecuadorian crude oil ..........................................................................155
ANNEX B: Article published in Science of the Total Environment .................................................157
ANNEX C: Coordinates of sampling points ..................................................................................173

List of Figures
xiii
List of Figures
INTRODUCTION &FOREWORDS Figure I. Percentage of total exportations for the main Ecuadorian exporting products from 1990 to
2015. (Modified from: Calderón et al., 2016). ............................................................................. 15
Figure II. Oil waste disposal in the NEAR: A. Waste earthen pool and open flares. B. Dumping or liquid waste. C. Crude oil spread on local dirt road. (Credit photos: A and B from MONOIL, 2015; C from IESC, 2004). .................................................................................................................................. 18
Figure III. Colonization in Ecuador: accumulated surface in km2 (from: Gondard and Mazurek, 2001). ..................................................................................................................................................... 21
Figure IV. USDA soil classification and oil blocks distribution in Ecuador (modified from: USDA, 2005 and MAE and PRAS, 2015). .......................................................................................................... 24
Figure V. Structure of sixteen US-EPA parent PAHs. (*) Molecules considered as possibly carcinogenic (modified from CCME,2010). ....................................................................................................... 30
Figure VI. Conceptual example of threshold effect level (TEL) and Probable effect level (PEL).Source: CCME (1999). ............................................................................................................................... 31
Figure VII. Water access in Ecuador: A. Available surface water flow. B. Main sources of drinking water supply. C. Percentage of urban homes with access to public water system. D. Percentage of rural homes with access to public water system. (modified from IGM, 2010) ..................................... 82
Figure VIII. Domestic water sources in Ecuador: A. Treated piped water network. B. Rainfall water collected in plastic tank. C. Spring water. D. Artesian private well. E. Deep public well. (Photo Credits : MONOIL®, 2016). ........................................................................................................... 84
CHAPTER 1 Figure 1-1. Location of study drainage basins and sampling points: Northern Ecuadorian Pacific Coast
(NEPC), Northern Ecuadorian Amazon Region (NEAR), Southern Ecuadorian Amazon Region (SEAR) and Southern Ecuadorian Pacific Coast (SEPC). ................................................................ 39
Figure 1-2. Percentage of samples quantified in A) waters and B) Sediments. .................................... 43
Figure 1-3. Concentration (ng.L-1, log-scale) of different aromatic groups in water samples from upstream to downstream in the sub-basins from the reference zones (A), NEAR (B and C) and NEPC (D). TAC=total aromatic charge, nMN=Sum of methyl-naphthtalenes, 16PAH=∑USEPA-PAHs; USWQG=B[bjk]Fa+B[ghi]Pe+IP; ECWQG =Fa+B[bjk]Fa+B[a]P+B[ghi]Pe+IP. The two first initials indicate the name of the closest city, village or parish: PN=Puerto Napo, PO=Puerto Francisco de Orellana, SC=San Sebastian del Coca, JS=Joya de los Sachas, LI=Limoncocha, DY=Dayuma, TI=Tiputini, NR=Nuevo Rocafuerte, A8=Auca08, LM=Lumbaqui, DU=Dureno, PK=Pacayacu, SF=Shushufindi, SR=San Roque, SJ=San José, BB=Bomboiza, S=Santiago, CC=Carlos Concha, VL=Vuelta Larga, AG=5 de Agosto, SM=San Mateo, E=Esmeraldas, SA=Santa Ana; (i)= GC-MS interferences. The number at the end of the site’s code indicates the year of sampling (2:2012, 3:2013, 4:2014, 5:2015 and 6: 2016) and the lowercase letter indicates the location of the sampling points from upstream (a) to downstream (d) from a same parish, village or city. ....... 45
Figure 1-4. Distribution of PAHs as relative abundance of total aromatic charge in sediments from upstream to downstream of the different basins. LMW=Low molecular weight, HMW=high molecular weight, PASH= Polycyclic aromatic sulfur heterocycles, M=methylated molecules, Perylene is excluded; (i)= GC-MS interferences. The two first initials indicate the name of the closest city, village or parish: PN=Puerto Napo, PO=Puerto Francisco de Orellana, SC=San Sebastian del Coca, JS=Joya de los Sachas, LI=Limoncocha, DY=Dayuma, TI=Tiputini, NR=Nuevo Rocafuerte, A8=crude waste pit, A3=Crude Auca oilfield, PL= LM=Lumbaqui, DU=Dureno, PK=Pacayacu, SF=Shushufindi, SR=San Roque, SJ=San José, BB=Bomboiza, S=Santiago, CC=Carlos Concha, VL=Vuelta Larga, AG=5 de Agosto, SM=San Mateo, E=Esmeraldas, SA=Santa Ana. The number at the end of the site’s code indicates the year of sampling (2:2012, 3:2013, 4:2014, 5:2015 and 6: 2016) and the lowercase letter indicates the location of the sampling points from upstream (a) to downstream (d) from a same parish, village or city. ................................. 54
Figure 1-5. Distribution of PAHs concentrations (ng.g-1 dw; log scale) in sediments from upstream to

List of Figures
xiv
downstream in the study basins. LMW=Low molecular weight, HMW=high molecular weight, PASH= Polycyclic aromatic sulfur heterocycles, M=methylated molecules, Perylene is excluded, ERL=effect range low; ERM= effet range median; PN=Puerto Napo, PO=Puerto Francisco de Orellana, SC=San sebastian del Coca, JS=Joya de los Sachas, LI=Limoncocha, DY=Dayuma, TI=Tiputini, NR=Nuevo Rocafuerte, A8=crude waste pit, A3=Crude Auca oilfield, PL= LM=Lumbaqui, DU=Dureno, PK=Pacayacu, SF=Shushufindi, SR=San Roque, SJ=San José, BB=Bomboiza, S=Santiago, CC=Carlos Concha, VL=Vuelta Larga, AG=5 de Agosto, SM=San Mateo, E=Esmeraldas, SA=Santa Ana. The number at the end of the site’s code indicates the year of sampling (2:2012, 3:2013, 4:2014, 5:2015 and 6: 2016) and the lowercase letter indicates the location of the sampling points from upstream (a) to downstream (d) from a same parish, village or city. ............................................................................................................................... 55
Figure 1-6. Oil pollution hazard map by runoff accumulation area (by Cadot.E ; MONOIL, 2017). ...... 56
Figure 1-7. Hierarchical Cluster Analysis (HCA)-Complete-linkage method based on the isomeric ratios of aromatic charge in sediments (N and Pe excluded), Esmeraldas Basin. .................................. 58
Figure 1-8. Hierarchical Cluster Analysis (HCA)-Complete-linkage method based on the isomeric ratios of aromatic charge in sediments (N and Pe excluded): A) Napo Basin, B) Aguarico Basin. .......... 59
Supplementary Information 1 Figure SI-1. Interannual (2012-2016) average monthly discharge from five HyBAm stations: A)
Aguarico_Nueva Loja, B) Coca_San Sebastian, C) Napo_Francisco de Orellana, D)Napo_Rocafuerte and E) Santiago_Batallon. ........................................................................... 78
Figure SI-2. Dissolved-total aromatic charge (ng.L-1) in the studied sub-basins ................................... 78
Figure SI-3. Hazard risk, grain size; carbon, nitrogen and sulfur and relative abundance of PAHs in sediments (%); *All the units are expressed in %, except the pollution hazard (dimensionless). 79
Figure SI-4. PAH distributions in sediments (naphthalene and perylene included); A) Crude oil and oil saturated samples; B) Control sites; C) Esmeraldas Basin; D) Napo Basin; E) Aguarico Basin. ..... 80
CHAPTER 2 Figure 2-1. Hazards description (flares, oil spills, pools and pits, refinery, oil fields and pipelines) and
sampling points of drinking waters (from various sources: rainfall, river, spring, stream, well) in four study areas: A) Northern Ecuadorian Pacific Coast (NEPC), B) Northern Ecuadorian Amazon Region (NEAR) and C) in two control zones (Southern Ecuadorian Amazon Region (SEAR) and Southern Ecuadorian Pacific Coast (SEPC)) .................................................................................. 91
Figure 2-2. Major element concentrations in drinking water sampled during the 2012-2016 period, in (A) the Northern Ecuadorian Amazon Region (NEAR) and in (B) the control zone in the Southern Ecuadorian Amazon Region (SEAR); the red and blue lines report maximum a nd minimum values recommended by the World Health Organization for drinking water (2005) respectively; international water quality guidelines (WQG) are reported. ....................................................... 98
Figure 2-3. Al, Fe, Mn, Zn and Ba concentrations in drinking water sampled during the 2012-2016 period, in (A) the Northern Ecuadorian Amazon Region (NEAR) and in (B) the control zone in the Southern Ecuadorian Amazon Region (SEAR). The red and blue lines report maximum and minimum values recommended by the World Health Organization for drinking water (2005), respectively; international quality guidelines (WQG) are reported. .......................................... 101
Figure 2-4. Distribution of ingestion and dermal contact Hazard Index (HI) for the Amazon and Pacific Ecuadorian regions, followed by the percentage of samples that overcome the Total HI reference value (US EPA, 2015) in children and adults. ............................................................................. 103
Figure 2-5. The 20 most cited words in Spanish by local people living in Dayuma and Pacayacu villages. (©NVivo simulation.) ................................................................................................................. 110
Supplementary Information 2 Figure SII-1. Kernel Density Plots for pollution hazard and the different variables in domestic water.
................................................................................................................................................... 128

List of Tables
xv
List of Tables
INTRODUCTION Table I. RAOHE and TULSMA water guidelines (mg.L-1) for Ba, Cr, Pb, V, TPH and PAHs .................... 19
CHAPTER 1 Table 1-1. Average concentration ± standard deviation of dissolved organic carbon (mg.L-1), total
suspended solids (mg.L-1 ) and PAHs (ng.L-1 ) in surface water from different basins in the Northern oil extraction and Southern Ecuadorian Amazon Region (NEAR and SEAR, respectively) and in the Northern and Southern Ecuadorian Pacific Coast (NEPC and SEPC, respectively) ...... 47
Table 1-2. Ranges of total aromatic charge (TAC) in ng.L-1 in surface freshwater of our study and around the world, in oil producer countries or in urban areas. ............................................................... 48
Table 1-3. Average ± standard deviation of pollution hazard, grain size (%) and concentration (ng.g-1 dry weight) of PAHs in sediments from different basins in the Northern and Southern Ecuadorian Amazon Region (NEAR and SEAR, respectively) and in the Northern and Southern Ecuadorian Pacific Coast (NEPC and SEPC, respectively). ............................................................................... 50
Supplementary Information 1 Table SI-1. List and proprieties of organic molecules analyzed in the present study ........................... 65
Table SI-2. National and international water quality guidelines in freshwater. ................................... 66
Table SI-3. Spearman’s correlation (p<0.05) for the main variables in sediments. .............................. 66
Table SI-4. Normality test (Shapiro-Wilk) applied to PAHs concentrations in bottom sediments. ....... 67
Table SI-5. Total aromatic charge (ng.g-1), mean-SQG quotients and total-equivalent quantity (TEQ-BaP, ng.g-1) in sediments from Napo, Aguarico and Esmeraldas basins. ...................................... 68
Table SI-6. Toxicological reference values (TRV) for sediments in ng.g-1, TEF is dimensionless. .......... 70
Table SI-7. Ranges of dissolved organic carbon (mg.L-1 ), total suspended solids (mg.L-1 ), and dissolved PAHS (ng.L-1 ) in surface water from different basins in the Northern and Southern Ecuadorian Amazon Region (NEAR and SEAR, respectively) and in the Northern and Southern Ecuadorian Pacific Coast (NEPC and SEPC, respectively). ............................................................................... 71
Table SI-8. Ranges of pollution hazard, grain size (%) and average concentration (ng.g--1dw) of PAHS in sediments from different basins in the Northern and Southern Ecuadorian Amazon Region (NEAR and SEAR, respectively) and in the Northern and Southern Ecuadorian Pacific Coast (NEPC and SEPC, respectively)....................................................................................................................... 73
CHAPTER 2 Table 2-1. Local metrics#,##,b,c, inorganic major element b and metal(oid)s average concentrations
(±Standard Deviation)d,e in different sources of domestic water in the Northern and Southern Ecuadorian Amazon Region (NEAR and SEAR, respectively) and in the Northern and Southern Ecuadorian Pacific Coast (NEPC and SEPC, respectively). ............................................................ 99
Table 2-2. Health Index for ingestion and dermal exposure pathways (HIing and HIder), Total Hazard Index (THI), Cancer Risk for ingestion and dermal exposure pathways (CRing and CRder), Total Cancer Risk (TCR), and percentage of samples (%) higher than the reference value for non-cancer risk (THI:1) and for cancer risk (TCR:10−6–10−4).......................................................................... 105
Supplementary Information 2 Table SII-1. Detection and quantification limits and recovery percentage in water analysis. ............ 120
Table SII-2. List and proprieties of PAHs and BTEX analyzed in the present study. ............................ 121
Table SII-3. Water quality guidelines (WQG) and minimum health requirement for treated and natural water intended for human consumption. .................................................................................. 122
Table SII-4. Average (± Standard Deviation) PAHs and BTEX concentrations (ng.L-1) and coliforms (CFU.100 mL-1) in different sources of domestic water collected in the Northern and Southern Ecuadorian Amazon Region (NEAR and SEAR, respectively) and in the Northern and in the Northern and Southern Ecuadorian Pacific Coast (NEPC and SEPC, respectively). .................... 124
Table SII-5. Individual hazard quotient (HQ) for ingestion pathway in the Ecuadorian amazon region. ................................................................................................................................................... 126

List of Tables
xvi
ANNEXES Table A-1. Trace elements (µg.g-1) and PAHs (ng.g-1) concentrations (average±SD) in Ecuadorian
Amazon crude oil and natural bituminous sandstone. ....................................................................155
Table C-1. Localization (UTM coordinates) of surface water sampling points (Chapter 1). ...................173
Table C-2. Localization (UTM) coordinates of drinking-water sampling points (Chapter 2). .................175

INTRODUCTION
1
INTRODUCTION (VERSION FRANÇAISE)
I.1. CONTEXTE DU PROJET
La forêt amazonienne est la plus grande richesse naturelle d’Amérique Latine. Elle est aussi au
centre de nombreux débats économiques, écologiques et socioculturels. Le bassin amazonien
équatorien, bien qu’ayant une très faible densité de population, dévoile un important registre
de conflits socio-environnementaux, principalement dus à l’exploitation pétrolière.
I.1.1. Production et raffinage du pétrole en Équateur : contexte historique, économique et
législatif
L’extraction du pétrole en Équateur a débuté sur la côte Pacifique en 1911 et s'est centralisée
sur cette région pendant près de 60 ans (BCE, 1990). Actuellement, cette région produit moins
de 1% du pétrole du pays, tandis que 99% sont concentrés dans la région amazonienne nord
équatorienne (North Ecuadorian Amazon Region, NEAR), principalement dans les provinces
d'Orellana et de Sucumbíos (Bustamante and Jarrín, 2005; EP Petroecuador, 2013). Les
activités d'extraction dans la NEAR ont débuté en 1967 avec le forage du premier puits du
pétrole par Texaco Gulf, et sont devenues économiquement importantes dès 1972, avec
initialement une production de 300 000 barils par jour pour atteindre 522 000 barils en 2017
(BCE, 2018; EP Petroecuador, 2013). L’exportation de pétrole brut a été la principale source
de revenus de l'économie équatorienne, représentant plus du 50% des exportations totales
de 2004 à 2014 (Figure I) puis s’réduisant à 37% en 2017 (BCE, 2010; Calderón et al., 2016;
MCE, 2017). En Amérique du Sud, l'Équateur est désormais le 4ème plus gros producteur de
pétrole, et le 3ème en volume de réserves (OPEC, 2017).
Figure I. Pourcentage des exportations totales des principaux produits équatoriens de 1990 à 2015 (Calderón et al., 2016).

INTRODUCTION
2
Le raffinage du pétrole en Équateur est, depuis le début de l’exploitation en 1926, centré sur
la côte Pacifique. Actuellement le pays compte trois usines de raffinage: la raffinerie
« Shushufundi », la seule située en Amazonie et cumulant 10% du raffinage total national; la
raffinerie de «La Libertad » et celle « Esmeraldas », situées sur la côte pacifique et produisant
la presque totalité des dérivés raffinés du pays. La raffinerie d'Esmeraldas (REE), construite en
1977, représente 63% de la capacité totale de raffinage du pays (EP Petroecuador, 2013).
Les infrastructures de production pétrolière situées en Amazonie et les installations de
raffinage de la côte Pacifique ont engendré la construction de nombreux systèmes de stockage
et de transport de pétrole brut et de leurs produits dérivés: notamment l’oléoduc trans-
équatorien (SOTE), l’oléoduc San Miguel-Lago Agrio (OSLA), l’oléoduc du pétrole lourd (OCP)
et la tuyauterie Eden Yuturi-Villano qui collectent et transportent le pétrole brut depuis la
NEAR, traversent la cordillère des Andes, et arrivent jusqu'au port maritime d'Esmeraldas à
Balao (EP Petroecuador, 2013).
Ainsi, suite à ce développement important des activités pétrolières, dans ce contexte
historique et économique, des pratiques environnementales peu soucieuses du respect de la
Nature ont vu le jour. Cependant, ces pratiques environnementales en Équateur sont restées
méconnues jusqu'en 1972: les premiers rapports bibliographiques remontent à peine au
début des années 70 en lien avec l'affaire Texaco (1990-2010). Certains auteurs ont signalé
des documents de 1972 expliquant aux employés que seuls les incidents environnementaux
déjà connus par la presse ou par le gouvernement doivent être signalés, les autres devant être
passés sous silence et les enregistrements existants effacés (Andrade, 2008; Buccina et al.,
2013). Par ailleurs, il apparait que le gouvernement équatorien n’a appliqué aucune
réglementation environnementale au cours des 28 années d’exploitation pétrolière par la
compagnie Texaco Gulf Company, en lien également avec les 12 autres compagnies
pétrolières impliquées dans la région NEAR (BCE, 1990; Narváez, 2000).
Sans aucune mesure de protection de l'environnement, l’extraction du pétrole opérée en
Amazonie Equatorienne par l’entreprise Texaco aurait causé le déversement d’environ 65
milliards de litres de pétrole, le rejet de 76 milliards de litres d’eau de formation dans les
rivières et la combustion de 7 millions de m3 de gaz. Plus de 1000 piscines de déchets toxiques
ont été abandonnées (Narváez, 2000). En 1992, Texaco-Gulf transféra toutes ses installations
à l’entreprise publique Petroecuador ; et encore, sans aucune contrôle de la remédiation
imposée par le gouvernement, les pratiques industrielles sont demeurées les mêmes pendant
de nombreuses années (Kashinsky, 2008).

INTRODUCTION
3
Sur la côte Pacifique, aucun incident n’avait été répertorié avant la publication du document
de Narváez (2000) présentant une liste des incidents liés au transport par oléoducs et aux
incendies ayant touché les rivières Esmeraldas et Teaone depuis 1997.
Le CEPAL (1990) indique que l’obsolescence des infrastructures a contribué à la pollution
chronique de l’air, de l’eau et du sol ; et à la génération de scénarii favorables aux conflits
socio-environnementaux, comme par exemple, le cas des effluents liquides de la REE dilués et
dispersés dans les rivières Teaone et Esmeraldas. Récemment, Chachalo (2016) a signalé que
la REE a produit plus de 30 000 tonnes de sous-produits dangereux en août 2014 et que de
nouveaux procédés remplaçaient les anciens depuis 2015. Des améliorations similaires
avaient déjà été mises en place en 1987, 1995 et 1997 afin d'augmenter la capacité de
raffinage de 55 000 à 110 000 barils par jour; mais ces ajustements techniques n'ont en rien
amélioré l'impact de la raffinerie sur l'environnement (Cevallos, 2015).
En 2015, le Ministère équatorien de l'environnement (MAE) a répertorié 3 raffineries, 2
oléoducs majeurs, 6383 puits d’extraction et 1190 plates-formes, tandis que les passifs
environnementaux étaient estimés à 1170 accidents de fuites de pétrole et 2489 fosses à
déchets (MAE, 2015a). Ces éléments ont induit des impacts environnementaux et sociaux
importants; plusieurs communautés autochtones ont été forcées de migrer (Buccina et al.,
2013). La pollution des eaux de surface et des eaux souterraines dans les provinces d'Orellana
et de Sucumbíos a affecté cette zone dont la biodiversité est particulièrement riche
(Bustamante and Jarrín, 2005; Marx, 2010; Wernersson, 2004). Selon le MAE (2015), 97% du
total des passifs environnementaux (fosses et déversements d'hydrocarbures) se situent dans
la NEAR. Et l’eau est le milieu que les populations locales considèrent comme le plus affecté
par les activités pétrolières (Clinica Ambiental and CSS, 2017).
Les activités de l'industrie pétrolière sont regroupées en cinq phases: (1) exploration, (2)
exploitation ou production, (3) stockage et transport, (4) raffinage et (5) commercialisation ;
toutes ces activités affectent l'environnement et particulièrement les sources d'eau, mais les
phases de production et de transport sont les plus critiques en raison des volumes importants
d'eaux de formation rejetées (liquide très salé contenant des hydrocarbures et des éléments
métalliques), des boues de forage, des eaux de traitement et des risques de déversement
(Avellaneda, 2005; Fontaine, 2013). En Equateur, l'exploration et l’exploitation du pétrole sont
sous la responsabilité de l'entreprise publique Petroamazonas tandis que les activités de
raffinage, de transport et de vente sont sous le contrôle de Petroecuador travaillant
également avec certaines entreprises internationales (chinoises, canadiennes, etc.).

INTRODUCTION
4
Certains auteurs ont listé des variables « cause-effet » de la pollution pétrolière dans la région
amazonienne équatorienne (Buccina et al., 2013; IESC, 2004; Narváez, 2000; Widener, 2007).
Parmi ces causes de pollution signalées durant la période 1972-1993 (Figure II), et affectant le
système aquatique, nous pouvons énumérer:
- la construction de fosses à proximité des puits de pétrole pour recueillir les déchets (une à
trois fosses par puits),
- les déchets solides et liquides eux-mêmes, ayant été accumulés dans les piscines ou déversés
dans les cours d’eau,
- les déchets accumulés qui ont été incinérés ou récupérés pour être épandus sur des chemins
de terre,
- les résidus de pétrole ayant été souvent emportés par les eaux de ruissellement vers les
Figure II. Élimination des déchets pétroliers dans la NEAR: A. Torchères et fosse des déchets. B. Déversement des déchets liquides. C. Pétrole brut répandu sur une route de terre. (Crédit photos: A et B de MONOIL, 2015 ; C de IESC, 2004).

INTRODUCTION
5
cours d’eau,
- le gaz brûlé sur place (environ 200 torchères brulaient 2 millions de m3 de gaz par jour).
Les mauvaises pratiques pétrolières en Equateur représentent depuis plusieurs décennies un
cas rare de pollution chronique où l’adoption d’une réglementation environnementale est
arrivée tardivement et avec une applicabilité biaisée. Ainsi, le TULSMA ou «Texto Unico de
Legislación Secundaria del Ministerio del Ambiente» (MAE, 2015; MAE, 2003) fixe désormais
des seuils pour la préservation de la vie aquatique. Parallèlement, le «Reglamento Ambiental
de las operaciones hidrocarburiferas» (RAOHE, 2001), consacré à la surveillance des effluents
et des émissions des activités pétrolières, présente des seuils différents, mettant en évidence
de fortes disparités entre ces deux réglementations.
Les seuils donnés par le RAOHE n'ont pas changé depuis près de 20 ans et sont toujours utilisés
pour le contrôle des effluents de l'industrie pétrolière, tandis que la réglementation du
TULSMA, qui inclut les directives de l'Organisation Mondiale de la Santé (WHO, 2017), a été
modifié plusieurs fois avec une réduction du nombre de paramètres surveillés (MAE, 2015).
La législation RAOHE présente des seuils pour seulement quatre éléments métalliques
toxiques (baryum, chrome, plomb et vanadium), pour les hydrocarbures totaux (TPH) et les
hydrocarbures aromatiques polycycliques totaux (HAPs) dans l'eau et les effluents liquides
provenant de tous les procédés de l'industrie pétrolière. Mais aucune de ces normes ne
contrôle la qualité des sédiments alors que la plupart des contaminants sont hydrophobes. Le
RAOHE propose de surveiller le risque pour la vie aquatique en suivant deux critères : les
teneurs au niveau du point de décharge des effluents industriels ou en aval dans la masse
d'eau douce qui les recueille. De son côté, le TULSMA contrôle la qualité des eaux selon leur
Table I. Seuils relatives à la qualité de l’eau (mg.L-1) pour Ba, Cr, Pb, V, TPH et PAHs d’après RAOHE et TULSMA
ÉLÉMENT
RAOHE1 RAOHE2 TULSMA TULSMA Point de décharge
Point de contrôle
Préservation de la vie aquatique
Vers le réseau d'égout
Baryum <5 -- 1.0 -- Chrome <0.5 -- 0.032 0.5 as Cr(VI) Plomb <0.5 -- 0.001 0.5
Vanadium <1 -- -- -- TPH <0.5 <0.5 0.5 20.0
HAPs <0.0003 <0.0003 -- -- D’après: Table 4 de RAOHE (2001); Table 2 et Table 8 de TULSMA-2015 (MAE, 2015) 1.- Point de décharge des effluents après traitement 2.- Au moins 300 mètres en aval du point de décharge

INTRODUCTION
6
objectif d’utilisation (consommation, préservation de la vie aquatique, etc.) (Table I).
Mais, les effluents sont-ils destinés à s'écouler directement dans un cours d'eau douce ?
Affectent-ils la vie aquatique ? Et si les eaux de formation atteignent les principales sources
d'eau utilisées par les populations, existe-t-il un risque pour la santé humaine ?
Ces quelques questions permettent de prendre conscience de l’ambiguïté de ces deux
règlementations équatoriennes en matière de surveillance de l’environnement et de contrôle
des activités pétrolières.
I.1.2. Contexte social et sanitaire dans les zones d'activités pétrolières en Équateur
La production pétrolière en Équateur constitue un cas d'étude intéressant car elle reflète
l’évolution historique de l'utilisation des ressources naturelles, elle permet de visualiser les
relations économie-société-environnement et d'identifier un groupe de quatre acteurs de
cette dynamique: 1) les habitants métisses et indigènes, 2) les entreprises extractives, 3) les
organisations locales et internationales et enfin, 4) l'État équatorien (Juteau-Martineau,
2012). Ce dernier a été le principal acteur (positivement ou négativement) parmi les autres
éléments lors des étapes du développement du pays depuis la pré-réforme agraire, la réforme
agraire (1964-1979) et jusqu’à l'ère d’exploitation pétrolière à partir de 1973 (Juteau-
Martineau et al., 2014).
Avant la réforme agraire, les relations entre les habitants autochtones de l’Amazonie et la
nature étaient basées sur une agriculture itinérante à petite échelle ainsi que d’autres
pratiques productives qui préservaient l’équilibre écologique et la conservation des
ressources à long terme (Varea et al., 1995). L'économie équatorienne était basée sur
l'exportation de produits agricoles de la région côtière (bananes et cacao notamment) et la
population rurale servait généralement de main-d'œuvre agricole (Acosta, 2006). Pendant la
première période de la réforme agraire (1964-1972), les provinces de Pichincha, Esmeraldas
et Morona Santiago sont devenus de nouvelles zones de colonisation (Gondard and Mazurek,
2001) et l'industrie pétrolière, concentrée sur la côte Pacifique, restait minimale (EP
Petroecuador, 2013). Cependant, une forte colonisation est apparue lors de la deuxième
réforme agraire du pays, qui a coïncidé avec le début de la production pétrolière dans la NEAR
(1972) et la construction de la raffinerie (1975) dans la province d'Esmeraldas (Wasserstrom
and Southgate, 2013). À la suite de ces événements et des activités minières également en
expansion, la colonisation des provinces amazoniennes et d'Esmeraldas a augmenté de
manière exponentielle (Figure III), alors qu’elle est restée linéaire dans le reste du pays

INTRODUCTION
7
(Gondard and Mazurek, 2001).
La route Quito-Lago Agrio (construite en 1972) a rendu la NEAR accessible, la colonisation de
zones considérées jusque-là comme inhabitées (malgré la présence de populations
autochtones) a avancé amplement, et les compagnies pétrolières ont construit de
nombreuses routes et ponts (Wasserstrom and Southgate, 2013). L’exploitation des
ressources naturelles (bois, pétrole, etc.) avec le soutien de l’état a forcé la migration des
différents groupes ethniques ainsi que la confrontation entre les « colons» et les peuples
« originaires » (Jarrín et al., 2016). Les entreprises étaient gérées sur le principe
d’investissement minimal; les « colons » sont devenus la main-d'œuvre principale et on
assistait en parallèle à l'expansion de l'agriculture pour l'autoconsommation ou pour le
marché local (Gondard and Mazurek, 2001; Varea et al., 1995). Dans ces schémas de
production, ni les aspects environnementaux ni les aspects socioculturels n’ont été pris en
compte. Les nouveaux arrivants (appelés en Amazonie les «colonos»), sans assistance
technique ni ressources financières, ont commencé à déforester et à appliquer leurs propres
techniques agricoles, générant dès lors une importante dégradation des sols. Les pratiques
Figure III. Colonisation en Equateur: surface accumulée en km2 (Gondard et Mazurek, 2001).

INTRODUCTION
8
ancestrales telles que l'agriculture itinérante ont été perdues ou sédentarisées. L'économie
est devenue dépendante des exportations de pétrole (Acosta, 2006) et les effets visibles de sa
production sur les populations et l'environnement se sont multipliés (voir la section I.1.1).
Dans ce contexte, d’un point de vue sanitaire, plusieurs études épidémiologiques dans des
communautés situées à proximité d'infrastructures pétrolières ont mis en évidence des
affections de la santé humaine en raison d'une exposition chronique au pétrole brut et/ou à
ses déchets toxiques. Ces études ont signalé des maladies respiratoires, des symptômes et des
lésions cutanées ainsi que des effets chroniques, notamment des troubles psychologiques,
des troubles endocriniens et reproductifs. Certaines études ont mis en évidence une
génotoxicité de ces produits avec notamment des cas de leucémies, fausses couches et
différents types de cancer (Arana and Arellano, 2007; Hurtig and San Sebastián, 2005; IESC,
2004; Kelsh et al., 2009; San Sebastián and Hurtig, 2005). L’eau est alors apparue comme le
principal vecteur des contaminants (O’Callaghan-Gordo et al., 2016; Ramirez et al., 2017; Levy
and Nassetta, 2011).
Hurtig and San Sebastian (2002) ont signalé que les taux de cancer dans les communautés
équatoriennes vivant près des zones d'exploitation pétrolière étaient plus élevés que dans le
reste du pays, et probablement liés, comme le proposent différents auteurs dans les années
2000, à des hydrocarbures tels que le benzo(a)pyrène, déversé dans les zones de production
pétrolière (Buccina et al., 2013; Hurtig and San Sebastian, 2002). Cependant, aucune donnée
sérieuse sur les impacts environnementaux des activités pétrolières sur la qualité de l’eau et
du sol n’a été publiée à ce jour pour confirmer cette hypothèse. Plus récemment, Webb et al.
(2016) ont analysé le mercure et le 1-hydroxypyrène (1-OHP) dans l'urine d'individus vivant
dans les zones de production du pétrole au Pérou et en Équateur. Ils ont constaté que les
femmes qui utilisent des eaux de surface pour se laver et se baigner présentent des teneurs
plus élevées en mercure et HAPs; par ailleurs les concentrations en Hg étaient plus élevées
chez les hommes au Pérou et chez les ouvriers travaillant pour la mise en place des dispositifs
de remédiation des déversements de pétrole.
Cependant, la question de la santé est plus complexe puisque, en épidémiologie
environnementale, il n'y a pas de relation directe entre les causes (émissions de déchets
pétroliers) et les effets sur la santé (incidences du cancer), même si les habitants des zones
pétrolières présentent des signes et des symptômes d’une exposition aiguë et/ou chronique
au pétrole brut et aux composés volatiles. En 2008, des analyses génotoxiques sur des
individus de la NEAR ont toutefois confirmé que l'exposition aux hydrocarbures avait causé

INTRODUCTION
9
des dommages à l'ADN et augmenté le risque de développer un cancer (Paz-y-Miño et al.,
2008).
I.1.3. Contexte socio-scientifique du projet MONOIL
Dans ce contexte de production pétrolière et de mise en évidence d’impacts sur
l’environnement et la santé des habitants, l’Équateur a mis en place en 2008 une nouvelle
constitution qui reconnaît le droit de la Nature à être restaurée, le droit des personnes à vivre
dans un environnement sain et l'action de l'État pour garantir la santé et la restauration des
écosystèmes en cas de catastrophes environnementales (AC, 2008). Ainsi, le gouvernement
équatorien a mis en place le “Programa de Reparación Ambiental y Social” (PRAS). Ce
programme inclut la politique publique de réparation des dégâts ou des passifs
environnementaux comme une nécessité de l'État équatorien (Bissardon et al., 2013a; MAE,
2012).
En 2010, la “Secretaría Nacional de Ciencia y Tecnologia” (SENESCYT) et la compagnie
pétrolière EP-Petroecuador ont demandé à l'Institut français de recherche pour le
développement (IRD) de les aider à mieux comprendre toutes les conséquences sociales et
environnementales des activités pétrolières en Equateur, et ce depuis la première période
d'exploitation du pétrole dans la région amazonienne équatorienne. A partir de 2010, et en
collaboration directe avec des partenaires académiques et institutionnels français et
équatoriens, une équipe de l'IRD, du CNRS et de l’Université de Toulouse, au GET, a développé
et mis en œuvre un projet de recherche binational d'évaluation des impacts des activités
pétrolières en Equateur. Il s’agit du programme MONOIL (Monitoring environnemental, santé,
société et pétrole en Equateur) qui a pour but d’améliorer les connaissances
transdisciplinaires sur les impacts sociaux et environnementaux des activités pétrolières en
Equateur (ANR, 2013). Ce programme a été financé par l'Agence Nationale de la Recherche
(ANR, 2014-2018) et des aides supplémentaires ont été offertes en France par l'IRD et le CNRS,
et en Équateur par les universités USFQ, EPN et UASB et le Secrétariat d’Etat à l’Education
Supérieure, la SENESCYT (dont 2 bourses doctorales).
Cette thèse s'inscrit dès lors dans le deuxième objectif principal de ce projet, et notamment
au sein de la tâche 3 du programme MONOIL qui a pour but de mesurer les impacts et les
risques des mélanges chimiques des hydrocarbures aromatiques polycycliques (HAPs et des
métaux et métalloïdes (TM) associés aux activités extractives sur la qualité des eaux, des
sédiments et de la chaîne trophique aquatique.

INTRODUCTION
10
Dans ce vaste programme pluridisciplinaire, un des objectifs vise à déterminer les sources et
les niveaux de pollution causés par les activités pétrolières sur l’environnement dans la région
amazonienne équatorienne (centre de production pétrolière) et sur la côte équatorienne
(principale zone de raffinage). La zone d'étude est ainsi présentée avant de décrire les
différents objectifs de cette thèse.
I.2. ZONE D'ETUDE
I.2.1 Les spécificités de la région amazonienne
La région amazonienne en Équateur représente 45% de la surface totale du pays et est placée
sur une zone sédimentaire comprenant des plaines, des zones à forte pente, des aires
marécageuses et sableuses; elle est formée de sols latéritiques issus de couches volcaniques
présentant une teneur élevée en oxydes de fer et d'aluminium (Figure IV); cette région se
trouve entre 200 et 1 200 m d’altitude, le climat y est humide et pluvieux avec une
température moyenne de 25 °C et des précipitations annuelles de l’ordre de 500 à 4 000
millimètres (Narváez, 2000; Schlesinger, 2000). Au cours de l'année, les pluies sont
abondantes et constantes sans saisonnalité marquée (Foucault, 2016); mais il y a deux
périodes où les précipitations ont une influence majeure: la première de décembre à avril et
la seconde de septembre à novembre, avec des valeurs maximales de mars à avril et en
octobre. Les précipitations minimales sont généralement enregistrées de juin à août (Armijos
et al., 2013; Gualpa et al., 2001). Les précipitations annuelles moyennes diminuent du nord au
sud, elles sont en moyenne de 3100 mm dans le bassin du Napo et de 2000 mm dans le bassin
du Santiago (Laraque et al., 2007; USDA, 2005)..
Des sables saturés de pétrole brut lourd et d'asphalte émergent le long des rives des rivières
Hollin, Jodachi et Napo; les champs pétrolifères datent du Crétacé et la roche réservoir se
compose de grès provenant des formations Hollin, Napo et Tena (Baby et al., 2014). Environ
68 200 km2 (soit 68%) de l’Amazonie équatorienne sont recouverts de blocs pétroliers (Figure
IV); avec 8,3 milliards de barils de réserves et une production journalière d'environ 550 000
barils (EP Petroecuador, 2013; Lessmann et al., 2016; OPEC, 2018).
Les précipitations, les températures et l'humidité dans la région amazonienne constituent des
conditions idéales pour le développement de la forêt tropicale humide, un des écosystèmes
offrant la plus grande biodiversité sur Terre. Près de 50% des espèces de mammifères
amazoniens se trouvent en Amazonie équatorienne; 1 100 espèces d'arbres, 270 espèces
d'amphibiens (150) et de reptiles (121), 500 espèces d'oiseaux, 300 espèces de mammifères,

INTRODUCTION
11
382 espèces de poissons et 35 000 espèces d'insectes (sur un rayon de 3 km) ont été détectées
dans le parc Yasuni (Bass et al., 2010; Dangles et al., 2009; Hettler et al., 1996). Ce parc national
appartient à un groupe de dix zones protégées au sein de la région amazonienne équatorienne
dans le cadre du programme «Sistema Nacional de Areas protegidas» (Système national
d'aires protégées) ( MAE, 2015b).
En dépit d'être une zone d’une biodiversité extrêmement riche, et avec des ressources
naturelles importantes (pétrole, bois et agriculture), la région amazonienne présente le
pourcentage de pauvreté le plus élevé du pays : 71% contre 45% au niveau national (INEC,
2010a).
Figure IV. Classification des sols et distribution des blocs pétroliers en Équateur (modifié d’après USDA, 2005 et MAE-PRAS, 2015).

INTRODUCTION
12
Avec près de la moitié du territoire national et seulement 5% de sa population totale,
l'Amazonie équatorienne présente une riche diversité culturelle; 2 populations sont en
isolement volontaire et 11 autres groupes de populations indigènes vivent dans le bassin
amazonien équatorien (López, 2016; Oberem, 1980; Vallejo and Ávila, 2017). L’UNESCO (2010)
a ainsi enregistré 9 langues autochtones en Amazonie équatorienne, toutes en danger
d’extinction. Les autochtones représentent 30% de la population de cette région, les
« blancs » 10% et les «métis» 60% (Juteau-Martineau, 2012).
En plus de l’exploitation pétrolière, la région amazonienne présente d'autres stratégies de
production locale: 1) petit élevage et agriculture (cacao, café), 2) agriculture industrielle
(palmier africain), 3) extraction de bois et de minéraux, 4) main d’œuvre technique pour
différents travaux et 5) services touristiques ; ces activités sont secondaires par rapport à la
capacité d'investissement de l'industrie pétrolière (SENPLADES and ECORAE, 2016; Varea et
al., 1995).
I.2.2 Les spécificités de la côte Pacifique
La région Pacifique équatorienne (Costa) couvre 26% de la superficie du pays; elle s’insère
entre l'océan Pacifique et les Andes occidentales. Les principaux bassins versants côtiers de
l'Équateur sont les bassins du Guayas et d’Esmeraldas, qui s'écoulent d’est en ouest, dans
l'océan Pacifique (Buckalew et al., 1998). Cette région présente une saisonnalité marquée avec
une saison des pluies intense de février à mai et une saison sèche de juillet à novembre
(Armijos et al., 2013).
La province d'Esmeraldas est située au nord-ouest de l'Équateur avec une superficie de 16
155,97 km² en plateau avec de petites collines formées par sols ferralitiques rouges fortement
acides. Elle se caractérise par un climat tropical subhumide à très humide, et une température
moyenne de 23 °C ; les rivières Teaone et Esmeraldas constituent le principal système
hydrologique de la zone. Cette zone s’inscrit dans la microrégion de Choco présentant l'un des
taux de biodiversité les plus élevés au monde (Espinosa et al., 2017; Sierra et al., 2009)
La population d'Esmeraldas représente 3% de la population équatorienne totale et se définit
comme afro-descendante et métisse «mestizo» (INEC, 2010b). Malgré les activités
industrielles (centrale thermique, raffineries, etc.), cette région est considérée comme l'une
des plus pauvres de l'Équateur (SENPLADES, 2015). Une grande partie de son économie
dépend du tourisme, de la production de crevettes, de bananes et de cacao et de l’élevage et
la vente de bétail (PUCE-Esmeraldas, 2017).

INTRODUCTION
13
I.3. OBJECTIF GENERAL DE LA THESE
L'objectif principal de ce travail est d'étudier les impacts des activités pétrolières actuelles et
passées sur la qualité de l'eau du bassin amazonien équatorien (zone de production pétrolière)
et du bassin versant de la rivière Esmeraldas (zone de raffinage) en déterminant les
concentrations en HAPs dans les eaux de surface et les sédiments. L'étude spécifique des
teneurs en HAPs et éléments inorganiques (métaux et métalloïdes) dans les sources d'eaux
utilisées pour la consommation humaine fournira des informations sur les niveaux
d'exposition des populations vivant dans ces zones.
I.4. OBJECTIFS SPECIFIQUES
Plus précisément, cette étude a pour objectif de :
• Mesurer les concentrations en HAPs dans les sédiments et eaux de surface (phase
dissoute et particulaire) des rivières situées en zone d’exploitation pétrolière et de
raffinage
• Mesurer les concentrations des TM et HAPs dans les eaux de consommation humaine
en zone d’exploitation pétrolière et de raffinage
• Comparer les résultats avec une zone de contrôle située dans le bassin amazonien et
non affectée par les activités extractives
• Identifier les potentielles sources de contaminants organiques et métalliques dans les
eaux de surface et de consommation
• Comparer les résultats avec les normes nationales et internationales de régulation
environnementale
• Calculer des indices de risque sanitaire pour les éléments cancérigènes et non
cancérigènes mesurés dans les eaux de consommation
• Proposer des recommandations pour réduire le risque d’exposition des populations
locales.
Le présent manuscrit est divisé en deux grands chapitres présentés sous la forme de
publications scientifiques, l’un portant que la qualité environnementale des eaux de surface
et des sédiments associées dans les zones impactées par les activités pétrolières et l’autre se
focalisant sur la qualité sanitaire des eaux de consommation en Equateur. Les informations
supplémentaires sont incluses dans chaque chapitre, et autres informations complémentaires
sont presentés comme annexe à la fin de ce manuscrit de thèse.
Le Chapitre 1 correspond à un article en préparation intitulé “Polycyclic aromatic

INTRODUCTION
14
hydrocarbons (PAHs) in surface water and sediments at oil exploration and refining sites in
Ecuador: concentrations and source distribution”. Dans cet article, les hydrocarbures
aromatiques polycycliques sont spécifiquement étudiés : les concentrations en HAPs dans les
eaux de surface et dans les sédiments du bassin amazonien équatorien sont comparées entre
les zones contaminées par le pétrole et une région non perturbée par les activités extractives,
tout en tenant compte des recommandations nationales et internationales pour préserver la
vie aquatique. Le quotient SQG moyen a été utilisé pour définir la priorité par rapport au
niveau de toxicité. Le facteur de toxicité équivalente au benzo(a)pyrène (TEF) a été utilisé pour
définir le risque cancérogène, et un important traçage des sources de ces polluants est
proposé via la méthode des ratios isomériques.
Le Chapitre 2 intitulé “ Drinking water quality in areas impacted by oil activities in Ecuador:
associated health risks and social perception of human exposure” traite des concentrations en
HAPs et TM dans les eaux consommées sur la côte Pacifique et en Amazonie équatorienne.
Les concentrations sont comparées aux directives équatoriennes et internationales relatives
à la qualité de l’eau de consommation ; et une évaluation du risque sanitaire est proposée en
considérant un scénario mis en œuvre sur deux populations (adultes et enfants) et en
considérant deux voies d'exposition aux polluants (contact cutané et ingestion). En effet, en
utilisant différentes sources d'eau brute comme source d'eau domestique, les populations
équatoriennes peuvent mettre leur santé en danger, car les polluants émis par les activités
pétrolières peuvent rapidement atteindre les systèmes aquatiques. Certaines
recommandations sont également proposées. Ce chapitre 2 correspond à un article
récemment publié dans le journal Science for The Total Environment (STOTEN) en juillet 2019.
Enfin, ce manuscrit de thèse s’achève par une partie de conclusions générales et de
perspectives proposées pour ce travail.
La version anglaise de cette partie introductive est présentée en suivant.

INTRODUCTION
15
INTRODUCTION (ENGLISH VERSION)
I.1. PROJECT CONTEXT
The Amazon rainforest is considered as the largest natural capital in Latin America due to the
richness of its natural resources; this place has become the center of debates related with the
economic, ecologic, and socio-cultural sustainability. The Ecuadorian Amazon basin, with a
very low population density and only 2% of the total Amazon Rainforest, has an important
register of socio-environmental conflicts, mainly due to oil production.
I.1.1. Oil production and refining in Ecuador: Historic, economic and legislative context
Oil production in Ecuador began inshore on the Pacific coast in 1911, and lasted concentrated
in this region for 60 years (BCE, 1990); at present, this region produces less than 1%, while
99% is concentrated in the Ecuadorian Amazon region, mainly in the provinces of Orellana and
Sucumbíos (Bustamante and Jarrín, 2005; EP Petroecuador, 2013). Extraction crude activities
in the Northern Ecuadorian Amazon Region (NEAR) began in 1967 with the drilling of the first
oil well by Texaco Gulf, becoming economically important in 1972, with a daily production of
300,000 barrels reaching 522,000 barrels in 2017 (BCE, 2018; EP Petroecuador, 2013). Since
1972, crude oil exportation has represented the main source of income for the Ecuadorian
economy, exceeding 50% of total exportations from 2004 to 2014 (Figure I), and settling down
at 37% in 2017 (BCE, 2010; Calderón et al., 2016; MCE, 2017). In South America, Ecuador is
the 4th larger oil producer and the 3rd country with the largest oil reserves (OPEC, 2017).
Oil refining processes in Ecuador have been centered on the Pacific coast since their origin
(1926); this region possesses 90% of the total refining production. The country has three
refineries: “Esmeraldas”, "Libertad" and the industrial complex “Shushufindi”. The Esmeraldas
Figure I. Percentage of total exportations for the main Ecuadorian exporting products from 1990 to 2015. (Modified from: Calderón et al., 2016).

INTRODUCTION
16
refinery (built in 1977) represents 63% of the total refining capacity (EP Petroecuador, 2013).
La Libertad and Esmeraldas are refineries situated on the coast, whereas the Shushufundi
refinery is located in the Northern Amazon area.
The oil production infrastructures concentrated in the NEAR and the refining facilities on the
Pacific coast have generated many systems of storage and transport of crude oil and
derivatives: the Trans-Ecuadorian pipeline (SOTE), the San Miguel-Lago Agrio pipeline (OSLA),
the heavy-crude Pipeline (OCP) and the Eden Yuturi-Villano Pipeline. These pipelines collect
and transport crude oil from the NEAR, crossing the Andean Cordillera, until the Balao seaport
in Esmeraldas (EP Petroecuador, 2013).
Environmental practices related with oil industry in Ecuador remained unregistered until
1972: the first bibliographic reports dated back to the early 1970s and appeared because of
the importance of Texaco trial in the last two decades (1990-2010). Some authors pointed out
documents from 1972 which explained to employees that only environmental incidents
already known by the press or the government should be reported, otherwise they do not
have to be registered and the existing reports must be destroyed (Andrade, 2008; Buccina et
al., 2013).
Through the 28 years that Texaco Gulf Company with other 12 private oil companies operated
in the NEAR, no environmental regulation was enforced by Ecuador Government (BCE, 1990;
Narváez, 2000). Oil production in a context of non-environmental policies caused almost 65
billion liters of crude oil spills, 76 billion liters of formation water discharged in the
environment, and the burning of 7 million cubic meters of gas. And more than 1000 pools of
toxic waste were abandoned (Narváez, 2000). In 1992, Texaco-Gulf transferred all its goods to
the state company Petroecuador, without any remediation obligations imposed by the
government at that time, and industrial practices remained similar for several years
(Kashinsky, 2008).
The historic of the environmental practices related with the refining zones in the Pacific coast
since the beginning has not been published; (Narváez, 2000) presents a record (1997-2000) of
oil spills, pipeline and fire incidents that affected the Esmeraldas and Teaone rivers since 1997,
but not previous information exists. CEPAL (1990) indicates that the obsolescence of
infrastructures contributed to chronic pollution of the air, water and soil leaving a favorable
scenario for socio-environmental conflicts; in the case of liquid effluents of the REE, they used
to be diluted and dispersed in the Teaone and Esmeraldas rivers.
Chachalo (2016) signaled that Esmeraldas refinery (REE) generated more than 30000 tons of

INTRODUCTION
17
dangerous byproducts in August 2014, and that new treatment processes are replacing the
old ones since the last renovation in 2015. These kind of improvements were already realized
in the refinery facilities in 1987, 1995 and 1997 allowing to increase the refining capacity from
55000 to 110000 barrels per day; but, these technical adjustments have not improved the
refinery's impact on the environment (Cevallos, 2015).
In 2015, the Ecuadorian Ministry of Environment (MAE) inventoried 3 refineries (2 in the
Pacific coast and 1 in the NEAR), 2 main oil pipelines, 6383 wells and 1190 platforms while the
environmental liabilities were estimated at 1170 oil spills and 2489 waste pits (Ministerio del
Ambiente (MAE), 2015a). These liabilities have induced important environmental and social
impacts; several indigenous communities were forced to migrate (Buccina et al., 2013) and
the pollution of surface and ground waters in Orellana and Sucumbíos provinces affected this
rich biodiverse area (Bustamante and Jarrín, 2005; Marx, 2010; Wernersson, 2004).
According to the MAE-PRAS (2015), 97 % of the total environmental liabilities (waste pits and
oil spills) is located in the NEAR being the water the abiotic component that local people claim
as the most affected by oil activities (Clinica Ambiental and CSS, 2017).
The activities involved in the oil industry are grouped into five main phases: (1) exploration,
(2) exploitation or production, (3) storage and transport, (4) refining and (5)
commercialization. These activities impacts on the environment mainly affect water sources.
However, production and transport phases are the most critical due to the high volumes of
formation water (very salty liquid that contains hydrocarbons and metallic elements), drilling
mud, process water and the risk of spills (Avellaneda, 2005; Fontaine, 2013). The activities of
exploration-exploitation are now in charge of the Petroamazonas public company while the
activities of refining, transport and sale are under the control of the Petroecuador public
company. Some international-private companies (Chinese, Canadian, etc.) work together with
the national enterprises.
Some authors have listed many of the cause-effect variables in the case of oil pollution in the
Ecuadorian Amazon region (Buccina et al., 2013; IESC, 2004; Narváez, 2000; Widener, 2007).
Some of the current practices mentioned by these authors for the 1972-1993 period, and that
can affect negatively the aquatic system are shown in the Figure II, and listed below:
- One to three waste pools were built in the vicinity of oil wells to collect byproducts formed
by drilling mud, water, oil residues and formation water.
- Solid and liquid wastes were accumulated in pools or discharged directly into rivers and

INTRODUCTION
18
streams.
- Once waste was accumulated in pools, it was incinerated or recovered to be spread on local
dirt roads.
- Crude oil residues were often released by runoff into rivers and estuaries.
- Gas was burned; about 200 flares continuously burned 2 million cubic meters of gas per day.
The bad industrial practices during oil production in the Ecuadorian Amazon region for several
decades, represents a rare case of long-term chronic pollution where the adoption of
environmental regulation arrived late and with a biased applicability. To ensure a legislative
basis to the environmental protection and water quality, the TULSMA or “Texto Unico de
Legislación Secundaria del Ministerio del Ambiente” (MAE, 2015; MAE, 2003) was
Figure II. Oil waste disposal in the NEAR: A. Waste earthen pool and open flares. B. Dumping or liquid waste. C. Crude oil spread on local dirt road. (Credit photos: A and B from MONOIL, 2015; C from IESC, 2004).

INTRODUCTION
19
implemented by setting quality guidelines for water and liquid effluents in Ecuador but these
thresholds were seriously reduced by the “Reglamento Ambiental de las operaciones
hidrocarburiferas” (RAOHE, 2001) dedicated to the monitoring of oil activities effluents and
emissions. There are high disparities between them.
Quality guidelines given by the RAOHE have no changed since their publication almost 20 years
ago and are still considered for the effluents and emissions from oil industry, while TULSMA
that is more accurate as it includes the guidelines given by the World Health Organization
(WHO, 2017); it has been modified several times but reducing the number of monitored
parameters (MAE, 2015). RAOHE legislation presents thresholds for only four toxic metallic
elements (barium, chromium, lead and vanadium), for the Total Hydrocarbons (TPH) and Total
PAHs in water and liquid effluents from the oil industry processes. But in any normative, river
sediments control is considered while most of contaminants are hydrophobic. ). These both
two Ecuadorian regulations are presented in the Table I.
According to the RAOHE normative, which proposed to monitor the risk for aquatic life, two
criteria for choosing the sampling points are proposed: directly into the discharge point of the
industrial effluent or downstream in the freshwater body receiving the effluent. In the
TULSMA normative, effluents quality to freshwater body is controlled regarding the water
uses (drinking water, preservation of aquatic life, etc.)
Are these effluents allowed to flow directly into a freshwater body? Do they affect aquatic life?
And if formation waters reach the main sources of water used by the populations, is there any
risk to human health?
Some questions that allows to visualize the ambiguity of the two Ecuadorian regulations
regarding the oil activities monitoring and control.
Table I. RAOHE and TULSMA water guidelines (mg.L-1) for Ba, Cr, Pb, V, TPH and PAHs
ELEMENT
RAOHE1 RAOHE2 TULSMA TULSMA Discharge
point Control point
Preservation of aquatic life
Input to sewer system
Barium <5 -- 1.0 -- Chromium <0.5 -- 0.032 0.5 as Cr(VI)
Lead <0.5 -- 0.001 0.5 Vanadium <1 -- -- --
TPH <0.5 <0.5 0.5 20.0 PAHs <0.0003 <0.0003 -- --
Source: Table 4 from RAOHE (2001); Table 2 and Table 8 from TULSMA-2015 (MAE, 2015) 1.- Point where effluents are discharged after treatment 2.- At least 300 meters downstream of the discharge point

INTRODUCTION
20
I.1.2. Social and health context in oil activities zones in Ecuador
The petroleum production zones in Ecuador constitute an interesting case of study because it
reflects the historical evolution of the land and natural resources use. It is possible to visualize
the relations economy-society-environment and identify a group of four actors that define
this dynamic: 1) the native inhabitants 2) the extractive companies, 3) the local and
international organizations and 4) the Ecuadorian State (Juteau-Martineau, 2012). This latter
has been the main integrator (positively or negatively) among the other actors during the
stages of the development of the country before the agrarian reform (Juteau-Martineau et al.,
2014), during the first and second agrarian reform period (1964-1979) and in the petroleum
era (since 1973).
Before the agrarian reform, in the Amazon rainforest, the relationships between the native
inhabitants and Nature were based in an itinerant small-scale agriculture and other productive
practices preserving the ecological equilibrium and the conservation of natural resources in
the long term (Varea et al., 1995). The Ecuadorian economy was based on the exportation of
raw agriculture products coming from the coastal region (banana and cocoa) and the rural
population generally served as workforce in these activities (Acosta, 2006).
During the first agrarian reform period (1964-1972), only Pichincha and Esmeraldas (where
access roads existed) and Morona Santiago (where roads were built to encourage migration
to the Southern Amazon) showed important new areas of colonization (Gondard and
Mazurek, 2001). During this period, the petroleum industry, centered on the Pacific coast, was
minimal (EP Petroecuador, 2013). But, a strong colonizing boom occurred since the issuance
of the second agrarian reform law, which coincided with the start of oil production in the NEAR
(1972) and the construction of the refinery (1975) in the Esmeraldas province (Wasserstrom
and Southgate, 2013). As a consequence of these events and of the mining activities, the
colonization of Amazonian provinces and Esmeraldas increased exponentially (Figure III).
When the road Quito-Lago Agrio was completed (1972), the NEAR became more accessible.
The Ecuadorian government advanced with the colonization of zones considered uninhabited
(ignoring the right of original groups regarding the land occupation) and the oil companies
were asked to build complementary facilities (roads and bridges) (Wasserstrom, 2013). The
companies that exploited natural resources (wood, petroleum, etc.) with the complicity of the
government forced the displacement of ethnic groups, and the confrontation between
“colonos” and indigenous people became usual (Jarrín et al., 2016). The petroleum, logging or
agro-industrial companies were based on economic interests extracting the natural resources

INTRODUCTION
21
with the minimum investment in workforce and technology; the “colonos” who became the
main local workforce in the companies, expanded the agriculture for their self-consumption
or to supply the local market (Gondard and Mazurek, 2001; Varea et al., 1995). In these
productive schemes, neither environmental nor socio-cultural aspects were considered.
The new settlers (“colonos”), without technical assistance or financial resources, cut down the
forest and applied the same techniques from his place of origin generating important soil
degradation; some ancestral practices such as the itinerant agriculture were lost or modified.
The economy became dependent of petroleum exportations (Acosta, 2006). But the effects of
oil production on populations and the environment were multiple (See Section I.1.1)
In a health context, several epidemiological studies assigned human health affections in
communities based near oil infrastructures due to chronic exposure to crude oil and its toxic
byproducts. These studies reported respiratory diseases, skin symptoms and lesions, and
chronic effects including psychological disorders, endocrine and reproductive affections and
Figure III. Colonization in Ecuador: accumulated surface in km2 (from: Gondard and Mazurek, 2001).

INTRODUCTION
22
genotoxicity with leukemia, miscarriages and different sort of cancers (Arana and Arellano,
2007; Hurtig and San Sebastián, 2005; IESC, 2004; Kelsh et al., 2009; San Sebastián and Hurtig,
2005) with water being one of the main vectors of contaminants (O’Callaghan-Gordo et al.,
2016; Ramirez et al., 2017; Levy and Nassetta, 2011).
Hurtig and San Sebastian (2002) reported that cancer rates in Ecuadorian communities living
close to oil exploitation areas were higher than in the rest of the country, possibly linked, as
proposed by different authors in the 2000’s, to oil-based pollutants such as benzo(a)pyrene
discharged into oil production areas (Buccina et al., 2013; Hurtig and San Sebastian, 2002). But
any serious data on environmental impacts of oil activities on the water and soil quality were
published to confirm this hypothesis.
More recently, Webb et al. (2016) analyzed mercury and 1-hydroxypyrene(1-OHP) in urine
samples from humans living in the Amazonian oil production zones in Peru and Ecuador, and
determined that women using surface water for washing and bathing showed higher contents
of mercury and PAHs; this author found also that men exposed to mercury concentrations
were higher in Peru and in individuals involved in oil spill remediation activities.
But the health issue is more complex since, in environmental epidemiology, there is no direct
relationship between causes (oil by-products emissions in the environment) and health effects
(cancer incidences), even if inhabitants living in oil areas show different signs and symptoms
of an acute and/or chronic exposure to crude oil and gas compounds. For example, in 2008,
genotoxic analyses on individuals from the NEAR confirmed that the exposition to
hydrocarbons has produced DNA damage and increased the risk of developing cancer (Paz-y-
Miño et al., 2008).
I.1.3. Socio-scientific context of the MONOIL project
In this general context of oil production and impacts on Amazon rainforest environment and
inhabitant’s health, in 2008, Ecuador established a new Constitution which recognizes the
right of Nature to be restored, the rights of people to live in a healthy environment, and the
action of the State to guarantee the health and the restoration of the ecosystems in the case
of environmental disasters (AC, 2008). The Ecuadorian Government has established the
“Programa de Reparación Ambiental y Social” (PRAS). This program includes the public policy
of repairing damages or environmental liabilities as a necessity of the Ecuadorian State
(Bissardon et al., 2013a; Ministerio del Ambiente (MAE), 2012).
In 2010, the “Secretaría Nacional de Ciencia y Tecnologia” (SENESCYT) and the oil company

INTRODUCTION
23
EP-Petroecuador requested the French Institute of Research for the Development (IRD) to
help them in understanding better all the social and environmental consequences of oil
activities since the first period of oil exploitation in the Ecuadorian Amazon region. From 2010,
in straight collaboration with French and Ecuadorian academic and institutional partners,
IRD’s team developed and implemented a binational research project for evaluating the
impacts of oil activities in Ecuador, the MONOIL program which aims to improve
transdisciplinary knowledge on the social and environmental impacts related with the oil
activities in Ecuador (ANR, 2013). This Program has been funded by the French National
Research Agency (ANR, 2014-2018) and some additional helps have been offered in France by
the IRD and the CNRS, and in Ecuador by the USFQ, the EPN and the UASB Universities; and
the SENESCYT (2 PhD grants).
This Thesis is part of the second main objective and the task 3 of the MONOIL program:
“Monitoring of oil activities in Ecuador: a cross-disciplinary approach between Environment,
Health and People”, that aims to measure the impacts and risks of chemical mixtures of
polycyclic aromatic hydrocarbons (PAH) and trace metal(oid)s (TM) associated with extractive
activities on waters, sediments and aquatic food chains.
In the large and pluridisciplinary MONOIL program, this specific work aims to determine the
origins and the levels of pollution caused by oil activities on the environment in the Ecuadorian
Amazon Region as the center of oil production and in the Ecuadorian Pacific coast, where the
main refinery of the country is located. The study area is thus presented before describing the
different objectives of this work thesis.
I.2. STUDY AREA
I.2.1 Amazon Region: specificities
The Amazon Region in Ecuador represents 45% of the total surface of the country and is placed
over a sedimentary zone that includes plains, areas with steep slopes, swampy and sandy
areas; this region is mainly formed by lateritic soils of volcanic coats that are characterized by
their high content of iron and aluminium oxides (Figure IV); it is located between 200 and 1
200 m.a.s.l and the climate is defined as wet and rainy with an average temperature of 25 °C
and an annual precipitation of 500 to 4 000 millimeters (Narváez, 2000; Schlesinger, 2000).
During the year, the presence of abundant rains tends to be constant without a marked
seasonality (Foucault, 2016); but there are two periods in which precipitation has a major
influence: the first from December to April, and the second from September to November,

INTRODUCTION
24
with maximum values in March–April and in October. The minimum rainfall is registered from
June to August (Armijos et al., 2013; Gualpa et al., 2001). The mean annual precipitation
decreases from the North to the South, from 3100 mm in the Napo basin, and 2000 mm in the
Santiago basin (Laraque et al., 2007; USDA, 2005)..
Sands saturated with heavy-crude oil and asphalt emerge along the banks of the Hollin,
Jodachi and Napo rivers; the oilfields date from the Cretaceous and the reservoir rock consists
of sandstone from Hollin, Napo and Tena formations (Baby et al., 2014). 68 200 km2 (68%) of
the Ecuadorian Amazon is covered by oil blocks from the Andean piedmont till the Peruvian
border (Figure IV); with 8.3 billion barrels of proved reserves and an average daily production
of ~550000 barrels (EP Petroecuador, 2013; Lessmann et al., 2016; OPEC, 2018).
Figure IV. USDA soil classification and oil blocks distribution in Ecuador (modified from: USDA, 2005 and MAE and PRAS, 2015).
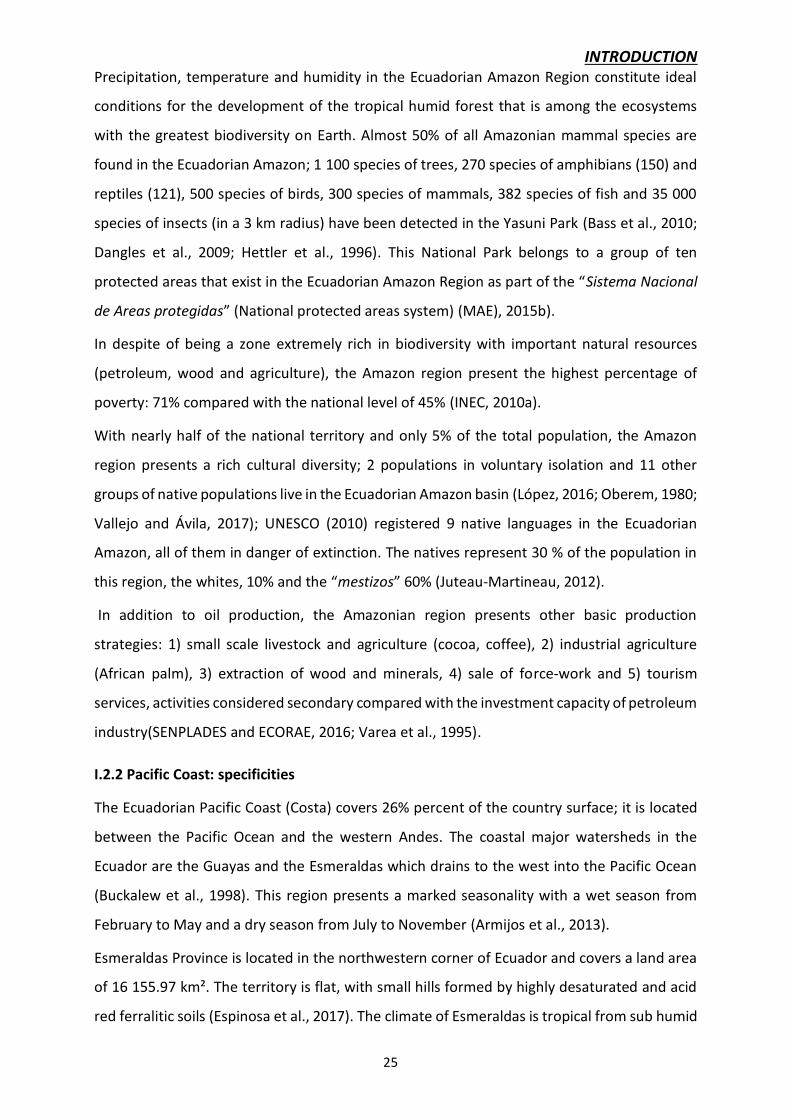
INTRODUCTION
25
Precipitation, temperature and humidity in the Ecuadorian Amazon Region constitute ideal
conditions for the development of the tropical humid forest that is among the ecosystems
with the greatest biodiversity on Earth. Almost 50% of all Amazonian mammal species are
found in the Ecuadorian Amazon; 1 100 species of trees, 270 species of amphibians (150) and
reptiles (121), 500 species of birds, 300 species of mammals, 382 species of fish and 35 000
species of insects (in a 3 km radius) have been detected in the Yasuni Park (Bass et al., 2010;
Dangles et al., 2009; Hettler et al., 1996). This National Park belongs to a group of ten
protected areas that exist in the Ecuadorian Amazon Region as part of the “Sistema Nacional
de Areas protegidas” (National protected areas system) (MAE), 2015b).
In despite of being a zone extremely rich in biodiversity with important natural resources
(petroleum, wood and agriculture), the Amazon region present the highest percentage of
poverty: 71% compared with the national level of 45% (INEC, 2010a).
With nearly half of the national territory and only 5% of the total population, the Amazon
region presents a rich cultural diversity; 2 populations in voluntary isolation and 11 other
groups of native populations live in the Ecuadorian Amazon basin (López, 2016; Oberem, 1980;
Vallejo and Ávila, 2017); UNESCO (2010) registered 9 native languages in the Ecuadorian
Amazon, all of them in danger of extinction. The natives represent 30 % of the population in
this region, the whites, 10% and the “mestizos” 60% (Juteau-Martineau, 2012).
In addition to oil production, the Amazonian region presents other basic production
strategies: 1) small scale livestock and agriculture (cocoa, coffee), 2) industrial agriculture
(African palm), 3) extraction of wood and minerals, 4) sale of force-work and 5) tourism
services, activities considered secondary compared with the investment capacity of petroleum
industry(SENPLADES and ECORAE, 2016; Varea et al., 1995).
I.2.2 Pacific Coast: specificities
The Ecuadorian Pacific Coast (Costa) covers 26% percent of the country surface; it is located
between the Pacific Ocean and the western Andes. The coastal major watersheds in the
Ecuador are the Guayas and the Esmeraldas which drains to the west into the Pacific Ocean
(Buckalew et al., 1998). This region presents a marked seasonality with a wet season from
February to May and a dry season from July to November (Armijos et al., 2013).
Esmeraldas Province is located in the northwestern corner of Ecuador and covers a land area
of 16 155.97 km². The territory is flat, with small hills formed by highly desaturated and acid
red ferralitic soils (Espinosa et al., 2017). The climate of Esmeraldas is tropical from sub humid

INTRODUCTION
26
to very humid, with an average temperature of 23 °C. The Teaone and Esmeraldas Rivers make
up the hydrological system of the province. Esmeraldas is part of the Choco microregion that
has one of the highest rates of biodiversity in the world (Sierra et al., 2009)
The population in Esmeraldas represents 3% of the total Ecuadorian population and is defined
as afrodescendant and “mestizo” (INEC, 2010b). Despite of the industrial activities (thermal
plant, refineries, etc.), this region is considered as one of the poorest in Ecuador (SENPLADES,
2015). Much of its economy depends on tourism, the production of shrimp, banana and cocoa;
and livestock (PUCE-Esmeraldas, 2017).
I.3. GENERAL OBJECTIVE
The main objective of this work is to study the impacts of current and past oil activities on
water quality of the Ecuadorian Amazon basin (oil production area) and the Esmeraldas River
watershed (refining zone) by the determination of the concentrations of polycyclic aromatic
hydrocarbons (PAHs) in surface water and sediments. The specific study of metal(loid)s and
PAHs contents in water sources used for the human consumption will provide information on
exposure levels of populations living in these areas.
I.4. SPECIFIC OBJECTIVES
• Measure the concentrations of PAHs in sediments and surface waters (dissolved and
particulate phase) from petroleum production and refining areas.
• Measure the concentrations of trace metal(oid)s and PAHs in human consumption
waters from petroleum production and refining areas
• Compare the results with a control watershed located in the Southern Amazon basin
and unaffected by extractive activities.
• Identify the sources of contaminants in surface and/or drinking waters.
• Compare the results with national and international environmental guidelines.
• Calculate health risk indices for carcinogenic and non-carcinogenic elements in
drinking waters
• Propose recommendations for local populations to reduce the risk of exposure to
contaminants.
The present manuscript is divided into two big chapters presented in scientific publication
format, one dealing with environmental quality of surface waters and sediments, in areas
impacted by oil activities; and the other focusing on health quality of drinking waters in

INTRODUCTION
27
Ecuador. The Supplementary information is also included in each chapter, and other additional
information is presented as an appendix at the end of the manuscript thesis.
The Chapter 1 is a draft version of a scientific article entitled “Polycyclic aromatic
hydrocarbons (PAHs) in surface water and sediments at oil exploration and refining sites in
Ecuador: concentrations and source distribution”. In this draft article, polycyclic aromatic
hydrocarbons are specifically studied; PAHs contents in surface waters and sediments are
compared in oil impacted areas with a pristine region not disturbed by extractive activities
taking into count the current national and international quality guidelines to preserve the
aquatic life. The mean SQG quotient was used to define the priority relative to the level of
toxicity; the toxicity-equivalent benzo(a)pyrene factor (TEF) was employed to define the
carcinogenic risk, and an important source tracing was done by using the isomeric-ratios
method.
The Chapter 2 entitled “Drinking water quality in areas impacted by oil activities in Ecuador:
associated health risks and social perception of human exposure” deals with concentration
data for PAHs and metal(oid)s in drinking waters from the Pacific coast and the Amazon region.
Results were compared to Ecuadorian and International quality guidelines and an assessment
of health risks involved by the two exposition pathways (dermal and ingestion) is proposed
considering a scenario on two populations (adults and children).Actually, by using different
raw water sources as domestic water supplies, Ecuadorian populations can endanger their
health since oil pollutants can reach aquatic systems. Some recommendations are also
proposed. This Chapter 2 corresponds to an article published in Science for The Total
Environment (STOTEN) in July 2019.
And finally, a last part of general discussions and perspectives is presented at the end of the
manuscript.

28
xxx

CHAPTER 1
29
CHAPTER 1. Tracing oil activities sources by PAHs distribution
in surface water and sediments of the Amazonian and coastal
regions of Ecuador
Forewords
“Je découvre que l’absence a une consistance. Peut-être celle des eaux sombres d’un fleuve, on jurerait du pétrole, en tout cas un liquide
gluant, qui salit, dans lequel on se débattrait, on se noierait. Ou alors une épaisseur, celle de la nuit, un espace indéfini, où l’on ne possède
pas de repères, où l’on pourrait se cogner, où l’on cherche une lumière, simplement une lueur, quelque chose à quoi se raccrocher, quelque
chose pour nos guider. Mais l’absence, c’est d’abord, évidement, le silence, ce silence enveloppant, qui appuie sur les épaules, dans lequel on
sursaute dès que se fait entendre un bruit imprévu non identifiable, ou la rumeur de dehors.” -Phillipe Besson, 2017
"I discover that absence has a consistency. Perhaps that of the dark waters of a river, we would swear oil, at least a sticky liquid, which dirties,
in which we would struggle, we would drown. Or maybe it's a thickness, the thickness of the night, an indefinite space, where we don't have
any landmarks, where we could hit each other, where we look for a light, just a glow, something to hold on to, something to guide us. But
absence, of course, is first; and the silence, that surrounding silence that presses on the shoulders, and in which one jumps as soon as an
undefined and unexpected noise is heard; or the rumour from outside." -Phillipe Besson, 2017
Polycyclic aromatic hydrocarbons (PAHs) are considered as ubiquitous contaminants in the
environment; they are formed by three or more benzene rings in its structure (Figure V); but
the molecules with four to seven rings are considered particularly toxic. PAHs are generated
by the incomplete combustion of organic materials (wood or fossil fuels); in general PAHs of
high molecular weight (e.g., fluoranthene, benzo(a)pyrene) are considered issued of
combustion while the molecules of low molecular weight (e.g., naphthalene, fluorene) and
the alkylated ones are associated to unburned petroleum (Crane and Hennes, 2007).
Environmental quality has been traditionally based on specific water and sediment thresholds
developed and adopted by different countries. These thresholds or guidelines are developed
since toxicity tests on benthic environments and recommended for protecting the aquatic life
from adverse effects (CCME, 1999). In the case of sediments Keshavarzi et al. (2015) classified
the different sediment quality guidelines (SQG) as follows:
-Effect range low (ERL) and threshold effect level (TEL) are thresholds below which adverse
effects are not expected;
-Effect range median (ERM) and probable effect level (PEL) are thresholds related with
concentrations where adverse effects are more probable to be manifested.
A description of TEL, PEL and different effect ranges are presented in the Figure VI.

CHAPTER 1
30
Other values like the “no observed effect level” (NOEL) and the “lowest observed effect level”
(LOEL) are also important thresholds used for developing specific sediment quality guidelines
(CCME, 1999).
Although many environmental quality guidelines (water and sediments) have been proposed
by different countries, the criteria given by the NOAA (2008) and CCME (2018) have become
Figure V. Structure of sixteen US-EPA parent PAHs. (*) Molecules considered as possibly carcinogenic (modified from CCME,2010).

CHAPTER 1
31
the most frequently employed to assess environmental quality based on the charge of
pollutants in sediments (Hübner et al., 2009; Kwok et al., 2014). These SQG are nearly similar
since they both are based in the rapports developed by Long and Morgan (1990) and compiled
by Swartz (1999). Not being deeply modified since then, they are considered as the most
accurate sediment quality criteria for aquatic ecosystems (Burton, Jr., 2002; de Deckere et al.,
2011; Ugwu and Ukoha, 2018).
Some chemicals are harmless individually and/or at low doses, but can be harmful when they
interact. Amiard (2017) defines four ways in which chemicals can interact (synergy,
antagonism, inhibition and potentiation). It is called "the cocktail effect" and cannot be
evaluated by the individual toxicity thresholds, because they do not take into account the
different interactions. The identification of these conjugated effects constitutes a major
scientific challenge and some methods has been proposed (Choudhury et al., 2000; European
Commission, 2012).
There are many aspects where environmental conclusions based on GC and GCMS data may
be unclear, or inadequate, in general as a result of weathering processes (evaporation, photo
oxidation, water washing, and biodegradation: they change the distribution of components in
the spilled material making it very different from the original sample. The possibility of
incorporating the isotopic analysis (carbon and/or hydrogen isotopic analysis) can eliminate
many of these uncertainties because stable isotopes have the ability to permit a better
correlation between original and weathered samples; but even with isotopic chemistry an
individual compound from oil spills would be nearly useless for trace sourcing (Baskaran,
2012). The fingerprinting of the n-alkane fraction in crude oils and refined products combined
Figure VI. Conceptual example of threshold effect level (TEL) and Probable effect level (PEL).Source: CCME (1999).

CHAPTER 1
32
with isotopic analysis of carbon from individual homologues is also useful to tracing sources
of sediment contamination. But the principal aim of the different hydrocarbon fingerprint
identification techniques is to distinguish biogenic, petrogenic and pyrogenic sources (Wang
and Fingas, 2003) .
Measuring and defining environmental risk and tracing sources of oil pollutants (PAHs) are the
main topics in our first chapter developed in the lines below.

CHAPTER 1
33
Polycyclic aromatic hydrocarbons (PAHs) in surface water and sediments
at oil exploration and refining sites in Ecuador: concentrations and source
distribution
Fausto López1,6, Laurence Maurice1,2, Hélène Budzinski3, Karyn Le Menach3, Hala Jamhoury4,
Emilie Lerigoleur5, Jenny Ruales6, Emmanuelle Cadot7, Marie Hélène Devier3, Valeria
Ochoa8, and Eva Schreck1
1 Géosciences Environnement Toulouse (GET), Observatoire Midi Pyrénées, Université de Toulouse, CNRS, IRD, 31400 Toulouse, France. 2 Universidad Andina Simón Bolívar, Área de Salud, Toledo N22-80, P.O. Box 17-12-569, Quito, Ecuador. 3 Laboratoire de Physico- et Toxico-Chimie de l’Environnement (LPTC), Molecular Sciences Institute (ISM), Université de Bordeaux 1, CNRS, 33405 Talence, France. 4 Institute of Environmental Engineering, ETH Zürich, 8093 Zürich, Switzerland. 5 Géographie de l'Environnement (GEODE), Maison de la Recherche, Université de Toulouse, CNRS, 31058 Toulouse, France 6 Escuela Politécnica Nacional (EPN), Department of Food Science and Biotechnology, P.O. Box 17-12-759, Quito, Ecuador 7 Hydrosciences Montpellier (HSM), IRD, CNRS, Université de Montpellier, 300 Avenue du Professeur Emile Jeanbrau, 34090 Montpellier, France 8 Universidad San Francisco de Quito, Colegio de Ciencias e Ingenierías, Diego de Robles y Vía Interoceánica, P.O. 17-0901, Quito, Ecuador
Highlights
• PAHs concentrations in surface waters were in range with levels measured in control zones.
• Punctual pollution was found in few streams of the refining and extraction areas.
• The perylene predominance highlights the biogenic fingerprint in the sediment’s PAHs content.
• Sedimentary and dissolved phases are in compliance with quality guidelines.
• Cluster analysis applied to Isomeric ratios showed the fingerprint of ancient pollution.

CHAPTER 1
34
Abstract
Polycyclic aromatic hydrocarbons (PAHs) are compounds of environmental and health
concern due to their toxicity. In rivers, PAHs can accumulate in sediments and suspended
materials increasing the risk of exposition and damage to aquatic flora and fauna. In Ecuador,
several natural (volcanism, organic matter decomposition) and anthropogenic sources (slash
and burn, incomplete combustion of wood and fossil fuels, oil refining and production, oil
spills, etc.) are suspected to have an important effect on the distribution and transport of PAHs
in rivers. In the present study, concentrations of 39 PAHs containing the sixteen parent PAHs
recommended by the U.S. Environmental Protection Agency (US EPA) and their alkylated
forms were determined in surface water and sediments of the crude oil production zone
(Napo and Aguarico river basins) and the refining zone (Esmeraldas river basin). Their
distribution has been compared to rivers located in non-extractive sites.
Alkyl-naphthalenes represented the most important fraction of total aromatic charge in the
dissolved phase. With PAHs concentrations below the international quality guidelines for the
preservation of the aquatic life, surface waters are not at risk in the different basins except in
the national refinery effluent and in one point located in an oil field (Auca 22).
The total aromatic charge in sediments showed in most of the sampling sites an important
biogenic fingerprint due to the predominance of perylene. The alkylated-low-molecular
weight compounds were the most abundant fraction in all sites, which indicates a petrogenic
origin. By considering the non-alkylated PAHs in sediments, significant correlations were
found between the Auca-oilfield sampling points and the crude oil showing that sediments
collected from Rumiyacu and Tiputini Rivers are directly affected by oil extraction activities.
Similar results were obtained along the Aguarigo River in the parishes of Dureno, Pacayacu
and Shushufindi.
In the Amazon region, oil activity is considered by local communities as the main source of
environmental pollution and health risk. Even if there is evidence that natural petrogenic
sources are meaningful, we found that pyrolytic and biogenic sources are not negligible.
Keywords: polycyclic aromatic hydrocarbons, sources, environmental quality, surface water,
sediments, risk

CHAPTER 1
35
1. Introduction
Ecuador is affected from east to west by all the petroleum-industry stages, most of which are
centered in two areas the Northeast Amazonian region (NEAR), focused on crude extraction
and characterized for having the totality (99.8% of oil rigs) of crude extraction facilities, and
the Northeast Pacific Coast (NEPC), related with refining process, where 155000 barrels per
day (90 % of the total refining capacity) are treated, with the majority (110000 barrels per
day) being processed in the Esmeraldas refinery (BCE, 2018; EP Petroecuador, 2013).
Petroleum activities executed in Ecuador during the last four decades, in particular during
the period from 1970 to 1993, are related with many environmental and social problems.
As a consequence of the lack of environmental policies, crude-waste byproducts were
directly released in the environment, polluting waters, air and soils, affecting humans health,
as well as the local flora and fauna (Clínica Ambiental, 2017; Jochnick and Normand, 1994;
Paz-y-Miño et al., 2008; San Sebastián and Hurtig, 2005). The dumping of oil-waste and
crude oil in the Ecuadorian Amazon region is considered among the most extreme cases of
pollution in the world, with 18 billion gallons of formation-water and 16 million gallons of
spilled crude, approximately 50% more than the crude dumped by the Exxon Valdez in Prince
William Sound, Alaska, in 1989 (Buccina et al., 2013; Narváez, 2000; Skinner and Reilly, 1989).
The “Centro de Estudios para America Latina y el Caribe”, CEPAL (1990), noted that the
infrastructural obsolescence of the Esmeraldas Refinery contributed to chronic
environmental pollution in the nearby of the Esmeraldas Refinery (REE), where the liquid
effluents used to be diluted and dispersed in the Teaone and Esmeraldas rivers.
Since hydrocarbons constitute the main fraction of crude oil, many organic molecules, in
particular the polycyclic aromatic hydrocarbons (PAHs) have been widely used to trace the
petrogenic origin of pollution (Benlahcen et al., 1997; Chen et al., 2015; Li et al., 2014;
Speight, 2002). PAHs are molecules formed by multiple (2 to 6) fused aromatic rings and
distributed in the different environmental compartments as function of their solubility and
vapor pressure, these physicochemical properties (Table SI-1) are inversely correlated with
the molecular weight and the alkylated substituents (Jørgensen and Fath, 2010). Therefore,
low molecular weight species (2-3 benzene rings) are mostly found in water and high
molecular weight species (4-6 benzene rings) are dominant in particulate matter and
sedimentary bed.
As other persistent organic pollutants (POPs), most PAHs can resist to environmental

CHAPTER 1
36
degradation resulting in their bioaccumulation and increasing the probability of exposure and
the risk of acute and chronic toxic effects on human health and the environment (Abdel-Shafy
and Mansour, 2016). Though non-metabolized PAHs are suspected to produce toxic effects
(i. e. ingested or inhaled naphthalene is related with the destruction of red-blood cells), a
higher concern is given to the produced metabolites, such as epoxides and dihydrodiols, since
these molecules present probed genotoxic and carcinogenetic properties (Rengarajan et al.,
2015).
PAHs with alkylated substituents, commonly present in crude oils and ancient sediments, are
known to be more abundant, persistent ant toxic than parent PAHs; hence including the
alkylated PAHs along with the parent PAHs concentrations is thus important in a risk
assessment (Budzinski et al., 1995; Casal et al., 2014)
Once in the human body, PAHs are easily absorbed in the intestine, and metabolized by the
liver. A study done on aquatic species after a marine oil spill, showed that PAHs in fish and
crustaceans can contribute from 2 to 7% in human exposure by ingestion pathway (Amiard,
2017).
For their carcinogenic and mutagenic properties, 16 molecules have been considered as
priority pollutants by the US-EPA; this list includes seven molecules (benzo(a)anthracene,
chrysene, benzo(a)pyrene, benzo(b)fluoranthene, benzo(k) fluoranthene,
dibenz(a,h)anthracene, and indeno(1,2,3-cd)pyrene) considered as carcinogenic for humans
(Bojes and Pope, 2007; US EPA, 2015a). Amiard, (2017) claims that PAHs in humans can
induce hematological, immunological, hepatic and reproductive disorders, with 4-5 aromatic
rings being the most carcinogenic, in particular the Benzo(a)pyrene.
Despite the concerning health issue, till now, no precise data on PAHs contents and
distribution in the aquatic systems of the Ecuadorian oil exploration and refining sites were
available. This work is based on the analysis of polycyclic aromatic hydrocarbons (PAHs) in
surface water and sediments from the main basins of two Ecuadorian regions affected by oil
activities in order to: (i) analyze the influence of oil activities on environmental quality (PAHs
concentrations) of waters and sediments by comparing the zones of crude extraction and
refining areas with control zones; (ii) compare PAH concentrations in water and sediments
with different quality guidelines and (iii) Asses the fingerprint of the PAHs origins by using
statistical methods as Principal Component Analysis (PCA ) and Hierarchical Cluster Analysis
(HCA ).

CHAPTER 1
37
2. Materials and methods
2.1 Study Area
Extraction zone
The Ecuadorian Amazon region represents 116 588 km2 (2% of the total Amazonian rainforest)
and covers nearly half of the Ecuadorian territory (Ríos and Oliveira-Miranda, 2015). The oil
extraction facilities are located in the northern part of the Ecuadorian Amazon region (NEAR);
this zone is known as a hot spot of biodiversity, being even considered as the richest place on
Earth in terms of biodiversity (Dangles et al., 2009). Average precipitation levels can reach
4000 mm annually with air temperatures nearly constant and a not very differentiate
seasonality during the year (Armijos et al., 2013; Schlesinger, 2000). Along the Napo and
Aguarico Rivers, seven sub-basins were selected between 75°12'0"-77°47'58"W and 0°3'25"N-
1°2'50"S. This area covers the parishes of Dayuma and Pacayacu considered as the main hot
spots of oil extraction in Ecuador (Bustamante and Jarrín, 2005) and for comparison a control
area was chosen in the Southern Amazon (Morona-Santiago province) between 77°41'00"-
78°34'51"W and 2°53'00"-3°31'20"S (Figure 1-1) considered free of anthropogenic sources of
hydrocarbons, heavy metals and with geographical, geomorphological, ecological and
hydrological characteristics similar to those of the NEAR. And with a population density (6
people.km2) lower than Orellana (6.3) and Sucumbios (10) provinces (INEC, 2010).
Refining zone
In the refining study zone, the Teaone and the Esmeraldas river basins were considered. This
study area is located between 79°36'60"- 79°42'1"W and 0°42'26"- 0°57'35"N (Figure 1-1)
close to Esmeraldas city where the biggest refinery of the country (63% of the total national
refining capacity) is located. The Esmeraldas Province is part of the Choco micro-region, a hot
spot of biodiversity characterized by a marked seasonality with a wet season from February
to May, a dry season from July to November and an annual average precipitation of 368 mm
(Armijos et al., 2013; Sierra et al., 2009). A specific site (1°11'38.53"S; 80°19'50.91"W) at the
South, in the Portoviejo basin (Manabi Province) was considered as the reference point of the
NEPC.
2.2 Sample Collection
A total of 90 water and 85 sediment samples (Table C-1) were collected between 2012 and
2016 during the dry and rainy seasons (Figure SI-1) considering the location of oil facilities

CHAPTER 1
38
throughout the Napo and Aguarico Rivers’ basins, the refining zone in Esmeraldas and 2
control areas at the South (Morona, Santiago and Portoviejo Rivers).
Water samples were collected in 2L amber glass bottles, filtered a couple of hours after the
sampling on glass-fiber membranes (0.7 µm) and kept frozen (-18°C) in 10 ml SPME (solid
phase micro extraction) glass vials until analysis. All the material was previously calcined at
550°C.
Sediment samples were obtained by scraping the top 1-3 cm of the surface sediment at the
riverbanks according to USEPA considerations given in the SW-846 (US EPA, 2014): a metallic
sampler was used and the collected samples were placed in aluminum boxes. In addition to
sediment river samples, a natural bituminous sandstone from the Andean headwater (Napo)
and a residual soil from an ancient waste pool close to Auca 08 oil pit were collected. Two
samples of crude oil (national pipeline and Auca 03 oilfield) were also collected. All the
samples were kept frozen at -18◦C until analysis.
2.3 Chemical analysis
Parent HAPs and their alkylated forms in the dissolved phase were determined by Solid-phase
microextraction (SPME) coupled to gas chromatography-mass spectrometry (Agilent
Technologies:7890GC-5975MS) according to the methodology developed by Kanan et al.
(2012). The quantification limits were calculated as 10 times the reagent blanks standard
deviation (SD) and quality control analysis was performed by using supra-pure water enriched
with 10µl of a reference solution (MIX PAH45, Dr Ehrenstorfer) containing 18 native PAHs. In
addition, 15 µl of a solution containing a mixed of 19 deuterated PAHs (Cambridge Isotope
Laboratories, Inc) was added in each sample to correct losses due to manipulations as reported
in de-Perre et al. (2014). The recoveries obtained in the enriched water was equal to 101±7 %.
The freeze sediments were freeze-dried and subsequently treated by microwave extraction
(StartE, Millestone®). The extracts were pre-concentrated using a RapidVap vacuum
evaporation system (Labconco) and purified in column using dichloromethane and pentane in
two steps; the first one using active copper and alumina as stationary phase; and the second
one using silica in order to separate the aliphatic from the aromatic compounds. Purified
extracts containing the aromatic charge were re-concentrated to 300 µl of isooctane solution
under a gentle stream of nitrogen. Finally, total-PAHs concentrations of individual molecules
were determined by gas chromatography-mass spectrometry (Hewlett-Packard series: 5890
GC-5972MS).

CHAPTER 1
39
Figure 1-1. Location of study drainage basins and sampling points: Northern Ecuadorian Pacific Coast (NEPC), Northern Ecuadorian Amazon Region (NEAR), Southern Ecuadorian Amazon Region (SEAR) and Southern Ecuadorian Pacific Coast (SEPC).

CHAPTER 1
40
Reagent blanks and certified materials were analyzed altogether with the sediment samples.
The Fontainebleau sandstone (1-3 g) embedded with 100 µl of a reference solution (MIX
PAH45, Dr Ehrenstorfer) as well as 0.5 g of a marine sediment (SRM® NIST1941b) were used
to determine the recovery. A reference solution (Cambridge Isotope Laboratories, Inc)
containing 19 deuterated PAHs was diluted to obtain 2 mg.L-1 of each molecule, 30 µl of this
solution was added into each sample before extraction to calculate the response factors. The
average recovery of certified materials was 91±10 %.
As complementary analysis, nitrogen, carbon and sulfur (FLASH 2000 CHNS/O Analyzer;
ThermoScientificTM); and the grain size distribution (LA-950 Laser Particle Size Analyzer) were
determined in most of the sediment samples.
Different series of analysis were needed for the same year, so different quantification limits
were considered for each molecule.
2.4 Statistical analysis
In the complete database, the 50% of the annual-average limit of quantification was replaced
in all the values detected under the LQ. Values under the limit of detection were reported as
non-detected (nd). Excel and the complement RStudio from the software R were used for the
statistical analysis. Different basic statistic tests (normality, correlation, PCA and HCA) were
performed. Hierarchical Cluster and PCA were applied separately to the relative abundances
and isomeric ratios in order to differentiate the PAHs sources (natural and due to oil activities).
2.5 Environmental and human risk assessment
Many tools are proposed to evaluate the risk of PAHs distribution in the environment. All these
tools are based on different “toxicity reference values” (TRVs) like the quality
guidelines/reference concentrations, reference doses, toxic units and toxic equivalent
factors(Anses, 2018; European Commission, 2012).
Environmental quality guidelines, as defined by the US Environmental Protection Agency, are
the highest concentrations of contaminants in a specific compartment (water, sediments, soil,
air) that are expected not to pose a significant risk to most of the species in a given
environment (US EPA, 2015b, 2018a). Different water quality guidelines (WQG) for PAHs have
been developed at local and international levels; among them, the Canadian (CCME, 2018)
and European (European Commission, 1998) guidelines seem the most complete, and propose
quality guidelines for individual components, while Ecuadorian (RAOHE) and US-EPA
guidelines are defined by the sum of different molecules. A compilation of different surface

CHAPTER 1
41
water regulations is presented in Table SI-2.
The sediment quality guidelines (SQG) are defined as numerical limits from which toxicity tests
on benthic environments ensure the protection of the aquatic life from adverse effects (CCME,
1999); Keshavarzi et al. 2015) sets SQG in several ranges : “Effect range low” (ERL) and
“threshold effect level” (TEL) defined by concentrations below which adverse effects are
improbable and infrequently expected; “effect range median” (ERM) and “probable effect
level” (PEL) that define the concentration at which adverse effects are more probable to occur.
Other values like NOEL (no observed effect level) and LOEL (lowest observed effect level) are
also considered in Canadian sediment quality guidelines (CCME, 1999). In the case of Ecuador,
there is no regulation for PAHs contents in river sediments, but a recent amendment (TULSMA,
2015) allows the use of international SQGs except for oil activities monitoring (where RAHOE applies).
We used the ERL/TEL and PEL/ERM for assessing the environmental quality of the different basins.
References doses (RfD), According to the Environmental Protection Agency (US EPA, 2019) RfD
is a numerical estimate of a daily oral exposure to the human population that is not likely to cause
harmful effects during a lifetime. This concept is extrapolated for other exposure pathways as dermal
or inhalation, and can be used for evaluating acute or chronic human risk (A human risk analysis based
on reference doses related to water by dermal and ingestion pathways is presented in the Chapter 2).
Toxic units (TU) is defined as concentration of a chemical divided by a standard measure of its
toxicity TEL, PEL , ERL and ERM are typical values used as standard measures of toxicity (US
EPA, 2019). The addition of the individual TUs (accumulated toxicity) is considered as the toxic
units accumulated (TUA), and the mean is known as the " mean SQG quotient" (mSQGQ) .We
used the approach developed by Soliman et al. (2015) in assessing the Ecological Risk to obtain
two mSQG quotients based on the TEL and ERM, respectively; and estimate the potential
acute toxicity of the PAHs.
Toxic equivalent Factor (relative potency factors) this method allows to represent a group of
molecules with similar mechanisms of action as the concentration of a single molecule with a
well characterized toxicity. In the case of PAHs, multiplying the measured concentration of
the individual hydrocarbon by its corresponding TEF gives the concentration of the molecule
in terms of BaP, since BaP is considered the most well defined in terms of carcinogenicity and
toxicity; the addition of individual concentrations results in a total concentration of BaP
defined as the toxic equivalent quantity (TEQ) (Keshavarzi et al., 2015; Nisbet and LaGoy,
1992)
Alternatively, cartographic methods are also of current use for mapping hazards and risks

CHAPTER 1
42
(Baynard et al., 2013; Cuba et al., 2014; Durango-Cordero et al., 2018; Finer et al., 2008). To
determine the hydrocarbon pollution hazard we combined the surface runoff estimated with
the IRIP (Intensive Rainfall Runoff) method(Cadot et al., 2016). Since this method is based on
the environmental characteristics (geology, nature of soils, relief, land use, etc.) and takes into
account the multiplicity of sources, it was used only for the NEAR. In addition, the software
Qgis and Arcmap 10.4 were used to define the number of oil facilities (oilwells and flares) and
pollution sources (pits and pools, and oil spills) affecting each one of the sampling sites. These
results were integrated to our database and used for analyzing the correlation with the
molecules analyzed.
2.6 Identification of PAHs sources
From the main anthropogenic sources of PAHs, we can distinguish the pyrogenic PAHs
originated from the incomplete combustion of coal, petroleum and biomass, and the
petrogenic PAHs presented in petroleum products found in fossil fuels and crude-oil spills
(Amiard, 2017; Sun et al., 2017). The use of molecular ratios of isomeric PAHs in bottom
sediments allow to reduce the misinterpretation due to volatility, water solubility, adsorption,
etc; this method has been developed and widely used for source identification of PAHs
contamination (Budzinski et al., 1997; Sun et al., 2017, 2010, Yunker et al., 2014, 2002). This
method is based on the fact that low molecular weight (LMW) and alkylated PAHs are mainly
present in petrogenic sources, while pyrogenic sources are mostly formed by high molecular
weight (HMW) parent PAHs (Raza et al., 2013).
The ratios Phe-A and Fa-Py has been traditionally used to distinguish petrogenic and pyrolytic
sources; Phenanthrene is considered as the most thermodynamically stable among the LMW-
PAHs (Budzinski et al., 1997) and the presence of Phe, Flu and Py is related with a pyrolytic
origin of the pollution (Stogiannidis and Laane, 2015). Since naphthalene, is highly volatile and
hydrophilic (Douben, 2003) it is relatively unstable in sediments, thus it was not considered in
the analysis of sources.
For each site, different isomeric ratios were calculated and we considered that samples from
a common origin present similar isomeric ratios, they were used in a Hierarchical Cluster
Analysis (HCA) and PCA in order to trace de different sources in function of its nature. This is
a new approach proposed here that allows to treat all the isomeric ratios in an only one
analysis, instead of using the traditional bi-plot analysis.

CHAPTER 1
43
3. Results and discussion
3.1 Distribution of PAHs concentrations in surface freshwater
All the PAHs acronyms are presented in the Table SI-1.
3.1.1 Dissolved individual PAHs and total aromatic charge
Among the parent-PAHs with two or three aromatic rings (LMW), Ph (0.3-141 ng.L-1), Fl(0.3-
212 ng.L-1) and N (2.5-1830 ng.L-1) were present over the LQ in 87%, 56% and 40% of samples,
respectively. The other LMW-PAHs were present in 8% to 27% of the samples
(Anthracene=8%, acenaphthylene =13% and acenaphthene=27 % ). In the parent-PAHs from
tetra to hexa-aromatics molecules (HMW), the concentrations of BaA, BbjkF, BaP, IP, DBA and
BPe were under the limit of quantification (LQ) with most of non-detected data in 45, 56, 88,
97, 98 and 90% of sites, respectively. Pyrene concentrations ranged from 0.3 to 79 ng.L-1
distributed on 47 % of the sampling sites, followed by Fa (0.2-5 ng.L-1) in 39% of the samples
and BeP concentrations (07-2.4 ng.L-1) detected in 18 % of the samples where the only value
over the LQ was measured in the Teaone river (2.5 ng.L-1) at the REE channel outlet (VL-d4).
Perylene was detected (>LD) in 35% of the samples, but only the Tiputini river (point TI-b4) in
the Napo basin presented a value over the LQ (1.8 ng.L-1); this river is a black water river
draining a large forest basin without any Andean sources. The less frequently detected PAH
was Ch (0.3-8 ng.L-1) in only 10% of the sites.
Alkyl-PAHs were present (>LQ) in most of the samples: mono-methyl phenanthrenes (mMPh)
were found in 63 to 71% of water samples and methyl-naphthalenes were present in nearly
all the sites and ∑DMN in all the sampling points. In fact, in 90% of samples alkyl-naphthalenes
(nMN) represent the most important fraction (70-96 %) of the total aromatic charge (TAC)
followed by the mMPh (0.6 to 6% to TAC). The remaining alkylated-compounds were detected
with a frequency inferior to 33%. The ranges of the different molecules and the respective
percentages of sites with values over LQ are presented in the Table SI-7 and in the Figure 1-2.
Figure 1-2. Percentage of samples quantified in A) waters and B) Sediments.

CHAPTER 1
44
The TAC analyzed along the Pacific Coast Rivers ranged from 129 ng.L-1 in the Portoviejo basin
to 1803 ng.L-1 in the outflow of the refinery channel (VL-b6). This range is similar to the
extreme values found in the Amazon region (31-1134 ng.L-1) excluding the DY-j4 sampling
point (Auca 22) that reached 131726 ng.L-1. In the NEAR, we found two points with a TAC
similar to the point VL-e6 (1517 ng.L-1) in the Teaone river downstream the refinery. One of
these points was located in Auca 22 (1032 ng.L-1 in DY-k2), and the other one close to Atacapi
03 oil well in the Aguarico basin (1134 ng.L-1 in DU-c3, Dureno parish) upstream of the
Libertador oil field. The average concentrations of all the analyzed molecules in each sub-basin
are reported in the Table 1-1.
Comparing the different sampling points, the site DY-j4 (Tiputini River located in the Auca 22
oil well influence zone, close to Dayuma) presented the maximum concentrations for 26
molecules (79%) from the 33 analyzed; this point showed a TAC (131,726 ng.L-1) 73 times the
second highest value (1803 ng.L-1) measured in the refinery channel (VL-b6). These both sites
can be considered as the most contaminated from the whole study area; the Auca 22 (DY-j4)
point presented an aromatic charge 2278 times the value obtained in the upstream-cleanest
point from the Tiputini River and 1333 times the average from the Morona Santiago basin,
non-affected by extractive activities. The TAC in the effluents of the refinery (VL-b6) reached
10 and 14 times the average aromatic charge found in the same River upstream (CC-a6, CC-b4
and VL-a3) and in the reference basin (SA6), respectively. This site also revealed the presence
of phenanthrene, anthracene, methyl-anthracene and methyl-phenanthrenes in
concentrations that the analysis method did not allowed to determine individually due to
important peak interferences between molecules. Although the results (Figure SI-2) of TAC
and 16PAH are underestimated for the refinery effluents, even so this site presented the
highest PAHs concentrations measured in the NEPC, placing the Teaone River as the most
contaminated Ecuadorian River in relation to aromatic hydrocarbons.
The TAC trends to grow in urbanized places and in points close to oil facilities (Figure 1-3). We
can consider that a TAC lower than 100 ng.L-1 is representative of non-contaminated sites in
Ecuador since these values were found in points non-directly influenced by human activities,
in particular in the Amazon Region upstream, without agricultural and oil activities. From the
total of the sites, 30% of the samples belongs to this category. Comparable ranges of TAC in
the control areas (Al-Agroudy et al., 2017; Farooq et al., 2011; Manoli et al., 2000; Montuori
et al., 2016; Ross and Oros, 2004) were found in surface water from Northern countries with
better environmental practices, in the Chesapeake Bay, and Missisipi (US) or the Seine

CHAPTER 1
45
(France) Rivers (Fernandes et al., 1997; Gustafson and Dickhut, 1997; Zhang et al., 2007).
In Ecuador, urban sewage treatment is only processed in the two main cities (Quito and
Figure 1-3. Concentration (ng.L-1, log-scale) of different aromatic groups in water samples from upstream to downstream in the sub-basins from the reference zones (A), NEAR (B and C) and NEPC (D). TAC=total aromatic charge, nMN=Sum of methyl-naphthtalenes, 16PAH=∑USEPA-PAHs; USWQG=B[bjk]Fa+B[ghi]Pe+IP; ECWQG =Fa+B[bjk]Fa+B[a]P+B[ghi]Pe+IP. The two first initials indicate the name of the closest city, village or parish: PN=Puerto Napo, PO=Puerto Francisco de Orellana, SC=San Sebastian del Coca, JS=Joya de los Sachas, LI=Limoncocha, DY=Dayuma, TI=Tiputini, NR=Nuevo Rocafuerte, A8=Auca08, LM=Lumbaqui, DU=Dureno, PK=Pacayacu, SF=Shushufindi, SR=San Roque, SJ=San José, BB=Bomboiza, S=Santiago, CC=Carlos Concha, VL=Vuelta Larga, AG=5 de Agosto, SM=San Mateo, E=Esmeraldas, SA=Santa Ana; (i)= GC-MS interferences. The number at the end of the site’s code indicates the year of sampling (2:2012, 3:2013, 4:2014, 5:2015 and 6: 2016) and the lowercase letter indicates the location of the sampling points from upstream (a) to downstream (d) from a same parish, village or city.

CHAPTER 1
46
Guayaquil), while oil wastewaters are censed to be treated before their discharges in the
environment, according to the legislation. The presence of cities and oil infrastructures with
non-manifested impacts showed TAC-values between 100 and 500 ng.L-1, corresponding to
62% of the sampling points; these concentrations tends to increase from upstream to
downstream in each sub-basin (Figure 1-3). The TAC values in the Teaone River vary from 100
to 196 ng.L-1 upstream the Refinery and reaches 293 ng.L-1 before the confluence with the
Esmeraldas River (285-426 ng.L-1). Similar values were also found in the NEAR, in the city of
San Sebastian del Coca (127-421 ng.L-1) Coca river downstream, in Puerto Francisco de
Orellana (293 ng.L-1) under the main bridge of the village; in Puerto Napo (upstream of Napo
Basin, 197-300 ng.L-1) and along the Payamino River (152-281 ng.L-1), part of the latest river
being located in active-oil camps. From all the other basins, the Tiputini River downstream
presents the highest value of the TAC range (400-499 ng.L-1), even though this part of the
Tiputini River is isolated and sparsely populated. This river is usually employed to reach the
Napo River by motor-boats, which could explain the local TAC values. This values are similar
to the ones determined in other studies for example, in San Francisco Estuary, Suez Canal,
Tiber River, and in the Aliakmon Basin (Table 1-2). In these regions, TAC is suspected to come
from (sub)urban, industrial and agricultural activities (Al-Agroudy et al., 2017; Farooq et al.,
2011; Manoli et al., 2000; Montuori et al., 2016; Ross and Oros, 2004).
Only 8% of our study sites showed a TAC over 500 ng.L-1; in all these places, there is at least
one active source of oil emissions. Along the Pacific Coast, we recorded values from 551 to
1803 ng.L-1 that came from points directly influenced by the discharge of liquid effluents from
oil-refining processes that are dumped into the Teaone River. In the NEAR, two points (1032-
131726 ng.L-1) close to Auca 22 oilwell in the Tiputini sub-basin are affected by the presence
of a waste pool and occasional oil spills. Another point (WasteA8,TAC= 869 ng.L-1) close to
Auca08 oil well, is also influenced by an abandoned waste pit covered by soil where rainwater
can percolate. The last point (1134 ng.L-1) is close to Atacapi 03 oil well; water comes from a
swamp that belongs to the Aguarico basin in Dureno parish. In this site there is a waste pool
under remediation process. Higher values like the last ones are typically found in places
categorized as polluted (Table 2) like the Gao-ping River and in channels from Hangzhou City
in China (Chen et al., 2004; Doong and Lin, 2004).
Other similar studies also reported high TAC values in coastal waters affected by highly
industrialized areas (Gorleku et al., 2014) and in rivers where municipal sewage waste is
discharged directly without any treatment (Nekhavhambe et al., 2014).

CHAPTER 1
47
The weathering (physicochemical and biological processes) altogether with the local
hydrodynamics in both studied areas should be responsible of a fast reduction in the TAC from
Table 1-1. Average concentration ± standard deviation of dissolved organic carbon (mg.L-1), total suspended solids (mg.L-1 ) and PAHs (ng.L-1 ) in surface water from different basins in the Northern oil extraction and Southern Ecuadorian Amazon Region (NEAR and SEAR, respectively) and in the Northern and Southern Ecuadorian Pacific Coast (NEPC and SEPC, respectively)
VARIABLE NEAR SEAR NEPC SEPC
Napo Payamino Coca Rumiyacu Tiputini Aguarico Shushufindi Santiago Teaone Esmeraldas Portoviejo
DOC 8.7±15.4 10.7±15.3 7±14.1 44.5±86.1 25.1±51.8 19.2±37.1 2.9±1.6 28.6±38.1 5.2±3.9 2.2±0.4 2.5*
TSS 66±59 14±7 41±52 16±15 46±34 126±337 14±4 44±100 36±40 66±74 137*
N 6.4±7.0 4.7±2.9 5.6±5.2 3.9±2.3 216.4±605.4 7.8±7.8 4.2±3.5 <3.0 5.6±6.8 5.6±2.5 <3.0*
Ac 0.65±0.33 <0.67 0.69±0.58 <0.67 26.43±48.45 0.68±0.48 0.74±0.5 <0.67 0.69±0.53 <0.67 <0.67*
Ace 1.0±1.0 1.5±2.1 <0.6 1.2±1.9 19.7±48.2 1.4±2.5 0.6±0.3 <0.6 1.7±2.5 0.9±0.8 <0.6*
Fl 3.8±7.0 2.7±4.7 1.6±2.4 1.9±2.8 30.8±69.8 5.3±9.5 <0.42 0.5±0.4 1.2±1.2 1.2±0.6 <0.4*
Ph 2.2±1.4 2.1±1 1.5±1.5 2.1±2 19.6±45.9 2.3±1.9 1.1±0.5 0.9±1.2 2.6±2.1(i) 1.9±0.5 0.43*
A <0.4 <0.4 <0.4 <0.4 3.6±6.5 <0.4 <0.4 <0.4 0.5±0.3(i) <0.4 <0.4*
Fa 0.5±0.5 0.4±0.4 0.3±0.2 0.5±0.8 1.0±1.5 0.5±0.4 0.3±0.2 <0.3 0.5±0.3 0.5±0.4 <0.3*
Py 0.6±0.5 0.4±0.4 0.3±0.3 1.0±1.6 1.3±2.2 0.6±0.7 0.4±0.2 <0.3 11.8±27.2 1.3±1.1 <0.3*
BaA <0.40 <0.40 <0.40 <0.40 <0.40* <0.40 <0.40 <0.40 <0.40 <0.40 <0.40*
Ch <0.40 <0.40 <0.40 0.63±0.75 0.89±1.25 0.72±1.43 <0.40 <0.40 3.58±3.62 <0.40 <0.40*
BbjkF <1.0 <1.0 <1.0 <1.0 <1.0 <1.0 <1.0 <1.0 <1.0 <1.0 <1.0*
BaP <1.0 nd <1.0 <1.0 nd <1.0 nd <1.0 <1.0 nd nd
IP <1.0 nd nd <1.0 nd nd nd nd nd nd nd
DBA <1.0 nd nd nd nd nd nd nd nd nd nd
BPe <1.0 nd <1.0 <1.0 nd <1.0 nd <1.0 <1.0 nd nd
16PAH 16.1±10.7 13±10.2 11.5±8.7 12.2±8.8 298.3±802.5 19±16.7 8.2±3.2 6.7±1.5 27.9±32.9 12.9±2.1 6.3*
USWQG 3.7±1.4 3.1±0.3 3±1.7 3.7±2.2 31.9±78.4 3.3±2 2.3±0.6 2.5±1 6.7±4.3 3.1±0.8 2.3*
ECWQG 1.2±0.9 0.9±0.03 0.7±0.5 1.3±1.0 1.1±1.5 0.8±0.6 0.7±0.4 1.1±0.5 1.1±1.1 0.9±0.1 1.0*
BeP <1.0 <1.0 nd <1.0 <1.0 <1.0 nd <1.0 1.1±0.8 nd <1.0*
Pe <1.0 <1.0 <1.0 <1.0 1.1±0.6 <1.0 <1.0 <1.0 <1.0 <1.0 <1.0*
MCh <0.52 <0.52 <0.52 1.2±0.75 4.3±5.67 4.06±5.33 <0.52 <0.52 4.72±2.23 3.63* <0.52*
3MPh 0.8±0.6 0.8±0.5 0.4±0.3 0.9±0.8 15.5±43.5 1.0±1.4 0.4±0.3 0.8±1.6 2.4±3.3(i) 1.2±0.3 <0.3*
2MPh 0.9±0.8 0.8±0.6 0.5±0.5 1.0±0.9 7.7±18.9 0.8±0.9 0.5±0.3 0.8±1.6 2.5±3.5(i) 1.3±0.6 <0.3*
MA 0.4±0.4 0.4±0.4 <0.3 0.9±1.7 <0.3 0.3±0.4 <0.3 <0.3 0.5±0.7(i) <0.3 <0.3*
MPhMA 0.9±0.8 1.1±0.6 0.4±0.4 1.1±1.1 16.0±43.9 1.1±1.8 0.5±0.4 0.6±1.2 2.9±3.9(i) 1.4±0.4 <0.3*
1MPh 0.8±0.7 0.9±0.5 0.4±0.4 0.8±0.9 31.6±91.1 1±1.7 0.3±0.2 0.5±0.8 2.1±2.9(i) 1.0±0.5 <0.3*
mMPh 3.3±2.9 3.7±2 1.7±1.6 3.8±3.5 70.8±197.3 3.9±5.7 1.7±1.2 2.7±5.1 9.9±1 (i) 4.9±1.7 <0.6*
∑DMPh 4.9±3.7 7.9±8.9 <3.0 6.9±7.7 87.4±240.7 7.1±14.8 3.2±1.4 4.4±5.6 19.5±25.8 8.2±4.2 <3.0*
∑TMPh 3.7±2.5 4.5±4.1 <3.0 6.2±5.7 39.4±94.7 8.1±18.5 3.3±1.7 3.3±2.3 17.1±16.3 6±2.8 <3.0*
2MN 9±4 9±3 8±6 8±2 511±1496 12±10 8±5 6±3 17±21 18±10 10*
1MN 5±3 5±1 5±4 6±5 832±2469 9±9 6±4 3±3 14±21 12±7 5.3*
∑DMN 47±27 41±20 37±38 59±52 190±340 73±53 42±32 24±14 107±91 85±27 43*
∑TMN 57±35 67±28 44±55 88±75 9442±27976 78±71 55±43 26±20 204±198 116±15 25*
∑TeMN 32±19 46±10 23±20 63±89 3290±9675 54±114 38±34 21±20 230±338 69±24 30*
nMN 149±83 167±51 117±120 225±220 14265±41951 227±200 149±113 79±55 572±586 301±61 113*
BNT <0.4 <0.4 <0.4 <0.4 <0.4 0.4±0.4 <0.4 <0.4 0.8±1.1 <0.4 <0.4*
DBT <0.4 <0.4 <0.4 0.6±0.9 52.6±154.8 0.6±0.7 <0.4 <0.4 1.1±1.3 0.6±0.2 <0.4*
∑MDBT 1.6±1.2 2±1.3 1.3±0 2.8±4.3 122.6±360.4 2.8±5.8 1.3±0 1.8±1.8 5.2±8.1 3.0±2.0 1.3*
TAC 179±94 199±70 137±131 257±243 14933±43798 267±243 167±118 99±68 648±646 338±64 129*
nMN/TAC 0.81±0.08 0.85±0.06 0.81±0.08 0.87±0.05 0.86±0.04 0.85±0.06 0.85±0.08 0.77±0.11 0.88±0.04 0.89±0.03 0.88*
16PAH/TAC 0.09±0.04 0.06±0.03 0.10±0.04 0.06±0.03 0.08±0.04 0.08±0.04 0.07±0.03 0.09±0.06 0.04±0.01 0.04±0.01 0.049*
NEAR=North Ecuadorian Amazon Region; SEAR= South Ecuadorian Amazon Region; NEPC= North Ecuadorian Pacific Coast; SEPC= South Ecuadorian
Pacific Coast; DOC=dissolved organic carbon ; TSS=total suspended solids; N=naphthalene; Ac=acenaphthylene; Ace=acenaphthene; Fl=Fluorene;
Ph=phenanthrene; A=anthracene; Fa=Fluoranthene; Py=pyrene; BaA=benzo[a]anthracene; Ch= chrysene + triphenylene; BbjkF=benzo[b jk]fluoranthene;
BaP=benzo[a]pyrene; IP=indeno[1,2,3-cd]pyrene; DBA=dibenzo[ah]anthracene; BPe=benzo[ghi]perylene; 16PAH=∑US-EPA PAHs;
USWQG=B[bjk]Fa+B[ghi]Pe+IP; ECWQG =Fa+B[bjk]Fa+B[a]P+B[ghi]Pe+IP;BeP=benzo[e]Pyrene; Pe= perylene; MCh=methylchrysene;
3MPh=3Methylphenanthrene; 2MPh=2methylphenanthrene; MA=2methylanthracene; MPhMA=[9+4]methylphenanthrene+1methylanthracene+
4,5methylenephenanthrene; 1MPh=1methylphenanthrene; mMPh=∑mono-methyl phenanthrenes ; ∑DMPh=∑dimethylphenanthrene;
∑TMPh=∑trimethylphenanthrene; 2MN=2methylnaphthalene; 1MN=1methyl- naphthalene; ∑DMN=∑dimethylnaphthalene;
∑TMN=∑trimethylnaphthalene; ∑TeMN=∑tetramethylnaphthalene; nMN= ∑methylnaphthalenes; BNT=2,1benzonaphtothiophene;
DBT=dibenzothiophene; ∑MDBT=∑methyldibenzothiophene; TAC=total aromatic charge; *= single value (n=1); nd=non detected (<LD) ; --=non
measured data; (i)=interference; #= percentage of analyzed samples (all sites) over the quantification limit(LQ).
Detected molecules with an average concentration between LD and LQ are reported as <LQ.

CHAPTER 1
48
the punctual source. In the Teaone River it is not possible to differentiate urban/agricultural
activities from industrial ones, we hypothesize that aromatic charge downstream of the
Esmeraldas Refinery is a mixed of both.
3.1.2 Environmental quality risk related with dissolved aromatic charge
By comparing PAH-concentrations with the different quality guidelines compiled in the Table
SI-2 we found that PAHs in surface water (Figure 1-3) from the Amazon region matched with
Ecuadorian and international guidelines, except in a spring (DY-j4) from the Napo basin (sub-
basin of Tiputini river) at the edge of Auca-22 oil well in Dayuma parish. This oil well is still
active and the spring water crosses a waste pool just covered with soil and oil waste poured
on the forest hill; this point presents the highest naphthalene (1830 ng.L-1) and anthracene
Table 1-2. Ranges of total aromatic charge (TAC) in ng.L-1 in surface freshwater of our study and around the world, in oil producer countries or in urban areas.
SITE NUMBER# TAC (phase) REFERENCE
NEAR 33 parents+alkyl 37-1134 (d) (present study)
NEAR(Auca22) 33 parents+alkyl 131725 (d) (present study)
SEAR 33 parents+alkyl 31-244 (d) (present study)
NEPC 33 parents+alkyl 142-1803 (d) (present study)
SEPC 33 parents+alkyl 129 (d) (present study)
Seine River and Estuary, France 11 parents 4-36 (d) (Fernandes et al., 1997)
Harbour Line, India 15 parents 9-47 (d) (Dhananjayan et al., 2012)
Hartbeespoort Dam, South Africa 16 USEPA 30-52 (d) (Amdany et al., 2014)
Chesapeake Bay, USA 17 parents 20-66(d) (Gustafson and Dickhut, 1997)
24-91 (d+p)
Mississippi river, USA 16 USEPA 63-145 (d+p) (Zhang et al., 2007)
Amazon Region, Ecuador 33 parents+alkyl 29-184 (d) drinking water network (Maurice et al,2019)
North Sea, Norway +50 parents+alkyl 25-350 (d) at 1km from oil platform (Durell et al., 2006)
4-8 (d) background sea level
Amazon Region, Ecuador 33 parents+alkyl 52-324 (d) rainfall (Maurice et al,2019)
Suez Canal, Egypt 16 USEPA 12-500 (b) (Al-Agroudy et al., 2017)
Tiber River and Estuary, Italy 16 USEPA 2-607 (d) (Montuori et al., 2016)
Tehran, Iran 16USEPA 33-733 (d), drinking water network (Karyab et al., 2013)
San Francisco Estuary, USA 25 parents+alkyl 1-847 (d+p), total range (Ross and Oros, 2004)
7-120 (d+p), median range
Aliakmon basin, Greece 16 USEPA 184-856 (b), surface water) (Manoli et al., 2000)
143-954 (b), precipitation
Xiamen Harbour, China 16USEPA 106-945 (d) (Zhou, 2000)
Chenab River, Pakistan 17 parents 888–1140 (d+p), urban (Farooq et al., 2011)
87–703 (d+p), suburban
473–522 (d+p), agricultural
Gao-ping River, Taiwan 16USEPA 10-9400 (d) (Doong and Lin, 2004)
Hangzhou City, China 10 parents 989-9663 (d) (Chen et al., 2004)
Tianjin, China 16 USEPA 1800-35000(d) (Cao et al., 2005)
Sergipe, Brazil 11 parents 37500 produced water (Dórea et al., 2007)
< 40-52430 coastal areas
Tema Harbour, Ghana 20 parents 33200-84500 (b) (Gorleku et al., 2014)
Limpopo, South Africa 6 parents 100-137000(b) (Nekhavhambe et al., 2014)
Luleå, Sweden 16 USEPA 700-340000 (d), gully pots (Karlsson and Viklander, 2008)
Mvudi and Nzhele River, South Africa 16 USEPA 13174000–26382000 (b) (Edokpayi et al., 2016)
d= dissolved phase
p=particulate phase
b=brut, if not specified we assumed non-filtered water
#=number of compounds analyzed in the study

CHAPTER 1
49
(13 ng.L-1) concentrations measured in the Amazon Region exceeding the Canadian
regulations (CCME, 2018). The sum of Ac, BaA, BaP; BbjkF, BPe, Ch, DBA, IP and Ph (244 ng.L-
1) reached eight times the US-EPA recommendation (US EPA, 2018b) at this same sampling
point. The last updated version of Ecuadorian regulation (MAE, 2015c) does not present limits
for PAHs in surface water; only RAOHE (2001) sets a value of 300 ng.L-1 for the sum of six
molecules (Fa+BbjbkF+BaP+BPe+IP). In none of our sampling points, this sum exceeded the
national quality criteria for oil activities areas.
Along the Pacific Coast, all water samples are in compliance with the regulations, except the
refining effluent point (VL-b6), which presented the highest concentration of pyrene (79
ng.L-1) overpassing the Canadian recommended value (CCME: 25 ng.L -1). The peak
interferences found in phenanthrene and anthracene did not allow to define their relation
with the WQGs.
Since environmental water quality guidelines we observed that there is not risk for aquatic
environments in most of the basins analyzed in the present study. Punctual pollution does
not show an important contribution to the aromatic charge in the dissolved phase further
than one kilometer from the source. This punctual contamination was found in sampling
points directly related with oil activities, but only in 8% of samples.
3.2 Concentrations of PAHs in bottom sediments
3.2.1 Sedimentary aromatic charge
Nearly all the analyzed PAHs were detected in sediment samples (Figure 1-2), representing
99.6 % of the database. The average concentrations in dried weight are presented in the
Table 1-3. Ac, A, DBA and MA are the molecules with the lowest percentages of samples
with concentrations over the LQ (27 %, 52 %, 52 and 71%, respectively), being Ac the
molecule that present the highest number of values inferior to LQ with concentrations
ranging from 0.1 to 70 ng.g-1. In parent PAHs, total PAH16 concentrations ranged from 1.3 to
1677 ng.g-1 with Ch (0.1-448 ng.g-1) and Pe (0.1-556 ng.g-1) measured in 95% and 98 % of the
samples, respectively. While in methylated PAHs, the alkyl-phenanthrenes were present in
88-93 % of sites altogether with MCh (95%; 0.1-1420 ng.g-1), alkyl naphthalenes from 75%
for 1MN (0.1-1241 ng.g-1) to 87 % for the ΣTeMN (0.5-34440 ng.g-1); and ∑MDBT (81%; 0.1-
2475 ng.g-1). The percentages of sites with values over LQ in the different molecules are
presented in the Figure 1-2.
The distribution of the total aromatic charge (TAC) analyzed in sediments is represented in the

CHAPTER 1
50
Figure 1-4.Perylene represented 0% of the TAC analyzed in crude oil, waste pool and b.sands Table 1-3. Average ± standard deviation of pollution hazard, grain size (%) and concentration (ng.g-1 dry weight) of PAHs in sediments from different basins in the Northern and Southern Ecuadorian Amazon Region (NEAR and SEAR, respectively) and in the Northern and Southern Ecuadorian Pacific Coast (NEPC and SEPC, respectively).
VARIABLE NEAR SEAR NEPC SEPC
Napo Payamino Coca Rumiyacu Tiputini Aguarico Shushufindi Santiago Teaone Esmeraldas Portoviejo
hazard 1.3±10 2.4±0.8 1.9±0.2 2.8±0.5 2.6±0.8 2.4±0.6 2.8±0.8 0.0 -- -- --
≤ 4 μm 12±7 12±6 7±5 14±2 19±7 13±8 16±6 23±13 12±3 12±1 12*
4-63 µm 55±10 50±9 34±22 47±8 51±10 50±15 50±4 48±4 56±11 53±10 44*
≤ 63 µm 66±13 62±13 41±26 61±10 71±15 63±21 66±10 71±15 69±14 65±10 57*
> 63μm 34±13 38±13 59±26 39±10 29±15 37±21 34±10 29±15 31±14 35±10 43*
TC (%) 1.1±0.7 3.8±4.0 0.6±0.4 1.1±0.7 2.0±1.1 1.4±1.3 2.2±0.8 1.6±1.0 1.9±0.9 1.4±0.6 0.8*
OC (%) 0.9±0.6 3.6±4.0 0.5±0.4 0.9±0.7 1.7±0.9 1.3±1.3 2.0±0.8 1.0±0.8 1.5±0.8 1.0±0.2 0.5*
N 3±2 11±13 2±1 <1.15 13±21 3±3 2±3 <1.2 23±41 <1.2 <1.2*
Ac <0.1 14.3±31.4 <0.1 <0.1 2.2±6.0 0.3±0.8 <0.1 <0.1 1.6±4.7 0.2±0.1 <0.1*
Ace 0.3±0.4 28.6±57.3 0.1±0.1 <0.1 2.8±6.2 0.3±0.6 <0.1 <0.1 9.5±24.1 <0.1 <0.1*
Fl 0.6±0.6 86.0±182.5 0.3±0.2 0.2±0.1 10.3±27.0 0.6±1.1 <0.2 0.2±0.2 21.0±40.5 0.4±0.4 <0.2*
Ph 4.3±4.1 38.8±52.0 3.2±2.3 0.8±0.5 19.7±39.2 4.5±7.9 0.9±0.1 2.6±5.0 101.7±196.9 1.9±1.1 <0.7*
A 0.2±0.3 1.2±1.4 0.1±0.1 <0.1 0.5±1.2 0.2±0.6 <0.1 <0.1 8.8±18.3 0.210.2 <0.1*
LMW 9±7 180±326 6±4 2±1 48±93 8±12 4±3 4±6 165±312 4±2 1*
Fa 2.0±4.9 30.7±38.6 0.5±0.4 0.4±0.5 20.0±39.3 3.5±13.5 0.5±0.4 0.5±0.7 54.9±152.9 1.2±0.6 0.2*
Py 2.1±3.8 18.1±27.4 1.0±0.7 0.8±0.9 13.8±27.0 3.0±9.8 0.6±0.5 1.2±2.1 68.0±133.4 1.9±1.2 <0.2*
BaA 0.6±0.8 4.2±4.9 0.4±0.2 0.2±0.3 2.7±7.5 0.4±0.6 0.3±0.1 0.3±0.7 12.1±25.3 0.5±0.4 <0.1*
Ch 1.6±1.0 31.2±52.6 1.6±1.3 1.1±1.5 51.5±148.8 2.8±3.1 0.6±0.4 2.4±5.6 41.8±91.3 1.2±0.7 0.2*
BbjkF 0.9±0.6 6.2±5.5 0.7±0.6 0.7±0.7 9.4±25.1 1.1±1.0 1.1±0.5 1.4±2.7 10.0±17.6 1.0±0.3 <0.3*
BaP 0.4±0.4 2.5±2.4 0.3±0.2 0.4±0.3 0.4±0.6 0.4±0.5 0.3±0.2 0.3±0.6 8.9±18.9 0.6±0.4 <0.2*
IP 0.9±2.3 1.3±0.8 0.3±0.3 0.4±0.4 1.7±3.5 0.3±0.3 0.6±0.3 <0.2 2.0±2.2 0.7±0.4 <0.2*
DBA 0.3±0.4 1.0±1.1 <0.2 <0.2 2.7±7.3 0.2±0.2 <0.2 <0.2 2.0±3.8 <0.2 <0.2*
BPe 1.2±0.9 3.6±3.5 0.9±0.8 1.0±1.3 4.7±10.2 1.2±1.7 0.8±0.3 1.3±2.9 6.9±10.7 1.1±0.6 1.2*
16PAH 18±16 278±417 12±8 7±6 155±344 21±38 8±4 12±22 372±685 12±7 3*
BeP 1.1±0.5 10.7±12.1 1.2±1.0 0.9±1.4 16.2±43.1 2.2±3.0 0.5±0.3 2.6±6.7 17.2±34.8 0.8±0.5 <0.2*
HMW# 11±10 109±106 7±5 6±7 123±294 15±28 5±3 10±22 224±398 9±5 2*
Pe 58±120 211±180 24±16 29±24 42±48 58±127 91±27 8±14 33±27 329±22 3*
MCh 3.9±2.1 89.1±146.0 4.1±3.8 4.4±7.8 162.0±471.7 7.1±9.1 3.6±3.8 4.7±9.9 180.9±414.6 4.4±5.2 <0.3*
3MPh 1.4±1.0 183.5±389.4 1.5±1.4 0.3±0.3 47.8±140.9 1.7±2.2 0.3±0.1 1.1±2.3 119.1±273.3 0.9±0.5 <0.1*
2MPh 1.9±1.4 215.5±454.8 1.9±1.7 0.4±0.4 60.3±177.0 2.4±3.1 0.4±0.2 1.4±2.8 148.8±370.1 1.1±0.7 <0.1*
MA 0.3±0.3 14.4±28.7 0.2±0.1 <0.1 5.6±16.0 0.2±0.3 <0.1 0.1±0.1 15.6±32.7 0.2±0.1 <0.1*
MPhMA 2.7±1.9 278.0±586.9 2.7±2.5 0.5±0.6 99.0±277.9 2.6±3.1 0.6±0.3 2.0±4.6 106.7±253.9 1.0±0.7 <0.1*
1MPh 2.2±1.5 316.4±677.2 2.6±2.4 0.5±0.6 99.5±279.3 1.9±2.2 0.6±0.4 1.6±3.9 90.4±213 0.7±0.5 <0.1*
∑DMPh 15±9 1803±3858 17±13 8±8 920±2738 16±18 4±2 9±18 1075±2545 17±21 <1*
∑TMPh 15±9 1614±34501 18±13 7±10 1213±3614 19±30 4±2 6±13 1041±2461 21±30 <1*
2MN 4.0±2.7 274.8±565.0 4.2±2.5 0.8±0.7 39.6±84.7 10.6±19.3 0.3±0.3 0.8±1.3 81.1±188.9 0.4±0.3 <0.3*
1MN 3.5±2.3 265.9±546.0 3.7±2.2 0.6±0.6 33.3±73.8 9.05±17.14 0.3±0.2 1.2±2.5 65.2±153.6 0.3±0.2 <0.3*
∑DMN 17±10 2859±6120 17±11 3±2 423±1207 26±33 2±2 6±13 3190±8990 3±3 <1*
∑TMN 28±17 5366±11460 31±22 4±3 1174±3494 21±22 4±2 10±22 5936±16880 8±11 <1*
∑TeMN 17±11 3270±6980 16±12 6±5 1227±3655 16±18 8±3 9±16 4034±11416 12±17 <1*
MPAH 111±63 16550±35259 121±85 36±35 5482±16190 133±146 28±13 53±109 16085±44133 70±89 3*
BNT 0.4±0.3 14.5±29.1 0.5±0.5 0.3±0.4 26.0±77.2 0.6±0.7 0.1±0.1 0.5±0.9 12.7±26.3 0.1±0.1 <0.1*
DBT 1.5±1.2 67.7±142.1 0.8±0.6 0.3±0.3 34.0±98.8 0.9±1.2 <0.1 0.4±0.6 38.8±75.8 0.3±0.2 <0.1*
PASH 1.9±1.5 82.2±171.1 1.2±1.0 0.5±0.5 60.0±176.0 1.5±1.7 0.2±0.1 0.8±1.4 51.5±101.0 0.4±0.2 0.1*
∑MDBT 2.7±2.9 501.6±1103.2 2.4±2.1 1.0±1.0 210.6±628.3 2.2±2.3 0.5±0.2 0.6±0.9 178.5±415.2 1.0±0.8 0.2*
TAC 193±103 17633±36988 161±112 74±49 5965±17364 218±188 129±15 76±139 16738±45122 117±90 9*
TAC# 135±76 17422±36944 137±96 45±42 5924±17371 160±168 37±17 68±139 16704±45117 85±97 6*
Pe/TAC 0.25±0.31 0.3±0.31 0.19±0.11 0.44±0.3 0.4±0.37 0.24±0.3 0.7±0.15 0.15±0.22 0.26±0.37 0.38±0.23 0.30*
NEAR=North Ecuadorian Amazon Region; SEAR= South Ecuadorian Amazon Region; NEPC= North Ecuadorian Pacific Coast; SEPC= South Ecuadorian Pacific
Coast; N=naphthalene; Ac=acenaphthylene; Ace=acenaphthene; Fl=Fluorene; Ph=phenanthrene; A=anthracene; LMW=low molecular weight; Fa=Fluoranthene;
Py=pyrene; BaA=benzo[a]anthracene; Ch= chrysene + triphenylene; BbjkF=benzo[bjk]fluoranthene; BaP=benzo[a]pyrene; IP=indeno[1 ,2,3-cd]pyrene;
DBA=dibenzo[ah]anthracene; BPe=benzo[ghi]perylene; BeP=benzo[e]Pyrene; HMW=high molecular weight Pe= perylene; MCh=methylchrysene;
3MPh=3Methylphenanthrene; 2MPh=2methylphenanthrene;MA=2methylanthracene; MPhMA=[9+4]methylphenanthrene+1methylanthracene+
4,5methylenephenanthrene; 1MPh=1methylphenanthrene; ∑DMPh=∑dimethylphenanthrene; ∑TMPh=∑trimethylphenanthrene; 2MN=2methylnaphthalene;
1MN=1methyl- naphthalene; ∑DMN=∑dimethylnaphthalene; ∑TMN=∑trimethylnaphthalene; ∑TeMN=∑tetramethylnaphthalene;
BNT=2,1benzonaphtothiophene; DBT=dibenzothiophene; ∑MDBT=∑methyldibenzothiophene; #=Pe excluded; *= single value (n=1) Detected molecules with an average concentration between LD and LQ are reported as <LQ; Data non meausured=--

CHAPTER 1
51
(Table A-1), but in these samples, the levels of Fa and Py were higher than our method allowed
to analyze. Perylene was detected in all the sediments in a range of 0.1 to 852 ng.g-1 (Table SI-
8), in higher concentrations upstream and/or downstream the study rivers, but not close to
main villages or oil facilities.
Perylene is a derivative molecule of perylenequinones, and its presence confirms its biogenic
origin explained by the transformation of the biomass particularly important in the tropical
forest (Zamani et al., 2015).This natural process allows us to use Pe as an indicator of the
environmental quality of uncontaminated sites with a high primary productivity. The highest
proportion of Pe correspond to Joya de los Sachas (435 ng.g-1) and Pacayacu (555 ng.g-1)
representing 98% of the total aromatic charge in both sites. The average charge of Pe in
relation to the total aromatic charge (Pe/TAC) ranged from 20% in the Coca basin to 70% in
the Shushufindi Basin. The Coca basin drains basin through two of the most populated cities
(Sas Sebastian del Coca and Francisco de Orellana) in the Amazon Region. While Rumiyacu and
Tiputini basins are characterized by less populated areas.
Since our main objective is tracing oil contamination and considering that Pe is a compound
tied to the natural biogenic origin, from all the variables analyzed (Figure SI-3 and Figure SI-4)
we decided to exclude Pe from the relative abundance of the aromatic charge in the following
analysis. These results represented in the Figure 1-5 show that the methylated compounds
from low molecular weight molecules (M-LMW) are the dominant ones in nearly all the
samples (30% to 97% of TAC). In the two crude oils analyzed this fraction represents the 92%
and 94 % of aromatic charge; a similar abundance (>90%) was found in all the basin versants
at the points closest to active oil wells (Coca 08, Auca22, Carabobo and Shuara 24), at the
discharge channel of the Refinery (97%) and in the Payamino river in the point of drinking
water abstraction used to the villages Shushufindi, Sacha and Coca.
In sediments, no one of the variables showed a normal distribution (Shapiro-Wilk test) of the
concentrations; the results of these normality tests are presented in the Table SI-4. Two
supplementary normality test were done using the relative abundance of each PAH molecule
related with the totality of analyzed hydrocarbons, and to the sum of parent PAHs,
respectively; these methodology allows to consider the crude oil samples and the bituminous
together with the sediment samples in the subsequent analysis.
Spearman correlation analysis (p<0.05) showed that only nitrogen presents a significant
correlation with total carbon (r=0.96) and organic carbon (r=0.90); the organic carbon
represents more than 75% of total carbon in 65%of the samples which explains these

CHAPTER 1
52
correlations with nitrogen and shows that most of the carbon found in our samples belongs
to organic matter from the forest instead of hydrocarbons from oil activities. No correlation
was found between TAC and organic carbon (Table SI-3); it coincides with other studies
(Cavalcante et al., 2009; Farias et al., 2008; Raza et al., 2013) claiming that only polluted sites
shows correlations between total-PAHs and TOC (Simpson et al., 1996). TAC presented the
strongest correlations with HMW molecules (r=0.84) and with 16PAH (r=0.86), the lattest is
mainly represented by molecules of HMW, in particular the fluoranthene and chrysene.
3.2.2 Environmental quality risk related with sedimentary aromatic charge
Individual parent-PAHs showed a general compliance with the TEL and PEL (Table SI-5). Three
specific exceptions existed in (1) the Payamino River (Coca oilfield: PO-g and PO-h ) for the
LMW-molecules Py and Ch; (2) the upstream of Tiputini River in Dayuma Parish in an specific
oil well (Auca22: DY-j, DY-k and DY-l) for all the LMW-molecules, and certains HMW (Py, Ch
and DBA). And (3) in the Teaone River at the refinery channel (VL-b and VL-c), where at least
66% of parent-PAHs regulated by the NOAA/CCME were over the TEL. Among all the places
that overcome the TEL, there is only one point (Payamino river, PO-g, Coca8 oilwell) with
concentrations over the PEL for Ace (1.5 times the PEL) and Fl (3 times the PEL).
The only methylated molecule with defined TEL and PEL by NOAA/CCME is the 2-
methylnaphthalene, the concentrations of this hydrocarbon confirmed the punctual pollution
manifested beforehand since the parent-PAHs, in particular the points close to the oil wells
Coca 8 (PO-g, Payamino River), Auca 22 (DY-j, Tiputini River) and the refinery channel (VL-b,
Teaone River), where 2MN overpass the PEL with 6, 1.3 and 3 times, respectively. In addition,
2MN showed that Aguarico river in three points from Pacayacu parish (PK-b, PK-f and PK-g) is
also affected by anthropogenic activities, since these points shows values between the TEL
and the PEL, even though this points do not overpass the PEL. These concentrations could
possibly be the result of fresh crude oil presence as alkylated naphthalenes are characteristic
of crude oil profile (Hawthorne et al., 2006).
The NOAA/CCME does not present TEL-PEL values for the TAC in sediments from freshwater,
but ERL and ERM are reported among the SQG. We considered TAC as the sum of all quantified
parent and alkyl PAHs (Stogiannidis and Laane, 2015) to compare it with the ERL and the ERM.
We determined that only 5 % of the sites (4 points: VL-b, VL-c, PO-g, DY-j ) are over the ERL,
among them; only one (VL-c) is inferior to the ERM.
Since the TEL/PEL analysis, we observed that only 12% (10 samples) shows at least one

CHAPTER 1
53
individual compound over the TEL; among them only 3 samples (4% of the total) manifested
values over the PEL of 2MN and only one sample showed concentrations over the PEL for Ace
and Fl. 88% of individual sites studied here do not present a risk for aquatic populations, since
these samples are under the TEL-value in all individual compounds. It was confirmed with the
analysis of the TAC compared with the ERL and ERM. And finally, we can affirm that the Teaone
Basin in the refinery channel and the Payamino River close to Coca08 oilwell are the most
affected by oil activities, followed by the Tiputini River in Auca 22 and Teaone River
downstream of the dump of the Refinery channel. According to (CCME, 1999) these points
overcome a threshold value (ERM) above which adverse effects on most species are
frequently or always observed. The TEQ expressed as concentration of BaP was also compared
with the TEL, PEL, ERL and ERM and confirmed that 93% of the sampling sites are under the
TEL, but 100% are in compliance with PEL, ERL and ERM.
The quotients mERMQ and mPELQ allow to define a relative level of priority related to toxicity
(Soliman et al., 2015); applying these method to our analysis (Table SI-5), only three points
(refinery channel, Coca8 and Auca 22) are defined as slightly toxic, requiring a low medium
priority in order to correct or modify the sources of pollution. The same level of priority was
present in the bituminous sands. The only point determined as “high priority site” and highly
toxic is the residual soil (wasteA8) from an ancient waste pool close to Auca08 oilwell. These
points are dirty references for assessing the sources of PAHs.
The results exposed beforehand are in accord with the cartographic method (Figure 1-6)
developped by Cadot in the frame of the MONOIL program. This method also found wasteA8
(Auca08) as the place with the highest oil pollution hazard. But, since this method takes into
count the main sources of pollution (cause), it is usefull to evaluete the risk tied to the density
of infraestructures and the presence of oilspils based on historical registres or database, but
not directly tied to chemical concentrations as the mERMQ and mPELQ. we could not relate
directly our results with the hazard values. It is confirmed with the Spearman’s correlation
where none of the variables presented a relation with the oil pollution hazards.
In spite of the high concentration of oil infrastructures and the risk that these may present, it
does not necessarily imply the presence of pollutants in the surrounding environment. This
can be explained by the improvement in environmental practices due to local actions, in
particular since 2008 in which the Ecuadorian State recognized Nature as a “subject of rights”
and impel to repair and prevent environmental damages in order to waranty the protection
of nature.

CHAPTER 1
54
Figure 1-4. Distribution of PAHs as relative abundance of total aromatic charge in sediments from upstream to downstream of the different basins. LMW=Low molecular weight, HMW=high molecular weight, PASH= Polycyclic aromatic sulfur heterocycles, M=methylated molecules, Perylene is excluded; (i)= GC-MS interferences. The two first initials indicate the name of the closest city, village or parish: PN=Puerto Napo, PO=Puerto Francisco de Orellana, SC=San Sebastian del Coca, JS=Joya de los Sachas, LI=Limoncocha, DY=Dayuma, TI=Tiputini, NR=Nuevo Rocafuerte, A8=crude waste pit, A3=Crude Auca oilfield, PL= LM=Lumbaqui, DU=Dureno, PK=Pacayacu, SF=Shushufindi, SR=San Roque, SJ=San José, BB=Bomboiza, S=Santiago, CC=Carlos Concha, VL=Vuelta Larga, AG=5 de Agosto, SM=San Mateo, E=Esmeraldas, SA=Santa Ana. The number at the end of the site’s code indicates the year of sampling (2:2012, 3:2013, 4:2014, 5:2015 and 6: 2016) and the lowercase letter indicates the location of the sampling points from upstream (a) to downstream (d) from a same parish, village or city.

CHAPTER 1
55
Figure 1-5. Distribution of PAHs concentrations (ng.g-1 dw; log scale) in sediments from upstream to downstream in the study basins. LMW=Low molecular weight, HMW=high molecular weight, PASH= Polycyclic aromatic sulfur heterocycles, M=methylated molecules, Perylene is excluded, ERL=effect range low; ERM= effet range median; PN=Puerto Napo, PO=Puerto Francisco de Orellana, SC=San sebastian del Coca, JS=Joya de los Sachas, LI=Limoncocha, DY=Dayuma, TI=Tiputini, NR=Nuevo Rocafuerte, A8=crude waste pit, A3=Crude Auca oilfield, PL= LM=Lumbaqui, DU=Dureno, PK=Pacayacu, SF=Shushufindi, SR=San Roque, SJ=San José, BB=Bomboiza, S=Santiago, CC=Carlos Concha, VL=Vuelta Larga, AG=5 de Agosto, SM=San Mateo, E=Esmeraldas, SA=Santa Ana. The number at the end of the site’s code indicates the year of sampling (2:2012, 3:2013, 4:2014, 5:2015 and 6: 2016) and the lowercase letter indicates the location of the sampling points from upstream (a) to downstream (d) from a same parish, village or city.

CHAPTER 1
56
3.3 Oil activities tracing (source tracing)
Trace sourcing was done by using different isomeric ratios and treated by a PCA and a HCA
(Figure 1-7 and Figure 1-8). The isomeric ratios are reported in the Table SI-9. The results show
that in all the basins, dimethyl and three-methyl phenanthrenes; and methyl chrysene
strongly influence the analysis.
In the Pacific Coast; the refinery effluents are similar to the ancient oil waste pits found in
Auca08; showing that refining process results in a nature similar to ancient non-restored
waste pools, and a fingerprint downstream similar to bituminous sands. In the Napo Basin,
the Tiputini River from a black water river is totally independent from the others, showing the
forest fingerprint (biogenic). Different associations were detected, most of the points show a
Figure 1-6. Oil pollution hazard map by runoff accumulation area (by Cadot.E ; MONOIL, 2017).

CHAPTER 1
57
fingerprint similar to bituminous sands and oil waste soil, only one point (recent oil spill) is
connected to pipeline crude sample, point for the main villages show a fingerprint similar to
the oil waste soil and bituminous sands. In the Aguarico basin a similar distribution is
observed, two main clusters, one tied to waste oil pit and another one to bituminous sands.
Tracing sources allowed to manifest that ancient oil spills (oil waste) or the natural background
of hydrocarbons (bituminous sands) are more related to the concentrations in sediment
samples than fresh crude oil.
4. Conclusions
Low molecular weight-PAHs and its corresponding methylated molecules contribute with the
highest proportion to the total aromatic charge in the dissolved and in the sedimentary
phases.
Surface water samples do not show pollution related with PAHs; the international permissible
levels are not exceeded in most of the study sites. In fact, only in the case of direct contact
with fresh crude oil like in Auca 22 or the dumping of refining liquid byproducts like in the
Teaone River, showed naphthalene, anthracene and pyrene in concentrations higher than the
permissible levels.
Sedimentary charge is in compliance with the different water quality guidelines, with punctual
pollution in sites close to active extraction or refining facilities.
The biogenic fingerprint is manifested since the concentrations of Perylene, in particular
downstream of the Andes influence; it was manifested in a black-water river in the Tiputini
Ecological Reserve. Perylene is presented in nearly all the samples, confirming that the
amazon rainforest is a source of this molecule.
Since not important values were manifested downstream of punctual pollution, except in the
closer samples (< 1km); we can affirm that oil production and refining processes are not
important sources of contamination neither in the Pacific Coast nor in the Amazon Region.
Because the results in the present study (dissolved phase) are similar to values found in cities
with some industrial, agricultural and urban activities, we claim that even with only 5% of the
Ecuadorian population living in the Amazon region, not only oil processes, but also urban
activities altogether with local agriculture contribute to the presence of PAHs in the dissolved
phase. On the other hand, in the Pacific Coast, the Esmeraldas Refinery represents the main
source of surface water pollution, within 1 km from the effluents affecting the Teaone River,
but not the Esmeraldas River, whose values remain similar upstream and downstream the

CHAPTER 1
58
confluence with the Teaone River. It was confirmed by the hierarchical cluster analysis applied
to the sedimentary phase, where most of the analyzed places are not directly influenced by
fresh crude oil, but by ancient waste or similar to the geochemical background (bituminous
sands). HCA showed different associations with the main populated sites and agricultural
emplacements that need a deeper analysis in order to characterize these origins. Local efforts
to improve environmental quality should be reflected in future studies about local pollution
in Refining Ecuadorian zones.
Figure 1-7. Hierarchical Cluster Analysis (HCA)-Complete-linkage method based on the isomeric ratios of aromatic charge in sediments (N and Pe excluded), Esmeraldas Basin.

CHAPTER 1
59
Fi
gure
1-8
. Hie
rarc
hic
al C
lust
er A
nal
ysis
(H
CA
)-C
om
ple
te-l
inka
ge m
eth
od
bas
ed o
n t
he
iso
mer
ic r
atio
s o
f aro
mat
ic c
har
ge in
sed
imen
ts (
N a
nd
Pe
excl
ud
ed):
A) N
apo
Bas
in,
B)
Agu
aric
o B
asin
.

CHAPTER 1
60
Quotients like mPELQ and mERMQ were accurate for determining the environmental risk
since a scale is proposed. But a complete human hazard risk based in sediments
concentrations could help to better understand the risk to local populations that are
accustomed to swim and fish in the studied rivers.
Acknowledgements
The authors would like to thank the French National Agency of Research for the financial aid
in the frame of the ANR-MONOIL Project N°ANR-13-SENV-0003-01. This work was made
possible by support from the French Research Institute for the Development (IRD) and the
Ecuadorian PhD grant from the “Instituto de fomento al talento humano” (IFTH). We thank to
anonymous reviewers for comments on earlier and to the engineers and technicians from the
laboratories EPOC (Bordeaux) and GET (Toulouse) for all their support and advices during
analytical processes.
References
Abdel-Shafy, H.I., Mansour, M.S.M., 2016. A review on polycyclic aromatic hydrocarbons: Source, environmental impact, effect on human health and remediation. Egypt. J. Pet. 25, 107–123. https://doi.org/10.1016/j.ejpe.2015.03.011
Al-Agroudy, N., Soliman, Y.A., Hamed, M.A., Zaghloul, G.Y., 2017. Distribution of PAHs in Water, Sediments Samples of Suez Canal During 2011. J. Aquat. Pollut. Toxicol. 1.
Amiard, J.C., 2017. Les risques chimiques environnementaux: méthodes d’évaluation et impacts sur les organismes, 2nd ed. Tec & Doc Lavoisier, Paris, France.
Anses, 2018. Toxicity reference values (TRVs) [WWW Document]. URL https://www.anses.fr/en/content/toxicity-reference-values-trvs (accessed 11.16.18).
Armijos, E., Laraque, A., Barba, S., Bourrel, L., Ceron, C., Lagane, C., Magat, P., Moquet, J.S., Pombosa, R., Sondag, F., Vauchel, P., Vera, A., Guyot, J.L., 2013. Yields of suspended sediment and dissolved solids from the Andean basins of Ecuador. Hydrol. Sci. J. 58, 1478–1494. https://doi.org/10.1080/02626667.2013.826359
Baynard, C.W., Ellis, J.M., Davis, H., 2013. Roads, petroleum and accessibility: the case of eastern Ecuador. GeoJournal 78, 675–695. https://doi.org/10.1007/s10708-012-9459-5
BCE, 2018. REPORTE DEL SECTOR PETROLERO. IV trimestre de 2017.
Benlahcen, K.T., Chaoui, A., Budzinski, H., Bellocq, J., Garrigues, P., 1997. Distribution and sources of polycyclic aromatic hydrocarbons in some Mediterranean coastal sediments. Mar. Pollut. Bull. 34, 298–305. https://doi.org/10.1016/S0025-326X(96)00098-7
Bojes, H.K., Pope, P.G., 2007. Characterization of EPA’s 16 priority pollutant polycyclic aromatic hydrocarbons (PAHs) in tank bottom solids and associated contaminated soils at oil exploration and production sites in Texas. Regul. Toxicol. Pharmacol. 47, 288–295. https://doi.org/10.1016/j.yrtph.2006.11.007
Buccina, S., Chene, D., Gramlich, J., 2013. Accounting for the environmental impacts of Texaco’s operations in Ecuador: Chevron’s contingent environmental liability disclosures. Account. Forum 37, 110–123. https://doi.org/10.1016/j.accfor.2013.04.003
Budzinski, H., Garrigues, P., Connan, J., Devillers, J., Domine, D., Radke, M., Oudins, J.L., 1995. Alkylated

CHAPTER 1
61
phenanthrene distributions as maturity and origin indicators in crude oils and rock extracts. Geochim. Cosmochim. Acta 59, 2043–2056. https://doi.org/10.1016/0016-7037(95)00125-5
Budzinski, H., Jones, I., Bellocq, J., Piérard, C., Garrigues, P., 1997. Evaluation of sediment contamination by polycyclic aromatic hydrocarbons in the Gironde estuary. Mar. Chem. 58, 85–97. https://doi.org/10.1016/S0304-4203(97)00028-5
Bustamante, T., Jarrín, M., 2005. Impactos sociales de la actividad petrolera en Ecuador: un análisis de los indicadores. Iconos 21, 19–34. https://doi.org/10.17141/iconos.21.2005.77.
Cadot, E., V, B., Rousseau, M., Sebag, D., 2016. Impact environnemental de la diffusion de produits phytosanitaires par ruissellement : deux exemples contrastés en Europe et en Afrique. Dyn. Environnementales 182–198.
Casal, C.S., Arbilla, G., Corrêa, S.M., 2014. Alkyl polycyclic aromatic hydrocarbons emissions in diesel/biodiesel exhaust. Atmos. Environ. 96, 107–116. https://doi.org/10.1016/j.atmosenv.2014.07.028
Cavalcante, R.M., Sousa, F.W., Nascimento, R.F., Silveira, E.R., Freire, G.S.S., 2009. The impact of urbanization on tropical mangroves (Fortaleza, Brazil): Evidence from PAH distribution in sediments. J. Environ. Manage. 91, 328–335. https://doi.org/10.1016/j.jenvman.2009.08.020
CCME, 2018. CCME Tableau Sommaire [WWW Document]. URL http://st-ts.ccme.ca/fr/index.html (accessed 6.26.18).
CCME, 1999. Protocol for the derivation of Canadian sediment quality guidelines for the protection of aquatic life (Article; Article/Report No. CCME EPC-98E). [Ottawa], Ont. : The Council.
CEPAL, N., 1990. Impacto ambiental de la contaminación hídrica producida por la Refinería Estatal Esmeraldas: análisis técnico-económico. CEPAL.
Chen, B., Xuan, X., Zhu, L., Wang, J., Gao, Y., Yang, K., Shen, X., Lou, B., 2004. Distributions of polycyclic aromatic hydrocarbons in surface waters, sediments and soils of Hangzhou City, China. Water Res. 38, 3558–3568. https://doi.org/10.1016/j.watres.2004.05.013
Chen, Y., Jia, R., Yang, S., 2015. Distribution and Source of Polycyclic Aromatic Hydrocarbons (PAHs) in Water Dissolved Phase, Suspended Particulate Matter and Sediment from Weihe River in Northwest China. Int. J. Environ. Res. Public. Health 12, 14148–14163. https://doi.org/10.3390/ijerph121114148
Clínica Ambiental, 2017. Informe de Salud [WWW Document]. informe_salud_tex. URL www.clinicambiental.org/docs/publicaciones/informe_salud_tex.pdf (accessed 6.7.18).
Cuba, N., Bebbington, A., Rogan, J., Millones, M., 2014. Extractive industries, livelihoods and natural resource competition: Mapping overlapping claims in Peru and Ghana. Appl. Geogr. 54, 250–261. https://doi.org/10.1016/j.apgeog.2014.05.003
Dangles, O., Nowicki, F., Valencia, R., 2009. Biota máxima : Ecuador biodiverso. Quito.
de Perre, C., Le Ménach, K., Ibalot, F., Parlanti, E., Budzinski, H., 2014. Development of solid-phase microextraction to study dissolved organic matter—Polycyclic aromatic hydrocarbon interactions in aquatic environment. Anal. Chim. Acta 807, 51–60. https://doi.org/10.1016/j.aca.2013.11.026
Doong, R., Lin, Y., 2004. Characterization and distribution of polycyclic aromatic hydrocarbon contaminations in surface sediment and water from Gao-ping River, Taiwan. Water Res. 38, 1733–1744. https://doi.org/10.1016/j.watres.2003.12.042
Durango-Cordero, J., Saqalli, M., Laplanche, C., Locquet, M., Elger, A., 2018. Spatial Analysis of Accidental Oil Spills Using Heterogeneous Data: A Case Study from the North-Eastern Ecuadorian Amazon. Sustainability 10, 4719. https://doi.org/10.3390/su10124719
EP Petroecuador, 2013. El petróleo en el Ecuador : la nueva era petrolera, 1st ed. Manthra Comunicación, Quito, Ecuador.
European Commission, 2012. Toxicity and Assessment of Chemical Mixtures.

CHAPTER 1
62
European Commission, 1998. Directive 98/83/EC of the European Parliament and of the Council of 3 November 1998 on on the quality of water intended for human consumption, Off J Eur Union 98;L 330/32 . [Novembre 98].
Farias, C.O., Hamacher, C., Wagener, A. de L.R., Scofield, A. de L., 2008. Origin and degradation of hydrocarbons in mangrove sediments (Rio de Janeiro, Brazil) contaminated by an oil spill. Org. Geochem. 39, 289–307. https://doi.org/10.1016/j.orggeochem.2007.12.008
Farooq, S., Ali-Musstjab-Akber-Shah Eqani, S., Malik, R.N., Katsoyiannis, A., Zhang, G., Zhang, Y., Li, J., Xiang, L., Jones, K.C., Shinwari, Z.K., 2011. Occurrence, finger printing and ecological risk assessment of polycyclic aromatic hydrocarbons (PAHs) in the Chenab River, Pakistan. J. Environ. Monit. 13, 3207. https://doi.org/10.1039/c1em10421g
Fernandes, M.B., Sicre, M.-A., Boireau, A., Tronczynski, J., 1997. Polyaromatic hydrocarbon (PAH) distributions in the Seine River and its estuary. Mar. Pollut. Bull. 34, 857–867. https://doi.org/10.1016/S0025-326X(97)00063-5
Finer, M., Jenkins, C.N., Pimm, S.L., Keane, B., Ross, C., 2008. Oil and Gas Projects in the Western Amazon: Threats to Wilderness, Biodiversity, and Indigenous Peoples. PLoS ONE 3, e2932. https://doi.org/10.1371/journal.pone.0002932
Gorleku, M., Carboo, D., Palm, L., Quasie, W., 2014. Polycyclic aromatic hydrocarbons (PAHs) pollution in marine waters and sediments at the Tema Harbour, Ghana. Acad. J. Environ. Sci. 2.
Gustafson, K.E., Dickhut, R.M., 1997. Distribution of polycyclic aromatic hydrocarbons in southern Chesapeake Bay surface water: Evaluation of three methods for determining freely dissolved water concentrations. Environ. Toxicol. Chem. 16, 452–461. https://doi.org/10.1002/etc.5620160310
Hawthorne, S.B., Miller, D.J., Kreitinger, J.P., 2006. Measurement of total polycyclic aromatic hydrocarbon concentrations in sediments and toxic units used for estimating risk to benthic invertebrates at manufactured gas plant sites. Environ. Toxicol. Chem. 25, 287. https://doi.org/10.1897/05-111R.1
INEC, I.N. de E. y C., 2010. Población, superficie (km2), densidad poblacional a nivel provincial [WWW Document]. Inst. Nac. Estad. Censos. URL http://www.ecuadorencifras.gob.ec/wp-content/plugins/download-monitor/download.php?id=321&force=0 (accessed 6.20.19).
Jochnick, C., Normand, R., 1994. Rights violation in the Ecuadorian Amazon The human consequences of oil development [WWW Document]. URL http://www.cesr.org/sites/default/files/Rights_Violation_in_the_Ecuadorian_Amazon_The_Human_Consequences_of_Oil_Development_1_1.pdf (accessed 2.7.18).
Jørgensen, S.E., Fath, B.D. (Eds.), 2010. Ecotoxicology: a derivative of Encyclopedia of ecology, 1st ed. Elsevier/Academic Press, Amsterdam, The Netherlands.
Kanan, R., Le Floch, S., Andersson, J., Le Menach, K., Budzinski, H., 2012. Extraction of Polycyclic Aromatic Hydrocarbons (PAHs), Polycyclic Aromatic Sulfur Heterocycles (PASHs) and Alkylated Derivatives from Seawater using Solide-Phase Microextraction (SPME)-Gas Chromatography-Mass Spectrometry (GC-MS). In Proceedings of the Thirty-Five AMOP Technical Seminar on Environmental Contamination and Response, Environment Canada, Ottawa, June 2012.
Keshavarzi, B., Mokhtarzadeh, Z., Moore, F., Rastegari Mehr, M., Lahijanzadeh, A., Rostami, S., Kaabi, H., 2015. Heavy metals and polycyclic aromatic hydrocarbons in surface sediments of Karoon River, Khuzestan Province, Iran. Environ. Sci. Pollut. Res. 22, 19077–19092. https://doi.org/10.1007/s11356-015-5080-8
Li, F., Zeng, X., Yang, J., Zhou, K., Zan, Q., Lei, A., Tam, N.F.Y., 2014. Contamination of polycyclic aromatic hydrocarbons (PAHs) in surface sediments and plants of mangrove swamps in Shenzhen, China. Mar. Pollut. Bull. 85, 590–596. https://doi.org/10.1016/j.marpolbul.2014.02.025
Manoli, E., Samara, C., Konstantinou, I., Albanis, T., 2000. Polycyclic aromatic hydrocarbons in the bulk precipitation and surface waters of Northern Greece. Chemosphere 41, 1845–1855.

CHAPTER 1
63
https://doi.org/10.1016/S0045-6535(00)00134-X
Ministerio del Ambiente (MAE), 2015. Refórmese el Texto Unificado de Legislación Secundaria, Registro Oficial-Edición Especial N° 387; Acuerdo 097-A [Noviembre 04].
Montuori, P., Aurino, S., Garzonio, F., Sarnacchiaro, P., Nardone, A., Triassi, M., 2016. Distribution, sources and ecological risk assessment of polycyclic aromatic hydrocarbons in water and sediments from Tiber River and estuary, Italy. Sci. Total Environ. 566–567, 1254–1267. https://doi.org/10.1016/j.scitotenv.2016.05.183
Narváez, I., 2000. Aguas de formación y derrames de petróleo. La dimensión política en la problemática socioambiental petrolera, 1st ed. Quito, Ecuador.
Nekhavhambe, T., Van Ree, T., Fatoki, O., 2014. Determination and distribution of polycyclic aromatic hydrocarbons in rivers, surface runoff, and sediments in and around Thohoyandou, Limpopo Province, South Africa. Water SA 40, 415. https://doi.org/10.4314/wsa.v40i3.4
Nisbet, I.C.T., LaGoy, P.K., 1992. Toxic equivalency factors (TEFs) for polycyclic aromatic hydrocarbons (PAHs). Regul. Toxicol. Pharmacol. 16, 290–300. https://doi.org/10.1016/0273-2300(92)90009-X
Paz-y-Miño, C., López-Cortés, A., Arévalo, M., Sánchez, M.E., 2008. Monitoring of DNA Damage in Individuals Exposed to Petroleum Hydrocarbons in Ecuador. Ann. N. Y. Acad. Sci. 1140, 121–128. https://doi.org/10.1196/annals.1454.013
RAOHE, 2001. Decreto No 1215 - Reglamento sustitutivo del Reglamento ambiental para las operaciones hidrocarburíferas en el Ecuador.
Raza, M., Zakaria, M.P., Hashim, N.R., Yim, U.H., Kannan, N., Ha, S.Y., 2013. Composition and source identification of polycyclic aromatic hydrocarbons in mangrove sediments of Peninsular Malaysia: indication of anthropogenic input. Environ. Earth Sci. 70, 2425–2436. https://doi.org/10.1007/s12665-013-2279-1
Rengarajan, T., Rajendran, P., Nandakumar, N., Lokeshkumar, B., Rajendran, P., Nishigaki, I., 2015. Exposure to polycyclic aromatic hydrocarbons with special focus on cancer. Asian Pac. J. Trop. Biomed. 5, 182–189. https://doi.org/10.1016/S2221-1691(15)30003-4
Ríos, S., Oliveira-Miranda, T., 2015. Deforestación en la Amazonía (1970 - 2013). São Paulo.
Ross, J.R.M., Oros, D.R., 2004. Polycyclic aromatic hydrocarbons in the San Francisco Estuary water column: Sources, spatial distributions, and temporal trends (1993–2001). Chemosphere 57, 909–920. https://doi.org/10.1016/j.chemosphere.2004.08.010
San Sebastián, M., Hurtig, A.K., 2005. Oil development and health in the Amazon basin of Ecuador: the popular epidemiology process. Soc. Sci. Med. 60, 799–807. https://doi.org/10.1016/j.socscimed.2004.06.016
Schlesinger, W., 2000. Biogeoquímica - Un Analisis del Cambio Global. Ariel, Barcelona.
Sierra, R., Flores, S., Zamora, G., 2009. Climate change assesment for Esmeraldas, Ecuador: A summary. UN-HABITAT, Nairobi.
Simpson, C.D., Mosi, A.A., Cullen, W.R., Reimer, K.J., 1996. Composition and distribution of polycyclic aromatic hydrocarbon contamination in surficial marine sediments from Kitimat Harbor, Canada. Sci. Total Environ. 181, 265–278. https://doi.org/10.1016/0048-9697(95)05026-4
Skinner, S., Reilly, W., 1989. The EXXON VALDEZ Oil Spill: A Report to the President. Environmental Protection Agency.
Soliman, N.F., Nasr, S.M., Okbah, M.A., 2015. Potential ecological risk of heavy metals in sediments from the Mediterranean coast, Egypt. J. Environ. Health Sci. Eng. 13, 70. https://doi.org/10.1186/s40201-015-0223-x
Speight, J.G., 2002. Handbook of petroleum product analysis. Wiley-Interscience, New York, United States.

CHAPTER 1
64
Stogiannidis, E., Laane, R., 2015. Source Characterization of Polycyclic Aromatic Hydrocarbons by Using Their Molecular Indices: An Overview of Possibilities, in: Whitacre, D.M. (Ed.), Reviews of Environmental Contamination and Toxicology. Springer International Publishing, Cham, pp. 49–133. https://doi.org/10.1007/978-3-319-10638-0_2
Sun, C., Zhang, J., Ma, Q., Chen, Y., Ju, H., 2017. Polycyclic aromatic hydrocarbons (PAHs) in water and sediment from a river basin: sediment–water partitioning, source identification and environmental health risk assessment. Environ. Geochem. Health 39, 63–74. https://doi.org/10.1007/s10653-016-9807-3
Sun, F., Wen, D., Kuang, Y., Li, J., Li, J., Zuo, W., 2010. Concentrations of heavy metals and polycyclic aromatic hydrocarbons in needles of Masson pine (Pinus massoniana L.) growing nearby different industrial sources. J. Environ. Sci. 22, 1006–1013. https://doi.org/10.1016/S1001-0742(09)60211-4
US Environmental Protection Agency (US EPA), 2019. Terms & Acronyms [WWW Document]. URL https://ofmpub.epa.gov/sor_internet/registry/termreg/searchandretrieve/termsandacronyms/search.do?search=&term=reference%20dose&matchCriteria=Contains&checkedAcronym=true&checkedTerm=true&hasDefinitions=false
US Environmental Protection Agency (US EPA), 2018a. EPA EcoBox Tools by Effects - Aquatic [WWW Document]. US EPA. URL https://www.epa.gov/node/150329/view (accessed 11.16.18).
US Environmental Protection Agency (US EPA), 2018b. Chapter 62-302 Surface water quality standards.
US Environmental Protection Agency (US EPA), 2015a. Toxic and Priority Pollutants Under the Clean Water Act [WWW Document]. US EPA. URL https://www.epa.gov/eg/toxic-and-priority-pollutants-under-clean-water-act (accessed 6.13.18).
US Environmental Protection Agency (US EPA), 2015b. National Recommended Water Quality Criteria - Aquatic Life Criteria Table [WWW Document]. US EPA. URL https://www.epa.gov/wqc/national-recommended-water-quality-criteria-aquatic-life-criteria-table (accessed 8.13.18).
US Environmental Protection Agency (US EPA), 2014. Chapter Four of the SW-846 Compendium: Organic Analytes.
Yunker, M.B., Macdonald, R.W., Vingarzan, R., Mitchell, R.H., Goyette, D., Sylvestre, S., 2002. PAHs in the Fraser River basin: a critical appraisal of PAH ratios as indicators of PAH source and composition. Org. Geochem. 33, 489–515. https://doi.org/10.1016/S0146-6380(02)00002-5
Yunker, M.B., McLaughlin, F.A., Fowler, M.G., Fowler, B.R., 2014. Source apportionment of the hydrocarbon background in sediment cores from Hecate Strait, a pristine sea on the west coast of British Columbia, Canada. Org. Geochem. 76, 235–258. https://doi.org/10.1016/j.orggeochem.2014.08.010
Zamani, M., Khorasani, N., Bakhtiari, A.R., Rezaei, K., 2015. Source identification of perylene in surface sediments and waterbird eggs in the Anzali Wetland, Iran. Environ. Pollut. 205, 23–32. https://doi.org/10.1016/j.envpol.2015.05.007
Zhang, S., Zhang, Q., Darisaw, S., Ehie, O., Wang, G., 2007. Simultaneous quantification of polycyclic aromatic hydrocarbons (PAHs), polychlorinated biphenyls (PCBs), and pharmaceuticals and personal care products (PPCPs) in Mississippi river water, in New Orleans, Louisiana, USA. Chemosphere 66, 1057–1069. https://doi.org/10.1016/j.chemosphere.2006.06.067

CHAPTER 1
65
Supplementary Information 1
Table SI-1. List and proprieties of organic molecules analyzed in the present study
GROUP MOLECULE RING
S
SOLUBILITY
(mg L-1)
MOLECULAR
WEIGHT
(g mole-1)
IARC
GROUP ABBREVIATION
US-EPA
PARENT
PAHs
Naphthalene 2 31 128.17 2B N
Acenaphthylene 3 3.9 152.20 - Ac
Acenaphthene 3 3.8 154.21 3 Ace
Fluorene 3 1.9 166.22 3 Fl
Phenanthrene 3 1.1 178.23 3 Ph
Anthracene 3 0.045 178.23 3 A
Fluoranthene 4 0.26 202.26 3 Fa
Pyrene 4 0.132 202.26 3 Py
Benzo[a]anthracene 4 0.011 228.29 2B BaA
Chrysene* 4 0.0015 228.29 2B Ch
Benzo[b]fluoranthene** 5 0.0015 252.32 2B BbjkF
Benzo[k]fluoranthene** 5 0.0008 252.32 2B BbjkF
Benzo[a]pyrene 5 0.0038 252.32 1 BaP
Indeno[1,2,3-cd]pyrene 6 0.062 276.34 2B IP
Dibenzo[a,h]anthracene*** 5 0.0005 278.35 2A DBA
Benzo[g,h,i]perylene 6 0.00026 276.34 3 BPe
OTHER
PARENT
PAHs
Triphenylene* 4 0.0066 228.29 3 Ch
Benzo[e]pyrene 5 0.0063 252.32 3 BeP
Benzo[j]fluoranthene** 5 0.0025 252.32 2B BbjkF
Dibenzo[a,c]anthracene*** 5 0.0016 278.35 3 DBA
Perylene 5 0.0004 252.32 3 Pe
METHYL
And
THIO
PAHs
1Methylnaphthalene 2 25 142.2 - 1MN
2Methylnaphthalene 2 24.6 142.2 - 2MN
ΣDimethylnaphthalene 2 2-11 156.2 - ∑DMN
ΣTrimethylnaphthalene 2 1.7-2.0 170.3 - ∑TMN
ΣTetramethylnaphthalene 2 - 184.3 - ∑TeMN
2Methylanthracene 3 0.021 192.3 - MA
1Methylanthracene**** 3 0.27 192.3 - MPhMA
[9+4]Methylphenanthrene**** 3 - 192.3 - MPhMA
[4,5]Methylenephenanthrene**** 3 1.1 190.2 - MPhMA
1Methylphenanthrene 3 0.3 192.3 3 1MPh
2Methylphenanthrene 3 0.3 192.3 - 2MPh
3Methylphenanthrene 3 - 192.3 3 3MPh
ΣDimethylphenanthrene 3 - 206.2 3 ∑DMPh
ΣTrimethylphenanthrene 3 - 220.3 - ∑TMPh
ΣMethylchrysene 4 0.062-0.065 242.3 2B#, 3 MCh
ΣMethyldibenzothiophene 3 - 198.3 - ∑MDBT
Dibenzothiophene 3 1.47 184.3 3 DBT
2,1-Benzonaphtothiophene 4 - 234.32 3 BNT
Source:(Bojes and Pope, 2007; International Agency for Research on Cancer (IARC), 2018; National Center for Biotechnology
Information (NCBI) and US National Library of Medicine (USNLM), 2018); IARC=International Agency for Research on
Cancer; * Ch= Chrysene+Triphenylene=this two compounds are in the same analytical ensemble; Triphenylene is not in the
US-EPA list **BbjkF= Benzo[b,j,k]fluoranthene=this three compounds are in the same analytical ensemble; Benzo[j]fluoranthene is not in the US-EPA list; ***DBA=dibenzo[a,h]anthracene+dibenzo[a,c]anthracene ; ****MPhMA
=[9+4]methylphenanthrene+ [4,5]methylenephenanthrene +1methylanthracene, this three compounds belongs to the same
analytical ensemble. # only for 5-MCh.

CHAPTER 1
66
Table SI-3. Spearman’s correlation (p<0.05) for the main variables in sediments.
r(p<0.05) hazard clays silts sands TC OC TN TS 16PAH LMW HMW TAC MPAH
hazard 1.00
clays 0.00 1.00
silts -0.07 0.36 1.00
sands 0.10 -0.73 -0.85 1.00
TC 0.02 0.22 0.44 -0.33 1.00
OC 0.11 0.21 0.41 -0.31 0.94 1.00
TN -0.06 0.38 0.50 -0.46 0.96 0.90 1.00
TS -0.13 -0.14 0.32 -0.17 0.34 0.43 0.19 1.00
16PAH 0.16 0.03 0.33 -0.24 0.22 0.24 0.10 0.43 1.00
LMW 0.12 -0.03 0.31 -0.21 0.21 0.25 0.05 0.44 0.95 1.00
HMW 0.15 0.04 0.32 -0.23 0.24 0.26 0.14 0.40 0.96 0.84 1.00
TAC 0.22 0.14 0.35 -0.31 0.18 0.21 0.03 0.26 0.86 0.79 0.84 1.00
MPAH 0.17 -0.04 0.22 -0.13 0.17 0.18 -0.06 0.40 0.92 0.89 0.88 0.85 1.00
Table SI-2. National and international water quality guidelines in freshwater.
MOLECULE(S) RAOHEa USEPAb CCMEb EUb FRb
TSS# 1700 -- -- -- --
N -- -- 1100 2400 130000
Ace -- -- 5800 -- --
Fl -- -- 3000 -- --
Ph -- -- 400 -- --
A -- -- 12 400 100
Fa -- -- 40 1000 120
Py -- -- 25 -- --
BaA -- -- 18 -- --
BbjkF -- -- -- 30 17
BaP -- -- 15 100 270
IP -- -- -- 2 --
BPe -- -- -- 2 8,2
WQG USEPA -- 31 -- -- --
WQG EC 300 -- -- -- --
a At least 300 m downstream of the discharge point
b=freshwater (inland)
#=in mg.L-1

CHAPTER 1
67
Table SI-4. Normality test (Shapiro-Wilk) applied to PAHs concentrations in bottom sediments.
VARIABLE AMAZON COAST AMAZON* COAST*
W p-value W p-value W p-value W p-value
hazard 8.88E-01 1.91E-05 -- -- 9.39E-01 7.81E-03 -- --
≤ 4 μm 9.01E-01 6.00E-05 8.94E-01 9.21E-02 9.58E-01 2.50E-02 9.50E-01 5.66E-01
4-63 µm 9.28E-01 7.85E-04 9.36E-01 3.73E-01 6.97E-01 1.84E-10 9.12E-01 1.71E-01
≤ 63 µm 9.37E-01 2.06E-03 9.66E-01 8.15E-01 7.31E-01 9.00E-10 9.41E-01 4.29E-01
> 63μm 9.37E-01 2.06E-03 9.66E-01 8.15E-01 9.70E-01 1.06E-01 9.67E-01 8.37E-01
TC (%) 7.39E-01 1.40E-09 9.00E-01 1.13E-01 9.64E-01 4.81E-02 9.09E-01 1.52E-01
OC (%) 6.87E-01 1.17E-10 9.17E-01 1.98E-01 9.46E-01 6.00E-03 9.68E-01 8.47E-01
N 4.31E-01 1.11E-14 5.11E-01 7.17E-06 9.74E-01 1.81E-01 8.40E-01 1.61E-02
Ac 1.50E-01 <2.2E-16 3.10E-01 2.64E-07 4.31E-01 1.13E-14 5.81E-01 2.77E-05
Ace 1.49E-01 <2.2E-16 3.62E-01 5.87E-07 6.85E-01 1.06E-10 7.18E-01 5.74E-04
Fl 1.44E-01 <2.2E-16 4.64E-01 3.12E-06 8.12E-01 8.11E-08 8.17E-01 8.17E-03
Ph 3.77E-01 2.37E-15 4.59E-01 2.88E-06 9.26E-01 6.67E-04 8.40E-01 1.61E-02
A 3.44E-01 1.66E-15 4.44E-01 2.22E-06 6.50E-01 3.61E-11 8.31E-01 1.23E-02
Fa 3.37E-01 7.94E-16 3.22E-01 3.19E-07 8.35E-01 3.76E-07 8.26E-01 1.06E-02
Py 3.53E-01 1.23E-15 4.66E-01 3.23E-06 9.22E-01 4.24E-04 9.06E-01 1.40E-01
BaA 2.98E-01 2.96E-16 4.37E-01 1.96E-06 8.99E-01 5.22E-05 9.48E-01 5.27E-01
Ch 1.75E-01 <2.2E-16 4.14E-01 1.34E-06 9.57E-01 2.02E-02 9.40E-01 4.19E-01
BbjkF 2.17E-01 <2.2E-16 5.08E-01 6.81E-06 9.69E-01 8.71E-02 9.36E-01 3.67E-01
BaP 5.03E-01 1.69E-13 4.22E-01 1.53E-06 9.64E-01 5.26E-02 9.55E-01 6.36E-01
IP 3.54E-01 1.28E-15 7.26E-01 6.90E-04 9.57E-01 2.17E-02 9.54E-01 6.23E-01
DBA 1.72E-01 <2.2E-16 4.61E-01 2.99E-06 8.39E-01 6.75E-07 9.71E-01 8.86E-01
BPe 3.77E-01 3.07E-15 5.71E-01 2.27E-05 9.74E-01 1.72E-01 9.66E-01 8.22E-01
16PAH 2.92E-01 2.51E-16 4.69E-01 3.41E-06 9.18E-01 2.99E-04 8.70E-01 4.20E-02
BeP 2.38E-01 <2.2E-16 4.39E-01 2.04E-06 9.59E-01 2.79E-02 9.47E-01 5.20E-01
Pe 5.27E-01 2.35E-13 9.03E-01 1.25E-01 9.33E-01 1.38E-03 9.51E-01 5.82E-01
MCh 1.66E-01 <2.2E-16 3.95E-01 9.83E-07 9.61E-01 3.77E-02 9.57E-01 6.71E-01
BNT 1.54E-01 <2.2E-16 4.43E-01 2.20E-06 8.01E-01 4.14E-08 8.50E-01 2.20E-02
3MPh 1.71E-01 <2.2E-16 4.07E-01 1.20E-06 9.04E-01 8.11E-05 9.00E-01 1.12E-01
2MPh 1.74E-01 <2.2E-16 3.71E-01 6.77E-07 9.19E-01 3.38E-04 9.01E-01 1.16E-01
MA 1.91E-01 <2.2E-16 4.44E-01 2.23E-06 6.54E-01 3.41E-11 7.90E-01 3.79E-03
MPhMA 1.78E-01 <2.2E-16 3.89E-01 8.96E-07 9.18E-01 3.45E-04 9.21E-01 2.27E-01
1MPh 1.71E-01 <2.2E-16 3.95E-01 9.85E-07 9.00E-01 6.36E-05 9.01E-01 1.18E-01
∑DMPh 1.73E-01 <2.2E-16 3.90E-01 9.10E-07 9.06E-01 9.57E-05 9.70E-01 8.75E-01
∑TMPh 1.74E-01 <2.2E-16 3.88E-01 8.86E-07 9.13E-01 1.86E-04 9.67E-01 8.40E-01
2MN 1.74E-01 <2.2E-16 3.93E-01 9.55E-07 9.45E-01 4.86E-03 8.16E-01 7.98E-03
1MN 1.66E-01 <2.2E-16 3.87E-01 8.75E-07 9.34E-01 1.59E-03 7.91E-01 3.86E-03
∑DMN 1.50E-01 <2.2E-16 3.20E-01 3.09E-07 9.10E-01 1.43E-04 8.34E-01 1.34E-02
∑TMN 1.61E-01 <2.2E-16 3.17E-01 2.94E-07 8.90E-01 2.25E-05 8.85E-01 6.84E-02
∑TeMN 1.73E-01 <2.2E-16 3.18E-01 3.01E-07 8.56E-01 1.65E-06 8.97E-01 1.01E-01
DBT 1.82E-01 <2.2E-16 4.65E-01 3.21E-06 8.70E-01 4.54E-06 8.59E-01 2.95E-02
∑MDBT 1.70E-01 <2.2E-16 4.01E-01 1.09E-06 8.69E-01 4.40E-06 9.02E-01 1.20E-01
*Logaritmic transformation

CHAPTER 1
68
Table SI-5. Total aromatic charge (ng.g-1), mean-SQG quotients and total-equivalent quantity (TEQ-BaP, ng.g-1) in sediments from Napo, Aguarico and Esmeraldas basins.
BASIN SITE TAC (nonPe) mERM-Q mPEL_Q TEQ-BaP SUB-BASIN
b.sands(i) 112594 2.7E-01 8.6E-01 2289 --
wasteA8(i) 1158235 1.3E+00 4.6E+00 2476 --
crudeA3(i) 7636490 7.6E+01 2.8E+02 3354 --
crudePL(i) 13743430 1.3E+02 4.5E+02 4804 --
SJ6 21 1.9E-04 6.5E-04 0.54 M.Santiago
BB6 29 1.0E-04 3.7E-04 0.44 M.Santiago
S-a5 6 1.5E-04 5.4E-04 0.36 M.Santiago
S-b6 8 1.4E-04 5.5E-04 0.38 M.Santiago
S-c5 6 1.5E-04 5.3E-04 0.40 M.Santiago
S-d5 5 1.5E-04 5.3E-04 0.32 M.Santiago
S-e5 410 2.6E-03 8.5E-03 8.50 M.Santiago
S-f6 60 5.0E-04 1.7E-03 1.07 M.Santiago
SA6 6 1.1E-04 4.2E-04 0.25 Portoviejo
PN-a4 194 1.7E-03 5.9E-03 1.04 Napo
PN-b5 146 1.4E-03 5.1E-03 1.17 Napo
PN-c6 197 1.6E-03 5.8E-03 1.69 Napo
PN-d2 190 2.9E-03 1.0E-02 1.44 Napo
PO-a6 127 5.4E-04 1.7E-03 2.41 Napo
PO-b3 32 3.9E-04 1.3E-03 0.96 Napo
PO-c4 205 1.6E-03 6.0E-03 1.74 Napo
PO-d6 189 1.5E-03 5.2E-03 3.07 Napo
PO-e6(i) 3003 1.4E-02 4.8E-02 17.20 Payamino
NAPO PO-f5** 77 5.9E-04 2.0E-03 1.52 Payamino
PO-g2(i)** 83473 2.7E-01 9.9E-01 21.43 Payamino
PO-h2** 376 1.1E-02 3.7E-02 2.16 Payamino
PO-i6 182 1.1E-03 3.5E-03 3.84 Payamino
SC-b6 225 1.3E-03 4.4E-03 1.66 Coca
SC-d3 101 9.1E-04 3.1E-03 0.98 Coca
SC-e4 204 1.4E-03 4.9E-03 1.44 Coca
SC-f5 17 2.1E-04 7.3E-04 0.40 Coca
JS6 7 8.5E-05 3.1E-04 0.33 Napo
LI5 9 1.5E-04 5.3E-04 0.59 Napo
DY-a6** 28 2.2E-04 8.1E-04 0.44 Rumiyacu
DY-b6** 28 3.6E-04 1.3E-03 1.13 Rumiyacu
DY-c2** 47 3.9E-04 1.4E-03 0.96 Rumiyacu
DY-d4** 10 1.8E-04 7.7E-04 0.05 Rumiyacu
DY-e3** 73 5.1E-04 1.7E-03 1.86 Rumiyacu
DY-f5** 126 6.7E-04 2.1E-03 3.55 Rumiyacu
DY-g6 5 9.1E-05 3.3E-04 0.32 Rumiyacu
DY-h3** 18 1.5E-04 5.0E-04 0.94 Tiputini
DY-i6** 20 3.4E-04 1.3E-03 1.31 Tiputini
DY-j2(i)** 52243 8.3E-02 2.9E-01 128.16 Tiputini
DY-k2** 596 1.2E-02 4.0E-02 8.01 Tiputini
DY-l6** 335 1.1E-02 4.0E-02 0.70 Tiputini
DY-m6 12 1.3E-04 4.4E-04 0.79 Tiputini
TI-a4 37 2.8E-04 1.1E-03 1.03 Tiputini
TI-b4 29 5.8E-04 2.0E-03 0.99 Tiputini
TI-c4(i) 24 2.1E-04 7.9E-04 1.03 Tiputini
NR-a4 153 1.4E-03 4.1E-03 7.55 Napo
NR-b2 170 1.2E-03 4.2E-03 1.10 Napo
LM-a5 189 1.3E-03 4.6E-03 1.24 Aguarico
LM-b6 253 1.6E-03 5.4E-03 2.38 Aguarico
LM-c4 227 1.8E-03 6.5E-03 2.58 Aguarico
LM-d3 26 3.1E-04 1.0E-03 0.95 Aguarico
AGUARICO DU-a4 87 5.2E-04 2.0E-03 1.23 Aguarico
DU-b3** 10 1.2E-04 3.7E-04 0.94 Aguarico
PK-a5(i)** 12 1.4E-04 5.1E-04 0.38 Aguarico
PK-b2** 639 7.9E-03 2.7E-02 6.89 Aguarico
PK-c6 7 9.2E-05 3.5E-04 0.11 Aguarico

CHAPTER 1
69
Table SI-5. Total aromatic charge (ng.g-1), mean-SQG quotients and total-equivalent quantity (TEQ-BaP, ng.g-1) in sediments from Napo, Aguarico and Esmeraldas basins. (continued)
BASIN SITE TAC # mERM-Q mPEL_Q TEQ-BaP SUB-BASIN
PK-d4 173 1.3E-03 4.5E-03 1.13 Aguarico
PK-e3 39 3.5E-04 1.1E-03 0.95 Aguarico
PK-f2** 291 8.2E-03 2.8E-02 1.93 Aguarico
AGUARICO PK-g2** 124 3.2E-03 1.1E-02 1.05 Aguarico
PK-h3** 11 2.0E-04 5.1E-04 2.86 Aguarico
PK-i3 23 2.2E-04 7.2E-04 1.08 Aguarico
SF-a6 15 1.5E-04 5.5E-04 0.23 Shushufindi
SF-b6 36 1.9E-04 6.6E-04 0.69 Shushufindi
SF-c4 46 5.7E-04 2.3E-03 2.00 Shushufindi
SF-d4 53 3.5E-04 1.2E-03 1.62 Shushufindi
SR6 336 2.4E-03 8.3E-03 3.07 Aguarico
NR-c4 83 5.8E-04 2.0E-03 1.02 Aguarico
NR-d2 349 6.5E-03 2.2E-02 2.21 Aguarico
CC-a6 8 9.8E-05 3.5E-04 0.37 Teaone
CC-b4 21 2.7E-04 9.5E-04 1.37 Teaone
VL-a3 11 1.5E-04 4.8E-04 0.95 Teaone
VL-b6* 136627 1.3E-01 4.5E-01 136.25 Teaone
VL-c2* 11266 8.7E-02 3.1E-01 33.89 Teaone
ESMERALDAS VL-d4* 208 1.5E-03 4.7E-03 12.83 Teaone
VL-e6* 1335 7.6E-03 2.7E-02 7.00 Teaone
VL-f2 515 3.7E-03 1.3E-02 3.30 Teaone
AG-a3 349 1.0E-03 3.5E-03 4.24 Teaone
SM6 18 2.5E-04 8.6E-04 0.85 Esmeraldas
AG-b3 228 9.7E-04 3.2E-03 3.57 Esmeraldas
E-a6 35 2.8E-04 9.6E-04 0.82 Esmeraldas
E-b4 57 4.9E-04 1.7E-03 1.64 Esmeraldas
# Perylene non included

CHAPTER 1
70
Tab
le S
I-6
. To
xico
logi
cal r
efer
ence
val
ues
(TR
V)
for
sed
imen
ts in
ng.
g-1, T
EF is
dim
ensi
on
less
.
MO
LE
CU
LE
Sw
art
z ,1
999
NO
AA
/CC
ME
N
OA
A
TO
XIC
ITY
EQ
UIV
AL
EN
T F
AC
TO
R
TE
L
PE
L
ER
L
ER
M
fres
hw
ate
r se
aw
ate
r E
RL
E
RM
(
Mon
tuori,
2016
;
EP
A, 1993,2
019)
(K
esh
avarzi
, 2015
Nis
bet,
1992
Coll
ins,
1998)
(CC
ME
,2010
) T
EL
P
EL
T
EL
P
EL
Ace
1
0
90
20
50
0
6.7
1
88
.9
6.7
1
88
.9
5
00
--
0.0
01
--
Ac
10
13
0
40
64
0
5.8
7
12
8
5.8
7
12
8
44
64
0
--
0.0
01
--
A
50
24
0
90
11
00
46
.9
24
5
46
.9
24
5
85
11
00
--
0.0
1
--
F
20
14
0
20
54
0
21
.2
14
4
21
.2
14
4
19
54
0
--
0.0
01
--
N
30
39
0
16
0
21
00
34
.6
39
1
34
.6
39
1
16
0
21
00
--
0.0
01
--
Ph
9
0
54
0
24
0
15
00
41
.9
51
5
86
.7
54
4
24
0
15
00
--
0.0
01
--
LM
W-P
AH
2
10
15
30
57
0
63
80
15
7.2
1
423
31
2
14
42
55
2
31
60
--
--
--
Ba
A
70
69
0
26
0
16
00
31
.7
38
5
74
.8
69
3
26
1
16
00
0.1
0.1
0.1
Bb
F
70
71
0
32
0
18
80
--
--
--
--
--
--
0.1
0.1
0.1
Bk
F
60
61
0
28
0
16
20
--
--
--
--
--
--
0.0
1
0.1
0.1
Ba
P
90
76
0
43
0
16
00
31
.9
78
2
88
.8
76
3
43
0
16
00
1
1
1
DB
A
--
--
--
--
6.2
2
13
5
6.2
2
13
5
63
26
0
1
5*
1.0
00
Ch
1
10
85
0
38
0
28
00
57
.1
68
2
10
8
84
6
38
4
28
00
0.0
01
0.0
1
0.0
1
Fa
1
10
14
90
60
0
51
00
11
1
23
55
11
3
14
94
60
0
51
00
--
0.0
01
--
Py
1
50
14
00
66
0
26
00
53
87
5
15
3
13
98
66
5
26
00
--
0.0
01
--
IP
--
--
--
--
--
--
--
--
--
--
0.1
0.1
0.1
HM
W-P
AH
s 6
60
65
10
29
30
17
20
0
29
0.9
2
52
14
65
5
66
76
17
00
96
00
--
--
--
TA
C
87
0
80
40
35
00
23
58
0
44
8.1
0
66
37
16
84
16
77
0
40
22
44
79
2
--
--
--
BP
e --
--
--
--
--
--
--
--
--
--
--
0.0
1
0.0
1
2M
N
--
--
--
--
20
.2
20
1
20
.2
20
1
70
67
0
--
0.0
01
--
*O
nly
for
dil
ute
d w
ater
NO
AA
, 2008;
CC
ME
, 2010

CHAPTER 1
71
Tab
le S
I-7
. R
ange
s o
f d
isso
lved
org
anic
car
bo
n (
mg.
L-1 )
, to
tal s
usp
end
ed s
olid
s (m
g.L-1
),
and
dis
solv
ed P
AH
S (n
g.L-1
) in
su
rfac
e w
ater
fro
m d
iffe
ren
t b
asin
s in
th
e N
ort
her
n a
nd
So
uth
ern
Ecu
ado
rian
Am
azo
n R
egio
n (
NEA
R a
nd
SEA
R,
resp
ecti
vely
) an
d in
th
e N
ort
her
n a
nd
So
uth
ern
Ecu
ado
rian
Pac
ific
Co
ast
(NEP
C a
nd
SE
PC
, res
pec
tive
ly).

CHAPTER 1
72
Tab
le S
I-7
. R
ange
s o
f d
isso
lved
org
anic
car
bo
n (
mg.
L-1 )
, to
tal s
usp
end
ed s
olid
s (m
g.L-1
), a
nd
dis
solv
ed P
AH
S (n
g.L-1
) in
su
rfac
e w
ater
fro
m d
iffe
ren
t b
asin
s in
th
e N
ort
her
n a
nd
So
uth
ern
Ecu
ado
rian
Am
azo
n R
egio
n (
NEA
R a
nd
SEA
R, r
esp
ecti
vely
) an
d in
th
e N
ort
her
n a
nd
So
uth
ern
Ecu
ado
rian
Pac
ific
Co
ast
(NEP
C a
nd
SE
PC
, res
pec
tive
ly).
(co
nti
nu
ed)

CHAPTER 1
73
Tab
le S
I-8
. R
ange
s o
f p
ollu
tio
n h
azar
d,
grai
n s
ize
(%)
and
ave
rage
co
nce
ntr
atio
n (
ng.
g--1
dw
) o
f P
AH
S in
sed
imen
ts f
rom
dif
fere
nt
bas
ins
in t
he
No
rth
ern
an
d
Sou
ther
n E
cuad
ori
an A
maz
on
Reg
ion
(N
EAR
an
d S
EAR
, res
pec
tive
ly)
and
in t
he
No
rth
ern
an
d S
ou
ther
n E
cuad
ori
an P
acif
ic C
oas
t (N
EPC
an
d S
EPC
, res
pec
tive
ly).

CHAPTER 1
74
Tab
le S
I-8
. Ran
ges
of p
ollu
tio
n h
azar
d, g
rain
siz
e (%
) an
d a
vera
ge c
on
cen
trat
ion
(ng.
g-1 d
w) o
f PA
HS
in s
edim
ents
fro
m d
iffe
ren
t b
asin
s in
the
No
rth
ern
an
d S
ou
ther
n
Ecu
ado
rian
Am
azo
n R
egio
n (
NEA
R a
nd
SEA
R, r
esp
ecti
vely
) an
d in
th
e N
ort
her
n a
nd
So
uth
ern
Ecu
ado
rian
Pac
ific
Co
ast
(NEP
C a
nd
SEP
C, r
esp
ecti
vely
).(c
on
tin
ued
)

CHAPTER 1
75
Tab
le S
I-9
. Iso
mer
ic r
atio
s si
nce
PA
H c
on
cen
trat
ion
in s
edim
ents
.

CHAPTER 1
76
Tab
le S
I-9
. Iso
mer
ic r
atio
s si
nce
PA
H c
on
cen
trat
ion
in s
edim
ents
. (co
nti
nu
ed)

CHAPTER 1
77
Tab
le S
I-9
. Iso
mer
ic r
atio
s si
nce
PA
H c
on
cen
trat
ion
in s
edim
ents
. (co
nti
nu
ed)

CHAPTER 1
78
Figure SI-1. Interannual (2012-2016) average monthly discharge from five HyBAm stations: A) Aguarico_Nueva Loja, B) Coca_San Sebastian, C) Napo_Francisco de Orellana, D)Napo_Rocafuerte and E) Santiago_Batallon.
Figure SI-2. Dissolved-total aromatic charge (ng.L-1) in the studied sub-basins.

CHAPTER 1
79
Figure SI-3. Hazard risk, grain size; carbon, nitrogen and sulfur and relative abundance of PAHs in sediments (%); *All the units are expressed in %, except the pollution hazard (dimensionless).

CHAPTER 1
80
Figure SI-4. PAH distributions in sediments (naphthalene and perylene included); A) Crude oil and oil saturated samples; B) Control sites; C) Esmeraldas Basin; D) Napo Basin; E) Aguarico Basin.s

CHAPTER 2
81
CHAPTER 2. Oil pollution hazards and health quality of
drinking waters in Ecuador
Forewords
"Nosotros no queremos plata, no queremos dinero, lo que queremos es tener dos cosas señores: agua queremos porque en la zona no hay
como coger agua. Está contaminada. Por más que las autoridades locales quieran darnos agua no lo pueden, todo está contaminado, inclusive
el aire. Queremos agua y justicia, nada más.” -José Shingre, campesino ecuatoriano en la audiencia de la ONU, 2013
“We do not want money, we don’t want cash, we only want two things, Sirs: we want water, because it is not possible to take water in the
area. It is contaminated. Even if the local authorities want to give us water, they cannot, everything is contaminated, even the air. We want
water and justice, nothing else.” -José Shingre, Ecuadorian farmer at the parliamentary hearing at the United Nations, 2013
Insufficient and not-safe drinking water are the main causes of 842,000 deaths and billions of
diarrheal-disease cases per year around the world, with children under-five being the most
affected population (Kayser et al., 2015). Quantity and quality need to be considered at the
moment of determining the adequacy of drinking water supply (Martínez et al., 2018). Access
to safe water in Ecuador emphasizes the conflicts between environment and law in which local
water governance has been developed. It constitutes an interesting case of study, and
throughout the present chapter, these two aspects (water quality and its access as well as
governance) are considered.
Although the high number of Ecuadorian water sources, safe water is not guaranteed for local
populations (Figure VII, A and B). In Ecuador, the access to improved water sources (piped or
not) increased from 74% in 1990 to 97 % in 2015; but, focalized in urban zones where 85% of
the population uses water considered “free from any contamination” while in rural areas 46
% still uses water sources of doubtful quality (Kayser et al., 2015; WHO and UNICEF, 2017).
Until the 2010 census Figure VII, C and D), the Andean region has been the only one with
water system coverage above the national average, followed by the Coastal Region. Finally,
the Amazon Region presents the lowest percentage of dwelling places with access to system
water (IGM, 2013; Kayser et al., 2015). Only recently (2014-2018) the Amazon Region has
improved its systems of water supply (75% of coverage), approaching the Coastal Region
(82%), but still far from the 97% in the Andean Region (Fernández et al., 2018)
The inter-regional evolution in water-access gap in Ecuador is explained by the progress in
water governance and other time-line events associated with oil production and agrarian

CHAPTER 2
82
reforms (Gondard and Mazurek, 2001; Wasserstrom and Southgate, 2013). Among these
events, the social conflicts in the Amazon Region due to the Texaco trial (1993-2018) remain
important, together with the implementation of national water quality guidelines (WQG) and
the engagements of municipalities in water management and sanitation due to the
constitutional reform (2008-2018) and PRAS missions (Fernández and Buitrón Cisneros, 2012;
Kayser et al., 2015; Pinto et al., 2012).
The first document on water governance appeared in 1972 (Gobierno del Ecuador, 1972) with
prioritization of irrigation water over drinking water, in raison of agrarian reforms (Martínez
Figure VII. Water access in Ecuador: A. Available surface water flow. B. Main sources of drinking water supply. C. Percentage of urban homes with access to public water system. D. Percentage of rural homes with access to public water system. (modified from IGM, 2010)

CHAPTER 2
83
et al., 2018). But Ecuadorian WQGs appeared late: the first one, the norm INEN 1108, was
accepted as compulsory drinking water quality guidelines in 1984 (Gobierno del Ecuador,
2005). In 2003, a second group of WQGs was set up in the “Texto Unificado de Legislación
Secundaria del Ministerio del Ambiente”(MAE, 2003); this updated version (MAE, 2015) is
used as the current directive for environmental control. Both regulations are based on the
WQGs given by the World Health Organization (Pinto et al., 2012). But, as similar regulatory
frames in developing countries, Ecuadorian drinking water directives need to be improved
towards more accurate risk-based management to better assure water safety (Martínez et al.,
2018).
Although, 25 years have passed since Texaco left Ecuador and drinking water and health
programs have been enhanced but the risk related to oil activities for human health is still
present in local communities. Since 1973, people have struggled with the presence of crude
oil residuals floating on water, roads covered by crude, oil waste pits (some of them are still
present in their farms) and formation-water discharged in the nature. They have also faced
cancer or other diseases, developing a local perception of the risk and declaring the effects of
oil contamination in national and international courts during a long trial (1993-2018).
Throughout this lawsuit, environmental damages were determined in about US$ 27 billons
(BBC Press, 2018; Buccina et al., 2013).
Ecuadorians living closer to oil industrial zones are considered exposed to hazards (physical,
chemical and biological) by consuming not safe water to drink, bath, wash clothes and cook
(Figure VIII); it enables the entry of contaminants by ingestion or dermal contact and
absorption. Metal(oid)s and hydrocarbons presented in byproducts from crude oil extraction
or refining processes are suspected to reach surface waters and groundwaters affecting the
sources of water supply and increasing the risk of acute and chronic diseases.
No health studies describing risks linked to oil pollution have been published from 1973 to
1993. The first epidemiological study on cancer incidence from 1989-1998 showed a cancer
rate in the NEAR higher than in other places (IESC, 2004; San Sebastian, 2001; San Sebastián
and Córdoba, 1999). But, further studies have not found correlation between oil activities and
human health risks (Kelsh et al., 2009; Moolgavkar et al., 2014). This contradiction triggers the
question of the human risk related with water uses, not only in the Amazon Region, but also
in other areas influenced by oil industries.
However, local populations have linked abortions, cancer, skin problems, respiratory
problems, digestive problems, etc. to oil pollution. Although many of these diseases are tied
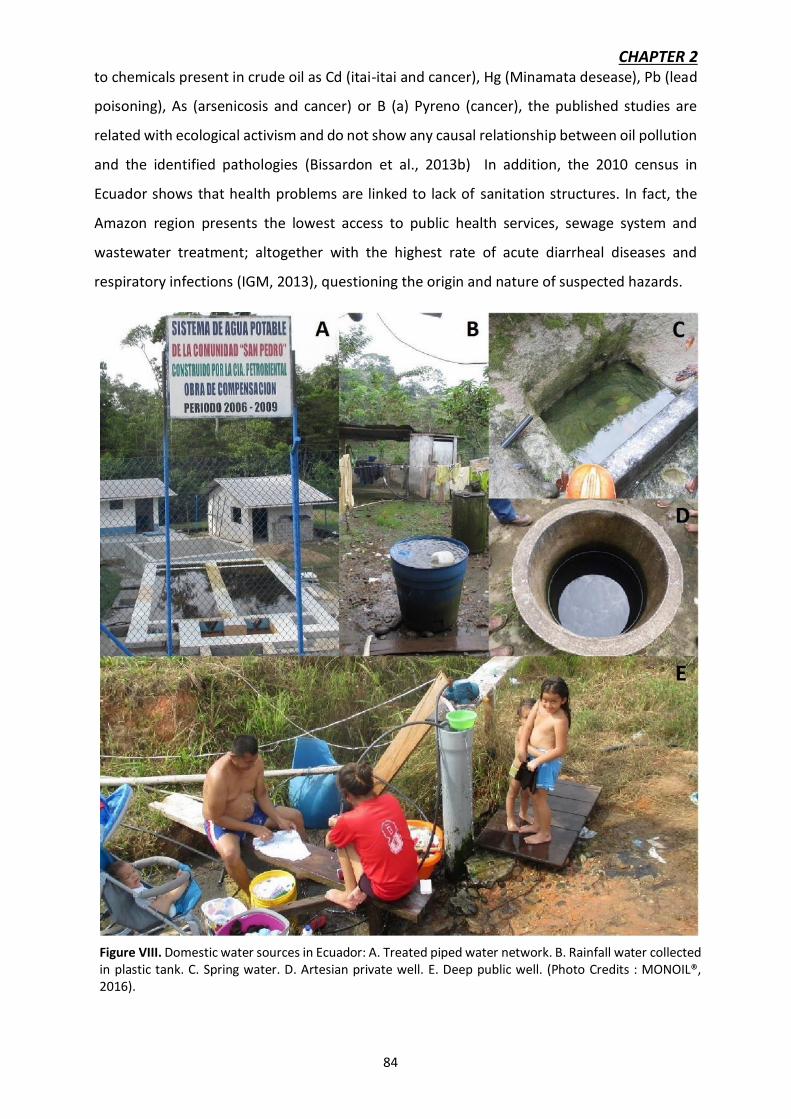
CHAPTER 2
84
to chemicals present in crude oil as Cd (itai-itai and cancer), Hg (Minamata desease), Pb (lead
poisoning), As (arsenicosis and cancer) or B (a) Pyreno (cancer), the published studies are
related with ecological activism and do not show any causal relationship between oil pollution
and the identified pathologies (Bissardon et al., 2013b) In addition, the 2010 census in
Ecuador shows that health problems are linked to lack of sanitation structures. In fact, the
Amazon region presents the lowest access to public health services, sewage system and
wastewater treatment; altogether with the highest rate of acute diarrheal diseases and
respiratory infections (IGM, 2013), questioning the origin and nature of suspected hazards.
Figure VIII. Domestic water sources in Ecuador: A. Treated piped water network. B. Rainfall water collected in plastic tank. C. Spring water. D. Artesian private well. E. Deep public well. (Photo Credits : MONOIL®, 2016).

CHAPTER 2
85
Thus, to define if human populations in oil-industrial zones are impacted by water
consumption, five field campaigns were conducted and domestic waters (Figure VIII) were
sampled from different sources (rainfall, river, spring, stream, system and well) in 18
Amazonian parishes and in 7 coastal parishes. We used different methods combining
chemistry and spectroscopy (ICP-MS, ICP-OES, AFS and GC-MS) to define the concentrations
of major anions (Ca, K, Mg, Na, and Si), 20 metallic elements and 38 organic compounds (PAHs
and BTEX). We focalized our analyses and discussion on chemicals directly related with oil
pollution (Ba, Mn, Ni, V and PAHs) and those that are known to involve risk for humans (As,
Cd, Cr, Ni, Pb, PAHs and BTEX).
We also used the available WQGs (local and international) to define water quality and to
determine the potential risks incurred by local populations. Drinking-water showing accepted
WQGs is supposed not to present any significant risk for human health, as a result of individual
substances concentrations (WHO, 2018). Although the water quality assessment based on
WQGs is the most used method worldwide, it does not allow to really determine the risk
related with a cocktail of chemicals. Some chemicals are harmless individually and/or at low
doses, but can be harmful when they interact.
Amiard (2017) defines synergy, antagonism, inhibition and potentiation as the main ways in
which chemicals can interact. The effect of each of these interactions in an organism is known
as "the cocktail effect" and cannot be evaluated by the individual toxicity thresholds (WQGs).
Then, we apply the Health Risk Assessment (HRA) developed by the US EPA (2004, 2003) to
consider two mixtures of dissolved components (ETMs and PAHs), the local characteristics of
the population (weight, daily ingestion, age and time of exposure) and the different exposure
routes.
Thus, in the article below, we analyse water quality by comparing it with different WQGs. As
water is defined as the main pathway of pollutants, we determine the main routes of exposure
(dermal contact or ingestion), define the population potentially impacted (adults or children),
the hazard of concern (chemical, microbiological and/or socio-economical) and the
provenance of health hazards (industrial or public discharge).

CHAPTER 2
86
(article published in Science of the Total Environment)
Drinking water quality in areas impacted by oil activities in Ecuador:
associated health risks and social perception of human exposure
Laurence Mauricea,b*, Fausto Lópeza, Sylvia Becerraa, Hala Jamhouryc, Karyn Le Menachd,
Marie Hélène Devierd, Hélène Budzinskid, Jonathan Pruniere,a, Guilhem Juteau-Martineauf,
Valeria Ochoag,h, Diego Quiroga g, Eva Schrecka
a Géosciences Environnement Toulouse (GET), Observatoire Midi Pyrénées, Université de Toulouse, CNRS, IRD, 31400 Toulouse, France b Universidad Andina Simón Bolívar, Área de Salud, Toledo N22-80, P.O. Box 17-12-569, Quito, Ecuador c Swiss Federal Institute of Technology in Zurich, Master Génie de l'Environnement, Switzerland. d Bordeaux University - CNRS, EPOC UMR 5805, LPTC, F-33400 Talence, France e Laboratoire des Sciences du Bois, UMR EcoFoG, CNRS, Campus Agronomique de Kourou, 97387 Kourou, France f Centre d’Études et de Recherches Travail Organisation Pouvoir (CERTOP), Maison de la Recherche, Université de Toulouse, 31058 Toulouse, France g Universidad San Francisco de Quito, Colegio de Ciencias e Ingenierías, Diego de Robles y Vía Interoceánica, P.O. 17-0901, Quito, Ecuador h Department of Environmental Sciences and Engineering, Gillings School of Global Public Health, University of North Carolina at Chapel Hill, NC 2759, USA *Corresponding author : Laurence Mauricea,b
Permanent address: aGéosciences Environnement Toulouse (GET), Observatoire Midi Pyrénées, Université de Toulouse, CNRS, IRD, 31400 Toulouse, France E-mail address: [email protected]; phone number: +593 995448461
HIGHLIGHTS
• A punctual enrichment in volatile hydrocarbons is observed in several private wells.
• Low mineralization of drinking waters is a special health issue in the Amazon region.
• The bacterial contamination of waters needs more attention by public policy.
• Local stakeholders are unable to provide effective water supply and water treatment systems.
• Social and economic constraints lead people to choose the risks they have to face.

CHAPTER 2
87
Abstract
The unregulated oil exploitation in the Northern Ecuadorian Amazon Region (NEAR), mainly
from 1964 to the 90's, led to toxic compounds largely released into the environment. A large
majority of people living in the Amazon region have no access to drinking water distribution
systems and collects water from rain, wells or small streams. The concentrations of major ions,
trace elements, PAHs (polycyclic aromatic hydrocarbons) and BTEX (benzene, toluene,
ethylbenzene, xylenes) were analyzed in different water sources to evaluate the impacts of oil
extraction and refining. Samples were taken from the NEAR and around the main refinery of
the country (Esmeraldas Oil Refinery/State Oil Company of Ecuador) and were compared with
domestic waters from the Southern region, not affected by petroleum activities. In most of
the samples, microbiological analysis revealed a high level of coliforms representing significant
health risks. All measured chemical compounds in waters were in line with national and
international guidelines, except for manganese, zinc and aluminium. In several deep-water
wells, close to oil camps, toluene concentrations were higher than the natural background
while PAHs concentrations never exceeded individually 2 ng·L−1. Water ingestion represented
99% of the total exposure pathways for carcinogenic and non-carcinogenic elements (mainly
zinc) in adults and children, while 20% to 49% of the Total Hazard Index was caused by arsenic
concentrations. The hazard index (HI) indicates acceptable chronic effects for domestic use
according the US-EPA thresholds. Nevertheless, these limits do not consider the cocktail
effects of metallic and organic compounds. Furthermore, they do not include the social
determinants of human exposure, such as socio-economic living conditions or vulnerability.
Most (72%) of interviewed families knew sanitary risks but a discrepancy was observed
between knowledge and action: religious beliefs, cultural patterns, information sources,
experience and emotions play an important role front to exposure.
Keywords: Oil activities, domestic waters, hydrocarbons, metal(loid)s, demineralized waters,
social risk perception.

CHAPTER 2
88
GRAPHICAL ABSTRACT
1. Introduction
Since decades, the petroleum industry has become a significant component of the global
economy, but with strong environmental and social impacts (WEC, 2016). A high record of
accidents occurring throughout the history of oil production demonstrates the devastating
effects and the risks involved for exposed populations (Amiard, 2017; Levy and Nassetta,
2011). In Ecuador, crude oil exportation represents the country’s main source of income,
exceeding 50% of the total exportations from 2004 to 2014, and settling down at 37% in 2017
(BCE, 2010; Calderon et al., 2016; MCE, 2017). On the other hand, Ecuadorian oil industry is
characterized by a long-term history of social and environmental conflicts (Fontaine, 2007).
The oil industry exerted with inadequate environmental standards is strongly suspected of
polluting surface and ground waters, particularly in Orellana and Sucumbíos provinces where
80% of total oil spills and 97% of waste pits were recorded (Bustamante and Jarrín, 2005; MAE,
2015). During the Texaco oil extraction period (1964-1992), formation waters were directly
released into the environment, in forests and rivers (Buccina et al., 2013; Narváez, 2000).
However, since the 2000’s the Ecuadorian legislation prohibited these practices, binding oil
companies to redirect these waters into ancient oil wells. Nevertheless, local inhabitants
testified that illegal polluting discharges are still released punctually and mainly during the
night.
Figure 2-0. Human risk-drinking water (Grafical abstract)

CHAPTER 2
89
Oil hydrocarbons, in particular PAHs and BTEX, are considered a high environmental and
health concern since most of them are persistent and carcinogenic (Amiard, 2017; Jørgensen
and Fath, 2010). Certain PAHs and their metabolites can induce leukemia, hepatitis and
immunotoxicity; they can also affect the reproductive system and cause genotoxic and
carcinogenic effects (IARC, 2010). Twelve PAHs and BTEX have been classified as probable or
suspected carcinogens in humans but only benzo(a)pyrene (BaP) and benzene are confirmed
as carcinogenic (ATSDR, 2007; IARC, 2018; Tremblay et al., 2000). Despite their high toxicity,
volatility and solubility in water, BTEX are not commonly studied; noting that they are
responsible for acute and chronic effects including eyes and throat irritation, headaches,
tachycardia, leukemia, affections to nervous system, cancer and death (Leusch and Bartkow,
2010; Mitra and Roy, 2011; Neghab et al., 2015). Previous epidemiological studies reported
numerous chronic effects including psychological disorders, endocrine and reproductive
affections and cases of cancers (Hurtig and San Sebastián, 2002; Levy and Nassetta, 2011;
Ramirez et al., 2017; UDAPT-Clinica Ambiental-CSS, 2017; Webb et al., 2018). Genotoxic
analyses on individuals from the NEAR showed that the exposition to hydrocarbons has caused
DNA damage and increased the risk of developing cancer (Paz-y-Miño et al., 2008).
Although hydrocarbons constitute the main fraction (75%) of crude oil, petroleum is a complex
mixture of elements, such as sulfur, major cations, anions, trace metal(oid)s (TME) and organic
molecules. Major elements (potassium (K), magnesium (Mg), sodium (Na) and calcium (Ca)),
and trace elements (nickel (Ni), vanadium (V), iron (Fe) and cooper (Cu)), are naturally present
as salts or organometallic compounds in crude and formation waters, while barium (Ba),
cobalt (Co), arsenic (As) and lead (Pb) salts are added during the extraction, transportation or
storage (Abdel-Raouf, 2012; Amiard, 2017; Speight, 2002). Though certain metallic elements
are essential for biological functions, most of them could be highly toxic, even at low
concentrations, and can cause hazardous effects due to their tendency to bio-accumulate
(Jørgensen and Fath, 2010). In 2017, IARC listed cadmium (Cd), As, Cr and Ni as probed
carcinogenic elements for humans (lungs, prostate, bladder, kidney, liver and stomach
cancers); they can also affect nervous, immune and reproductive systems and can induce
abortions, anemia, and teratogenic effects (Fry, 2015).
Released in the environment, hydrocarbons, metals and metalloids can reach aquifers and
surface waters throughout all the phases of petroleum production. These pollutants can
integrate the dissolved phase or be sorbed onto sediment and particles as their speciation and
distribution depend on the physicochemical characteristics of aquatic environments (Amiard,

CHAPTER 2
90
2017; Boehler et al., 2017; US EPA, 2000).
Extensive information has been compiled in relation with the signs and symptoms of health
problems in oil extraction areas in Ecuador (Arana and Arellano, 2007; Hurtig and San
Sebastián, 2005; O’Callaghan-Gordo et al., 2016; San Sebastian, 2001). However, to our
knowledge, there is no quantitative determination of the risks involved by drinking water
exposure, nor epidemiological studies that connect water quality to suspected cancer and
non-cancer risks.
In Ecuador, access to a water supply network has increased in recent years but the percentages
of the supplied population are very heterogenous over the territory; in the studied cantons, it
varies from 26,6% in Aguarico, to 33,7% in Shushufindi, 41,6% in Joya de Los Sachas and 57,5%
in Orellana (SENPLADES, 2014). Nevertheless, in the NEAR, the use of unreliable water sources
for domestic purposes (drinking, cooking, bathing and washing clothes) is still a high-risk factor
of exposition to toxic pollutants either by dermal contact or ingestion. In Esmeraldas city, along
the Pacific coast, where refining activities take place, the water distribution system reaches
most of the households but is unreliable supply and safety wise. Therefore, Amazonian and
Esmeraldas inhabitants rely on different water sources such as rivers, springs, streams,
rainwater, or private wells; sources that are not always safe ( IGM, 2013). Most of the dug wells,
in general deep wells (≥8 m), were drilled by oil companies as compensation for the disturbance
caused by their activities. However, inhabitants dig private shallow wells (<8 m) given that they
don’t trust the groundwater quality. Then, in this context of extended oil activities in a
precarious environment, the presence of pollutants can not only reach the groundwater, as
well as superficial waters (Webb et al., 2018; Wernersson, 2004), highlighting a serious health
concern for local populations of the NEAR and Esmeraldas areas. But, in Ecuador, similar to
most of countries, effective regulations for drinking waters do not exist or are still inadequate
(Kayser et al., 2015; Pinto et al., 2012), mainly because they define thresholds for individual
elements and not for the mixture of metallic and organic compounds present in water.
Then, this study aims to measure the drinking water quality level (by determining trace
metal(loid)s and hydrocarbons contents) and the associated human health risk in areas
influenced by oil industry (production and refining activities) in Ecuador. The two major
questions that motivated our research were: i) are the punctual and local wastewater
discharges by oil companies in the Ecuadorian Amazon traceable by chemical analysis? and ii)
what are the social responses of local communities to face the perceived contamination of
drinking water?

CHAPTER 2
91
2. Materials and Methods
2.1 Study area
Two oil areas were selected for this study (Figure 2-1). The first area is located in the Northern
Ecuadorian Amazon Region (NEAR) between 76°30'20"-77°12'00"W and 00°05'01"N-
00°55’11”S covering the Orellana and Sucumbíos provinces. This area was defined by the
Ecuadorian Ministry of Environment (PRAS Program, 2010) as the most affected socially and
environmentally due to oil activities. The second area is located in the Northern Ecuadorian
Pacific Coast (NEPC) between 79°39'27"-79°42'18"W and 00°53'52.00"-00°56'41"N in the
Esmeraldas province where most of the crude oil refining is performed (EP Petroecuador,
2013). During four decades, these zones were associated to a historic record of oil production
and many environmental disasters (Buccina et al., 2013). Both regions were compared with
two control areas located in the Morona-Santiago province (77°53'12"-78°34'51"W; 2°58'48"-
3°31'20"S) in the Southern Ecuadorian Amazon Region (SEAR) and in the Manabí province
(80°19'59"-80°20'57"W; 1°12'57"S-1°13'32" S) Pacific Coast (SEPC), where neither oil nor
mining activities has taken place.
Figure 2-1. Hazards description (flares, oil spills, pools and pits, refinery, oil fields and pipelines) and sampling points of drinking waters (from various sources: rainfall, river, spring, stream, well) in four study areas: A) Northern Ecuadorian Pacific Coast (NEPC), B) Northern Ecuadorian Amazon Region (NEAR) and C) in two control zones (Southern Ecuadorian Amazon Region (SEAR) and Southern Ecuadorian Pacific Coast (SEPC)).

CHAPTER 2
92
2.2 Water sample collection
From 2012 to 2016, a total of 83 samples of domestic water were collected from local
communities from 7 different sources: 15 samples from deep wells (≥ 8 m depth), 8 from
shallow wells (< 8 m depth), 10 from rainwater stored in plastic or concrete tanks, 18 from
springs, 10 from rivers, 5 from streams, and 17 of households tap water. Among these water
samples, 15 were collected from the Pacific coast coming mainly from the water distribution
system (Table C-2).
Water sampling was performed according to the US EPA method (US EPA, 1996) in Teflon
bottles, using ultra-clean procedures. River waters were filtered (0.45 µm porosity) in the field
on Teflon and cellulose acetate pre-cleaned membranes. Each sample was conditioned by
addition of nitric acid (for major and trace elements analysis) and hydrochloric acid (for Hg
analysis) and kept cooled (4°C) until analysis. For PAHs determination, samples were collected
in glass bottles (SPME 10 mL) previously calcined at 550°C and kept frozen (-18°C) until
analysis.
Temperature (T), potential Hydrogen (pH), electrical conductivity (EC), oxide reduction
potential (ORP) and dissolved oxygen (DO) were measured in situ by ®YSI probes.
2.3 Analytical methods
2.3.1 Major and trace elements concentrations
Analysis of fluorides, chlorides, sulfates and nitrates were performed by Ion Chromatography
(Dionex® ICS 200). The cations Ca, K, Mg, Na and Si were determined by Optical Emission
Spectrometry-Inductively Coupled Plasma (ICP-OES, Horiba® Jobin Yvon Ultima2). The
determination of trace metal(loid)s elements (TM) was performed by Mass Spectrometry-
Inductively Coupled Plasma (ICP-MS, Agilent 7500CE). Total Hg analysis were performed
according to the US EPA Methods 1631 (US EPA, 2002) using oxidation-reduction with BrCl
and SnCl2, and finally analyzed by cold-vapor atomic fluorescence spectrometer (CV-AFS,
Brooks Rand®).
The quantification limits were calculated as 10 times the reagent blanks standard deviation
(SD) and listed in the Table SII-1. The recoveries were calculated from different River Water
Certified Reference Standards; the percentages obtained for anions, trace metal(loid)s and
cations were 104±5% (ION-915), 96±10 % (SLRS-5) and 105±4 % (SLRS-5 and EPOND)
respectively. The average recovery for total Hg analysis reached 92±9 % (ORMS-5).

CHAPTER 2
93
2.3.2 PAHs and BTEX concentrations
Solid-phase microextraction (SPME) was used in immersion mode in combination with gas
chromatography–mass spectrometry (SPMEGC/MS) for the analysis of parent and alkylated
PAHs and BTEX in water samples (8 mL and 10 mL for PAHs and BTEX, respectively).
An Agilent Technologies 7890A/5975C GC/MS (Palo Alto, CA, USA) was used for the analysis
of BTEX. A MPS2XL autosampler (Gerstel®) was used to hold the 65 μm PDMS/DVB SPME fibre
(Supelco) during extraction and injection. After the addition of perdeuterated surrogate
standards, the fibre was immersed into the 10 mL water sample with agitation (250 rpm) at
40 °C during 30 min. After extraction, the fibre was thermally desorbed for 3 min into the liner
of the GC injector port at 220 °C in pulsed splitless mode (25 psi, 1.5 min). Helium (6.0) was
used as the carrier gas at a flow rate of 2 mL.min− . Analytes were separated on a DB-624
column (30 m × 0.32 mm, 1.8 μm film thickness; Agilent Technologies, J&W Scientific).
The column oven program was as follows: 0 °C (5 min) (liquid nitrogen) to 150 °C (1 min) at 5
°C·min−1 and then to 260 °C (8 min) at 30 °C·min−1. The MSD was operated with electron
impact ionization (70 eV) in selected ion monitoring (SIM) mode. The transfer line, source and
quadrupole temperatures were 260, 230 and 150 °C, respectively. Parent and alkylated PAHs
were analyzed using an Agilent Technologies 7890A/5973 GC/MS (Palo Alto, CA, USA) (Kanan
et al., 2012). A GC Sampler 120 (Agilent Technologies) was used to hold the 100 μm PDMS
SPME fibre fibre (Supelco) during extraction and injection. After the addition of perdeuterated
surrogate standards, the fibre was immersed into the 8 mL water sample with agitation (250
rpm) at 40 °C during 60 min. After extraction, the fibre was thermally desorbed for 3 min into
the liner of the GC injector port at 270 °C in pulsed splitless mode (25 psi, 1 min). Helium (6.0)
was used as the carrier gas at a flow rate of 1.3 mL·min−1. Analytes were separated on a HP-
5MS-UI column (30 m × 0.25 mm, 0.25 μm film thickness; Agilent Technologies, J&W
Scientific). The column oven program was as follows: 50 °C (2 min) to 300 °C (5 min) at 10
°C·min−1. The MSD was operated with electron impact ionization (70 eV) in selected ion
monitoring (SIM) mode. The transfer line, source and quadrupole temperatures were 280, 300
and 180 °C, respectively.
PAHs and BTEX were quantified by their perdeuterated surrogate standards using their
molecular ions (SIM mode). Analyzed compounds (and acronyms) and their limits of
quantification (LQs) are listed in Table SII-2 and Table SII-1, respectively. A fibre blank was
measured before each water sample by exposing the SPME fibre in an empty vial under the
same conditions as the samples. A blank sample (reagents and surrogate standards) and a

CHAPTER 2
94
control sample (blank sample spiked with model compounds) were performed for each batch
of experiments in order to check the background contamination and the analytical
performance. Whole-method accuracy was determined on spiked water samples (at 10 ng·L−1
in Milli-Q water and 50 ng·L−1 in Vittel water for PAHs and BTEX, respectively) and remained
between 100 and 105% (CV b 10%) for parent and alkylated PAHs and 89–98% (CV b 10%) for
BTEX. Limits of quantification (LQs) were determined from a 10 signal to noise ratio (SNR)
observed in low-spiked samples, except for compounds present in blanks. For these latter
compounds, LQs were determined using blank levels, assuming at least a factor three between
the analyte mass in the sample and that found in the blank. LQs are in the range 0.3–5.0 ng·L−1
for parent and alkylated PAHs, and 2–9 ng·L−1 for BTEX, except for benzene (100 ng·L−1).
2.3.3 Microbiological analysis
Water samples were collected in sterile flasks, refrigerated and analyzed within 12 hours of
collection. One mL of raw sample was plated onto selective 3M™ Petrifilm™ 6404/6414/6444
plates (3M Microbiology Products, St. Paul, MN) and incubated following manufacturer
instructions. The concentrations of total coliforms and E. coli were determined within 24-48 h
of incubation time at 30C. Confirmed coliforms are red or blue colonies with associated gas
bubbles. Confirmed E. coli are blue colonies with associated gas bubbles. Results are accurate
between 25-250 colonies of total coliforms per plate.
2.4 Sociological methods
Sociological methods “Risk culture” refers to the oil contamination risks awareness, behaviors
and social practices to cope with it in everyday life, considering another set of risks (social,
economic), and the capacity to think the building of future projects at both individual and
territorial scale(Becerra et al., 2016). The sociological study was centred on two rural parishes
of the NEAR, Dayuma (Orellana Province) and Pacayacu (Sucumbíos province). We studied
how people perceived and managed their environment and the associated contamination
risks. Water resources were not the only issue considered in the interviews, while it appeared
as the main concern. We focused on both mestizo1 and indigenous communities. Primary data
was collected during various field surveys between 2014 and 2016. Were realized 160
qualitative interviews, according various levels of exposure, living next to possible sources of
1 In other words, the individuals who consider that they don’t belong to any ethnic group or native nationality
because their parents have different geographical and cultural characteristics.

CHAPTER 2
95
contamination. Various generations as well as both genders were represented. Around 30
interviews were conducted with elected officials and community leaders. Interviews were
built around 4 general topics: 1) History of life; 2) Living conditions (economic incomes),
perceptions of oil activities impacts (positive and/or negative), perception of their regulation
by local or national authorities; 3) Attitude towards the future (quality of life, future projects);
and 4) Biographical data (age, nationality, education level, etc.).
2.5 Health risk assessment
Risk assessments were carried out according risk management measures proposed by the
WHO (2014). Since human exposure to multiple chemical mixtures is ubiquitous (polluted air,
soil and water), we used US-EPA guidelines (Callahan and Sexton, 2007; Choudhury et al.,
2000) for assessing the cumulative risk related to these chemical cocktails and considering
different pathways for toxic compounds into the body, with ingestion and dermal contact as
main exposure routes (Barraza et al., 2018; US Environmental Protection Agency (US EPA),
2015c, 2015d).
Mathematical equations of the Probabilistic Risk Assessment (as published by Barraza et al.,
2018) allow us to evaluate the Hazard Index (HI) and the Total Cancer Risk (TCR), which are
defined as the addition of individual quotients of non-carcinogenic (HQ) and carcinogenic (CR)
elements respectively, obtained from the average daily dose (ADD), the lifetime average daily
dose (LADD) and the references doses (RfD) (US Environmental Protection Agency (US EPA),
2015d, 2015c). For drinking water, we supposed a daily consumption rate of 3 L and 1.5 L for
adults and children, respectively and an annual exposure frequency of 350 days per year,
assuming that people moved 15 days every year in the Amazonian region. Values of HI higher
than 1 means that adverse health effects can occur. The TCR is the accumulation of cancer risk
values (CR) calculated for carcinogenic elements (As, Cd, Cr, Ni) and PAHs by the product of
slope factor (SF) and LADD. The TCR is then compared with the guidelines given by the US EPA
meaning the probability of providing cancer risks of 10-4 (1 in 10 000) or 10-6 (1 in 1 000 000).
2.6 Statistical analysis
Software ©Rstudio (Version 3.5.1) was used for statistical analysis and box plots figures. One
sample t-test was used when data showed a normal distribution (Shapiro-Wilcoxon test). In
other cases (Figure SII-1), variables were log-transformed to follow a normal distribution. A
confidence level of 0.95 was chosen. Pearson coefficient correlations were calculated to check
the significance of the correlations between the parameters.

CHAPTER 2
96
3. Results
3.1 Physico-chemical parameters
Physico-chemical parameters of drinking waters (Table 2-1) were compared with the
different water quality guidelines (WQGs) reported in the Supplementary Information (Table
SII-3).
In the drinking water sources of the Amazonian region, the pH values ranged from 3.5 to 8.7
(average of 5.8±1.3) with an extreme minimum value of 2.5 in a forest spring (Shuara 09 oil
camp). Most pH values (73%) were in the range of the Ecuadorian quality guidelines (min:
6.5; max: 8.5). Several water sources were found to be acidic: the river water from the SEAR
(4.80±1.47), and the rainwater (pH of 4.84±1.02). The only neutral sources were stream and
distribution system waters (7.02±1.38 and 7.16±0.51, respectively).
The EC range (3-1479 µS.cm-1; average: 122±204 µS.cm-1) showed that all the samples were
lower than the maximum recommended value (1100 µS.cm-1), except in a deep well (26 m)
in Pacayacu (NEAR). Only 19% of the samples were in line with the WQG used in France (200-
1100 µS.cm-1): most of the water samples (78%) showed conductivity lower than 200 µS.cm -
1, and can be considered as demineralized waters. In the Amazon Region, rainwaters showed
the lowest conductivity in both, the oil (11.9±12.9 µS.cm-1) and control area (5.21 µS.cm-1).
Only the deep wells (272.2±348.5 µS.cm-1) and system waters (224.3±152.2 µS.cm-1) in the
NEAR, and river surface water (237.7±139.2 µS.cm-1) in the SEAR showed conductivity higher
than the recommended value (200 µS.cm-1). However, in Esmeraldas, the tap water
conductivity never reached the minimum WQG (200 µS.cm-1).
Concerning the total dissolved salts (TDS) content of the samples, it was found to be very low
falling below the minimum concentration of 100 mg.L-1 and the optimal range of 250-500 mg.
L-1 set by WHO. Only water from deep wells and the distribution system met the minimum
recommended value.
3.2 Major and TME concentrations
The analyzed anions (Table 2-1) are present in concentrations compliant to the local and
international standards but lower than the recommended WHO guidelines. For example, all
analyzed sources were deficient in fluoride based on the minimum level of 0.5 mg.L-1
recommended by WHO (2005) for dental health. Similarly, most of the major cations’
concentrations (for example Ca and Mg) were lower than the minimum 2005 WHO guidelines
(Figure 2-2).

CHAPTER 2
97
Regarding Al concentrations (Figure 2-3), all the water sources sampled in the Amazon region
(SEAR and NEAR) showed values in a similar and acceptable range (WHO, 2005). While in the
public water system, these concentrations exceeded regularly 200 µg.L-1, the utilization of
aluminum sulfate as flocculent during the water treatment. A similar behavior was observed
with Fe concentrations, both elements presenting a common origin from the soil weathering;
tropical, ferralitic soils are characterized by elevated Al and Fe contents (Mainville et al.,
2006; Quesada et al., 2011).
Manganese concentrations in drinking water sources ranged between 0 and 2373 µg.L-1, and
averaged 72 µg.L-1; the highest concentrations being measured in a deep well close to
Pacayacu village in a private property (Pichincha 11, Libertador oil camp). In the majority of
private water wells, Mn concentrations exceeded the recommended values by Ecuador (100
µg.L-1), and a fortiori France and Canada (50 µg.L-1), while in rivers, springs and water systems,
they were acceptable (Figure 2-3).
The Zn concentrations in samples collected from rainwater tanks were significantly higher
than other sources (Figure 2-3). Even though high concentrations of this element are not of
health concern, a limit of 500 µg/L was considered as WQG in France, being the most
restrictive value among the legislations consulted; all rain waters exceeded this limit. In
isolated areas of the Amazon basin, people collect rainwater from their home’s roof. The
acidic rain water passing through the roofs leached, dissolved and transported dissolved Zn
to water tanks.
Regarding Ba distribution, rainwater presents the lowest concentrations (2 to 30 µg.L -1).
The elements As, Cd, Cr, Ni and Pb, and Co are considered carcinogenic (group 1 and 2A),
while oxides of Sb, V and Mo are defined as possibly carcinogenic (2B) by the IARC. System
water and (deep and shallow) wells presented the highest values of As, Ni, Cr, Pb, Sb, and V
without exceeding the WQGs. Chromium concentrations were very low (average of 0.56±5.44
µg.L-1) and the maximum value (10.57 µg.L-1), lower than the WQGs, was measured in the
Dayuma tap water. The increase of these carcinogenic elements may come from the
pipework quality of the water distribution system. Antimony in rainwater presented also a
mean concentration (0.087±0.097 µg.L-1) higher than in the other sources, but lower than the
recommended values.

CHAPTER 2
98
Figure 2-2. Major element concentrations in drinking water sampled during the 2012-2016 period, in (A) the Northern Ecuadorian Amazon Region (NEAR) and in (B) the control zone in the Southern Ecuadorian Amazon Region (SEAR); the red and blue lines report maximum a nd minimum values recommended by the World Health Organization for drinking water (2005) respectively; international water quality guidelines (WQG) are reported.

CHAPTER 2
99
Tab
le 2
-1.
Loca
l met
rics
#,##
,b,c
, in
org
anic
maj
or
elem
ents
b a
nd
met
al(o
id)s
ave
rage
co
nce
ntr
atio
nsd
,e (
±Sta
nd
ard
Dev
iati
on
) in
dif
fere
nt
sou
rces
of
do
mes
tic
wat
er
in t
he
No
rth
ern
an
d S
ou
ther
n E
cuad
ori
an A
maz
on
Reg
ion
(N
EAR
an
d S
EAR
, re
spec
tive
ly)
and
in t
he
No
rth
ern
an
d S
ou
ther
n E
cuad
ori
an P
acif
ic C
oas
t (N
EPC
an
d
SEP
C, r
esp
ecti
vely
).
NE
AR
S
EA
R
NE
PC
S
EP
C

CHAPTER 2
100
Tab
le 2
-1. L
oca
l met
rics
#,##
,b,c
, in
org
anic
maj
or
elem
ents
b a
nd
met
al(o
id)s
ave
rage
co
nce
ntr
atio
nsd
,e (
±Sta
nd
ard
Dev
iati
on
) in
dif
fere
nt
sou
rces
of
do
mes
tic
wat
er in
th
e N
ort
her
n a
nd
So
uth
ern
Ecu
ado
rian
Am
azo
n R
egio
n (
NEA
R a
nd
SEA
R,
resp
ecti
vely
) an
d i
n t
he
No
rth
ern
an
d S
ou
ther
n E
cuad
ori
an P
acif
ic C
oas
t (N
EPC
an
d S
EPC
, re
spec
tive
ly).
(co
nti
nu
ed)
NE
AR
S
EA
R
NE
PC
S
EP
C
NE
AR
=N
ort
h E
cuad
ori
an A
maz
on
Reg
ion;
SE
AR
= S
outh
Ecu
ado
rian
Am
azo
n R
egio
n;
NE
PC
= N
ort
h E
cuad
ori
an P
acif
ic C
oas
t; S
EP
C=
Sou
th E
cuad
ori
an P
acif
ic C
oas
t; #
=m
asl
(met
ers
abo
ve
sea
lev
el);
##
=°C
; * s
ing
le v
alu
e (n
=1
) ;
**C
a+M
g (
mm
ol.
L-1
) ;
a=µ
S.c
m-1
; b
= m
g.L
-1;
c=%
satu
rati
on;
d=
ng
.L-1
; e
= µ
g.L
-1.

CHAPTER 2
101
Figure 2-3. Al, Fe, Mn, Zn and Ba concentrations in drinking water sampled during the 2012-2016 period, in (A) the Northern Ecuadorian Amazon Region (NEAR) and in (B) the control zone in the Southern Ecuadorian Amazon Region (SEAR). The red and blue lines report maximum and minimum values recommended by the World Health Organization for drinking water (2005), respectively; international quality guidelines (WQG) are reported.

CHAPTER 2
102
3.3 PAHs concentrations
All aromatic organic compounds (PAHs and BTEX) concentrations measured in the analyzed
drinking waters (Table SII-4) were in line with the WQGs, even in the NEAR. The
benzo(a)pyrene considered as carcinogenic (group 1) was under the quantification limit in all
the samples. However, high values of toluene (2000 to 6000 ng.L-1) were measured in deep
wells of the “12 de Febrero” community in San Carlos village located on the Sacha oil field.
Benzene (also classified as carcinogenic group 1) was present in the water from the
distribution system in Esmeraldas (NEPC) and Portoviejo (SEPC) sampled in 2016 but these
significant concentrations (490 to 710 ng.L-1) close to the WQG (1000 ng.L-1), were not
detected in 2017. The results of 2016 can be due to the contamination of the water stored by
residents in plastic or metallic tanks as a solution for the frequent water network shortages.
Our results show that there is a risk of accidental and local contamination of drinking water
by benzene in collection tanks from traffic or industrial emissions in Esmeraldas city.
3.4 Bacteriological results
One of the main health concerns was the presence of Escherichia Coli and total coliforms in
water sources sampled in the Amazon region which could reach in deep wells up to 40 and
700 CFU.100 mL-1, respectively, except in the public water distribution systems. According to
international regulations on drinking water quality, Escherichia Coli and total coliforms must
be absent in drinking water. Untreated wastewaters, agricultural runoffs, migration and
development of microorganisms in wells and shallow surface waters exposed to light and high
temperatures can contribute to the development of coliforms. Therefore, it would be crucial
to disinfect (e.g. boiling, chlorination) any kind of water sources in the Amazon region prior to
consumption to prevent any risk of water-borne diseases.
3.5 Human health risks assessment
For both adults and children (Table 2-2), the ingestion hazard index (HIing) showed a
contribution of 99 to 100% to the non-carcinogenic total hazard index (THI). Compared to the
reference value (US EPA, 2015), 7% and 27% of the THI obtained for deep well water sources
was higher for adults and children, respectively.
For adults, the values of HI ranged from 3.4x10-02 to 2.6 and from 1.4x10-04 to 2.0x10-02 for
ingestion and dermal routes, respectively. From the sites that shows HQ values > 1 (Table SII-
5), two samples came from the NEAR, with the highest value (THI=2.6) in Dayuma due to high
aluminum concentrations (HQ=1.8) in the system water and in a deep well (HI=1.1) with an

CHAPTER 2
103
elevated hazard quotient in Mn (HQ=0.75). Along the Pacific coast (NEPC), only one sample
showed a HQ value > 1, corresponding to a tap water collected from a pumping and storage
station in front of the discharge channel of the main refinery of the country; this elevated HI
(1.8) is mainly explained by the Cd content (HQ=1.5).
For children, no contribution of dermal exposure was found in the total hazard index. The
ingestion route in the THI ranged from 7.5x10-02 to 5.5. From all the samples, 9 (11%) were
higher than the reference value (US EPA, 2015). The highest THI values were found in deep
wells waters of the NEAR, two in Pacayacu (HI =1.6 and 0.61 due to Mn concentrations), and
two in Dayuma (HI=1.32 and 1.38 explained by As concentrations), in a private well and in the
stadium, respectively. Individually, hazard quotients >1 in rainwater were found in the whole
Amazon region, being Zn the element that contributed to most of the total hazard index (HQ
of Zn=1.01 and 1.06, in the NEAR and SEAR respectively).
Figure 2-4. Distribution of ingestion and dermal contact Hazard Index (HI) for the Amazon and Pacific Ecuadorian regions, followed by the percentage of samples that overcome the Total HI reference value (US EPA, 2015) in children and adults.

CHAPTER 2
104
Finally, in the system water from Dayuma (NEAR), we found one point with a high
concentration of Al in Auca 09 field corresponding to THI equal to 3.9. In the NEPC, the highest
risk explained by Cd (HI=3.13) and As (HI=0.38) concentrations were found in Esmeraldas, in
the potable water pumping station and in a particular house, respectively.
For both, adults and children, water from a deep well located in the stadium of Dayuma (NEAR)
presented the highest contribution (93%) of carcinogenic molecules in the dermal-HI, while
regarding the ingestion risk contribution, system water from the pumping station close to the
refinery exhibited a contribution of 88% to the total HI.
It is interesting to notice that the hazard quotient of arsenic represents between 20% and 49%
of the total ingestion HI (Figure 2-4), while As concentrations never exceeded 3 μg·L−1. In the
Total Hazard Index (THI) calculated for carcinogenic elements (As, Cd, Cr and Ni), arsenic
contributes with 51% to 100% in 65 points (78% of the total sampling points). In Esmeraldas,
Cd contributes with 56% to 94% of the THI in 4 system water samples.
4. Discussion
4.1 Impacts of oil activities on drinking water quality
Vanadium, Ba, Ni, Co, Mo and PAHs (except AC, IP, and Pe) are the main elements and
compounds that can trace oil activities impacts in the hydrological system, due to their high
contents in the Ecuadorian Amazon crude oil (Table A-1). High concentrations of V (305±36
mg.kg-1), Ba (133±5 mg.kg-1), Ni (99±11 mg.kg-1), Co (1.82±0.04 mg.kg-1), and Mo (0.93±0.02
mg.kg-1) were measured in a topsoil sampled in a waste pool (from the Auca 08 oil well, NEAR).
These values were slightly higher than the concentrations measured in fresh crude oil from
the same oil camp (Auca 03), except for barium (7±1 mg.kg-1). However, the crude from the
national oil pipeline showed slightly lower values of toxic compounds than these in the waste
pool soil except for PAHs. Barium is then considered as a relevant element to trace oil activities
since barite (barium sulfate) is commonly used in drilling activities. This element in surface
and groundwaters mainly comes from the soil drainage, as in Ecuador these sources are
defined as calcium bicarbonate waters (Armijos et al., 2013) where barium salts may
precipitate easily (Kabata-Pendias and Szteke, 2015). All the Ba values measured in the study
drinking waters were in line with most of the WQGs except French-WQG (100 μg·L−1). The only
elements that exceeded the WQGs thresholds were Al, Fe, Mn, Cu and Ba; these elements
mainly originate from the natural soil erosion and are not of health concern at observed
concentrations except for Mn.

CHAPTER 2
105
Tab
le 2
-2.
Hea
lth
In
dex
fo
r in
gest
ion
an
d d
erm
al e
xpo
sure
pat
hw
ays
(HIin
g an
d H
Ider
), T
ota
l H
azar
d I
nd
ex (
THI)
, C
ance
r R
isk
for
inge
stio
n a
nd
der
mal
exp
osu
re
pat
hw
ays
(CR
ing
and
CR
der
), T
ota
l Can
cer
Ris
k (T
CR
), a
nd
per
cen
tage
of
sam
ple
s (%
) h
igh
er t
han
th
e re
fere
nce
val
ue
for
no
n-c
ance
r ri
sk (
THI:1
) an
d f
or
can
cer
risk
(T
CR
:10
−6–1
0−4
).
AD
UL
TS
HIi
ng
HId
er
TH
I
> 1
CR
ing
CR
der
TC
R
>1
0-4
10
-6-1
0-4
7
3%
29%
10
0%
86%
10
0%
10
0%
10
0%
0%
10
0%
10
0%
10
0%
10
0%
10
0%
10
0%
10
0%
10
0%
<1
0-6
1
3%
71%
0%
14%
0%
0%
0%
10
0%
0%
0%
0%
0%
0%
0%
0%
0%
CH
ILD
RE
N
HIi
ng
HId
er
TH
I
> 1
CR
ing
CR
der
TC
R
>1
0-4
10
-6-1
0-4
<1
0-6
NE
AR
=N
ort
h E
cuad
ori
an A
maz
on
Reg
ion
; S
EA
R=
So
uth
Ecu
ado
rian
Am
azo
n R
egio
n;
NE
PC
= N
ort
h E
cuad
ori
an P
acif
ic C
oas
t; S
EP
C=
So
uth
Ecu
ado
rian
Pac
ific
Co
ast;
HIi
ng
=haz
ard
ind
ex
for
ing
esti
on
ex
po
siti
on
; H
ider
= h
azar
d i
nd
ex f
or
der
mal
ex
po
siti
on
TH
I=to
tal
haz
ard
ind
ex.

CHAPTER 2
106
The water sample from Pacayacu (Pichincha 11 oil camp) presented concentrations in most of
the analyzed elements and compounds 10 to 100 times higher than the sampling points
average. Manganese concentrations were higher than 50, 100 and 500 µg.L-1 in 11%, 9% and
4% of the samples, respectively. The highest concentrations were all observed in private or
public deep wells. Manganese can be related with agriculture practices, as it is one of the main
components in fertilizers, animal food, and pesticides (Brunet, 2006). As proposed by van
Wendel de Joode et al. (2016), drinking water risk assessment should consider Mn as a health
hazard. Several studies have shown a negative association between elevated Mn
concentrations in drinking waters and children’s neurodevelopment, behavior and academic
achievement (Bouchard et al., 2011; van Wendel de Joode et al., 2016).
Regarding organic toxic compounds, no pollution by hydrocarbons was found in the study
water samples. The unique concern highlighted in drinking water sources which can originate
from the oil activities, was the toluene and the sum of methylnaphthalene concentrations
measured in several deep wells in the San Carlos community (located on oil camps managed
by the Rio Napo Company), nevertheless without exceeding individually, national and
international guidelines. Individual alkylated PAHs have been observed to have potentially
mutagenic, tumor-promoting, or carcinogenic activity (Baird et al., 2007) and their toxic
potential may easily surpass that of the parent compounds (Andersson and Achten, 2015).
However, the concentrations of di- and tri-methylnaphthalenes were very low, but except for
1- and 2-methylnaphthalene, insufficient toxicity data is available to quantify toxicity or cancer
risk from chronic exposure to individual alkylated PAHs or mixtures of alkylated PAHs.
Considering the concentrations ranges of carcinogenic PAHs, we may suppose that direct
ingestion of water and dermal contact are probably not the main exposure routes. This
hypothesis was confirmed by the Total Cancer Risk indexes calculated for parents and
alkylated-PAHs (section 3.5).
On the other hand, we observed just two significant correlations between toxic compounds
and oil activities impacts. These moderate and positive correlations were found between the
number of pits in the vicinity area of the sampling points and MA (2-methylanthracene;
r=0.43) and total dissolved Hg (r=0.47) concentrations. However, no correlation was found
with the oil spills frequency, nor with the number of flares or oil waste pools.
4.2 Drinking water risks due to low mineralization
In the whole Ecuadorian Amazon Region and along the Pacific Coast, the study water sources

CHAPTER 2
107
presented very low mineralization levels, till 10 to 100 times lower than the WHO’s minimum
recommended concentrations (WHO, 2006), with certain exceptions in deep wells. Although
high concentrations of certain major elements can affect the human health (Nerbrand et al.,
2003), it is very important to pay attention to acid and low mineralized water sources as well.
Acid pH water can accelerate the leaching of toxic metals and other compounds from
distribution pipes and modify the taste. Acidic pH is a characteristic of rainwaters which feed
spring and shallow groundwater in the Amazon basin and is the main source of drinking water
for local people. The percolation of rain waters in tropical soils of the Amazonian plain does
not change the water pH as these soils are acidic and highly weathered. Additionally, the lack
of minerals can cause direct health effects like tooth caries due to the lack of fluoride,
malfunction of the intestines, reduction of calcium and magnesium intake and other essential
elements as well as an increase of intake of toxic elements, due to their dissolution in acid
waters during the cooking for example (WHO, 2006).
For about 50 years, epidemiological studies in many countries all over the world have reported
that soft water (i.e., water low in Ca and Mg) is associated with increased morbidity and
mortality from cardiovascular disease (CVD) compared to hard water and water high in Mg
(Kozisek, 2005). Epidemiological studies of an ecologic design among Russian populations
supplied with water varying in TDS suggested that low-mineral drinking water may be a risk
factor for hypertension and coronary heart disease, gastric and duodenal ulcers, chronic
gastritis, goiter, pregnancy complications and several complications in newborns and infants,
including jaundice, anemia, fractures and growth disorders (Turnlund, 2002). The intake of
low water-content in Ca, is associated with a higher risk of fracture in children, certain
neurodegenerative diseases, pre-term birth and low weight at birth and some types of
cancer(Kozisek, 2005). The WHO established in 1980 minimum and optimum levels of minerals
that should be in demineralized water. After evaluating the available health, organoleptic and
other information, they recommended that demineralized water contains: for Mg and Ca, a
minimum of 10 and 20 mg.L-1, respectively; and an optimum range of 20-30 and 40-80 mg.L-1,
respectively. For total water hardness, the sum of Ca and Mg should be 2 to 4 mmol/L (Kozisek,
2005). In rainwater, the most important drinking water source for Amazonian communities,
the Mg and Ca average concentrations were less than 0.01 and 1.28 mg.L-1, respectively.
Average concentration of Na in rainwater was 0.12 mg.L-1, 2000 less than the minimum
recommended value (WHO, 2011).
Another issue caused by the regular domestic use of low mineralized water is the loss of

CHAPTER 2
108
essential minerals from food during the cooking, mainly of Mg and Ca and in a less extent of
essential microelements (Cu, Mn and Co). A low diversified diet due to precarious living
conditions coupled to the domestic use of demineralized water could not provide all essential
elements in sufficient quantities to local populations and participate to the child
undernutrition.
It appears that the health risk tied to the chronic exposure to low mineralized water can be as
important or in some cases, more important than the health risk related with current oil
activities. Though, it is necessary to pay attention to specific sampling points (deep wells) were
the total hazard index and total cancer risk denote that inorganic elements related with oil
production (as V or Mo in surface water, Table 2-2, Table SII-5) can contribute significantly to
the sanitary risk.
However, the quality of rainwater may subsequently deteriorate during harvesting, storage
and household use (WHO, 2011). In the Amazon region, many families collect rainwater from
their house’s roof, explaining the very high concentrations of Zn measured in this water
source. Later, they store it in large plastic or metallic tanks without any cover where wind-
blown dirt, leaves, insects, fecal particles, or particles from the atmosphere or from burning
materials (e.g. trash or oil flares) can contaminate the stored rainwater.
4.3 Limits of Ecuadorian Regulations
We suggest three types of limits in the National environmental regulations: legal, technical
and political.
4.3.1 Legal limits
In Ecuador, two regulations have been set up: the INEN 1-108 and the TULSMA (Texto
Unificado de Legislación Secundaria del Ministerio del Ambiente). The Ecuadorian regulation
INEN 1-108 is related to treated water for human consumption, and certain parameters, such
as pH, conductivity or oxygen percentage were omitted from the 2014 latest version
compared to the 2006 version. Regarding the inorganic compounds, from 34 parameters
considered in the 2006, only 18 were proposed in 2014. Even the maximum permissible limits
became less restrictive, like for example the Mn threshold values that increased from 0.1 mg.
L-1 in 2006 to 0.4 mg.L-1 in 2011, to completely be removed in 2014. From 5 PAHs regulated in
2006, INEN reduced to one molecule in 2014, the Benzo(a)Pyrene, with a maximum
permissible value (MPV) higher than in the 2006 version. For BTEX molecules, benzene and

CHAPTER 2
109
xylene remained unchanged, while toluene MPV became more permissive, from 0.17 ng.L-1 in
2006 to 0.7 ng.L-1 in actual versions, and ethylbenzene regulation disappeared in the last text.
A restriction of the maximum permissible limit for microbiological parameters was also
observed, reducing the MPV for fecal coliforms from 2 NMP.100 ml-1 in 2006 to 1.1 NMP.100
ml-1 currently, and eliminating total coliforms guidelines.
The second Ecuadorian regulation, TULSMA, is applicable to natural water sources for human
consumption prior to any treatment. In its last version (November 2015), this regulation
eliminated in its classification, the type of waters that only required disinfection and only
considered treated-clean waters and raw water that needed a physical treatment. The latest
version of TULSMA presented a lower number of parameters than the former text. The MPV
of some elements, such as Cd, increased from 0.003 mg.L-1 in February, 2015 to 0.02 mg.L-1 in
November, 2015. Concentrations of PAHs and BTEX in drinking water sources are not
regulated. Fecal coliforms for water requiring conventional treatment, the current version
(November, 2015) set up a lower concentration (1000 NMP.100 ml-1) than the previous ones
(2000 NMP/100 ml) but it still remains very high.
Then, during the last decade, both Ecuadorian regulations, INEN and TULSMA, have not just
reduced the number of control parameters but also proposed less restrictive values without
considering international recommendations. Since international regulations (Santé-Canada,
WHO, US-EPA and European Union) are based on epidemiological and risk assessment studies,
we considered them in this study as more adequate water quality references for the health
risk assessment discussion. Nevertheless, concentrations thresholds are related to individual
elements or molecules, or for groups of specific metal or organic contaminants but not for
chronic exposure to cocktails of both categories of toxic elements and compounds.
4.3.2. Technical limits
These limits are mainly due to the weakness of technical capacities of local stakeholders. In
the different visited communities, we found collective water supply systems installed by local
autonomous governments that were often ineffective. Many of these systems were
abandoned because of the lack of water availability, and/or of pump maintenance. This
ineffectiveness reflects two realities combined in the Amazon region: i) the lack of technical
ability of the projects managers and ii) lack of proper management of public resources.
Sometimes, under the pretext of public utility projects, public funds can be redirected to non-
public matters.

CHAPTER 2
110
4.3.3. Political limits: political ability to relay the social demands
People in charge of community relationships between public oil companies and local
inhabitants have always negated the link between river’s contamination and oil activities.
According to them and policy makers, water quality degradation is mainly due to the presence
of total and fecal coliforms, given that wastewater treatment is not available in the country,
except in big cities. They don’t constitute any opposition force that would set up a water
quality monitoring or at least the compliance of safety regulations. The latter does not reflect
the social experience of inhabitants of the oil region, with what they observed in their own
farm or in the close river, this experience leads them to ask for remediation, compensation
and indemnity. The local political ability to relay the social demands varies from place to place.
For example, in the Management Plan of Pacayacu, oil activities are not accounted as
responsible for the poor water quality, in contrast to the Dayuma Plan that holds oil
companies responsible for the contamination of water resources, even during environmental
remediation activities.
4.4 Social perception of the risk and human exposure
4.4.1. Perceived environment and perceived exposure to health risks
In the Amazon basin, traditionally, indigenous and mestizo use water sources close to their
Figure 2-5. The 20 most cited words in Spanish by local people living in Dayuma and Pacayacu villages. (©NVivo simulation.)

CHAPTER 2
111
home, from rivers, streams, rainwater or shallow wells. But in the oil Amazon basin, the lack
of access to drinking water is the major concern expressed by communities living close to oil
infrastructures (Figure 2-5), not only for inhabitants but also for cattle. The social experience
of the environmental pollution is stable with time and the general resentment is that
“everything is polluted and oil companies are lying”. Contamination is mainly perceived
empirically, directly from the farms or indirectly from a decrease in aquatic biodiversity.
The interviews conducted in the NEAR showed 2 main social responses to perceived
contamination of local water resources, Exit and Voice (as proposed by Hirschman et al.,
2017)): Exit means leaving the current water supply. At the household level, harvesting
rainwater is today perceived as the safest and most effective way to collect water even if in
fact various sources are combined (rainwater, wells, rivers or spring). Harvesting rainwater
has undergone a rapid development thanks to the social compensation programs
systematically implemented by the National oil Company, Petroecuador, since the 2000’s.
During oil exploration campaigns or when opening new platforms, the public company offered
zinc plates to cover the roofs of many communities’ houses and water tanks to store the clean
water. Later filtration systems were offered by NGOs to specific families involved in the
protestation against oil activities. At the community scale, collective action takes place: for
instance, two communities close to the urban centre of Pacayacu developed their own
drinking water supply system within a "minga", an indigenous practice of cooperative and
voluntary work for the common good. One of them has failed due to the lack of technical and
financial maintenance.
Voice: In the centre of Pacayacu village, most of the inhabitants contrary to the position of the
leaders, do not trust the quality of the drinking water system and choose the « voice » thanks
to the help of the NGO “Acción Ecológica”. The mobilization, coordinated by this same NGO,
operates in different ways: creation in 2009 of the “environmental clinic” as an alternative
program to restore the environment and livelihoods of about 30 families living in the oil
impacted area; in 2011, opening of a defense committee of families that perceived a local
contamination of their water resources, and organization of “Toxic-tours” in Atacapi and
Libertador oil camps.
4.4.2. Facing the risk but to which risk high priority is given?
The perception of the contamination risk was largely shared in the interviewed families as 72%
of them knew about sanitary risks linked to bad water quality. But there was a discrepancy

CHAPTER 2
112
between knowledge and action, as social investigations underlined for other risks (Langumier,
2006; Weiss et al., 2011): existence of the first (knowledge) does not guarantee the second
(action). It is important to distinguish between the drinking water supplies: primarily public
water system in urban centres and rain, river or private wells in rural areas. Paradoxically to
the perceived sanitary risk, the adopted strategy is not always to reduce the exposure. An oil
spill in a private farm is generally conserved as a proof of oil activities damages and used to
ask for material compensation (job or material good) or money (Becerra et al., 2016). Similarly,
a riparian who saw his water resource damaged by an oil spill for example, won’t necessary
look for other water sources for domestic use.
The role of religious beliefs, cultural ideals, experience and emotions were evaluated in order
to understand why people resist to change their practices to face supposed polluted water
sources.
Religious beliefs. Data collected from interviews with mestizo people showed that culture risk
is highly influenced by religious beliefs in at least two ways. First, faith can bring a certain form
of fatalism towards one’s own existence. Some individuals could also stop worrying about the
future since God decides for them. Data collected gave numerous references to biblical
scriptures.
Cultural ideals and practices. Change to prevent sanitary risk depends first on social
perceptions of the risks, and secondly on a cultural process, but also depends on the existence
of other available alternative ways and on adequate financial resources. In the Amazon forest,
Shuar and Kichwa communities have a strong reliance on nature and surface waters because
of their ancestral culture. Their spirituality is based on the principle of Mother Earth as well as
deities of the jungle, the agricultural garden ¨chacra¨ and the water. They usually leave far
from towns or oil infrastructures. Even if these groups tend to evolve toward a cultural
hybridism (for instance integrating modern food to their diet), they prefer natural food and
water from the farm, rivers or mountain (Béguet, 2015) . Furthermore, in indigenous groups,
environmental pollution is unequally perceived. We observed in Shuar and Kichwa groups that
generally, this perception by women is less noticeable than by men: maybe because women
usually don’t work for oil company (Racines, 2017).
Sensitive experience. Danger is learned by sensitive experiences which could be traduced by:
“the kick warns you and the damage teaches you”. Since health effects of environmental
exposure are not immediate, people tend not to change their practices and the collective
action stops to the suspicion or denunciation. Social determinants such as the high rates of

CHAPTER 2
113
unemployment and poverty (Larrea and Camacho, 2013) explain the difficulty to get out from
this situation of “environmental suffering”. People respond to the contamination of water in
a confused way. As explained by (Auyero and Swistun, 2007) often people under these
conditions have “toxic confusion”, as awareness of their situation is distorted by lack of
knowledge of the real causes which leads to inappropriate behaviors.
4.4.3. Chronic and historical distrust of oil companies.
Due to numerous social liabilities between oil companies and Amazonian communities, health
issues related to water contamination are attributed by inhabitants to the impact of oil
activities which obscure the complexity of the causes neglecting all the historical and political
context that is responsible for poor health of inhabitants, limits the perception of their own
responsibilities and inhibits practices changes. Because of this situation that despite the
awareness of rivers and water being contaminated, people are not changing their daily
practices based on the hope that finally, there will be some recognition and retribution due
to the damage caused by the oil companies during the last decades. Each emergence of cancer
cases, whatever its origins, nourished the proofs list against oil companies’ activities. The
social liability acts as a psychological lock that convinces inhabitants and NGOs that only oil
companies are responsible of the environmental and sanitary hazards of the region.
5. Conclusion and recommendations
Contrarily to the common prejudices, this study showed for the first time that the health risks
due to drinking water exposure could be more impacted by the precarious living conditions
than by the oil activities in the Ecuadorian Amazon region. Local people routinely chose the
water sources based on the end-use, availability and some of them regarding their perception
of contamination risks especially after an accident (oil spill).
International and national regulations are generally based on maximum acceptable
concentrations of inorganic and organic compounds because water may contain elements and
molecules that are undesirable. The different water sources sampled in Ecuador can be
considered as suitable for human consumption. It is important to control the quantity of
aluminum sulfate in the system during the water treatment as well as the way of collecting
and storing rainwater. Regarding Mn, a well-known neurotoxin, the high concentrations
observed in private wells can also be related to agriculture (use of pesticides; (van Wendel de
Joode et al., 2016)). Arsenic which contributes from 20% to 49% to the ingestion health index,
is naturally present in high concentrations in soils and waters of most of Latin America regions

CHAPTER 2
114
(Bundschuh et al., 2012). But the novelty of this study is the low mineralization of the drinking
water sources which could be an important health issue due to the deficiency in essential
minerals like Ca, Mg and F. The addition of salt enriched with fluoride and iodine into the
cooking water is a common practice, but not used everywhere in Ecuador, especially in remote
areas. Most of the symptoms as fatigue, stomachaches or dizziness, often signaled by the
population can be related with the low concentrations of minerals in their domestic water.
In Ecuador, agricultural runoffs and discharges of household effluents into water bodies
without previous waste treatment seems to be the main source of microbiological pollution,
confirmed by the presence of fecal coliforms in almost all the drinking water samples. It
appears primordial before consumption, to disinfect or boil any kind of water sources before
use in areas where there is no access to treated clean water. At the national level, public
policies should address this problem by extending rural potable water supply and waste water
treatment systems to the communities living in remote areas of the Amazon region.
Although no toxic compounds in drinking water samples exceeded the international water
quality guidelines, human co-exposure to low mineralized water and volatile organic
molecules needs more attention in oil impacted areas since almost five decades. Local people
living in areas affected by oil activities still endure the insufficient recognition of historical
impacts of oil exploitation by the Ecuadorian government, confirming that information can be
considered as a sort of power that should be shared. Till now, without any satisfactory
processing of the historical impacts of the oil activities in the country, inhabitants of the NEAR
focus their problems on oil companies ignoring other possible sources, such as agriculture
practices or the lack of water treatment. The belief held by many of the inhabitants that oil
companies are the only reason for water pollution is part of a symbolic process by which water
pollution crystallizes the set of social and environmental claims in front of oil industry. Water
quality preservation is the most shared argument that can become a symbol of the oil
companies’ environmental debt and of the government to solve this issue.
Acknowledgements
This work was supported by the French National Research Agency (ANR-13-SENV-0003-01)
and realized in the frame of the French-Ecuadorian MONOIL Program “Monitoring of social
and environmental impacts and vulnerabilities in an oil country, Ecuador”. We are very
grateful to the technical teams of the two laboratories where chemical analyses were
performed (OMP-GET and EPOC in France). We would like to sincerely thank the local

CHAPTER 2
115
populations from the Amazon and Pacific coast regions, especially from Dayuma, Joya de los
Sachas and Pacayacu villages and in Esmeraldas for their kind cooperation during the field
work, to the farmers for sharing their knowledge, and the IRD in Quito for its cooperation to
the field trips. This work has been possible thanks to the Ecuadorian Secretary of Higher
Education, Science and Technology (SENESCYT) for financing the PhD grant of Fausto Lopez.
References
Abdel-Raouf, M.E.-S. (Ed.), 2012. Crude Oil Emulsions- Composition Stability and Characterization. InTech, Egyptian Petroleum Research Institute, Egypt. https://doi.org/10.5772/2677
Agency for Toxic Substances & Disease Registry (ATSDR), 2007. Priority List of Hazardous Substances [WWW Document]. Subst. Prior. List SPL Resour. Page. URL https://www.atsdr.cdc.gov/spl/previous/07list.html (accessed 6.8.18).
Amiard, J.C., 2017. Les risques chimiques environnementaux: méthodes d’évaluation et impacts sur les organismes, 2nd ed. Tec & Doc Lavoisier, Paris, France.
Andersson, J.T., Achten, C., 2015. Time to Say Goodbye to the 16 EPA PAHs? Toward an Up-to-Date Use of PACs for Environmental Purposes. Polycycl. Aromat. Compd. 35, 330–354. https://doi.org/10.1080/10406638.2014.991042
Arana, A., Arellano, F., 2007. Cancer incidence near oilfields in the Amazon basin of Ecuador revisited. Occup. Environ. Med. 64, 490.
Armijos, E., Laraque, A., Barba, S., Bourrel, L., Ceron, C., Lagane, C., Magat, P., Moquet, J.S., Pombosa, R., Sondag, F., Vauchel, P., Vera, A., Guyot, J.L., 2013. Yields of suspended sediment and dissolved solids from the Andean basins of Ecuador. Hydrol. Sci. J. 58, 1478–1494. https://doi.org/10.1080/02626667.2013.826359
Auyero, J., Swistun, D., 2007. Confused because exposed: Towards an ethnography of environmental suffering. Ethnography 8, 123–144. https://doi.org/10.1177/1466138107078630
Baird, S.J.S., Bailey, E.A., Vorhees, D.J., 2007. Evaluating Human Risk from Exposure to Alkylated PAHs in an Aquatic System. Hum. Ecol. Risk Assess. Int. J. 13, 322–338. https://doi.org/10.1080/10807030701226277
Banco Central del Ecuador (BCE), 2010. La Economía Ecuatoriana Luego de 10 Años de Dolarización [WWW Document]. URL https://contenido.bce.fin.ec/documentos/PublicacionesNotas/Notas/Dolarizacion/Dolarizacion10anios.pdf (accessed 6.7.18).
Barraza, F., Maurice, L., Uzu, G., Becerra, S., López, F., Ochoa-Herrera, V., Ruales, J., Schreck, E., 2018. Distribution, contents and health risk assessment of metal(loid)s in small-scale farms in the Ecuadorian Amazon: An insight into impacts of oil activities. Sci. Total Environ. 622–623, 106–120. https://doi.org/10.1016/j.scitotenv.2017.11.246
Becerra, S., Saqalli, M., Gangneron, F., Dia, A.H., 2016. Everyday vulnerabilities and “social dispositions” in the Malian Sahel, an indication for evaluating future adaptability to water crises? Reg. Environ. Change 16, 1253–1265. https://doi.org/10.1007/s10113-015-0845-7
Béguet, E., 2015. « Del monte, del campo, o del pueblo ? » : subsister en zone pétrolière chez les Shuar d’Amazonie équatorienne. Université Paris Ouest Nanterre la Défense, Paris, France.
Boehler, S., Strecker, R., Heinrich, P., Prochazka, E., Northcott, G.L., Ataria, J.M., Leusch, F.D.L., Braunbeck, T., Tremblay, L.A., 2017. Assessment of urban stream sediment pollutants entering estuaries using chemical analysis and multiple bioassays to characterise biological activities. Sci. Total Environ. 593–594, 498–507. https://doi.org/10.1016/j.scitotenv.2017.03.209
Bouchard, M.F., Sauvé, S., Barbeau, B., Legrand, M., Brodeur, M.-È., Bouffard, T., Limoges, E., Bellinger,

CHAPTER 2
116
D.C., Mergler, D., 2011. Intellectual Impairment in School-Age Children Exposed to Manganese from Drinking Water. Environ. Health Perspect. 119, 138–143. https://doi.org/10.1289/ehp.1002321
Brunet, J., 2006. Synthèse bibliographique sur l’élimination du manganèse dans les eaux d’origine minière (No. BRGM/RP-54479-FR). Bureau de Recherches Géologiques et Minières (BRGM), France.
Buccina, S., Chene, D., Gramlich, J., 2013. Accounting for the environmental impacts of Texaco’s operations in Ecuador: Chevron’s contingent environmental liability disclosures. Account. Forum 37, 110–123. https://doi.org/10.1016/j.accfor.2013.04.003
Bundschuh, J., Litter, M.I., Parvez, F., Román-Ross, G., Nicolli, H.B., Jean, J.-S., Liu, C.-W., López, D., Armienta, M.A., Guilherme, L.R.G., Cuevas, A.G., Cornejo, L., Cumbal, L., Toujaguez, R., 2012. One century of arsenic exposure in Latin America: A review of history and occurrence from 14 countries. Sci. Total Environ. 429, 2–35. https://doi.org/10.1016/j.scitotenv.2011.06.024
Bustamante, T., Jarrín, M., 2005. Impactos sociales de la actividad petrolera en Ecuador: un análisis de los indicadores. Iconos 21, 19–34. https://doi.org/10.17141/iconos.21.2005.77.
Callahan, M.A., Sexton, K., 2007. If Cumulative Risk Assessment Is the Answer, What Is the Question? Environ. Health Perspect. 115, 799–806. https://doi.org/10.1289/ehp.9330
Choudhury, H., Hertzberg, R., Rice, G., Cogliano, J., 2000. Supplementary Guidance for Conducting Health Risk Assessment of Chemical Mixtures. (No. EPA/630/R-00/002). US Environmental Protection Agency, Washington, DC.
Clínica Ambiental, 2017. Informe de Salud [WWW Document]. informe_salud_tex. URL www.clinicambiental.org/docs/publicaciones/informe_salud_tex.pdf (accessed 6.7.18).
Dini, M., Stumpo, G., 2016. Los desafíos del Ecuador para el cambio estructural con inclusión social.
EP Petroecuador, 2013. El petróleo en el Ecuador : la nueva era petrolera, 1st ed. Manthra Comunicación, Quito, Ecuador.
Fry, R.C. (Ed.), 2015. Systems biology in toxicology and environmental health, 1st ed. Academic Press, Amsterdam, Netherlands.
Hirschman, A.O., Besseyrias, C., Delwit, P., 2017. Exit, voice, loyalty: défection et prise de parole. Ed. de l’Université de Bruxelles, Bruxelles, Belgique.
Hurtig, A., San Sebastián, M., 2005. Epidemiology vs epidemiology: the case of oil exploitation in the Amazon basin of Ecuador. Int. J. Epidemiol. 34, 1170–1172. https://doi.org/10.1093/ije/dyi151
Hurtig, A.-K., San Sebastián, M., 2002. Geographical differences in cancer incidence in the Amazon basin of Ecuador in relation to residence near oil fields. Int. J. Epidemiol. 31, 1021–1027. https://doi.org/10.1093/ije/31.5.1021
Instituto de Epidemiología y Salud Comunitaria (IESC), 2004. Informe Yana Curi: Impacto de la actividad petrolera en la salud de poblaciones rurales de la Amazonía ecuatoriana. Abya-Yala, Quito, Ecuador.
Instituto Geográfico Militar (IGM), 2013. Atlas geográfico de la República del Ecuador, 2nd ed. Instituto Geográfico Militar, Quito, Ecuador.
International Agency for Research on Cancer (IARC), 2018. IARC Monographs- Classifications [WWW Document]. URL http://monographs.iarc.fr/ENG/Classification/latest_classif.php (accessed 1.26.18).
International Agency for Research on Cancer (IARC), 2010. Some non-heterocyclic polycyclic aromatic hydrocarbons and some related occupational exposures, IARC monographs on the evaluation of carcinogenic risks to humans. World Health Organization, Lyon, France.
Jørgensen, S.E., Fath, B.D. (Eds.), 2010. Ecotoxicology: a derivative of Encyclopedia of ecology, 1st ed. Elsevier/Academic Press, Amsterdam, The Netherlands.

CHAPTER 2
117
Kabata-Pendias, A., Szteke, B., 2015. Trace Elements in Abiotic and Biotic Environments, 1st ed. CRC Press, Florida, United States.
Kanan, R., Le Floch, S., Andersson, J., Le Menach, K., Budzinski, H., 2012. Extraction of Polycyclic Aromatic Hydrocarbons (PAHs), Polycyclic Aromatic Sulfur Heterocycles (PASHs) and Alkylated Derivatives from Seawater using Solide-Phase Microextraction (SPME)-Gas Chromatography-Mass Spectrometry (GC-MS). In Proceedings of the Thirty-Five AMOP Technical Seminar on Environmental Contamination and Response, Environment Canada, Ottawa, June 2012.
Kayser, G.L., Amjad, U., Dalcanale, F., Bartram, J., Bentley, M.E., 2015. Drinking Water Quality Governance: A Comparative Case Study of Brazil, Ecuador, and Malawi. Environ. Sci. Policy 48, 186–195. https://doi.org/10.1016/j.envsci.2014.12.019
Kozisek, F., 2005. Health Risk from Drinking Demineralized Water, in: Nutrients in Drinking Water. World Health Organization, Geneva, Switzerland, pp. 148–163.
Langumier, J., 2006. Survivre à la catastrophe : paroles et récits d’un territoire inondé. Contribution à une ethnologie de l’événement à partir de la crue de l’Aude de 1999 (Thesis). École des hautes études en sciences sociales, Paris.
Larrea, C., Camacho, G., 2013. Atlas de las desigualdades socioeconómicas del Ecuador. SENPLADES, Quito.
Leusch, F., Bartkow, M., 2010. A short primer on benzene, toluene, ethylbenzene and xylenes (BTEX) in the environment and in hydraulic fracturing fluids [WWW Document]. URL https://www.ehp.qld.gov.au/management/coal-seam-gas/pdf/btex-report.pdf (accessed 6.8.18).
Levy, B.S., Nassetta, W.J., 2011. The Adverse Health Effects of Oil Spills: A Review of the Literature and a Framework for Medically Evaluating Exposed Individuals. Int. J. Occup. Environ. Health 17, 161–168. https://doi.org/10.1179/107735211799031004
Mainville, N., Webb, J., Lucotte, M., Davidson, R., Betancourt, O., Cueva, E., Mergler, D., 2006. Decrease of soil fertility and release of mercury following deforestation in the Andean Amazon, Napo River Valley, Ecuador. Sci. Total Environ. 368, 88–98. https://doi.org/10.1016/j.scitotenv.2005.09.064
MCE, 2017. Informe Mensual de Comercio Exterior Diciembre 2017. Ministerio de Comercio Exterior e Inversiones, Quito, Ecuador.
Ministerio del Ambiente (MAE), 2015. Explotación Hidrocarburífera [WWW Document]. Explot. Hidrocarburífera-PRAS. URL http://pras.ambiente.gob.ec/fr/web/siesap/explotacion-hidrocarburifera (accessed 6.7.18).
Mitra, S., Roy, P., 2011. BTEX : A Serious Ground-water Contaminant. Res. J. Environ. Sci. 5, 394–398. https://doi.org/10.3923/rjes.2011.394.398
Neghab, M., Hosseinzadeh, K., Hassanzadeh, J., 2015. Early Liver and Kidney Dysfunction Associated with Occupational Exposure to Sub-Threshold Limit Value Levels of Benzene, Toluene, and Xylenes in Unleaded Petrol. Saf. Health Work 6, 312–316. https://doi.org/10.1016/j.shaw.2015.07.008
Nerbrand, C., Agréus, L., Lenner, R.A., Nyberg, P., Svärdsudd, K., 2003. The influence of calcium and magnesium in drinking water and diet on cardiovascular risk factors in individuals living in hard and soft water areas with differences in cardiovascular mortality. BMC Public Health 3, 21. https://doi.org/10.1186/1471-2458-3-21
Nevels, D., 2013. The effects of oil operations on the Pacayacu and Sacha river watersheds in the Ecuadorian Amazon. Univ. Wash. Bothell Policy J. 19–30.
O’Callaghan-Gordo, C., Orta-Martínez, M., Kogevinas, M., 2016. Health effects of non-occupational exposure to oil extraction. Environ. Health 15. https://doi.org/10.1186/s12940-016-0140-1
Paz-y-Miño, C., López-Cortés, A., Arévalo, M., Sánchez, M.E., 2008. Monitoring of DNA Damage in

CHAPTER 2
118
Individuals Exposed to Petroleum Hydrocarbons in Ecuador. Ann. N. Y. Acad. Sci. 1140, 121–128. https://doi.org/10.1196/annals.1454.013
Quesada, C.A., Lloyd, J., Anderson, L.O., Fyllas, N.M., Schwarz, M., Czimczik, C.I., 2011. Soils of Amazonia with particular reference to the RAINFOR sites. Biogeosciences 8, 1415–1440. https://doi.org/10.5194/bg-8-1415-2011
Racines, D., 2017. Cultura de riesgo: Impacto social de la actividad petrolera en comunidades shuar y kichwa de la parroquia de Dayuma, Francisco de Orellana. Universidad San Francisco de Quito, Quito.
Ramirez, M.I., Arevalo, A.P., Sotomayor, S., Bailon-Moscoso, N., 2017. Contamination by oil crude extraction – Refinement and their effects on human health. Environ. Pollut. 231, 415–425. https://doi.org/10.1016/j.envpol.2017.08.017
San Sebastian, M., 2001. Exposures and cancer incidence near oil fields in the Amazon basin of Ecuador. Occup. Environ. Med. 58, 517–522. https://doi.org/10.1136/oem.58.8.517
SENPLADES, 2014. Agua potable y alcantarillado para erradicar la pobreza en el Ecuador.
Speight, J.G., 2002. Handbook of petroleum product analysis. Wiley-Interscience, New York, United States.
Tremblay, C., Bouchard, M., Gagnon, F., Cartier, J., 2000. Les hydrocarbures aromatiques polycycliques : exposition et risques dans la population générale [WWW Document]. URL https://www.inspq.qc.ca/es/node/1137 (accessed 6.8.18).
Turnlund, J., 2002. Molybdenum Metabolism and Requirements in Humans, in: Sigel, A., Sigel, H. (Eds.), Metals Ions in Biological System. CRC Press, pp. 727–739. https://doi.org/10.1201/9780203909331.ch21
US Environmental Protection Agency (US EPA), 2015a. Exposure Assessment Tools by Routes - Ingestion [WWW Document]. US EPA. URL https://www.epa.gov/expobox/exposure-assessment-tools-routes-ingestion (accessed 5.31.18).
US Environmental Protection Agency (US EPA), 2015b. Exposure Assessment Tools by Routes - Dermal [WWW Document]. US EPA. URL https://www.epa.gov/expobox/exposure-assessment-tools-routes-dermal (accessed 5.31.18).
US Environmental Protection Agency (US EPA), 2002. Method 1631 Mercury in Water by Oxidation, Purge and Trap, and Cold Vapor Atomic Fluorescence Spectrometry. (No. EPA-821-R-02-019). US Environmental Protection Agency, Office of Water, Washington, DC.
US Environmental Protection Agency (US EPA), 2000. Profile of the Oil and Gas Extraction Industry (No. EPA/310-R-99-006). US Environmental Protection Agency, Washington, DC.
US Environmental Protection Agency (US EPA), 1996. Method 1669 Sampling Ambient Water for Trace Metals at EPA Water Quality Criteria Levels. US Environmental Protection Agency, Office of Water, Washington, DC.
van Wendel de Joode, B., Barbeau, B., Bouchard, M.F., Mora, A.M., Skytt, Å., Córdoba, L., Quesada, R., Lundh, T., Lindh, C.H., Mergler, D., 2016. Manganese concentrations in drinking water from villages near banana plantations with aerial mancozeb spraying in Costa Rica: Results from the Infants’ Environmental Health Study (ISA). Environ. Pollut. 215, 247–257. https://doi.org/10.1016/j.envpol.2016.04.015
Webb, J., Coomes, O.T., Mergler, D., Ross, N.A., 2018. Levels of 1-hydroxypyrene in urine of people living in an oil producing region of the Andean Amazon (Ecuador and Peru). Int. Arch. Occup. Environ. Health 91, 105–115. https://doi.org/10.1007/s00420-017-1258-3
Webb, J., Coomes, O.T., Ross, N., Mergler, D., 2016. Mercury concentrations in urine of amerindian populations near oil fields in the peruvian and ecuadorian amazon. Environ. Res. 151, 344–350. https://doi.org/10.1016/j.envres.2016.07.040
WEC, 2016. World Energy Resources Oil 2016.

CHAPTER 2
119
Weiss, K., Girandola, F., Colbeau-Justin, L., 2011. Les comportements de protection face au risque naturel : de la résistance à l’engagement. Prat. Psychol. 17, 251–262. https://doi.org/10.1016/j.prps.2010.02.002
Wernersson, A.-S., 2004. Aquatic ecotoxicity due to oil pollution in the Ecuadorian Amazon. Aquat. Ecosyst. Health Manag. 7, 127–136. https://doi.org/10.1080/14634980490281470
Widener, P., 2007. Oil Conflict in Ecuador: A Photographic Essay. Organ. Environ. 20, 84–105. https://doi.org/10.1177/1086026607300321
World Health Organization (WHO), 2011. Guidelines for drinking-water quality - 4th ed., 4th ed. World Health Organization, Geneva, Switzerland.
World Health Organization (WHO), 2006. Guidelines for drinking-water quality: recommendations, 3rd ed. World Health Organization, Geneva, Switzerland.
World Health Organization (WHO), 2005. Nutrients in Drinking Water. World Health Organization, Geneva, Switzerland.
World Health Organization (WHO), United Nations Children’s Fund (UNICEF), 2014. Progress on sanitation and drinking-water: 2014 update. World Health Organization, Geneva, Switzerland.

CHAPTER 2
120
Supplementary Information 2
Table SII-1. Detection and quantification limits and recovery percentage in water analysis.
GROUP ANALYTE DL QL RECOVERY ANALYTE LD LQ RECOVERY
MAJOR
ELEMENTS a
Ca 0.006 0.019 107% Chlorides 0.003 0.009 98%
K 0.018 0.061 104% Sulfates 0.003 0.009 101%
Mg 0.003 0.011 105% Nitrates 0.002 0.006 106%
Na 0.057 0.189 105% Bicarbonates 0.188 0.626 104%
Si 0.001 0.003 107% Fluorides 0.005 0.015 --
TRACE
ELEMENTS b
Hgc 0.023 0.078 92% Zn 0.066 0.218 103%
Al 0.120 0.401 101% As 0.005 0.016 92%
Ti 0.007 0.024 90% Se 0.017 0.058 101%
V 0.018 0.061 100% Sr 0.007 0.023 99%
Cr 0.004 0.013 100% Mo 0.007 0.022 91%
Mn 0.003 0.009 97% Cd 0.000 0.001 105%
Fe 0.158 0.528 97% Sb 0.003 0.010 93%
Co 0.001 0.003 101% Ba 0.002 0.008 99%
Ni 0.010 0.033 99% Pb 0.001 0.004 85%
Cu 0.014 0.045 104% U 0.000 0.001 93%
PAHS and
BTEXc
N 0.5 3.0 98% 3MPh 0.1 0.3 106%
Ac 0.2 0.7 98% 2MPh 0.1 0.3 106%
Ace 0.2 0.6 103% MA 0.1 0.3 106%
Fl 0.1 0.4 106% MPhMA 0.1 0.3 106%
Ph 0.2 0.5 106% 1MPh 0.1 0.3 106%
A 0.1 0.4 105% ∑DMPh 1.0 3.0 106%
Fa 0.1 0.3 102% ∑TMPh 1.0 3.0 106%
Py 0.1 0.3 102% 2MN 0.4 1.3 98%
BaA 0.1 0.4 103% 1MN 0.4 1.1 98%
Ch 0.1 0.4 101% ∑DMN 1.6 5.0 98%
BbjkF 0.3 1.0 104% ∑TMN 1.6 5.0 98%
BaP 0.3 1.0 97% ∑TeMN 1.6 5.0 98%
IPy 0.3 1.0 103% DBT 0.1 0.4 --
DBA 0.3 1.0 102% ∑MDBT 0.3 1.0 --
BPe 0.3 1.0 100% Benzene 50 150 --
BePy 0.3 1.0 99% Toluene 5.7 17.0 --
Pe 0.3 1.0 98% Ethylbenzene 0.7 2.0 --
MCh 0.2 0.5 101% pm-xylene 1.5 4.5 --
BNT 0.1 0.4 101% o-xylene 0.7 2.0 --
a=mg.L-1; b=µg.L-1; c=ng.L-1; N=naphthalene; Ac=acenaphthylene; Ace=acenaphthene; Fl=Fluorene; Ph=phenanthrene;
A=anthracene; Fa=Fluoranthene; Py=pyrene; BaA=benzo[a]anthracene; Ch= chrysene+triphenylene;
BbjkF=benzo[bjk]fluoranthene; BaP=benzo[a]pyrene; IPy=indeno[1,2,3-cd]pyrene; DBA=dibenzo[ah]anthracene;
BPe=benzo[ghi]perylene; BePy=benzo[e]Pyrene; Pe=perylene; MCh=methylchrysene; BNT=2,1benzonaphtothiophene;
3MPh=3Methylphenanthrene; 2MPh=2methylphenanthrene; MA=2methylanthracene; MPhMA=[9+4]methylphenanthrene+
1methylanthracene+ 4,5methylenephenanthrene; 1MPh=1methylphenanthrene; ∑DMPh=∑dimethylphenanthrene;
∑TMPh=∑trimethylphenanthrene; 2MN=2methylnaphthalene; 1MN=1methyl-naphthalene; ∑DMN=∑dimethylnaphthalene;
∑TMN=∑trimethylnaphthalene; ∑TeMN=∑tetramethylnaphthalene; DBT=dibenzothiophene; ∑MDBT=∑methyldibenzothiophene;
∑MN= Σmethylnaphthalenes; -- = non certified

CHAPTER 2
121
Table SII-2. List and proprieties of PAHs and BTEX analyzed in the present study.
GROUP MOLECULE RINGS SOLUBILITY
(mg L-1)
MOLECULAR
WEIGHT
(g mole-1)
IARC
GROUP ABBREVIATION
US-EPA
PARENT
PAHs
Naphthalene 2 31 128.17 2B N
Acenaphthene 3 16.1 152.20 3 Ace
Acenaphthylene 3 3.8 154.21 - Ac
Anthracene 3 1.9 166.22 3 A
Phenanthrene 3 1.1 178.23 3 Ph
Fluoranthene 4 0.26 202.26 3 Fa
Chrysene 4 0.132 202.26 2B Ch
Benzo[ghi]perylene 6 0.062 276.34 3 BPe
Fluorene 3 0.045 178.23 3 Fl
Pyrene 4 0.011 228.29 3 Py
Benzo[b]fluoranthene* 5 0.0038 252.32 2B
BbjkF Benzo[j]fluoranthene* 5 0.0025 252.32 2B
Benzo[k]fluoranthene* 5 0.0015 252.32 2B
Benz[a]anthracene 4 0.0015 228.29 2B BaA
Benzo[a]pyrene 5 0.0008 252.32 1 BaP
Indeno[1,2,3-cd]pyrene 6 0.0005 278.35 2B IP
Dibenzo[a,h]anthracene 6 0.00026 276.34 2A DBA
OTHER
PARENT
PAHs
Benzo[e]pyrene 5 0.0063 252.32 3 BeP
Perylene 5 0.0004 252.09 3 Pe
2,1-Benzonaphtothiophene 3 - 234.32 3 BNT
METHYL
PAHs
2Methylnaphthalene 2 24.6 142.2 - 2MN
1Methylnaphthalene 2 25 142.2 - 1MN
Dibenzothiophene 2 1.47 184.3 3 DBT
ΣMethylchrysene 4 - 242.3 3 MCh
3Methylphenanthrene 3 - 192.3 3 3MPh
2Methylphenanthrene 3 - 192.3 - 2MPh
2Methylanthracene 3 - 192.3 - MA
9+4Methylphenanthrene** 3 - 192.3 -
MPhMA [4,5]Methylenephenanthrene** 3 - 192.3
1Methylanthracene** 3 - 190.3
1Methylphenanthrene 3 - 192.3 3 1MPh
ΣDimethylphenanthrene 3 - 206.2 3 ∑DMPh
ΣTrimethylphenanthrene 3 - 220.3 - ∑TMPh
ΣDimethylnaphthalene 2 - 156.2 - ∑DMN
ΣTrimethylnaphthalene 2 - 170.3 - ∑TMN
ΣTetramethylnaphthalene 2 - 184.3 - ∑TeMN
ΣMethyldibenzothiophene 2 - 198.3 - ∑MDBT
ΣMethilnaphthalenes 2 - 142.2-184.3 - ∑MN
BTEX
Benzene 1 1790 78.1 1 Benzene
Toluene 1 526 92.1 3 Toluene
Ethylbenzene 1 169 106.2 2B EB
[p+m]-xylene 1 162 106.2 - pm-xyl
o-xylene 1 178 106.2 - o-xyl
∑xylenes 1 - 106.2 3 ∑xyl
Source:(Bojes and Pope, 2007; NCBI and USNLM, 2018);
* BbjkF=Benzo[bjk]fluoranthene=this three compounds belongs to the same analytical ensemble, they are reported as one,
Benzo[j]fluoranthene is not in the US-EPA list; ** MPhMA =9+4Methylphenanthrene+ [4,5]Methylenephenanthrene +1Methylanthracene,
this three compounds belongs to the same analytical ensemble, they are reported as a unique one.

CHAPTER 2
122
Tab
le S
II-3
. Wat
er q
ual
ity
guid
elin
es (
WQ
G)
and
min
imu
m h
ealt
h r
equ
irem
ent
for
trea
ted
an
d n
atu
ral w
ater
inte
nd
ed f
or
hu
man
co
nsu
mp
tio
n.
PA
RA
ME
TE
R
Min
istr
y o
f th
e
En
vir
on
men
t-
Ecu
ad
ora
Min
istr
y o
f
the
En
vir
on
men
t-
Ecu
ad
or
b
Min
istr
y o
f
the
En
vir
on
men
t-
Ecu
ad
orc
Hea
lth
Ca
na
da
a
Min
istr
y o
f
So
lid
ari
ty a
nd
Hea
lth
-Fra
nce
a
Min
istr
y o
f
So
lid
ari
ty a
nd
Hea
lth
-Fra
nce
b
Min
istr
y o
f
So
lid
ari
ty a
nd
Hea
lth
-Fra
nce
c
Th
e C
ou
nci
l o
f
the
Eu
rop
ean
Un
ion
a
US
-EP
Aa
WH
Oa
WH
Om
W
HO
s
CE
(µ
S c
m-1
) –
–
–
–
2
00
– 1
10
0R
–
11
00
<2
500
h
–
–
–
–
pH
6
.5-8
.5d
6.0
-9.0
6
.0-9
.0g
7.0
-10
.5
6.5
-9.0
–
6
.5-8
.5R
6.5
-9.5
h
6.5
-8.5
i 6
.5-8
.5j
–
–
F (
mg
L-1
) <
1.5
<
1.5
<
1.4
f <
1.5
<
1.5
–
0
.7-1
.0R
<1
.5
<4
.0
<1
.5
–
0.5
-1.0
Cl
(mg
L-1
) <
25
0d
–
–
<2
50
AO
< 2
50
< 2
50
<2
00
R
<2
50
h
<2
50
i <
25
0j
–
–
SO
4= (
mg
L-1
) <
20
0d
<5
00
<2
50
g
< 5
00
AO
< 2
50
< 2
50
< 1
50
R
< 2
50
h
<2
50
i <
50
0j
–
–
NO
3- (m
g L
-1)
<5
0
<5
0
<5
0g
<4
5
<5
0
<5
0 o
r <
100
<2
5
<5
0
<1
0R
<5
0
–
–
HC
O3
- (m
g L
-1)
–
–
–
–
–
–
–
–
–
–
30
–
Ca
(mg
L-1
) –
–
–
–
–
–
–
–
–
<
10
0j,
R
20
40
-80
(50
)
Mg
(m
g L
-1)
–
–
–
–
–
–
–
–
–
–
10
20
-30
TD
S (
mg
L-1
) –
–
–
–
–
–
–
–
–
–
1
00
25
0-5
00
Na
(mg
L-1
) <
20
0d,R
<
20
0f
< 2
00
f <
20
0A
O,R
<
20
0R
< 2
00
R
–
< 2
00
h,R
–
<
20
0j,
R
20
–
As_
µg/L
<
10
R
<1
00
<1
0g,R
<
10
R
<1
0R
<1
00
<1
0R
<1
0R
<1
0R
<1
0R
–
–
Cd
(µ
g L
-1)
<3
<
20
<3
g
<5
<
5
<5
<
1R
<5
<
5
<3
–
–
Cr
(µg
L-1
) <
50
R
–
–
<5
0R
<5
0R
<5
0R
<5
0R
<5
0R
<1
00
<5
0R
–
–
Ni
(µg
L-1
) <
70
–
<2
5f
–
<2
0R
–
–
<2
0R
–
<7
0
–
–
Pb
(µ
g L
-1)
<1
0R
<1
0R
<1
0g
<1
0R
<1
0R
<5
0
<1
0R
<1
0R
<1
5
<1
0R
–
–
Al
(µg
L-1
) <
25
0d
<2
00
g,R
<
10
0g
<1
00
<2
00
R
–
–
< 2
00
h
50
- 2
00
i <
20
0j,
R
–
–
V (
µg
L-1
) <
10
0d,R
–
–
–
–
–
–
<
14
0
–
–
–
–
Mn
(µ
g L
-1)
<4
00
e <
10
0f
<1
00
f <
50
R
<5
0R
–
<5
0R
<5
0h,R
<
50
i,R
<4
00
j –
–
Fe
(µg
L-1
) <
30
0d
<1
000
<3
00
g
<3
00
<2
00
–
<1
00
R
< 2
00
h
<3
00
i 3
00
j –
–
Co
(µ
g L
-1)
<2
00
d,R
–
–
–
–
–
–
–
–
–
–
–
Cu
(µ
g L
-1)
<2
000
<2
000
<2
000
g
<1
000
<1
000
–
<2
0R
<2
000
<1
300
<2
000
–
–
Zn
(µ
g L
-1)
<3
000
d
<5
000
g
<5
000
g
<5
000
–
<5
000
<5
00
R
–
<5
000
i <
30
00
j –
–
Se
(µg
L-1
) <
40
<1
0R
<1
0g,R
<
50
<1
0R
<1
0R
<1
0R
<1
0R
<5
0
<4
0
–
–
Mo
(µ
g L
-1)
–
–
–
–
–
–
–
–
–
<7
0j,
R
–
–
Sb
(µ
g L
-1)
<2
0
–
–
<6
<
5R
–
–
<5
R
<6
<
20
–
–
Ba
(µg
L-1
) <
70
0
<1
000
<7
00
g
<1
000
<7
00
<1
00
R
<1
00
R
–
<2
000
<1
300
–
–
Hg
(µ
g L
-1)
<6
<
6
<6
g
<1
<
1
<1
<
0.5
R
<1
<
2
<6
–
–
U (
µg
L-1
) –
–
–
<
20
R
–
–
–
–
<3
0
<3
0
–
–
Fa
(µg
L-1
) –
–
–
–
–
<
1**
<
0.2
**
–
–
<
4j,
R
–
–
B[b
k]F
a (µ
g L
-1)
–
–
–
–
<0
.1*
<1
**
<
0.2
**
<
0.1
*
–
–
–
–
B[a
]P (
µg
L-1
) <
0.7
<
0.0
1f,
R
<0
.01
f,R
<0
.04
<0
.01
R
<1
**
<
0.2
**
<
0.0
1R
<0
.2
<0
.7
–
–
IP (
µg
L-1
) <
0.0
3d,R
–
–
–
<
0.1
*
<1
**
<
0.2
**
<
0.1
*
–
–
–
–
B[g
hi]
Pe
(µg
L-1
) <
0.0
3d,R
–
–
–
<
0.1
*
<1
**
<
0.2
**
<
0.1
*
–
–
–
–

CHAPTER 2
123
Tab
le S
II-3
. Wat
er q
ual
ity
guid
elin
es (
WQ
G)
and
min
imu
m h
ealt
h r
equ
irem
ent
for
trea
ted
an
d n
atu
ral w
ater
inte
nd
ed f
or
hu
man
co
nsu
mp
tio
n.
(co
nti
nu
ed)
PA
RA
ME
TE
R
Min
istr
y o
f th
e
En
vir
on
men
t-
Ecu
ad
ora
Min
istr
y o
f
the
En
vir
on
men
t-
Ecu
ad
or
b
Min
istr
y o
f
the
En
vir
on
men
t-
Ecu
ad
or
c
Hea
lth
Ca
na
da
a
Min
istr
y o
f
So
lid
ari
ty a
nd
Hea
lth
-Fra
nce
a
Min
istr
y o
f
So
lid
ari
ty a
nd
Hea
lth
-Fra
nce
b
Min
istr
y o
f
So
lid
ari
ty a
nd
Hea
lth
-Fra
nce
c
Th
e C
ou
nci
l o
f
the
Eu
rop
ean
Un
ion
a
US
-EP
Aa
WH
Oa
WH
Om
W
HO
s
Ben
zen
e (µ
g L
-1)
<1
0
<1
0f
–
<5
<
1R
–
–
<1
R
<5
<
10
–
–
Tolu
ene
(µg
L-1
) <
70
0
<1
000
f –
<
60
R
–
–
–
–
<1
000
<7
00
–
–
<2
00d
<7
00
f –
<
14
0R
–
–
–
–
<7
00
<3
00
–
–
Xy
len
es (
µg
L-1
) <
50
0
<1
000
0f
–
<9
0
–
–
–
–
<1
000
0
<5
00
–
–
E. C
oli
k
<1
CF
U
10
00
MP
N
20
MP
Ng
0 C
FU
0
CF
U
20
00
0 C
FU
2
0 C
FU
0
CF
U
<2
.5%
l 0
CF
U
–
–
Tota
l co
lifo
rmsk
<
1 C
FU
d
20
00
MP
Ng
20
0 M
PN
g
0 C
FU
0
CF
U
–
50
CF
U
0 C
FU
<
2.5
%l
0 C
FU
–
–
US
-EP
A=
US
Envir
onm
enta
l P
rote
ctio
n A
gen
cy; W
HO
=W
orl
d H
ealt
h O
rgan
izat
ion; a=
tre
ated
-cle
an w
ater
sourc
es; b=
raw
wat
er that
nee
ds
trea
tmen
t; c
= r
aw w
ater
that
nee
ds
sim
ple
physi
cal t
reat
men
t an
d/o
r dis
infe
ctio
n;
AO
=ae
sthet
ic o
bse
rvat
ion (
tast
e or
smel
l); d=
IN
EN
-2006; e=
IN
EN
-2011; f=
TU
LS
MA
-2003; g=
TU
LS
MA
-Feb
2015; h=
Indic
ator
par
amet
ers;
i=
Non
-enfo
rcea
ble
guid
elin
es c
osm
etic
eff
ects
; j=
non e
stab
lish
ed g
uid
elin
e;
k=
counte
d
in
100
ml
volu
me;
l=
If
<
40
sam
ple
s/m
onth
. m
axim
un
one
sam
ple
(2
.5%
)
can
be
posi
tive;
m
=m
inim
um
hea
lth
requir
emen
t;
s=opti
mal
hea
lth
requie
rem
ent;
*B
[bk]F
a+B
[ghi]
Pe+
IP;
**F
a+B
[bk]F
a+B
[a]P
+B
[ghi]
Pe+
IP;
Fa=
fluora
nth
ene;
B[b
k]F
a=ben
zo[b
k]f
luora
nth
ene;
B[a
]P=
ben
zo[a
]pyre
ne;
IP
=in
den
o[1
,2,3
-cd]p
yre
ne;
B[g
hi]
Pe
CF
U=
colo
ny f
orm
ing u
nit
s; M
PN
=m
ost
pro
bab
le n
um
ber
; R
=val
ue
consi
der
ed i
n t
he
pre
sent st
udy.

CHAPTER 2
124
Tab
le S
II-4
. Ave
rage
(± S
tan
dar
d D
evia
tio
n) P
AH
s an
d B
TEX
co
nce
ntr
atio
ns
(ng.
L-1) a
nd
co
lifo
rms
(CFU
.10
0 m
L-1) i
n d
iffe
ren
t so
urc
es o
f do
mes
tic
wat
er c
olle
cted
in
th
e N
ort
her
n a
nd
So
uth
ern
Ecu
ado
rian
Am
azo
n R
egio
n (
NEA
R a
nd
SEA
R,
resp
ecti
vely
) an
d in
th
e N
ort
her
n a
nd
in t
he
No
rth
ern
an
d S
ou
ther
n E
cuad
ori
an
Pac
ific
Co
ast
(NEP
C a
nd
SEP
C, r
esp
ecti
vely
).
PA
RA
ME
TE
R N
EA
R
SE
AR
N
EP
C
SE
PC
dee
p
wel
l ra
infa
ll
riv
er
sha
llo
w
wel
l sp
rin
g
stre
am
sy
stem
ra
infa
ll ri
ver
sp
rin
g
stre
am
sy
stem
ra
infa
ll
syst
em
syst
em
sha
llo
w
wel
l
N
<5
.0
<5
.0
<5
.0
<5
.0
<5
.0
<5
.0
<5
.0
5.6
*
<5
.0
<5
.0
<5
.0*
<5
.0*
8.2
*
<5
.0
<5
.0*
<5
.0*
AC
<
0.9
0
.9±
0.7
<
0.9
<
0.9
1
.7±
2.1
<
0.9
n
d
3.1
*
<0
.9
<0
.9
<0
.9*
nd
*
1.5
*
1.6
±3
.1
<0
.9*
nd
*
AC
E
<0
.9
<0
.9
<0
.9
<0
.9
<0
.9
0.9
±0
.8
<0
.9
<0
.9*
<0
.9
<0
.9
<0
.9*
<0
.9*
1.2
*
<0
.9
<0
.9*
<0
.9*
Fl
1±
2.4
0
.6±
0.4
<
0.6
<
0.6
3
.4±
10
12
.6±
24
.7
<0
.6
0.8
*
0.8
±0
.5
<0
.6
<0
.6*
<0
.6*
3.5
*
0.9
±1
.4
<0
.6*
<0
.6*
Ph
1
±1
.1
2.6
±1
.9
0.8
±0
.6
1±
0.6
1
.6±
2.7
2
.7±
4
1.4
±0
.7
5.8
*
1.8
±1
.9
0.6
±0
.3 <
0.6
*
<0
.6*
8.6
*
4.7
±9
.8
<0
.6*
<0
.6*
A
<0
.6
<0
.6
<0
.6
<0
.6
<0
.6
<0
.6
<0
.6
0.8
*
<0
.6
<0
.6
<0
.6*
nd
*
<0
.6*
0.7
±1
.3
<0
.6*
<0
.6*
Fa
<
0.4
0
.7±
0.5
<
0.4
<
0.4
0
.6±
0.6
<
0.4
0
.5±
0.3
2
*
<0
.4
<0
.4
<0
.4*
<0
.4*
1*
1.7
±3
.6
0.4
*
<0
.4*
Py
0
.4±
0.3
0
.7±
0.7
<
0.4
<
0.4
0
.6±
0.7
0
.6±
0.8
0
.5±
0.3
1
.7*
0.4
±0
.2
0.4
±0
.3 <
0.4
*
<0
.4*
1.2
*
2.2
±4
.8
<0
.4*
<0
.4*
Ba
A
0.8
±1
.2
<0
.5
<0
.5
<0
.5
<0
.5
<0
.5
<0
.5
<0
.5*
<0
.5
<0
.5
<0
.5*
nd
*
<0
.5*
<0
.5
<0
.5*
nd
*
Ch
<
0.5
<
0.5
<
0.5
<
0.5
<
0.5
0
.9±
1.3
<
0.5
<
0.5
*
<0
.5
<0
.5
<0
.5*
nd
*
<0
.5*
<0
.5
<0
.5*
<0
.5*
Bb
jkF
<
1.5
<
1.5
<
1.5
<
1.5
<
1.5
<
1.5
<
1.5
<
1.5
*
<1
.5
<1
.5
<1
.5*
nd
*
<1
.5*
<1
.5
<1
.5*
<1
.5*
Ba
Py
<
1.5
<
1.5
<
1.5
n
d
<1
.5
<1
.5
nd
<1
.5*
nd
<1
.5
nd
*
nd
*
<1
.5*
<1
.5
<1
.5*
<1
.5*
IPy
<
1.5
<
1.5
<
1.5
n
d
nd
nd
nd
nd
*
nd
nd
nd
*
nd
*
<1
.5*
nd
nd
*
nd
*
DB
A
nd
nd
<1
.5
<1
.5
<1
.5
nd
nd
nd
*
nd
nd
nd
*
nd
*
nd
*
nd
nd
*
nd
*
BP
e
<1
.5
<1
.5
<1
.5
nd
nd
nd
nd
<1
.5*
nd
<1
.5
nd
*
nd
*
<1
.5*
<1
.5
<1
.5*
nd
*
∑1
6P
AH
s 8
.8±
10
.2
11
.4±
4.5
7
±3
6±
1.3
1
0.9
±15
.3 2
3.4
±35
.1
6.7
±0
.9
23
*
7.7
±2
.5
6.4
±1
.1 6
.0*
4.7
*
29
.1*
17
.7±
27
.8
7.7
*
6*
∑N
orm
1
0.8
±0
.2
0.8
±1
0.4
±0
.8
0.3
±0
.4
0.1
±0
.3
0.2
±0
.4
0.2
±0
.4
1.5
*
0.7
±0
0.7
±0
.5 0
.7*
0.7
*
2.2
±*
0.8
±0
.4
1.5
*
0.7
*
∑N
orm
2
0.9
±0
.6
1.7
±1
.4
0.8
±1
.1
0.6
±0
.3
0.8
±0
.7
0.7
±0
.7
0.7
±0
.2
4.2
*
0.9
±0
1.2
±0
.8 0
.9*
0.9
*
4±
*
3±
3.3
2
.6*
1.7
*
BeP
y
nd
<1
.5
nd
nd
nd
nd
nd
<1
.5*
nd
nd
nd
*
nd
*
<1
.5*
<1
.5
<1
.5*
<1
.5*
Pe
<1
.5
nd
<1
.5
nd
nd
<1
.5
nd
<1
.5*
nd
nd
<1
.5*
nd
*
<1
.5*
<1
.5
<1
.5*
nd
*
MC
h
<0
.6
<0
.6
<0
.6
nd
<0
.6
nd
<0
.6
<0
.6*
<0
.6
<0
.6
nd
*
nd
*
<0
.6*
<0
.6
nd
*
nd
*
BN
T
<0
.5
<0
.5
<0
.5
<0
.5
<0
.5
<0
.5
nd
<0
.5*
<0
.5
<0
.5
<0
.5*
<0
.5*
<0
.5*
<0
.5
nd
*
<0
.5*
3M
Ph
0
.3±
0.3
0
.8±
1.2
0
.3±
0.2
0
.3±
0.2
0
.4±
0.5
0
.8±
1.3
1
.1±
1.6
0
.8*
1.9
±2
.5
<0
.3.1
<
0.3
*
<0
.3*
1*
1.8
±3
.9
<0
.3*
<0
.3*
2M
Ph
0
.3±
0.2
1
.1±
1.5
0
.3±
0.2
0
.3±
0.2
0
.6±
0.9
1
±1
.8
1.1
±1
.1
0.7
*
2±
2.6
<
0.3
.1
<0
.3*
<0
.3*
1.2
*
2.4
±5
.6
<0
.3*
<0
.3*
MA
<
0.3
<
0.3
<
0.3
<
0.3
<
0.3
<
0.3
<
0.3
<
0.3
*
0.3
±0
.2
<0
.3
<0
.3*
<0
.3*
--
0.3
±0
.2
<0
.3*
<0
.3*
MP
h-M
A
0.3
±0
.2
1±
1.8
0
.3±
0.3
0
.3±
0.1
0
.4±
0.7
1
.4±
2.4
0
.7±
0.9
0
.7*
1.6
±1
.8
<0
.3.1
<
0.3
*
<0
.3*
1.2
*
2.8
±5
.6
<0
.3*
<0
.3*

CHAPTER 2
125
Tab
le S
II-4
. Ave
rage
(±
Stan
dar
d D
evia
tio
n)
PA
Hs
and
BTE
X c
on
cen
trat
ion
s (n
g.L-1
) an
d c
olif
orm
s (C
FU.1
00
mL-1
) in
dif
fere
nt
sou
rces
of
do
mes
tic
wat
er
colle
cted
in t
he
No
rth
ern
an
d S
ou
ther
n E
cuad
ori
an A
maz
on
Reg
ion
(NEA
R a
nd
SEA
R, r
esp
ecti
vely
) an
d in
th
e N
ort
her
n a
nd
in t
he
No
rth
ern
an
d S
ou
ther
n
Ecu
ado
rian
Pac
ific
Co
ast
(NEP
C a
nd
SEP
C, r
esp
ecti
vely
). (
con
tin
ued
)
PA
RA
ME
TE
R
NE
AR
S
EA
R
NE
PC
S
EP
C
dee
p
wel
l ra
infa
ll
riv
er
sha
llo
w
wel
l sp
rin
g
stre
am
sy
stem
ra
infa
ll
riv
er
spri
ng
stre
am
sy
stem
ra
infa
ll
syst
em
syst
em
sha
llo
w
wel
l
1M
Ph
<
0.3
.1
1.2
±2
.4
0.3
±0
.2 <
0.3
.1
0.4
±0
.6
1.3
±2
.3
0.4
±0
.3
0.6
*
1.2
±1
.3
<0
.3
<0
.3*
<0
.3*
1.6
*
2.7
±5
.6
<0
.3*
<0
.3*
∑D
MP
h
<5
.0.9
5
.1±
7.3
<
5.0
<
5.0
<
5.0
1
0.5
±16
4.4
±3
.2
<5
.0*
8.1
±9
.7
<5
.0
<5
.0*
<5
.0*
<5
.0*
14
.9±
31
.4
<5
.0*
<5
.0*
∑T
MP
h
<5
.0
3.8
±3
.5
<5
.0
<5
.0
<5
.0
14
.9±
17
.5
<5
.0
<5
.0*
<5
.0
<5
.0
<5
.0*
nd
*
<5
.0*
25
5±
79
5.2
<
5.0
*
nd
*
2M
N
12
±3
3.9
6
.1±
6
5.8
±4
.5 3
.7±
3.2
3
.6±
3.7
5
.6±
7.2
5
.3±
4.1
7
.2*
5.3
±3
.4
<2
.0
6.1
*
<2
.0*
13
.7*
5.6
±5
.4
5.5
*
2.8
*
1M
N
9.4
±2
9.8
4
.2±
4.7
3
.4±
4
1.6
±1
.2
2.2
±2
.7
4.9
±8
.3
3.2
±3
.4
4.1
*
3±
1.9
<
1.5
3
.6*
<1
.5*
7.7
*
3.6
±4
.9
2.1
*
<1
.5*
∑D
MN
5
7±
153
37
.6±
28
28
±2
2
23
±1
2
24
±1
9
49
±7
7
35
±1
0
17
*
28
±1
5
9±
2
24
*
6.3
*
44
.4*
25
±3
5
12
.5*
7.0
*
∑T
MN
4
5±
124
44
±3
8.
33
±2
7
25
±1
7
29
±3
6
10
6±
19
0
36
±3
2
12
*
38
±2
7
6±
3
20
*
5.8
*
49
.8*
34
0±
85
9.1
*
<5
.0*
∑T
eMN
1
9.5
±39
.1
20
±1
5
20
±1
5
13
.6±
4
18
±1
9
75
±1
34
26
±1
3
12
*
36
±3
2
6±
3
15
*
5.3
*
40
.3*
41
±7
9
7.1
*
<5
.0*
DB
T
<0
.6
<0
.6
<0
.6
<0
.6
<0
.6
1±
1.4
<
0.6
<
0.6
*
0.7
±0
.4
<0
.6
<0
.6*
<0
.6*
0.7
*
0.7
±1
.1
<0
.6*
<0
.6*
∑M
DB
T
<2
.5
<2
.5
<2
.5
<2
.5
<2
.5
3.8
±5
<2
.5
<2
.5*
3±
3
<2
.5
<2
.5*
<2
.5*
<2
.5*
4.4
±6
.3
<2
.5*
<2
.5*
∑M
N
13
5±
37
0
11
2±
83
92
±7
1
67
±3
5
77
±8
0
24
0±
41
6
10
6±
49
52
*
11
0±
73
23
±7
69
*
19
*
15
6*
11
4±
20
8
36
*
16
*
Ben
zen
e <
10
0
<1
00
<1
00
<1
00
<1
00
<1
00
<1
00
<1
00
*
--
<1
00
<1
00
*
<1
00
*
<1
00
*
22
4±
24
2
82
5*
33
4*
To
luen
e 1
182
±2
04
0 1
9±
15
20
±4
<9
4
7±
50
15
±1
1
70
59
*
--
40
±1
4
81
*
61
*
54
*
45
±5
2
36
*
25
*
Eth
ylb
en
zen
e 3
2±
16
77
±9
6
16
±8
13
±8
89
±1
05
17
±2
44
*
19
*
--
14
±1
40
*
19
*
16
0*
14
4±
20
0
17
5*
10
9*
pm
-xy
len
e 3
1±
22
72
±7
7
23
±4
30
±1
7
79
±8
9
17
±3
61
*
36
*
--
19
±3
53
*
41
*
16
3*
10
8±
14
6
12
2*
12
1*
o-x
yle
ne
6±
8
11
±1
1
5±
0
10
±5
11
±9
5±
1
17
*
14
*
--
6±
2
12
*
20
*
31
*
22
±2
2
18
*
22
*
∑x
yle
nes
3
8±
30
83
±8
7
28
±4
40
±2
2
90
±9
8
22
±4
78
*
50
*
--
24
±4
65
*
61
*
19
4*
17
7±
17
7
14
0*
14
3*
E. C
oli
1
9±
20
--
5*
--
0
--
0
--
--
--
--
--
--
--
--
--
To
tal
coli
form
s 3
47±
35
0
--
53
0
--
32
8±
44
1 -
- 2
9
--
--
--
--
--
--
--
--
--
NE
AR
=N
ort
h E
cuad
ori
an A
maz
on
Reg
ion
; S
EA
R=
Sou
th E
cuad
ori
an A
maz
on
Reg
ion
; N
EP
C=
No
rth E
cuad
ori
an P
acif
ic C
oas
t ;S
EP
C=
Sou
th E
cuad
ori
an P
acif
ic C
oas
t; *
sin
gle
val
ue
(n=
1);
N=
nap
hth
alen
e;
AC
=ac
enap
hth
yle
ne;
A
CE
=ac
enap
hth
ene;
F
l=F
luo
ren
e;
Ph=
ph
enan
thre
ne;
A
=an
thra
cen
e;
Fa=
Flu
ora
nth
ene;
P
y=
py
ren
e;
BaA
=ben
zo[a
]anth
race
ne;
C
h=
chry
sene+
trip
hen
yle
ne;
Bb
jkF
=b
enzo
[bjk
]flu
ora
nth
ene;
B
aPy=
ben
zo[a
]py
ren
e;
IPy=
ind
eno
[1,2
,3-c
d]p
yre
ne;
D
BA
=dib
enzo
[ah]a
nth
race
ne;
B
Pe=
ben
zo[g
hi]
per
yle
ne;
B
ePy=
ben
zo[e
]Pyre
ne;
P
e=per
yle
ne;
MC
h=
met
hy
lch
ryse
ne;
BN
T=
2,1
ben
zon
aph
toth
iop
hen
e; 3
MP
h=
3M
ethy
lph
enan
thre
ne;
2M
Ph=
2m
ethy
lph
enan
thre
ne;
MA
=2
met
hy
lan
thra
cen
e; M
PhM
A=
[9+
4]m
ethylp
hen
anth
rene+
1m
ethyla
nth
race
ne+
4,5
met
hyle
nep
hen
anth
rene;
1M
Ph=
1m
ethylp
hen
anth
rene;
∑
DM
Ph=
∑dim
ethylp
hen
anth
rene;
∑
TM
Ph=
∑tr
imet
hylp
hen
anth
rene;
2M
N=
2m
ethyln
aphth
alen
e;
1M
N=
1m
ethyl-
nap
hth
alen
e;
∑D
MN
=∑
dim
ethy
lnap
hth
alen
e;
∑T
MN
=∑
trim
ethy
lnap
hth
alen
e;
∑T
eMN
=∑
tetr
amet
hy
lnap
hth
alen
e;
DB
T=
dib
enzo
thio
phen
e;
∑M
DB
T=
∑m
ethyld
iben
zoth
iophen
e;
∑M
N=
Σ
met
hyln
aphth
alen
es;
∑N
orm
1=
B[b
jk]F
a+B
[gh
i]P
e+IP
; ∑
No
rm2
=F
a+B
[bjk
]Fa+
B[a
]P+
B[g
hi]
Pe+
IP.
Det
ecte
d m
ole
cule
s w
ith
an
av
erag
e co
nce
ntr
atio
n b
etw
een
LD
an
d L
Q a
re r
epo
rted
as
<L
Q.
Dat
a lo
wer
th
an t
he
DL
are
rep
ort
ed a
s n
d=
no
n d
etec
ted
. --
: not
mea
sure
d.

CHAPTER 2
126
Tab
le S
II-5
. In
div
idu
al h
azar
d q
uo
tien
t (H
Q)
for
inge
stio
n p
ath
way
in t
he
Ecu
ado
rian
am
azo
n r
egio
n.
PO
PU
LA
TIO
N
PA
RA
ME
TE
R
NE
AR
S
EA
R
dee
p w
ell
rain
fall
ri
ver
sh
all
ow
wel
l sp
rin
g
stre
am
sy
stem
ra
infa
ll
river
sp
rin
g
stre
am
sy
stem
AD
UL
TS
As
1.2
8x
10
-1
4.9
4x
10
-3
3.2
6x
10
-2
6.0
8x
10
-2
2.5
0x
10
-2
9.2
0x
10
-2
1.7
5x
10
-1
1.2
2x
10
-3
8.9
3x
10
-2
5.0
3x
10
-2
7.3
7x
10
-2
1.2
5x
10
-1
Cd
3
.17x
10
-3
1.9
8x
10
-3
1.7
2x
10
-3
7.5
2x
10
-3
3.6
9x
10
-3
3.5
2x
10
-3
1.2
9x
10
-3
3.2
0x
10
-3
7.8
9x
10
-3
3.4
2x
10
-3
2.8
4x
10
-4
9.4
0x
10
-5
Cr
9.1
0x
10
-3
3.3
5x
10
-3
3.7
9x
10
-3
2.0
4x
10
-3
9.0
7x
10
-3
3.1
2x
10
-3
5.4
2x
10
-2
7.3
5x
10
-4
4.6
7x
10
-3
2.7
2x
10
-3
9.4
2x
10
-4
1.6
7x
10
-3
Ni
1.2
6x
10
-3
5.7
0x
10
-4
4.0
8x
10
-4
8.4
0x
10
-4
1.7
1x
10
-3
1.1
9x
10
-3
1.8
2x
10
-3
1.7
4x
10
-3
5.7
0x
10
-4
5.4
9x
10
-4
4.5
3x
10
-4
3.8
8x
10
-4
Hg
3
.13x
10
-4
2.7
6x
10
-4
2.4
6x
10
-4
1.2
2x
10
-4
3.9
0x
10
-4
2.2
3x
10
-4
1.1
8x
10
-3
–
–
–
2.2
8x
10
-4
–
Al
4.8
7x
10
-3
1.4
3x
10
-3
2.8
5x
10
-3
5.5
7x
10
-3
1.5
1x
10
-2
4.9
9x
10
-3
6.0
6x
10
-1
6.0
1x
10
-4
5.0
8x
10
-3
5.8
2x
10
-3
2.4
0x
10
-4
2.4
4x
10
-3
V
1.1
3x
10
-2
2.2
1x
10
-3
1.5
0x
10
-2
5.3
1x
10
-3
7.9
5x
10
-3
1.9
7x
10
-2
3.0
8x
10
-2
3.8
4x
10
-4
1.3
0x
10
-2
5.7
0x
10
-3
3.0
9x
10
-3
7.1
1x
10
-3
Mn
7
.28x
10
-2
1.6
8x
10
-3
3.7
5x
10
-3
7.3
3x
10
-2
6.9
1x
10
-3
1.8
1x
10
-2
1.4
3x
10
-3
1.6
9x
10
-3
1.2
7x
10
-3
3.9
5x
10
-3
8.9
3x
10
-3
5.8
0x
10
-4
Co
5.1
1x
10
-4
9.2
6x
10
-5
2.4
1x
10
-4
1.3
3x
10
-3
7.1
5x
10
-4
8.3
8x
10
-4
2.0
1x
10
-4
7.4
3x
10
-5
1.9
5x
10
-4
2.8
8x
10
-4
4.1
4x
10
-4
6.8
6x
10
-5
Cu
8
.59x
10
-3
1.6
9x
10
-3
4.0
1x
10
-4
9.8
2x
10
-3
1.1
9x
10
-3
7.8
3x
10
-4
7.5
5x
10
-3
6.7
0x
10
-4
2.8
3x
10
-3
9.5
8x
10
-3
5.6
9x
10
-4
2.2
2x
10
-3
Zn
3
.00x
10
-3
2.4
0x
10
-1
7.9
8x
10
-5
7.3
6x
10
-3
8.4
8x
10
-3
3.3
0x
10
-4
4.2
0x
10
-3
4.8
9x
10
-1
5.1
9x
10
-4
1.2
6x
10
-3
2.9
7x
10
-5
5.9
1x
10
-4
Se
1.4
7x
10
-2
2.3
9x
10
-3
3.2
0x
10
-3
1.0
9x
10
-2
3.8
8x
10
-3
2.6
9x
10
-3
1.8
6x
10
-3
2.5
7x
10
-4
7.1
1x
10
-4
2.5
7x
10
-4
5.9
2x
10
-4
2.5
7x
10
-4
Sr
1.5
2x
10
-2
2.8
4x
10
-4
5.2
3x
10
-3
9.2
6x
10
-3
5.4
3x
10
-3
5.5
7x
10
-3
4.9
9x
10
-3
2.4
9x
10
-5
4.1
7x
10
-3
1.7
9x
10
-3
4.3
3x
10
-3
1.9
5x
10
-3
Mo
2
.29x
10
-2
2.5
4x
10
-4
4.8
3x
10
-3
5.7
9x
10
-4
6.1
7x
10
-4
1.7
1x
10
-3
2.8
7x
10
-3
1.1
5x
10
-4
4.8
7x
10
-2
2.1
4x
10
-4
1.1
0x
10
-3
1.1
5x
10
-4
Sb
2
.61x
10
-3
9.6
4x
10
-3
1.4
8x
10
-3
3.0
5x
10
-3
1.2
2x
10
-3
2.5
9x
10
-3
6.0
5x
10
-3
2.5
4x
10
-2
3.1
3x
10
-3
1.8
3x
10
-3
3.6
2x
10
-3
8.7
0x
10
-4
Ba
1
.21x
10
-2
2.0
9x
10
-3
6.2
7x
10
-3
1.2
0x
10
-2
1.3
9x
10
-2
8.6
9x
10
-3
9.9
3x
10
-3
1.2
0x
10
-4
6.1
7x
10
-3
3.2
7x
10
-3
6.6
0x
10
-3
6.0
8x
10
-3
Pb
6
.43x
10
-3
1.4
8x
10
-2
1.0
6x
10
-3
1.9
4x
10
-2
3.1
3x
10
-3
1.6
3x
10
-3
1.2
0x
10
-2
1.9
0x
10
-3
3.1
2x
10
-3
1.0
2x
10
-2
4.2
3x
10
-5
1.1
4x
10
-3
U
1.0
4x
10
-3
6.5
4x
10
-5
3.9
8x
10
-4
3.2
6x
10
-4
1.0
1x
10
-3
1.0
2x
10
-3
5.8
3x
10
-3
1.5
9x
10
-5
6.1
3x
10
-4
1.1
6x
10
-4
1.3
4x
10
-4
5.2
6x
10
-5
HI
3.1
7x
10
-1
2.8
8x
10
-1
8.3
4x
10
-2
2.2
9x
10
-1
1.0
9x
10
-1
1.6
9x
10
-1
9.2
7x
10
-1
5.2
7x
10
-1
1.9
2x
10
-1
1.0
1x
10
-1
1.0
5x
10
-1
1.5
1x
10
-1
CH
ILD
RE
N
As
2.7
7x
10
-1
1.0
7x
10
-2
7.0
6x
10
-2
1.3
2x
10
-1
5.4
3x
10
-2
1.9
9x
10
-1
3.8
0x
10
-1
2.6
4x
10
-3
1.9
3x
10
-1
1.0
9x
10
-1
1.6
0x
10
-1
2.7
2x
10
-1
Cd
6
.86x
10
-3
4.2
8x
10
-3
3.7
2x
10
-3
1.6
3x
10
-2
7.9
9x
10
-3
7.6
2x
10
-3
2.8
0x
10
-3
6.9
4x
10
-3
1.7
1x
10
-2
7.4
0x
10
-3
6.1
5x
10
-4
2.0
4x
10
-4
Cr
1.9
7x
10
-2
7.2
6x
10
-3
8.2
1x
10
-3
4.4
2x
10
-3
1.9
7x
10
-2
6.7
7x
10
-3
1.1
7x
10
-1
1.5
9x
10
-3
1.0
1x
10
-2
5.8
8x
10
-3
2.0
4x
10
-3
3.6
2x
10
-3
Ni
2.7
2x
10
-3
1.2
4x
10
-3
8.8
4x
10
-4
1.8
2x
10
-3
3.7
0x
10
-3
2.5
9x
10
-3
3.9
4x
10
-3
3.7
6x
10
-3
1.2
4x
10
-3
1.1
9x
10
-3
9.8
1x
10
-4
8.4
1x
10
-4
Hg
6
.79x
10
-4
5.9
7x
10
-4
5.3
2x
10
-4
2.6
4x
10
-4
8.4
4x
10
-4
4.8
3x
10
-4
2.5
5x
10
-3
–
–
–
4.9
5x
10
-4
–

CHAPTER 2
127
Tab
le S
II-5
. In
div
idu
al h
azar
d q
uo
tien
t (H
Q)
for
inge
stio
n p
ath
way
in t
he
Ecu
ado
rian
am
azo
n r
egio
n.
(co
nti
nu
ed)
PO
PU
LA
TIO
N
PA
RA
ME
TE
R
NE
AR
S
EA
R
dee
p w
ell
rain
fall
ri
ver
sh
all
ow
wel
l sp
rin
g
stre
am
sy
stem
ra
infa
ll
river
sp
rin
g
stre
am
sy
stem
CH
ILD
RE
N
Al
1.0
6x
10
-2
3.0
9x
10
-3
6.1
7x
10
-3
1.2
1x
10
-2
3.2
6x
10
-2
1.0
8x
10
-2
1.3
1x
10
+0
0
1.3
0x
10
-3
1.1
0x
10
-2
1.2
6x
10
-2
5.2
0x
10
-4
5.2
8x
10
-3
V
2.4
5x
10
-2
4.7
9x
10
-3
3.2
4x
10
-2
1.1
5x
10
-2
1.7
2x
10
-2
4.2
6x
10
-2
6.6
7x
10
-2
8.3
2x
10
-4
2.8
2x
10
-2
1.2
4x
10
-2
6.6
9x
10
-3
1.5
4x
10
-2
Mn
1
.58x
10
-1
3.6
5x
10
-3
8.1
3x
10
-3
1.5
9x
10
-1
1.5
0x
10
-2
3.9
2x
10
-2
3.0
9x
10
-3
3.6
6x
10
-3
2.7
6x
10
-3
8.5
5x
10
-3
1.9
4x
10
-2
1.2
6x
10
-3
Co
1.1
1x
10
-3
2.0
1x
10
-4
5.2
1x
10
-4
2.8
8x
10
-3
1.5
5x
10
-3
1.8
1x
10
-3
4.3
5x
10
-4
1.6
1x
10
-4
4.2
3x
10
-4
6.2
4x
10
-4
8.9
6x
10
-4
1.4
9x
10
-4
Cu
1
.86x
10
-2
3.6
5x
10
-3
8.6
8x
10
-4
2.1
3x
10
-2
2.5
7x
10
-3
1.7
0x
10
-3
1.6
4x
10
-2
1.4
5x
10
-3
6.1
4x
10
-3
2.0
8x
10
-2
1.2
3x
10
-3
4.8
1x
10
-3
Zn
6
.50x
10
-3
5.2
1x
10
-1
1.7
3x
10
-4
1.6
0x
10
-2
1.8
4x
10
-2
7.1
5x
10
-4
9.1
0x
10
-3
1.0
6x
10
+0
0
1.1
2x
10
-3
2.7
2x
10
-3
6.4
4x
10
-5
1.2
8x
10
-3
Se
3.1
8x
10
-2
5.1
7x
10
-3
6.9
3x
10
-3
2.3
6x
10
-2
8.4
0x
10
-3
5.8
2x
10
-3
4.0
3x
10
-3
5.5
7x
10
-4
1.5
4x
10
-3
5.5
7x
10
-4
1.2
8x
10
-3
5.5
7x
10
-4
Sr
3.3
0x
10
-2
6.1
4x
10
-4
1.1
3x
10
-2
2.0
1x
10
-2
1.1
8x
10
-2
1.2
1x
10
-2
1.0
8x
10
-2
5.3
9x
10
-5
9.0
3x
10
-3
3.8
7x
10
-3
9.3
8x
10
-3
4.2
1x
10
-3
Mo
4
.96x
10
-2
5.5
1x
10
-4
1.0
5x
10
-2
1.2
5x
10
-3
1.3
4x
10
-3
3.7
0x
10
-3
6.2
3x
10
-3
2.4
9x
10
-4
1.0
6x
10
-1
4.6
3x
10
-4
2.3
9x
10
-3
2.4
9x
10
-4
Sb
5
.66x
10
-3
2.0
9x
10
-2
3.2
2x
10
-3
6.6
2x
10
-3
2.6
4x
10
-3
5.6
1x
10
-3
1.3
1x
10
-2
5.5
1x
10
-2
6.7
7x
10
-3
3.9
6x
10
-3
7.8
5x
10
-3
1.8
9x
10
-3
Ba
2
.62x
10
-2
4.5
3x
10
-3
1.3
6x
10
-2
2.6
0x
10
-2
3.0
1x
10
-2
1.8
8x
10
-2
2.1
5x
10
-2
2.6
1x
10
-4
1.3
4x
10
-2
7.0
8x
10
-3
1.4
3x
10
-2
1.3
2x
10
-2
Pb
1
.39x
10
-2
3.2
0x
10
-2
2.3
0x
10
-3
4.2
1x
10
-2
6.7
7x
10
-3
3.5
3x
10
-3
2.6
0x
10
-2
4.1
2x
10
-3
6.7
5x
10
-3
2.2
1x
10
-2
9.1
6x
10
-5
2.4
7x
10
-3
U
2.2
6x
10
-3
1.4
2x
10
-4
8.6
2x
10
-4
7.0
6x
10
-4
2.1
9x
10
-3
2.2
2x
10
-3
1.2
6x
10
-2
3.4
4x
10
-5
1.3
3x
10
-3
2.5
2x
10
-4
2.9
0x
10
-4
1.1
4x
10
-4
HI
6.8
8x
10
-1
6.2
4x
10
-1
1.8
1x
10
-1
4.9
7x
10
-1
2.3
7x
10
-1
3.6
5x
10
-1
2.0
1x
10
0
1.1
4x
10
0
4.1
6x
10
-1
2.1
9x
10
-1
2.2
8x
10
-1
3.2
7x
10
-1
NE
AR
=N
ort
h E
cuad
ori
an A
maz
on
Reg
ion;
SE
AR
= S
outh
Ecu
ado
rian
Am
azo
n R
egio
n.

CHAPTER 2
128
Figure SII-1. Kernel Density Plots for pollution hazard and the different variables in domestic water.

CONCLUSIONS & PERSPECTIVES
129
CONCLUSIONS, RECOMMANDATIONS ET PERSPECTIVES (FR)
Conclusion Générale
L’économie équatorienne est historiquement liée aux cours des différentes matières
premières exportées, au premier rang desquelles figure le pétrole qui représente la moitié de
la valeur des exportations. C’est aujourd’hui 45% du budget général de l’Etat, majoritairement
alloué au remboursement de la dette. L’écrasante majorité des réserves de pétrole se trouve
en Amazonie, dans les provinces de Sucumbíos et d’Orellana. La production nationale de
pétrole représentait en janvier 2012, 15,6 millions de barils dont près de 72% reviennent à
l’entreprise publique Petroecuador. Avec ses géo-ressources, la région amazonienne
représente à elle seule la plus grande part des revenus du pays. Si elle occupe 45% de la
surface territoriale du pays, elle ne compte que 5% de la population équatorienne dont 71%
vivant en situation de pauvreté, contre 45% au niveau national (INEC, 2010).
Or, du fait des activités pétrolières intenses d’extraction ou de raffinage, actuelles et passées
en Equateur, l’environnement des régions amazoniennes d’une part et de la côte Pacifique
d’autre part a souvent été impacté par des contaminations.
En effet, depuis plus de 40 ans, la contamination environnementale due à l’industrie du
pétrole est ponctuelle, accidentelle ou continue, et distribuée sur une grande partie de
l’Amazonie équatorienne, principalement dans la partie nord. Les principales sources de
contamination sont les rejets d’hydrocarbures liquides et d’eaux de formation dans les sols,
les eaux de surface et souterraines ainsi que les rejets gazeux dans l’atmosphère. Les effets
sur l’environnement dépendent des différentes phases d’exploration et d’exploitation, depuis
les études sismiques, les perforations, la production, mais aussi le transport jusqu’au
raffinage. Le procédé d’exploitation pétrolière génère des déchets (boues et liquides)
hautement toxiques qui peuvent être stockés de manière temporaire dans des fosses,
étanches ou non, pour être ensuite brûlés ou réinjectés dans des zones perforées en sous-sol
ou directement rejetées vers les sols et eaux de surface. En particulier, le processus de
production génère des « eaux de formation » qui combinent des quantités élevées de sels, de
métaux lourds et du pétrole « en émulsion ». A cette « contamination routinière »
(Maldonado et Narvaez, 2005) s’ajoutent les fuites liées aux ruptures de canalisations ou aux
dysfonctionnements de puits d’exploitation. Ces accidents restent malheureusement
fréquents, et encore difficiles à maitriser.
Cependant, l’impact réel de ces activités pétrolières sur la qualité des eaux de surface et des

CONCLUSIONS & PERSPECTIVES
130
sédiments associés a longtemps été supposé mais peu d’études ont effectivement évalué ces
effets, et les conséquences induites sur la santé des populations, dans un pays où les difficultés
sociales et sanitaires restent importantes. En effet, les déchets du pétrole contiennent
principalement des métaux et métalloïdes co-émis avec des HAPs, et tout aussi toxiques pour
l'Homme et l'envir onnement. Etant donné qu’ils peuvent être facilement transférés dans les
eaux, leur quantification dans les principaux cours d’eau et les eaux de consommation semble
essentielle.
Ainsi, les deux principaux objectifs de notre étude étaient :
1. Évaluer les niveaux de contamination en HAPs -comme principaux polluants de
l’activité pétrolières – et leur distribution dans les principaux bassins versants
Amazoniens et de la côte Pacifique au Nord (régions NEPC et NEAR impactées par les
activités pétrolières) et au Sud du pays (SEAR et SEPC, répertoriées comme zone
contrôle), afin de déterminer la qualité environnementale des eaux (phase dissoute et
particulaire, mais aussi sédiments) des rivières situées en zone d’exploitation
pétrolière et de raffinage mais aussi les risques impliqués pour la santé humaine,
2. Estimer la qualité sanitaire (liée au potentiel cocktail de métaux, métalloïdes et HAPs)
des eaux de consommation, en comparaison aux normes de potabilité en vigueur
dans le monde, dans un pays où l’accès à la ressource en eau reste très inégalitaire.
L’idée étant toujours de comparer nos zones a priori impactées par les activités extractives ou
de raffinage à des zones jugées comme « témoins », car exemptes d’activités pétrolières.
A cela s’ajoutaient des sous-objectifs d’identification des sources des contaminants
organiques et métalliques dans les eaux de consommation et de traçage du devenir des HAPs
dans les eaux de surface. Nous avions également pour objectif de comparer les résultats
obtenus avec les normes nationales et internationales de protection de l’environnement mais
aussi de calculer des indices de risque sanitaire pour les éléments cancérigènes et non
cancérigènes mesurés dans les eaux de consommation. Enfin, comme ce projet s’inscrit dans
une démarche sociale d’amélioration et de développement dans un pays largement impacté,
il nous tenait à cœur de pouvoir proposer des recommandations pour réduire le risque
d’exposition des populations locales.
Plusieurs méthodes analytiques biogéochimiques, impliquant des analyses de molécules
organiques comme de métaux lourds, ainsi qu'une approche sociologique, ont été combinées
dans le cadre du programme de recherche interdisciplinaire ANR MONOIL dans lequel s’inscrit
pleinement cette thèse. Au total 160 échantillons d’eau et 90 de sédiments ont été analysés,

CONCLUSIONS & PERSPECTIVES
131
dont 60% utilisés par les populations locales dans leurs activités quotidiennes.
L’échantillonnage a été réalisé sur plusieurs années consécutives (2012-2016, dont 3
campagnes de terrain réalisées au cours de cette thèse), en saison sèche et saison humide,
depuis le piémont andin jusqu’à la frontière péruvienne, et le long du bassin de la rivière
Teaone jusqu'à l'embouchure de la rivière Esmeraldas dans l'océan Pacifique. Un contrôle de
la qualité chimique a également été réalisé dans la partie sud du bassin, sur des tributaires
non affectés par des activités extractives (minières ou pétrolières).
Les principaux résultats de cette recherche concernent alors la distribution des HAPs dans les
eaux de surface et les sédiments, mais aussi la qualité sanitaire des eaux de consommation
dans les zones impactées par les activités pétrolières.
- Pour les teneurs en HAPs dans les eaux de surface et les sédiments :
Comme des valeurs non importantes se sont manifestées en aval de la pollution ponctuelle,
sauf dans les échantillons les plus proches (< 1 km), on peut affirmer que les processus de
production et de raffinage du pétrole ne sont pas des sources importantes de contamination
ni sur la côte Pacifique ni dans la région Amazonienne. Étant donné que les résultats de la
présente étude (phase dissoute) sont similaires aux valeurs observées dans les villes ayant
certaines activités industrielles, agricoles et urbaines, nous affirmons que même avec
seulement 5% de la population équatorienne vivant dans la région amazonienne, non
seulement les processus pétroliers, mais aussi les activités urbaines et l'agriculture locale
contribuent à la présence des HAP dans la phase dissoute. D'autre part, sur la côte Pacifique,
la raffinerie d'Esmeraldas représente la principale source de pollution des eaux de surface, à
moins de 1 km des effluents affectant la rivière Teaone, mais pas la rivière Esmeraldas, dont
les valeurs restent similaires en amont et en aval du confluent avec la rivière Teaone. Cela a
été confirmé par l'analyse hiérarchique des grappes appliquée à la phase sédimentaire, où la
plupart des lieux analysés ne sont pas directement influencés par le pétrole brut frais, mais
par des déchets anciens ou similaires au fond géochimique (sable bitumineux). HCA a montré
différentes associations avec les principaux sites peuplés et les sites agricoles qui nécessitent
une analyse plus approfondie afin de caractériser ces origines. Les efforts locaux visant à
améliorer la qualité de l'environnement devraient se refléter dans les futures études sur la
pollution locale dans les zones de raffinage équatoriennes.
Des quotients comme mPELQ et mERMQ étaient précis pour déterminer le risque
environnemental, puisqu'une échelle est proposée. Mais un risque complet de danger pour
l'homme basé sur les concentrations de sédiments pourrait aider à mieux comprendre le

CONCLUSIONS & PERSPECTIVES
132
risque pour les populations locales qui sont habituées à nager et à pêcher dans les rivières
étudiées.
- Pour la qualité sanitaire des eaux de consommation :
Aucune pollution par les hydrocarbures pétroliers les plus courants n’a été constatée dans les
échantillons d’eau de consommation de notre étude. La principale préoccupation en lien avec
les activités pétrolières et mise en évidence dans certaines sources d’eau potable est le
toluène, ainsi que des concentrations totales élevées en méthylnaphtalène mesurées dans
plusieurs puits profonds de la communauté de San Carlos (situés à proximité des camps
pétroliers gérés par la société Rio Napo), sans toutefois dépasser les directives nationales et
internationales.
Dans l’ensemble de la région amazonienne et le long de la côte du Pacifique, les
approvisionnements en eau étudiés présentaient de très faibles niveaux de minéralisation,
jusqu’à 10 à 100 fois inférieures aux concentrations minimales recommandées par l’OMS
(OMS, 2006), à quelques exceptions près dans les puits profonds. Si des concentrations
élevées en certains éléments majeurs peuvent affecter la santé humaine, les eaux acides et/ou
faiblement minéralisées sont également à surveiller pour garantir la santé des habitants. Un
pH acide peut accélérer la lixiviation des métaux toxiques et d’autres éléments toxiques
présents dans les réseaux de distribution de l’eau et aussi en modifier le goût. En outre, le
manque de minéraux peut avoir des effets néfastes directs sur la santé. Un autre problème lié
à l'utilisation domestique régulière d'eau peu minéralisée est la perte de minéraux essentiels
contenus dans les aliments pendant la cuisson, principalement le magnésium et la calcium et,
dans une moindre mesure, les microéléments essentiels (Cu, Mn et Co). Un régime alimentaire
peu diversifié du fait de conditions de vie précaires et de l'utilisation domestique d'eau
déminéralisée ne pourrait alors pas fournir tous les éléments essentiels en quantité suffisante
aux populations locales.
Par ailleurs, bien que les eaux investiguées restent conformes aux restrictions en lien avec leur
consommation, notre étude a mis en évidence des limitations dans les normes en vigueur et
leur évolution dans le temps. En effet, nous avons montré qu’au cours de la dernière décennie,
la réglementation équatorienne (via INEN et TULSMA) a non seulement réduit le nombre de
paramètres de contrôle, mais a également proposé des valeurs moins restrictives sans tenir
compte des recommandations internationales. Les réglementations internationales, reposant
sur des études épidémiologiques et d’évaluation des risques, apparaissent donc comme des
références plus adéquates pour la qualité de l’eau à des fins de consommation. Néanmoins,

CONCLUSIONS & PERSPECTIVES
133
les seuils établis ne tiennent pas compte des effets « cocktail » de polluants, ni de l’exposition
chronique et des effets éventuels à plus long terme.
Finalement, cette étude a montré que les conditions de vie précaires pourraient avoir plus de
répercussions sur la santé que l'exposition à une eau impactée par les activités pétrolières
environnantes, en Amazonie Equatorienne. Par ailleurs, la perception du risque prend ici tout
son sens… les populations se tournent vers certains réseaux d’approvisionnements pour éviter
des eaux qu’ils jugent a priori contaminées, sans aucune certitude scientifique…
Jusqu'à présent, en l’absence d’une reconnaissance satisfaisante des impacts historiques des
activités pétrolières en Equateur, les habitants de l’Amazonie cristallisent leurs problèmes sur
les entreprises pétrolières en ignorant ainsi d'autres sources de contamination et d’impacts
sanitaires possibles, telles que les pratiques agricoles ou le manque de traitement de l'eau.
Enfin, les principaux résultats de cette thèse ont déjà été largement communiqués auprès de
populations locales, notamment via les colloques de restitution du programme MONOIL
réalisés à Quito mais aussi dans les différentes provinces où ont eu lieu les échantillonnages
d’eaux (surface et consommation) et sédiments. Notre objectif était un transfert des données
acquises vers les populations, sous des formes vulgarisées et percutantes, dans le simple
objectif d’éveiller la connaissance des habitants et de leur éviter de faire certains choix par
dépit ou simple ignorance des enjeux sanitaires et environnementaux.
Recommandations et perspectives
D’un point de vue environnemental, la distribution des polluants proposée dans le Chapitre 1
ne considère que les molécules organiques HAPs. Malheureusement, par manque de temps,
les résultats des composés métalliques dans les eaux de surface et les sédiments des zones
d'étude n’ont pas pu être intégrés dans ce travail de thèse, mais les données en cours de
traitement sont prometteuses. Les résultats montrent notamment des contaminations de ces
eaux en métaux lourds très localisées et sur de petits tronçons : au pied de plates-formes
pétrolières qui fuient ou de piscines non remédiées ou en voie de remédiation. Si l’on se réfère
aux normes nationales et internationales de potabilité, ces points de contamination
n’affectent pas la qualité des rivières à l’échelle du bassin versant. Cependant, de fortes
teneurs en sodium, chlorures (et HAP comme évoqué précédemment) ont été mesurées dans
les eaux de certains puits profonds (> 8 m), mettant en évidence un mélange d’eaux
souterraines naturelles avec des rejets d’eaux de formation, caractérisées par de fortes

CONCLUSIONS & PERSPECTIVES
134
teneurs en sels et en hydrocarbures.
D’un point de vue sanitaire, l’étude des eaux de consommation dans le pays a montré que la
principale recommandation à apporter à la population est de saler l’eau utilisée pour la
cuisine, afin de garantir des apports satisfaisants en sels minéraux essentiels au bon
développement des personnes. Avant la consommation, il semble primordial également de
désinfecter ou de faire bouillir toutes les sources d’eau de la région amazonienne avant de les
utiliser. Au niveau national, les politiques publiques devraient s’attaquer à ce problème en
étendant les systèmes d’approvisionnement en eau potable et de traitement des eaux usées
des zones rurales aux communautés vivant dans des régions reculées de la région
amazonienne.
En termes de risques potentiellement associés à la présence, même en faible quantité de
métaux lourds et métalloïdes dans les eaux de surface et les sédiments, une première
évaluation quantitative des risques sanitaires sera proposée dans une étude à venir.
Par ailleurs, il est important de noter que la législation en termes d’éléments contaminants
propose des valeurs seuils de risque par élément (organique ou inorganique) sans prendre en
compte les risques sanitaires liés à l’effet cumulé de ces contaminants. Il serait alors judicieux
de pouvoir en tenir compte par la suite afin d'évaluer les impacts potentiels combinés de ces
composés sur la santé humaine.
Par la suite, nous envisageons aussi de réaliser une évaluation sanitaire des risques encourus
par les populations en intégrant tous les facteurs de risques mais aussi en prenant en compte
l’ensemble des voies d’exposition (inhalation, ingestion et contact cutané), ce qui suggère un
état des lieux très détaillé des régimes alimentaires, des habitudes de vie, des expositions
selon le genre, l’âge, l’origine et les prédispositions sociales, etc.
Il est également conseillé aux habitants de sélectionner leurs voies d’approvisionnement en
eau de consommation, lorsqu’ils en ont la possibilité. Les populations locales vivant dans des
zones touchées par les activités pétrolières subissent encore la prise en compte insuffisante
des impacts historiques de l'exploitation pétrolière par l'État équatorien, ce qui confirme que
les informations peuvent être considérées comme une sorte de pouvoir qui devrait être
partagé. Un travail sociétal conséquent est ici à développer afin que la perception du risque,
parfois erronée, ne conduise pas à des mises en danger supplémentaire, par manque de
confiance dans les entreprises pétrolières et leurs agissements. Cette donnée concernant la
perception du risque a fait l’objet d’étude approfondies, notamment via le volet sociétal du
programme MONOIL, et dont la confrontation avec nos données a permis de mieux

CONCLUSIONS & PERSPECTIVES
135
comprendre les habitudes et modes de vie, souvent à l’origine d’une exposition inconsciente
et finalement plus forte.
Cette perception du risque et les interactions avec les sciences sociales au cours de cette thèse
ont mis en évidence l’intérêt majeur de l’interdisciplinarité dans ce type de préoccupation
environnementale et sanitaire, et ses atouts pour ouvrir un nouveau champ des possibles dans
le traitement et la mise en commun des données scientifiques sur une même zone d’étude.
Enfin, le cas de l’Equateur, largement étudié dans cette thèse mais aussi à travers tout le
programme MONOIL, pourra être transposé à des pays voisins ou des sociétés similaires,
subissant les mêmes dommages historiques des activités extractives, pétrolières ou minières,
et partageant les mêmes espoirs de remédiation.

CONCLUSIONS & PERSPECTIVES
136
CONCLUSIONS, RECOMMENDATIONS AND PERSPECTIVES (EN)
General Conclusion
Ecuadorian economy is historically linked to the incomes of various exported raw materials,
with oil being the most important, accounting for half of the exported products. Today, oil
economy represents 45% of the general budget of Ecuador, whereas most of which is
allocated to debt payment. The majority of oil reserves are located in the Amazon Region, and
more precisely in the Sucumbíos and Orellana provinces. In January 2012, national oil
production represented 15.6 million barrels, nearly 72% corresponding the state-owned
Petroecuador. With its geo-resources, the Amazon region alone accounts for the largest share
of the country's income. Even if Amazon region occupies 45% of the country's territorial area,
it accounts for only 5% of the Ecuadorian population (of which 71% are living in poverty,
compared to 45% at the national level, INEC, 2010). Due to current and past intense-oil
activities (extraction and refining) in Ecuador, the environment of the Amazon regions on the
one hand and the Pacific coast on the other has often been affected by contamination.
Actually, for over 40 years, environmental contamination caused by oil industry has been
punctual, accidental or continuous, and distributed over a large part of the Ecuadorian
Amazon, mainly in the northern part of the country. The main sources of contamination are
the discharges of liquid hydrocarbons and formation water into soils, surface and
groundwaters; as well as gaseous discharges into the atmosphere. The environmental effects
are related to the different phases of exploration and exploitation of petroleum; from seismic
exploration, perforation, production, to transport and refining. The oil industry process
generates highly toxic waste (sludge and liquids) that can be temporarily stored in pits, sealed
or not, and then burned or re-injected into perforated areas underground or directly
discharged into soil and surface water. In particular, extraction process generates "formation
waters" that contain high quantities of salts, heavy metals and oil in "emulsion". In addition
to this daily contamination (Maldonado and Narvaez, 2005), there are leaks related to pipe
breaks or malfunctions in operating wells. Unfortunately, these accidents are still frequent
and difficult to control.
Even though the real impact of these oil activities on the quality of surface waters and
sediments has long been assumed, few studies have really assessed these impacts and their
consequences on local human populations, in a country where social and health difficulties
remain significant. Oil waste mainly contains metals and metalloids co-emitted with PAHs, also

CONCLUSIONS & PERSPECTIVES
137
toxic for humans and the environment. Since these contaminants can be easily transferred to
water, their quantification in major rivers and drinking waters seems essential.
Thus, the two main objectives of our study were:
1. To assess the contamination level of PAHs as the main pollutants of oil activity, and
their distribution in the main rivers from the Amazon and Pacific coast in the North
(NEPC and NEAR regions affected by oil activities) and in the South of the country (SEAR
and SEPC, listed as control areas), in order to determine the environmental quality of
water (dissolved phase, but also sediments) in rivers located in extraction and refining
areas, but also the risks involved for human health;
2. To assess the health quality (related to the potential cocktail of metals, metalloids and
PAHs) of drinking waters, by comparison with guidelines currently used worldwide,
in a country where access to water resources remains highly inequitable.
The main purpose of this manuscript was then to compare our areas supposed to be impacted
by extraction or refining activities with areas considered as "control", as they are free of oil
activities.
In addition, some specific objectives were proposed for identifying the sources of organic and
metallic contaminants in drinking water and for tracing the fate of PAHs in surface water. We
also aimed to compare the results obtained with national and international environmental
protection standards and to calculate health risk indices for carcinogenic and non-carcinogenic
elements measured in drinking water. Finally, as this project is included in a larger program
(ANR MONOIL) with a strong social dimension of improvement and development in a country
widely impacted, we have also planned to propose recommendations to reduce the risk of
exposure of local populations.
Several biogeochemical methods, involving analyses of organic molecules and heavy metals,
as well as a sociological approach, have been combined within the framework of the
interdisciplinary research program ANR MONOIL, in which this thesis is fully integrated. A total
of 160 water samples and 90 sediment samples were analyzed, 60% of water samples belongs
to sources widely used by local populations in their daily activities. Sampling was carried out
over several consecutive years (2012-2016, including 3 field campaigns), in both the dry and
wet seasons, from the Andean foothills to the Peruvian border; and along the Teaone River to
the mouth of the Esmeraldas River in the Pacific Coast. A chemical monitoring of the
environmental quality was also performed in the southern part of the basin, on areas not
affected by (mining or oil) extractive activities.

CONCLUSIONS & PERSPECTIVES
138
The main results of this research focused on the distribution of PAHs in surface waters and
sediments, but also on the health quality of drinking water in areas impacted by oil activities.
- For PAH contents in surface waters and sediments:
Since not important values were manifested downstream of punctual pollution, except in the
closer samples (< 1km); we can affirm that oil production and refining processes are not
important sources of contamination neither in the Pacific Coast nor in the Amazon Region.
Since results in the present study (dissolved phase) are similar to values found in cities with
some industrial, agricultural and urban activities, we claim that even with only 5% of the
Ecuadorian population living in the Amazon region, not only oil processes, but also urban
activities altogether with local agriculture contribute to the presence of PAHs in the dissolved
phase. On the other hand, in the Pacific Coast, the Esmeraldas Refinery represents the main
source of surface water pollution, within 1 km from the effluents affecting the Teaone River,
but not the Esmeraldas River, whose values remain similar upstream and downstream the
confluence with the Teaone River. It was confirmed by the hierarchical cluster analysis applied
to the sedimentary phase, where most of the analyzed places are not directly influenced by
fresh crude oil, but by ancient waste or similar to the geochemical background (bituminous
sands). HCA showed different associations with the main populated sites and agricultural
emplacements that need an deeper analysis in order to characterize these origins. Local
efforts to improve environmental quality should be reflected in future studies about local
pollution in Refining Ecuadorian zones.
Quotients like mPELQ and mERMQ were accurate for determining the environmental risk,
since a scale is proposed. But a complete human hazard risk based in sediments
concentrations could help to better understand the risk to local populations that are
accustomed swim and fish in the studied rivers.
- For drinking water quality:
No pollution by the most common hydrocarbons was found in the drinking water samples
collected for this study. The main concern related to oil activities and identified in some
drinking water sources is toluene, as well as high total methylnaphthalene concentrations
measured in several deep wells in the San Carlos community (located near the oil camps
managed by Rio Napo), but not exceeding national and international guidelines.
Across the Amazon region and along the Pacific coast, the water supplies studied had very low
levels of mineralization, about 10 to 100 times below the minimum concentrations
recommended by WHO (WHO, 2006), with a few exceptions in deep wells. Not only high

CONCLUSIONS & PERSPECTIVES
139
concentrations of some major elements can affect human health; acid and/or low mineralized
waters should also be monitored to ensure the health of residents, as well. An acidic pH can
for example accelerate the leaching of toxic metals and other toxic elements from water
distribution systems changing their taste. In addition, lack of minerals can have direct
detrimental effects on human health. Another problem related to the regular domestic use of
low mineralized water is the loss of essential minerals contained in food during cooking,
mainly magnesium and calcium and, to a lesser extent, essential microelements (Cu, Mn and
Co). A poorly diversified diet due to precarious living conditions and the domestic use of
demineralized water would then not be able to provide all the essential elements in sufficient
quantities to local populations.
Moreover, although the waters investigated remain in compliance with the regulatory
restrictions related to their consumption, our study highlighted limitations in the current
standards and their evolution over time. Indeed, we have shown that over the last decade,
Ecuadorian regulations (INEN and TULSMA) have not only reduced the number of control
parameters, but have also proposed less restrictive values without taking into account
international recommendations. International regulations based on epidemiological and risk
assessment studies appear to be more appropriate references for controlling the quality of
water for human consumption; nevertheless, these thresholds do not take into account the
"cocktail effect" of pollutants, the chronic exposure and the potential long-term effects.
Finally, this study showed that precarious living conditions could have more impact on health
than exposure to water impacted by surrounding oil activities in Ecuador. Moreover, the
perception of risk takes here a high importance... people often avoid some water supply
networks as they consider them as contaminated a priori, without any scientific
demonstration...
So far, in the absence of a satisfactory recognition of the historical impacts of oil activities in
Ecuador, Amazon people are crystallizing their problems on oil companies, thus in this way,
they ignore other sources of contamination and possible health impacts, such as agricultural
practices or lack of water treatment.
Finally, the main results of this thesis have already been widely communicated to local
populations, in particular through the restitution conference of the MONOIL program held in
Quito but also in the various provinces where surface and drinking water as well as sediment
samplings took place. Our objective was to transfer the acquired data to the local populations,
in popularized and powerful forms, with the simple objective of awakening the knowledge of

CONCLUSIONS & PERSPECTIVES
140
the inhabitants and avoiding them to make some choices out of spite or for lack of information
about the health and environmental issues.
Recommendations and perspectives
From an environmental point of view, the distribution of pollutants proposed in Chapter 1
only considers organic PAH molecules. Unfortunately, due to time constraints, the results of
metallic compounds in surface waters and sediments in the studied areas could not be
integrated into this thesis work, but the data being processed are promising. The results show
in particular a contamination of these waters with very localized heavy metals and on small
sections: at the foot of leaking oil platforms or pools that are not remedied or are being
remedied. According to national and international drinking water standards, these
contamination points do not affect the quality of rivers at the scale of the catchment area.
However, high levels of sodium, chlorides (and PAHs as mentioned above) have been
measured in the waters from some deep wells (> 8 m), showing a mixture of natural
groundwater with formation water discharges, characterized by high salt and hydrocarbon
contents.
From a health point of view, the study of drinking water in this country has shown that the
main recommendation to be made to the population is to salt the water used for cooking, in
order to guarantee supplies of mineral salts essential for the proper development of people.
Before consumption, it also seems essential to disinfect or boil water whatever the sources in
the Amazon region before using them. At the national level, public policies should address this
problem by extending rural drinking water supply and wastewater treatment systems to
communities in remote areas of the Amazon region.
In terms of risks potentially associated to the presence, even in small quantities, of heavy
metals and metalloids in surface waters and sediments, a first quantitative assessment of
health risks will be proposed in a future study.
In addition, it is important to note that legislation in terms of contaminants proposes
threshold risk values per element (organic or inorganic) without taking into account the health
risks associated with the cumulative effect of these contaminants. It would then be
appropriate to be able to take them into account later in order to assess the combined
potential impacts of these compounds on human health.
Subsequently, we also propose to carry out a health assessment of the risks incurred by

CONCLUSIONS & PERSPECTIVES
141
populations by integrating all risk factors but also by taking into account all exposure routes
(inhalation, ingestion and dermal contact), which suggests a very detailed inventory of diets,
lifestyle habits, exposures by gender, age, origin and social predispositions, etc.
Residents are also advised to select their drinking-water supply sources, where they have the
opportunity to do so. Local populations living in areas affected by oil activities still suffer from
insufficient attention of the historical impacts of oil exploitation by the Ecuadorian State,
which confirms that information can be considered as a kind of power that should be shared.
A substantial amount of societal work needs to be developed here so that the sometimes
erroneous perception of risk does not lead to additional threats, due to a lack of confidence
in oil companies and their actions. This data on risk perception has been the subject of in-
depth studies, particularly via the societal component of the MONOIL program, whose
comparison with our data has made it possible to better understand habits and lifestyles,
often at the origin of unconscious and ultimately higher exposure. This perception of risk and
the interactions with the social sciences during this manuscript highlighted the major interest
of “interdisciplinarity” in this kind of environmental and health research, and its advantages
in opening up a new field of possibilities in the processing and sharing of scientific data in the
same study area.
Finally, the case of Ecuador, which is widely studied in this thesis but also throughout the
MONOIL program, could be transposed to neighboring countries or similar social groups
suffering the same historical damage from oil extraction or mining activities, and sharing the
same hopes of remediation.

LIMITATIONS
142
LIMITATIONS
1- One of the main difficulties found during the development of this project was the
impossibility to find a non-anthropized zone. Areas considered as reference (geochemical
background) showed concentrations similar to the anthropized areas.
2-The distance between the different sampling points generates the problem of
homogenization in the specialization of the sites, since the points considered in this study are
extremely distant from each other (some kilometers) with important different characteristics
(Andean foothills and amazon lowland).
3-Sediments are considered as excellent tracers of historic pollution, but scraping the 2
centimeters of the first sedimentary layer is not enough to characterize the contaminating
history of oil activities. In addition to not knowing the dynamics of pollutant degradation, the
sedimentation velocity cannot be defined (hydrological dynamics of each sampling site).
4-The relative abundance of PAHs in sediments is considered non-variable with time in
samples from the same source. So, ancient samples polluted by petrol can present different
PAHs distribution than recently polluted sites, causing a misinterpretation of the PAH-
distribution patterns.
BIBLIOGRAPHY
143
BIBLIOGRAPHY
Abdel-Raouf, M.E.-S. (Ed.), 2012. Crude Oil Emulsions- Composition Stability and Characterization. InTech, Egyptian Petroleum Research Institute, Egypt. https://doi.org/10.5772/2677
Abdel-Shafy, H.I., Mansour, M.S.M., 2016. A review on polycyclic aromatic hydrocarbons: Source, environmental impact, effect on human health and remediation. Egypt. J. Pet. 25, 107–123. https://doi.org/10.1016/j.ejpe.2015.03.011
AC, 2008. RO No 449 Constitucion de la Republica del Ecuador, R. O. No. 449.
Acosta, A., 2006. Breve historia económica del Ecuador. Corporación Editora Nacional, Quito.
Agency for Toxic Substances & Disease Registry (ATSDR), 2007. Priority List of Hazardous Substances [WWW Document]. Subst. Prior. List SPL Resour. Page. URL https://www.atsdr.cdc.gov/spl/previous/07list.html (accessed 6.8.18).
Al-Agroudy, N., Soliman, Y.A., Hamed, M.A., Zaghloul, G.Y., 2017. Distribution of PAHs in Water, Sediments Samples of Suez Canal During 2011. J. Aquat. Pollut. Toxicol. 1.
Amiard, J.C., 2017. Les risques chimiques environnementaux: méthodes d’évaluation et impacts sur les organismes, 2nd ed. Tec & Doc Lavoisier, Paris, France.
Andersson, J.T., Achten, C., 2015. Time to Say Goodbye to the 16 EPA PAHs? Toward an Up-to-Date Use of PACs for Environmental Purposes. Polycycl. Aromat. Compd. 35, 330–354. https://doi.org/10.1080/10406638.2014.991042
Andrade, J., 2008. Ecuador Terra Incognita - Juicio a Texaco.
ANR, 2013. Projet ANR Monitoring environnemental, santé, société et pétrole en Equateur [WWW Document]. ANR. URL http://www.agence-nationale-recherche.fr/projet-anr/?tx_lwmsuivibilan_pi2[CODE]=ANR-13-SENV-0003 (accessed 7.19.18).
Anses, 2018. Toxicity reference values (TRVs) [WWW Document]. URL https://www.anses.fr/en/content/toxicity-reference-values-trvs (accessed 11.16.18).
Arana, A., Arellano, F., 2007. Cancer incidence near oilfields in the Amazon basin of Ecuador revisited. Occup. Environ. Med. 64, 490.
Armijos, E., Laraque, A., Barba, S., Bourrel, L., Ceron, C., Lagane, C., Magat, P., Moquet, J.S., Pombosa, R., Sondag, F., Vauchel, P., Vera, A., Guyot, J.L., 2013. Yields of suspended sediment and dissolved solids from the Andean basins of Ecuador. Hydrol. Sci. J. 58, 1478–1494. https://doi.org/10.1080/02626667.2013.826359
Auyero, J., Swistun, D., 2007. Confused because exposed: Towards an ethnography of environmental suffering. Ethnography 8, 123–144. https://doi.org/10.1177/1466138107078630
Avellaneda, A., 2005. Petróleo, seguridad ambiental y exploración petrolera marina en Colombia. Iconos 11–17.
Baby, P., Rivadeneira, M., Barragan, R. (Eds.), 2014. La Cuenca Oriente: Geología y Petróleo.
Baird, S.J.S., Bailey, E.A., Vorhees, D.J., 2007. Evaluating Human Risk from Exposure to Alkylated PAHs in an Aquatic System. Hum. Ecol. Risk Assess. Int. J. 13, 322–338. https://doi.org/10.1080/10807030701226277
Banco Central del Ecuador (BCE), 2010. La Economía Ecuatoriana Luego de 10 Años de Dolarización [WWW Document]. URL https://contenido.bce.fin.ec/documentos/PublicacionesNotas/Notas/Dolarizacion/Dolarizacion10anios.pdf (accessed 6.7.18).
Barraza, F., Maurice, L., Uzu, G., Becerra, S., López, F., Ochoa-Herrera, V., Ruales, J., Schreck, E., 2018. Distribution, contents and health risk assessment of metal(loid)s in small-scale farms in the Ecuadorian Amazon: An insight into impacts of oil activities. Sci. Total Environ. 622–623, 106–120. https://doi.org/10.1016/j.scitotenv.2017.11.246

BIBLIOGRAPHY
144
Baskaran, M. (Ed.), 2012. Handbook of Environmental Isotope Geochemistry. Springer Berlin Heidelberg, Berlin, Heidelberg. https://doi.org/10.1007/978-3-642-10637-8
Bass, M.S., Finer, M., Jenkins, C.N., Kreft, H., Cisneros-Heredia, D.F., McCracken, S.F., Pitman, N.C.A., English, P.H., Swing, K., Villa, G., Di Fiore, A., Voigt, C.C., Kunz, T.H., 2010. Global Conservation Significance of Ecuador’s Yasuní National Park. PLoS ONE 5, e8767. https://doi.org/10.1371/journal.pone.0008767
Baynard, C.W., Ellis, J.M., Davis, H., 2013. Roads, petroleum and accessibility: the case of eastern Ecuador. GeoJournal 78, 675–695. https://doi.org/10.1007/s10708-012-9459-5
BBC Press, 2018. Ecuador loses Chevron pollution case.
BCE, 2018. REPORTE DEL SECTOR PETROLERO. IV trimestre de 2017.
BCE, 1990. La actividad petrolera en el Ecuador en la década de los 80. Banco Central del Ecuador.
Becerra, S., Saqalli, M., Gangneron, F., Dia, A.H., 2016. Everyday vulnerabilities and “social dispositions” in the Malian Sahel, an indication for evaluating future adaptability to water crises? Reg. Environ. Change 16, 1253–1265. https://doi.org/10.1007/s10113-015-0845-7
Béguet, E., 2015. « Del monte, del campo, o del pueblo ? » : subsister en zone pétrolière chez les Shuar d’Amazonie équatorienne. Université Paris Ouest Nanterre la Défense, Paris, France.
Benlahcen, K.T., Chaoui, A., Budzinski, H., Bellocq, J., Garrigues, P., 1997. Distribution and sources of polycyclic aromatic hydrocarbons in some Mediterranean coastal sediments. Mar. Pollut. Bull. 34, 298–305. https://doi.org/10.1016/S0025-326X(96)00098-7
Bissardon, P., Becerra, S., Maurice, L., 2013a. The health risk linked to oil activities in the Ecuadorian Amazon: From alerts to decisions. Environ. Risques Sante 12, 338–344. https://doi.org/10.1684/ers.2013.0627
Bissardon, P., Becerra, S., Maurice, L., 2013b. The health risk linked to oil activities in the Ecuadorian Amazon: From alerts to decisions. Environ. Risques Santé 338–344. https://doi.org/10.1684/ers.2013.0627
Boehler, S., Strecker, R., Heinrich, P., Prochazka, E., Northcott, G.L., Ataria, J.M., Leusch, F.D.L., Braunbeck, T., Tremblay, L.A., 2017. Assessment of urban stream sediment pollutants entering estuaries using chemical analysis and multiple bioassays to characterise biological activities. Sci. Total Environ. 593–594, 498–507. https://doi.org/10.1016/j.scitotenv.2017.03.209
Bojes, H.K., Pope, P.G., 2007. Characterization of EPA’s 16 priority pollutant polycyclic aromatic hydrocarbons (PAHs) in tank bottom solids and associated contaminated soils at oil exploration and production sites in Texas. Regul. Toxicol. Pharmacol. 47, 288–295. https://doi.org/10.1016/j.yrtph.2006.11.007
Bouchard, M.F., Sauvé, S., Barbeau, B., Legrand, M., Brodeur, M.-È., Bouffard, T., Limoges, E., Bellinger, D.C., Mergler, D., 2011. Intellectual Impairment in School-Age Children Exposed to Manganese from Drinking Water. Environ. Health Perspect. 119, 138–143. https://doi.org/10.1289/ehp.1002321
Brunet, J., 2006. Synthèse bibliographique sur l’élimination du manganèse dans les eaux d’origine minière (No. BRGM/RP-54479-FR). Bureau de Recherches Géologiques et Minières (BRGM), France.
Buccina, S., Chene, D., Gramlich, J., 2013. Accounting for the environmental impacts of Texaco’s operations in Ecuador: Chevron’s contingent environmental liability disclosures. Account. Forum 37, 110–123. https://doi.org/10.1016/j.accfor.2013.04.003
Buckalew, J., James, M., Scott, L., Reed, P., 1998. Water resources assessment of Ecuador. US Army Corps of Engineers, Washington, DC.
Budzinski, H., Garrigues, P., Connan, J., Devillers, J., Domine, D., Radke, M., Oudins, J.L., 1995. Alkylated phenanthrene distributions as maturity and origin indicators in crude oils and rock extracts. Geochim. Cosmochim. Acta 59, 2043–2056. https://doi.org/10.1016/0016-7037(95)00125-5

BIBLIOGRAPHY
145
Budzinski, H., Jones, I., Bellocq, J., Piérard, C., Garrigues, P., 1997. Evaluation of sediment contamination by polycyclic aromatic hydrocarbons in the Gironde estuary. Mar. Chem. 58, 85–97. https://doi.org/10.1016/S0304-4203(97)00028-5
Bundschuh, J., Litter, M.I., Parvez, F., Román-Ross, G., Nicolli, H.B., Jean, J.-S., Liu, C.-W., López, D., Armienta, M.A., Guilherme, L.R.G., Cuevas, A.G., Cornejo, L., Cumbal, L., Toujaguez, R., 2012. One century of arsenic exposure in Latin America: A review of history and occurrence from 14 countries. Sci. Total Environ. 429, 2–35. https://doi.org/10.1016/j.scitotenv.2011.06.024
Burton, Jr., G.A., 2002. Sediment quality criteria in use around the world. Limnology 3, 65–76. https://doi.org/10.1007/s102010200008
Bustamante, T., Jarrín, M., 2005. Impactos sociales de la actividad petrolera en Ecuador: un análisis de los indicadores. Iconos 21, 19–34. https://doi.org/10.17141/iconos.21.2005.77.
Cadot, E., V, B., Rousseau, M., Sebag, D., 2016. Impact environnemental de la diffusion de produits phytosanitaires par ruissellement : deux exemples contrastés en Europe et en Afrique. Dyn. Environnementales 182–198.
Calderón, Á., Dini, M., Stumpo, G. (Eds.), 2016. Los desafíos del Ecuador para el cambio estructural con inclusión social, Documentos de Proyectos, Estudios e Investigaciones. Comisión Económica para América Latina y el Caribe (CEPAL), Santiago, Chile.
Callahan, M.A., Sexton, K., 2007. If Cumulative Risk Assessment Is the Answer, What Is the Question? Environ. Health Perspect. 115, 799–806. https://doi.org/10.1289/ehp.9330
Casal, C.S., Arbilla, G., Corrêa, S.M., 2014. Alkyl polycyclic aromatic hydrocarbons emissions in diesel/biodiesel exhaust. Atmos. Environ. 96, 107–116. https://doi.org/10.1016/j.atmosenv.2014.07.028
Cavalcante, R.M., Sousa, F.W., Nascimento, R.F., Silveira, E.R., Freire, G.S.S., 2009. The impact of urbanization on tropical mangroves (Fortaleza, Brazil): Evidence from PAH distribution in sediments. J. Environ. Manage. 91, 328–335. https://doi.org/10.1016/j.jenvman.2009.08.020
CCME, 2018. CCME Tableau Sommaire [WWW Document]. URL http://st-ts.ccme.ca/fr/index.html (accessed 6.26.18).
CCME, 1999. Protocol for the derivation of Canadian sediment quality guidelines for the protection of aquatic life (Article; Article/Report No. CCME EPC-98E). [Ottawa], Ont. : The Council.
CEPAL, N., 1990. Impacto ambiental de la contaminación hídrica producida por la Refinería Estatal Esmeraldas: análisis técnico-económico. CEPAL.
Cevallos, G., 2015. Programa de compensacion social para los barrios del sur de la ciudad de Esmeraldas : percepciones y movilizacion social.
Chachalo, M., 2016. Programa de minimización de desechos peligrosos para la Refinería Esmeraldas.
Chen, B., Xuan, X., Zhu, L., Wang, J., Gao, Y., Yang, K., Shen, X., Lou, B., 2004. Distributions of polycyclic aromatic hydrocarbons in surface waters, sediments and soils of Hangzhou City, China. Water Res. 38, 3558–3568. https://doi.org/10.1016/j.watres.2004.05.013
Chen, Y., Jia, R., Yang, S., 2015. Distribution and Source of Polycyclic Aromatic Hydrocarbons (PAHs) in Water Dissolved Phase, Suspended Particulate Matter and Sediment from Weihe River in Northwest China. Int. J. Environ. Res. Public. Health 12, 14148–14163. https://doi.org/10.3390/ijerph121114148
Choudhury, H., Hertzberg, R., Rice, G., Cogliano, J., 2000. Supplementary Guidance for Conducting Health Risk Assessment of Chemical Mixtures. (No. EPA/630/R-00/002). US Environmental Protection Agency, Washington, DC.
Clínica Ambiental, 2017. Informe de Salud [WWW Document]. informe_salud_tex. URL www.clinicambiental.org/docs/publicaciones/informe_salud_tex.pdf (accessed 6.7.18).
Crane, J., Hennes, S., 2007. Guidance for the se and application of sediment quality targets for the protection of sediment-dwelling organisms in Minnesota.

BIBLIOGRAPHY
146
Cuba, N., Bebbington, A., Rogan, J., Millones, M., 2014. Extractive industries, livelihoods and natural resource competition: Mapping overlapping claims in Peru and Ghana. Appl. Geogr. 54, 250–261. https://doi.org/10.1016/j.apgeog.2014.05.003
Dangles, O., Nowicki, F., Valencia, R., 2009. Biota máxima : Ecuador biodiverso. Quito.
de Deckere, E., De Cooman, W., Leloup, V., Meire, P., Schmitt, C., von der Ohe, P.C., 2011. Development of sediment quality guidelines for freshwater ecosystems. J. Soils Sediments 11, 504–517. https://doi.org/10.1007/s11368-010-0328-x
de Perre, C., Le Ménach, K., Ibalot, F., Parlanti, E., Budzinski, H., 2014. Development of solid-phase microextraction to study dissolved organic matter—Polycyclic aromatic hydrocarbon interactions in aquatic environment. Anal. Chim. Acta 807, 51–60. https://doi.org/10.1016/j.aca.2013.11.026
Dini, M., Stumpo, G., 2016. Los desafíos del Ecuador para el cambio estructural con inclusión social.
Doong, R., Lin, Y., 2004. Characterization and distribution of polycyclic aromatic hydrocarbon contaminations in surface sediment and water from Gao-ping River, Taiwan. Water Res. 38, 1733–1744. https://doi.org/10.1016/j.watres.2003.12.042
Durango-Cordero, J., Saqalli, M., Laplanche, C., Locquet, M., Elger, A., 2018. Spatial Analysis of Accidental Oil Spills Using Heterogeneous Data: A Case Study from the North-Eastern Ecuadorian Amazon. Sustainability 10, 4719. https://doi.org/10.3390/su10124719
EP Petroecuador, 2013. El petróleo en el Ecuador : la nueva era petrolera, 1st ed. Manthra Comunicación, Quito, Ecuador.
Espinosa, J., Moreno, J., Bernal, G., 2017. The Soils of Ecuador. Springer.
European Commission, 2012. Toxicity and Assessment of Chemical Mixtures.
European Commission, 1998. Directive 98/83/EC of the European Parliament and of the Council of 3 November 1998 on on the quality of water intended for human consumption, Off J Eur Union 98;L 330/32 . [Novembre 98].
Farias, C.O., Hamacher, C., Wagener, A. de L.R., Scofield, A. de L., 2008. Origin and degradation of hydrocarbons in mangrove sediments (Rio de Janeiro, Brazil) contaminated by an oil spill. Org. Geochem. 39, 289–307. https://doi.org/10.1016/j.orggeochem.2007.12.008
Farooq, S., Ali-Musstjab-Akber-Shah Eqani, S., Malik, R.N., Katsoyiannis, A., Zhang, G., Zhang, Y., Li, J., Xiang, L., Jones, K.C., Shinwari, Z.K., 2011. Occurrence, finger printing and ecological risk assessment of polycyclic aromatic hydrocarbons (PAHs) in the Chenab River, Pakistan. J. Environ. Monit. 13, 3207. https://doi.org/10.1039/c1em10421g
Fernandes, M.B., Sicre, M.-A., Boireau, A., Tronczynski, J., 1997. Polyaromatic hydrocarbon (PAH) distributions in the Seine River and its estuary. Mar. Pollut. Bull. 34, 857–867. https://doi.org/10.1016/S0025-326X(97)00063-5
Fernández, D., Solís, H., Basani, M., 2018. Evolución reciente y perspectivas de los servicios de agua potable y alcantarillado en Ecuador. Inter-American Development Bank. https://doi.org/10.18235/0001171
Fernández, N., Buitrón Cisneros, R., 2012. The Right to Water and Sanitation in Ecuador: Progress, Limitations, and Challenges. Environ. Justice 5, 77–81. https://doi.org/10.1089/env.2011.0021
Finer, M., Jenkins, C.N., Pimm, S.L., Keane, B., Ross, C., 2008. Oil and Gas Projects in the Western Amazon: Threats to Wilderness, Biodiversity, and Indigenous Peoples. PLoS ONE 3, e2932. https://doi.org/10.1371/journal.pone.0002932
Fontaine, G., 2013. Microconflictos ambientales y crisis de gobernabilidad en la Amazonía ecuatoriana. Íconos - Rev. Cienc. Soc. 0, 35. https://doi.org/10.17141/iconos.21.2005.80
Foucault, A., 2016. Climatologie et paléoclimatologie, 2nd ed. Dunod, Paris.
Fry, R.C. (Ed.), 2015. Systems biology in toxicology and environmental health, 1st ed. Academic Press,

BIBLIOGRAPHY
147
Amsterdam, Netherlands.
Gobierno del Ecuador, 2005. Acuerdo No 684 - NTE INEN 1 108 sobre requisitos del agua potable. [WWW Document]. URL https://www.ecolex.org/details/legislation/acuerdo-no-684-nte-inen-1-108-sobre-requisitos-del-agua-potable-lex-faoc053700/?q=inen+1+108&xdate_min=&xdate_max= (accessed 1.17.19).
Gobierno del Ecuador, 1972. Decreto Supremo No 369 - Ley de Aguas. [WWW Document]. URL https://www.ecolex.org/details/legislation/decreto-supremo-no-369-ley-de-aguas-lex-faoc003006/ (accessed 1.17.19).
Gondard, P., Mazurek, H., 2001. 30 años de reforma agraria y colonizacidn en el Ecuador (1964- 1994) - Dinamicas espaciales. Estud. Geogr., Dindinmicas territoriales: Ecuador, Bolivia, Perú, Venezuela, Estudios de Geografía 10, 15–40.
Gorleku, M., Carboo, D., Palm, L., Quasie, W., 2014. Polycyclic aromatic hydrocarbons (PAHs) pollution in marine waters and sediments at the Tema Harbour, Ghana. Acad. J. Environ. Sci. 2.
Goss, P.E., Lee, B.L., Badovinac-Crnjevic, T., Strasser-Weippl, K., Hurlbert, M., Durstine, A., Azenha, G., 2013. Planning cancer control in Latin America and the Caribbean. Lancet Oncol. 14, 391–436. https://doi.org/10.1016/S1470-2045(13)70048-2
Gualpa, S., Torres, M., Galárraga, R., 2001. Estudio preliminar de la calidad bio-geoquímica del agua en la cuenca del río Napo dentro del proyecto AARAM. EPN, Quito.
Gustafson, K.E., Dickhut, R.M., 1997. Distribution of polycyclic aromatic hydrocarbons in southern Chesapeake Bay surface water: Evaluation of three methods for determining freely dissolved water concentrations. Environ. Toxicol. Chem. 16, 452–461. https://doi.org/10.1002/etc.5620160310
Hawthorne, S.B., Miller, D.J., Kreitinger, J.P., 2006. Measurement of total polycyclic aromatic hydrocarbon concentrations in sediments and toxic units used for estimating risk to benthic invertebrates at manufactured gas plant sites. Environ. Toxicol. Chem. 25, 287. https://doi.org/10.1897/05-111R.1
Hettler, J., Lehmann, B., LeMarie, L., 1996. Environmental problems of petroleum production in the Amazon lowland of Ecuador, 1st ed. UNEP, Berlin,.
Hirschman, A.O., Besseyrias, C., Delwit, P., 2017. Exit, voice, loyalty: défection et prise de parole. Ed. de l’Université de Bruxelles, Bruxelles, Belgique.
Hübner, R., Brian Astin, K., Herbert, R.J.H., 2009. Comparison of sediment quality guidelines (SQGs) for the assessment of metal contamination in marine and estuarine environments. J. Environ. Monit. 11, 713. https://doi.org/10.1039/b818593j
Hurtig, A., San Sebastián, M., 2005. Epidemiology vs epidemiology: the case of oil exploitation in the Amazon basin of Ecuador. Int. J. Epidemiol. 34, 1170–1172. https://doi.org/10.1093/ije/dyi151
Hurtig, A.-K., San Sebastián, M., 2002. Geographical differences in cancer incidence in the Amazon basin of Ecuador in relation to residence near oil fields. Int. J. Epidemiol. 31, 1021–1027. https://doi.org/10.1093/ije/31.5.1021
INEC, 2010a. Pobreza por Ingresos – Resultados 2010 [WWW Document]. Inst. Nac. Estad. Censos. URL http://www.ecuadorencifras.gob.ec/pobreza-por-ingresos-resultados-2010/ (accessed 7.30.18).
INEC, 2010b. Fascículo provincial Esmeraldas.
INEC, I.N. de E. y C., 2010. Población, superficie (km2), densidad poblacional a nivel provincial [WWW Document]. Inst. Nac. Estad. Censos. URL http://www.ecuadorencifras.gob.ec/wp-content/plugins/download-monitor/download.php?id=321&force=0 (accessed 6.20.19).
Instituto de Epidemiología y Salud Comunitaria (IESC), 2004. Informe Yana Curi: Impacto de la actividad petrolera en la salud de poblaciones rurales de la Amazonía ecuatoriana. Abya-Yala, Quito, Ecuador.

BIBLIOGRAPHY
148
Instituto Geográfico Militar (IGM), 2013. Atlas geográfico de la República del Ecuador, 2nd ed. Instituto Geográfico Militar, Quito, Ecuador.
International Agency for Research on Cancer (IARC), 2018. IARC Monographs- Classifications [WWW Document]. URL http://monographs.iarc.fr/ENG/Classification/latest_classif.php (accessed 1.26.18).
International Agency for Research on Cancer (IARC), 2010. Some non-heterocyclic polycyclic aromatic hydrocarbons and some related occupational exposures, IARC monographs on the evaluation of carcinogenic risks to humans. World Health Organization, Lyon, France.
Jarrín, P.S., Tapia Carrillo, L., Zamora, G., 2016. La colonia interna vigente: transformación del territorio humano en la región amazónica del Ecuador. Let. Verdes Rev. Latinoam. Estud. Socioambientales 22. https://doi.org/10.17141/letrasverdes.20.2016.2063
Jochnick, C., Normand, R., 1994. Rights violation in the Ecuadorian Amazon The human consequences of oil development [WWW Document]. URL http://www.cesr.org/sites/default/files/Rights_Violation_in_the_Ecuadorian_Amazon_The_Human_Consequences_of_Oil_Development_1_1.pdf (accessed 2.7.18).
Jørgensen, S.E., Fath, B.D. (Eds.), 2010. Ecotoxicology: a derivative of Encyclopedia of ecology, 1st ed. Elsevier/Academic Press, Amsterdam, The Netherlands.
Juteau-Martineau, G., 2012. L’exploitation pétrolière en Équateur : À la recherche d’un nouveau modèle de développement, entre enjeux économiques et conflits socio-environnementaux.
Juteau-Martineau, G., Becerra, S., Maurice, L., 2014. Ambiente, petróleo y vulnerabilidad política en el Oriente Ecuatoriano: ¿hacia nuevas formas de gobernanza energética? América Lat. Hoy 67, 119. https://doi.org/10.14201/alh201467119137
Kabata-Pendias, A., Szteke, B., 2015. Trace Elements in Abiotic and Biotic Environments, 1st ed. CRC Press, Florida, United States.
Kanan, R., Le Floch, S., Andersson, J., Le Menach, K., Budzinski, H., 2012. Extraction of Polycyclic Aromatic Hydrocarbons (PAHs), Polycyclic Aromatic Sulfur Heterocycles (PASHs) and Alkylated Derivatives from Seawater using Solide-Phase Microextraction (SPME)-Gas Chromatography-Mass Spectrometry (GC-MS). In Proceedings of the Thirty-Five AMOP Technical Seminar on Environmental Contamination and Response, Environment Canada, Ottawa, June 2012.
Kashinsky, I., 2008. Petroecuador más de lo mismo [WWW Document]. Ecuad. Terra Incogn. URL http://www.terraecuador.net/revista_55/55_petroecuador.html (accessed 8.6.18).
Kayser, G.L., Amjad, U., Dalcanale, F., Bartram, J., Bentley, M.E., 2015. Drinking Water Quality Governance: A Comparative Case Study of Brazil, Ecuador, and Malawi. Environ. Sci. Policy 48, 186–195. https://doi.org/10.1016/j.envsci.2014.12.019
Kelsh, M.A., Morimoto, L., Lau, E., 2009. Cancer mortality and oil production in the Amazon Region of Ecuador, 1990–2005. Int. Arch. Occup. Environ. Health 82, 381–395. https://doi.org/10.1007/s00420-008-0345-x
Keshavarzi, B., Mokhtarzadeh, Z., Moore, F., Rastegari Mehr, M., Lahijanzadeh, A., Rostami, S., Kaabi, H., 2015. Heavy metals and polycyclic aromatic hydrocarbons in surface sediments of Karoon River, Khuzestan Province, Iran. Environ. Sci. Pollut. Res. 22, 19077–19092. https://doi.org/10.1007/s11356-015-5080-8
Kozisek, F., 2005. Health Risk from Drinking Demineralized Water, in: Nutrients in Drinking Water. World Health Organization, Geneva, Switzerland, pp. 148–163.
Kwok, K.W.H., Batley, G.E., Wenning, R.J., Zhu, L., Vangheluwe, M., Lee, S., 2014. Sediment quality guidelines: challenges and opportunities for improving sediment management. Environ. Sci. Pollut. Res. 21, 17–27. https://doi.org/10.1007/s11356-013-1778-7
Langumier, J., 2006. Survivre à la catastrophe : paroles et récits d’un territoire inondé. Contribution à une ethnologie de l’événement à partir de la crue de l’Aude de 1999 (Thesis). École des hautes

BIBLIOGRAPHY
149
études en sciences sociales, Paris.
Laraque, A., Ronchail, J., Cochonneau, G., Pombosa, R., Guyot, J.L., 2007. Heterogeneous Distribution of Rainfall and Discharge Regimes in the Ecuadorian Amazon Basin. J. Hydrometeorol. 8, 1364–1381. https://doi.org/10.1175/2007JHM784.1
Larrea, C., Camacho, G., 2013. Atlas de las desigualdades socioeconómicas del Ecuador. SENPLADES, Quito.
Lessmann, J., Fajardo, J., Muñoz, J., Bonaccorso, E., 2016. Large expansion of oil industry in the Ecuadorian Amazon: biodiversity vulnerability and conservation alternatives. Ecol. Evol. 6, 4997–5012. https://doi.org/10.1002/ece3.2099
Leusch, F., Bartkow, M., 2010. A short primer on benzene, toluene, ethylbenzene and xylenes (BTEX) in the environment and in hydraulic fracturing fluids [WWW Document]. URL https://www.ehp.qld.gov.au/management/coal-seam-gas/pdf/btex-report.pdf (accessed 6.8.18).
Levy, B.S., Nassetta, W.J., 2011. The Adverse Health Effects of Oil Spills: A Review of the Literature and a Framework for Medically Evaluating Exposed Individuals. Int. J. Occup. Environ. Health 17, 161–168. https://doi.org/10.1179/107735211799031004
Li, F., Zeng, X., Yang, J., Zhou, K., Zan, Q., Lei, A., Tam, N.F.Y., 2014. Contamination of polycyclic aromatic hydrocarbons (PAHs) in surface sediments and plants of mangrove swamps in Shenzhen, China. Mar. Pollut. Bull. 85, 590–596. https://doi.org/10.1016/j.marpolbul.2014.02.025
Long, E.R., Morgan, L.G., 1990. The Potential for Biological Effects of Sediments-Sorbed Contaminants Tested in the National Status and Trends Program (Technical Report). National Oceanic and Atmospheric Admininistration.
López, V., 2016. Cartografía histórica de las áreas naturales protegidas y los territorios indígenas de la Amazonía ecuatoriana. Red Amazónica de Información Socioambiental Georreferenciada (RAISG), Quito.
MAE, 2015. ACUERDOS 097-A Refórmese el Texto Unificado de Legislación Secundaria, Registro Oficial Edición Especial No 387, 4 de noviembre de 2015.
Mainville, N., Webb, J., Lucotte, M., Davidson, R., Betancourt, O., Cueva, E., Mergler, D., 2006. Decrease of soil fertility and release of mercury following deforestation in the Andean Amazon, Napo River Valley, Ecuador. Sci. Total Environ. 368, 88–98. https://doi.org/10.1016/j.scitotenv.2005.09.064
Manoli, E., Samara, C., Konstantinou, I., Albanis, T., 2000. Polycyclic aromatic hydrocarbons in the bulk precipitation and surface waters of Northern Greece. Chemosphere 41, 1845–1855. https://doi.org/10.1016/S0045-6535(00)00134-X
Martínez, A., Aguilar, V., Verdugo Silva, T., 2018. The Vital Minimum Amount of Drinking Water Required in Ecuador. Resources 7, 15. https://doi.org/10.3390/resources7010015
Marx, E., 2010. The Fight for Yasuni. Science 330, 1170–1171. https://doi.org/10.1126/science.330.6008.1170
MCE, 2017. Informe Mensual de Comercio Exterior Diciembre 2017. Ministerio de Comercio Exterior e Inversiones, Quito, Ecuador.
Ministerio del Ambiente (MAE), 2015a. Explotación Hidrocarburífera [WWW Document]. Explot. Hidrocarburífera-PRAS. URL http://pras.ambiente.gob.ec/fr/web/siesap/explotacion-hidrocarburifera (accessed 6.7.18).
Ministerio del Ambiente (MAE), 2015b. Áreas protegidas por región | Sistema Nacional de Áreas Protegidas del Ecuador [WWW Document]. URL http://areasprotegidas.ambiente.gob.ec/todas-areas-protegidas-por-region?t=A (accessed 7.23.18).
Ministerio del Ambiente (MAE), 2015c. Refórmese el Texto Unificado de Legislación Secundaria,

BIBLIOGRAPHY
150
Registro Oficial-Edición Especial N° 387; Acuerdo 097-A [Noviembre 04].
Ministerio del Ambiente (MAE), 2012. Programa de Reparación Ambiental y Social (PRAS) [WWW Document]. Minist. Ambiente. URL http://www.ambiente.gob.ec/programa-de-reparacion-ambiental-y-social-pras/ (accessed 7.19.18).
Ministerio del Ambiente (MAE), 2003. Norma de Calidad Ambiental y de descarga de efluentes: recurso agua (Anexo I, Libro VI: De la Calidad Ambiental, del Texto Unificado de la Legislación Secundaria del Ministerio del Ambiente), Registro Oficial-Edición Especial N° 002; Decreto N°3516 [marzo 31].
Mitra, S., Roy, P., 2011. BTEX : A Serious Ground-water Contaminant. Res. J. Environ. Sci. 5, 394–398. https://doi.org/10.3923/rjes.2011.394.398
MONOIL, 2015. MONOIL Monitoring environnemental, Santé, Societé et Pétrole en Equateur; Galerie photographique du projet MONOIL Monitoring environnemental, Santé, Societé et Pétrole en Equateur [WWW Document]. URL http://www.monoil.ird.fr/photos (accessed 9.4.18).
Montuori, P., Aurino, S., Garzonio, F., Sarnacchiaro, P., Nardone, A., Triassi, M., 2016. Distribution, sources and ecological risk assessment of polycyclic aromatic hydrocarbons in water and sediments from Tiber River and estuary, Italy. Sci. Total Environ. 566–567, 1254–1267. https://doi.org/10.1016/j.scitotenv.2016.05.183
Moolgavkar, S.H., Chang, E.T., Watson, H., Lau, E.C., 2014. Cancer mortality and quantitative oil production in the Amazon region of Ecuador, 1990–2010. Cancer Causes Control 25, 59–72. https://doi.org/10.1007/s10552-013-0308-8
Narváez, I., 2000. Aguas de formación y derrames de petróleo. La dimensión política en la problemática socioambiental petrolera, 1st ed. Quito, Ecuador.
National Oceanic and Atmospheric Administration (NOAA), 2008. Screening Quick Reference Tables [WWW Document]. URL https://response.restoration.noaa.gov/sites/default/files/SQuiRTs.pdf (accessed 4.15.19).
Neghab, M., Hosseinzadeh, K., Hassanzadeh, J., 2015. Early Liver and Kidney Dysfunction Associated with Occupational Exposure to Sub-Threshold Limit Value Levels of Benzene, Toluene, and Xylenes in Unleaded Petrol. Saf. Health Work 6, 312–316. https://doi.org/10.1016/j.shaw.2015.07.008
Nekhavhambe, T., Van Ree, T., Fatoki, O., 2014. Determination and distribution of polycyclic aromatic hydrocarbons in rivers, surface runoff, and sediments in and around Thohoyandou, Limpopo Province, South Africa. Water SA 40, 415. https://doi.org/10.4314/wsa.v40i3.4
Nerbrand, C., Agréus, L., Lenner, R.A., Nyberg, P., Svärdsudd, K., 2003. The influence of calcium and magnesium in drinking water and diet on cardiovascular risk factors in individuals living in hard and soft water areas with differences in cardiovascular mortality. BMC Public Health 3, 21. https://doi.org/10.1186/1471-2458-3-21
Nevels, D., 2013. The effects of oil operations on the Pacayacu and Sacha river watersheds in the Ecuadorian Amazon. Univ. Wash. Bothell Policy J. 19–30.
Nisbet, I.C.T., LaGoy, P.K., 1992. Toxic equivalency factors (TEFs) for polycyclic aromatic hydrocarbons (PAHs). Regul. Toxicol. Pharmacol. 16, 290–300. https://doi.org/10.1016/0273-2300(92)90009-X
Oberem, U., 1980. Los Quijos. Historia de la transculturación de un grupo indígena en el Oriente ecuatoriano. Instituto Otavaleño de Antropología, Otavalo:
O’Callaghan-Gordo, C., Orta-Martínez, M., Kogevinas, M., 2016. Health effects of non-occupational exposure to oil extraction. Environ. Health 15. https://doi.org/10.1186/s12940-016-0140-1
OPEC, 2018. Annual Statistical Bulletin.
OPEC, 2017. Annual Statistical Bulletin.
Paz-y-Miño, C., López-Cortés, A., Arévalo, M., Sánchez, M.E., 2008. Monitoring of DNA Damage in

BIBLIOGRAPHY
151
Individuals Exposed to Petroleum Hydrocarbons in Ecuador. Ann. N. Y. Acad. Sci. 1140, 121–128. https://doi.org/10.1196/annals.1454.013
Pinto, V.G., Heller, L., Bastos, R.K.X., 2012. Drinking water standards in South American countries: convergences and divergences. J. Water Health 10, 295. https://doi.org/10.2166/wh.2012.087
PUCE-Esmeraldas, 2017. Programa institucional de vinculación con la colectividad línea estratégica: sector productivo.
Quesada, C.A., Lloyd, J., Anderson, L.O., Fyllas, N.M., Schwarz, M., Czimczik, C.I., 2011. Soils of Amazonia with particular reference to the RAINFOR sites. Biogeosciences 8, 1415–1440. https://doi.org/10.5194/bg-8-1415-2011
Racines, D., 2017. Cultura de riesgo: Impacto social de la actividad petrolera en comunidades shuar y kichwa de la parroquia de Dayuma, Francisco de Orellana. Universidad San Francisco de Quito, Quito.
Ramirez, M.I., Arevalo, A.P., Sotomayor, S., Bailon-Moscoso, N., 2017. Contamination by oil crude extraction – Refinement and their effects on human health. Environ. Pollut. 231, 415–425. https://doi.org/10.1016/j.envpol.2017.08.017
RAOHE, 2001. Decreto No 1215 - Reglamento sustitutivo del Reglamento ambiental para las operaciones hidrocarburíferas en el Ecuador.
Raza, M., Zakaria, M.P., Hashim, N.R., Yim, U.H., Kannan, N., Ha, S.Y., 2013. Composition and source identification of polycyclic aromatic hydrocarbons in mangrove sediments of Peninsular Malaysia: indication of anthropogenic input. Environ. Earth Sci. 70, 2425–2436. https://doi.org/10.1007/s12665-013-2279-1
Rengarajan, T., Rajendran, P., Nandakumar, N., Lokeshkumar, B., Rajendran, P., Nishigaki, I., 2015. Exposure to polycyclic aromatic hydrocarbons with special focus on cancer. Asian Pac. J. Trop. Biomed. 5, 182–189. https://doi.org/10.1016/S2221-1691(15)30003-4
Ríos, S., Oliveira-Miranda, T., 2015. Deforestación en la Amazonía (1970 - 2013). São Paulo.
Ross, J.R.M., Oros, D.R., 2004. Polycyclic aromatic hydrocarbons in the San Francisco Estuary water column: Sources, spatial distributions, and temporal trends (1993–2001). Chemosphere 57, 909–920. https://doi.org/10.1016/j.chemosphere.2004.08.010
San Sebastian, M., 2001. Exposures and cancer incidence near oil fields in the Amazon basin of Ecuador. Occup. Environ. Med. 58, 517–522. https://doi.org/10.1136/oem.58.8.517
San Sebastián, M., Córdoba, J., 1999. “Yana Curi” Report The impact of oil development on the health of the people of the Ecuadorian Amazon. Departamento de Pastoral Social del Vicariato de Aguarico, London School of Hygiene and Tropical Medicine Medicus Mundi.
San Sebastián, M., Hurtig, A.K., 2005. Oil development and health in the Amazon basin of Ecuador: the popular epidemiology process. Soc. Sci. Med. 60, 799–807. https://doi.org/10.1016/j.socscimed.2004.06.016
Schlesinger, W., 2000. Biogeoquímica - Un Analisis del Cambio Global. Ariel, Barcelona.
SENPLADES, 2015. Agenda Zonal Zona 1 - Norte Provincias de: Esmeraldas, Imbabura, Carchi y Sucumbíos 2013-2017.
SENPLADES, 2014. Agua potable y alcantarillado para erradicar la pobreza en el Ecuador.
SENPLADES, ECORAE, 2016. Plan intregral para la Amazonía 2016.
Sierra, R., Flores, S., Zamora, G., 2009. Climate change assesment for Esmeraldas, Ecuador: A summary. UN-HABITAT, Nairobi.
Simpson, C.D., Mosi, A.A., Cullen, W.R., Reimer, K.J., 1996. Composition and distribution of polycyclic aromatic hydrocarbon contamination in surficial marine sediments from Kitimat Harbor, Canada. Sci. Total Environ. 181, 265–278. https://doi.org/10.1016/0048-9697(95)05026-4
Skinner, S., Reilly, W., 1989. The EXXON VALDEZ Oil Spill: A Report to the President. Environmental
BIBLIOGRAPHY
152
Protection Agency.
Soliman, N.F., Nasr, S.M., Okbah, M.A., 2015. Potential ecological risk of heavy metals in sediments from the Mediterranean coast, Egypt. J. Environ. Health Sci. Eng. 13, 70. https://doi.org/10.1186/s40201-015-0223-x
Speight, J.G., 2002. Handbook of petroleum product analysis. Wiley-Interscience, New York, United States.
Stogiannidis, E., Laane, R., 2015. Source Characterization of Polycyclic Aromatic Hydrocarbons by Using Their Molecular Indices: An Overview of Possibilities, in: Whitacre, D.M. (Ed.), Reviews of Environmental Contamination and Toxicology. Springer International Publishing, Cham, pp. 49–133. https://doi.org/10.1007/978-3-319-10638-0_2
Sun, C., Zhang, J., Ma, Q., Chen, Y., Ju, H., 2017. Polycyclic aromatic hydrocarbons (PAHs) in water and sediment from a river basin: sediment–water partitioning, source identification and environmental health risk assessment. Environ. Geochem. Health 39, 63–74. https://doi.org/10.1007/s10653-016-9807-3
Sun, F., Wen, D., Kuang, Y., Li, J., Li, J., Zuo, W., 2010. Concentrations of heavy metals and polycyclic aromatic hydrocarbons in needles of Masson pine (Pinus massoniana L.) growing nearby different industrial sources. J. Environ. Sci. 22, 1006–1013. https://doi.org/10.1016/S1001-0742(09)60211-4
Swartz, R.C., 1999. Consensus sediment quality guidelines for polycyclic aromatic hydrocarbon mixtures. Environ. Toxicol. Chem. 18, 780–787. https://doi.org/10.1002/etc.5620180426
Tremblay, C., Bouchard, M., Gagnon, F., Cartier, J., 2000. Les hydrocarbures aromatiques polycycliques : exposition et risques dans la population générale [WWW Document]. URL https://www.inspq.qc.ca/es/node/1137 (accessed 6.8.18).
Turnlund, J., 2002. Molybdenum Metabolism and Requirements in Humans, in: Sigel, A., Sigel, H. (Eds.), Metals Ions in Biological System. CRC Press, pp. 727–739. https://doi.org/10.1201/9780203909331.ch21
Ugwu, K.E., Ukoha, P.O., 2018. Polycyclic aromatic hydrocarbons (PAHs) in surface sediments near a mining site in Okobo-Enjema, Nigeria: concentrations, source apportionment and risk assessment. Environ. Geochem. Health 40, 359–373. https://doi.org/10.1007/s10653-017-9916-7
UNESCO, 2010. Atlas de las lenguas del mundo en peligro. Christopher Moseley.
US Department of Agriculture (USDA), 2005. Global Soil Regions Map | NRCS Soils [WWW Document]. URL https://www.nrcs.usda.gov/wps/portal/nrcs/detail/soils/use/worldsoils/?cid=nrcs142p2_054013 (accessed 9.5.18).
US Environmental Protection Agency (US EPA), 2019. Terms & Acronyms [WWW Document]. URL https://ofmpub.epa.gov/sor_internet/registry/termreg/searchandretrieve/termsandacronyms/search.do?search=&term=reference%20dose&matchCriteria=Contains&checkedAcronym=true&checkedTerm=true&hasDefinitions=false
US Environmental Protection Agency (US EPA), 2018a. EPA EcoBox Tools by Effects - Aquatic [WWW Document]. US EPA. URL https://www.epa.gov/node/150329/view (accessed 11.16.18).
US Environmental Protection Agency (US EPA), 2018b. Chapter 62-302 Surface water quality standards.
US Environmental Protection Agency (US EPA), 2015a. Toxic and Priority Pollutants Under the Clean Water Act [WWW Document]. US EPA. URL https://www.epa.gov/eg/toxic-and-priority-pollutants-under-clean-water-act (accessed 6.13.18).
US Environmental Protection Agency (US EPA), 2015b. National Recommended Water Quality Criteria - Aquatic Life Criteria Table [WWW Document]. US EPA. URL https://www.epa.gov/wqc/national-recommended-water-quality-criteria-aquatic-life-

BIBLIOGRAPHY
153
criteria-table (accessed 8.13.18).
US Environmental Protection Agency (US EPA), 2015c. Exposure Assessment Tools by Routes - Ingestion [WWW Document]. US EPA. URL https://www.epa.gov/expobox/exposure-assessment-tools-routes-ingestion (accessed 5.31.18).
US Environmental Protection Agency (US EPA), 2015d. Exposure Assessment Tools by Routes - Dermal [WWW Document]. US EPA. URL https://www.epa.gov/expobox/exposure-assessment-tools-routes-dermal (accessed 5.31.18).
US Environmental Protection Agency (US EPA), 2014. Chapter Four of the SW-846 Compendium: Organic Analytes.
US Environmental Protection Agency (US EPA), 2004. Risk Assessment Guidance for Superfund Volume I: Human Health Evaluation Manual (Part E, Supplemental Guidance for Dermal Risk Assessment). (No. EPA/540/R/99/005). U.S. Environmental Protection Agency, Washington, DC.
US Environmental Protection Agency (US EPA), 2003. Framework for Cumulative Risk Assessment (No. EPA/630/P-02/001F). US Environmental Protection Agency, Washington, DC.
US Environmental Protection Agency (US EPA), 2002. Method 1631 Mercury in Water by Oxidation, Purge and Trap, and Cold Vapor Atomic Fluorescence Spectrometry. (No. EPA-821-R-02-019). US Environmental Protection Agency, Office of Water, Washington, DC.
US Environmental Protection Agency (US EPA), 2000. Profile of the Oil and Gas Extraction Industry (No. EPA/310-R-99-006). US Environmental Protection Agency, Washington, DC.
US Environmental Protection Agency (US EPA), 1996. Method 1669 Sampling Ambient Water for Trace Metals at EPA Water Quality Criteria Levels. US Environmental Protection Agency, Office of Water, Washington, DC.
Vallejo, I., Ávila, R., 2017. El último grito del jaguar: memorias del I Congreso sobre pueblos indígenas aislados en la Amazonía ecuatoriana. ABYA-YALA, Quito.
van Wendel de Joode, B., Barbeau, B., Bouchard, M.F., Mora, A.M., Skytt, Å., Córdoba, L., Quesada, R., Lundh, T., Lindh, C.H., Mergler, D., 2016. Manganese concentrations in drinking water from villages near banana plantations with aerial mancozeb spraying in Costa Rica: Results from the Infants’ Environmental Health Study (ISA). Environ. Pollut. 215, 247–257. https://doi.org/10.1016/j.envpol.2016.04.015
Varea, A., Ortiz, P., Martínez, E., Bustamante, T., Navarro, M., Garzón, P., Villamil, H., Garcés, A., 1995. Marea negra en la Amazonia : conflictos socioambientales vinculados a la actividad petrolera en el Ecuador.
Wang, Z., Fingas, M.F., 2003. Development of oil hydrocarbon fingerprinting and identification techniques. Mar. Pollut. Bull. 47, 423–452. https://doi.org/10.1016/S0025-326X(03)00215-7
Wasserstrom, R., Southgate, D., 2013. Deforestation, Agrarian Reform and Oil Development in Ecuador, 1964-1994. Nat. Resour. 04, 31–44. https://doi.org/10.4236/nr.2013.41004
Webb, J., Coomes, O.T., Mergler, D., Ross, N.A., 2018. Levels of 1-hydroxypyrene in urine of people living in an oil producing region of the Andean Amazon (Ecuador and Peru). Int. Arch. Occup. Environ. Health 91, 105–115. https://doi.org/10.1007/s00420-017-1258-3
Webb, J., Coomes, O.T., Ross, N., Mergler, D., 2016. Mercury concentrations in urine of amerindian populations near oil fields in the peruvian and ecuadorian amazon. Environ. Res. 151, 344–350. https://doi.org/10.1016/j.envres.2016.07.040
WEC, 2016. World Energy Resources Oil 2016.
Weiss, K., Girandola, F., Colbeau-Justin, L., 2011. Les comportements de protection face au risque naturel : de la résistance à l’engagement. Prat. Psychol. 17, 251–262. https://doi.org/10.1016/j.prps.2010.02.002
Wernersson, A.-S., 2004. Aquatic ecotoxicity due to oil pollution in the Ecuadorian Amazon. Aquat.

BIBLIOGRAPHY
154
Ecosyst. Health Manag. 7, 127–136. https://doi.org/10.1080/14634980490281470
Widener, P., 2007. Oil Conflict in Ecuador: A Photographic Essay. Organ. Environ. 20, 84–105. https://doi.org/10.1177/1086026607300321
World Health Organization (WHO), 2018. Developing drinking-water quality regulations and standards. World Health Organization, Geneva, Switzerland.
World Health Organization (WHO), 2017. Guidelines for drinking-water quality: fourth edition incorporating the first addendum, 4th ed. World Health Organization, Geneva, Switzerland.
World Health Organization (WHO), 2011. Guidelines for drinking-water quality - 4th ed., 4th ed. World Health Organization, Geneva, Switzerland.
World Health Organization (WHO), 2006. Guidelines for drinking-water quality: recommendations, 3rd ed. World Health Organization, Geneva, Switzerland.
World Health Organization (WHO), 2005. Nutrients in Drinking Water. World Health Organization, Geneva, Switzerland.
World Health Organization (WHO), United Nations Children’s Fund (UNICEF), 2017. Progress on Drinking Water, Sanitation and Hygiene 2017. Geneva, Switzerland.
World Health Organization (WHO), United Nations Children’s Fund (UNICEF), 2014. Progress on sanitation and drinking-water: 2014 update. World Health Organization, Geneva, Switzerland.
Yunker, M.B., Macdonald, R.W., Vingarzan, R., Mitchell, R.H., Goyette, D., Sylvestre, S., 2002. PAHs in the Fraser River basin: a critical appraisal of PAH ratios as indicators of PAH source and composition. Org. Geochem. 33, 489–515. https://doi.org/10.1016/S0146-6380(02)00002-5
Yunker, M.B., McLaughlin, F.A., Fowler, M.G., Fowler, B.R., 2014. Source apportionment of the hydrocarbon background in sediment cores from Hecate Strait, a pristine sea on the west coast of British Columbia, Canada. Org. Geochem. 76, 235–258. https://doi.org/10.1016/j.orggeochem.2014.08.010
Zamani, M., Khorasani, N., Bakhtiari, A.R., Rezaei, K., 2015. Source identification of perylene in surface sediments and waterbird eggs in the Anzali Wetland, Iran. Environ. Pollut. 205, 23–32. https://doi.org/10.1016/j.envpol.2015.05.007
Zhang, S., Zhang, Q., Darisaw, S., Ehie, O., Wang, G., 2007. Simultaneous quantification of polycyclic aromatic hydrocarbons (PAHs), polychlorinated biphenyls (PCBs), and pharmaceuticals and personal care products (PPCPs) in Mississippi river water, in New Orleans, Louisiana, USA. Chemosphere 66, 1057–1069. https://doi.org/10.1016/j.chemosphere.2006.06.067

ANNEX A
155
ANNEX A: Composition of Ecuadorian crude oil
Table A-1. Trace elements (µg.g-1) and PAHs (ng.g-1) concentrations (average±SD) in Ecuadorian Amazon crude oil and natural bituminous sandstone.
PARAMETER NATIONAL
PIPELINE
AUCA 03
OIL WELL
AUCA 08
WASTE POOL
BITUMINOUS
SANDSTONES
Hg <1 <1 <1 <1
Al <0.025 <0.025 3.48/2.42* 2.03±0.14
Ti <1 <1 108±5 240±17
V 158.1±0.3 278±11 305±36 25±2
Cr <5 <5 <5 <5/12*
Mn <1 <1 34±4 2.7/1.7*
Fe <20 57±8 1.55±0.08 2.37±0.02
Co 0.45±0.01 0.77±0.05 1.82±0.04 0.5±0.1
Ni 58±2 87±4 99±11 24±2
Cu <1 <1 4.1±0.6 2.36±0.5
Zn <5 <5 13.7±0.2 <5
As <0.1 <0.1 0.33±0.01 2.4±0.3
Mo <0.5 0.6/1.9* 0.93±0.02 1.5±0.3
Cd <0.1 <0.1 <0.1 <0.1
Ba <0.1 7±1 133±5 16.0±0.7
Pb <0.2 <0.2 3.0±0.5 30/59*
U <0.1 <0.1 0.14±0.01 0.23±0.02
N 391159 274832 22 <20
Ac <2.30 <2.30 <2.30 81
Ace 12778 9336 841 <2
Fl 35872 25799 1783 101
Ph 146635 98999 6496 <20
A 3861 1050 335 <3
BaA 1567 1209 836 427
Ch 21563 17642 10482 3760
BbjkF 2747 2386 2615 1810
BaP 460 <0.35 445 582
IPy <0.35 <0.35 328 <0.35
DBA 443 332 303 286
BPe 2476 2167 1752 1330
BePy 5854 4984 3213 2205
Pe <0.35 <0.35 <0.35 852
MCh 53487 48686 27179 21310
BNT 15256 14730 7172 <0.35
3MPh 84939 64407 14700 <3
2MPh 87773 77322 17085 <3
MA 4483 1236 715 <3
MPhMA 161054 122653 36321 <3
1MPh 112516 60351 10267 <3
∑DMPh 758012 475565 205049 9329
∑TMPh 688377 430727 241733 41451

ANNEX A
156
Table A.1. Trace elements (µg.g-1) and PAHs (ng.g-1) concentrations (average±SD) in Ecuadorian Amazon crude oil and natural bituminous sandstone. (continued)
PARAMETER NATIONAL
PIPELINE
AUCA 03
OIL WELL
AUCA 08
WASTE POOL
BITUMINOUS
SANDSTONES
2MN 830311 474908 725 55
1MN 650847 308722 836 70
∑DMN 3068374 1579610 41148 9653
∑TMN 4381888 2007652 218295 10514
∑TeMN 1854331 1097326 235404 9595
DBT 88143 103169 7846 <3
∑MDBT 2747 2386 2615 1810
∑MN 391159 274832 22 <20
* heterogeneous sample; N=naphthalene; Ac=acenaphthylene; Ace=acenaphthene; Fl=
fluorene; Ph=phenanthrene; A=anthracene; BaA=benzo[a]anthracene; Ch= chrysene+triphenylene; BbjkF=benzo[bjk]fluoranthene; BaP=benzo[a]pyrene;
IPy=indeno[1,2,3-cd]pyrene; DBA=dibenzo[ah]anthracene; BPe= benzo[ghi]perylene;
BePy=benzo[e]Pyrene; Pe=perylene; MCh=methylchrysene; BNT=
2,1benzonaphtothiophene; 3MPh=3Methylphenanthrene; 2MPh=2methylphenanthrene; MA=2methylanthracene; MPhMA=[9+4]methylphenanthrene+ 1methylanthracene+ 4,5
methylenephenanthrene; 1MPh=1methylphenanthrene; ∑DMPh=
∑dimethylphenanthrene; ∑TMPh=∑trimethylphenanthrene; 2MN=2methylnaphthalene;
1MN=1methylnaphthalene; ∑DMN=∑dimethylnaphthalene; ∑TMN= ∑trimethylnaphthalene; ∑TeMN=∑tetramethylnaphthalene; DBT=dibenzothiophene;
∑MDBT=∑methyldibenzothiophene; ∑MN= Σmethylnaphthalenes; i=interference.

ANNEX B
157
ANNEX B: Article published in Science of the Total
Environment
Drinking water quality in areas impacted by oil activities in Ecuador: Associated health risks and social perception of human exposure

ANNEX B
158

ANNEX B
159

ANNEX B
160

ANNEX B
161

ANNEX B
162

ANNEX B
163

ANNEX B
164

ANNEX B
165

ANNEX B
166

ANNEX B
167

ANNEX B
168

ANNEX B
169

ANNEX B
170
ANNEX B
171

ANNEX B
172

ANNEX C
173
ANNEX C: Coordinates of sampling points
Table C-1. Localization (UTM coordinates) of surface water sampling points (Chapter 1).
BASIN SUB-BASIN CODE PARISHES UTM COORDINATES WATER SEDIMENT
Napo b. sand Pto. Misahualli 18 M 194628 9921851 ✓ ✓
Napo PN-a4 Pto. Napo 18M 188685 9884404 ✓ ✓
Napo PN-b5 Pto. Napo 18M 188685 9884404 ✓ ✓
Napo PN-c6 Pto. Napo 18M 188625 9884480 ✓ ✓
Napo PN-d2 Pto. Misahualli 18M 200126 9884189 ✓ ✓
Napo PO-a6' Pto. Fco. de Orellana 18M 271659 9943790 ✓ X
Napo PO-a6 Pto. Fco. de Orellana 18M 271819 9943587 ✓ ✓
Napo PO-b3 Pto. Fco. de Orellana 18M 276524 9945544 ✓ ✓
Napo PO-c4 Pto. Fco. de Orellana 18M 276520 9945556 ✓ ✓
Payamino PO-d6 Pto. Fco. de Orellana 18M 276443 9945371 ✓ ✓
Payamino PO-e6 Pto. Fco. de Orellana 18M 261244 9950543 ✓ ✓
Payamino PO-f5** Pto. Fco. de Orellana 18M 269232 9955379 ✓ ✓
Payamino PO-g2** Pto. Fco. de Orellana 18M 270389 9954665 X ✓
Payamino PO-h2** Pto. Fco. de Orellana 18M 270562 9955067 ✓ ✓
Payamino PO-i6 Pto. Fco. de Orellana 18M 276701 9950922 ✓ ✓
Coca SC-a6 San Sebastian del Coca 18M 268710 9982811 ✓ X
Coca SC-b6 San Sebastian del Coca 18M 267272 9982580 ✓ ✓
Coca SC-c6 San Sebastian del Coca 18M 275397 9966278 ✓ X
Coca SC-d3 San Sebastian del Coca 18M 276655 9962158 ✓ ✓
Coca SC-d'6 San Sebastian del Coca 18M 276679 9962184 ✓ X
Coca SC-e4 San Sebastian del Coca 18M 276655 9962158 ✓ ✓
NAPO Coca SC-f5 San Sebastian del Coca 18M 279648 9963505 ✓ ✓
(NEAR) Napo PO-j2 Pto. Fco. de Orellana 18M 287234 9948808 ✓ X
Napo JS6 Joya de los Sachas 18M 293465 9958342 ✓ ✓
Napo LI5 Limoncocha 18M 318689 9961878 ✓ ✓
Rumiyacu waste A8 Dayuma 18M 291093 9928465 ✓ ✓
Rumiyacu DY-a6** Dayuma 18M 292198 9927298 ✓ ✓
Rumiyacu DY-b6** Dayuma 18M 290458 9925971 ✓ ✓
Rumiyacu DY-b3** Dayuma 18M 290458 9925971 ✓ X
Rumiyacu DY-c2** Dayuma 18M 291054 9926304 ✓ ✓
Rumiyacu DY-d4** Dayuma 18M 291034 9926303 ✓ ✓
Rumiyacu DY-e3** Dayuma 18M 291064 9926301 ✓ ✓
Rumiyacu DY-f5** Dayuma 18M 291520 9923055 ✓ ✓
Rumiyacu DY-g6 Dayuma 18M 295243 9925497 ✓ ✓
Tiputini DY-h3** Dayuma 18M 291087 9916886 ✓ ✓
Tiputini DY-i6** Dayuma 18M 289918 9918913 ✓ ✓
Tiputini DY-j2** Dayuma 18M 290977 9917803 X ✓
Tiputini DY-j4** Dayuma 18M 290978 9917805 ✓ X
Tiputini DY-k2** Dayuma 18M 290906 9917788 ✓ ✓
Tiputini DY-l6** Dayuma 18M 290802 9917724 ✓ ✓
Tiputini DY-m6 Dayuma 18M 299005 9917233 ✓ ✓
Tiputini TI-a4 Tiputini 18M 336619 9932675 ✓ ✓
Tiputini TI-b4 Tiputini 18M 369683 9929565 ✓ ✓
Tiputini TI-c4 Tiputini 18M 438642 9908793 ✓ ✓
Napo NR-a4 Nuevo Rocafuerte 18M 454177 9899407 ✓ ✓
Napo NR-b2 Nuevo Rocafuerte 18M 454645 9899031 ✓ ✓

ANNEX C
174
Table C-1. Localization (UTM coordinates) of surface-water sampling points (Chapter 1) .(continued)
BASIN SUB-BASIN CODE PARISHES UTM COORDINATES WATER SEDIMENT
Aguarico LM-a5 Lumbaqui 18N 233592 3169 ✓ ✓
Aguarico LM-b6 Lumbaqui 18N 243266 5986 ✓ ✓
Aguarico LM-c4 Lumbaqui 18N 243266 5986 ✓ ✓
Aguarico LM-d3 Lumbaqui 18N 243387 5825 ✓ ✓
Aguarico DU-a4 Dureno 18N 313064 5723 ✓ ✓
Aguarico DU-b3** Dureno 18N 314380 3433 ✓ ✓
Aguarico DU-c3** Dureno 18N 314380 3433 ✓ X
AGUARICO Aguarico PK_a4** Pacayacu 18N 326418 6748 ✓ X
(NEAR) Aguarico PK-a5** Pacayacu 18N 325469 141 ✓ ✓
Aguarico PK-b2** Pacayacu 18M 323625 9998301 ✓ ✓
Aguarico PK-c6 Pacayacu 18M 320944 9997146 ✓ ✓
Aguarico PK-d4 Pacayacu 18M 320987 9997151 ✓ ✓
Aguarico PK-e3 Pacayacu 18M 320967 9997141 ✓ ✓
Aguarico PK-f2** Pacayacu 18M 323427 9994136 ✓ ✓
Aguarico PK-g2** Pacayacu 18M 327601 9997831 ✓ ✓
Aguarico PK-h3** Pacayacu 18M 325818 9994400 ✓ ✓
Aguarico PK-i3 Pacayacu 18M 327116 9993763 ✓ ✓
Shushufindi SF-a6 Shushufindi 18M 312277 9979792 ✓ ✓
Shushufindi SF-b6 Shushufindi 18M 316303 9986562 ✓ ✓
Shushufindi SF-c4 Shushufindi 18M 316522 9973520 ✓ ✓
Shushufindi SF-d4 Shushufindi 18M 315038 9979506 ✓ ✓
Aguarico SR6 San Roque 18M 347130 9967006 ✓ ✓
Aguarico NR-c4 Nuevo Rocafuerte 18M 474080 9896603 ✓ ✓ Aguarico NR-d2 Nuevo Rocafuerte 18M 474267 9896576 ✓ ✓
M.Santiago SJ6 San José de Morona 18M 199581 9680317 ✓ ✓
M.Santiago BB6 Bomboiza 17M769754 9611197 ✓ ✓
M.Santiago S-a5 Santiago 17M829941 9663837 ✓ ✓
M.SANTIAGO M.Santiago S-b6 Santiago 17M829941 9663837 ✓ ✓
(SEAR) M.Santiago S-b6' Santiago 17M 832422 9662617 ✓ X
M.Santiago S-c5 Santiago 18M 167464 9663947 ✓ ✓
M.Santiago S-d5 Santiago 18M 168127 9664373 ✓ ✓
M.Santiago S-e5 Santiago 18M 177656 9668659 ✓ ✓
M.Santiago S-f6 Santiago 18M 181321 9670666 ✓ ✓
Teaone CC-a6 Carlos Concha 17N 645312 78233 ✓ ✓
Teaone CC-b4 Carlos Concha 17N 645665 78232 ✓ ✓
ESMERALDAS Teaone VL-a3 Vuelta Larga 17N 644715 99347 ✓ ✓
(NEPC) Teaone VL-b4* Vuelta Larga 17N 646183 102590 ✓ X
Teaone VL-b6* Vuelta Larga 17N 646440 102360 ✓ ✓
Teaone VL-c2* Vuelta Larga 17N 646459 102350 X ✓
Teaone VL-d4* Vuelta Larga 17N 646489 102370 ✓ ✓
Teaone VL-e6* Vuelta Larga 17N 646489 102370 ✓ ✓
Teaone VL-f2 Vuelta Larga 17N 647300 102237 X ✓
Teaone AG-a3 5 de Agosto 17N 647302 102241 ✓ ✓
Esmeraldas SM6 San Mateo 17N 653546 92500 ✓ ✓
Esmeraldas AG-b3 5 de Agosto 17N 649225 102340 ✓ ✓
Esmeraldas E-a6 Esmeraldas 17N 651667 105863 ✓ ✓
Esmeraldas E-b4 Esmeraldas 17N 651729 106065 ✓ ✓
PORTOVIEJO
(SEPC) Portoviejo SA6 Sta Ana 17M 574450 9868014 ✓ ✓
✓ = sample collected and analyzed ; X = non sample collected ; NEAR= Northern Ecuadorian Amazon Region; NEPC=
Northern Ecuadorian Pacific Coast ; SEAR= Southern Ecuadorian Amazon Region ; SEPC= Southern Ecuadorian Pacific
Coast.

ANNEX C
175
Table C-2. Localization (UTM) coordinates of drinking-water sampling points (Chapter 2).
STUDY AREA SOURCE CODE PARISHES UTM COORDINATES
deep well M12-17 Pacayacu 18M 325220 9998734
deep well M13-02 Pacayacu 18M 321263 9997172
deep well M13-04 Pacayacu 18M 324943 9996358
deep well M14-15 Pacayacu 18N 326344 6528
deep well M14-21 Pacayacu 18M 324345 9996378
deep well M16-07 Dayuma 18M 290875 9926921
deep well M16-13 Dayuma 18M 289988 9918939
deep well M16-21 Dayuma 18M 291280 9926372
deep well M16-26 San Sebastian del Coca 18M 275333 9966352
deep well M16-28 San Sebastian del Coca 18M 271576 9975651
deep well M16-33 Shushufindi 18M 317150 9990663
deep well M16-39 Joya de los Sachas 18M 293549 9967979
deep well M16-40 Joya de los Sachas 18M 290576 9958107
deep well M16-41 Joya de los Sachas 18M 291345 9957984
deep well M16-43 Pacayacu 18M 321072 9997195
rainfall M12-15 Pacayacu 18M 323603 9995592
rainfall M13-13 Dayuma 18M 289959 9912027
rainfall M14-05 Dayuma 18M 290749 9926167
rainfall M14-23 Pacayacu 18M 324345 9996378
rainfall M16-09 Dayuma 18M 292270 9927287
rainfall M16-15 Dayuma 18M 290854 9917918
rainfall M16-19 Dayuma 18M 304564 9918887
rainfall M16-23 Puerto Fco. de Orellana 18M 271822 9943776
NEAR river M13-14 Dayuma 18M 291087 9916886
river M13-16 Dayuma 18M 290458 9925971
river M14-20 Shushufindi 18M 316522 9973520
river M15-02 Limoncocha 18M 318689 9961878
river M16-04 Dayuma 18M 290458 9925971
river M16-22 Puerto Fco. de Orellana 18M 261244 9950543
river M16-27 San Sebastian del Coca 18M 275397 9966278
shallow well M12-14 Pacayacu 18M 323603 9995592
shallow well M13-03 Pacayacu 18M 325073 9996386
shallow well M13-07 Pacayacu 18M 325834 9993929
shallow well M13-08 Pacayacu 18M 324372 9994867
shallow well M14-22 Pacayacu 18M 324345 9996378
shallow well M16-36 Pacayacu 18M 324955 9996238
shallow well M16-37 Pacayacu 18M 323541 9995623
spring M12-11 Dayuma 18M 290853 9917917
spring M13-01 Pacayacu 18M 322806 9995660
spring M13-17 Dayuma 18M 289790 9931001
spring M13-18 Dayuma 18M 289720 9931296
spring M13-18F Dayuma 18M 289720 9931296
spring M14-12 Dayuma 18M 290854 9917918
spring M14-14 Pacayacu 18N 326344 6528
spring M16-02 Dayuma 18M 295397 9924949
spring M16-05 Dayuma 18M 290605 9923356
spring M16-14 Dayuma 18M 290802 9917724
spring M16-17 Dayuma 18M 298886 9917180
spring M16-20 Dayuma 18M 304564 9918887
stream M12-12 Dayuma 18M 290906 9917788
stream M13-09 Dureno 18N 314380 3433
stream M16-25 Puerto Fco. de Orellana 18M 271659 9943790
stream M16-29 San Sebastian del Coca 18M 268710 9982811

ANNEX C
176
Table C- 2. Localization (UTM) coordinates of drinking-water sampling points (Chapter 2). (continued)
STUDY AREA SOURCE CODE PARISHES UTM COORDINATES
system M14-04 Dayuma 18M 290749 9926167
NEAR system M16-06 Dayuma 18M 290749 9926167
system M16-11 Dayuma 18M 290576 9928171
spring M15-08C Santiago 18M 168127 9664373
rainfall M16-53 Santiago 18M 172629 9666674
river M15-09C Santiago 17M 829941 9663837
river M15-10C Santiago 18M 177656 9668659
river M15-11C Santiago 18M 167464 9663947
SEAR spring M16-47 Bomboiza 17M 769851 9610949
spring M16-48 Bomboiza 17M 769851 9610949
spring M16-52 Santiago 17M 832422 9662617
spring M16-54 Santiago 18M 172629 9666674
spring M16-56 Santiago 18M 172253 9665191
stream M16-46 Bomboiza 17M 769754 9611197
system M16-55 Santiago 17M 832361 9662423
system M16-59 Vuelta Larga 17N 646394 102410
system M14-29 Vuelta Larga 17N 645029 101631
rainfall M16-67 Vuelta Larga 17N 646959 100260
system M16-61 Vuelta Larga 17N 645029 101631
system M16-64 Vuelta Larga 17N 645083 101687
NEPC system M16-65 Vuelta Larga 17N 645139 101601
system M16-66 Vuelta Larga 17N 644921 101610
system M16-68 Vuelta Larga 17N 646959 100260
system M16-69 Vuelta Larga 17N 645512 101547
system M16-70 5 de Agosto 17N 647094 103010
system M16-71 5 de Agosto 17N 647392 102576
system M16-72 5 de Agosto 17N 648973 102086
system M16-73 Vuelta Larga 17N 645916 101387
SEPC shallow well M16-77 Sta Ana 17M 574193 9864533
system M16-76 Sta Ana 17M 572397 9865618
NEAR= Northern Ecuadorian Amazon Region; NEPC= Northern Ecuadorian Pacific Coast ; SEAR= Southern
Ecuadorian Amazon Region ; SEPC= Southern Ecuadorian Pacific Coast.

"When the moment comes to choose between economic growth and ecological stability,
politicians, CEOs and voters almost always prefer growth. In the twenty-first century, we shall
have to do better if we are to avoid catastrophe"
-Yuval Noah Harari, 2016

LOPEZ MEDINA Fausto
TITLE: Environmental impacts of current and past oil activities on water quality in Ecuador
ABSTRACT:
Spills and discharges of solid and liquid residues caused by the oil industry in Ecuador have resulted in the presence of pollutants with a high content of hydrocarbons (PAHs and BTEX) and metal elements (salts), which are known for their acute and/or chronic toxicity. This study aims to assess the quality of the aquatic environment in three watersheds (Esmeraldas, Napo and Aguarico) in the extraction and refining zones in order to determine the level of environmental and human risk from different water sources. The sources analyzed are in compliance with environmental guidelines and are defined as "non-toxic". Pollution from oil activities is punctual. Urbanization and agriculture are also visualized as stress factors for water bodies. Human risk is mainly related to low water mineralization and in some cases to the presence of inorganic elements (Mn, As, Al and Zn).
KEYWORDS:
Ecuador; oil activities; water quality; polycyclic aromatic hydrocarbons, metal(loid)s; health
risk.

AUTEUR : LOPEZ MEDINA Fausto
TITRE : Impacts environnementaux des activités pétrolières actuelles et passées sur la qualité des eaux en Equateur
DIRECTRICES DE THESE : Laurence MAURICE, Eva SCHRECK,
ET DATE DE SOUTENANCE : Toulouse, le 10 juillet 2019.
RESUME :
Les déversements et le rejet de résidus solides et liquides causés par l'industrie pétrolière en
Équateur ont entraîné la présence de déchets à forte teneur en hydrocarbures (HAP et BTEX)
et en éléments métalliques (sels), qui sont reconnus pour leur toxicité aiguë et/ou chronique.
Cette étude vise à évaluer la qualité du milieu aquatique dans trois bassins versants
(Esmeraldas, Napo et Aguarico) sur les zones d'extraction et de raffinage afin de déterminer
le niveau de risque environnemental et humain à partir de différentes sources d'eau.
Les sources analysées sont conformes aux indicateurs environnementaux et définis comme
"non toxiques". La pollution due aux activités pétrolières est ponctuelle. L'urbanisation et
l'agriculture sont aussi visualisées comme facteurs de stress des masses d'eau. Le risque
humain est lié principalement à la faible minéralisation de l'eau et dans certains cas à la
présence d'éléments inorganiques (Mn, As, Al et Zn).
MOTS-CLES : Equateur; Activités pétrolières; Qualité des eaux, hydrocarbures aromatiques polycycliques, Métaux; Risque sanitaire.
DISCIPLINE ADMINISTRATIVE : SURFACES ET INTERFACES CONTINENTALES, HYDROLOGIE
INTITULE ET ADRESSE DE L'U.F.R. OU DU LABORATOIRE :
Géosciences Environnement Toulouse (GET) UMR 5563 CNRS/ UR 234 IRD/ UM 97 UPS/ CNES Observatoire Midi-Pyrénées 14 Avenue Edouard Belin 31400 Toulouse France
Copyright © 2022 FDOKUMEN

