Designing Representations for Digital Documents - TEL
169
HAL Id: tel-03662229 https://tel.archives-ouvertes.fr/tel-03662229 Submitted on 9 May 2022 HAL is a multi-disciplinary open access archive for the deposit and dissemination of sci- entific research documents, whether they are pub- lished or not. The documents may come from teaching and research institutions in France or abroad, or from public or private research centers. L’archive ouverte pluridisciplinaire HAL, est destinée au dépôt et à la diffusion de documents scientifiques de niveau recherche, publiés ou non, émanant des établissements d’enseignement et de recherche français ou étrangers, des laboratoires publics ou privés. Designing Representations for Digital Documents Han Han To cite this version: Han Han. Designing Representations for Digital Documents. Human-Computer Interaction [cs.HC]. Université Paris-Saclay, 2022. English. NNT: 2022UPASG025. tel-03662229
-
Upload
khangminh22 -
Category
Documents
-
view
1 -
download
0
Transcript of Designing Representations for Digital Documents - TEL

HAL Id: tel-03662229https://tel.archives-ouvertes.fr/tel-03662229
Submitted on 9 May 2022
HAL is a multi-disciplinary open accessarchive for the deposit and dissemination of sci-entific research documents, whether they are pub-lished or not. The documents may come fromteaching and research institutions in France orabroad, or from public or private research centers.
L’archive ouverte pluridisciplinaire HAL, estdestinée au dépôt et à la diffusion de documentsscientifiques de niveau recherche, publiés ou non,émanant des établissements d’enseignement et derecherche français ou étrangers, des laboratoirespublics ou privés.
Designing Representations for Digital DocumentsHan Han
To cite this version:Han Han. Designing Representations for Digital Documents. Human-Computer Interaction [cs.HC].Université Paris-Saclay, 2022. English. �NNT : 2022UPASG025�. �tel-03662229�

Designing Representations for Digital Documents
Conception de représentations pour les documents numériques
Thèse de doctorat de l'université Paris-Saclay
École doctorale n°580 Sciences et technologies de l information et de la communication (STIC)
Spécialité de doctorat : Informatique Graduate School : informatique et sciences du numérique
Référent : Faculté de sciences d Orsay
Thèse préparée dans l unité de recherche Laboratoire Interdisciplinaire des
Sciences du Numérique (Université Paris-Saclay, CNRS, Inria), sous la direction de Michel BEAUDOUIN-LAFON, Professeur
Thèse soutenue à Paris-Saclay, le 30 Mars 2022, par
Han HAN
Composition du Jury
Sarah COHEN-BOULAKIA Professeure, Université Paris-Saclay
Présidente
James HOLLAN Professeur, University of California San Diego
Rapporteur & Examinateur
Yannick PRIÉ Professeur, Université de Nantes
Rapporteur & Examinateur
Victoria BELLOTTI Chercheur UX Senior, Netflix
Examinatrice
Ken HINCKLEY Directeur de la recherche, Microsoft
Examinateur
Michel BEAUDOUIN-LAFON Professeur, Université Paris-Saclay
Directeur de thèse
NN
T : 2
022U
PASG
025
TH
ESE
DE
DO
CT
OR
AT

Titre : Conception de représentations pour les documents numériques
Mots clés : Interaction Humain-Machine, Design d interaction, Utilisateur extrême, Interface graphique, Documents numériques, Mod les d interaction
Résumé : Des millions d utilisateurs travaillent l aide de documents afin d effectuer leurs t ches quotidiennes, mais les interfaces utilisateurs n ont pas fondamentalement changé depuis leur première conception à la fin des années 70. Les ordinateurs d aujourd hui sont utilis s par une grande vari t d utilisateurs pour r aliser un large ventail de tâches, ce qui interroge les limites des interfaces actuelles. Je soutiens qu en se concentrant sur les utilisateurs extrêmes et en adoptant une perspective fondée sur des principes de conception, nous pouvons concevoir des représentations efficaces et flexibles pour soutenir le travail de connaissance lié aux documents.
J tudie d abord l une des t ches les plus courantes, savoir le traitement de texte dans le contexte des documents techniques. En nous concentrant sur les professionnels du droit, nous mettons en lumière les limites des logiciels de traitement de texte actuels. Les professionnels du droit doivent faire appel à leur mémoire pour gérer les dépendances et maintenir un vocabulaire cohérent dans leurs documentations. Pour résoudre ces problèmes, nous introduisons Textlets, des objets interactifs qui réifient les sélections de texte en éléments persistants. Nous présentons un prototype de preuve de concept d montrant plusieurs cas d utilisation, notamment la recherche et le remplacement sélectifs, le comptage des mots et les mots alternatifs. L valuation observationnelle montre l utilit et l efficacit de Textlets, ce qui prouve la validité du concept.
Au cours de mon travail avec des professionnels du droit, j ai t initi la r daction et au d p t de brevets. Dans le processus de brevetage, les avocats rédigent des demandes de brevet qui décrivent une invention donnée. Les examinateurs de brevets étudient la demande et décident si un brevet peut lui être accordé. En collaboration avec l Office europ en des brevets, j ai tudi le processus de recherche et de révision des examinateurs de brevets.
L tude montre la n cessit de g rer le texte de plusieurs documents
à travers diverses activités interconnectées, tout en suivant manuellement leur provenance. Je prolonge Textlets pour créer Passages, des objets de sélection de texte qui peuvent être manipulés, réutilisés et partagés entre plusieurs outils. Deux tudes d utilisateurs montrent que Passages facilitent les pratiques des professionnels et permettent une plus grande réutilisation des informations.
Ces deux projets ont conduit à un autre aspect important du travail intellectuel : la gestion des fichiers. Je me concentre sur les scientifiques, un autre exemple d utilisateurs extr mes, pour tudier leurs pratiques de gestion des documents. Les scientifiques travaillent avec une vari t d outils et ils ont des difficult s utiliser le système de fichiers pour suivre et maintenir la cohérence entre des informations connexes mais distribuées. Nous avons créé FileWeaver, un système qui détecte automatiquement les dépendances entre les fichiers sans action explicite de l utilisateur, suit leur historique et permet aux utilisateurs d interagir directement avec les graphiques repr sentant ces d pendances et l historique des versions. En rendant les dépendances entre fichiers visibles, FileWeaver facilite l automatisation des flux de travail des scientifiques et des autres utilisateurs qui s appuient sur le syst me de fichiers pour g rer leurs données.
Je réfléchis à mon expérience de conception et d valuation de ces représentations et propose trois nouveaux principes de conception : granularité, individualité et synchronisation.
Avec les résultats empiriques de ces utilisateurs extrêmes, la démonstration technologique de trois prototypes de preuve de concept et trois principes de conception, cette thèse démontre de nouvelles approches originales pour travailler avec des documents. Je soutiens qu en adoptant une perspective fond e sur les principes et la théorie, nous pouvons contribuer à des concepts d interface innovants.

3
Title : Designing Representations for Digital Documents
Keywords : Human-Computer Interaction, Interaction Design, Extreme User, Graphical User Interface, Digital Documents, Interaction Model
Abstract : Millions of users work with documents for their everyday tasks but their user interfaces have not fundamentally changed since they were first designed in the late seventies. Today s computers come in many forms and are used by a wide variety of users for a wide range of tasks, challenging the limits of current document interfaces. I argue that by focusing on extreme users and taking on a principled perspective, we can design effective and flexible representations to support document-related knowledge work.
I first study one of the most common document tasks, text editing, in the context of technical documents. By focusing on legal professionals, one example of extreme document users, we reveal the limits of current word processors. Legal professionals must rely on their memory to manage dependencies and maintain consistent vocabulary within their technical documents. To address these issues, we introduce Textlets, interactive objects that reify text selections into persistent items. We present a proof-of-concept prototype demonstrating several use cases, including selective search and replace, word count, and alternative wording. The observational evaluation shows the usefulness and effectiveness of textlets, providing evidence of the validity of the textlet concept.
During my work with legal professionals in the first project, I was introduced to the domain of patent writing and filling. In the patent process, patent attorneys write patent submissions that describe the invention created by the inventor. Patent examiners review the submission and decide whether the submission can be granted as a patent. In collaboration with a European Patent Office, I studied the patent examiners search and review process. The study reveals the need to manage text from multiple documents across various interconnected activities, including searching, collecting, annotating, organizing, writing and reviewing, while manually tracking their provenance. I extend Textlets to create Passages, text selection objects that can be
manipulated, reused, and shared across multiple tools. Two user studies show that Passages facilitate knowledge workers practices and enable greater reuse of information.
These two projects led to another important aspect of knowledge work: file management. I focus on scientists, another example of extreme knowledge workers, to study their document management practices. In an age where heterogeneous data science workflows are the norm, instead of relying on more self-contained environments such as Jupyter Notebooks, scientists work across many diverse tools. They have difficulties using the file system to keep track of, re-find and maintain consistency among related but distributed information. We created FileWeaver, a system that automatically detects dependencies among files without explicit user action, tracks their history, and lets users interact directly with the graphs representing these dependencies and version history. By making dependencies among files explicit and visible, FileWeaver facilitates the automation of workflows by scientists and other users who rely on the file system to manage their data.
These three document representations rely on the same underlying theoretical principles: reification, polymorphism and reuse. I reflect on my experience designing and evaluating these representations and propose three new design principles: granularity, individuality and synchronization.
Together with the empirical findings from three examples of extreme users, technological demonstration of three proof-of-concept prototypes and three design principles, this thesis demonstrates fresh new approaches to working with documents, a fundamental representation in GUIs. I argue that we should not accept current desktop interfaces as given, and that by taking on a principled and theory-driven perspective we can contribute innovative interface concepts.


Synthèse en Français
Des millions d’utilisateurs travaillent à l’aide de documents afin d’effectuer leurs tâches quotidiennes,mais les interfaces utilisateurs n’ont pas fondamentalement changé depuis leur première conception àla fin des années 70 (Smith et al., 1982). Les ordinateurs d’aujourd’hui se présentent sous différentesformes et sont utilisés par une grande variété d’utilisateurs pour réaliser un large éventail de tâches,ce qui interroge les limites des interfaces actuelles. Je soutiens qu’en se concentrant sur les utilisateursextrêmes et en adoptant une perspective fondée sur des principes de conception, nous pouvons concevoirdes représentations efficaces et flexibles pour soutenir le travail de connaissance lié aux documents.
J’étudie d’abord l’une des tâches les plus courantes, à savoir le traitement de texte dans le contexte desdocuments techniques. En nous concentrant sur les professionnels du droit, un exemple d’utilisateurs ex-trêmes, nous mettons en lumière les limites des logiciels de traitement de texte actuels. Les professionnelsdu droit doivent faire appel à leur mémoire pour gérer les dépendances et maintenir un vocabulaire co-hérent dans leurs documents techniques. Pour résoudre ces problèmes, nous introduisons les Textlets, desobjets interactifs qui réifient les sélections de texte en éléments persistants. Nous présentons un prototypede preuve de concept démontrant plusieurs cas d’utilisation, notamment la recherche et le remplacementsélectifs, le comptage des mots et les mots alternatifs. L’évaluation observationnelle montre l’utilité etl’efficacité des Textlets, ce qui prouve la validité du concept.
Au cours de mon travail avec des professionnels du droit dans le cadre du premier projet, j’ai été initié àla rédaction et au dépôt de brevets. Dans le processus de brevetage, les avocats rédigent des demandes debrevet qui décrivent l’invention créée par l’inventeur. Les examinateurs de brevets étudient la demande etdécident si un brevet peut lui être accordé. Je me suis intéressé à la manière dont les examinateurs analy-sent et étudient les documents techniques, en complément du processus de rédaction des documents. Encollaboration avec une institution chargée de l’attribution de brevets, j’ai étudié le processus de rechercheet de révision des examinateurs de brevets. L’étude montre la nécessité de gérer le texte de plusieursdocuments à travers diverses activités interconnectées, notamment la recherche, la collecte, l’annotation,l’organisation, la rédaction et la révision, tout en suivant manuellement leur provenance. Je développe

iv
les Textlets pour créer des Passages, des objets de sélection de texte qui peuvent être manipulés, réutil-isés et partagés entre plusieurs outils. Deux études d’utilisateurs montrent que les Passages facilitent lespratiques des professionnels et permettent une plus grande réutilisation des informations.
Ces deux projets ont conduit à un autre aspect important du travail intellectuel : la gestion des fichiers. Jeme concentre sur les scientifiques, un autre exemple d’utilisateurs extrêmes, pour étudier leurs pratiquesde gestion des documents. À une époque où les flux de travail hétérogènes sont la norme en science desdonnées, au lieu de s’appuyer sur des environnements plus autonomes tels que Jupyter Notebooks, lesscientifiques travaillent avec une variété d’outils. Ils ont des difficultés à utiliser le système de fichiers poursuivre, retrouver et maintenir la cohérence entre des informations connexes mais distribuées. Nous avonscréé FileWeaver, un système qui détecte automatiquement les dépendances entre les fichiers sans actionexplicite de l’utilisateur, suit leur historique et permet aux utilisateurs d’interagir directement avec lesgraphiques représentant ces dépendances et l’historique des versions. En rendant les dépendances entrefichiers explicites et visibles, FileWeaver facilite l’automatisation des flux de travail des scientifiques et desautres utilisateurs qui s’appuient sur le système de fichiers pour gérer leurs données.
Ces trois représentations de documents reposent sur les mêmes principes théoriques : réification, polymor-phisme et réutilisation. Je réfléchis à mon expérience de conception et d’évaluation de ces représentationset propose trois nouveaux principes de conception : granularité, individualité et synchronisation.
Avec les résultats empiriques de trois exemples d’utilisateurs extrêmes, la démonstration technologique detrois prototypes de preuve de concept et trois principes de conception, cette thèse démontre de nouvellesapproches originales pour travailler avec des documents, une représentation fondamentale dans les inter-faces graphiques. Je soutiens que nous ne devrions pas accepter les interfaces de bureau actuelles pouracquises, et qu’en adoptant une perspective fondée sur les principes et la théorie, nous pouvons contribuerà des concepts d’interface innovants.

Abstract
Millions of users work with documents for their everyday tasks but their user interfaces have not funda-mentally changed since they were first designed in the late seventies. Today’s computers come in manyforms and are used by a wide variety of users for a wide range of tasks, challenging the limits of currentdocument interfaces. I argue that by focusing on extreme users and taking on a principled perspective, wecan design effective and flexible representations to support document-related knowledge work.
I first study one of the most common document tasks, text editing, in the context of technical documents.By focusing on legal professionals, one example of extreme document users, we reveal the limits of currentword processors. Legal professionals must rely on their memory to manage dependencies and maintainconsistent vocabulary within their technical documents. To address these issues, we introduce Textlets,interactive objects that reify text selections into persistent items. We present a proof-of-concept prototypedemonstrating several use cases, including selective search and replace, word count, and alternative word-ing. The observational evaluation shows the usefulness and effectiveness of textlets, providing evidence ofthe validity of the textlet concept.
During my work with legal professionals in the first project, I was introduced to the domain of patent writ-ing and filling. In the patent process, patent attorneys write patent submissions that describe the inventioncreated by the inventor. Patent examiners review the submission and decide whether the submission canbe granted as a patent. In collaboration with a European Patent Office, I studied the patent examiners’search and review process. The study reveals the need to manage text from multiple documents acrossvarious interconnected activities, including searching, collecting, annotating, organizing, writing and re-viewing, while manually tracking their provenance. I extend Textlets to create Passages, text selectionobjects that can be manipulated, reused, and shared across multiple tools. Two user studies show thatPassages facilitate knowledge workers practices and enable greater reuse of information.
These two projects led to another important aspect of knowledge work: file management. I focus onscientists, another example of extreme knowledge workers, to study their document management prac-

vi
tices. In an age where heterogeneous data science workflows are the norm, instead of relying on moreself-contained environments such as Jupyter Notebooks, scientists work across many diverse tools. Theyhave difficulties using the file system to keep track of, re-find and maintain consistency among related butdistributed information. We created FileWeaver, a system that automatically detects dependencies amongfiles without explicit user action, tracks their history, and lets users interact directly with the graphs repre-senting these dependencies and version history. By making dependencies among files explicit and visible,FileWeaver facilitates the automation of workflows by scientists and other users who rely on the file systemto manage their data.
These three document representations rely on the same underlying theoretical principles: reification, poly-morphism and reuse. I reflect on my experience designing and evaluating these representations andpropose three new design principles: granularity, individuality and synchronization.
Together with the empirical findings from three examples of extreme users, technological demonstrationof three proof-of-concept prototypes and three design principles, this thesis demonstrates fresh new ap-proaches to working with documents, a fundamental representation in GUIs. I argue that we should notaccept current desktop interfaces as given, and that by taking on a principled and theory-driven perspectivewe can contribute innovative interface concepts.

Acknowledgments
When I look back at the past three years, I feel fortunate that I’ve been able to finish this thesis in acompany of an incredibly generous, supportive, and inspiring group of people.
To Michel, I offer my heartfelt gratitude. It is from you that I learned to pick the right research question,think deeply, challenge the obvious and communicate the key messages. I have learned that what it takesto do great work: a vision, high standard and hard work. These things have pushed and will always pushme to achieve the best as I can, to do great work. I don’t think I could ever learn enough of you. Everyconversation with you, I learn something.
To Wendy, I learned so much from you. Thank you for sharing your vast knowledge about conductingresearch and all your experience. I will never forget the energy you have when we talked about researchand that energy is infectious.
Thank you my jury members : Sarah, Jim, Yannick, Victoria and Ken, for your interest, support and advicefor my research. I appreciate it. Thank you Victoria for your generous mentorship and guidance to mycareer. I still vividly remember your can-do attitude when I ask you to be an examiner of my thesis. Thankyou for taking on this challenge.
To all my collaborators, Miguel, Julien, Enjung, Junhang, Raphael, Alex. I am lucky to have the opportunityto work with you. We worked hard and your contribution to this thesis is enormous. To other colleagueson the same boat, Viktor, Liz, Miguel and Téo, we all made it. To the previous generation of Ph.D students,Marianela, Carla, Stacy, Germán, Nolwenn, Jean-Philippe, Michael and Philip, thank you all for the sharingof Ph.D experience and advice with me. The advice guided me through my own journey. To the newmembers of ExSitu team, Tove, Alex, Arthur, Camille, Capucine, Anna and Wissal, best of luck for yourjourneys. I am sure they will be uniquely interesting.
Thank you Junhang for showing me design and showing me how to use my eyes to see good design. With
viii
you, we were able to make the vision a reality. Working with you is one of my most creative periods in thepast three years. Thank you for supporting me to the end of this journey by being my technical supportfor this defense. You are the best producer. We need to make a movie together.
To Domenico, the director of European Patent Office. Thank you for accepting my research proposal andyour generous support and trust to a young researcher. I will always remember the first time we met inthe business meeting. You brought sense of humour to the seriousness of the meeting. It reminds me ofwhat John Cleese said something about ”being funny does not make the business we are discussing lessserious”. I truly believe that.
And my girlfriend Mylène. You let me see the exciting parts of life outside of research. You bring thesunshine to me. I bring HCI to you... You have this unique ability to see my research in a crystal clear way.Thank you for being just you.
And lastly, to my mum and dad, I know that you guys are always there for me, as my parents who giveme love but also as friends who give me advice about life. You will always be my mentors no matter howmany doctor degrees I have.
Thank you all very much.
This work was supported by European Research Council (ERC) grant No 695464 “ONE: Unified Principlesof Interaction.

ix
Contents
1 Introduction 1
1.1 Thesis Statement . . . . . . . . . . . . . . . . . . . . . . . . . 3
1.2 Research Approach . . . . . . . . . . . . . . . . . . . . . . . . 3
1.3 Contribution . . . . . . . . . . . . . . . . . . . . . . . . . . . . 4
1.4 Organization . . . . . . . . . . . . . . . . . . . . . . . . . . . . 5
1.5 Publications . . . . . . . . . . . . . . . . . . . . . . . . . . . . 6
1.6 On The Use Of The Pronoun ’We’ . . . . . . . . . . . . . . 7
2 Background 9
2.1 Representation and Manipulation . . . . . . . . . . . . . . 9
2.2 Personal Information Management . . . . . . . . . . . . . . 14
2.3 Document Software Systems . . . . . . . . . . . . . . . . . . 17
2.4 Interaction Frameworks and Models . . . . . . . . . . . . . 20
3 Representation for Document Editing 23
3.1 Context . . . . . . . . . . . . . . . . . . . . . . . . . . . . . . . 23
3.2 Related Work . . . . . . . . . . . . . . . . . . . . . . . . . . . 24
3.3 Interview with Legal Professionals . . . . . . . . . . . . . . 26
3.4 Results and Discussion . . . . . . . . . . . . . . . . . . . . . 28
3.5 Textlets Concept . . . . . . . . . . . . . . . . . . . . . . . . . 33
3.6 Textlets User Interface . . . . . . . . . . . . . . . . . . . . . . 40
3.7 Structured Observation . . . . . . . . . . . . . . . . . . . . . 44
3.8 Results and Discussion . . . . . . . . . . . . . . . . . . . . . 45
3.9 Conclusion . . . . . . . . . . . . . . . . . . . . . . . . . . . . . 48
4 Representation for Document Analysis 51
4.1 Context . . . . . . . . . . . . . . . . . . . . . . . . . . . . . . . 52
4.2 Related Work . . . . . . . . . . . . . . . . . . . . . . . . . . . 53
4.3 Study 1: Interviews with Patent Examiners . . . . . . . . 56
4.4 Results and Dicussion . . . . . . . . . . . . . . . . . . . . . . 57
4.5 Study 2: Interviews with Scientists . . . . . . . . . . . . . . 62
4.6 Results and Discussion . . . . . . . . . . . . . . . . . . . . . 63

x
4.7 Passages Concept . . . . . . . . . . . . . . . . . . . . . . . . . 65
4.8 The User Experience . . . . . . . . . . . . . . . . . . . . . . . 66
4.9 Passages User Interface . . . . . . . . . . . . . . . . . . . . . 70
4.10 Study 3: Design Walkthrough with Patent Examiners . . 75
4.11 Results and Discussion . . . . . . . . . . . . . . . . . . . . . 77
4.12 Study 4: Structured Observation with Scientists . . . . . 78
4.13 Results and Discussion . . . . . . . . . . . . . . . . . . . . . 80
4.14 Conclusion . . . . . . . . . . . . . . . . . . . . . . . . . . . . . 85
5 Representation for Document Management 87
5.1 Context . . . . . . . . . . . . . . . . . . . . . . . . . . . . . . . 88
5.2 Related Work . . . . . . . . . . . . . . . . . . . . . . . . . . . 89
5.3 Interviews with Scientists . . . . . . . . . . . . . . . . . . . . 92
5.4 Results and Discussion . . . . . . . . . . . . . . . . . . . . . 92
5.5 FileWeaver User Interface . . . . . . . . . . . . . . . . . . . . 99
5.6 The User Experience . . . . . . . . . . . . . . . . . . . . . . . 101
5.7 System Implementation . . . . . . . . . . . . . . . . . . . . . 104
5.8 Discussion and Evaluation . . . . . . . . . . . . . . . . . . . 108
5.9 Conclusion . . . . . . . . . . . . . . . . . . . . . . . . . . . . . 110
6 Design Principles 113
6.1 Granularity . . . . . . . . . . . . . . . . . . . . . . . . . . . . . 113
6.2 Individuality . . . . . . . . . . . . . . . . . . . . . . . . . . . . 116
6.3 Synchronization . . . . . . . . . . . . . . . . . . . . . . . . . . 118
6.4 Summary . . . . . . . . . . . . . . . . . . . . . . . . . . . . . . 121
7 Conclusion and Future Work 123
7.1 Conclusion . . . . . . . . . . . . . . . . . . . . . . . . . . . . . 123
7.2 Future Work . . . . . . . . . . . . . . . . . . . . . . . . . . . . 125

xi
List of Figures
1.1 The Star Interface. Source: Smith et al. (1982) 1
1.2 The scrollbar to navigate a document has not evolved from XeroxStar (1981) to Windows 10 (2015). (Arguably, MacOS changedthe scrollbars significantly by reversing the direction of move-ment related to the users motion. Also, iOS popularized inertialscrolling and the disappearance of scrollbar.) Source: https://scrollbars.matoseb.com/ 3
1.3 Illustration of the thesis organization. The main chapters focuseson 1) single document editing, 2) multiple documents analysisand 3) multiple documents management. 6
2.1 Selected examples of evolving writing surfaces and tools. Imagesfrom a wonderful BBC documentary about the history of writing.Source: https://www.bbc.co.uk/programmes/m000mtml 9
2.2 A reproduced page of Leonardo da Vinci’s notebook. Source:https://commons.wikimedia.org/wiki/File:Reproduction_of_page
_from_notebook_of_Leonardo_da_Vinci_LCCN2006681086.jpg 10
2.3 If Sumerians designed the icon, it may look like this. 10
2.4 Evolution of document icon. Source: https://commons.wikimedia.org/wiki/File:Evolution_of_the_document_icon_shape.jpg 10
2.5 Perceptual properties of visual and auditory systems. Left is fromSemiology of Graphics (Bertin, 1983) and right is from SonicFinder (Gaver,1989) 11
2.6 A simplified definition of representation 12
2.7 Example of Denis Diderot’s encyclopedie. Source: https://commons.wikimedia.org/wiki/File:Defehrt_epinglier_pl2.jpg 13
2.8 Scott McCloud shows how comics represent invisible things suchas smell. Image taken from (McCloud, 1993) 13
2.9 Bill Verplank’s Sketch interaction design. Source: http://billverplank.com/CiiD/IDSketch.pdf 13

xii
2.10 Screenshot from the video where Ron Kaplan and Allen Newelltried to use the copier. Source: https://www.youtube.com/watch
?v=DUwXN01ARYg 14
2.11 Biologist’s paper lab notebook. Source: Tabard et al. (2008) 15
2.12 Field biologist’s paper lab notebook. Source: Yeh et al. (2006) 15
2.13 Jupyter Notebook. Source: https://jupyter.org/ 16
2.14 Bush’s Memex 17
2.15 Engelbart’s NLS. (See demo: https://www.youtube.com/watch?v=qI8r8D46JOY&list=PL76DBC8D6718B8FD3&index=9 17
2.16 Nelson’s Xanadu. See demo: https://www.youtube.com/watch
?v=En_2T7KH6RA 17
2.17 Cut-paste in Gypsy. See demo: https://www.youtube.com/watch?v=Dhmz68CII9Y 18
2.18 Dourish et al.’s Presto 18
2.19 Bederson and Hollan’s Pad++ 18
2.20 Robertson et al.’s Data Mountain 19
2.21 Fertig et al.’s Lifestreams 19
2.22 Oleksik et al.’s TAGtivity 19
2.23 Jacob et al.’s Reality-Based Interaction 20
2.24 Beaudouin-Lafon’s Instrumental Interaction 21
3.1 Editing a document 23
3.2 Example of technical documents: patent (top), technical manual(middle), contract (bottom) 24
3.3 Miller and Marshall’s cluster-based search and replace 25
3.4 Beaudouin-Lafon’s instrumental search and replace 25
3.5 Oney and Brandt’s Codelets 26
3.6 Kery et al.’s Variolite 26
3.7 Ko and Myers’s Barista 26
3.8 Critical object interviews in participants’ workplace. 27
3.9 A collection of story portraits based on the analysis 28
3.10 Which term to use? 28
3.11 Summary of Invention and claims are linked 29
3.12 Patent claims use three different numbering systems (left). Patentillustration (right). 30
3.13 Normal and automatic numbering. The user cannot tell themapart unless she selects them 30
3.14 Participant jumps at different document locations. 31
3.15 A story portrait illustrating how one participant consolidate changesfrom various collaborators as it from one party 32
3.16 Transient selection. a,b) the user selects a piece of text; c) sheapplies a set of command to it; d) the appearance of the text haschanged based on the command; e) as soon as she selects anothertext, the previous selection is gone. 34

xiii
3.17 Hill et al. (1992)’s Edit and Read Wear 36
3.18 Microsoft Word’s word count with a modal dialog 38
3.19 A mock-up of timelets. The user can record her voice and see thetime she takes to read the text. 38
3.20 Dragicevic et al. (2019)’s explorable multiverse analyses 38
3.21 Goffin et al. (2017)’s word-scale graphics embedded in text docu-ments 38
3.22 Bret Viktor’s computed text. Source: What can a technologist doabout climate change 39
3.23 First prototype with the side panel showing a variantlet, a countlet
and a numberlet containing a numbered item and a reference, andtheir visualization in the document. 40
3.24 Countlet: a textlet for counting words. 41
3.25 Variantlet: a textlet for editing local versions. 41
3.26 Numberlet: a textlet for numbering and referencing. 42
3.27 Searchlet: a textlet for searching and replacing text. 43
3.28 A user think-aloud in the observational study 44
3.29 A timeline of study procedure 45
3.30 Adding the design of individual replacement, undo and ignore,based on participants feedback 45
4.1 Analyze multiple documents 51
4.2 O’Hara et al. (1998)’s model of various document related activitiesof library users. 52
4.3 Hinckley et al. (2012)’s Gather Reader 54
4.4 Tashman and Edwards (2011b)’s Liquid Text 54
4.5 Subramonyam et al. (2020)’s TexSketch 54
4.6 Hearst (1995)’s TileBar 55
4.7 schraefel et al. (2002)’s HunterGather 55
4.8 Liu et al. (2019)’s Unakite 55
4.9 Gotz (2007)’s Scratchpad 55
4.10 Patent examiners engage in a series of document-related activitieswhen searching for prior art, including formulating search terms;reading and annotating documents; and writing and reviewingtheir own and other examiners’ reports. 58
4.11 Tables created by P2 and P5 for their literature reviews. 64
4.12 Passages reifies text selections into interactive objects that can bemanipulated, reused and shared across applications 66
4.13 The Viewer lets Emma collect interesting text as passages, by se-lecting them and clicking the “Passage” button. 67
4.14 The Table lets Emma drag and drop collected passages and orga-nize them into rows and columns 68

xiv
4.15 The Searcher lets Emma iteratively search for more documents byspecifying multiple search terms, and keeping track of her searchhistory. 68
4.16 The Editor helps Emma communicate her findings, while pre-serving the provenance of each passage as she writes her report.
69
4.17 (a) Fluid transitions across applications through drag-and-drop ofpassages between windows; (b) Reuse of content and structurefrom the Table directly into the Editor 70
4.18 The Reader lets Alex read the report while still easily accessingthe source documents to verify the claims 71
4.19 Passages overall user interface with six applications. 72
4.20 One participant’s critiques and suggestions for seven interactionpoints demonstrating the key features of Passages in the generativewalkthrough workshop. 75
4.21 A timeline of the design walkthrough 76
4.22 Having both source and reference side by side. 77
4.23 Document set and application choice are counterbalanced. 79
4.24 Interacting with Passages: Table (a) and report (c) created by par-ticipants. (b) P4 drag-dropped a newly created passage directlyinto the Table. 81
4.25 Participants largely reuse the passages collected. 81
4.26 In current design, dropping a passage in the editor (a) inserts thewhole raw passage (b). 84
5.1 Manage multiple documents. 87
5.2 Guo (2012)’s typical data science workflow 88
5.3 Information locked in its applications. 89
5.4 Tabard et al. (2008)’s research shows how biologists juggles com-plex mix of paper and computer-based information. 90
5.5 A Jupyter notebook combines code, text and visualization in a sin-gle notebook format. Image taken from (Rule et al., 2018b). 90
5.6 Karlson et al. (2011)’s versionset: folder view with indentation(top) and graph view showing file relationship (bottom) 91
5.7 Sourcetree’s timeline interface for version control. Source: https://www.sourcetreeapp.com/ 91
5.8 Scientists take advantages of different artifacts such as paper, white-board, lab notebook and Jupyter notebook 93
5.9 Hoard information such as whiteboard photos, paper and scriptversions. 94
5.10 Various strategies for re-finding, e.g. summarizing, linking andcombined with other documents. 95
5.11 Rapid lifecycle of various documents in scentists’ workflow. 97

xv
5.12 The FileWeaver User Interface. The Folder View is a standard filebrowsing window. Users can add files together with their depen-dencies to the Graph View by clicking “Add File”. The GraphView was displayed by selecting main.tex in the Folder View,and shows the dependency graph for that file. The History Viewshows the history of versions of main.tex 99
5.13 Graph View with a copy (green arrow). 100
5.14 A morph file 100
5.15 History View. 100
5.16 Selected user interaction to detect and maintain file dependencies.(See text and video for a complete interaction) 101
5.17 Selected user interaction to manage variants of files. (See text andvideo for a complete interaction) 102
5.18 Selected user interaction to manage history and version of a file.(See text and video for a complete interaction) 103
5.19 Selected user interaction to easily share all related files. (See textand video for a complete interaction) 103
5.20 Each file managed by FileWeaver has a cookbook page, in a hiddenfolder called cookbook. A cookbook page also holds the versioncontrol repository. 106
6.1 Text is treated as a character in a word processor (left) but as agraphic in a font design software. Image taken from: MicrosoftWord and FontArk (Source: https://fontark.net/farkwp/). 114
6.2 Rivière et al. (2019)’s MoveOn interface with short clips represent-ing a digestible movement. 115
6.3 Variantlets 115
6.4 A morph represents a group of similar files. 116
6.5 Interactions to manipulate groups of objects in Draco (Kazi et al.,2014), DataInk (Xia et al., 2018) and Textlets. 117
6.6 Synchronization between textlets in the side panel and the maintext 119
6.7 Synchronization between the Graph View and the Folder View 120
7.1 Textlets 124
7.2 Passages 124
7.3 FileWeaver 124


xvii
List of Tables
3.1 How different behaviors of textlet address some issues and chal-lenges observed in the interview 35
4.1 How different features of Passages address the issues found inStudies 1 and 2. 75
5.1 Six issues observed in the interview study. 98
5.2 How different features of FileWeaver address issues observed inthe interview study 108
6.1 Questions that can be asked to apply the concepts and principlesin this chapter analytically, critically and constructively. 121
7.1 Thesis overview with three aspects of document-related knowl-edge work. 123


1
1Introduction
Figure 1.1. The Star Interface.
Source: Smith et al. (1982)
Today’s computer interfaces are based on principles and conceptualmodels created in the late seventies. The Xerox Star (Smith et al., 1982),which pioneered today’s graphical user interfaces (GUIs), made use of“the Desktop metaphor” with a real office, featuring the WIMP (win-dows, icons, menus, pointer) paradigm. Familiar office objects, suchas documents, folders and file drawers, are represented as small pic-tures or icons. The content of the icons are represented in a largerform called “window”. One of the fundamental representations is the

2
document, as the Star interface designers emphasize its importance:
The document is the heart of the world, and unifies it. (Johnson et al., 1989)
This emphasis is based on the assumption that “the primary use of the
system is to create and maintain documents.” (Johnson et al., 1989). Aphysical document is represented as an icon that resembles the appear-ance of a typical document. The desk is represented as a 2D workspacecalled “the Desktop” where documents are displayed.
These powerful document representations were revolutionary but sel-dom evolved since then. If we look at the scrollbar for example (Fig. 1.2),we can see that they are based on the same logic and provide the sameinteraction. Today, millions of users work with documents for a vari-ety of tasks. Do these representation still satisfy today users’ needs?Maybe not.
First, today’s document editing tools are “bloated” with hundreds offeatures (McGrenere et al., 2002), making them harder to use. De-spite the development of direct manipulation (Shneiderman, 1983),users still rely on the manipulation of additional user interface ele-ments such as menus and dialog boxes to achieve simple tasks, result-ing in cumbersome and indirect interaction with the objects of inter-est (Beaudouin-Lafon, 2000). How can we design new representationswhile preserving simplicity of interaction? Second, today’s users areoverloaded with information (Whittaker and Sidner, 1996) from vari-ous sources and in different formats. They often need to work withmultiple documents (Tashman and Edwards, 2011a) using multipleseparated applications (Oleksik et al., 2012). How do they keep trackof this complex information and manage multiple applications?
At the same time, researchers have explored new Post-WIMP 1 inter-1 https://en.wikipedia.org/wiki/
Post-WIMPaction theories and principles for designing new interfaces. For exam-ple, Beaudouin-Lafon (2000)’s Instrumental Interaction model extendsand generalizes the principles of direct manipulation, and is opera-tionalized by three design principles (Beaudouin-Lafon and Mackay,2000): Reification turns commands into first class objects or instru-ments; polymorphism applies instruments to different types of ob-jects; and reuse makes both user input and system output accessiblefor later use. How can we apply modern interaction design theoriesand principles to create alternative representations?

3
Figure 1.2. The scrollbar to navi-
gate a document has not evolved
from Xerox Star (1981) to Win-
dows 10 (2015). (Arguably, Ma-
cOS changed the scrollbars signif-
icantly by reversing the direction
of movement related to the users
motion. Also, iOS popularized in-
ertial scrolling and the disappear-
ance of scrollbar.) Source: https://
scrollbars.matoseb.com/
1.1 Thesis Statement
I argue that by focusing on extreme users and taking on a principledperspective, e.g. to represent the object of interest in the users’ mindinto manipulable interface elements, we can design effective and flexi-ble representations to support document-related knowledge work.
1.2 Research Approach
Triangulation
Mackay and Fayard (Mackay and Fayard, 1997) pointed out that “HCI
cannot be considered a pure natural science because it studies the interac-
tion between people and artificially-created artifacts, rather than naturally-
occurring phenomena, which violates several basic assumptions of natural
science.” This thesis follows this triangulation framework, interleavingobservation, design and theory. I use a wide variety of research meth-ods from other disciplines including critical incident interviews (Mackay,2002), interactive thread (Mackay, 2004), participatory design work-shops (Mackay, 2002), technology probes (Hutchinson et al., 2003),generative walkthroughs (Lottridge and Mackay, 2009) and structuredobservations (Garcia et al., 2014).
Extreme User Innovation
Another approach I applied is the lead user method. Given the factthat the topic of digital documents have been extensively researched, Ideliberately chose to focus on the Extreme User. The concept of Extreme
User is similar to von Hippel (1986)’s Lead User because both of themface extreme problems and have extreme needs. The difference is thatLead User is leading in respect to the market trend and the goal isto forecast needs for marketing research as von Hippel (1986) pointsout: “users whose present strong needs will become general in a marketplace

4
months or years in the future.” My goal is not to identify future marketsfor a specific trend. During the thesis, I have discovered many userinnovations and found them extremely valuable and useful for bothunderstanding the underlying problems and for design. For example,one patent engineer has developed a prototype to help him keep trackof the reference numbers in a patent document. This user innovationwas also disseminated to several colleagues of his because they sharesimilar problems.
Reflecting on the discovery of these user innovations, although I didnot intend to “find” the “right” extreme users, the way I discoveredthese user innovations is similar to Von Hippel’s method of network-ing 2. That is, by asking participants “Who do you know that has
2 MIT OpenCourseWare: https://youtu.be/31iUEuwi740
more extreme problems?”, I “crawl” towards the user innovators. Ialso found out that innovative users also share some common charac-teristics: 1) extreme needs, 2) unique knowledge or understanding oftheir work and, 3) technical or design skills (so that they can build pro-totypes). I believe the combination of these characteristics influencesthe user innovation.
As a designer, this observation makes me realize the danger of a single-minded view on what user is. The user is not a single person; it is agroup of people who have different working practices, knowledge oftheir work and levels of technical skills. The user does not just haveproblems and needs that wait to be understood by designers, theyhave incentives and can innovate for themselves. I believe it is theopenness and willingness to learn from users that can bring togetherboth knowledge and skills of user and designer, to achieve the designpurpose. In relation to market research, Von Hippel shows four typesof users: lead users, early adopters, routine users and laggards. In thisthesis, I have encountered all of them. The identification and distinc-tion of these users helps me to bring their different values throughoutthe design process. These user-focused approaches and methods arethe foundation of this thesis.
1.3 Contribution
This thesis provides empirical findings from multiple studies, techni-cal contributions in the form of functional prototypes, and theoreticalcontributions that introduce design principles.

5
Empirical Contributions: Through the study of three groups of knowl-edge workers, I found that
• legal professionals must rely on their memory to manage depen-dencies and maintain consistent vocabulary within their technicaldocuments;
• patent examiners and scientists need to manage text from multi-ple documents across various interconnected activities, includingsearching, collecting, annotating, organizing, writing and review-ing, while manually tracking their provenance; and
• computational scientists have difficulties using the file system tokeep track of, re-find and maintain consistency among related butdistributed information.
Technical Contributions: I designed or contributed to the design of
• Textlets, interactive objects that reify text selections into persistentitems;
• Passages, interactive objects that can be manipulated, reused andshared across multiple tools while maintaining their provenances;and
• FileWeaver, a system that automatically detects dependencies amongfiles without explicit user action, tracks their history, and lets usersinteract directly with the graphs representing these dependenciesand version history.
Theoretical Contribution: I propose
• three complementary design principles for creating new represen-tations: granularity, individuality, synchronization.
1.4 Organization
Chapter 2 presents the definition of representation and manipulationthrough examples. I review the research area of personal informationmanagement and influential document software systems. I also reviewtwo new interaction models.

6
Chapter 3 focuses on document editing and presents the design andevaluation of Textlets with legal professionals.
Chapter 4 focuses on document analysis and presents the design andevaluation of Passages with patent examiners and scientists.
Chapter 5 focuses on document management and presents the designof FileWeaver with scientists.
Chapter 6 proposes three design principles when creating new pre-sentations, generated from the design process and the lessons learnedfrom the thesis.
Chapter 7 concludes the thesis with a summary of the main contribu-tions and directions for future research.
Figure 1.3. Illustration of the thesis
organization. The main chapters
focuses on 1) single document edit-
ing, 2) multiple documents anal-
ysis and 3) multiple documents
management.
1.5 Publications
Some ideas and figures appeared previously in the following publica-tions:
Chapter 3 Han L. Han, Miguel A Renom, Wendy E. Mackay, MichelBeaudouin-Lafon (2020). Textlets: Supporting Constraints and Consis-tency in Text Documents. In Proceedings of the 2020 CHI Conferenceon Human Factors in Computing Systems (CHI’20).

7
DOI: https://doi.org/10.1145/3313831.3376804Video: https://youtu.be/9xDl1hFVsKU
Chapter 4 Han L. Han, Junhang Yu, Alexandre Ciorascu, RaphaelBournet, Wendy E. Mackay, Michel Beaudouin-Lafon (2022). Passages:Reading and Interacting with Text Across Documents. In Proceedingsof the 2022 CHI Conference on Human Factors in Computing Systems(CHI’22).DOI: https://doi.org/10.1145/3491102.3502052Video: https://youtu.be/aLC2GVVitl0
Chapter 5 Julien Gori, Han L. Han, Michel Beaudouin-Lafon (2020).FileWeaver: Flexible File Management with Automatic DependencyTracking. In Proceedings of the 33rd Annual ACM Symposium onUser Interface Software and Technology (UIST’20).DOI: https://doi.org/10.1145/3379337.3415830Video: https://youtu.be/PrcuF1MG1to
Han L. Han (2020). Designing Representations for Digital Documents.In Adjunct Publication of the 33rd Annual ACM Symposium on UserInterface Software and Technology (UIST’20 Doctoral Symposium).DOI: https://doi.org/10.1145/3379350.3415805
1.6 On The Use Of The Pronoun ’We’
The core research projects in this thesis were highly collaborative.Upon reflection, I feel both lucky and grateful for my collaborator’scontributions, efforts and support throughout the thesis. I have learneda lot from them and am greatly indebted to them. In recognition ofthe collaborative nature of this thesis, and for ease of reading, I thususe the pronoun ’we’ when describing collaborative parts of this thesisand use "I" when it is done by myself.


9
2Background
This chapter presents the definition of representation and manipula-tion in interaction design through examples. I represent key researchliterature in personal information management (PIM) and influentialdocument systems in a chronological order. I also describe interactionframeworks and models.
2.1 Representation and Manipulation
Figure 2.1. Selected examples
of evolving writing surfaces
and tools. Images from a
wonderful BBC documentary
about the history of writing.
Source: https://www.bbc.co.uk/
programmes/m000mtml
About 5000 years ago in Mesopotamia (present-day Iraq), the Sumeri-ans developed the first city states. The city dwellers felt the need for a

10
kind of record keeping and developed the first form of document. Itis a clay tablet with symbols representing numbers and small stylisedpictures representing commodities, created by a reed stylus (Fig. 2.1,a).
Figure 2.2: A reproducedpage of Leonardo da Vinci’snotebook. Source: https://
commons.wikimedia.org/wiki/
File:Reproduction_of_page
_from_notebook_of_Leonardo
_da_Vinci_LCCN2006681086.jpg
Since then, we started to see a rich history of writing, along with anevolution of writing surfaces, tools and technologies. Egyptians firstinvented papyrus as a writing surface. Later on, Europeans replacedit by locally produced parchment, usually made of untanned animalskins (Fig. 2.1, b). The documents produced by parchment were ex-tremely durable but were expensive to make and only accessible tothe nobles. In 1448, Johannes Gutenberg, a German goldsmith, in-troduced movable-type printing, largely speeding up the process ofputting ink on paper (Fig. 2.1, c). What he did ushered in the modernperiod of human history, including Renaissance, Scientific Revolution,knowledge-based economy and mass communication. Leonardo daVinci surely took advantage of the paper at that time and used it as acanvas for his ideas and thoughts (Fig. 2.2).
As time travels to 1874, we started to type the alphabet on paper usinga typewriter using a QWERTY keyboard (Fig. 2.1, d). This lasted forone century. In the 1980s, the invention of the graphical user interfaceat Xerox PARC lowered the learning curve of using a computer, mak-ing it accessible to the masses (Fig. 2.1, e). Instead of typing commandsthat have to be learned, people interact with the information throughgraphical representations such as windows, icons, menus and pointer(WIMP).
Figure 2.3: If Sumerians de-signed the icon, it may look likethis.
Representation
Figure 2.4: Evolution ofdocument icon. Source:https://commons.wikimedia
.org/wiki/File:Evolution_of
_the_document_icon_shape.jpg
If we take a look at the first document 5000 years ago and the currentdocument in the graphical user interface, one commonality is that theyboth use something to represent something. The first document is aclay tablet with symbols representing numbers and small stylised pic-tures representing commodities (Fig. 2.3). In the Star interface, a phys-ical document is represented as an icon that resembles the appearanceof that document. The location of the document is represented in a2D space, the Desktop. A group of properties of the document arerepresented in graphical forms called property sheets. The length ofthe document is represented as a scollbar. These representations arepowerful because they allow users to interact with the information ina way that is familiar and meaningful to them. Herbert Simon under-stands the importance of representations as he wrote in his book The
Sciences of the Artificial (Simon, 1996):

11
This view can be extended to all of problem solving. Solving a problem
simply means representing it so as to make the solution transparent. 1 If the1 The text is not emphasized in the orig-inal book. I added the emphasis.
problem solving could actually be organized in these terms, the issueof representation would indeed become central. But even if it cannotif this is too exaggerated a view a deeper understanding of how repre-sentations are created and how they contribute to the solution of prob-lems will become an essential component in the future theory of design.[Chapter 5, Page 132]
System of perception
1 variation 1 variation sensory variables of sound of marks
2 dimensions 1 variation
of time of the plane
total 2 variables 3 variables
instantaneous 1 sound Relationships perception among
3 variables
2
Perceptual properties of linear and spatial systems
Figure 2.5. Perceptual properties
of visual and auditory systems.
Left is from Semiology of Graph-
ics (Bertin, 1983) and right is from
SonicFinder (Gaver, 1989)
So what is a representation? In semiology, De Saussure (2011) pro-poses that signs are made up of two parts: signified and signifier. Sig-nified refers to the concept or object that is represented; signifier is theform of a sign. Another similar concepts for signified and signifier couldbe: content and form, meaning and appearance, information and rep-resentation. Charles Sanders Peirce (Atkin, 2013) adds that signs canbe defined as belonging to one of three categories: icon, index, or sym-
bol. An icon has a resemblance to the signified. An index, such as aclock or thermometer, correlates to an object by presenting a qualityof an object. A symbol has no resemblance between the signifier andthe signified. The connection between them must be learned. In inter-face design, Gaver (1989) introduced another categorization: symbolic,
metaphorical and iconic. The one different category metaphorical makesuse of similarities between signified and signifier, as he clarified, “an
icon does not imply a literal pictorial, or recorded mapping, instead its char-
acteristics are casually related to the things it represents”.

12
Signs can communicate through any of the senses such as visual, au-ditory, tactile, olfactory, or gustatory. For example, the study of visualinformation is about communicating the sign through visual, such asJacques Bertin’s Semiology of Graphics (1983). The study of sonifica-tion is about communicating sign through our auditory sense, such asGaver (1989)’s SonicFinder.
What are the things that can be represented? Tversky (2015) exam-ines historical artifacts of information and finds that they all depictpeople, animals, things, space, place, time, events and numbers. Onecharacteristic of these things is that they are important to the peoplewho created them. Norman (1991) considers the cognition as a set,in the mind (internal) and in the world (external). Internal things arethe knowledge, concepts, and structure in the forms of mental images,schemas, or connections. External things are external rules, constraintsor relationship embedded in physical configurations.
Combining all these concepts of representation, I propose a simplifieddefinition in this thesis.
A representation is a sign that describe the “things” that can be both inhumans’ mind and in the world. The representation can be perceivedthrough different senses, including visual, auditory, olfactory, gustatoryand tactile. The relationship between the sign and the thing that it rep-resents can be symbolic, metaphorical and iconic. (Fig. 2.6)
Ch the nind S metptorico eplesettton
e
m the vad Conc
Figure 2.6. A simplified definition
of representation
This thesis focuses on describing things in people’s mind through vi-sual signs, thus visual representations. With this definition of rep-resentation, design becomes a process to transcribe the things into asign-system and arrange them in such a way as best to accomplish aparticular purpose.
Now, let us see some good examples of visual representations. In this

13
painting (Fig. 2.7) from Denis Diderot’s encyclopedia, the importantelements are extracted and selectively represented from an ordinaryscene in a factory. The idea of selecting important things to representmight seem trivial to us. But I believe this idea is important in design-ing representation because the first question is to choose which thingsto represent.
Figure 2.7: Example of De-nis Diderot’s encyclopedie.Source: https://commons
.wikimedia.org/wiki/File:
Defehrt_epinglier_pl2.jpg
Tufte (2001)’s book The Visual Display of Quantitative Information presentsa collection of hundreds of visual representations. These beautiful rep-resentations exploit the characteristics of perceptual properties of thevisual system and show the underlying data (or things) effectively. Cat-egories of representations introduced in the book includes data maps,time-series, space-time narrative designs and relational graphics. Mc-Cloud (1993)’s book Understanding Comics have great examples of rep-resentation of stories and events. It illustrates how comics, as a formof sequential visual art, represent invisible things such as time, motionand feelings.
DESPITE THEIR SUPERFICIAL RESEMBLANCE,
THESE ARE TWO VERY DIFFERENT SETS OF
LINES. ONE REPRESENTS A VISIBLE PHENOMENON, SMOKE, WHILE THE OTHER REPRESENTS AN /VVISI3LE ONE, OUR
SENSE OF SMELL.
3
Figure 2.8: Scott McCloudshows how comics represent in-visible things such as smell. Im-age taken from (McCloud, 1993)
Manipulation
While representation is about how to represent the things that peo-ple are interested in, manipulation concerns what the people can dowith the representation. Bill Verplank introduces interaction design asrepresentation for manipulation in his sketchbook 2.
2 Source: http://www.billverplank
.com/IxDSketchBook.pdf
What computers do is to represent other things both real and imaginary.The form of representation is not arbitrary. The best representationsare compact and extensible, efficient and widely available. The goal forrepresentations is usually some form of manipulation or translation.
Figure 2.9: Bill Verplank’sSketch interaction design.Source: http://billverplank
.com/CiiD/IDSketch.pdf
In his sketch, he gives the example of controls such as handles andknobs for manipulation. In today’s graphical user interfaces, peopledo not use controls but perform their action directly on the objects(precisely, the representation of objects of interest). This is knownas direct manipulation. The interaction model of direct manipulationproposed by Ben Shneiderman (1983) includes several principles: 1)continuous representation of objects of interest, 2) physical actions onobjects rather than complex syntax, 3) fast, incremental, and reversibleoperations with an immediately-apparent effect, and 4) the layered orspiral approach to learning. Hutchins et al. (1985) give a cognitiveaccount of both the advantages and disadvantages of direct manipula-tion interfaces, identifying underlying phenomena that give rise to thefeeling of directness. They argue that direct engagement is the feelingthat “one is directly engaged with control of the objects - not with the pro-
grams, not with the computer, but with the semantic objects of our goals and

14
intentions”. In order to have direct engagement, the representation ofobjects should behave as if they were the real thing. Beaudouin-Lafon(2000) extends and generalizes the principles of direct manipulationto instrumental interaction: interaction between users and domain ob-jects is mediated by interaction instruments, similar to the tools andinstruments we use in the real world to interact with physical objects.
The manipulations I have designed in this thesis focus on the interac-tive behaviors of the new representations. The purpose is to give usersa sense of directness and engagement.
2.2 Personal Information Management
Personal Information Management (PIM) describes the collection, stor-age, organization and retrieval of information by an individual com-puter user. It draws from several disciplines such as digital libraries,database management, information retrieval and human-computer in-teraction (HCI). The following sections describe three focuses of PIMresearch: context in PIM, paperless office and today’s diverse usergroups and types of documents. While this section provides a his-torical account, more recent related work is in each chapter.
Context in PIM
Figure 2.10: Screenshot fromthe video where Ron Ka-plan and Allen Newell triedto use the copier. Source:https://www.youtube.com/
watch?v=DUwXN01ARYg
Suchman (1987) criticized the cognitivist view that both human mindand computers are information processors manipulating representa-tions of the world. Her theoretical view, situated action, emphasizes theinterrelationship between people’s actions and their context: “under-
scores the view that every course of action depends in essential ways upon
its material and social circumstances. Rather than attempting to abstract
action away from its circumstances and represent it as a rational plan, the
approach is to study how people use their circumstances to achieve intelligent
action.“ A live example is the video made in 1983 where PARC com-puter scientist Austin Henderson and Lucy Suchman, Ph.D. student inAnthropology at UC Berkeley, observed two computer scientists, RonKaplan and Allen Newell, using a copier. This situated approach moti-vated early research on PIM to study practices in context, such as theirworkplace.
In the 1980s, there were several early personal information systems,including the Xerox Star (Smith et al., 1982). Malone (1983) pointedout that “None of these systems, however, is based on a systematic under-

15
standing of how people actually use their desks and how they organize their
personal information environments.”. His study identified two key userstrategies for organizing their desk: filing and piling. He also notedthat categorizing information is cognitively difficult and that informalpiles on the desk allow people to avoid the cognitive effort requiredfor long-term filing.
Barreau and Nardi (1995) investigated a similar question for computerfiles. They identified three types of information: ephemeral, workingand archived. They observed that ephemeral and working items weremainly retrieved by browsing whereas archived items were searchedfor. Teevan et al. (2004) also observed users preference towards “ori-
enteering”, i.e. navigating one step at a time rather than jumping to asearch results, because orienteering lets users specify less informationat once. Many researchers have focused on other types of personal in-formation such as email (Ducheneaut and Bellotti, 2001; Mackay, 1988;Whittaker and Sidner, 1996), web bookmarks (Abrams et al., 1998) andimages (Rodden and Wood, 2003).
Paperless Office
Figure 2.11: Biologist’s paper labnotebook. Source: Tabard et al.(2008)
Figure 2.12: Field biologist’s pa-per lab notebook. Source: Yehet al. (2006)
Although these early studies have implied a shift from paper-based todigital-based knowledge work, paper is still around. The term “paper-
less office” can be tracked back to Xerox PARC, the birthplace of manyradical ideas including laser printer, graphical user interface and Eth-ernet. Interestingly, “Paperlessness as a goal ran completely counter to what
was then Xerox’s main business: the making of money from paper, in partic-
ular the copying of one paper document onto another” (Sellen and Harper,2003). In their book “The Myth of the Paperless Office” (2003), AbigailSellen and Richard Harper pointed out the unique affordance of papersuch as supporting annotation while reading, quick navigation, flexi-bility of spatial layout, and its value in a wide variety of activities inoffice life. Both a real-world reading study (Adler et al., 1998) and acontrolled lab study (O’Hara and Sellen, 1997) have shown people’sdiverse reading practices and how paper can support these activities.Based on these insights, they advocate viewing paper as an analyticalresource for the design of technologies rather than as a problem (Sellenand Harper, 1997). Other ethnographic studies with air traffic con-trollers (Mackay, 1999), field biologists (Yeh et al., 2006) (Fig. 2.12) andbench biologists (Tabard et al., 2008) (Fig. 2.11) have also shown theimportance of physical paper in these users work practices.

16
Diverse Digital Information
Today’s digital information is becoming increasingly diverse, raisingnew challenges for users to manage. New forms of documents emergesuch as computational notebook and interactive documents. Compu-tational notebooks (Fig. 2.13) combine code, visualizations, and text ina single document, supporting the workflow of data analysis, frominteractive exploration to publishing a detailed record of computa-tion (Kluyver et al., 2016). Researchers, data analysts and even journal-ists are rapidly adapting this new form of notebook. In recent years,HCI researchers have started to investigate the information manage-ment challenges of this new type of documents (Kery et al., 2018;Rule et al., 2018b).
Figure 2.13: Jupyter Notebook.Source: https://jupyter.org/
The Explorable Explanations 3 introduced by Bret Victor have opened
3 http://worrydream.com/
ExplorableExplanations/
up a new way of thinking about documents.
The goal is to change people’s relationship with text. People currentlythink of text as information to be consumed. I want text to be used asan environment to think in.
His project has inspired and motivated other HCI researchers to re-think and explore the dynamic nature of digital documents (Conlenand Heer, 2018; Dragicevic et al., 2019). For example, Dragicevicet al. (2019) apply the idea to multiverse analysis documents, allowingreaders to explore alternative analysis options by dynamically chang-ing some elements of the document.
Users also interact with increasing numbers of devices and applica-tions for their work. Jung et al. (2008) introduced the concept of ecology
of artifacts to describe any implicit or explicit relationships among inter-active artifacts in one’s personal life, encouraging designers to considerthe dynamic interplays among multiple related artifacts. Other empir-ical studies have identified the challenges of managing these devicesand applications. Dearman and Pierce (2008) found that managinginformation across devices was the most challenging aspect of usingmultiple devices. Oleksik et al. (2012) studied the artifact ecology ofa research center and found that scientists used multiple computingapplications to create information artifacts that are locked into appli-cations, making it difficult to reuse content and get a unified view ofthe related research material.
This thesis thus investigates how today’s knowledge workers interactwith information in the modern age where new forms of documentsand an increasing number of applications are the norm.

17
2.3 Document Software Systems
If we look back in history, several visions and demos have fundamen-tally changed the way people interact with information. I describe in-fluential document systems in chronological order, followed by morerecent systems that provide alternative perspectives.
Influential Visions and Demos
Figure 2.14: Bush’s Memex
Memex (1945). Bush (1945)’s essay “As We May Think” envisioned anew way of accessing information through association. Bush describeda system called ”Memex” (Fig. 2.14) based on linked microfilm records:
A library of a million volumes could be compressed into one end ofa desk. If the human race has produced since the invention of movabletypes a total record, in the form of magazines, newspapers, books, tracts,advertising blurbs...
Even though he did not build it, his idea of cross-linked informationinspired HypterText and the World Wide Web, fundamentally chang-ing the way people access information.
Figure 2.15: Engelbart’sNLS. (See demo: https://
www.youtube.com/watch
?v=qI8r8D46JOY&list=
PL76DBC8D6718B8FD3&index=9
NLS (1968). In 1968, Doug Engelbart gave the demo of his NLS sys-tem 4, which is also known the ”mother of all demos”. In this demo, he
4 See https://dougengelbart.org/
content/view/155/
showed the graphical interfaces, hypertext, and computer supportedcooperative work, which are all widely used today. Let us take a closerlook at one of this demo (Fig. 2.15). At one point, he calls in the remotecollaborator, Bill Paxton, and starts to work on the shared documenttogether. If we look closely, we can actually see two separate cursors.These two cursors even has different capabilities as Doug Engelbartexplained: “but we have carefully reserved for me the right to control and
operate on this so that my bug (cursor) is more powerful than yours.” Theintent of this design is to enable people work on the same shared doc-ument together.
Figure 2.16: Nelson’sXanadu. See demo: https://
www.youtube.com/watch?v=En
_2T7KH6RA
Xanadu (1967). Deeply inspired by Bush’s vision, Ted Nelson intro-duced the idea of hyptertext, interconnected information such as text,graphics and sounds. In one demo of his project Xanadu (Fig. 2.16),Ted Nelson shows both the concepts of transclusion and link. The tran-sclusion content is placed side by side and as he navigates the maindocument, the companion document is taken into the front, ready tobe read. The intent of this design is to clearly show the connectionsamong documents.

18
The idea of linking information was taken further by other systemssuch as NoteCard (Halasz et al., 1986), HyperCard 5, Intermedia and
5 HyperCard demo: https://
www.youtube.com/watch?v=FquNpWdf9vgso on. For example, in this demo of Intermedia 6, we can see that users
6 Intermedia demo: https://
www.youtube.com/watch?v=bGGxdF0Pn4g
can create bi-directional link between specific parts of any documentas easily as copy-paste and visualize all the links in a web.
Xerox Star (1981). The Xerox Star is the first commercial system thatmakes use of many concepts of user interfaces such as direct manipu-lation, the mouse as input device, overlapping windows and a WYSI-WYG text editor. Applying a desktop metaphor, documents are repre-sented by ”concrete objects” that can be selected, moved, filed, copied,mailed and opened by other applications, etc. (Smith et al., 1982).
Figure 2.17: Cut-paste inGypsy. See demo: https://
www.youtube.com/watch?v=
Dhmz68CII9Y
Bravo and Gypsy (1974). One killer app of the Xerox Star is Bravo -the first WYSIWYG text editor. However, Bravo is still a modal editorwhere characters typed on the keyboard can be interpreted as eithercontent or commands, depending on the mode. Larry Tesler realizedthe issue with modes and introduced the notion of a modeless interface.Copy-paste (Fig. 2.17) is one of the most known modeless pattern. Oneimportant realization towards the vision of modeless interface is theshift of the syntax of the command from prefix to suffix (Tesler, 2012),which makes selection the first step of most user actions. Larry Teslerand his colleagues developed Gypsy, a document preparation systemthat is based on Bravo but eliminated modes. Gypsy was taken furtherto BravoX, LisaWrite and MS Word.
Alternative Representations
More recent HCI research continues to innovate alternative perspec-tives and ideas.
Figure 2.18: Dourish et al.’sPresto
Metadata-Based Systems. To address the issues of using a hierar-chical structure for organizing information, Dourish et al. (1999)’sPresto system (Fig. 2.18) provides user-level document attributes, al-lowing users to rapidly reorganize their documents for the task athand. These document attributes such as year, author and topic, aretreated as first-class objects and used to search, group and organizedocuments. Presto is an example of a metadata-based system thatmakes use of the meta-data of the documents to provide appropriaterepresentations and interactions. Harper et al. (2013) reflected on therepresentation of digital files and also proposed to encompass meta-data within a file abstraction.
Figure 2.19: Bederson and Hol-lan’s Pad++
Zoomable Systems. Bederson and Hollan (1994) challenge the metaphor-

19
based approach, which primarily mimics mechanisms of older me-dia. Their system, Pad++, is a zooming graphical interface wheredata objects of any size can be created, and zooming is a fundamentalinteraction technique (Fig. 2.19). They used semantic zooming basedon Pad (Perlin and Fox, 1993), that changes representations whenzoomed:
It is natural to see the details of an object when zoomed in and viewingit up close. When zoomed out, however, instead of simply seeing ascaled down version of the object, it is potentially more effective to seea different representation of it.
The intent of this design is to see interface design as the developmentof a physics of appearance and behavior for collections of informa-tional objects.
Figure 2.20: Robertson et al.’sData Mountain
3D and Time-Based Systems. While most desktop interface are 2Dbased, an alternative approach is to add another dimension and makeit 3D. For example, Robertson et al. (1998)’s Data Mountain (Fig. 2.20)allows users to place documents at arbitrary positions on an inclinedplane in a 3D desktop virtual environment using a simple 2D inter-action technique. Their intent is to take advantage of human spatialmemory, i.e., the ability to remember where you put something. An-other dimension that can be useful is time. LifeStreams (Fertig et al.,1996) (Fig. 2.21) leverage the temporal dimension of data to organizedocuments.
Figure 2.21: Fertig et al.’sLifestreams
Figure 2.22: Oleksik et al.’sTAGtivity
Activity-Based System. Bardram et al. (2006) propose the activity-based computing (ABC) framework to let users manage activities ontheir desktop. The ABC framework challenges the application-centricand document-centric approach to designing desktop interfaces, treat-ing activity as a first-class object. The user can create and manageactivities under their control, e.g. group windows and resources intoactivities that can be resumed or suspended to switch among tasks.The concept of focusing on activities has inspired other systems suchas Giornata (Voida and Mynatt, 2009) and TAGtivity (Oleksik et al.,2009) (Fig. 2.22).
In summary, these systems explored a variety of design spaces to in-teract with documents and served as great inspiration for the designof new representations in this thesis.
20
2.4 Interaction Frameworks and Models
Besides developing novel document interfaces, research has also pro-posed interaction models to guide the design of alternative user inter-faces.
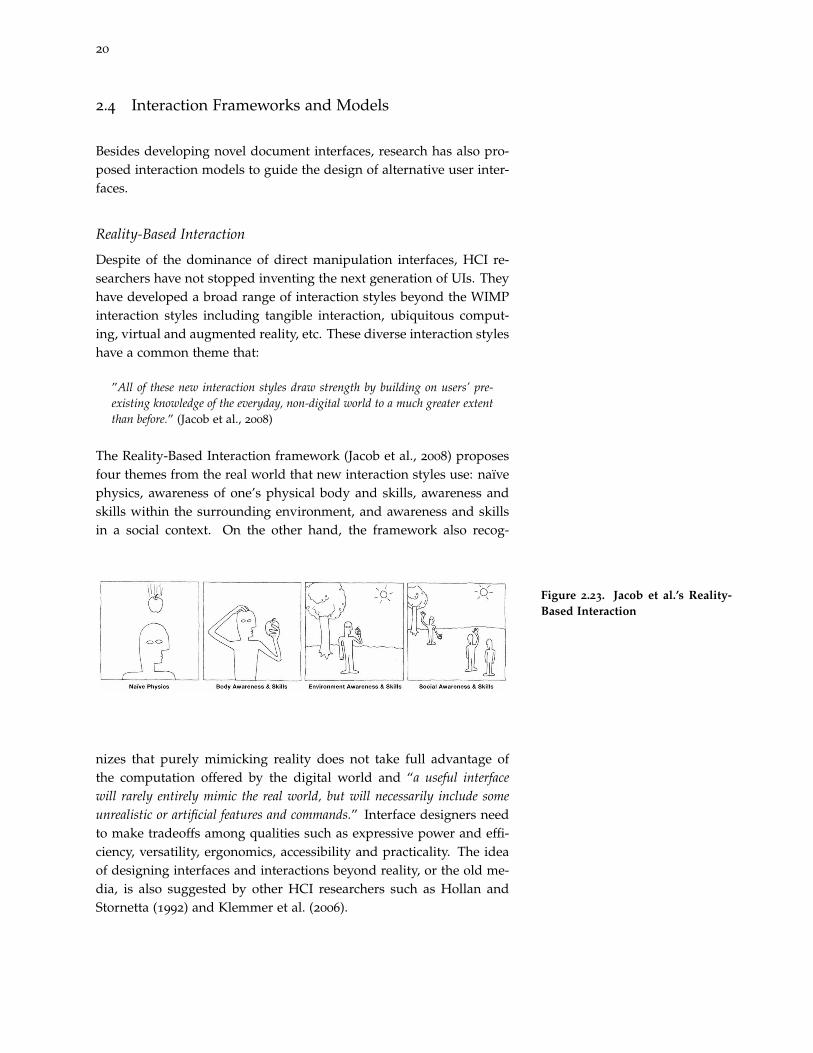
Reality-Based Interaction
Despite of the dominance of direct manipulation interfaces, HCI re-searchers have not stopped inventing the next generation of UIs. Theyhave developed a broad range of interaction styles beyond the WIMPinteraction styles including tangible interaction, ubiquitous comput-ing, virtual and augmented reality, etc. These diverse interaction styleshave a common theme that:
”All of these new interaction styles draw strength by building on users’ pre-
existing knowledge of the everyday, non-digital world to a much greater extent
than before.” (Jacob et al., 2008)
The Reality-Based Interaction framework (Jacob et al., 2008) proposesfour themes from the real world that new interaction styles use: naïvephysics, awareness of one’s physical body and skills, awareness andskills within the surrounding environment, and awareness and skillsin a social context. On the other hand, the framework also recog-
Figure 2.23. Jacob et al.’s Reality-
Based Interaction
nizes that purely mimicking reality does not take full advantage ofthe computation offered by the digital world and “a useful interface
will rarely entirely mimic the real world, but will necessarily include some
unrealistic or artificial features and commands.” Interface designers needto make tradeoffs among qualities such as expressive power and effi-ciency, versatility, ergonomics, accessibility and practicality. The ideaof designing interfaces and interactions beyond reality, or the old me-dia, is also suggested by other HCI researchers such as Hollan andStornetta (1992) and Klemmer et al. (2006).

21
Instrumental Interaction
GUIs are based on the principle of direct manipulation (Shneider-man, 1983) where users manipulate visual representations of the ob-jects of interest through physical actions. However, current GUIs relyon the manipulation of additional widgets such as menus, scrollbarsand dialog boxes, causing indirect interaction with objects of inter-est (Beaudouin-Lafon, 2000; van Dam, 1997). Instrumental Interac-tion (Beaudouin-Lafon, 2000) is based on the observation that our in-teractions in the physical world are also often mediated by instrumentsor tools, e.g. pencils, screw-drivers and toothbrushes.
In instrumental interaction, the objects of interests, such as documents,are called domain objects, and are manipulated through interaction in-struments, or UI elements. The interaction instruments transform theuser’s actions into commands that act upon the objects. The instru-
Figure 2.24. Beaudouin-Lafon’s In-
strumental Interaction
mental interaction also provides a model to compare different interac-tion styles with three aspects including 1) degree of indirection (spatialand temporal), 2) degree of integration and 3) degree of compatibility.
These interaction models provide the theoretical foundation of thisthesis. My goal is to apply these interaction models to design newrepresentations that address the challenges faced by today’s knowl-edge workers.


23
3Representation for Document Editing
The work reported in this chapter was joint with Miguel Renom, a Ph.D stu-
dent in the same research team. I took the lead on the project. Miguel Renom
and myself conducted the interview study and created the initial design concept
together with Michel Beaudouin-Lafon. Michel Beaudouin-Lafon implemented
the first functional prototype and Miguel implemented the more advanced one
used in the evaluation study. I designed and conducted the evaluation study.
The whole team contributed to the paper writing.
The work was published at ACM CHI2020 (Han et al., 2020).
Figure 3.1: Editing a document
This chapter explores one of the most common document tasks: edit-ing. We focus on one example of extreme user, legal professionals, tostudy their current practices with existing text editing tools. Based onthis empirical understanding, we explore the idea of reifying the tran-sient text selection into persistent and interactive objects called Textlets.Users can manipulate this new representation, user interface object, toperform various editing tasks, including selective search and replace,word count, and alternative wording. The evaluation study shows thevalidity and generative power of the concept of textlets.
3.1 Context
Text editing was once considered a ‘killer app’ of personal comput-ing (Bergin, 2006). Editing text is usually the first skill a novice com-puter user masters, and all personal computers are sold with a wordprocessor. Many professions require advanced text editing skills to

24
ensure consistent use of terms and expressions within structured doc-uments, such as contracts, patents, technical manuals and researcharticles (Fig. 3.2).
For example, lawyers begin each contract with a list of defined terms,and must use them consistently thereafter. This is critical, since ‘minor’wording changes can have serious legal implications. For example,American patents define “comprises” as “consists at least of”; whereas“consists of” means “consists only of”, indicating a significantly differ-ent scope of protection. Sometimes terms are disallowed, e.g. the USPatent and Trademark Office (USPTO) does not accept “new”, “im-
proved” or “improvement of” at the beginning of a patent title. Wordlimits are also common, such as the European Patent Office’s 150-wordlimit for patent abstracts.
Figure 3.2: Example of technicaldocuments: patent (top), tech-nical manual (middle), contract(bottom)
Despite their many features, standard word processors do not addressall of these professional needs. For example, although spell checking iscommon, flagging forbidden words or ensuring consistent use of par-ticular terms must be done manually. Real-time counts of words andcharacters can be displayed for the whole document, but not for a sin-gle section. Thus, we decided to study how legal professionals managethe contrarians and consistency when editing technical documents.
3.2 Related Work
Literature on both word processing and code editing are relevant tous. Code is a particularly interesting form of technical document thatrequires professional software developers to manage multiple internalconstraints, and the specific tools developed to ensure internal consis-tency in code may inform our design.
Text Editing Practices
Text editing was an active research topic in the 1980s when word pro-cessors became mainstream. For example, Card et al. (1987) mod-eled expert users’ behavior in manuscript-editing tasks; Tyler et al.(1982) investigated the acquisition of text editing skills; and Rosson(1983) explored the effects of experience on real-world editing be-havior. Others examined paper-based editing practices to improvecomputer-based text editing (Marshall, 1997; O’Hara and Sellen, 1997;Sellen and Harper, 1997) and collaborative writing (Baecker et al., 1993;Churchill et al., 2000; Noël and Robert, 2004).

25
More recent studies identify issues with modern word processors. Forexample, Srgaard and Sandahl (1997) found that users rarely take ad-vantage of text styles, and argue that this is because styles do notimpose restrictions on the document structure. Alexander et al. (2009)found that although users often revisit document locations, they rarelyuse the specific revisitation tools found in Microsoft Word and AdobeReader. Chapuis and Roussel (2007) examined users’ frustration withunexpected copy-paste results due to format conversion. This workidentifies a clear mismatch between the advanced features offered bymodern word processors and actual user practice, and highlights theneed for new tools and concepts.
Tools to Support Text Editing
Figure 3.3: Miller and Mar-shall’s cluster-based search andreplace
Figure 3.4: Beaudouin-Lafon’sinstrumental search and replace
Researchers have created a variety of text editing tools to supportannotation (Schilit et al., 1998; Yoon et al., 2013; Zheng et al., 2006),navigation (Alexander et al., 2009; Laakso et al., 2000; Wexelblat andMaes, 1999) and formatting (Myers, 1991); as well as distributing edit-ing tasks (Bernstein et al., 2015; Teevan et al., 2016) and taking ad-vantage of a text’s structure (Miller and Myers, 2002a). We focus hereon copy-paste (Bier et al., 2006; Stylos et al., 2004), and search-and-replace (Beaudouin-Lafon, 2000; Miller and Marshall, 2004), both es-pecially relevant to supporting internal document consistency.
Chapuis and Roussel (2007) propose new window management tech-niques to facilitate copy-paste tasks. Citrine (Stylos et al., 2004) extractsstructure from text, e.g. an address with different components, that canbe pasted with a single operation. Multiple selection (Miller and My-ers, 2002b) offers smart copy-paste that is sensitive to source and des-tination selections, while Entity Quick Click (Bier et al., 2006) extractsinformation to reduce cursor travel and number of clicks. Cluster-based search-and-replace (Miller and Marshall, 2004) groups occur-rences by similarity, allowing entire clusters to be replaced at once(Fig. 3.3). Beaudouin-Lafon (2000) instrumental search-and-replacetool highlights all items at once, so users can make changes in anyorder, not only as they occur in the document (Fig. 3.4).
Commercial applications such as Grammarly1 check grammar and spelling1 https://grammarly.comby suggesting alternative wording, style and tone, among other fea-
tures. However they do not ensure consistent use of specific terms,e.g. always referring to a party in a contract with a single name. Othersoftware tools automatically generate consistent references, includingMendeley2 and EndNote3 for researchers, and Exhibit Manager4 for le-
2 https://mendeley.com
3 https://endnote.com
4 https://exhibitmanager.com
gal professionals. Although automated reference management solves

26
some problems, users still lack flexibility for others, e.g. creating acustom citation format. These tools are also separate from the wordprocessor, potentially distracting users from their documents and frag-menting workflow.
Figure 3.5: Oney and Brandt’sCodelets
Figure 3.6: Kery et al.’s Variolite
Figure 3.7: Ko and Myers’sBarista
Code Editing Practices
Code editing has been widely studied, especially copy-paste (Kapserand Godfrey, 2008; Kim et al., 2004), use of online resources (Brandtet al., 2009) and drawings (Cherubini et al., 2007), and performingmaintenance tasks (Ko et al., 2005). A key challenge that emergesfrom these studies is how to manage dependencies. For example, Kimet al. (2004) found that programmers rely on their memory of copy-pasted dependencies when they apply changes to duplicated code.Ko et al. (2005) identified both ‘direct’ dependencies, e.g. going froma variable’s use to its declaration, and ‘indirect’ ones, e.g. going froma variable’s use to the method that computed its most recent value,and proposed ways of visualizing these dependencies in the editor.While technical document constraints are less stringent than in com-puter code, we hope to exploit certain commonalities.
We see program code as an extreme case of a technical document, withmany internal constraints. For example, Toomim et al. (2004)’s tech-nique supports editing duplicated code and visualizing links amongduplicates. To help programmers use web examples more efficiently,Codelets (Oney and Brandt, 2012) treat snippets of code examples as‘first-class’ objects in the editor, even after they are pasted into thecode. Kery et al. (2017)’s tool for lightweight local versioning supportsprogrammers performing exploratory tasks, while AZURITE (Yoonand Myers, 2015) lets programmers selectively undo fine-grained codechanges made in the editor. Barista (Ko and Myers, 2006) supportsenriched representations of program code, while Whyline (Ko and My-ers, 2004) and HelpMeOut (Hartmann et al., 2010) support debuggingtasks.
3.3 Interview with Legal Professionals
Editing technical documents requires a complex editing process (Co-hen et al., 1999), especially to maintain the document’s constraintsand internal consistency (Farkas, 1985). We first conducted critical ob-ject interviews (Mackay, 2002) to better understand how professionalsmanage such constraints and consistency in their technical documents.

27
Figure 3.8. Critical object inter-
views in participants’ workplace.
Participants: We interviewed 12 participants (three women, nine men;aged 24-50). Their occupations include: contract manager, legal af-fairs director, candidate to a Ph.D. in law, lawyer, patent attorney,and patent engineer. All use Microsoft Word on either the Windows(11/12) or MacOS (1/12) platforms; only one uses the latest 2019 ver-sion.
Procedure: All interviews were conducted in English, each lastingfrom 45-60 minutes. We ran four pilot interviews with colleagues to es-tablish the protocol, then visited participants in their offices and askedthem to show us specific examples of their current digital and physi-cal documents. We asked them to describe a recent, memorable eventrelated to editing that document, either positive or negative. The firsttwo authors conducted all interviews, alternating asking questions.
Data Collection: All interviews were audio recorded and transcribed.We also took hand-written notes. We were not allowed to videotape ortake photographs for confidentiality reasons.
Data Analysis: We analyzed the interviews using reflexive thematicanalysis (Braun and Clarke, 2019). We generated codes and themesboth inductively (bottom-up) and deductively (top-down), looking forbreakdowns, workarounds and user innovations. After interviewingeight participants, we conducted the first analysis together, groupingcodes into larger categories and focusing on participants’ editing be-havior. We discussed any disagreements and rechecked the interviewtranscripts to reach a shared understanding. We also created story por-traits (Jalal et al., 2015) to graphically code the data, which helped usengage with the collected data and resolve disagreements, e.g. Fig. 3.9.

28
We arrived at the final themes after three iterations.
Figure 3.9. A collection of story
portraits based on the analysis
3.4 Results and Discussion
We identified six themes: maintaining term consistency, managing de-pendencies by hand, reusing content, visiting and revisiting documentlocations, managing annotations, and collaboration.
Figure 3.10: Which term to use?
Maintain Term Consistency
All participants rely on their memories to maintain consistency acrossdocument terms, which are often defined in the beginning of the doc-ument. This causes problems. For example, P7 (legal affair director)struggled to use the full name of a party across the document andP5 (patent attorney) often made the wrong choice between two wordswith highly similar meanings.
Sometimes terms must be changed, e.g. shifting from British to Amer-ican English or if the client prefers another word. To avoid introducinginconsistencies, lawyers must update each term and its variations, e.g.singular vs. plural, and adjust verbs (P1), articles (P1,6,7,9) and pro-nouns (P9) accordingly.
Although all participants use ”search and replace” to make consistent

29
edits, most (9/12) avoid ”replace all”: ”It is too risky.” (P4); ”I will not
let the computer do it for me.” (P6); and ”I prefer to do it manually.” (P5).Instead, they use a one-by-one search-navigate-check-replace strategyto manually replace each term. They ensure correctness by viewingand assessing each term’s context: ”We have to conjugate the verb with
the subject. It’s like a lot [of work].” (P4) Checking context is also essentialfor avoiding partial matches, i.e. when the search term matches asubset of a longer word (P3, 11), which requires performing additionalsearch-and-replace operations.
Summary: Participants maintain consistency across terms primarilyby hand, which they find cumbersome and prone to error. Most avoid“replace all” because they do not trust the results and cannot easilycheck them.
Managing dependencies by hand
We define a dependency as two or more sections of text that mustbe kept identical or consistent. Most participants (8/12) rely on theirmemories to manage document dependencies, and synchronize themby hand. We identified three types of dependency problems: manag-ing consistency across pasted copies, numbering items, and managingcross-references.
All patent attorneys (4/4) copy text from the Claims section to the Sum-
mary of the Invention when drafting the latter. However, when theychange the claims, they often forget to update the summary accord-ingly: “Because it is not automatically updated with the claims, I can easily
forget to update.”(P6).
Figure 3.11: Summary of Inven-tion and claims are linked
Patents contain three types of numbering systems (Fig. 3.12): claimnumber, claim dependency number (when the current claim dependsupon another claim), and reference number (to specific parts of theillustration). Most patent attorneys (3/4) manage these numbers byhand instead of using Word’s cross-reference feature, typically leavinga gap between consecutive references. This lets them add additionalnumbers later, while ensuring that the reference numbers remain inascending order.
Most lawyers and patent writers insist on maintaining full control ofthe text, especially the critically important claims section, even if theprocess is tedious. This is especially true of the claims section, whichis critical to the patent. Even participants who are comfortable usingautomatic features do not rely on automatic numbering:

30
Figure 3.12. Patent claims use three
different numbering systems (left).
Patent illustration (right).
P7 said: “most of the time, I prefer if something can be automatically achieved”
yet avoids automatic numbering: “I cannot really tell you why. One rea-
son might be that if I have automatic numbering set up, this would have
become paragraph 2 and all the numbering of the claims would have been
changed...I would not be very happy.”.
Figure 3.13: Normal and auto-matic numbering. The user can-not tell them apart unless she se-lects them
Summary: Their key reasons for avoiding automatic numbering in-clude 1) their inability to differentiate automatic from normal number-ing, unless they select the text; 2) incorrect display of references, e.g.when items are added to a list, until a manual update is triggered; and3) invisibility of dependencies after an update, since they lack feedbackand cannot be sure if the changes are correct.
Reusing content
All participants reuse previous document elements to create new doc-uments, incorporating text, styles and templates. When copy-pastinga piece of text for reuse, they must often edit the content betweencopy and paste operations or adapt the format after pasting, e.g. usingthe brush tool (P6) or a macro (P7). If visual formatting results fromapplying a style, pasting new text can bring “bad” styles into the docu-ment and pollute existing styles: “When you copy-paste into a document,
you can import the style of the [original] document. Too many unnecessary
styles makes the document heavier and you have to remember which style to
use. This is a mess.” (P4). Although ”paste without formatting” optionis available right after pasting the text in the destination document,the option disappears after users start other operation, e.g. clickingthe text to start editing. Since the default pasting behavior is to keepthe source formatting, users also need two additional clicks to apply”paste without formatting”.
Most participants (10/12) use templates to create new documents, in-

31
cluding pre-written text, preset styles or both. Although useful forwriting letters, filling cover pages, generating tables and managingformatting consistency, participants still struggle with formatting is-sues caused by style conflicts.
Summary: They often reuse content, but are not satisfied with thecorresponding introduction of format inconsistencies.
Visiting and revisiting document locations
Figure 3.14: Participant jumps atdifferent document locations.
Participants rarely write or edit documents sequentially and often re-visit different parts of the document. For example, P7 created a set ofkeyboard shortcuts to “jump to different parts of the document” becausehe needs to switch often. This is consistent with Alexander et al.’s find-ings concerning users’ revisitation behavior (Alexander et al., 2009).
Participants also need better revisitation support when systematicallygoing through the whole document, e.g. incorporating edits one byone or performing search-and-replace tasks. The latter often involveschecking an earlier replacement, after the fact. Unfortunately, Wordimposes sequential interaction, so users cannot return to the previousreplacement: “The problem is that I cannot check. It made the replacement
and it goes to the next occurrence, so I don’t see what just happened.” (P7).P8’s workaround to address this problem involves turning on “trackchanges” to leave an inspectable trace of each replacement.
Summary: Participants experience problems navigating their docu-ments, especially with respect to tracking recent or oft-visited parts ofthe document.
Managing annotations
Some participants (4/12) appropriate and customize their tools to sup-port comments and annotation, rather than using the dedicated fea-tures of their word processor. For example, P5 uses footnotes to addcomments for his clients because he dislikes how the text gets smallerwhen using Word’s Track Changes. P7 avoids Track Changes altogetherand uses different colors to encourage active reading and convey theimportance of certain comments to his clients.
For documents with two or more co-authors, some participants (4/12)complained that the Track Changes feature introduces more problemsthan it solves (P2, P4) and makes it difficult to understand the mod-ifications (P5, P7). Instead, some (3/12) use the comparison function

32
after making changes, to make modifications visible to their clients.
Interestingly, P9 also used the comparison function to ‘cheat’: He mod-ified the document with Track Changes on a Saturday night but did notwant his client to know he worked over the week-end. So he acceptedall the changes and then compared it to the original document onMonday morning, making it appear that the changes had been madeon Monday.
Summary: Participants find annotation tools frustrating and constrain-ing, and some creatively use other features to meet their needs.
Collaborate
Figure 3.15. A story portrait illus-
trating how one participant consol-
idate changes from various collab-
orators as it from one party
Most participants (11/12) collaboratively edit documents. We catego-rize their collaboration strategy as branching (versioning and parti-tioning) and merging.
When versioning, participants exchange documents via email and savesuccessive versions to keep track of changes made to the document.They use simple suffixes to identify versions over email, e.g. V1, V2,V3, so documents with similar content hang around and are hard tofind again. P12 complained that she created eight versions of the samedocument even though she made only minor changes. The notion ofFile Biography (Lindley et al., 2018) could help them manage theseissues. Local versioning, explored for code editing in Variolite (Keryet al., 2017), would also be useful but standard word processors do not

33
support it. Compare to edit history which is generated by the com-puter, versions are defined by the users to mark a substantial changeto the document that are meaningful to them. In collaborative editing,people are afraid of ”stepping on the foot of others”(Larsen-Ledet andKorsgaard, 2019). Version creates a safe and private space for individ-ual work before committing to the collaborative space.
Some participants partition the master document for co-authors to editand merge it later. The problem in the merge stage is style pollution, asdiscussed above, due to foreign styles being imported through copy-paste (P4) or forgetting to format text (P2). Because the style panel inMicrosoft Word is not displayed by default when users open a docu-ment, it is often hidden from users. As a result, formatting and styleinconsistencies are often undetected.
When a version of a document is sent out and then returns with pro-posed changes, participants have to merge these changes into the mas-ter document. Even though they use the Track Changes feature of Mi-crosoft Word, they usually make the changes by hand, going througheach document and deciding which edits to incorporate. They do notaccept all the changes for various reasons: “It might destroy the way
[the text] was presented” (P5), “We do not consider all comments” (P6),“[clients’] comments are difficult to understand” (P7), or the changes re-quire other modifications to be made in other parts of the text (P7).In summary, we found that participants manually version their docu-ments, even for minor edits, and merge documents by hand, incorpo-rating changes one by one, as they struggle with style pollution.
Summary: The interview study shows not only that professional tech-nical writers must maintain consistent use of terms, but also that theymanage the resulting dependencies mostly by hand. They struggleto maintain formatting consistency when reusing text and lack toolsfor keeping track of their navigation within their document, flexiblygenerating annotations, and collaborating asynchronously. Based onthese results and the theoretical framework provided by InstrumentalInteraction (Beaudouin-Lafon, 2000), we propose a general solution toaddress some of their needs.
3.5 Textlets Concept
General-purpose word processors such as Microsoft Word have hun-dreds of features. As we saw in the interview study, even when users

34
know that a feature exists, such as ‘replace all’ or ‘automatic num-bering’, they often prefer making changes by hand to stay in control.Rather than proposing specific new features to address the varioususe cases we observed, we seek a general approach that fits how theyactually deal with text.
a
b
c
d
e
Figure 3.16: Transient selection.a,b) the user selects a piece oftext; c) she applies a set of com-mand to it; d) the appearance ofthe text has changed based onthe command; e) as soon as sheselects another text, the previousselection is gone.
Word processors rely heavily on the concept of selection: the user se-lects a piece of text and then invokes a command using a menu, toolbaror keyboard shortcut that affects the content of the selection. However,the selection is transient: selecting a new piece of text causes the pre-vious selection to be lost. (Fig. 3.16)
We introduce the concept of textlet as the reification (Beaudouin-Lafonand Mackay, 2000) of a text selection into a persistent, interactive, first-class object. A textlet represents a piece of the text document identifiedas interesting to the user. They can be highlighted in the documentitself, listed in a side panel, or visualized through other interface ele-ments, e.g. a scrollbar, for easy access.
To create a textlet, a user simply selects a piece of text and invokes acommand, e.g. Ctrl+T. The selected text is highlighted and the textletis listed in the side panel where a behavior (see below) can be assignedto it.
Textlets can also be created automatically by a higher-level object calleda grouplet. For example, to create textlets that represent all the occur-rences of a word in the document, the user creates a search grouplet (orsearchlet), e.g. with the traditional Find command Ctrl+F. The search-
let appears in the side panel and the user can type the search string.A textlet is automatically created for each match of the search stringand appears as an item underneath the searchlet. This list is auto-matically updated when editing the document or when changing thesearch string.
The power of textlets comes from the behaviors associated with them.The most basic behavior is to (re)select the piece of text from thetextlet, e.g. by double-clicking the textlet representation in the sidepanel. Other behaviors include the ability to change or automati-cally generate the content of the text, to change its style, and to at-tach annotations or additional information, such as character or wordcount. Creating textlets with different behaviors leverages the powerof polymorphism (Beaudouin-Lafon and Mackay, 2000) because a sin-gle concept (reified text selection) addresses a variety of commands(searching, counting, referencing), providing users with a unifying

35
concept to manage text documents. This slightly extends the definitionin (Beaudouin-Lafon and Mackay, 2000), which focused on polymor-phic instruments.
The rest of this section illustrates the power of textlets by describinghow different behaviors can address some of the issues observed in theinterview study. Table 3.1 summarizes the use cases and the solutionswe have implemented.
Use Case Issue Behavior of textlet
Consistent Reuse Recurrent copy-paste to start newdocuments from scratch requires re-selecting the text in one or moredocuments.
All textlets save their text, which can be reusedusing simple actions such as drag-and-drop.
Term Consistency Repeatedly navigating across a doc-ument using search terms leaves notraces of scroll positions, making ithard to go back and forth.
Searchlets create occurrence textlets that let usersnavigate by interacting directly with them onthe side panel.
Reference Consistency Automated numbered lists andcross-references take control awayfrom users. Numbered items andreferences do not update automat-ically.
Numberlets are counters that can be manipulatedand applied to numbered lists, sections, figures,etc. References to numberlets can be created bycopy-pasting them in the document. Item num-bers and references are always up to date.
Length Constraints Standard word processors requireselecting text each time to countwords in a specific area and getother metrics.
Countlets add a persistent decoration to the textof interest that displays a word count and up-dates it as users edit the content.
Exploratory Writing Keeping track of alternatives is dif-ficult. Undo/redo is not adapted togo back and forth between versions.
Variantlets store alternative versions of textletsthat can be easily retrieved, compared andedited.
Table 3.1. How different behav-
iors of textlet address some issues
and challenges observed in the in-
terview
Textlets for Consistent Reuse
The interview study showed that technical writers often reuse portionsof text or entire templates when creating new documents. They rely oncopy-paste to incorporate parts of other documents, but this requiresprecisely (re)selecting the text to be copied.
With textlets, users can create text snippets specifically for reuse, suchas common vocabulary and phrases, list templates, or pre-written para-graphs with placeholders. Reusing a snippet simply involves a drag-and-drop or click-based interaction with the textlet. Placeholders canthemselves be textlets to highlight the parts that need to be filled in,so that they can be easily identified, selected, and replaced with theproper text.

36
These snippets can be collected in dedicated documents or embeddedinto other documents. The interview study identified collaborativepractices where users share a set of constraints and consistency cri-teria. By collecting reusable textlets in separate documents, they caneasily share these documents and facilitate consistency across usersand documents.
Textlets for Term Consistency
We observed that technical writers need to go back and forth in theirdocuments to check for consistency or make consistent changes acrossthe document. To that end, they often use the search command,butthey do not trust the search-and-replace tool enough to perform replace-all actions blindly, and prefer to check the term and its context beforeeach replacement.
Searchlets, briefly introduced earlier, can address these use cases byautomatically searching for all the occurrences of a text in the docu-ment. A searchlet is a grouplet that creates occurrence textlets for eachmatch they find in the document. These occurrences are listed underthe searchlet in a side panel and automatically updated when the docu-ment changes. This supports fast navigation to each occurrence in thedocument, e.g. with a click on the occurrence in the side panel.
Searchlets support flexible search-and-replace. After specifying a re-placement text for the searchlet, the user can replace all occurrences atonce, or replace them one by one, in any order. At any time, includingafter a replace-all, it is possible to revert individual occurrences, givingusers full control and visibility over their actions. Multiple searchlets
can be active simultaneously, so that users can keep earlier searchesaround and get back to them later.
When users navigate the document to check for consistency and tomake changes, they often lose track of where they were when theystarted the check. Searchlets facilitate navigation among occurrences,but do not address the need for location tracking in the document.
Figure 3.17: Hill et al. (1992)’sEdit and Read Wear
Building on previous work such as Read Wear (Alexander et al., 2009;Hill et al., 1992) (Fig. 3.17) and Footprints (Wexelblat and Maes, 1999),a history grouplet can record recent selections and let the user navigateamong them. Previous selections can appear as individual textlets in aside panel or, to save space, the grouplet can display arrows to navigatethe history of selections.

37
Textlets for Reference Consistency
Standard word processors include tools for managing certain types ofdependencies automatically, most notably numbered lists and cross-references. The interview study showed that participants distrust andstruggle with automatically numbered lists, and thus avoid automatedcross-reference management tools.
Documents often include numbered items such as sections, figures,patent claims or references. Both the numbered items and the refer-ences are good candidates for textlets: Both are computed textlets, i.e.their content is computed and updated as the document changes, butthe user can still interact with them. A numberlet is a grouplet that cre-ates numbered items and ensures that the number sequence matchesthe document’s item order. Each numbered item is itself a grouplet forcreating and managing textlets representing references to that item.
Numberlets, numbered items and references can be listed in the sidepanel for easy navigation. Creating new numbered items and newreferences involves a simple drag-and-drop or clicking on the corre-sponding textlet.
This design may seem complex compared to the automatic number-ing and cross-referencing features of standard word processors, butit leaves users in control by turning numbered items and referencesinto objects that they can see and manipulate while the system main-tains consistency during document editing. It is also more powerfuland flexible than the predefined types of references offered by stan-dard word processors. For example, Microsoft Word 16 for Mac cancross-reference Headings, Bookmarks, Footnotes, Endnotes, Equations, Fig-
ures and Tables, but not Articles or Claims, which are used extensivelyby contract and patent writers. Numberlets let users control what typesof numbered items they need, providing flexibility within a unifiedinterface.
Textlets for Length Constraints
Word count and character count limits are common in technical doc-uments. For example, patent offices limit the number of claims in apatent, the number of words in the abstract, and the number of char-acters in the patent title. Standard word processors include tools tocount words and characters in a selection, but they require users toreselect the text and recount after every modification. Microsoft Wordshows the total word count of the entire document and current selec-tion in real time, but counting the characters in, e.g. a section of the

38
document requires selecting the text and bringing up a modal dialog.(Fig. 3.18)
Figure 3.18: Microsoft Word’sword count with a modal dialog
Counting textlets, or countlets, solve this problem by counting the num-ber of words or characters in a segment of the document and display-ing it in the document itself and/or a side panel. As the user editsthe text, the counter updates, avoiding the need for special commandsor re-selection. The user can set a threshold above which the textletwill signal that the text is too long. Additional metrics could easilybe included, such as the text’s estimated reading time. Such timelets
would be useful, e.g. for journalists and authors of video subtitles.
Figure 3.19: A mock-up oftimelets. The user can record hervoice and see the time she takesto read the text.
Textlets for Exploratory Writing
Study 1 showed how professional technical writers often need to man-age multiple alternatives for parts of a document, before deciding oragreeing on which one to keep. Although standard word processorssupport change tracking, this is insufficient, since it tracks all edits,not the intermediate versions the user may want to keep. Participantsmust either make copies of the entire document, or use colored text orcomments to list alternatives within the document.
Variant textlets, or variantlets, let users keep track of the changes madeto a selection rather than the entire document.
Figure 3.20: Dragicevic et al.(2019)’s explorable multiverseanalyses
Figure 3.21: Goffin et al. (2017)’sword-scale graphics embeddedin text documents
We were inspired by Explorable Multiverse Analyses (Dragicevic et al.,2019), where alternative analyses can be embedded in a research paperand selected by the reader to view them in context. A variantlet savesthe original content of the selected text. After editing the text, theuser can swap it with the original version for immediate comparison,and swap again with the edited version. More sophisticated behaviorscan be added to manage multiple alternatives, such as displaying thealternatives side by side or displaying the changes in a manner similarto the track changes mode of word processors. Variantlets providegreater control on version management by supporting local versioningrather than traditional document-level versioning. A similar conceptis featured in Variolite (Kery et al., 2017) for code editing.
Generative Power
The previous examples show the power of textlets to support a varietyof tasks. We have also identified other behaviors for textlets that couldbe useful for a wider range of use cases:

39
• Attaching comments, summaries, translations, word-scale graphics(Fig. 3.21) or emojis and adding decorations to a textlet, e.g. high-lighting or badges, to annotate the document;
Figure 3.22: Bret Viktor’s com-puted text. Source: What cana technologist do about climatechange
• Supporting arbitrary computed content, such as Bret Victor’s Reac-tive Documents5, where a textlet is defined by a formula that refers
5 http://worrydream.com/Tangle/
to other textlets, as in a spreadsheet;
• Controlling the style and formatting of the text by associating styleattributes with the textlet;
• Crowdsourcing the text of a textlet or a collection of textlets for re-viewing or grammar checking, as in Soylent (Bernstein et al., 2015);and
• Organizing textlets freely in a canvas to help analyze or annotatethe content of a document
The generative power (Beaudouin-Lafon, 2004) of textlets comes fromthe combination of a set of behaviors:
• Navigating to the text of the textlet in the document;
• Selecting the text of the textlet, leveraging all the existing commandsthat act on the selection;
• Replacing/modifying text either based on user edits or automati-cally;
• Modifying the style of the text;
• Adding decorations that are not part of the text itself; and
• Representing and manipulating textlets in a separate view, such asa list in a side panel.
Generative power also comes from the ability to create textlets not onlydirectly, by selecting text in the document, but also automatically, byusing grouplets that identify and live-update a set of matching textlets.Grouplets let users deal with dynamic collections of text in a concreteway, whereas standard word processors typically offer advanced, spe-cialized commands that users hesitate to learn and use. Althoughtextlets may involve more actions than these specialized commands,we argue that users are more likely to try them, and will save time

40
compared to the manual solutions users resort to.
3.6 Textlets User Interface
Figure 3.23. First prototype with
the side panel showing a variant-
let, a countlet and a numberlet con-
taining a numbered item and a ref-
erence, and their visualization in
the document.
In order to demonstrate the concept of textlets, we created a proof-of-concept implementation with four types of textlets: word count(countlets), text variants (variantlets), numbered references (numberlets),and search-and-replace (searchlets). These textlets address multiple usecases described in the interview study.
We created two prototypes6 as plugins to the ProseMirror7 web-based6 See a video illustration: https://youtu.be/9xDl1hFVsKU
7 http://prosemirror.net
word processing toolkit. The first prototype (Fig. 3.23, left) was devel-oped internally as our first proof of concept and implements countlets,variantlets and numberlets. The second prototype (Fig. 3.23, right) im-plements searchlets and was developed in an iterative process with theparticipants in the interview study, where it was used as a technologyprobe (Hutchinson et al., 2003).
The main window contains the text document, with a traditional tool-bar for basic formatting at the top, and a side panel dedicated totextlets on the right. The panel features a toolbar for creating newtextlets and the list of textlets themselves. It also features grouplets,with their list of textlets below them. A textlet is created using any ofthree techniques:
a) Selecting the text content in the document and clicking a creationtool in the toolbar;
b) Clicking a creation tool in the toolbar and selecting the text contentin the document; or
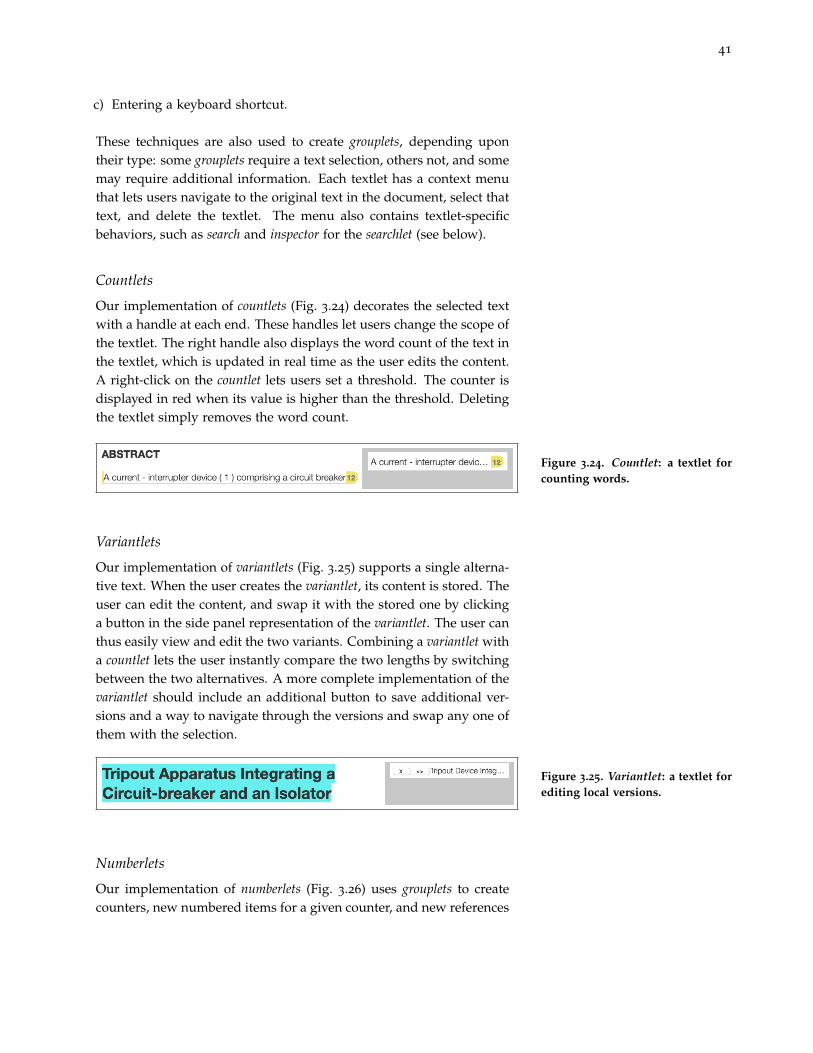
41
c) Entering a keyboard shortcut.
These techniques are also used to create grouplets, depending upontheir type: some grouplets require a text selection, others not, and somemay require additional information. Each textlet has a context menuthat lets users navigate to the original text in the document, select thattext, and delete the textlet. The menu also contains textlet-specificbehaviors, such as search and inspector for the searchlet (see below).
Countlets
Our implementation of countlets (Fig. 3.24) decorates the selected textwith a handle at each end. These handles let users change the scope ofthe textlet. The right handle also displays the word count of the text inthe textlet, which is updated in real time as the user edits the content.A right-click on the countlet lets users set a threshold. The counter isdisplayed in red when its value is higher than the threshold. Deletingthe textlet simply removes the word count.
Figure 3.24. Countlet: a textlet for
counting words.
Variantlets
Our implementation of variantlets (Fig. 3.25) supports a single alterna-tive text. When the user creates the variantlet, its content is stored. Theuser can edit the content, and swap it with the stored one by clickinga button in the side panel representation of the variantlet. The user canthus easily view and edit the two variants. Combining a variantlet witha countlet lets the user instantly compare the two lengths by switchingbetween the two alternatives. A more complete implementation of thevariantlet should include an additional button to save additional ver-sions and a way to navigate through the versions and swap any one ofthem with the selection.
Figure 3.25. Variantlet: a textlet for
editing local versions.
Numberlets
Our implementation of numberlets (Fig. 3.26) uses grouplets to createcounters, new numbered items for a given counter, and new references

42
to a given numbered item. The user creates a new counter by selectinga piece of text that contains a number or a hash sign (#), e.g. Article #.This text serves as a template for the numbering scheme. The newcounter appears in the side panel as a button. Clicking this buttoninserts a new numbered item (the numberlet) at the cursor position,with the proper number. This numberlet is added to the side panel andis also a grouplet: clicking it inserts a reference to that item in the textat the cursor position, as well as the corresponding reference textlet (orreflet) in the side panel.
Numbered items and references are updated when the content of thedocument changes. The numbering of items follows their order ofappearance in the document, and is therefore updated when movingtext around. If a numbered item is removed and there are danglingreferences to it, these references show the error. All updates are im-mediately visible in both the text and the side panel, ensuring consis-tent numbering at all times. An additional feature (not implemented)should let users drag a reference textlet below another numbered itemto change the reference to that item. This would make it possible tore-attach dangling references.
Figure 3.26. Numberlet: a textlet for
numbering and referencing.
Searchlets
Our implementation of searchlets (Fig. 3.27) supports flexible searchand replace by extending Beaudouin-Lafon (2000)’s search-and-replaceinstrument. A searchlet is created by clicking the creation tool thenspecifying the search text, or selecting the search text in the documentand clicking the creation tool. Users can also create a blank searchlet
and then enter the search string. Enabling the search behavior findsall occurrences of the search text, highlights them in the documentand displays the number of occurrence in the panel. The usual “wordmatching” and “case sensitive” options become available in the menuto refine the search (Fig. 3.23, right).
Navigating Occurrences Enabling the inspector behavior generates thelist of occurrences below the searchlet in the panel, highlights them inthe document, and gives access to the replace capability (Fig. 3.27).

43
Figure 3.27. Searchlet: a textlet for
searching and replacing text.
Changing the search string or the search settings re-runs the searchand updates the list of occurrences underneath it. Editing the doc-ument also dynamically updates the list of occurrences: typing thesearched text in the document creates a new occurrence and changingthe text of an occurrence in the document removes it from the list oftextlets if it does not match anymore.
Each occurrence is a textlet that displays the text surrounding thematch in the document and updates it in real time. An occurrencecan be expanded by clicking it to better show the context (Fig. 3.27).The user can then click the ellipsis buttons to show more context.
Occurrences can be moved, including under another searchlet, givingusers flexibility to organize the search results as they see fit. For ex-ample, occurrences of different mispellings of a word can be identifiedwith different searchlets and then grouped under one searchlet, afterwhich they can all be replaced at once. When moved, occurrencesadopt the color of their new host searchlet. They also “belong” to theirnew host for the purposes of the replace-all action. In the current im-plementation, they disappear from the list when the search string orthe search settings of the new host are changed.
Replacing Text Selecting “Replace Matches” in the searchlet contextmenu (Fig. 3.23, right) shows a text input field for typing a replacestring and a button for replacing all occurrences in the list. Each oc-currence textlet also includes three buttons that: replace only that oc-currence, revert to the previous text, or ignore this occurrence fromfuture replace-all operations. These actions can also be performed inthe document itself using keyboard shortcuts.
Replaced occurrences stay in the textlet’s occurrence list until a newsearch string is entered for that searchlet. This lets users work with theoccurrences and make changes to the document after they performa replace operation without losing track of the positions that were

44
originally matched.
Searchlets extend Beaudouin-Lafon’s previous work (Beaudouin-Lafon,2000) by supporting multiple simultaneous searches. Each occurrenceis reified as an item in the side panel, which supports additional func-tions such as disabling an occurrence in a global replace, or movingan occurrence to another searchlet. Our design is also grounded in ourobservations of the real-world challenges experienced by a group ofprofessional users.
3.7 Structured Observation
Figure 3.28: A user think-aloudin the observational study
We used our second prototype as a technology probe (Hutchinsonet al., 2003) to evaluate searchlets with an observational study. We didnot run a comparative study with, e.g., Microsoft Word as a baselinebecause many features that we implemented do not exist in Word orare clearly faster, e.g., a persistently-displayed character count withcountlets, versus highlighting text and invoking Word’s word countcommand.
Our goals were to gather feedback, identify potential novel and unex-pected uses, and discuss new ideas with the participants in order torefine our design. The study focused on searchlets, but we also showedthe participants the other textlets from the first prototype. We incor-porated suggestions incrementally so that successive participants usedslightly different versions of the probe.
Participants: We recruited eight participants: three patent attorneys,one patent inventor (one woman, three men; aged 29-50 who use var-ious versions of Microsoft Word) and four researchers (one woman,three men; aged 24-26 who use LaTeX). Three of the patent attorneyshad participated in the interview study. We included researchers be-cause we believe that textlets address the needs of a wider range ofusers than those in the interview study and authors of research arti-cles must also manage consistency in their papers.
Apparatus: The prototype is a Web application accessed with the par-ticipant’s choice browser on their own computer 8. We provided a 13”
8 We choose a web application just be-cause of our prototyping skill set. Fromparticipants’ perspective, the interac-tions and tasks are the same as if theyare in a non web document editor. Wedo not change the work they do.
MacBook Pro laptop running macOS 10.14 and Firefox 68.0 for par-ticipants who did not have a computer at hand. We created two setsof documents to match the participant’s background: two patents andtwo research papers.

45
Procedure: We started by describing the features of the Textlets pro-totype, and gave participants 10 minutes to experiment with it. Weused a think-aloud protocol (Fonteyn et al., 1993) and asked partici-pants to perform two similar tasks on two documents: one using theeditor of their choice and the other using the Textlets prototype. Wecounterbalanced for document order across participants.
Figure 3.29: A timeline of studyprocedure
Each task consisted of three small exercises with increasing difficulty:1) replace a word by another and then change it back; 2) replace a wordby another but only in certain contexts; and 3) replace two words withsimilar meanings with another word, including all relevant variations.Thus replacing “mouse” with “rodent” also requires changing “mice”with “rodents”.
The two tasks, each with three exercises, took approximately 20 min-utes. After an interview, participants completed a short questionnaire.The session ended with a debriefing to identify additional use casesand discuss ideas for improvement. We also showed participants thecountlets and variantlets from the first prototype, and asked them todescribe scenarios for which they might be useful.
Data Collection: We recorded audio, took hand-written notes duringthe session, and collected the answers to the questionnaire.
3.8 Results and DiscussionFigure 3.30: Adding the designof individual replacement, undoand ignore, based on partici-pants feedback
All participants successfully interacted with the textlet prototype andfound the tasks representative of their everyday work. The textlet sidepanel was “faster to use” (P1, P3). It avoids jumping to the main text(P1, P2, P3, P6), so that they can focus on the relevant document parts,thus reducing mental workload. Most participants (6/8) preferredmaking changes directly with a searchlet over Word’s non-interactiveside panel. Two participants (P1, P2) asked for even greater interac-tivity with searchlets, such as one-by-one replacement directly from thepanel, which we added in a later version, and merging two searchlets
to apply the same replacement to their occurrences. We added othersmall improvements based on participants’ feedback, including bettercolors and icons, and decluttering the textlet interface by using a menuinstead of a series of buttons.

46
Replace-all-then-correct Strategy
Most participants (7/8) used a one-by-one search-check-replace strat-egy with both Microsoft Word and LaTeX: They search for the word,go to each occurrence in the main document to check the context andthen perform the replacement, either by clicking a button or retyping.
Participants used a different strategy with textlets, which we character-ize as search-overview-replace. They started by creating one or moresearchlets, scanned the overview of the occurrences to see the variationsand assessed which ones to replace. P1 said: “I can see immediately what
variations are in the text [from the side panel]. So I see it will work by replac-
ing all matches”.
The combination of overview and contextual information around eachmatch encouraged participants to spontaneously develop two differentstrategies for the final search-overview-replace step: Six participantsused a replace-all-then-correct strategy, first replacing all occurrences,then checking each replacement in the overview list for errors, whichthey corrected either with the ‘revert’ button or by retyping in the doc-ument. The other two participants (P6, P7) used an ignore-replace-allstrategy, first pressing the ‘ignore’ button to skip outliers, then apply-ing ‘replace-all’, similar to the ‘perfect selection’strategy in (Miller andMarshall, 2004). In summary, although participants were reluctant touse replace-all with their regular word processor, they felt comfortableusing the searchlets’ replace-all and quickly developed strategies forselective replacement.
Persistent Selection: Keep Track, Individual Undo
Although both Microsoft Word and TexWorks (LATEXeditor) providean overview list of all search occurrences, they do not track them byposition. By contrast, searchlets create persistent occurrences that helpusers keep track of what happened. P5 felt more confident with theprototype, saying: “Here (pointing at the side panel) I can see the changes
in context. It helps me [and] reassures me that I did the right thing.”
Furthermore, searchlets let users check the results of their previous re-placements. The overview of occurrences persists in the panel evenas users edit the document. This differs from other word processorsthat clear the search whenever the user types in the document, whichforces users to tediously re-enter the search text. For example, P3 said:“I have this list of all the occurrences. When I want to do some replacements,
I choose some of them and I keep the whole list that I can always check [in
the side panel]. This is quite important...I do not need to proof-read the whole

47
text.”
Because each occurrence is also a textlet with its own history of changes,it can be undone individually and ignored in a replace-all commandwhile still remaining in the overview list. These novel behaviors con-tributed to most participants (6/8) spontaneously adopting a replace-all-then-correct strategy. For example, P3 said while performing a task:“Maybe it is better to replace all and check the ones that do not work.”.This suggests that making changes persistent, visible and reversibleincreases users’ trust in the system.
Representing Constraints
One participant suggested embedding a group of searchlets as “a high-
light [feature] for forbidden words.”(P4), arguing that making co-authorsaware of these words as the document circulates would help themmaintain consistency and improve collaborative editing. Textlets canthus embody constraints and serve as an active guideline when em-bedded in a document.
Feedback for countlet and variantlet
Participants also described situations in which they wanted to usecountlets and variantlets. For example, P3 wanted to count the wordsin patent abstracts: “I think this could be very useful because many times
you are going to count words and [the system] does not keep it.” P4 wantedto use variantlets as a local versioning tool: “If you can version one para-
graph [instead] of the whole document, it could be very useful. In that case,
you can track which part you have changed.” Future work should comparevariantlets to ”suggested edits feature” in most document editor.
Scalability and Limitations
A potential limitation of our approach is scalability: Searchlets thatgenerate large numbers of matches or large numbers of textlets andgrouplets in the side panel could cause problems when dealing withlarge documents. We did not observe such problems during the study,probably due to its short-term nature. Several features mitigate scal-ability issues: users can collapse grouplets, e.g. search results, to savespace, or disable them to remove highlighting in the main text. Scrollingbetween the document and the side panel could also be synchronizedso that the side panel can only display relevant textlets to current page.future textlets could combine behaviors, e.g. countlet +variantlet, to savespace.

48
One participant found that searchlets might be less useful in simplecases with few matches or variations of the same word: “[With] only 3
matches, I would like to change it directly in the main text” (P3). Anotherparticipant wanted searchlets to support regular expressions so that shecan specify search patterns. Both features could easily be supported ina future prototype.
Summary: This study demonstrated the value of searchlets, the mostcomplex textlet we developed, as well as the potential of other textlets.By turning search matches into persistent objects that users can manip-ulate directly, users were willing to use functions, such as replace-all,that they otherwise avoid with traditional word processors. They alsospontaneously devised novel strategies and appropriated the textletconcept in unexpected ways, such as embedding searchlets for forbid-den words. This study provides evidence for the validity of the textletconcept, and encourages us to further develop and assess the textletswe have developed, as well as design new ones.
3.9 Conclusion
This chapter investigated the common task of document editing. Weinterviewed 12 legal professionals about their practices to meet theconstraints and consistency requirements of technical documents. Thisrevealed the limitations of current text editing tools that technical writ-ers are reluctant to use advanced features of their word processors, andmust instead rely on their memory to manage dependencies and main-tain consistent vocabulary within their documents. We introduced asimple concept called Textlets, interactive objects that reify text selec-tions into persistent items. We showed five use cases where textletscan be applied to support consistent reuse, term and reference consis-tency, word count constraint, and exploratory writing. Our observa-tional evaluation showed that participants successfully used the textletto perform advanced tasks, and can quickly adapt to and appropriatetextlet.
What have we learned about representation and manipulation? Theoriginal representations in the Star user interface are mostly based onphysical objects in an office, such as paper and folders. This choice wasbased on the design principle of Familiar User’s Conceptual Model:”we
hoped this would make the electronic “world” seem more familiar, less alien,
and require less training.” (Smith et al., 1982). I believe that today’s usersare already quite familiar with these representations and our interview

49
study has shown that they are not enough to meet the needs of legalprofessionals. This chapter thus introduced a new representation, rei-fied text selection object, to support some of these unmet needs. Thedesign of this new representation is less based on existing office objectsbut more on semantic objects in users’ mind. The process of reifica-tion makes this semantic object persistently 9 visible, which ”lets users
9 In a conventional word processor,when a user selects a piece of text, it ishighlighted and the user interacts withit, e.g. by dragging it. It is visible butnot persistently visible like the textlets
conduct experiments to test, verify, and expand their understanding” (Smithet al., 1982). Searchlets is a good example as one participant said: ”I
have this list of all the occurrences. When I want to do some replacements,
I choose some of them and I keep the whole list that I can always check [in
the side panel]. This is quite important...I do not need to proof-read the whole
text.” (P3)
This new representation (or object) is more like a function icon (Smithet al., 1982) that can perform actions. For example, textlets can per-form actions on the main document, e.g. count words and search oc-currences. Another way to look at it is to see this new representationas an instrument (Beaudouin-Lafon, 2000) that users can manipulateto act on the main content. Instead of going through a myriad of com-mands, users directly act on the textlets to perform a variety of actionsto change the main text. I argue that this improves the users directengagement with the main text and simplifies the user’s conceptualmodel.
In summary, I expand our understanding of representation by intro-ducing a new representation based on the semantic object in users’mind, rather than the existing physical objects. The persistently visi-ble characteristic of this new representation allows users to verify andexpand their understanding of the content. Users can directly act onthis new representation as an instrument to engage with their content.


51
4Representation for Document Analysis
The work reported in this chapter was joint with Junhang Yu, a master stu-
dent intern, and Alexandre Ciorascu and Raphael Bournet, two undergraduate
interns. I secured the collaboration with the European Patent Office, conducted
the interview study with patent examiners and took the lead on the project.
Junhang Yu conducted the interview study with scientists. Alexandre Cio-
rascu, Raphael Bournet and myself implemented the prototype. I conducted two
evaluation studies together with Junhang Yu.
The work is being published at ACM CHI2022 (Han et al., 2022) (In Print).
Figure 4.1: Analyze multipledocuments
Through the participants in Chapter 3, I had the opportunity to collab-orate with the European Patent Office. This gave me a chance to studyanother key aspect of knowledge work: document analysis. In thischapter, I study the patent examination process in-depth and find thatall examiners use specialized tools for managing text from multipledocuments across various inter-connected activities, including search-ing, collecting, annotating, organizing, writing and reviewing, whilemanually tracking their provenance. I became interested in testing thegeneralizability of the findings. This leads me to collaborate with Jun-hang Yu to interview scientists about their literature review process,which also involves manipulating a set of key documents. The studyshows similar findings. We created Passages, a cross-document repre-sentation that can be reused, manipulated and shared in multiple ap-plications. Two evaluative user studies show that participants foundPassages both elegant and powerful, facilitating their work practicesand enabling greater reuse of information.

52
4.1 Context
Document analysis is a complex activity that involves juggling docu-ments, most text-based. Studies of knowledge work (Adler et al., 1998;Marshall et al., 2001; O’Hara et al., 1998) highlight the complexity ofthis process, which involves active reading, search, retrieval, annota-tion and writing activities (Fig. 4.2). Many professions have developedspecialized productivity software (Oleksik et al., 2012; Zhang et al.,2020) to support this process. For example, legal professionals takeadvantage of specialized online services to find and cite relevant lawbooks and articles that serve as precedents for their cases (Marshallet al., 2001). Scientists follow a similar process when searching forrelated articles that support their arguments, using the research liter-ature to “describe, summarize, evaluate, clarify and/or integrate thecontent of primary reports” (Cooper, 1998).
Figure 4.2. O’Hara et al. (1998)’s
model of various document related
activities of library users.
Unfortunately, current software typically traps information into infor-
mation silos (More details in Section 5.2), making it difficult to reusecontent or obtain a unified view of the material (Oleksik et al., 2012).This poses a serious design challenge, since adding yet another toolrisks complicating, rather than supporting, the complex, multi-facetednature of document management. We first need to better understandhow today’s knowledge workers currently perform active reading intheir document management process, with particular emphasis ontheir use of existing software tools.
A second key problem knowledge workers face is capturing and main-taining provenance (Cheney et al., 2009)—tracking the source of a doc-ument and returning to it—despite varied formats and diverse, non-interconnected sources. Evans et al. (2020) argue that tracking prove-

53
nance is a key factor in the media industry’s current “crisis in jour-nalism” (Starbird et al., 2018), and Flintham et al. (2018) show howidentifying an article’s source is essential for evaluating its trustwor-thiness. Similarly, scientists rely on provenance to ensure reproducibil-ity and uncover potential plagiarism (Cheney et al., 2009), and Jensenet al.’s (Jensen et al., 2010) longitudinal study of knowledge workersfinds that provenance cues significantly aid recall. We thus seek tounderstand how today’s knowledge workers manage provenance.
4.2 Related Work
Knowledge workers engage in active reading of documents, both tomake sense of them and to evaluate each document’s relevance to theirneeds. When they find useful documents, they must also keep trackof their sources, or maintain the provenance of each document, in or-der to cite them accurately and return to them if needed. We thusreview related work with respect to three key areas within knowl-edge work: active reading of documents, sensemaking, and informa-tion provenance.
Active Reading of Documents
Practices. Knowledge workers engage in “active reading” of docu-ments, which involves interweaving reading with a variety of asso-ciated activities (Adler et al., 1998; Golovchinsky, 2008; Golovchinskyet al., 1999). For example, O’Hara et al. (1998) interviewed researchersabout their library use and characterise scholarly research as “a com-plex process of searching, information retrieval, reading, informationextraction and recording by annotation and note-taking, informationreview, and writing new compositions (such as papers or thesis chap-ters)”. (Fig. 4.2) In a diary study of knowledge workers’ reading prac-tices, Adler et al. (1998) found that reading goes hand-in-hand withwriting, and that knowledge workers often read multiple documentsin parallel, a finding echoed by Tashman and Edwards (2011a)’s studyof active reading (Schilit et al., 1998). Marshall et al. (2001) foundthat law students switch frequently and fluidly between annotating,organizing and writing. Although this research shows that readingoften occurs with other activities, we do not fully understand the re-lationships among these activities, nor how current systems supporttransitions across them.
Systems. Multiple systems support document reading, including ac-

54
tive reading (Hinckley et al., 2012; Marshall et al., 2001; Tashman andEdwards, 2011b), active diagramming (Subramonyam et al., 2020) andactive note-taking (Hinckley et al., 2007), as well as more specific taskssuch as annotation (Romat et al., 2019; Yoon et al., 2013,1) and naviga-tion (Alexander et al., 2009; Woodruff et al., 2001).
Figure 4.3: Hinckley et al.(2012)’s Gather Reader
Figure 4.4: Tashman and Ed-wards (2011b)’s Liquid Text
Figure 4.5: Subramonyam et al.(2020)’s TexSketch
Several systems explicitly support document-reading practices, suchas InkSeine (Hinckley et al., 2007), which accommodates searchingduring active note taking. By transforming search queries into firstclass objects, users can quickly capture and save search results intotheir ‘ink” notebooks. GatherReader (Hinckley et al., 2012) builds onthe finding that reading co-occurs with writing and cross-referencingdocuments (Adler et al., 1998), as well as gathering pieces of infor-mation (Marshall and Bly, 2005). It supports collecting multiple ob-jects via a temporal visual clipboard, using pen and touch interaction.LiquidText (Tashman and Edwards, 2011b) offers readers highly flexi-ble and malleable documents, with fluid representations and a multi-touch gesture-based interface. These systems focus on reading-relatedactivities, particularly note-taking (Hinckley et al., 2012; Tashman andEdwards, 2011b) and searching (Golovchinsky et al., 1999; Hinckleyet al., 2007). On the interface level, these systems also have similarlayout: document on the right side and a note space on the right. (SeeFig. 4.3, 4.4, 4.5). However, we are also interested in helping readersmanage active reading while dealing with multiple document-basedapplications.
Sensemaking
Practices. Sensemaking is defined as creating a mental representa-tion of an information space to support the user’s goals (Russell et al.,1993). Sensemaking research explores relationships across differentknowledge work activities, especially searching, capturing and orga-nizing information. Kittur et al. (2013) differentiate between two mainphases—first information seeking then sensemaking—and highlightthe cost of creating structure too early in the foraging process. Sellenet al. (2002) identify six categories of knowledge workers’ use of theweb, and found that most searches lead to further activities, especiallyreferring back to a result and incorporating it into a document. Theyargue that users need more flexible ways of saving text and search re-sults. Other studies of web-based information seeking highlight users’revisitation behavior (Adar et al., 2009; Ma Kay and Watters, 2008) andtheir use of multiple windows (Dubroy and Balakrishnan, 2010; Wag-ner et al., 2012; Weinreich et al., 2008), as well as activities beyondsearching (Capra et al., 2010; Sellen et al., 2002). A key sensemaking

55
activity involves creating external representations, such as tables (Liuet al., 2019), hierarchies (Abrams et al., 1998), diagrams (Subramonyamet al., 2020), networks (Halasz et al., 1986), canvases (Koch et al., 2020),and more (Shipman et al., 1995). Unlike reading, sensemaking focusesmore on searching, capturing and organizing information. We are in-terested in the knowledge worker’s complete workflow, encompassingthe interconnection of reading and sensemaking activities.
Figure 4.6: Hearst (1995)’s Tile-Bar
Figure 4.7: schraefel et al.(2002)’s HunterGather
Figure 4.8: Liu et al. (2019)’s Un-akite
Figure 4.9: Gotz (2007)’sScratchpad
Systems. Multiple systems support sensemaking, including search-ing (Hearst, 2009; Mackinlay et al., 1995; Rao et al., 1995; White andRoth, 2009), collecting (Hong et al., 2008; Kittur et al., 2013) and or-ganizing (Card et al., 1996; Halasz et al., 1986; Marshall et al., 1991;Robertson et al., 1998) information, as well as systems for creatingtables (Pirolli and Rao, 1996), graphs and hypermedia structures (Rus-sell et al., 1993). Hunter Gatherer (schraefel et al., 2002), Unakite (Liuet al., 2019), ScratchPad (Gotz, 2007), and (Dontcheva et al., 2006)’sweb summarization system (Dontcheva et al., 2006) support search-ing, collecting and organizing information, but do not extend to writ-ing or reviewing final documents, e.g. summaries and analysis re-ports (Tashman and Edwards, 2011a), which are also a part of knowl-edge work (O’Hara et al., 1998). Other systems such as CiteSense (Zhanget al., 2008) and Entity Workspace (Billman and Bier, 2007) providean integrated environment with a multi-panel interface, but do notsupport the flexibility needed for the diverse and changing nature ofknowledge work (Kidd, 1994; Tashman and Edwards, 2011a). Moregenerally, such systems are not designed to support the interconnectedactivities required for reading and sensemaking.
Provenance
According to Pérez et al. (2018), “Provenance refers to the entire amountof information, comprising all the elements and their relationships,that contribute to the existence of a piece of data.” Jensen et al.(2010)’s investigation of the provenance of files and documents onknowledge workers’ desktops shows that it helps reveals their workpatterns. Researchers have developed several systems that accommo-date file provenance, e.g. for version management (Karlson et al., 2011)and file retrieval (Ghorashi and Jensen, 2012; Soules and Ganger, 2005;Stumpf et al., 2007). TaskTrail (Stumpf et al., 2007) tracks file prove-nance from copy-paste and save-as commands to help users re-finddocuments. Versionset system (Karlson et al., 2011) tracks copy re-lationships among files to help users handle version management.Given our currently highly networked world, Lindley et al. (2018)challenge the original file metaphor (Smith et al., 1982). They intro-

56
duce the concept of ‘file biography’ to capture the provenance of eachfile and let users track how it propagates. Despite research showinghow knowledge workers often focus on snippets of information (Liuet al., 2019; schraefel et al., 2002; Subramonyam et al., 2020; Tashmanand Edwards, 2011a), none of these systems directly support snippet
provenance.
Although the above systems offer useful support for different aspectsof knowledge work, from reading and making sense of documents,to determining their provenance, we lack understanding of the over-all knowledge work process. We decided to examine two groups ofknowledge workers, patent examiners and research scientists, whoread, interpret, organize and share documents across multiple appli-cations over long periods of time, to contribute insights to the designof more advanced software tools.
4.3 Study 1: Interviews with Patent Examiners
The legal profession offers an extreme example of document-intensiveknowledge work, with numerous design challenges (Adler et al., 1998;Marshall et al., 2001). Chapter 3 focused on lawyers and patent writ-ers (Han et al., 2020). Here, I explore the issues faced by a relatedgroup—patent examiners—who must search for, analyze and commu-nicate effectively about complex legal documents in order to makecritical decisions about intellectual property.
Participants: We recruited 12 participants (11 men, 1 woman; mean=13
years of experience), from a major patent organization. Nine are full-time patent examiners, and three are part-time patent examiners—twosoftware engineers and a product owner from the software develop-ment team. All use the organization’s internal software applications tosearch and examine patent applications, and each specializes in a par-ticular technical field, including antennas, biotechnology, CPUs, dis-plays, medicine, optics, and polymers.
Procedure: Each interview lasted two-three hours. In addition to col-lecting basic information about each patent examiner’s background,we conducted story interviews (Mackay, 2002) where they were askedto describe a recent, memorable event related to searching and exam-ining a specific patent application. Participants were encouraged toshow the specific documents and software involved, and to re-enacteach search process, step by step. We also interviewed members of the

57
development team for a different perspective on the challenges facedby patent examiners as well as their goals for future system develop-ment.
Data Collection: All interviews were screen recorded and transcribed.We also took hand-written notes and collected examples of documentsand software screens.
Analysis: Junhang Yu and I analyzed the interviews using reflex-ive thematic analysis (Braun and Clarke, 2019). We generated codesand themes both inductively (bottom-up) and deductively (top-down),looking for breakdowns, workarounds and user innovations. Afterinterviewing six participants, we conducted the first analysis, group-ing codes into larger categories. We discussed any disagreements andrechecked the interview transcripts to reach a shared understanding.We arrived at the final themes after two iterations.
4.4 Results and Dicussion
We collected 13 unique patent examples from the 12 patent examiners.For confidentiality reasons, participants sometimes needed to hide in-formation and would jump to another, similar example to illustrate thethe relevant aspect of the process, and would then return to the mainexample. The next sections describe the patent examiners’ current doc-ument management process and six challenges that patent examinersface during the search phase, followed by a summary and implicationsfor design.
Patent Examination Process
Awarding a new patent involves six basic steps: filing, search, exami-nation, grant award, opposition and appeal1. We focus on the search
1 Note that this practice dif-fers between Europe ( https://
www.epo.org/learning/materials/
inventors-handbook/protection/
patents.html) and the United States( https://www.uspto.gov/patents/
basics/patent-process-overview)
step, illustrated in Fig. 4.10, which judges the patentability, or novelty,of an application relative to all prior art. We chose it because involvesa variety of interrelated document-based activities and is common toall patent examiners.
Patent examiners first read the patent application to understand itsclaimed invention (1). If the application is re-submitted, they mustalso read other related documents, such as previous search reports andletters from the attorneys, to understand the full context (1). Examinersactively annotate the application and issue queries (1.1) that search

58
Figure 4.10. Patent examiners en-
gage in a series of document-
related activities when searching
for prior art, including formulating
search terms; reading and annotat-
ing documents; and writing and re-
viewing their own and other exam-
iners’ reports.
for prior art (2). Because of the highly technical nature of patents,examiners must often search for new terminology and term definitionsusing specialized web services (3). Next, they browse the search resultsto identify relevant documents (4.1) and then read them (4.2). Studyparticipants reported reading from 100 to 300 documents for a singlepatent search. The examiners next compare selected documents tothe patent application, using criteria such as novelty, inventive stepsand clarity (5). This reading and searching process is highly iterative:Examiners may learn a new term from one prior art document anduse it to refine subsequent queries (1.2) to search for (1.1) and readadditional documents (4.2). Several participants mentioned that theytake notes to keep track of their work. (5)
This process usually results in identifying three to five highly relevantprior art documents. Examiners then write a search report, drawingfrom their personal notes (6). The patent institute requires them tocite specific, sentence-level evidence in their report. They often re-fer back to the patent application (6.2) and prior art documents (6.1),and sometimes search for additional documents (6.3) if they realizethat something is missing. The search report is then reviewed by thechairman of the patent division (7). This review also involves frequentreferences to the application (7.1) and prior art documents(7.2), andmay also result in additional searches (7.3).
The search phase usually leads to the examination phase, when thepatent office decides whether or not to grant the patent. Three patentexaminers examine the application, one of whom maintains contactwith the patent attorney. The dialogue between the examiner and thepatent attorney sometimes results in modifications to the initial patentapplication.

59
Six challenges
We identified six challenges that patent examiners face during thesearch step: transferring information across applications is cumber-some; organizing personal notes risks duplicating information; re-finding passages from multiple sources is tedious; automatic draftingignores human expertise; sharing knowledge has few rewards; andinformal search results disappear.
Transferring information across applications is cumbersome. Thepatent organization has developed over 20 specialized applications forpatent examiners. Most are designed for specific activities such as taskmanagement, report creation, document viewing, and searching forprior art. Others are designed for highly specific tasks. For exam-ple, a chemistry examiner (P7) showed us a specialized application forfinding the CAS (Chemical Abstract Service) registry number wheninformation found on a website or database entry is messy or incom-plete.
Despite the availability of these applications, examiners must spenda great deal of time choosing among them and setting them up be-fore they can perform any real work. P2 said: “One of the problems
that examiners have is that there are many different tools and there are many
different times that you have to go here and there. So it is very cumber-
some.” They must also follow a preset process when using these sys-tems. For example, P4 must open three different applications just toview a document “so that it has the right dossier number and then it is syn-
chronized.” This produces many unnecessary windows that are hard tomanage and clutter examiner’s screen. Two examiners (P3, P4) devel-oped workarounds to avoid the rigidity of this procedure-based inter-action. For example, the classification tool only sends codes to threetools, none of which is the one he wants. So P3 copy-pasted the tool’sentire classification code 2 into a Microsoft Word document, which lets
2 Patent classification is a systemfor organizing all patent documentsand other technical documents intospecific technology groupings basedon common subject matter. Source:https://www.uspto.gov/patents/
search/classification-standards-and
-development
him easily search for and copy the codes he needs.
Organizing personal notes risks duplicating information. Examinerscollect information snippets and add them to their personal notes. Thisnot only supports the current task, but also helps them in the future.P6 called these notes a “letter to myself ”—when the application comesback for re-examination in a year, she will not have to “spend the same
amount of time again to re-familiarize [herself] with the file.”
Some examiners structure their notes as a comparison table (P1, P6,P9), free-form canvas (P7) or as linear text (P6, P10, P11). For example,

60
P6 created a table in Microsoft Word to compare the application andprior art documents. She considers the table to be “a mental help to
remember what the claims are about and what are the features.” P7 pastestext snippets and screenshots into Microsoft OneNote so that he canhave “all the information at a glance”. Other examiners avoid organizingpersonal notes into an intermediate structure, and instead treat thetext editor where they write the final report as their note-taking space.For example, P11 keeps the claims in his head and tries “to start the
communication [with the attorney] as soon as possible”.
Examiners find it tedious to copy-paste text snippets from the orga-nization’s internal applications into their personal notes. They alsofind it difficult to maintain links back to the original text, even thoughthey frequently revisit these snippets when they edit or review theirreports. P6 found it “really painful...it is really nasty. It is the duplication
of information...Copying is the maximum I would like to invest.”.
Re-finding snippets from multiple sources is tedious. All examinersreported manually re-finding text snippets from multiple sources, in-cluding prior art, application software and other related documents,in order to verify or cite them in their report. They developed diversestrategies, from using the search function (P2) or manually keeping a“link” (P7), to reduce the time involved in collecting snippets. Thistask is even more extreme for a chairman, who has to locate and ver-ify many cited passages during the review process. P2 (a chairman)even has to manually count line numbers: “If I see here that this claim is
supported by the description on page 5, line 15-17, I go on page 5 and have to
count to the line and I find [it].”
Although citing the snippets is tedious, examiners agree on its impor-tance for making evidence-based decisions and easing the later com-munication process. For example, P11 (a junior examiner) said: “I have
learned that, in the examination argumentation phase, it can be really helpful
to cite the specific passage. If you read from the line that this functional fea-
ture is present, it does not mean that everybody else will read it. You have to
explain it. If you don’t, you will get a lengthy letter back. You have to explain
it anyway and this is a waste of time for both parties. This is why I am often
quoting complete sentences, saying that this feature is really there, don’t come
back to me and say it is not there.”
Automatic drafting ignores human expertise. The organization de-veloped an application for automatically generating a report from aform the examiners fill out. Although intended to improve report-writing productivity by reducing copy-pasting and re-writing, many

61
examiners have mixed feelings about the system and are reluctant touse it. They emphasize the importance of having a human select theright text, and the need for human-to-human communication in theirintellectual work. P6 said that her team dislikes it, so she dropped it:“I did not see the benefits. I was typing as much as before and the communi-
cation is much longer because it has all these standard sentences that I don’t
really need to repeat every time.” For her, the intellectual part is about“selecting the passages”. P8 and P10 emphasized that the human valuelies in communication and dialogue with applicants. P8 said: “If we
are moving in the direction where the communication will be automatically
generated by computer, we will be sending the message that we don’t really
do the intellectual work. So [the patent attorneys] will be less likely to be
convinced, the same way I am less likely to be convinced.”
Sharing knowledge has few rewards. Almost half the examiners(5/12) have their own library of synonyms for their respective do-mains. These libraries are a form of knowledge that examiners haveaccumulated over many years and can be both useful to themselvesand to others. The main ways examiners share knowledge is throughtalking to people (P4, P5), exchanging Microsoft Excel or text files (P11,P12) or using an internal system (P6, 11). P6, an experienced exam-iner, said that if he works in an unfamiliar field, he just goes next doorand asks his colleague. This is consistent with research that showsthat people prefer obtaining information from other people within anorganization (Hertzum and Pejtersen, 2000). Two examiners (P11, 12)also mentioned exchanging their personal synonym stored in Excelfiles with colleagues.
Although the organization has an internal system for sharing synonymlibraries, one participant said that examiners gradually stopped usingit, since the focus on improving productivity discouraged them fromtaking the extra time needed to create reusable libraries. Others werewilling to share their synonyms but received no benefits if they createdsomething that exceeded their personal needs. One exception is anexaminer with a huge personal synonym database—he has around500, in contrast to his colleagues’ 20 or 30—who constantly refinesand improves it, and emails it to a dozen colleagues every six months.His role is similar to the “translator” identified in Mackay’s study ofexchange of customization files (Mackay, 1990).
Informal search results disappear. Examiners not only search forprior art documents but also for term definitions and synonyms onthe web to help them understand an unfamiliar domain. The inter-nal search tool keeps track of the main search activity, which is the

62
search for prior art. However, queries and results of informal searchesremain ephemeral, causing repetitive re-searching for the same infor-mation. For example, after starting a search, P5 would “go back and
maybe have another look at the dictionary or the Wikipedia” because it giveshim new ideas for a search query.
Summary. This study highlights the difficulties encountered by patentexaminers when managing interconnected document-intensive activi-ties through multiple specialized but separate applications. Examinersestablish multiple personal strategies for organizing information, butconstantly struggle to maintain its provenance. Examiners are worriedthat the shift to ever more automated systems will reduce the humanvalue that they add, and they want to main control of their human-to-human communication with other parties. In parallel, the push forincreased productivity reduces incentives to share knowledge, whichmay affect the quality of their work.
4.5 Study 2: Interviews with Scientists
Reviewing and analyzing the scientific literature has a number of simi-larities to the patent review process (Federico et al., 2017). We decidedto broaden the scope of our study to include this more open-endedform of knowledge work, and thus conducted a second series of inter-views with research scientists3.
3 Junhang Yu conducted the interviewsand I participanted in the analysis.
Participants. We interviewed 12 scientists (4 women, 8 men) fromthe following disciplines: computer science, game design, mechanicalengineering, physics and psychology.
Procedure. Each interview lasted 45 - 60 minutes and was conductedby video. We conducted story interviews where each participant de-scribed a recent example of searching the research literature for a lit-erature review or related work section.
Data Collection and Analysis. All interviews were screen-recordedand transcribed. The same two researchers analyzed the data usingthe same reflexive thematic analysis approach described in Study 1,We checked the interview transcripts to reach a shared understandingand arrived at agreement after two iterations.

63
4.6 Results and Discussion
We collected a total of 33 examples of specific literature search prob-lems encountered by the 12 scientists, approximately three stories perscientist. Although the overall process of searching for the researchliterature is more open-ended than that of patent examiners, it is sim-ilarly complex. We identify four challenges that scientists face whensearching the literature, three of which correspond directly with thoseof Study 1: transferring information across applications is hard; re-finding papers from multiple sources is tedious; reusing notes is diffi-cult; and search results are easily lost..
Transferring information across applications is hard. Scientists, sim-ilar to patent examiners, use multiple specialized applications for ac-tivities such as reading, note-taking, document management and writ-ing. Many researchers expressed their frustration when trying to makethese systems work together. For example, P5 creates a new Mark-down file in Obsidian4 every time he decides to read a paper in depth.
4 Markdown (https://daringfireball.net/projects/markdown/syntax) is asimple mark-up format for text, and Ob-sidian is a “knowledge base” (https://obsidian.md) for markdown files.
He must manually create a link between his notes and the source pa-per. Since many note-taking applications focus on supporting stand-alone reading, researchers struggled to transform their notes into theirfinal document. Most tediously copy-paste their notes into the text ed-itor, then re-organize them and manually add citations. For example,P10 complained that because Overleaf5 did not display his personal
5 https://www.overleaf.com – LATEX ed-itor
notes from JabRef6, he had to read the paper again to figure out the
6 https://www.jabref.org – bibliogra-phy management tool
exact content. Although the details differ, the scientists face the samechallenge as the patent examiners, which is to transfer informationeffectively across different applications.
Re-finding papers from multiple sources is tedious. Researchershave multiple strategies for finding papers, including keyword search(5/12), references from key papers(4/12) and recommendations fromothers (5/12). Similar to patent examiners, they often need to go backand re-read the papers. For example, P3 goes back to her papers andreads them again when she her notes lack sufficient context and shecan no longer understand them. Others (P5, P12) developed strategiesfor manually adding a link to facilitate later backtracking. However,the process is tedious, especially when writing: “Then when I need to
write, I start from my note, and often go back to the article to see what is cor-
responding to what.” (P11) Most researchers (10/12) track informationat the document-level, unlike patent examiners who track it at the pas-sage level. However, two researchers created more fine-grained notes:P9 recorded the page numbers of printed papers to make it easy to re-

64
Figure 4.11. Tables created by P2
and P5 for their literature reviews.
turn to a precise location, and P6 added comments under section titlesthat served as an anchor for future re-finding.
Reusing notes is difficult. All scientists (12/12) take structured per-sonal notes as they read, which include both objective information,e.g., paper title, link, and quotations, as well as subjective information,e.g., personal summaries and comments. Although most participants(10/12) take notes that summarize the contribution(s) of the article,two (P5 and P8) also copy direct quotations.
All participants (12/12) use multiple applications for recording theirnotes. Most participants (10/12) comment on the articles directly,using PDF Reader’s annotation feature, or write notes on physicallyprinted copies (P9,P11). They also use a diverse set of additionalsoftware tools for recording personal notes, each of which imposesa corresponding file format. Some are open-ended, such as Microsoft
Word (P1,P2,P4,P7,P10,P11), TextEdit (P8,P10), and Emacs (P6), or hand-written notes (P9) or hand-drawn tree graphs (P3). Others are de-signed specifically for taking notes, such as Obsidian (P5), Zettlr (P8)and Evernote (P12). The rest are highly structured as Microsoft Excel
tables (P2,P3,P5,P12).
The format of the original notes directly affects the writing phase.Some (P2,P3,P5,P12) use tables to structure their notes. This providesan overview of the papers, making it easy to compare them (P12),and allowing them to discover “missing bricks in the literature” (P5).However, some uses of tables are problematic. For example, partic-ipants find it tedious to manually copy-paste information from mul-tiple sources into each table, and maintain links to sources by hand.When writing, they must also manually copy-paste contents from thetable. They also lack tools for interconnecting their data. For example,P8 wanted the text editor to automatically suggest relevant notes thathe could cite. Fig. 4.11 shows how P2 uses Excel to categorize articlesaccording to specified criteria. When she changed her categorizationstrategy, she decided to color code articles to reflect it, but found it

65
difficult to find relevant notes as she wrote her paper.
More flexible note-writing applications also led to frustration whenparticipants needed to re-organize their notes or keep track of eacharticle’s quotations or provenance. For example, P2, P5 and P8 werefrustrated by Word’s lack of structure which P5 described as a “sand-
box” that made it hard to find notes again.
In summary, reusing notes is difficult. Applications that avoid im-posing structure during initial note taking make it difficult to findand resuse those notes later. Yet applications that impose an initialstructure are only useful if that structure does not change during thesensemaking process.
Search results are easily lost. Given their diverse search approaches,researchers wanted to preserve traces of their search explorations. Forexample, P2 noted that she has no record of her history of searchingfor papers in the ACM Digital Library, which acts as a disincentive tofurther exploration. She wanted it to track “what I had searched and what
rabbit holes I had gone [down] and back”. P7 was frustrated that he couldnot remember where he found a particular paper, and cannot use it asa “memory helper” to start writing.
Summary. Together, studies 1 and 2 illustrate the challenges facedby two types of knowledge worker, patent examiners and scientists,as they try to read, search, annotate, organize, write and review textacross multiple specialized applications, while manually tracking itsprovenance. Both groups develop personal strategies for organizinginformation, with comparison tables as the most common represen-tation. A key difficulty they face is the lack of connection across theapplications, which results in repetitive tasks, loss of information orboth. The next section introduces Passages, a system we designed toaddress these issues.
4.7 Passages Concept
Based on these findings, we focused our design on facilitating thetransfer of information across applications while tracking its prove-nance. Rather than creating a new, integrated application that sup-ports the complex web of activities we observed, which would havecreated yet another information silo, we created a new type of interac-tive object that can be integrated into existing applications.
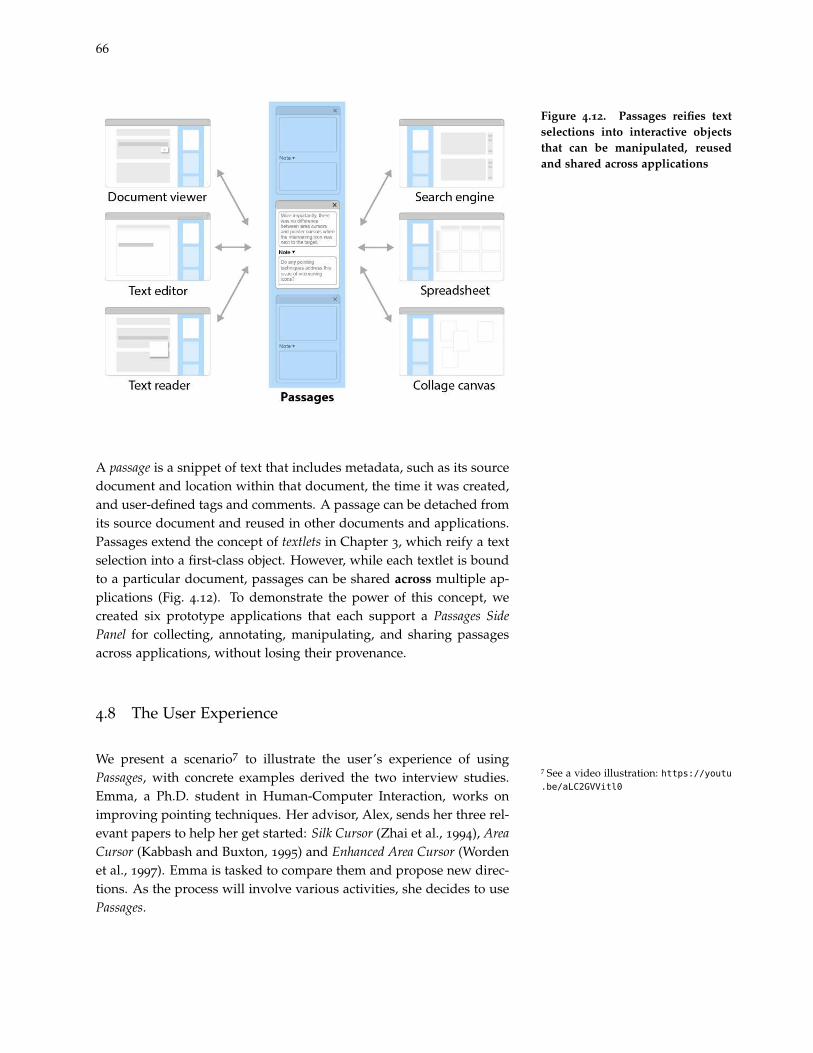
66
Figure 4.12. Passages reifies text
selections into interactive objects
that can be manipulated, reused
and shared across applications
A passage is a snippet of text that includes metadata, such as its sourcedocument and location within that document, the time it was created,and user-defined tags and comments. A passage can be detached fromits source document and reused in other documents and applications.Passages extend the concept of textlets in Chapter 3, which reify a textselection into a first-class object. However, while each textlet is boundto a particular document, passages can be shared across multiple ap-plications (Fig. 4.12). To demonstrate the power of this concept, wecreated six prototype applications that each support a Passages Side
Panel for collecting, annotating, manipulating, and sharing passagesacross applications, without losing their provenance.
4.8 The User Experience
We present a scenario7 to illustrate the user’s experience of using7 See a video illustration: https://youtu.be/aLC2GVVitl0
Passages, with concrete examples derived the two interview studies.Emma, a Ph.D. student in Human-Computer Interaction, works onimproving pointing techniques. Her advisor, Alex, sends her three rel-evant papers to help her get started: Silk Cursor (Zhai et al., 1994), Area
Cursor (Kabbash and Buxton, 1995) and Enhanced Area Cursor (Wordenet al., 1997). Emma is tasked to compare them and propose new direc-tions. As the process will involve various activities, she decides to usePassages.

67
Reading
Figure 4.13. The Viewer lets Emma
collect interesting text as passages,
by selecting them and clicking the
“Passage” button.
She opens the three papers in the Viewer (Fig. 4.13) and starts to readthem, trying to find their similarities and differences. As she readsthe Area Cursor paper, she realizes that it is inappropriate for fine po-sitioning tasks, since selections may become ambiguous on cluttereddisplays. She finds this an interesting limitation and collects the cor-responding text by selecting it and clicking the "Passage" button. Thecollected passage immediately appears in the side panel.
As she reads the Enhanced Area Cursor paper, she identifies severaldifferences compared to the Area Cursor. For example, although theEnhanced Area Cursor switches dynamically between pointer and areacursor, performance become the same when an intervening icon ap-pears next to the target. Emma collects this and other relevant text aspassages, using the same interaction.
Organizing
As the number of passages grows on the side panel, she decides toorganize them. She opens the Table (Fig. 4.19, Table) and drags anddrop passages from the side panel into the table. She quickly tiresof dragging the passages individually, and decides to move all thepassages related to one paper into a column, all at once. She dragsthe title of the Enhanced Area Cursor paper and drops it into an emptycolumn. All the passages automatically fill up the column and shenames the column “Enhanced Area Cursor”.
Emma begins to see patterns in the table. For example, neither Area
Cursor nor Enhanced Area Cursor improve performance when interven-

68
Figure 4.14. The Table lets Emma
drag and drop collected passages
and organize them into rows and
columns
ing targets appear, and the Silk Cursor only works for 3D selection. Shesummarizes these patterns by naming the rows accordingly. Emma re-alizes that she has forgotten what one of the passages is about, soshe double clicks it, which opens the original source document, withthe relevant text selected and highlighted. This helps her examine thepassage in its original context. Emma continues to build the table bymoving freely among the passages.
Searching
Figure 4.15. The Searcher lets
Emma iteratively search for more
documents by specifying multiple
search terms, and keeping track of
her search history.
Emma wonders if other papers address the problem of interveningicons next to the target. She returns to the Searcher application (Fig. 4.19,Searcher) and revisits her search history, where she discovers a newkeyword: “intervening”. She creates a new keyword by selecting thetext and clicking the “Create” button. She also adds “close” as a syn-

69
onym 8 and launches a new search with these additional terms. The8 Normally, ”close” is not a synonym for”intervening”. But in the context here,when multiple icons are close to oneicon, usually these icons are interveningicons because it distracts users to acquirethe icon she wants.
distribution of the different terms in the scrollbar of each resulting doc-ument helps Emma quickly locate the relevant text within the paper.After skimming the highlighted sections, she finds the Bubble Cursorpaper (Grossman and Balakrishnan, 2005), which seems to address theissue of intervening icons. She creates a new passage with the relevanttext description. She then decides to continue reading the documentin the Viewer.
Writing
Figure 4.16. The Editor helps
Emma communicate her findings,
while preserving the provenance
of each passage as she writes her
report.
After filling the table with passages, and some additional searchingand reading, Emma searches for pointing techniques that remain effi-cient in the presence of intervening targets. She then decides to writeup her findings for Alex. She opens the Editor (Fig. 4.19, Editor) butdoes not want to start from a blank page. She returns to the table anduses the Quick Drafting feature: she clicks the “Export by Row” button(Fig. 4.17, (b)), which converts the row header and the passages (to-gether with their notes) from this row into paragraphs in the Editor.Emma re-organizes the text into a concise evidence-based review, witha logical flow. While writing the last paragraph, Emma realizes thatone piece of evidence is missing. However, she remembers that shehad already read about it in the Area Cursor Paper. She opens the pa-per in the Viewer and immediately finds the related text. She collectsit as a passage and drags it from Viewer and drops it into Editor’s sidepanel (Fig. 4.17, (a)). She then inserts it as a citation by dragging anddropping it into the text area of the Editor. Emma is satisfied with herreview and exports it so she can send it to Alex.

70
Figure 4.17. (a) Fluid transitions
across applications through drag-
and-drop of passages between
windows; (b) Reuse of content and
structure from the Table directly
into the Editor
Communicating
Alex receives Emma’s review and reads it with the Reader (Fig. 4.19,Reader). He wants to find out more about one passage cited as evi-dence. When he clicks on it, the original passage immediately appearsas a yellow tooltip next to the text he is reading. He can also see thefull context by double clicking on the passage tooltip, which opensthe original paper at the correct scrolling position, with the relevantpassage selected and highlighted. This helps him understand Emma’sreview. He pins two interesting passages into the side panel, as a re-minder that he should discuss them further with Emma at their nextmeeting.
4.9 Passages User Interface
We describe the system and its implementation in greater detail. Inorder to demonstrate the concept of passage, we created a proof-of-concept implementation with six applications: Searcher, Viewer, Table,Canvas, Editor, and Reader that can share passages.

71
Figure 4.18. The Reader lets Alex
read the report while still easily
accessing the source documents to
verify the claims
The Passages prototype is implemented as a series of web applicationswritten in HTML, CSS and Javascript with the Vue.js framework. Theback-end is implemented in Node.js and an NeDB database, exceptfor the searcher application, which uses a PostgreSQL database forfull-text search.
Passages and Passages Side Panels
Each passage is displayed as a box with the quote from the originaldocument and a note containing text that can be edited by the user. Itkeeps track of both source document and its position of the text withinthe document, and can also be tagged with a color picked in a radialmenu.
Users can always locate and re-select the text from the passage’s sourcedocument simply by clicking on the passage. Since the text is re-selected instead of simply highlighted, users can immediately use nor-mal copy-paste if needed.
A Passages side panel (or side panel for short) displays a collectionof passages from one or more documents, automatically organizedby document. Each of the applications we created includes a sidepanel, although passages can also exist independently of a side panel.The side panel provides an easy-to-understand, central location forholding the passages relevant to the user’s current task. In additionto automatically classifying passages by their source documents, userscan also filter the passages in a side panel according to their color tags.

72
Figure 4.19. Passages overall user
interface with six applications.Viewer: Collecting Passages
The Viewer application (Fig. 4.19, Viewer) offers a lightweight wayto collect passages across multiple documents. To create a passage,the user simply selects the desired text with cursor and clicks on the“Passage” button that pops up next to the cursor. The collected pas-sage appears as a persistent interactive object in the side panel, witha small text area for personal notes. We intentionally did not providea categorisation mechanism, such as tags, when creating passages inorder to avoid the significant costs of eliciting structure early in theforaging process (Kittur et al., 2013). However, as mentioned earlier,passages can be tagged once created.

73
Table and Canvas: Organizing Passages
The Table and Canvas applications (Fig. 4.19, Table and Canvas) aredesigned to help users organize passages. The Table uses a grid struc-ture, which is particularly useful for comparison tasks (Chang et al.,2020; Liu et al., 2019), whereas the Canvas offers a more free-form wayto organize passages. The Table lets users drag-and-drop passagesback and forth between the table and the side panel, as well as amongtable cells. A cell can contain more than one passage. If users drag apassage into a cell that already has a passage, the target cell will con-tain two passages. Users can populate a column with all the passagesrelated to a specific source document simply by dragging the docu-ment title from the side panel to the column. Alternatively, users canclick and hold a cell containing a passage to select it all those below itbelonging to the same document, and then drag that set to a differentcell.
We intentionally separated the collecting application (Viewer) from theorganizing applications (Table and Canvas) for two reasons. First, thisseparation supports the “two-stage” model of sensemaking, where in-formation is gathered first and then organized (Kittur et al., 2013).Second, this provides more flexibility and opens up the possibility ofintegrating Passages into other applications such as Mural 9, Liquid-
9 Mural: https://www.mural.co/Text 10 or Muse 11, through a future API.10 LiquidText: https://www.liquidtext
.net/
11 Muse: https://museapp.com/
Searcher: Searching with Passages
The Searcher application (Fig. 4.19, Searcher) combines the designs ofTileBars (Hearst, 1995) and SearchLens (Chang et al., 2019), which letusers create multiple keyword objects (Chang et al., 2019; Hearst, 1995)and visualize them in the scrollbar of each document to support rapidnavigation (Hearst, 1995). Unlike SearchLens (Chang et al., 2019), thekeyword object has two fields: an editable search query area and a“related field” (like a scrapbook). The search query area gives userscomplete control over their search queries, allowing them to apply ad-vanced search, such as proximity search and add complex synonyms,as suggested by Studies 1 and 2.
The “related field” addresses another need identified in the interviewstudies, i.e. to learn about unfamiliar domains by searching for termdefinitions. Each keyword object offers a quick way to collect smallpieces of information as passages, and attach them to the keywordusing drag-and-drop. Users can capture the results of these informalsearches and use them to grow their domain knowledge.

74
Editor: Writing with Passages
The Editor application (Fig. 4.19, Editor) lets users use drag-and-dropto embed any collected passage as a citation directly into main writing.Dropping a passage object inserts that passage’s note as normal text,with the passage itself appearing a blue citation. This interaction isbased on our observations of knowledge workers who copy-paste theirnotes into their final writing for reuse. Hovering over the blue passagetext scrolls the side panel and highlights the corresponding passageobject. Users can edit the text as usual, and the link to the sidebarobject is always preserved. Future work will include an additionalbutton for selecting different citation reference styles, e.g. ACM or theAmerican Psychological Association.
Reader: Communicating with Passages
The Reader application (Fig. 4.19, Reader) provides a quick and easyway to access any referenced documents. A single click on the bluetext lets users see the exact underlying passage as a yellow tooltip.Users can then either open its source document to examine in greaterdetail, or pin it into the side panel for later reuse. Pinned passages canserve as reminders, e.g. for a discussion with the author. Maintaininga parallel link between the document and its reference informationfacilitates comparison and verification of the claims, which encouragesbetter evidence-based practices.
We do not include the author’s personal notes in the Reader becausepatent examiners in Study 1 expressed that seeing other people’s notesmight introduce bias in their own judgement. Future prototypes shouldoffer the reader the possibility of either seeing or hiding their personalnotes.
Summary
Table 4.1 summarizes the features of Passages that address the themesidentified in the Study 1 and 2. Moving passages across applicationslets users flexibly interleave knowledge work activities without beingforced to follow a preset process. Moreover, the consistent representa-tion of passages across the various applications supports a simple butpowerful mental model for users.
Unlike previous systems where note-taking and writing are supportedseparately, Passages lets users reuse their notes as they write whilemaintaining their provenance. When exporting content from the Tableto the Editor, Passages automatically collects the row or column head-

75
Issue Feature of Passages
Transferring information across applica-tions is hard.
Users can drag and drop passages across applications while main-taining their provenance.
Recording personal notes. Notes can be attached to passages, and stay attached when movingpassages across applications.
Re-finding snippets from multiple sourcesis tedious.
Passages always keep their provenance and let users access thesource document with a single click.
Search results are easily lost. Search results can be captured quickly and saved as passages.
Automatic drafting ignores human exper-tise.
Users maintain control when authoring, and can link their writingto passages and their corresponding sources.
Reusing notes is difficult. The Table and Canvas provide flexible ways of collecting and or-ganizing notes.
Table 4.1. How different fea-
tures of Passages address the is-
sues found in Studies 1 and 2.ers and their associated passages, and converts them into text and ci-tations, which users can then edit freely. A more complete implemen-tation should support a similar feature for the Canvas, by letting usersspecify export rules, e.g., based on tags. Finally the Reader reuses linkscreated during writing process to provide easy access to the originalreference material. This connects writing and reading in a fluid cycle,with passages serving as common underlying objects.
4.10 Study 3: Design Walkthrough with Patent Examin-ers
Figure 4.20. One participant’s cri-
tiques and suggestions for seven
interaction points demonstrating
the key features of Passages in the
generative walkthrough workshop.
We conducted a design walkthrough (Mackay, 2019) to gather system-atic, focused feedback about the benefits and weaknesses of variousfeatures of Passages; to collect ideas and suggestions for improvement;

76
and to assess the overall value and relevance of the concept of Passages.We based the design walkthrough on a scenario that illustrates the useof Passages in a realistic context, with interaction snippets drawn di-rectly from examples provided by patent examiners in Study 1. Thisscenario is explicitly designed to highlight challenges related to themesidentified in Studies 1 and 2.
Participants: We recruited one current patent examiner, two internalsoftware developers, two designers and one manager (two women,four men) from the same patent organization. The two designers werenot patent examiners; whereas the other four all had current or previ-ous experience as patent examiners. One developer had participated inStudy 1 and was also the author of the automatic drafting applicationmentioned in Study 1.
Procedure: The workshop lasted one hour and featured three mainsections: a 5-minute video demo, a 35-minute scenario-based designwalkthrough and a 15-minute general discussion. Participants receiveda description of the design walkthrough procedure prior to the work-shop, and a worksheet to fill out with their critiques and suggestions.
Figure 4.21: A timeline of the de-sign walkthrough
After first viewing a 5-minute video of the design scenario describedin section 4.8, the first author presented or “walked through” a livedemonstration of the scenario, pausing at each step to elicit critiquesand suggestions from the participants. This scenario is organized intoseven “interaction snippets” that illustrate how a patent examiner usesone or more key features of Passages to: 1) collect a passage; 2) organizepassages in a table; 3) locate other passages; 4) use the table contentfor drafting a patent report; 5) include an additional passage; 6) inserta passage as citation; and 7) review the final report. At each step,participants discussed the pros and cons of each feature, and filledout a specially designed worksheet that recorded their critiques andsuggestions for improvement. The workshop concluded with a generaldiscussion of the strengths and weaknesses of Passages.
Data Collection: We video-recorded the session and collected par-ticipants’ notes about critiques and suggestions. We also took hand-written notes during the session.

77
4.11 Results and Discussion
All participants found Passages to be an interesting and elegant con-cept: “a good way of improving the way we are working now.”(P1). P4 saidthe concept of interacting with information snippets is fundamental totheir work: “Because we always deal with pieces of information. With this
link, you can always navigate between the documents and to communicate
etc. I think it is an elegant way of dealing with it. It is not rigid and you can
always move it around. This is what I like.” P1 and P3 also appreciatedthe power and flexibility offered by Passages. P1 said:“The difference is
really the flexibility, dragging things around, we have no way of doing that.”
Two participants immediately wanted to integrate several features intotheir organization’s existing applications. For example, P2 wanted tointegrate the Reader into their current reviewing applications: “I like
the connection that you can open the document. It is really good. I can
imagine it working. In terms of integration, actually I could imagine this in-
tegrated into the current tools.” P3 especially liked the concept of reusingsnippets and the ability to always trace their provenance: “It is a very
interesting concept, especially this interaction of having the repository of snip-
pets and just use them in the table and the communication. It saves a lot of
time just by linking the documents and having the original version available
and having an easy to compare several documents.”
Figure 4.22: Having both sourceand reference side by side.
Two participants (P3, P4) appreciated the connection between readingand writing. P3 liked the ability to quickly access the reference infor-mation and the ability to quickly insert a reference in the text editor.P4 followed up saying that it is also the ability to have both informa-tion (source and reference) in parallel that makes it a great feature. P2
suggested combining reading and writing into a live thread, so thatexaminers could reply directly within the same passage.
Critiques. Although Passages lets users always go back to the sourcedocument by double clicking on it, one participant (P1) wanted moreinformation about the source document when using a passage in theside panel, Table and Editor, so as to avoid making organization orcitation mistakes. This suggests that users should have greater controlover configuring the visibility of provenance information.
P1 also mentioned that the scalability of the Table may be an issue:“I
think I might get lost in a bigger table”. The current feature of collapsiblenote in the passages could mitigate this concern. We are also consid-ering supporting zooming in and out and coloring cells as in standard

78
spreadsheet software.
Suggestions. Participants understood the role of the side panel as “a
repository of snippets and small fragments” (P3) and found “having them
available all the time is really useful.”(P6) They suggested additional bidi-
rectional connections between the side panel and other applications.For example, P2 suggested that once the passage is included as cita-tion, the side panel could indicate that it has already been used. P3
suggested a similar idea in the other direction: users could also see allthe places in the editor where a particular passage has been inserted.Beyond the side panel, P2 suggested connecting the Table and Editorso that passages included as citations in the Editor would appear inthe Table as well.
Two participants (P2, P3) immediately understood the power of reuse.They brainstormed about structuring mechanisms, such as taggingpassages while collecting them. Examiners could then reuse this struc-ture for other tasks, such as filtering and categorizing. P2 also sug-gested providing Table templates, either predefined or user-defined,with standard clauses in the Editor for examiners to reuse.
Other use cases. Participants suggested other use cases, such as coach-ing and quality control, where one examiner must review another ex-aminers’ work. P4 also saw a connection with reviewing the literature:“I will also generalize it not only to the review of patent, but also to any
academic document, not just limited to patent world.”
4.12 Study 4: Structured Observation with Scientists
In order to provide a grounded, qualitative assessment of the strengthsand weaknesses of Passages, we also conducted a structured observa-tion study (Garcia et al., 2014) with scientists. Participants first per-form and then reflect upon a set of realistic literature review tasks, us-ing both their usual literature review process and the Passages Viewer,Table and Editor applications. They then compare the details of each,both to identify problems and suggest new ideas. We also asked par-ticipants for feedback about Passages’s Canvas, Reader and Searcherapplications.
Participants: We recruited 12 graduate-level human-computer inter-action researchers (9 male, 3 female, ages 22 to 28), with an averageof 3 years of research experience. They use a diverse set of applica-

79
tions for reviewing literature, including multiple PDF viewers, GoogleDocs (3/12), Microsoft Word (2/12), Overleaf (2/12), Obsidian (2/12),Google Sheets (1/12), Notion (1/12), and MarginNote (1/12).
Setup: Participants accessed Passages via a web application on theirpersonal computers. We prepared two equivalent sets of HCI researchpapers about basic pointing techniques. Participants were already fa-miliar with pointing as an HCI research domain, which is based on afundamental model—Fitts’ Law.
The first set of three papers is based on the principle of increasing tar-get width: Area Cursor (Kabbash and Buxton, 1995), Enhanced Area Cur-
sor (Worden et al., 1997) and Silk Cursor (Zhai et al., 1994). The secondset of three papers is based on the principle of reducing target distance:Drag-and-pop (Baudisch et al., 2003), Pie menus (Callahan et al., 1988),and Object pointing (Guiard et al., 2004). We use Balakrishnan (2004)’scross-document comparison criteria, specifically participant profile, in-tervening targets, and commands for switching to normal interaction,to establish the “correct” criteria for analyzing each set of papers.
Procedure: Each session lasts approximately two hours. Participantsare asked to read two groups of three research papers, once usingtheir current set of software applications, and once using three Passages
applications: Viewer, Table, and Editor. They then write a short reviewthat compares the features of pointing techniques for each group ofdocuments.
Figure 4.23: Document set andapplication choice are counter-balanced.
The two conditions, document set: increasing target width or reduc-ing target distance, and application choice: with or without Passages,are counterbalanced for order within and across participants. Partic-ipants hear a scripted presentation that describes the functions of theViewer, Table and Editor applications immediately before performingthe Passages condition. We also show participants the Reader applica-tion, even though it is not necessary to perform the tasks, so they cansee how a fictional colleague would read their report.
The tasks are presented in the form of the following scenario: Your
colleague wants to start a new research project with you. She sends you three
documents about pointing techniques that she thinks are relevant but that she
has not read. Your goal is to read and compare them. For example, what
are the differences and similarities among these techniques? You will write a
short paragraph at the end to tell your colleague about what you found out, so
she can review and verify your findings. In the Passages condition, partici-pants perform the task with the Viewer, Table and Editor applications.

80
In the non-Passages condition, participants are free to use their ownsoftware. Participants use a think-aloud protocol (Fonteyn et al., 1993)to describe their experiences during each task. After each task, partic-ipants complete a short questionnaire and answer questions based onthe experimenter’s observations of their behavior.
After completing both tasks, participants complete a final question-naire that compares their usual literature review process with theirexperiences using Passages. Each question uses a five-point Likertscale, ranging from strongly disagree to strongly agree. Participantsare asked to assess their performance on three tasks—making annota-tions, assessing similarities and differences between documents, andwriting an evidence-based report—with respect to their mental load,perceived success, task difficulty and level of frustration. We concludeby asking participants to identify additional use cases from their recentprojects; discuss the advantages and disadvantages of using Passages;and make suggestions for improvement. We also show participants theCanvas and Searcher applications and ask them to describe situationsfor which they might be useful.
Data Collection: We collected all the passages participants createdwith the Viewer, Table and Editor applications, as well as the ques-tionnaire results. We took screen recordings as participants performedeach task in both conditions, as well as video of the interviews anddiscussions. We also took hand-written notes.
4.13 Results and Discussion
We analyzed the criteria that each participant created for comparingthe papers in each condition, and counted how many are correct, ac-cording to Balakrishnan (2004). The correct criteria for the increasing
target width condition are: participant profile; transparent or translu-cent; and intervening targets. The correct criteria for the reducing target
distance condition are: types of targets; intervening targets; and com-mands for switching back and forth.
All participants successfully completed the task in the Passages condi-tion (Fig 4.24). Participants considered provenance tracking (8/12) andtable exportation (8/12) as their favorite features. Provenance tracking“enables me to work more efficiently in terms of going back to the paper (P2)”;“is really good to be able to see the location of citation in the original document
(P4)” ; and “saves me a lot of time finding the context of my previous notes

81
a b
c
drag & drop
Figure 4.24. Interacting with Pas-
sages: Table (a) and report (c) cre-
ated by participants. (b) P4 drag-
dropped a newly created passage
directly into the Table.
during writing (P11)”. P2 liked Table exportation because it “enables me
to compare what [I] have. I like that fact that [I] can just export it for my
writing, not waste it. ”
Participants appreciated the fluid combination of reading and writing:“It feels great because the [Reader is] not something that really exists [in
Google Docs]...I really like the way we can click on...and trace the reference.
(P1)” P3 compared Passages with the many note-taking apps she hastried, including LiquidText, MarginNote and Notion, and said noneoffers Passages’ combination of reading and writing.
Participants immediately understood the concept of passages as genericobjects that work across multiple applications: “I really like it keeping the
notes as separate objects that are not explicitly linked to any PDF, making it
a more flexible format (P10).” Other participants wanted to make pas-sages work with their existing applications, such as Mural (P8) andemail (P9).
Reuse Structure, Not Only Content
Participants reused passages collected in the Viewer in the Table (aver-age reuse rate = 77.17%, SD = 0.37) and the Editor (average reuse rate= 88.36%, SD = 0.14). P9 said:“It feels great I can directly use the notes for
organization and writing.”. Only two participants did not use the table,since they usually write directly in a Google doc.
Figure 4.25: Participants largelyreuse the passages collected.

82
Participants developed two major strategies for generating the struc-ture for the report: task-based (5/12) and information-based (7/12).Those who used a task-based strategy took advantage of their pre-vious experience with a similar task to generate the initial structure,e.g. pros and cons: “Because the task is to compare interaction techniques,
using pros and cons is very natural to me.” (P2). These participants col-lected passages as they read. By contrast, participants who used aninformation-based strategy first skimmed two or three papers withoutcollecting any passages, to gain a general overview, since they did not“know what to collect (P8).”. They then read each paper in greater detailand began collecting passages.
Despite the differences between these two strategies, all participantswanted to reuse both content and structure. P1 explained: “For me, the
important part of using a sheet is the structure.”. Similar to the Study 3
examiner’s suggestion to provide tags in the Viewer side panel, bothP1 and P6 wanted to tag their passages in the Viewer and reuse thatstructure in the Table. Half of the participants (6/12) wanted to reusestructure from the Table in the Editor, either by exporting rows asseparate sections or by including column titles as subsections.
Table Helps Discover New Insights
Participants were three times more likely to identify the correct com-parison criteria when using Passages (Mean = 1.5, SD = 1, total = 18
times) compared to their own applications (Mean = 0.5, SD = 0.8, to-tal = 6 times). Ten participants found at least one comparison criterionusing Passages, compared to 4 participants when using their own appli-cations. This suggests that Passages encourages participants to detectpatterns across documents and generate new insights during compar-ison tasks.
Participants found the Table especially useful in discovering insightsand keeping track of their sensemaking process. This includes threeparticipants (P3, P8, P9) who had never previously used tables in theirprevious literature reviews. P7 said: “The table may help me structure.
The format really helps me make something apparent, by adding a table, you
have two dimensions.” P6 said the table helped him to have the “epiphany
aha moment” about the conceptual link across different domains. P9
said that, while he does not usually work with tables, he was happyhe used it because it is very convenient to have all the informationat a glance, and described it as “conceptual model”. Three participantswho had used their own applications before trying Passages sponta-neously created a table in that condition using a Markdown editor,

83
Google sheet or LibreOffice. This supports earlier findings that tablesoffer common and useful representation for analyzing sets of relateddocuments.
Three participants perceived the Table as a temporary placeholder thathelps organize their thoughts. P1 said: “When I’m in a rush, I would
completely focus on the writing instead of the sheet.”. P3 said she hadnot previously used tables because she cannot reuse the content whenwriting, but that the export feature encouraged her to use the Tableapplication.
We also found that several participants (5/12) returned to the Viewerto collect more passages, in order to fill in missing cells in the Table(See Fig. 4.24, b). P8 said: “The Table feels like a basket and you are looking
for eggs.”, and explained that it serves as a description of what heis looking for and guides his search, giving him hints about whichparticular passages he needs to collect.
Composing and Rephrasing
Participants used a writing-oriented strategy when using their own ap-plications, and a composition-oriented strategy when using Passages.In the former condition, participants write in the Editor while inspect-ing their notes or source documents. In the Passages condition, par-ticipants organise exported text directly into the Editor. Participantsappreciated seeing all their notes in the same place, which limits win-dow switching during copy-paste operations and reduces time wastedlocating certain notes. P3 said: “In Google Docs, I write mostly by myself.
When I’m using Passages, I’m less likely to copy and paste contents, they
are mostly from the original paper. It’s more convenient. [After importing] I
would just change a little, make it more smoothly and logically [organized].”
Participants had mixed opinions about exporting raw passages (SeeFig. 4.26). Most (10/12) mentioned that they rephrase the text fromthe reference document in their own writing because they do not wantto plagarize. P10 said: “I’m afraid it will be too similar to the original text
if I just copy and paste. You don’t want to plagiarize stuff. Sometimes I quote
but I just don’t want to do [it] all the time.” One participant found the ex-ported raw passage a bit “distracting for thoughts and writing something
coherent”. Another participant wrote that pie menus have issues withlarge numbers of items even though the original passage states that“Pie menus seem promising, but more experiments are needed beforeissuing a strong recommendation.” As he built his table, he realizedhis mistake and said: “facing the evidence forces me not to twist the words

84
Figure 4.26. In current design,
dropping a passage in the editor (a)
inserts the whole raw passage (b).
and misquote.” This suggests that passages that appear in the Editorshould be collapsible, to reduce clutter while still maintaining accessto the original evidence.
Feedback for Searcher and Canvas
Participants quickly saw the benefits of the Searcher for their ownwork. For example, P6 had a problem retrieving definitions he hadcollected about machine learning in his papers, and found it reallyuseful to attach definitions to keywords. P5 said he had to search hisdocuments one by one to find papers related to “immersive technol-ogy” and “stereoscopic”, and wanted to use the Searcher to combinethese two concepts, so he could search all his documents together.When shown the Canvas, three participants suggested to using it tomanage themes in the thematic analysis of their qualitative studies.
Quantitative Results and Limitations
In the post-hoc questionnaire, participants ranked Passages as easier,less mentally demanding and less frustrating to use and more success-ful to accomplish the task than their existing applications. However,four participants also found it more frustrating to write the summary.Follow-up interviews showed that this was due to the Editor’s limitedfunctionality compared to a commercial editor, e.g. lack of rich for-matting and automatic formatting of lists. Participants also suggestedfeatures for improving how citations are inserted in the Editor, such

85
as inserting the document name and maintaining the link after copy-pasting text. Participants considered tagging in the Editor and auto-filling columns in the Table to be the two least useful features. Manyparticipants suggested adding tagging to the Viewer, rather than theEditor, because they already have a structure in mind when writing.
Summary
Study 4 demonstrated that scientists can quickly learn to use Passages
and take advantage of its flexibility. They largely reused the collectedpassages in terms of both content and structure and used the Tableto discover more insights across documents. They also spontaneouslydevised compositing strategies by organizing exported passages into aconcise writing and suggested other use cases, such as thematic anal-ysis.
4.14 Conclusion
This chapter investigated how knowledge workers analyze and syn-thesis information by interacting with multiple documents. We inter-viewed two groups of “extreme” knowledge workers, patent examin-ers and scientists, and analyzed the complex interconnections amongtheir document-related activities, especially active reading, searching,collecting, organizing, writing and reviewing. We identified six keydifficulties they face, shown in Table 4.1. We found that these knowl-edge workers find it difficult to successfully manage their overall work-flow given the set of specialized applications they use; and have trou-ble maintaining the provenance of the information they collect.
We then introduce the concept of a passage, an interactive object thatreifies a selected snippet of text and maintains a link to its source doc-ument, allowing it to retain its provenance. Each passage can thenbe manipulated, reused, and shared across multiple applications us-ing simple interactions such as drag-and-drop. We created a proof-of-concept collection of six applications, each with a Passages side panelthat supports the creation and sharing of passages across them.
We conducted two studies to assess Passages: a design walkthroughwith six participants from a major patent organization; and a struc-tured observation study with 12 scientists. Participants found Passages
to be both elegant and powerful, and especially appreciated its flexi-bility and their ability to track the provenance of individual passages.

86
They felt it would improve their work practices, facilitate reuse, andoffer them novel strategies for analyzing and composing documents.
What have we learned about representation and manipulation? Oneof the design principle in the Star user interface is universal com-mands that can be used throughout the system, such as move, copyand delete (Smith et al., 1982). These universal commands ”strip away
the extraneous application-specific semantics to get at the underlying princi-
ples” (Smith et al., 1982). This is also the essential design concept forPassages. What I found in the interview study is that patent exam-iners needs to deal with snippets of information across applications.This has been confirmed by one director in the patent organization:”Because we always deal with pieces of information.” This observationmotivates the design of a new representation based on informationsnippets that users can flexibly move across applications, which I call”universal objects”. These universal objects represent the users’ continu-ous object of interest in multiple activities. The representation of theseuniversal objects is consistent across multiple applications but the be-havior is adapted to each specific context. For example, dragging apassage into a Table moves a passage from the side panel to the cell ofthe table. But dragging a passage into the text editor inserts a quoteas linked editable text. The evaluative study has shown that users canquickly learn this context-sensitive behavior.
In summary, many current computer systems support a few universalcommands since they are primarily designed based on the Star user in-terface. In this chapter, I expand our understanding of representationand manipulation by introducing the idea of ”universal objects” thatmaintain a consistent representation but also adapt to specific contextsin different applications. I argue that universal objects simplify theuser’s conceptual model and improve the flexibility of the manipula-tion.

87
5Representation for Document Management
The work reported in this chapter was joint with Julien Gori, a post-doc in the
same research team. I conducted the initial interviews and worked with Julien
Gori to create the interface concept. Julien Gori and Michel Beaudouin-Lafon
implemented the prototype and I conducted the evaluation analysis.
The work was published at ACM UIST2020 (Gori et al., 2020).
Figure 5.1: Manage multipledocuments.
We have now seen how knowledge workers edit one document andanalyze a set of related documents. To complete this thesis work aboutrepresentations for digital documents, I wanted to investigate one lastfundamental aspect: document management.
In this chapter, I want to explore how knowledge workers managetheir documents in an age where heterogeneous data science work-flows become the norm. My interviews with scientists show that in-stead of relying on more self-contained environments such as JupyterNotebooks, scientists work across many diverse tools. But they havedifficulties using the file system to keep track of, re-find and main-tain consistency among related but distributed information. This ledus to create FileWeaver, a system that automatically detects dependen-cies among files without explicit user action, tracks their history, andlets users interact directly with the graphs representing these depen-dencies and version history. We show that by making dependenciesamong files explicit and visible, FileWeaver facilitates the automationof workflows by scientists and other users who rely on the file systemto manage their data.

88
5.1 Context
Chapter 4 showed that many knowledge workers, such as scientists,must use several specialized tools that are not designed to dialogwith each other. Prior work has also shown similar findings for dataanalysis activity. For example, Oleksik et al. (2012) describes how re-searchers use a mix of standard office productivity tools and special-ized tools for experimental protocols and data analysis, while Zhanget al. (2020) list up to 13 different categories of tools used by data sci-entists.
These specialized tools typically load and save information in propri-etary and/or binary data formats, such as Matlab1 .mat files or SPSS2
1 https://mathworks.com/products/
matlab.html
2 https://www.ibm.com/analytics/
spss-statistics-software
.sav files. Knowledge workers have to rely on standardized exchangefile formats and file format converters to communicate informationfrom one application to the other, leading to a multiplication of files.
Figure 5.2. Guo (2012)’s typical
data science workflow
Moreover, as exemplified by Guo’s (2012) “typical” workflow of a datascientist (Fig. 5.2), knowledge workers’ data analysis practices oftenconsist of several iterations of exploratory, production and dissemina-tion phases, in which workers create copies of files to save their work,file revisions, e.g. to revise the logic of their code, and file variants, e.g.to modify parameter values.
However, neither the file system nor file navigation tools are designedto track the relationships between files nor the histories of files, offeringlittle support to knowledge workers for managing the numerous filesand associated workflows that their work requires. Software designedto capture file provenance (Muniswamy-Reddy et al., 2006; Murta et al.,

89
2014) addresses a similar issue by capturing metadata describing theorigin of the files as well as all the actions that are performed on itand the actors who perform them. However, we do not know if thisfine-grained approach is adapted to the needs of knowledge workers.In this chapter, we are thus interested in investigating how knowledgeworkers manage their documents and how we can support the pro-duction and dissemination of the knowledge.
5.2 Related Work
Three main areas are related to document management while usingmany specialized tools: the issues related to information silos, i.e. thefact that digital information tends to be trapped in proprietary filesformats and closed systems; the practices and workflows used by sci-entists in their data analysis tasks; and the studies and tools addressingthe management of file relationships.
Information Silos
Figure 5.3: Information lockedin its applications.
Previous work has identified the difficulties that users encounter withthe rigid hierarchical organization of current file systems (Bondarenkoand Janssen, 2005; Dourish et al., 1999; Ravasio et al., 2004) and the in-formation fragmentation created by information silos (Karger and Jones,2006; Ravasio et al., 2004). In a study of users’ desktops, Ravasio et al.(2004) reported the interviewees’ frustration with the fragmentation ofinformation across files and most interviewees expressed the need tohave their information linked together. The Placeless system (Dourishet al., 1999) partially addressed these issues by letting users create andmanage their own document properties. Karger and Jones (2006) pro-posed three approaches to address information fragmentation: group-ing (including tagging), annotating, and linking; and showed that link-ing related information can support users orienteering behavior (Tee-van et al., 2004).
Research on scientists’ work practices further highlights these issues.Oleksik et al. (2012) studied the artifact ecology of a research centerand found that scientists used multiple computing applications to cre-ate information artifacts that are locked into applications, making itdifficult to reuse content and get a unified view of the related researchmaterial. Their follow-up study (Oleksik et al., 2013) revealed the needto support three types of links: inheritance (source document), spa-tial proximity (spatial layout), and explicit links (resources and notes).

90
Tabard et al. (2008) (Fig. 5.4) studied lab notebooks and found thatbiologists work with a complex web of interrelated references in boththe physical and digital worlds that they keep in their head, and thatthey struggle to map this structure into a single organizational form.
Figure 5.4: Tabard et al. (2008)’sresearch shows how biologistsjuggles complex mix of paperand computer-based informa-tion.
Data Analysis Tasks and Workflows
Data analysis and results sharing is an essential part of scientific dis-covery (Oleksik et al., 2012). The iterative and exploratory nature ofdata analysis (Guo, 2012) tends to produce numerous manually ver-sioned scripts and output files (Guo and Seltzer, 2012). Computationalnotebooks combine code, visualizations and text, bringing fragmentedbut related information into a single document (Rule et al., 2018b). Sci-entists are rapidly adopting this new medium to document and shareexploratory data analyses (Shen, 2014). Researchers have built toolsfor computational notebooks to support various activities such as in-formal and rapid version control (Kery et al., 2017), re-finding of pastanalysis choices (Kery et al., 2019), easy navigation (Rule et al., 2018a)and managing messes (Head et al., 2019).
Figure 5.5. A Jupyter notebook
combines code, text and visual-
ization in a single notebook for-
mat. Image taken from (Rule et al.,
2018b).
However, building these tools within computational notebooks doesnot fully solve the problem: studies show that users of computationalnotebooks need to access diverse tools (Zhang et al., 2020) and com-bine them with other tools and documents (Chattopadhyay et al., 2020;Rule et al., 2018b). A survey (Zhang et al., 2020) of data scientists’ col-laborative practices reported 13 high-level categories of tools, includ-ing code editors (e.g. Visual Studio Code), computational notebooks(e.g. Jupyter Notebook), spreadsheets, data analysis tools (e.g. SPSS),document editing tools (e.g. LaTeX), and presentation software (e.g.Microsoft PowerPoint). Rule et al. (2018b) found that “individual note-

91
books rarely tell a story by themselves but are routinely combined with other
notebooks, emails, slides, and ReadMe”. Furthermore, their interviewees“even transferred outputs of the analysis to an entirely different medium (e.g.
slides, word processing document) for easier review.”
These studies suggest that scientists use a variety of tools in their dataanalysis and sharing process. We are interested in how they trackthe inter-connections between different documents in this process andwhy they choose to create multiple documents in the first place.
Figure 5.6: Karlson et al.(2011)’s versionset: folderview with indentation (top)and graph view showing filerelationship (bottom)
Figure 5.7: Sourcetree’s time-line interface for version con-trol. Source: https://www
.sourcetreeapp.com/
File Relationships
Previous research has explored file relationships to devise new waysto organize digital content, including using provenance (See more insection 4.2) and linking (Tabard et al., 2007).
Provenance Karlson et al. (2011) (Fig. 5.6) described a system thattracks copy relationships among files, helping users to manage theirversions. They introduced the ‘versionset’, a set of files that representa user’s concept of a document and found that file format is an im-portant element of the user’s conceptual model. Lindley et al. (2018)developed the ‘file biography’ to encompass the provenance of a fileand its propagation. Commercial user interfaces for version controlsystems such as Sourcetree (Fig. 5.7) represent file revisions in a time-based tree visualization3, but these tools are designed primarily for co-
3 See a list of GUIs at https://git-scm
.com/downloads/guis/.
ordinating work among programmers. Prior studies have found thatscientists rarely use version control systems (Kery et al., 2017; PerezDe Rosso and Jackson, 2013) and that knowledge workers mostly usemanual versioning (Chapter 3 and (Karlson et al., 2011)) because theyfind version control systems too complex. We find two limitations tothese systems: They require users to explicitly specify relationshipsamong files, and the relationships are presented as non-interactivegraphs. We are therefore interested in improving both automationto infer file dependencies and direct interaction to provide more usercontrol.
Linking Tabard et al. (2007) take a different approach to support webnavigation by automatically linking web pages together according touser actions. Software development tools such as webpack4 generate a
4 https://webpack.js.org/dependency graph by analyzing source code, but do not visualize norlet users control the resulting graph.

92
5.3 Interviews with Scientists
Our first step was to understand scientists’ document managementpractices. We conducted semi-structured interviews in their work-places to examine their document artifacts and the way they managethem.
Participants: We interviewed 23 scientists (7 women, 16 men): sixprofessors, four researchers, four Ph.D. students, five research engi-neers, three post-docs, and one research associate. The research topicsinclude neuroscience, mathematics, chemistry, physics, biology andcomputer science.
Procedure: All interviews were conducted in English by the secondauthor and lasted 45-60 minutes each. We visited the participants intheir labs and asked them to show us the tools, e.g. notebooks, thatthey use to keep track of their research information. Based on the arti-facts they showed us, we asked them to describe a recent, memorableevent, either positive or negative, related to using that artifact. We thenasked about their work practices based on these events and artifacts.
Data Collection: All interviews were audio recorded and transcribed.We also took photos and hand-written notes.
Data Analysis: We analyzed the interviews using reflexive thematicanalysis (Braun and Clarke, 2019). We generated codes and themesboth inductively (bottom-up) and deductively (top-down), looking forbreakdowns, workarounds and user innovations. Two coders (includ-ing the interviewer) conducted the analysis. They grouped codes intolarger categories, discussed any disagreements and rechecked the in-terview transcripts to reach a shared understanding. They arrived atthe final themes after two iterations.
5.4 Results and Discussion
We generated six primary themes: taking advantage of the character-istics of artifacts; transferring information across artifacts; keeping in-formation “just in case”; finding and re-finding; iterating the produce-communicate cycle; and expressing file relationships.

93
Taking Advantage of the Characteristics of Artifacts
All participants take advantage of the characteristics of different typesof information artifacts to manage their information (Fig. 5.8). Forexample, they use paper as a thinking and reasoning tool because free-hand drawing enables rich representations, flexible layout and bettermemorization. This is consistent with prior studies on the advantagesof paper (Mackay, 1999; O’Hara and Sellen, 1997; Sellen and Harper,1997, 2003).
Most participants (20/23) use at least one blackboard or whiteboard intheir office or in meeting rooms. These boards offer a large workingspace for free-hand sketching and writing, supporting fluid collocatedcollaboration (Pedersen et al., 1993; Tang et al., 2009).
Figure 5.8: Scientists take ad-vantages of different artifactssuch as paper, whiteboard, labnotebook and Jupyter notebook
Five participants with experimental science training also keep a phys-ical lab notebook. This notebook follows a chronological order andmakes it easy to switch between structured and free-form informa-tion. Participants create links to keep related information in contextby noting down file names or sticking print-outs on the relevant pages.Participants also have at least one personal notebook for “purely tem-
poral information” (P15). These personal notebooks are less clean andstructured than the “official” lab notebook. Participants transfer theimportant information to the lab notebook.
Similar to the analysis of biologists’ work practice (Tabard et al., 2008),these results suggest that the nature of information being distributedamong different artifacts such as paper, whiteboard and lab notebook,is driven by their unique characteristics.
Transferring Information Across Artifacts
From a first raw idea on paper to a well-written article, participantscontinuously structure their ideas over time as a project unfolds. Wefound that the process of transferring information from one artifactto another is a necessary cognitive process where participants review,rethink and re-evaluate their ideas.
P9 described how he worked with a colleague on an idea by writingon the blackboard; copying it onto paper in a cleaner version; goingback and forth between blackboard and paper several times until itwas mature enough to write it in LaTeX. He explained: “When I copy,
I am not just copying. I try to understand it of course... We also fix errors
when we transfer”.

94
Seven participants reported taking whiteboard photos during meet-ings to persist information digitally (Fig. 5.9, top). While taking aphoto is quick, they often forget to do it (P9, 10) and find it cumber-some to transfer the photos to their laptop (P2), organize them (P2, 9,21) and understand the messy content of the whiteboard after the fact(P22). As a result they prefer transcribing information onto a differentartifact, such as their notebook.
Figure 5.9: Hoard informationsuch as whiteboard photos, pa-per and script versions.
Keeping Information “Just in case”
A quarter of the scientists (P1, 6, 9, 10, 14, 21) tend to hoard informa-tion (whiteboard photos, figures, versions of paper) “just in case” eventhough they rarely revisit it (P9, 10, 14), partially because they are notable to anticipate what will be needed in the future (Fig. 5.9). For ex-ample, P21 (computer scientist) said: “It is really insane that amount of
photos we have. We clearly do not use all of them.”
Hoarding information adds to the challenge of future re-finding. Par-ticipants find it difficult to determine the right version among theirmultiple devices: “Anyways, everything is mixed up (between home and
work computers).” (P11). Participants use time stamps and modificationevents as primary cues to determine the right version. While prior re-search has focused on supporting document versions (Karlson et al.,2011), we also found the need to support managing the versions andvariants of graphs, particularly in scientists’ data analyses. For exam-ple, P6 (bioinformatician) prints several versions of the same graphsas he iterates analyses and puts the latest version in a plastic folder toeasily identify it.
Finding and Re-finding
All participants develop various strategies to support their future re-finding tasks.
Summarizing Participants summarize information to avoid having togo back to the raw source. The summarized information is usually inanother artifact that serves as a reference when re-finding. For exam-ple, P19 (experimental chemist) summarizes everything about a par-ticular molecule in a physical album when she completes a series ofexperiments and has a clear result (Fig. 5.10, top).
Linking related information Five experimental scientists link related in-formation together in their master lab notebook, like in (Tabard et al.,2008). If they need to link digital content, they simply note down the

95
file names. For example, P15 (computational chemist) writes down allthe information related to a plot in his paper lab notebook, includ-ing location of the data, scripts to generate that plot, location of theJupyter notebook of that plot and, name and location of the image file(Fig. 5.10, middle).
However, these manual links with file names break when participantschange the name or location of the file, as illustrated by P16 (experi-mental physicist): “I have done a lot of cleaning of my files so I don’t know
if I can find it.”
Figure 5.10: Various strategiesfor re-finding, e.g. summariz-ing, linking and combined withother documents.
Saving data in a single place Eight data scientists use a project-basedorganization to save related information in a single folder, similarto (Tabard et al., 2008). But their tendency to hoard information andthe messy results produced by exploratory programming (Rule et al.,2018b) result in folder clutter. For example, P18 (machine learning re-searcher) saves the data, the analysis scripts and the output in a singlefolder. As he produces variations and versions of the scripts and cor-responding outputs, files accumulate, hindering re-finding (Fig. 5.9,bottom).
Several participants use computational notebooks, e.g. Jupyter note-books, to keep track of their analysis process by saving scripts andtheir outputs in a single place. However, as Rules et al. (Rule et al.,2018b), we found that these notebooks are routinely combined withother documents such as slides (Fig. 5.10, bottom) and ReadMe.
This suggests that the strategy of saving data in a single place mightnot be flexible enough for scientists’ knowledge management. Theyalso need a lightweight way of linking related but distributed contenttogether.
Preserving importance The transition from one artifact to another isalso a process where participants assess the importance of informa-tion. They usually preserve important information in a new artifact ina more structured way and discard information they do not need any-more. For example, P10 (mathematician) first works on paper, thenselects the ideas he thinks are worth preserving and transfers themonto his paper notebook.
This process also applies to data analysis. P14 (bioinformatician) per-forms exploratory data analysis in one Jupyter notebook, where heproduces many graphs and statistics. Once he is happy with the re-sults, he copy-pastes them into his main Jupyter notebook, where he

96
collects all the important results.
Iterating the Produce-Communicate-Reproduce Cycle
Communicating results often involves manually cleaning, selectingand inputting content into another type of document or software tool(Fig. 5.11). Note that the results are often in the form of plots andgraphs. Participants use a range of media for sharing their results in-cluding Microsoft PowerPoint (P22, 6, 16) and Word (P22), Printout(P6, 13), LaTeX (P13), Google doc (P21), HTML (P15, 2), Markdown(P18) and Jupyter notebook (P14, 22). This supports the finding thatdata analysts transfer outputs of their analyses to an entirely differ-ent medium, e.g. slides or word processing document, for easier re-view (Rule et al., 2018b).
Participants’ choice of medium is related to the audience they target.For example, P13 prefers to give his supervisor a paper printout be-cause she is more likely to read it and get back to him. P2 (bioinfor-matician) prefers to share a static HTML file instead of an interactiveJupyter notebook because “what we have done in the project is that every
group has its own expertise. If they want to change the parameters, they will
ask you to change it. They won’t do it directly.”
Some participants (P6, 22) complain that it is time-consuming to te-diously copy-paste content into slides for easy sharing: “The problem
is that you have to drag and drop into PowerPoint. So when you have 15
images, it is a bit time consuming.” (P6)
Scientists often face re-finding challenges when they need to modifycontent after getting feedback. For example, P18 had to recreate agraph after discussing with coauthors but could not find the data forthat graph: “I did so many experiments that I could have accidentally over-
written the file...”
After a modification, the new results need to be communicated again.Scientists need to manually re-execute the update pipeline by cleaning,selecting and putting content into another medium. P14 (bioinformati-cian) said: “There is obviously a problem of synchronisation. At some point,
I generate the new version of a figure with slightly different parameters. I
need to reload it in Overleaf. It happens often.” Managing different fileformats or variants adds more overhead, as P11 illustrated: “Including
external files in LaTeX can get messy very very quickly. What? I want to use
jpeg; I am pretty sure this thing is jpeg. But the browser is suggesting that it
is not a jpeg.”

97
…
…
Hard to find source file
Manual
Synchronization
Manage
Versions
Tedious
copy-paste
Manage
FormatsFeedback Given
Iteration
Figure 5.11. Rapid lifecycle of var-
ious documents in scentists’ work-
flow.In summary, the produce-communicate-reproduce cycle requires sci-entists to successfully re-find the original content, reproduce the re-sults with new settings while keeping the previous versions and man-ually synchronizing the updated changes to another medium to com-municate these results again.
Expressing Inter-File Relationships
We identified three types of inter-file relationships that scientists wantto express: description, dependency and coexistence.
Description To help re-find and re-understand in the future, partici-pants often use text files to add explanations to other files, e.g. tables,images, pictures and code. Participants use ReadMe files (P14), tablesof contents in notebooks (P15) and code comments (P6). For exam-ple, P21 (computer scientist) writes plain text files for each image in afolder to help re-find them.
Re-finding code is particularly challenging because it requires under-standing the code again. P14 (bioinformatician) finds computationalnotebook useful but still writes additional ReadMe files for each Jupyter

98
notebook to explain the analysis to his future self (Rule et al., 2018b).Other participants complain that out-of-order execution and unclearcell dependencies hinders the reproducibility of previous results. Forexample, P15 does not use a Jupyter notebook as a full-fledged labnotebook because he can accidentally re-run a code cell that overwritesthe figure he wants to save. He still uses his paper notebook.
Dependency Participants need to keep track of files that are generatedby other files and manually keep them in sync. This often happens inproduce-communicate-reproduce cycle when scientists need to manu-ally modify and remix content across applications.
Coexistence All eight data scientists put the data and analysis scripts(including Jupyter notebook) in sub-folders of the same folder to linkthe data with the corresponding analyses. P14 (bioinformatician) andhis student created two separate but linked Jupyter notebooks becausethey use two languages (R and Python), that Jupyter does not supportsimultaneously.
Participants rely on file names to express inter-file relationships. How-ever, links with file names are easy to break in case of renaming. Filenames are also used for other information such as experiment param-eters, manual version suffix and file format, resulting in long, hard-to-understand file names.
Issue Empirical Evidence
Hard to re-find related butdistributed information
Related information is often distributed by necessity because scientists takeadvantage of the characteristics of different information artifacts (both physicaland digital), resulting in difficult information re-finding.
Lack of tools to track inter-filerelationships
Among various strategies to support future re-finding, linking is effective butlimited because participants want to create different types of relationshipsamong files and using file naming conventions is error-prone.
Manual synchronization To share results, participants manually re-execute the pipelines that create thetarget documents.
Difficult version management Participants’ hoarding behavior and use of multiple devices adds to the chal-lenges of re-finding and versioning. They have difficulty keeping track ofversions of their documents, such as graphs.
Lack of support to managefile variants, e.g. format
Participants produce variants of a file for different purposes. Different variantsof the same file clutter the folder, making it hard to manage.
Tedious creation of shareddocument
Participants complain that it is time-consuming and tedious to re-create shareddocument for review.
Table 5.1. Six issues observed in
the interview study.

99
Summary
This study shows that related information is often distributed by neces-
sity because scientists take advantage of the characteristics of differentinformation artifacts. Their hoarding behavior complicates their ver-sioning practices. They struggle to keep track, re-find and maintainconsistency of this related but distributed information, particularlywhen collaborating asynchronously with students or colleagues.
5.5 FileWeaver User Interface
Based on the findings from the user study, we decided to focus onthe file-related issues listed in Table 5.1. We designed FileWeaver , aprototype that augments traditional file management tools with auto-matic tracking and interactive visualization of file dependencies andhistories. FileWeaver detects file dependencies and can update the de-pendents of a file when that file is changed. It also records file historiesand can manage simultaneous versions and variants of a file.
Figure 5.12. The FileWeaver User
Interface. The Folder View is
a standard file browsing window.
Users can add files together with
their dependencies to the Graph
View by clicking “Add File”. The
Graph View was displayed by
selecting main.tex in the Folder
View, and shows the dependency
graph for that file. The History
View shows the history of versions
of main.tex
FileWeaver ’s interface has three interactive views (Fig. 5.12):
• A Folder View that displays all files in the current directory, similarto a typical file browser;
• A Graph View that displays files as nodes and dependencies as di-rected edges. For example, a file containing a dataset loaded by ascript is connected to the file holding the script;

100
• A History View that displays the history of a file as an interactivetree, where each new version is connected to the previous one.
In all three views, a menu with FileWeaver commands is accessible byright clicking a target or the background.
Folder View
FileWeaver uses the standard Folder view of the user’s operating sys-tem (Fig. 5.12), with an added sub-menu in the context menu of eachfile to invoke FileWeaver commands. The key command is New Link,which lets users add files to FileWeaver together with their dependen-cies. Files managed by FileWeaver have a little arrow on their icons toprovide a visual cue.
File Dependencies and the Graph View
Each file added to FileWeaver is a node in a graph, and the dependen-cies between files are directed edges between the nodes. This graphis constructed and updated automatically. Whenever the user selectsa file managed by FileWeaver in the Folder view, she can immedi-ately see the dependency graph of that file in a separate Graph view.Most FileWeaver commands are available in both the Folder and Graphviews.
Figure 5.13: Graph View with acopy (green arrow).
Figure 5.14: A morph file
Black edges represent regular, up-to-date dependencies. Other colorsrepresent a different status: a green dashed edge indicates a FileWeaver
copy (Fig. 5.13); a red edge indicates a stale dependency; a gray edgeindicates a manual dependency, e.g. between a ReadMe file and ascript; and a blue edge indicates the morph group of a file (Fig. 5.14).
Version Control and the History View
Figure 5.15: History View.
FileWeaver puts each file it manages under version control. When theuser edits the file via the Edit File and Update command and saves it,FileWeaver asks her to enter a commit message and records a new ver-sion upon closing that file.
The Show History command (Fig. 5.12) opens a History view whereeach node represents a version, labeled with the first line of the commitmessage and the time it was created. Branches corresponds to the useof the FileWeaver Copy command. Using the context menu, the usercan open any version of a file and compare two versions with color-highlighted differences.

101
Synchronization among Views
The Folder, Graph, and History views are synchronized and kept con-sistent. When the user selects a file in the Folder view, the Graph viewupdates to display the relevant graph. When FileWeaver detects thatthe dependencies of a file have changed, the graph is animated. Theuser can open a new Folder view at the location of any selected file inthe Graph view, and a History view from either the Folder or Graphview.
This makes navigating the file system flexible: the Folder view pro-vides traditional navigation of the file hierarchy, the Graph view dis-plays the dependencies of a file, irrespective of their location in thehierarchy, and the History view lets users explore the evolution of agiven file over time.
5.6 The User Experience
Figure 5.16. Selected user interac-
tion to detect and maintain file de-
pendencies. (See text and video for
a complete interaction)
The combination of synchronized views, automatic dependency track-ing and updating, and automatic versioning opens up new possibilitiesfor managing files. We introduce the main features that we have im-plemented in FileWeaver through several use scenarios inspired by the

102
interview study, starring Jane, a data scientist 5.5 I suggest to follow the scenario withthis video illustration: https://youtu
.be/PrcuF1MG1toScenario 1: Detecting and Maintaining Dependencies
Jane wants to keep track of the LaTex file main.tex where she writes thereport. She adds the LaTeX file main.tex to FileWeaver and then addsthe files linked to it. She also adds a Python script. FileWeaver runsthe script and adds the generated figure. Jane wants to add this newFigure to her report. She edits the LaTeX file to add a figure (Fig. 5.16,1 and 2) and is promped for a commit message (3). After saving themessage, FileWeaver automatically updates all the dependent files, andopens the resulting PDF file. The new Figure has been added and thegraph has been updated (4). Jean opens the original folder of thePython script and edits it to change the color to green. After savingit, FileWeaver runs the scripts, updates the linked files, and opens theupdated PDF. The figure becomes green.
Scenario 2: Managing Variants with Polymorphic Files
Figure 5.17. Selected user inter-
action to manage variants of files.
(See text and video for a complete
interaction)
Jane opens the folder of an image file and sees four variants of the samefigure. She merges them into a polymorphic file, or morph (Fig. 5.17,1) The Graph View connects the variants with blue lines (2). Janecollapses the morph to simplify the graph and reduce clutter (3 and

103
4). When she calls the morph from the Beamer file (for presentation),FileWeaver automatically calls the preferred extension.
Scenario 3: Managing Histories and Versions
Figure 5.18. Selected user interac-
tion to manage history and version
of a file. (See text and video for a
complete interaction)
Jane opens the history of the main TeX file. (Fig. 5.18, 1) She firstopens a previous version (2), and then selects two recent versions anddisplays their differences. Jane creates a copy of the file with its linkedfiles. In the Graph View, a green arrow links the original to the copy.She updated the file linked to the copy. She first edits the copy andsees the result. She then edits the original and checks the result. Whenshe opens the History View again, she can see the branch with theoriginal and the copy.
Scenario 4: Sharing files
Figure 5.19. Selected user interac-
tion to easily share all related files.
(See text and video for a complete
interaction)
Jane wants to share all files related to the main TeX file with her col-league Alex. She selects ”Flat Archive”, (Fig. 5.19, 1), which gathers allrelevant files into a single folder (2). Jane can also create a runnablearchive that also copies the hierarchy of folders. This lets Alex directlyedit and compile these files.

104
5.7 System Implementation
FileWeaver runs on Linux Ubuntu 18.04 LTS and was implemented byJulien Gori and Michel Beaudouin-Lafon. This section reflects theirwork and is included for completeness.
Graph Attributes
Nodes and edges of the graph have attributes that are stored in a sep-arate database. Some attributes are maintained automatically, e.g. edge
update time, which tracks when the dependency between two files waslast brought up to date. FileWeaver compares it to the file’s UNIX mtime
attribute to decide whether to update the dependency. Each node alsostores the version ID of the corresponding file, and each edge the ver-sion ID of the source side of the edge. If two files (A and B) dependon different versions of a third file (C), the edge (say, from C to A)representing the dependency that is not up to date is shown in red.This tells the user that A should be updated. If instead A and B wereproduced from C as part of the produce-communicate-reproduce cy-cle, it tells the user that the version of C that was used to produce Ais accessible from the History View, whereas it would normally havebeen overwritten by the version that produced B.
Other attributes are under user control. For example, The user can setnode update to false to specify that this node should not be automati-cally updated, e.g. because it is too computationally expensive to runthe update. The user can also change the recipes for a given file (seenext).
Recipes: Tracking and Updating Dependencies
FileWeaver uses file-dependent scripts called recipes, stored as node at-tributes, to track and maintain dependencies. These recipes specifyhow each file is processed (update), displayed to the user (interact) orits dependencies tracked (trace), allowing a high level of task automa-tion and the ability to always keep the Graph view up to date.
The update recipe processes the file and produces its output if there isone. For example, the recipe for a LaTeX file can simply be latexmk
$filename. The update recipe is run whenever a file needs to be up-dated. When a user triggers a FileWeaver command on a given file,FileWeaver checks that the dependent files are up to date, in a topolog-ical sorting order, and launches the update recipe on the target file if anupdate is indeed needed.
105
The trace recipe is optional and should produce the same file accessesas update, only faster. If unspecified, the update recipe is used instead.For example, the trace recipe for a LaTeX file can be simply pdflatex
$filename. FileWeaver traces the file accesses resulting from runningthe trace recipe when the file dependency list needs updating, e.g.when a file is edited or newly added. Trace recipes are motivatedby files with long compilation procedures, such as LaTeX files: whilethe update call to latexmk will usually result in at least three calls topdflatex, the trace recipe only needs a single one. Update and trace
recipes should include clean-up commands, if needed, to remove tem-porary files and avoid cluttering.
The interact recipe opens an editor or viewer for the file. For a La-TeX file, it calls the user’s preferred LaTeX editor, e.g. texmaker -n
$filename. FileWeaver runs the interact recipe when the user edits thefile through FileWeaver , or when FileWeaver wishes to display a file tothe user, e.g. to show the result of an update. When the user closes theeditor (which exits the interact recipe), changes are automatically ver-sioned. Note that the user can always edit a file outside of FileWeaver ;it will then be recognized as out of date on the next call to a FileWeaver
command.
When a file is added to FileWeaver , the recipes are initialized accordingto the file’s type. Each file type has a default set of recipes stored in a.rcp file. FileWeaver currently features recipes for 9 popular file types:.tex, .py, .pdf, .png, .jpg, .jpeg, .csv, .svg, .txt. Users can edit.rcp files, share them, and specify custom recipes for any given file.
We acknowledge that writing recipes may require some computingknowledge. We expect to provide more recipe to cover more file types,and a simple editor to facilitate creating, editing and sharing them.
Links and the Cookbook
The FileWeaver backend runs in the background and strives to be astransparent as possible to the user. It uses a hidden folder called thecookbook to store its files.
Each file managed by FileWeaver is attributed a folder, called a cookbook
page, in the cookbook. When FileWeaver starts tracking a file, that file ismoved to a new cookbook page, and a symbolic (soft) link is created atthe original file location, pointing to the file in its cookbook page. Thisleaves the user’s folder virtually unchanged, except for the fact that theuser now sees a symbolic link rather than a standard file. We use soft

106
Figure 5.20. Each file managed by
FileWeaver has a cookbook page, in
a hidden folder called cookbook.
A cookbook page also holds the
version control repository.
links rather than hard links because the latter do not span filesystems(including partitions). Also, most file browsers display symbolic linkswith an arrow on top of the file icon, giving the user a clue that thefile is managed by FileWeaver .
A cookbook page also holds the version control repository for thatparticular file (Fig. 5.20). Cookbook pages are named after the de-vice and i-node number of the file that they store, making for a cheapand memoryless, hashtable-like one-to-one mapping between files andcookbook pages6.
6 Some text editors use temporary filesthat are renamed into the original file af-ter saving, therefore changing the i-nodenumber of the file. FileWeaver creates anadditional, hidden hard link to the filewhen it is added to the cookbook page toprevent the i-node from changing. Thishard link can also serve as a backup ac-cess to the file.
Tracking File History Through Version Control
Whenever a file is edited via the Edit and Update File command, FileWeaver
prompts the user for a message and automatically commits the fileto the version control repository located in the file’s cookbook page.While FileWeaver could automatically detect file changes and performactions, we avoided this behavior to give users a better sense of con-trol. The FileWeaver Copy command creates a new cookbook page forthe copy but shares the same repository as the original file so thatthe user can merge the two files with the Merge Files command. Alledges to parent nodes and attributes are copied from the original file,preserving custom settings.
Polymorphic files
When the user selects several files and invokes the Morph Files com-mand, FileWeaver adds these files to its cookbook as usual, and as-signs them to a morph group. Instead of creating a soft link for eachfile, it creates a single soft link for the morph with a .gifc extension

107
(generic image format container). When a file calls a .gifc extension,FileWeaver goes through the graph and looks if there is an edge be-tween that file and a member of the morph group. If so it redirectsthe soft link with the .gifc extension to that morph group member;otherwise it goes through the default image formats associated withthat file, e.g. pdf/png/jpg for a LaTeX file, and creates an edge withthe corresponding morph group member. Whenever a file is used byFileWeaver , e.g. as part of an update, FileWeaver checks if that file usesa morph. If so, it makes sure that the soft link is pointing to the rightmember of the morph group. Since some systems, e.g. LaTeX, use thefile extension of included files, FileWeaver creates a second, temporarysoft link with the right extension, and runs a stream editor to searchand replace the morph file name with the right extension. When theupdate is complete, the original file content is restored and the secondsoft link is removed.
Implementation Details
FileWeaver runs on Linux Ubuntu 18.04 LTS. The backend is writ-ten in just under 5000 lines of Python with calls to standard UNIXtools such as bash and sed7. File dependencies are detected by run-
7 https://www.gnu.org/software/ning Tracefile8 on the trace recipe to track file accesses. The graph8 https://github.com/ole-tange/
tangetools/blob/master/tracefile/
tracefile.pod, which is a wrapperaround Linux’s standard strace
(https://linux.die.net/man/1/strace).
database is managed via the graph-tool library9. The backend cur-
9 https://graph-tool.skewed.de/
rently runs only on Linux due to the use of Tracefile and strace, butwe are considering alternatives for Mac OS.
The Folder view is the GNOME Nautilus file manager10 (Fig. 5.12 left).
10 https://github.com/GNOME/nautilus
We use nautilus-python11 to write extensions to Nautilus for running
11 https://github.com/GNOME/
nautilus-python
the backend and adding the menu of FileWeaver commands to the stan-dard Nautilus file menu.
Both the Graph and History views (Fig. 5.12 center) are implementedwith NWJS12, a platform to create web-based desktop applications.
12 https://nwjs.io/The Graph View sends commands to the backend through a simplepipe, and receives updates to the graph through a shared file. It usesdot13 for the layout of the graph. The version control system is Git14.
13 https://www.graphviz.org
14 https://git-scm.com/
Although not designed to deal with binary files such as figures, it canhandle a moderate amount of them without problem. We plan to ex-plore extensions to Git that deal with large or numerous binaries15.
15 such as git-lfs, git bup, git-annexThe History View directly calls Git commands for the different versionmanagement commands. It uses git2dot16 to create the version tree
16 https://github.com/jlinoff/
git2dotand diff2html17 to display version diffs. The FileWeaver Copy com-
17 https://diff2html.xyz
mand uses the git-worktree feature to check out several branches ata time.

108
5.8 Discussion and Evaluation
Issue FileWeaver Features
Hard to re-find related but dis-tributed information.
Visualize file relationship in interactivegraphs.
Manual synchronization. Automatically update dependent files.
Difficult version management. Visualize version history in a timeline.
Lack of support to manage filevariants, e.g. format.
Abstract file format into generic file.
Tedious creation of shared doc-ument.
Automatically collect all dependenciesin an archive.
Table 5.2. How different features
of FileWeaver address issues ob-
served in the interview study
Table 5.2 lists the most important features implemented in FileWeaver
and how they address the issues identified in the formative study (seeTable 5.1). We complement this analysis with a more general qual-itative evaluation of FileWeaver based on Green et al.’s cognitive di-mensions (Green, 1990). We leave a formal, longitudinal user study tofuture work.
Visibility and Hidden Dependencies
Visibility is the ability to view components easily, while hidden depen-dencies reflects whether important links between entities are visible ornot. FileWeaver achieves high visibility and low hidden dependenciesby making dependencies among files explicit and visible in the Graphview. Dependencies are represented by edges that can be manipulated,e.g. change the update rule. Automatically running recipes also revealdependencies as files are edited, unlike tools such as, e.g. Makefiles,that require manual editing to describe the dependencies.
In typical folder-based views, all non-hidden files are visible, whichmay clutter the folder. FileWeaver ’s polymorphic files let users view themultiple variants of a file as a single entity, making their relationshipmore explicit and reducing clutter.
Viscosity
Viscosity refers to resistance to change. FileWeaver has low viscositybecause it automatically propagate the user’s changes to a file to itsdependents, achieving consistency between files without explicit useraction.
FileWeaver also automatically stores successive versions of a file so thatusers can examine and revert to previous versions using the History

109
view. It supports exploration of alternatives by making it easy to createparallel copies and merge them.
FileWeaver prompts the user for a message when a file is edited viaEdit and Update File, which has high viscosity. Although encouragingusers to document their changes can help them re-find the right ver-sion in the future, this requires extra effort. We plan on simplifyingthis process, e.g. by suggesting auto-generated commit messages.
Error-proneness
FileWeaver reduces errors by automating the processes of dependencyupdate and versioning. The former reduces the risk of running thewrong command to update files, and the latter makes it possible to getback to a former version in case of an error. In future work we planto use version control also for the graph itself, which would make itpossible to easily recover deleted files and dependencies.
Secondary Notation
Secondary notation refers to the ability to carry additional informa-tion. FileWeaver lets users tag files to rename the node labels whilekeeping the underlying files with their original name. Users can alsoedit the recipe and interact scripts of individual files to tailor them totheir needs. In future work we will make it easier to define file typesand edit default recipes, as they are not currently readily accessible tonovice users.
Role Expressiveness
Role expressiveness refers to how obvious the role of each componentis. Each view in FileWeaver has a specific role: Folder view for reg-ular file management, Graph view for managing dependencies, andHistory view for versioning. Role expressiveness could be furtherimproved by decoupling components and giving users more flexibleways to combine them.
Premature Commitment
Premature commitment refers to constraints on the order to completetasks. FileWeaver limits premature commitment by letting users addfiles to the system whenever they want. File names, contents and loca-tions can also be modified at any time. Asking for a commit messagewhen saving a file is a form of premature commitment, and should be

110
made more flexible.
5.9 Conclusion
This chapter studies how knowledge workers manage their informa-tion. I interviewed 23 scientists and showed that the information theymanage is often distributed, because they take advantage of the char-acteristics of different information artifacts and rely on specializedtools. Although scientists develop strategies to cope with re-findinginformation, they still struggle to manage versions, maintain consis-tency and keep track of related distributed information. We intro-duced FileWeaver , where the traditional folder view is augmented byan interactive Graph View that displays dependencies among files anda History View that lets users interact with the different versions of afile, supporting navigation and re-finding tasks. FileWeaver also fea-tures polymorphic files, which groups the different variants of a fileinto a single, generic format.
We plan to evaluate FileWeaver in a realistic setting to gather feed-back and improve the interface. We also need to assess its scalabilityon larger sets of files. Future improvements include making recipeseditable by novice users, including through automatic capture of com-mands; simplifying the commit process, e.g. by suggesting commitmessages; and detecting dependencies in files such as zip archives andWord documents. Finally, FileWeaver has great potential for collabo-ration, since the file contents and its relationships are under versioncontrol and can therefore be pushed to a remote server for sharing.
What have we learned about representation and manipulation? Onepower of visual representation is that it gives users the ability to seeinvisible things. Once users see them, they can understand and learnto use them. The invisible things described in this chapter are the rela-
tionships among files that users typically have to manage in their heads.We make these invisible file relationships visible so that ”the display
screen relieves the load on the short-term memory by acting as a sort of “vi-
sual cache. (Smith et al., 1982)”. We created three new representationsbased on three types of file relationships: dependency, variation andversion. The dependency relationship is represented by a graph; thevariation relationship is represented by a group; and the version rela-tionship is represented by a tree.
In summary, I expand our understanding of representation by intro-

111
ducing three new representations based on the invisible file relation-ships that users typically have to manage in their heads. These newrepresentations demonstrate the power of visualizing the invisible. Iargue that these new representations improve users’ understanding oftheir own files and enable a flexible way to manipulate them.


113
6Design Principles
The design principles of reification, polymorphism, and reuse intro-duced by Beaudouin-Lafon and Mackay (2000) strongly influenced thedesign of the new representations investigated in this thesis. I nowanalyze these new representations and reflect on my experience de-signing them. I propose three new design principles, with the goalof enriching existing design principles and providing designers with anew perspective to think about designing digital objects. These threedesign principles are:
1. Granularity
2. Individuality
3. Synchronization
6.1 Granularity
Beaudouin-Lafon and Mackay (2000) refer to reification as “the process
by which concepts are turned into objects” and describe several existingexamples including a style in a text editor, a group in a graphical editorand a scrollbar for documents. The first principle I propose is thatThe reified representations should be adapted to the granularity of the users’
objects of interest. Using an analogy with objects in the physical world,I categorize granularity into two types: material and scale.

114
Granularity of Material refers to the property of the distinguishablepieces. I will illustrate this using text as an example. In a text editor,text is represented at a character level 1. The Granularity of Material
1 In text editing, users manipulate textat several levels of granularity such ascharacter, words, paragraphs, etc. I ar-gue that these levels are in the categoryof granularity of scale, not of materialsbecause the atomic level is still the char-acter. Furthermore, despite the fact thatthese levels are in the category of granu-larity of scale, the principle still appliesbecause text editing tools are adapted tothese different levels, e.g. by making se-lection.
is the character. This is appropriate for text editing but may not befor font design. When designing a new font, font designers need tomanipulate the strokes, the glyphs, the angles between two lines etc.If the text were still represented in the character level, it would notbe possible; the designer simply cannot manipulate these essential el-ements to design their font. The text is thus represented as a graphicalshape (Fig. 6.1, right). The Granularity of Material is finer than fortext editing; it is at the level of a shape. This level is appropriate be-cause designers can now manipulate these elements to define a font.Although the object in both examples is the text, it has different repre-sentations in terms of granularity of material in their digital environ-ments. An appropriate representation should match the granularity ofthe users’ object of interest.
Figure 6.1. Text is treated as a
character in a word processor (left)
but as a graphic in a font design
software. Image taken from: Mi-
crosoft Word and FontArk (Source:
https://fontark.net/farkwp/).
Granularity of Scale refers to the size of the distinguishable pieces. InBeaudouin-Lafon’s examples, a style (in a text editor) works at thelevel of character; a group works at the level of individual shape anda scrollbar works at the level of a row of pixels spanning the docu-ment. Now imagine a situation where you can only apply style tothe whole text, not just part of it, in a text editor; a situation whereyou can only group objects by layers, not arbitrary objects in the samelayer, in graphical editor; and a situation where you can only scroll thedocument by a whole paragraph, not a line of text. Although theseare just imaginary examples, it helps understand the importance ofdesigning representations whose Granularity of Scale is matched to thesize of users’ object of interest. Another research example of this ap-proach is MoveOn (Rivière et al., 2019), which lets dancers segmentthe seeker bar of the video into short, repeatable clips to support the

115
dance learning process. When learning a movement, the dancers’ ob-ject of interest is a short clip of a single, digestible movement ratherthan the entire video. This shorter clip thus has a finer-grained scaleto better support the dancers’ learning process.
Figure 6.2. Rivière et al. (2019)’s
MoveOn interface with short clips
representing a digestible move-
ment.
Example: Textlets
In the Textlets project, we observed that many users’ editing tasks areat the level of the selection (Granularity of Scale). The action of select-ing indicates the user’s intention of specifying the object of interest 2.
2 A shift from prefix syntax to suffix syn-tax helps systems to get rid of the mode,thus improving the usability (Tesler,2012)
This led to the design of a new representation at the level of the se-lection, namely the textlets. The benefits of such a design is demon-strated in the examples of countlets and variantlets. Technical writersoften need to constantly count words and characters for a single ormultiple sections in a document. But standard word processors onlyconstantly display the count for the whole document. Word count ofa specific range of text requires users to repetitively select the text. Be-cause Textlets work at a Granularity of Scale closer to the users’ actualobject of interest during an editing task, users can easily keep track oftheir word counts in real-time without repetitive selection. Similarly, inthe example of variantlets, technical writers often want to explore alter-natives at the granularity of word, sentence or paragraph. Variantlets
let users keep track of the changes made to a selection which could bea word, sentence or paragraph, rather than the entire document.
Figure 6.3: Variantlets
Example: Passages
When working with patent examiners, we found that they not onlywork with multiple documents but also snippets of text from multipleresources and remix them as needed. For example, they iteratively

116
take keywords from prior art documents to search for more relevantdocuments; they compare text snippets from multiple documents tounderstand the differences; they also cite specific text snippets (or pas-sages) when writing the final report. These observations informed ourdesign to focus on creating a finer granularity of representation, thepassage. Both textlets and passages give users the ability to createselection-level flexible representations, which are closer to the users’objects of interest in their daily tasks.
Example: FileWeaver
Figure 6.4: A morph representsa group of similar files.
While the above two examples create representations that are morefine-grained, the representation of a ”morph”, where multiple file vari-ants can be merged together, is more coarse-grained. We observed thatwhen a scientist talks about, e.g. a figure in her experimental results,she refers to “that box plot she created the other day”. She does notneed to know the format (e.g. png, jpg and svg) or resolution of thatimage file except when it is really needed. This is the rationale behindthe design of polymorphic files: a group of similar files forming theuser’s concept of a document that is meaningful to them.
6.2 Individuality
Polymorphism (Beaudouin-Lafon and Mackay, 2000) refers to the abil-
ity to apply a command to a group of objects, of the same or different types. Itis a powerful way to manipulate multiple objects beyond just mimicingthe reality (Jacob et al., 2008). Many research tools leverage the powerof polymorphism. For example, Draco (Kazi et al., 2014) allows usersto add granular motion by directly manipulating example objects. Theperformed transformation is recorded and is applied to each of the in-dividual, repeated objects generated from the patch (Fig 6.5, first row).DataInk (Xia et al., 2018) allows users to interact with the subgroup ofan object collection by specifying the mapping between data dimen-sions and visual properties of the glyph (Fig 6.5, second row). Unlikethe focus on expressivity and creativity in these contexts, knowledgework requires accuracy and consistency. For example, patent examin-ers are required to cite a specific quote in order to accurately commu-nicate and justify their decisions with patent attorneys. Scientists needto keep a specific set of experimental conditions and the correspond-ing results consistent. These differences raise other challenges to applypolymorphism and lead us to the second design principle: in additional
to the ability to apply a command to a group of objects, also support the ability

117
Figure 6.5. Interactions to ma-
nipulate groups of objects
in Draco (Kazi et al., 2014),
DataInk (Xia et al., 2018) and
Textlets.
to interact with individual and subgroups of objects. Enabling interactionwith individual element of a group further extends the flexibility ofpolymorphism. This is linked to the principle of Granularity becauseit is about decomposing a group into its element. It is also differentbecause Granularity focuses on the object itself while Individuality fo-cuses on the relationship among similar objects, i.e. the group.
Example: Textlets
In text editing tools, “replace all” is a command that replaces all theoccurrences of a search term with another in the whole text. However,one interesting observation that emerged from the interview study isthat most legal professionals do not use the “replace all” command.They prefer to replace occurrences one by one instead. A deeper inves-tigation revealed that it is because they need to ensure the correctnessof each match depending on the individual context. For example, ina situation where they change to a noun that has a different genderor number, they also may need to change the verb and article of thatsentence. This is especially true for our users who primarily work onFrench documents.

118
The current “replace all” command is a limited polymorphic command.The limitations are due to three reasons. First, users cannot see thecontext of each individual occurrence to make decisions on which onescan be replaced directly and which ones need further edits. Second,users cannot see what has been replaced before. They cannot check theprevious replacement unless they restart the search tool with the re-placed term. Finally, users cannot select a sub-group of all occurrencesto apply different strategies 3.
3 Miller and Marshall (2004)’s also real-ized this problem and intended to im-prove it. Their cluster-based search andreplace prototype automatically groupsthe matches so that users can replacesimilar matches at once.
Searchlets, one type of Textlets, extends the flexibility of polymorphismby enabling individual-level commands. Three individual-level com-mands of searchlet encourage users to perform “replace all”: 1) extend-able context, 2) individual undo, 3) partial selection (Fig 6.5, thirdrow). Extendable context allows users to see and assess the contextof an individual occurrence to make decisions. Individual undo letsusers revert back to the text before the replacement to make compar-isons. Partial selection gives users the ability to select a subset of theoccurrences that can be replaced all at once.
Example: Passages
To facilitate the process of manually moving each passage from theside panel to the table, we designed a feature where users can dragthe document title to the header of the table. This inserts all the pas-sages from this document into the column at once. However, the cur-rent design does not allow users to just move a subgroup of passages.A design improvement is to allow users to specify the sub-group ofpassages and then move them together.
Example: FileWeaver
We designed ”morphs” to let users manage a group of conceptually-similar files. But we also maintain the ability for the users to interactwith individual files, e.g. by expanding the morph, when they need to.
6.3 Synchronization
The last design principle is to always synchronize new and existing repre-
sentations. The rationale is that whatever representations users interactwith, if the underlying information they are interested in is the same,changes in the information should be reflected in the representationsaccordingly and consistently. Designers might also consider provid-

119
ing linking mechanisms between these representations. This couldenhance users’ conceptual model about the relationship between tworepresentations and a smooth shift between the two when the taskchanges. For example, most LaTeX editor, such as Overleaf 4, provides
4 https://www.overleaf.comat least two representations, the source plain text editor and the out-put PDF. Although Overleaf allows users to navigate to the location ofcorresponding content between these two representations by clickinga button, the selection is still not synchronized. Also, these representa-tions are not synchronized in real time and users still need to compileeach time to see the updated PDF. These can be areas of improvementusing the principle of Synchronization.
Example: Textlets
When designing textlets, we needed to make a choice about the loca-tion of the new selection objects. We considered several alternatives:integrated in the main text itself, represented in a separate panel onthe side or integrated into the scroll bar. The advantage of having aseparate place for new reified text selection objects is that users canhave an independent space to work on these objects without interfer-ing with other tools, e.g. the scroll bar. But we were also concernedthat the new representation on the side panel would shift users’ at-tention away from the main text. In the end, we decided to presentthem in a side panel because we wanted to test them independentlyfrom other tools and wanted to study how these new representationswould affect the users’ editing behavior. We keep the main text andthe Textlets side panel synchronized and provide ways for users toswitch between these two representations. For example, clicking onthe textlet navigates the main document to the location of the occur-rence and highlights it . Similarly, clicking on an occurrence in themain document highlights the corresponding textlet in the side panel.
Figure 6.6. Synchronization be-
tween textlets in the side panel and
the main text

120
In the evaluation of Searchlets, participants found the side panel sur-prisingly useful because they did not need to go back to the maintext. This suggests that participants indeed shift their attention to theside panel but for a good reason. Their attention is now focused onmore relevant information. The side panel provides a filtered view ofthe document with relevant information for the user’s task at hand,leaving the extra information in the main text accessible only whenneeded. We also observed that several users did go back to the maintext by clicking on the textlet on the side panel to locate it in the maintext, i.e. using it as a navigation tool.
Example: Passages
The synchronization principle is especially relevant for Passages. Pas-sages need to maintain two types of synchronization: the passage itselfand the side panel. Currently, the passage itself is always synchronizedacross applications but the side panels are not. Our original argumentis that the side panel is task- and application- specific. For example,users might want to use different sets of passages in different appli-cations, e.g. Table and Editor. However, this causes inconsistenciesamong multiple side panels and a lack of single source of truth, mak-ing it hard for users to manage the passages. If we were to apply theprinciple of Synchronization to the side panel, we would synchronizeall the side panels across applications but preserve the structures of thepassages for that specific application, e.g. if users have tagged them.We could also reduce the number of side panels to one, and make itstandalone and work with other applications. In this case, we wouldonly need to synchronize one side panel instead of multiple ones. Thiswould also simplify the user’s conceptual model.
Example: FileWeaver
Figure 6.7. Synchronization be-
tween the Graph View and the
Folder View
FileWeaver is not intended to replace the existing file manager but to

121
provide a new representation by visualizing the relationships amongfiles of users’ interest. We applied the principle of Synchronization sothat every user command, either from the Folder view or the Graphview , affects both views consistently.
6.4 Summary
As described in Chapter 2, Bill Verplank defines interaction design asrepresentation for manipulation. In graphical user interfaces, the rep-resentations are the graphical objects and the manipulations are thecommands to act on the them. An interaction design’s job can bebroadly considered as to choose the appropriate representations andcommands. In this chapter, I proposed three design principles thatcan help guide interaction designers to create appropriate representa-tions. Beaudouin-Lafon et al. (2021) introduced Generative Theories ofInteraction and recognized the idea of using concepts and principlesto create new designs. Following their method, I created a summarytable (Table 6.1) with sample questions, to help interaction designersapply the concepts and principles introduced in this chapter.
Designing
Representations
Analytical Critical Constructive
Concept
Representation What are the existing repre-sentations that users can ma-nipulate?
Do these representationsmatch the objects of interestin users’ minds?
Are there other objects of in-terest that have not been rep-resented in the user interface?Should new representationsbe designed?
Principle
Granularity Which level of granularity(both scale and material) arethe representations at?
Are the granularity of repre-sentations adapted to users’objects of interest?
Which granularity of repre-sentations should we create?Finer-grain or coarser-grain?
Individuality Which representations can begrouped? Which commandsapply to individual and grouprepresentations?
Should commands apply toindividual elements and sub-sets in the group?
How to make commands ap-ply to individual elementswithout breaking the group orlosing the ability to apply tothe whole group?
Synchronization Which representations de-scribe the same underlyinginformation? Are these repre-sentations synchronized?
Should representations besynchronized?
How to make representationssynchronized?
Table 6.1. Questions that can be
asked to apply the concepts and
principles in this chapter analyti-
cally, critically and constructively.

122
These principles are based on my own design experience and anal-ysis of existing interfaces. The scope of these principles should befurther tested. Beaudouin-Lafon and Mackay (2000) validated theirprinciples in the interface redesign Coloured Petri Net. I plan to applythe proposed principles in other areas such as presentation software,spreadsheet, etc. Presentation software is an interesting example be-cause it already has a rich set of representations such as the slide deck,the slide and the shape and text fields in each slide. I believe that bystudying specific examples and applying the proposed principles toredesign them, we can test the power and limitation of these princi-ples and possibly learn new ones. Another way to test these principlesis to collect and analyze representations in the existing literature. Ihave analyzed several representations in this thesis and I would like toconduct a more systematic and exhaustive literature review focusingon representations.

123
7Conclusion and Future Work
7.1 Conclusion
This thesis explores how to design representations for today’s document-related knowledge work. It challenges some fundamental and taken-for-granted representations in graphical user interfaces. My intent isto create a new perspective on knowledge work and demonstrate thatwe can still design innovative interfaces to support it.
I study today’s knowledge work from three main activities arounddocuments: editing (Chapter 3), analyzing (Chapter 4) and managing(Chapter 5). By studying extreme users (von Hippel, 1986) for eachactivity, I reveal the limits of current representations. By taking on aprincipled and theory-driven approach, I designed three flexible andeffective representations to support these activities.
Document Activity Extreme User Representation
Editing Lawyers Textlets
Analyzing Patent Examiners Passages
Managing Scientists FileWeaver
Table 7.1. Thesis overview with
three aspects of document-related
knowledge work.
My first focus is document editing, one of the most common docu-ment activities. We conducted contextual interview with lawyers andshowed that they struggle to manage the internal dependencies and tomaintain consistent use of vocabulary within their documents. Theydo not use the automatic features, e.g. “replace all”, because they do

124
not trust it. This leads to the design of Textlets (Fig. 7.1), a persistentrepresentation of text selection. The proof-of-concept implementationdemonstrates how Textlets address identified user issues. We studiedthe use of Textlets in an observational study where participants foundit useful and effective.
Figure 7.1: TextletsMy second focus is document analysis. Through a collaboration withthe European Patent Office, I conducted contextual interviews andobservations with patent examiners. The results showed that patentexaminers need to analyze information snippets from multiple doc-uments across various interconnected activities, including searching,collecting, annotating, organizing, writing and reviewing, while man-ually tracking their provenance. I designed Passages, a representa-tion of text selection that can be reused across multiple tools whilemaintaining the ability to retrieve its source document when needed.We conducted a walkthrough workshop and an observational studyto evaluate the use of Passages. The results show that that Passagesfacilitate knowledge workers practices and enable greater reuse of in-formation.
Figure 7.2: Passages
I finally turn my focus to document management. My interviewswith scientists from a broad variety of backgrounds revealed that in-formation is distributed among many artifacts by necessity becausescientists take advantages of different characteristics of these artifacts.They find it difficult to keep track of, re-find and maintain consis-tency among these related but distributed information. This leads usto create FileWeaver, a system that automatically detects dependenciesamong files without explicit user action, tracks their history, and letsusers interact directly with the graphs representing these dependen-cies and version history. We qualitatively evaluate FileWeaver basedon Green (1990)’s cognitive dimensions to identify areas for improve-ment.
Figure 7.3: FileWeaverThe design of three document representations are inspired by the sametheoretical principles: reification, polymorphism and reuse (Beaudouin-Lafon and Mackay, 2000). I reflect on our experience designing andevaluating these representations and propose three new design princi-ples: granularity, individuality and synchronization.

125
7.2 Future Work
From Extreme Users to General Users
While this thesis has focused on designing for extreme users, one nextstep is to find out how we can generalize to more ordinary users. Thisquestion has two levels.
1. How are the empirical findings still relevant to ordinary users?
2. Would our designs still work for ordinary users?
To address the first question, one method is to survey a large pop-ulation of ordinary users based on the findings of this thesis. Forexample, one finding with lawyers is that they need to keep consistentuse of terms but it is not clear if other user populations have the sameneed. To generalize this finding, the survey should focus on the searchand replace experience of a variety of users.
The results of the first question could provide us with some initialhints about the second question. If the results show that ordinaryusers have similar needs, it is likely that our designs could still workfor them. If the results show that they have different needs, we thenneed to study them in more detail. Another method is to let a varietyof users try out or ”experience” our designs. By doing so, we notonly use our designs to further probe their needs and also evaluatethe usefulness of our designs. For example, I am interested in makingPassages a stand-alone tool 1, and deploy it to various users for them
1 Yoink is a good example of a visibleclipboard: https://apps.apple.com/us/app/yoink-improved-drag-and-drop/
id457622435?mt=12
to use for a period of time2.
2 This is also related to litera-ture on Product Developmentsuch as Eric Ries’s Lean Startup:https://www.amazon.com/Lean
-Startup-Entrepreneurs-Continuous
-Innovation/dp/0307887898
Human Value in AI
All three prototypes in this thesis are purely based on direct manipu-lation and are agnostic of the past interaction history. Prior work suchas the Lumiere project (Horvitz et al., 1998) have proposed adaptivesystems that offer tailored assistance by identifying the user’s goalsand needs. More recent work, e.g. BIGFile (Liu et al., 2018), usesBayesian Information Gain framework to assist the user in navigatingto a desired target (file or folder). One future direction is to explorehow to bring both direct manipulation and adaptive systems together,especially from a user’s perspective.
In our Passages project with patent examiners, we observed their re-luctance to use the tool that automatically generates a report. From

126
this, we learned that the nature of their intellectual work is based inthe human-human communication, as one patent examination man-ager said:
If we are moving in the direction where the communication will be au-tomatically generated by computer, we will be sending the message thatwe don’t really do the intellectual work. So [the patent attorneys] will beless likely to be convinced, the same way I am less likely to be convinced.
This illustrates the importance of maintaining user control in this human-human communication. At the interface level, the difference can bevery subtle. For example, instead of generating the full report andasking the users to post-edit it, our Passages editor gathers all the rel-evant passages and waits for them to be selected by the user. Thesubtle interface difference between post-editing and active composingmaintains the user in control to decide how they want to write theirdocuments.
Final Thoughts
During my mid-term presentation of my Ph.D, Jean-Daniel Feketeasked me:
What is a document?
I was not able to answer that question. It was not because I do notknow how to do a quick search on Google but I did not know howmy thesis could answer that question. I have been thinking about thisquestion since then. Two years later, I came across him on the trainand I told him that I might have the answer for that question. He wasready to listen. I said:
A document is an artifact that persists information and is intended forhuman-to-human communication.
There are two elements in my definition: persistent and human-to-human communication. First, a document must hold and persist in-formation. The traditional way is to have it written. From this aspect,human speech is not a document because it disappears with time. Sec-ond, a document is intended for human-to-human communication.This implies the involvement of at least two parties, the writer andthe reader, and they are both humans. From this aspect, the computercode is not a document if it is intended to be read only by the com-puter (non human). The computer code together with comments anddocumentation is a document because it is intended to be read by a hu-

127
man. Together, these are the two essential elements of my definitionof a document. He thought about it for a bit and said:
OK. I accept this answer.


129
References
Abrams, D., Baecker, R., and Chignell, M. (1998). Information archiv-ing with bookmarks: Personal web space construction and or-ganization. In Proceedings of the SIGCHI Conference on Human
Factors in Computing Systems, CHI ’98, page 41–48, USA. ACMPress/Addison-Wesley Publishing Co.
Adar, E., Teevan, J., and Dumais, S. T. (2009). Resonance on the web:Web dynamics and revisitation patterns. In Proceedings of the
SIGCHI Conference on Human Factors in Computing Systems, CHI’09, page 1381–1390, New York, NY, USA. Association for Com-puting Machinery.
Adler, A., Gujar, A., Harrison, B. L., O’Hara, K., and Sellen, A. (1998).A diary study of work-related reading: Design implications fordigital reading devices. In Proceedings of the SIGCHI Conference
on Human Factors in Computing Systems, CHI ’98, page 241–248,USA. Association for Computing Machinery.
Alexander, J., Cockburn, A., Fitchett, S., Gutwin, C., and Greenberg, S.(2009). Revisiting Read Wear: Analysis, Design, and Evaluation of a
Footprints Scrollbar, page 1665–1674. Association for ComputingMachinery, New York, NY, USA.
Atkin, A. (2013). Peirce’s Theory of Signs. In Zalta, E. N., editor,The Stanford Encyclopedia of Philosophy. Metaphysics Research Lab,Stanford University, Summer 2013 edition.
Baecker, R. M., Nastos, D., Posner, I. R., and Mawby, K. L. (1993). Theuser-centered iterative design of collaborative writing software.In Proceedings of the INTERACT ’93 and CHI ’93 Conference on Hu-
man Factors in Computing Systems, CHI ’93, pages 399–405, NewYork, NY, USA. ACM.
Balakrishnan, R. (2004). "beating" fitts’ law: Virtual enhancements forpointing facilitation. Int. J. Hum.-Comput. Stud., 61(6):857–874.
Bardram, J., Bunde-Pedersen, J., and Soegaard, M. (2006). Supportfor activity-based computing in a personal computing operating

130
system. In Proceedings of the SIGCHI Conference on Human Factors
in Computing Systems, CHI ’06, page 211–220, New York, NY,USA. Association for Computing Machinery.
Barreau, D. and Nardi, B. A. (1995). Finding and reminding: Fileorganization from the desktop. SIGCHI Bull., 27(3):39–43.
Baudisch, P., Cutrell, E., Robbins, D., Czerwinski, M., Tandler, P.,Bederson, B., and Zierlinger, A. (2003). Drag-and-pop anddrag-and-pick: Techniques for accessing remote screen con-tent on touch- and pen-operated systems. In Human-Computer
Interaction–INTERACT ’03, pages 57–64. IOS Press.Beaudouin-Lafon, M. (2000). Instrumental interaction: An interaction
model for designing post-wimp user interfaces. In Proceedings
of the SIGCHI Conference on Human Factors in Computing Systems,CHI ’00, pages 446–453, New York, NY, USA. ACM.
Beaudouin-Lafon, M. (2004). Designing interaction, not interfaces. InProceedings of the Working Conference on Advanced Visual Interfaces,AVI ’04, pages 15–22, New York, NY, USA. ACM.
Beaudouin-Lafon, M., Bødker, S., and Mackay, W. E. (2021). Generativetheories of interaction. ACM Trans. Comput.-Hum. Interact., 28(6).
Beaudouin-Lafon, M. and Mackay, W. E. (2000). Reification, polymor-phism and reuse: Three principles for designing visual inter-faces. In Proceedings of the Working Conference on Advanced Visual
Interfaces, AVI ’00, pages 102–109, New York, NY, USA. ACM.Bederson, B. B. and Hollan, J. D. (1994). Pad++: A zooming graphical
interface for exploring alternate interface physics. In Proceedings
of the 7th Annual ACM Symposium on User Interface Software and
Technology, UIST ’94, page 17–26, New York, NY, USA. Associa-tion for Computing Machinery.
Bergin, T. (2006). The origins of word processing software for personalcomputers: 1976-1985. Annals of the History of Computing, IEEE,28:32–47.
Bernstein, M. S., Little, G., Miller, R. C., Hartmann, B., Ackerman,M. S., Karger, D. R., Crowell, D., and Panovich, K. (2015). Soylent:A word processor with a crowd inside. Commun. ACM, 58(8):85–94.
Bertin, J. (1983). Semiology of graphics; diagrams networks maps.Technical report.
Bier, E. A., Ishak, E. W., and Chi, E. (2006). Entity quick click: Rapidtext copying based on automatic entity extraction. In CHI ’06
Extended Abstracts on Human Factors in Computing Systems, CHIEA ’06, pages 562–567, New York, NY, USA. ACM.
Billman, D. and Bier, E. A. (2007). Medical Sensemaking with Entity
Workspace, page 229–232. Association for Computing Machinery,New York, NY, USA.

131
Bondarenko, O. and Janssen, R. (2005). Documents at hand: Learningfrom paper to improve digital technologies. In Proceedings of the
SIGCHI Conference on Human Factors in Computing Systems, CHI’05, page 121–130, New York, NY, USA. Association for Comput-ing Machinery.
Brandt, J., Guo, P. J., Lewenstein, J., Dontcheva, M., and Klemmer, S. R.(2009). Two studies of opportunistic programming: Interleavingweb foraging, learning, and writing code. In Proceedings of the
SIGCHI Conference on Human Factors in Computing Systems, CHI’09, pages 1589–1598, New York, NY, USA. ACM.
Braun, V. and Clarke, V. (2019). Reflecting on reflexive thematic analy-sis. Qualitative Research in Sport, Exercise and Health, 11(4):589–597.
Bush, V. (1945). As We May Think. Atlantic Monthly, 176(1):641–649.Callahan, J., Hopkins, D., Weiser, M., and Shneiderman, B. (1988). An
empirical comparison of pie vs. linear menus. In Proceedings of the
SIGCHI Conference on Human Factors in Computing Systems, CHI’88, page 95–100, New York, NY, USA. Association for Comput-ing Machinery.
Capra, R., Marchionini, G., Velasco-Martin, J., and Muller, K. (2010).Tools-at-Hand and Learning in Multi-Session, Collaborative Search,page 951–960. Association for Computing Machinery, New York,NY, USA.
Card, S. K., Moran, T. P., and Newell, A. (1987). Computer text-editing: An information-processing analysis of a routine cog-nitive skill. In Baecker, R. M. and Buxton, W. A. S., editors,Human-computer Interaction, chapter Computer Text-editing: AnInformation-processing Analysis of a Routine Cognitive Skill,pages 219–240. Morgan Kaufmann Publishers Inc., San Francisco,CA, USA.
Card, S. K., Robertson, G. G., and York, W. (1996). The webbook andthe web forager: An information workspace for the world-wideweb. In Proceedings of the SIGCHI Conference on Human Factors in
Computing Systems, CHI ’96, page 111–ff., New York, NY, USA.Association for Computing Machinery.
Chang, J. C., Hahn, N., and Kittur, A. (2020). Mesh: Scaffolding com-parison tables for online decision making. In Proceedings of the
33rd Annual ACM Symposium on User Interface Software and Tech-
nology, UIST ’20, page 391–405, New York, NY, USA. Associationfor Computing Machinery.
Chang, J. C., Hahn, N., Perer, A., and Kittur, A. (2019). Searchlens:Composing and capturing complex user interests for exploratorysearch. In Proceedings of the 24th International Conference on Intel-
ligent User Interfaces, IUI ’19, page 498–509, New York, NY, USA.Association for Computing Machinery.

132
Chapuis, O. and Roussel, N. (2007). Copy-and-paste between overlap-ping windows. In Proceedings of the SIGCHI Conference on Human
Factors in Computing Systems, CHI ’07, pages 201–210, New York,NY, USA. ACM.
Chattopadhyay, S., Prasad, I., Henley, A. Z., Sarma, A., and Barik,T. (2020). What’s wrong with computational notebooks? painpoints, needs, and design opportunities. In Proceedings of the 2020
CHI Conference on Human Factors in Computing Systems, CHI ’20,page 1–12, New York, NY, USA. Association for Computing Ma-chinery.
Cheney, J., Chong, S., Foster, N., Seltzer, M., and Vansummeren,S. (2009). Provenance: A future history. In Proceedings of the
24th ACM SIGPLAN Conference Companion on Object Oriented Pro-
gramming Systems Languages and Applications, OOPSLA ’09, page957–964, New York, NY, USA. Association for Computing Ma-chinery.
Cherubini, M., Venolia, G., DeLine, R., and Ko, A. J. (2007). Let’s goto the whiteboard: How and why software developers use draw-ings. In Proceedings of the SIGCHI Conference on Human Factors in
Computing Systems, CHI ’07, pages 557–566, New York, NY, USA.ACM.
Churchill, E. F., Trevor, J., Bly, S., Nelson, L., and Cubranic, D. (2000).Anchored conversations: Chatting in the context of a document.In Proceedings of the SIGCHI Conference on Human Factors in Com-
puting Systems, CHI ’00, pages 454–461, New York, NY, USA.ACM.
Cohen, A. L., Cash, D., and Muller, M. J. (1999). Awareness, planningand joint attention in collaborative writing: From fieldwork todesign. LOTUS CODE# 1999.02, pages 94–101.
Conlen, M. and Heer, J. (2018). Idyll: A markup language for author-ing and publishing interactive articles on the web. In Proceedings
of the 31st Annual ACM Symposium on User Interface Software and
Technology, UIST ’18, page 977–989, New York, NY, USA. Associ-ation for Computing Machinery.
Cooper, H. M. (1998). Synthesizing research: A guide for literature reviews,volume 2. Sage.
De Saussure, F. (2011). Course in general linguistics. Columbia Univer-sity Press.
Dearman, D. and Pierce, J. S. (2008). It’s on my other computer!computing with multiple devices. In Proceedings of the SIGCHI
Conference on Human Factors in Computing Systems, CHI ’08, page767–776, New York, NY, USA. Association for Computing Ma-chinery.
Dontcheva, M., Drucker, S. M., Wade, G., Salesin, D., and Cohen, M. F.

133
(2006). Summarizing personal web browsing sessions. In Proceed-
ings of the 19th Annual ACM Symposium on User Interface Software
and Technology, UIST ’06, page 115–124, New York, NY, USA. As-sociation for Computing Machinery.
Dourish, P., Edwards, W. K., LaMarca, A., and Salisbury, M. (1999).Presto: An experimental architecture for fluid interactive docu-ment spaces. ACM Trans. Comput.-Hum. Interact., 6(2):133–161.
Dragicevic, P., Jansen, Y., Sarma, A., Kay, M., and Chevalier, F. (2019).Increasing the transparency of research papers with explorablemultiverse analyses. In Proceedings of the 2019 CHI Conference on
Human Factors in Computing Systems, CHI ’19, pages 65:1–65:15,New York, NY, USA. ACM.
Dubroy, P. and Balakrishnan, R. (2010). A study of tabbed brows-ing among mozilla firefox users. In Proceedings of the SIGCHI
Conference on Human Factors in Computing Systems, CHI ’10, page673–682, New York, NY, USA. Association for Computing Ma-chinery.
Ducheneaut, N. and Bellotti, V. (2001). E-mail as habitat: An explo-ration of embedded personal information management. Interac-
tions, 8(5):30–38.Evans, N., Edge, D., Larson, J., and White, C. (2020). News provenance:
Revealing news text reuse at web-scale in an augmented newssearch experience. In Extended Abstracts of the 2020 CHI Conference
on Human Factors in Computing Systems, CHI EA ’20, page 1–8,New York, NY, USA. Association for Computing Machinery.
Farkas, D. K. (1985). The concept of consistency in writing and editing.Journal of Technical Writing and Communication, 15(4):353–364.
Federico, P., Heimerl, F., Koch, S., and Miksch, S. (2017). A sur-vey on visual approaches for analyzing scientific literature andpatents. IEEE Transactions on Visualization and Computer Graphics,23(9):2179–2198.
Fertig, S., Freeman, E., and Gelernter, D. (1996). Lifestreams: An al-ternative to the desktop metaphor. In Conference Companion on
Human Factors in Computing Systems, CHI ’96, page 410–411, NewYork, NY, USA. Association for Computing Machinery.
Flintham, M., Karner, C., Bachour, K., Creswick, H., Gupta, N., andMoran, S. (2018). Falling for fake news: Investigating the con-sumption of news via social media. In Proceedings of the 2018
CHI Conference on Human Factors in Computing Systems, page 1–10,New York, NY, USA. Association for Computing Machinery.
Fonteyn, M. E., Kuipers, B., and Grobe, S. J. (1993). A descriptionof think aloud method and protocol analysis. Qualitative Health
Research, 3(4):430–441.Garcia, J., Tsandilas, T., Agon, C., and Mackay, W. E. (2014). Structured

134
observation with polyphony: A multifaceted tool for studyingmusic composition. In Proceedings of the 2014 Conference on De-
signing Interactive Systems, DIS ’14, page 199–208, New York, NY,USA. Association for Computing Machinery.
Gaver, W. W. (1989). The sonicfinder: An interface that uses auditoryicons. Hum.-Comput. Interact., 4(1):67–94.
Ghorashi, S. and Jensen, C. (2012). Leyline: Provenance-based searchusing a graphical sketchpad. In Proceedings of the Symposium on
Human-Computer Interaction and Information Retrieval, HCIR ’12,New York, NY, USA. Association for Computing Machinery.
Goffin, P., Boy, J., Willett, W., and Isenberg, P. (2017). An exploratorystudy of word-scale graphics in data-rich text documents. IEEE
Transactions on Visualization and Computer Graphics, 23(10):2275–2287.
Golovchinsky, G. (2008). Reading in the office. In Proceedings of the
2008 ACM Workshop on Research Advances in Large Digital Book
Repositories, BooksOnline ’08, page 21–24, New York, NY, USA.Association for Computing Machinery.
Golovchinsky, G., Price, M. N., and Schilit, B. N. (1999). From readingto retrieval: Freeform ink annotations as queries. In Proceedings
of the 22nd Annual International ACM SIGIR Conference on Research
and Development in Information Retrieval, SIGIR ’99, page 19–25,New York, NY, USA. Association for Computing Machinery.
Gori, J., Han, H. L., and Beaudouin-Lafon, M. (2020). Fileweaver: Flex-ible file management with automatic dependency tracking. InProceedings of the 33rd Annual ACM Symposium on User Interface
Software and Technology, UIST ’20, page 22–34, New York, NY,USA. Association for Computing Machinery.
Gotz, D. (2007). The scratchpad: Sensemaking support for the web. InProceedings of the 16th International Conference on World Wide Web,WWW ’07, page 1329–1330, New York, NY, USA. Association forComputing Machinery.
Green, T. R. G. (1990). Cognitive dimensions of notations. In Proceed-
ings of the Fifth Conference of the British Computer Society, Human-
Computer Interaction Specialist Group on People and Computers V,page 443–460, USA. Cambridge University Press.
Grossman, T. and Balakrishnan, R. (2005). The Bubble Cursor: Enhancing
Target Acquisition by Dynamic Resizing of the Cursor’s Activation
Area, page 281–290. Association for Computing Machinery, NewYork, NY, USA.
Guiard, Y., Blanch, R., and Beaudouin-Lafon, M. (2004). Object point-ing: A complement to bitmap pointing in guis. In Proceedings of
Graphics Interface 2004, GI ’04, page 9–16, Waterloo, CAN. Cana-dian Human-Computer Communications Society.

135
Guo, P. J. (2012). Software tools to facilitate research programming. PhDthesis, Stanford University Stanford, CA.
Guo, P. J. and Seltzer, M. (2012). Burrito: Wrapping your lab notebookin computational infrastructure. In Proceedings of the 4th USENIX
Conference on Theory and Practice of Provenance, TaPP’12, page 7,Berkeley, CA, USA. USENIX Association.
Halasz, F. G., Moran, T. P., and Trigg, R. H. (1986). Notecards in anutshell. SIGCHI Bull., 17(SI):45–52.
Han, H. L., Junhang., Y., Ciorascu., A., Bournet., R., Mackay, W. E.,and Beaudouin-Lafon, M. (2022). Passages: Reading and Interact-
ing with Text Across Documents. Association for Computing Ma-chinery, New York, NY, USA.
Han, H. L., Renom, M. A., Mackay, W. E., and Beaudouin-Lafon, M.(2020). Textlets: Supporting constraints and consistency in textdocuments. In Proceedings of the 2020 CHI Conference on Human
Factors in Computing Systems, page 1–13, New York, NY, USA.Association for Computing Machinery.
Harper, R., Lindley, S., Thereska, E., Banks, R., Gosset, P., Smyth, G.,Odom, W., and Whitworth, E. (2013). What is a file? In Proceed-
ings of the 2013 Conference on Computer Supported Cooperative Work,CSCW ’13, page 1125–1136, New York, NY, USA. Association forComputing Machinery.
Hartmann, B., MacDougall, D., Brandt, J., and Klemmer, S. R. (2010).What would other programmers do: Suggesting solutions to er-ror messages. In Proceedings of the SIGCHI Conference on Human
Factors in Computing Systems, CHI ’10, pages 1019–1028, NewYork, NY, USA. ACM.
Head, A., Hohman, F., Barik, T., Drucker, S. M., and DeLine, R. (2019).Managing messes in computational notebooks. In Proceedings of
the 2019 CHI Conference on Human Factors in Computing Systems,CHI ’19, New York, NY, USA. Association for Computing Ma-chinery.
Hearst, M. A. (1995). Tilebars: Visualization of term distribution in-formation in full text information access. In Proceedings of the
SIGCHI Conference on Human Factors in Computing Systems, CHI’95, page 59–66, USA. ACM Press/Addison-Wesley PublishingCo.
Hearst, M. A. (2009). Search User Interfaces. Cambridge UniversityPress.
Hertzum, M. and Pejtersen, A. M. (2000). The information-seekingpractices of engineers: Searching for documents as well as forpeople. Inf. Process. Manage., 36(5):761–778.
Hill, W. C., Hollan, J. D., Wroblewski, D., and McCandless, T. (1992).Edit wear and read wear. In Proceedings of the SIGCHI Conference

136
on Human Factors in Computing Systems, CHI ’92, pages 3–9, NewYork, NY, USA. ACM.
Hinckley, K., Bi, X., Pahud, M., and Buxton, B. (2012). Informal in-formation gathering techniques for active reading. In Proceedings
of the SIGCHI Conference on Human Factors in Computing Systems,page 1893–1896, New York, NY, USA. Association for ComputingMachinery.
Hinckley, K., Zhao, S., Sarin, R., Baudisch, P., Cutrell, E., Shilman, M.,and Tan, D. (2007). Inkseine: In situ search for active note taking.In Proceedings of the SIGCHI Conference on Human Factors in Com-
puting Systems, page 251–260, New York, NY, USA. Associationfor Computing Machinery.
Hollan, J. and Stornetta, S. (1992). Beyond being there. In Proceed-
ings of the SIGCHI Conference on Human Factors in Computing Sys-
tems, CHI ’92, page 119–125, New York, NY, USA. Associationfor Computing Machinery.
Hong, L., Chi, E. H., Budiu, R., Pirolli, P., and Nelson, L. (2008).Spartag.us: A low cost tagging system for foraging of web con-tent. In Proceedings of the Working Conference on Advanced Visual
Interfaces, AVI ’08, page 65–72, New York, NY, USA. Associationfor Computing Machinery.
Horvitz, E., Breese, J., Heckerman, D., Hovel, D., and Rommelse, K.(1998). The lumière project: Bayesian user modeling for inferringthe goals and needs of software users. In Proceedings of the Four-
teenth Conference on Uncertainty in Artificial Intelligence, UAI’98,page 256–265, San Francisco, CA, USA. Morgan Kaufmann Pub-lishers Inc.
Hutchins, E. L., Hollan, J. D., and Norman, D. A. (1985). Direct ma-nipulation interfaces. Hum.-Comput. Interact., 1(4):311–338.
Hutchinson, H., Mackay, W., Westerlund, B., Bederson, B. B., Druin,A., Plaisant, C., Beaudouin-Lafon, M., Conversy, S., Evans, H.,Hansen, H., Roussel, N., and Eiderbäck, B. (2003). Technologyprobes: Inspiring design for and with families. In Proceedings
of the SIGCHI Conference on Human Factors in Computing Systems,CHI ’03, page 17–24, New York, NY, USA. Association for Com-puting Machinery.
Jacob, R. J., Girouard, A., Hirshfield, L. M., Horn, M. S., Shaer, O.,Solovey, E. T., and Zigelbaum, J. (2008). Reality-based interac-tion: A framework for post-wimp interfaces. In Proceedings of the
SIGCHI Conference on Human Factors in Computing Systems, CHI’08, page 201–210, New York, NY, USA. Association for Comput-ing Machinery.
Jalal, G., Maudet, N., and Mackay, W. E. (2015). Color portraits: Fromcolor picking to interacting with color. In Proceedings of the 33rd

137
Annual ACM Conference on Human Factors in Computing Systems,CHI ’15, pages 4207–4216, New York, NY, USA. ACM.
Jensen, C., Lonsdale, H., Wynn, E., Cao, J., Slater, M., and Dietterich,T. G. (2010). The Life and Times of Files and Information: A Study
of Desktop Provenance, page 767–776. Association for ComputingMachinery, New York, NY, USA.
Johnson, J., Roberts, T. L., Verplank, W., Smith, D. C., Irby, C. H., Beard,M., and Mackey, K. (1989). The Xerox Star: A retrospective. Com-
puter, 22(9):11–26, 28–29.Jung, H., Stolterman, E., Ryan, W., Thompson, T., and Siegel, M. (2008).
Toward a framework for ecologies of artifacts: How are digitalartifacts interconnected within a personal life? In Proceedings of
the 5th Nordic Conference on Human-Computer Interaction: Building
Bridges, NordiCHI ’08, page 201–210, New York, NY, USA. Asso-ciation for Computing Machinery.
Kabbash, P. and Buxton, W. A. S. (1995). The “prince” technique: Fitts’law and selection using area cursors. In Proceedings of the SIGCHI
Conference on Human Factors in Computing Systems, CHI ’95, page273–279, USA. ACM Press/Addison-Wesley Publishing Co.
Kapser, C. J. and Godfrey, M. W. (2008). "cloning considered harmful"considered harmful: Patterns of cloning in software. Empirical
Softw. Engg., 13(6):645–692.Karger, D. R. and Jones, W. (2006). Data unification in personal infor-
mation management. Communications of the ACM, 49(1):77–82.Karlson, A. K., Smith, G., and Lee, B. (2011). Which version is this? im-
proving the desktop experience within a copy-aware computingecosystem. In Proceedings of the SIGCHI Conference on Human Fac-
tors in Computing Systems, page 2669–2678, New York, NY, USA.Association for Computing Machinery.
Kazi, R. H., Chevalier, F., Grossman, T., Zhao, S., and Fitzmaurice,G. (2014). Draco: Bringing life to illustrations with kinetic tex-tures. In Proceedings of the SIGCHI Conference on Human Factors in
Computing Systems, CHI ’14, page 351–360, New York, NY, USA.Association for Computing Machinery.
Kery, M. B., Horvath, A., and Myers, B. (2017). Variolite: Supportingexploratory programming by data scientists. In Proceedings of
the 2017 CHI Conference on Human Factors in Computing Systems,CHI ’17, page 1265–1276, New York, NY, USA. Association forComputing Machinery.
Kery, M. B., John, B. E., O’Flaherty, P., Horvath, A., and Myers, B. A.(2019). Towards effective foraging by data scientists to find pastanalysis choices. In Proceedings of the 2019 CHI Conference on Hu-
man Factors in Computing Systems, CHI ’19, New York, NY, USA.Association for Computing Machinery.

138
Kery, M. B., Radensky, M., Arya, M., John, B. E., and Myers, B. A.(2018). The story in the notebook: Exploratory data science us-ing a literate programming tool. In Proceedings of the 2018 CHI
Conference on Human Factors in Computing Systems, CHI ’18, NewYork, NY, USA. Association for Computing Machinery.
Kidd, A. (1994). The marks are on the knowledge worker. In Pro-
ceedings of the SIGCHI Conference on Human Factors in Computing
Systems, CHI ’94, page 186–191, New York, NY, USA. Associationfor Computing Machinery.
Kim, M., Bergman, L., Lau, T., and Notkin, D. (2004). An ethnographicstudy of copy and paste programming practices in oopl. In Pro-
ceedings of the 2004 International Symposium on Empirical Software
Engineering, ISESE ’04, pages 83–92, Washington, DC, USA. IEEEComputer Society.
Kittur, A., Peters, A. M., Diriye, A., Telang, T., and Bove, M. R. (2013).Costs and benefits of structured information foraging. In Pro-
ceedings of the SIGCHI Conference on Human Factors in Computing
Systems, page 2989–2998, New York, NY, USA. Association forComputing Machinery.
Klemmer, S. R., Hartmann, B., and Takayama, L. (2006). How bod-ies matter: Five themes for interaction design. In Proceedings of
the 6th Conference on Designing Interactive Systems, DIS ’06, page140–149, New York, NY, USA. Association for Computing Ma-chinery.
Kluyver, T., Ragan-Kelley, B., Pérez, F., Granger, B., Bussonnier, M.,Frederic, J., Kelley, K., Hamrick, J. B., Grout, J., Corlay, S., Ivanov,P., Avila, D., Abdalla, S., Willing, C., and Team, J. D. (2016).Jupyter notebooks - a publishing format for reproducible compu-tational workflows. In International Conference on Electronic Pub-
lishing.Ko, A. J., Aung, H., and Myers, B. A. (2005). Eliciting design require-
ments for maintenance-oriented ides: A detailed study of correc-tive and perfective maintenance tasks. In Proceedings of the 27th
International Conference on Software Engineering, ICSE ’05, pages126–135, New York, NY, USA. ACM.
Ko, A. J. and Myers, B. A. (2004). Designing the whyline: A debug-ging interface for asking questions about program behavior. InProceedings of the SIGCHI Conference on Human Factors in Comput-
ing Systems, CHI ’04, pages 151–158, New York, NY, USA. ACM.Ko, A. J. and Myers, B. A. (2006). Barista: An implementation frame-
work for enabling new tools, interaction techniques and views incode editors. In Proceedings of the SIGCHI Conference on Human
Factors in Computing Systems, CHI ’06, pages 387–396, New York,NY, USA. ACM.

139
Koch, J., Taffin, N., Beaudouin-Lafon, M., Laine, M., Lucero, A., andMackay, W. E. (2020). Imagesense: An intelligent collaborativeideation tool to support diverse human-computer partnerships.Proc. ACM Hum.-Comput. Interact., 4(CSCW1).
Laakso, S. A., Laakso, K. P., and Saura, A. J. (2000). Improved scrollbars. In CHI ’00 Extended Abstracts on Human Factors in Computing
Systems, CHI EA ’00, pages 97–98, New York, NY, USA. ACM.Larsen-Ledet, I. and Korsgaard, H. (2019). Territorial functioning
in collaborative writing. Computer Supported Cooperative Work
(CSCW), 28(3):391–433.Lindley, S. E., Smyth, G., Corish, R., Loukianov, A., Golembewski, M.,
Luger, E. A., and Sellen, A. (2018). Exploring new metaphors fora networked world through the file biography. In Proceedings of
the 2018 CHI Conference on Human Factors in Computing Systems,CHI ’18, New York, NY, USA. Association for Computing Ma-chinery.
Liu, M. X., Hsieh, J., Hahn, N., Zhou, A., Deng, E., Burley, S., Tay-lor, C., Kittur, A., and Myers, B. A. (2019). Unakite: Scaffoldingdevelopers’ decision-making using the web. In Proceedings of the
32nd Annual ACM Symposium on User Interface Software and Tech-
nology, UIST ’19, page 67–80, New York, NY, USA. Associationfor Computing Machinery.
Liu, W., Rioul, O., McGrenere, J., Mackay, W. E., and Beaudouin-Lafon,M. (2018). Bigfile: Bayesian information gain for fast file retrieval.In Proceedings of the 2018 CHI Conference on Human Factors in Com-
puting Systems, page 1–13, New York, NY, USA. Association forComputing Machinery.
Lottridge, D. and Mackay, W. E. (2009). Generative walkthroughs: Tosupport creative redesign. In Proceedings of the Seventh ACM Con-
ference on Creativity and Cognition, page 175–184, New York, NY,USA. Association for Computing Machinery.
Ma Kay, B. and Watters, C. (2008). Exploring multi-session web tasks.In Proceedings of the SIGCHI Conference on Human Factors in Com-
puting Systems, CHI ’08, page 1187–1196, New York, NY, USA.Association for Computing Machinery.
Mackay, W. E. (1988). Diversity in the use of electronic mail: A prelim-inary inquiry. ACM Trans. Inf. Syst., 6(4):380–397.
Mackay, W. E. (1990). Patterns of sharing customizable software. InProceedings of the 1990 ACM Conference on Computer-Supported Co-
operative Work, CSCW ’90, page 209–221, New York, NY, USA.Association for Computing Machinery.
Mackay, W. E. (1999). Is paper safer? the role of paper flight strips in airtraffic control. ACM Trans. Comput.-Hum. Interact., 6(4):311–340.
Mackay, W. E. (2002). Using video to support interaction design. DVD

140
Tutorial, CHI, 2(5).Mackay, W. E. (2004). The interactive thread: Exploring methods for
multi-disciplinary design. In Proceedings of the 5th Conference on
Designing Interactive Systems: Processes, Practices, Methods, and
Techniques, DIS ’04, page 103–112, New York, NY, USA. Asso-ciation for Computing Machinery.
Mackay, W. E. (2019). Designing with sticky notes. In Christensen, B.,Halskov, K., and Klokmose, C., editors, Sticky Creativity: Post-It
Note Cognition, Interaction and Digitalization, pages 231–256. Aca-demic Press.
Mackay, W. E. and Fayard, A.-L. (1997). HCI, natural science and de-sign: A framework for triangulation across disciplines. In Pro-
ceedings of the 2nd Conference on Designing Interactive Systems: Pro-
cesses, Practices, Methods, and Techniques, DIS ’97, page 223–234,New York, NY, USA. Association for Computing Machinery.
Mackinlay, J. D., Rao, R., and Card, S. K. (1995). An organic userinterface for searching citation links. In Proceedings of the SIGCHI
Conference on Human Factors in Computing Systems, CHI ’95, page67–73, USA. ACM Press/Addison-Wesley Publishing Co.
Malone, T. W. (1983). How do people organize their desks? implica-tions for the design of office information systems. ACM Trans.
Inf. Syst., 1(1):99–112.Marshall, C. C. (1997). Annotation: From paper books to the digital
library. In Proceedings of the Second ACM International Conference
on Digital Libraries, DL ’97, pages 131–140, New York, NY, USA.ACM.
Marshall, C. C. and Bly, S. (2005). Saving and using encountered in-formation: Implications for electronic periodicals. In Proceedings
of the SIGCHI Conference on Human Factors in Computing Systems,page 111–120, New York, NY, USA. Association for ComputingMachinery.
Marshall, C. C., Halasz, F. G., Rogers, R. A., and Janssen, W. C. (1991).Aquanet: A hypertext tool to hold your knowledge in place. InProceedings of the Third Annual ACM Conference on Hypertext, HY-PERTEXT ’91, page 261–275, New York, NY, USA. Associationfor Computing Machinery.
Marshall, C. C., Price, M. N., Golovchinsky, G., and Schilit, B. N. (2001).Designing e-books for legal research. In Proceedings of the 1st
ACM/IEEE-CS Joint Conference on Digital Libraries, JCDL ’01, page41–48, New York, NY, USA. Association for Computing Machin-ery.
McCloud, S. (1993). Understanding Comics: The Invisible Art. TundraPublishing Ltd.
McGrenere, J., Baecker, R. M., and Booth, K. S. (2002). An evaluation of

141
a multiple interface design solution for bloated software. In Pro-
ceedings of the SIGCHI Conference on Human Factors in Computing
Systems, CHI ’02, page 164–170, New York, NY, USA. Associationfor Computing Machinery.
Miller, R. C. and Marshall, A. M. (2004). Cluster-based find and re-place. In Proceedings of the SIGCHI Conference on Human Factors in
Computing Systems, CHI ’04, pages 57–64, New York, NY, USA.ACM.
Miller, R. C. and Myers, B. A. (2002a). Lapis: Smart editing with textstructure. In CHI ’02 Extended Abstracts on Human Factors in Com-
puting Systems, CHI EA ’02, pages 496–497, New York, NY, USA.ACM.
Miller, R. C. and Myers, B. A. (2002b). Multiple selections in smarttext editing. In Proceedings of the 7th International Conference on
Intelligent User Interfaces, IUI ’02, pages 103–110, New York, NY,USA. ACM.
Muniswamy-Reddy, K.-K., Holland, D. A., Braun, U., and Seltzer, M. I.(2006). Provenance-aware storage systems. In Usenix annual tech-
nical conference, general track, pages 43–56, Berkeley, CA, USA.USENIX Association.
Murta, L., Braganholo, V., Chirigati, F., Koop, D., and Freire, J. (2014).noworkflow: capturing and analyzing provenance of scripts. InInternational Provenance and Annotation Workshop, pages 71–83.Springer.
Myers, B. A. (1991). Text formatting by demonstration. In Proceedings
of the SIGCHI Conference on Human Factors in Computing Systems,CHI ’91, pages 251–256, New York, NY, USA. ACM.
Noël, S. and Robert, J.-M. (2004). Empirical study on collaborativewriting: What do co-authors do, use, and like? Comput. Supported
Coop. Work, 13(1):63–89.Norman, D. A. (1991). Cognitive artifacts. Designing interaction: Psy-
chology at the human-computer interface, 1(1):17–38.O’Hara, K. and Sellen, A. (1997). A comparison of reading paper and
on-line documents. In Proceedings of the ACM SIGCHI Conference
on Human Factors in Computing Systems, CHI ’97, pages 335–342,New York, NY, USA. ACM.
O’Hara, K., Smith, F., Newman, W., and Sellen, A. (1998). Studentreaders’ use of library documents: Implications for library tech-nologies. In Proceedings of the SIGCHI Conference on Human Fac-
tors in Computing Systems, CHI ’98, page 233–240, USA. ACMPress/Addison-Wesley Publishing Co.
Oleksik, G., Jetter, H.-C., Gerken, J., Milic-Frayling, N., and Jones, R.(2013). Towards an information architecture for flexible reuse ofdigital media. In Proceedings of the 12th International Conference on

142
Mobile and Ubiquitous Multimedia, MUM ’13, New York, NY, USA.Association for Computing Machinery.
Oleksik, G., Milic-Frayling, N., and Jones, R. (2012). Beyond data shar-ing: Artifact ecology of a collaborative nanophotonics researchcentre. In Proceedings of the ACM 2012 Conference on Computer Sup-
ported Cooperative Work, CSCW ’12, page 1165–1174, New York,NY, USA. Association for Computing Machinery.
Oleksik, G., Wilson, M. L., Tashman, C., Mendes Rodrigues, E.,Kazai, G., Smyth, G., Milic-Frayling, N., and Jones, R. (2009).Lightweight tagging expands information and activity manage-ment practices. In Proceedings of the SIGCHI Conference on Human
Factors in Computing Systems, CHI ’09, page 279–288, New York,NY, USA. Association for Computing Machinery.
Oney, S. and Brandt, J. (2012). Codelets: Linking interactive docu-mentation and example code in the editor. In Proceedings of the
SIGCHI Conference on Human Factors in Computing Systems, CHI’12, pages 2697–2706, New York, NY, USA. ACM.
O’Hara, K. and Sellen, A. (1997). A comparison of reading paper andon-line documents. In Proceedings of the ACM SIGCHI Conference
on Human Factors in Computing Systems, CHI ’97, page 335–342,New York, NY, USA. Association for Computing Machinery.
Pedersen, E. R., McCall, K., Moran, T. P., and Halasz, F. G. (1993).Tivoli: An electronic whiteboard for informal workgroup meet-ings. In Proceedings of the INTERACT ’93 and CHI ’93 Conference
on Human Factors in Computing Systems, CHI ’93, page 391–398,New York, NY, USA. Association for Computing Machinery.
Perez De Rosso, S. and Jackson, D. (2013). What’s wrong with git? aconceptual design analysis. In Proceedings of the 2013 ACM Inter-
national Symposium on New Ideas, New Paradigms, and Reflections on
Programming & Software, Onward! 2013, page 37–52, New York,NY, USA. Association for Computing Machinery.
Perlin, K. and Fox, D. (1993). Pad: An alternative approach to thecomputer interface. In Proceedings of the 20th Annual Conference
on Computer Graphics and Interactive Techniques, SIGGRAPH ’93,page 57–64, New York, NY, USA. Association for Computing Ma-chinery.
Pirolli, P. and Rao, R. (1996). Table lens as a tool for making senseof data. In Proceedings of the Workshop on Advanced Visual Inter-
faces, AVI ’96, page 67–80, New York, NY, USA. Association forComputing Machinery.
Pérez, B., Rubio, J., and Sáenz-Adán, C. (2018). A systematic review ofprovenance systems. Knowledge and Information Systems, 57.
Rao, R., Pedersen, J. O., Hearst, M. A., Mackinlay, J. D., Card, S. K.,Masinter, L., Halvorsen, P.-K., and Robertson, G. C. (1995). Rich

143
interaction in the digital library. Commun. ACM, 38(4):29–39.Ravasio, P., Schär, S. G., and Krueger, H. (2004). In pursuit of desktop
evolution: User problems and practices with modern desktopsystems. ACM Trans. Comput.-Hum. Interact., 11(2):156–180.
Rivière, J.-P., Alaoui, S. F., Caramiaux, B., and Mackay, W. E. (2019).Capturing movement decomposition to support learning andteaching in contemporary dance. Proc. ACM Hum.-Comput. In-
teract., 3(CSCW).Robertson, G., Czerwinski, M., Larson, K., Robbins, D. C., Thiel, D.,
and van Dantzich, M. (1998). Data mountain: Using spatial mem-ory for document management. In Proceedings of the 11th Annual
ACM Symposium on User Interface Software and Technology, UIST’98, page 153–162, New York, NY, USA. Association for Comput-ing Machinery.
Rodden, K. and Wood, K. R. (2003). How do people manage theirdigital photographs? In Proceedings of the SIGCHI Conference on
Human Factors in Computing Systems, CHI ’03, page 409–416, NewYork, NY, USA. Association for Computing Machinery.
Romat, H., Pietriga, E., Henry-Riche, N., Hinckley, K., and Appert, C.(2019). Spaceink: Making space for in-context annotations. InProceedings of the 32nd Annual ACM Symposium on User Interface
Software and Technology, UIST ’19, page 871–882, New York, NY,USA. Association for Computing Machinery.
Rosson, M. B. (1983). Patterns of experience in text editing. In Pro-
ceedings of the SIGCHI Conference on Human Factors in Computing
Systems, CHI ’83, pages 171–175, New York, NY, USA. ACM.Rule, A., Drosos, I., Tabard, A., and Hollan, J. D. (2018a). Aiding
collaborative reuse of computational notebooks with annotatedcell folding. Proc. ACM Hum.-Comput. Interact., 2(CSCW).
Rule, A., Tabard, A., and Hollan, J. D. (2018b). Exploration and expla-nation in computational notebooks. In Proceedings of the 2018 CHI
Conference on Human Factors in Computing Systems, CHI ’18, NewYork, NY, USA. Association for Computing Machinery.
Russell, D. M., Stefik, M. J., Pirolli, P., and Card, S. K. (1993). The coststructure of sensemaking. In Proceedings of the INTERACT ’93 and
CHI ’93 Conference on Human Factors in Computing Systems, CHI’93, page 269–276, New York, NY, USA. Association for Comput-ing Machinery.
Schilit, B. N., Golovchinsky, G., and Price, M. N. (1998). Beyond pa-per: Supporting active reading with free form digital ink anno-tations. In Proceedings of the SIGCHI Conference on Human Fac-
tors in Computing Systems, CHI ’98, page 249–256, USA. ACMPress/Addison-Wesley Publishing Co.
schraefel, M. C., Zhu, Y., Modjeska, D., Wigdor, D., and Zhao, S.
144
(2002). Hunter gatherer: Interaction support for the creation andmanagement of within-web-page collections. In Proceedings of the
11th International Conference on World Wide Web, WWW ’02, page172–181, New York, NY, USA. Association for Computing Ma-chinery.
Sellen, A. and Harper, R. (1997). Paper as an analytic resource for thedesign of new technologies. In Proceedings of the ACM SIGCHI
Conference on Human Factors in Computing Systems, CHI ’97, page319–326, New York, NY, USA. Association for Computing Ma-chinery.
Sellen, A. J. and Harper, R. H. (2003). The Myth of the Paperless Office.MIT Press, Cambridge, MA, USA.
Sellen, A. J., Murphy, R., and Shaw, K. L. (2002). How knowledgeworkers use the web. In Proceedings of the SIGCHI Conference on
Human Factors in Computing Systems, CHI ’02, page 227–234, NewYork, NY, USA. Association for Computing Machinery.
Shen, H. (2014). Interactive notebooks: Sharing the code. Nature,515(7525):151–152.
Shipman, F. M., Marshall, C. C., and Moran, T. P. (1995). Finding andusing implicit structure in human-organized spatial layouts ofinformation. In Proceedings of the SIGCHI Conference on Human
Factors in Computing Systems, CHI ’95, page 346–353, USA. ACMPress/Addison-Wesley Publishing Co.
Shneiderman (1983). Direct manipulation: A step beyond program-ming languages. Computer, 16(8):57–69.
Simon, H. A. (1996). The Sciences of the Artificial. MIT Press, Cambridge,MA, 3 edition.
Smith, D. C., Irby, C., Kimball, R., and Harslem, E. (1982). The Star userinterface: An overview. In Proceedings of the June 7-10, 1982, Na-
tional Computer Conference, AFIPS ’82, page 515–528, New York,NY, USA. Association for Computing Machinery.
Soules, C. A. N. and Ganger, G. R. (2005). Connections: Using contextto enhance file search. In Proceedings of the Twentieth ACM Sym-
posium on Operating Systems Principles, SOSP ’05, page 119–132,New York, NY, USA. Association for Computing Machinery.
Srgaard, P. and Sandahl, T. I. (1997). Problems with styles inword pro-cessing: Aweak foundation for electronic publishing with sgml.In Proceedings of the 30th Hawaii International Conference on System
Sciences: Digital Documents - Volume 6, HICSS ’97, pages 137–,Washington, DC, USA. IEEE Computer Society.
Starbird, K., Dailey, D., Mohamed, O., Lee, G., and Spiro, E. S. (2018).Engage early, correct more: How journalists participate in falserumors online during crisis events. In Proceedings of the 2018 CHI
Conference on Human Factors in Computing Systems, page 1–12,

145
New York, NY, USA. Association for Computing Machinery.Stumpf, S., Fitzhenry, E., and Dietterich, T. G. (2007). The use of prove-
nance in information retrieval. In Workshop on Principles of Prove-
nance (PROPR).Stylos, J., Myers, B. A., and Faulring, A. (2004). Citrine: Providing
intelligent copy-and-paste. In Proceedings of the 17th Annual ACM
Symposium on User Interface Software and Technology, UIST ’04,pages 185–188, New York, NY, USA. ACM.
Subramonyam, H., Seifert, C., Shah, P., and Adar, E. (2020). Texsketch:Active diagramming through pen-and-ink annotations. In Pro-
ceedings of the 2020 CHI Conference on Human Factors in Computing
Systems, page 1–13, New York, NY, USA. Association for Com-puting Machinery.
Suchman, L. A. (1987). Plans and situated actions: The problem of human-
machine communication. Cambridge university press.Tabard, A., Mackay, W., Roussel, N., and Letondal, C. (2007).
Pagelinker: Integrating contextual bookmarks within a browser.In Proceedings of the SIGCHI Conference on Human Factors in Com-
puting Systems, CHI ’07, page 337–346, New York, NY, USA. As-sociation for Computing Machinery.
Tabard, A., Mackay, W. E., and Eastmond, E. (2008). From individ-ual to collaborative: The evolution of prism, a hybrid laboratorynotebook. In Proceedings of the 2008 ACM Conference on Computer
Supported Cooperative Work, CSCW ’08, page 569–578, New York,NY, USA. Association for Computing Machinery.
Tang, A., Lanir, J., Greenberg, S., and Fels, S. (2009). Supporting tran-sitions in work: Informing large display application design byunderstanding whiteboard use. In Proceedings of the ACM 2009
International Conference on Supporting Group Work, GROUP ’09,page 149–158, New York, NY, USA. Association for ComputingMachinery.
Tashman, C. S. and Edwards, W. K. (2011a). Active reading and itsdiscontents: The situations, problems and ideas of readers. InProceedings of the SIGCHI Conference on Human Factors in Comput-
ing Systems, page 2927–2936, New York, NY, USA. Associationfor Computing Machinery.
Tashman, C. S. and Edwards, W. K. (2011b). Liquidtext: A flexible,multitouch environment to support active reading. In Proceedings
of the SIGCHI Conference on Human Factors in Computing Systems,page 3285–3294, New York, NY, USA. Association for ComputingMachinery.
Teevan, J., Alvarado, C., Ackerman, M. S., and Karger, D. R. (2004). Theperfect search engine is not enough: A study of orienteering be-havior in directed search. In Proceedings of the SIGCHI Conference

146
on Human Factors in Computing Systems, CHI ’04, page 415–422,New York, NY, USA. Association for Computing Machinery.
Teevan, J., Iqbal, S. T., and von Veh, C. (2016). Supporting collaborativewriting with microtasks. In Proceedings of the 2016 CHI Conference
on Human Factors in Computing Systems, CHI ’16, pages 2657–2668, New York, NY, USA. ACM.
Tesler, L. (2012). A personal history of modeless text editing andcut/copy-paste. Interactions, 19(4):70–75.
Toomim, M., Begel, A., and Graham, S. L. (2004). Managing duplicatedcode with linked editing. In Proceedings of the 2004 IEEE Sympo-
sium on Visual Languages - Human Centric Computing, VLHCC ’04,pages 173–180, Washington, DC, USA. IEEE Computer Society.
Tufte, E. R. (2001). The Visual Display of Quantitative Information. Graph-ics Press, Cheshire, CT, 2 edition.
Tversky, B. (2015). The cognitive design of tools of thought. Review of
Philosophy and Psychology, 6:99–116.Tyler, S. W., Roth, S., and Post, T. (1982). The acquisition of text editing
skills. In Proceedings of the 1982 Conference on Human Factors in
Computing Systems, CHI ’82, pages 324–325, New York, NY, USA.ACM.
van Dam, A. (1997). Post-wimp user interfaces. Commun. ACM,40(2):63–67.
Voida, S. and Mynatt, E. D. (2009). It feels better than filing: Everydaywork experiences in an activity-based computing system. In Pro-
ceedings of the SIGCHI Conference on Human Factors in Computing
Systems, CHI ’09, page 259–268, New York, NY, USA. Associationfor Computing Machinery.
von Hippel, E. (1986). Lead users: A source of novel product concepts.Manage. Sci., 32(7):791–805.
Wagner, J., Mackay, W. E., and Huot, S. (2012). Left-over win-dows cause window clutter... but what causes left-over windows?In Proceedings of the 2012 Conference on Ergonomie et Interaction
Homme-Machine, Ergo’IHM ’12, page 213–216, New York, NY,USA. Association for Computing Machinery.
Weinreich, H., Obendorf, H., Herder, E., and Mayer, M. (2008). Notquite the average: An empirical study of web use. ACM Trans.
Web, 2(1).Wexelblat, A. and Maes, P. (1999). Footprints: History-rich tools for in-
formation foraging. In Proceedings of the SIGCHI Conference on Hu-
man Factors in Computing Systems, CHI ’99, pages 270–277, NewYork, NY, USA. ACM.
White, R. W. and Roth, R. A. (2009). Exploratory Search: Beyond the
Query-Response Paradigm. Morgan & Claypool Publishers, [SanRafael, Calif.].

147
Whittaker, S. and Sidner, C. (1996). Email overload: Exploring personalinformation management of email. In Proceedings of the SIGCHI
Conference on Human Factors in Computing Systems, page 276–283,New York, NY, USA. Association for Computing Machinery.
Woodruff, A., Faulring, A., Rosenholtz, R., Morrsion, J., and Pirolli, P.(2001). Using thumbnails to search the web. In Proceedings of the
SIGCHI Conference on Human Factors in Computing Systems, CHI’01, page 198–205, New York, NY, USA. Association for Comput-ing Machinery.
Worden, A., Walker, N., Bharat, K., and Hudson, S. (1997). Makingcomputers easier for older adults to use: Area cursors and stickyicons. In Proceedings of the ACM SIGCHI Conference on Human
Factors in Computing Systems, CHI ’97, page 266–271, New York,NY, USA. Association for Computing Machinery.
Xia, H., Henry Riche, N., Chevalier, F., De Araujo, B., and Wigdor,D. (2018). DataInk: Direct and Creative Data-Oriented Drawing,page 1–13. Association for Computing Machinery, New York,NY, USA.
Yeh, R., Liao, C., Klemmer, S., Guimbretière, F., Lee, B., Kakaradov, B.,Stamberger, J., and Paepcke, A. (2006). Butterflynet: A mobilecapture and access system for field biology research. In Proceed-
ings of the SIGCHI Conference on Human Factors in Computing Sys-
tems, CHI ’06, page 571–580, New York, NY, USA. Associationfor Computing Machinery.
Yoon, D., Chen, N., and Guimbretière, F. (2013). Texttearing: Openingwhite space for digital ink annotation. In Proceedings of the 26th
Annual ACM Symposium on User Interface Software and Technology,UIST ’13, pages 107–112, New York, NY, USA. ACM.
Yoon, D., Chen, N., Guimbretière, F., and Sellen, A. (2014). Richreview:Blending ink, speech, and gesture to support collaborative doc-ument review. In Proceedings of the 27th Annual ACM Symposium
on User Interface Software and Technology, UIST ’14, page 481–490,New York, NY, USA. Association for Computing Machinery.
Yoon, Y. S. and Myers, B. A. (2015). Supporting selective undo in a codeeditor. In Proceedings of the 37th International Conference on Software
Engineering - Volume 1, ICSE ’15, pages 223–233, Piscataway, NJ,USA. IEEE Press.
Zhai, S., Buxton, W., and Milgram, P. (1994). The “silk cursor”: Investi-gating transparency for 3d target acquisition. In Proceedings of the
SIGCHI Conference on Human Factors in Computing Systems, CHI’94, page 459–464, New York, NY, USA. Association for Comput-ing Machinery.
Zhang, A. X., Muller, M., and Wang, D. (2020). How do data scienceworkers collaborate? roles, workflows, and tools. Proc. ACM

148
Hum.-Comput. Interact., 4(CSCW1).Zhang, X., Qu, Y., Giles, C. L., and Song, P. (2008). Citesense: Sup-
porting sensemaking of research literature. In Proceedings of the
SIGCHI Conference on Human Factors in Computing Systems, CHI’08, page 677–680, New York, NY, USA. Association for Comput-ing Machinery.
Zheng, Q., Booth, K., and McGrenere, J. (2006). Co-authoring withstructured annotations. In Proceedings of the SIGCHI Conference
on Human Factors in Computing Systems, CHI ’06, pages 131–140,New York, NY, USA. ACM.