Essays on eco-innovation - TEL - Thèses
238
HAL Id: tel-01124356 https://tel.archives-ouvertes.fr/tel-01124356 Submitted on 6 Mar 2015 HAL is a multi-disciplinary open access archive for the deposit and dissemination of sci- entific research documents, whether they are pub- lished or not. The documents may come from teaching and research institutions in France or abroad, or from public or private research centers. L’archive ouverte pluridisciplinaire HAL, est destinée au dépôt et à la diffusion de documents scientifiques de niveau recherche, publiés ou non, émanant des établissements d’enseignement et de recherche français ou étrangers, des laboratoires publics ou privés. Essays on eco-innovation Serdal Ozusaglam To cite this version: Serdal Ozusaglam. Essays on eco-innovation. Economics and Finance. Université de Strasbourg, 2014. English. NNT : 2014STRAB002. tel-01124356
-
Upload
khangminh22 -
Category
Documents
-
view
0 -
download
0
Transcript of Essays on eco-innovation - TEL - Thèses

HAL Id: tel-01124356https://tel.archives-ouvertes.fr/tel-01124356
Submitted on 6 Mar 2015
HAL is a multi-disciplinary open accessarchive for the deposit and dissemination of sci-entific research documents, whether they are pub-lished or not. The documents may come fromteaching and research institutions in France orabroad, or from public or private research centers.
L’archive ouverte pluridisciplinaire HAL, estdestinée au dépôt et à la diffusion de documentsscientifiques de niveau recherche, publiés ou non,émanant des établissements d’enseignement et derecherche français ou étrangers, des laboratoirespublics ou privés.
Essays on eco-innovationSerdal Ozusaglam
To cite this version:Serdal Ozusaglam. Essays on eco-innovation. Economics and Finance. Université de Strasbourg,2014. English. �NNT : 2014STRAB002�. �tel-01124356�

1 | P a g e
UNIVERSITÉ DE STRASBOURG ÉCOLE DOCTORALE AUGUSTIN COURNOT
[Bureau d‘Économie Théorique et Appliquée, UMR 7522]
THÈSE présentée par :
[ Serdal OZUSAGLAM ]
soutenue le : 10 Avril 2014
Pour obtenir le grade de : Docteur de l’Université de Strasbourg
Discipline/ Spécialité : Science Économiques
ESSAIS SUR l’ECO-INNOVATION
(Essays on Eco-Innovation)
Membres du Jury
Prof. Robin COWAN Professeur, Université de
Strasbourg
Directeur de thèse
Dr. Stéphane ROBIN Maitre de Conférence HDR,
Université Paris-Sorbonne
Co-directeur de thèse
Prof. Pierre MOHNEN Professeur, UNU-MERIT Rapporteur
Prof. Benoît MULKAY Professeur, Université de
Montpellier 1
Rapporteur
Prof. Jacques MAIRESSE Professeur, CREST – ENSAE,
UNU-MERIT
Rapporteur externe
Dr. Phu NGUYEN-VAN Chargé de Recherches HDR,
CNRS, Université de Strasbourg
Rapporteur interne
BETA Bureau d’Économie Théorique et Appliquée

2 | P a g e

3 | P a g e
L‟Université de Strasbourg n‟entend donner aucune approbation ni improbation aux
opinions émises dans les thèses. Ces opinions doivent être considérées comme propres à
leurs auteurs.

4 | P a g e

5 | P a g e
Acknowledgements
Writing a Ph.D. thesis is a hard task and it is impossible to complete it with help and
support of others. I would like to thank to everyone who helped and supported me during my
doctoral work. Of course, my Ph.D. director Prof. Robin Cowan and co-director Prof.
Stéphane Robin deserve the biggest appreciation and gratitude, without their trust and
constant support this work would have never been completed. I would like to thank to Prof.
Stéphane Robin for his never ending patience and his faith in me. He stood by me while I was
discouraged and showed that there is a light at the end of the tunnel. His contribution is truly
invaluable. I also would like to thank Prof. Pierre Mohnen, Prof. Benoit Mulkay, Prof.
Jacque Mairesse and Dr. Phu Nguyen-Van for forming my Ph.D. thesis defense committee
and their remarks to improve my work.
The OECD and CEE (Centre d'Etudes de l'Emploi) deserve recognition for providing me
the databases to work with. Their contribution is essentially important and without it this
doctoral work would have never existed.
A special thanks to Prof. Pelin Demirel and Joanna Kocsis for reading my articles and
helping me to improve them.
I also would like to thank to all the members of the BETA and the office 148. It was a
great pleasure to be in office 148 and work with such cool people. A special thanks to
Mickael and Faustine for being great colleagues and incredible friends. They did not only
help me in my thesis, they also became real friends so BIG UP to you guys.
Support of my family is, of course, the most important factor that has constantly
motivated me to finish my thesis. Without them, I would have never find courage to come until
this point. So I want to thank to my dad Sadik, mom Filiz, sister Mine and brother Samet for
being a constant support throughout my studies. Sercan, Abdullah and Caner also deserve
special thanks for being the best cousins. I wish to thank to Coline and her family for their
incredible confidence in me. They were with me when I needed support the most and tried to
help me however they can.
My second family are my friends in Strasbourg and they deserve a special note. I would
like to thank to „Joss-B‟, „J. Bellot‟, „Vincenzo‟, „Nico Niño‟, „Sergio de Madrid‟ „Marie J. de
sud‟, „Johann and Olive‟, „Khema‟, „Johann‟, „Gaetan‟ for being such good friends. Finally,
I also would like to recognize Siyah‟s contribution to my thesis. She is the funniest and the
most efficient motivational speaker and without her I would have never completed this thesis.

6 | P a g e

7 | P a g e
Resumé
Le Chapitre 1 propose un survol de la littérature consacrée à l'éco-innovation. A la lumière
des travaux passés en revue, l'éco-innovation n‘est pas encore un concept bien stabilisé : sa
définition même continue d'évoluer, appelant des corrections et des précisions. Ce chapitre
accorde une attention particulière au rôle de la règlementation, qui est souvent présentée dans
la littérature comme un déterminant essentiel de l'éco-innovation, notamment quand
l'innovation concerne un procédé de fabrication. Une controverse demeure à ce propos, en
particulier quand la règlementation repose sur des normes environnementales peu
contraignantes, voire facultatives (telle la norme ISO 14001). Le processus de diffusion de
l'éco-innovation est un autre objet de controverse dans la littérature. Nous refermons ce
chapitre en concluant qu'il convient de focaliser les recherches empiriques sur ces deux points
de controverse, ce que nous essayons de faire dans les chapitres suivants.
Le Chapitre 2 va donc s'intéresser au premier point de controverse, à savoir le rôle des
règlementations environnementales ayant une dimension facultative, comme les normes de
type ISO 14001. A l'aide d'une analyse par appariement sur les scores de propension, nous
examinons l'effet de l'adoption de normes de type ISO 140001 sur la performance des
entreprises (mesurée à partir de la Valeur Ajoutée). La première étape de l'analyse consiste à
prédire l'adoption de ces normes à l'aide d'un modèle Probit afin de calculer le score de
propension. La seconde étape consiste à calculer, à l'aide d'un algorithme d'appariement non
paramétrique, l'effet de l'adoption sur la VA des entreprises ayant adopté les normes (par
rapport aux entreprises ayant un score de propension similaire mais n'ayant pas adopté ces
normes). L'analyse est menée sur les données françaises de l'enquête COI 2006 combinées
aux Enquêtes Annuelles d'Entreprises de 2003 à 2006. Ces données nous permettent de
distinguer parmi les entreprises adoptant des normes de types ISO 14001, celles les ayant
adopté précocement et celles les ayant adopté tardivement. Afin de tenir compte de ces deux
comportements d'adoption, le score de propension est calculé à l'aide d'un Probit multivarié.
Nos résultats indiquent qu'adopter des normes environnementales de type ISO 14001 sur une
base volontaire permet d'accroître la VA des entreprises, que l'adoption soit précoce ou
tardive. Une analyse de sensibilité conduite en estimant un modèle linéaire à interactions
complètes (Fully Interacted Linear Model) vient conforter ces résultats.

8 | P a g e
Le Chapitre 3 s'intéresse à savoir le processus de diffusion de l'éco-innovation. En raison des
contraintes posées par les données disponibles, cette investigation se fait du point de vue des
barrières à, et des déterminants de, l'innovation environnementale. L'analyse repose sur
l'estimation de fonctions de production d'innovation à l'aide de modèles à deux équations. La
première est une équation de sélection qui permet de tenir compte du fait que toutes les
entreprises recensées dans un échantillon ne sont pas nécessairement innovantes. La seconde
équation permet d'expliquer l'intensité de l'éco-innovation, mesurée de différentes manières.
Ces modèles sont estimés par Maximum de Vraisemblance sur les données européennes
micro-anonymisées (ou "bruitées") de l'Enquête Communautaire sur l'Innovation de 2004
(CIS 2004). Les données fournissent deux mesures approchées de l'intensité de l'éco-
innovation: (1) une mesure de la "réduction de l'utilisation des consommations intermédiaires
et de la consommation d'énergie par unité produite" (sur une échelle de 0 à 4) et (2) une
mesure de la "réduction de l'impact environnemental ou sanitaire et amélioration de la
sécurité" (également sur une échelle de 0 à 4). Ces deux mesures peuvent être combinées
pour obtenir une mesure continue de l'intensité d'éco-innovation. Les deux variables peuvent
également être utilisées telle quelles, et séparément, ce qui conduit à estimer deux modèles
économétriques dans laquelle l'équation de deuxième étape est un Probit ordonné. Les
modèles estimés sur l'ensemble de l'échantillon suggèrent que la coopération avec des
partenaires extérieurs et le degré d'ouverture de l'entreprise sont les principaux facteurs
associés à une plus grande intensité de l'éco-innovation. Ce résultat fait sens dans la mesure
où l'éco-innovation repose moins sur le développement de produits de haute technologie que
sur l'adoption de procédés de production moins polluants – procédés qu'une entreprise peut
acquérir en externe, auprès de partenaires plus expérimentés dans ce domaine. Les analyses
conduites sur les quatre sous-échantillons évoqués plus haut conduisent toutefois à nuancer ce
résultat, dans la mesure où la R&D apparaît bien comme un déterminant de l'éco-innovation
dans les pays d'Europe de l'Ouest et du Nord d'une part, et dans les pays d'Europe
méditerranéenne d'autre part.
Le Chapitre 4 exploitant les données des Enquêtes Communautaires sur l'Innovation de 2008
(CIS 2008), qui contiennent un module spécifiquement dédié à l‘éco-innovation. Ainsi, à la
différence du chapitre 3, nous établissons – à l'aide du module spécifique de l'enquête – une
typologie originale permettant de distinguer, parmi les entreprises éco-innovantes: (1) les
entreprises adoptant une éco-innovation de manière passive, (2) les entreprises adoptant

9 | P a g e
tardivement une éco-innovation de manière stratégique, (3) les entreprises adoptant
précocement une éco-innovation de manière stratégique, (4) les éco-innovateurs stratégiques
tardifs et (5) les éco-innovateurs stratégiques précoces. Ces cinq types d'entreprises éco-
innovantes s'opposent aux entreprises innovantes mais non éco-innovantes, et toutes se
distinguent des entreprises non innovantes. Notre objectif est ici d'identifier des facteurs
spécifiques à un type d'entreprise éco-innovante. Pour ce faire, nous estimons par Maximum
de Vraisemblance de modèles comprenant une équation de sélection et une équation de type
Probit ordonné. Comme dans le Chapitre 3, le degré d'ouverture des entreprises et la
coopération avec des partenaires extérieurs apparaissent prédominants, et ce quel que soit le
type d'éco-innovateur considéré. Toutefois, la R&D joue ici un rôle aussi important que ces
deux facteurs. Il est donc a priori difficile d'identifier les spécificités de chaque type d'éco-
innovateur, bien que les éco-innovateurs stratégiques précoces soient plus susceptibles de
recourir à l'adoption de normes environnementales volontaires. Par contraste, les entreprises
modérément éco-innovantes ont besoin d'encouragements financiers, qui peuvent prendre la
forme d'un soutien de l'UE. L'estimation sur des sous-échantillons permet de nuancer ces
résultats, en soulignant notamment que l'importance de la coopération avec des partenaires
extérieurs varie d'un groupe de pays à l'autre.

10 | P a g e
Abstract
Environmental innovation or eco-innovation1 is considered one of the most significant
paradigm shifts in the innovation behaviour. The specificity of eco innovation lies in the fact
that environmental improvement, in addition to technological advancement, is the main
reason of its development. By combining these two objectives, eco-innovation has become
one of primary tools in the search to solve the world‘s environmental problems and
sustainability challenges. Despite its prevalence, there is still more to be discovered within
the eco-innovation literature. The drivers of and barriers to eco-innovation discussion is one
of the most significant amongst all. More notably, the role of a firm‘s social, technological,
economic and organizational characteristics within the eco-innovation process has been little
studied. With this Ph.D. thesis we aim to fill the existing gap with four distinct research
articles.
In order to provide a solid background for the discussion, Chapter 1 proposes a literature
survey that collects and presents the most prominent theoretical and empirical contributions
in the field of eco-innovation. In view of those studies, we show that the concept and
definition of eco-innovation is still evolving and policy and regulation appear as specific
drivers of eco-innovation especially, for environmental process innovation. Nevertheless,
some issues remains controversial i.e., the impact of some of the less stringent environmental
regulations (such as, ISO 14001 and EMAS) and its diffusion process. We concluded that if
eco-innovation is to be encouraged among firms and consumers, more empirical research is
needed on these queries.
Chapter 2 investigates, firstly, whether firms‘ internal characteristics have an impact on the
adoption of voluntary environmental standards. Secondly, the causal effect of adoption of
environmental standards on the firms performance. Based on the empirical evidence
obtained, we show that medium-size, high-tech manufacturing firms operating at the EU
level and using quality standards are more likely to adopt these standards earlier. By contrast,
late adopters are more likely to be large, low/medium tech manufacturing firms that rely on
1 According to Measuring Eco-innovation (MEI
1, 2007) project, eco-innovation is assimilation or
exploitation of a product, production process, service or management or business method that it is
novel to the firm or user and which results, throughout its life cycle, in a reduction of environmental
risk, pollution and other negative impacts of resources use (including energy use) compared to
relevant alternatives (p. 3)

11 | P a g e
other quality standards. We also observe that both of these adopters could reap financial
benefits through Total Value Added (VA) but we do not detect any significant difference
between the early and late adopters. We concluded this chapter by asserting that voluntary
environmental standards may be a good complement for market-based instruments (such as;
tradable permits, emission taxes, subsidies etc.) and, command and control mechanisms to
increase firms‘ economic performance while becoming greener.
In Chapter 3, we stressed the significance of a firm‘s structural characteristics in another
context and aimed at investigating the role these characteristics play in realization of product
and/or process eco-innovation. We contributed to the discussion of drivers of and barriers to
eco-innovation by investigating the role of a firm‘s internal characteristics, its openness and
cooperation with external partners within the eco-innovation process. Based on the empirical
evidence collected, we show that a firm‘s cooperative behaviour may be more beneficial than
some of their structural characteristics and this behaviour may even substitute its certain
internal efforts i.e., R&D intensity. With regard to country specific differences, the results
point out that established R&D tradition in Western and Mediterranean countries (when
contrasted to Central European and Baltic countries) is indeed one of the most significant
components of a firm‘s product and/or process eco-innovation capabilities. While fierce
competition in European markets and existing technological differences among country
groups may force Eastern European and Baltic firms to speed up and shift their approach
(i.e., through networking and formal cooperation) to eco-innovate.
In Chapter 4 we moved forward the analyses conducted in Chapter 3 to another context and
examined the influence of firm‘s economic, technological, organisational capabilities on the
eco-innovation behaviour for different types of product, process, organisational or marketing
eco-innovators. The results of our empirical analyses point out the marginal impacts of firm‘s
characteristics changes with respect to type of eco-innovator. More notably, a firm‘s
voluntary engagement in eco-innovation is as important as the environmental regulations for
early strategic eco-innovators. While financial funds provided by the EU seem to spur firms‘
propensity to become a late strategic eco-innovator and strategic eco-adopters. Country-
specific analyses indicate that within the Western European and Baltic countries firms‘
structural characteristics, voluntary engagement in eco-innovation and environmental
regulation are the main factors that leads firms to be early strategic eco-innovators. The

12 | P a g e
marginal impact of the same factors is of higher importance for the late strategic eco-
innovators within the Eastern European and Mediterranean countries. We concluded this
chapter by claiming that besides a firm‘s internal characteristics and innovation capabilities,
the conceptual and regulatory framework being involved and, the interrelations with other
external factors may also shape their innovation strategy.

13 | P a g e
LIST OF FIGURES
Chapter 1
2.2.2. Possible distribution of firms according to eco-activities .............................................. 42
Chapter 2
3.3.1. Systematic visualisation of the EMS adopters .............................................................. 79

14 | P a g e
15 | P a g e
LIST OF TABLES
Chapter 2
3.1. Summary of key variables before and after merging the datasets ................................... 77
3.1.1. Frequency of adopters and non-adopters according observation periods ..................... 80
3.1.2. Summary statistics on the variables used in the econometric analysis ......................... 82
3.1.2. Aggregated Nace codes according to OECD‘s technology classification .................... 83
4.1. Estimation Results ........................................................................................................... 79
4.2. Average Treatment Effect on the Treated (ATT) obtained from PSM and FILM .......... 90
4.2. Summary statistics on the choice of variables before and after matching ....................... 92
Chapter 3
3.3. Distribution of Eco-innovators and innovators according to industry classifications ... 114
3.4. Summary statistics of the variables used in the econometric analysis ........................... 117
3.4. Descriptive statistics of the regressors for eco-innovators and conventional innovators118
4.1. Estimates of the Generalized Tobit Model for eco-innovation ...................................... 123
4.2. Estimates of the Generalized Tobit model by group of countries (Western Europe and
Mediterranean) ....................................................................................................................... 125
4.2. Estimates of the Generalized Tobit model by group of countries (Eastern Europe and
Baltic countries) ..................................................................................................................... 127
Chapter 4
3.3. Taxonomy of Firms (Terms used in this study) ............................................................. 170
3.4. Summary statistics on the variables used in the empirical estimation ........................... 177
3.4. Summary statistics on the variables used in the estimations by type of eco-innovator . 178
3.5. Descriptive statistics according to industry affiliations ................................................. 180
3.5. Distribution of eco-innovators across industries for each type of eco-innovator .......... 182
3.5. Summary statistics for different types of eco-innovators across all manufacturing
industries and service sectors ................................................................................................ 184
4.1. Marginal effects for the whole sample ........................................................................... 187
4.2. Distribution of innovators across countries ................................................................... 191
4.2.1. Marginal effects for the Western European group ...................................................... 193
4.2.1. Marginal effects for the Baltic group .......................................................................... 195
4.2.1. Marginal effects for the Mediterranean group ............................................................ 197
4.2.1. Marginal effects for the Eastern European group ....................................................... 199

16 | P a g e

17 | P a g e
General introduction
The tendency to innovate plays a vital role in human development; it has enabled us to
improve our health and living conditions, expand and share our knowledge and increase our
productivity and income. Innovation has undoubtedly improved our lives in many ways; it
has also, however, led to serious problems, challenges which we are now struggling to
address. As the world population continues to grow, and with it, demands for improved
standards of living, increased consumption is leading to worsening pollution, more severe
climatic change, and the irreversible depletion of natural resources and biodiversity (Cawsey,
1996). It is no surprise to hear then, at both international and national levels, about the
severity of the impacts of global climate change and possible solutions for reversing these
impacts. It is clear that in order to address this problem we will have to invest extensive
work, resources and time, but as we debate and discuss, we are running out of time and
applicable solutions while environmental degradation continues to grow. In order to escape
this inertia, we need to make fundamental changes in policy (such as efficient use, definition
and governance of regulatory frameworks, standards and norms), institutions (from education
to research) and practices (from the household level to industrial organization and to society
as a whole). These goals are indeed well beyond the reach of single handed efforts of
individual firms or nations and require conjoint efforts of individuals, organizations,
businesses and governments. Ekins (2010) states that the scale of the changes that seem to be
envisaged goes well beyond individual technologies and artefacts, and involves system
innovation through ‗a technological transition‘ where this transition aims at both reducing
environmental impacts and the use of natural resources. The literature calls this type of
paradigm shift environmental innovation (a.k.a. Eco-innovation), which is rather a new
concept (see Fussler and James, 1996). Despite its recent appearance it succeeded to attract
the attentions of many. Its success can be related with increasing global environmental
problems (air, water soil and sound pollution along with decreasing stock of renewable
resources), consumer awareness and demand, pressures from regulatory authorities and, the
economic gains that it can provide. On a micro scale, firms consider eco-innovation as a
crucial technological opportunity to reduce their carbon foot-prints and to obtain substantial
financial returns through decreased input use and increasing demand for their product,
process, organisational and marketing eco-innovations.
Eco-industries (e.g., air pollution control, waste water management, solid waste
management, soil remediation, and renewable energies and recycling) are among the fastest

18 | P a g e
growing industries in the world and they are likely to be worth around 2$ trillion by 2020
(European Commission2, 2012). On a macro scale, countries or group of countries such as the
EU approach this specific paradigm shift as pathway to a more sustainable, competitive and
knowledge based economy i.e. the EU‘s Lisbon agenda (2000). Therefore, it may be the only
way to sustain the current quality of life (or even increase it) in the long run. The most
significant difference between conventional innovation and eco-innovation is the
environmental concern embedded in the latter. By joining two objectives that for much of
history appeared to be mutually exclusive, eco-innovation has become one of the most pivotal
developments in the search to solve the world‘s environmental problems and sustainability
challenges.
Previous studies and motivation of this research
Undoubtedly, introduction and development of eco-innovation is important for a
better future but also for a more sustainable economy. If successfully realized, it could
provide substantial financial return through i.e., decreased energy and/or material use,
increased labour and capital productivity in the production process and through
commercialization of the product, production, organizational and marketing innovations.
Despite its increasing importance there are still many issues that deserve a thorough
investigation. Difficulties inherent in measuring the environmental aspects of an innovation
has led to certain problems in collecting accurate and reliable data, which, resulted in lack of
empirical research and knowledge. These complications have led the researchers to deal with
certain aspects of eco-innovation and thus the empirical eco-innovation literature calls for a
thorough empirical research. For example, most researchers identified the drivers and barriers
of eco-innovation mainly from the technology-push, market-pull and regulatory framework
context. Even though these conventional factors should be considered as of the utmost
importance for a successful eco-innovation, as an evolutionary mechanism, the traditional
process of innovation requires steady change while the process becomes highly complex,
interdependent and more difficult to coordinate. Evolutionary economists (i.e., Nelson and
Winter, 1982; 2009) draw our attention to the significance of social interactions by stating
that innovation is a path-dependent and a complex process where technology is developed
through various applicable knowledge accrued by interacting with various actors and other
2 The EU‘s, Number of Jobs Dependent on the Environment and Resource Efficiency Improvements
project, Final Report, 2012.

19 | P a g e
factors. Combined with the double externality problem3 (Rennings, 2000), the process of eco-
innovation tends to be even more complex and is affected by even more factors. Kemp and
Pearson (2007) assert that firms‘ propensity to eco-innovate is positively related to their
ability to build on organisational capabilities. De Marchi (2012) emphasizes the role of
engagement in continuous R&D activities and cooperation activities as a driver of eco-
innovation. Mazzanti and Zoboli (2005) show that networking activities may be a major
driver for environmental innovation and they may be even more important than the structural
characteristics of firms (such as size). Hemmelskamp (1997), in a study of German
manufacturing firms, claims that eco-innovators tend to have lower R&D intensity and the
use of external sources of information can be a good solution to countervail potential
information gaps. In addition, Kesidou and Demirel (2012) and Horbach (2008) claim that
the adoption of Environmental Management Systems (EMS), as an indicator of a firm‘s
organisational capabilities, may indeed increase the firm‘s eco-innovation intensity. Porter
and van der Linde (1995) raised considerable attention when they postulated that stricter
environmental regulations would lead firms to eco-innovate and the economic gains that
could be reaped from this investment would offset (partially or fully) the cost of the
regulation itself, leading to a situation known as a win-win opportunity. The drivers of and
barriers to eco-innovation discussion is one of the most significant subject for a thorough
empirical investigation. More notably, the role of a firm‘s social, technological, economic
and organizational characteristics within the eco-innovation process has been little studied.
This Ph.D. thesis aims at contributing to both theoretical and empirical literature of eco-
innovation by questioning the role of a firm‘s economic, technological, organisational and
social capabilities in eco-innovation process.
Aims and scopes of the research
This Ph.D. thesis aims at finding empirical evidence regarding the influence of firms‘
structural, economic, technical, managerial and social capabilities on various aspects of the
eco-innovation process. This research question has been addressed using a firm-level
perspective, embracing both the economic and the management literatures. This thesis thus
3 Eco-innovations produce positive spill overs in both, the innovation and diffusion phase. Positive
spill overs of R&D activities can be usually identified for all kinds of innovations. The peculiarity of
eco-innovations is that positive spill overs appear also in the diffusion phase due to a smaller amount
of external costs compared to competing goods and service on the market. This peculiarity of eco-
innovations has been called the double externality problem (Rennings, 2000).

20 | P a g e
contributes to the discussion on the drivers of and barriers to eco-innovation discussion. It
also provides further empirical evidence on the validity of the so-called "Porter hypothesis".
These questions are addressed from an empirical economic perspective, relying primarily
on concepts drawn from the economics of innovation (such as the "innovation production
function" and "innovativity") and on econometric analyses. While the questions at hand may
concern environmental economics as well as innovation economics, the emphasis in this
Ph.D. thesis is deliberately on the latter. One of the reasons for this (apart from a sheer
interest in the economics of innovation) is that a recurrent problem in eco-innovation studies
is the shortage of available quantitative data to conduct empirical research. This thesis tackles
this challenge by utilizing to the utmost some of the most extensive databases available,
which all pertain to some form of innovation (organizational innovation, ICT-related
innovation, product and/or process innovation). Each chapter of the thesis focuses on a
precise research question that fully exploits one of three datasets made available for this
research. These three datasets are: (1) the French "Organisational Changes and ICT use"
Survey of 2006 (Changement Organisationnel et Informatisation 2006, COI 2006) matched
with the French Annual Firm Survey (Enquête Annuelle d‟Entreprises, EAE) and (2) micro-
anonymised data from the 2004 and 2008 waves of the Community Innovation Survey (CIS
2004 and 2008) available for several European Countries. The firm-level data provided by the
COI 2006 survey matched with the relevant EAE was used in Chapter 2 to test a "weak or
narrow" version of the Porter hypothesis. The third and the fourth chapters of the thesis
exploit the micro-anonymised data from CIS 2004 and CIS 2008, respectively, to examine
the barriers to and drivers of eco-innovation (in Chapter 3) and to identify the characteristics
of different types of eco-innovators (in Chapter 4). While Chapter 2 was focused on France,
using micro-anonymised CIS data available for several EU countries (and affiliates) allowed
us to address the research questions in Chapters 3 and 4 from a truly international
perspective. Using micro-anonymised CIS data, we were able to highlight country-specific
differences with regard to firms‘ eco-innovation intensity and eco-innovative behaviour.
Despite their usefulness, the aforementioned data still suffer from certain limitations, which
constrained our empirical analyses. In particular, the French COI 2006 data does not allow
researchers to distinguish between ISO 14001 environmental standards and other related non-
mandatory standards, all of them being encompassed by a single variable. In another vein,
while the micro-anonymised CIS data covers several countries, it often leaves out some of the
core EU member States presenting a wealth of information on more recent entrants.

21 | P a g e
Given the reliance of this Ph.D. thesis on econometric analyses, the choice of appropriate
econometric methodology and tools was of the utmost importance. Except in Chapter 1
(dedicated to a survey of the literature), we have tried, in each chapter, to address the research
question with the most appropriate tools and state-of-the-art techniques. In Chapter 2, we thus
use both Propensity Score Matching (PSM) Method and Fully Interacted Linear Models
(FILM) to measure the impact of the adoption of ISO 14001-type standards on firm
performance. Both methods aim at correcting selection biases with respect to observable
characteristics, the latter allowing us, in addition, to test for the presence of heterogeneous
effects (Goodman and Sianesi, 2005). In the third and fourth chapters, we adapted and
estimated an innovation production function following the innovativity approach proposed by
Mohnen and Mairesse (2002). This approach consists in estimating an innovation production
function specified as a Generalized Tobit model (i.e., a variant of the Heckman (1979)'s
selection model estimated by Maximum Likelihood), in order to address the selection bias
inherent in the use of CIS data. One of our conceptual adaptation of this framework consists
for instance in replacing Mohnen and Mairesse (2002)'s measure of innovation intensity with
a measure of eco-innovation intensity. Other technical adaptations consist in replacing the
linear intensity equation of the Generalized Tobit model with an Ordered Probit equation
when our measure of eco-innovation is not a continuous, but an ordered categorical variable.
Another contribution of this thesis, in the second and the fourth chapters, is that we were
able to distinguish different types of eco-innovators, further refining our analysis. In Chapter
2, we have thus separated the adopters of voluntary ISO 14001-type environmental standards
into two categories: early adopters and late adopters. Since the data covers the period from
2003 to 2006, a firm that adopted this type of standards in 2003 is considered as an early
adopter and firms that adopted the same standards in 2006 considered as a late adopter.
Being an early adopter indicates that a firm is relatively more experienced in dealing with
environmental problems and environmental management practices. In Chapter 4, we propose
a new taxonomy of eco-innovators and eco-adopters with regard to a firm‘s strategic
behaviour towards eco-innovation. Adapting and refining Kemp and Pearson (2007)‘s
categorization, we could classify eco-innovators into five mutually exclusive categories:
(i) ―passive‖ eco-adopters, (ii) ―late‖ strategic eco-adopters, (iii) ―early‖ strategic eco-
adopters, (iv) ―late‖ strategic eco-innovators and (v) ―early‖ strategic eco-innovators. To the
best of our knowledge, this type of distinction between eco-innovators has not been attempted
by any other empirical research based on the econometric analysis of firm-level data.

22 | P a g e
Structure of The Ph.D. Thesis
Based on our research question, this Ph.D. thesis comprises four mutually-exclusive
research articles on eco-innovation4.
Chapter 1, entitled “Environmental Innovation: A Concise Review of the Literature5”,
aims at providing a solid background for the discussion, and proposes a literature survey that
collects and presents the most prominent theoretical and empirical contributions in the field
of eco-innovation. This paradigm is rather new and there is a need for an extensive review of
the existing researches in the field of eco-innovation. With the first chapter of this Ph.D.
thesis, we provide the reader with a detailed presentation of the concept of eco-innovation
from a historical perspective. Its definition and its peculiarities are the issues addressed in the
main section of this chapter. The other sections include an extensive body on the issue of
drivers and barriers of eco-innovation and its diffusion process. Based on both theoretical and
empirical literature surveys, we show that the concept and definition of eco-innovation is still
evolving and, besides the conventional supply-side and demand-side determinants of
innovation, policy and regulation appear as specific drivers of eco-innovation. Empirical
evidence also indicates that environmental policy and an appropriate regulatory framework
both have a strong impact on eco-innovation, and especially on environmental process
innovation. Nevertheless, the impact of some of the less stringent environmental regulations
(e.g., voluntary proactive approaches such as; ISO 14001 and EMAS6) on the introduction of
eco-innovation remains controversial. We suggest that an in-depth empirical analysis is
required to stress the importance of voluntary ‗ISO-14001 type‘ environmental standards and
norms for the eco-innovation process. Finally, we can also claim that more (empirical)
research on the diffusion processes of eco-innovation is needed, so that it can be efficiently
encouraged by policy makers among both firms and consumers.
Building upon the conclusions of the Chapter 1, Chapter 2, entitled ―Voluntary
environmental standards: A new strategy to promote greener business?” 7
, investigates, first,
whether firms‘ internal characteristics have an impact on the adoption of ‗ISO 14001- 4Eco-innovation is assimilation or exploitation of a product, production process, service or
management or business method that is novel to the firm or user and which results, throughout its life
cycle, in a reduction of environmental risk, pollution and other negative impacts of resource use
(including energy use) compared to relevant alternatives‖ (MEI, Kemp and Pearson (2007, p. 3). 5 This chapter was published as an article in VSE (Vie et Science de l‟Entreprise) in January 2013.
6 Environmental Management and Audit Schemes
7This chapter corresponds to a research paper co-authored with Stéphane Robin (Université Paris 1
Panthéon-Sorbonne) and about to be submitted for publication.

23 | P a g e
type‘voluntary environmental standards and second, the effect of the adoption of these
standards on firms performance. The OECD (2009) refers to organisational innovation as
―incremental or radical change of a firm‘s processes and responsibilities, which reduces
environmental impact and supports organisational learning‖. We can therefore consider
adopters of EMAS and ISO 14001-type standards as organisational-eco-innovators. This type
of environmental standards is often considered as one of the most efficient voluntary
proactive approaches and a useful supplement to traditional mandatory command and control
regulations (e.g., Khanna and Damon, 1999; Alberini and Segerson, 2002). They do not
impose environmental performance requirements and help organisations to form their own
EMS8. Many organisations consider these types of standards as a good and flexible approach
to clean their operations and a good opportunity to identify themselves as eco-innovators. But
less is known about the factors that lead firms to adopt ISO 14001-type standards and about
the potential returns to the adoption of such standards (in terms for instance of increased sales
or profits). The average cost of implementation of such environmental standards can reach to
hundreds of thousand dollars. If the financial return is not guaranteed, a firm‘s motivation to
adopt these standards deserves a thorough empirical investigation. The proposed research is a
direct attempt to test the validity of the ―narrow or weak‖ version (see Jaffe and Palmer,
1997) of the Porter hypothesis. The empirical analyses rely on the Propensity Score Matching
(PSM) method and Fully Interacted Linear Model (FILM). These methods are applied using
firm-level data acquired from a large French survey (COI 2006) matched with administrative
EAE (2006) data. As a result of this merger, we worked with a panel of 11,168 observations
(5,584 firms observed in 2003 and in 2006) with more than 11 employees. Within the context
of this chapter, a firm that adopted an ISO 14001-type standard in 2003 is considered as an
early adopter and a firm that adopted the same type of standard in 2006 is considered as a
late adopter. Being an early adopter basically indicates a firm‘s relative experience in dealing
with environmental problems and environmental management practices. Our empirical results
suggest that a firm‘s structural characteristics organisational capabilities, business market and
technological complexity are some of the factors that have a significant impact on a firm‘s
propensity to adopt voluntary EMS. We also showed that respective marginal effect of these
factors may differ between the early and late adopters of the EMS. Last but not least, we also
observed that both types of adopters reap financial benefits (as measured by an increase in
Value Added) from the adoption of environmental standards, but we do not detect any
8 Environmental Management Standards (EMS)
24 | P a g e
significant difference in this respect between early and late adopters. These results support
the Porter hypothesis to a certain extent. We concluded this chapter by asserting that
voluntary environmental standards may be a good complement for market-based instruments
(such as; tradable permits, emission taxes, subsidies etc.) and command and control
mechanisms to make firms greener while increasing their economic performance.
In Chapter 3, entitled ―Which firm characteristics matter? Identifying the drivers for
eco-innovation‖, we stress the significance of a firm‘s structural characteristics in another
context and aim at investigating the role these characteristics play in the realization of
product and/or process eco-innovation. We suggest that due to environmental concerns and
the double externality problem9 (Rennings, 2000), the process of eco-innovation tends to be
even more complex than the conventional innovation process and it is likely to be affected by
even more factors. These complexities, therefore, imply that it is essential to identifying those
firms‘ technical, organizational and/or social capabilities which are liable to affect their
engagement in eco-innovation. We contribute to this discussion by investigating how a firm‘s
openness and of formal cooperation with external partners affect their eco-innovation
intensity. We test the significance of these factors by conducting empirical analyses which
focus on the estimation of innovation production functions following the innovativity
framework proposed by Mohnen and Mairesse (2002). Formally, this approach relies on the
estimation (by Maximum Likelihood) of a Generalized Tobit model in which the first
equation addresses selection into (general) innovation and the second equation addresses the
intensity of eco-innovation. We performed our estimations on micro-anonymised data from
the 4th
wave of the Community Innovation Survey (CIS 4). This database provides us with
comparable firm-level data on innovation activities in European countries. The empirical
analysis is first conducted on the whole sample covering 104,943 observations across 1510
different countries, and then by country group11
. The empirical results show that eco-
innovative firms tend to be large, autonomous firms that are open to the use of internal and
9 Eco-innovations produce positive spill overs in both, the innovation and diffusion phase. Positive
spill overs of R&D activities can be usually identified for all kinds of innovations. The peculiarity of
eco-innovations is that positive spill overs appear also in the diffusion phase due to a smaller amount
of external costs compared to competing goods and service on the market. This peculiarity of eco-
innovations has been called the double externality problem (Rennings, 2000). 10 Belgium, Bulgaria, Czech Republic, Germany, Estonia, Spain, Greece, Hungary, Lithuania, Latvia,
Norway, Portugal, Romania, Slovenia and Slovakia. 11
We created four country groups: Western European, Eastern European, Mediterranean and Baltic
countries

25 | P a g e
external sources of information (‗openness‘). We found evidence that eco-innovative firms
tend to countervail basic R&D intensity and engagement in continuous R&D by cooperating
with public research institutes, universities and other higher education institutions, as well as
other non-scientific partners, which supporting Hemmelskamp‘s (1997) claims. We then
have reasons to believe that a firm‘s cooperative behaviour may be more beneficial to the
development of an eco-innovation than some of their structural characteristics, and that this
behaviour may even, to a certain extent, act as a substitute for internal R&D efforts. With
regard to country specific differences, we concluded that countries‘ economic, social and
technological levels indeed have a significant impact on a firm‘s eco-innovation strategy and
the way eco-innovation is developed in each country groups. The results point out that
established R&D tradition in Western and Mediterranean countries (when contrasted to
Central European and Baltic countries) is indeed one of the most significant components of a
firm‘s product and/or process eco-innovation capabilities. Fierce competition in European
markets and existing technological differences among country groups may nevertheless force
Eastern European and Baltic firms to speed up and shift their approach (e.g., through
networking and formal cooperation) to eco-innovation.
In Chapter 4, entitled ―A Study on the Types of Eco-innovators Using Micro-anonymised
Data: Case of eco-innovators and eco-adopters”, we moved forward the analyses conducted
in Chapter 3 to another context and examined the influence of firm‘s economic,
technological, and organisational capabilities on the eco-innovation behaviour for different
types of product, process, organisational or marketing eco-innovators. Until now there has
been little or no attempt, in empirical studies, to distinguish true eco-innovators from mere
eco-adopters, which is partly due to a lack of empirical data. In this chapter, we used micro-
anonymised data from the 2008 wave of the Community Innovation Survey (CIS 2008), a
wave which includes a special module on eco-innovation and provides us with detailed
information about the environmental benefits of product, process, organisational or marketing
innovations introduced during the observation period (from 2006 to 2008). In this final
chapter, we propose a new typology of eco-innovators by adapting and refining Kemp and
Pearson (2007)‘s categorization. Using (i) the environmental impacts of an innovation and (ii)
the way the eco-innovations are implemented, we were able to classify eco-innovators into
five mutually exclusive categories First, the measured environmental impacts of realised
product, process, organisational and marketing innovations are used to qualify a firm as an
eco-innovator. Second, the information about the way eco-innovations are implemented is

26 | P a g e
used to separate "true" strategic eco-innovators from strategic eco-adopters. Combining these
two dimensions of eco-innovation yield the five aforementioned categories of eco-innovators:
passive eco-adopters, early strategic eco-adopters, late strategic eco-adopters, early strategic
eco-innovators and late strategic eco-innovators. Our empirical analyses aim at identifying
specific differences between these different types of eco-innovators, taking into account the
fact that they have to be distinguished from non-innovators and non-eco-innovators. Again,
we adapted the innovativity framework first proposed by Mohnen and Mairesse (2002) to our
purposes. Our extension consists in estimating a model accounting first for selection into
innovation, and second for the probability to be one of the five aforementioned types of eco-
innovators rather than a "conventional" innovator that does not eco-innovate. To do so, we
estimated an Ordered Probit model with selection. This model has a Probit selection equation
(to model selection into innovation), and an Ordered Probit equation (replacing the
innovation intensity equation of Mohnen and Mairesse, 2002), the dependent variable of
which has six categories: the five aforementioned categories of eco-innovators, and the base
category (conventional innovators that do not eco-innovate). Both equations are estimated
simultaneously by Full Information Maximum Likelihood. The model is first estimated on
the whole sample, which comprises 79,972 observations across 1112 EU countries. As in
Chapter 3, we then create four country groups and replicate our estimations within these
country groups. The results of our empirical analyses allow us to shed light on the factors and
characteristics that lead a firm towards a more active, strategic eco-innovation behaviour. In
particular, we find that voluntary engagement in eco-innovation is as important as
environmental regulations for early strategic eco-innovators. By contrast, financial funds
provided by the EU seem to spur firms‘ propensity to be a "late strategic eco-innovator" or a
"strategic eco-adopter". This latest result suggests that environmental regulation might be an
efficient tool for attracting new firms to eco-innovation, or at least for making their
innovative behaviour more sustainable. If efficiently used, these tools may have a significant
impact on firm‘s eco-innovation efforts and increase the number of eco-innovators. Country-
specific analyses show that a firm‘s cooperative behaviour, internal R&D efforts,
international market conditions and financial funds provided by the EU are the main factors
that lead a firm towards a more active eco-innovation behaviour. Forming formal cooperation
with scientific and other partners and being open to external sources of information appears
to be especially important for eco-innovators. Eco-adopters, as well as eco-innovators, tend to
12
Bulgaria, Cyprus, Czech Republic, Germany, Estonia, Hungary, Ireland, Lithuania, Portugal,
Romania and Slovakia

27 | P a g e
look for external financial support to mitigate financial risks involved in the eco-innovation
process. We conclude this chapter by claiming that besides a firm‘s internal characteristics
and innovation capabilities, the regulatory framework the interrelations with other external
actors also shape their innovation strategy.

28 | P a g e

29 | P a g e
References for general introduction
Alberini, A. & Segerson, K. (2002): Assessing voluntary programs to improve environmental
quality, Environmental and Resource Economics, Springer, 22, 157-184
Cawsey, D. C. (1996): Influencing the future through innovations in environmental
engineering education, European journal of engineering education, Taylor & Francis, 21,
393-402
De Marchi, V. (2012): Environmental innovation and R&D cooperation: Empirical evidence
from Spanish manufacturing firms, Research Policy, Elsevier, 41, 614-623
Ekins, P. (2010): Eco-innovation for environmental sustainability: concepts, progress and
policies, International Economics and Economic Policy, Springer, 7, 267-290
Fussler, C. & James, P. (1996): Driving eco-innovation: a breakthrough discipline for
innovation and sustainability, Pitman London, 364 p.
Goodman, A. & Sianesi, B. (2005): Early Education and Children's Outcomes: How Long Do
the Impacts Last? Fiscal Studies, Wiley Online Library, 26, 513-548
Heckman, J. J. (1979): Sample selection bias as a specification error, Econometrica: Journal
of the econometric society, JSTOR, 153-161
Hemmelskamp, J. (1997): Environmental policy instruments and their effects on innovation
European Planning Studies, Taylor & Francis, 5, 177-194
Horbach, J. (2008): Determinants of environmental innovation—new evidence from German
panel data sources, Research policy, Elsevier, 37, 163-173
Jaffe, A. B. & Palmer, K. (1997): Environmental regulation and innovation: a panel data
study, Review of economics and statistics, MIT Press, 79, 610-619
Kemp, R. & Pearson, P. 2007: Final report MEI project about measuring eco-innovation,
Deliverable 15 of MEI project (D15), UM Merit, Maastricht, 10
Kesidou, E. & Demirel, P. (2012): On the drivers of eco-innovations: Empirical evidence
from the UK, Research Policy, Elsevier, 41, 862-870

30 | P a g e
Khanna, M. & Damon, L. A. (1999): EPA's voluntary 33/50 program: impact on toxic
releases and economic performance of firms, Journal of environmental economics and
management, Elsevier, 37, 1-25
Mairesse, J. & Mohnen, P. (2002): Accounting for innovation and measuring innovativeness:
an illustrative framework and an application, American Economic Review, JSTOR, 226-230
Mazzanti, M. & Zoboli, R. (2005): The drivers of environmental innovation in local
manufacturing systems, Economia politica, Società editrice il Mulino, 22, 399-438
Nelson, R. R. & Winter, S. G. (2009): An evolutionary theory of economic change
Harvard University Press
OECD (2009), Sustainable Manufacturing and Eco‑innovation: Framework, Measurement
and Industry and policy practices, Synthesis report, available at
www.oecd.org/sti/innovation/sustainablemanufacturing
Porter, M. E. and van der Linde C. (1995): Toward a New Conception of the Environment-
Competitiveness Relationship, in: Journal of Economic Perspectives, 9, No. 4, 97-118.
Rennings, K. (2000): Redefining innovation—eco-innovation research and the contribution
from ecological economics, Ecological economics, Elsevier, 32, 319-332

31 | P a g e
Chapter 1
Environmental Innovation: A Concise Review of the
Literature

32 | P a g e

33 | P a g e
Table of Contents
1. Introduction .......................................................................................................................... 37
2. Eco-innovation: A Specific form of Innovation?................................................................. 38
2.1. From Innovation to Eco-innovation ...................................................................... 38
2.2. What is Eco-innovation? ................................................................................................... 39
2.2.1. Toward a Definition of Eco-innovation ................................................. 39
2.2.2. Classification of Eco-innovators and Eco-innovation ............................ 41
3. Drivers of and Barriers to Eco-innovation ........................................................................... 45
3.1. Drivers .................................................................................................................. 45
3.2. Barriers .................................................................................................................. 45
4. Environmental Policy........................................................................................................... 48
4.1. Recognition of Environmental Policy as a Driver of Eco-innovation .................. 48
4.2. Effectiveness of Environmental Policy as a Driver of Eco-innovation ............... 49
4.3. Proactive Approaches to Environmental Protection ............................................ 51
5. Diffusion of Eco-innovation ................................................................................................ 53
5.1. From Normal Innovation to Eco-innovation ......................................................... 53
5.2. Hindrances to Diffusion of Eco-innovation .......................................................... 55
6. Conclusion ........................................................................................................................... 56

34 | P a g e

35 | P a g e
Environmental Innovation: A Concise Review of the Literature
Abstract
The importance of environmental innovation or "eco-innovation" has become well
recognized in the innovation literature. The present survey proposes a review of the most
prominent theoretical and empirical contributions in the field, without aiming at being
exhaustive. The review of the theoretical works suggests that the definition of eco-innovation
is still evolving, although recent definitions of eco-innovation all tend to be based on
environmental performance rather than on environmental aim. The review of the empirical
research indicates that the regulatory framework and environmental policy both have a strong
impact on eco-innovation, besides conventional technology-pushed and demand-pulled
factors. This is mostly a result of eco-innovation sharing some of the characteristics of a
public good, thus giving rise to a double-externality problem. We also consider some issues
that remain to be explored, such as the diffusion of eco-innovation. If it is as beneficial as
expected (i.e., likely to overcome environmental problems without hampering economic
performance), a better grasp of its adoption mechanisms is still required, so that it can be
efficiently encouraged by policy makers among both firms and consumers.
Keywords: Eco-innovation, Barriers and Drivers, Environmental policy, Diffusion

36 | P a g e

37 | P a g e
1. Introduction
Innovation has been long been considered as a subject of the utmost importance in the
managerial and economic literature. At the level of an economy, innovation is one of the
most important factors leading to development, growth and competitiveness. At the firm
level, innovation, because its focus is on change and on the creation and/or
commercialization of novelty, requires specific, flexible forms of management. These
considerations have led to an abundant literature on innovation. Environmental innovation
(a.k.a. "eco-innovation"), a specific form of innovation aiming at reducing the impact of
products and production processes on the natural environment, has only recently appeared in
the innovation literature. It has since then attracted the attention of scholars, who have
attempted to define the concept of eco-innovation and identify its drivers and barriers at
various levels of analysis (from consumer and firm levels to industry and national levels).
Among these contributions, the seminal work of Porter and Van der Linde (1995) has led
to the much-debated "Porter hypothesis", according to which environmentally benign
innovations can lead to an increase in firms performance, for instance through a reduction of
energy or materials use. Since firms are not always aware of the opportunities offered by eco-
innovation, a strict and effective environmental regulation is required, so that they can be
brought, through compliance, to this awareness. In this conception, environmental policy
appears as an important driver of eco-innovation and deserves a specific attention.
Although it kick-started an increased interest in eco-innovation, the Porter hypothesis
remains controversial, due to contrasting empirical evidence. More generally, despite its
increasing importance, research on eco-innovation is still in an early stage as far as the
gathering of quantitative and qualitative evidence is concerned. Furthermore, provided that
environmental innovation is as beneficial as expected, issues such as its diffusion remain
largely unexplored. The present survey proposes a summary of the most relevant and
prominent researches in the field of eco-innovation. This literature review does not pretend to
be exhaustive, but aims at providing relevant insights, which may give readers a better grasps
of various aspects of eco-innovation.
The paper is organized as follows. In the first and second sections, we examine the
specifics of environmental innovation (or "eco-innovation") compared to "normal" innovation
and touch upon the definition of eco-innovation issue. The third section is dedicated to the
identification of the drivers and barriers to eco-innovation, while the fourth section focuses

38 | P a g e
on the specific role played by environmental policy and regulation. The fifth section
considers the issue of the diffusion of eco-innovations. We conclude in a final section.
2. Eco-innovation: A Specific Form of Innovation?
2.1. From Innovation to Eco-Innovation
Technological innovation has long been strictly defined as ―the introduction of new
products, processes or service into the market‖ (UNCTAD13
, 2006). With the development of
innovation studies as an interdisciplinary field (involving business research, economics,
epistemology, management and sociology, among others), this definition soon appeared as
too narrow and somewhat restrictive. A somewhat broader definition has been given by the
"OSLO Manual" (OECD, 1997:2009), according to which innovation is ―the implementation
of a new or significantly improved product (good or service), or process, a new marketing
method, or a new organizational method in business practice". This definition stresses that an
innovation needs not be novel to the market to be qualified as such; it is sufficient that it be
novel to the firm which implements it. Hence, any new process or business practice which
has been developed somewhere else and then adapted to the said firm can also be counted as
an innovation. One may then wonder whether this broader definition is not actually too broad,
being so all-encompassing that it might lose the specificity of what makes an innovation.
This broader definition can find a justification, though, in the fact that technological
change is generally consider to take place in three stages: invention, innovation and diffusion.
This classification, originally proposed by Schumpeter, is still widely used even though it is
often regarded as over-simplistic (Foxon et al. 2007). In spite of its supposed crudeness, this
classification is of a practical interest here, as it allows one to point out that, while innovation
should be distinguished from invention, diffusion can be regarded as an extension of
innovation.
The distinction between invention and innovation is well-known: The concept of
invention refers to discovery, whereas most innovations are not based on discovery. They
rather are the outcome of applied research and development informed by theoretical
knowledge, engineering experience and knowledge about user needs. By contrast, diffusion
can be considered as another, important part of the innovation process. Kemp and Pearson
(2007), among others, have underlined that innovation continues in the diffusion stage of the
innovation process. New uses and users may be found during diffusion. Advances in
13
United Nations Conference on Trade and Development

39 | P a g e
technology, increasing R&D efforts and feedback from users and suppliers help sellers
improve their products, while competition may bring the price of an innovative product
down.
When it comes to innovation, the choice of a definition is important, if only because the
assessed impact of an innovation varies considerably depending on the concept of the
innovation used. This makes the effects of innovation sometimes hard to measure (Kline and
Rosenberg, 1986). The availability, since the early 1990s, of innovation surveys constructed
according to the guidelines provided by the Oslo manual has allowed for significant advances
in that domain (for an overview, see Kleinknecht and Mohnen (2002) and OECD (2009), for
instance). However, these econometric studies mostly focus on the impact of innovation on
productivity. Even then, distinguish the respective impacts of different forms of innovation
(e.g. product innovation, process innovation and organisational innovations) remains difficult
due to imprecision and measurement errors (Mairesse and Robin, 2012).
Innovation can be classified into different forms alongside different dimensions, one of
them being the distinction between incremental and radical innovation. Another dimension,
which is a core concern of the present survey, is the degree of "environmental friendliness" of
an innovation. This dimension deserves a specific examination, since it has given rise to the
notion of environmental innovation or "eco-innovation", which is often presented as a
specific form of innovation supposedly presenting a large number of positive impacts at
different levels: the economy, the society, and the planet. In the next section we attempt to
clarify and define the notion of eco-innovation.
2.2. What is eco-innovation?
2.2.1. Toward a Definition of Eco-innovation
The claim that the economy is embedded in the human society, which is itself embedded
in the natural, physical environment of planet Earth is not recent, and has already been made
by environmentally-conscious economists such as René Passet (see Passet, 1979 in
particular). However, the concept of "eco-innovation" per se is rather recent, since it first
appeared in the innovation literature in a book by Fussler and James (1996). These authors
defined eco-innovations as ―new products and processes which provide customer and
business value, but significantly decrease environmental impacts‖. However, since this term
has first been coined, the concept of eco-innovation has attracted the attention of many
scholars, and – as was already the case for innovation – various definitions of eco-innovation

40 | P a g e
have been proposed in the literature. Some of them are strictly based on the environmental
aim or environmental performance of innovations. Early studies of eco-innovation have
focused on environmentally motivated innovation, overlooking the potential environmental
gains that may be derived from ―normal‖ innovations14
. However, most current definitions of
eco-innovation are based on environmental performance rather than on environmental aim,
since it is not the aim that is of interest, but whether there are positive environmental effects
related to the innovation (Kemp and Pearson, 2007). Today, the most widely accepted
definition of eco-innovation may be that proposed by Kemp and Pearson (2007) as part of the
MEI15
project:
“assimilation or exploitation of a product, production process, service or management
or business method that it is novel to the firm or user and which results, throughout its life
cycle, in a reduction of environmental risk, pollution and other negative impacts of resources
use (including energy use) compared to relevant alternatives (p. 3)”.
The above definition includes not only innovation aimed at reducing environmental
impacts, but also cases where innovation leads to reduced impacts without this being an
explicit aim. In that sense, normal innovations which have positive environmental effect are
also counted as eco-innovations. As mentioned by OECD (2009), eco-innovation may be
environmentally motivated, but may also occur as a side-effect of other goals, such as
complying with regulations and norms, increasing productivity, reducing input costs (and
hence production costs). Thus, according to this definition, a normal innovation should also
be considered as a potential eco-innovation. Moreover, innovations thus defined are not
Schumpeterian in the sense that they need not create a new market (or be novel to the existing
market) to be considered as innovations: being novel to the firm is enough.
The MEI definition embraces the idea of adopting environmental performance rather
than aim as the fundamental defining criterion. According to this definition, eco-innovations
need not have an environmental aim in either the development phase or the use of the
product/process. They just have to be better than their alternatives on a life cycle basis (Speirs
et al. 2008). According to the contributors to the MEI project, the concept of eco-innovation
should not be limited to new or better environmental technologies, which results in every
14
―Normal‖ innovations are those developed for usual market-oriented reasons such as saving costs or
providing better service to users. 15 ―Measuring Eco-Innovation‖ Project co-funded by the European Commission within the Sixth
Framework Programme (2002-2006).

41 | P a g e
environmentally-improved product or service counting as an eco-innovation. The justification
for this is that only taking into account the aim of an innovation would narrow too much the
boundary of the term.
2.2.2. Classifications of Eco-innovators and Eco-innovation
Taking a critical look at the definition given in Section 2.1, one may fear that such an all-
encompassing definition may be too imprecise and too optimistic as regards the effects of
innovation on the environment. This is not necessarily the case. Indeed, the contributors to
the MEI project acknowledge that eco-innovation is likely to occur in different manners in
the whole economy (Kemp and Pearson, 2007). Given this, it is necessary to distinguish
between innovations that will have a major positive impact on the environment and those that
will have only a limited impact.
Thus, although the MEI project states that ―any company adopting a good, service,
production process management or business method with environmental benefit is an eco-
innovator (Kemp and Foxon, 2007b, p. 17)‖, it also acknowledge the necessity to distinguish
between four types of eco-innovators (i.e., firms with different behaviours regarding eco-
innovation): (1) Strategic eco-innovators are active in eco-equipment and service sectors,
and/or develop eco-innovations for sale to other firms; (2) Strategic eco-adopters
intentionally implement eco-innovations, be they developed in-house, acquired from other
firms, or both; (3) Passive eco-innovators have no specific strategy to eco-innovate,
although they may accidentally implement innovations that result in environmental benefits;
(4) Non eco-innovators do not develop either intentional or unintended innovations with
environmental benefits. This typology of eco-innovators, suggested by (Kemp and Pearson,
2007), is summarized in Figure 1.

42 | P a g e
Figure 1: Possible distribution of firms according to eco-activities
Passive eco-adopters
Non eco-innovator Strategic eco-adopters
Strategic eco-
innovators
Source: MEI, Kemp and Pearson (2007)
Due to the all-encompassing nature of the MEI definition of eco-innovation,
distinguishing between four types of eco-innovators is not enough to capture the diversity of
the concept. It is important to be able to classify eco-innovations themselves, according to the
nature of the innovations involved. One such classification is proposed by Kemp and Foxon
(2007a), who distinguish between: (i) environmental technologies, (ii) organisational
innovation for the environment, (iii) product and process innovations offering environmental
benefits and (iv) green system innovations. Each category includes a variety of items, which
we briefly summarized below.
Environmental technologies gather together all pollution control technologies and
cleaning technologies that treat pollution released in the natural environment. This includes:
cleaner process technologies (i.e., new manufacturing processes that are less polluting and/or
more resource efficient than relevant alternatives), waste management equipment (e.g., waste
water treatment technologies), environmental monitoring and instrumentation, green energy
technologies, water supply and noise and vibration control.
Organizational innovation for the environment refers to the introduction of
organizational methods and management systems dealing with environmental issues
encountered in the production process. Organizational methods include all pollution
prevention schemes aimed at the prevention of pollution through input substitution, more
efficient operation of processes and small changes to production plants (e.g., avoiding or
stopping leakages). Environmental management and auditing systems include all formal
systems of environmental management involving measurement, reporting and responsibilities
concerning issues of material use, energy, water and waste (EMAS and ISO 14001 are
examples of environmental management systems). Such organizational innovations may be

43 | P a g e
extended to the whole value chain. This chain management requires the commitment of a
larger number of actors, since it involves cooperation between companies in order, for
instance, to close material loops and to avoid environmental damage across the value chain
(following products and treating hazardous materials "from the cradle to the grave").
Product and service innovation offering environmental benefits include all new or
environmentally-improved products as well as environmentally beneficial service. These
encompass: new or environmentally improved goods including eco-houses and buildings;
green financial products (such as eco-leases or climate mortgages); environmental service
(e.g., waste and water management, management, environmental consulting, testing and
engineering); service that are less pollution and resource intensive (car sharing, for example).
Green system innovations are alternative systems of production and consumption,
which are more environmentally benign than the existing ones. Biological agriculture and
renewable-based energy systems are examples of green system innovation.
Although it is fairly widespread, this categorization is not the only existing one in the
literature. For instance, Andersen (2005) has proposed a classification based on five
categories of eco-innovation, which partially overlap those of Kemp and Foxon (2007a). The
categories suggested in Andersen (2005) are: (i) add-on innovations (pollution- and resource-
handling technologies or service), (ii) integrated innovations (cleaner technological processes
or products), (iii) eco-efficient technological system innovations (new technological paths),
(iv) eco-efficient organizational system innovations (new organizational structures) and (v)
general purpose eco-efficient innovations.
Add-on innovations are products (artefacts or service) that improve the environmental
performance of the customer. The product in itself need not be environmentally friendly.
Integrated innovations are innovations which contribute to the solution of environmental
problems within the company or other organizations (public institutions, families...). It is in
this sense that they are integrated. Eco-efficient technological system innovations are
innovations that represent a technological discontinuity. These radical innovations have wide
systemic effects. They built on new theories, competencies and practices and may demand a
change of both production and consumption patterns. Eco-efficient organizational system
innovations entail new concepts for an eco-efficient way of organizing society. This means
new ways of organizing production and consumption at the societal level, with new
functional interplays between organizations, e.g. between companies (―industrial symbiosis‖),
between families and workplaces (―urban ecology‖), etc.

44 | P a g e
Finally, general purpose eco-efficient innovations are technologies that affect the
economy profoundly, because they have an underlying importance and feed into a range of
other technological innovations. Information and Communication Technologies (ICT) may be
the archetypical example of general purpose innovation in the context of "normal"
innovations. While ICT as they are now are unlikely to have direct green effects (some even
claim it may quite the contrary), it is important to look for eco-oriented changes in general-
purpose technologies. These technologies are so fundamental that any "green change" they
undergo will have a major effect on all other eco-innovations and on the environment itself. It
is interesting to note that, in spite of some degree of overlap in their categorization, Kemp
and Foxon (2007a) tend to disagree with this last point. They state that incremental
innovations are important sources of productivity and that therefore, environmental
improvements coming from incremental innovations should not be considered of lesser
importance than those generated by radical eco-innovations. This may be because they are
too optimistic as regards the likelihood of any radical eco-innovation appearing with general-
purpose innovations in the near future.
Now that we have highlighted what eco-innovations may consist in, the next step is to
consider how they may come into being. As for regular innovations, the generation of eco-
innovations largely depends on the benefits received by the innovator. Successful innovations
must provide higher value or reduce costs and, ultimately, either increase revenues from
existing customers or attract new customers (Carrillo-Hermosilla et al. 2010). The eco-
innovator may benefit from its innovative activity both directly and indirectly. According to
Kemp and Andersen (2004), direct benefits for an eco-innovator consist in operational
advantages such as cost savings from greater resource productivity and better logistics, and
sales from commercialization. Indirect benefits include a better image, better relations with
suppliers, customers and authorities, an enhanced innovation capability overall thanks to
contacts with knowledge holders, health and safety benefits and greater worker satisfaction.
Hence, the indirect benefits mostly have value in the long run, and while they may be
overlooked by firms looking for short-run profits, they might well be the most important
drivers for proactive green behaviour. These considerations lead us to the issue of drivers of
and barriers to eco-innovation.

45 | P a g e
3. Drivers of and Barriers to Eco-innovation
For eco-innovation to unfold its full potential, firms and decision makers need to be able
to identify the drivers of (and barriers to) eco-innovation. Policy makers need to be aware of
the many drivers of eco-innovation (Kemp and Foxon, 2007a) in order to spur eco-
innovativeness, while many eco-innovations fail or are abandoned because firms are unable
to overcome the manifold barriers they encounter (Bleischwitz et al. 2009). Drivers are
thoroughly explored in Section 2.1., while Section 2.2. deals with barriers.
3.1. Drivers
The innovation literature has long been dominated by two contrasting explanations of
what drives technological change: the push of the technology itself ("technology-push") on
the one hand, and the pull of the market ("demand-pull") on the other. Empirical evidence has
shown that both forces are very likely to be at play in the actual world (Pavitt, 1984). It is
therefore necessary to examine drivers and barriers from both the supply side (where
technology push is supposed to occur) and the demand side (which exerts the market pull).
As far as eco-innovation is concerned, technology push factors include all new eco-efficient
technologies, whereas market pull (or demand pull) factors include consumers' preference for
environmentally friendly products and the need for companies to maintain their
environmentally-responsible reputation (Rennings, 1998). Environmental innovation and
"normal" innovation notably differ in that institutional and political factors are likely to play
an even more important role in the former than in the latter. The main features of eco-
innovations are correlated to the determining role of regulations. Table 1 lists these three
types of determinants: (1) technological and supply-side related, (2) market and demand-side
related, and (3) policy related. Since environmental policy may interact with both supply and
demand sides, it will be examined in the next section, and the present section focuses on the
first two types of determinants.
3.2. Barriers
Broadly defined, barriers to eco-innovation include every element that may hinder the
development and/or diffusion of environmental innovations. Rather than thinking in terms of
supply and demand, as was done for drivers, the literature usually classifies barriers and
drivers into categories such as political, informational, financial etc. (Bleischwitz et al. 2009).

46 | P a g e
Among these categories, informational and financial barriers are often deemed to be the most
important ones. Without being exhaustive, we can consider here some established typologies.
For instance, Bleischwitz et. al. (2009) consider the following barriers to eco-innovation:
(i) informational barriers arise from an asymmetric distribution of knowledge about
material and resource efficiency among various actors, such as users and producers;
(ii) financial barriers are generally the result of a splitting of financial incentives between
actors (e.g., between user and investor) with contrasting interests as regards the introduction
of eco-innovation; (iii) a gap between R&D and market launch often occurs when the risks
associated with R&D expenditures are high, in which case a firm will only accept to act as a
―first mover‖ (i.e. to introduce an eco-innovation) if it can benefit from a sufficient patent
protection.
Reid and Miedzinski (2008), relying on an analysis of CIS316
indicators, found that the
most significant barriers for firms that are classified as eco-innovators, were (1) the high
costs of innovation activity (for almost 30% of these firms), (2) the lack of an appropriate
source of funding (for %23) and (3) the excessive economic risks (perceived by around 20%
of these firms). This analysis thus points to financial barriers as the most important ones.
However, one should be aware that any analysis of barriers conducted using CIS data is likely
to be biased by the fact that the data refer to barriers encountered by innovators, and not to
barriers that may have caused a firm to remain a non-innovator.
Reid and Miedzinski (2008) suggest that, whatever the data limitation, any classification
of drivers and barriers to eco-innovation is difficult because it depends to a large extent on
the cultural, institutional and historical context of the country. According to his conclusion,
socio-cultural factors that can be considered as barriers to eco-innovation are (1) low or low-
quality education at all levels, (2) low environmental awareness and lack of clear
information, (3) low openness of society (e.g., ―fear of change‖, closed networks, risk
aversion, etc.), (4) limited access to human resources and expert knowledge, (5) lack of
organisational capacities, (6) persistent power structures within societies (―institutional
inertia‖ and historical path dependency), (7) short-term decision-making, (8) weak social
corporate responsibility. The risk with such an approach, however, is to be of little practical
usefulness if what is really needed for the study of eco-innovation is a general model or
framework. In this case, saying that the object of the study is mostly country-specific for
cultural and historical reasons is hardly a step towards such a framework.
16
Third Community Innovation Survey, conducted in 2001 across all EU Member States.

47 | P a g e
Institutional and social barriers certainly have to be taken into account, nevertheless; and
they precisely seem to be absent of classifications such as the following one, proposed in
European Commission (ETAP, 2004). This classification distinguishes: (i) economic
barriers, ranging from market prices which do not reflect the external costs of products or
service (such as health care costs due to urban air pollution) to the higher cost of investments
in environmental technologies (e.g., because of the complexity of switching from traditional
to ―green‖ technologies); (ii) regulations and standards can also act as barriers to
innovation when they are unclear or too detailed, while a good legislation can stimulate
environmental technologies; (iii) insufficient research efforts, coupled with an inappropriate
working of the research system in European countries and weaknesses in information and
training; (iv) inadequate availability of risk capital to move from the drawing board to the
production line; (v) lack of market demand from the public sector, as well as from
consumers. The weakness of this typology is that almost every barrier it lists is of an
economic nature, and it fails to encompass purely technological barriers as well as social
factors.
In the end, one has to go back to a work such as that of Ashford (1993) to find an
extensive and complete list of barriers. Those are: (i) Technological barriers (e.g.,
unavailability of certain technologies for specific applications, or lack of alternative
substances to substitute for the hazardous components; (ii) Financial barriers (e.g., costs of
R&D, or non-comprehensive cost evaluations and cost-benefit analyses leading to a lack of
funding for eco-innovation); (iii) Labour force-related barriers (e.g., lack of persons in
charge of the management, control, and/or implementation of waste reduction technology);
(iv) Regulatory barriers (e.g., lack of incentives to invest in reuse and recovery
technologies); (v) Consumer-related barriers (e.g., risk of customer loss if output properties
change slightly or if product cannot be delivered for a certain period); (vi) Supplier-related
barriers (lack of supplier support in terms of product advertising, good maintenance service,
expertise of process adjustments, etc.); (vii) Managerial barriers (e.g., lack of top
management commitment, or reluctance on principle to initiate change in the company).
Ashford (1993) emphasizes that most of the barriers listed above can be disaggregated to
a more detailed level. For instance, the ―lack of top management commitment‖ may be
caused by various factors. It could come from a lack of information regarding the profitability
of waste reduction technologies in general. It could also stem from a lack of confidence in the
performance of new technologies, or, more crucially, from short-sightedness: if the top

48 | P a g e
management is not aware of the long-term benefits that may be derived, for instance, from
waste reduction, then waste reduction will remain a low-priority issue.
Once a general framework such as the one above has been proposed, further analyses
may help identify which type of barriers to eco-innovation should be addressed first, and
which type could be considered as secondary. This is where the institutional and cultural
context matters, since the most important type of barriers may differ across economic sectors
and even across countries (Hitchens et al., 2003). For instance, in a study of environmental
performance in EU countries, Kemp and Foxon (2007a) found that financial barriers were
more important in Germany than in the UK, whereas lack of time was a greater barrier in the
UK than in Germany.
4. Environmental Policy
4.1. Recognition of Environmental Policy as a Driver of Eco-innovation
Empirical evidence shows that the regulatory framework and environmental policy have
a strong impact on eco-innovation (Green et al. 1994; Porter and van der Linde 1995; Kemp,
1997; Hemmelskamp, 1997; Cleff and Rennings, 1998; Berman and Bui, 2001). However,
according to Rennings (1998), environmental product innovation tends to be more driven by
the strategic market behaviour of firms (market-pulled effect). By contrast, regulation tends
to drive more environmental process innovation, because the public-good character of clean
technology leads to under-investment in environmental R&D (Rennings and Rammer, 2009).
Therefore, environmental regulation is especially necessary to foster environmental process
innovation. When the reduction of the environmental impact of a firm‘s activity offers little
operational or commercialization benefits, then regulation may become the primary driver of
eco-innovation (Kemp and Foxon, 2007a). For example, regulations to protect local air
quality have stimulated an innovation such as catalytic converters, which have led to dramatic
reductions in the emission of pollutants from vehicles (Kemp and Foxon, 2007a).
Therefore, environmental policy is a potentially strong driving force for eco-innovation,
which deserves to be studied separately. Environmental policies may fall under the
―command-and-control‖ or ―market-based‖ types. Market-based instruments such as
pollution charges, subsidies, tradable permits, and some types of information programs can
encourage firms or individuals to undertake pollution control efforts that are in their own
interests and that collectively meet policy goals (Jaffe et al., 2002). By contrast, command
and control regulations tend to force firms to take on similar shares of the pollution burden,

49 | P a g e
regardless of the cost. They often do this by setting uniform standards for firms, the most
prevalent of which are performance- and technology-based standards (ibid).
In the wake of the Lisbon agenda, the European Council adopted in 2001 the Sustainable
Development Strategy and introduced the ―Environmental Technologies Action Plan‖
(ETAP) in 2004. In the ETAP, the European Union acknowledged the strategic importance of
eco-innovation. Although the actual impact of ETAP remains to be precisely assessed, it
seems to have led to an increased recognition of environmental problems (and of the need for
eco-innovation as an answer) in the public and political consciousness.
The results from a survey across ten OECD countries show that an increasing number of
countries now perceive environmental challenges not as a barrier to economic growth but as a
new opportunity (OECD, 2009). This new understanding has made environmental policy
appear as an important driver of eco-innovation, thus reconciling real-world policy with the
theoretical considerations of Porter and Van der Linde (1995). These authors argued in the
mid-nineties that environmental progress requires companies to improve their resource
productivity through dedicated innovation, so that regulation becomes not an obstacle but a
driver for innovation. In Porter and Van der Linde (1995), implicitly, the more prescriptive
the regulation is, the more confined will the innovation be.
More recently, Rennings (2000) also emphasized that environmental policy is becoming
the main driver of eco-innovations. According to him, eco-innovations differ from normal
innovations because they produce a double externality, consisting in (1) the usual knowledge
externalities in the research and innovation phases and (2) externalities in the adoption and
diffusion phases due to the positive impact upon the environment (Oltra, 2008). In other
words, the beneficial environmental impact of environmental innovations makes their
diffusion always socially desirable. However, these positive external effects lead to market
failures which may hinder eco-innovation. The private return on R&D in environmental
technology is less than its social return due to its public good nature, which in turn causes a
lack of private incentives leading firms to under-invest in environmental R&D and innovation
(Oltra, 2008). Therefore, environmental policy and/or an appropriate regulatory framework
appear as a requirement for eco-innovation.
4.2. Effectiveness of Environmental Policy as a Driver of Eco-innovation
According to Porter and van der Linde (1995), environmental standards can foster
innovation under three conditions. First, they must create maximum opportunities for eco-
innovation, letting the industry (and not a standard-setting agency) choose its own approach

50 | P a g e
to innovation. Second, regulation should foster continuous improvement, rather than locking
in any particular technology. Third, the regulatory process should leave as little room as
possible for uncertainty at every stage.
Therefore, the type of regulation/policy and the way it is implemented is significantly
important. It should lead firms to effectively address environmental problems rather than
restrict firms in a specific technology and leave the environmental problem unsolved. The
stringency of the policy and the terms in which it is defined are equally important, since
uncertainty depends on these factors. In spite of on-going controversies on whether
environmental regulation actually has an impact on innovation and on the most efficient
policy instruments (see for instance Greenstone, 2002; Jaffe et al., 2002), many empirical
studies (European Commission, 2001; Rennings et al. 2006, Belin et al. 2009) find a positive
correlation between innovation and regulation.
Porter and van der Linde, (1995), Kemp et al. (1998) and, Jänicke and Jacob (2002) all
predict that strict environmental regulations stimulate innovation in a number of ways (e.g.
first mover advantages created by the development of ―green‖ technologies). These
predictions are in line with the so-called ―Porter hypothesis‖ postulates that ―there are win-
win opportunities through environmental regulation, where simultaneously pollution is
reduced when having an increase in productivity‖. As mentioned above, this hypothesis has
fuelled controversies17
, but its argument remains at the core of current research on eco-
innovation.
The rationale behind this argument is that firms do not detect the potential of
environmental innovations because they are ―still inexperienced in dealing creatively with
environmental issues‖ (Porter and van der Linde, 1995, p. 99). Environmentally and
economically benign innovations are not realized because of incomplete information, and of
organizational and/or coordination problems (ibid). Firms are not able to recognize the cost
saving potentials (e.g. energy or materials savings) of environmental innovation (Frondel et
al. 2007). This leads many of them to believe that an environmentally-virtuous behaviour is a
burden rather than an asset (Kemp and Andersen, 2004). Therefore, regulations and policies
can be a catalyst and help them to understand the potential benefits of environmental
innovations.
17
For instance, Jaffe et al. (2002) state that while it is theoretically valid, its relevance with regard to
the magnitude of win–win potentials is debatable.

51 | P a g e
However, as Porter and Van der Linde (1995) hinted at, the types of environmental
policies used matter. Popp (2009) argues that in general, market-based policies are thought to
provide greater incentives for innovation, as they provide rewards for continuous
improvement in environmental quality. In contrast, command-and-control policies penalize
polluters who do not meet the standard, but do not reward those who do better than mandated
as the command-and-control regulations direct a specific level of performance, such as
pounds of sulphur dioxide (SO2) emissions per million BTUs of fuel burned, or the
percentage of electricity that must be generated using renewable sources.
Popp (2009) also argues that what matters is not just the type of policy instruments used:
differences within one policy type (e.g. market-based policies) may also matter. His ideas
find some support in the results of Johnstone et al. (2008), who analyse the effect of different
policy instruments on renewable energy innovation in 25 OECD countries. In their study,
they compare price-based policies such as tax credits and feed-in tariffs18
to quantity-based
policies such as renewable energy mandates. They find that quantity-based policies favour
the development of wind energy while, by contrast, direct investment incentives are effective
in supporting innovation in solar and waste-to-energy technologies. However, designing such
instruments efficiently for different pollutants is sophisticated and costly.
Moreover, the introduction of such policies has often met with opposition from at least some
industries (e.g., Arimura et al. 2008). As a result, in recent years, voluntary proactive
approaches to environmental protection are considered useful supplements to traditional
mandatory command and control regulations and economic incentives (e.g., Khanna and
Damon, 1999; Alberini and Segerson, 2002).
4.3. Proactive approaches to environmental protection
The most important voluntary approaches to environmental protection are subsumed
under ISO 14001, EMAS19
and 33/50, the first two being international and the latter being
specific to the US. ISO 14001 comprises standards that must be adopted. EMAS requires
facilities – besides third-party audits with independent environmental verifiers and
registration bodies – to publish an environmental statement. Finally, 33/50, which was
launched by the U.S. Environmental Protection Agency (EPA) in 1991, aimed at reducing
aggregate emissions of 17 chemicals reported to the Toxic Release Inventory (TRI) (Ziegler
18
Feed-in tariffs, used in various European countries, guarantee renewable energy producers a
minimum price for the electricity they produce 19
Eco-Management and Audit Scheme

52 | P a g e
and Nogareda, 2009). The main reasons for introducing these voluntary approaches are (1)
that they are more flexible and cheaper than government based policies, and (2) they are
likely to improve corporate environmental performance. For example, EMAS-certified
facilities in Germany benefit from regulatory relief and from more (and higher) subsidies
based on the EMAS privilege regulation (Ziegler and Nogareda, 2009). In line with these
implications, Rehfeld et al. (2007) emphasizes that a careful design of EMAS is important for
both the environmental and economic performance of a facility. It is important to note that
public voluntary programs such as 33/50 do not imply any penalties for withdrawal at any
time. In other words, these measures do not guarantee an improvement in environmental
performance (Anton et al. 2004). For this reason, critics have arisen that consider Voluntary
Environmental Programmes (VEP) as ―green washing‖. According to these critics, VEP fail
to lead participants to clean their operations due to the absence of significant obligations or
enforcements (e.g., Potoski and Prakash, 2005). However, some studies, such as Fischer et al.
(2003), do not find a clear ranking when comparing VEP to other instruments. Fischer et al.
(2003) claim that no instrument is generally preferable, and the welfare gain of environmental
policy instruments (VEP, command-and-control policies, and market-based regulation)
depends on different sets of circumstances, such as the number of polluting firms, the costs of
an innovation, and the costs of imitating an innovation. As a result, the debate on appropriate
policy instruments for developing eco-innovation is still open and the definition of an
adequate policy may change depending on the situation. This asserts that more empirical
investigation needed to stress the importance of voluntary proactive approaches to stimulate
eco-innovation.
The OECD (2009)‘s policy brief discussion pays considerable attention to notable
policies that have actually been introduced in various countries. This discussion gives
examples and provides detailed examples of certain policies such as the United States
Department of Energy (DOE)‘s Technology Commercialization Fund (TCF). This funding
for technology deployment complements ―angel investment‖, or early-stage corporate
product development. The TCF brings the DOE‘s national laboratories and industry together
to identify technologies that are promising, but face the ―commercialization valley of death‖
(OECD, 2009). Another programme is Japan‘s Top Runner Programme, launched in 1998,
which adopts a process of setting and revising standards by taking the current highest energy-
efficiency rate of products in some 21 product groups as a benchmark, instead of setting fixed
targets. This flexible standard-setting creates incentives and competition among
manufacturers to improve product performance without providing financial support. The

53 | P a g e
European Automobile Manufacturers Association (ACEA) voluntary agreements is another
programme discussed within this discussion, these agreement are an important element of the
EU‘s strategy to reduce CO2 emissions from passenger vehicles and more generally to
improve fuel efficiency. With these agreements, the automobile industry committed to reduce
total new passenger fleet average CO2 emissions according to specific targets and timetables
(Leitner et al. 2010). One interesting distinction between the Japanese Top Runner
programme and the corresponding European Automobile Manufacturers‘ Association
approach (based on voluntary agreements) is that the ACEA sets standards at the industry
level, while the Top Runner Programme sets standards at the company level. This latter
approach has the advantage that companies are more directly involved. It is remarkable that
only about half of the European car manufacturers mentioned the ACEA standard in their
annual reports (Tressel et al., 2007). As a last example, let us mention the ―Bonus-Malus‖
(reward-penalty) scheme introduced in France in 2007 to encourage manufacturers of
personal cars to develop low-emission vehicles by guiding consumer choice. This carrot and
stick scheme for diffusing eco-innovative product provides a subsidy to those who
purchase a new car which emits less than 130 grams of CO2 per kilometre, and imposes a
penalty on those who buy a new car that emits over 160 g CO2/km (Popp, 2009). As
mentioned above, these policies based on goodwill are supplements to traditional
environmental policies and therefore do not ―punish‖ the failing firms or manufacturers. The
―bonus-malus‖ programme implemented in France could be considered as an exception, but it
must be noted that the ―stick‖ in this programme targets consumers, and not manufacturers.
5. Diffusion of Eco-Innovation
5.1. From Normal Innovation to Eco-innovation
The last policy example examined in the previous section leads us to the issue of the
diffusion of eco-innovations. In the innovation studies literature, Rogers (1962:2010) was
among the first to study the diffusion of innovations, using an original approach based on
well-established theories in sociology, psychology, and communications. According to
Rogers (1962), diffusion is ―the process by which an innovation is communicated through
certain channels over time among the members of a social system‖. Therefore, diffusion can
be considered as a special type of communication concerned with the spreading of messages
that are perceived as new ideas for the potential users.
54 | P a g e
Moreover, diffusion is a complex process. The widespread diffusion of new technologies
can take anywhere from between five to fifty years, depending on the innovation (Mansfield,
1968). This is mainly because of the perceived uncertainty and the risk about the new
technology. Countless studies have confirmed that the diffusion of new technologies follows
a predictable temporal pattern; technologies are adopted rather slowly at first, then more
rapidly, and then slowly again as a technology specific "adoption ceiling" is reached. Thus, a
plot of the number or the proportion of adopters over time assumes a sigmoid shape
(Blackman, 1999) as Rogers has indicated in his innovation diffusion model (Rogers, 1983).
Therefore, Moore (1998) suggested that the early stage of new product development hinges
on innovators and early adopters, as their reaction to the innovation will determine the
product success or failure. Early adopters play a crucial role in the diffusion process, because
they are taken as examples for others to follow.
In the case of eco-innovation, the diffusion of clean technologies is also likely to follow
an S-shaped pattern, although far less research has been done on clean than on ―normal‖
technologies. Kemp and Volpi (2007) explain that diffusion of a clean technology is initially
slow because it is initially not well known, and surrounded with even greater uncertainty than
technologies involved in ―normal‖ innovation. In spite of this uncertainty, there are good
reasons to support the development and diffusion of eco-innovations. First and foremost is an
environmental reason: the world population continues to increase and there are demands for
higher standards of living, with more consumption leading to increased pollution, climatic
change, and the depletion of natural resources and biodiversity (Cawsey, 1996). In this
context, eco-innovation may be the only way to sustain the current quality of life (or even
increase it) in the long run.
Among secondary reasons for supporting the diffusion of eco-innovations is a purely
economic reason. Eco-industries (e.g., air pollution control, waste water management, solid
waste management, soil remediation, and renewable energies and recycling) are among the
fastest growing industries in the world and they are likely to be worth around 2$ trillion by
2020 (European Commission20
, 2012). As an example, European eco-industries are a small
but quickly growing portion of the EU economy representing 2.1% of the EU‘s GDP and
sustain 3.5 million full-time jobs in the EU. Around 75% of these jobs are in labour intensive
sectors such as water and solid waste management (European Commission, 2004). We can
20
The EU‘s, Number of Jobs Dependent on the Environment and Resource Efficiency Improvements
project, Final Report, 2012.

55 | P a g e
thus expect that, as the awareness of environmental issues increases, eco-industries will
create greater opportunities for new employment.
5.2. Hindrances to Diffusion of Eco-innovation
There are specific problems inherent to eco-innovative activities which make the
diffusion of eco-innovations difficult. One of the main problems is the double externality
issue mentioned in Section 3.1: since this double externality leads firms to under-invest in
eco-innovation, it also strangles the diffusion of eco-innovations at its very root.
Another problem associated with eco-innovation is that in many cases the adoption and
the diffusion of environmental technologies can be viewed as a typical case of technological
competition between an established technology and an alternative environmental technology,
or a set of alternative environmental technologies (Oltra, 2008). In order to be successful in
the diffusion process, the alternative technology should become a viable substitute to the
existing technology. The more efficient the new environmental technology is on the
mainstream characteristics, the more likely its diffusion becomes (Christensen, 1997). But,
the superiority of the eco-innovation compared to the established technology is always a
debatable issue and needs further investigation. Moreover, most industries shy away from
technological environmental innovations in the first instance because of their complexity and
of the financial risks they entail.
The heterogeneity of potential adopters only adds to the second problem: a technology
that is generally superior will not be equally superior for all potential users, and may remain
inferior to the existing technology for some users for an extended period of time after its
introduction (Jaffe et al. 2002). Therefore, it is important to understand how potential users,
be they consumers or firms, value the environmental characteristics of the new technology.
Very often, clean technologies or products are adopted at the expense of other technologies or
other products. As a result, potential users want to gain some advantages from their
investments (e.g., an increased competitiveness in the case of firms that have adopted a clean
technology) and generally want to know the expected returns before the implementation
process.
In general, when users are consumers (and not firms) they do not have adequate
information about the new technology or product. This lack of adequate information
constitutes another great obstacle to the diffusion of the new technology. Consumers have to
cope with the typical problem of experience goods since they cannot know ex ante the
environmental characteristics of goods and/or technologies (Oltra, 2008). This issue gives
56 | P a g e
more importance to communication channels, since better explanations and increasing
awareness about environmental issues may enable a more widespread adoption of eco-
innovations. Increasing awareness about the shortcomings of the existing technologies and
identifying the required technological improvements may also increase the speed of adoption.
This is the reason why policy instruments such as information provision and eco-labels are
necessary to inform consumers efficiently and to stimulate the diffusion of environmental
products (Oltra, 2008). For example, ISO 14000 standards can be a good tool for increasing
environmental awareness. All the above-mentioned obstacles raise the question of how to
give a kick not only to the creation of eco-innovations, but also to their diffusion process. So
far, however, the empirical literature seems to have focused on the determinants and/or
effects of eco-innovation, or on testing the Porter Hypothesis. There is still scope for
empirical work on the diffusion processes of environmental innovations.
6. Conclusion
Conventional or "normal" innovation has been the subject of countless research until
now. However, eco-innovation, as a specific form of innovation, still deserves further
exploration. The present survey summarized the most relevant and prominent researches in
the field, in order to highlight the most important insights.
Our review of theoretical researches shows that the concept and definition of eco-
innovation is still evolving, although all current definitions of eco-innovation tend to be based
on environmental performance rather than environmental aim. Moreover, the degree of
novelty required for a product or process to be defined as an innovation is fairly minimal: it is
sufficient for the product or process to be new at the firm level rather than, for instance, at the
level of an industry or an economy. Direct and indirect benefits perceived by the innovator
have significant impact on eco-innovativeness. The direct benefits are relevant in the short
term while, the indirect benefits are more relevant in the long term. The literature also asserts
that, besides the conventional supply-side and demand-side determinants of innovation,
policy and regulation appear as specific drivers of eco-innovation.
Empirical evidence shows that environmental policy and an appropriate regulatory
framework both have a strong impact on eco-innovation. Environmental product innovation
tends to be more driven by the strategic market behaviour of firms (market pull), whereas
policy and regulation tend to drive environmental process innovation, because the public-
good character of clean technologies leads to under-investment in environmental R&D.
Nevertheless, the impact of some of the less stringent environmental regulations (e.g.,

57 | P a g e
voluntary proactive approaches such as; ISO 14001 and EMAS) on the introduction of eco-
innovation remains controversial. This suggest that more in-depth empirical investigation to
stress the importance of voluntary environmental standards and norms for the eco-innovation
process is beneficial to support (or contradict) the so-called Porter hypothesis. Last but not
least, more (empirical) research on the diffusion processes of eco-innovation is also needed.
If it is as beneficial as the Porter hypothesis suggests (i.e., likely to overcome environmental
problems without hampering economic performance), then a better grasp of its adoption
mechanisms is still required, so that it can be efficiently encouraged by policy makers among
both firms and consumers.

58 | P a g e

59 | P a g e
References for Chapter One
Alberini, A. & Segerson, K. (2002): Assessing voluntary programs to improve environmental
quality, Environmental and Resource Economics, Springer, 22, 157-184
Andersen, M. M. (2005): Path creation in the making-the case of nanotechnology
Proceedings (online). DRUID 10th Anniversary Summer conference
Anton, W. R. Q.; Deltas, G. & Khanna, M. (2004): Incentives for environmental self-
regulation and implications for environmental performance, Journal of environmental
economics and management, Elsevier, 48, 632-654
Arimura, T. H.; Hibiki, A. & Katayama, H. (2008): Is a voluntary approach an effective
environmental policy instrument? : A case for environmental management systems
Journal of Environmental Economics and Management, Elsevier, 55, 281-295
Ashford, N. (1993): Understanding Technological Responses of Industrial Firms to
Environmental Problems: Implications for Government Policy (chapter)
Belin, J.; Horbach, J. & Oltra, V. (2011): Determinants and specificities of eco-innovations--
an econometric analysis for the French and German industry based on the Community
Innovation Survey, Groupe de Recherche en Economie Théorique et Appliquée
Blackman, A. (1999): The economics of technology diffusion: implications for climate policy
in developing countries, Resources for the Future
Bleischwitz, R.; Bahn-Walkowiak, B.; Irrek, W.; Schepelmann, P.; Schmidt-Bleek, F.;
Giljum, S.; Lutter, S.; Bohunovski, L.; Hinterberger, F.; Hawkins, E. & others (2009): Eco-
innovation-putting the EU on the path to a resource and energy efficient economy, Wuppertal
Spezial, Wuppertal Institut für Klima, Umwelt und Energie
Carrillo-Hermosilla J., d. R. P. & Könnölä, T. (2010): Diversity Of Eco-Innovations:
Reflections From Selected Case Studies, Journal of Cleaner Production , 18 ,1073 – 1083
Cawsey, D. C. (1996): Influencing the future through innovations in environmental
engineering education, European journal of engineering education, Taylor & Francis, 21,
393-402

60 | P a g e
Christensen, C. (2013): The innovator's dilemma: when new technologies cause great firms
to fail, Harvard Business Review Press
European Commission (2001): EU Socio-Economic Research, The Impact of Clean
Production on Employment in Europe – An Analysis using Surveys and Case Studies
(IMPRESS), Final Report, No: SOE-1-CT-98-1106
European Commission (2004): Stimulating Technologies for Sustainable Development:
An Environment Technologies Action Plan for the European Union (ETAP). COM
(2004), 38 final, Brussels.
Fischer, C.; Parry, I. W. & Pizer, W. A. (2003): Instrument choice for environmental
protection when technological innovation is endogenous, Journal of Environmental
Economics and Management, Elsevier, 45, 523-545
Foxon, T.; Gross, R.; Heptonstall, P.; Pearson, P. & Andersron, D. (2007): Energy
Technology Innovation: A System Perspective, Report for the Garnaut Climate Change
Review
Frondel, M.; Horbach, J. & Rennings, K. (2007): End-of-pipe or cleaner production? An
empirical comparison of environmental innovation decisions across OECD countries,
Business Strategy and the Environment, Wiley Online Library, 16, 571-584
Fussler, C. & James, P. (1996): Driving eco-innovation: a breakthrough discipline for
innovation and sustainability, Pitman London
Green, K.; McMeekin, A. & Irwin, A. (1994): Technological trajectories and R&D for
environmental innovation in UK firms, Futures, Elsevier, 26, 1047-1059
Greenstone, M. (2002): The Impacts of Environmental Regulations on Industrial
Activity: Evidence from the 1970 and 1977 Clean Air Act Amendments and the
Census of Manufactures, Journal of Political Economy, University of Chicago Press, vol.
110(6), pages 1175-1219.
Hemmelskamp, J. (1997): Environmental policy instruments and their effects on innovation,
European Planning Studies, Taylor & Francis, 5 ,177-194

61 | P a g e
Hitchens, D. (2003): Small and Medium Sized Companies in Europe: Environmental
Performance, Competitiveness and Management: International EU Case Studies
Springer
Jaffe, A. B.; Newell, R. G. & Stavins, R. N. (2002): Environmental policy and technological
change, Environmental and resource economics, Springer, 22, 41-70
Jaffe, A. B.; Newell, R. G. & Stavins, R. N. (2002): Environmental policy and technological
change, Environmental and resource economics, Springer, 22 ,41-70
Jänicke, M. & Jacob, K. (2005): Ecological modernisation and the creation of lead markets,
Towards environmental innovation systems, Springer, 175-193
Johnstone, N.; Labonne, J. & Thevenot, C. (2008): Environmental policy and economies of
scope in facility-level environmental practices
Kemp, R. & Andersen, M. M. (2004): Strategies for eco-efficiency innovation
Strategy paper for the EU Informal Environmental Council Meeting, 16-18
Kemp, R. & Foxon, T. (2007a): Typology of eco-innovation, Project Paper: Measuring Eco-
Innovation, 1-24
Kemp, R. & Foxon, T. (2007b): Eco-innovation from an innovation dynamics perspective,
Proyecto Measuring Eco-innovation (MEI)
Kemp, R. & Pearson, P. (2007): Final report MEI project about measuring eco-innovation,
UM Merit, Maastricht, 10
Kemp, R. & Volpi, M. (2008): The diffusion of clean technologies: a review with suggestions
for future diffusion analysis, Journal of Cleaner Production, Elsevier, 16, S14-S21
Kemp, R. (1997): Environmental policy and technical change
Kemp, R.; Arundel, A. & Smith, K. (1998): Survey indicators for environmental innovation,
Idea
Khanna, M. & Damon, L. A. (1999): EPA's voluntary 33/50 program: impact on toxic
releases and economic performance of firms, Journal of environmental economics and
management, Elsevier, 37, 1-25

62 | P a g e
Kleinknecht, A. & Mohnen, P. A. (2002): Innovation and firm performance: econometric
explorations of survey data, Palgrave New York,
Kline, S. J. & Rosenberg, N. (1986): An overview of innovation, The positive sum strategy:
Harnessing technology for economic growth, National Academy Press Washington, DC, 275,
305
Leitner, A.; Wehrmeyer, W. & France, C. (2010): The impact of regulation and policy on
radical eco-innovation: The need for a new understanding, Management Research Review,
Emerald Group Publishing Limited, 33, 1022-1041
Mairesse, J. and Robin, S. (2012): The Importance of Research for Innovation and
Productivity: Comparing Different Estimators of the Innovation Production Function,
Chapter 6 in Innovation and Growth: From R&D Strategies of Innovating Firms to Economy-
wide Technological Change, Andersson, Johansson, Karlsson and Lööf (Eds), Oxford
University Press, 368 p.
Mansfield, E. (1968): Industrial research and technological innovation; an econometric
analysis
Moore, G. A. (2002): Crossing the chasm, Capstone
OECD (1997): The Measurement of Scientific and Technological Activities: Proposed
Guidelines for Collecting and Interpreting Technological Innovation Data: Oslo Manual,
OECD
OECD (2005): Oslo manual: Guidelines for collecting and interpreting innovation data,
OECD publishing
OECD (2009): Sustainable Manufacturing and Eco-innovation: Framework, Measurement
and Industry and policy practices, OECD
Oltra, V. (2008): Environmental innovation and industrial dynamics: the contributions of
evolutionary economics, Cahiers du GREThA, Groupe de Recherche en Economie Théorique
et Appliquée, 28 ,27
Passet, R. (1979): L'économique et le vivant, Payot, 23

63 | P a g e
Pavitt, K. (1984): Sectoral patterns of technical change: towards a taxonomy and a theory,
Research policy, Elsevier, 13, 343-373
Popp, D. (2009): Policies for the development and transfer of eco-innovations: Lessons from
the literature, OECD Publishing
Porter, M. (1991): America's Green Strategy, Scientific American, 264, 168
Porter M., E. & Van der Linde, C. (1995): Toward a new conception of the environment-
competitiveness relationship, The journal of economic perspectives, JSTOR, 97-118
Potoski, M. & Prakash, A. (2005): Covenants with weak swords: ISO 14001 and facilities'
environmental performance, Journal of policy analysis and management, Wiley Online
Library, 24, 745-769
Rehfeld, K.-M.; Rennings, K. & Ziegler, A. (2007): Integrated product policy and
environmental product innovations: an empirical analysis, Ecological Economics, Elsevier,
61, 91-100
Reid, A. & Miedzinski, M. (2008): Eco-innovation, Final report for sectoral innovation
watch, Technopolis
Rennings, K. (1998): Towards a Theory and Policy of Eco-Innovation-Neoclassical and (Co-
Evolutionary Perspectives, ZEW Discussion Papers
Rennings, K. (2000): Redefining innovation—eco-innovation research and the contribution
from ecological economics, Ecological economics, Elsevier, 32 ,319-332
Rennings, K. & Rammer, C. (2009): Increasing energy and resource efficiency through
innovation: an explorative analysis using innovation survey data ZEW Discussion Papers
Rennings, K.; Ziegler, A.; Ankele, K. & Hoffmann, E. (2006): The influence of different
characteristics of the EU environmental management and auditing scheme on technical
environmental innovations and economic performance, Ecological Economics, Elsevier, 57,
45-59
Rogers, E. M. (1962): Diffusion of innovations, New York
Rogers, E. M. (1983): Diffusion of innovations, New York

64 | P a g e
Rogers, E. M. (1995): Diffusion of innovations, New York,
Rogers, E. M. (2010): Diffusion of innovations, Simon and Schuster,
Speirs, J.; Pearson, P. & Foxon, T. (2008): Adapting innovation systems indicators to assess
eco-innovation, Date Accessed: January, 4, 2012
Tressel, T.; Kandel, N.; Thoraval, L.; Oosterhuis, F.; Shaw, B. & Ekins, P. (2007): Designing
environmental policy to be innovation friendly, Final Report Edited by Yves Tressel
Ziegler, A. & Nogareda, S. (2009): Environmental management systems and technological
environmental innovations: Exploring the causal relationship
Research Policy, Elsevier, 38, 885-893

65 | P a g e
Chapter 2
Voluntary environmental standards: A new strategy to
promote greener business?

66 | P a g e

67 | P a g e
Table of Contents
1. Introduction .......................................................................................................................... 71
2. Environmental Management Systems and ISO 14001 standards ........................................ 73
2.1. A brief history ....................................................................................................... 73
2.2. Requirements to adopt an EMS ............................................................................ 73
2.3. EMS, Firm performance and the Porter hypothesis .............................................. 74
3. Data and Research Methodology ......................................................................................... 76
3.1. Data ....................................................................................................................... 76
3.1.1. Dependent variable and Treatment group .............................................. 78
3.1.2.Explanatory variables and Descriptive statistics ..................................... 80
3.2. Methodology ......................................................................................................... 84
3.2.1. Propensity Score Matching and Fully Interacted Linear Matching ...... 84
4. Econometric Results ............................................................................................................ 85
4.1. Estimations obtained with PSM ........................................................................... 85
4.2. PSM Estimates of the ATT ................................................................................... 90
4.3. Robustness of the Matching Method ................................................................... 91
5. Conclusion ........................................................................................................................... 92

68 | P a g e

69 | P a g e
Voluntary environmental standards: A new strategy to promote greener business?
Abstract
The direct impact of Environmental Management System (EMS) on firms‘ business
performance is still a debated issue. The aim of this research is to identify the organisational
capabilities of firms that facilitate the adoption of ―ISO 14001 type‖ standards and the impact
of their adoption on (early and late) adopters‘ business performance. The business
performance of a firm is measured through Total Value Added (hereafter VA). This empirical
analysis is based on firm-level data acquired from a large French survey (COI 2006) matched
with administrative data, comprising 11,168 manufacturing and service firms. Empirical
results obtained by the Propensity Score Matching (PSM) and Fully Interacted Linear
Matching (FILM) methods showed that a firm‘s structural characteristics, organisational
capabilities, business market and technological complexity are some of the factors that have a
significant impact on a firm‘s propensity to adopt voluntary EMSs. We also showed that the
respective marginal effect of these factors may differ between the early and late adopters of
the EMSs. Last but not least, we observed that the adoption of voluntary EMSs may have a
significant impact on adopters‘ VA but we did not observe any significant difference between
the early and late adopters of the standards with respect to return on VA.

70 | P a g e

71 | P a g e
1. Introduction
The Porter Hypothesis (PH) (Porter and van der Linde, 1991; 1995) is one of the most
investigated issues within the environmental innovation (eco-innovation) literature. Many
economists and policy makers give considerable attention to the claims of the Porter
Hypothesis as it has challenged the foundations of the established opinion in regards to the
relationship between environmental regulations, innovativeness and firm performance.
According to one of the first assumptions of this hypothesis, firms are not profit maximizing
organisations, hence they are not able to capture available market opportunities without
proper and well-designed environmental policies and regulations. These environmental
policies and regulations assume to help organisations in reducing their carbon foot-print
through environmental innovations. More precisely the PH postulates that;
“[r]educing carbon foot-print (or pollution) is often coincident with improving
productivity with which resources are used and strict environmental standards can
encourage innovations that increase competitiveness. Thus, the right environmental policies
can greatly reduce the costs of environmental policies and can even make companies more
profitable by creating “win-win” opportunities through environmental regulation, where
simultaneously pollution is reduced when having an increase in productivity (Porter and van
der Linde, 1991, 1995).
Even though the predictions of the PH sound appealing, the hypothesis has been heavily
criticized by many scholars (i.e. Palmer, Oates and Portney, 1995). The main criticisms relate
to the fact that the hypothesis is based on case studies, hence far from generalization, and
incompatibility with the assumption that firms are profit maximizing firms. Therefore,
researchers have generally disaggregated the PH into its component parts (―weak21
‖,
―narrow‖ and ―strong22
‖ versions) in order to test the theory and collect empirical evidence.
This research distinguishes itself from the existing empirical investigations by testing the
validity of the ―narrow‖ version of the PH, which argues that flexible regulatory policies give
firms greater incentives to innovate and thus are better than prescriptive forms of regulation
(Jaffe and Palmer, 1997).
21
The ―weak‖ version of the hypothesis claims that properly designed environmental regulation may spur
innovation. 22
The ―strong‖ version of the hypothesis claims that properly designed environmental regulation may spur
innovation.

72 | P a g e
Accordingly, in the first step of our investigation we try to identify the structural
characteristics and organisational capabilities of firms that facilitate the adoption of voluntary
Environmental Management Standards (EMS). In the second step, we examine the impact of
voluntary EMS adoption (i.e., ISO 14001 and Eco-Management and Audit Scheme (EMAS)
– type standards) on (early and late) adopters‘ business performance. A firm‘s business
performance is measured by its Total Value Added with factor costs (hereafter VA). These
types of voluntary standards are considered as the most efficient tools in order to support the
market-based instruments (i.e. tradable permits, emission taxes, subsidies etc.) as they do not
impose environmental performance requirements but helping organisations to form their own
EMS. In addition, they do not aim at improving adopters‘ business performance. However,
they may help firms to introduce product improvements, to reduce their carbon foot-print and
input cost, and increase employee, consumer, investor, shareholder and insurer trust by
reflecting environmentally friendly image (ISO23
). This ‗greener‘ image may also provide
substantial marketing advantages to capture additional market share, provide access to green
markets, reduce insurance charges and input costs, which in turn may have a significant
impact on a firm‘s business performance. Some recent investigations (i.e., Hart and Ahuja,
1996; Newell et al., 1999; Berman and Bui, 2001; Konar and Cohen, 2001) show that there
may be a significant relationship between environmental regulations and a firm‘s business
performance but the impact of the regulation depends on different factors such as regulation
stringency of environmental regulation, timing of regulation, measure of business
performance etc. In this research, we explicitly introduced a distinction between the ‗early‘
and ‗late‘ adopters of voluntary EMS depending on the adoption date. This type of distinction
is non-existent in the eco-innovation literature and thus, it is one of the most significant
added-values of this research. The data constraint for the empirical analyses is acknowledged
as a common problem for eco-innovation studies. To tackle this problem the empirical
analysis is based on firm-level data acquired from a large French survey (COI 2006,
Organisational Changes and Computerization) matched with administrative data (EAE, The
Annual Enterprise Survey). This new dataset comprises 11,168 manufacturing and services
firms, and it allows us to investigate all significant differences between relatively ―early‖ and
―late‖ adopters of voluntary EMSs. This paper is organized as follows. Section 2, reviews the
related literature of EMS and provides insights about the relationship between the EMS and
the PH. We present our data and discuss our research methodology in section 3. We will
23
International Organization for Standardization

73 | P a g e
present the econometric results in section 4 and finally, in section 5, we draw some
conclusions and offer direction for further research.
2. Environmental Management Systems and ISO 14001 Standards
2.1. A brief history
EMS is a management structure that provides firms with a framework to minimise their
environmental impact, ensure compliance with environmental laws and regulation, and
reduce wasteful uses of natural resources. EMS could be integrated in a firm‘s daily operation
via different environmental standards (e.g. ISO 14001, EMAS - Environmental Management
and Audit Scheme, Responsible Care, etc.). These central Voluntary Environment
Programmes (VEPs) are unilateral agreements by firms regarding EMS and the most
important program in this respect is the ISO 14001 (Ziegler and Nogareda, 2009). This
standard is part of ISO‘s environmental management standards family (ISO 1400) and it
helps organisations to form their own EMS. They are considered as one of the most efficient
tools to support the market-based instruments (i.e. tradable permits, emission taxes, subsidies
etc.) and they do not impose environmental performance requirements (Khanna and Damon,
1999; Alberini and Segerson, 2002). This feature of the standards ensure that organisations
are responsible for setting their own environmental targets and make the standards applicable
to wide variety of organisations, in size and in occupation, (such as; manufacturing
companies, branch offices, plants, construction sites, refineries, administration centres, etc.).
2.2. Requirements to adopt an EMS
Implementation of an EMS requires several steps to be taken and successful
implementation of the standard depends on how well the ‗Plan, Do, Check, Act (PDCA)‘
model is applied. The main components of the standards include 1) environmental policy, 2)
performance goals: objectives and targets, 3) environmental programs: action plan to meet
objectives, 4) roles and responsibilities, 5) training and awareness, 6) communication—
internal and external, 7) documentation of the system, including procedures or operational
controls, 8) monitoring, measurement and record keeping, 9) procedures for corrective and
preventive action, 10) Environmental Management System audits and 11) management
reviews (adapted from ISO24
). Capturing the potential advantages of the ISO 14001 standards
24 Environmental Management Systems, Requirements with Guidance for Use, ISO 14001

74 | P a g e
depends on a firm‘s capabilities (structural, organisational, technical, networking etc.) to
detect and reduce its eco foot-print. Therefore, these steps make sure that the organisations
identify and minimise the negative effect of their operations, comply with existing laws and
continually improve in the above. Darnall et al. (2001) assert that basically the
documentation requirements of the standard itself may increase firms‘ understanding of how
their operations affect the natural environment. Hence, following these requirements may
cause firms to systematically analyse some of their environmental impacts for the first time
and lead them to consider their impacts related to various inputs and their production process.
2.3. EMS, firm performance and the Porter hypothesis
EMS is not designed to improve a firm‘s business performance. However, the
relationship between the EMS and firm performance is a significant research question as its
potential advantages can benefit industries and society at large. If successfully implemented,
the standard may provide substantial financial return via different channels. For example;
firms may reduce input cost (raw materials, energy, water, labour), mitigate environmental
liability and create a sustainable brand image that can attract new customers and/or reduce
trade barriers to reach certain markets (i.e. European markets). Some studies claim that
welfare gain of environmental policy instruments depends on different sets of circumstances
(Fischer et al. 2003) (i.e. on the number of polluting firms, the costs of an innovation and the
costs of imitating an innovation) and none of the policy instruments is generally preferable
when the endogeneity of technological progress is taken into account, as is done in
evolutionary economics as well as in the new institutional and growth theory (Rennings and
Rammer, 2009). According to Hart and Ahuja (1996) there is a positive relationship between
emissions reductions and financial performance. However, there is a two-year lag until
financial performance benefits are reaped. Newell et al. (1999) showed that environmental
regulations may indeed induce energy efficient eco-innovations. By estimating the impact of
local air pollution regulation on abatement investment, Berman and Bui (2001) showed that
heavily regulated firms face Total Factor Productivity increases compared to non-regulated
ones. However, Konar and Cohen (2001) claimed that legally emitted toxic chemicals have a
significant effect on the intangible asset value of publicly traded companies and, therefore, on
their future performance. Furthermore, some empirical investigations (Delmas and Pekovic,
2013, Frondel et al., 2007) show that even implementing an EMS may have a positive effect
on a firm‘s performance such as improving internal efficiency, reducing costs or enhancing
the firm‘s reputation and providing access to green markets. Hence, the adoption of an EMS

75 | P a g e
may allow a firm to decrease their environmental liabilities while having an increase in their
performance, which is called ―win-win‖ opportunity for firms. The ―win-win‖ opportunity
through environmental regulation was first proposed by the Porter Hypothesis. Based on case
studies, the PH asserts that strict environmental regulations may help firms to exploit existing
market opportunities via development and/or adoption of eco-innovations, and the cost of the
regulation might be mitigated with the productivity gains that can be accrued through
realized/adopted eco-innovation (Porter, 1991; Porter and van der Linde, 1995). Nevertheless,
even after two decades, the literature does not provide clear evidence to support or contradict
the PH. Ambec et al. (2013) states that empirical studies that test the validity of the PH
generally fall into three categories: those testing the ―weak‖ version of the hypothesis, those
testing a ―strong‖ version focused on firm-level performance, and those testing a ―strong‖
version focused on country-level competitiveness. We contribute and extend the discussion
about the PH by investigating another particular case of the hypothesis, namely the ―narrow‖
version of the PH, which argues that flexible regulatory policies give firms greater incentives
to innovate and thus are better than prescriptive forms of regulation (Jaffe and Palmer, 1997).
As mentioned above, EMS is not designed to improve a firm‘s business performance
therefore, mitigating the EMS implementation cost is not the primary aim of this type of
management standards. As the financial return is not guaranteed, identifying the
organisational capabilities of a firm that facilitates the adoption of an EMS and investigating
the impact of this adoption on a firm‘s business performance becomes a highly significant
research question. Many of the previous studies that investigate the determinants of
productivity sensu lato have suffered from several technical difficulties such as lack of
adequate data, missing environmental regulation stringency, timing and firm performance
measures that does not allow for complete empirical investigation. According to Ambec et al.
(2013) some of the researchers have often regressed productivity at time 0 on proxies of
environmental regulation stringency at time 0 as well. Our extensive database, however let us
to overcome this challenge and allow us to consider this time lag between regulation and its
actual effect on firm performance. We therefore, introduced a clear distinction between
relatively ―early‖ and ―late‖ adopters of voluntary EMSs by considering the adoption year.
By doing so, we could identify the relationship between the adoption of an EMS and its
impact on early and late adopters business performance and, provide robust empirical
evidence to support/contradict the ―narrow‖ version of the PH.

76 | P a g e
3. Data and Research Methodology
3.1. Data
This research is based on two data sources. The first one is the French ―Organisational
Changes and, Information and Communication Technologies use 2006‖ (COI 2006) survey.
The COI survey provides a matched employer / employee dataset on organisational change
and ICT use, compiled through the joint efforts of the INSEE (National Institute for Statistics
and Economic Studies), DARES (Ministry of Labour) and CEE (Centre for Labour Studies).
This comprehensive survey contains various questions related to changes and is addressed to
companies and to their employees. The latest survey was conducted in 2006 on a
representative sample (7700 firms) of the population of French firms from all industries
except agriculture, forestry and fishing. Each of these firms filled in a questionnaire
concerning the use of ICT and organisational practises in 2003, in 2006 and during the period
in between. The COI 2006 survey is a retrospective survey in which firms answer in 2006 a
questionnaire that includes questions pertaining to 2003 and to the period in between.
Furthermore, the survey design allows for an easy matching with administrative databases. In
order to obtain information about value added, material expenditures, number of employees
and some other accounting variables, we merged the COI survey with another French
administrative dataset; the Annual Enterprise Survey (EAE). As a result of this merger, we
worked with a panel of 11,168 observations (5584 firms observed in 2003 and in 2006) of
firms with more than 11 employees. We tried to eliminate the outliers by excluding firms that
employ less than 11 employees and have more than 100% annual growth rate (in terms of
totals sales). Table 1 presents ―before merger‖ and ―after merger‖ means and the standard
deviation of all the key variables used in our empirical analyses. The test for differences in
means indicates that merging datasets did not lead to severe selection biases and there aren‘t
any significant changes in mean values of the key variables before and after merger.
Therefore, we can use the merged database for our empirical investigations.

77 | P a g e
Table 1. Summary of key variables before and after merging the datasets
COI COI and EAE
Variables: Mean Std. Dev. Mean Std. Dev. P-value
Firm Size 691,85 3739,84 653,7 3735,85 0,29
Turnover 168558,5 1132874 152650,1 1034387 0,21
Firm part of a Group in 2006 0,34 0,48 0,35 0,48 0,38
Firm part of a Group in 2003 0,36 0,48 0,36 0,48 0,37
Firm active in Local or Regional markets in
2006 0,13 0,34 0,13 0,34 0,48
Firm active in National market in 2006 0,3 0,46 0,3 0,46 0,24
Firm active in European market in 2006 0,54 0,5 0,53 0,5 0,25
Firm active in International market in 2006 0,64 0,48 0,64 0,48 0,41
Firm active in Local or Regional market in 2003 0,14 0,34 0,14 0,34 0,46
Firm active in National market in 2003 0,31 0,46 0,3 0,46 0,2
Firm active in European market in 2003 0,55 0,5 0,55 0,5 0,26
Firm active in International market in 2003 0,65 0,48 0,65 0,48 0,39
Having ISO 9001 certificate in 2006 0,49 0,5 0,47 0,5 0,1
Having ISO 14001certificate in 2006 0,8 0,4 0,79 0,41 0,2
Having ISO 9001 certificate in 2003 0,53 0,5 0,52 0,5 0,08*
Having ISO 14001 certificate in 2003 0,85 0,36 0,84 0,37 0,19
Firm belongs to High-tech. manufacturing 0,03 0,18 0,04 0,19 0,27
Firm belongs to High-medium tech.
manufacturing 0,09 0,29 0,1 0,29 0,16
Firm belongs to Low-medium tech.
manufacturing 0,1 0,3 0,1 0,31 0,14
Firm belongs to Low-tech manufacturing 0,14 0,35 0,15 0,36 0,08*
Firm belongs to Knowledge intensive services 0,18 0,39 0,18 0,38 0,32
Firm belongs to Other services 0,46 0,5 0,44 0,5 0,02*
Disaggregated industry affiliations:
Textile, clothing, accessories 0,02 0,14 0,02 0,15 0,32
Wood 0,01 0,09 0,01 0,09 0,37
Paper and printing 0,03 0,17 0,03 0,17 0,26
Coal, petroleum and nuclear products 0 0,05 0 0,05 0,43
Chemical products 0,03 0,17 0,03 0,17 0,28
Rubber and plastic 0,02 0,15 0,02 0,15 0,31
Non-metallic mineral products 0,02 0,13 0,02 0,13 0,32
Metal and metal products 0,06 0,23 0,06 0,24 0,23
Machinery and equipment 0,03 0,18 0,03 0,18 0,3
Electrical and electronic equipment 0,04 0,19 0,04 0,2 0,28
Transportation equipment 0,02 0,14 0,02 0,15 0,3
Other manufactured products; recycling 0,02 0,13 0,02 0,13 0,34
Electricity, gas and water 0 0,07 0,01 0,07 0,4
Construction 0,07 0,26 0,07 0,26 0,21
Car dealing and repair 0,03 0,16 0,03 0,17 0,27
Wholesale trade 0,08 0,27 0,08 0,27 0,15
Retail trade 0,09 0,29 0,1 0,3 0,13
Hotels and restaurants (horeca) 0,03 0,18 0,04 0,18 0,29
Transportation & communication services 0,09 0,29 0,1 0,29 0,16
Housing and real estate 0,02 0,14 0,02 0,14 0,34
Rental 0,02 0,13 0,02 0,13 0,37
ICT services, R&D 0,04 0,21 0,03 0,18 0,*
Services to firms 0,12 0,32 0,12 0,33 0,09*
Culture, entertainment, sports 0,01 0,1 0,01 0,1 0,45
Financial and insurance services 0,04 0,2 0,04 0,2 0,2

78 | P a g e
3.1.1. Dependent variable and Treatment group
In this research, we used another, rather rare, approach to distinguish ‗early‘ and ‗late‘
adopters of voluntary EMS (see figure A. for systematic representation). Table 2 below
represents frequency of the adopters and non-adopters with respect to observation periods.
According to our approach, firms that already adopted voluntary environmental standards and
obtained the certificates in 2003 are considered ―early adopters‖ and similarly, firms that did
not have the certification in 2003 but obtained the certification between 2003 and 2006 are
considered ―late adopters‖. Firms that did not have an EMS certificate either in 2003 or 2006
are considered non-adopter. In addition, firms that had an EMS certification in 2003 but not
in 2006 are excluded from our sample.
We may assume that a certain amount of time is required before the standards can have
significant effect on firms‘ performance. Empirical evidence (Hart and Ahuja, 1996) assert
that there may be a positive relationship between emissions reductions and financial
performance but one may have to wait as long as two-years to have any significant financial
return. Ambec et al. (2013) claims that in many of the previous studies that investigate the
determinants of productivity, researchers have often regressed productivity at time 0 on
proxies of environmental regulation stringency at time 0 as well, which does not allow time
for the innovation process to occur. Introducing a clear distinction between the early and late
adopters of voluntary EMS therefore, allows us to test this claim. The database does not
distinguish between the standards (i.e. ISO 14001, organic labelling, AB, fair trade, etc.)
since they were put together under the same category in the survey. Nevertheless, the
literature acknowledges that the ISO 14001 environmental standards and EMAS as the most
widely used EMS in the world.

79 | P a g e
Firm has an EMS in 2006?
Yes
No
Firm has an EMS in 2003?
No
Yes
Figure A: Systematic visualisation of the EMS adopters
Non-
adopter
Late
adopter
Early
adopter
Excluded

80 | P a g e
Table 2. Frequency of adopters and non-adopters according observation periods
Yes No
# of early adopter 927 (%15.5) 1248 (%21)
# of late adopter 321 (%5.4) 5661 (%94.6)
Total in both year 1248 (%21) 4734 (%79)
3.1.2. Explanatory Variables and Descriptive Statistics
We are first interested in observing the impact of a firm‘s size on voluntary EMS
adoption decision. We measure the firm size with its actual number of workers. We also
included ―Size²‖ variable, which is measured by taking the square of a firm‘s size. These two
variables together could point out the direction of the relationship between a firm‘s size and
their propensity to adopt the standards. In practice, large firms have higher chances of
securing additional financial resources for innovative activities and they are more likely to be
faced with growing international pressures to clean up their operations and minimize
environmental hazards. Most empirical studies found that the probability of implementing
environmental standards increases with firm size (e.g. Delmas and Montiel, 2009; Grolleau et
al. 2007a, b). However, difficulties in reorganization and stabilization of certain routines, red-
tape, lack of managerial capabilities, complex, costly and the time-consuming nature of the
adoption process should also be accounted for. Firms that are too large may find the adoption
of voluntary EMS unnecessary and its adoption process highly demanding, which in return
may have a significant impact on a firm‘s adoption decision.
Being part of a ―Group‖ is another control variable and it would help us to understand
whether being part of a group gives an advantage when adopting voluntary EMS. According
to Pekovic (2010) and Zyglidopoulos (2002), a group firm may have relatively easier access
to a larger amount of financial resources to invest in new practices. However, having a larger
amount of financial resources is only one side of the coin. We should also consider the
organisational challenges pertinent to large organisations that comprise several sister
companies. Accordingly, the relationship among the parent and sister companies and their
respective organisational, structural, managerial and other characteristics may play significant
role in the adoption decision. Accordingly, if the sister companies are bounded to the parent
company‘s strategic decision-making and general business strategy, being part of a larger
group of firms may also constitute certain organisational issues. Hence, firms may or may not
have to adopt the standards depending on parent company‘s business strategy.

81 | P a g e
We also would like to control for the impact of having other types of quality standards
(ISO 9001) and customer-related services (Labelling and Delivery) on a firm‘s propensity to
adopt voluntary EMS. The ISO 9001 quality standards are one of the most widely used
management tools in the world today and the isomorphic pressures from different countries
and industries makes the adoption of this standard virtually mandatory. By integrating ISO
14001-like standards into the existing ISO 9001 management system, organisations‘
environmental responsibility may become a component of their product quality. Customer
services along with quality standards are the other efficient tools to maintain customer
satisfaction, increase efficiency, reduce time and cost etc. In this research, we assume that a
firm contractually undertaking to deliver or supply goods or services in a fixed deadline
requires a close relation with customers. Such a relation with customers then, may help firms
to obtain feedback and precisely identify customers‘ needs. Corporate reputation can also be
affected by information about an organisation‘s environmental performance (Arora and
Gangopadhyay, 1995; Konar and Cohen, 1997; Marshall and Mayer, 1991). Hence, firms that
have close links with their customers may also have strong incentives to demonstrate
goodwill by adopting and implementing successful environmental management systems
(Nishitani, 2009). We, therefore included three dummy variables to investigate whether a
firm‘s existing experience in implementing i) ISO 9001 quality standards, i)) Labelling
services and iii) Delivery services has any significant impact on a firm‘s decision to adopt
voluntary EMS.
We have also included a categorical variable indicating whether a firm is active in
―National‖, ―European‖ and ―International‖ markets, where the local and regional markets
category is the base category for comparison. By including this variable we aim to observe
the respective significance of different business markets on a firm‘s propensity to adopt
voluntary EMS. Increasing local, national and international pressures to reduce carbon foot-
prints and increasing consumer awareness, especially within the EU markets, created
perceivable pressures on firms to take preventive measures. As a consequence, we may
observe an upward shift in firms‘ behaviour towards the adoption standards, as they may now
consider the adoption a key strategy and a significant advantage to capture additional market
share or to enter new markets.
The industry classification dummies are also included in our econometric model. These
dummies therefore indicates whether a firm is i) High-tech manufacturing, i)) High-medium
tech manufacturing, iii) Low-medium tech manufacturing, iv) Low-tech manufacturing and
v) Knowledge-intensive firm. These categories are identified following the OECD‘s

82 | P a g e
technological levels classification, which is based on the ratio of the total R&D expenditures
in total turnover. These dummy variables then, help us to investigate whether a firm‘s
technological complexity has a significant impact on the adoption decision. We assume that
firms with high technological complexity are more likely to have higher carbon footprint.
Operating at the high technology level generally involves using precise, complex and energy-
intensive technologies and, processing rare materials with the use of toxic and harmful
substances. Therefore, we expect to see a positive relationship between the propensities to
adopt the standards and a firm‘s respective technological complexity.
Table 3. shows the summary statistics on the variables used in the econometric analysis,
while table 4. presents the classification of the technological levels by the industries and their
respective Nace codes.
Table 3. Summary statistics on the variables used in the econometric analysis
Variables used: Mean Std. Dev. Min Max
Firm size (in numbers) 640.4 3611.2 11 116.989
Firm size² (in numbers) 1345 32704.7 0.0121 1368643
Firm part of a Group 0.34 0.47 0 1
Having ISO9001certificate 0.51 0.5 0 1
Having Delivery services 0.69 0.46 0 1
Having Labelling services 0.34 0.47 0 1
Firm active in Local market 0.87 0.34 0 1
Firm active in National market 0.71 0.45 0 1
Firm active in European market 0.47 0.5 0 1
Firm active in International market 0.36 0.48 0 1
Firm belongs to High-tech manufacturing 0.025 0.15 0 1
Firm belongs to High-medium tech. manufacturing 0.095 0.29 0 1
Firm belongs to Low-medium tech manufacturing 0.10 0.31 0 1
Firm belongs to Low-tech manufacturing 0.15 0.36 0 1
Firm belongs to Knowledge intensive sectors 0.15 0.36 0 1

83 | P a g e
Table 4. Aggregated Nace codes according to OECD’s technology classification
Technology
classification
Nace codes
High-technology 24.4 Manufacture of pharmaceuticals, medicinal chemicals and
botanical products
30 Manufacture of office machinery and computers
32 Manufacture of radio, television and, communication equipment
and apparatus
33 Manufacture of medical, precision and optical instruments, watches
and clocks
35.3 Manufacture of aircraft and spacecraft
High-medium-
technology
24 Manufacture of chemicals and chemical product, excluding 24.4
Manufacture of pharmaceuticals, medicinal chemicals and botanical
products
29 Manufacture of machinery and equipment n.e.c
31 Manufacture of electrical machinery and apparatus n.e.c
34 Manufacture of motor vehicles, trailers and semi-trailer
35 Manufacture of other transport equipment, excluding 35.1
Building and repairing of ships and boats and excluding 35.3
Manufacture of aircraft and spacecraft.
Low-medium-
technology
23 Manufacture of coke, refined petroleum products and nuclear fuel
25 to 28 Manufacture of rubber and plastic products; basic metals and
fabricated metal products; other non-metallic mineral products
35.1 Building and repairing of ships and boats.
Low-technology 15 to 22 Manufacture of food products, beverages and tobacco;
textiles and textile products; leather and leather products; wood and
wood products; pulp, paper and paper products, publishing and
printing
36 to 37 Manufacturing n.e.c.
Knowledge-
intensive services
(KIS)
61 Water transport
62 Air transport
64 Post and telecommunications
65 to 67 Financial intermediation
70 to 74 Real estate, renting and business activities
80 Education
85 Health and social work
92 Recreational, cultural and sporting activities

84 | P a g e
3.2. Methodology
3.2.1. Propensity Score Matching and Fully Interacted Linear Matching
The aim of this research is twofold. First, we are interested in discovering the intrinsic
characteristics of firms that may have an impact on the adoption of environmental standards.
Secondly, discovering the causal effect of adoption of environmental standards on the firms
performance (the average effect of treatment on the treated – ATT) through Total Value
Added (VA). Even though, there are several other performance measures such as labour,
material, energy productivity, specific issues and problems call for an appropriate measure of
performance. In our approach, we use a performance indicator to measure efficiency in the
use of resources approximated with total price of sales minus the total production cost
including factor costs (i.e., material cost along with subventions, taxes and subsidies) as the
Porter hypothesis postulates. Therefore, we consider it appropriate to use Total Value Added
(VA) as the relevant measure of performance proxy. In order to check the robustness of our
empirical estimation, we also specified other performance measures i.e. VA / Total turnover.
Nevertheless, the estimation results obtained with alternative dependent variables remains
robust to our main results. Therefore, we will only discuss the results pertinent to our
benchmark model.
In order to estimate the impact of adoption on adopters‘ VA, we need to compare the
average VA of these firms to the average VA that these same firms would have achieved had
they not adopted the standards. However, since a firm either adopts the standards or does not,
the average VA that firm would have achieved had they not adopt the standards remains an
unobserved counterfactual since only one outcome is observed. More precisely, what would
have resulted had the firm not been adopted the standards (treated) cannot be observed, which
gives a rise to the ‗Evaluation Problem‘ (Vandenberghe and Robin, 2004). The evaluation
problem consists in providing unbiased estimates of this average counter-factual through the
use of appropriate methods and usually untestable assumptions (Goodman and Sianesi,
2005). Hence, we used the Propensity Score Matching (PSM) method proposed by
Rosenbaum and Rubin (1983) and further developed by Heckman et al. (1997, 1998). The
matching method is a non-parametric alternative to Instrumental Variable (IV) and Heckman
type models for estimating a causal effect net of endogeneity bias.
In our research, relying on Ordinary Least Square method (OLS) may produce biased
results when considering the fact that there would be some firms adopting the standards,
which are not comparable to the firms in the non-adopting sample. In this sense, performing
85 | P a g e
OLS might hide the fact that we are actually comparing incomparable firms by using the
linear estimation (Goodman and Sianesi, 2005). The propensity score matching method
(PSM) then offers a unique advantage by excluding the firms from the sample that are not
comparable to any other firm in the non-adopting sample, leaving only firms from both group
that have same features and hence, comparable. Even though, the PSM offers certain
advantages over the OLS, we can bring the OLS estimations closer to the PSM estimates by
imposing common support before running the OLS and by allowing the impact of treatment
(in our case adoption) to vary for each observable variable. This technique is generally
referred as Fully Interacted Linear Model (FILM) and it allows the impact of adoption to vary
for each observable variable. This aspect of the FILM allows us to test the presence
heterogeneous return (Goodman and Sianesi, 2005). If the method does not provide evidence
for heterogeneous return, the estimation results will simply coincide with simple OLS.
Hence, both the PSM and FILM methods have been carried out in this research in order to
provide comparability between the estimation results.
4. Econometric Results
4.1. Estimations obtained with PSM
The first step of our empirical analysis is to estimate the propensity score i.e. the
probability of adopting environmental standards on a voluntary basis conditional on
observable control variables that may affect this probability as well as the response variable.
Table 5, below, displays the Probit estimation results obtained by using the PSM as well as
the conditional marginal effects obtained after the PSM. The Probit estimation results are
generally hard to interpret alone, therefore we displayed the marginal affects after the PSM so
that we can interpret the estimation results better.
The estimation results obtained by the PSM imply that a firm‘s size is one of the most
significant firm characteristics and it facilitates the adoption of voluntary EMS. The existing
literature assert that the probability of implementing environmental standards increases with
the firm size (Delmas and Montiel, 2009; Grolleau et al., 2007a, 2007b) and larger
organizations are more likely to possess the knowledge-based skills that may be critical
factors in their capacity to commit to environmental initiatives (Hart and Ahuja, 1996). Our
results, on the one hand, support these claims and show that medium and large size firms are
more likely to adopt voluntary EMS. On the other hand, they point out that propensity to
adopt the standards may decrease as the firm size reaches to a threshold. We can note that

86 | P a g e
size-square (size2) variable has a negative sign, which implies that the relationship between
adoption of these standards and firm size can be represented by an inverted U-shape. The
existence of such a relationship may indicate that some big firms may suffer from certain
implementation problems (i.e., red tape and stabilization of certain routines) hence they may
shy away from the adoption. Moreover, the marginal effects obtained after the PSM imply the
same and show that the marginal effect of a firm‘s size on the adoption decision of voluntary
EMS is significantly higher for the early adopters than the late adopters.
The estimation results also reveal an important insight about the relationship between
voluntary EMS adoption and group ownership. Like medium and large size firms, group
firms or sister companies tend to have significant advantages over individual firms to access
financial resources, human capital and technical capabilities for technology transfer and
knowledge outsourcing. The estimation results show that these potential advantages alone
might not provide sufficient incentives to adopt an EMS. The results obtained by the PSM
show that being a sister company tends to lower a firm‘s propensity to adopt the standards.
We can also note that the marginal impact of being a sister company on the adoption decision
is significant and negative, both for the early and late adopters. We can relate this negative
relationship to the implementation cost inherent in the adoption of voluntary EMS and to the
role of a parent company‘s general business strategy. We presume that individual firms are
more likely to be (relatively) smaller than group firms in terms of firm size and, as we noted
earlier, some big firms may suffer from certain implementation problems that can hinder the
adoption of voluntary EMS. When this is the case, it is reasonable to believe that individual
firms rather than group firms are more likely to adopt and implement the standards. Another
explanation can also be made by assuming that that a parent company‘s organisational and
technical capabilities, general business strategy, environmental consciousness and long-term
strategic thinking may have a direct and significant impact on sister company‘s‘ decision
making. If the sister company has enough managerial space to plan and execute strategic
actions then they may easily choose to adopt the standards. But if the relationship between
the parent company and its sister companies is rather prescriptive, sister companies may leave
little or no space for individual decision making and will have to bound the strategic
decisions (adopting or not adopting the standards) made by the parent company. Our
estimation results show that the second scenario is more likely to occur and left us to
conclude that individual firms, rather than firms that are part of a larger group, are more
likely to adopt the standards.

87 | P a g e
Furthermore, Probit estimation results obtained by the PSM indicate that having other
type of quality standards (ISO 9001) and customer related services (Labelling and Delivery)
may significantly increase a firm‘s propensity to adopt voluntary EMS. On the one hand, we
note that the early adopters tend to have both quality standards and customer related services
and, they are more likely to use their existing experience in implementing these standards.
On the other hand, we observe that the late adopters of voluntary EMS tend to have only
the ISO 9001 quality standard. This may imply that having already one type of quality
standards from a standards family (i.e. ISO 9001 standards) may facilitate the adoption of
another type of standards from the same family (i.e. ISO 14001). Many industries and
countries often adopt ISO 9001-type standards as requirements for doing business, which
makes their adoption virtually mandatory. The isomorphic pressures from industries and
countries might be a significant factor for the adoption of such standards but we should also
consider the role of a firm‘s strategic thinking and general marketing strategy to adopt them.
If efficiently used, a green marketing strategy may help an adopting firm to capture additional
market share and it may even grant access to new markets. Therefore, by looking at the
estimation results, it is reasonable to believe that firms that have existing experience in
implementing such standards and services tend to consolidate their reputation (or even to
improve it) by implementing other types of quality and management standards i.e. ISO 14001
and EMAS - type environmental standards. Moreover, we can also note that the marginal
impact of having these types of quality standards and customer related services on the
adoption of voluntary EMS is significantly higher for the early adopters than the late
adopters. Especially, the marginal impact of having ISO 9001 quality standards is
significantly higher for the early adopters. This result is not a surprise and it attests that
especially the early adopters of voluntary EMS tend to rely on their existing experience in
implementing other type of quality standards.
Besides a firm‘s structural characteristics and organisational capabilities, a firm‘s
business market might be another important factor affecting its decision to adopt and/or when
to adopt voluntary EMS. Unlike ISO 9001 type quality standards, the diffusion of voluntary
EMSs are still in the catching-up phase as their adoption is solely voluntary (ISO 9000 family
is first introduced in 1987 while ISO 14001 EMS was first introduced in 1996). The ISO
14001-type standards are especially flexible (more flexible than EMAS) and applicable to
wide variety of organisations, in size and in occupation, such as companies, branch offices,
construction sites, administration centres etc. However, we expect that firms that are active in
a relatively greater context i.e. International or European markets, are more likely to adopt

88 | P a g e
the standards as the adoption decision might be influenced by the isomorphic pressures from
industries and countries. The Probit estimation results obtained by the PSM imply that being
active in national markets significantly decreases a firm‘s propensity to adopt the standards.
On the contrary, we observe that being active in the European markets tend to be a significant
factor that increases a firm‘s propensity to adopt them. Furthermore, the marginal effects
obtained after the PSM show that the effect of being active in the European markets is
significant and positive only for the early adopters. This has led us to conclude that the
European markets may perceive the environmental standards adoption as a compulsory action
as a result of the isomorphic pressures within industry hence, imposing the adoption of the
standards for certain firms, i.e. early adopters.
Finally, the Probit estimation results obtained by the PSM suggest that a firm‘s
technological complexity may have significant impact on EMSs adoption. We observe that
‗high-medium technology manufacturing‘ firms are more likely to adopt the standards earlier
than the firms within other technological complexity levels. On the contrary, ‗low-tech
manufacturing‘ firms are more likely to adopt the standards relatively later. In addition, the
marginal effects obtained after estimating the PSM indicate that being a high-medium
technology manufacturing firm has a significant and positive impact on the early adoption
decision. This result, at the best, may imply the existence of mimicking behaviour performed
by less hazardous and technologically less complex low-technology manufacturing
companies. We expect that the marginal benefit that the low technology manufacturing firms
that would reap from adopting voluntary EMS tends to be lower when compared to
technologically more complex and more hazardous industries i.e. high-medium technology
manufacturing. Hence, firms within low tech. manufacturing industries might be reluctant to
adopt the standards and might choose the ‗wait and see‘ strategy to observe whether the
standards adoption provide any return, both environment and business performance wise,
before taking the adoption decision. When we consider the fact that the adoption of EMS is
solely voluntary and depend on a firm‘s general business strategy, our results make more
sense. The results also provide important insights about the adoption behaviour of
‗knowledge-intensive services‘ sectors. Accordingly, the results suggest that firms within
‗knowledge-intensive services‘ sectors are less likely to adopt the standards. The marginal
effect of being active in knowledge-intensive services sectors on the adoption decision is also
significant and negative. Given that the knowledge-intensive sectors tend to have less carbon
foot-print compared to the manufacturing industries in general, we have reasons to believe
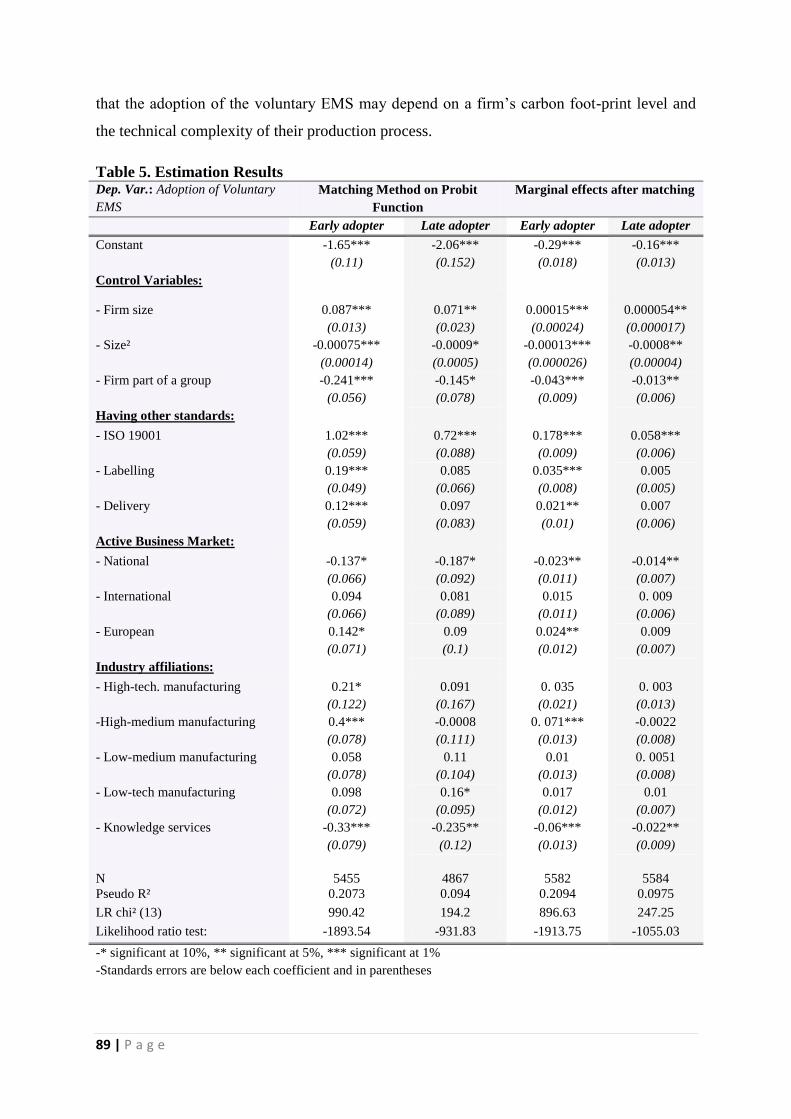
89 | P a g e
that the adoption of the voluntary EMS may depend on a firm‘s carbon foot-print level and
the technical complexity of their production process.
Table 5. Estimation Results Dep. Var.: Adoption of Voluntary
EMS
Matching Method on Probit
Function
Marginal effects after matching
Early adopter Late adopter Early adopter Late adopter
Constant -1.65***
(0.11)
-2.06***
(0.152)
-0.29***
(0.018)
-0.16***
(0.013)
Control Variables:
- Firm size 0.087***
(0.013)
0.071**
(0.023)
0.00015***
(0.00024)
0.000054**
(0.000017)
- Size² -0.00075***
(0.00014)
-0.0009*
(0.0005)
-0.00013***
(0.000026)
-0.0008**
(0.00004)
- Firm part of a group -0.241***
(0.056)
-0.145*
(0.078)
-0.043***
(0.009)
-0.013**
(0.006)
Having other standards:
- ISO 19001 1.02***
(0.059)
0.72***
(0.088)
0.178***
(0.009)
0.058***
(0.006)
- Labelling 0.19***
(0.049)
0.085
(0.066)
0.035***
(0.008)
0.005
(0.005)
- Delivery 0.12***
(0.059)
0.097
(0.083)
0.021**
(0.01)
0.007
(0.006)
Active Business Market:
- National -0.137*
(0.066)
-0.187*
(0.092)
-0.023**
(0.011)
-0.014**
(0.007)
- International 0.094
(0.066)
0.081
(0.089)
0.015
(0.011)
0. 009
(0.006)
- European 0.142*
(0.071)
0.09
(0.1)
0.024**
(0.012)
0.009
(0.007)
Industry affiliations:
- High-tech. manufacturing 0.21*
(0.122)
0.091
(0.167)
0. 035
(0.021)
0. 003
(0.013)
-High-medium manufacturing 0.4***
(0.078)
-0.0008
(0.111)
0. 071***
(0.013)
-0.0022
(0.008)
- Low-medium manufacturing 0.058
(0.078)
0.11
(0.104)
0.01
(0.013)
0. 0051
(0.008)
- Low-tech manufacturing 0.098
(0.072)
0.16*
(0.095)
0.017
(0.012)
0.01
(0.007)
- Knowledge services -0.33***
(0.079)
-0.235**
(0.12)
-0.06***
(0.013)
-0.022**
(0.009)
N 5455 4867 5582 5584
Pseudo R² 0.2073 0.094 0.2094 0.0975
LR chi² (13) 990.42 194.2 896.63 247.25
Likelihood ratio test: -1893.54 -931.83 -1913.75 -1055.03
-* significant at 10%, ** significant at 5%, *** significant at 1%
-Standards errors are below each coefficient and in parentheses

90 | P a g e
4.2. Average Treatment Effect on the Treated (ATT)
In order to provide robust empirical evidence to support/contradict the PH, the second
step of our empirical analysis involves in estimating the average treatment effects on the
treated (i.e. the impact of environmental standards adoption on Total Value Added). We
calculated the ATT given the propensity scores calculated as predictions of the Probit models
estimated. The dependent variable for the ATT is log of total value added indicated by VA
(total price of sales minus total production costs) as the PH postulates. Table 6 below reports
the results of the ATT estimations. In order to provide a robustness check of our primary
estimation method, namely the PSM, table 6 also presents the ATT results obtained by using
the FILM method.
Table 6. Average Treatment Effect on the Treated (ATT) obtained from PSM and
FILM Dep. Var.: Total Value
Added Propensity Score Matching
(PSM)
Fully Interacted Linear Matching
(FILM)
Early adopter Late adopter Early adopter Late adopter
ATT 0.49***
(0.07)
0.51***
(0.1)
0.38***
(0.076)
0.28***
(0.071)
On support (untreated) 4588 4602 9995 9995
On support (treated) 867 264 1173 1172
Off support (treated) 0 1 0 1
N 5455 4867 11168 11168
-* significant at 10%, ** significant at 5%, *** significant at 1%
-Standards errors are below each coefficient and in parentheses
The ATT results calculated by the FILM estimation indicate that adoption of voluntary
EMS has a significant impact on a firm‘s Total Value Added (VA). The ATT‘s coefficient is
significant and has positive sign while the impact of the adoption on firms‘ total value added
is slightly higher for the early adopters.
The ATT calculated by the PSM estimation is also in line with the results obtained by the
FILM estimation but with a slight difference in the coefficients. According to our benchmark
approach, the adoption of voluntary EMS may reveal slightly higher VA for the late adopters.
However, the difference takes place in the last decimal of the calculated coefficient and it
might be attained to computational differences between these two approaches. Therefore, the
estimation results may point out that adoption voluntary EMS may indeed increase a firm‘s
business performance through VA, regardless of the adoption year. These results are

91 | P a g e
especially important for establishing the validity of the narrow version of the Porter
hypothesis and they provide us a preliminary proof for ―win-win‖ situation. Even though, we
could not find significant difference between the early and late adopters of voluntary EMS in
terms of financial performance that they can reap. The voluntary EMS can be efficient tools
to decrease a firm‘s environmental liabilities while enabling them to reap competitive
advantage. Even though increasing firms‘ business performance and competitiveness is not
the primary aim of ISO 14001 type standards, lesser environmental liability, reduced input
costs, environmentally friendly image and, increased employee, consumer, investor,
shareholder and insurer trust might enable firms to increase their VA. We can conclude this
section by asserting that the ―win-win‖ opportunity indeed exists even without relying on the
strict environmental regulations. However, in order to reach a certain level of global
environmental efficiency the number of adopting firms should be augmented rapidly. In order
to do so, the policy makers should efficiently use their communication channels to explain
the environmental and economic impact of voluntary EMS and, assist them through their
transition to become less environmentally hazardous and more profitable organisations.
4.3. Robustness Test of the Matching Method
The next step of the matching method is to check whether or not the ―balancing
property‖ is achieved. Accordingly, we will control whether the propensity score effectively
balances characteristics between the treatment and comparison group. If the balancing
property is achieved, we are confident that the bias associated with observable characteristics
is reduced. Table 7 presents the balancing tests that are performed for the two groups,
―adopter‖ versus ―non-adopter‖. In addition to reporting the mean values of the groups and
the t-statistics, we also report the standardised difference, that is, the size of the difference in
means of a conditioning variable (between the treatment and comparison units), scaled by (or
as a percentage of) the square root of the average of their sample variances.

92 | P a g e
Table 7. Summary statistics on the choice of variables before and after matching
Adopter vs. Non-
adopter
Before matching After matching
Variables Treated
(adopter)
Control
(non-
adopter)
t-test Treated Control t-test % reduction
in bias
ISO 9001 0.9 0.42 27.8*** 0.9 0.89 0.68 97.9
Group 1.16 1.39 -12.41*** 1.16 1.17 0.49 96
Delivery 0.84 0.65 11.05*** 0.84 0.84 0.01 9.99
Size 1590.1 464.1 8.5*** 1590.1 1254.1 1.14 70
Size²
0.005 0.0067 3.45*** 0.0049 0.0031 0.7 58.2
Local 0.78 0.88 -7.74*** 0.78 0.76 0.7 85.8
National 0.82 0.69 7.66*** 0.82 0.81 0.52 92.5
European 0.67 0.43 13.66*** 0.67 0.67 0.12 99
International 0.56 0.32 13.98*** 0.56 0.57 0.34 96.7
High-tech man &
High-medium man.
0.29 0.096 16.38*** 0.29 0.32 1.03 88.5
Low-medium man.
& Low-tech man.
0.32 0.26 3.41*** 0.32 0.31 0.55 78.2
Knowledge services 0.08 0.18 -7.07*** 0.08 0.086 -0.21 97
- * Significant at 10%, ** significant at 5%, *** significant at 1%
Before-matching results show that there is clearly an imbalance between the treated and
the control groups. All t-statistics are highly significant indicating that the null hypothesis of
joint equality of means in the matched sample is rejected. By contrast, in the after-matching
results, we clearly see that the differences are no longer statistically significant therefore, we
are confident that our matching significantly reduced bias.
5. Conclusion
Since it was first introduced the Porter Hypothesis (Porter and van der Linde, 1991,
1995) has been subject to various empirical investigations to prove or disprove its validity.
Many researchers have generally disaggregated the PH into its component parts (―weak‖,
―narrow‖ and ―strong‖ versions) in order to test the theory and collect empirical evidence (see
Jaffe and Palmer, 1997). According to Ambec et al. (2013) empirical investigation of the PH
generally fall into three categories: those testing the ―weak‖ version of the hypothesis, those
testing a ―strong‖ version focused on firm-level performance, and those testing a ―strong‖
version focused on country-level competitiveness. This research distinguishes itself from the
existing empirical investigation in several ways. First of all, it tries to identify the drivers of

93 | P a g e
voluntary EMS adoption from firms‘ organisational capabilities perspective. Accordingly, we
try to find out whether a firm‘s structural characteristics and organisational capabilities
facilitate ―early and/or late‖ adoption of voluntary EMSs. In the second step, we investigate
the validity of the ‗narrow‘ version of the PH, which argues that flexible regulatory policies
give firms greater incentives to innovate and thus are better than prescriptive forms of
regulation (Jaffe and Palmer, 1997). Following this claim the second step of our analyses
consists in examining the impact of voluntary EMS adoption (i.e., ISO 14001 and Eco-
Management and Audit Scheme (EMAS) – type standards) on early and late adopters‘
business performance. In our approach, we use a performance indicator to measure efficiency
in the use of resources - total price of sales minus the total production cost that is Total Value
Added (VA) - as the PH postulates. The last contribution of this paper has to do with
classification of the adopters of voluntary EMS which is one of the most significant added-
values of this research. We explicitly introduced a distinction between the ‗early‘ and ‗late‘
adopters of the standards depending on the adoption year. By doing so, we can investigate
potential differences (in terms of organisational capabilities and structural characteristics and,
return on VA) between the early and late adopters of voluntary EMS. To our knowledge, this
type of distinction is non-existent in the eco-innovation literature and therefore, it is a
significant contribution to existing the eco-innovation literature.
The results obtained in the first step of our empirical analyses show that a firm‘s
structural characteristics organisational capabilities, business market and technological
complexity are some of the factors that facilitate the adoption of voluntary EMS. Moreover,
we also showed that the respective marginal effect of these factors may differ between the
early and late adopters of the EMS. More precisely, we observe that medium and big size
firms are more likely to adopt the standards but the results also suggest that some big firms
may suffer from certain implementation problems due to i.e. red tape and stabilization of
certain routines. Having established ISO 9001 quality standards and customer related services
(i.e. labelling and delivery services) are the other significant factors that facilitate the
adoption of voluntary EMS. Moreover, the results indicate that having existing experience in
implementing such standards and services can greatly affect a firm‘s decision to adopt the
standards in a relatively earlier stage. In the same vein, we assert that being active in
European markets can be a significant factor for voluntary EMS adoption. We associate this
result with the isomorphic pressures from industries and countries that makes the adoption of
EMS virtually a mandatory action to survive within highly competitive and environmentally
conscious European markets. The marginal impact of being active in European markets is
94 | P a g e
statistically significant and positive for the early adopters, which supports our deduction to a
great extent. Finally, the results stress the importance of a firm‘s technological complexity as
a driver to adopt voluntary EMS. Accordingly, high-medium technology manufacturing firms
(R&D / Total turnover ratio is between 5% and 3%) are more likely to adopt the standards
earlier, while Low technology firms (R&D / Total turnover ratio is between 0.09% and 0%)
are more likely to adopt the standards in a later stage.
In the second step, we showed that the adoption of voluntary EMS may have a
significant impact on adopters‘ VA. Furthermore, we did not observe any significant
difference between the early and late adopters of the standards with regards to return on VA.
We tried to ensure the reliability of the results by performing robustness check with the use of
alternative estimation method (namely, Fully Interacted Linear Model) and highlighted that
the empirical results obtained with this approach are robust to the results obtained by
Propensity Score Matching method. In short, we concluded this research paper by asserting
that even though government intervention through environmental regulations are still the
most important factor leading firms to lower their hazardous impact on environment, the
voluntary environmental standards may be a good complement for market-based instruments
(such as tradable permits, emission taxes, subsidies etc.) and, command and control
mechanisms to increase firms‘ economic performance while becoming greener. Hence, the
policy setting institutions should use this opportunity to communicate and explain positive
economic and social gains that could be reaped from the adoption of environmental
standards. By doing so, a domino effect could be launched and the number of adopters could
be multiplied while leading to less environmentally hazardous and more profitable
organisations, enabling them to enjoy the ―win-win‖ opportunity as the narrow version of the
Porter Hypothesis postulates.

95 | P a g e
References for Chapter Two
Alberini, A. & Segerson, K. (2002): Assessing voluntary programs to improve environmental
quality, Environmental and Resource Economics 22(1-2), 157--184.
Ambec, S.; Cohen, M. A.; Elgie, S. & Lanoie, P. (2013): The Porter Hypothesis at 20: Can
Environmental Regulation Enhance Innovation and Competitiveness? Review of
Environmental Economics and Policy, Oxford University Press, Res 016
Arora, S. & Gangopadhyay, S. (1995): Toward a theoretical model of voluntary over
compliance, Journal of economic behavior & organization 28(3), 289--309
Berman, E. & Bui, L. T. (2001): Environmental regulation and productivity: evidence from
oil refineries, Review of Economics and Statistics, MIT Press, 83, 498-510
Delmas, M. & Montiel, I. (2009): Greening the supply chain: when is customer pressure
effective?, Journal of Economics & Management Strategy 18(1), 171--201
Delmas, M. A. & Pekovic, S. (2013): Environmental standards and labor productivity:
Understanding the mechanisms that sustain sustainability, Journal of Organizational
Behavior, Wiley Online Library, 34, 230-252
Frondel, M.; Horbach, J. & Rennings, K. (2007): End-of-pipe or cleaner production? An
empirical comparison of environmental innovation decisions across OECD countries,
Business Strategy and the Environment 16(8), 571--584
Goodman, A. & Sianesi, B. (2005): Early Education and Children's Outcomes: How Long
Do the Impacts Last?, Fiscal Studies 26(4), 513--548
Grolleau, G.; Mzoughi, N. & Pekovic, S. (2007a): The characteristics of chemical firms
registering for ISO 14001 or Responsible Care, Economic Bulletin 12(29), 1--13
Grolleau, G.; Mzoughi, N. & Thomas, A. (2007b): What drives agrifood firms to register for
an Environmental Management System?, European Review of Agricultural Economics 34(2),
233--255
Hart, S. L. & Ahuja, G. (1996): Does it pay to be green? An empirical examination of the
relationship between emission reduction and firm performance, Business strategy and the
Environment 5(1), 30--37
96 | P a g e
Heckman, J. J. (1979): Sample selection bias as a specification error, Econometrica: Journal
of the econometric society, 153--161
Heckman, J., Ichimura, H. and Todd, P. (1997): Matching as an econometric evaluation
estimator: Evidence from evaluating a job training program, Review of Economic Studies,
64(4), 605
Heckman, J. J.; Ichimura, H. & Todd, P. (1998): Matching as an econometric evaluation
estimator, The Review of Economic Studies, Oxford University Press, 65, 261-294
Jaffe, A. B. & Palmer, K. (1997), 'Environmental regulation and innovation: a panel data
study', Review of economics and statistics 79(4), 610--619
Khanna, M. & Damon, L. A. (1999): EPA's voluntary 33/50 program: impact on toxic
releases and economic performance of firms. Journal of environmental economics and
management 37(1), 1--25
Konar, S. & Cohen, M. A. (1997): Information as regulation: the effect of community right to
know laws on toxic emissions, Journal of environmental Economics and Management 32(1),
109--124
Konar, S. & Cohen, M. A. (2001): Does the market value environmental performance?
Review of economics and statistics, MIT Press, 83, 281-289
Marshall, M. & Mayer, D. W. (1992): Environmental training: It's good business, Business
Horizons 35(2), 54 - 57
Newell, R. G.; Jaffe, A. B. & Stavins, R. N. (1998): The induced innovation hypothesis and
energy-saving technological change, The Quarterly Journal of Economics, 114(3), 941-975
Nishitani, K. (2009): An empirical study of the initial adoption of ISO 14001 in Japanese
manufacturing firms, Ecological Economics, Elsevier, 68, 669-679
Palmer, K.; Oates, W. E. & Portney, P. R. (1995): 'Tightening environmental standards: The
benefit-cost or the no-cost paradigm?', The Journal of Economic Perspectives, 119--132
Pekovic, S. (2010): The determinants of ISO 9000 certification: A comparison of the
manufacturing and service sectors, Journal of Economic Issues, ME Sharpe, 44 ,895-914
Porter, M. (1991): America's Green Strategy, Scientific American, 264, 168

97 | P a g e
Porter, M. E. & Van der Linde, C. (1995): Toward a new conception of the environment-
competitiveness relationship, The journal of economic perspectives, 97--118
Rennings, K. & Rammer, C. (2009): Increasing energy and resource efficiency through
innovation: an explorative analysis using innovation survey data, Technical report, ZEW
Discussion Papers
Rosenbaum, P. R. & Rubin, D. B. (1983): The central role of the propensity score in
observational studies for causal effects, Biometrika, Biometrika Trust, 70, 41-55
Vandenberghe, V. & Robin, S. (2004): Evaluating the effectiveness of private education
across countries: a comparison of methods, Labour economics, Elsevier, 11, 487-506
Ziegler, A. & Nogareda, S. (2009): Environmental management systems and technological
environmental innovations: Exploring the causal relationship, Research Policy, Elsevier, 38,
885-893
Zyglidopoulos, S. C. (2002): The social and environmental responsibilities of multinationals:
evidence from the Brent Spar case, Journal of Business Ethics, Springer, 36, 141-151

98 | P a g e

99 | P a g e
Chapter 3
Which firm characteristics matter? Identifying the drivers
for eco-innovation

100 | P a g e

101 | P a g e
Table of Contents 1. Introduction ........................................................................................................................ 105
2. Review of the Literature .................................................................................................... 106
2.1. Defining eco-innovation ..................................................................................... 106
2.2. Drivers of eco-innovation ................................................................................... 107
3. Data and Methodology ....................................................................................................... 108
3.1. Data ..................................................................................................................... 108
3.2. Specification and estimation of the model .......................................................... 110
3.3. Innovators and environmental innovators ........................................................... 112
3.4. Explanatory variables ......................................................................................... 115
3.5. Choice of an exclusion variable .......................................................................... 119
4. Empirical Results ............................................................................................................... 120
4.1. Estimations conducted on the whole sample ...................................................... 120
4.2. Estimations conducted by group of countries ..................................................... 124
5. Conclusion ......................................................................................................................... 129

102 | P a g e

103 | P a g e
Which firm characteristics matter? Identifying the drivers for eco-innovation
Abstract
Up until now, researchers have emphasized the importance of conventional technology-push,
market-pull drivers and regulatory framework for successful eco-innovation. The importance
of firms‘ structural characteristics, of their openness and of formal cooperation with external
partners have been comparatively disregarded. The aim of this research is to examine the
importance of firms‘ structural characteristics and to understand the role these characteristics
play in the realization of eco-innovation. We estimate a Generalized Tobit model on micro-
anonymised data from the 4th
wave of the Community Innovation Survey (CIS 4). We find
that eco-innovative firms tend to be large, autonomous firms that are open to use of internal
and external sources of information. Moreover, we find evidence of a possible substitution
effect between formal cooperation with external partners and basic R&D efforts. Our results
are robust to country-specific analyses.
Key words: Eco-innovation, Generalized Tobit, CIS 4, Firm characteristics, Environmental
consequences.
JEL codes: D2- Production and Organizations, L2- Firm Objectives, Organization, and
Behaviour, Q5-Environmental Economics, O3- Technological Change

104 | P a g e
105 | P a g e
1. Introduction
Over the last decade, there has been a rise in the introduction and development of
environmentally benign innovation (a.k.a. Eco-innovation). Global environmental problems
and fierce competition among firms may have played a significant role in the emergence of
this type of innovation. A consequence of increasing global environmental consciousness and
of concomitant firms‘ willingness to reduce environmental hazards related to their activities,
eco-innovation is presented as one of the most promising tools to solve the world‘s
sustainability issues. Eco-innovation may help firms overcome environmental challenges by
modifying, re-designing, creating and using alternative products, processes and
organizational methods. Despite its recent emergence (see Fussler and James, 1996); the
concept of eco-innovation has gained content and scope in a relatively short period of time.
The complexity of the eco-innovation process suggests that, besides conventional innovation
drivers, there should be certain firm specific capabilities and competencies that could be
complements or even substitutes to conventional innovation drivers. These competencies and
capabilities might be related to experience, knowledge base, managerial and technological
capabilities, degree of openness, cooperation and collaboration with internal and external
agents, etc.
These capabilities may be of even greater importance for eco-innovative firms than they
are for conventional innovators since eco-innovation incorporates environmental concerns in
the usual innovation-related challenges. However, the eco-innovation literature is still in need
of extensive empirical research to identify these capabilities. Our research aims at filling this
gap by identifying those firm characteristics that are inherent in the realization of innovations
with positive environmental consequences.
The policy implications of the proposed research are twofold. First, identifying the
aforementioned characteristics may give policy makers a better apprehension of the drivers
and other facilitating factors of eco-innovation. This improved comprehension may in turn
help policy makers design eco-innovation policies that are more effective and easier to
implement. Second, a better grasp of the above-mentioned capabilities and competencies
might give firms themselves useful guidelines for the successful implementation of eco-
innovation.
Our empirical analysis exploits data from the 4th
Community innovation Survey (CIS 4)
that comprises 104,943 firms observed across 15 EU member States (or associated countries)
over the years 2002 to 2004. The target population is made of firms of at least 10 employees.

106 | P a g e
By conducting firm-specific analyses with such a large dataset, we aimed at finding evidence
at the micro level in a macro context. Moreover, besides conducting an empirical analysis on
the whole dataset, we also conducted country specific analyses in order to highlight the
potential differences among the European countries with regard to firm characteristics that
are inherent in the realization of innovations with positive environmental consequences. The
remainder of this paper is organized as follows. Section 2 reviews the literature related to
eco-innovation and state our research objective. Section 3 presents the data, estimation
strategy and choice of variables. Section 4 reports the estimation results. Concluding remarks
are given in a final section.
2. Review of the Literature
2.1. Defining eco-innovation
The innovation literature defines eco-innovation as ―Assimilation or exploitation of a
product, production process, service or management or business methods that it is novel to
the firm or user and which results, throughout its lifecycle, in a reduction of environmental
risk, pollution and other negative impact of resource use (including energy use) compared to
the relevant alternatives‖ (Kemp and Pearson, 2007). As one can clearly see, the definition is
quite general and rather minimalist. It embraces every environmentally improved product,
production process, services, management or business method as potential eco-innovation,
even if the environmental concerns are not the corner-stone of the realized innovation.
Accordingly, unintentionally reduced environmental hazard could be sufficient enough to
characterize an innovation as an eco-innovation. However, this aspect of eco-innovation
raises some identification and measurement problems, all the more since every different
definition tends to focus on different aspects of eco-innovation. For instance, the Japanese
government‘s Industrial Science Technology Policy Committee defines eco-innovation as ―a
new field of techno-social innovations [that] focuses less on products‘ functions and more on
[the] environment and people‖ (adapted from OECD, 2009). This definition considers eco-
innovation as a central component in order to overcome societal challenges on the way to
sustainable development. However, other, more technical aspects can be emphasized. For
instance, a product innovation in one firm (e.g. product innovation in machinery, packaging
etc.) could be considered as a process eco-innovation in another firm (e.g. Schmookler, 1966;
Scherer 1982a, b). Such complications explain why eco-innovation has to be defined in such
a general way.

107 | P a g e
Whatever its definition, its promise in terms of competitiveness and sustainability have
attracted the general attentions of both firms and countries towards eco-innovation. This has
led to an increase in the number of eco-innovating firms and to significant market
development for eco-innovative technologies. For instance, Stern (2006) claims that markets
for low-carbon energy products are likely to be worth at least 500 billion dollars per year by
2050. Other prominent example of this development is the EU‘s Lisbon agenda, which aims
at significant targets for sustainable growth such as: (1) reducing greenhouse gas emissions
by 20% (compared to 1990 levels) by 2020, (2) increasing the share of renewable energies in
final energy consumption to 20%, and (3) moving towards a 20% increase in energy
efficiency (European Commission). The targets set by the EU do not solely aim at being
environmentally benign, but also at increasing the competitiveness of the Union by reaching
certain levels of efficiency in input use and in productivity. As Porter (1991) and, Porter and
van der Linde (1995) asserted pollution is generally associated with unnecessary, inefficient
or incomplete use of resources, or with loss of energy potential. Hence, reducing pollution
would not only make the world a better place, but would also improve resource productivity,
which could trigger drastic competitive advantage for successful innovators over non-
innovators.
2.2. The drivers of eco-innovation
The innovation literature highlights the significance of technology-push and market-pull
factors as the main drivers of successful conventional innovation. According to Pavitt (1984),
the technology push factors are essential in the first stages of a product's lifecycle, whereas
the market related factors are significant in the diffusion phase. For successful eco-innovation
however, regulatory push/pull effect can also be considered of the utmost importance. As
stated in van Leeuwen and Mohnen (2013), environmental regulation and public funding of
R&D are the first impetus to have more green technologies developed by individual firms.
Despite the on-going controversies on this issue, the acceptance of environmental regulation
as one of the main drivers of eco-innovation took some time and considerable efforts. Porter
and van der Linde were the pioneers of this sometimes heated discussion and naturally have
been heavily criticized by many scholars (e.g. Palmer, Portney and Oates, 1995).
The Porter hypothesis (Porter, 1991; Porter and van der Linde, 1995) assert that stricter
environmental regulation would lead firms to eco-innovate and the economic gains that could
be reaped from this investment would offset (partially or fully) the cost of the regulation
itself, leading to a ―win-win‖ situation. Later on, Rennings (2000) consolidated the

108 | P a g e
importance of environmental regulation when he introduced the notion of ―double
externality‖ problem. According to him the eco-innovation comprises two distinct
externalities, unlike other innovations. These externalities are i) the usual knowledge
externalities in the research and innovation phases and ii) the environmental externalities in
the adoption and diffusion phases (Oltra, 2008). More precisely, the beneficial environmental
impacts of eco-innovations make their diffusion always socially desirable (Belin et al. 2011).
However, these positive external effects bring some market failures that reduce the incentives
for firms to invest in eco-innovation (Rennings, 2000), which makes the environmental
regulations one of the most crucial factors affecting the introduction and development of eco-
innovation.
Nevertheless, the conventional drivers of innovation and environmental regulation are
not the only factors likely to affect a firm's involvement in the eco-innovative process. As the
eco-innovative process becomes more complex, the role of (and need for) firm-specific
capabilities and competencies is getting increasingly important. The acquisition of these
capabilities and competencies often comes to rely on cooperation. The time where innovation
(and eco-innovation) was seen only a ―one-man work‖ is long gone. Cooperation with
internal and external agents has become a strategic move to attain success in innovative
activities. This seems to be even more the case when eco-innovation is concerned. Thus,
Hemmelskamp (1999) found that eco-innovative companies tend to have lower R&D
intensity and tend to countervail this relatively low R&D effort with use of external sources
information. Additionally, eco-innovation is a highly complex activity which involves
increasing interdependencies and relies on external knowledge and information (Andersen,
1999, 2002; Foxon and Andersen, 2009). The complexity of the eco-innovation process
suggests that, besides the conventional innovation drivers, there should be certain firm-
specific capabilities and competencies that could act as complements or even substitutes to
the impulsion of technology, the pull of the market and the environmental regulation. The
aim of this research is to identify those capabilities and competencies that are liable to assist
firms in the eco-innovative process.
3. Data and Methodology
3.1. Data
This research exploits micro-ananoymised data drawn from the 4th wave of the
Community Innovation Survey (CIS 4). The CIS is a survey that aims at providing

109 | P a g e
comparable firm-level data on innovation activities in the European countries. It is
coordinated throughout Europe by Eurostat in cooperation with the statistical offices of the
Member States. It relies on a harmonized questionnaire based on the Oslo Manual (1997),
which provides invaluable information on innovation activities at the firm level (see Eurostat,
2005). The CIS data is available as micro (firm-level) data for a given country (from this
country's national statistical office), but also as micro-anonymised data for several EU
Member States (from Eurostat).
The present research uses the micro-anonymised CIS 4 data, available for 15 EU
Member States (or associated countries). Micro-anonymised CIS is firm-level data which has
been made anonymous by adding random "error terms" to the raw firm-level data. This
method makes it almost impossible to break the anonymity of individual firms, while
allowing researchers to conduct econometric analyses (which will take out the added noise).
This process is explained in details in Mohnen, Mairesse and Dagenais (2006). Experiments
on specific countries have shown that econometric analyses conducted on the micro-
anonymised data yield results that are not significantly different from those of analyses
conducted on the corresponding firm-level data (Mohnen, Mairesse, and Dagenais, 2006).
The CIS 4 survey contains information about the main economic activity of each
sampled firm, location, number of employees, total turnover, expenditures in intramural and
extramural R&D, innovation output, innovation collaboration and knowledge sources for
innovation. Compared to the traditional R&D and patent data, the innovation output
indicators used in the CIS surveys have the advantage of measuring innovation directly,
which means they capture the innovations that were introduced to the market and their
relative weight for the innovators total sales (Kleinknecht et al. 2002).
The 4th
wave of the CIS survey does not contain information which directly pertains to
eco-innovation. However, there are some variables that can help researchers identify the
environmental impact of product and/or process innovations introduced during the
observation period (2002 to 2004). The environmental outcome of the product and/or process
innovations can thus be measured by (i) "reduced materials and energy per unit output" and
(ii) "reduced environmental impact or improved health and safety". In what follows, we will
use these two measures as proxies for the environmental outcomes of innovation activities.
Hence, using this dataset may allow us to compare and contrast the specific characteristics of
eco-innovation compared to non-environmental (or "conventional") innovations. The dataset

110 | P a g e
includes 104,943 firms observed across 15 different countries25
over the years 2002 to 2004.
This sample is representative of the population of firms with 10 employees or more based in
these 15 countries. As such, it is one of the most extensive datasets on innovation available,
which will let us conduct our empirical investigation beyond the confines of a specific
industry or geographical area.
3.2. Specification and Estimation of the model
The aim of this research is to identify firms' characteristics and capabilities that have
significant impact on firms‘ eco-innovation intensity. To do so, we deemed it relevant to
estimate an innovation production function following the ―innovativity‖ approach proposed
by Mairesse and Mohnen (2002). The main departure from this approach is that our measure
of innovation output will actually be a measure of eco-innovation. We chose to estimate a
Generalized Tobit model (i.e., a variant of the Heckman (1979)'s selection model estimated
by Maximum Likelihood) in order to reduce the selection bias inherent in the use of CIS data.
This bias arises due to the presence of "filtering" questions in the questionnaire. These
questions are designed to characterize firms as "innovating" or "non-innovating", and only
the former have to fill in the full questionnaire (see Mohnen, Mairesse and Dagenais (2006)
for further details). This attribute of CIS surveys can endanger the reliability of the empirical
analysis if one does not take into account the selection problem.
Our dependent variables of interest (the two proxies mentioned in the previous section)
are categorical variables coded from 0 to 3 (a higher number denoting a larger positive effect
of the innovation on the environment). However, continuous variables would be better suited
to the intensity equation of the Generalized Tobit model. To address this issue, we applied a
factor analysis on our two categorical eco-innovation proxies. Both loaded to a single
continuous factor with an eigenvalue close to 1, asserting that there is a single underlying
variable that accounts for most (91%) of the total variance with a 0.67 factor loading. We use
the scores of this underlying variable (first factor) to build a continuous measure of eco-
innovation intensity, which we then used as the intensity variable in our Generalized Tobit
model. In order to make interpretation easier, we have normalized this variable so that it has a
standard normal distribution with zero mean and a standard deviation of 1.
25 Belgium, Bulgaria, Czech Republic, Germany, Estonia, Spain, Greece, Hungary, Lithuania, Latvia, Norway,
Portugal, Romania, Slovenia and Slovakia.

111 | P a g e
The Generalized Tobit model is a two-equation model, both equations being estimated
simultaneously by Maximum Likelihood. In our application, the first equation (or selection
equation) models the probability of being a product and/or process innovator. This equation is
specified as a Probit model, as is usually done in the literature. The second equation (or
intensity equation) models the intensity of eco-innovation activities for firms that innovate.
The dependent variable used in this equation is the normalized continuous index built from
the factor analysis, as explained above. The intensity equation is central to our empirical
analysis, as it is the equation which allows us to identify the determinants of eco-innovation.
(1)
(2)
(3)
~ N(0,1)
N(0,
Corr( =
In Equation (1), represents the unobserved innovation decision variable which
measures the propensity to innovate, represents the vector of explanatory variables
determining the innovation decision and the ‘s are the coefficients to be estimated for each
explanatory variable. If a firm‘s propensity to innovate is bigger than zero, ( ), then the
firm is considered as an innovator (Equation 2). In Equation (3), is the normalized variable
measuring the intensity of eco-innovation. is the vector of explanatory variables for this
equation, and denotes the vector of associated parameters to be estimated. In the model,
and are standard normal random error terms with correlation coefficient . Taken
together, Equation (2) and Equation (3) defined the Generalized Tobit model that is estimated
by Maximum Likelihood. The model is estimated first on all firms (i.e., the 104,943
observations taken from all of the 15 countries covered in the dataset). In this second step, we
distinguish Western European countries (Belgium, Germany, and Norway26
), Eastern
26
Although Norway is not part of the EU, it is a Northern European country and part of the larger
European Economic Area. We thus find it relevant to include Norway alongside Belgium and
Germany for the purpose of our analysis.

112 | P a g e
European countries (Bulgaria, Czech Republic, Hungary, Romania, Slovakia and Slovenia),
Mediterranean countries (Spain, Greece, Portugal), and Baltic countries (Estonia, Latvia,
Lithuania), and estimate the model for these country groups.
3.3. Innovators and Environmental innovators
Our empirical analysis hinges on the distinction between non innovators, innovators, and
environmental innovators (or eco-innovators). The selection equation of our Generalized
Tobit model relies on a binary variable indicating whether a firm introduced an innovation or
not during the period of observation (i.e. from 2002 to 2004). The dependent variable used in
the intensity equation of the model is based on two categorical variables indicating whether
the innovation had ―low‖, ―medium‖ or ―high‖ environmental effects or ―no‖ environmental
effect at all.
To take a first glance at the data, we can recode these two variables as binary (with 1
corresponding to an environmental effect and 0 corresponding to none) and define an eco-
innovator as a firm with a value of 1 in either of these two variables (or both), and a non-eco-
innovator as a firm with a value of 0 in both variables. Table 1 gives the distribution of
innovators and eco-innovators across industries for the 15 countries covered in the survey.
Table 1 displays a slight difference in the distribution of eco-innovators across the services
and manufacturing industries. The number of eco-innovative firms is higher in the
manufacturing industries than in the services sectors. As regard services, we can note that that
the highest concentration of eco-innovators is within ―Computer and Related Activities‖
(27.8%), while the lowest concentration lies within ―Real Estate Activities‖ (9.3%). We can
also detect that ―R&D and Other Business Activities‖ and ―Wholesale Trade‖ have the
highest number of eco-innovators in absolute terms. The former has 1760 eco-innovating
firms while the latter contains 1687 eco-innovators.
The picture is a bit different within manufacturing industries. The average number of
eco-innovating firms is higher among manufacturing firms, which highlights the
manufacturing companies‘ greater need to reduce their ecological foot-print. By nature,
manufacturing industries tend to pollute more than the services sectors and hence become the
main target of regulatory authorities. Moreover, the voluntary proactive approaches to lower
environmental hazards can be considered as another significant factor increasing the number
of eco-innovators within these industries.
The ―Coke and Petroleum products‖ and ―Chemicals and Chemical products‖ industries
have the highest (53.1%) share of eco-innovators among manufacturing industries. The

113 | P a g e
highest number of eco-innovators is within the ―Electrical and Optical Equipment‖ industries
(1984 firms) with 41% of all firms within this industry having reported a positive
environmental impact of their realized innovations. ―Textile and Textile Products‖ has the
lowest share (13.7%) of eco-innovators among all manufacturing industries. Overall, our
summary statistics suggest that firms involved in eco-innovation activities are concentrated in
industries where the production process presents a higher technological complexity and
involves more negative environmental externalities.
Summary statistics for the eco-innovation proxies (in their categorical and binary forms)
together with those for the continuous measure of eco-innovation built from these variables
are given in Table 2.

114 | P a g e
Table 1: Distribution of Eco-innovators and innovators according to industry
classifications
Classification Total no. of
firms
% of eco-
innovators
% of
innovators
Services and Other Sectors:
50: Sale and Repair of Motor
Vehicles
1179 172 (14.6%) 249 (21.1%)
51: Wholesale Trade 13669 1687 (12.3%) 2668 (19.5%)
52: Retail Trade 2498 248 (9.9%) 410 (16.4%)
60_61_62: Transport 4930 558 (11.3%) 747 (15.2%)
63: Auxiliary Transport Activities 2206 355 (16.1%) 540 (24.5%)
64: Post and telecommunications 1155 289 (25%) 447 (38.7%)
70: Real Estate Activities 728 68 (9.3%) 111 (15.3%)
71: Renting Machinery and
Equipment
294 38 (12.9%) 69 (23.5%)
72: Computer and Related Activities 2589 720 (27.8%) 1485 (57.4%)
73_74: R&D and Other Business
Activities
7897 1760 (22.3%) 2491 (31.5%)
E: Electric, Gas and Water Supply 1921 437 (22.7%) 517 (26.9%)
F: Construction 4353 628 (14.4%) 855 (19.6%)
H: Hotels and restaurants 1424 153 (10.7%) 211 (14.8%)
J: Financial Intermediation 2354 544 (23.1%) 1053 (44.7%)
Manufacturing:
20_21: Manufacture of wood, pulp
and paper
4122 919 (22.3%) 1148 (28%)
22: Publishing and printing 2474 562 (22.7%) 811 (32.8%)
27: Basic Metal 1360 479 (35.2%) 534 (39.3%)
28: Fabricated Metal Products 4096 1457 (35.6%) 1710 (35%)
C: Mining and Quarrying 1444 270 (18.7%) 323 (22.4%)
DA: Food, Beverages and Tobacco 7907 2070 (26.2%) 2565 (32.5%)
DB: Textiles and Textile Products 8905 1222 (13.7%) 1652 (18.5%)
DC: Leather and Leather Products 1746 269 (15.4%) 334 (19.1%)
DF_DG: Coke, Petroleum Products &
Chemicals, Chemical products 2657 1410 (53.1%) 1578 (59.4%)
DH: Rubber and Plastic Products 2531 913 (36.1%) 1059 (41.8%)
DI: Non-metallic Mineral Products 2855 864 (30.3%) 1034 (36.2%)
DK: Machinery and Equipment 4315 1736 (40.2%) 2036 (47.2%)
DL: Electrical and Optical Equipment 4838 1984 (41%) 2418 (50%)
DM: Transport Equipment 2643 1033 (41.2%) 1192 (45%)
DN: Other Manufacturing 3810 1034 (27.1%) 1282 (33.7%)
Total 103710 23879 (23.02%) 31529 (30.64%)

115 | P a g e
3.4. Explanatory variables
Size is one of the most important characteristics of a firm and it is necessary to include it
as a control variable in our regressions. The literature stresses the importance of firm size as a
determinant of innovation (del Rio Gonzalez, 2005, 2009; Kammerer, 2009), suggesting
either a linear relationship (as bigger firms can more easily make large investments in R&D)
or an inverted-U relationship (as the intensity of innovation may decrease after firms reach a
certain size, due to red tape and stabilization of certain routines). The measure of size
available in our dataset is an ordered variable comprising three categories (―small‖,
―medium‖ or ―large‖) depending on the number of employees, small being the category of
reference in our estimations.
Besides firm size, being part of a larger group may also affect firms‘ propensity to
innovate (Cainelli et al., 2011). On the one hand, we can assert that being part of a group may
give easier access to the financial resources required for investment in R&D. On the other
hand, this may negatively affect their involvement in eco-innovation since as subsidiaries
they may have to follow the parent company‘s innovation strategy. Accordingly, we include a
binary variable indicating whether a firm is part of a group.
Market characteristics such as maturity of the market, existing technological
opportunities, established and/or future regulations, standards and norms, and consumer
awareness can have an impact on the introduction of both innovation and eco-innovation.
These characteristics may encourage (or discourage) firms to actively engage in eco-
innovation. We include two dummy variables, indicating whether a firm operates mainly on
the national or international market, in order to control for the impact of different markets on
the introduction of eco-innovation.
Firms‘ engagement in continuous R&D and R&D intensity are two conventional
innovation inputs measuring firms‘ determination in innovation. The knowledge created and
the experience obtained during the research phase is of a great importance for the on-going
and future innovative projects. A continuous engagement in R&D not only enhances a firm‘s
scientific and technological capabilities, but also maintains the absorptive capacity needed to
undertake successful innovation (Hemmelskamp, 1997; Horbach, 2008). Interestingly,
Hemmelskamp (1999) claims that eco-innovative companies are likely to have a lower R&D
intensity as they tend to rely more on cooperation and external sources information. In our
estimations, we include two distinct variables to control for the respective impacts of R&D
intensity and of engagement in continuous R&D. Since in CIS surveys, some firms do not

116 | P a g e
engage in R&D on a continuous basis (and some firms do not engage in R&D at all), it is
usual to use both variables as regressors in econometric models of the innovation production
function (see for instance Mairesse and Mohnen, 2002). In our application, R&D intensity is
classically measured by the share of (intramural and extramural) R&D expenditures in total
sales, while the continuous engagement in R&D is captured by a binary variable equal to 1 in
case of continuous R&D and to 0 otherwise.
Hemmelskamp (1999)‘s claim on the use of external sources of information took our
attention to another crucial point: firms may need to be more open in order to acquire the
resources and competences they need for eco-innovation. Following Laursen and Salter‘s
(2004, 2006) approach, we include an ordered variable that controls for the importance of the
openness of the firm for the development of eco-innovation. According to Laursen and Salter
(2004, 2006), we can measure the degree of openness of a firm by looking at the use of
general internal and external sources of information within the innovative process. Following
their methodology, we recode the ―sources of information‖ variables provided by CIS4 as
binary variables equal to 1 if a source is used and to 0 otherwise. These variables are then
summed up to provide the ordered variable, a greater value of which indicates a larger degree
of openness. In our application, we use the following information sources27
: (1) sources from
within the enterprise or its group, (2) suppliers of equipment or materials, (3) clients or
customers, (4) competitors and other enterprises in same industry, (5) consultants,
commercial labs or private R&D institutes, (6) professional conferences, trade fairs,
meetings, (7) scientific journals, trade/scientific publications, (8) professional and industry
associations. According to this method, the greatest possible openness score (which is
attained if a firm uses all information sources) is equal to 8 while the lowest possible score is
0.
Openness in the above sense does not entail a formal cooperation with the sources of
information used (e.g., a firm might obtain information from a competitor without formally
cooperating in R&D with this competitor). Formal cooperation may thus be distinct from
openness, especially when academic knowledge is involved (see Footnote 3). To take this
into account in our model, we include two more variables, as in Robin and Schubert (2013).
The first variable is an indicator of scientific cooperation (i.e., cooperation with either
27
As in Laursen and Salter (2004) and Robin and Schubert (2013), we do not include academic sources of
information because most firms report no (or a very low) use of these sources. This is a recurrent feature of CIS
data, which may be due to the fact that relying on academic knowledge to innovate generally implies some
measure of formal cooperation. Thus, the use of academic knowledge is better captured by other variables, such
as indicators of cooperation, as will be done here.

117 | P a g e
universities and higher education institutions or government/public research institutes). The
second variable is an indicator of cooperation with other partners, which captures interactions
between firms and non-scientific cooperation partners. Cooperating with ―other‖ partners
entails a formal cooperation between a firm and at least one of the following: (i) other
enterprises within the group, (ii) suppliers of equipment, materials, components, or software,
(iii) clients or customers, (iv) competitors or other enterprises in the firm‘s industry and (v)
consultants, commercial labs, or private R&D institutes.
Table 2: Summary statistics of the variables used in the econometric analysis
Variables Mean Std. dev.
Dependent :
Firm introduced a product innovation (yes/no) %23 0.42
Firm introduced a process innovation (yes/no) %23 0.42
Innovator (Product and/or Process) %30.4 0.46
Proxy #1 for innovation with environmental impact: EMATa %83.2 1.02
Proxy #2 for innovation with environmental impact: EENVb %93.5 1.11
Explanatory:
Size in 2002c %47.6 0.69
Size in 2004 %51.1 0.69
Part of a group (yes/no) %23.3 0.42
R&D intensity %0.33 16.08
Engagement in continuous R&D (yes/no) %9.7 0.3
Indicator of Openness of the company 7.2% 1.8
Cooperation with public research institutions (yes/no) %4.71 0.21
Cooperation with others (yes/no) %9.9 0.3
Firm active in international markets (yes/no) %35.7 0.48
Firm active in national market (yes/no) %59.6 0.49
Financial support for innovation activities by the E.U (yes/no) %2.1 0.14
Exclusion:
Soviet %65.4 0.47
a - Reduced materials and energy per unit output (0: Not relevant, 1: Low, 2: Medium and 3: High)
b - Reduced environmental impacts or improved health and safety (0: Not relevant, 1: Low, 2:
Medium and 3: High) c - 0: Small, 1: Medium and 2: Large, small being the base category

118 | P a g e
Table 3: Descriptive statistics of the regressors for eco-innovators and conventional
innovators
Eco-innovators Innovators
Variables Mean Std. Dev. Mean Std. Dev.
Size 2002a
76.4% 0.79 70.3% 0.771
Size 2004b
80.3% 0.783 74.3% 0.767
Group 39.2% 0.484 37.6% 0.484
National market 73.9% 0.439 73.6% 0.44
International market 58.4% 0.492 54.8% 0.5
Fund 6.8% 0.253 6% 0.24
Cont. R&D 33.1% 0.47 29.2% 0.46
R&D intensity 0.72 22.71 0.754 24.74
Openness 6.23 1.98 5.8 2.26
Scientific cooperation 16.5% 0.371 14.5% 0.352
Other cooperation 33% 0.47 31% 0.462
Soviet countries 47.9% 0.499 50.1% 0.5
a and
b- 0: Small, 1: Medium and 2: Large, small being the base category
According to van Leeuwen and Mohnen (2013), environmental regulation and public
funding of R&D are the first impetus to have more green technologies developed by
individual firms. Moreover, Porter and van der Linde (1995) assert that stricter environmental
regulation would lead firms to eco-innovate and the economic gains that could be reaped
from this investment would offset (partially or fully) the cost of the regulation itself, leading
to a ―win-win‖ situation (Porter, 1991; Porter and van der Linde, 1995). Even though these
authors consider the regulatory framework as being of utmost importance for the
development of eco-innovation, CIS 4 lacks indicators that would allow us to test this claim.
The best we have at our disposal is a binary variable indicating whether a firm has received
support from the EU‘s 5th
or 6th
Framework Program, part of which are designed to foster
environmental innovation and sustainable growth. We thus include in our estimations a
dummy variable equal to 1 if a firm received any public financial support for innovation
activities from the EU‘s FP during 2002-2004, and to 0 otherwise.
Finally, in order to capture the technological conditions as regard to eco-innovation
among different industry segments and among various European countries, we include two-
digit Nace codes along with country dummies in our regressions.

119 | P a g e
3.5. Choice of an exclusion variable
Although the Generalized Tobit model can be identified through its non-linearity alone,
it is preferable to rely, for identification, on an exclusion variable which should be correlated
with the error term in selection equation, but not with the error term of the intensity equation.
This is generally a hard task, which often implies relying on variables sourced in external
databases compatible with the one at hand. In our application, such external sources were not
available, so we created a dummy variable indicating whether the country to which a firm
belongs was an ex-Soviet nation or not. This variable is equal to one if a country is an ex-
Soviet Union country lato sensu (Estonia, Latvia and Lithuania, Bulgaria, Hungary, Czech
Republic, Romania, Slovakia and Slovenia), which was strictly tied to the Soviet Union as a
result of having a communist regime. We refer to all of these countries as ―Soviet‖ for
simplification. This variable is included among the selection equation regressors, but not
among those of the intensity equation, because we expect it to have an impact on being a
conventional innovator, but not an eco-innovator.
The rationale for choosing this variable as the exclusion variable is as follows:
Communist regimes were well known for stressing the importance of productivity at the
national level, and for dedicating a significant amount of resources to science and technology.
At the same time, industrial expansion in the Soviet countries often occurred at the expense
of environment (of which the draught of the Aral Sea constitutes one of the most striking and
extreme examples). We claim that a potential eco-innovator would have technical capabilities
to develop knowledge and all the more, it would have environmental consciousness to turn
this created knowledge to an applicable solution. The former is definitely one of the
fundamental characteristics of the ex-Soviet Union countries. However, the latter is suspected
to be one of the most significant barriers to eco-innovate for the same countries. We assume
that having a communist regime for long years may have affected the ecologic awareness of
former Soviet countries as compared to Western European countries. Especially, with
growing global competition firms within these countries have taken advantage of unregulated
economic system and political regimes, absent environmental protection framework,
problems in implementing existing regulations and standards, auditing problems etc.
Therefore, as a result of not having the same environmental consciousness levels with their
Western European counterparts, firms within the ex-Soviet countries are presumed to be less
eco-innovative. We acknowledge the fact many of these countries are now EU member States
(some of them became members in 2004, others in 2007), and that there are certain criteria to
120 | P a g e
be fulfilled before entering the EU – including ecological criteria. These criteria are
negotiated before the acceptance of the candidate country and put into action before their
entry into the EU. However, it would naïve to expect total compliance to the legislations right
from the start. More precisely, there will be a certain time span between the implementation
of the European legislations and the observation of significant changes (in particular as
regards an increased social awareness of environmental issues and the widespread adoption
of eco-innovation). As a result, it is admissible to assume that establishing widespread
environmental consciousness within those countries would take some time even after their
acceptance into the EU. This assumption is all the more valid since the observation period of
our micro-anonymised CIS 4 dataset 2002-2004, and most of former Soviet countries have
become member States in 2004. Two countries, Bulgaria and Romania, have even become
member States in 2007, i.e. after the period of observation considered in CIS4. Accordingly,
choosing the indicator of a former Soviet regime as an exclusion variable (i.e., assuming it is
can be correlated with the error term of the ―selection into innovation‖ equation, but not with
the error term of the ―intensity of eco-innovation‖ equation) seems reasonable. This can only
be done, however, when we estimate our model on all firms (i.e. the whole sample of 104,943
observations spread across 15 countries). In the second series of estimations, performed by
groups of countries, we have to rely on the nonlinearity of the Generalized Tobit model for
identification (as do Mairesse and Mohnen, 2002, for instance).
4. Empirical Results
4.1. Estimations conducted on the whole sample
This section discusses the estimation results obtained from the Heckman selection model.
Table 4 displays the estimations results from two distinct approaches. We first estimated the
Generalized Tobit model with a country fixed effect and without an exclusion variable (since
our exclusion variable is an indicator of former Soviet countries, it cannot be combined with
a country fixed effect). In this first approach, the model is identified through its non-linearity
alone. Second, we have estimated the model with the exclusion variable (which might
improve identification) but without the country fixed effect. We present the estimates of the
Generalized Tobit with a country fixed-effect (but no exclusion variable) in Columns I and II
of Table 4, and those of the Generalized Tobit with an exclusion variable (but without a
country fixed effect) in Columns III and IV of Table 4.

121 | P a g e
Table 4 first reveals that five variables (firm size, belonging to a group, type of market,
openness and scientific cooperation) are significant within the intensity equations of both
models. Therefore, these factors appear as those that are primarily relevant to eco-innovation.
We can attribute the significance of firm size firms to financial risks inherent in the eco-
innovative process. Small and medium size firms may not have easy access to financial
sources and/or technological opportunities required for a successful eco-innovation which
may result lack of interest or, no or low success in eco-innovative projects. In general, the
innovation literature assumes that the larger firms have easier access to the financial sources
thus less effort to innovate (del Rio Gonzalez, 2005, 2009; Kammerer, 2009). These
assumptions are consolidated with our estimation results.
In both models, being part of a group is negatively associated with the intensity of eco-
innovation. Firms that have to closely follow the innovation strategy of their parent company
may have less opportunity to get actively involved in eco-innovation. Being part of a group
may indeed require high level of interdependence among the firms affecting firms‘
innovation strategy and their decision-making mechanism. Firms‘ organic network within the
same group could diffuse important knowledge related to other firms' innovation activities.
However, the diffused knowledge may entail firms to be more similar and homogenous in
terms of innovative activities and technological levels. For instance, a general innovation
strategy might be binding for all the subsidiaries within the group, which would certainly
affect their behaviour towards environmentally benign innovations. Thus, in our case being a
conventional innovator rather than an eco-innovator could be the results of such a strategy.
Table 4 also reveals that firms operating mainly on national markets have a lower
intensity of eco-innovation, whereas those operating mainly on international markets tend to
have (in the second specification of the model, at least), a higher intensity of eco-innovation.
This may be because firms exposed to an international market face a more heterogeneous
demand, including a higher demand for "greener" products from countries which are more
environmentally aware.
According to Table 4, a greater openness of the firms is associated with a higher intensity
of eco-innovation, and the same goes for cooperation with science (i.e. universities or public
research institutes). Reid and Miedzinski (2008) state that the main features of innovation are
determined early in the innovation process. This deduction is especially true for eco-
innovations since without the correct apprehension of the environment and environmental
aspects of the intended innovation it would be challenging, if not impossible, to develop eco-
innovations. A greater openness may allow firms to get a better grasp of environmental issues

122 | P a g e
and thus allow them to perform better as eco-innovators. In the same vein, firms‘ ability to
establish scientific cooperation may increase their eco-innovation intensity because the
complexity of eco-innovation may indeed lead firms to look for other means to complement
their capabilities during the eco-innovative process. As stated in Robin and Schubert (2013),
the Framework Program (FP) of the EU is the prime example of the cooperation between
public research institutions and industry and this claim is consolidated with our results.
Additionally, cooperation with other non-scientific partners is highly significant in the
intensity equation of the second model. This indicates that besides the scientific knowledge,
firms‘ formal relationships with other agents is of high importance for actively pursuing new
ideas and develop eco-innovations. The results in Table 4 also give us significant clues about
various aspects of eco-innovation and its relationship with the conventional innovation
inputs. We note that the R&D intensity has no significant impact on the intensity of eco-
innovation as in De Marchi (2012) and Horbach (2008). On the contrary, engagement in
continuous R&D is significantly positive in our benchmark model. Hemmelskamp (1997) and
Horbach (2008) found evidence that stresses the significance of continuous R&D as one of
the conventional innovation inputs that can enhance a firm‘s scientific and technological
capabilities as well as the absorptive capacity needed to undertake a successful innovation.
Moreover, De Marchi (2012) suggests that the internal R&D effort is a key component of
innovative process, increasing the effectiveness of incoming information and knowledge to
the development of innovation. However, we should note here that the intentions of the R&D
activities are considerably important for successful eco-innovations. More precisely, simply
increasing R&D related expenditures (and, hence, the R&D intensity) may not be enough to
develop innovations with positive environmental impacts. In order to do so, one should
incorporate the environmental aspects to the R&D process since the beginning of innovative
process. On the one hand, incorporating environmental aspects in basic R&D efforts may
require several specific competences, knowledge-base, experience, considerable effort,
financial sources and of course, time. On the other, some of these prerequisites may not be
available within the company, which may yield low or no success in the innovative process.
Following the same intuition, our result supports Hemmelskamp‘s (1999) claim that eco-
innovative companies are likely to have lower R&D intensity, and they tend to countervail
the low R&D effort with external use of information sources. This may affirm that
conventional innovation and eco-innovation are indeed different in nature and therefore, they
need to be treated as two distinct entities. The estimated coefficients of our openness and
cooperation variables seem to support Hemmelskamp‘s claims to a great extent.

123 | P a g e
Table 4: Estimates of the Generalized Tobit Model for eco-innovation
With a country fixed-effect With an exclusion variable
(I) Selection
equation
(II)
Intensity
equation
(III) Selection
equation
(IV)
Intensity
equation
Constant term 0.23***
(0.043)
-0.93***
(0.044)
0.94***
(0.037)
-0.71***
(0.027)
Firm size
Medium 0.17*** (0.015)
-0.001 (0.013)
0.11*** (0.014)
-0.03* (0.013)
Large 0.2*** (0.021)
0.1*** (0.017)
0.11*** (0.021)
0.06*** (0.016)
Characteristics
Being part of a Group 0.1*** (0.016)
-0.03* (0.012)
-0.01 (0.016)
-0.06*** (0.012)
Active in National market 0.23***
(0.014)
-0.03*
(0.014)
0.25***
(0.013)
-0.04**
(0.013)
Active in Inter. Market 0.28*** (0.014)
0.02 (0.013)
0.27*** (0.014)
0.03* (0.013)
Funded by EU 0.53*** (0.072)
0.03 (0.022)
0.62*** (0.069)
0.03 (0.023)
Engagement in Continuous R&D 1.16*** (0.029)
0.02 (0.021)
1.01*** (0.028)
0.07*** (0.018)
R&D intensity 2.03*** (0.31)
0.05 (0.066)
1.73*** (0.282)
-0.08 (0.065)
Openness -0.29*** (0.004)
0.16*** (0.004)
-0.3*** (0.004)
0.14*** (0.004)
Scientific cooperation 0.02 (0.054)
0.09*** (0.018)
-0.03 (0.051)
0.08*** (0.019)
Cooperation with others 1.53*** (0.037)
-0.03 (0.022)
1.63*** (0.034)
0.09*** (0.022)
Exclusion variable
Soviet -
-
0.238*** (0.013)
Industry dummies (chi² test) 2677.04*** 2720.58***
Country Dummies (chi² test) 4736.90*** -
No of observations 64919 64919
Censored observations 37910 37910
Uncensored observations 27009 27009
Chi² (df) 9328.71(53)*** 6637.76(39)***
-Associated standard errors are in parenthesis below each coefficient
- ***
significant at the 1% level, **
significant at the 1% level, *significant at the 1% level
-For the 1st model Wald test of indep. Eqs. is: 7.06 with Prob>Chi
2:0.008** and rho is : -.11
-For the 2nd
model Wald test of indep. Eqs. is: 0.29 with Prob>Chi2:0.589 and rho is : 0.16
124 | P a g e
Due to the double externality involved in the development of eco-innovation and its
pubic good nature, firms‘ propensity to engage in eco-innovation can be easily affected by
the regulatory framework. The central authorities tend to influence firms‘ behaviour towards
eco-innovation by using various tools such as command and control mechanisms, market
based instruments, incentives and subsidies. Accordingly, our funding proxy indicates that
the EU‘s Framework Programmes are efficient in assisting firms throughout their
conventional innovative process. However, we fail to observe any significant impact of the
same Programmes on the intensity of eco-innovation. This could be due to lack of demand for
available funds, lack of successful eco-innovative projects, problems inherent in the
distribution of funds, excessive applications from the conventional innovators or a relative
inefficiency of the EU funding to generate eco-innovation in the period covered by CIS 4.
Lastly, our exclusion variable asserts that former soviet countries are indeed active
innovators and they tend to engage in conventional innovation slightly more than their other
European counterparts. This result could be the reflection of on-going process of
technological, economic and social change within the ex-soviet countries.
4.2. Estimations conducted by groups of countries
The analyses presented in the Section 4.1 aimed at drawing a general picture of eco-
innovators within the 15 EU countries considered in the survey. However, 104,943
observations make for a huge sample, which may results in having some explanatory
variables appear more significant in the estimations than they really are (due to the sheer
number of degrees of freedom available). Therefore, it makes sense to perform additional
estimations on sub-samples, which is what we do in our analysis by groups of countries.
Indeed, another important aim of this research is to compare and contrast the profiles of eco-
innovators between different countries (or groups of countries). In order to do so, we have
separated the countries according to their geographic proximity. As a result, four different
country groups ―Western Europe‖, ―Mediterranean‖, ―Eastern Europe‖ and ―Baltic‖ have
been created. Accordingly, the Western European group comprises Germany, Belgium and
Norway where Germany is the country of reference for comparison. We deemed it more
relevant to include Norway in this group not because of its geographic proximity to Germany
or to Belgium but as a result of its economic, technologic and social proximity to these
countries. The Mediterranean group includes Spain, Greece and Portugal where Spain is the
country of reference within this group. Lithuania, Latvia and Estonia form the third group,
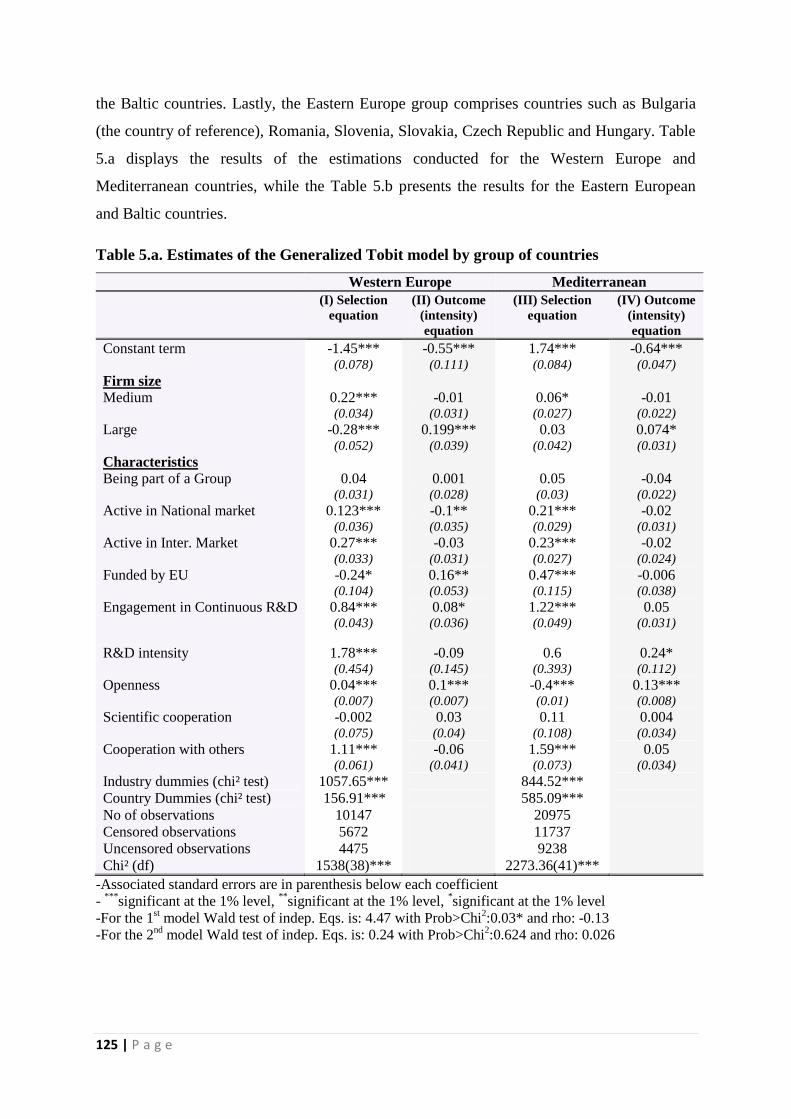
125 | P a g e
the Baltic countries. Lastly, the Eastern Europe group comprises countries such as Bulgaria
(the country of reference), Romania, Slovenia, Slovakia, Czech Republic and Hungary. Table
5.a displays the results of the estimations conducted for the Western Europe and
Mediterranean countries, while the Table 5.b presents the results for the Eastern European
and Baltic countries.
Table 5.a. Estimates of the Generalized Tobit model by group of countries
Western Europe Mediterranean
(I) Selection
equation
(II) Outcome
(intensity)
equation
(III) Selection
equation
(IV) Outcome
(intensity)
equation
Constant term -1.45*** (0.078)
-0.55*** (0.111)
1.74*** (0.084)
-0.64*** (0.047)
Firm size
Medium 0.22*** (0.034)
-0.01 (0.031)
0.06* (0.027)
-0.01 (0.022)
Large -0.28*** (0.052)
0.199*** (0.039)
0.03 (0.042)
0.074* (0.031)
Characteristics
Being part of a Group 0.04 (0.031)
0.001 (0.028)
0.05 (0.03)
-0.04 (0.022)
Active in National market 0.123*** (0.036)
-0.1** (0.035)
0.21*** (0.029)
-0.02 (0.031)
Active in Inter. Market 0.27*** (0.033)
-0.03 (0.031)
0.23*** (0.027)
-0.02 (0.024)
Funded by EU -0.24* (0.104)
0.16** (0.053)
0.47*** (0.115)
-0.006 (0.038)
Engagement in Continuous R&D 0.84*** (0.043)
0.08* (0.036)
1.22*** (0.049)
0.05 (0.031)
R&D intensity 1.78*** (0.454)
-0.09 (0.145)
0.6 (0.393)
0.24* (0.112)
Openness 0.04*** (0.007)
0.1*** (0.007)
-0.4*** (0.01)
0.13*** (0.008)
Scientific cooperation -0.002 (0.075)
0.03 (0.04)
0.11 (0.108)
0.004 (0.034)
Cooperation with others 1.11*** (0.061)
-0.06 (0.041)
1.59*** (0.073)
0.05 (0.034)
Industry dummies (chi² test) 1057.65*** 844.52***
Country Dummies (chi² test) 156.91*** 585.09***
No of observations 10147 20975
Censored observations 5672 11737
Uncensored observations 4475 9238
Chi² (df) 1538(38)*** 2273.36(41)***
-Associated standard errors are in parenthesis below each coefficient
- ***
significant at the 1% level, **
significant at the 1% level, *significant at the 1% level
-For the 1st model Wald test of indep. Eqs. is: 4.47 with Prob>Chi
2:0.03* and rho: -0.13
-For the 2nd
model Wald test of indep. Eqs. is: 0.24 with Prob>Chi2:0.624 and rho: 0.026

126 | P a g e
At first glance, we observe that only the firm size and openness indicator has established
its significance for the eco-innovators within each country group. This indicates that large
firms are more likely to be eco-innovators while their openness is another factor that assists
them throughout the eco-innovation process. Additionally, the country groups diverge from
each other with regard to the significance of conventional innovation inputs and their
cooperative behaviour. The former has a more significant effect among Western European
and Mediterranean countries, whereas the latter is more significant in Eastern European and
Baltic countries.
Furthermore, besides being large in size, and being open to use of external sources of
information, the Western European eco-innovators tend to engage in R&D on a continuous
basis. This may point out the significance of the technical and scientific knowledge and
experience that could be accrued from doing R&D. Financial funding provided by the EU is
another significant factor for the Western European eco-innovators. Indeed, considering the
double externality problem (Rennings, 2000), financial funds are becoming increasingly
important to change firms‘ innovative behaviour to a more sustainable one. Due to the
presence of two distinct externalities inherent in eco-innovation (the first being the usual
knowledge spill-overs that occur during the production of an innovation and the second being
positive environmental externalities), financial funds and subsidies can mitigate the financial
risks involved in eco-innovation.
Mediterranean eco-innovators also tend to be large in size and open to use of external
sources of information. Moreover, unlike their Western European counterparts, they tend to
eco-innovate by increasing internal and external R&D expenditures, hence R&D intensity.
This indicates that both in the Western and the Mediterranean countries conventional
innovation inputs are regarded as of the utmost importance for eco-innovation. This result
may also be an indication of a comparatively longer R&D history within these countries
(when contrasted to Central European and Baltic countries).

127 | P a g e
Table 5.b. Estimates of the Generalized Tobit model by group of countries
Eastern Europe Baltic
(I) Selection
equation
(II) Outcome
(intensity)
equation
(I) Selection
equation
(II) Outcome
(intensity)
equation
Constant term 5.41***
(0.261)
-0.78***
(0.037)
2.87***
(0.247)
-0.86***
(0.093)
Firm size
Medium 0.25***
(0.026)
0.01
(0.021)
0.11
(0.084)
-0.04
(0.047)
Large 0.488***
(0.033)
0.09***
(0.026)
0.46***
(0.115)
0.11
(0.081)
Characteristics
Being part of a Group 0.14***
(0.031)
-0.03
(0.02)
0.25**
(0.097)
-0.1*
(0.047)
Active in National market 0.32***
(0.024)
0.005
(0.019)
0.41**
(0.151)
0.01
(0.062)
Active in Inter. Market 0.35***
(0.028)
0.07***
(0.021)
0.41***
(0.091)
0.16**
(0.057)
Funded by EU 1.08***
(0.211)
0.02
(0.034)
0.63
(0.427)
0.01
(0.062)
Engagement in Continuous R&D 1.6***
(0.115)
0.02
(0.027)
0.95***
(0.228)
0.01
(0.068)
R&D intensity 4.72***
(1.384)
-0.002
(0.097)
-2.2
(1.3)
-0.08
(0.315)
Openness -0.71***
(0.03)
0.19***
(0.007)
-0.32***
(0.025)
0.14***
(0.019)
Scientific cooperation 0.16
(0.171)
0.17***
(0.031)
-0.09
(0.262)
0.17*
(0.065)
Cooperation with others 1.78***
(0.108)
-0.04
(0.027)
1.69***
(0.177)
0.06
(0.087)
Industry dummies (chi² test) 1059.7*** 610.83***
Country Dummies (chi² test) 2028.1*** 343.06***
No of observations 30942 2855
Censored observations 19461 1040
Uncensored observations 11481 1815
Chi² (df) 5044.38(44)*** .
-Associated standard errors are in parenthesis below each coefficient
- ***
significant at the 1% level, **
significant at the 1% level, *significant at the 1% level
-For the 1st model Wald test of indep. Eqs. is: 10.85 with Prob>Chi
2:0.001** and rho: -0.13
-For the 2nd
model Wald test of indep. Eqs. is: 0.1 with Prob>Chi2:0.749 and rho: 0.09
Eastern European eco-innovators distinguish themselves from Western and
Mediterranean eco-innovators by the importance of establishing formal cooperation with
scientific partners. Provided that openness is another significant characteristic of the eco-
innovators within this country group, we can claim that information is a key factor that can

128 | P a g e
increase firms‘ eco-innovation intensity. Moreover, eco-innovators within this country group
tend be active in international markets which create an adequate environment for firms to
learn about new environmental standards, technological advancements and establish networks
that can provide invaluable knowledge and information that can be utilized throughout the
eco-innovation process. Mazzanti and Zoboli (2005) show that networking activities may
constitute great importance for environmental innovation, even more important than
structural characteristics of firms such as size.
Eco-innovators in the Baltic countries tend to have similar characteristics as their Eastern
European counterparts. Accordingly, besides being large in size, and being open to use of
internal and external source of information, they are also active in international markets and
more likely to establish formal cooperation with scientific partners. Additionally, they also
tend to be individual firms that are responsible from their own innovative strategy. Therefore,
both the Eastern European and the Baltic eco-innovators, in general sense, tend to be more
social in their attitude towards eco-innovation incorporating various other partners within the
eco-innovation process.
In general, we can conclude that the results that obtained from the global model are
robust to country-specific analyses. Both level of analyses show that certain firm
characteristics associated with a higher intensity of eco-innovation (namely, size and
openness) are commonly shared among firms within all country groups. Other favourable
characteristics (being active on the international market and cooperating with scientific
partners) appear in two country groups, namely Central European counties and Baltic
countries.
Moreover, the importance of conventional R&D inputs and networking activities change
respective to the country group, pointing out the differences inherent in each country groups
with regard to their eco-innovation behaviour. Both Western European and Mediterranean
countries are long-term EU members and enjoyed the welfare gains and standardization
enabled by the EU. The EU aims at establishing standardization among countries, especially
with regard to environmental issues, and attains a higher level of innovative efforts towards
eco-innovation by providing incentives for innovation and passing new laws and regulations
to solve sustainability problems. The EU‘s Gothenburg Summit (2001) and Lisbon strategy
(2010) are the primary examples of this strategic behaviour. Therefore, expectedly Western
European and Mediterranean firms are relatively more mature than their Eastern European
and Baltic counterparts in dealing with environmental issues and moreover, in eco-

129 | P a g e
innovating. The fact that most of Eastern Europeans and Baltic countries become EU‘s
member states by the end of our observation period (2004) may indicate that firms within
these country groups may be in need of additional time to comply with existing rules,
standards and regulation and moreover, to eco-innovate at the same level as their Western
European and Mediterranean counterparts. While fierce competition in European markets and
existing technological differences among country groups may force Eastern European and
Baltic firms to speed up their innovation production process, the realization of a successful
eco-innovation, as mentioned earlier, is more difficult. It may require additional knowledge,
information, technical and organizational capabilities that potential eco-innovative firms in
the latter two country groups do not possess. In order to reduce these differences, eco-
innovative firms within the Eastern European and the Baltic countries may use their
networking activities for their advantage. As Hemmelskamp (1999) stated, potential eco-
innovative companies are likely to have a lower R&D intensity and tend to countervail their
low R&D effort with the use of external sources of information. This is especially true in the
case of lack of technological capabilities and increasing need for technical and organizational
knowledge for a successful eco-innovation. Indeed, the networking, be it by being open to the
use of external sources of information, or by cooperating with scientific or other partners,
may convey invaluable knowledge required to undertake an eco-innovation. De Marchi
(2012) supports our claim by asserting the role of engagement in continuous R&D activities
and cooperation activities as a driver of eco-innovation. We observed that both of these
factors are indeed crucial to undertake a successful eco-innovation.
5. Conclusion
Despite its relatively new appearance in the literature, eco-innovation succeeded to
attract the attention of many as one of the most important factors to overcome world‘s
sustainability challenges. On the one hand, the complexity of measuring the environmental
aspect of an innovation makes it troublesome to gather data and conduct empirical analysis,
which has hitherto resulted in a relative lack of empirical evidence about the driving forces of
eco-innovation. On the other hand, the eco-innovation literature acknowledges the
importance of both conventional (technology-push and market-pull) innovation drivers and
environmental regulatory framework as the primary drivers of eco-innovation. However as
the eco-innovative process becomes more complex, the role of (and need for) firm-specific
capabilities and competencies is getting increasingly important. The acquisition of these
capabilities and competencies often comes to rely on cooperation. These statements have led

130 | P a g e
us to investigate, besides conventional innovation drivers and regulatory framework, the role
of other firm-specific characteristics and capabilities in the eco-innovation process.
Accordingly, this paper aimed at identifying, among firm capabilities that are thought to be
essential to the innovation process, those characteristics which more specifically favoured the
introduction of innovations with positive environmental consequences.
To do so, we estimated an (eco-)innovation production function on micro-anonymised
data constructed from firm-level CIS4 (2004) data and covering 104,943 observations across
15 countries. Adapting the ―innovativity‖ approach proposed by Mairesse and Mohnen
(2002), we estimated a Generalized Tobit model in which the first equation deals with
selection into innovation and the second equation measures the intensity of eco-innovation.
This model allowed us to address the selectivity issue that the CIS 4 data may cause.
Moreover, we estimated two different specifications of the model in order to check the
robustness of the results. The models were first estimated on the whole sample of 104,943
micro-anonymised observations and then within four mutually exclusive groups of countries
(Western European countries, Mediterranean countries, Eastern/Central European countries,
and Baltic countries).
Our global estimation results indicate that, among the structural characteristics of a firm,
being a large and individual firm (i.e., not a subsidiary) is positively associated with a higher
intensity of eco-innovation. Being open to the use of external sources of knowledge is
another significant attribute of successful eco-innovators. Moreover, we find evidence
supporting Hemmelskamp‘s (1999) claims that eco-innovative firms tend to countervail a
lower R&D intensity by cooperating with public research institutes, universities and other
higher education institutions. Indeed, increasing R&D intensity may not be sufficient to
successfully develop eco-innovation. This suggests one should treat eco-innovation apart
from conventional innovation, since the former may require specific intentions, capabilities,
considerations, knowledge stock, know-how, strategic planning and more in order to be
successfully achieved. Without embedding the environmental issues into the basic R&D
efforts one cannot come up with an eco-innovation (ruling out, here, the innovations with
unintended positive environmental consequences). Furthermore, while it is generally assumed
that more competitive market conditions would lead firms to be more innovative, here only
being active on the international market seems to matter for eco-innovation. Being active on
the international market does not necessarily imply a fiercer competition, but could expose
firms to a more heterogeneous demand, with more widespread requests for "greener"
products.
131 | P a g e
The by-group analyses show that the main results obtained with the global model are
robust to country-specific analyses, while highlighting some divergences between different
groups of countries as regards their eco-innovation behaviour. More precisely, firm size and
openness appear as the main determinants of eco-innovation within all country groups. By
contrast, the importance of conventional R&D inputs and networking activities change with
the country groups. The former are more significant in Western European and Mediterranean
countries while the latter is more significant in Eastern European and Baltic countries. We
attribute this divergence to fierce competition in the European markets and the existing
technological differences among these country groups. These factors may give Eastern
European and Baltic firms incentives to accelerate their innovation production process in
order to ameliorate their technological base and catch up with the overall European standards.
In order to do so firms may require additional knowledge, information, technical and
organizational capabilities that the potential eco-innovative firm does not possess. Therefore,
closing this technological gap among countries might be dependent on how well they can
complement the eco-innovation process with the external information and knowledge.
To sum it up, this research does not deny the importance of conventional innovation
drivers (such as firm size) as drivers of eco-innovation. It does, however, point out to some
firm characteristics (such as openness and cooperation) that may act as specific drivers of
eco-innovation. This suggests that eco-innovation differs from conventional innovations to a
certain extent and that both should be treated as two separate instances. In particular, firms
R&D effort is clearly not enough when eco-innovation is the concern. Cooperation, openness
to external sources of knowledge and networking are key factors to a successful eco-
innovation. It seems, thus, that successful eco-innovations depend not only on firms‘
individual efforts but, also (and perhaps primarily) on joint efforts realized by governments,
firms and (private and public) research institutions.

132 | P a g e
APPENDICES
To test the robustness of the previous results, we considered also different specifications
of the dependent variable. Accordingly, we specified the dependent variables in two distinct
ways. In our first approach, we separately re-coded our two eco-innovation proxies i) reduced
environmental impacts or improved health and safety (ECO1) and ii) reduced materials and
energy per unit output (ECO2) as binary dependent variables and conduct two separate
estimations. The first dependent variable takes the value of 1, if the realized innovation has a
relevant reduced environmental impact or improved health and safety and 0 otherwise. While,
the second proxy is coded as 1, if the realized innovation has led to a reduced materials and
energy per unit output and 0 otherwise. The results of this approach are presented in the
Appendix A.
In our second approach, our dependent variables of interest are categorical variables
coded from 0 to 3 in order to indicate the relative importance of the environmental impacts, i)
reduced environmental impacts or improved health (EENV) and, safety and ii) reduced
materials and energy per unit output (EMAT), of their product and/or process innovation
introduced during the three years 2002 to 2004. Accordingly, the responses take value from 0
to 3 (0 being not relevant to 3 being highly important). The results of this approach are
presented in the Appendix B.
In both of these approaches we explicitly take into account sample selection. In the first
approach (Appendix A), this leads to the estimation of a "Heckman Probit" in which the
selection equation and the intensity equation (both specified as Probit equations) are jointly
estimated by ML. In the second approach (Appendix B), this amounts to the joint estimation
of a Probit selection equation and an Ordered Probit intensity equation. The joint estimation
is performed by ML using the cmp module for Stata (Roodman, 2009).
In what follows, Table A.1 and A.3 in Appendix A (and B.1 and B.3 in Appendix B)
present the estimates of the models with a country fixed-effect (and no exclusion variable)
and with the "Soviet" exclusion variable (and no country fixed effect) respectively. Tables
A.2.a and A.4.a in Appendix A (and B.2.a and B.4.a in Appendix B) display the results of the
estimations conducted for the Western Europe and Mediterranean countries, while Tables
A.2.b and A.4.b (B.2.b and B.4.b in Appendix B) present the results for Eastern European
and Baltic countries.

133 | P a g e
Appendix A
A.1. The results of global model on ECO1
At first glance, we observe that the significance of the estimated coefficients in our new
approach deviates from our previous results to a certain extent. This time the country fixed-
effect model indicates that the funds provided by the EU, continuity of R&D efforts and
moreover, R&D intensity are among the factors that significantly increases firms‘ eco-
innovation intensity. The significance of firm size, being an individual firm, international
market conditions, firms‘ openness and formal cooperation between scientific organisations
are also consolidated. Furthermore, the benchmark model points out the same direction.
Accordingly, eco-innovative firms tend to be individual medium and large size firms that are
active in international markets. They distinguish themselves from the other firms by giving
significant importance to the funds provided by the EU, engagement in continuous R&D,
being open to the internal and external sources of knowledge and, formal cooperation with
the scientific and non-scientific organisations. We also detect a substantial difference in
significance of two variables. Accordingly, in our new estimation results we also observe that
the impact of being medium size firm and impact of R&D intensity is also significantly
positive, unlike in our global model.

134 | P a g e
Table A.1. Estimates of the Heckman Probit Model for eco-innovation (ECO1)
With a country fixed-effect With an exclusion variable
(I) Selection
equation
(II)
Outcome
(intensity)
equation
(III) Selection
equation
(IV)
Outcome
(intensity)
equation
Constant term 0.23*** (0.043)
-1.31*** (0.062)
0.94*** (0.036)
-1.09*** (0.041)
Firm size
Medium 0.18*** (0.015)
0.045* (0.02)
0.11*** (0.014)
0.05* (0.02)
Large 0.2*** (0.021)
0.17*** (0.027)
0.11*** (0.021)
0.18*** (0.026)
Characteristics
Being part of a Group 0.01*** (0.016)
-0.06** (0.02)
-0.01 (0.016)
-0.01*** (0.019)
Active in National market 0.24*** (0.015)
0.01 (0.022)
0.26*** (0.013)
0.0 (0.020)
Active in Inter. Market 0.28*** (0.015)
0.05* (0.02)
0.26*** (0.014)
0.04* (0.02)
Funded by EU 0.53*** (0.072)
0.1** (0.038)
0.61*** (0.068)
0.13*** (0.038)
Engagement in continuous R&D 1.17*** (0.029)
0.08** (0.029)
1.1*** (0.028)
0.08**
(0.029)
R&D intensity 1.99*** (0.31)
0.29** (0.107)
1.73*** (0.282)
0.29** (0.105)
Openness -0.29*** (0.005)
0.2*** (0.006)
-0.3*** (0.004)
0.19*** (0.008)
Scientific cooperation 0.01 (0.054)
0.12*** (0.03)
-0.03 (0.051)
0.11*** (0.029)
Cooperation with others 1.53*** (0.037)
0.01 (0.03)
1.63*** (0.034)
0.05*** (0.037)
Exclusion variable
Soviet -
-
0.24*** (0.013)
Industry dummies (chi² test) 2466.61*** 2561.77***
Country Dummies (chi² test) 3201.38*** -
No of observations 65058 65058
Censored observations 37910 37910
Uncensored observations 27148 27148
Chi²(df) 4653.28(53)*** 4312.88(39)***
-Associated standard errors are in parenthesis below each coefficient
- ***
significant at the 1% level, **
significant at the 1% level, *significant at the 1% level
-For the 1st model Wald test of indep. Eqs. is: 1.39 with Prob>Chi
2:0.2377 and rho: 0.048
-For the 2nd
model Wald test of indep. Eqs. is: 6.25 with Prob>Chi2:0.0124* and rho: 0.12
135 | P a g e
A.2. The results of the country specific analyses on ECO1
The country specific analyses display another picture of the relationship between the
selection into innovation and intensity of eco-innovation, and firm characteristics.
Accordingly, the Western European eco-innovators tend to be large firms that can efficiently
use the funds provided by the EU and more importantly, they assist their innovation process
with the use of internal and external sources of information hence by being open.
Mediterranean eco-innovators, however, tend to be large individual firms that give significant
importance to the R&D intensity in order to produce successful innovations while using the
internal and external sources of information. Therefore, the main difference between the
Western European and Mediterranean eco-innovators is the relative importance given to the
R&D intensity.

136 | P a g e
Table A.2.a. Estimates of the Global model by group of countries
Western Europe Mediterranean
(I) Selection
equation
(II)
Outcome
(intensity)
equation
(III) Selection
equation
(IV) Outcome
(intensity)
equation
Constant term -1.43*** (0.078)
-0.53 (0.294)
1.74*** (0.084)
-1.01*** (0.075)
Firm size
Medium 0.22*** (0.033)
0.01 (0.052)
0.06* (0.027)
0.06 (0.035)
Large -0.26*** (0.052)
0.27*** (0.067)
0.03 (0.042)
0.17*** (0.049)
Characteristics
Being part of a Group 0.035 (0.031)
-0.05 (0.045)
0.05 (0.03)
-0.11** (0.035)
Active in National market 0.134*** (0.036)
-0.05 (0.058)
0.21*** (0.029)
-0.01 (0.049)
Active in Inter. Market 0.26*** (0.036)
-0.08 (0.054)
0.23*** (0.027)
-0.04 (0.037)
Funded by EU -0.25* (0.104)
0.19* (0.091)
0.47*** (0.115)
0.04 (0.062)
Engagement in Continuous R&D 0.84*** (0.043)
0.07 (0.083)
1.22*** (0.049)
0.08 (0.051)
R&D intensity 1.8*** (0.452)
-0.2 (0.249)
0.5 (0.393)
0.38* (0.185)
Openness 0.04*** (0.007)
0.18*** (0.014)
-0.4*** (0.01)
0.2*** (0.015)
Scientific cooperation -0.02 (0.076)
0.04 (0.066)
0.11 (0.108)
0.02 (0.055)
Cooperation with others 1.12*** (0.061)
-0.13 (0.096)
1.59*** (0.074)
0.06 (0.056)
Industry dummies (chi² test) 699.48*** 845.88***
Country Dummies (chi² test) 157.97*** 509.85***
No of observations 10194 20977
Censored observations 5672 11737
Uncensored observations 4522 9240
Chi²(df) 713.66(38)*** 1526.77(41)***
-Associated standard errors are in parenthesis below each coefficient
- ***
significant at the 1% level, **
significant at the 1% level, *significant at the 1% level
-For the 1st model Wald test of indep. Eqs. is: 1.02 with Prob>Chi
2:0.3133 and rho: -0.16
-For the 2nd
model Wald test of indep. Eqs. is: 0.05 with Prob>Chi2:0.8218 and rho: 0.02

137 | P a g e
Table A.2.b. Estimates of the Global model by group of countries
Eastern Europe Baltic
(I) Selection
equation
(II) Outcome
(intensity)
equation
(III) Selection
equation
(IV) Outcome
(intensity)
equation
Constant term 5.4***
(0.26)
-1.16***
(0.058)
2.87***
(0.246)
-1.46***
(0.157)
Firm size
Medium 0.25*** (0.026)
0.01 (0.032)
0.11 (0.084)
0.07 (0.075)
Large 0.48*** (0.033)
0.13** (0.041)
0.46*** (0.114)
0.13 (0.123)
Characteristics
Being part of a Group 0.15*** (0.031)
-0.04 (0.032)
0.26** (0.097)
-0.08 (0.077)
Active in National market 0.32***
(0.024)
0.04
(0.03)
0.42**
(0.15)
0.23*
(0.093)
Active in Inter. Market 0.35*** (0.028)
0.13***
(0.031)
0.4***
(0.09)
0.35*** (0.086)
Funded by EU 1.07*** (0.213)
0.13* (0.063)
0.63 (0.419)
0.21 (0.172)
Engagement in Continuous R&D 1.6*** (0.115)
0.001 (0.042)
0.95*** (0.226)
0.15 (0.094)
R&D intensity 4.67*** (1.373)
0.58** (0.179)
-2.26 (1.269)
-0.08 (0.561)
Openness -0.71*** (0.03)
0.21*** (0.009)
-0.32*** (0.025)
0.21*** (0.022)
Scientific cooperation 0.15 (0.17)
0.23*** (0.048)
-0.09 (0.25)
0.42*** (0.108)
Cooperation with others 1.77*** (0.107)
-0.05 (0.038)
1.69*** (0.176)
0.06 (0.096)
Industry dummies (chi² test) 1003***
1071.13***
Country Dummies (chi² test) 1012.05*** 360.6***
No of observations 31032 2855
Censored observations 19461 1040
Uncensored observations 11571 1815
Chi²(df) 1834.76(44)*** .
-Associated standard errors are in parenthesis below each coefficient
- ***
significant at the 1% level, **
significant at the 1% level, *significant at the 1% level
-For the 1st model Wald test of indep. Eqs. is: 0.996 with Prob>Chi
2: 0.00*** and rho: -0.0002
-For the 2nd
model Wald test of indep. Eqs. is: 1.1 with Prob>Chi2: 0.2935 and rho: 0.21

138 | P a g e
We observe a similar difference between the Eastern European and Baltic eco-
innovators. We note that each country group value different innovation inputs. For example,
the estimation results indicate the fact that the Eastern European eco-innovators put more
emphasis on the importance of R&D intensity even though they do not necessarily engage in
intramural R&D efforts. They also complement their shortcomings with internal and external
information and, cooperative efforts with the scientific institutions. The eco-innovators in the
Baltic countries however, choose to countervail technical aspects of innovation process with
the use of internal and external sources of information and, establishing formal bond with the
scientific institutions. Besides their attitude towards the innovative process, their structural
characteristics also deviate. We observe that eco-innovators in the Eastern European
countries tend to be large in size and in search of external financial aid to engage in eco-
innovation activities. Nevertheless, international market condition seems to be a significant
factor affecting the eco-innovation intensity of firms within both of the country groups.
Additionally, national market condition perceived as a significant factor only in the Baltic
countries.
A.3. The results of global model on ECO2
Table A.3 below presents the estimation results obtained from the Heckman Probit with a
country fixed-effect and the Heckman Probit with an exclusion variable. As mentioned in the
beginning of this section, the dependent variable used in this approach is a binary response
variable indicating whether the realized innovation has led to ―reduced materials and energy
per unit output‖ (ECO2).
By inspecting the estimation results we can notice that the country fixed-effect model
and the benchmark model contradict each other only on the impact of size, where this
variation could be attributed to the inclusion of an exclusion variable. Accordingly, the
country fixed-effect estimation result points out that eco-innovator tend to be large individual
firm that pursues continuous R&D while trying to assist the innovative process with the use
of internal and external sources of knowledge. Moreover, we can also note that national
market conditions tend to have a significant negative impact on the intensity of eco-
innovation. Furthermore, the result of the benchmark model shows that being medium and
large size firm, national market conditions, the funds provided by the EU and the R&D
intensity tend to negatively effects firms‘ eco-innovation intensity. While, international
market conditions, engagement in continuous R&D efforts, the use of internal and external
sources of knowledge and, formal cooperation with other non-scientific organizations tend to

139 | P a g e
increase eco-innovation intensity. Even though, these two models contradicts each other and
show a slight deviation from each other the significance of most of the variables is
established.
Table A.3. Estimates of the Heckman Probit Model for eco-innovation (ECO2)
With a country fixed-effect With an exclusion variable
(I) Selection
equation
(II)
Outcome
(intensity)
equation
(III) Selection
equation
(IV)
Outcome
(intensity)
equation
Constant term 0.23*** (0.043)
-1.17*** (0.066)
0.94*** (0.037)
-1.03*** (0.041)
Firm size
Medium 0.18*** (0.015)
0.015 (0.021)
0.114*** (0.014)
-0.1*** (0.02)
Large 0.2*** (0.021)
0.14*** (0.028)
0.111*** (0.021)
-0.077** (0.025)
Characteristics
Being part of a Group 0.01*** (0.017)
-0.06** (0.021)
-0.009 (0.016)
-0.077 (0.019)
Active in National market 0.24*** (0.015)
-0.055* (0.023)
0.256*** (0.013)
-0.11*** (0.019)
Active in Inter. Market 0.28*** (0.015)
0.023 (0.023)
0.265*** (0.014)
0.052** (0.02)
Funded by EU 0.52*** (0.073)
-0.022 (0.038)
0.613*** (0.069)
-0.097** (0.036)
Engagement in Continuous R&D 1.17*** (0.029)
0.01*** (0.029)
1.088*** (0.028)
0.31*** (0.029)
R&D intensity 1.99*** (0.311)
0.11 (0.108)
1.745*** (0.284)
-0.28** (0.098)
Openness -0.29*** (0.005)
0.205*** (0.006)
-0.297*** (0.004)
0.16*** (0.008)
Scientific cooperation 0.01 (0.054)
0.016 (0.03)
-0.033 (0.051)
0.04 (0.029)
Cooperation with others 1.53*** (0.038)
-0.034 (0.03)
1.627*** (0.034)
0.19*** (0.038)
Exclusion variable
Soviet -
-
0.243*** (0.013)
Industry dummies (chi² test) 1742.91*** 1849.82***
Country Dummies (chi² test) 4218.52*** -
No of observations 65058 65058
Censored observations 37910 37910
Uncensored observations 27148 27148
Chi²(df) 4099.12(53)*** 3542.65(39)***
-Associated standard errors are in parenthesis below each coefficient
- ***
significant at the 1% level, **
significant at the 1% level, *significant at the 1% level
-For the 1st model Wald test of indep. Eqs. is: 1.16 with Prob>Chi
2: 0.2819 and rho: -0.045
-For the 2nd
model Wald test of indep. Eqs. is: 1.01 with Prob>Chi2: 0.3152 and rho: 0.05

140 | P a g e
A.4. The country specific analyses on ECO2
The country specific analyses give us significant clues in order to identify the eco-
innovators within different country groups. The results assert that the eco-innovators in the
Western European countries are tend to be large firms that engage in continuous R&D and
open to the use of internal and external sources of information. Moreover, we can also note
that the national market tend to hinder the eco-innovation intensity indicating that the
national market conditions are still away from being a significant driver for the introduction
and development of innovations with the reduced materials and energy per unit output
(ECO2). The Mediterranean countries however, tend to differ from their Western European
counterparts in regard to size. Accordingly, the size is not a significant factor affecting firms‘
eco-innovation intensity in Mediterranean countries. Nevertheless, we can observe that R&D
intensity, continuous engagement in R&D efforts and firms‘ openness to the use of internal
and external knowledge sources have significant positive impact on the firms‘ eco-innovation
intensity.

141 | P a g e
Table A.4.a. Estimates of the Global model by group of countries (ECO2)
Western Europe Mediterranean
(I) Selection
equation
(II) Outcome
(intensity)
equation
(III) Selection
equation
(IV)
Outcome
(intensity)
equation
Constant term -1.42***
(0.078)
-1.22***
(0.232)
1.74***
(0.084)
-0.79***
(0.072)
Firm size
Medium 0.22*** (0.033)
0.04 (0.051)
0.06* (0.027)
-0.02 (0.034)
Large -0.26*** (0.052)
0.26*** (0.066)
0.03 (0.042)
0.08 (0.048)
Characteristics
Being part of a Group 0.035 (0.031)
-0.035 (0.046)
0.06 (0.03)
-0.06 (0.035)
Active in National market 0.13***
(0.036)
-0.14*
(0.058)
0.21***
(0.029)
-0.08
(0.048)
Active in Inter. Market 0.26*** (0.033)
0.07 (0.052)
0.23*** (0.027)
-0.02 (0.036)
Funded by EU -0.24* (0.104)
0.07 (0.087)
0.47*** (0.115)
-0.06 (0.059)
Engagement in Continuous R&D 0.84*** (0.043)
0.164* (0.07)
1.22*** (0.049)
0.12* (0.048)
R&D intensity 1.8*** (0.455)
0.03 (0.237)
0.59 (0.393)
0.43* (0.182)
Openness 0.04*** (0.007)
0.18*** (0.013)
-0.4*** (0.01)
0.17*** (0.014)
Scientific cooperation -0.015 (0.076)
-0.09 (0.065)
0.11 (0.109)
-0.07 (0.052)
Cooperation with others 1.2*** (0.061)
0.025 (0.083)
1.6*** (0.073)
0.03 (0.053)
Industry dummies (chi² test) 668.76*** 494.26***
Country Dummies (chi² test) 157.77*** 496.09***
No of observations 10194 20977
Censored observations 5672 11737
Uncensored observations 4522 9240
Chi²(df) 728.14(38)*** 1005.51(41)***
-Associated standard errors are in parenthesis below each coefficient
- ***
significant at the 1% level, **
significant at the 1% level, *significant at the 1% level
-For the 1st model Wald test of indep. Eqs. is: 0.06 with Prob>Chi
2: 0.8089 and rho:0.03
-For the 2nd
model Wald test of indep. Eqs. is: 1.15 with Prob>Chi2:0.2836 and 0.083

142 | P a g e
Table A.4.b. Estimates of the Global model by group of countries
Eastern Europe Baltic
(I) Selection
equation
(II) Outcome
(intensity)
equation
(III)
Selection
equation
(IV) Outcome
(intensity)
equation
Constant term 5.41***
(0.261)
-1.27***
(0.067)
2.87***
(0.249)
-1.06***
(0.154)
Firm size
Medium 0.25*** (0.026)
0.055 (0.035)
0.11 (0.085)
-0.05 (0.074)
Large 0.48*** (0.033)
0.13** (0.044)
0.45*** (0.113)
0.11 (0.124)
Characteristics
Being part of a Group 0.14*** (0.031)
-0.075* (0.035)
0.26** (0.097)
-0.04 (0.075)
Active in National market 0.32***
(0.024)
-0.02
(0.034)
0.41**
(0.151)
0.14*
(0.091)
Active in Inter. Market 0.34*** (0.028)
0.09** (0.035)
0.4*** (0.092)
0.16*** (0.086)
Funded by EU 1.07*** (0.212)
-0.05 (0.065)
0.63 (0.426)
0.25 (0.175)
Engagement in Continuous R&D 1.6*** (0.114)
0.09* (0.044)
0.96*** (0.231)
0.16 (0.091)
R&D intensity 4.65*** (1.373)
-0.11 (0.182)
-2.23 (1.297)
0.58 (0.579)
Openness -0.71*** (0.03)
0.24*** (0.009)
-0.32*** (0.025)
0.2*** (0.022)
Scientific cooperation 0.15 (0.17)
0.09 (0.05)
-0.08 (0.252)
0.12*** (0.105)
Cooperation with others 1.76*** (0.107)
-0.09* (0.041)
1.69*** (0.177)
-0.001 (0.098)
Industry dummies (chi² test) 726.7*** 928.77***
Country Dummies (chi² test) 1736.22*** 344.23***
No of observations 31032 2855
Censored observations 19461 1040
Uncensored observations 11571 1815
Chi²(df) 5176.33(88)*** .
-Associated standard errors are in parenthesis below each coefficient
- ***
significant at the 1% level, **
significant at the 1% level, *significant at the 1% level
-For the 1st model Wald test of indep. Eqs. is: 0.55 with Prob>Chi
2: 0.4597** and rho: -0.18
-For the 2nd
model Wald test of indep. Eqs. is: 0.32 with Prob>Chi2: 0.5744 and rho: 0.12

143 | P a g e
Appendix B
B.1. The results of global model on EENV
In the main analyses, our dependent variable was the normalized continuous index built
from the factor analysis on two distinct eco-innovation proxies. In appendix A, we changed
our approach and we used a binary response model with sample selection hence a binary
response variable as the dependent variable. As mentioned before, in this section we change
our approach towards the main dependent variables and we use two distinct ordered response
variables (EENV and EMAT).
In the present section we discuss the results with those pertaining to EENV. By
inspecting the result of the country fixed-effect model, we note that the results slightly
deviate from the main results. Accordingly, we affirm that, in general, the eco-innovators
tend to be large individual firms that are mainly active in international markets and can
efficiently use the funds provided by the EU. More importantly, we can also claim that the
formal cooperation with scientific organizations and the use of internal and external sources
of knowledge are other significant characteristics commonly shared among the eco-
innovators.

144 | P a g e
Table B.1. Ordered Response Models with Sample Selection (using EENV Proxy)
With a country fixed-effect With an exclusion variable
(I) Selection
equation
(II)
Outcome
(intensity)
equation
(III) Selection
equation
(IV)
Outcome
(intensity)
equation
Constant term 0.23*** (0.043)
-
0.94*** (0.037)
-
Firm size
Medium 0.18*** (0.015)
-0.001 (0.017)
0.11*** (0.014)
-0.003* (0.017)
Large 0.2*** (0.021)
0.1*** (0.022)
0.11*** (0.021)
0.12*** (0.021)
Characteristics
Being part of a Group 0.1*** (0.016)
-0.03* (0.016)
-0.01 (0.016)
-0.1*** (0.016)
Active in National market 0.24*** (0.014)
0.01 (0.019)
0.25*** (0.013)
0.008 (0.017)
Active in Inter. Market 0.28*** (0.015)
0.03* (0.018)
0.27*** (0.014)
0.016 (0.017)
Funded by EU 0.52*** (0.072)
0.13*** (0.03)
0.61*** (0.069)
0.15*** (0.03)
Engagement in Continuous R&D 1.16*** (0.029)
0.04 (0.03)
1.09*** (0.028)
-0.017 (0.029)
R&D intensity 1.99*** (0.31)
0.01 (0.089)
1.73*** (0.281)
0.12 (0.086)
Openness -0.29*** (0.004)
0.16*** (0.007)
-0.29*** (0.004)
0.16*** (0.009)
Scientific cooperation 0.012 (0.054)
0.14*** (0.023)
-0.03 (0.051)
0.11*** (0.023)
Cooperation with others 1.53*** (0.037)
0.02 (0.033)
1.63*** (0.034)
0.001 (0.04)
Exclusion variable
Soviet -
-
0.24*** (0.013)
Industry dummies (chi² test) 2335.83*** 2460.98***
Country Dummies (chi² test) 3289.64*** -
No of observations 65058 65058
Chi²(df) 15297.01(106)*** 14538.38(79)***
Cut-off points
Cut-off - 1 1.11***
(0.063)
0.74***
(0.04) Cut-off - 2 1.65***
(0.064) 1.28***
(0.04) Cut-off - 3 2.52***
(0.064) 2.13***
(0.041)
-Associated standard errors are in parenthesis below each coefficient
- ***
significant at the 1% level, **
significant at the 1% level, *significant at the 1% level
The benchmark model again consolidates the significance of our key variables. The only
significant difference between the country fixed-effect model and the benchmark model is the
role of the international market conditions. The significance of the estimated coefficients of
the rest of the variables is consolidated in our benchmark model.

145 | P a g e
B.2. Country specific analyses on EENV
The country specific analyses again give another picture of the eco-innovators within
each country groups. We observe that the Western European eco-innovators tend to be large
in size, receive financial support from the EU and are open to the use of internal and external
sources of knowledge. However, we also note that the national and international market
conditions seem to be far away from offering significant opportunities to engage in eco-
innovative activities. Instead, they seem to hinder firms‘ eco-innovation intensity.

146 | P a g e
Table B.2.a. Ordered Response Models with Sample Selection (EENV Proxy) by group of
countries
Western Europe Mediterranean
(I) Selection
equation
(II)
Outcome
(intensity)
equation
(III) Selection
equation
(IV)
Outcome
(intensity)
equation
Constant term -1.43***
(0.078)
-
1.74***
(0.085)
-
Firm size
Medium 0.22*** (0.033)
-0.03 (0.043)
0.06* (0.027)
-0.01 (0.028)
Large -0.26*** (0.052)
0.15** (0.054)
0.028 (0.042)
0.08* (0.039)
Characteristics
Being part of a Group 0.035 (0.031)
-0.017 (0.039)
0.06 (0.03)
-0.05 (0.028)
Active in National market 0.13***
(0.036)
-0.094*
(0.048)
0.2***
(0.029)
0.01
(0.042)
Active in Inter. Market 0.26*** (0.033)
-0.11* (0.043)
0.23*** (0.027)
-0.03 (0.033)
Funded by EU -0.245* (0.104)
0.23** (0.069)
0.47*** (0.115)
0.05 (0.049)
Engagement in Continuous R&D 0.84*** (0.043)
0.05 (0.054)
1.22*** (0.049)
0.046 (0.068)
R&D intensity 1.79*** (0.455)
-0.127 (0.22)
0.59 (0.393)
0.23 (0.15)
Openness 0.04*** (0.007)
0.14*** (0.013)
-0.4*** (0.01)
0.15*** (0.021)
Scientific cooperation -0.015 (0.076)
0.083 (0.054)
0.11 (0.109)
0.053 (0.042)
Cooperation with others 1.12*** (0.061)
-0.092 (0.062)
1.59*** (0.073)
0.04 (0.075)
Industry dummies (chi² test) 692.33*** 795.21***
Country Dummies (chi² test) 145.23*** 461.23***
No of observations 10194 20977
Chi²(df) 2818.34(76)*** 4489.24(82)***
Cut-off points
Cut-off - 1 0.34
(0.18) 0.65***
(0.07) Cut-off – 2 1.08***
(0.18) 1.2***
(0.07) Cut-off - 3 1.92***
(0.19) 2.05***
(0.072)
-Associated standard errors are in parenthesis below each coefficient
- ***
significant at the 1% level, **
significant at the 1% level, *significant at the 1% level
Furthermore, the results claim that the Mediterranean eco-innovators tend to be large
firms that are open to the use of internal and external sources of knowledge. We fail to
observe a significance relationship between the eco-innovation intensity and the rest of the
firm characteristics.
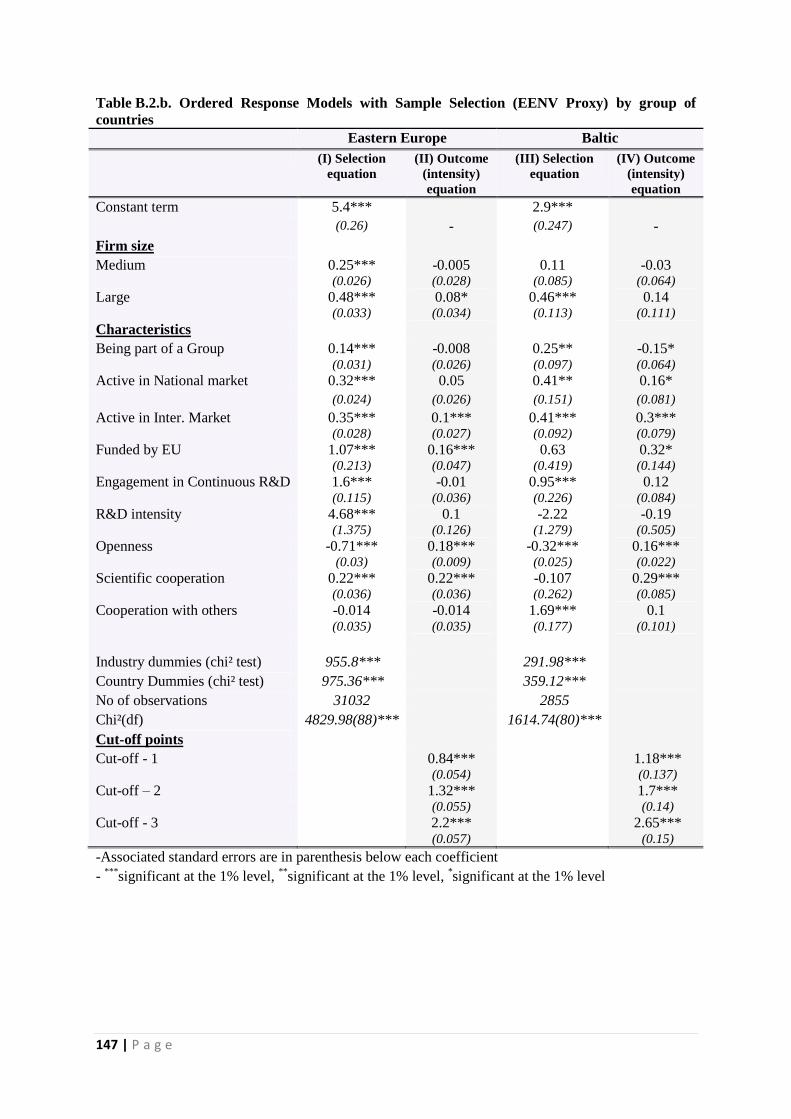
147 | P a g e
Table B.2.b. Ordered Response Models with Sample Selection (EENV Proxy) by group of
countries
Eastern Europe Baltic
(I) Selection
equation
(II) Outcome
(intensity)
equation
(III) Selection
equation
(IV) Outcome
(intensity)
equation
Constant term 5.4***
(0.26)
-
2.9***
(0.247)
-
Firm size
Medium 0.25*** (0.026)
-0.005 (0.028)
0.11 (0.085)
-0.03 (0.064)
Large 0.48*** (0.033)
0.08* (0.034)
0.46***
(0.113)
0.14 (0.111)
Characteristics
Being part of a Group 0.14*** (0.031)
-0.008 (0.026)
0.25** (0.097)
-0.15* (0.064)
Active in National market 0.32***
(0.024)
0.05
(0.026)
0.41**
(0.151)
0.16*
(0.081)
Active in Inter. Market 0.35*** (0.028)
0.1*** (0.027)
0.41*** (0.092)
0.3*** (0.079)
Funded by EU 1.07*** (0.213)
0.16*** (0.047)
0.63 (0.419)
0.32* (0.144)
Engagement in Continuous R&D 1.6*** (0.115)
-0.01 (0.036)
0.95*** (0.226)
0.12 (0.084)
R&D intensity 4.68*** (1.375)
0.1 (0.126)
-2.22 (1.279)
-0.19 (0.505)
Openness -0.71*** (0.03)
0.18*** (0.009)
-0.32***
(0.025) 0.16***
(0.022) Scientific cooperation 0.22***
(0.036) 0.22*** (0.036)
-0.107 (0.262)
0.29***
(0.085) Cooperation with others -0.014
(0.035) -0.014 (0.035)
1.69*** (0.177)
0.1
(0.101)
Industry dummies (chi² test) 955.8*** 291.98***
Country Dummies (chi² test) 975.36*** 359.12***
No of observations 31032 2855
Chi²(df) 4829.98(88)*** 1614.74(80)***
Cut-off points
Cut-off - 1 0.84*** (0.054)
1.18*** (0.137)
Cut-off – 2 1.32*** (0.055)
1.7***
(0.14) Cut-off - 3 2.2***
(0.057) 2.65***
(0.15)
-Associated standard errors are in parenthesis below each coefficient
- ***
significant at the 1% level, **
significant at the 1% level, *significant at the 1% level

148 | P a g e
B.3. The results of global model on EMAT
This section presents the results pertaining to the eco-innovation with ―reduced materials
and energy per unit output‖ (EMAT). The estimated coefficients obtained from the global
models take our attention to the significant differences between the two models.
On the one hand, our country fixed-effect model shows that eco-innovative firms tend to
be large and individual, while they also tend to be open to the use of internal and external
sources of information. Moreover, the national market conditions seem to have a significant
negative impact on firms‘ eco-innovation intensity.
On the other hand, our benchmark model claims that the international market conditions,
engagement in continuous R&D, openness of the company and formal cooperation with other
non-scientific partners tend to have significantly positive impact on the intensity of eco-
innovation. While, being medium size firm, national market conditions, funds provided by
the EU and intensity of R&D efforts seem to hinder firms‘ eco-innovation intensity. As a
result, we obtain two distinct estimation results from two distinct models. Our benchmark
model consolidates our previous estimation results while our country fixed-effect model
tends to yield significantly different results. We suspect that specification of the models could
lead such results.

149 | P a g e
Table B.3. Ordered Response Models with Sample Selection (EMAT Proxy)
With a country fixed-effect With an exclusion variable (I) Selection
equation
(II) Outcome
(intensity)
equation
(III) Selection
equation
(IV) Outcome
(intensity)
equation
Constant term 0.23*** (0.043)
-
0.94***
(0.037)
-
Firm size
Medium 0.17*** (0.015)
0.001 (0.017)
0.11***
(0.014)
-0.078***
(0.017) Large 0.2***
(0.021) 0.13***
(0.022)
0.11***
(0.021) -0.017 (0.021)
Characteristics
Being part of a Group 0.1***
(0.016)
-0.043** (0.016)
-0.009 (0.016)
-0.016 (0.015)
Active in National market 0.24***
(0.014)
-0.04* (0.019)
0.26***
(0.013) -0.084***
(0.017)
Active in Inter. Market 0.28***
(0.015) 0.02
(0.018) 0.265***
(0.014) 0.047** (0.017)
Funded by EU 0.53***
(0.072) -0.05 (0.03)
0.612***
(0.069) -0.081**
(0.03) Engagement in Continuous
R&D
1.17***
(0.029) 0.2
(0.03) 1.087***
(0.028) 0.16*** (0.029)
R&D intensity 1.99***
(0.31) 0.044 (0.089)
1.75***
(0.284) -0.241**
(0.083) Openness -0.29***
(0.004) 0.18***
(0.007) -0.29***
(0.004) 0.137***
(0.006) Scientific cooperation 0.014
(0.054) 0.02
(0.023) -0.033 (0.051)
0.025 (0.022)
Cooperation with others 1.53***
(0.037) -0.033 (0.033)
1.63***
(0.034) 0.186***
(0.026)
Exclusion variable
Soviet -
-
0.242***
(0.013)
Industry dummies (chi²
test)
1660.79*** 1706.23***
Country Dummies (chi²
test)
67252.82*** -
No of observations 65058 65058
Chi²(df) 122495.55
(106)***
13927.95 (79)***
Cut-off points
Cut-off - 1 1.02***
(0.066) 0.81***
(0.036) Cut-off – 2 1.77***
(0.068) 1.5***
(0.037) Cut-off - 3 2.71***
(0.07) 2.37***
(0.038)
-Associated standard errors are in parenthesis below each coefficient
- ***
significant at the 1% level, **
significant at the 1% level, *significant at the 1% level

150 | P a g e
B.4. Country specific analyses on EMAT
The country specific analyses aim at displaying the differences among country groups.
The results show that we indeed achieved to show profiles of successful eco-innovators
within different country groups.
When we inspect the estimation results, we can note that there are significant differences
inherent in the relative importance of firm characteristics for each country groups. The
comparison of Western European and Mediterranean countries indicate that the Western
European eco-innovators tend to be bigger in size and moreover, they also engage in
continuous R&D efforts. Mediterranean countries, however, give greater importance to the
R&D intensity rather than the continuity of R&D efforts. The openness measure, on the other
hand, is the only factor commonly shared between these country groups. Therefore, the
significance of the openness measure for the eco-innovators is again consolidated with these
new estimation results.

151 | P a g e
Table B.4.a. Ordered Response Models with Sample Selection (EMAT Proxy) by group of
countries
Western Europe Mediterranean
(I) Selection
equation
(II) Outcome
(intensity)
equation
(I) Selection
equation
(II) Outcome
(intensity)
equation
Constant term -1.42***
(0.078)
-
1.74***
(0.085)
-
Firm size
Medium 0.22***
(0.033) 0.011 (0.042)
0.057*
(0.027) -0.01
(0.028) Large -0.26***
(0.052) 0.268***
(0.052) 0.03
(0.042) 0.054 (0.038)
Characteristics
Being part of a Group 0.034 (0.031)
0.006 (0.038)
0.056 (0.03)
-0.026 (0.028)
Active in National market 0.13***
(0.036)
-0.13**
(0.047)
0.205***
(0.029)
-0.051
(0.042)
Active in Inter. Market 0.26***
(0.033) 0.06
(0.042) 0.234***
(0.027) -0.003 (0.032)
Funded by EU -0.24* (0.104)
0.108 (0.066)
0.472*** (0.115)
-0.054
(0.049) Engagement in Continuous R&D 0.845***
(0.043) 0.124*
(0.051) 1.219***
(0.049) 0.086
(0.068) R&D intensity 1.795***
(0.453) -0.011 (0.21)
0.596 (0.393)
0.328*
(0.138) Openness 0.039***
(0.007) 0.138***
(0.013) -0.404***
(0.01) 0.124***
(0.018) Scientific cooperation -0.017
(0.076) -0.036 (0.052)
0.105 (0.109)
-0.054 (0.042)
Cooperation with others 1.118***
(0.061) -0.043 (0.06)
1.588*** (0.073)
0.086
(0.063)
Industry dummies (chi² test) 644.5*** 463.52***
Country Dummies (chi² test) 146.76*** 657.81***
No of observations 10194 20977
Chi²(df) 277.36(76)*** 4187.3(82)***
Cut-off points
Cut-off - 1 0.87*** (0.171)
0.65***
(0.065) Cut-off – 2 1.81***
(0.174) 1.4***
(0.066) Cut-off - 3 2.72***
(0.178) 2.36***
(0.067)
-Associated standard errors are in parenthesis below each coefficient
- ***
significant at the 1% level, **
significant at the 1% level, *significant at the 1% level

152 | P a g e
Table B.4.b. Ordered Response Models with Sample Selection with EMAT Proxy by group of
countries
Eastern Europe Baltic
(I) Selection
equation
(II) Outcome
(intensity)
equation
(I) Selection
equation
(II) Outcome
(intensity)
equation
Constant term 5.4***
(0.261)
-
2.871***
(0.247)
-
Firm size
Medium 0.252***
(0.026)
0.032 (0.028)
0.112 (0.085)
-0.066 (0.063)
Large 0.483*** (0.033)
0.152*** (0.035)
0.458***
(0.113) 0.071 (0.107)
Characteristics
Being part of a Group 0.145*** (0.031)
-0.068*
(0.027) 0.255** (0.097)
-0.062 (0.064)
Active in National market 0.325***
(0.024)
0.023
(0.028)
0.41**
(0.151)
0.083
(0.083)
Active in Inter. Market 0.349***
(0.028)
0.103***
(0.029) 0.404***
(0.092) 0.129 (0.079)
Funded by EU 1.073*** (0.212)
-0.099* (0.05)
0.63 (0.419)
0.02 (0.122)
Engagement in
Continuous R&D
1.602***
(0.115) 0.041 (0.034)
0.95***
(0.226) 0.117 (0.088)
R&D intensity 4.668***
(1.377) -0.152 (0.145)
-2.204 (1.297)
0.32 (0.444)
Openness -0.709***
(0.03)
0.22*** (0.009)
-0.322***
(0.025) 0.161***
(0.029) Scientific cooperation 0.15
(0.17) 0.078* (0.036)
-0.086
(0.256) 0.054 (0.082)
Cooperation with others 1.767*** (0.107)
-0.019 (0.039)
1.692***
(0.177) 0.073 (0.127)
Industry dummies (chi²
test)
750.13*** 675.12***
Country Dummies (chi²
test)
26019.42*** 340.42***
No of observations 31032 2855
Chi²(df) 42958.02(88)*** 1622.62(80)***
Cut-off points
Cut-off - 1 1.04***
(0.06) 0.86***
(0.135) Cut-off – 2 1.74***
(0.062) 1.51***
(0.139) Cut-off - 3 2.68***
(0.065) 2.51***
(0.146)
-Associated standard errors are in parenthesis below each coefficient
- ***
significant at the 1% level, **
significant at the 1% level, *significant at the 1% level

153 | P a g e
References for Chapter Three
Andersen, M.M. (1999): Trajectory Change through Inter-organisational Learning. On the
Economic Organisation of the Greening of Industry, Copenhagen Business School, PhD.
Series, Copenhagen
Andersen, M. M. (2002): Organising Inter-firm Learning – as the Market Begins to Turn
Green, in de Bruijn, T.J.N.M. and A. Tukker (eds.), Partnership and Leadership – Building
Alliances for a Sustainable Future. Dordrecht: Kluwer Academic Publishers, pp.103-119.
Andersen, M.M. and Foxon, T. (2009): The Greening of Innovation Systems for Eco-
innovation - Towards an Evolutionary Climate Mitigation Policy, Paper for ‗Eco-innovation‘
Theme at DRUID Summer Conference 2009 on ‗Innovation, Strategy and Knowledge‘,
Copenhagen Business School, Denmark, 18-20 June 2009
Belin, J., Horbach, J. and Oltra, V. (2011): Determinants and Specificities of Eco-innovation
–An Econometric Analysis for the French and German Industry based on the Community
Innovation Survey, Cahiers du GREThA, n°2011-17.
Cainelli, G., Mazzanti, M. and Zoboli, R. (2011): ―Environmentally Oriented Innovative
Strategies and Firm Performance in Services. Micro-evidence from Italy”, International
Review of Applied Economics, Vol. 25 No. 1, pp. 61-85.
De Marchi, V. (2012): Environmental Innovation and R&D Cooperation: Empirical Evidence
from Spanish Manufacturing Firms, Research Policy, 41(2012), 614-623.
Del Rio Gonzalez, P. (2005): Analysing the Factors Influencing Clean Technology Adoption:
A Study of the Spanish Pulp and Paper Industry, Business Strategy and the Environment,
Vol. 14, 2005, 20-37.
Del Rio Gonzalez, P. (2009): The empirical analysis of the determinants for environmental
technological change: A research agenda, Ecological Economics, Vol. 68, 861-878.
Eurostat (2005): The Third Community Innovation Survey CIS3. Methodology of
Anonymisation. 11-07-2005.
Fussler, C. and James, P. (1996): Driving Eco-Innovation: A Breakthrough Discipline for
Innovation and Sustainability, London, Pitman Publishing, 364 p.

154 | P a g e
Heckman, J. (1979): Sample Selection Bias as a Specification Error, Econometrica 47:153–
161.
Hemmelskamp, J. (1997): Environmental Policy Instruments and their Effects on Innovation,
European Planning Studies, Vol. 5 No. 2, pp. 177 - 194.
Hemmelskamp, J. (1999): The Inuence of Environmental Policy on Innovative Behaviour:
An Econometric Study, Fondazione Eni Enrico Mattei Working Paper No. 18.99.
Horbach J. (2008): Determinants of Environmental Innovation – New Evidence from German
Panel Data Sources, Research Policy, 37 (2008):163-173 p.
Kammerer, D. (2009): The effects of customer benefit and regulation on environmental
product innovation, Empirical evidence from appliance manufacturers in Germany,
Ecological Economics, Elsevier, 68, 2285-2295
Kemp, R. and Pearson, P. (2007): Final Report MEI Project about Measuring Eco-
Innovation: Deliverable 15 of MEI project (D15), Project Report, Maastricht, 4, 5 p.
Kleinknecht, A., van Montfort, K. and Brouwer, E. (2002): The Non-trivial Choice between
Innovation Indicators, Economics of Innovation and New Technology 11:2, 109-121.
Laursen, K. & Salter, A. (2004): Searching high and low: what types of firms use universities
as a source of innovation?, Research Policy, Elsevier, 33 ,1201-1215
Laursen, K. and Salter, A. (2006): Open for Innovation: The Role of Openness in Explaining
Innovation Performance among U.K. Manufacturing Firms, Strategic Management Journal,
Wiley Online Library, 27, 131-150
Mohnen, P. and Mairesse, J. (2002): Accounting for Innovation and Measuring
Innovativeness: An Illustrative Framework and an Application, American Economic Review,
Papers and Proceedings, 92(2), 226-230, 2002
Mohnen, P.; Mairesse, J. & Dagenais, M. (2006): Innovativity: A comparison across seven
European countries, Economics of Innovation and New Technology, Taylor & Francis,
15 ,391-413

155 | P a g e
OECD (2009): Sustainable manufacturing and eco-innovation, Framework, Practices and
Measurement, Synthesis report, Paris, Available at:
www.oecd.org/sti/innovation/sustainablemanufacturing
OECD, Organization for Economic Co-operation and Development (1997): Oslo Manual The
Measurement of Scientific and Technological Activities, Proposed Guidelines for Collecting
and Interpreting Technological Innovation Data. Available at:
http://www.oecd.org/dataoecd/35/61/2367580.pdf
Oltra, V. (2008): Environmental Innovations: Indicators, Stylised Facts and Sectoral
Analyses, Environmental Innovation and Industrial Dynamics: the contributions of
evolutionary economics, DIME Working Papers on Environmental Innovation, no 7,
December, 2008, Bordeaux, available at: http://www.dime-eu.org/files/active/0/DIME-2-
5_WP04.pdf
Palmer, K., Oates, W.E. and Portney, P.R. (1995): Tightening Environmental Standards: The
Benefit-Cost or the No Cost Paradigm, Journal of Economic Perspectives, 9: 119-132.
Pavitt K. (1984): Sectoral Patterns of Technical Change: Towards a Taxonomy and a Theory,
Research Policy, 13, 343-373.
Porter, M. E. and van der Linde, C. (1995): Towards a New Conception of the Environment-
Competitiveness Relationship, Journal of Economic Perspectives, 9(4):97-118
Porter, M.E. (1991): America‘s Green Strategy, Scientific American, Vol. 264, no. 4, 96.
Reid, A. and Miedzinski, M. (2008): Eco-innovation: Final Report for Sectoral Innovation
Watch (Brighton: Technopolis Group), available at:
www.technopolis-group.com/resources/downloads/661_report_final.pdf
Rennings, K. (2000): Redefining Innovation – Eco-Innovation Research and the Contribution
from Ecological Economics. Ecological Economics, 32:319-332
Robin, S. and Schubert T. (2012): Cooperation with Public Research Institutions and Success
in Innovation: Evidence from France and Germany, Research Policy, 42 (2013) 149–166.
Roodman D. (2009): Estimating Fully Observed Recursive Mixed-Process Models with Cmp,
CDG Working Paper n° 168, Center for Global Development, Washington D.C.

156 | P a g e
Scherer, F. M. (1982a): Inter-Industry Technology Flows in the United States, Research
Policy, 11(4), 227–245.
Scherer, F. M. (1982b): Inter-Industry Technology Flows and Productivity Growth, Review
of Economics and Statistics, 64(4), 627–634.
Schmookler, J. (1966): Invention and Economic Growth. Cambridge, MA: Harvard
University Press, Chapter 8
Stern, N. (2006): Stern Review: The Economics of Climate Change, Office of Climate
Change, UK.
Van Leeuwen, G. and Mohnen, P. (2013): Revisiting the porter hypothesis: An empirical
analysis of green innovation for the Netherlands, UNU-MERIT Working Paper Series 002,
United Nations University, Maastricht Economic and social Research and training centre on
Innovation and Technology

157 | P a g e
Chapter 4
A Study on the Types of Eco-innovators Using Micro-
Anonymised Data:
The case of eco-innovators and eco-adopters

158 | P a g e

159 | P a g e
Table of Contents
1. Introduction ....................................................................................................................... 163
2. Literature Review .............................................................................................................. 164
2.1. Definition of Eco-innovation ............................................................................. 164
2.2. What Drives Eco-innovation .............................................................................. 166
3. Econometric Analysis ........................................................................................................ 168
3.1. The Data ............................................................................................................. 168
3.2. The Estimation Strategy and the Econometric Model ....................................... 169
3.3. A Typology of Eco-innovators ........................................................................... 169
3.4. Choice of Explanatory Variables ........................................................................ 173
3.5. Descriptive Statistics ........................................................................................... 179
4. The Empirical Results ....................................................................................................... 185
4.1. The Results of Estimations Conducted on the Whole Sample ........................... 185
4.2. The Country Specific Analyses .......................................................................... 190
4.2.1. The Results of Estimations Conducted by Group of Countries .......... 191
5. Conclusion ......................................................................................................................... 200

160 | P a g e

161 | P a g e
A Study on the Types of Eco-innovators Using Micro-Anonymised Data
Abstract
Despite its accelerating importance, the eco-innovation literature lacks consistent empirical
evidence reflecting the role of firm characteristics and capabilities within the eco-innovation
process. Furthermore, there has been little or no attempt, in empirical studies, to distinguish
true eco-innovators from mere eco-adopters. This research aims at filling this gap by
examining the influence of a firm‘s economic, technological, organisational and social
capabilities on the eco-innovation behaviour for different types of eco-innovators. It exploits
micro-aggregated data drawn from the 2008 wave of the Community Innovation Survey,
which includes a special module on eco-innovation. Our results stress the importance of
conventional R&D inputs, firms‘ formal cooperative behaviour and firms' openness.
Moreover, we find evidence that firms‘ voluntary engagement in eco-innovation is as
important as the environmental regulations for early strategic eco-innovators, while financial
funding from the EU seem to spurs eco-innovativeness among late strategic eco-innovators
and strategic eco-adopters. Country-specific analyses indicate that the role of cooperative
behaviour may be more important in some groups of countries than in others, whereas the
significance of environmental regulations and voluntary engagement in eco-innovation is
established in each country group.
Keywords: Eco-innovation, micro-aggregated data, CIS 2008, Firm capabilities, cooperative
behaviour, Environmental regulations
JEL codes: D2- Production and Organizations, L2- Firm Objectives, Organization, and
Behaviour, Q5-Environmental Economics, O3- Technological Change

162 | P a g e

163 | P a g e
1. Introduction
Environmentally friendly innovation, green innovation, sustainable innovation, and
environmentally benign innovation are terms commonly used for a specific type of
innovation, labelled in the innovation literature as "eco-innovation". The specificity of eco-
innovation lies in the fact that it makes environmental concerns, in addition to technological
advancement, its prime objective. By combining these two objectives (that may appear
mutually exclusive), eco-innovation has become one of primary tools in the search to solve
the world‘s environmental problems and sustainability challenges. The EU‘s Lisbon strategy
(2000) and the Gothenburg Summit (2001) are the most visible examples of the macro-scale
acknowledgement of its significance. These strategies give considerable importance to the
introduction and development of eco-innovation: according to the Lisbon Strategy it is
supposed to play a key role in making the EU‘s economy one of "the most competitive and
dynamic knowledge-based economy in the world capable of sustainable economic growth
with more and better jobs and greater social cohesion" (the Lisbon Agenda, 2000).
As an evolutionary mechanism, the conventional innovation process requires a steady
change even as it becomes more complex, interdependent and difficult to coordinate.
Because of the double externality problem highlighted by Rennings (2000), the eco-
innovation process tends to be even more complex and is affected by even more factors,
asserting that sustainability cannot be achieved through policies only but requires profound
changes in the strategic thinking of firms. Hence, to become successful eco-innovators and in
order to survive within a competitive market, firms need to be more systematic in their
strategic behaviour towards innovation, well-informed on the environmental regulatory
framework and able to capture existing and future opportunities. If elaborated within this
context, a firm‘s economic, technological, organisational and social capabilities appear to be
significant components of the eco-innovative process. However, due to its recent emergence
in innovation research and to the scarcity of relevant quantitative data, there is still much
debate and unexplored issues with regard to the concept of eco-innovation.
The exploration of the drivers of and barriers to eco-innovation is one of the most
debated issues in the eco-innovation literature and it must be approached with caution. Most
empirical studies address the drivers and barriers from the conventional market-pull,
technology-push, and institutional (regulatory) factors perspective (Porter and Van der Linde,
1995; Rennings, 2000; Brunnermeier and Cohen, 2003; Jaffe et al., 2002). A few studies
highlight the importance of other dynamic factors, such as firms‘ economic, technical,

164 | P a g e
managerial and social capabilities (Horbach, 2008; Borghesi et al., 2012; De Marchi, 2012).
A significant part of these empirical studies are focused on specific geographical areas,
industry segments or types of eco-innovation (Horbach, 2008). Additionally, Kemp and
Pontoglio (2011, p. 34) claim that a significant amount of econometric research has focused
on eco-innovation that is new to the world, disregarding the potential differences in
characteristics and capabilities among eco-innovators and eco-adopters.
The present research aims at overcoming (some of) these limitations. It contributes to the
discussion about the drivers of eco-innovation by introducing a distinction between eco-
innovators and eco-adopters on the basis of firms‘ strategic behaviour and the ways in which
they innovate. In order to do so, we adapted Kemp and Pearson‘s (2007, p. 18) approach in
defining different types of eco-innovators. Accordingly, within this research, eco-innovators
are classified as ―early‖ and ―late‖ strategic eco-innovators, ―early‖ and ―late‖ strategic eco-
adopters and ―passive‖ eco-adopters. We thus contribute to the literature by proposing an
empirically relevant typology of eco-innovators and by identifying the technical and
organisational characteristics and capabilities that are specific to each type of eco-innovator.
Our research is one of the first quantitative empirical studies to classify eco-innovators
according to their strategic behaviour and to identify type-specific drivers of eco-innovation.
Our econometric analysis relies on micro-aggregated data drawn from the 2008 wave of
the Community Innovation Survey (CIS 2008), which includes a special module on eco-
innovation. The data covers 79972 firms observed between 2006 and 2008 across 11 EU
member states, and allows us to control for national and sectoral differences in the factors
that are relevant for innovation and performance. It also allows us to separate and categorise
eco-innovators and to distinguish the firm-specific characteristics of each type of eco-
innovator.
The remainder of this paper is organised as follows. Section 2 provides a definition of
eco-innovation and reviews its possible drivers. Section 3 presents our data, our typology of
eco-innovators, our estimation strategy and choice of variables. Section 4 presents the results
of our global and country-specific analyses. We draw a general conclusion in Section 5.
2. Literature Review
2.1. Definition of Eco-innovation
Due to its increasing relevance, the concept of eco-innovation has attracted the attention
of many. Because the concept of eco-innovation is rather novel, the innovation literature is

165 | P a g e
abundant with various definitions. In this research we adopt one of the most widely used
definitions, proposed by the EU‘s Measuring Eco-innovation project (MEI). According to
this definition, eco-innovation is:
"assimilation or exploitation of a product, production process, service or management or
business method that is novel to the firm or user and which results, throughout its life cycle,
in a reduction of environmental risk, pollution and other negative impacts of resource use
(including energy use) compared to relevant alternatives” (MEI, Kemp and Pearson (2007,
p. 3).
Upon completion of the MEI project in 2008, the concept of eco-innovation has acquired
a solid theoretical base that helps and guides researchers from various fields of study.
According to this background, ―any company adopting a good, service, production process,
management or business method with environmental benefit is considered an eco-innovator‖
(Kemp and Pearson, 2007, p. 17). This definition is somehow general and tends to address
various types of eco-innovators. Therefore, there are also other definitions addressing specific
type of eco-innovators. For example, the OECD (2009) refers to organisational eco-
innovation as ―incremental or radical change of a firm‘s processes and responsibilities, which
reduces environmental impact and supports organisational learning‖. Even though, this
definition is rather direct, it does not specifically address the adopters of environmental
management standards (such as; EMAS and ISO 14001-type standards). Therefore, there is
no consensus on whether the adopter‘s environmental management standards should be
considered as organisational eco-innovator. De Marchi (2012) stated the general definition of
eco-innovation is based on the effect of the innovation activities independently of their initial
intent, and includes both incremental and radical improvements. Hence, the overall
environmental impact of an innovation, rather than its original intention, is the point of
interest within this definition. This broad definition intrinsically brings in certain
complications while categorizing different types of eco-innovators. It is efficient enough to
separate eco-innovators from non-eco-innovators but it is too fuzzy to distinguish real eco-
innovators from mere eco-adopters. As a result, most empirical studies have used the general
categorization of eco-innovation, neglecting the potential differences between real eco-
innovators and eco-adopters. We have concluded that at the best case scenario, these
standards may help organisations to become aware of their environmental responsibilities and
lower their carbon foot-print through changes in their organisational structure. Therefore, for

166 | P a g e
our empirical analyses the adopters of these standards are considered as organisational-eco-
innovator.
2.2. What Drives Eco-innovation
The eco-innovation literature points out to three external settings as the primary drivers
of eco-innovation. Amongst them, conventional market-pull and technology push factors are
relevant to the technical aspects of eco-innovation while regulation (both in the form of
command and control and market-based instruments) is relevant to the environmental aspects
of eco-innovation. The double externality problem highlighted by Rennings (2000) is
characteristic of eco-innovation that makes environmental regulation a necessity if eco-
innovation is to occur at all. More precisely, the expected positive environmental impacts of
eco-innovation make it desirable, and policy maker encourage firms to take actions and be a
part of the solution to environmental issues. However, the negative externalities inherent in
the innovation production phase, (through the usual knowledge spill overs) make eco-
innovation rather costly, with a financial return that is even more uncertain than that
conventional innovation. When firms faced with such options, they may show a tendency to
shy away from eco-innovation as the competitive market conditions may require them to do
so. In their seminal work, Porter and Van Der Linde (1995) have stressed the significance of
strict environmental regulation as a mean to channel firms‘ innovative efforts towards more
sustainability. They also claim that productivity gains and competitive advantages accrued
from eco-innovation (through reduced material and energy use and patenting and learning
effects) could offset the costs of innovation, leading to a ―win-win‖ situation. This claim is
also known as the Porter Hypothesis. Palmer et al. (1995) have criticized Porter and Van Der
Linde‘s statements on the grounds that they are supported only by case studies and hence,
provide insufficient evidence for generalization. Since then, several studies have been
conducted on this issue and the literature still lacks solid empirical evidence to support or
reject the Porter Hypothesis (see Wagner, 2003 for a detailed review). On the one hand, in
their empirical investigation van Leeuwen and Mohnen (2013) have found a supporting
evidence for the weak version of the Porter hypothesis hence, they concluded that
environmental considerations (i.e., government regulations, market pressures) seem to be an
important factor in the decision making of firms to invest in R&D and eco-investments and
they also play a crucial role in the introduction of different types of eco-innovations.
However, they did not observe any direct impact of environmental regulations on Total
Factor Productivity (TFP) and on firms‘ decision to invest in eco R&D. Therefore, they

167 | P a g e
couldn‘t approve or disapprove the strong version of the hypothesis. On the other, Ozusaglam
and Robin (2013) have concluded that government intervention through environmental
regulations is indeed one of the most important factors leading firms to lower their hazardous
impact on environment. However, they also show that voluntary environmental standards i.e.
ISO 14001 and EMAS may be a good complement for market-based instruments (such as;
tradable permits, emission taxes, subsidies etc.) and, command and control mechanisms to
increase firms‘ economic performance through Total Value Added. Given that these
voluntary environmental standards help firms to reduce their carbon foot-print, their
statement supports the weak version of the Porter hypothesis.
As can be seen, there is no consensus on the overall validity of the Porter hypothesis
which can be largely attributed to problems inherent in measuring eco-innovation, the lack of
available quantitative data and the stringency measures used in the analyses. Mulatu et al.
(2001) stated that environmental regulation-competitiveness linkage should be investigated
with data on the industrial level and with better stringency measures. These problems have
led researchers to analyse the drivers of and barriers to eco-innovation issue from the
conventional innovation perspective. This resulted in underestimating the importance of firm-
specific characteristics and capabilities within the eco-innovation process. However, there are
rather few investigating the role of more dynamic factors such as firms specific
characteristics, technical, organisational and social capabilities within the eco-innovation
process. Amongst them, Kemp and Pearson (2007) asserted that firms‘ propensity to eco-
innovate is positively related to their ability to build on organisational capabilities. De Marchi
(2012) emphasized the role of engagement in continuous R&D activities and cooperation
activities as a driver of eco-innovation. This author found, though, (as did Horbach, 2008)
that firms‘ R&D intensity was not a significant driver of the eco-innovation process. In
addition, Kesidou and Demirel (2012) and Horbach (2008) claim that the adoption of
Environmental Management Systems (EMS), as an indicator of a firm‘s organisational
capabilities, may indeed increase the firm‘s eco-innovation intensity. Ozusaglam and Robin
(2013) postulate that firms that fall in ―high-technology and high-medium manufacturing‖
level are more prone to adopt voluntary environmental standards and thus they might be an
efficient choice for making firms more competitive and greener. Nevertheless, a through
empirical research on the role of a firm's internal characteristics and technical, organisational
and social capabilities in the eco-innovation process is rather scarce. This research article
aims to investigate the respective role of these characteristics and capabilities by conducting
in-depth empirical analyses.

168 | P a g e
3. Econometric Analysis
3.1. The Data
The relative lack of quantitative data appears to be one of the most significant obstacles
to empirical studies in the field of eco-innovation. The problem can be associated with the
recent appearance of the concept of eco-innovation and the difficulties involved in measuring
it. Nevertheless, certain improvements have taken place within the last few years and the
2008 wave of the Community Innovation Survey (CIS 2008) includes a special module on
eco-innovation. The CIS is coordinated throughout Europe by Eurostat in cooperation with
the statistical offices of the Member States. It relies on a harmonised questionnaire based on
the Oslo Manual (OECD, 1997), which provides invaluable information on the characteristics
of innovation activities at the firm level (see Eurostat, 2005). The CIS data is available either
as micro (firm-level) data for a given country (from each country's national statistical office),
or as micro-aggregated data for several EU Member States (from Eurostat).
Micro-aggregated data is firm-level data which has been made anonymous by adding
random "error terms" to the raw firm-level data. This method makes it almost impossible to
break the anonymity of individual firms, while allowing researchers to conduct econometric
analyses (which will, by their very nature, take out the added noise). This process is
explained in detail by Mohnen, Mairesse and Dagenais (2006). Experiments on specific
countries have shown that econometric analyses conducted on the micro-aggregated data
yield results that are not significantly different from those of analyses conducted on the
corresponding firm-level data (Mohnen, Mairesse, and Dagenais, 2006). Moreover, all
enterprises included in the data set conform with the minimum coverage (10 employees or
more). The data provides information about (among others) main economic activity, location,
number of employees, turnover, expenditure in intramural and extramural research and
development (R&D), innovation output, innovation collaboration, knowledge sources,
primary objective of environmental innovations and environmental benefits from innovation.
In its original design, the survey does not aim at extracting information directly related to
eco-innovation. However, CIS 2008 includes a special module on eco-innovation which lists
a series of environmental benefits for product, process, organisational or marketing
innovations introduced during the observation period (from 2006 to 2008). This module
makes it an adequate dataset for our purposes.

169 | P a g e
3.2. The Estimation Strategy and the Econometric Model
Our empirical analysis aims at identifying a firm‘s characteristics and capabilities that
lead a firm towards a more active and strategic eco-innovation behaviour. The analysis relies
on the innovativity approach first proposed by Mairesse and Mohnen (2002). Within the
context of this research, this approach consists in estimating an innovation production
function specified as an Ordered Probit model with selection. Using some sort of selection
model is necessary to address the selection issues that arise with CIS 2008 (as with all waves
of the CIS). A potential selection bias arises because of the presence of "filtering" questions
in the CIS questionnaire. These questions are designed to characterize firms as "innovating"
or "non-innovating", and only the former have to fill in the full questionnaire (see for instance
Mohnen and Mairesse (2002) or Mairesse, Mohnen and Dagenais (2006) for more detailed
explanations). This attribute of CIS surveys can endanger the reliability of the empirical
analysis if one does not take into account the selection problem.
The econometric model used in this research contains a selection equation (selection into
conventional product, process, organizational or marketing innovation) which is specified as
a Probit model, as is usually done in the literature. The outcome equation (intensity equation)
of the model is specified as an Ordered Probit model rather than as a linear equation. We
adapted this model since there is a natural ranking in our typology; the different types of eco-
innovators are ranked from the less eco-innovative (passive eco-adopters) to the more eco-
innovative (early strategic eco-innovators). Therefore, the Ordered Probit will give the effect
of each explanatory variable on eco-innovation "as a whole", with a different "cut-off point"
for each type of eco-innovator while non-eco-innovators being taken as the category of
reference. This model is estimated using the Conditional Mixed Process estimator (CMP)
programme that runs with Stata econometric software (Roodman, 2009).
3.3. A Typology of Eco-innovators
The eco-innovation literature lacks consistent empirical research on the eco-innovation
behaviour of different types of eco-innovators and the role of firm specific characteristics as
drivers to eco-innovate for each type of eco-innovator. We aim at filling this gap with this
research. To do so, we adapted and refined the categorization of eco-innovators proposed by
Kemp and Pearson (2007). Their categorization is as follows:
Strategic eco-innovators: active in eco-equipment and service sectors, develop eco-
innovations for sale to other firms.

170 | P a g e
Strategic eco-adopters: intentionally implement eco-innovations, either developed in-
house, acquired from other firms, or both.
Passive eco-innovators: process, organisational, product innovations etc. that result in
environmental benefits, but where there is no specific strategy to eco-innovate.
Non eco-innovators: no activities for either intentional or unintended innovations with
environmental benefits.
In our approach, eco-innovators are classified as ―early‖ and ―late‖ strategic eco-
innovators, ―early‖ and ―late‖ strategic eco-adopters, ―passive‖ eco-adopters and non-eco-
innovators. Table 1 displays the taxonomy used for different type of eco-innovators.
Table 1: Taxonomy of Firms (Terms used in this study)
Our proposed definitions allow us to distinguish the different types of eco-innovators
alongside two dimensions: (1) the environmental impacts of the realised product, process,
organisational or marketing innovation are used to determine qualification as an eco-
innovator; (2) the way the eco-innovations are implemented is used to separate "true"
strategic eco-innovators from strategic eco-adopters. Regarding the first dimension, CIS 2008
lists the direct environmental impacts of the realised product, process, organisational or
marketing innovation within the enterprise as follows: (i) Reduced material use per unit of
output, (ii) Reduced energy use per unit of output, (iii) Reduced CO2 ‗footprint‘ (total CO2
production) by the enterprise, (iv) Replaced materials with less polluting or hazardous
substitutes, (v) Reduced soil, water, noise, or air pollution and (vi) Recycled waste, water, or
materials. In addition to the direct environmental benefits within the enterprise, the direct
environmental benefits after sale, by the end-user such as (i) Reduced energy use, (ii)
Early Late
Strategic Passive
Eco-innovators Eco-adopters

171 | P a g e
Reduced air, water, soil or noise pollution and (iii) Improved recycling of product after use,
are also included in the survey. These environmental impact indicators are utilised in order to
separate eco-innovators from non-eco-innovators.
After introducing this separation, we disentangle eco-innovators according to their
strategic behaviour towards eco-innovation (that is to say, how they innovate). We rely on
the adoption date of voluntary environmental procedures at the firm level (e.g.,
environmental audits, the setting environmental performance goals, ISO 14001 certification)
to differentiate firms that are at the leading edge of eco-innovation and laggards. Indeed,
adopting such procedures amounts to implementing an Environmental Management Standard
(EMS). Many researchers (Rennings et al., 2006; Rehfeld et al. 2007; Wagner, 2008; Khanna
et al., 2009) have stated that the implementation of an EMS is a relevant form of eco-
innovation, because EMS are voluntary, proactive approaches that reflect the environmental
awareness of firms. Horbach et al. (2012) have asserted that the EMS help overcome
problems related to incomplete information as well as organizational and coordination
problems within a firm, and that they are also important for the introduction of cost-saving
cleaner technologies.
In practice, we use a question on the adoption of the above-mentioned procedures that is
featured in the module dedicated to environmental innovation of the CIS 2008 survey. For
firms that have adopted such procedures (or, in other words, that have implemented an EMS),
the question let us know whether the EMS was implemented before January 2006 (i.e., before
the start of CIS 2008) or after January 2006 (i.e., during the time period covered by the CIS
2008). Utilizing the year 2006 as the separation measure can raise some question as this year
might be perceived as rather random. However, we assert that by doing so we are able to
determine whether an eco-innovator as defined alongside the first dimension is relatively
early or late in implementing an EMS, indicating their experience in managing the EMS and
their relatively higher environmental consciousness. By combining the two above-mentioned
dimensions (the introduction of an innovation with an environmental impact and the date of
implementation of an EMS), we can assign all innovative firms to one of five mutually
exclusive categories.
A passive eco-adopter is defined as an innovator that introduces a product, process,
organisational or marketing innovation that results in environmental benefits (eco-
innovation), even though the firm has no specific strategy to eco-innovate (no established
environmental management standards, norms, procedures or regulations within the
enterprise). Therefore, this group represents a set of eco-innovators in which the firms show

172 | P a g e
no sign of commitment to solve environmental problems and moreover, have no overt
intention or strategic plan to eco-innovate. The introduction of eco-innovation could be a
mere coincidence and/or the positive environmental impacts could be side effects of their
conventional innovations. As can be expected this category comprises the majority of the
population and includes a heterogeneous sub-populations from various technological levels
(from low-tech manufacturing to high-tech manufacturing). Accordingly, a passive eco-
adopter might be a high-tech manufacturing firm engaging in conventional i.e., product or
process innovation, where the firm has no intention or strategic plan to eco-innovate.
A late strategic eco-adopter represents an innovator that established environmental
management standards (EMS), norms, procedures or regulations in place to regularly identify
and reduce the enterprise‘s environmental impacts ―after 2006‖ but did not introduce any
eco-innovation. This type of eco-adopter is labelled as ―late‖ due to fact that they adopt the
EMS‘s at a relatively later date. Nevertheless, even if the adoption took place after the base
year (2006), it can still signal an on-going change in their commitment to reduce their
ecological foot-print.
An early strategic eco-adopter is defined as an innovator that has the same
environmental management standards, norms, procedures or regulations in place ―before and
after 2006‖ but did not introduce any eco-innovation. Firms within this group indeed show a
relatively higher degree of environmental commitment than the aforementioned groups.
Adopting the EMS‘s before the base year may point out the existence of an established long-
term environmental awareness and experience that may offer significant advantages in the
effort to tackle environmental problems. However, their proactive approach is not sufficient
to develop and/or introduce a successful eco-innovation.
A late strategic eco-innovator is an eco-innovator that adopted environmental
management standards, norms, procedures or regulations ―after 2006‖ and succeeded in
introducing an eco-innovation during the observation period. Therefore, firms within this
group show signs of significant efforts to reduce their ecological foot-print. Moreover, they
tend to embed their environmental concerns in their day to day interactions by adopting
EMS‘s even if the adoption took place relatively later than that of other firms.
Last but not least, an early strategic eco-innovator is an eco-innovator that established
the environmental management standards, norms, procedures or regulations ―before 2006‖
and succeeded in introducing an eco-innovation during the observation period. This group of
firms is significantly more strategic than the rest. They tend to have a longer history of
environmental commitment and are more experienced in the application of environmental

173 | P a g e
management standards. Therefore, identifying the characteristics and capabilities of this type
of eco-innovator is crucial for this research.
In order to prevent potential confusion, we must indicate here that throughout this
research, we will use the word ―eco-innovator‖ to represent all of these five sub-groups,
while their respective titles will be used when differentiation is necessary.
3.4. Choice of Explanatory Variables
The eco-innovation literature highlights the significance of firm size as one of the most
important firm characteristics and it is included as our first control variable. It is generally
assumed that bigger firms tend to have easier access to financial resources to invest in
innovation inputs (del Rio Gonzalez, 2005, 2009; Kammerer, 2009) such as R&D related
activities, acquisition of knowledge and equipment etc. In the micro-aggregated CIS 2008
survey data, the indicator of firm size is an ordered variable comprising three categories
(―small‖ ―medium‖ or ―large‖) depending on the number of employees (where small is the
category of comparison).
Besides a firm‘s size, being part of a larger group (being a subsidiary) can also be
considered another significant firm characteristic that can affect firm‘s propensity to
innovate. Various studies (i.e., Jeppesen and Hansen, 2004; Cainelli et al., 2011) have shown
that being part of a group can be a significant opportunity for firms to learn about existing
environmental standards and other ways to reduce their carbon foot-print. In the best-case
scenario, a subsidiary may need to spend less effort to access the financial resources,
knowledge and technical support needed for successful innovation than individual firms.
However, dependence on the parent company‘s decisions may also have an adverse effect on
a firm‘s innovative efforts. Being strictly tied to the parent company‘s innovation strategy
may restrict the creative process of an otherwise innovative firm. We will attempt to test
these assumptions by including a binary indicator of group ownership as the second control
variable.
As was previously mentioned, one of the significant advantages of the CIS survey is that
it covers multiple EU member states and allows us to control for national and sectoral
differences in the factors that are relevant for innovation and performance. Therefore, we aim
to use this aspect of the survey to our advantage by including both manufacturing and service
sectors in the regressions. Accordingly, 2-digit industry affiliation dummies (Nace codes)
included in our regressions. In the same vein, in order to capture the technological conditions

174 | P a g e
as regard to eco-innovation among different we also included country dummies in the
regressions.
Besides firm specific characteristics, a firm‘s contextual surroundings can also shape its
innovative behaviour; we can consider the market conditions as the prime example. Maturity
of the markets, existing technological opportunities, sufficient market demand, consumer
awareness and existence of regulatory framework are the other examples of the market
characteristics. Accordingly, we included two dummy variables indicating whether a firm is
active in ―national‖ or ―international‖ market. By including these dummy variables we aimed
at controlling for the impact of different markets on the introduction of eco-innovation.
In addition to abovementioned control variables, we also acknowledge R&D efforts
(engagement in continuous R&D and R&D intensity) as "classic" inputs in the innovation
production function. For example, a continuous engagement in R&D is generally considered
as one of the conventional innovation inputs that not only can enhance a firm‘s scientific and
technological capabilities but increases a firm‘s absorptive capacity needed to undertake
successful innovation (Hemmelskamp, 1997; Horbach, 2008). Through a firm-level analysis
Rennings et al. (2006) claimed that the internal R&D efforts could be of greater importance
for eco-innovation than for conventional innovation. Moreover, a firm‘s ―R&D intensity‖ can
help identify the importance the firm gives to the development of future products and
processes. Successful outcomes of these efforts can be considered innovation, and this
success can augment the intensity of R&D in return. Interestingly, Hemmelskamp (1999)
claims that eco-innovative companies are likely to have a lower R&D intensity as they tend
to rely more on cooperation and external sources information. Since in CIS surveys, some
firms do not engage in R&D on a continuous basis (and some firms do not engage in R&D at
all), it is usual to use both variables as regressors in econometric models of the innovation
production function (see for instance Mairesse and Mohnen, 2002). The continuous
engagement in R&D is captured by a binary variable equal to 1 in case of continuous R&D
and to 0 otherwise while R&D intensity is classically measured by the share of (intramural
and extramural) R&D expenditures in total sales.
The innovation production is a long and a challenging practice characterized as a highly
complex process that requires increased interdependencies and information/knowledge
exchange among incorporating partners. This complexity makes the absorption of external
knowledge an invaluable factor within the innovation process (Cohen and Levinthal, 1989).
However, the significance of the absorptive capacity through external knowledge is stressed
mainly for the conventional product and process innovation (Zahra and George, 2002) while

175 | P a g e
little has been made with respect to eco-innovation. In order to observe the significance of
interdependencies between involved partners and the importance of the information that they
convey, we introduced three mutually exclusive variables namely: (i) Openness, (ii)
Scientific cooperation and (iii) Other cooperation.
According to Laursen and Salter (2004, 2006), we can measure the degree of ―openness‖
of a firm by looking at the use of general internal and external sources of information within
the innovative process. Following their methodology, we recode the ―sources of information‖
variables provided by CIS 2008 as binary variables equal to 1 if a source is used and to 0 if it
is not. These variables are then summed up to provide the ordered variable, in which a greater
value indicates a larger degree of openness. In our application, we use the following
information sources28
: (1) sources from within the enterprise or its group, (2) suppliers of
equipment or materials, (3) clients or customers, (4) competitors and other enterprises in the
same industry, (5) consultants, commercial labs or private R&D institutes, (6) professional
conferences, trade fairs, meetings, (7) scientific journals, trade/scientific publications, and (8)
professional and industry associations. According to this method, the greatest possible
openness score (which is attained if a firm uses all eight sources of information) is equal to 8,
while the lowest possible score is 0.
Openness in the above sense does not entail formal cooperation with the sources of
information used (for example, a firm might obtain information from a competitor without
formally cooperating in R&D with this competitor). Therefore, the second variable, labelled
―scientific cooperation‖, controls for formal cooperation with scientific partners as is
discussed by Robin and Schubert (2013) (i.e., cooperation with universities and higher
education institutions or with government/public research institutes). This may be distinct
from openness, especially when academic knowledge is involved (see Footnote 2).
The third variable, labelled ―other cooperation‖, is an indicator of cooperation with other
partners, which captures interactions between firms and non-scientific cooperation partners.
Cooperating with other partners entails a formal cooperation between a firm and at least one
of the following: (i) other enterprises within the group, (ii) suppliers of equipment, materials,
28
As in Laursen and Salter (2004) and Robin and Schubert (2013), we do not include academic
sources of information because most firms report no (or a very low) use of these sources. This is a
recurrent feature of CIS data, which may be due to the fact that relying on academic knowledge to
innovate generally implies some measure of formal cooperation. Thus, the use of academic
knowledge is better captured by other variables, such as indicators of cooperation, as will be done
here.

176 | P a g e
components, or software, (iii) clients or customers, (iv) competitors or other enterprises in the
firm‘s industry and (v) consultants, commercial labs, or private R&D institutes.
In addition, (i) available financial funds, (ii) regulatory framework and (iii) voluntary
efforts are also considered exogenous factors that can shape a firm‘s eco-innovative
behaviour. Therefore, three binary variables included in the analyses. The variable ―fund‖
indicates whether a firm received any public financial support for innovation activities from
the EU‘s 6th and 7th Framework Programme. When considering the second component of the
‗double externality problem‘, namely externality through the usual knowledge spill overs,
firms may need incentives (such as financial help, credits, tax reduction etc.) to engage in
eco-innovation. Absence of these incentives may cause some firms to shy away from
engaging in such an activity. Therefore, by including this dummy variable we aim to test the
significance of the EU‘s Framework Programmes.
In the same vein, the ―regulation‖ variable indicates whether a firm introduced an
environmental innovation in response to ‗existing environmental regulations or taxes on
pollution‘ while the ―voluntary‖ variable identifies whether ‗the voluntary codes or
agreements for environmental good practice‘ are the main motivation to introduce an eco-
innovation. Table 2, below, presents the summary statistics on the main variables used in the
econometric analysis while Table 3 displays the summary statistics on the variables used in
the empirical estimation for each type of eco-innovator.

177 | P a g e
Table 2: Summary statistics on the variables used in the empirical estimation
Variables Mean Std. dev. Min Max
Dependent variables:
Firm introduced a product innovation (yes/no) 0.22 0.41 0 1
Firm introduced a process innovation (yes/no) 0.25 0.43 0 1
Firm introduced an organisational innovation
(yes/no)
0.26 0.44 0 1
Firm introduced an marketing innovation (yes/no) 0.21 0.41 0 1
Firm is an innovator (yes/no) 0.43 0.49 0 1
Firm is a passive eco-adopter (yes/no) 0.12 0.33 0 1
Firm is a late strat. eco-adopter (yes/no) 0.042 0.2 0 1
Firm is an early strat. eco-adopter (yes/no) 0.092 0.29 0 1
Firm is a late strat. eco-innovator (yes/no) 0.063 0.24 0 1
Firm is an early strat. eco-innovator (yes/no) 0.069 0.25 0 1
Firm is an eco-innovator (yes/no) 0.26 0.43 0 1
Explanatory variables:
Size 2006a
0.46 0.66 0 2
Size 2008a 0.48 0.66 0 2
Group (yes/no) 0.21 0.41 0 1
R&D intensity (Total R&D exp. / Total turnover 584.8 97251.6 0 1.73e+07
Continuous R&D (yes/no) 0.07 0.26 0 1
Openness (0-8)b
6.47 2.49 0 8
Scientific Cooperation (yes/no) 0.048 0.21 0 1
Other Cooperation (yes/no) 0.11 0.31 0 1
International market (yes/no) 0.39 0.49 0 1
National market (yes/no) 0.68 0.46 0 1
Local market (yes/no) 0.67 0.46 0 1
Funds (yes/no) 0.023 0.15 0 1
Regulation (yes/no) 0.154 0.36 0 1
Voluntary (yes/no) 0.16 0.36 0 1
a - Small, medium and large, small being the base category
b- Openness is an ordered variable ranging from 0 to 8 where the highest score is 8 and the lowest
score is 0

178 | P a g e
Table 3: Summary statistics on the variables used in the estimations by type of eco-
innovator
Variables
Passive eco-
adopter
Late strat.
eco-adopter
Early strat.
eco-adopter
Late strat. eco-
innovator
Early strat.
eco-innovator
Dependent variables:
Introduction of a product
innovation (yes/no)
0.51
(0.5)
0.11
(0.31)
0.11
(0.31)
0.52
(0.5)
0.51
(0.5)
Introduction of a process
innovation (yes/no)
0.55
(0.49)
0.15
(0.36)
0.14
(0.35)
0.63
(0.48)
0.62
(0.48)
Introduction of an
organisational innovation
(yes/no)
0.57
(0.49)
0.18
(0.38)
0.15
(0.36)
0.67
(0.47)
0.6
(0.49)
Introduction of a marketing
innovation (yes/no)
0.53
(0.5)
0.13
(0.33)
0.13
(0.33)
0.54
(0.5)
0.49
(0.5)
Firm is an innovator
(yes/no)
0.87
(0.33)
0.3
(0.46)
0.3
(0.45)
0.88
(0.32)
0.87
(0.32)
Explanatory variables:
Size 2006a 0.54
(0.68)
0.67
(0.7)
0.63
(0.68)
0.86
(0.76)
1.03
(0.76)
Size 2008a
0.58
(0.68)
0.7
(0.7)
0.59
(0.66)
0.9
(0.74)
0.98
(0.75)
Group (yes/no) 0.28
(0.45)
0.2
(0.4)
0.21
(0.41)
0.4
(0.49)
0.45
(0.5)
R&D intensity 2100.4
(190357.1)
0.02
(0.11)
0.02
(0.15)
0.02
(0.12)
0.086
(2.81)
Continuous R&D (yes/no) 0.17
(0.37)
0.03
(0.18)
0.02
(0.16)
0.17
(0.37)
0.23
(0.42)
Openness (0-8)b 4.8
(2.62)
7.07
(2.05)
7.25
(1.86)
5.63
(2.4)
5.63
(2.4)
Scientific Cooperation
(yes/no)
0.11
(0.32)
0.03
(0.16)
0.02
(0.13)
0.15
(0.36)
0.19
(0.39)
Other Cooperation (yes/no) 0.26
(0.43)
0.06
(0.23)
0.05
(0.21)
0.32
(0.46)
0.32
(0.46)
International market
(yes/no)
0.55
(0.5)
0.4
(0.5)
0.37
(0.48)
0.58
(0.49)
0.61
(0.48)
National market (yes/no) 0.78
(0.41)
0.57
(0.49)
0.54
(0.5)
0.74
(0.43)
0.73
(0.44)
Local market (yes/no) 0.69
(0.46)
0.57
(0.49)
0.61
(0.48)
0.63
(0.48)
0.62
(0.48)
Funds (yes/no)
0.058
(0.23)
0.012
(0.11)
0.008
(0.09)
0.06
(0.24)
0.07
(0.26)
Regulation (yes/no) 0.41
(0.49)
0.08
(0.27)
0.035
(0.18)
0.7
(0.45)
0.62
(0.48)
Voluntary (yes/no) 0.29
(0.45)
0.05
(0.21)
0.02
(0.14)
0.5
(0.5)
0.44
(0.49)
- Standard deviations are displayed in parenthesis
a - Small, medium and large, small being the base category
b - Openness is an ordered variable ranging from 0 to 8 where the highest score is 8 and the lowest
score is 0

179 | P a g e
3.5. Descriptive Statistics
In this section we present the general characteristics of the firms included in the sample
by providing simple summary of the collected data. Table 4 displays the distribution of
conventional innovators and eco-innovators across the manufacturing industries and service
sectors. The main objective of this research being to stress the differences across the types of
eco-innovators we have defined earlier, we present in Tables 5.A and 5.B summary statistics
by type of eco-innovators across all manufacturing industries and service sectors.
We can first note significant differences between different industry segments with regard
to the distribution of innovators and eco-innovators. Table 4 shows that there are more
conventional innovators (product, process, organizational and marketing innovator) than eco-
innovators in all sectors and both of these innovators are concentrated within two industries.
More precisely, among the manufacturing industries ―Manufacture of Computer, Electronic
and Electrical equipment‖ and ―Manufacture of Coke, Chemicals, Chemical products‖ sectors
have the highest concentration of conventional innovators and eco-innovators. Moreover,
Table 5.A and 5.B show that these two industries comprise the most ―early‖ and ―late‖
strategic eco-innovators. In addition, the low-tech industries such as ―Manufacture of
Textiles, Wearing apparel and Leather products‖, ―Manufacture of Food, Beverages and
Tobacco products‖ and ―Manufacture of Wood, Paper and Printing‖ have high rates of
―passive eco-adopters‖ and, ―early‖ and ―late‖ strategic eco-adopters. This may point out that
the technical sophistication of an industry may be one of the main determining factors that
lead firms to pursue different innovative strategies and therefore, the reduction of negative
impact might be the most relevant for the high-tech and high medium-tech industries than the
low-tech industries.
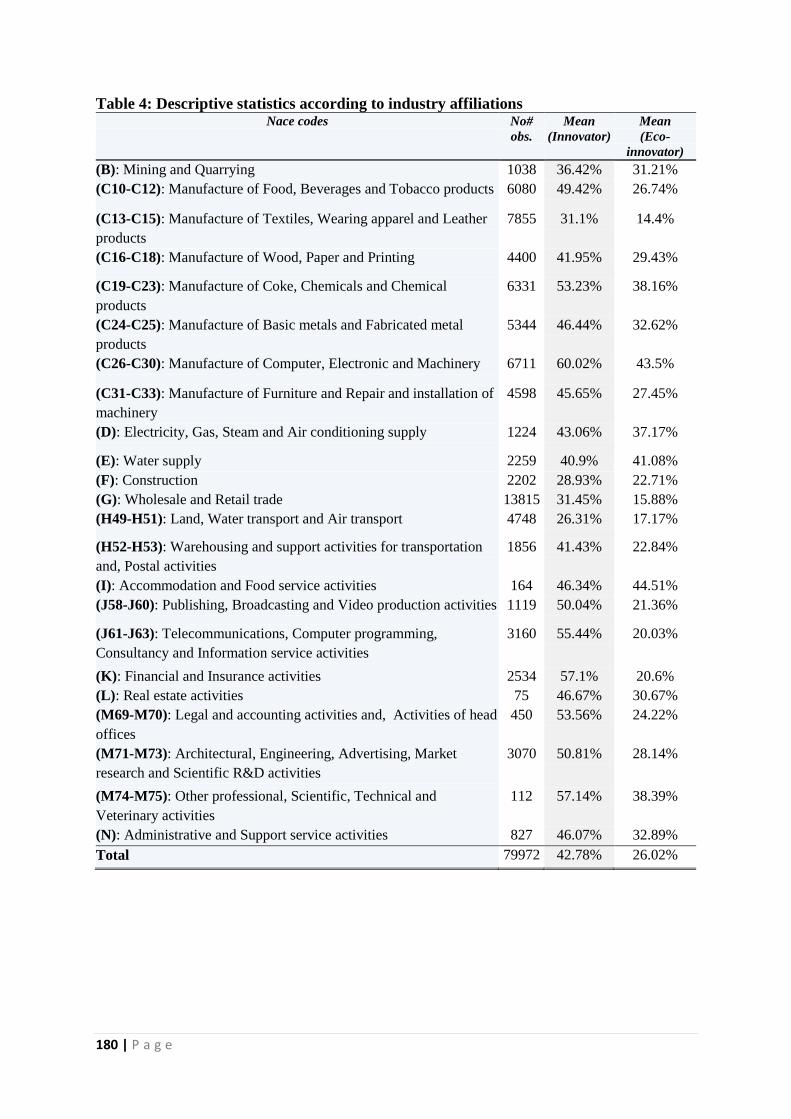
180 | P a g e
Table 4: Descriptive statistics according to industry affiliations Nace codes No#
obs.
Mean
(Innovator)
Mean
(Eco-
innovator)
(B): Mining and Quarrying 1038 36.42% 31.21%
(C10-C12): Manufacture of Food, Beverages and Tobacco products 6080 49.42% 26.74%
(C13-C15): Manufacture of Textiles, Wearing apparel and Leather
products
7855 31.1% 14.4%
(C16-C18): Manufacture of Wood, Paper and Printing 4400 41.95% 29.43%
(C19-C23): Manufacture of Coke, Chemicals and Chemical
products
6331 53.23% 38.16%
(C24-C25): Manufacture of Basic metals and Fabricated metal
products
5344 46.44% 32.62%
(C26-C30): Manufacture of Computer, Electronic and Machinery 6711 60.02% 43.5%
(C31-C33): Manufacture of Furniture and Repair and installation of
machinery
4598 45.65% 27.45%
(D): Electricity, Gas, Steam and Air conditioning supply 1224 43.06% 37.17%
(E): Water supply 2259 40.9% 41.08%
(F): Construction 2202 28.93% 22.71%
(G): Wholesale and Retail trade 13815 31.45% 15.88%
(H49-H51): Land, Water transport and Air transport 4748 26.31% 17.17%
(H52-H53): Warehousing and support activities for transportation
and, Postal activities
1856 41.43% 22.84%
(I): Accommodation and Food service activities 164 46.34% 44.51%
(J58-J60): Publishing, Broadcasting and Video production activities 1119 50.04% 21.36%
(J61-J63): Telecommunications, Computer programming,
Consultancy and Information service activities
3160 55.44% 20.03%
(K): Financial and Insurance activities 2534 57.1% 20.6%
(L): Real estate activities 75 46.67% 30.67%
(M69-M70): Legal and accounting activities and, Activities of head
offices
450 53.56% 24.22%
(M71-M73): Architectural, Engineering, Advertising, Market
research and Scientific R&D activities
3070 50.81% 28.14%
(M74-M75): Other professional, Scientific, Technical and
Veterinary activities
112 57.14% 38.39%
(N): Administrative and Support service activities 827 46.07% 32.89%
Total 79972 42.78% 26.02%

181 | P a g e
To be more precise, we can report that within the ―Manufacture of Computer, Electronic
and Electrical equipment‖ sector 60% and 43% of all the firms are conventional innovator
and eco-innovators, respectively. Within the ―Manufacture of Coke, Chemicals and Chemical
products‖ sector these rates are 53% and 38%. The least innovative, both in terms of
conventional innovation and eco-innovation, manufacturing sectors is the ―Manufacture of
Textiles, Wearing apparel and Leather products‖ by 31% and 14.4%, respectively. Among
the service sectors, ―Accommodation and Food service activities‖ appear to be the most eco-
innovative. 45% of all the firms within this sector reported as eco-innovator.
Inspecting Table 5.A and 5.B gives a clearer picture of the distribution of different type
of eco-innovators. In Table 5.A, we observe that the ―passive eco-adopters‖ represent the
biggest share of all types of eco-innovators. Accordingly, 12% of the eco-innovators have no
specific strategy to eco-innovate and moreover, 31% of all firms do not eco-innovate at all.
This may indicate that the most of the firms‘ lack environmental commitment and hence,
firms‘ deficiency in embedding environmental concern into their general innovation strategy.
Among all the manufacturing industries the ―Manufacture of Computer, Electronic and
Electrical equipment‖ sector has the highest concentration of passive eco-adopters (19%)
while the ―Accommodation and Food service activities‖ sector is the frontrunner within the
service sectors (32%).
As in the case of passive eco-adopters, the ―Manufacture of Computer, Electronic and
Electrical‖ sector makes up the biggest proportion of late strategic eco-adopters (4.7%), while
―Construction‖ has the biggest share of late strategic eco-adopters (8.9%) within the service
sectors.

182 | P a g e
Table 5.A.: Distribution of eco-innovators across industries for each type of eco-
innovator
Nace codes No#
obs.
Non eco-
innovator
Passive eco-
adopter
Late strategic
eco-adopter
(B): Mining and Quarrying 1038 28.42% 12.04% 4.43%
(C10-C12): Manufacture of Food, Beverages and
Tobacco products
6080 28.78% 12.38% 3.22%
(C13-C15): Manufacture of Textiles, Wearing
apparel and Leather products
7855 27.4% 7.49% 4.03%
(C16-C18): Manufacture of Wood, Paper and
Printing
4400 29.84% 13.75% 3.7%
(C19-C23): Manufacture of Coke, Chemicals and
Chemical products
6331 25.44% 15.28% 3.22%
(C24-C25): Manufacture of Basic metals and
Fabricated metal products
5344 29.67% 15.02% 3.79%
(C26-C30): Manufacture of Computer, Electronic
and Machinery
6711 27.67% 18.89% 4.7%
(C31-C33): Manufacture of Furniture and, Repair
and installation of machinery
4598 32.92% 14.28% 4.52%
(D): Electricity, Gas, Steam and Air conditioning
supply
1224 33.33% 15.68% 5.39%
(E): Water supply 2259 23.37% 13.28% 5.62%
(F): Construction 2202 60.94% 8.81% 8.9%
(G): Wholesale and Retail trade 13815 25.8% 7.49% 4.86%
(H49-H51): Land, Water transport and Air
transport
4748 24.22% 9.49% 2.86%
(H52-H53): Warehousing and support activities
for transportation and, Postal activities
1856 37.44% 9.21% 5.6%
(I): Accommodation and Food service activities 164 52.43% 31.7% 1.21%
(J58-J60): Publishing, Broadcasting and Video
production activities
1119 41.28% 14.29% 4.02%
(J61-J63): Telecommunications, Computer
programming and Consultancy
3160 42.12% 13.13% 4.33%
(K): Financial and Insurance activities 2534 43.21% 12.74% 3.23%
(L): Real estate activities 75 60% 24% 6.66%
(M69-M70): Legal and accounting activities and,
Activities of head offices
450 65.11% 20.88% 2%
(M71-M73): Scientific R&D, Architectural and
Engineering activities
3070 40.84% 15.47% 4.23%
(M74-M75): Other professional, Scientific,
Technical and Veterinary activities
112 55.35% 30.35% 0.89%
(N): Administrative and Support service activities 827 53.08% 21.88% 2.29%
Total 79972 31.05% 12.33% 4.23%
183 | P a g e
In Table 5.B, we can observe that the proportion of early strategic eco-adopters does not
vary much between sectors. For example, across the manufacturing industries it varies only
slightly from 7.41% to 13% indicating the existence of an established but rather low
environmental consciousness within the manufacturing industries. Among the service sectors,
however, the proportion of early strategic eco-adopters is much more variable (ranging from
1.11% to 16%). Among all the manufacturing industries, the ―Mining and Quarrying‖ sector
have the highest percentage of early strategic eco-adopters (13%), and ―Financial and
Insurance activities‖ have an even higher rate, as the leader within the service sector (16%).
The divergence between the manufacturing industries and service sectors could be associated
to significantly higher social and environmental costs pertinent to the manufacturing
industries than the service sectors.
We can also note that the three industries have the highest concentration of early
strategic eco-innovators and late strategic eco-innovators. Overall, the ―Water Supply‖ sector
has the highest rate of both types of strategic eco-innovators, with 11.8% of early strategic
eco-innovators and 15.5% of late strategic eco-innovators. Within the manufacturing
industries ―Manufacture of Coke, Chemicals and Chemical products‖ and ―Manufacture of
Computer, Electronic and Electrical equipment‖ have the highest concentrations of both types
of strategic eco-innovators. The late strategic eco-innovators make up 10.6% of the former
sector, while this rate is 10% for the latter. Moreover, the early strategic eco-innovators
constitute 11.6% of all the firms within ―Manufacture of Coke, Chemicals and Chemical
products‖ and 14% of all the firms within ―Manufacture of Computer, Electronic and
Electrical equipment‖. This may indeed point out the importance of reducing carbon footprint
for the high-tech manufacturing industries.

184 | P a g e
Table 5.B.: Summary statistics for different types of eco-innovators across all
manufacturing industries and service sectors
Nace codes No#
obs.
Early
strategic eco-
adopter
Late strategic
eco-innovator
Early strategic
eco-innovator
(B): Mining and Quarrying 1038 13% 9.63% 8.57%
(C10-C12): Manufacture of Food, Beverages
and Tobacco products
6080 7.46% 6.61% 7.4%
(C13-C15): Manufacture of Textiles, Wearing
apparel and Leather products
7855 9.12% 2.71% 3.95%
(C16-C18): Manufacture of Wood, Paper and
Printing
4400 9.06% 7.27% 7.86%
(C19-C23): Manufacture of Coke, Chemicals
and Chemical products
6331 8.33% 10.61% 11.64%
(C24-C25): Manufacture of Basic metals and
Fabricated metal products
5344 7.41% 8.85% 8.15%
(C26-C30): Manufacture of Computer,
Electronic and Machinery
6711 9.17% 10.04% 13.96%
(C31-C33): Manufacture of Furniture and
Repair and installation of machinery
4598 8.61% 6.17% 6.65%
(D): Electricity, Gas, Steam and Air
conditioning supply
1224 11.02% 9.55% 11.51%
(E): Water supply 2259 12.12% 11.81% 15.49%
(F): Construction 2202 7.44% 7.31% 6.58%
(G): Wholesale and Retail trade 13815 10.93% 4.14% 4.02%
(H49-H51): Land, Water transport and Air
transport
4748 7.79% 3.83% 3.39%
(H52-H53): Warehousing and support activities
for transportation and, Postal activities
1856 12.23% 6.25% 6.73%
(I): Accommodation and Food service activities 164 1.82% 5.48% 7.31%
(J58-J60): Publishing, Broadcasting and Video
production activities
1119 9.2% 3.03% 3.48%
(J61-J63): Telecommunications, Computer
programming, Consultancy and Information
service activities
3160 9.43% 3.51% 3.1%
(K): Financial and Insurance activities 2534 15.78% 3.78% 3.7%
(L): Real estate activities 75 2.66% 2.66% 4%
(M69-M70): Legal and accounting activities
and, Activities of head offices
450 1.11% 1.77% 0.88%
(M71-M73): Architectural, Engineering,
Advertising, Market research and Scientific
R&D activities
3070 8.69% 5.96% 6.02%
(M74-M75): Other professional, Scientific,
Technical and Veterinary activities
112 2.67% 5.35% 2.67%
(N): Administrative and Support service
activities
827 3.38% 4.83% 5.19%
Total 79972 9.29% 6.3% 6.96%

185 | P a g e
4. Empirical Results
4.1. The Results of Estimations Conducted on the Whole Sample
As mentioned in section 3.3., we have estimated an innovation production function
specified as an Ordered Probit model with selection. The dependent variable of the selection
equation is specified as a Probit model and the dependent variable of the intensity equation
(or outcome equation) is an ordered variable ranking firms from the less (non eco-innovator)
to the more eco-innovative (early strategic eco-innovator). The results obtained from the
ordered probit model are rather hard to interpret; one should also estimate the marginal
effects of the independent variables in order to get robust and meaningful deductions.
Accordingly, Table 6 reports marginal effects calculated after estimating the selection
equation and the outcome equation. The first column of Table 6 displays the marginal effects
for the selection equation. In the same vein, the other columns of Table 6 displays the
marginal effects for each type of eco-innovator computed after estimating the ordered probit
with selection.
The estimation results indicate that the firm-specific characteristics, organizational and
technical capabilities and moreover, firms‘ cooperative behaviour are significantly important
for eco-innovators. Voluntary engagement and environmental regulation are the other crucial
factors that have a significant impact on firms‘ eco-innovation behaviour. Nevertheless, we
also note that the marginal impact of these factors tend to change according to different types
of eco-innovators. More precisely, we observe that the voluntary engagement is significantly
more important for the early strategic eco-innovators than the rest, while the marginal impact
of the environmental regulation is more significant for the late strategic eco-innovators than
the other types of eco-innovators. We note a similar relationship between the voluntary
engagement and environmental regulations and their respective marginal impact on early and
late strategic eco-adopters. This indicates that self-determination is a key point for early
strategic eco-innovators and early strategic adopters while environmental regulation might be
an efficient tool for attracting new firms and channelling their innovative behaviour to a more
sustainable approach.
Table 6 shows that being part of a larger group has a significantly positive marginal
impact on each type of eco-innovator, except passive eco-adopters. This indicates that firms
in groups, rather than individual firms, are more likely engage in eco-innovation. Firms that
are part of a larger group are 1.5% and 2.4% more likely to be early strategic eco-innovator
and late strategic eco-innovator, respectively. This can be explained through relatively easier
186 | P a g e
access to the financial resources and to technological and organisational assistance required
for the realisation of eco-innovation. By considering the proximity to these essential factors,
group members may perceive the eco-innovation process as less risky which may, in return,
have a positive impact on firm‘s eco-innovative behaviour. Another reason for this effect
could be the mutual innovative strategy of the group firms, in general. When the group
members share the same concerns, in this case environmental concerns, their innovative
approaches may become alike, which may explain the positive impact of group membership
on eco-innovation behaviour.
The other control variable, firm size also indicates a positive relationship between firm
size and firms‘ strategic behaviour towards eco-innovation. The estimation results show that
both medium and large firms are more likely to be eco-innovators, especially the strategic
eco-innovators. Large firms are 6% more likely to be early strategic eco-innovators and 7.7%
more likely to be late strategic eco-innovators, while the marginal effect for early strategic
eco-adopters and late strategic eco-adopters is 2.2% and 0.9%, respectively. As in the case of
group membership large firms presumably have easier access to the financial resources
required for their R&D investments. This assumption is supported by these results to a certain
extent. Indeed, the uncertain market demand and financial risks inherent in the innovative
process may hinder a firm‘s eco-innovative behaviour leaving only the medium and large size
firms to engage in eco-innovation as they may be the only ones that have the required
financial resources to actively engage in eco-innovation.

187 | P a g e
Table 6: Marginal effects for the whole sample
Selection
equation
Type of eco-innovator
Selection into
Innovation
Early
strategic
eco-
innovator
Late
strategic
eco-
innovator
Early
strategic eco-
adopter
Late
strategic
eco-adopter
Passive
eco-
adopter
Non eco-
innovator
Group 0.065**
(0.027)
0. 015***
(0.002)
0.024***
(0.002)
0.008***
(0.001)
0.003***
(0.0004)
0.001
(0.001)
-0.051***
(0.006)
Medium size 0.12***
(0.025)
0.02***
(0.002)
0.031***
(0.002)
0.01***
(0.001)
0.004***
(0.0004)
0.001
(0.001)
-0.066***
(0.006)
Large size 0.25***
(0.045)
0.06***
(0.004)
0.077***
(0.004)
0.022***
(0.001)
0.009***
(0.0005)
-0.023***
(0.003)
-0.145***
(0.007)
R&D intensity -0.0002***
(0.0)
0.004***
(0.0002)
0.006***
(0.0003)
0.003***
(0.0001)
-0.007***
(0.0009)
-0.005**
(0.0001)
-0.001***
(0.0001)
Continuous
R&D
0.7***
(0.055)
0.012***
(0.0002)
0.017***
(0.003)
0.005***
(0.001)
0.002***
(0.0005)
0.0001
(0.0006)
-0.036***
(0.007)
Openness -0.076***
(0.004)
0.003***
(0.0003)
0.005***
(0.0005)
0.0022***
(0.0002)
0.0008***
(0.0001)
0.001**
(0.0002)
-0.012***
(0.001)
Scientific
cooperation
-0.04
(0.077)
0.013***
(0.003)
0.021***
(0.004)
0.0063***
(0.001)
0.003***
(0.0005)
-0.0003
(0.0009)
-0.043***
(0.008)
Other
cooperation
0.93***
(0.05)
0.015***
(0.002)
0.023***
(0.003)
0.0076***
(0.001)
0.003***
(0.0005)
0.0004
(0.0008)
-0.049***
(0.007)
International
market
0.21***
(0.024)
0.007***
(0.001)
0.013***
(0.002)
0.0042***
(0.001)
0.0022***
(0.0004)
0.0016*
(0.0006)
-0.028***
(0.005)
National market 0.21***
(0.026)
-0.005**
(0.002)
-0.01**
(0.003)
-0.003**
(0.001)
-0.0014**
(0.0004)
-0.0006
(0.0003)
0.02**
(0.006)
Public funds 0.28***
(0.087)
0.012**
(0.003)
0.019**
(0.004)
0.006**
(0.001)
0.0022**
(0.0006)
-0.0062
(0.0007)
-0.033**
(0.009)
Voluntary 0.52***
(0.034)
0.082***
(0.003)
0.11***
(0.003)
0.03****
(0.001)
0.01***
(0.0006)
-0.034***
(0.003)
-0.198***
(0.006)
Regulation 0.48***
(0.031)
0.016***
(0.003)
0.15***
(0.003)
0.045***
(0.001)
0.019***
(0.007)
-0.03***
(0.004)
-0.2***
(0.0061)
- This table reports marginal effects
- Standard deviation is reported in parentheses below each coefficient
-*, **
and ***
denote significance at the 10%, 5% and 1% level, respectively
-Wald chi² (88): 18562.74***
-Global significance of Industry dummies: 1403.46*** and Global significance of Country dummies:
8953.09***
- Number of observation: 30637 and Rho: -0.069
Amongst the conventional innovation inputs, the marginal effect of R&D intensity is
significantly positive for early strategic eco-innovator (0.03%), late strategic eco-innovator
(0.05%) and early strategic eco-adopter (0.02%). The impact of R&D intensity is negative for
the rest of the eco-innovators and non-eco-innovators. We suggest that the R&D intensity

188 | P a g e
may point out the importance given to the introduction and/or development of new products
and processes developed in-house therefore observing a relatively higher marginal impact for
the strategic eco-innovators could support this claim. Nevertheless, the marginal impact of
the R&D intensity is rather low. This could be due to the nature of eco-innovation itself,
which often requires knowledge and skills that may fall outside of the firm‘s expertise.
Hemmelskamp (1999) claims that potential eco-innovative companies are likely to have
lower R&D intensity as they tend to countervail the low R&D effort with use of external
sources of information. The other reason could be the original intentions of the innovative
project. More precisely, if environmental concerns are at the heart of the innovative
behaviour, a potential eco-innovator should and would incorporate environmental concerns
and objectives into the innovative process from the beginning. Failing to do so may not be
sufficient to yield eco-innovation per se. When the former is the case, the case of increasing
need for additional technical and scientific knowledge, the eco-innovative firms may draw on
the existing knowledge base accrued from engaging in continuous R&D and incorporate this
knowledge with other competencies such as cooperation with external partners. Indeed, the
estimation results point out this direction. Engagement in continuous R&D activities is the
second conventional innovation input that reveals a positive marginal impact on a firm‘s
propensity to become an eco-innovator especially, the ―early‖ and ―late‖ strategic eco-
innovator. Accordingly, firms that engage in continuous R&D activities are 1.7% more likely
to be late strategic eco-innovator while the rate is 1% for being an early strategic eco-
innovator. The marginal effect for early strategic eco-adopters (0.5%) is higher than late
strategic eco-adopters (0.2%) indicating the significance of scientific knowledge,
technological capabilities and absorptive capacity that can be acquired by engaging in R&D
on a continuous basis. These competencies may be of greater importance for strategic eco-
innovators than strategic eco-adopters since technical capabilities are more essential for
developing an eco-innovation than for adopting them.
In addition, the results take our attention to the significance of the use of external sources
of information (openness) for each type of eco-innovators. These firms are 0.5% and 0.3%
more likely to be late strategic eco-innovators and early strategic eco-innovators,
respectively. The marginal effect of openness for different types of eco-adopters is relatively
less but still significant, indicating that the heterogeneous information is of great importance
for each type of eco-innovator. We assume that firms would need to establish formal and
informal networks to associate their existing knowledge with the other external knowledge.
As Robin and Schubert (2013) claimed most lines of research agree on the fact that
189 | P a g e
interactions between industry and science are among the most prominent institutional
interfaces for knowledge diffusion which is a crucial component for value creation and
successful innovation. Networks may provide an adequate environment for potential eco-
innovators to fill the gap between their competencies and the competencies required to
undertake successful innovation. Accordingly, indicators of formal cooperation, both with
scientific and non-scientific partners, imply the strategic importance of establishing formal
cooperation. Both of these formal cooperation indicators reveal a significantly positive
marginal impact on the eco-innovation behaviour of different types of eco-innovators. Firms
that establish cooperation with non-scientific partners are 1.5% and 2.3% more likely to be
early strategic eco-innovators and late strategic eco-innovators, respectively. These
percentages are 1.3% and 2.1% for those that established formal cooperation with scientific
partners. The estimation results on the use of internal and external sources of information and
the use of formal cooperation partners indeed indicate the complexity of the eco-innovation
process and the heterogeneity of the knowledge and the information required to undertake
successful eco-innovation. Besides the technical complexity of the innovation process, the
environmental concerns inherent in the eco-innovation process can turn a promising
innovative attempt into a complex mission. In order to avoid this type of inertia, firms can
involve other partners and mitigate the risks inherent in the innovative process and
complement their competencies with the information obtained from their formal and informal
partners.
International market conditions appear to be another factor that has a positive impact on
a firm‘s strategic eco-innovation behaviour. Firms that are active in international markets are
0.7% more likely to be early strategic eco-innovators while this impact is almost twice as
high (1.3%) for late strategic eco-innovators. The results, however, also indicate that national
market conditions may not be as efficient as international market conditions with regard to
incentives that it may provide and hence, firms that are active in national markets are less
likely to introduce eco-innovation and/or adopt eco-innovation. These results, in general,
imply that only international competition can be regarded as a relevant driver for successful
eco-innovation and/or adoption of eco-innovation, which may rule out the national and local
market conditions as significant drivers for eco-innovating firms.
The EU‘s 6th
and 7th
Framework Programmes aim at providing funding opportunities to
consolidate and develop the EU‘s leading edge in becoming one of the world‘s most
knowledge-based and sustainable economies. The estimation results show that the financial
support provided by the EU is, indeed, one of the significant components of an eco-

190 | P a g e
innovative firm‘s strategy. Accordingly, firms that have received the EU funds are 0.1% more
likely to be early strategic eco-innovators while this rate is 1.6% for being a late strategic
eco-innovator. We can also observe that the marginal effect of the EU funds is significantly
positive for eco-adopters.
4.2. The Country Specific Analyses
The main objective of the above section is to draw a general picture of the firm-specific
characteristics and capabilities of different types of eco-innovators found within the eleven
EU countries and the respective roles of these characteristics within the eco-innovation
process. Running a regression on the whole sample for the eleven European countries may,
sometimes, be misleading since the sheer sample size may reflect some regressors as more
significant than they actually are. In order to prevent any dispute on this issue we move the
analysis one step ahead and conduct country specific analyses on sub-samples.
Accordingly, we constructed four different country groups out of the eleven European
countries included in the CIS 2008 survey. The separation of country groups is based on the
geographic proximity of each country to other countries in the group. Thus, the four different
country groups are as follows: Western European (Germany and Ireland), Mediterranean
(Cyprus and Portugal), Eastern European (Bulgaria, Romania, Slovakia, Czech Republic and
Hungary) and Baltic (Lithuania and Estonia). To provide greater detail Table 7 (below)
presents the distribution of eco-innovators and conventional innovators for each of the eleven
countries. We can see that, there is significant heterogeneity among the countries in terms of
the number of observations, the distribution of eco-innovators and non-eco-innovators.
Amongst all the countries included in the regressions, Germany and Portugal appear to
be the most innovative. 67% of all German firms and 65% of all Portuguese firms included in
the survey introduced at least one conventional innovation. When we consider the eco-
innovative performance, we observe that Portuguese firms appear to be slightly more eco-
innovative than German firms, which according to us a bit peculiar. Thus, 59% of all
Portuguese firms and 53% of all German firms included in the survey appear to be eco-
innovators. Furthermore, with respect to innovative and eco-innovative performance,
Bulgaria is the least innovative country in our dataset. Among all the firms included in the
survey, 30% of all firms within this country introduced a conventional innovation while only
7.3% of them were able to introduce an eco-innovation during the observation period.
Considering the heterogeneity inherent in the distribution of innovators in each country, it
makes sense to conduct country specific analysis in order to shed light on the role of firm

191 | P a g e
specific characteristics and capabilities that are assumed to have determining role on firm‘s
strategic eco-innovation behaviour. The following section will discuss the regression results
that are obtained from the country specific analyses.
Table 7: Distribution of innovators across countries
Country No# obs. Innovator
(Mean)
Eco-innovator
(Mean)
Bulgaria 31718 29.52% 7.31%
Cyprus 1024 58.11% 15.82%
Czech Republic 6804 57.55% 48.5%
Germany 6026 66.69% 52.7%
Estonia 3986 62.07% 30.76%
Hungary 5390 33.04% 21.04%
Ireland 2178 58.72% 42.1%
Lithuania 2111 42.02% 22.64%
Portugal 6512 64.71% 58.71%
Romania 9631 39.57% 32.79%
Slovakia 4592 40.94% 24.35%
Total 79972 42.78% 26.02%
- An innovator is product, process, organisational and marketing innovator without any
environmental impact
4.2.1. The Results of Estimations Conducted by Group of Countries
As was the case for our global regression model, we start the discussion of the results
with those pertaining to the marginal effects obtained after conducting the Ordered Probit
model with selection. Table 8.A, 8.B, 8.C and 8.D displays the estimation results pertinent to
the country specific sub-samples.
When we inspect the estimation results, we can see that only the control variables (group
membership and firm size), voluntary engagement and regulation seem to be important for all
the eco-innovators within all country groups. Moreover, the marginal impacts of these factors
appear to be more significant for the strategic eco-innovators than the strategic eco-adopters
in all country groups but their respective importance varies accordingly. More precisely,
within the Western European and Baltic countries firms‘ structural characteristics, voluntary
engagement in eco-innovation and environmental regulation are the main factors that leads
firms to be early strategic eco-innovators. The marginal impact of the same factors is of
higher importance for the late strategic eco-innovators within the Eastern European and

192 | P a g e
Mediterranean countries highlighting the differences in eco-innovation strategies of each
country group. Nonetheless, our analysis reveals new insights and highlights the existence of
significant differences between country groups with regard to their cooperative behaviour,
importance of conventional innovation inputs, market conditions and financial funds
provided by the EU.
To begin with, we can observe that within the Western European countries engagement
in R&D on a continuous basis and being active in the international markets are distinguishing
characters shared by all types of eco-innovators. As expected, the respective importance of
these factors is significantly more important for the early strategic eco-innovators than the
rest. Moreover, the marginal impact of voluntary engagement is also higher than the impact
of the regulatory framework for the early strategic eco-innovators asserting the significance
of voluntary proactive approaches to eco-innovation for this type of eco-innovators. Lastly,
we can note that the marginal impact of the EU funds is significantly positive only for the late
strategic eco-innovators and late strategic eco-adopters indicating that the EU‘s 6th
and 7th
Framework Programmes are indeed efficient tools in providing incentives and attracting new
firms to engage in eco-innovation.

193 | P a g e
Table 8.A: Marginal effects for the Western European group Selection
equation
Type of eco-innovator
Variables Selection
into
Innovation
Early
strategic
eco-
innovator
Late
strategic
eco-
innovator
Early
strategic
eco-
adopter
Late
strategic
eco-
adopter
Passive
eco-
adopter
Non eco-
innovator
Group 0.031
(0.06)
0.028**
(0.009)
0.013**
(0.004)
0.003**
(0.001)
0.002**
(0.0004)
0.004
(0.003)
-0.05**
(0.014)
Medium size 0.11
(0.057)
0.041***
(0.009)
0.019***
(0.004)
0.004***
(0.001)
0.002**
(0.0005)
0.004
(0.004)
-0.07***
(0.015)
Large size 0.17
(0.09)
0.148***
(0.019)
0.052***
(0.006)
0.012***
(0.002)
0.005***
(0.001)
-0.047**
(0.016)
-0.17***
(0.015)
R&D
intensity
-0.66**
(0.24)
0.009
(0.033)
0.004
(0.015)
0.001
(0.003)
0.0004
(0.001)
0.002
(0.007)
-0.017
(0.061)
Continuous
R&D
0.52***
(0.097)
0.025**
(0.009)
0.012**
(0.004)
0.003*
(0.001)
0.001*
(0.0005)
0.003
(0.003)
-0.044**
(0.016)
Openness 0.28***
(0.018)
0.002
(0.002)
0.0008
(0.0009)
0.0002
(0.0002)
0.00
(0.01)
0.0004
(0.0006)
-0.0034
(0.003)
Scientific
cooperation
-0.073
(0.129)
0.02
(0.013)
0.0082
(0.006)
0.0023
(0.001)
0.0008
(0.0006)
0.0017
(0.002)
-0.033
(0.02)
Other
cooperation
0.31**
(0.113)
0.02
(0.011)
0.008
(0.005)
0.002
(0.001)
0.001
(0.0005)
0.002
(0.002)
-0.033
(0.018)
International
market
0.138*
(0.06)
0.0172*
(0.008)
0.007*
(0.004)
0.002*
(0.001)
0.0008*
(0.0004)
0.004
(0.003)
-0.031*
(0.015)
National
market
0.091
(0.062)
-0.0042
(0.01)
-0.0012
(0.005)
-0.0006
(0.001)
-0.0001
(0.0004)
-0.0008
(0.002)
0.007
(0.018)
Public funds 0.6
(0.34)
0.037
(0.021)
0.016*
(0.008)
0.003
(0.001)
0.001*
(0.0008)
-0.002
(0.007)
-0.055*
(0.026)
Voluntary 0.34***
(0.083)
0.147***
(0.014)
0.05***
(0.005)
0.011***
(0.001)
0.004***
(0.001)
-0.046***
(0.013)
-0.166***
(0.012)
Regulation 0.36***
(0.073)
0.104***
(0.01)
0.04***
(0.004)
0.009***
(0.001)
0.004***
(0.0009)
-0.014
(0.009)
-0.143***
(0.013)
- This table reports marginal effects
- Standard deviation is reported in parentheses below each coefficient
-*, **
and ***
denote significance at the %10, %5 and %1 level, respectively
-Wald chi² (64): 1702.67***
-Global significance of Industry dummies: 305.31***
- Number of observation: 4016 and Rho: -0.26**

194 | P a g e
Within the Baltic countries, formal cooperation with non-scientific partners is of
significant importance for all type of eco-innovators especially, for the early strategic eco-
innovators. As stated in Von Hippel (1988) and Belderbos et al. (2004) cooperation with non-
scientific partners (such as customers, suppliers, etc.) may indeed reduce the risks inherent in
the market introduction phase and can increase the technological base of the firm. Therefore,
we found supporting evidence for this claim. Furthermore, unlike the Western European case,
we now see that the marginal impact of environmental regulation is slightly higher than the
marginal impact of voluntary engagement for the early strategic eco-innovators. This result
indicates that firms within the Western European countries are slightly more proactive than
their counterparts within the Baltic countries. However, the estimated coefficients of the
voluntary engagement and regulatory framework are quite similar to each other asserting that
they are the main factors shaping the firms‘ eco-innovation strategy within the Baltic
countries.

195 | P a g e
Table 8.B: Marginal effects for the Baltic group Selection
equation
Type of eco-innovator
Variables Innovator Early
Strategic
Eco-
Innovator
Late
Strategic
Eco-
Innovator
Early
Strategic
Eco-
Adopter
Late
Strategic
Eco-
Adopter
Passive
Eco-
Adopter
Non Eco-
Innovator
Group -0.07
(0.08)
0.021*
(0.008)
0.019**
(0.007)
0.005*
(0.002)
0.002*
(0.0008)
0.003
(0.002)
-0.051**
(0.019)
Medium size 0.32***
(0.085)
0.044***
(0.008)
0.041***
(0.007)
0.012***
(0.002)
0.004***
(0.001)
0.008
(0.005)
-0.111***
(0.02)
Large size 0.54***
(0.13)
0.104***
(0.028)
0.07***
(0.014)
0.016***
(0.003)
0.005***
(0.001)
-0.017
(0.012)
-0.178***
(0.036)
R&D intensity 0.073
(0.052)
-0.09
(0.067)
-0.083
(0.062)
-0.025
(0.019)
-0.008
(0.006)
-0.017
(0.017)
0.226
(0.168)
Continuous
R&D
0.45**
(0.169)
0.009
(0.01)
0.008
(0.008)
0.002
(0.002)
0.0009
(0.0009)
0.001
(0.001)
-0.023
(0.023)
Openness -0.33***
(0.02)
0.004
(0.003)
0.003
(0.002)
0.001
(0.0007)
0.0003
(0.0002)
0.0007*
(0.0003)
-0.01
(0.006)
Scientific
cooperation
0.0
(0.0)
0.003
(0.013)
0.003
(0.011)
0.001
(0.003)
0.0003
(0.001)
0.0006
(0.002)
-0.009
(0.032)
Other
cooperation
0.5***
(0.112)
0.033***
(0.008)
0.03***
(0.007)
0.008**
(0.002)
0.003**
(0.001)
0.004
(0.004)
-0.08***
(0.021)
International
market
0.48***
(0.088)
0.017
(0.009)
0.016
(0.009)
0.005
(0.003)
0.001
(0.001)
0.004
(0.004)
-0.044
(0.026)
National market 0.175*
(0.086)
0.003
(0.009)
0.003
(0.009)
0.0009
(0.002)
0.0003
(0.001)
0.0006
(0.002)
-0.008
(0.025)
Public funds -0.083
(0.247)
0.016
(0.014)
0.014
(0.012)
0.004
(0.003)
0.001
(0.001)
0.001
(0.001)
-0.038
(0.031)
Voluntary 0.45**
(0.146)
0.174***
(0.017)
0.11***
(0.009)
0.026***
(0.003)
0.007***
(0.001)
-0.028*
(0.014)
-0.29***
(0.019)
Regulation 0.98***
(0.118)
0.196***
(0.014)
0.126***
(0.01)
0.03***
(0.004)
0.009***
(0.002)
-0.024
(0.014)
-0.338***
(0.024)
Lithuania -0.96***
(0.091)
-0.077***
(0.009)
-0.074***
(0.011)
-0.023***
(0.004)
-0.008***
(0.002)
-0.024
(0.013)
0.21***
(0.034)
- Standard deviation is reported in parentheses below each coefficient
-*, **
and ***
denote significance at the %10, %5 and %1 level, respectively
-Wald chi² (67): 2332.2***
-Global significance of Industry dummies: 322.8***
- Number of observation: 3320 and Rho: -0.001

196 | P a g e
Within the Mediterranean countries, engagement in R&D on a continuous basis is a
significant factor for each type of eco-innovators however, it is relatively more important for
the late strategic eco-innovator than the rest of the eco-innovators. Besides, international
market conditions and their interactions with external partners seem to be other significant
exogenous factors for the eco-innovators within this country group. We observe that the eco-
innovators tend to be open to the use of internal and external sources of information and,
establish a formal bond with other cooperation partners. Additionally, both of the strategic
eco-adopters tend to take this cooperative behaviour one step forward and incorporate the
scientific partners within the eco-innovative process. Therefore, we can claim that firms
within the Mediterranean countries are more likely to have a cooperative behaviour and the
late strategic eco-innovators are driven by mostly with their voluntary motivation while the
environmental regulation is of second degree importance.

197 | P a g e
Table 8.C: Marginal effects for the Mediterranean group Selection
equation
Type of eco-innovator
Variables Innovator Early
Strategic
Eco-
Innovator
Late
Strategic
Eco-
Innovator
Early
Strategic
Eco-
Adopter
Late
Strategic
Eco-
Adopter
Passive
Eco-
Adopter
Non Eco-
Innovator
Group 0.19**
(0.062)
0.02***
(0.005)
0.043***
(0.009)
0.004***
(0.001)
0.002***
(0.0005)
-0.016**
(0.005)
-0.053**
(0.011)
Medium size 0.06
(0.058)
0.022***
(0.004)
0.046***
(0.008)
0.004***
(0.0009)
0.002***
(0.0005)
-0.02***
(0.005)
-0.058***
(0.01)
Large size 0.23
(0.167)
0.088***
(0.015)
0.128***
(0.014)
0.009***
(0.002)
0.004***
(0.001)
-0.097***
(0.018)
-0.132***
(0.013)
R&D
intensity
3.21
(4.08)
-0.009
(0.012)
-0.022
(0.028)
-0.002
(0.003)
-0.001
(0.001)
0.007
(0.008)
0.029
(0.036)
Continuous
R&D
1.6***
(0.31)
0.022***
(0.006)
0.044***
(0.011)
0.004***
(0.001)
0.002***
(0.0005)
-0.02**
(0.006)
-0.053***
(0.012)
Openness -0.56***
(0.033)
0.003**
(0.001)
0.007**
(0.002)
0.0007**
(0.0002)
0.0004**
(0.0001)
-0.002*
(0.001)
-0.009***
(0.002)
Scientific
cooperation
-0.44
(0.283)
0.011
(0.006)
0.024
(0.013)
0.002*
(0.001)
0.001*
(0.0006)
-0.009
(0.006)
-0.03*
(0.015)
Other
cooperation
1.73***
(0.175)
0.009*
(0.004)
0.021*
(0.009)
0.002*
(0.001)
0.001*
(0.0005)
-0.007*
(0.003)
-0.026*
(0.012)
International
market
0.125*
(0.052)
0.009*
(0.003)
0.02*
(0.008)
0.002*
(0.0009)
0.001*
(0.0005)
-0.006*
(0.002)
-0.027*
(0.01)
National
market
0.143*
(0.058)
-0.003
(0.005)
-0.007
(0.011)
-0.0007
(0.001)
-0.0004
(0.0006)
0.002
(0.003)
0.009
(0.013)
Public funds 0.46
(0.36)
-0.0004
(0.007)
-0.001
(0.016)
-0.0001
(0.001)
0.0
(0.0009)
0.0003
(0.004)
0.001
(0.021)
Voluntary 0.53***
(0.061)
0.091***
(0.006)
0.157***
(0.009)
0.014***
(0.001)
0.007***
(0.001)
-0.083***
(0.009)
-0.186***
(0.011)
Regulation 0.43***
(0.07)
0.062***
(0.005)
0.113***
(0.008)
0.01***
(0.001)
0.005***
(0.0007)
-0.06***
(0.007)
-0.133***
(0.01)
- This table reports marginal effects
- Standard deviation is reported in parentheses below each coefficient
-*, **
and ***
denote significance at the %10, %5 and %1 level, respectively
-Wald chi² (64): 2540.48***
-Global significance of Industry dummies: 452.37***
- Number of observation: 6599 and Rho: -0.06
In Table 8.D we observe that the Eastern European eco-innovators tend to differentiate
themselves from the other eco-innovators within other country groups. The main difference
has to do with use of internal and external sources of information and, the formal bonds with

198 | P a g e
external partners. Accordingly, openness is one of the distinguishing characteristic of the
Eastern European eco-innovators along with the cooperative behaviour with the scientific and
other non-scientific partners. Moreover, their relative importance is higher for the late
strategic eco-innovators than the rest. As in the Mediterranean countries, continuous R&D
effort is another significant factor leading firms to be more eco-innovative especially, for the
late strategic eco-innovators. International market condition is also another significant factor.
Therefore, firms that are active in the international markets tend to be eco-innovative, while
national market conditions tend to reveal exact opposite impact. Finally, we also observe that
financial funds provided by the EU‘s 6th
and 7th
Framework Programmes are perceived as
another significant factor by the Eastern European eco-innovators. These funds are of higher
importance for the late strategic eco-innovators than the rest hence, cannot be disregarded.

199 | P a g e
Table 8.D: Marginal effects for the Eastern European group Selection
equation
Type of eco-innovator
Variables Innovator Early
Strategic
Eco-
Innovator
Late
Strategic
Eco-
Innovator
Early
Strategic
Eco-
Adopter
Late
Strategic
Eco-
Adopter
Passive
Eco-
Adopter
Non Eco-
Innovator
Group 0.035
(0.059)
0.011***
(0.002)
0.022***
(0.004)
0.01***
(0.001)
0.004***
(0.0008)
0.001
(0.0006)
-0.049***
(0.009)
Medium Size 0.022
(0.051)
0.015***
(0.002)
0.03***
(0.003)
0.014***
(0.001)
0.006***
(0.0008)
0.001
(0.0008)
-0.068***
(0.008)
Large Size 0.003
(0.078)
0.044***
(0.004)
0.073***
(0.005)
0.03***
(0.002)
0.012***
(0.0009)
-0.013***
(0.003)
-0.146***
(0.009)
R&D
intensity
0.005
(0.007)
0.0007
(0.0004)
0.001
(0.0008)
0.0006
(0.0004)
0.0003
(0.0001)
0.0001
(0.0001)
-0.003
(0.002)
Continuous
R&D
-0.133
(0.084)
0.005*
(0.002)
0.01*
(0.005)
0.004*
(0.002)
0.002*
(0.001)
0.0006*
(0.0002)
-0.023*
(0.012)
Openness 0.143***
(0.011)
0.002***
(0.0003)
0.005***
(0.0007)
0.002***
(0.0003)
0.001***
(0.0001)
0.0006**
(0.0001)
-0.011***
(0.001)
Scientific
cooperation
-0.31**
(0.097)
0.012***
(0.003)
0.023***
(0.006)
0.01***
(0.002)
0.004***
(0.001)
-0.0002
(0.001)
-0.05***
(0.012)
Other
cooperation
0.55***
(0.086)
0.011***
(0.002)
0.022***
(0.004)
0.01***
(0.002)
0.004***
(0.0009)
0.0008
(0.0006)
-0.049***
(0.009)
International
market
0.136**
(0.05)
0.007***
(0.001)
0.015***
(0.003)
0.007***
(0.001)
0.003***
(0.0007)
0.001**
(0.0006)
-0.035***
(0.008)
National
market
0.131**
(0.05)
-0.008***
(0.002)
-0.016***
(0.004)
-0.007***
(0.001)
-0.003***
(0.0008)
-0.0008
(0.0004)
0.036***
(0.008)
Public funds -0.007
(0.092)
0.007*
(0.003)
0.013*
(0.006)
0.006*
(0.002)
0.002*
(0.001)
0.0004
(0.0005)
0.03*
(0.013)
Voluntary 0.31***
(0.087)
0.056***
(0.004)
0.089***
(0.005)
0.035***
(0.002)
0.013***
(0.0009)
-0.022***
(0.003)
-0.17***
(0.008)
Regulation 0.23***
(0.062)
0.09***
(0.004)
0.14***
(0.005)
0.054***
(0.002)
0.021***
(0.001)
-0.03***
(0.003)
-0.277***
(0.007)
Romania 0.34***
(0.081)
0.446***
(0.011)
0.217***
(0.006)
0.026***
(0.002)
-0.003**
(0.001)
-0.27***
(0.006)
-0.41***
(0.005)
Slovakia 0.4***
(0.118)
0.054***
(0.006)
0.083***
(0.007)
0.031***
(0.002)
0.011***
(0.0009)
-0.027***
(0.005)
-0.15***
(0.011)
Czech
republic
0.11
(0.074)
0.063***
(0.005)
0.098***
(0.005)
0.038***
(0.002)
0.014***
(0.001)
-0.027***
(0.004)
-0.18***
(0.009)
Hungary -0.52***
(0.072)
0.101***
(0.008)
0.13***
(0.007)
0.043***
(0.002)
0.014***
(0.0009)
-0.067***
(0.007)
-0.22***
(0.009)
- This table reports marginal effects
- Standard deviation is reported in parentheses below each coefficient
-*, **
and ***
denote significance at the %10, %5 and %1 level, respectively
-Wald chi² (75): 9778.03***
-Global significance of Industry dummies: 507***
- Number of observation: 13660 and Rho: -0.212***

200 | P a g e
5. Conclusion
Eco-innovation is one of the most pivotal developments in the search to solve the
world‘s environmental problems and sustainability challenges. Most of the empirical research
addresses the drivers and barriers of eco-innovation from the conventional market-pull,
technology-push, and institutional (regulatory) factors perspective (Porter and Van der Linde,
1995; Rennings, 2000; Brunnermeier and Cohen, 2003; Jaffe et al., 2002) while few studies
highlight the importance of other dynamic factors, such as firms‘ economic, technical,
managerial and social capabilities (Horbach, 2008; Borghesi et al., 2012; De Marchi, 2012).
Highlighting the significance of these factors then, is our primary object. In addition to that
significant amount of econometric research has focused on eco-innovation that is new to the
world, disregarding the potential differences in characteristics and capabilities among eco-
innovators and eco-adopters (Kemp and Pontoglio, 2011, p. 34) which constitutes our second
research question that is addressed within the context of this research. Therefore, we aim at
overcoming these limitations and try to identify the role of firms‘ internal characteristics and
organizational capabilities for different type of eco-innovators by employing a unique
database drawn from the last wave of the Community Innovation Survey (CIS) 2008. The
most significant added value of this research is its ability to distinguish eco-innovators into
five mutually exclusive categories namely ―Passive eco-adopters‖, ―Late strategic eco-
adopter‖, ―Early strategic eco-adopter‖, ―Late strategic eco-innovator‖ and ―Early strategic
eco-innovator‖. Besides, we also conducted country specific analyses in order to compare and
contrast the country specific differences with regard to strategic behaviour of eco-innovators
and the role of firm specific characteristics within the eco-innovation process.
The estimation results indicate that a firm‘s structural characteristics and organizational
and technical capabilities are crucial factors affecting its strategic behaviour toward eco-
innovation. Those factors also have significant impact on firms‘ strategic behaviour towards
eco-innovation. We note that large and medium size firms and moreover, firms that are part
of a larger organization (group firms) are more likely to be eco-innovators. Firms‘
cooperative behaviour (such as, cooperation with scientific partners and/or other partners)
and their ability to use external sources of information are the other factors that increase
firms‘ probability to engage in eco-innovation. We have evidence to believe that potential
eco-innovators are more likely to be active in larger markets (e.g. international market). All
the more, we observe that the marginal impact of certain factors tend to change according to
type of eco-innovator. More precisely, early strategic eco-innovators distinguish themselves

201 | P a g e
from the rest of the eco-innovators with a highest marginal effect of the adoption of voluntary
environmental agreements. Strategic adopters, by contrast, display a higher marginal effect of
environmental regulation and available public funding, such as the financial funds provided
by the EU‘s 6th
and 7th
FP. This, on the one hand, demonstrates the efficiency of regulatory
framework in attracting firms‘ attention to eco-innovation. On the other, it suggests that we
still in need of individually determined risk takers to achieve higher level of eco-innovative
efforts. If efficiently used these tools may have a significant impact on firm‘s eco-innovation
efforts, increase the number of eco-innovators by channelling otherwise non eco-innovator
firms‘ innovative behaviour to a more sustainable approach.
We also found some intriguing results in regard to the role of conventional R&D inputs
as determinants of a firm‘s eco-innovation behaviour. Our estimation results show that the
marginal impact of a firm‘s R&D intensity is rather low for eco-innovators. This result
indeed point out the role of some other external factors (such as; scientific cooperation,
cooperation with others and informal cooperation ‗openness‘) within a firm‘s eco-innovation
process. Given that eco-innovation process is very complex, presumably even more than
conventional innovation, realization of eco-innovation relies on multiple interactions with
various actors (such as, research institutes, independent experts of government agencies etc.).
Therefore, a firm‘s single-handed efforts, such as increasing R&D expenditures, may not be
enough to allow for the introduction of an eco-innovation. This has let us conclude that
potentially eco-innovative companies are likely to have lower R&D intensity, since they tend
to countervail the low R&D effort with the use of external sources information as
Hemmelskamp‘s (1999) suggested.
By acknowledging the technical problems that running a regression on the whole sample,
we also conducted country specific analyses on sub-samples. Our overall estimation results
consolidated with the country-specific estimation results. In short, the analyses showed that
different country groups diverge from each other with respect to the role of their cooperative
behaviour and the role of conventional R&D inputs. Within Western European and Baltic
countries, firms‘ structural characteristics, voluntary engagement in eco-innovation and
environmental regulation are the main factors associated with a higher probability to be early
strategic eco-innovators. Within Eastern European and Mediterranean countries, the marginal
impact of those same factors is higher for late strategic eco-innovators, which may highlight
differences with respect to eco-innovation strategies across country groups. This is to say,
besides the firms‘ technical capabilities, their global network can also be crucially important
for successful eco-innovation. Forming formal cooperation with scientific and other partners

202 | P a g e
and, being open to the external sources of information appear to be especially important for
eco-innovators. Eco-adopters, as well as eco-innovators, tend to look for external financial
support to mitigate financial risks involved in the process. According to our understanding,
this shows the complex nature of eco-innovation process which may require external
information, knowledge and skills that may not be at the firm‘s disposal. When this is the
case, entering into partnership with scientific and non-scientific partners could be of greater
importance especially for the less R&D-intense sectors. Within these sectors, the cost of
external knowledge can be costly and time consuming to obtain. Firms that possess well
established global network, both with formal and informal partners, could use their
acquaintance to lower the associated cost and the time required.
Hence, we can conclude this chapter by claiming that a firm‘s structural characteristics
and organizational and technical capabilities are crucial factors affecting its strategic
behaviour toward eco-innovation. All the more, the conceptual framework being involved
(e.g., available public funds, environmental regulation, international market conditions) and,
the interrelations with other external factors (through the use of external source of
information and through formal cooperation with scientific and non-scientific partners) may
also shape a firm‘s innovation strategy. These factors tend to have even greater significance
as the environmental and technical challenges inherent in eco-innovation process makes its
development and the introduction more complex and a dynamic process (maybe even more
so than conventional innovation). In that respect, eco-innovation should be treated apart from
conventional innovation, since the former may require specific organisation, knowledge,
know-how, and technical capabilities in order to be realized

203 | P a g e
References for Chapter Four
Belderbos, R., Carree, M. and Lokshin, B. (2004): Cooperative R&D and firm performance,
Research Policy, 33, 1477–1492.
Borghesi, R.; Houston, J. F. & Naranjo, A. (2012): What Motivates Corporate Managers to
Make Socially Responsible Investments? Available at SSRN 2171916
Brunnermeier, S. B. & Cohen, M. A. (2003): Determinants of environmental innovation in
US manufacturing industries, Journal of environmental economics and management,
Elsevier, 45, 278-293
Cainelli, G.; Mazzanti, M. & Zoboli, R. (2011): Environmentally oriented innovative
strategies and firm performance in services. Micro-evidence from Italy, International Review
of Applied Economics, Taylor & Francis, 25, 61-85
Cohen, W. M. & Levinthal, D. A. (1989): Innovation and learning: the two faces of R & D,
The economic journal, JSTOR, 569-596
De Marchi, V. (2012): Environmental innovation and R&D cooperation: Empirical evidence
from Spanish manufacturing firms
Research Policy, Elsevier, 41, 614-623
Del Rio Gonzalez, P. (2005): Analysing the factors influencing clean technology adoption: a
study of the Spanish pulp and paper industry
Business strategy and the environment, Wiley Online Library, 14, 20-37
Del Rio Gonzalez, P. (2009): The empirical analysis of the determinants for environmental
technological change: A research agenda Ecological Economics, Elsevier, 68, 861-878
Hemmelskamp, J. (1997): Environmental Policy Instruments and their Effects on Innovation,
European Planning Studies, Vol. 5 No. 2, pp. 177 - 194.
Hemmelskamp, J. (1999): The Inuence of Environmental Policy on Innovative Behaviour:
An Econometric Study, Fondazione Eni Enrico Mattei Working Paper No. 18.99.
Horbach, J. (2008): Determinants of environmental innovation—new evidence from German
panel data sources, Research policy, Elsevier, 37, 163-173
204 | P a g e
Horbach, J.; Rammer, C. & Rennings, K. (2012): Determinants of eco-innovations by type of
environmental impact—The role of regulatory push/pull, technology push and market pull,
Ecological Economics, Elsevier, 78, 112-122
Jaffe, A. B.; Newell, R. G. & Stavins, R. N. (2002): Environmental policy and technological
change, Environmental and resource economics, Springer, 22, 41-70
Jeppesen, S. & Hansen, M. W. (2004): Environmental upgrading of third world enterprises
through linkages to transnational corporations. Theoretical perspectives and preliminary
evidence, Business Strategy and the Environment, Wiley Online Library, 13, 261-274
Kesidou, E. & Demirel, P. (2012): On the drivers of eco-innovations: Empirical evidence
from the UK, Research Policy, Elsevier, 41, 862-870
Kemp, R. & Pearson, P. (2007): Final report MEI project about measuring eco-innovation,
UM Merit, Maastricht, 10
Kemp, R. & Pontoglio, S. (2011): The innovation effects of environmental policy
instruments—A typical case of the blind men and the elephant? Ecological Economics,
Elsevier, 72, 28-36
Khanna, M.; Deltas, G. & Harrington, D. R. (2009): Adoption of pollution prevention
techniques: the role of management systems and regulatory pressures, Environmental and
Resource Economics, Springer, 44, 85-106
Laursen, K. & Salter, A. (2004): Searching high and low: what types of firms use universities
as a source of innovation?, Research Policy, Elsevier, 33 ,1201-1215
Laursen, K. and Salter, A. (2006): Open for Innovation: The Role of Openness in Explaining
Innovation Performance among U.K. Manufacturing Firms, Strategic Management Journal,
Wiley Online Library, 27 ,131-150
Mairesse, J. & Mohnen, P. (2002): Accounting for innovation and measuring innovativeness:
an illustrative framework and an application, American Economic Review, JSTOR, 226-230
Mohnen, P.; Mairesse, J. & Dagenais, M. (2006): Innovativity: A comparison across seven
European countries, Economics of Innovation and New Technology, Taylor & Francis, 15,
391-413

205 | P a g e
Mulatu, A.; Florax, R. J. & Withagen, C. A. (2003): Environmental regulation and
competitiveness: An exploratory meta-analysis, Empirical modelling of the economy and the
environment, Springer, 23-54
Ozusaglam, S. & Robin, S. (2014): Voluntary Environmental Standards: A new strategy to
promote greener business?
OECD (1997): The Measurement of Scientific and Technological Activities: Proposed
Guidelines for Collecting and Interpreting Technological Innovation Data: Oslo Manual,
OECD
OECD (2009): Sustainable Manufacturing and Eco-innovation: Framework, Measurement
and Industry and policy practices, OECD
Palmer, K.; Oates, W. E. & Portney, P. R. (1995): Tightening environmental standards: The
benefit-cost or the no-cost paradigm? The Journal of Economic Perspectives, JSTOR, ,119-
132
Porter M., E. & Van der Linde, C. (1995): Toward a new conception of the environment-
competitiveness relationship, The journal of economic perspectives, JSTOR, 97-118
Rehfeld, K.-M.; Rennings, K. & Ziegler, A. (2007): Integrated product policy and
environmental product innovations: an empirical analysis, Ecological Economics, Elsevier,
61, 91-100
Rennings, K. (2000): Redefining innovation—eco-innovation research and the contribution
from ecological economics, Ecological economics, Elsevier, 32, 319-332
Rennings, K.; Ziegler, A.; Ankele, K. & Hoffmann, E. (2006): The influence of different
characteristics of the EU environmental management and auditing scheme on technical
environmental innovations and economic performance, Ecological Economics, Elsevier, 57,
45-59
Robin, S. & Schubert, T. (2013): Cooperation with public research institutions and success in
innovation: Evidence from France and Germany, Research Policy, Elsevier, 42, 149-166
Roodman, D. (2009): Estimating fully observed recursive mixed-process models with cmp,
Center for Global Development Working Paper, 168, 1-57

206 | P a g e
Wagner, M. (2003): The Porter hypothesis revisited: a literature review of theoretical models
and empirical tests, CSM
Wagner, M. (2008): Empirical influence of environmental management on innovation:
evidence from Europe, Ecological Economics, Elsevier, 66, 392-402
Von Hippel, E. (1988): The Sources of Innovation. Oxford University Press, New York.
Van Leeuwen, G. v. & Mohnen, P. (2013): Revisiting the porter hypothesis: An empirical
analysis of green innovation for the Netherlands, United Nations University, Maastricht
Economic and social Research and training centre on Innovation and Technology
Zahra, S. A. & George, G. (2002): Absorptive capacity: A review, reconceptualization, and
extension, Academy of management review, Academy of Management, 27, 185-203

207 | P a g e
General Conclusion
This Ph.D. thesis aims at contributing to both theoretical and empirical literature of eco-
innovation by questioning the role of firms‘ structural, economic, technical, managerial and
social capabilities in eco-innovation process. Eco-innovation differentiates itself from the
conventional innovation by embedding environmental concerns as its primary objective. This
contextual shift in innovation behaviour makes eco-innovation one of the most significant
developments in the search to solve the world‘s environmental problems and sustainability
challenges. Besides its desired environmental impacts such as reducing firms‘ carbon foot-
prints, an eco-innovation may also provide firms a substantial financial return through
decreased inputs use and increasing demand for their product, process, organisational and
marketing eco-innovations. Moreover, if realized on a macro-scale, it can be also a pathway
to a more sustainable, competitive and knowledge based economy as the Lisbon Agenda
(2000) postulates. However, in order to achieve a perceivable environmental efficiency and
observe environmental amelioration, we need to make fundamental changes in policy,
institutions and practices. Therefore, development and introduction of eco-innovation is
pertinent to people, firms, industries, countries and in short to the Earth. Eco-industries such
as air pollution control, waste water management, solid waste management, soil remediation,
and renewable energies and recycling are leading the way to solve world‘s environmental
problems and they are also able to capture sizeable business opportunities. According to
Bleischweitz et al. (2009) these industries expected to worth around 1$ trillion worldwide by
2015. Danish Wind Industry Association (DWIA29
, 2013) claims that 28% of Denmark‘s
electric supply is produced by the wind power and by 2050 Denmark is to be free of fossil
fuels. The DWIA (2013) also states that Danish wind energy industry holds a quarter of the
global turnover and the industry exported 7 Billion EUR worth of electric in 2012. These
statements indeed demonstrate the economic and environmental significance of eco-
innovation not only for a firm or a geographic area but for a country as a whole. Up until
now, researchers have emphasized the importance of conventional technology-push, market-
pull drivers and regulatory framework for successful eco-innovation. However, the
significance of a firm‘s structural, economic, technical, managerial and social capabilities
was rarely explicitly analysed. This thesis, therefore, aimed at filling this gap by identifying
29 Danish Wind Industry Association (DWIA) (2013): visited on 20-11-2013 available at:
http://www.windpower.org/en/knowledge/statistics.html

208 | P a g e
the determinants of eco-innovation from the firms‘ economic, technological, organisational
and social capabilities perspective. This research question is addressed with four mutually
exclusive chapters.
In each chapter, we have addressed the determinants of eco-innovation issue in different
contexts. The advantage of carrying out multi-aspect analysis of the determinants of eco-
innovation is that it allows us to gain a deeper knowledge about the firm specific
characteristics and capabilities that are associated with development and introduction of eco-
innovation. By conducting these separate empirical analyses, we can draw specific
conclusions from each study and make links between all four chapters. The empirical
findings of this Ph.D. thesis are derived through the application of various statistical and
econometric tools to a number of firm-level databases. In each chapter, we used the most
adequate econometric tools that can control for selection and endogeneity biases. By using
original databases, we are able to examine the impact of various firm specific characteristics
and, technical, managerial, social and organisational capabilities on development and
introduction of eco-innovation.
The Chapter 1 of this thesis forms a literature review of the most prominent theoretical
and empirical contributions in the field. Within the first chapter, we provide a detailed
analysis of eco-innovation concept from a historical perspective. To the best of our
knowledge, a review of the eco-innovation literature and the empirical investigation of the
role of firm specific characteristics and capabilities are still lacking. Therefore, we aim at
filling this existing gap and provide a solid theoretical background for our research. In
Chapter 2 aims at contributing to the drivers of and barriers to eco-innovation discussion. By
conducting empirical analyses, we try to shed light on the role of a firm‘s internal
characteristics on the adoption of voluntary environmental standards (such as, ISO 14001 and
EMAS) and the causal effect of adoption of environmental standards on the firms‘ business
performance i.e., through VA. We developed further the extent of our research question by
diversifying the adopters of these standards as early and late adopters. This chapter makes a
clear contribution to discussions about the so-called Porter hypothesis. In Chapter 3, we
stressed the significance of a firm‘s structural characteristics in another context. With this
chapter, we aimed at providing a clearer understanding of the relationship between firms‘
structural characteristics, capabilities, cooperative behaviour and development of product
and/or process eco-innovations. Besides conducting an empirical analysis on the whole
sample (disregarding the country specific differences), we also conducted country specific

209 | P a g e
analyses by clustering various European countries into several groups. Country specific
analyses conducted in Chapter 3 are significantly important as the eco-innovation literature
lacks empirical evidence that compares and contrasts the importance of certain firm
characteristics for the eco-innovation in different European countries. With Chapter 4 we
moved our empirical investigation to another level. Consequently, we aim at identifying the
role of a firm‘s internal characteristics and, technical and organizational capabilities on the
eco-innovation (product, process, organisational and marketing eco-innovation) behaviour for
different type of eco-innovators. We suggest a new typology of eco-innovators and eco-
adopters for empirical purposes and aim at highlighting the importance of a firm‘s structural
characteristics amongst these eco-innovators and eco-adopters. Moreover, within this chapter,
in order to compare and contrast the results obtained from the global estimation, we again
conducted country specific analyses. The discussion below summarizes the main findings and
their policy implications.
Main results
Our review of theoretical researches in Chapter 1 show that eco-innovation is a rather
new paradigm in innovation studies, and thus the very definition of eco-innovation is still
evolving. Some trends can however be identified. For instance, most current definitions of
eco-innovation tend to be based on environmental performance rather than environmental
aim. Current definitions also tend to be broad, in the sense that they simply require the
environmentally benign (product, process, organizational or marketing) innovation to be
novel at the firm level rather than at the level of a market, an industry or an economy.
Therefore, the issue of drivers and barriers to eco-innovation requires to be addressed with
certain precision in terms of level of analysis. In this thesis, we aimed at identifying the
drivers and barriers to eco-innovation at the firm-level rather than at the industry or macro
level.
Our survey of the literature also suggests that, besides conventional supply-side and
demand-side determinants of innovation, policy and regulation appear as specific drivers of
eco-innovation. The existing empirical evidence tend to support this assertion and shows that
environmental product innovation tends to be more driven by the strategic market behaviour
of firms (market pull), whereas policy and regulation tend to drive environmental process
innovation. The latter aspect could be associated with the public-good character of clean
technologies which leads to under-investment in environmental R&D. Therefore, firms tend

210 | P a g e
to perceive environmental regulations and standards as an opportunity (rather than an
obstacle) to become eco-innovative. We could not find, however, an extensive body of work
investigating the impact of some of the less stringent environmental regulations (e.g.,
voluntary proactive approaches such as; ISO 14001 and EMAS) on the introduction of eco-
innovation. Their role remains controversial, and we suggest that more empirical
investigation is required precisely assess the importance of voluntary environmental
standards and norms in the eco-innovation process. This question is investigated in the
second chapter of this thesis.
Last but not least, based on our survey of the literature we claim that if diffusion of eco-
innovation is as beneficial as the Porter hypothesis suggests (i.e., likely to overcome
environmental problems without hampering economic performance), then more (empirical)
research on the diffusion processes of eco-innovation is needed. Conducting a thorough
empirical analysis on this issue could assist policy makers in promoting eco-innovation
among both firms and consumers. Within the context of this research, we could not touch
upon this important issue as the available quantitative data does not allow such an empirical
investigation. Therefore, it could be an important research question to be investigated in the
future.
The empirical findings in Chapter 2 suggest that firms‘ internal characteristics, such as
size, indeed play a significant role in the adoption process of environmental standards.
Moreover, firms that already have adopted ISO 9001 quality standards and provide customer-
oriented services are also more likely to adopt voluntary ‗ISO 14001-type‘ environmental
standards. This, in its basic sense, could point out that an existing experience in managing
quality standards and in some other practices may indeed provide firms with a certain ease in
implementing ISO 14001 and EMAS-type environmental standards. We also note that the
adoption of these types of standards seems more relevant for firms that are active in wider
market (e.g., the European or international market rather than the national market). This
result is consistent with the fact that the EU is one of the first political entities to come up
with a road-map (the Lisbon Agenda of 2000, predecessor of Europe 2020) towards
becoming one of the most competitive and knowledge-based economy in the world. Indeed,
increasing environmental consciousness amongst European customers and regulatory
pressures from the EU are giving firms strong incentives to clean up their operation by
replacing, re-organizing and/or re-designing their production process, products,
organizational behaviour or marketing methods.

211 | P a g e
We also observe that the firms‘ strategic behaviour towards the adoption of these
standards varies with the technological complexity and the environmental impact of the
industry in which a firm operates. Accordingly, the early adoption of voluntary standards is
more relevant for high-technology and high/medium technology manufacturing firms. Firms
operating in high tech industries tend to have higher carbon footprints, and voluntary
environmental standards might therefore be an efficient choice to become both more
competitive and greener. These environmental standards might not only help firms to clean
up their operations, they might also enable firms to market themselves as "environmentally
friendly". Firms could use the adoption of such standards as a signal in order to acquire
additional market shares, enter new markets or simply reduce their inputs costs by replacing
them with less environmentally hazardous ones.
In a nutshell, the results in Chapter 2 tend to support the predictions of the so-called
Porter Hypothesis to a certain extent. We can claim that voluntary environmental standards
may be good complements to market-based instruments (such as tradable permits, emission
taxes or subsidies) and "command and control" mechanisms, as they are liable to make firms
greener without harming their economic performance (quite to the contrary, they might even
improve it). Policy makers could use this opportunity to communicate and explain the
positive economic and social gains that could be reaped from the adoption of environmental
standards. Doing so would increase the number of adopters, up to a certain threshold. Indeed,
one can imagine that as the number of adopters increase pas a certain threshold, the
competitive advantages and gains begin to decrease, as environmentally-conscious consumers
have a larger number of "green" suppliers to turn to for fulfilling their everyday needs. Our
empirical analysis suggest that we are still far from this theoretical situation, however – and
firms desiring to keep a competitive advantage can always increase their efforts to become
greener.
In Chapter 3 we identify the firm characteristics and economic factors that lead firms to
become more eco-innovative. The empirical analyses conducted in this chapter show that
large and individual firms tend to have a higher intensity of eco-innovation. Besides, firms
that are open to the use of external sources of knowledge and active in larger markets (e.g.
international market) are also likely to have a higher intensity of eco-innovation. We also
found evidence that eco-innovative firms tend to have a lower engagement in "continuous"
R&D and comparatively low R&D intensity. They however tend to countervail their lower
R&D activity by cooperating with external partners (in particular, public research institutes

212 | P a g e
and universities) which supports Hemmelskamp (1999)'s claims. Although this conclusion
may be initially met with some suspicion, at least two closely-related elements can be
brought forward to support it. The first is that the eco-innovation process is very complex –
even more so than conventional innovation – and by its very nature relies on multiple
interactions with various actors. The second element is that eco-innovation cannot generally
be realized single-handedly: while increasing a firm‘s R&D intensity is often necessary to
introduce important innovations, it may not be enough to allow for the introduction of an eco-
innovation. In that respect, eco-innovation should be treated apart from conventional
innovation, since the former may require specific intentions, capabilities, considerations,
knowledge stock, know-how, and strategic planning in order to be realized. Without
embedding environmental issues into their basic R&D efforts, firms can rarely come up with
an eco-innovation (in saying so, we rule out conventional innovations with unintended
positive environmental consequences). And this embedment generally relies on cooperation
with external partners, be they research institutes, independent experts of government
agencies.
The country-specific analyses showed the robustness of the results obtained with the
global estimation. Certain firm-specific characteristics (‗firm size‘ and ‗openness‘) are
important within all country groups, while the importance of conventional R&D inputs and
networking activities varies with country groups. The reliance on conventional R&D inputs
tend to be more significant in Western European and Mediterranean countries, while the
reliance on networks is more significant for Eastern European and Baltic countries. We can
attribute this divergence to the existing technological gap among these country groups, which
may indeed force Eastern European and Baltic firms to accelerate their innovation production
processes in order to ameliorate their technological base and catch up with the overall
European standards. Closing this technological gap among countries might be dependent on
how well they can complement the eco-innovation process with the external information and
knowledge.
To conclude on this chapter, we do not deny the importance of the conventional
innovation drivers for eco-innovation. However, our results assert that the nature of eco-
innovation differs from the nature of conventional innovation to a certain extent and that both
should be treated as separately. Conventional innovation drivers, such as basic R&D efforts,
are clearly not sufficient to explain the intensity of eco-innovation, which largely depends on

213 | P a g e
cooperation and joint efforts realized with external actors such as government agencies and
public research institutions.
Chapter 4 consolidates and builds upon the deductions obtained in Chapter 3. In Chapter
4, we show that a firm‘s structural characteristics and organizational and technical
capabilities are crucial factors affecting its strategic behaviour toward eco-innovation.
Besides, we also show that firms‘ eco-innovation strategies could be affected by other
external factors (such as environmental regulation and available public funding) and by their
reactions to these external factors (such as the adoption of voluntary environmental
agreements). Firms‘ cooperative behaviour and their ability to use external sources of
information are other factors that increase firms‘ probability to engage in eco-innovation.
While all these factors matter for all types of eco-innovators, their marginal effect tends to
change across types of eco-innovator. Our empirical evidence shows that early strategic eco-
innovators distinguish themselves from the rest of the eco-innovators with a highest marginal
effect of the adoption of voluntary environmental agreements. Strategic adopters, by contrast,
display a higher marginal effect of environmental regulation and available public funding,
such as the financial funds provided by the EU‘s 6th
and 7th
FP. Moreover, eco-innovators in
general tend to have a comparatively lower R&D intensity, which they countervail by
cooperating with external partners (in particular, public research institutes and universities)
and by using of external sources information, as Hemmelskamp‘s (1999) suggested.
Following the reasoning proposed in Chapter 3, we also conducted country-specific
analyses. These analyses show that country groups differ from each other with respect to the
role of their cooperative behaviour and the role of classic R&D inputs. Within Western
European and Baltic countries, firms‘ structural characteristics, voluntary engagement in eco-
innovation and environmental regulation are the main factors associated with a higher
probability to be early strategic eco-innovators. Within Eastern European and Mediterranean
countries, the marginal impact of those same factors is higher for late strategic eco-
innovators, which may highlight differences with respect to eco-innovation strategies across
country groups. Overall, these results points out towards certain factors that qualifies as
specific determinants of eco-innovation. In order to introduce eco-innovation, firms tend to
give considerable importance to their existing network and to the contextual framework in
which they operate. Therefore, creating a formal partnership with scientific and non-scientific
partners and/or informal interaction with external sources of information could be crucially
important, especially, for less R&D-intense sectors. As far as we understand, this gives

214 | P a g e
important clues about the nature of eco-innovation process. Besides internal characteristics
and their ability to use external information, firm's knowledge capital and skills are of an
even greater importance for eco-innovation than for innovation. The required knowledge
could pertain to a specific technology, process, product, input or to a new marketing method
that may not necessarily be obtained or developed internally. We can conclude that the
development and the introduction of eco-innovations is a complex and a dynamic process
(maybe even more so than conventional innovation), it‘s the realization of which goes well
beyond the reach of the single-handed efforts of individual firms. In that respect, eco-
innovation should be treated apart from conventional innovation, since the former may
require specific organisation, knowledge, know-how, and technical capabilities in order to be
realized.

215 | P a g e
Serdal OZUSAGLAM
ESSAIS SUR L’ECO-INNOVATION
BETA Bureau d’Économie Théorique et Appliquée
Résumé étendu en français
L'innovation environnementale ou "éco-innovation" est un concept apparu assez récemment dans la
littérature consacrée à l'innovation. La spécificité de ce concept est qu'il vise à combiner deux
objectifs: réaliser une avancée technologique ou un changement dans les procédés ou l'organisation de
l'entreprise d'une part, et préserver ou restaurer l'environnement naturel d'autre part. Bien que le
concept d'éco-innovation ait déjà fait l'objet d'une abondante littérature, de nombreuses interrogations
demeurent, en particulier quand il s'agit de quantifier ses effets sur la performance économique des
entreprises, ou encore d'identifier les facteurs conduisant ces dernières à adopter un comportement
éco-innovant. Cette thèse vise à apporter des éléments de réponse empiriques à ces questions, au
travers de quatre chapitres correspondant à quatre articles de recherche distincts.
En premier lieu, afin de fournir un cadre de référence solide à l'analyse empirique, le
Chapitre 1 propose un survol de la littérature consacrée à l'éco-innovation. A partir de ce socle, les
chapitres suivants proposent trois analyses originales sur des thèmes identifiés comme pertinents dans
le premier chapitre. Le Chapitre 2 réexamine, dans une perspective empirique, l‘hypothèse dite de
Porter, selon laquelle une réglementation environnementale plus stricte conduirait non seulement à
préserver l‘environnement mais aussi à une performance économique accrue des entreprises. Cette
hypothèse est examinée ici dans une version « faible », le Chapitre 2 s'intéressant au rôle des
règlementations environnementales facultatives, comme les normes de type ISO 14001, dont
l'adoption est volontaire. Nous y examinerons l'effet de l'adoption de normes de ce type sur la
performance des entreprises, à l‘aide des données françaises de l'enquête COI 2006 combinées aux
Enquêtes Annuelles d'Entreprises de 2003 à 2006. Le Chapitre 3 porte sur le processus de diffusion
de l'éco-innovation, abordée (en raison de contraintes liées aux données) du point de vue des
déterminants de l'innovation environnementale, et des barrières à cette dernière. L'analyse, qui vise à
identifier ces déterminants et barrières, utilise des modèles de « fonction de production d'innovation »
estimés sur les données européennes micro-anonymisées ("bruitées") de l'Enquête Communautaire sur
l'Innovation de 2004 (CIS 2004). Le Chapitre 4 étend cette analyse en exploitant l‘Enquête
Communautaire sur l'Innovation de 2008 (CIS 2008), qui contient un module spécifiquement dédié à
l'innovation environnementale. L‘analyse repose toujours sur des modèles économétriques de
« fonction de production d‘innovation », mais l'exploitation des données ("bruitées") CIS 2008 permet

216 | P a g e
de changer l'angle d'approche, en proposant une classification originale des différents types
d‘entreprises éco-innovantes. Le contenu de ces quatre chapitres est détaillé ci-après.
CHAPITRE 1 : REVUE DE LA LITTERATURE
A la lumière des travaux passés en revue dans le Chapitre 1, il apparaît que l'éco-innovation n‘est pas
encore un concept bien stabilisé : sa définition même continue d'évoluer, appelant à des corrections et
à des précisions. Fussler et James (1996) furent sans doute les premiers auteurs à distinguer l‘éco-
innovation de l‘innovation au sens usuel du terme, en la définissant comme l‘introduction de
nouveaux produits et/ou procédés qui créent de la valeur tout en réduisant significativement leurs
impacts sur l‘environnement. A mesure que le concept d‘éco-innovation attirait l‘attention des
chercheurs, sa définition même évoluait, au risque d‘en faire un concept polysémique. Les premières
définitions du concept, assez strictes, se basaient uniquement sur les innovations ayant un objectif
environnemental explicite, négligeant ainsi les bénéfices environnementaux que peuvent
potentiellement procurer les innovations au sens usuel du terme. Les définitions les plus récentes,
toutefois, insistent sur le fait que c‘est sa performance en matière environnementale, plutôt que son
objectif, qui caractérise une éco-innovation. L‘objectif en lui-même ne présente guère d‘intérêt, dans
la mesure où une innovation ayant les meilleures intentions en matière d‘amélioration de
l‘environnement peut très bien échouer. Il est donc plus pertinent d‘observer les retombées
environnementales d‘une innovation, et de la caractériser a posteriori (ex post, disent les économistes)
comme une éco-innovation ou comme une innovation « conventionnelle ». S‘il fallait aujourd‘hui
trouver une définition faisant la quasi-unanimité au sein de la communauté des chercheurs, elle
pourrait prendre la forme de celle proposée par Kemp et Pearson (2007). Selon ces auteurs, l‘éco-
innovation est « l‘assimilation ou l‘exploitation d‘un produit, procédé de production, service ou
méthode de gestion nouvelle pour l‘entreprise ou l‘utilisateur et qui résulte, tout au long de son cycle
de vie, en une réduction des risques environnementaux, de la pollution et des autres impacts négatifs
de l‘utilisation de ressources (y compris énergétiques) comparées à des alternatives pertinentes »
(Kemp et Pearson, 2007, p. 3).
Cette définition est extrêmement générale, et englobe différents comportements éco-innovants
(cf. Figure 1). Elle inclut ainsi non seulement les innovations qui visent explicitement à réduire les
impacts sur l‘environnement, mais aussi celles qui conduisent à une réduction des impacts
environnementaux sans que ce cela soit leur objectif initial. Ainsi, toute innovation
« conventionnelle » qui aurait des effets bénéfiques pour l‘environnement comptera comme une éco-
innovation. Comme le souligne l‘OCDE (qui conçoit l‘éco-innovation comme un outil permettant de
relever les défis sociétaux sur la voie du développement durable), si l‘éco-innovation peut découler
d‘un objectif environnemental à la base, elle peut également survenir comme effet secondaire d‘autres

217 | P a g e
objectifs, tels que l‘accroissement de la productivité, la réduction du coût des facteurs de production,
ou encore le respect de la réglementation et de normes environnementales (OCDE, 2009).
Figure 1 : catégorisation des comportements des entreprises en matière d’éco-innovation
Eco-adoptions passives
Comportement non éco-
innovant Eco-adoptions stratégiques
Eco-innovations
stratégiques
Source : adapté de Kemp et Pearson (2007)
Ce premier chapitre accorde précisément une attention toute particulière au rôle de la
règlementation, qui est souvent présentée dans la littérature comme un déterminant essentiel de l'éco-
innovation, notamment quand l'innovation concerne un procédé de fabrication (moins polluant que les
procédés existants). Une controverse demeure à ce propos, en particulier quand la règlementation
repose sur des normes environnementales peu contraignantes, voire facultatives (telles que la norme
ISO 14001). Cette controverse trouve sa source dans l‘hypothèse dite de Porter (Porter et Van der
Linde, 1995), selon laquelle une réglementation environnementale plus stricte conduirait d‘une part à
des innovations ayant des effets bénéfiques pour l‘environnement, et d‘autre part à une performance
économique accrue des entreprises. Bien qu‘elle soit à l‘origine d‘un intérêt accrue pour l‘éco-
innovation, l‘hypothèse de Porter alimente la controverse, car les études empiriques qui tentent de la
tester ou de la mettre à l‘épreuve ne permettent pas de l‘étayer systématiquement (sur un plan plus
théorique, Jaffe et al. (2002) soulignent que même en admettant sa validité, l‘ampleur des gains
réalisés, tant en matière de performance économique qu‘en matière environnementale, demeure
sujette à caution).
En fait, comme le suggéraient déjà Porter et Van der Linde (1995), tout dépend du type de
politiques environnementales utilisées. Popp (2009) affirme qu‘en général, les politiques s‘appuyant
sur le levier du marché (étendent à fournir davantage d‘incitations à innover, dans la mesure où elles
récompensent une amélioration continue de la qualité de l‘environnement. Par opposition, les mesures
contraignantes de type « command and control » (imposition d‘une norme obligatoire, par exemple)
pénalisent les pollueurs qui ne respectent pas la norme en vigueur mais ne récompensent pas les
entreprises qui, en matière de respect de l‘environnement, parviennent à faire mieux que la norme
imposée. Par exemple, si une norme imposait que 10% de l‘électricité utilisée par les entreprises d‘un

218 | P a g e
pays doit être issue de sources renouvelables, une entreprise qui utiliserait 15% d‘électricité
« renouvelable » ne serait pas récompensée pour cela par rapport à une autre entreprise qui s‘en
tiendrait juste à la norme. De même, si une norme imposait de ne pas rejeter plus de x tonnes de CO2
par an, une entreprise qui rejetterait une quantité strictement inférieure à x n‘en retirerait aucun
avantage comparativement à une entreprise qui rejetterait une quantité juste égale à x. Popp (2009)
considère par ailleurs qu‘au-delà du type de mesure utilisée (recours aux normes versus recours au
marché), les différences existant au sein d‘un type de mesure (différences entre plusieurs instruments
basés sur le recours au marché par exemple) peuvent également se traduire par des bénéfices
environnementaux plus ou moins importants.
La question des politiques environnementales aboutit à un autre point, sinon controversé, du
moins encore relativement inexploré dans la littérature : la diffusion des éco-innovations. Depuis les
travaux de Rogers (1962) – situés aux confins de la sociologie, de la psychologie et de la théorie de la
communication), la diffusion d‘une innovation (au sens usuel du terme) est généralement définie
comme le processus par lequel les acteurs d‘un système social se communiquent une innovation au fil
du temps, à travers certains canaux. Cette diffusion est un processus complexe, dont l‘aboutissement
peut prendre aussi bien 5 ans que 50 ans, selon la formule de Mansfield (1968). La lenteur du
processus de diffusion d‘une innovation est liée à l‘incertitude et au risque lié à la commercialisation
et/ou à l‘utilisation d‘un produit, d‘une technologie, ou d‘un procédé nouveau. Il existe dans la
littérature un consensus selon lequel la diffusion d‘une innovation suit un schéma temporel assez
prévisible : les nouvelles technologies, nouvelles méthodes ou nouveaux procédés sont tout d‘abord
adoptés assez lentement, puis plus rapidement et à nouveau plus lentement à mesure qu‘un seuil
d‘adoption (spécifique à chaque nouveauté) est atteint. L‘évolution du nombre ou de la proportion
d‘entreprises (ou plus généralement d‘acteurs socio-économiques) adoptant une innovation peut ainsi
être représentée à l‘aide d‘une courbe en S (Rogers, 1983 ; Blackman, 1999). Il s‘ensuit que le succès
d‘une innovation repose d‘une manière cruciale sur les réactions des premières entreprises (ou des
premiers consommateurs) à l‘adopter, dans la mesure où celles-ci (ceux-ci) sont considérés comme
des exemples à suivre par les acteurs économiques plus « timorés » (Moore, 1998).
Dans le cas de l‘éco-innovation, il est probable que la diffusion de technologies « propres »
(ou « vertes ») suive également une courbe en S. Kemp et Volpi (2007) expliquent que la diffusion
d‘une technologie dite propre (au sens environnemental du terme) est très lent au début, car la
technologie est initialement méconnue et entourée d‘une incertitude encore plus grande que les
technologies impliquées dans le cadre d‘innovations « conventionnelles ». En dépit de cette
incertitude, il ne fait guère de doute que la diffusion des éco-innovations est souhaitable : d‘une part,
l‘éco-innovation est une des pistes privilégiés pour maintenir (voire accroître) la qualité de vie à long
terme ; d‘autre part, les industries éco-innovantes sont à l‘origine de profits non négligeables et
pourraient le devenir encore davantage dans les années à venir (Commission Européenne, 2012).

219 | P a g e
Toutefois, en raison de l‘incertitude mentionnée plus haut, laisser le marché être l‘unique vecteur de
diffusion des éco-innovations est risqué dans la mesure où celles-ci pourraient être introduites trop
tardivement pour inverser les tendances actuelles de dégradation de l‘environnement. Il reste donc à
trouver des politiques environnementales permettant d‘encourager la diffusion des éco-innovations.
De telles politiques sont toutefois difficiles à mettre en œuvre dans la mesure où les freins à
l‘innovation environnementale sont encore mal connus, de même que les facteurs qui la favorisent.
Elles semblent néanmoins indispensables, dans la mesure où il existe une double externalité inhérente
à l‘innovation environnementale, comme le souligne Rennings (2000). Les éco-innovations présentent
en effet, en premier lieu, les externalités usuelles liées à la production de connaissances pendant la
phase de R&D. Elles présentent également, en second lieu, des externalités positives sur
l‘environnement pendant la phase d‘adoption et de diffusion, externalités qui profitent à tous et qui
rendent la diffusion des éco-innovations toujours souhaitable. Toutefois, ces externalités peuvent
conduire à une situation où les rendements privés de la R&D sur des technologies « vertes » sont
inférieurs aux rendements sociaux – en raison de la nature de quasi « biens publics » des éco-
innovations, ce qui peut amener les entreprises (en l‘absence de politiques environnementales
appropriées) à sous-investir dans la R&D environnementale.
Nous refermons ce chapitre en concluant qu'il convient de focaliser les recherches empiriques
sur les deux points évoqués ci-dessus : d‘une part, la controverse sur l‘hypothèse de Porter, en
particulier quand la règlementation repose sur des normes environnementales peu contraignantes, et
d‘autre part, l‘identification des facteurs qui influencent le processus de diffusion de l‘innovation
environnementale (que ce soit en la freinant ou en l‘encourageant). C‘est ce que nous essayons de
faire dans les chapitres suivants.
CHAPITRE 2 : LES NORMES ENVIRONNEMENTALES A ADOPTION VOLONTAIRE :
DE NOUVELLES STRATEGIES POUR PROMOUVOIR UN « BUSINESS VERT » ?
Le Chapitre 2 s'intéresse au premier point de controverse évoqué dans le Chapitre 1, à savoir le rôle
des règlementations environnementales ayant une dimension facultative, comme les normes de type
ISO 14001, dont l'adoption est volontaire. A l'aide d'une analyse par appariement sur les scores de
propension, nous examinons l'effet de l'adoption de normes de type ISO 140001 (ou un système de
management environnemental, ci-après SME) sur la performance des entreprises (mesurée à partir de
la Valeur Ajoutée, ci-après VA). La première étape de l'analyse consiste à prédire l'adoption de ces
normes à l'aide d'un modèle Probit afin de calculer le score de propension (cette première étape
permet également d'identifier un certain nombre de déterminants de l'adoption). La seconde étape
consiste à calculer, à l'aide d'un algorithme d'appariement non paramétrique (ici, le kernel), l'effet de
l'adoption sur la VA des entreprises ayant adopté les normes (par rapport aux entreprises ayant un

220 | P a g e
score de propension similaire mais n'ayant pas adopté ces normes). L'analyse est menée sur les
données françaises de l'enquête COI 2006 (dont le champ est constitué des entreprises françaises de
plus de 10 salariés), combinées aux Enquêtes Annuelles d'Entreprises (EAE) de 2003 à 2006. Ces
données nous permettent de distinguer parmi les entreprises adoptant des normes de types ISO 14001
(ou un SME), celles (early adopters) les ayant adopté précocement, c‘est-à-dire en 2003 ou avant, et
celles (late adopters) les ayant adopté tardivement, c‘est-à-dire entre 2003 et 2006. Ces deux types
d‘adoption s‘opposent au comportement de non-adoption, comme indiqué dans la Figure 2 (il n‘existe
pas, dans nos données, d‘entreprises ayant adopté un SME en 2003 puis l‘ayant abandonné en 2006).
Afin de tenir compte de l‘existence de ces deux comportements d'adoption, le score de propension est
calculé à l'aide d'un Probit multivarié et non pas d‘un Probit simple.
En fusionnant l‘enquête COI 2006 et les données administratives des EAE, nous obtenons,
après un nettoyage standard des données fusionnées (consistant à exclure les entreprises de moins de
10 salariés et celles ayant un taux de croissance annuel du chiffre d‘affaires supérieur à 100%, indice
d‘une fusion-acquisition) un échantillon de 5584 entreprises observées en 2003 et 2006 (autrement
dit, un panel de deux ans). Le Tableau 1 présente – avant et après la fusion des bases de données – la
moyenne et l‘écart-type des principales variables utilisées dans l‘analyse. Un test de différences des
moyennes indique que la fusion et le nettoyage des bases de données n‘ont pas conduit à des biais de
sélection significatifs.
Figure 2 : modalité d’adoption d’un Système de Management Environnemental (SME)
par les entreprises de la base COI 2006
L‘entreprise dispose d‘un SME
en 2006
L‘entreprise ne dispose pas
d‘un SME en 2006
L‘entreprise dispose d‘un
SME en 2003 Adoption précoce catégorie non renseignée
L‘entreprise ne dispose pas
d‘un SME en 2003 Adoption tardive Non-adoption

221 | P a g e
Tableau 1 – Distribution des principales variables avant et après fusion/nettoyage des données
COI COI et EAE après nettoyage Test
Variables: Moyenne Ecart Type Moyenne Ecart Type P-valeur
Taille (nombre de salariés) 691,85 3739,84 653,70 3735,85 0,29
C.A. en euros 168558,50 1132874,00 152650,10 1034387,00 0,21
Filiale d‘un groupe en 2006 1,34 0,48 1,35 0,48 0,38
Filiale d‘un groupe en 2003 1,36 0,48 1,36 0,48 0,37
Ppal marché en 2006 :local 1,13 0,34 1,13 0,34 0,48
national 1,30 0,46 1,30 0,46 0,24
européen 1,54 0,50 1,53 0,50 0,25
international 1,64 0,48 1,64 0,48 0,41
Ppal marché en 2003 : local 1,14 0,34 1,14 0,34 0,46
national 1,31 0,46 1,30 0,46 0,20
européen 1,55 0,50 1,55 0,50 0,26
international 1,65 0,48 1,65 0,48 0,39
Certifiée ISO 9001 en 2006 1,49 0,50 1,47 0,50 0,10
" ISO 14001 en 2006 1,80 0,40 1,79 0,41 0,20
Certifiée ISO 9001 en 2003 1,53 0,50 1,52 0,50 0,08*
" ISO 14001 en 2003 1,85 0,36 1,84 0,37 0,19
Secteur d'activité:
Industrie haute tech. 0,03 0,18 0,04 0,19 0,27
Industrie moy./haute tech. 0,09 0,29 0,10 0,29 0,16
Industrie moy./basse tech. 0,10 0,30 0,10 0,31 0,14
Industrie basse tech. 0,14 0,35 0,15 0,36 0,08*
Services intensifs en
connaissance 0,18 0,39 0,18 0,38 0,32
Autres services 0,46 0,50 0,44 0,50 0,02*
Les résultats (effets marginaux) de l‘estimation du Probit multivarié sont fournis dans le
Tableau 2. Ils convient de rappeler que ces résultats concernent des entreprises françaises (ou
implantées en France) dans la première décennie du XXIème siècle. Ces résultats suggèrent que,
contrastés au comportement de non-adoption (des standards de type ISO 14001), l‘adoption précoce et
l‘adoption tardive présentent plus de similitudes que de différences – les principaux déterminants
étant la taille de l‘entreprise, l‘appartenance à un groupe, et l‘adoption préalable de standards de type
ISO 9001. En ce qui concerne la taille des entreprises, nos résultats suggèrent une relation en U
inversé entre la taille (mesurée par le nombre de salariés) et la probabilité d‘adopter des standards de
type ISO 14001 (précocement ou tardivement). Autrement dit, la probabilité d‘adoption s‘accroît
jusqu‘à un certain seuil (l‘adoption pouvant se révéler encore trop coûteuse pour des entreprises de
petite taille) puis décroît au-delà de ce seuil (l‘adoption pouvant se révéler trop complexe à gérer pour
des entreprises de très grande taille, surtout si elles sont réparties sur plusieurs pays).
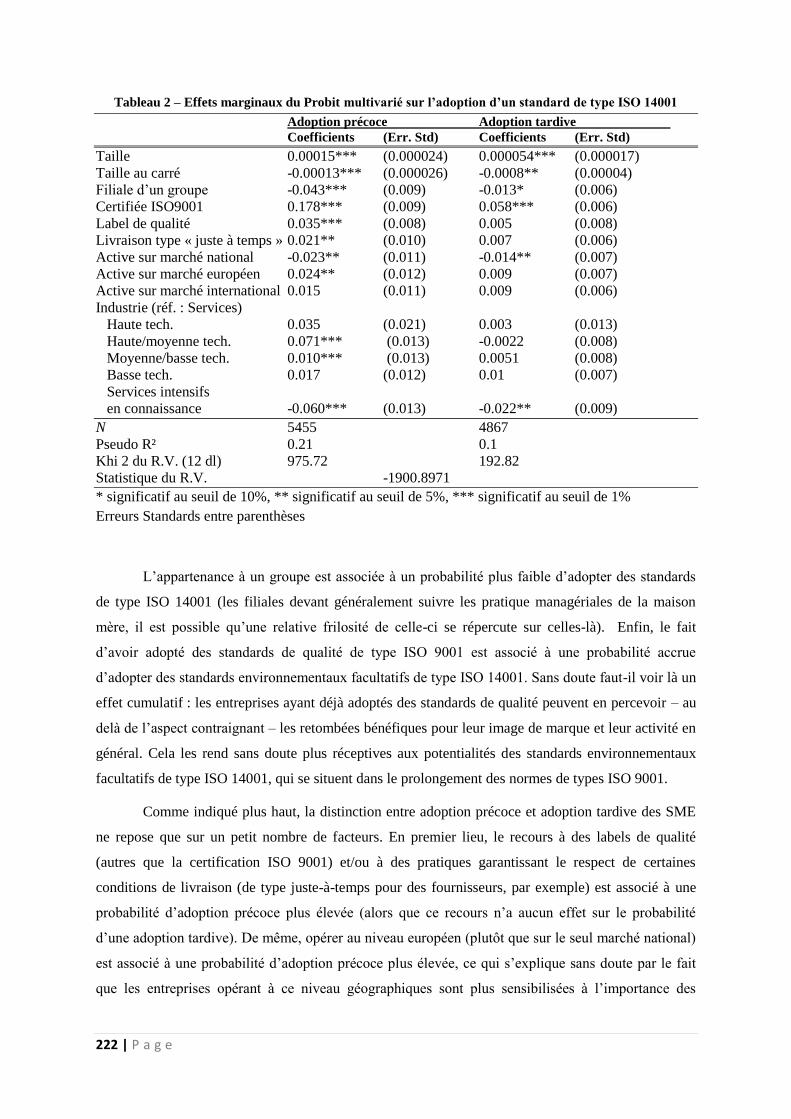
222 | P a g e
Tableau 2 – Effets marginaux du Probit multivarié sur l’adoption d’un standard de type ISO 14001
Adoption précoce Adoption tardive
Coefficients (Err. Std) Coefficients (Err. Std)
Taille 0.00015*** (0.000024) 0.000054*** (0.000017)
Taille au carré -0.00013*** (0.000026) -0.0008** (0.00004)
Filiale d‘un groupe -0.043*** (0.009) -0.013* (0.006)
Certifiée ISO9001 0.178*** (0.009) 0.058*** (0.006)
Label de qualité 0.035*** (0.008) 0.005 (0.008)
Livraison type « juste à temps » 0.021** (0.010) 0.007 (0.006)
Active sur marché national -0.023** (0.011) -0.014** (0.007)
Active sur marché européen 0.024** (0.012) 0.009 (0.007)
Active sur marché international 0.015 (0.011) 0.009 (0.006)
Industrie (réf. : Services)
Haute tech. 0.035 (0.021) 0.003 (0.013)
Haute/moyenne tech. 0.071*** (0.013) -0.0022 (0.008)
Moyenne/basse tech. 0.010*** (0.013) 0.0051 (0.008)
Basse tech. 0.017 (0.012) 0.01 (0.007)
Services intensifs
en connaissance -0.060*** (0.013) -0.022** (0.009)
N 5455 4867
Pseudo R² 0.21 0.1
Khi 2 du R.V. (12 dl) 975.72 192.82
Statistique du R.V. -1900.8971
* significatif au seuil de 10%, ** significatif au seuil de 5%, *** significatif au seuil de 1%
Erreurs Standards entre parenthèses
L‘appartenance à un groupe est associée à un probabilité plus faible d‘adopter des standards
de type ISO 14001 (les filiales devant généralement suivre les pratique managériales de la maison
mère, il est possible qu‘une relative frilosité de celle-ci se répercute sur celles-là). Enfin, le fait
d‘avoir adopté des standards de qualité de type ISO 9001 est associé à une probabilité accrue
d‘adopter des standards environnementaux facultatifs de type ISO 14001. Sans doute faut-il voir là un
effet cumulatif : les entreprises ayant déjà adoptés des standards de qualité peuvent en percevoir – au
delà de l‘aspect contraignant – les retombées bénéfiques pour leur image de marque et leur activité en
général. Cela les rend sans doute plus réceptives aux potentialités des standards environnementaux
facultatifs de type ISO 14001, qui se situent dans le prolongement des normes de types ISO 9001.
Comme indiqué plus haut, la distinction entre adoption précoce et adoption tardive des SME
ne repose que sur un petit nombre de facteurs. En premier lieu, le recours à des labels de qualité
(autres que la certification ISO 9001) et/ou à des pratiques garantissant le respect de certaines
conditions de livraison (de type juste-à-temps pour des fournisseurs, par exemple) est associé à une
probabilité d‘adoption précoce plus élevée (alors que ce recours n‘a aucun effet sur le probabilité
d‘une adoption tardive). De même, opérer au niveau européen (plutôt que sur le seul marché national)
est associé à une probabilité d‘adoption précoce plus élevée, ce qui s‘explique sans doute par le fait
que les entreprises opérant à ce niveau géographiques sont plus sensibilisées à l‘importance des

223 | P a g e
normes, standards et certifications (nombre d‘entre elles étant requises pour opérer à travers les pays
de l‘UE).
Tableau 3 – estimation de l’effet moyen du traitement sur les traités (ATT)
Adoption précoce Adoption tardive
Coefficients (Err. Std) Coefficients (Err. Std)
PSM 0.49*** (0.070) 0.51*** (0.100)
FILM 0.38*** (0.076) 0.28*** (0.071)
* significatif au seuil de 10%, ** significatif au seuil de 5%, *** significatif au seuil de 1%
Erreurs Standards entre parenthèses
L‘estimation du modèle Probit dont nous venons de commenter les résultats ne constitue
toutefois qu‘une étape préalable à l‘analyse qui nous intéresse ici. En effet, nous voulons surtout
déterminer si l‘adoption de standards facultatifs de type ISO 14001 à un effet significatif sur la
performance économique des entreprises, et si cet effet est positif ou négatif. Au-delà des résultats
factuels qu‘il fournit, le modèle Probit nous permet avant tout de calculer le score de propension, que
l‘on peut définir ici comme la probabilité prédite d‘adopter des standards environnementaux
conditionnellement aux caractéristiques observées (le variables explicatives du modèle Probit) des
entreprises les ayant effectivement adopté (dites entreprises « traitées » selon la terminologie
habituelle de cette méthode) mais aussi des entreprises ne les ayant pas adopte (le « groupe de
contrôle » selon la terminologie de cette méthode). L‘appariement sur score de propension consiste à
comparer la performance économique des entreprises du groupe traité à celle des entreprises du
groupe de contrôle en choisissant parmi ces dernières un ensemble d‘entreprises (le « support
commun ») présentant des caractéristiques similaires à celles du groupe traité (c‘est-à-dire un score de
propension ayant des valeurs proches de celles observées dans le groupe traité). L‘appariement se fait
à l‘aide d‘un algorithme non paramétrique (ici, le kernel). Cette méthode permet d‘éliminer un certain
nombre de biais de sélection et d‘endogénéité, pour se rapprocher de l‘estimation d‘un effet causal sur
des données non expérimentales.
L‘effet estimé est appelé « effet du traitement sur les traités » (ici, effet de l‘adoption de
normes environnementales de type ISO 14001) ou en abrégé ATT (pour Average effect of the
Treatment on the Treated). L‘estimation de l‘ATT obtenu dans le cas de notre étude est présentée
dans la première ligne du Tableau 3, pour les comportements d‘adoption précoce (colonne de gauche)
et d‘adoption tardive (colonne de droite). Nos résultats indiquent qu'adopter des normes
environnementales de type ISO 14001 sur une base volontaire permet d'accroître significativement la

224 | P a g e
VA des entreprises (toutes choses égales par ailleurs), que l'adoption soit précoce ou tardive (la valeur
de l‘ATT étant de 0,49 dans le premier cas et de 0,51 dans le second).
Une analyse de sensibilité conduite en estimant un modèle linéaire à interactions complètes
(Fully Interacted Linear Model ou FILM) vient conforter ces résultats, en donnant toutefois un léger
avantage à l‘adoption précoce (la valeur de l‘ATT, présentée dans la seconde ligne du Tableau 3, étant
alors de 0,38 pour une adoption précoce contre 0,28 seulement pour une adoption tardive). Le
principe du modèle FILM est d‘imposer le « support commun » évoqué plus haut avant de procéder à
une estimation par les moindres carrés ordinaires (MCO) d‘un modèle linéaire dont la variable
dépendante est (dans notre étude) la mesure de performance des entreprises et dans lequel une
variable indicatrice d‘adoption (des standards de type ISO 14001) intervient comme variable
explicative. Le modèle FILM autorise l‘effet de cette variable à varier avec chaque autre variable
explicative du modèle linéaire (en introduisant autant de termes en interaction que nécessaire).
Enfin, l‘utilisation d‘une variable alternative permettant de tenir compte des effets de taille
(en l‘occurrence, productivité du travail définie comme la VA sur le nombre de salariés) conduit à des
résultats qualitativement similaires à ceux que nous venons de présenter, quelle que soit la méthode
utilisée (appariement sur les scores de propension ou modèle FILM). En conclusion, l'analyse menée
dans ce chapitre fournit des indices qui soutiennent l'hypothèse de Porter dans sa version faible, en
France pour la période 2003-2006.
CHAPITRE 3 : IDENTIFICATION DES DETERMINANTS DE L’ECO-INNOVATION.
Le Chapitre 3 s'intéresse au second point d‘intérêt évoqué dans le Chapitre 1, à savoir le processus de
diffusion de l'éco-innovation. En raison des contraintes posées par les données disponibles, cette
investigation se fait du point de vue des déterminants de, et des barrières à, l'innovation
environnementale. L'analyse repose sur l'estimation de fonctions de production d'innovation à l'aide
de modèles à deux équations, du type :
(1.a)
(1.b) = β. + i
L‘Equation (1.a) est une équation de sélection qui permet de tenir compte du fait que toutes
les entreprises recensées dans un échantillon ne sont pas nécessairement innovantes. Cette équation
est généralement spécifiée empiriquement à l'aide d'un modèle Probit:
(2) Pr(zi = 1) = Φ( γ.Wi) avec zi = 1 z*i si z
*i > 0 et zi = 0 si z
*i ≤ 0
La seconde équation, (1.b), est dite équation d‘intensité car elle permet d'expliquer l'intensité
de l'éco-innovation, mesurée de différentes manières (voir ci-après). Ces modèles sont estimés de
manière simultanée par Maximum de Vraisemblance sur les données européennes micro-anonymisées
(ou "bruitées") de l'Enquête Communautaire sur l'Innovation de 2004 (CIS 2004). La base de données

225 | P a g e
rassemble 104943 entreprises observées à travers 15 pays, qui peuvent être répartis en quatre groupes:
pays d'Europe du Nord et de l'Ouest (Allemagne, Belgique et Norvège), pays d'Europe Centrale et de
l'Est (Bulgarie, Hongrie, République Tchèque, Roumanie, Slovaquie et Slovénie), pays
méditerranéens ou d'Europe du Sud (Espagne, Grèce et Portugal) et pays baltes (Estonie, Lettonie,
Lituanie).
Bien que l'enquête CIS 2004 ne soit pas spécifiquement centrée sur l'innovation
environnementale, les données fournissent deux mesures approchées de l'intensité de l'éco-innovation:
(1) une mesure de la "réduction de l'utilisation des consommations intermédiaires et de la
consommation d'énergie par unité produite" (sur une échelle de 0 à 3) et (2) une mesure de la
"réduction de l'impact environnemental ou sanitaire et amélioration de la sécurité" (également sur une
échelle de 0 à 3).
Avec l'échelle ordonnée utilisée, une entreprise présentant une valeur non nulle de la première
variable a réduit (plus ou moins intensément) ses consommations intermédiaires et/ou sa
consommation d'énergie. De même, une entreprise présentant une valeur non nulle de la seconde
variable a réduit (plus ou moins intensément) l'impact environnemental ou sanitaire de son activité. Le
Tableau 4 présente, dans chaque industrie prise en compte par l'enquête CIS 2004, le pourcentage
d'entreprises "éco-innovantes", définies comme présentant une valeur non nulle de l'une ou l'autre de
nos deux mesures approchées.

226 | P a g e
Tableau 4 – pourcentage d'entreprises éco-innovantes par secteur d'activité (enquête CIS 2004)
Nombre
d'entreprises
% d'entreprises
éco-innovantes
Services (secteur tertiaire) et autres secteurs
50: Vente et réparation de véhicules à moteur 1179 249(21,1%)
51: Commerce de gros 13669 2668 (19,5%)
52: Commerce de détail 2498 410 (16,4%)
60_61_62: Transport 4930 747 (15,2%)
63: Activités auxiliaires des transports 2206 540 (24,5%)
64: Postes et télécommunications 1155 447 (38,7%)
70: Immobilier et activités associées 728 111 (15,3%)
71: Location de machines et d'équipement 294 69 (23,5%)
72: Services informatiques 2589 1485 (57,4%)
73_74: R&D et autres activités 7897 2491 (31,5%)
E: Fourniture d'électricité, de gaz et d'eau 1921 517 (26,9%)
F: Construction 4353 855 (19,6%)
H: Hôtellerie et restauration 1424 211 (14,8%)
J: Intermédiation financière 2354 1053 (44,7%)
Industrie (secteur secondaire)
20_21: Bois, pulpe et papier 4122 1148 (28%)
22: Imprimerie et édition 2474 811 (32,8%)
27: Métallurgie 1360 534 (39,3%)
28: Produits métalliques 4096 1710 (35%)
C: Exploitation des mines et carrières 1444 323 (22,4%)
DA: Agro-alimentaire, boissons et tabac 7907 2565 (32,5%)
DB: Textile 8905 1652 (18,5%)
DC: Cuir et peaux 1746 334 (19,1%)
DF_DG: Coke et produits du pétrole,
Chimie et produits chimiques 2657 1578 (59,4%)
DH: Plastique et caoutchouc 2531 1059 (41,8%)
DI: Produits minéraux non ferreux 2855 1034 (36,2%)
DK: Machinerie et équipement 4315 2036 (47,2%)
DL: Equipement électrique et optique 4838 2418 (50%)
DM: Equipement de transport 2643 1192 (45%)
DN: Autres 3810 1282 (33,7%)
Total 103710 31529 (30,64%)
Pour l'analyse économétrique proprement dite, ces deux mesures peuvent être combinées pour
obtenir (à l'aide d'une analyse factorielle) une mesure continue de l'intensité d'éco-innovation. Dans ce
cas, le modèle économétrique estimé prend la forme d'un modèle Tobit généralisé. Les deux variables
peuvent également être utilisées telle quelles, et séparément, ce qui conduit à estimer deux modèles
économétriques dans laquelle l'équation de deuxième étape est un Probit ordonné.
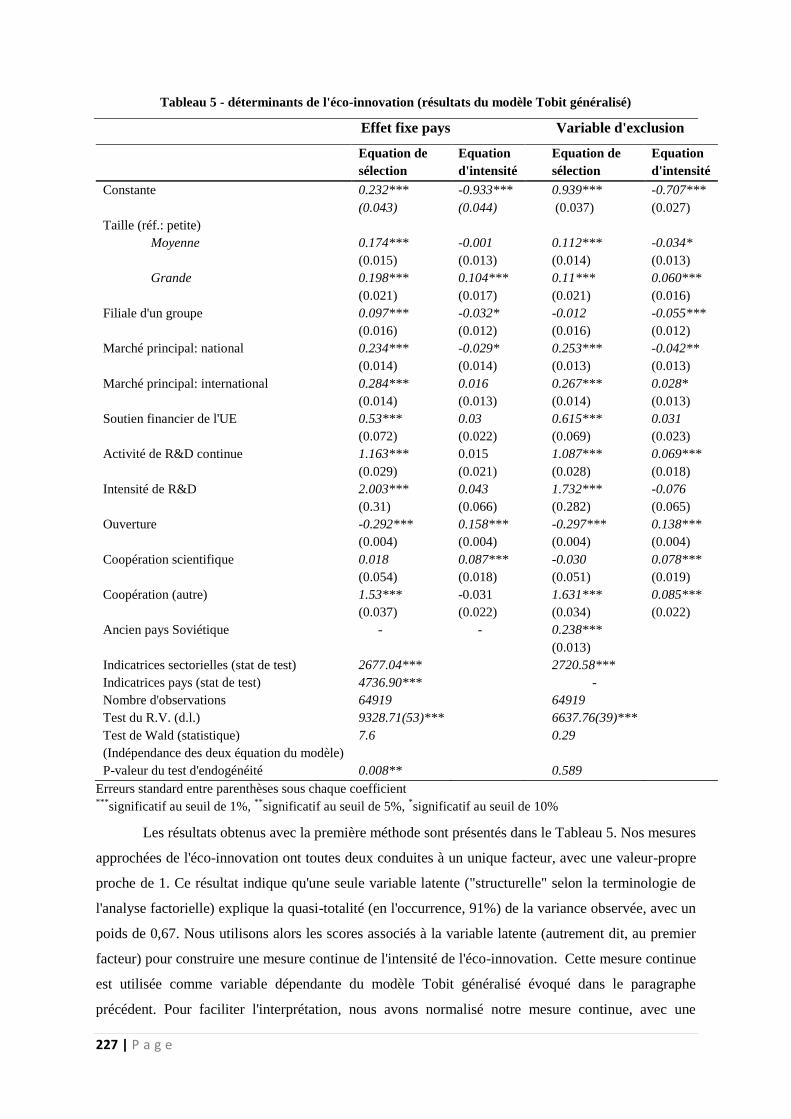
227 | P a g e
Tableau 5 - déterminants de l'éco-innovation (résultats du modèle Tobit généralisé)
Effet fixe pays Variable d'exclusion
Equation de
sélection
Equation
d'intensité
Equation de
sélection
Equation
d'intensité
Constante 0.232***
(0.043)
-0.933***
(0.044)
0.939***
(0.037)
-0.707***
(0.027)
Taille (réf.: petite)
Moyenne 0.174***
(0.015)
-0.001
(0.013)
0.112***
(0.014)
-0.034*
(0.013)
Grande 0.198***
(0.021)
0.104***
(0.017)
0.11***
(0.021)
0.060***
(0.016)
Filiale d'un groupe 0.097***
(0.016)
-0.032*
(0.012)
-0.012
(0.016)
-0.055***
(0.012)
Marché principal: national 0.234***
(0.014)
-0.029*
(0.014)
0.253***
(0.013)
-0.042**
(0.013)
Marché principal: international 0.284***
(0.014)
0.016
(0.013)
0.267***
(0.014)
0.028*
(0.013)
Soutien financier de l'UE 0.53***
(0.072)
0.03
(0.022)
0.615***
(0.069)
0.031
(0.023)
Activité de R&D continue 1.163***
(0.029)
0.015
(0.021)
1.087***
(0.028)
0.069***
(0.018)
Intensité de R&D 2.003***
(0.31)
0.043
(0.066)
1.732***
(0.282)
-0.076
(0.065)
Ouverture -0.292***
(0.004)
0.158***
(0.004)
-0.297***
(0.004)
0.138***
(0.004)
Coopération scientifique 0.018
(0.054)
0.087***
(0.018)
-0.030
(0.051)
0.078***
(0.019)
Coopération (autre) 1.53***
(0.037)
-0.031
(0.022)
1.631***
(0.034)
0.085***
(0.022)
Ancien pays Soviétique -
-
0.238***
(0.013)
Indicatrices sectorielles (stat de test) 2677.04*** 2720.58***
Indicatrices pays (stat de test) 4736.90*** -
Nombre d'observations 64919 64919
Test du R.V. (d.l.) 9328.71(53)*** 6637.76(39)***
Test de Wald (statistique)
(Indépendance des deux équation du modèle)
7.6 0.29
P-valeur du test d'endogénéité 0.008** 0.589
Erreurs standard entre parenthèses sous chaque coefficient ***
significatif au seuil de 1%, **
significatif au seuil de 5%, *significatif au seuil de 10%
Les résultats obtenus avec la première méthode sont présentés dans le Tableau 5. Nos mesures
approchées de l'éco-innovation ont toutes deux conduites à un unique facteur, avec une valeur-propre
proche de 1. Ce résultat indique qu'une seule variable latente ("structurelle" selon la terminologie de
l'analyse factorielle) explique la quasi-totalité (en l'occurrence, 91%) de la variance observée, avec un
poids de 0,67. Nous utilisons alors les scores associés à la variable latente (autrement dit, au premier
facteur) pour construire une mesure continue de l'intensité de l'éco-innovation. Cette mesure continue
est utilisée comme variable dépendante du modèle Tobit généralisé évoqué dans le paragraphe
précédent. Pour faciliter l'interprétation, nous avons normalisé notre mesure continue, avec une

228 | P a g e
moyenne de 0 et un écart-type de 1, de telle sorte qu'elle a une distribution normale centrée réduite. Le
modèle Tobit généralisé est estimé avec et sans variable d'exclusion. L'utilisation d'une variable
d'exclusion (corrélée avec la variable dépendante de l'équation de sélection, mais pas avec celle de
l'équation d'intensité) peut permettre d'améliorer l'identification, mais il est en général difficile de
trouver une variable propre à jouer ce rôle. Ici, la meilleure variable que nous ayons trouvée est une
indicatrice de l'appartenance à un ancien pays soviétique – l'idée étant que ces pays accordaient une
importance aussi grande à l'innovation que les pays de l'Ouest, alors que la sensibilisation à l'écologie
y fut beaucoup plus tardive. Cette variable d'exclusion étant très imparfaite (en particulier parce
qu'elle n'est pas mesurée au niveau de l'entreprise et parce qu'elle est parfaitement corrélée avec un
éventuel effet fixe pays), nous avons également estimé le modèle sans y recourir (mais en ajoutant
alors un effet fixe pays).
Estimés sur l'ensemble de l'échantillon, les deux variantes du modèle Tobit généralisé
présentées dans le Tableau 5 suggèrent que les principaux facteurs associés à une plus grande intensité
de l'éco-innovation sont la coopération avec des partenaires extérieurs et le degré d'ouverture de
l'entreprise (au sens de Laursen et Salter, 2004; 2006). Par contraste, l'engagement continu dans une
activité de R&D et l'intensité de R&D, s'ils sont bien associés à une probabilité d'innover (au sens
usuel du terme) plus élevée, ne semblent pas influencer significativement l'intensité de l'éco-
innovation. Ces résultats font sens dans la mesure où l'éco-innovation repose moins sur le
développement de produits de haute technologie que sur l'adoption de procédés de production moins
polluants – procédés qu'une entreprise peut acquérir en externe, auprès de partenaires plus
expérimentés dans ce domaine, et qu'elle n'a pas forcément intérêt à développer en interne. Les
analyses conduites sur les quatre sous-échantillons (groupes de pays) évoqués plus haut conduisent
toutefois à nuancer ce résultat, dans la mesure où la R&D apparaît bien comme un déterminant de
l'éco-innovation dans les pays d'Europe de l'Ouest et du Nord d'une part, et dans les pays d'Europe
méditerranéenne d'autre part. Il se peut que les entreprises de ces deux groupes de pays jouent un rôle
moteur dans le processus d'éco-innovation, alors que celles des pays d'Europe Centrale et de l'Est
d'une part, et des pays baltes d'autre part, auraient une attitude plus attentiste.
Les résultats obtenus avec la seconde méthode (estimation par Maximum de Vraisemblance,
pour chaque mesure approchée de l‘intensité de l‘éco-innovation, d‘un modèle à équations
simultanées combinant un Probit simple pour l‘équation de sélection et un Probit ordonné pour
l‘équation d‘intensité) sont présentés dans les Tableaux 6.a (quand la mesure ordonnée de l‘intensité
d‘innovation est la réduction des consommations intermédiaires et/ou d'énergie par unité produite) et
6.b. (quand la mesure ordonnée de l‘intensité d‘innovation est la réduction de l'impact
environnemental ou sanitaire lié à l'activité de l'entreprise). Les résultats obtenus avec cette méthode
alternative corroborent globalement ceux présentés plus haut, tout particulièrement quand l‘intensité
de l‘éco-innovation est mesurée par la réduction des consommations intermédiaires et/ou d'énergie par

229 | P a g e
unité produite. Ils n‘appellent donc pas à davantage de commentaires, en-dehors du fait que le rôle de
la R&D (déjà commenté plus haut apparaît plus déterminant quand l‘intensité de l‘éco-innovation est
mesurée par la réduction de l‘impact environnemental ou sanitaire lié à l‘activité de l‘entreprise).
Tableau 6.a - Déterminants de l'éco-innovation (modèle Probit ordonné avec équation de sélection,
variable ordonnée = réduction des consommations intermédiaires et/ou d'énergie par unité produite).
Effet fixe pays Variable d’exclusion
Equation de
sélection
Equation
d'intensité
Equation de
sélection
Equation
d'intensité
Constante 0.230***
(0.043)
0.941***
(0.037)
Taille (réf.: petite)
Moyenne 0.176***
(0.015)
-0.001
(0.017)
0.112***
(0.014)
-0.003*
(0.017)
Grande 0.202***
(0.021)
0.097***
(0.022)
0.109***
(0.021)
0.119***
(0.021)
Filiale d'un groupe 0.099***
(0.016)
-0.032*
(0.016)
-0.01
(0.016)
-0.098***
(0.016)
Marché principal: national 0.238***
(0.014)
0.012
(0.019)
0.253***
(0.013)
0.008
(0.017)
Marché principal: international 0.284***
(0.015)
0.035*
(0.018)
0.267***
(0.014)
0.016
(0.017)
Soutien financier de l'UE 0.522***
(0.072)
0.126***
(0.030)
0.612***
(0.069)
0.147***
(0.03)
Activité de R&D continue 1.163***
(0.029)
0.04
(0.03)
1.087***
(0.028)
-0.017
(0.029)
Intensité de R&D 1.998***
(0.31)
0.011
(0.089)
1.734***
(0.281)
0.118
(0.086)
Ouverture -0.292***
(0.004)
0.165***
(0.007)
-0.297***
(0.004)
0.164***
(0.009)
Coopération scientifique 0.012
(0.054)
0.137***
(0.023)
-0.032
(0.051)
0.109***
(0.023)
Coopération (autre) 1.53***
(0.037)
0.024
(0.033)
1.628***
(0.034)
0.001
(0.04)
Ancien pays Soviétique -
-
0.240***
(0.013)
Indicatrices sectorielles 2335.83*** 2460.98***
Indicatrices pays 3289.64*** -
Nombre d'observations 65058 65058
Test du R.V. (d.l.) 15297.01(106)*** 14538.38(79)*
**
Erreurs standard entre parenthèses sous chaque coefficient ***
significatif au seuil de 1%, **
significatif au seuil de 5%, *significatif au seuil de 10%

230 | P a g e
Tableau 6.b - déterminants de l'éco-innovation (modèle Probit ordonné avec équation de sélection,
variable ordonnée = réduction de l'impact environnemental ou sanitaire lié à l'activité de l'entreprise.)
Effet fixe pays Variable d’exclusion Equation de
sélection
Equation
d'intensité Equation de
sélection Equation
d'intensité
Constante 0.235***
(0.043)
0.939***
(0.037)
Taille (réf.: petite)
Moyenne 0.175***
(0.015)
0.001
(0.017)
0.114***
(0.014)
-0.078***
(0.017)
Grande 0.200***
(0.021)
0.132***
(0.022)
0.111***
(0.021)
-0.017
(0.021)
Filiale d'un groupe 0.098***
(0.016)
-0.043**
(0.016)
-0.009
(0.016)
-0.016
(0.015)
Marché principal: national 0.237***
(0.014)
-0.042*
(0.019)
0.256***
(0.013)
-0.084***
(0.017)
Marché principal: international 0.283***
(0.015)
0.020
(0.018)
0.265***
(0.014)
0.047**
(0.017)
Soutien financier de l'UE 0.526***
(0.072)
-0.051
(0.030)
0.612***
(0.069)
-0.081**
(0.03)
Activité de R&D continue 1.167***
(0.029)
0.2
(0.03)
1.087***
(0.028)
0.160***
(0.029)
Intensité de R&D 1.989***
(0.31)
0.044
(0.089)
1.749***
(0.284)
-0.241**
(0.083)
Ouverture -0.294***
(0.004)
0.180***
(0.007)
-0.297***
(0.004)
0.137***
(0.006)
Coopération scientifique 0.014
(0.054)
0.021
(0.023)
-0.033
(0.051)
0.025
(0.022)
Coopération (autre) 1.53***
(0.037)
-0.033
(0.033)
1.628***
(0.034)
0.186***
(0.026)
Ancien pays Soviétique -
-
0.242***
(0.013)
Indicatrices sectorielles 1660.79*** 1706.23***
Indicatrices pays 67252.82*** -
Nombre d'observations 65058 65058
Test du R.V. (d.l.) 122495.55(106)*** 13927.95(79)***
Erreurs standard entre parenthèses sous chaque coefficient ***
significatif au seuil de 1%, **
significatif au seuil de 5%, *significatif au seuil de 10%
CHAPITRE 4 : ETUDE DES TYPES DE COMPORTEMENTS D’ECO-INNOVATION A
L’AIDE DE DONNEES MICRO-ANONYMISEES
Le Chapitre 4 étend l'analyse conduite dans le Chapitre 3, en exploitant les données "bruitées" des
Enquêtes Communautaires sur l'Innovation de 2008 (CIS 2008), qui contiennent un module
spécifiquement dédié à l'innovation environnementale. Les modèles économétriques estimés dans ce
chapitre restent similaires à ceux utilisés dans le Chapitre 3, mais l'exploitation des données CIS 2008
permet de changer l'angle d'approche. Ainsi, plutôt qu'essayer de mesurer approximativement
l'intensité de l'éco-innovation, nous établissons à l'aide du module spécifique de l'enquête une

231 | P a g e
typologie originale permettant (comme indiqué dans la Figure 3) de distinguer, parmi les entreprises
éco-innovantes: (1) les entreprises adoptant une éco-innovation de manière passive (passive eco-
adopters), (2) les entreprises adoptant tardivement une éco-innovation de manière stratégique (late
strategic eco-adopters), (3) les entreprises adoptant précocement une éco-innovation de manière
stratégique (early strategic eco-adopters), (4) les éco-innovateurs stratégiques tardifs (late strategic
eco-innovators) et (5) les éco-innovateurs stratégiques précoces (early strategic eco-innovators).
Ces cinq types d'entreprises éco-innovantes suivent une gradation, de la moins éco-innovante
à la plus éco-innovante. Ainsi, les entreprises adoptant une éco-innovation de manière passive (type
(1) dans notre classification) n‘ont pas développé elles-mêmes une éco-innovation, mais ont adopté –
sans avoir de stratégie d‘éco-innovation spécifique – un produit, procédé de production ou méthode
d‘organisation ayant des effets bénéfiques sur l‘environnement. Les entreprises adoptant tardivement
une éco-innovation de manière stratégique (type (2) de notre classification) n‘ont pas développé elles-
mêmes une éco-innovation, mais ont adopté entre 2006 et 2008 – et après avoir mis en place des
procédures spécifique pour évaluer et réduire leur empreinte environnementale – une innovation
développée par d‘autres et ayant des effets bénéfiques sur l‘environnement. Les entreprises adoptant
précocement une éco-innovation de manière stratégique (type (3) de notre classification) n‘ont pas
développé elles-mêmes une éco-innovation, mais ont adopté avant 2006 – et après avoir mis en place
des procédures spécifique pour évaluer et réduire leur empreinte environnementale – une innovation
développée par d‘autres et ayant des effets bénéfiques sur l‘environnement. Les éco-innovateurs
stratégiques tardifs (type (4) de notre classification) ont introduit une éco-innovation entre 2006 et
2008, après avoir mis en place des procédures spécifique pour évaluer et réduire leur empreinte
environnementale. Les éco-innovateurs stratégiques précoces (type (5) de notre classification) ont
introduit une éco-innovation avant 2006, après avoir mis en place des procédures spécifique pour
évaluer et réduire leur empreinte environnementale. Ces cinq catégories d‘entreprises éco-innovantes
s'opposent aux entreprises innovantes au sens conventionnel du terme mais non éco-innovantes, toutes
se distinguent des entreprises non innovantes.
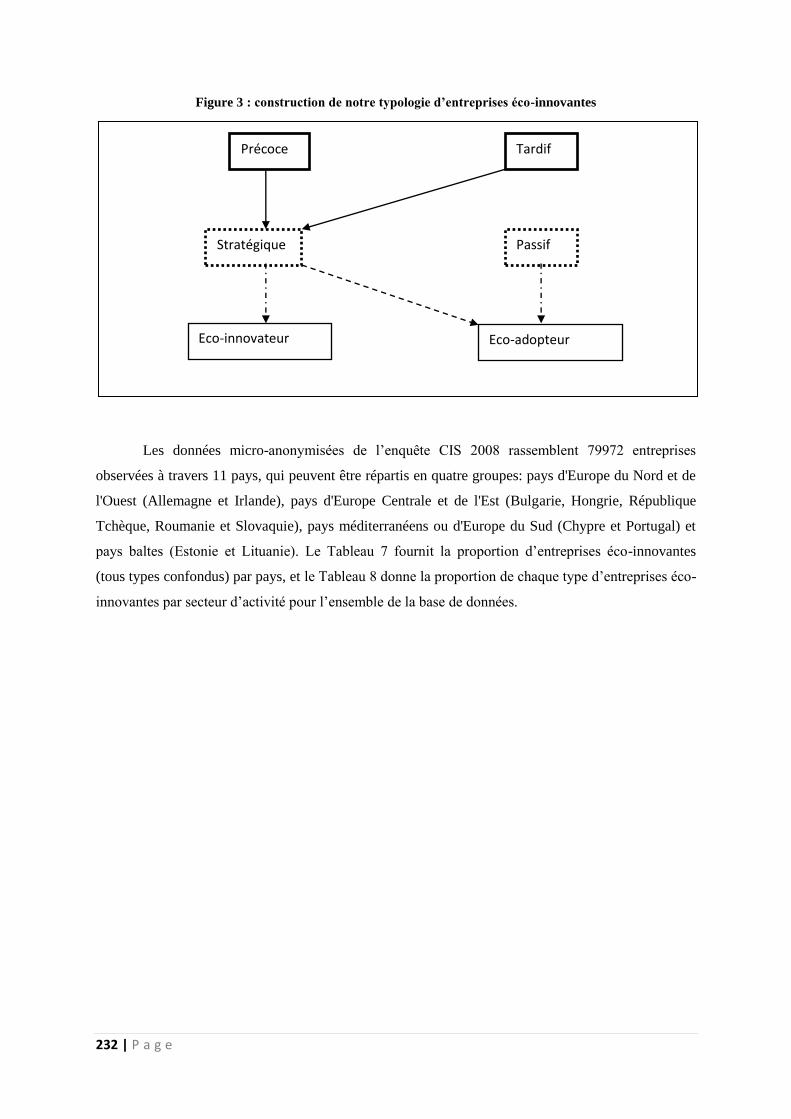
232 | P a g e
Figure 3 : construction de notre typologie d’entreprises éco-innovantes
Les données micro-anonymisées de l‘enquête CIS 2008 rassemblent 79972 entreprises
observées à travers 11 pays, qui peuvent être répartis en quatre groupes: pays d'Europe du Nord et de
l'Ouest (Allemagne et Irlande), pays d'Europe Centrale et de l'Est (Bulgarie, Hongrie, République
Tchèque, Roumanie et Slovaquie), pays méditerranéens ou d'Europe du Sud (Chypre et Portugal) et
pays baltes (Estonie et Lituanie). Le Tableau 7 fournit la proportion d‘entreprises éco-innovantes
(tous types confondus) par pays, et le Tableau 8 donne la proportion de chaque type d‘entreprises éco-
innovantes par secteur d‘activité pour l‘ensemble de la base de données.
Précoce Tardif
Stratégique Passif
Eco-innovateur Eco-adopteur

233 | P a g e
Tableau 7 – proportion d’entreprises éco-innovantes par pays
Pays Nombre d’observations % d’entreprises éco-innovantes
Allemagne 6026 52.7%
Bulgarie 31718 7.31%
Chypre 1024 15.82%
Estonie 3986 30.76%
Hongrie 5390 21.04%
Irlande 2178 42.1%
Lituanie 2111 22.64%
Portugal 6512 58.71%
République Tchèque 6804 48.5%
Roumanie 9631 32.79%
Slovaquie 4592 24.35%
Total 79972 26.02%
Notre objectif dans ce chapitre est d'identifier des facteurs spécifiques à un type d'entreprise
éco-innovante. Pour ce faire, nous estimons par Maximum de Vraisemblance des modèles comprenant
une équation de sélection (pour tenir compte des questions-filtres distinguant, dans les enquêtes CIS,
les entreprises innovantes des non-innovantes) et une équation de type Probit ordonné (dans laquelle
la variable dépendante est le type d'entreprise). Cette méthode correspond à la seconde approche
utilisée dans le chapitre précédent. Les résultats des estimations sont fournis dans le Tableau 9.
Comme dans le Chapitre 3, le degré d'ouverture des entreprises et la coopération avec des
partenaires extérieurs apparaissent prédominants, et ce quel que soit le type d'éco-innovateur
considéré. Toutefois, la R&D joue ici un rôle aussi important que ces deux facteurs (là encore quel
que soit le type d'entreprise considéré). Il est donc a priori difficile d'identifier les spécificités de
chaque type d'éco-innovateur, bien que les éco-innovateurs stratégiques précoces (les entreprises les
plus éco-innovantes de notre typologie) soient plus susceptibles de recourir à l'adoption de normes
environnementales volontaires (de type ISO14001). Par contraste, les entreprises modérément éco-
innovantes (late strategic eco-adopters, early strategic eco-adopters et late strategic eco-innovators)
ont besoin d'encouragements financiers, qui peuvent prendre la forme d'un soutien de l'UE. Comme
dans le Chapitre 3, l'estimation sur des sous-échantillons permet de nuancer ces résultats, en
soulignant notamment que l'importance de la coopération avec des partenaires extérieurs varie d'un
groupe de pays à l'autre.

234 | P a g e
Tableau 8 – pourcentage de chaque type d’entreprises éco-innovantes par secteur d’activité
Codes NACE Nombre
d’entreprises
Non éco-
innovantes
Passive eco-
adopter
Late strategic
eco-adopter
(B): Mines et Carrières 1038 28.42% 12.04% 4.43%
(C10-C12): Agro-alimentaire,
boissons et tabac 6080 28.78% 12.38% 3.22%
(C13-C15): Textiles et cuir 7855 27.4% 7.49% 4.03%
(C16-C18): Bois, papier et imprimerie 4400 29.84% 13.75% 3.7%
(C19-C23): Coke, chimie et produits
chimiques 6331 25.44% 15.28% 3.22%
(C24-C25): Métallurgie et produits
métalliques 5344 29.67% 15.02% 3.79%
(C26-C30): TIC, électronique et
machinerie 6711 27.67% 18.89% 4.7%
(C31-C33): Mobilier, réparation et
installation de machinerie 4598 32.92% 14.28% 4.52%
(D): Fourniture d‘électricité, de gaz,
de vapeur et d‘air conditionné
1224 33.33% 15.68% 5.39%
(E): Fourniture d‘eau 2259 23.37% 13.28% 5.62%
(F): Construction 2202 60.94% 8.81% 8.9%
(G): Commerce de gros et détail 13815 25.8% 7.49% 4.86%
(H49-H51): Transport 4748 24.22% 9.49% 2.86%
(H52-H53): Stockage, soutien au
transport, postage 1856 37.44% 9.21% 5.6%
(I): Services de logement et de
restauration 164 52.43% 31.7% 1.21%
(J58-J60): Publication, radio- et
télédiffusion, vidéo 1119 41.28% 14.29% 4.02%
(J61-J63): Télécommunications,
informatique et consultance 3160 42.12% 13.13% 4.33%
(K): Finance et assurance 2534 43.21% 12.74% 3.23%
(L): Immobilier 75 60% 24% 6.66%
(M69-M70): Direction, droit,
comptabilité 450 65.11% 20.88% 2%
(M71-M73): R&D, Architecture et
ingénierie 3070 40.84% 15.47% 4.23%
(M74-M75): Autres activités
scientifiques et techniques 112 55.35% 30.35% 0.89%
(N): Activités administratives 827 53.08% 21.88% 2.29%
Total 79972 31.05% 12.33% 4.23%

235 | P a g e
Tableau 8, suite (trois dernières colonnes)
Codes NACE Early strategic eco-
adopter
Late strategic eco-
innovator
Early strategic eco-
innovator
(B): Mines et Carrières 13% 9.63% 8.57%
(C10-C12): Agro-alimentaire, boissons
et tabac
7.46% 6.61% 7.4%
(C13-C15): Textiles et cuir 9.12% 2.71% 3.95%
(C16-C18): Bois, papier et imprimerie 9.06% 7.27% 7.86%
(C19-C23): Coke, chimie et produits
chimiques
8.33% 10.61% 11.64%
(C24-C25): Métallurgie et produits
métalliques
7.41% 8.85% 8.15%
(C26-C30): TIC, électronique et
machinerie
9.17% 10.04% 13.96%
(C31-C33): Mobilier, réparation et
installation de machinerie
8.61% 6.17% 6.65%
(D): Fourniture d‘électricité, de gaz, de
vapeur et d‘air conditionné
11.02% 9.55% 11.51%
(E): Fourniture d‘eau 12.12% 11.81% 15.49%
(F): Construction 7.44% 7.31% 6.58%
(G): Commerce de gros et détail 10.93% 4.14% 4.02%
(H49-H51): Transport 7.79% 3.83% 3.39%
(H52-H53): Stockage, soutien au
transport, postage
12.23% 6.25% 6.73%
(I): Services de logement et de
restauration
1.82% 5.48% 7.31%
(J58-J60): Publication, radio- et
télédiffusion, vidéo
9.2% 3.03% 3.48%
(J61-J63): Télécommunications,
informatique et consultance
9.43% 3.51% 3.1%
(K): Finance et assurance 15.78% 3.78% 3.7%
(L): Immobilier 2.66% 2.66% 4%
(M69-M70): Direction, droit,
comptabilité
1.11% 1.77% 0.88%
(M71-M73): R&D, Architecture et
ingénierie
8.69% 5.96% 6.02%
(M74-M75): Autres activités
scientifiques et techniques
2.67% 5.35% 2.67%
(N): Activités administratives 3.38% 4.83% 5.19%
Total 9.29% 6.3% 6.96%

236 | P a g e
Tableau 9 – déterminants du type d’entreprises éco-innovantes (effets marginaux,
modèle Probit multivarié avec équation de sélection)
Variables Equation de Type d‘entreprise
sélection Early strategic
eco-Innovator
Late strategic
eco-Innovator
Early strategic
eco-adopter
Late strategic
eco-adopter
Passive eco-
adopter
Non éco-
innovante
Filiale d‘un
groupe
0 .065**
(0.027)
0. 015***
(0.002)
0.024***
(0.002)
0.008***
(0.001)
0.003***
(0.0004)
0.001
(0.001)
-0.051***
(0.006)
Taille : Moyenne 0.12***
(0.025)
0.02***
(0.002)
0.031***
(0.002)
0.01***
(0.001)
0.004***
(0.0004)
0.001
(0.001)
-0.067***
(0.006)
Grande 0.25***
(0.045)
0.06***
(0.004)
0.077***
(0.004)
0.022***
(0.001)
0.009***
(0.0005)
-0.022***
(0.003)
-0.145***
(0.007)
Intensité de R&D -0.0002***
(0.0000)
0.0003***
(0.0002)
0.0005***
(0.0003)
0.0002***
(0.0001)
-0.0008***
(0.0009)
-0.0006**
(0.0001)
-0.0012***
(0.0001)
R&D Continue 0.700***
(0.055)
0.01***
(0.0002)
0.017***
(0.003)
0.005***
(0.001)
0.002***
(0.0005)
0.0002
(0.0006)
-0.036***
(0.007)
Ouverture -0.076***
(0.004)
0.003***
(0.0003)
0.005***
(0.0005)
0.002***
(0.0002)
0.001***
(0.0001)
0.0006**
(0.0002)
-0.012***
(0.001)
Coopération
scientifique
-0.040
(0.077)
0.013***
(0.003)
0.021***
(0.004)
0.006***
(0.001)
0.003***
(0.0005)
-0.0003
(0.0009)
-0.043***
(0.008)
Autre coopération 0.930***
(0.050)
0.015***
(0.002)
0.023***
(0.003)
0.007***
(0.001)
0.003***
(0.0005)
0.0004
(0.0008)
-0.049***
(0.007)
Marché
international
0.210***
(0.024)
0.007***
(0.001)
0.013***
(0.002)
0.004***
(0.001)
0.002***
(0.0004)
0.001*
(0.0006)
-0.028***
(0.005)
Marché national 0.210***
(0.026)
-0.005**
(0.002)
-0.009**
(0.003)
-0.003**
(0.001)
-0.001**
(0.0004)
-0.0006
(0.0003)
0.02**
(0.006)
Soutien public
(UE)
0.280***
(0.087)
0.001**
(0.003)
0.016**
(0.004)
0.005**
(0.001)
0.002**
(0.0006)
-0.0002
(0.0007)
-0.033**
(0.009)
Adoption de
normes
facultatives
0.520***
(0.034)
0.084***
(0.003)
0.011***
(0.003)
0.03****
(0.001)
0.012***
(0.0006)
-0.034***
(0.003)
-0.198***
(0.006)
Réglementation 0.48***
(0.031)
0.001***
(0.003)
0.123***
(0.003)
0.034***
(0.001)
0.014***
(0.007)
-0.033***
(0.004)
-0.237***
(0.006)

237 | P a g e
REFERENCES BIBLIOGRAPHIQUES
Blackman A. (1999): ―The economics of technology diffusion: implications for climate policy in
developing countries‖, Resources for the Future
Commission Européenne (2012): ―Number of Jobs Dependent on the « Environment and Resource
Efficiency Improvements project“, Final Report.
Fussler C. et P. James (1996): ―Driving eco-innovation: a breakthrough discipline for innovation and
sustainability”, Pitman, London, 364 p.
Jaffe , A. B.; Newell, R. G. et R.N. Stavins (2002): ―Environmental policy and technological change‖,
Environmental and resource economics, 22, 41-70
Kemp R. et P. Pearson (2007): ―Final report MEI project about measuring eco-innovation”,
Deliverable 15 of MEI project (D15), UM Merit, Maastricht, 10
Kemp R. et M. Volpi (2008): ―The diffusion of clean technologies: a review with suggestions for
future diffusion analysis‖, Journal of Cleaner Production, 16, S14-S21
Laursen, K. and A. Salter (2004): ―Searching High and Low: What Types of Firms Use Universities
as a Source of Innovation?‖ Research Policy, 33, 1201-1215.
Laursen, K., et A. Salter (2006): ―Open for innovation: the role of openness in explaining innovation
performance among U.K. manufacturing firms‖, Strategic Management Journal, 27, 131-150.
Mansfield E. (1968): ―Industrial research and technological innovation; an econometric analysis”
Moore G.A. (2002): ―Crossing the Chasm”, Capstone
OCDE (2009): ―Sustainable Manufacturing and Eco‑innovation: Framework, Measurement and
Industry and policy practices”, Synthesis report, available at
www.oecd.org/sti/innovation/sustainablemanufacturing
Popp D. (2009): ―Policies for the development and transfer of eco-innovations: Lessons from the
literature”, OECD Publishing
Porter M. et C. Van der Linde (1995): ―Toward a New Conception of the Environment-
Competitiveness Relationship‖, Journal of Economic Perspectives, 9(4), 97-118.
Rennings, K. (2000): ―Redefining innovation—eco-innovation research and the contribution
from ecological economics‖, Ecological economics, 32, 319-332
Rogers E.M. (1962): ―Diffusion of innovations”, New York.
Rogers E.M. (1983): ―Diffusion of innovations”, New York, 2nd
Edition.