


Bahasa
Halaman
Hukum

AUTHOR QUERY FORM
Journal: SCT Please e-mail or fax your responses and any corrections to:E-mail: [email protected]: +1 619 699 6721
Article Number: 16981
Dear Author,
Any queries or remarks that have arisen during the processing of your manuscript are listed below and highlighted by flags inthe proof. Please check your proof carefully and mark all corrections at the appropriate place in the proof (e.g., by using on-screen annotation in the PDF file) or compile them in a separate list.
For correction or revision of any artwork, please consult http://www.elsevier.com/artworkinstructions.
Any queries or remarks that have arisen during the processing of your manuscript are listed below and highlighted by flags inthe proof. Click on the ‘Q’ link to go to the location in the proof.
Locationin article
Query / Remark: click on the Q link to goPlease insert your reply or correction at the corresponding line in the proof
Q1 Please confirm that given names and surnames have been identified correctly.
Thank you for your assistance.
Our reference: SCT 16981 P-authorquery-v8
Page 1 of 1
1
2
3Q1
456
7
891011121314151617
41
42
43
44
45
46
47
48
49
50
51
52
53
Surface & Coatings Technology xxx (2011) xxx–xxx
SCT-16981; No of Pages 13
Contents lists available at SciVerse ScienceDirect
Surface & Coatings Technology
j ourna l homepage: www.e lsev ie r .com/ locate /sur fcoat
OF
Ultra-low carbon (ULC) steel modified by triode plasma nitriding and PVD coating:Effects on micro-abrasive wear behavior
C.A. Llanes Leyva a,⁎, Cristina Godoy a, A.C. Bozzi b, J.C. Avelar-Batista Wilson c
a UFMG, School of Engineering, Department of Metallurgical Engineering, Universidade Federal de Minas Gerais (PPGEM-UFMG), Brazilb UFES, Department of Mechanical Engineering, Universidade Federal do Espírito Santo (DEM-UFES), Brazilc TECVAC Ltd., Buckingway Business Park, Rowles Way, Swavesey, Cambridge, CB24 4UG, UK
⁎ Corresponding author at: Faculdade UCL, RodoviaSerra, ES, CEP: 29173-087, Brazil. Tel./fax: +55 27 3434
E-mail address: [email protected] (C.A. Llanes Leyv
0257-8972/$ – see front matter © 2011 Elsevier B.V. Alldoi:10.1016/j.surfcoat.2011.08.021
Please cite this article as: C.A. Llanes Leyva
O
a b s t r a c t
a r t i c l e i n f o18
Available online xxxx 1920
21
22
23
Keywords:Ti-stabilized ultra-low carbon steelMicro-abrasive wearDuplex coating
24
25
26
27
28
29
30
31
32
33
34
35
36
37
RECTED PRUltra-low carbon (ULC) steels exhibit low yield strength and excellent formability. Plasma Assisted PhysicalVapor Deposition (PAPVD) is a potential coating method for enhancing the strength at the surface of thesesteels [1]. However, when deposited onto low strength alloys PAPVD coatings may undergo premature failureif the substrate plastically deforms under heavy load. Extra load support is usually required for hard coatingsto perform satisfactorily. Combined treatments involving plasma nitriding and PAPVD coating have beenused to improve the load-bearing capacity of hard films [2]. This work describes the characterization andmicro-abrasive wear behavior of Ti-stabilized ULC steels after surface modification by D.C Triode Plasma Ni-triding (DC-TPN) and sequential coating with CrAlN by Electron Beam Plasma Assisted Physical Vapor Depo-sition (EB-PAPVD). Ti-ULC steel, plasma nitrided Ti-ULC steel and Ti-ULC duplex system were characterizedby SEM, EDS, XRD analyses, micro-hardness and instrumented indentation hardness measurements, and sty-lus profilometry. Micro-abrasive wear tests were performed in fixed-ball configuration up to 1350 revolu-tions using SiC abrasive slurry and a 25 mm diameter — AISI 52100 steel ball. Micro-abrasion mechanismsare presented and discussed. Nitrided steel and duplex systems were, respectively, 2.6 and 3.5 times harderthan the untreated Ti-ULC steel. Wear coefficient of nitrided steel was 36% lower than that of the parent Ti-ULC steel. Regression analyses were used to calculate substrate (ks) and coating (kc) wear coefficients for theduplex system, the latter being 6.5 times lower than that of the nitrided steel. Coating thickness (3 μm max.)was determined from inner and outer diameter measurements of the wear scars. Results indicate that it isfeasible to manufacture duplex Ti-ULC steel via PAPVD, as significant improvements in wear resistancewere recorded for both nitrided and duplex-treated steels. Duplex treatment clearly was the most effectivemethod to enhance the wear resistance of ULC steels.
38
ES 010, Km 6, Manguinhos,0100.
a).
rights reserved.
, et al., Surf. Coat. Technol. (2011), doi:10.101
© 2011 Elsevier B.V. All rights reserved.
3940
R54
55
56
57
58
59
60
61
62
63
64
65
UNCO1. Introduction
Over the past few years the range of applications for ultra-lowcarbon (ULC) steels has spread widely. As a general rule, these steelsexhibit low yield strength and excellent formability. For the verysame reason, applications for ULC steels are somehow restricted bytheir low resistance to surface degradation processes as wear andcorrosion. New applications could be developed for ULC steels –
e.g. for manufacturing complex shape products – if modificationtreatments allow enhancing the surface properties. Plasma AssistedPhysical Vapor Deposition (PAPVD) could be a potential coatingmethod for enhancing both wear and corrosion resistances of low
66
67
68
69
70
71
strength alloys [1,3]. However, when deposited onto lowmechanicalstrength alloys PAPVD coatings may undergo premature failure if thesubstrate plastically deforms under heavy load. Therefore, an extraload support is often required for hard coatings to perform satisfac-torily. Combined treatments involving plasma nitriding and PAPVDcoating have been successfully used to improve the load-bearingcapacity of hard films [2]. Other plasma thermochemical treatmentssuch as nitriding, carburizing, carbonitriding and post-oxidationhave also been employed to improve corrosion and wear resistanceof low carbon steels, as well as to increase their surface hardnessand fatigue life [4].
Some research work has been undertaken regarding improve-ments of surface hardness and corrosion resistance in low carbonsteels (AISI 1010 and 1020) which were surface modified by PAPVDprocesses [4–7]. However, to our knowledge, no reference can befound up to this date regarding the wear behavior of ULC steels mod-ified by sequential treatments comprising plasma nitriding andPAPVD coating (duplex treatment).
6/j.surfcoat.2011.08.021
RRECT
F
72
73
74
75
76
77
78
79
80
81
82
83
84
85
86
87
88
89
90
91
92
93
94
95
96
97
98
99
100
101
Table 1t1:1
Sample ID, nomenclature and manufacturing conditions for different systems underinvestigation.
t1:2t1:3 System
No.Description and manufacturing conditions Nomenclature
t1:4 1 Uncoated, untreated, cold rolled Ti-stabilized ULC steel ULCt1:5 2 Plasma nitrided Ti-ULC steel ULC-TPNt1:6 D.C Triode Plasma Nitriding at 500 °C for 2 ht1:7 3 Plasma Duplex Ti-ULC steel DUPLEX-ULCt1:8 Plasma nitrided Ti-ULC steel D.C. triode plasma at 500 °C
for 2 h followed by EBPAPVD CrAlN coating
Table 2t2:1
Chemical composition (in at.%) of as-received, cold rolled, Ti-stabilized ULC steelsamples.
t2:2t2:3 Elements (at.%)
t2:4 C Mn Si P S Al Ti Nb
t2:5 0.0025 0.0817 0.0099 0.0096 0.0090 0.0476 0.0639 0.0002t2:6
t2:7 N B Cu Ni Cr Mo Sn As
t2:8 0.0015 0.0002 0.0081 0.0131 0.0110 0.0014 0.0003 0.0018t2:9 Balance: Approx. 99.74% Fe
Table 3t3:1
Setup parameters that were used for the micro-abrasive wear tests.t3:2
t3:3 Parameter Unit/Specification
Parameter Unit/Specification
t3:4 Normalload
0.25 N Abrasive SiCb10 μm (Grade F600-C6)manufactured by Washington andMills Abrasives, Manchester, UK
t3:5 Ball AISI 52100 steel,∅25 mm,Ra=2.5±0.3 μm
Test duration 150, 300, 450, 600, 750, 900,1050, 1200 and 1350 revolutions
t3:6 Rotationspeed
80 rpm(8.38 rad/s)
Concentrationof abrasiveslurry
355 g/l
t3:7 Linearspeed
0.1 m/s Suspensionfluid
Distilled water
Fig. 2. Outer (b) and inner (a) diameters of wear scars (craters) measured in paralleland perpendicular directions [11].
2 C.A. Llanes Leyva et al. / Surface & Coatings Technology xxx (2011) xxx–xxx
OThis work is focused on the evaluation of wear behavior and charac-terization of Ti-stabilized ULC steel before and after surface modifica-tion by D.C Triode Plasma Nitriding (DC-TPN) and sequential coating
UNC
Fig. 1. Schematic drawing of the micro-abrasive test a
Please cite this article as: C.A. Llanes Leyva, et al., Surf. Coat. Technol. (2
Owith CrAlN by Electron Beam Plasma-Assisted Physical Vapor Deposi-tion (EB-PAPVD).
ED P
RO2. Experimental
2.1. Sampled materials and plasma surface modifications
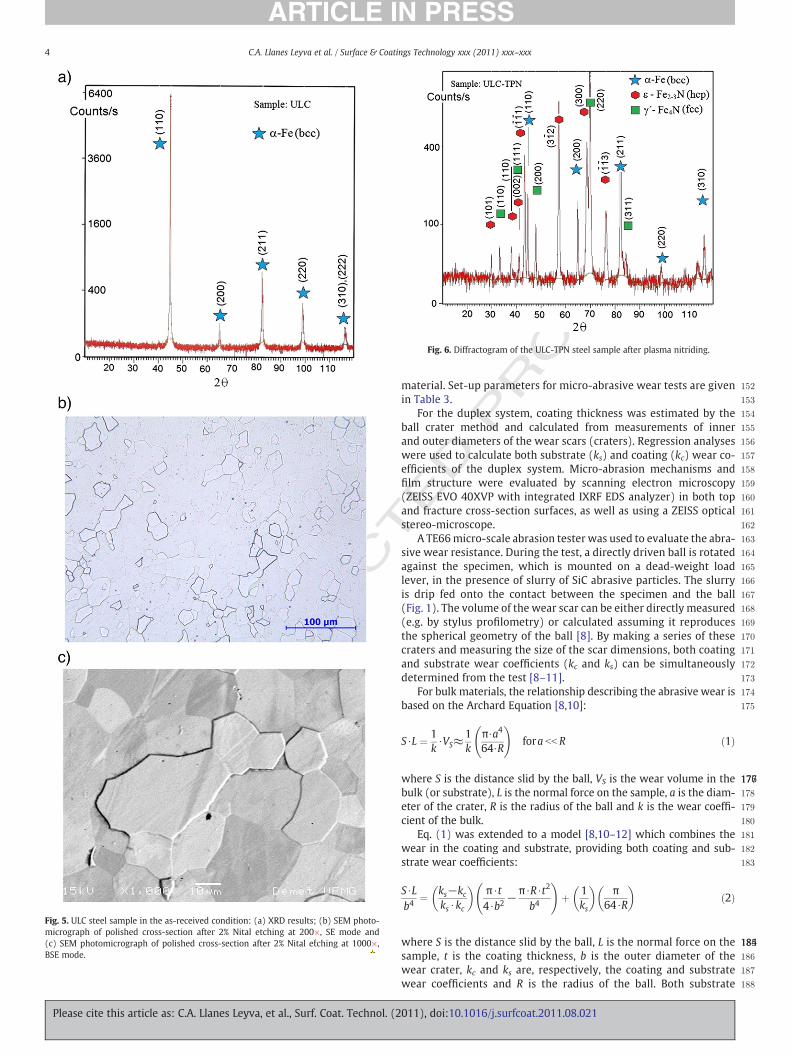
Sample ID, nomenclature and manufacturing conditions for thedifferent systems under investigation in this work are listed inTable 1. Samples of Ti-stabilized ULC steel were manufacturedunder standard industrial conditions by USIMINAS S.A, a Braziliansteel company. Chemical composition of cold rolled ULC steel sam-ples used in this work are given in Table 2. C, S and N contentswere determined by combustion method with LECO-CS-444 andLECO TC-136 analyzers. The other elements contents were obtainedby optical emission spectroscopy with ARL-3460 analyzer.
For comparison purposes uncoated, untreated ULC steel sampleswere investigated in the as-received condition and after being met-allographically ground (SiC paper) and polished (MD Dac cloth andDiapro Dac 3 μm suspension) to a mirror finish. This procedure wasadopted as a pre-treatment to improve the surface finish on samplesbeing subsequently nitrided and coated. Polished ULC steel test discs(38 mm in diameter, 3 mm thick) were treated by D.C. Triode PlasmaNitriding (ULC-TPN), and by a duplex treatment comprising sequen-tial D.C. Triode Plasma Nitriding and PAPVD CrAlN coating to producea duplex system (DUPLEX-ULC).
Plasma modification processes were conducted by TECVAC Ltd,U.K. Mirror polished Ti-ULC steel samples were ultrasonically cleanedin a fully automated cleaning line to remove any surface contamina-tion. After cleaning, samples were surface modified by D.C. Triode
pparatus used in this present investigation [12].
011), doi:10.1016/j.surfcoat.2011.08.021
CT
102
103
104
105
106
107
108
109
110
111
112
113
114
115
116
117
118
119
120
121
122
123
124
125
126
127
128
129
130
131
132
133
134
135
136
137
138
139
140
141
142
143
144
145
146
147
148
149
150
151
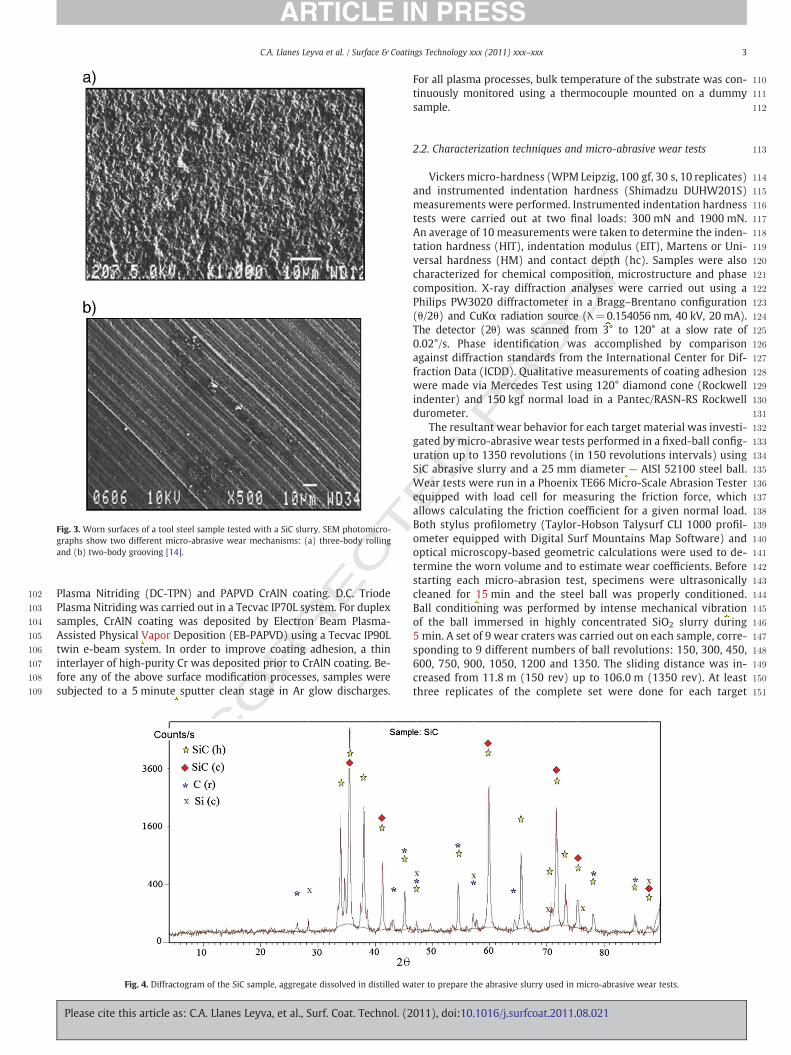
Fig. 3. Worn surfaces of a tool steel sample tested with a SiC slurry. SEM photomicro-graphs show two different micro-abrasive wear mechanisms: (a) three-body rollingand (b) two-body grooving [14].
3C.A. Llanes Leyva et al. / Surface & Coatings Technology xxx (2011) xxx–xxx
RREPlasma Nitriding (DC-TPN) and PAPVD CrAlN coating. D.C. Triode
Plasma Nitriding was carried out in a Tecvac IP70L system. For duplexsamples, CrAlN coating was deposited by Electron Beam Plasma-Assisted Physical Vapor Deposition (EB-PAPVD) using a Tecvac IP90Ltwin e-beam system. In order to improve coating adhesion, a thininterlayer of high-purity Cr was deposited prior to CrAlN coating. Be-fore any of the above surface modification processes, samples weresubjected to a 5 minute sputter clean stage in Ar glow discharges.
UNCO
Fig. 4. Diffractogram of the SiC sample, aggregate dissolved in distilled wa
Please cite this article as: C.A. Llanes Leyva, et al., Surf. Coat. Technol. (2
For all plasma processes, bulk temperature of the substrate was con-tinuously monitored using a thermocouple mounted on a dummysample.
ED P
RO
OF
2.2. Characterization techniques and micro-abrasive wear tests
Vickers micro-hardness (WPM Leipzig, 100 gf, 30 s, 10 replicates)and instrumented indentation hardness (Shimadzu DUHW201S)measurements were performed. Instrumented indentation hardnesstests were carried out at two final loads: 300 mN and 1900 mN.An average of 10 measurements were taken to determine the inden-tation hardness (HIT), indentation modulus (EIT), Martens or Uni-versal hardness (HM) and contact depth (hc). Samples were alsocharacterized for chemical composition, microstructure and phasecomposition. X-ray diffraction analyses were carried out using aPhilips PW3020 diffractometer in a Bragg–Brentano configuration(θ/2θ) and CuKα radiation source (λ=0.154056 nm, 40 kV, 20 mA).The detector (2θ) was scanned from 3° to 120° at a slow rate of0.02°/s. Phase identification was accomplished by comparisonagainst diffraction standards from the International Center for Dif-fraction Data (ICDD). Qualitative measurements of coating adhesionwere made via Mercedes Test using 120° diamond cone (Rockwellindenter) and 150 kgf normal load in a Pantec/RASN-RS Rockwelldurometer.
The resultant wear behavior for each target material was investi-gated by micro-abrasive wear tests performed in a fixed-ball config-uration up to 1350 revolutions (in 150 revolutions intervals) usingSiC abrasive slurry and a 25 mm diameter — AISI 52100 steel ball.Wear tests were run in a Phoenix TE66 Micro-Scale Abrasion Testerequipped with load cell for measuring the friction force, whichallows calculating the friction coefficient for a given normal load.Both stylus profilometry (Taylor-Hobson Talysurf CLI 1000 profil-ometer equipped with Digital Surf Mountains Map Software) andoptical microscopy-based geometric calculations were used to de-termine the worn volume and to estimate wear coefficients. Beforestarting each micro-abrasion test, specimens were ultrasonicallycleaned for 15 min and the steel ball was properly conditioned.Ball conditioning was performed by intense mechanical vibrationof the ball immersed in highly concentrated SiO2 slurry during5 min. A set of 9 wear craters was carried out on each sample, corre-sponding to 9 different numbers of ball revolutions: 150, 300, 450,600, 750, 900, 1050, 1200 and 1350. The sliding distance was in-creased from 11.8 m (150 rev) up to 106.0 m (1350 rev). At leastthree replicates of the complete set were done for each target
ter to prepare the abrasive slurry used in micro-abrasive wear tests.
011), doi:10.1016/j.surfcoat.2011.08.021
UNCO
RRECT
OO
F
152
153
154
155
156
157
158
159
160
161
162
163
164
165
166
167
168
169
170
171
172
173
174
175
176177178
179
180
181
182
183
184185186
187
188
Fig. 5. ULC steel sample in the as-received condition: (a) XRD results; (b) SEM photo-micrograph of polished cross-section after 2% Nital etching at 200×, SE mode and(c) SEM photomicrograph of polished cross-section after 2% Nital etching at 1000×,BSE mode.
Fig. 6. Diffractogram of the ULC-TPN steel sample after plasma nitriding.
4 C.A. Llanes Leyva et al. / Surface & Coatings Technology xxx (2011) xxx–xxx
Please cite this article as: C.A. Llanes Leyva, et al., Surf. Coat. Technol. (2
ED P
Rmaterial. Set-up parameters for micro-abrasive wear tests are givenin Table 3.
For the duplex system, coating thickness was estimated by theball crater method and calculated from measurements of innerand outer diameters of the wear scars (craters). Regression analyseswere used to calculate both substrate (ks) and coating (kc) wear co-efficients of the duplex system. Micro-abrasion mechanisms andfilm structure were evaluated by scanning electron microscopy(ZEISS EVO 40XVP with integrated IXRF EDS analyzer) in both topand fracture cross-section surfaces, as well as using a ZEISS opticalstereo-microscope.
A TE66micro-scale abrasion tester was used to evaluate the abra-sive wear resistance. During the test, a directly driven ball is rotatedagainst the specimen, which is mounted on a dead-weight loadlever, in the presence of slurry of SiC abrasive particles. The slurryis drip fed onto the contact between the specimen and the ball(Fig. 1). The volume of the wear scar can be either directly measured(e.g. by stylus profilometry) or calculated assuming it reproducesthe spherical geometry of the ball [8]. By making a series of thesecraters and measuring the size of the scar dimensions, both coatingand substrate wear coefficients (kc and ks) can be simultaneouslydetermined from the test [8–11].
For bulk materials, the relationship describing the abrasive wear isbased on the Archard Equation [8,10]:
S⋅L ¼ 1k ⋅VS≈
1k
π⋅a464⋅R
!fora bb R ð1Þ
where S is the distance slid by the ball, VS is the wear volume in thebulk (or substrate), L is the normal force on the sample, a is the diam-eter of the crater, R is the radius of the ball and k is the wear coeffi-cient of the bulk.
Eq. (1) was extended to a model [8,10–12] which combines thewear in the coating and substrate, providing both coating and sub-strate wear coefficients:
S⋅Lb4
¼ ks−kcks ⋅kc
� �π⋅t4⋅b2
−π⋅R⋅t2
b4
!þ 1
ks
� �π
64⋅R
� �ð2Þ
where S is the distance slid by the ball, L is the normal force on thesample, t is the coating thickness, b is the outer diameter of thewear crater, kc and ks are, respectively, the coating and substratewear coefficients and R is the radius of the ball. Both substrate
011), doi:10.1016/j.surfcoat.2011.08.021
UNCO
RRECT
189
190
191
192
193
194195
196197198
199
200
201202203
204
205
206
207
208
209
210211212
213214215
216
217
218
219
220
221
222
223
224
225226227
228229
230231232
233
234
235
236
237
238
239
240
241
242
243
244
245
246
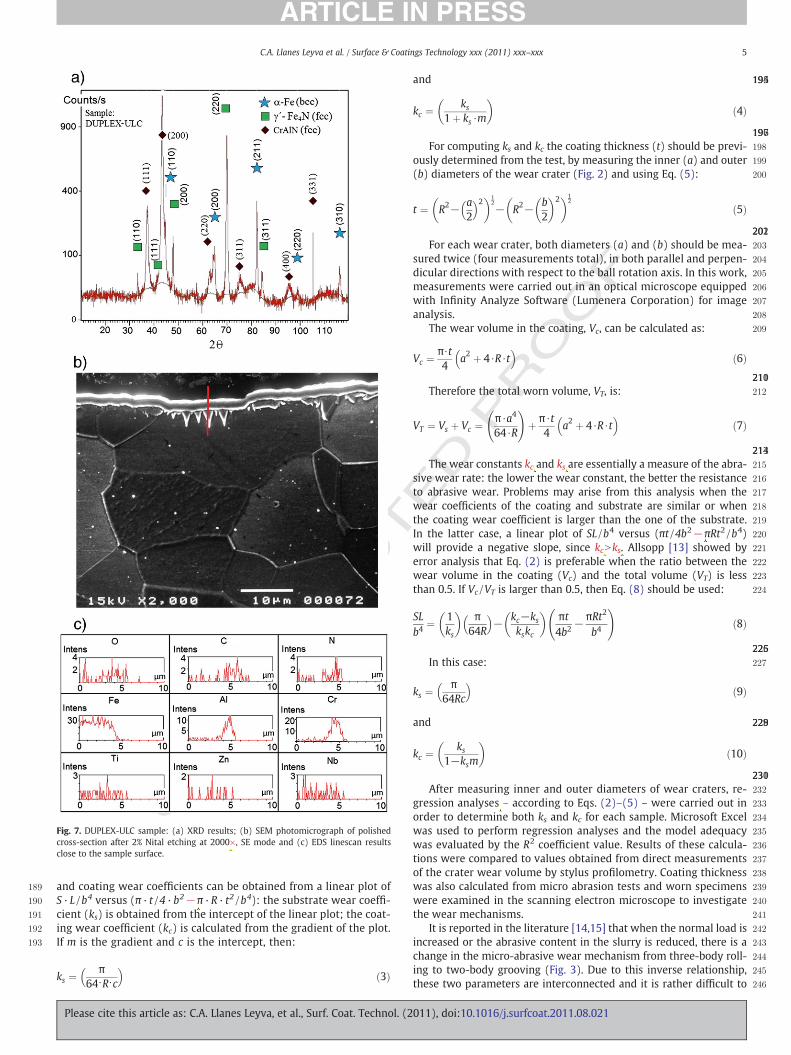
Fig. 7. DUPLEX-ULC sample: (a) XRD results; (b) SEM photomicrograph of polishedcross-section after 2% Nital etching at 2000×, SE mode and (c) EDS linescan resultsclose to the sample surface.
5C.A. Llanes Leyva et al. / Surface & Coatings Technology xxx (2011) xxx–xxx
and coating wear coefficients can be obtained from a linear plot ofS·L /b4 versus (π· t /4·b2−π·R· t2 /b4): the substrate wear coeffi-cient (ks) is obtained from the intercept of the linear plot; the coat-ing wear coefficient (kc) is calculated from the gradient of the plot.If m is the gradient and c is the intercept, then:
ks ¼π
64⋅R⋅c� �
ð3Þ
Please cite this article as: C.A. Llanes Leyva, et al., Surf. Coat. Technol. (2
ED P
RO
OF
and
kc ¼ks
1þ ks ⋅m
� �ð4Þ
For computing ks and kc the coating thickness (t) should be previ-ously determined from the test, by measuring the inner (a) and outer(b) diameters of the wear crater (Fig. 2) and using Eq. (5):
t ¼ R2− a2
� �2� �12
− R2− b2
� �2� �12
ð5Þ
For each wear crater, both diameters (a) and (b) should be mea-sured twice (four measurements total), in both parallel and perpen-dicular directions with respect to the ball rotation axis. In this work,measurements were carried out in an optical microscope equippedwith Infinity Analyze Software (Lumenera Corporation) for imageanalysis.
The wear volume in the coating, Vc, can be calculated as:
Vc ¼π⋅t4
a2 þ 4⋅R⋅t� �
ð6Þ
Therefore the total worn volume, VT, is:
VT ¼ Vs þ Vc ¼π⋅a464⋅R
!þ π⋅t
4a2 þ 4⋅R⋅t� �
ð7Þ
The wear constants kc and ks are essentially a measure of the abra-sive wear rate: the lower the wear constant, the better the resistanceto abrasive wear. Problems may arise from this analysis when thewear coefficients of the coating and substrate are similar or whenthe coating wear coefficient is larger than the one of the substrate.In the latter case, a linear plot of SL /b4 versus (πt /4b2−πRt2/b4)will provide a negative slope, since kcNks. Allsopp [13] showed byerror analysis that Eq. (2) is preferable when the ratio between thewear volume in the coating (Vc) and the total volume (VT) is lessthan 0.5. If Vc /VT is larger than 0.5, then Eq. (8) should be used:
SLb4
¼ 1ks
� �π
64R
� �− kc−ks
kskc
� �πt4b2
−πRt2
b4
!ð8Þ
In this case:
ks ¼π
64Rc
� �ð9Þ
and
kc ¼ks
1−ksm
� �ð10Þ
After measuring inner and outer diameters of wear craters, re-gression analyses – according to Eqs. (2)–(5) – were carried out inorder to determine both ks and kc for each sample. Microsoft Excelwas used to perform regression analyses and the model adequacywas evaluated by the R2 coefficient value. Results of these calcula-tions were compared to values obtained from direct measurementsof the crater wear volume by stylus profilometry. Coating thicknesswas also calculated from micro abrasion tests and worn specimenswere examined in the scanning electron microscope to investigatethe wear mechanisms.
It is reported in the literature [14,15] that when the normal load isincreased or the abrasive content in the slurry is reduced, there is achange in the micro-abrasive wear mechanism from three-body roll-ing to two-body grooving (Fig. 3). Due to this inverse relationship,these two parameters are interconnected and it is rather difficult to
011), doi:10.1016/j.surfcoat.2011.08.021
UNCO
RRECTED P
RO
OF
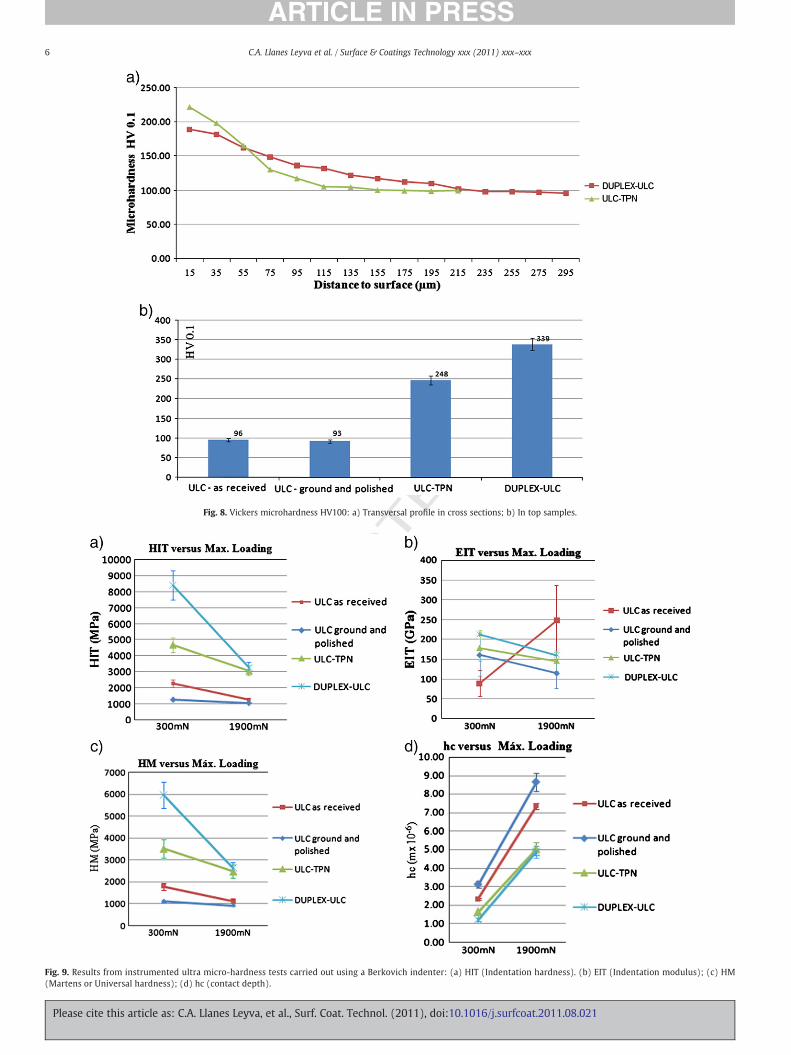
Fig. 8. Vickers microhardness HV100: a) Transversal profile in cross sections; b) In top samples.
Fig. 9. Results from instrumented ultra micro-hardness tests carried out using a Berkovich indenter: (a) HIT (Indentation hardness). (b) EIT (Indentation modulus); (c) HM(Martens or Universal hardness); (d) hc (contact depth).
6 C.A. Llanes Leyva et al. / Surface & Coatings Technology xxx (2011) xxx–xxx
Please cite this article as: C.A. Llanes Leyva, et al., Surf. Coat. Technol. (2011), doi:10.1016/j.surfcoat.2011.08.021
T
RO
OF
247
248
249
250
251
252
253
254
255
256
257
258
259
260
261
262
263
264
265
266
267
268
269
270
271
272
273
274
275
276
277
278
279
280
281
282
283
284
285
286
287
288
289
290
291
292
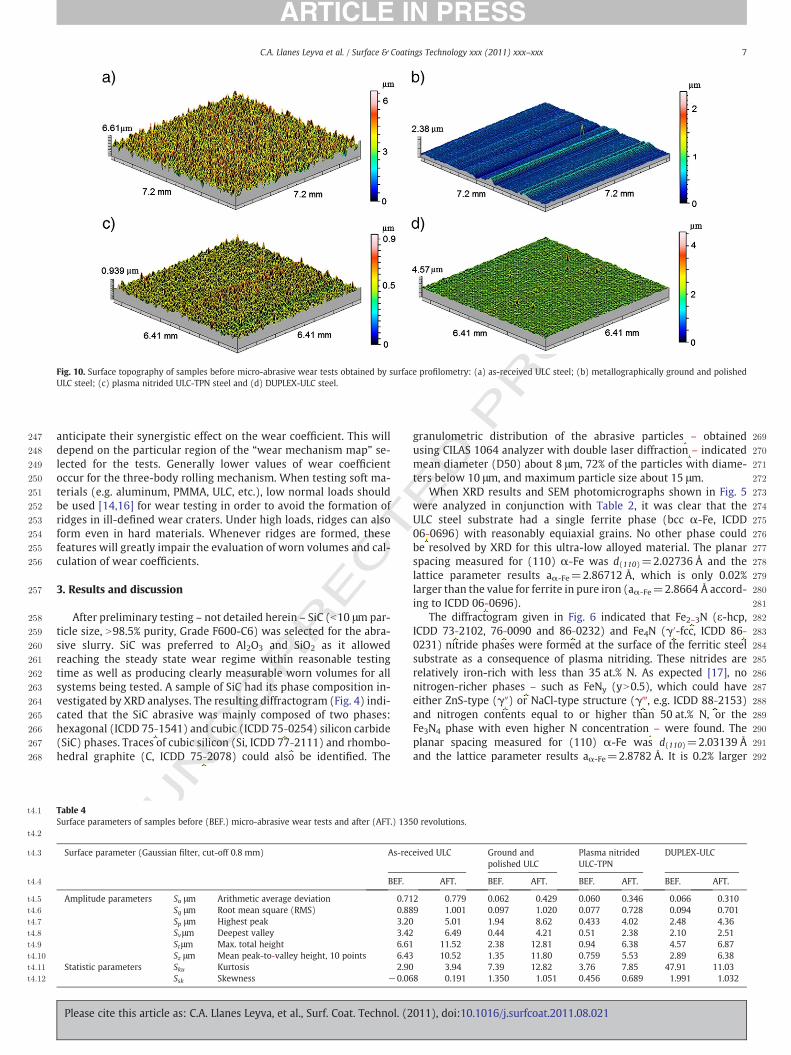
Fig. 10. Surface topography of samples before micro-abrasive wear tests obtained by surface profilometry: (a) as-received ULC steel; (b) metallographically ground and polishedULC steel; (c) plasma nitrided ULC-TPN steel and (d) DUPLEX-ULC steel.
t4:1
t4:2
t4:3
t4:4
t4:5
t4:6
t4:7
t4:8
t4:9
t4:10
t4:11
t4:12
7C.A. Llanes Leyva et al. / Surface & Coatings Technology xxx (2011) xxx–xxx
CO
RREC
anticipate their synergistic effect on the wear coefficient. This willdepend on the particular region of the “wear mechanism map” se-lected for the tests. Generally lower values of wear coefficientoccur for the three-body rolling mechanism. When testing soft ma-terials (e.g. aluminum, PMMA, ULC, etc.), low normal loads shouldbe used [14,16] for wear testing in order to avoid the formation ofridges in ill-defined wear craters. Under high loads, ridges can alsoform even in hard materials. Whenever ridges are formed, thesefeatures will greatly impair the evaluation of worn volumes and cal-culation of wear coefficients.
3. Results and discussion
After preliminary testing – not detailed herein – SiC (b10 μm par-ticle size, N98.5% purity, Grade F600-C6) was selected for the abra-sive slurry. SiC was preferred to Al2O3 and SiO2 as it allowedreaching the steady state wear regime within reasonable testingtime as well as producing clearly measurable worn volumes for allsystems being tested. A sample of SiC had its phase composition in-vestigated by XRD analyses. The resulting diffractogram (Fig. 4) indi-cated that the SiC abrasive was mainly composed of two phases:hexagonal (ICDD 75-1541) and cubic (ICDD 75-0254) silicon carbide(SiC) phases. Traces of cubic silicon (Si, ICDD 77-2111) and rhombo-hedral graphite (C, ICDD 75-2078) could also be identified. The
UN
Table 4Surface parameters of samples before (BEF.) micro-abrasive wear tests and after (AFT.) 135
Surface parameter (Gaussian filter, cut-off 0.8 mm) As-rec
BEF.
Amplitude parameters Sa μm Arithmetic average deviation 0.71Sq μm Root mean square (RMS) 0.88Sp μm Highest peak 3.20Svμm Deepest valley 3.42Stμm Max. total height 6.61Sz μm Mean peak-to-valley height, 10 points 6.43
Statistic parameters Sku Kurtosis 2.90Ssk Skewness −0.06
Please cite this article as: C.A. Llanes Leyva, et al., Surf. Coat. Technol. (2
ED Pgranulometric distribution of the abrasive particles – obtained
using CILAS 1064 analyzer with double laser diffraction – indicatedmean diameter (D50) about 8 μm, 72% of the particles with diame-ters below 10 μm, and maximum particle size about 15 μm.
When XRD results and SEM photomicrographs shown in Fig. 5were analyzed in conjunction with Table 2, it was clear that theULC steel substrate had a single ferrite phase (bcc α-Fe, ICDD06-0696) with reasonably equiaxial grains. No other phase couldbe resolved by XRD for this ultra-low alloyed material. The planarspacing measured for (110) α-Fe was d(110)=2.02736 Å and thelattice parameter results aα-Fe=2.86712 Å, which is only 0.02%larger than the value for ferrite in pure iron (aα-Fe=2.8664 Å accord-ing to ICDD 06-0696).
The diffractogram given in Fig. 6 indicated that Fe2–3N (ε-hcp,ICDD 73-2102, 76-0090 and 86-0232) and Fe4N (γ′-fcc, ICDD 86-0231) nitride phases were formed at the surface of the ferritic steelsubstrate as a consequence of plasma nitriding. These nitrides arerelatively iron-rich with less than 35 at.% N. As expected [17], nonitrogen-richer phases – such as FeNy (yN0.5), which could haveeither ZnS-type (γ″) or NaCl-type structure (γ‴, e.g. ICDD 88-2153)and nitrogen contents equal to or higher than 50 at.% N, or theFe3N4 phase with even higher N concentration – were found. Theplanar spacing measured for (110) α-Fe was d(110)=2.03139 Åand the lattice parameter results aα-Fe=2.8782 Å. It is 0.2% larger
0 revolutions.
eived ULC Ground andpolished ULC
Plasma nitridedULC-TPN
DUPLEX-ULC
AFT. BEF. AFT. BEF. AFT. BEF. AFT.
2 0.779 0.062 0.429 0.060 0.346 0.066 0.3109 1.001 0.097 1.020 0.077 0.728 0.094 0.701
5.01 1.94 8.62 0.433 4.02 2.48 4.366.49 0.44 4.21 0.51 2.38 2.10 2.51
11.52 2.38 12.81 0.94 6.38 4.57 6.8710.52 1.35 11.80 0.759 5.53 2.89 6.383.94 7.39 12.82 3.76 7.85 47.91 11.03
8 0.191 1.350 1.051 0.456 0.689 1.991 1.032
011), doi:10.1016/j.surfcoat.2011.08.021
UNCO
RRECTED P
RO
OF
293
294
295
296
297
298
299
300
301
302
303
304
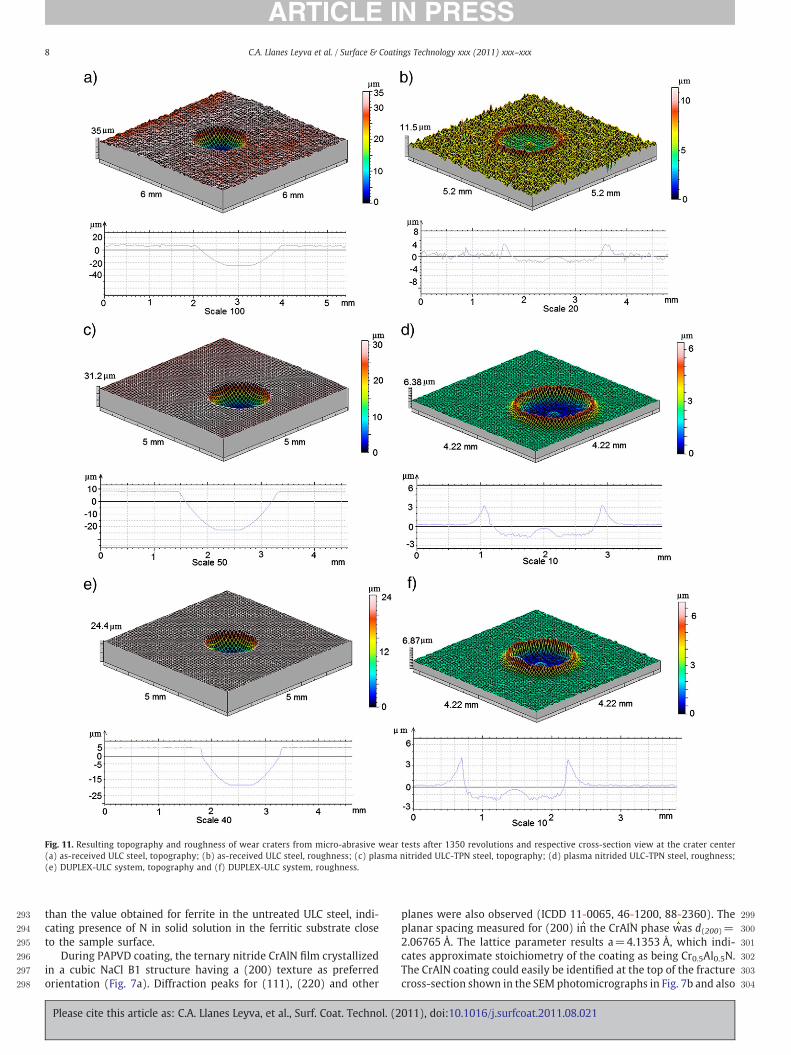
Fig. 11. Resulting topography and roughness of wear craters from micro-abrasive wear tests after 1350 revolutions and respective cross-section view at the crater center(a) as-received ULC steel, topography; (b) as-received ULC steel, roughness; (c) plasma nitrided ULC-TPN steel, topography; (d) plasma nitrided ULC-TPN steel, roughness;(e) DUPLEX-ULC system, topography and (f) DUPLEX-ULC system, roughness.
8 C.A. Llanes Leyva et al. / Surface & Coatings Technology xxx (2011) xxx–xxx
than the value obtained for ferrite in the untreated ULC steel, indi-cating presence of N in solid solution in the ferritic substrate closeto the sample surface.
During PAPVD coating, the ternary nitride CrAlN film crystallizedin a cubic NaCl B1 structure having a (200) texture as preferredorientation (Fig. 7a). Diffraction peaks for (111), (220) and other
Please cite this article as: C.A. Llanes Leyva, et al., Surf. Coat. Technol. (2
planes were also observed (ICDD 11-0065, 46-1200, 88-2360). Theplanar spacing measured for (200) in the CrAlN phase was d(200)=2.06765 Å. The lattice parameter results a=4.1353 Å, which indi-cates approximate stoichiometry of the coating as being Cr0.5Al0.5N.The CrAlN coating could easily be identified at the top of the fracturecross-section shown in the SEM photomicrographs in Fig. 7b and also
011), doi:10.1016/j.surfcoat.2011.08.021
T
F
305
306
307
308
309
310
311
312
313
314
315
316
317
318
319
320
321
322
323
324
325
326
327
328
329
330
331
332
333
334
335
336
337
338
339
340
341
342
343
344
345
346
347
348
349
350
351
352
353
354
355
356
Table 5t5:1
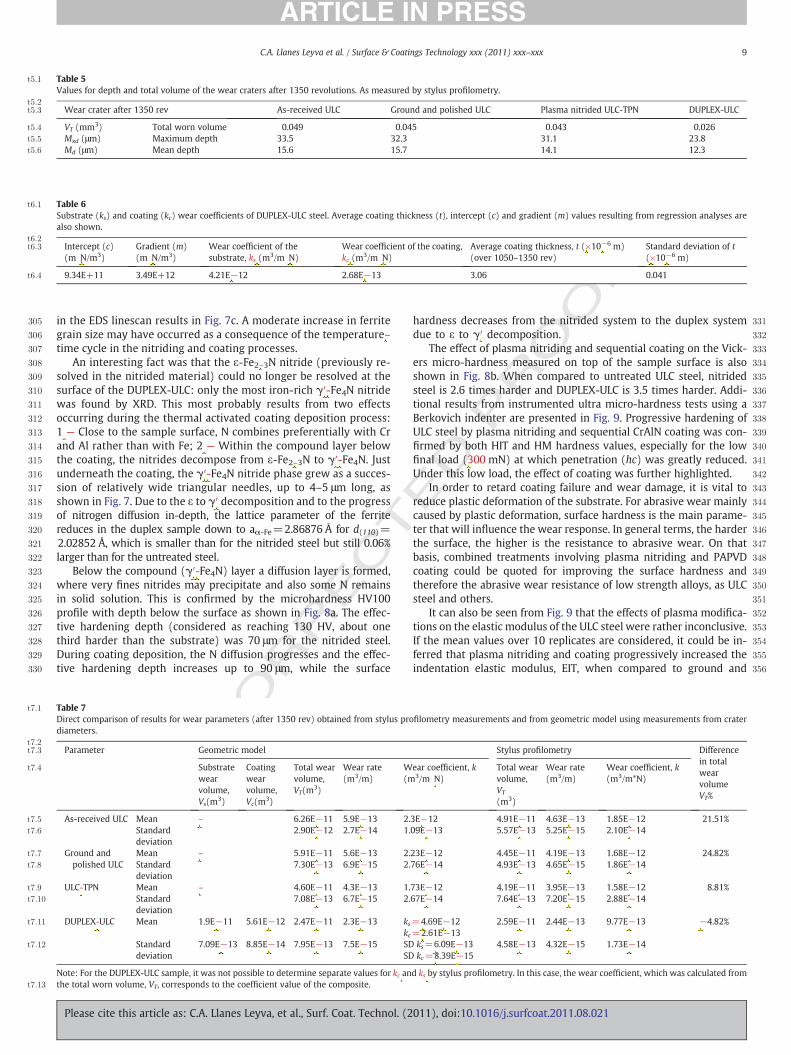
Values for depth and total volume of the wear craters after 1350 revolutions. As measured by stylus profilometry.t5:2t5:3 Wear crater after 1350 rev As-received ULC Ground and polished ULC Plasma nitrided ULC-TPN DUPLEX-ULC
t5:4 VT (mm3) Total worn volume 0.049 0.045 0.043 0.026t5:5 Mxd (μm) Maximum depth 33.5 32.3 31.1 23.8t5:6 Md (μm) Mean depth 15.6 15.7 14.1 12.3
Table 6t6:1
Substrate (ks) and coating (kc) wear coefficients of DUPLEX-ULC steel. Average coating thickness (t), intercept (c) and gradient (m) values resulting from regression analyses arealso shown.
t6:2t6:3 Intercept (c)
(m N/m3)Gradient (m)(m N/m3)
Wear coefficient of thesubstrate, ks (m3/m N)
Wear coefficient of the coating,kc (m3/m N)
Average coating thickness, t (×10−6 m)(over 1050–1350 rev)
Standard deviation of t(×10−6 m)
t6:4 9.34E+11 3.49E+12 4.21E−12 2.68E−13 3.06 0.041
t7:1
t7:2t7:3
t7:4
t7:5
t7:6
t7:7
t7:8
t7:9
t7:10
t7:11
t7:12
t7:13
9C.A. Llanes Leyva et al. / Surface & Coatings Technology xxx (2011) xxx–xxx
REC
in the EDS linescan results in Fig. 7c. A moderate increase in ferritegrain size may have occurred as a consequence of the temperature–time cycle in the nitriding and coating processes.
An interesting fact was that the ε-Fe2–3N nitride (previously re-solved in the nitrided material) could no longer be resolved at thesurface of the DUPLEX-ULC: only the most iron-rich γ′-Fe4N nitridewas found by XRD. This most probably results from two effectsoccurring during the thermal activated coating deposition process:1 — Close to the sample surface, N combines preferentially with Crand Al rather than with Fe; 2 — Within the compound layer belowthe coating, the nitrides decompose from ε-Fe2–3N to γ′-Fe4N. Justunderneath the coating, the γ′-Fe4N nitride phase grew as a succes-sion of relatively wide triangular needles, up to 4–5 μm long, asshown in Fig. 7. Due to the ε to γ′ decomposition and to the progressof nitrogen diffusion in-depth, the lattice parameter of the ferritereduces in the duplex sample down to aα-Fe=2.86876 Å for d(110)=2.02852 Å, which is smaller than for the nitrided steel but still 0.06%larger than for the untreated steel.
Below the compound (γ′-Fe4N) layer a diffusion layer is formed,where very fines nitrides may precipitate and also some N remainsin solid solution. This is confirmed by the microhardness HV100profile with depth below the surface as shown in Fig. 8a. The effec-tive hardening depth (considered as reaching 130 HV, about onethird harder than the substrate) was 70 μm for the nitrided steel.During coating deposition, the N diffusion progresses and the effec-tive hardening depth increases up to 90 μm, while the surface
UNCO
R
Table 7Direct comparison of results for wear parameters (after 1350 rev) obtained from stylus prodiameters.
Parameter Geometric model
Substratewearvolume,Vs(m3)
Coatingwearvolume,Vc(m3)
Total wearvolume,VT(m3)
Wear rate(m3/m)
W(m
As-received ULC Mean – 6.26E−11 5.9E−13 2.Standarddeviation
2.90E−12 2.7E−14 1.
Ground andpolished ULC
Mean – 5.91E−11 5.6E−13 2.Standarddeviation
7.30E−13 6.9E−15 2.
ULC-TPN Mean – 4.60E−11 4.3E−13 1.Standarddeviation
7.08E−13 6.7E−15 2.
DUPLEX-ULC Mean 1.9E−11 5.61E−12 2.47E−11 2.3E−13 kskc
Standarddeviation
7.09E−13 8.85E−14 7.95E−13 7.5E−15 SDSD
Note: For the DUPLEX-ULC sample, it was not possible to determine separate values for kc anthe total worn volume, VT, corresponds to the coefficient value of the composite.
Please cite this article as: C.A. Llanes Leyva, et al., Surf. Coat. Technol. (2
ED P
RO
Ohardness decreases from the nitrided system to the duplex systemdue to ε to γ′ decomposition.
The effect of plasma nitriding and sequential coating on the Vick-ers micro-hardness measured on top of the sample surface is alsoshown in Fig. 8b. When compared to untreated ULC steel, nitridedsteel is 2.6 times harder and DUPLEX-ULC is 3.5 times harder. Addi-tional results from instrumented ultra micro-hardness tests using aBerkovich indenter are presented in Fig. 9. Progressive hardening ofULC steel by plasma nitriding and sequential CrAlN coating was con-firmed by both HIT and HM hardness values, especially for the lowfinal load (300 mN) at which penetration (hc) was greatly reduced.Under this low load, the effect of coating was further highlighted.
In order to retard coating failure and wear damage, it is vital toreduce plastic deformation of the substrate. For abrasive wear mainlycaused by plastic deformation, surface hardness is the main parame-ter that will influence the wear response. In general terms, the harderthe surface, the higher is the resistance to abrasive wear. On thatbasis, combined treatments involving plasma nitriding and PAPVDcoating could be quoted for improving the surface hardness andtherefore the abrasive wear resistance of low strength alloys, as ULCsteel and others.
It can also be seen from Fig. 9 that the effects of plasma modifica-tions on the elastic modulus of the ULC steel were rather inconclusive.If the mean values over 10 replicates are considered, it could be in-ferred that plasma nitriding and coating progressively increased theindentation elastic modulus, EIT, when compared to ground and
filometry measurements and from geometric model using measurements from crater
Stylus profilometry Differencein totalwearvolumeVT%
ear coefficient, k3/m N)
Total wearvolume,VT
(m3)
Wear rate(m3/m)
Wear coefficient, k(m3/m*N)
3E−12 4.91E−11 4.63E−13 1.85E−12 21.51%09E−13 5.57E−13 5.25E−15 2.10E−14
23E−12 4.45E−11 4.19E−13 1.68E−12 24.82%76E−14 4.93E−13 4.65E−15 1.86E−14
73E−12 4.19E−11 3.95E−13 1.58E−12 8.81%67E−14 7.64E−13 7.20E−15 2.88E−14
=4.69E−12=2.61E−13
2.59E−11 2.44E−13 9.77E−13 −4.82%
ks=6.09E−13kc=8.39E−15
4.58E−13 4.32E−15 1.73E−14
d ks by stylus profilometry. In this case, the wear coefficient, which was calculated from
011), doi:10.1016/j.surfcoat.2011.08.021
TED P
RO
OF
357
358
359
360
361
362
363
364
365
366
367
368
369
370
371
372
373
374
375
376
377
378
379
380
381
382
383
384
385
386
387
388
389
390
391
392
Fig. 12. Comparative data for (a) wear coefficients and (b) wear rates for the different target materials, as calculated from the crater diameters.
10 C.A. Llanes Leyva et al. / Surface & Coatings Technology xxx (2011) xxx–xxx
CO
RREC
polished ULC steel. However, the standard deviations of the EIT valueswere large, hindering a conclusive statement. For the as-received ULCsteel the EIT values were even erratic. Several factors could haveplayed a part in instrumented indentation measurements carried outin this sample, including its high values for surface roughness param-eters and the eventual effect of an oxide layer at the surface. It hasalready been reported in the literature that EIT values measuredfrom instrumented indentation tests do not always agree with thoseresulting from tensile tests [18,19]. EIT is usually load dependentand is often affected by measuring method (unloading or reloadingcurve), grain orientation and size (especially for low loads), localdefects (porosity, micro-cracks, etc.), problems in computing contactarea (especially for soft materials) and themechanics of systems com-prising hard coatings on soft substrates, etc.
The surface roughness of the samples measured by stylus profilo-metry before micro-abrasive wear tests is illustrated in Fig. 10(note that different scales were used from (a) to (d)). The numericalvalues for the amplitude and statistical parameters of the initial
UN
Fig. 13. Substrate (ks) and coating (kc) wear coefficients of the DUPLEX-ULC steel system. W
Please cite this article as: C.A. Llanes Leyva, et al., Surf. Coat. Technol. (2
surface roughness are shown in Table 4. The surface roughness ofthe as-received ULC steel was significantly reduced by metallo-graphic grinding and polishing. Plasma nitriding did not essen-tially alter the previous surface topography, as evidenced by theULC-TPN sample. Sequential coating of the plasma nitrided steel(DUPLEX-ULC) increased the maximum peak and valley heights (aslocalized non-uniformities) but did not change both Sa and Sq param-eters of the surface.
Both topography and roughness of wear craters resulting frommicro-abrasive wear tests are shown in Fig. 11, as well as their re-spective cross-section profiles at the center of the crater. Numericalvalues for the amplitude and statistical parameters of the worn sur-faces are also listed in Table 4. Values for depth and total volume(VT) of the wear craters after 1350 revolutions are listed in Table 5,as measured by stylus profilometry. The crater volume is reducedfor the nitrided ULC-TPN steel in comparison to the ULC steel sub-strate; the reduction is evenmore substantial for the DUPLEX-ULC, in-dicating an increase in abrasive wear resistance.
ear coefficients were computed using the results obtained from the regression analysis.
011), doi:10.1016/j.surfcoat.2011.08.021
TED P
RO
OF
393
394
395
396
397
398
399
400
401
402
403
404
405
406
407
408
409
410
411
412
413
414
415
416
417
418
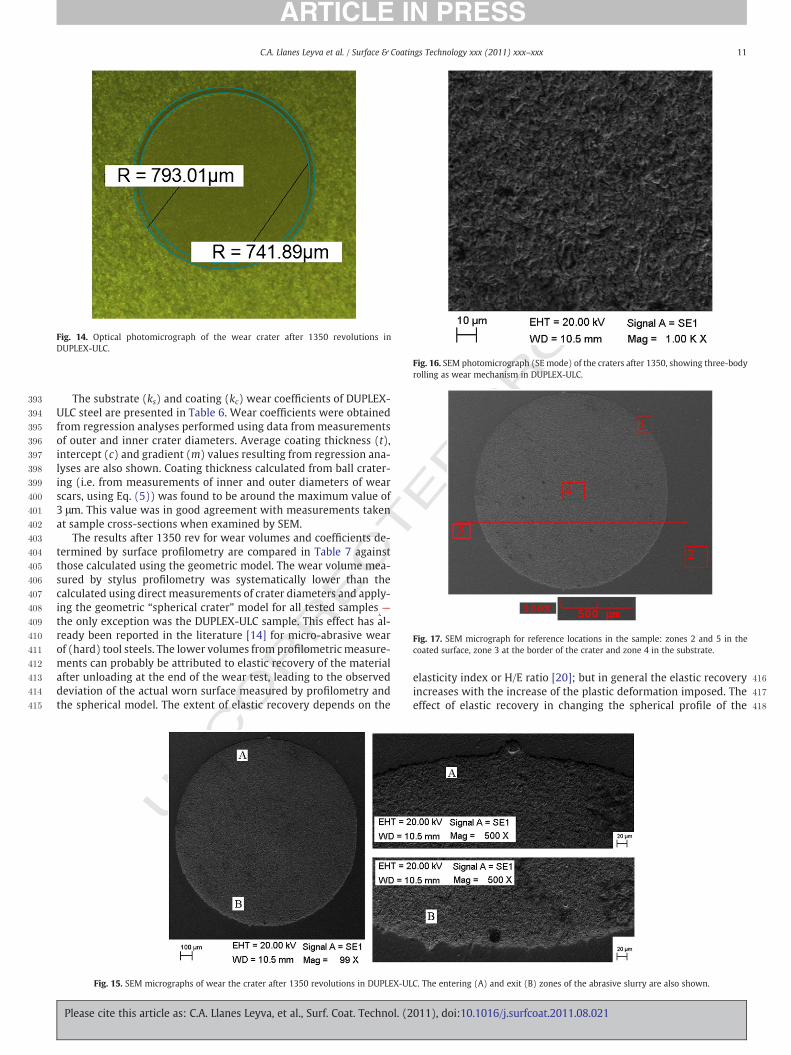
Fig. 14. Optical photomicrograph of the wear crater after 1350 revolutions inDUPLEX-ULC.
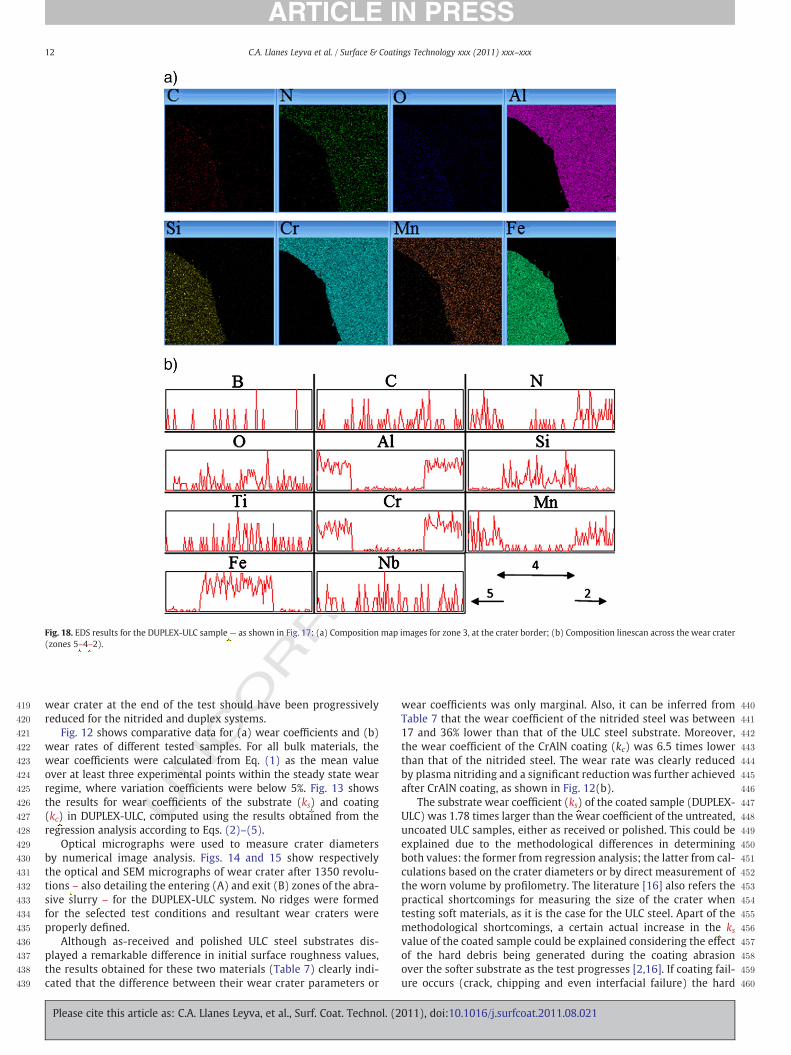
Fig. 16. SEM photomicrograph (SE mode) of the craters after 1350, showing three-bodyrolling as wear mechanism in DUPLEX-ULC.
Fig. 17. SEM micrograph for reference locations in the sample: zones 2 and 5 in thecoated surface, zone 3 at the border of the crater and zone 4 in the substrate.
11C.A. Llanes Leyva et al. / Surface & Coatings Technology xxx (2011) xxx–xxx
RREC
The substrate (ks) and coating (kc) wear coefficients of DUPLEX-ULC steel are presented in Table 6. Wear coefficients were obtainedfrom regression analyses performed using data from measurementsof outer and inner crater diameters. Average coating thickness (t),intercept (c) and gradient (m) values resulting from regression ana-lyses are also shown. Coating thickness calculated from ball crater-ing (i.e. from measurements of inner and outer diameters of wearscars, using Eq. (5)) was found to be around the maximum value of3 μm. This value was in good agreement with measurements takenat sample cross-sections when examined by SEM.
The results after 1350 rev for wear volumes and coefficients de-termined by surface profilometry are compared in Table 7 againstthose calculated using the geometric model. The wear volume mea-sured by stylus profilometry was systematically lower than thecalculated using direct measurements of crater diameters and apply-ing the geometric “spherical crater” model for all tested samples —
the only exception was the DUPLEX-ULC sample. This effect has al-ready been reported in the literature [14] for micro-abrasive wearof (hard) tool steels. The lower volumes from profilometric measure-ments can probably be attributed to elastic recovery of the materialafter unloading at the end of the wear test, leading to the observeddeviation of the actual worn surface measured by profilometry andthe spherical model. The extent of elastic recovery depends on the
UNCO
Fig. 15. SEM micrographs of wear the crater after 1350 revolutions in DUPLEX-UL
Please cite this article as: C.A. Llanes Leyva, et al., Surf. Coat. Technol. (2
elasticity index or H/E ratio [20]; but in general the elastic recoveryincreases with the increase of the plastic deformation imposed. Theeffect of elastic recovery in changing the spherical profile of the
C. The entering (A) and exit (B) zones of the abrasive slurry are also shown.
011), doi:10.1016/j.surfcoat.2011.08.021
RRECTED P
RO
OF
419
420
421
422
423
424
425
426
427
428
429
430
431
432
433
434
435
436
437
438
439
440
441
442
443
444
445
446
447
448
449
450
451
452
453
454
455
456
457
458
459
460
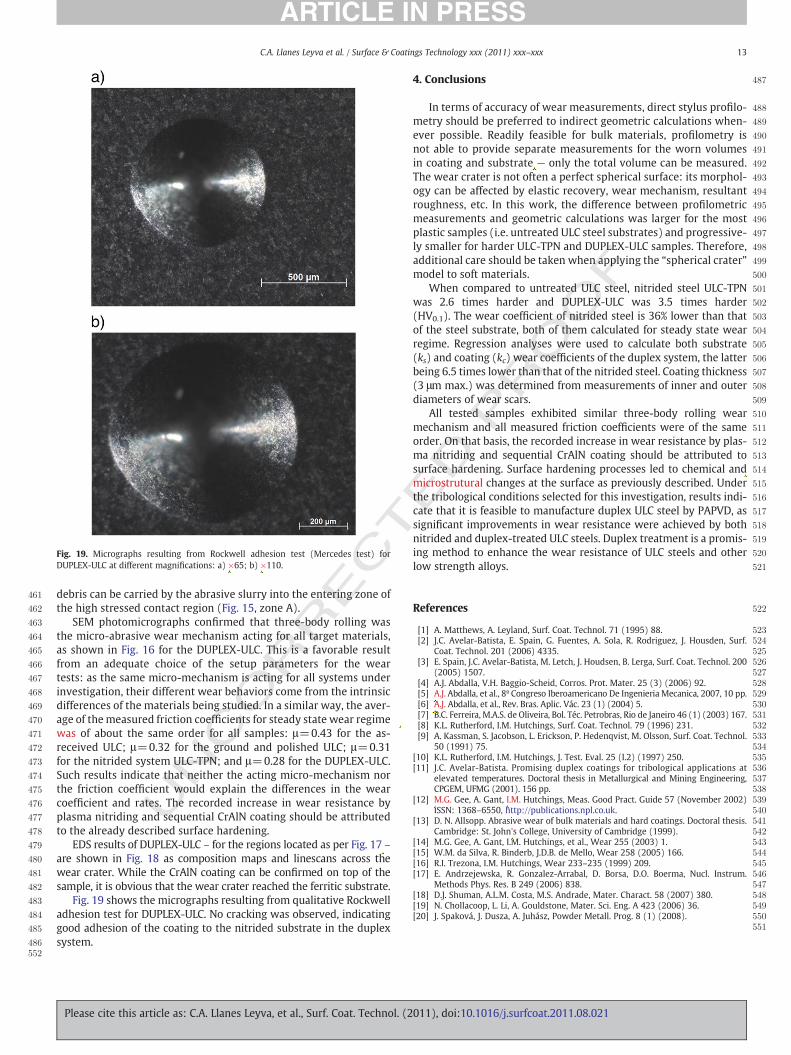
Fig. 18. EDS results for the DUPLEX-ULC sample — as shown in Fig. 17: (a) Composition map images for zone 3, at the crater border; (b) Composition linescan across the wear crater(zones 5–4–2).
12 C.A. Llanes Leyva et al. / Surface & Coatings Technology xxx (2011) xxx–xxx
UNCOwear crater at the end of the test should have been progressively
reduced for the nitrided and duplex systems.Fig. 12 shows comparative data for (a) wear coefficients and (b)
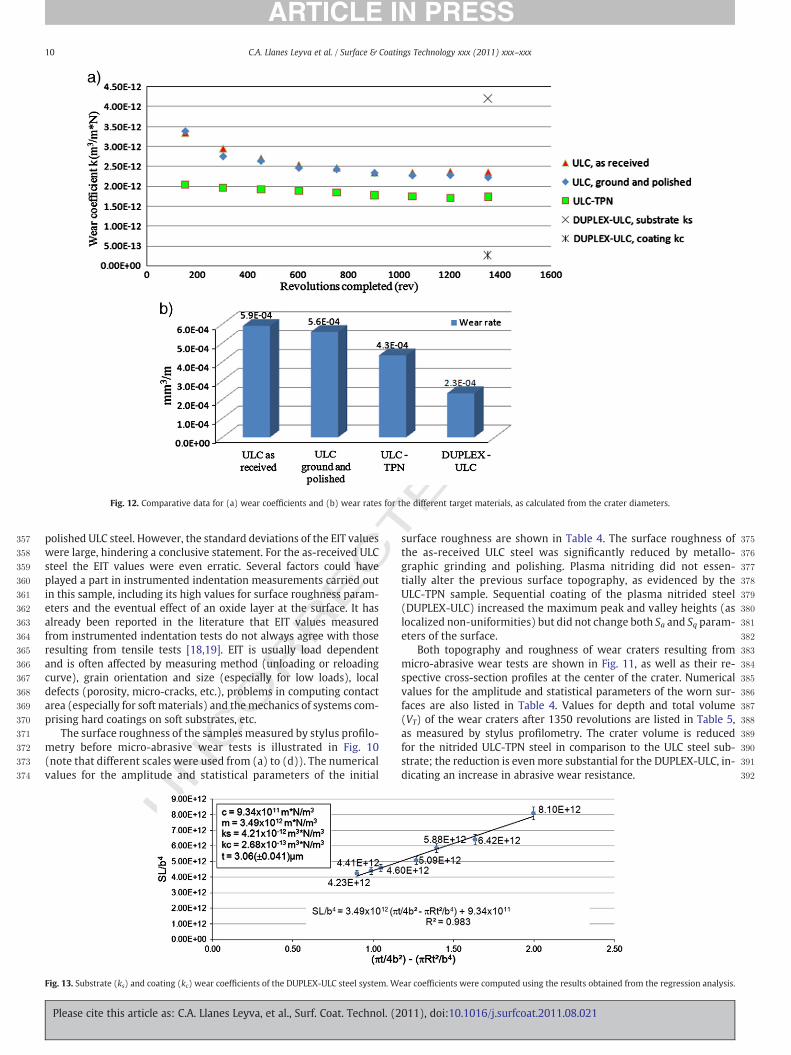
wear rates of different tested samples. For all bulk materials, thewear coefficients were calculated from Eq. (1) as the mean valueover at least three experimental points within the steady state wearregime, where variation coefficients were below 5%. Fig. 13 showsthe results for wear coefficients of the substrate (ks) and coating(kc) in DUPLEX-ULC, computed using the results obtained from theregression analysis according to Eqs. (2)–(5).
Optical micrographs were used to measure crater diametersby numerical image analysis. Figs. 14 and 15 show respectivelythe optical and SEM micrographs of wear crater after 1350 revolu-tions – also detailing the entering (A) and exit (B) zones of the abra-sive slurry – for the DUPLEX-ULC system. No ridges were formedfor the selected test conditions and resultant wear craters wereproperly defined.
Although as-received and polished ULC steel substrates dis-played a remarkable difference in initial surface roughness values,the results obtained for these two materials (Table 7) clearly indi-cated that the difference between their wear crater parameters or
Please cite this article as: C.A. Llanes Leyva, et al., Surf. Coat. Technol. (2
wear coefficients was only marginal. Also, it can be inferred fromTable 7 that the wear coefficient of the nitrided steel was between17 and 36% lower than that of the ULC steel substrate. Moreover,the wear coefficient of the CrAlN coating (kc) was 6.5 times lowerthan that of the nitrided steel. The wear rate was clearly reducedby plasma nitriding and a significant reduction was further achievedafter CrAlN coating, as shown in Fig. 12(b).
The substrate wear coefficient (ks) of the coated sample (DUPLEX-ULC) was 1.78 times larger than the wear coefficient of the untreated,uncoated ULC samples, either as received or polished. This could beexplained due to the methodological differences in determiningboth values: the former from regression analysis; the latter from cal-culations based on the crater diameters or by direct measurement ofthe worn volume by profilometry. The literature [16] also refers thepractical shortcomings for measuring the size of the crater whentesting soft materials, as it is the case for the ULC steel. Apart of themethodological shortcomings, a certain actual increase in the ksvalue of the coated sample could be explained considering the effectof the hard debris being generated during the coating abrasionover the softer substrate as the test progresses [2,16]. If coating fail-ure occurs (crack, chipping and even interfacial failure) the hard
011), doi:10.1016/j.surfcoat.2011.08.021
CT
461
462
463
464
465
466
467
468
469
470
471
472
473
474
475
476
477
478
479
480
481
482
483
484
485
486
487
488
489
490
491
492
493
494
495
496
497
498
499
500
501
502
503
504
505
506
507
508
509
510
511
512
513
514
515
516
517
518
519
520
521
522
523524525526527528529530531532533534535536537538539540541542543544545546547548549550551
552
Fig. 19. Micrographs resulting from Rockwell adhesion test (Mercedes test) forDUPLEX-ULC at different magnifications: a) ×65; b) ×110.
13C.A. Llanes Leyva et al. / Surface & Coatings Technology xxx (2011) xxx–xxx
UNCO
RREdebris can be carried by the abrasive slurry into the entering zone of
the high stressed contact region (Fig. 15, zone A).SEM photomicrographs confirmed that three-body rolling was
the micro-abrasive wear mechanism acting for all target materials,as shown in Fig. 16 for the DUPLEX-ULC. This is a favorable resultfrom an adequate choice of the setup parameters for the weartests: as the same micro-mechanism is acting for all systems underinvestigation, their different wear behaviors come from the intrinsicdifferences of the materials being studied. In a similar way, the aver-age of themeasured friction coefficients for steady state wear regimewas of about the same order for all samples: μ=0.43 for the as-received ULC; μ=0.32 for the ground and polished ULC; μ=0.31for the nitrided system ULC-TPN; and μ=0.28 for the DUPLEX-ULC.Such results indicate that neither the acting micro-mechanism northe friction coefficient would explain the differences in the wearcoefficient and rates. The recorded increase in wear resistance byplasma nitriding and sequential CrAlN coating should be attributedto the already described surface hardening.
EDS results of DUPLEX-ULC – for the regions located as per Fig. 17 –
are shown in Fig. 18 as composition maps and linescans across thewear crater. While the CrAlN coating can be confirmed on top of thesample, it is obvious that the wear crater reached the ferritic substrate.
Fig. 19 shows the micrographs resulting from qualitative Rockwelladhesion test for DUPLEX-ULC. No cracking was observed, indicatinggood adhesion of the coating to the nitrided substrate in the duplexsystem.
Please cite this article as: C.A. Llanes Leyva, et al., Surf. Coat. Technol. (2
ED P
RO
OF
4. Conclusions
In terms of accuracy of wear measurements, direct stylus profilo-metry should be preferred to indirect geometric calculations when-ever possible. Readily feasible for bulk materials, profilometry isnot able to provide separate measurements for the worn volumesin coating and substrate — only the total volume can be measured.The wear crater is not often a perfect spherical surface: its morphol-ogy can be affected by elastic recovery, wear mechanism, resultantroughness, etc. In this work, the difference between profilometricmeasurements and geometric calculations was larger for the mostplastic samples (i.e. untreated ULC steel substrates) and progressive-ly smaller for harder ULC-TPN and DUPLEX-ULC samples. Therefore,additional care should be taken when applying the “spherical crater”model to soft materials.
When compared to untreated ULC steel, nitrided steel ULC-TPNwas 2.6 times harder and DUPLEX-ULC was 3.5 times harder(HV0.1). The wear coefficient of nitrided steel is 36% lower than thatof the steel substrate, both of them calculated for steady state wearregime. Regression analyses were used to calculate both substrate(ks) and coating (kc) wear coefficients of the duplex system, the latterbeing 6.5 times lower than that of the nitrided steel. Coating thickness(3 μm max.) was determined from measurements of inner and outerdiameters of wear scars.
All tested samples exhibited similar three-body rolling wearmechanism and all measured friction coefficients were of the sameorder. On that basis, the recorded increase in wear resistance by plas-ma nitriding and sequential CrAlN coating should be attributed tosurface hardening. Surface hardening processes led to chemical andmicrostrutural changes at the surface as previously described. Underthe tribological conditions selected for this investigation, results indi-cate that it is feasible to manufacture duplex ULC steel by PAPVD, assignificant improvements in wear resistance were achieved by bothnitrided and duplex-treated ULC steels. Duplex treatment is a promis-ing method to enhance the wear resistance of ULC steels and otherlow strength alloys.
References
[1] A. Matthews, A. Leyland, Surf. Coat. Technol. 71 (1995) 88.[2] J.C. Avelar-Batista, E. Spain, G. Fuentes, A. Sola, R. Rodriguez, J. Housden, Surf.
Coat. Technol. 201 (2006) 4335.[3] E. Spain, J.C. Avelar-Batista, M. Letch, J. Houdsen, B. Lerga, Surf. Coat. Technol. 200
(2005) 1507.[4] A.J. Abdalla, V.H. Baggio-Scheid, Corros. Prot. Mater. 25 (3) (2006) 92.[5] A.J. Abdalla, et al., 8º Congreso Iberoamericano De Ingenieria Mecanica, 2007, 10 pp.[6] A.J. Abdalla, et al., Rev. Bras. Aplic. Vác. 23 (1) (2004) 5.[7] B.C. Ferreira, M.A.S. de Oliveira, Bol. Téc. Petrobras, Rio de Janeiro 46 (1) (2003) 167.[8] K.L. Rutherford, I.M. Hutchings, Surf. Coat. Technol. 79 (1996) 231.[9] A. Kassman, S. Jacobson, L. Erickson, P. Hedenqvist, M. Olsson, Surf. Coat. Technol.
50 (1991) 75.[10] K.L. Rutherford, I.M. Hutchings, J. Test. Eval. 25 (I.2) (1997) 250.[11] J.C. Avelar-Batista. Promising duplex coatings for tribological applications at
elevated temperatures. Doctoral thesis in Metallurgical and Mining Engineering,CPGEM, UFMG (2001). 156 pp.
[12] M.G. Gee, A. Gant, I.M. Hutchings, Meas. Good Pract. Guide 57 (November 2002)ISSN: 1368–6550, http://publications.npl.co.uk.
[13] D. N. Allsopp. Abrasive wear of bulk materials and hard coatings. Doctoral thesis.Cambridge: St. John's College, University of Cambridge (1999).
[14] M.G. Gee, A. Gant, I.M. Hutchings, et al., Wear 255 (2003) 1.[15] W.M. da Silva, R. Binderb, J.D.B. de Mello, Wear 258 (2005) 166.[16] R.I. Trezona, I.M. Hutchings, Wear 233–235 (1999) 209.[17] E. Andrzejewska, R. Gonzalez-Arrabal, D. Borsa, D.O. Boerma, Nucl. Instrum.
Methods Phys. Res. B 249 (2006) 838.[18] D.J. Shuman, A.L.M. Costa, M.S. Andrade, Mater. Charact. 58 (2007) 380.[19] N. Chollacoop, L. Li, A. Gouldstone, Mater. Sci. Eng. A 423 (2006) 36.[20] J. Spaková, J. Dusza, A. Juhász, Powder Metall. Prog. 8 (1) (2008).
011), doi:10.1016/j.surfcoat.2011.08.021
Top Related
Copyright © 2022 FDOKUMEN

