


Bahasa
Halaman
Hukum

The Science of the Total Environment 307(2003) 239–257
0048-9697/03/$ - see front matter� 2002 Elsevier Science B.V. All rights reserved.PII: S0048-9697Ž02.00609-5
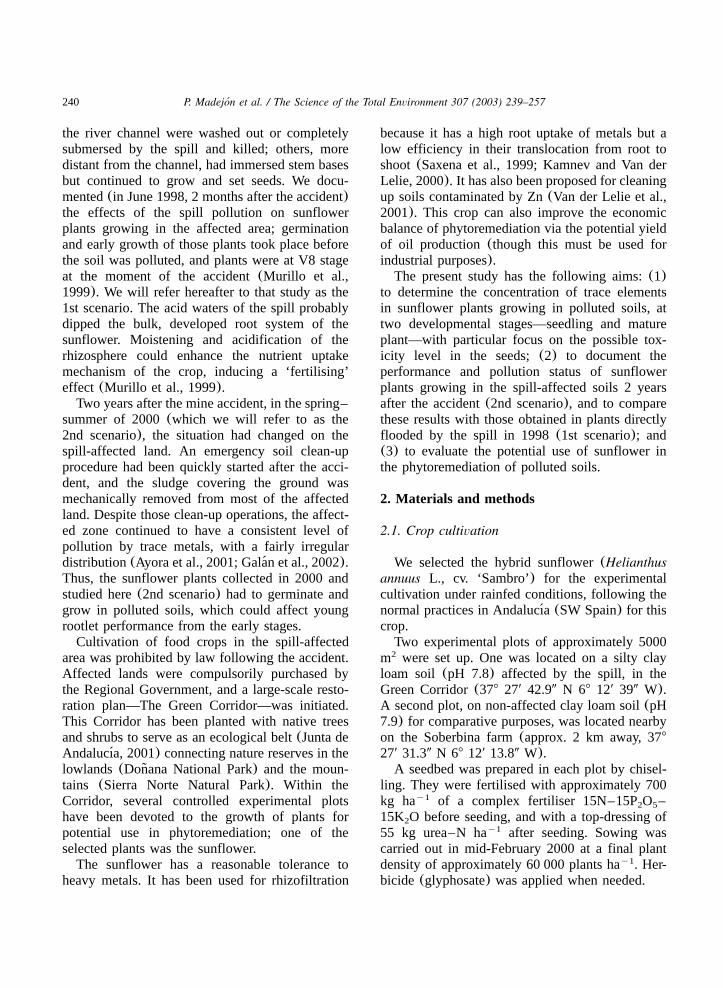
Trace element and nutrient accumulation in sunflower plants twoyears after the Aznalcollar mine spill´
P. Madejon *, J.M. Murillo , T. Maranon , F. Cabrera , M.A. Sorianoa, a a a b´ ˜ ´
IRNAS, CSIC, Instituto de Recursos Naturales y Agrobiologıa de Sevilla, Reina Mercedes Campus, P.O. Box 1052,a ´Sevilla 41080, Spain
Escuela Tecnica Superior de Ingenieros Agronomos y Montes, University of Cordoba, Apartado 3048, Cordoba 14080, Spainb ´ ´ ´ ´
Received 8 July 2002; received in revised form 8 November 2002; accepted 12 November 2002
Abstract
The failure of a tailing pond dam at the Aznalcollar pyrite mine(SW Spain) in April 1998 released a toxic spill´affecting approximately 4300 ha along the Agrio and Guadiamar valleys. Two years later, we have studied yield andconcentration of mineral nutrients and trace elements in sunflower plants grown in the spill-affected soil, and in anadjacent unaffected soil as comparison. The study has been carried out in plants at seedling(V4) and mature(R8)stages. Shoot and root biomass of sunflower seedlings was significantly smaller in the affected soil than in theunaffected soil, but there was no significant difference at the mature stage. Oil production was greater in the spill-affected plants. We have not detected any ‘fertilising’ effect caused by the acid waters of the spill on the mainnutrient(N, P and Ca) acquisition, as documented in 1998 for sunflower plants flooded by the spill. Sunflower plantsgrowing in the spill-affected soil reached adequate levels of nutrients. None of the trace elements measured—As, Cd,Cu, Pb and Tl—reached levels either phytotoxic or toxic for humans or animals in seeds and the above-ground partof the spill-affected plants. We evaluate the potential use of sunflower plants for phytoremediation. The potential forphytoextraction is very low; however, it may be used for soil conservation. The production of oil(usable for industrialpurposes) may add some value to this crop.� 2002 Elsevier Science B.V. All rights reserved.
Keywords: Guadiamar river; Heavy metals;Helianthus annuus; Pyrite tailings
1. Introduction
The failure of a tailing pond dam at the pyritemine of Aznalcollar (S. Spain) in April 1998´released a toxic spill of ca. 5=10 m , affecting a6 3
total of 4286 ha along the Agrio and Guadiamarriver valleys. The slurry comprised of approxi-mately 2=10 m of tailing (solid phase) and 3–6 3
*Corresponding author. Tel.:q34-95-462-4711; fax:q34-95-462-4002.
E-mail address: [email protected](P. Madejon).´
4=10 m of polluted acid water. Soil pollution6 3
by tailings tended to diminish below the 10-cmdepth (Simon et al., 1999), but polluted water´entered deeper into the soil(Ayora et al., 2001).A long strip, approximately 300–400-m wide and40 km in length, was covered by a layer of toxicblack sludge 2–30-cm thick on both sides of theriver channel(Grimalt et al., 1999).
The river floodplain was occupied mainly bycroplands and orchards. The effects of the spill oncrop plants varied with location. Many plants near
240 P. Madejon et al. / The Science of the Total Environment 307 (2003) 239–257´
the river channel were washed out or completelysubmersed by the spill and killed; others, moredistant from the channel, had immersed stem basesbut continued to grow and set seeds. We docu-mented(in June 1998, 2 months after the accident)the effects of the spill pollution on sunflowerplants growing in the affected area; germinationand early growth of those plants took place beforethe soil was polluted, and plants were at V8 stageat the moment of the accident(Murillo et al.,1999). We will refer hereafter to that study as the1st scenario. The acid waters of the spill probablydipped the bulk, developed root system of thesunflower. Moistening and acidification of therhizosphere could enhance the nutrient uptakemechanism of the crop, inducing a ‘fertilising’effect (Murillo et al., 1999).
Two years after the mine accident, in the spring–summer of 2000(which we will refer to as the2nd scenario), the situation had changed on thespill-affected land. An emergency soil clean-upprocedure had been quickly started after the acci-dent, and the sludge covering the ground wasmechanically removed from most of the affectedland. Despite those clean-up operations, the affect-ed zone continued to have a consistent level ofpollution by trace metals, with a fairly irregulardistribution(Ayora et al., 2001; Galan et al., 2002).´Thus, the sunflower plants collected in 2000 andstudied here(2nd scenario) had to germinate andgrow in polluted soils, which could affect youngrootlet performance from the early stages.
Cultivation of food crops in the spill-affectedarea was prohibited by law following the accident.Affected lands were compulsorily purchased bythe Regional Government, and a large-scale resto-ration plan—The Green Corridor—was initiated.This Corridor has been planted with native treesand shrubs to serve as an ecological belt(Junta deAndalucıa, 2001) connecting nature reserves in the´lowlands (Donana National Park) and the moun-˜tains (Sierra Norte Natural Park). Within theCorridor, several controlled experimental plotshave been devoted to the growth of plants forpotential use in phytoremediation; one of theselected plants was the sunflower.
The sunflower has a reasonable tolerance toheavy metals. It has been used for rhizofiltration
because it has a high root uptake of metals but alow efficiency in their translocation from root toshoot(Saxena et al., 1999; Kamnev and Van derLelie, 2000). It has also been proposed for cleaningup soils contaminated by Zn(Van der Lelie et al.,2001). This crop can also improve the economicbalance of phytoremediation via the potential yieldof oil production (though this must be used forindustrial purposes).
The present study has the following aims:(1)to determine the concentration of trace elementsin sunflower plants growing in polluted soils, attwo developmental stages—seedling and matureplant—with particular focus on the possible tox-icity level in the seeds;(2) to document theperformance and pollution status of sunflowerplants growing in the spill-affected soils 2 yearsafter the accident(2nd scenario), and to comparethese results with those obtained in plants directlyflooded by the spill in 1998(1st scenario); and(3) to evaluate the potential use of sunflower inthe phytoremediation of polluted soils.
2. Materials and methods
2.1. Crop cultivation
We selected the hybrid sunflower(Helianthusannuus L., cv. ‘Sambro’) for the experimentalcultivation under rainfed conditions, following thenormal practices in Andalucıa(SW Spain) for this´crop.
Two experimental plots of approximately 5000m were set up. One was located on a silty clay2
loam soil (pH 7.8) affected by the spill, in theGreen Corridor(378 279 42.90 N 68 129 390 W).A second plot, on non-affected clay loam soil(pH7.9) for comparative purposes, was located nearbyon the Soberbina farm(approx. 2 km away, 378279 31.30 N 68 129 13.80 W).
A seedbed was prepared in each plot by chisel-ling. They were fertilised with approximately 700kg ha of a complex fertiliser 15N–15P O –y1
2 5
15K O before seeding, and with a top-dressing of2
55 kg urea–N ha after seeding. Sowing wasy1
carried out in mid-February 2000 at a final plantdensity of approximately 60 000 plants ha . Her-y1
bicide (glyphosate) was applied when needed.
241P. Madejon et al. / The Science of the Total Environment 307 (2003) 239–257´
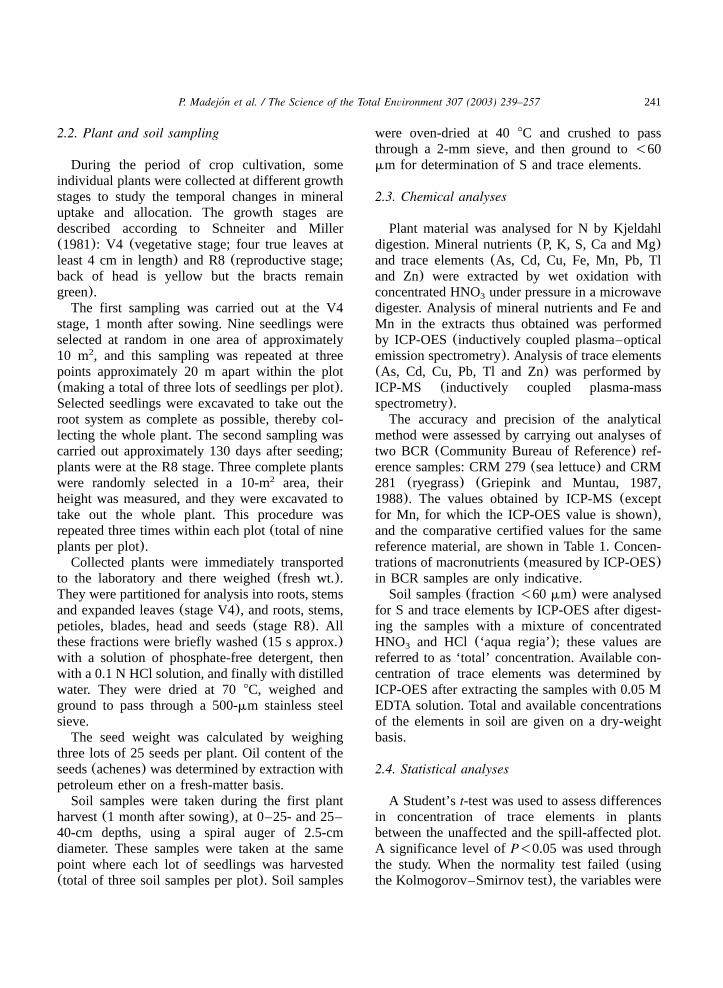
2.2. Plant and soil sampling
During the period of crop cultivation, someindividual plants were collected at different growthstages to study the temporal changes in mineraluptake and allocation. The growth stages aredescribed according to Schneiter and Miller(1981): V4 (vegetative stage; four true leaves atleast 4 cm in length) and R8(reproductive stage;back of head is yellow but the bracts remaingreen).
The first sampling was carried out at the V4stage, 1 month after sowing. Nine seedlings wereselected at random in one area of approximately10 m , and this sampling was repeated at three2
points approximately 20 m apart within the plot(making a total of three lots of seedlings per plot).Selected seedlings were excavated to take out theroot system as complete as possible, thereby col-lecting the whole plant. The second sampling wascarried out approximately 130 days after seeding;plants were at the R8 stage. Three complete plantswere randomly selected in a 10-m area, their2
height was measured, and they were excavated totake out the whole plant. This procedure wasrepeated three times within each plot(total of nineplants per plot).
Collected plants were immediately transportedto the laboratory and there weighed(fresh wt.).They were partitioned for analysis into roots, stemsand expanded leaves(stage V4), and roots, stems,petioles, blades, head and seeds(stage R8). Allthese fractions were briefly washed(15 s approx.)with a solution of phosphate-free detergent, thenwith a 0.1 N HCl solution, and finally with distilledwater. They were dried at 708C, weighed andground to pass through a 500-mm stainless steelsieve.
The seed weight was calculated by weighingthree lots of 25 seeds per plant. Oil content of theseeds(achenes) was determined by extraction withpetroleum ether on a fresh-matter basis.
Soil samples were taken during the first plantharvest(1 month after sowing), at 0–25- and 25–40-cm depths, using a spiral auger of 2.5-cmdiameter. These samples were taken at the samepoint where each lot of seedlings was harvested(total of three soil samples per plot). Soil samples
were oven-dried at 408C and crushed to passthrough a 2-mm sieve, and then ground to-60mm for determination of S and trace elements.
2.3. Chemical analyses
Plant material was analysed for N by Kjeldahldigestion. Mineral nutrients(P, K, S, Ca and Mg)and trace elements(As, Cd, Cu, Fe, Mn, Pb, Tland Zn) were extracted by wet oxidation withconcentrated HNO under pressure in a microwave3
digester. Analysis of mineral nutrients and Fe andMn in the extracts thus obtained was performedby ICP-OES(inductively coupled plasma–opticalemission spectrometry). Analysis of trace elements(As, Cd, Cu, Pb, Tl and Zn) was performed byICP-MS (inductively coupled plasma-massspectrometry).
The accuracy and precision of the analyticalmethod were assessed by carrying out analyses oftwo BCR (Community Bureau of Reference) ref-erence samples: CRM 279(sea lettuce) and CRM281 (ryegrass) (Griepink and Muntau, 1987,1988). The values obtained by ICP-MS(exceptfor Mn, for which the ICP-OES value is shown),and the comparative certified values for the samereference material, are shown in Table 1. Concen-trations of macronutrients(measured by ICP-OES)in BCR samples are only indicative.
Soil samples(fraction-60 mm) were analysedfor S and trace elements by ICP-OES after digest-ing the samples with a mixture of concentratedHNO and HCl (‘aqua regia’); these values are3
referred to as ‘total’ concentration. Available con-centration of trace elements was determined byICP-OES after extracting the samples with 0.05 MEDTA solution. Total and available concentrationsof the elements in soil are given on a dry-weightbasis.
2.4. Statistical analyses
A Student’st-test was used to assess differencesin concentration of trace elements in plantsbetween the unaffected and the spill-affected plot.A significance level ofP-0.05 was used throughthe study. When the normality test failed(usingthe Kolmogorov–Smirnov test), the variables were
242 P. Madejon et al. / The Science of the Total Environment 307 (2003) 239–257´
Table 1Analysis of BCR reference samples(for macronutrients, mean value"S.D., mg g dry matter; for trace elements, mean val-y1
ues"95% confidence interval, mg kg dry matter)y1 a
Element CRM 279(sea lettuce) CRM 281(ryegrass)
Certified Experimental Certified Experimental
N (20.5"0.4) 17.0"0.7 (33.2"0.5) 31.7"1.3P (1.80"0.04) 1.50"0.08 (2.30"0.05) 2.15"0.08K (13.9"0.9) 13.0"1.5 (35.2"2.7) 31.6"2.2Ca (27.4"1.1) 30.8"4.1 (7.20"0.09) 6.75"0.13Mg (14.4"0.8) 14.1"1.2 (1.66"0.02) 1.59"0.02
As 3.09"0.20 2.69"0.11 0.057"0.004 0.118"0.014Cd 0.274"0.022 0.202"0.007 0.120"0.003 0.117"0.005Cu 13.14"0.37 11.63"0.73 9.65"0.38 9.76"0.09Mn (2030"31.5) 1758"64.8 81.6"2.6 76.7"0.4Pb 13.48"0.36 12.47"1.09 2.38"0.11 2.29"0.07Zn 51.3"1.2 52.18"3.29 31.5"1.4 32.7"0.2
Values in parentheses are indicatives. Experimental values are calculated fromns6 (sea lettuce) andns5 (ryegrass). Indicativea
value for N in sea lettuce was determined by Dumas combustion.
logarithmically transformed; normality was thenpassed in all cases. The program SPSS(1999) forWindows was used for these statistical analyses.
3. Results and discussion
3.1. Soil pollution
The soil of the experimental plot located in thespill-affected area showed a significant level ofpollution by trace elements(Table 2). In particular,the top layer(0–25-cm depth) had much higherconcentrations of available Zn(18-fold), As (14-fold) and Cd(8-fold) than the non-affected soil.
Sulfur content in the pyrite-originated sludgewas extremely high, being within a range of 35–40% (Grimalt et al., 1999). Thus, a high S contentin the soil may be indicative of the presence ofsludge. In fact, the total S content of the topsoillayer in the spill-affected plot was ca. 23-fold thatin the non-affected soil. The mean value of S forthe polluted soil(0.46%) was outside the rangefor normal soils (maximum of 0.16%) and ca.seven-fold that of the median(0.07%) reported byBowen(1979, see Table 2).
Iron content in the sludge was also high, butthere were no significant differences in Fe concen-tration between affected and non-affected soils(data not shown). Manganese was not a polluting
element in the sludge(Table 2). The available Mnconcentration in the spill-affected soil(at 0–25-cm depth) was significantly lower than in the non-affected soil(Table 2).
Zinc was one of the highest-polluting elementsin the sludge, having a concentration up to 11 000mg kg (Cabrera et al., 1999). Consequently,y1
available Zn in the topsoil of the spill-affected plotwas approximately 18-fold that at the non-affectedsite (Table 2). The high value of Zn total concen-tration (209 mg kg ) in the same topsoil wasy1
almost double the median value for normal soils,although within the normal range(Bowen, 1979,see Table 2). Copper was another polluting ele-ment in the pyrite mine sludge, having a concen-tration of up to 2000 mg kg (Cabrera et al.,y1
1999). The pollution of the topsoil in the experi-mental plot was also significant, but less severethan for Zn: available Cu was almost double thatin non-affected soil. Murillo et al.(1999) sampledthe soil (removing the sludge layer) 2 monthsafter the mine spill, and found a similar trend ofhigher available(DTPA-extracted) Zn (14-fold)and Cu(six-fold) in the affected soil than in theadjacent non-affected soil. Two years later, asshown by this study, the topsoil remains polluted.
Three potentially toxic elements had a highconcentration in the mine sludge: lead(8633 mgkg ), arsenic(3818 mg kg ) and cadmium(21y1 y1
243P.
Madejon
etal.
/T
heScience
ofthe
TotalE
nvironment
307(2003)
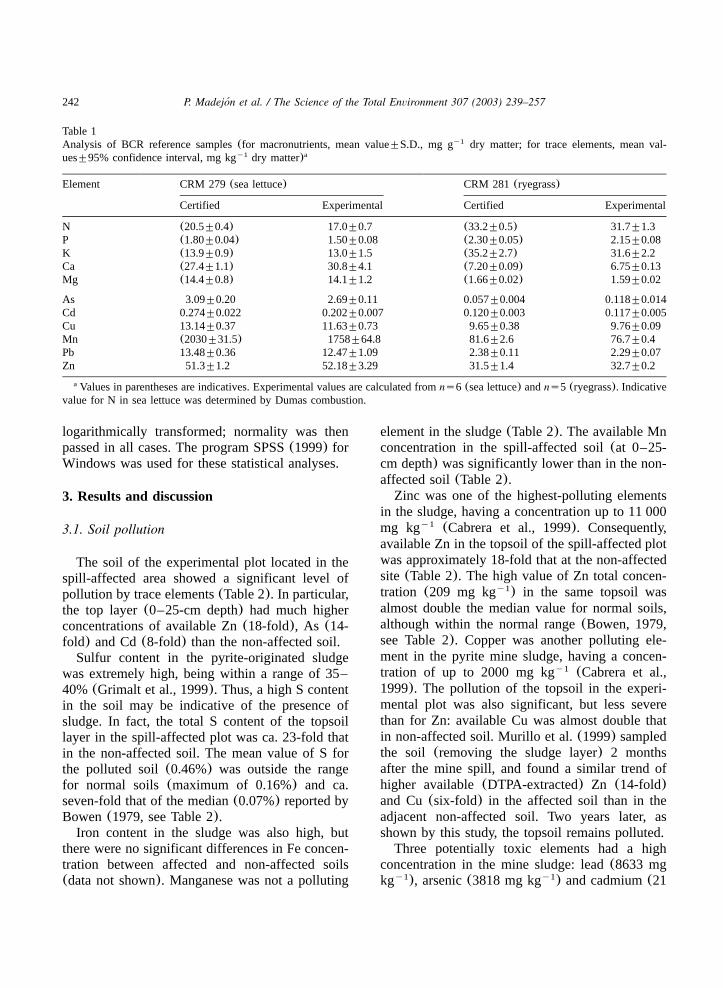
239–257´Table 2
Total and available(EDTA) concentrations of S and trace elements in the affected and unaffected soils(mean"S.E. of three samples)
Depth(cm) Fraction Soil S (%) Mn (mg kg )y1 Cu (mg kg )y1 Zn (mg kg )y1 As (mg kg )y1 Cd (mg kg )y1 Pb (mg kg )y1
0–25 Total Affected 0.46"0.04* 430"19* 40.3"1.9* 209"18* 65.6"6.3* – 113"11*
Unaffected 0.02"0.002 511"19 15.9"0.4 60.6"0.8 10.4"0.8 – 29.5"4.3EDTA Affected – 23.9"0.9* 7.94"0.32* 39.5"5.1* 0.31"0.01* 0.24"0.03* 19.7"1.8*
Unaffected – 119"35 4.02"0.58 2.2"0.06 0.04"0.02 0.03"0.001 9.9"2.6
25–40 Total Affected 0.16"0.05* 426"32 22.3"3.8 99.5"23.4 24.1"7.9 – 42.3"12.8Unaffected 0.02"0.001 501"15 15.0"0.01 61.3"1.3 11.4"1.3 – 32.4"6.1
EDTA Affected – 23.0"1.8 4.07"0.61 13.5"5.6 0.01"0.001 0.09"0.03 7.9"2.1Unaffected – 75.0"35 3.69"0.75 2.1"0.1 -0.01 0.03"0.003 9.7"2.7
Normal Median 0.07 1000 30 90 6 0.35 35soilsa (range) (0.003–0.16) (20–10000) (2–250) (1–900) (0.1–40) (0.01–2) (2–300)
Toxic for Range – 1500–3000 60–125 70–400 15–50 3–8 100–400plantsb
Bowen(1979).a
Kabata-Pendias and Pendias(1992).b
Significant differences from the unaffected soil(P-0.05 of Student’st-test) are marked with asterisks.*
244 P. Madejon et al. / The Science of the Total Environment 307 (2003) 239–257´
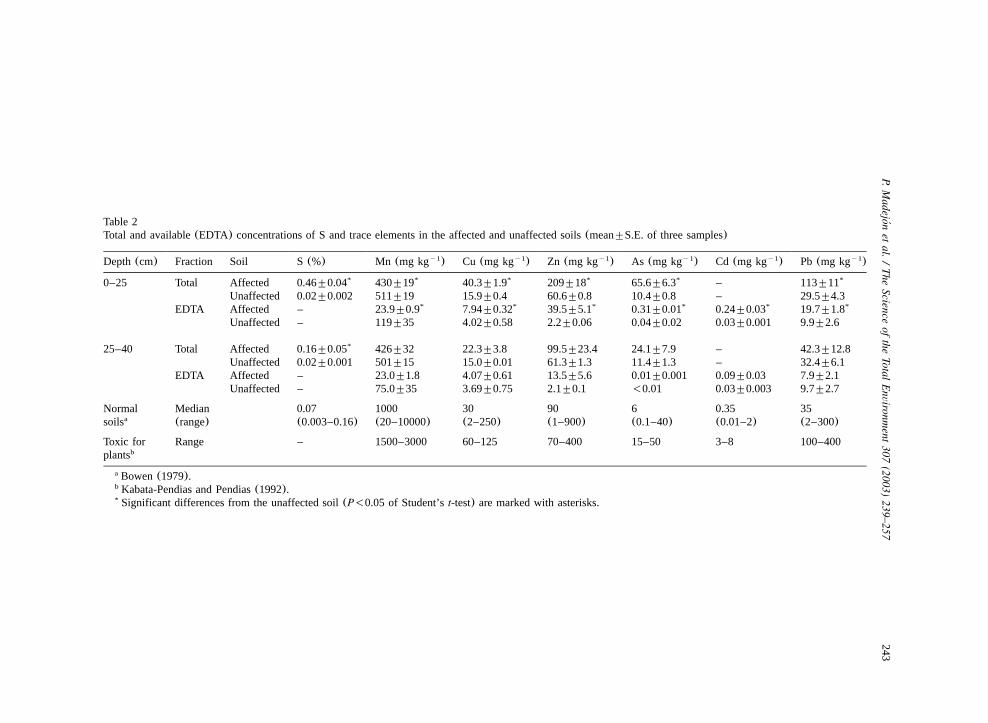
Table 3Height, above-ground and root mass, 1000 seeds weight and seed and oil production per plant(mean"S.E. of three samples forV4 and nine samples for R8, dry matter) of sunflower plants growing in the spill-affected and unaffected soils
Crop stage Soil Height Above-ground mass Root mass Seed weight Seed production Oil production(cm) (g) (g) (mg) (g) (%)
V4 Affected – 0.74"0.04* 0.08"0.004* – – –Unaffected – 1.07"0.10 0.13"0.01 – – –
R8 Affected 131"3 390"29 27.0"0.9 96.5"4.1 102"4 35.1"0.7*Unaffected 136"3 404"35 28.8"1.6 88.0"3.4 98.6"3.5 32.9"0.6
Significant differences from the unaffected soil(P-0.05 of Student’st-test) are marked with asterisks.*
mg kg ) (values for the sludge layer in the samey1
study area from Murillo et al., 1999). Consequent-ly, the values for available(EDTA-extracted) Pb,As and Cd in the spill-affected topsoil were higher(2=, 14= and 8=, respectively), than in the non-affected experimental plot(Table 2). Comparisonwith the soil pollution in the early period after themain spill shows that the pattern of pollution(increase in relation to the unaffected soil) byavailable Pb and Cd had not changed significantly.Even worse, the pollution derived from availableAs had increased in 2000(2nd scenario).
Soil pollution in the experimental plot locatedin the spill-affected area is still high for Zn, As,Cd, Pb and Cu, despite the clean-up and remedia-tion operations of the last 2 years. Soil pollutioncould have been much worse if the thick sludgelayer had not been removed a few months afterthe accident, in a complex and expensive operation(see Cabrera et al., 2003 for a general view of thesoil pollution in the Guadiamar valley). However,at some sites the cleaning machinery buried partof the sludge, previously confined to the topsoil,and increased the concentration of metals in thearable layer of the soil(Madejon et al., 2002).´
3.2. Plant growth and performance
Soil pollution significantly retarded early growthof sunflower, but the final harvest was not signif-icantly affected(Table 3). The above-ground bio-mass and root mass of seedlings(stage V4) weresignificantly smaller in the spill-affected soil.Roots of the affected plants were 1.6-fold smaller,and shoots 1.4-fold smaller. In general, toxic metalions primarily restrict root growth(Rengel, 1997),
thereby impairing nutrient uptake and reducingshoot growth.
Mature plants (R8 stage) reached a similarheight and above-ground and root mass in bothsoil conditions(Table 3). Apparently, sunflowerplants were able to overcome physiological con-straints imposed by soil pollution during earlygrowth. Moreover, yield components were some-what greater in plants grown in spill-affected soil;in particular, the oil production was significantlyhigher than at the non-affected site(Table 3). Thisfavourable result supports the potential use ofsunflower for phytoremediation, providing the add-ed value of biomass and oil(see an overview ofphytoremediation perspectives in Van der Lelie etal., 2001).
The sunflower plants flooded by the spill in1998 also produced slightly higher seed mass thannearby plants in non-affected soils: mean of 136gyplant vs. 127 gyplant (Murillo et al., 1999).These results, in both the 1st and 2nd scenarios,support the ability of sunflower to tolerate soilpollution and to produce seeds under adverseconditions.
3.3. Plant chemical composition
Although the plant mass was not significantlyaffected by soil pollution, the chemical composi-tion of the plant organs in sunflowers grown inspill-affected soil differed significantly from thatin those at the non-affected site(Tables 4 and 5).We now discuss the main effects of soil pollutionon the chemical composition of sunflower plants,separating three groups of elements:(1) macro-nutrients(N, P, K, S, Ca and Mg); (2) micronu-
245P.
Madejon
etal.
/T
heScience
ofthe
TotalE
nvironment
307(2003)
239–257´
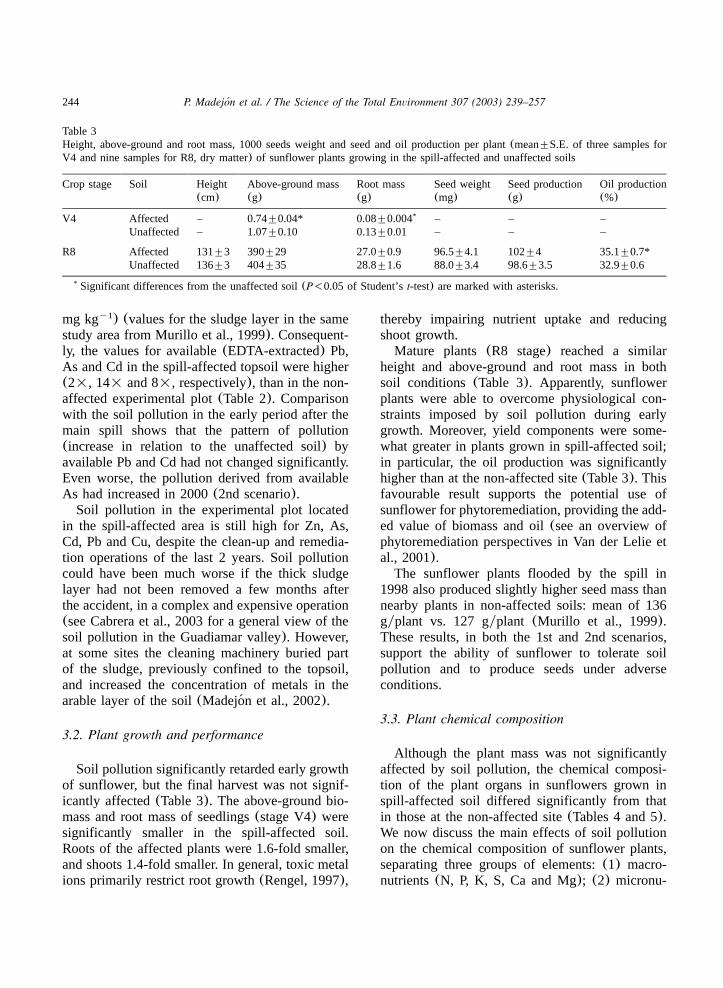
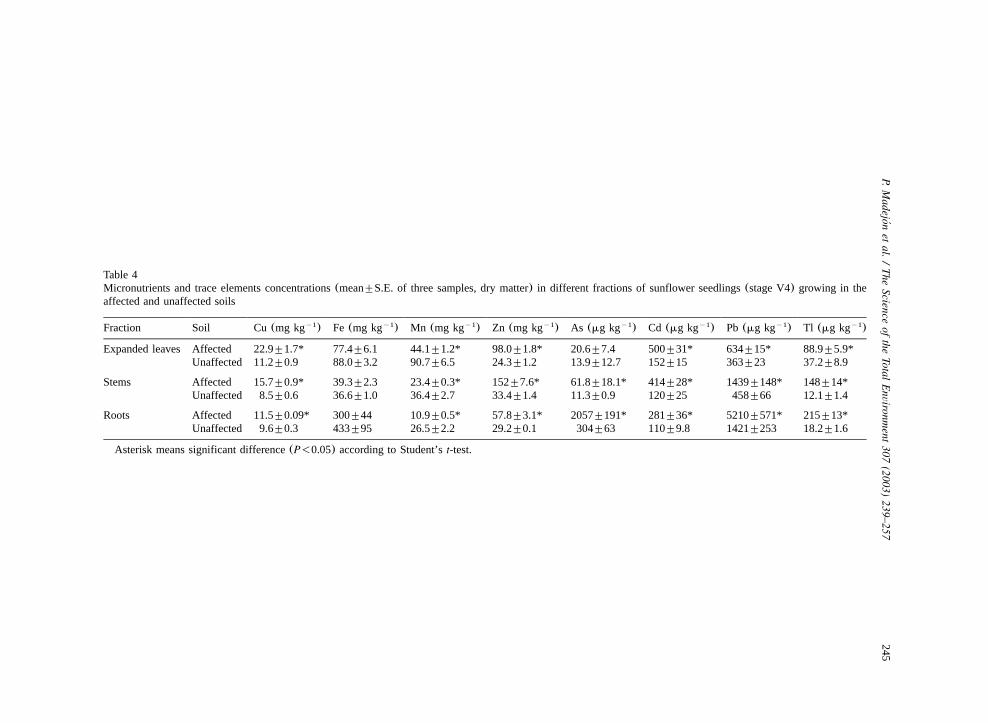
Table 4Micronutrients and trace elements concentrations(mean"S.E. of three samples, dry matter) in different fractions of sunflower seedlings(stage V4) growing in theaffected and unaffected soils
Fraction Soil Cu (mg kg )y1 Fe (mg kg )y1 Mn (mg kg )y1 Zn (mg kg )y1 As (mg kg )y1 Cd (mg kg )y1 Pb (mg kg )y1 Tl (mg kg )y1
Expanded leaves Affected 22.9"1.7* 77.4"6.1 44.1"1.2* 98.0"1.8* 20.6"7.4 500"31* 634"15* 88.9"5.9*Unaffected 11.2"0.9 88.0"3.2 90.7"6.5 24.3"1.2 13.9"12.7 152"15 363"23 37.2"8.9
Stems Affected 15.7"0.9* 39.3"2.3 23.4"0.3* 152"7.6* 61.8"18.1* 414"28* 1439"148* 148"14*Unaffected 8.5"0.6 36.6"1.0 36.4"2.7 33.4"1.4 11.3"0.9 120"25 458"66 12.1"1.4
Roots Affected 11.5"0.09* 300"44 10.9"0.5* 57.8"3.1* 2057"191* 281"36* 5210"571* 215"13*Unaffected 9.6"0.3 433"95 26.5"2.2 29.2"0.1 304"63 110"9.8 1421"253 18.2"1.6
Asterisk means significant difference(P-0.05) according to Student’st-test.
246P.
Madejon
etal.
/T
heScience
ofthe
TotalE
nvironment
307(2003)
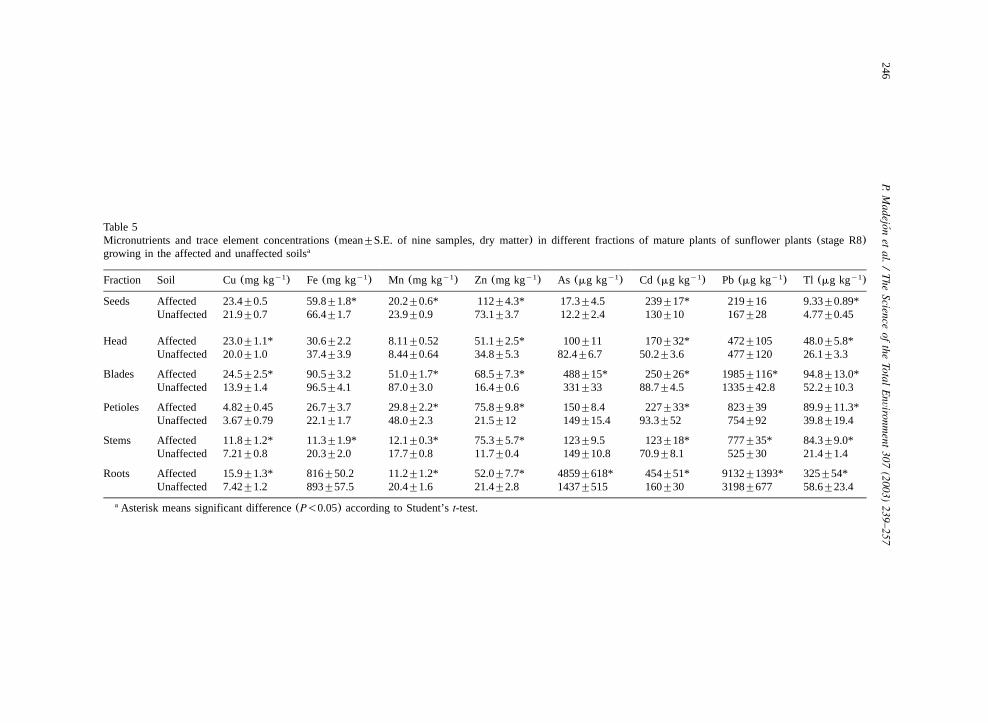
239–257´Table 5
Micronutrients and trace element concentrations(mean"S.E. of nine samples, dry matter) in different fractions of mature plants of sunflower plants(stage R8)growing in the affected and unaffected soilsa
Fraction Soil Cu (mg kg )y1 Fe (mg kg )y1 Mn (mg kg )y1 Zn (mg kg )y1 As (mg kg )y1 Cd (mg kg )y1 Pb (mg kg )y1 Tl (mg kg )y1
Seeds Affected 23.4"0.5 59.8"1.8* 20.2"0.6* 112"4.3* 17.3"4.5 239"17* 219"16 9.33"0.89*Unaffected 21.9"0.7 66.4"1.7 23.9"0.9 73.1"3.7 12.2"2.4 130"10 167"28 4.77"0.45
Head Affected 23.0"1.1* 30.6"2.2 8.11"0.52 51.1"2.5* 100"11 170"32* 472"105 48.0"5.8*Unaffected 20.0"1.0 37.4"3.9 8.44"0.64 34.8"5.3 82.4"6.7 50.2"3.6 477"120 26.1"3.3
Blades Affected 24.5"2.5* 90.5"3.2 51.0"1.7* 68.5"7.3* 488"15* 250"26* 1985"116* 94.8"13.0*Unaffected 13.9"1.4 96.5"4.1 87.0"3.0 16.4"0.6 331"33 88.7"4.5 1335"42.8 52.2"10.3
Petioles Affected 4.82"0.45 26.7"3.7 29.8"2.2* 75.8"9.8* 150"8.4 227"33* 823"39 89.9"11.3*Unaffected 3.67"0.79 22.1"1.7 48.0"2.3 21.5"12 149"15.4 93.3"52 754"92 39.8"19.4
Stems Affected 11.8"1.2* 11.3"1.9* 12.1"0.3* 75.3"5.7* 123"9.5 123"18* 777"35* 84.3"9.0*Unaffected 7.21"0.8 20.3"2.0 17.7"0.8 11.7"0.4 149"10.8 70.9"8.1 525"30 21.4"1.4
Roots Affected 15.9"1.3* 816"50.2 11.2"1.2* 52.0"7.7* 4859"618* 454"51* 9132"1393* 325"54*Unaffected 7.42"1.2 893"57.5 20.4"1.6 21.4"2.8 1437"515 160"30 3198"677 58.6"23.4
Asterisk means significant difference(P-0.05) according to Student’st-test.a
247P. Madejon et al. / The Science of the Total Environment 307 (2003) 239–257´
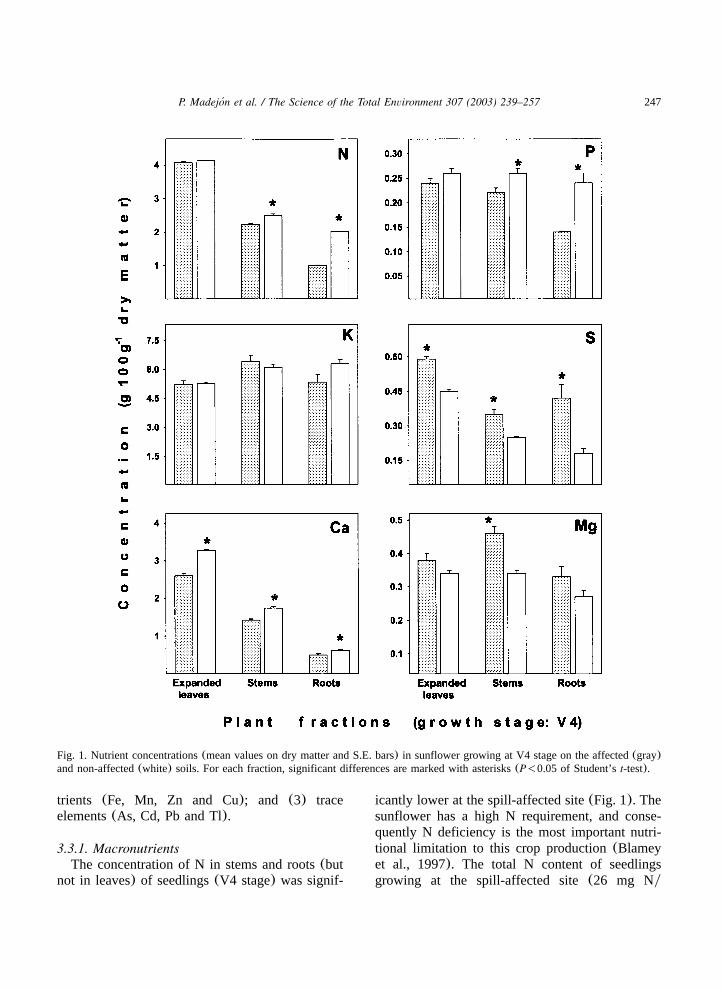
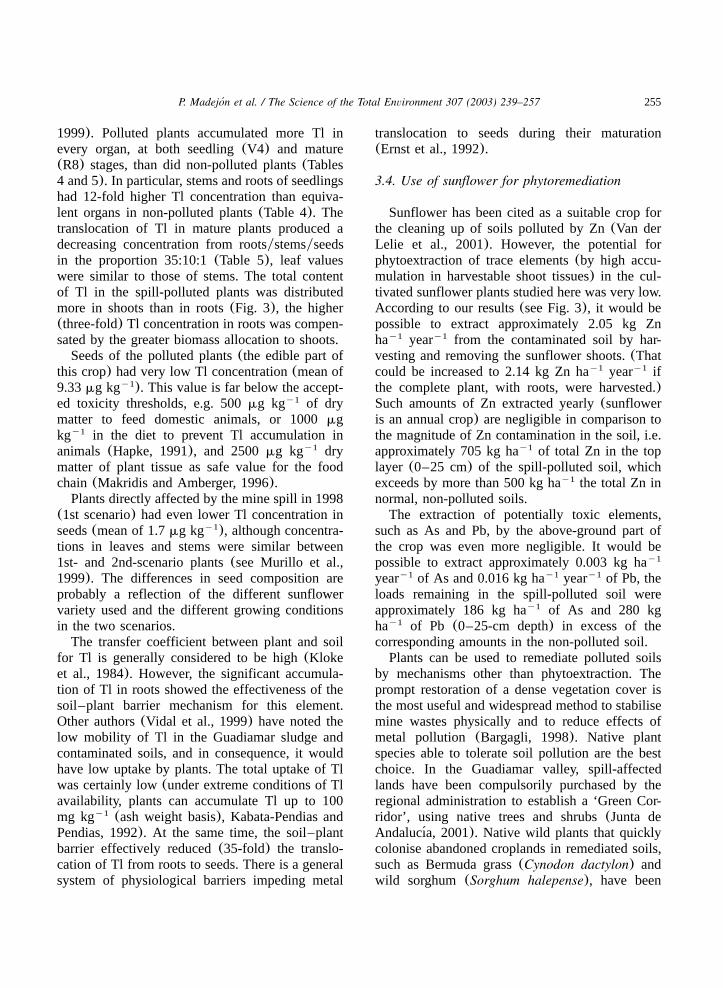
Fig. 1. Nutrient concentrations(mean values on dry matter and S.E. bars) in sunflower growing at V4 stage on the affected(gray)and non-affected(white) soils. For each fraction, significant differences are marked with asterisks(P-0.05 of Student’st-test).
trients (Fe, Mn, Zn and Cu); and (3) traceelements(As, Cd, Pb and Tl).
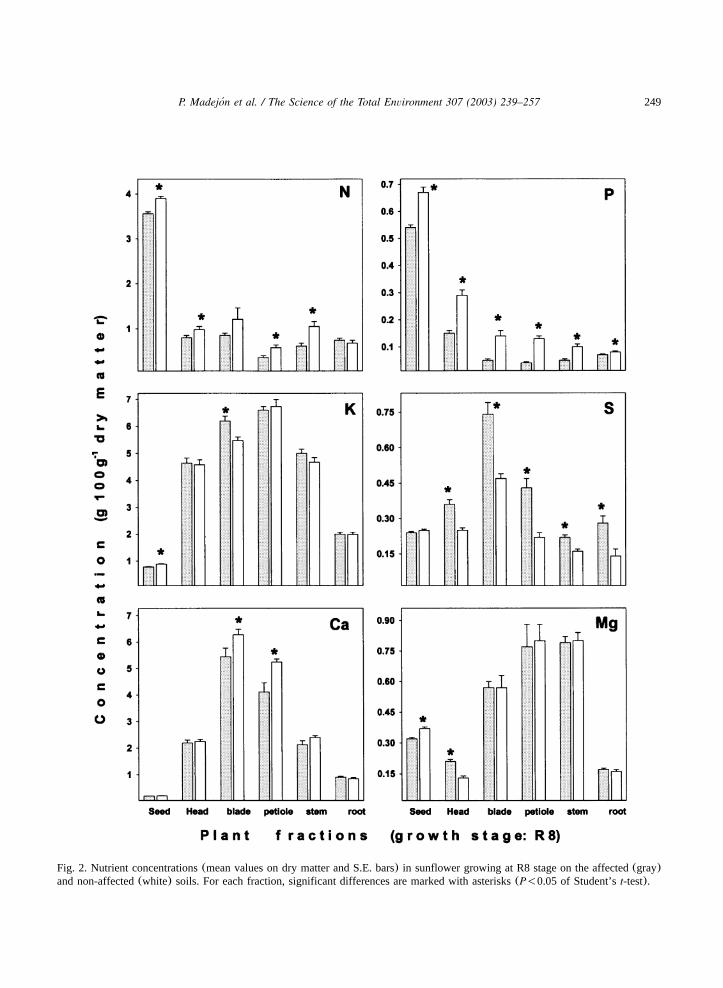
3.3.1. MacronutrientsThe concentration of N in stems and roots(but
not in leaves) of seedlings(V4 stage) was signif-
icantly lower at the spill-affected site(Fig. 1). Thesunflower has a high N requirement, and conse-quently N deficiency is the most important nutri-tional limitation to this crop production(Blameyet al., 1997). The total N content of seedlingsgrowing at the spill-affected site(26 mg Ny
248 P. Madejon et al. / The Science of the Total Environment 307 (2003) 239–257´
seedling) was lower than at the non-affected site(41 mg Nyseedling), due to their reduced growthat that stage.
Soil pollution caused a reduced root growth atearly stages and, in consequence, a lower N uptake.At more advanced stages, N uptake seemed to beless limiting. The root system mass reached atstage R8 was similar for plants in polluted andnon-affected soils(Table 3); probably they wereable to explore deeper horizons in the soil, whichwere less polluted(Table 2).
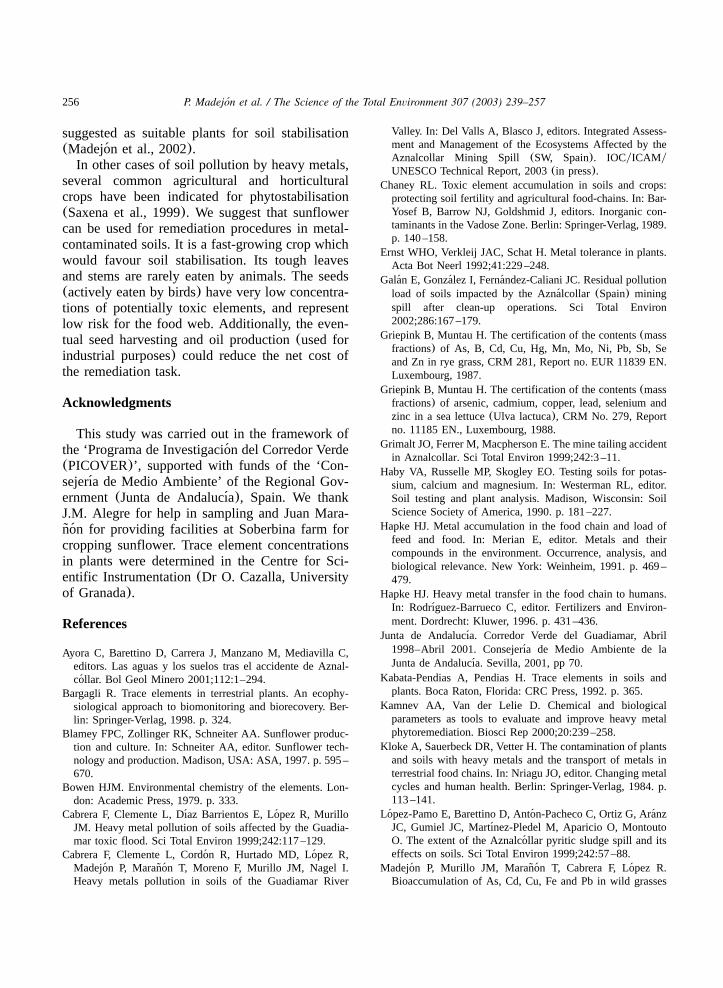
The N concentrations in leaf blades and rootsin mature plants(R8 stage) grown in pollutedsoils were not significantly different from those atthe non-affected site(Fig. 2). However, the struc-tural (stem and petiole) and reproductive(headand seed) organs did have a lower N concentrationin the polluted plants(Fig. 2). The total(mean)value of N accumulated in the plant mass in thepolluted soil was 6.79 g, compared with 8.05 g inthe non-affected soil(non-significantly differentby t-test); and total N content in seeds was 3.64gyplant in polluted soil compared with a similar3.84 gyplant in the non-polluted soil.
Nitrogen concentration in seeds was relativelyhigh (greater than 3.5 g N 100 g dry matter) iny1
the polluted soil, and seems to indicate adequateN nutrition, once the seedling stage is left behind.Blamey et al.(1997) reported a range of 2.58–3g N 100 g dry matter for sunflower seeds.y1
Phosphorus deficiency is probably the second(after N) major nutrient limitation to sunflowerproduction. At the Guadiamar spill-affected site, Pacquisition by sunflower plants was impaired. Pol-luted seedlings(V4 stage) had lower P concentra-tion in roots and stems(but not in leaves) thandid non-polluted ones(Fig. 1)—a trend similar tothe N accumulation pattern. Polluted mature plants(R8 stage) had consistently lower P concentrationin every organ compared with non-polluted plants(Fig. 2). Leaf blades and petioles were particularlydeprived of P(approx. three-fold lower), comparedwith non-polluted plants. The P uptake in thewhole plant was 1.01 g in the polluted soil,significantly lower than at the non-affected site(mean of 1.57 g Pyplant).
Sunflower seeds in the polluted soil had 0.54 gPy100 g dry matter. This value was significantly
lower than in the non-polluted soil(mean of 0.67g Py100 g dry matter); however, it is within therange of P concentration for normal sunflowercrop (approx. 0.4%), and well above the criticalconcentration (0.2%) indicating P deficiency(Reuter and Robinson, 1997). Total P accumula-tion in seeds of polluted plants was 0.55 gyplant,significantly lower than at the non-polluted site(mean of 0.66 g Pyplant).
Comparing the 1st(1998) and 2nd (2000)scenarios, we observe a reverse pattern. Seeds ofthe spill-flooded plants had higher concentrationsof N and P than those of non-polluted plants(Murillo et al., 1999), whereas plants grown inpolluted and remediated soils 2 years later hadlower N and P in their seeds than did non-pollutedplants (as shown above, Fig. 2). Murillo et al.(1999) interpreted the increased N and P acquisi-tion by the spill-affected plants as an indirect resultof soil moistening and acidification, derived fromthe large amount of acid water supplied by thespill (fertilising effect); 2 years later, plants havegrown in the remediated soil under rainfed condi-tions, without supplemental watering.
The influence of the sludge pollution on potas-sium nutrition was not very pronounced, at eitherthe seedling(V4, Fig. 1) or the mature(R8, Fig.2) stages. The high concentration of K in everyplant organ at the seedling(V4) and mature(R8)stages, in both soil conditions, may be an effectof ‘luxury’ consumption of this element. Plantstend to uptake and accumulate an excess of Kwhen it is abundant in the soil(see overview inMarschner, 1995, and reports for sunflower inMathers and Stewart, 1982). Acetate-extractable Kin the soil of both plots(0–25 cm) was approxi-mately 300 mg kg after fertilisation with they1
NPK complex fertiliser, a very high value accord-ing to most data in the literature(Haby et al.,1990).
The concentration of sulfur was significantlyhigher in every organ of the polluted seedlings(Fig. 1), and of the polluted mature plants(withthe exception of seeds, Fig. 2), compared withplants in non-polluted soil. This high accumulationof S in polluted plants is a reflection of the highS concentration in the spill-affected soil(Table 2).The differences in S concentration between pollut-
249P. Madejon et al. / The Science of the Total Environment 307 (2003) 239–257´
Fig. 2. Nutrient concentrations(mean values on dry matter and S.E. bars) in sunflower growing at R8 stage on the affected(gray)and non-affected(white) soils. For each fraction, significant differences are marked with asterisks(P-0.05 of Student’st-test).

250 P. Madejon et al. / The Science of the Total Environment 307 (2003) 239–257´
ed and non-polluted plants were especially markedfor the roots(at V4 and R8 stages) and leaves(atR8 stage). In general, plants are rather insensitiveto high sulfate concentration in the soil medium(except in the case of saline soils); when thesulfate taken up exceeds the S demand for thesynthesis of organic compounds, it can be storedin plant tissues without much damage(Marschner,1995).
The application of S fertilisers to sunflowercrops increases yield and oil concentration(Singand Sahu, 1986; Blamey et al., 1997). The high Scontent of the spill-affected soil could haveinduced, at least partly, the significantly greater oilconcentration in seeds of polluted vs. non-pollutedplants (Table 3). This higher production of sun-flower oil in polluted soils, probably due to the Senrichment, can be considered as added value inplanning the utilisation of this plant inphytoremediation.
The pattern of Ca and Mg concentrationchanged with plant age. At the seedling(V4)stage, they showed opposite trends(Fig. 1), prob-ably associated with the well-known antagonismeffect produced during the plant’s uptake of thesetwo elements. At maturity(R8 stage), leaf bladesand petioles showed a pollution-induced Ca deple-tion, whereas other plant organs accumulated Calevels similar to those in non-polluted plants(Fig.2). The concentration of Mg was not very differentbetween the two soil conditions for the vegetativeorgans. Concentrations of Ca and Mg in the seedsof polluted plants(0.19 and 0.32%, respectively),were normal for sunflower crop(Blamey et al.,1997). Overall, Ca uptake was greater in theunaffected plants(12.7 g per plant) than in theaffected plants(10.6 g per plant), but similar inthe case of Mg(1.87 g per plant in both groupsof plants).
Comparing the 1st(1998) and 2nd (2000)scenarios, Ca concentration in seeds was notaffected in either year studied. However, Ca inleaves was higher in the flood-affected plants(compared with non-polluted plants) in 1998 andlower in the 2000 plants grown on remediatedsoils (Murillo et al., 1999). The higher Ca accu-mulation in plants subjected to the spill floodcould be a consequence of carbonate dissolution
following the soil acidification produced by theirruption of sludge and acid water. The concentra-tion of Mg in seeds was not affected by sludgepollution in the 1st scenario(a pattern similar tothat of Ca), but it was lower in the polluted plantsof the 2nd scenario(as shown above). In general,the supply of Ca and Mg was adequate in bothscenarios, as a normal feature in alkaline soils.
3.3.2. MicronutrientsAlthough essential for plant growth, micronutri-
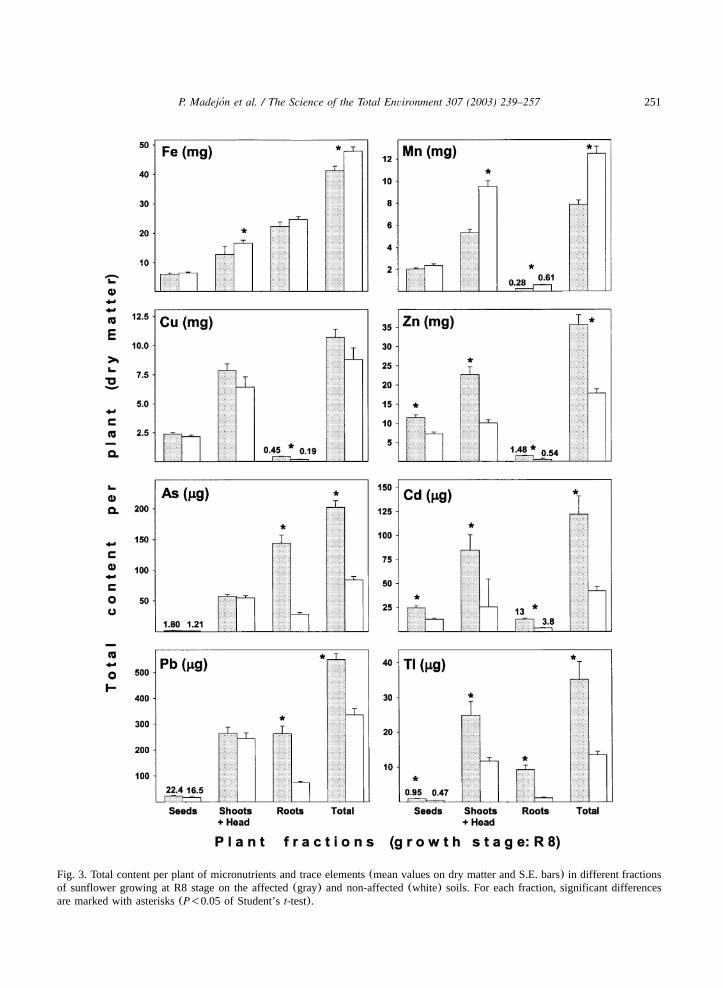
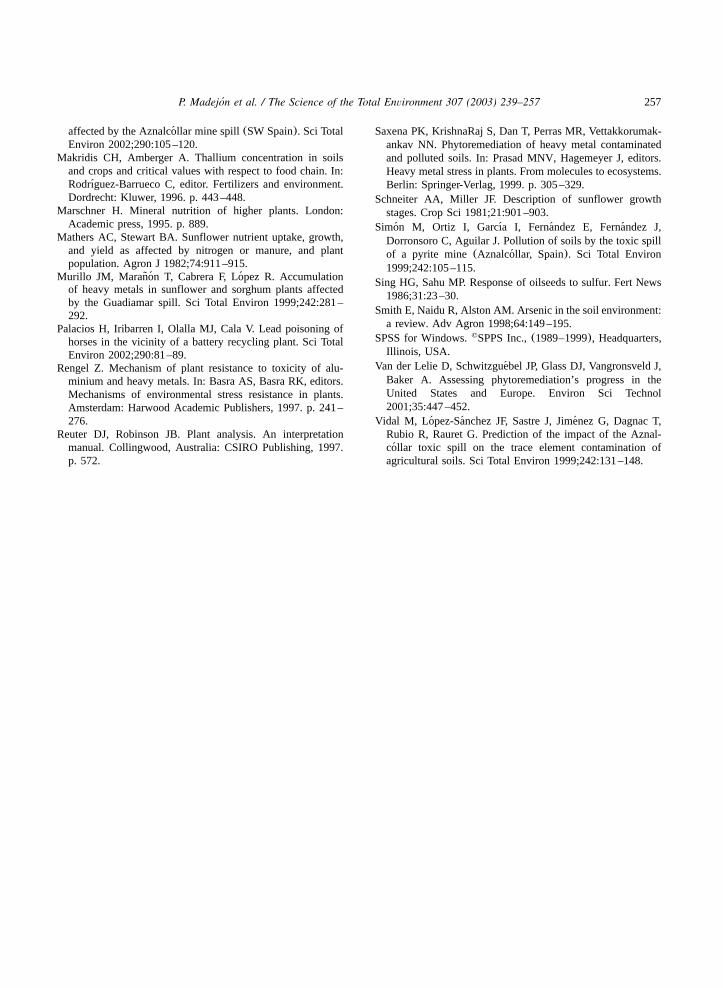
ents (Fe, Mn, Zn and Cu) can produce toxiceffects if they reach very high concentration in theplant tissues. Concentrations of Fe in pollutedseedlings were not significantly different fromthose in non-polluted ones(Table 4). However,seeds and stems of polluted mature plants hadlower Fe concentration than those of non-pollutedplants (Table 5). Total uptake of Fe by matureplants was also lower in polluted soil conditions(Fig. 3). Despite this reduced Fe accumulation inpolluted plants, the Fe concentration in their seeds(mean of 59.8 mg kg ) was higher than they1
normal value(33 mg kg ) reported for sunflowery1
crop (Blamey et al., 1997).The mine sludge originating the soil pollution
had a high concentration of Fe(approx. 370 000mg kg ), but spill-affected soils did not presenty1
significantly increased Fe content(Lopez-Pamo et´al., 1999). In fact, Fe(EDTA-extracted) availabi-lity of the polluted and remediated soil used togrow sunflower in this study(40 mg kg in 0–y1
25-cm depth) was not significantly different fromthat of the non-polluted soil used for comparison(45 mg kg ). Therefore, sunflower plants growny1
in spill-polluted soil did not show symptoms of Fetoxicity.
The concentration of Mn in seedlings andmature plants was much lower in the polluted soil(Tables 4 and 5) than at the non-polluted site.This apparent reduction of Mn accumulation wasfound in every plant organ, with the exception offlower heads(Table 5). Total uptake of Mn by themature plant was thus much reduced in the pollut-ed soil (Fig. 3). The apparently contradictorypattern of reduced Mn accumulation in pollutedplants is a reflection of the significantly lower
251P. Madejon et al. / The Science of the Total Environment 307 (2003) 239–257´
Fig. 3. Total content per plant of micronutrients and trace elements(mean values on dry matter and S.E. bars) in different fractionsof sunflower growing at R8 stage on the affected(gray) and non-affected(white) soils. For each fraction, significant differencesare marked with asterisks(P-0.05 of Student’st-test).
252 P. Madejon et al. / The Science of the Total Environment 307 (2003) 239–257´
availability of this heavy metal in the polluted soil(Table 2) than at the non-polluted site.
Despite the(relatively) low Mn concentrationin polluted plants, their seeds had a high Mncontent: mean of 20 mg kg , compared with they1
14 mg kg reported for normal sunflower cropsy1
(Blamey et al., 1997). The concentration of Mn inthe sludge was relatively low(lower than themedian for normal soils, according to Bowen,1979), and the high accumulation of Mn found inplants, both polluted and non-polluted, must be areflection of an inherent high Mn availability inthe background soil of the region.
Concentrations of the micronutrients Cu and Zn(in contrast to Fe and Mn) in seedlings and matureplants were higher in those in the polluted soilthan in those at the non-polluted site(Tables 4and 5). The increased accumulation of heavy metalin plants, induced by soil pollution, was morepronounced in the case of Zn, one of the majorpolluting elements in the mine sludge(Cabrera etal., 1999).
The concentration of Cu was significantly higherin every seedling organ(V4 stage, Table 4) andin most of the mature plant organs(with theexception of seeds and leaf petioles, Table 5) inthe polluted soil than in those at the non-pollutedsite. However, total plant uptake of Cu was notsignificantly different between the two soil condi-tions (Fig. 3). Only root uptake of Cu showed asignificant increase under polluted soil conditions(Fig. 3).
Copper reached its highest concentration in theleaf blades of mature plants, with a mean value of24.5 mg kg . The maximum value of 36 mgy1
kg would be already within the phytotoxic rangey1
for most plants: 25–40 mg kg , according toy1
Chaney(1989), although a higher threshold of 70mg kg has been reported for sunflower(Blameyy1
et al., 1997).Sunflower plants directly flooded by the spill in
1998(1st scenario) did show a significantly great-er Cu accumulation in their seeds(mean of 27.2mg kg ) than those in adjacent non-polluted soilsy1
(Murillo et al., 1999). On the other hand, there isa decreasing trend of Cu accumulation in thepolluted plants between the 1st(1998) and 2nd
(2000) scenarios, e.g. leaf blades decreased froma mean value of 63.0 mg kg of Cu in the spill-y1
flood conditions (1998) to a mean of 24.5 mgkg in the remediated soils(2000). In general,y1
contamination by Cu in plants was quite low incomparison to that by other toxic elements, suchas As, Cd, Pb and Zn. The temporal reduction ofCu accumulation in plants of the spill-affected areahas also been documented for wild grasses(Made-jon et al., 2002) and white poplar, wild olive and´holm oak(Madejon et al., unpublished).´
The concentration of Zn in plants growing inthe polluted soil was significantly higher for everyorgan, at both seedling and mature plant stages(Tables 4 and 5), compared with those in non-polluted soil. Total Zn uptake, for the entire plantand for the fractions analysed, was also signifi-cantly greater in the polluted soil than in non-polluted soil(Fig. 3). Despite this clear effect ofincreasing Zn accumulation induced by the soilpollution, the values reached(maximum of 163mg kg in one seedling stem) were always belowy1
the phytotoxic levels for plantsw500–1500 mgkg , according to Chaney(1989)x. Seeds(they1
edible part in this crop) of polluted plants had aZn concentration(mean of 112 mg kg ) belowy1
the maximum level tolerated by animals,(e.g.1000 mg kg for chicken, according to Chaneyy1
1989).Plants directly affected by the spill in 1998(1st
scenario) showed higher Zn concentration thanthose cultivated in adjacent, non-affected soils(Murillo et al., 1999). However, there is a trendof decreasing Zn accumulation in plants with time.Leaf blades of spill-flooded plants(in the 1stscenario, 1998) had a mean of 140 mg kg ofy1
Zn, whereas plants grown in remediated soils(2ndscenario, in 2000) had a mean Zn concentrationof 68.5 mg kg . This reduction in Zn accumula-y1
tion with time was also found for leaf petioles andstems, however, seeds harvested in the 2nd sce-nario had more Zn(mean of 112 mg kg ) thany1
those in the 1st scenario(mean of 73.6 mg kg ).y1
Soil pollution by the mine spill did significantlyaffect sunflower plants, in terms of higher Znaccumulation in their tissues. Two years after thespill, remediated soils are still contaminated by
253P. Madejon et al. / The Science of the Total Environment 307 (2003) 239–257´
Zn, and consequently affect plants, inducing ahigher Zn accumulation in their tissues. However,there is evidence that Zn accumulation in plants isdecreasing, as shown for sunflower plants(in thisstudy, and despite the contradictory values forseeds), and wild grasses(Madejon et al., 2002).´
3.3.3. Trace elementsThe trace elements As, Cd, Pb and Tl are not
essential for plant nutrition, and can have phyto-toxic effects, even at low concentration. Thesefour elements were present in the mine spillflooding the Guadiamar valley and, as a result,polluted sunflower plants had higher concentrationof As, Cd, Pb and Tl in their organs than did non-polluted plants(Table 4 and Table 5, Fig. 3).
Arsenic was one of the trace elements causingpublic concern after the mine spill, due to itsknown toxicity. Plant uptake of As occurs primar-ily through the root system, and the highest Asconcentration is usually reported in root and tubertissues; its accumulation in other(edible) parts isgenerally low(Smith et al., 1998). Polluted sun-flower plants(in this study) accumulated As main-ly in the roots, at both seedling(V4) and adult(R8) stages(Table 4 and Table 5). For example,the transfer coefficient for roots was 0.08 and forleaves was 6=10 , for mature plants in they4
polluted soil. The maximum value reached(7.9mg kg in roots of one mature plant) is withiny1
the range of 3–10 mg kg for phytotoxic effectsy1
(Chaney, 1989). Given that most of the As wasaccumulated in roots, and thus stayed belowground, at soil level, the potential for phytoextrac-tion and removal of As by harvesting above-ground sunflower organs, seems to be very low.
Sunflower seeds(the edible part) accumulatedmuch lower concentrations of As than did roots orleaves (Table 5 and Fig. 3), and the measuredvalues in polluted plants(mean of 17.3mg kg )y1
were not significantly different to those in non-polluted conditions. These As values are far belowthe accepted toxicity thresholds, e.g. 3000–10 000mg kg for phytoxicity effects(Chaney, 1989),y1
approximately 50 000mg kg in dry diet fory1
animal consumption(Blamey et al., 1997) and
1000 mg kg in dry diet as health limit fory1
humans(Smith et al., 1998).During the 1st scenario(1998), spill-flooded
sunflower plants also had comparatively low Asconcentration in seeds(mean of 31 mg kg ,y1
Murillo et al., 1999). The physiological barrier fortranslocation of trace elements to seeds actedeffectively in sunflower plants cultivated in pol-luted and remediated soils(2000, 2nd scenario),as well as in plants directly suffering the spillflood (1998, 1st scenario). Leaves of spill-floodedsunflower (1st scenario) had a very high Asconcentration(mean of 5815mg kg , Murillo ety1
al., 1999), probably increased by the intense dustcontamination during the early cleaning-up opera-tions to remove the sludge.
Cadmium is a trace element of particular interestin this study because sunflower tends to accumu-late it more than do other crops. Cd accumulationin spill-polluted plants was significantly greater, inevery organ, than in non-polluted plants, at bothseedling(V4) and mature(R8) stages(Table 4and Table 5). However, those values are withinthe normal range for plants; 100–1000mg kg ,y1
according to Chaney(1989). This low uptake andaccumulation of Cd by polluted sunflower contra-dicts the generally accepted pattern of its hightransfer coefficient between plant and soil, approx-imately 100-fold those of As and Pb(Kloke et al.,1984).
Total uptake of Cd by the plant was significantlygreater in the spill-polluted soil than under non-polluted conditions(Fig. 3). In contrast to the caseof As, plants accumulated more Cd in shoots thanin roots(Fig. 3).
Seeds in polluted plants had a higher Cd con-centration than those in non-polluted plants, butthe mean value(239mg kg ) was still below they1
toxicity level for livestock(500mg kg , Chaney,y1
1989) and the threshold recommended for humannutrition (1000 mg kg , Hapke, 1996). Seedsy1
collected from the directly flooded plants in 1998(1st scenario) had a similar Cd concentration(mean of 241mg kg , Murillo et al., 1999). Iny1
both scenarios, seeds of polluted sunflower plantshad relatively low Cd concentration, when com-pared with a comprehensive screening of 200
254 P. Madejon et al. / The Science of the Total Environment 307 (2003) 239–257´
sunflower lines cultivated in non-contaminatedsoils, which gave a range between 310 and 1340mg kg (Blamey et al., 1997).y1
Leaves and stems accumulated less Cd in theplants cultivated in polluted and remediated soils(2nd scenario) than in spill-flooded plants(1stscenario) (mean of 123mg kg in stems of 2nd-y1
scenario plants compared with 278mg kg iny1
1st-scenario plants) (Murillo et al., 1999). Theremoval of sludge and remediation of soils can beexpected to have diminished the level of Cdpollution in 2 years. However, it should be bornein mind that the cultivated sunflower varietieswere different and could differ in Cd uptake.Furthermore, they were grown under differentconditions: emerging plantlets in normal soils weresubjected to a sudden flood by pollutant spill andhad to adjust physiologically(1st scenario), where-as plants in the 2nd scenario germinated, emergedand grew in polluted and remediated soils. Finally,during the first year after the spill, sludge removalcaused severe dust contamination that could haveincreased external Cd, in particular on the rugoseleaves(Murillo et al., 1999).
Lead was one of the most important pollutingelements in the mine spill, and has well-knowntoxic effects on domestic animals and in humans(Palacios et al., 2002), the sludge contained up to9700 mg kg (Cabrera et al., 1999). Two yearsy1
after the mine spill, the availability of Pb in thepolluted and remediated soils of the Guadiamarvalley was still considerable(Table 2, Cabrera etal., 2003), despite the cleaning-up and remediationoperations carried out. Values of total Pb in soil(max. of 131 mg kg ) were above the acceptedy1
threshold(100 mg kg ) for toxic effects in plantsy1
(Kabata-Pendias and Pendias, 1992).However, only a fraction of the available Pb in
the soil is taken up by most plants, moreover, mostof the Pb taken up is accumulated in the roots andnot translocated into above-ground parts. That is,entry of Pb into the food web tends to be impededby the ‘soil-plant barrier’(Chaney, 1989), thuspreventing the contamination of animals feedingon leaves and fruits.
Spill-polluted plants had higher Pb concentrationin roots, stems and leaves, at both seedling(V4)and mature(R8) stages, than did non-polluted
plants(Table 4 and Table 5). At the seedling stage,Pb concentration in roots, stems and leaves was inthe proportion 8:2:1, and at the mature stage,11:1:3. Therefore, sunflower roots accumulatedmore Pb than did above-ground parts, althoughthere was still some translocation and accumula-tion into mature plant leaves and, especially, seed-ling stems.
On the other hand, there was no significantaccumulation of Pb in seeds, flower heads and leafpetioles(compared with non-polluted plants, Table5). For these organs, the soil-plant barrier for non-essential Pb seemed effective. Seeds of pollutedplants had relatively low Pb concentration(meanof 219 mg kg ), far below the suggested toxicityy1
level for livestock (30 000 mg kg , Chaney,y1
1989) and the more conservative threshold value(3000 mg kg ) accepted as safe for humany1
consumption(Hapke, 1991). Considering only theseeds, as the edible part of this crop, there was norisk of Pb toxicity from sunflower cultivated inthe spill-polluted and remediated soils. Neverthe-less, at ecosystem level, roots(with a maximumvalue of 17 270mg kg ) and leaves(with ay1
maximum of 2780mg kg ) of those plants couldy1
be toxic to small herbivores,(e.g. insects, wormsand hares) feeding on them.
The total Pb uptake by polluted plants wasalmost equally distributed between roots andshoots (Fig. 3), unlike As, which concentratedpreferentially in roots, and Cd, in shoots(Fig. 3).Although, the Pb concentration was lower inshoots(one-eleventh that in roots, see above), thehigher biomass allocated to the aboveground partsequalled the total uptake.
Plants directly flooded by the mine spill in 1998(1st scenario) also translocated small amounts ofPb to the seeds(mean concentration of 423mgkg ). However, the concentration of Pb measuredy1
in leaf blades was relatively high(mean of 7551mg kg ), probably a reflection of internal tissuey1
content plus external contamination by the intensedust caused by the early clean-up operations ofthe soil(Murillo et al., 1999).
Thallium was present at a high level in thesludge(approx. 60 mg kg , Cabrera et al., 1999),y1
and its concentration in polluted soil was alsorelatively high(approx. 1 mg kg , Murillo et al.,y1
255P. Madejon et al. / The Science of the Total Environment 307 (2003) 239–257´
1999). Polluted plants accumulated more Tl inevery organ, at both seedling(V4) and mature(R8) stages, than did non-polluted plants(Tables4 and 5). In particular, stems and roots of seedlingshad 12-fold higher Tl concentration than equiva-lent organs in non-polluted plants(Table 4). Thetranslocation of Tl in mature plants produced adecreasing concentration from rootsystemsyseedsin the proportion 35:10:1(Table 5), leaf valueswere similar to those of stems. The total contentof Tl in the spill-polluted plants was distributedmore in shoots than in roots(Fig. 3), the higher(three-fold) Tl concentration in roots was compen-sated by the greater biomass allocation to shoots.
Seeds of the polluted plants(the edible part ofthis crop) had very low Tl concentration(mean of9.33mg kg ). This value is far below the accept-y1
ed toxicity thresholds, e.g. 500mg kg of dryy1
matter to feed domestic animals, or 1000mgkg in the diet to prevent Tl accumulation iny1
animals (Hapke, 1991), and 2500mg kg dryy1
matter of plant tissue as safe value for the foodchain(Makridis and Amberger, 1996).
Plants directly affected by the mine spill in 1998(1st scenario) had even lower Tl concentration inseeds(mean of 1.7mg kg ), although concentra-y1
tions in leaves and stems were similar between1st- and 2nd-scenario plants(see Murillo et al.,1999). The differences in seed composition areprobably a reflection of the different sunflowervariety used and the different growing conditionsin the two scenarios.
The transfer coefficient between plant and soilfor Tl is generally considered to be high(Klokeet al., 1984). However, the significant accumula-tion of Tl in roots showed the effectiveness of thesoil–plant barrier mechanism for this element.Other authors(Vidal et al., 1999) have noted thelow mobility of Tl in the Guadiamar sludge andcontaminated soils, and in consequence, it wouldhave low uptake by plants. The total uptake of Tlwas certainly low(under extreme conditions of Tlavailability, plants can accumulate Tl up to 100mg kg (ash weight basis), Kabata-Pendias andy1
Pendias, 1992). At the same time, the soil–plantbarrier effectively reduced(35-fold) the translo-cation of Tl from roots to seeds. There is a generalsystem of physiological barriers impeding metal
translocation to seeds during their maturation(Ernst et al., 1992).
3.4. Use of sunflower for phytoremediation
Sunflower has been cited as a suitable crop forthe cleaning up of soils polluted by Zn(Van derLelie et al., 2001). However, the potential forphytoextraction of trace elements(by high accu-mulation in harvestable shoot tissues) in the cul-tivated sunflower plants studied here was very low.According to our results(see Fig. 3), it would bepossible to extract approximately 2.05 kg Znha year from the contaminated soil by har-y1 y1
vesting and removing the sunflower shoots.(Thatcould be increased to 2.14 kg Zn ha year ify1 y1
the complete plant, with roots, were harvested.)Such amounts of Zn extracted yearly(sunfloweris an annual crop) are negligible in comparison tothe magnitude of Zn contamination in the soil, i.e.approximately 705 kg ha of total Zn in the topy1
layer (0–25 cm) of the spill-polluted soil, whichexceeds by more than 500 kg ha the total Zn iny1
normal, non-polluted soils.The extraction of potentially toxic elements,
such as As and Pb, by the above-ground part ofthe crop was even more negligible. It would bepossible to extract approximately 0.003 kg hay1
year of As and 0.016 kg ha year of Pb, they1 y1 y1
loads remaining in the spill-polluted soil wereapproximately 186 kg ha of As and 280 kgy1
ha of Pb (0–25-cm depth) in excess of they1
corresponding amounts in the non-polluted soil.Plants can be used to remediate polluted soils
by mechanisms other than phytoextraction. Theprompt restoration of a dense vegetation cover isthe most useful and widespread method to stabilisemine wastes physically and to reduce effects ofmetal pollution (Bargagli, 1998). Native plantspecies able to tolerate soil pollution are the bestchoice. In the Guadiamar valley, spill-affectedlands have been compulsorily purchased by theregional administration to establish a ‘Green Cor-ridor’, using native trees and shrubs(Junta deAndalucıa, 2001). Native wild plants that quickly´colonise abandoned croplands in remediated soils,such as Bermuda grass(Cynodon dactylon) andwild sorghum (Sorghum halepense), have been
256 P. Madejon et al. / The Science of the Total Environment 307 (2003) 239–257´
suggested as suitable plants for soil stabilisation(Madejon et al., 2002).´
In other cases of soil pollution by heavy metals,several common agricultural and horticulturalcrops have been indicated for phytostabilisation(Saxena et al., 1999). We suggest that sunflowercan be used for remediation procedures in metal-contaminated soils. It is a fast-growing crop whichwould favour soil stabilisation. Its tough leavesand stems are rarely eaten by animals. The seeds(actively eaten by birds) have very low concentra-tions of potentially toxic elements, and representlow risk for the food web. Additionally, the even-tual seed harvesting and oil production(used forindustrial purposes) could reduce the net cost ofthe remediation task.
Acknowledgments
This study was carried out in the framework ofthe ‘Programa de Investigacion del Corredor Verde´(PICOVER)’, supported with funds of the ‘Con-sejerıa de Medio Ambiente’ of the Regional Gov-´ernment(Junta de Andalucıa), Spain. We thank´J.M. Alegre for help in sampling and Juan Mara-non for providing facilities at Soberbina farm for˜ ´cropping sunflower. Trace element concentrationsin plants were determined in the Centre for Sci-entific Instrumentation(Dr O. Cazalla, Universityof Granada).
References
Ayora C, Barettino D, Carrera J, Manzano M, Mediavilla C,editors. Las aguas y los suelos tras el accidente de Aznal-collar. Bol Geol Minero 2001;112:1–294.´
Bargagli R. Trace elements in terrestrial plants. An ecophy-siological approach to biomonitoring and biorecovery. Ber-lin: Springer-Verlag, 1998. p. 324.
Blamey FPC, Zollinger RK, Schneiter AA. Sunflower produc-tion and culture. In: Schneiter AA, editor. Sunflower tech-nology and production. Madison, USA: ASA, 1997. p. 595–670.
Bowen HJM. Environmental chemistry of the elements. Lon-don: Academic Press, 1979. p. 333.
Cabrera F, Clemente L, Dıaz Barrientos E, Lopez R, Murillo´ ´JM. Heavy metal pollution of soils affected by the Guadia-mar toxic flood. Sci Total Environ 1999;242:117–129.
Cabrera F, Clemente L, Cordon R, Hurtado MD, Lopez R,´ ´Madejon P, Maranon T, Moreno F, Murillo JM, Nagel I.´ ˜ ´Heavy metals pollution in soils of the Guadiamar River
Valley. In: Del Valls A, Blasco J, editors. Integrated Assess-ment and Management of the Ecosystems Affected by theAznalcollar Mining Spill (SW, Spain). IOCyICAM yUNESCO Technical Report, 2003(in press).
Chaney RL. Toxic element accumulation in soils and crops:protecting soil fertility and agricultural food-chains. In: Bar-Yosef B, Barrow NJ, Goldshmid J, editors. Inorganic con-taminants in the Vadose Zone. Berlin: Springer-Verlag, 1989.p. 140–158.
Ernst WHO, Verkleij JAC, Schat H. Metal tolerance in plants.Acta Bot Neerl 1992;41:229–248.
Galan E, Gonzalez I, Fernandez-Caliani JC. Residual pollution´ ´ ´load of soils impacted by the Aznalcollar(Spain) mining´spill after clean-up operations. Sci Total Environ2002;286:167–179.
Griepink B, Muntau H. The certification of the contents(massfractions) of As, B, Cd, Cu, Hg, Mn, Mo, Ni, Pb, Sb, Seand Zn in rye grass, CRM 281, Report no. EUR 11839 EN.Luxembourg, 1987.
Griepink B, Muntau H. The certification of the contents(massfractions) of arsenic, cadmium, copper, lead, selenium andzinc in a sea lettuce(Ulva lactuca), CRM No. 279, Reportno. 11185 EN., Luxembourg, 1988.
Grimalt JO, Ferrer M, Macpherson E. The mine tailing accidentin Aznalcollar. Sci Total Environ 1999;242:3–11.
Haby VA, Russelle MP, Skogley EO. Testing soils for potas-sium, calcium and magnesium. In: Westerman RL, editor.Soil testing and plant analysis. Madison, Wisconsin: SoilScience Society of America, 1990. p. 181–227.
Hapke HJ. Metal accumulation in the food chain and load offeed and food. In: Merian E, editor. Metals and theircompounds in the environment. Occurrence, analysis, andbiological relevance. New York: Weinheim, 1991. p. 469–479.
Hapke HJ. Heavy metal transfer in the food chain to humans.In: Rodrıguez-Barrueco C, editor. Fertilizers and Environ-´ment. Dordrecht: Kluwer, 1996. p. 431–436.
Junta de Andalucıa. Corredor Verde del Guadiamar, Abril´1998–Abril 2001. Consejerıa de Medio Ambiente de la´Junta de Andalucıa. Sevilla, 2001, pp 70.´
Kabata-Pendias A, Pendias H. Trace elements in soils andplants. Boca Raton, Florida: CRC Press, 1992. p. 365.
Kamnev AA, Van der Lelie D. Chemical and biologicalparameters as tools to evaluate and improve heavy metalphytoremediation. Biosci Rep 2000;20:239–258.
Kloke A, Sauerbeck DR, Vetter H. The contamination of plantsand soils with heavy metals and the transport of metals interrestrial food chains. In: Nriagu JO, editor. Changing metalcycles and human health. Berlin: Springer-Verlag, 1984. p.113–141.
Lopez-Pamo E, Barettino D, Anton-Pacheco C, Ortiz G, Aranz´ ´ ´JC, Gumiel JC, Martınez-Pledel M, Aparicio O, Montouto´O. The extent of the Aznalcollar pyritic sludge spill and its´effects on soils. Sci Total Environ 1999;242:57–88.
Madejon P, Murillo JM, Maranon T, Cabrera F, Lopez R.´ ˜ ´ ´Bioaccumulation of As, Cd, Cu, Fe and Pb in wild grasses
257P. Madejon et al. / The Science of the Total Environment 307 (2003) 239–257´
affected by the Aznalcollar mine spill(SW Spain). Sci Total´Environ 2002;290:105–120.
Makridis CH, Amberger A. Thallium concentration in soilsand crops and critical values with respect to food chain. In:Rodrıguez-Barrueco C, editor. Fertilizers and environment.´Dordrecht: Kluwer, 1996. p. 443–448.
Marschner H. Mineral nutrition of higher plants. London:Academic press, 1995. p. 889.
Mathers AC, Stewart BA. Sunflower nutrient uptake, growth,and yield as affected by nitrogen or manure, and plantpopulation. Agron J 1982;74:911–915.
Murillo JM, Maranon T, Cabrera F, Lopez R. Accumulation˜ ´ ´of heavy metals in sunflower and sorghum plants affectedby the Guadiamar spill. Sci Total Environ 1999;242:281–292.
Palacios H, Iribarren I, Olalla MJ, Cala V. Lead poisoning ofhorses in the vicinity of a battery recycling plant. Sci TotalEnviron 2002;290:81–89.
Rengel Z. Mechanism of plant resistance to toxicity of alu-minium and heavy metals. In: Basra AS, Basra RK, editors.Mechanisms of environmental stress resistance in plants.Amsterdam: Harwood Academic Publishers, 1997. p. 241–276.
Reuter DJ, Robinson JB. Plant analysis. An interpretationmanual. Collingwood, Australia: CSIRO Publishing, 1997.p. 572.
Saxena PK, KrishnaRaj S, Dan T, Perras MR, Vettakkorumak-ankav NN. Phytoremediation of heavy metal contaminatedand polluted soils. In: Prasad MNV, Hagemeyer J, editors.Heavy metal stress in plants. From molecules to ecosystems.Berlin: Springer-Verlag, 1999. p. 305–329.
Schneiter AA, Miller JF. Description of sunflower growthstages. Crop Sci 1981;21:901–903.
Simon M, Ortiz I, Garcıa I, Fernandez E, Fernandez J,´ ´ ´ ´Dorronsoro C, Aguilar J. Pollution of soils by the toxic spillof a pyrite mine(Aznalcollar, Spain). Sci Total Environ´1999;242:105–115.
Sing HG, Sahu MP. Response of oilseeds to sulfur. Fert News1986;31:23–30.
Smith E, Naidu R, Alston AM. Arsenic in the soil environment:a review. Adv Agron 1998;64:149–195.
SPSS for Windows. SPPS Inc.,(1989–1999), Headquarters,�
Illinois, USA.Van der Lelie D, Schwitzguebel JP, Glass DJ, Vangronsveld J,´
Baker A. Assessing phytoremediation’s progress in theUnited States and Europe. Environ Sci Technol2001;35:447–452.
Vidal M, Lopez-Sanchez JF, Sastre J, Jimenez G, Dagnac T,´ ´ ´Rubio R, Rauret G. Prediction of the impact of the Aznal-collar toxic spill on the trace element contamination of´agricultural soils. Sci Total Environ 1999;242:131–148.
Top Related
Copyright © 2022 FDOKUMEN

