


Bahasa
Halaman
Hukum


ii

iii
© Mossaed Yousif Al-Awwad
2013

iv
To my beloved parents, brother, and sisters

v
ACKNOWLEDGEMENT
In the name of Allah, the Entirely Merciful, the Especially Merciful “Our Lord, accept
[this] from us. Indeed, You are Hearing, the knowing” (2:127), The Holy Quran.
Acknowledgement is due to King Fahd University of Petroleum and Minerals for
supporting this work and providing the required literature. I wish to express my special
appreciation to my thesis advisor, Dr. Mohamed A. Habib for his generous and
continuous help, encouragement, suggestions and patience through this work. His
valuable and priceless suggestions made this work interesting and challenging for me.
My deep appreciation and grateful to my thesis committee members, Dr. Esmail
Mokheimer and Dr . Syed A. M. Said for their valuable guidance, suggestions and advice.
I am greatly indebted to Dr. Esmail Mokheimer for the valuable time he spent throughout
my thesis work and also for always being supportive and helping me to manage server
logistic issues.
Special thanks for Eng. Uthman Al-Dahlous and Eng. Ali Al-Nashmi from Saudi Aramco
for the provided technical information and illustrations.
Last, but certainly not least, I am very thankful to my beloved mother, father, brothers,
sisters, uncle, aunt and friends for their pray, patient, encouragement, support and
understanding

vi
TABLE OF CONTENTS
THESIS COMMITTEE ............................ ERROR! BOOKMARK NOT DEFINED.
ACKNOWLEDGEMENT ............................................................................................ V
LIST OF TABLES ...................................................................................................... IX
LIST OF FIGURES ...................................................................................................... X
THESIS ABSTRACT (ENGLISH) ........................................................................... XII
THESIS ABSTRACT (ARABIC) ............................................................................ XIV
CHAPTER 1: INTRODUCTION .............................................................................. 1
1.1 Problem Statement ...................................................................................... 1
1.2 Objectives ................................................................................................... 2
1.3 Thesis Outline ............................................................................................. 2
CHAPTER 2: LITERATURE REVIEW .................................................................. 4
2.1 Dynamic and Simulation Models ............................................................... 4
2.2 Boiler Control Systems ............................................................................. 13
2.3 Thermal Stresses ....................................................................................... 20
2.4 Uncertainty Analysis for Boiler Swing Rate ............................................ 26
2.5 Rapid Response Boiler Survey Summary ............................................... 28
2.6 Concluding Remarks ................................................................................ 31
CHAPTER 3 : INTRODUCTION TO STEAM SYSTEM IN SAUDI ARAMCO....... 32
3.1 Steam Generation Systems ....................................................................... 32
3.2 Steam Quality ........................................................................................... 34
3.3 Types of Boilers........................................................................................ 34
3.4 Major Steam System Components ........................................................... 38

vii
CHAPTER 4: BOILER OPERATION AND CONTROL..................................... 45
4.1 Steam Drum Level / BFW Rate ................................................................ 45
4.2 Shrink and Swell ....................................................................................... 47
4.3 Boiler Blowdown ...................................................................................... 49
4.4 Steam Drum Presure/Steam Production Rate ........................................... 49
4.5 Fuel Flow/Pressure ................................................................................... 50
4.6 Maximum Metal Temperatures ................................................................ 51
4.7 Minimum Metal Temperatures ................................................................. 51
4.8 Interaction of Variables (Total System) ................................................... 51
CHAPTER 5: FIELD DATA COLLECTION........................................................ 53
5.1 Data of a Typical Saudi Aramco Boiler ................................................... 53
5.2 Field Data Measurements ......................................................................... 60
CHAPTER 6: EVALUATION OF ACTUAL BOILER TUBE FAILURE……..74
6.1 Failure Analysis due to Flame Impingement ............................................ 74
6.2 Failure Analysis of Different Boilers ....................................................... 87
6.3 Boiler Tube Rupture due to Low Level in Steam Drum .......................... 99
CHAPTER 7: DISCUSSION AND ANALYSIS ................................................... 107
7.1 Analysis of Tube Failure due to Flame Impingement and Fuel Change 107
7.2 Failure Analysis of Different Boilers due to High Swing Rates ............ 113
7.3 Boiler Tube Rupture due To Low Level in Steam Drum ....................... 118
7.4 Other Tube Failure Phenomena .............................................................. 122
7.5 Concluding Remarks .............................................................................. 124
CHAPTER 8: CONCLUSION AND RECOMMENDATIONS.......................... 125
8.1 Conclusion .............................................................................................. 125
8.2 Recommendations .................................................................................. 126

viii
8.3 Rapid Response Boilers Technology ...................................................... 127
8.4 Future Research ...................................................................................... 128
NOMENCLATURE .................................................................................................. 129
REFERENCES ......................................................................................................... 131
VITAE ....................................................................................................................... 138

ix
LIST OF TABLES
Table 1: Typical Boiler Data Sheet --------------------------------------------------------------- 54
Table 2: Construction Details ---------------------------------------------------------------------- 54
Table 3: Typical Boiler: Anticipated Performance --------------------------------------------- 55
Table 4: Typical Boiler: Anticipated Performance --------------------------------------------- 56
Table 5: Boiler Tube Data (Boiler Type VP-26 W Tube Schedule) ------------------------- 60
Table 6: Operating Parameters of Typical MHI Boiler at 100 % MCR --------------------- 61
Table 7: Physical and Steady State Boiler Operational Data ---------------------------------- 62
Table 8: Operating Parameters of Typical Boiler at Steady State at the Instant of Upset. 62
Table 9: Sequence of Events of Boiler F-109 --------------------------------------------------- 76
Table 10: F-109 Boiler Load and Ramping Rate Variation with Time ---------------------- 92
Table 11: F-108 Boiler Ramping Rate during Incident ---------------------------------------- 94
Table 12: F-105 Boiler Ramping Rate during Incident ---------------------------------------- 95
Table 13: Sequence of Events of Boiler Tube Rupture ---------------------------------------104

x
LIST OF FIGURES
Figure 1: Typical Fired Tube Boiler ................................................................................... 36
Figure 2: Typical Water Tube Boiler ................................................................................. 36
Figure 3: Water Tube Boiler Major Parts ........................................................................... 37
Figure 4: Steam Drum Internals ......................................................................................... 39
Figure 5: Typical Steam Drum Cross Section .................................................................... 40
Figure 6: Typical Water Wall Constructions...................................................................... 42
Figure 7: Three-Element Feedwater Control System ......................................................... 49
Figure 8: Boiler Furnace Tubes Rapture ............................................................................ 52
Figure 9: Boiler Furnace Water Circulation Loop ............................................................. 57
Figure 10: Boiler Furnace Plan of The Boiler Furnace ...................................................... 57
Figure 11: Layout of the Boiler Furnace ............................................................................ 58
Figure 12: Detailed Construction of the Boiler Tubes ....................................................... 59
Figure 13: Variations in Steam Flow for Boiler F103 of Shedgum Plant .......................... 63
Figure 14: Response of Firing Rate to Variations in Steam Flow for Boiler of Shedgum
Plant .................................................................................................................. 63
Figure 15: Response of Drum Pressure to Variations in Steam Flow for Boiler of
Shedgum Plant .................................................................................................. 64
Figure 16: Response of Feedwater Flow Rate to Variations in Steam Flow for Boiler of
Shedgum Plant .................................................................................................. 64
Figure 17: Response of Drum Water Level to Variations in Steam Flow for Boiler F103 of
Shedgum Plant .................................................................................................. 65
Figure 18: Steam Drum Level Measurements for MHI Boiler 40 VP-26W ...................... 67
Figure 19: Variations in Steam Flow for Boiler F104 of Shedgum Plant .......................... 68
Figure 20: Response of Firing Rate to Variations in Steam Flow for Boiler F104 of
Shedgum Plant .................................................................................................. 68
Figure 21: Response of Drum Pressure to Variations in Steam Flow for Boiler F104 of
Shedgum Plant .................................................................................................. 69
Figure 22: Response of Feedwater Flow Rate to Variations in Steam Flow for Boiler F104
of Shedgum Plant ............................................................................................. 69
Figure 23: Response of Feedwater Flow Rate to Variations in Steam Flow for Boiler F104
of Shedgum Plant ............................................................................................. 70
Figure 24: Variations in Steam Flow for Boiler F103 of Shedgum Plant .......................... 71
Figure 25: Response of Drum Pressure to Variations in Steam Flow for Boiler F103 of
Shedgum Plant. ................................................................................................. 72
Figure 26: Response of Firing Rate to Variations in Steam Flow for Boiler F103 of
Shedgum Plant .................................................................................................. 73

xi
Figure 27: Response of Feedwater Flow Rate to Variations in Steam Flow for Boiler F103
of Shedgum Plant. ............................................................................................ 73
Figure 28: MHI Boiler Tube Rapture at the Boiler Firebox ............................................... 77
Figure 29: Tube Rapture Different Views .......................................................................... 78
Figure 30: Time Variation of Fuel Flow Rate and Air Valve Opening.............................. 81
Figure 31: Time Variation of Fuel Flow Rates of Methane (C1) and Ethane (C2)............ 81
Figure 32: Fuel Gas Heating Value in BTU Variation with Time ..................................... 82
Figure 33: Excess Oxygen Variation with Time ................................................................ 83
Figure 34: Single-Point Positioning Control ...................................................................... 84
Figure 35: Parallel Positioning Control .............................................................................. 85
Figure 36: Causal Factors Diagram Associated with Cause of Boiler Tube Failure.......... 86
Figure 37: Causal Factors Diagram Associated with Cause of Boiler Tube Failure.......... 88
Figure 38: Boiler Master Control ....................................................................................... 89
Figure 39: Plant Master Controller ..................................................................................... 90
Figure 40: F-109 Boiler Ramping Rate MCR % Variation with Time .............................. 93
Figure 41: F-108 Boiler Ramping Rate MCR % with Time Variation .............................. 94
Figure 42: F-108 Boiler Ramping Rate MCR % ................................................................ 96
Figure 43: F-105 Load and Steam Drum Level Vs. Boiler Load ....................................... 97
Figure 44: Main Steam Header Pressure & F-105 Steam Drum LVL ............................... 98
Figure 45: Boiler F-105 Trip Factors Diagram .................................................................. 99
Figure 46: Boiler Steam and BFW Operation .................................................................. 100
Figure 47: Data Show Operating parameters just before the trip ..................................... 101
Figure 48: Boiler Fuel Combustion Operation ................................................................. 102
Figure 49: Utility Plant Diagram ...................................................................................... 103
Figure 50: Fish Mouth Ruptured Tube and Hot Black Spot ............................................ 105
Figure 51: Bulged Tube .................................................................................................... 105
Figure 25: Heavy Scale Builds Up On the Tube Internal Diameter ................................. 106
Figure 53: DNB Formations on Boiler Tubes .................................................................. 110
Figure 54: Short-term Overheating of Roof Tube ............................................................ 111
Figure 55: Influence of Swing Rates on Maximum Limits of Drum Water Level in
Response to Rise in Steam Demand ............................................................... 116
Figure 56: Influence of Swing Rates on Maximum Limits of Drum Water Level in
Response to Drop in Steam Demand. ............................................................. 117
Figure 57: limits of swing rate for different values of friction factor coefficient and heat
flux factor. Based on allowable steam quality of x = 0.1 at p = 4.48 Mpa .... 118
Figure 58: Boiler Bulged Tube ......................................................................................... 119
Figure 59: Thermal Cracking ........................................................................................... 123

xii
THESIS ABSTRACT
NAME: MOSSAED YOUSIF ALAWWAD
TITLE: EXPERIMENTAL INVESTIGATION OF TUBE RUPTURE UNDER
BOILER DYNAMIC OPERATING CONDITIONS
MAJOR: MECHANICAL ENGINEERING
DATE: 2013
Steam generators that are commonly used in many industrial processes may experience
rapid and dynamic changes in steam demand and affect boiler integrity. These changes
result in rapid variations in drum pressure and water levels in the drum resulting in
operating boiler tubes dry and causing a tube rupture. The boiler tubes in natural
circulation boilers may suffer tube burnout because of rapid changes in boiler operating
variables such as over firing, drum pressure, and higher steam volume in steam-water
ratio. Improper design may also be considered a cause of tube overheating which is
normally caused by increased pressure loss in some of the riser tubes as a result of bends
or extra length that makes the tube a special case not considered in the calculation of
pressure loss at the design stage. To avoid such problems, actual boiler tubes failures
analysis and experimental response measurements of boiler main parameters to step
variation in fuel and steam flow rate were investigated. The results showed that the actual
steam quality should always be kept lower than the allowable limits and in order to

xiii
prevent tube overheating, maximum boiler swing rates should not be exceeded as
specified by boiler manufacturers.
MASTER OF SCIENCE DEGREE
KING FAHD UNIVERSITY OF PETROLEUM & MINERALS
Dhahran, Saudi Arabia

xiv
خالصة الرسالة
: مساعد يوسف عبدالعزيز العواد االسم
مختلفهال عملالروف تحت ظ البخاريهالتحقيق الهندسي في انفجار أنابيب المراجل عنوان الرسالة :
التخصص : هندسة ميكانيكية
م 5102تاريخ الشهادة :
في العديد من المشاريع الصناعية الى عمليات ديناميكيه سريعة مما المستخدمه الماء )الغاليات(مولدات بخارتتعرض
سريعه في ضغط ومعدل مستوى الماء في خزان ماء الغاليه إلى التغييرات التؤدي الغاليه. ة تشغيلثر على سالميؤ
الماء الطبيعيه الى ةذات دورأنابيب المراجل البخاريه أيضا تتعرض ها.رتبخر الماء في االنابيب ومن ثم انفجاسرعة
, ومعدل نسبه بسبب تغيرات التشغيل السريعه مثال ذلك الحراره المرتفعه, معدل مستوى الماء في خزان الغاليه لخللا
ومن للغاليه ئالحراره والجهد العالي على االنبوب الي انفجار االنبوب ومن ثم العطل المفاج تؤديوالبخار الى الماء.
ستمراريه انتاج إو ةعلى سالم وإنماالخدمه ىلإعاده الغاليه إو الصيانه. تاثير هذا العطل ليس فقط على تكلفه عملالم ثم
ئللعطل والحد من االرتفاع المفاج األسباب الجذرية دراسة وإختبار يجبالبتروليه. لتجنب هذه المشاكل، المشتقات
أقل من يبقىأن نوعية البخار الفعلي ينبغي دائما أن نتيجة الدراسهظهرت ولقد أ. للضغط والتحكم بكميه احتراق الوقود
نتاج البخار إفي ئ معدل االرتفاع المفاجفان ذلك, ىباالضافه الالحد المسموح به لمنع ارتفاع درجه حرارة االنبوب.
.للمراجل البخاريهيجب ان ال يتجاوز الحد االقصى المسموح به من قبل الشركات المصنعة
درجة الماجستير في العلوم
جامعة الملك فهد للبترول والمعادن
الظهران المملكه العربيه السعودية

1
CHAPTER 1
INTRODUCTION
1.1 Problem Statement
Steam generators that are commonly used in many industrial processes may experience
rapid and dynamic changes in the steam demand and affect boiler integrity. These changes
result in rapid variations in drum pressure and water levels in the drum that results to
operate boiler tubes dry and cause a tube rupture. The boiler tubes in natural circulation
boilers may suffer tube burnout because of rapid changes in boiler operating variables
such as over firing, drum pressure, flame impingement, and steam-water ratio. Tube
overheating and high stresses may cause tube failure resulting in unscheduled boiler
shutdown that may interrupt plant operation. The problem impact is not only due to the
cost of replacing defective parts but also due to the frequent need of system shutdown and
the possible imminent safety hazards. To avoid such problems, root causes of the failure
and limits of boiler load rates changing to control boiler firing in order to prevent tubes
overheating are measured and investigated.

2
1.2 Objectives
This study is aimed to provide actual and experimental measurements and analysis of
boiler main parameters response to step variation in fuel and steam flow rate. The
objective of measuring and determining those parameters are to control the level in the
steam drum, change inventory with load change, minimize interaction with combustion
control, and properly balance input and output. All of these parameters are linked directly
to boiler tubes integrity to avoid tube starvation phenomenon. In addition, Three (3) cases
of actual boiler tube rupture were investigated by measuring all the operating parameters
caused tube rupture. Last but not least, a survey was conducted on rapid response boilers
technology and the latest boiler design in the market which is summarized and referenced
in this study as a recommendation.
1.3 Thesis Outline
This thesis contains eight (8) chapters as follows:
Chapter 1: Introduces the boiler tube raptures where the problem statement and objectives
of the present thesis are discussed.
Chapter 2: Literature review which is focused on previous research work of relevance to
the present topic and the actual boiler tube rupture reports. This section is divided into
five (5) sections covering different aspects related to boiler operation dynamics. These are
dynamic and simulation models, boiler control systems, thermal stresses, uncertainty
analysis for boiler swing rate, and rapid response technology.

3
Chapter 3: Introducing Saudi Aramco steam system is illustrated. This section is divided
into four (4) main sections covering steam generation systems, steam quality, types of
boilers, and major steam system components.
In Chapter 4: Boiler operation and control were discussed in eight (8) main parts that
discuss boiler operation in every boiler tube section.
In Chapter 5: Collected field data measurements are illustrated and discussed for typical
Saudi Aramco boilers.
In Chapter 6: Evaluations of actual boiler tube failures were discussed and three (3) cases
of actual boiler tube rupture were investigated by measuring all operating parameters
caused tube rupture.
Chapter 7: Discussion and analysis of results of the actual boiler tube failures discussed in
chapter 6. In addition to that, other tube failures mechanisms were discussed.
In Chapter 8: Conclusions of this study are presented. The recommendations in how to
avoid tube rupture and the latest boiler technologies in the market are presented. A
proposed direction for future research is also presented to study boiler operation under
low operating load.

4
CHAPTER 2
LITERATURE REVIEW
The literature search was focused on previous research work of relevance to the present
topic and the actual boiler tube rupture reports. The literature review has been divided into
five (5) main parts covering different aspects related to boiler operation dynamics. These
are dynamic and simulation models, boiler control systems, thermal stresses, uncertainty
analysis for boiler swing rate, and rapid response boiler technology. It was found that
most of the previous work done on boilers was focused on boiler control and stresses
during start-up. Very few were related to the explanation of the boiler tube ruptures;
however, several failure cases have been collected from Saudi Aramco facilities related to
tubes ruptures under different root causes.
2.1 Dynamic and Simulation Models
Boiler operations face many challenges stemming from various economic, regulatory and
safety issues. Dynamic simulation models of boilers provide a very cost effective tool to
study plant transient characteristics with the aim to improve the design and control
strategies to meet stringent operational requirements. In the present investigation, it is
essential to be able to analyze the dynamic response of the boiler system due to changes in

5
the input values, system parameters and operating conditions. Such a goal can be achieved
via numerical simulation of the boiler’s system dynamic model with sufficient built-in
details. Dynamic models of boiler systems can be developed on the basis of laws of
conservation of mass, momentum and energy as applied to the various system’s
components or modules. The model also necessitates the use of several empirical
formulae, e.g. to account for friction effects, and heat transfer coefficients. Also, the fluid
properties must be accounted for as given by the standard water-steam tables. In the
literature, there are several models of boiler systems built for different objectives.
Davidenko and Rushchinskiy [24] investigated the numerical solution of a set of partial
differential equations representing a flow in a straight channel of a boiler. A single phase
flow was considered and simplified empirical expression of a standard heat transfer
coefficient was employed. Kar et al. [42] discussed the procedure of mathematical model
validation. Steady state, control tuning and dynamic response validations were treated.
Theoretical, technical and practical aspects of model identification and use in supervisory
control of dynamic matrices for different types of fossil fuel power plants were discussed
by Rovnak [64]. The control structures for once-through and drum boilers were reviewed
including a discussion of modification necessary for conversion to matrix base controls.
The control of dynamic, non-linear models that replicate the response to actual plants was
demonstrated. The author demonstrated the feasibility of applying a matrix controller for
the multivariable control of a power boiler. Results of a dynamic simulation indicate that
tight regulation of steam pressure and temperature can be achieved during significant load
changes. The analysis can be applicable to drum-type boilers and boilers with various
configurations of reheaters and superheaters.

6
Green et al. [35] developed a computational code for the thermal analysis of a once-
through boiler operating in power stations employing advanced gas-cooled nuclear
reactors (AGR). In these boilers, the primary fluid (carbon dioxide) flows through the gas
circulators and up through the reactor core where it is heated. The gas then flows down
through the boiler and heats the water flowing up through the boiler tubes. One of the
problems in the AGR boilers are the transition perturbations occurring as a result of
normal operational control (such as start-up and shut-down processes) causing damage to
the boiler tubes and their support structures. The developed code dealt with the analyses
of fluid flow and heat transfer of the primary and secondary fluids and utilizing the data
obtained from actual measurements of various physical quantities as input data. The code
contained two models. The first model was a one-dimensional model dealing with the
transient and steady state performance of one of the tubes of multi-tube boiler. The model
was based on one-dimensional differential equations of mass, momentum and energy
conservation. The model assumptions included constant pressure of the primary fluid
along the boiler, negligible longitudinal heat conduction in the fluid and pipe metal, and
others. The model utilizes empirical correlations for heat transfer, dry-out, frictional
pressure loss and two-phase voidage. The second model was a boiler multi-tube model
that takes into account the differences between various tubes and the resulting effect on
fluid flow, heat transfer and tube surface temperature. The authors indicated that the code
predictions have shown a good agreement with the plant data. De Mello [25] has
demonstrated the validity of simplified boiler models that have previously been used to
represent steam turbine mechanical power response including boiler pressure. Boiler
response characteristics derived from the basic energy balance, mass balance and volume
balance relations using physical boiler parameters were compared with those obtained

7
from two other simplified models, one which matched both the steady state and transient
open loop boiler response characteristics, and a simpler model which matches the initial
open loop response. It was shown that both simplified models yield acceptable results of
the boiler response including pressure controls. Peet and Leung [60] discussed the
development of a dynamic simulation model and its application in the study and design of
drum-type boiler system to meet the operational requirements of fossil fuelled steam
plants and to achieve flexible and economic production of steam.
Astrom and Bell [9] described a simple non-linear model derived from first principles for
a drum boiler. The model is characterized by a few physical parameters that are easily
obtained from construction data. The models were found to capture the major dynamical
behavior and were validated against experimental data. The models require steam tables
for a limited operating range. The model is capable of capturing the essence of the steam
generation in a heated pipe. Astrom and Bell [9] derived from first principle a non-linear
model for steam generation processes. Comparison with data from plant experiment
indicated that the model derives the behavior of the system quite well. The predicted
pressure swing was large in general. The results showed that increasing the metal mass
results in a decrease in the swing of the pressure. Possible modifications to the model
include dynamics in the model of circulation flow or making a finer subdivision of the
risers. Also, Bell and Astrom [14] derived from first principles a non-linear model for a
drum boiler. The model is characterized by a few physical parameters that are easily
obtained from construction data and steam tables. Comparisons with data from plant
experiments covered a large operating range for a plant at low and high loads. The results
of experiments at low and high loads included changes in fuel flow, feed water and steam

8
demand. The agreement of the model results with plant data was good. The pressure
dynamics predicted agreed with the plant data. The model captured the major dynamical
behavior of the process which is verified by the extensive comparisons with real plant
data presented in the paper. Wigren [77] applied a recursive prediction error method based
on a restricted non-linear state space ordinary differential equation model to simulated
data obtained from a second order non-linear simple drum-boiler model using ideas and
models from Astrom and Eklund [11,12]. The sustained fast load increase was found to
depend on the steam supply system’s storage capacity, the earliest and fastest possible
firing rate of the boiler and the utilization of the additional fast load response methods.
Design data and load increase results were reported for three 600 MW units operating
under three conditions. The first is the case of fast load response with small energy
storage capacity. The second is the case of modern drum-type boiler designs that can
provide faster load response with decreasing storage capacity and the third is the case of
large energy storage capacity but slow load response that is typical of conventional drum-
type boilers. It was found that approximately 5% sustained fast load response is a realistic
maximum.
Water circulation control of steam generation is an important problem that must be
considered for plant safety and reliability. Poor control leads to frequent shutdown. Water
circulation in natural circulation drum-boilers is one of the critical problems in boiler
technology. Poor water circulation may cause tubes burnout resulting in unscheduled
boiler shutdown and interrupting plant operation. Such poor circulation may arise from
operational-type problems such as rapid changes in boiler load causing rapid changes in
the heat flux as a result of rapid changes in fuel flow rates. During the last few years,

9
some boiler explosions were attributed to poor water circulation Pereyra et al. [62]. As a
result, calculations and measurements of water circulation and other operating parameters,
such as steam quality and void fraction, have become more important not only for boiler
manufacturers but also for large industrial establishments. Adequate water circulation is
necessary to cool tubes that form the boiler walls. Criteria are required to determine the
potential for tube overheating. These criteria can be applied using transient circulation
modeling and calculations to identify problem areas. Modeling the steam generator
system including boiler drum, riser and downcomer tubes is one of the important
problems. Many previous investigations were conducted with the objective of
understanding the transient behavior of the system. Drum boiler model which runs in real
time has been developed by Flynn and O' Malley [31] and validated using dynamic data
recorded on an actual plant. The model can be used for dynamic simulation studies in long
time frames, greater than 30 seconds, in particular where assessment of deviations of
internal parameters, such as steam pressure, drum level and steam temperature outside
safety limits is essential. The authors indicated that the model can be useful for predicting
performance capability while also modeling critical internal variables such as drum level
and steam temperatures which may cause the unit to trip if safety limits are violated. The
convective heat transfer coefficient in the boiler tubes was approximated to the Dittus-
Boelter formula for turbulent fluid flow. Leva et al. [51] discussed the difficulties
associated with model validation. They presented the results of boiler model validation
against a lab scale drum boiler set up. The work gave insight of the validation process.
The most critical step is the collection of significant data and also in the data
reconciliation. Inoue et al. [45] carried out a computational simulation for a power plant
equipped with a once-through boiler under changes in the power system frequency. The

10
plant control system was modeled together with the boiler-turbine control system
considering a large-size plant undergoing changes in the system frequency. The model
was subdivided to three models, namely, the boiler steam pressure model, the turbine-
governor model and the plant control system model. In the steam pressure model, a
number of nodes were selected including an evaporating node, a superheating node, a
steam line node and a reheater node. The pressure at each node was determined using a
simplified lumped model that was based on applying the mass and energy conservation
equations. The model was tested under different operating conditions and the sample
simulation results were found to be close to actual responses.
Motivated by model-based control, Astrom and Bell [13] developed a nonlinear dynamic
model for drum boilers. The model describes the complicated dynamics of the drum,
downcomer, and riser components. The model is based on physical parameters of the
plant. The goal was to develop a model which captures the key dynamical properties over
a wide operating range. The model is based on physical principles with a small number of
parameters. In their work particular attention was given to the dynamics of the drum level
as it has been recognized that drum level control is an important factor in power plant
operation. The model has four states; two states account for storage of total energy and
total mass, one characterizes steam quality at the risers output assuming linear variation of
the steam quality along the length of the risers, and another for the steam distribution in
the drum. The model is augmented by quadratic approximations of the steam tables and
physical parameters thus derived. The model has been validated against plant data with
very rich excitation that covers a wide operating range. These experiments have given
insight into the behavior of the system and have guided the modeling effort. The model is

11
nonlinear and agrees well with experimental data. The model gave insight into the
behavior of the system and in particular to the complex shrink and swell phenomena
associated with the drum water level. The model had a basic assumption of taking the
metal temperature identical to the steam saturation temperature. Changing et al. [17]
provided a dynamic model in terms of drum pressure and water volume assuming metal
temperature identical to fluid temperature. The drum level was given in terms of steam
residence time below the water level which is related to steam rise velocity. No expression
was given for the steam rise velocity. They assumed it to be obtainable from test data
without discussing the procedure for doing that. Dong and Tingkuan [27] developed a
computational model for the thermal-hydraulic simulation of the start-up period of a once-
through boiler equipped with various integral separator systems. The model was based on
an improved analytical-numerical method for solving the continuity, momentum and
coupled energy equations for the flue gas and the working fluid to obtain the transient heat
transfer occurring in the different components of the system. The results obtained from
the computational model were compared with the measured data of a 600-MW once-
through boiler. The comparison, which included the main steam pressure, the water
separator level, the economizer pressure as well as its inlet and exit temperatures showed
a reasonable agreement.
A drum boiler start-up simulation program for controlled and natural circulation boilers
was developed by Li et al. [52]. The model is based on the principles of mass, energy and
momentum conservations. The simulation results were compared with experimental
measurements. The program can be used for predicting the characteristics and the
performance of controlled circulation and natural circulation boilers during the startup

12
process. Boiler start-up was also considered by Kruger et al. [46] where fast startups were
discussed. It was suggested that startups can be optimized such that to limit the metal
temperature and steam pressure excursion from safe operational limits. Mathematical
details of the underlying system model were not given. Daren and Zhiqiang [23] provided
and evaluated a nonlinear coordinated controller through computer simulation using a
well-established and validated nonlinear boiler-turbine model. The simulation results were
presented to illustrate the performance of a nonlinear coordinated control system and
compare the proposed strategy with the conventional direct energy balance control
strategy. Deployed a model that optimizes the dynamic performance of steam boilers by
optimizing the design and the operation of the boilers. The model consists of a number of
differential equations and algebraic equations. The equation systems are integrated by the
mean of MATLAB’s solver. The optimized cost function/ objective function included the
weight of the boiler, the price of the consumables consumed during dynamic operation of
the boiler and quantification of the steam boilers capabilities with respect to dynamic
operation. As an output from the model, the required volume of the steam drum is given.
The results of this model have been implemented into the design and operation of boilers
in the industry and have resulted in cost savings and establishment of new products.
Tucakovic et al. [74] presented a method for carrying out a thermal-hydraulic simulation
and analysis of a forced circulation loop of a large steam boiler in which the evaporating
tubes in the furnace are of rifled type. The effects of rifled tube geometry on the heat
transfer process, thermal margin against burnout and friction pressure drop in the water
circulation loop were considered. The coupled thermal processes on the furnace gas side
and the thermal-hydraulics inside the evaporating tubes were performed for the entire
13
range of the plant operating loads. The paper focused on the hydraulic calculations of
both forced and natural circulation loops. The thermal safety margin (against burnout) of
rifled tubes was predicted and compared with that of smooth tubes for uniform and
variable heat loads on the walls of the furnace. The wall temperatures of the rifled tubes
were safer even under condition of high void fraction of the water/steam mixture that
prevents the occurrence of critical heat transfer conditions. The pressure drop in the rifled
tubes was also analyzed and compared with that of smooth tubes. The range of operating
conditions in which there is no need of circulation pumping was also investigated.
2.2 Boiler Control Systems
The main control problems that are normally handled are the combustion control and the
drum level control. The combustion control is mainly aimed at providing the right energy
input to maintain the drum pressure. It is also aimed at controlling the air to fuel ratio to
minimize the incomplete combustion and limit the excess air to achieve economic
operation at different boiler loads. The objective of the boiler drum level control systems
is to maintain the water/steam interface at its optimum level to provide a continuous
mass/heat balance by replacing the steam leaving the boiler with feedwater to replace it.
The interface level is subjected to several disturbances in the water/steam drum. These are
the drum pressure and feedwater temperature. As steam pressure rises or falls due to load
demand there is a transient change in drum level due to the expansion or contraction of
the steam bubbles in the drum water. When the steam pressure is lowered the water level
rises as the steam bubbles expand (swell). Conversely as the steam pressure rises the
water level lowers as the steam bubbles compress (shrink). Also as sub-cooled feedwater

14
enters the water/steam drum it cools the drum water at the entry point to below the
operating pressure boiling point. This acts to condense the steam bubbles in the boiler
drum water and collapse the steam blanket. Thus it is important that the water/steam drum
is large enough to absorb this sub-cooled water without being overly effected by its
influence.
As steam demand increases, there is an initial lowering of the drum pressure resulting in
an artificial rise in drum level as the steam bubbles expand and swell drum water level.
Using a single element, drum level control could send a wrong message when the demand
for steam increases and the pressure decreases. This phenomenon sends a false control
signal to reduce feed water flow, when in fact the feed water flow should be increasing to
maintain mass balance. Conversely, on a loss of steam demand, there is an initial rising of
steam drum pressure which acts to lower the drum level by compressing the steam
bubbles and shrinking the drum water level. This sends a false signal to increase feed
water flow when in fact it should be decreasing to maintain mass balance. In two element
control, steam flow is measured and added to the math summing function as the second
process variable. The two-element drum level system is suitable for processes with
moderate load swings and speeds, and it can be used on any size of boiler. This system
uses the two variables, drum level and steam flow to mass balance the feedwater demand.
Drum level is measured and the error between the desired setpoint and the actual control
point is sent to a math summing function as one of two process variables. The result of the
math summing function is the control output to the feedwater control valve. Since steam
flow is very dynamic, the result of this control method is that it will sense the rise or fall
in load demand before the drum level begins to change. The control system then adds or

15
subtracts control output to stabilize the reaction of the drum level controller on the
feedwater control valve. Since steam flow is normally the larger variable it can easily
override the trim effect of the drum level measurement on moderate load changes,
insuring a correct response to the demand change. The two element drum level control has
two drawbacks, which should be considered. First like the single element method, the
two-element control cannot adjust for pressure or load disturbances in the feed water
supply, as this is not a measured variable in this control system. As well, the two-element
control cannot eliminate phasing interaction between feed water flows and drum level
because only the relatively slow process of the drum level is controlled. This second issue
can lead to sub-cooled drum water on a large increase in demand by allowing excessive
feed water to enter the drum without consideration to the boilers thermal dynamic
capabilities. Three-element drum level control addresses these issues of phasing present in
the two-element control method. It introduces a third element which is the feed water flow
that is added to the drum level control method. The three-element method can easily
handle large and rapid changes because it matches the mass balance between the steam
flow from the boiler and feed water flow to it. This method is a must in boilers sharing the
same feed water and supply system due to variations in the available feed water flow to
any one boiler while two or more boilers are online. Also if the boilers are subjected to
sudden or unpredictable demand changes such as in a batching process, the three element
system is capable of matching these demands without operator trim corrections.
Silva et al. [66] described the application of a predictive adaptive controller to the
regulation of superheated steam temperature in a commercial boiler. The objective of the
investigation was testing the use of predictive adaptive controller for the regulation of
superheated steam temperature in the presence of load changes. The steam generated

16
from the boiler flows through a low temperature superheater and then receives a spray of
water injection before passing through a high temperature superheater and then to the
steam collector. The steam is then extracted from the collector to the turbine or to other
industrial users. Due to the variations in the steam consumption, the temperature of the
superheated steam changes and must be regulated using controls on the spray water valve.
The boiler considered had a capacity of 150 t/h of steam at maximum load, used both for
electric energy production in a turbine and industrial use. The combination of predictive
and adaptive techniques, relying on multiple models redundantly estimated, allowed a
continuous adjustment of the controller tuning for tracking plant dynamics variations. The
authors described experiments actually performed on the plant with adaptive predictive
control, in particular in the presence of load changes. A reduction of steam temperature
fluctuations with respect to an optimized cascade of PI controllers was observed. The
predictive adaptive control system was found to provide better performance in comparison
with the standard controller. Ben-Abdennour [15] presented a fuzzy supervisory scheme
to improve the performance of the boiler response during severe disturbances. This
scheme consisted of a robust local controller designed using the Linear Quadratic
Gaussian with Loop Transfer Recovery (LQG/LTR). He suggested that LQG/LTR system
has the advantage that the variations in the interconnection variables can be modeled as
uncertainties in the boiler model. The set-points to the controller were modified whenever
necessary by a supervisor partially based on fuzzy logic. The system utilized a nonlinear
model which solves differential equations for the pressure water swell and shrink effects
and fluid density. The author compared between a classical controller and LQG/LTR
controller. In the classical controller, the boiler was controlled by two decoupled
controllers (one for level and one for the pressure). The level is controlled by PI

17
controller. The PI controller exhibited a frequency response similar to a low pass filter. It
works on a linearized model. The discrepancy between a nonlinear and linearized model
makes tuning of the classical controllers unavoidable. It was concluded that LQG/LTR
results in improved boiler performance. It was also concluded that adding a supervisory
loop to monitor the boiler variables can significantly improve the performance even
further.
Farthing [30] presented the advantages of using advanced automatic control systems for
combustion control. He stated that such control systems can help in improving the overall
combustion efficiency and burner stability over varying loads. The paper described the
operation principle for a number of control systems including fixed position parallel
control, parallel position control, series metered control and cross-limited metered control
(CLC) systems. The CLC system was found to be a dynamic system that compensates for
differences in response times of the fuel and air end devices. He concluded that the system
flexibility allows its use in units experiencing sudden and large load swings as well as
steady state operation. The author also concluded that the most sophisticated control
systems could eliminate the need for operator input during load changes while
maintaining safe and reliable fuel-air ratio control. Yang et al. [80] proposed a new
approach for water level control in power station based on an internal model control using
neural networks. The control system adopted the steam flux signal to the internal model
controller. The influence of load changing, which has the ability of feed-forward
compensation for steam flux disturbance was considered. The authors indicated that the
system also can avoid “false water level” phenomenon. The basic start-up strategy of
steam boilers, considering the maximum allowable thermal stress and other constraints,

18
was investigated by Kruger et al. [46]. The authors presented models describing the
nonlinear behavior across a wide range of operating conditions, and are used for control
optimization, either computing a priori improved reference and input values or for an on-
line nonlinear model predictive controller application. After the mathematical formulation
of the boiler start-up optimization problem and of the cost function, including the related
hard constraints for inputs and states, the optimal reference and input control were
calculated using a multi-stage control vector parameterization method. The results of this
optimization process were optimal reference values and the corresponding input
trajectories. The control structures applied minimize both the fuel consumption and start-
up time of the boiler.
On-line optimization of drum boiler startup was investigated by Franke et al. [32]. The
optimization is based on a simple non-linear drum boiler model from the literature. The
model was implemented in Modelica using the new Modelica-Media and Modelica-Fluid
base libraries. The model exhibited three control inputs: feed water flow rate, heat input,
and position of a valve at the steam outlet. A PI control was embedded into the model for
the feed water flow. The other two control inputs were optimized. The optimization
results are compared with a straightforward control strategy. The objective was to
minimize the deviation of generated steam pressure and mass flow rate from given
reference points over the time horizon. The cost function was taken to be in terms of the
deviations of the steam pressure and steam flow rate from their reference values. The
reference values of steam pressure and flow rates were 110 bar, and 180 kg/s. The
optimization was subject to the constraints of the fuel flow rate, the valve position, and the
rate of firing. The thermal stress was taken as output constraint. A PI fuzzy controller was

19
designed by Koutbet al. [44] for drum level loop to remove the integrator effect of drum.
The response showed that the level output follows the initial non-minimum phase bump (a
reaction opposite to the final reaction) which would occur if the level was uncontrolled,
and then stabilizes the output at the desired value. They concluded that this behavior is
considered quite good since some bump is unavoidable, due to the non-minimum phase
zero which cannot be canceled, and the output after the bump is reasonably flat. Then with
this controller fixed, a multivariable fuzzy controller for both pressure and power loops
was applied.
Tan et al. [72] discussed the tuning of PID controllers for boiler-turbine units. A simple
model for a boiler-turbine unit was demonstrated in their work. A design and tuning
method for the controlled PID controller was proposed. They suggested that the model
can capture the essential dynamics of a unit. The design of a coordinated controller was
discussed based on this model. A PID control structure was derived, and a tuning
procedure was proposed. Their examples showed that the method is easy to apply and can
achieve acceptable performance. Daren and Zhiqiang [32] provided a nonlinear
coordinated control of drum boiler power unit based on feedback linearization. In their
work, a nonlinear coordinated controller was designed and evaluated through computer
simulation using a well-established and validated nonlinear boiler-turbine model. The real
benefits obtained include improved dispatch rate, tighter regulation of steam pressure, and
reduced maintenance over a wide range of operating conditions. The authors concluded
that these improvements in control can be maintained for large changes in operating
conditions. Xu et al. [79] proposed a cascade model predictive control scheme for boiler
drum level control and compared the results of the scheme to those of proportional

20
predictive control. They considered two loops. The inner loop is the feedwater flow valve
position system and the output is the feedwater flow. The outer loop is the drum level
water flow system and the output is the drum level. By employing generalized predictive
control structures for both inner and outer loops, measured and unmeasured disturbances
could be effectively rejected, and drum level at constant load was maintained. They
concluded that non-minimum phase characteristic and system constraints in both loops
can be handled effectively by generalized predictive control algorithms. Simulation results
were provided to show that cascade generalized predictive control results in better
performance than that of well-tuned cascade proportional integral differential controllers.
The algorithm was implemented to control a 75-MW boiler plant, and the results showed
an improvement over conventional control schemes. Yoon et al. [82] derived an
optimization rule for water level control of the steam generation unit in two Korean
nuclear power plants. The technique led to better performance during sudden load
changes, reduced water level trips, and increased power by 4.9%.
2.3 Thermal Stresses
A large number of studies on the general subject of thermal stresses in cylinders (pipes)
and spheres (vessels) are available in the open literature. Examples are those
investigations of Chang and Chu [16], Sinha [67], Kalam and Tauchert [39], Stasyuket al.
[70], Merah [54], Shadley et al. [65], Naga [55], Tamma and Railkar [71], Obata and
Noda [58], Kandil et al. [41] and Al-Zaharnah et al. [8]. Among these is the study of the
stress distribution in a metal tube, which was subject to a very high radial temperature
variation and pressure by Chang and Chu [16]. From experimental data, the radial
21
temperature distribution across the tube wall and the variations of the modulus of
elasticity and the coefficient of thermal expansion were obtained and taken into account in
calculations. The corresponding solutions were obtained by the method of variation of
parameters and in terms of Kummer series. Examples for the stress solutions were given.
Sinha [67] applied the finite element method to analyze the thermal stresses and
temperature distributions in a hollow thick cylinder subjected to a steady-state heat load in
the radial direction. He studied three test models of a cylinder, with different geometric
configurations, elastic properties, and temperature gradients assuming a logarithmic
temperature field over the thickness of the cylinder. The finite element method results and
the analytical results agreed well.
Stresses in hollow orthotropic elastic cylinders due to steady-state plane temperature
distribution were analyzed by Kalam and Tauchert [39] for traction free boundary
conditions. They obtained analytical solution for the stress field using a Fourier-series
form. A thermal-stress analysis of hollow cylinder with temperature-dependent thermal
conductivity was investigated by Stasyuket al.[70]. Assuming a heat flux on the outside
wall of the cylinder, the temperature distribution was obtained. Formulas for the radial
and tangential stresses were derived. The effect of induction heating stress remedies on
existing flaws in pipes was investigated by Merah [54] and Shadleyet al. [65]. They
showed that the smaller diameter pipes were subjected to higher thermal stresses. Naga
[55] presented a stress analysis and optimization of both thick walled impermeable and
permeable cylinders under the combined effect of temperature and pressure gradients. He
concluded that in thick walled solid and porous cylinder operating under high pressure,
the stress distribution could be optimized by just introducing a heat source in the cylinder

22
in such a way to satisfy certain optimization criteria.
Tamma and Railkar [71] introduced a new unified computational approach for
applicability to nonlinear/linear thermal-structural problems. The approach was
demonstrated for thermal stress and thermal-structural dynamic applications. By
combining the modeling versatility of contemporary finite element schemes in
conjunction with transform techniques and the classical Bubnov-Galerkin schemes, their
proposed transfinite element approach provided a viable hybrid computational
methodology. The steady thermal stresses in a hollow circular cylinder and a hollow
sphere made of functionally gradient material were investigated by Obata and Noda [58].
They discussed the influence of inside radius size on stresses and the temperature regions.
They also investigated the effect of the composition on stresses as well as the design of
optimum functionally gradient material hollow circular cylinder and hollow sphere.
Idemen et al. [37] presented an analysis of thermal stresses within a thick-walled cylinder
under dynamic internal temperature gradient. They presented an evaluation of temperature
and stress distributions, in a non-steady state, using a numerical model. The analysis
revealed that the maximum effective stress always occurs at the inside surface of the
cylinder, and its peak value takes place at the start of the operating temperature. When the
temperature of the inside surface was oscillated, oscillated stresses took place at different
radii of the cylinder. The maximum amplitude of the effective stress was found to be at
the inside surface while the minimum one is at the outside surface. Kandil et al. [41]
performed an analysis of thermal stresses in thick walled cylinders in which they included
the effect of periodic loading conditions. The analysis revealed that independent of the
value of the diameter ratio the maximum effective stress always occurred at the inside
surface of the cylinder and its peak values took place at the start of the operating

23
temperature. They suggested that in order to reduce the effective stress, the inner surface
of the cylinder should be heated gradually up to the operating temperature. A prediction,
using a numerical scheme, of the thermal stresses due to turbulent flow in thick pipes is
made by Al-Zaharnah et al. [8]. The simulations which were made for different pipe
materials and fluids showed that the temperature gradient changes rapidly at the solid-
fluid interface. Similar to what was observed by Kandil et al. [41], the effective stress was
found to have a maximum value at the pipe inner surface for steel. Unlike Kandil's results
which showed that the minimum effective stress is on the outer surface Al-Zaharnah et al.
[8] found that this minimum occurs in the mid-thickness of the pipe. They concluded that
the location of the minimum stress is not affected by the Reynolds number and fluid
properties. They, however, observed that pipe material affects the stress distribution as a
whole.
The problem of the evaluation of stresses due to the effect of both cyclic temperature and
pressure was considered by Kandil [40]. He presented a complete analysis of stresses
within the wall of a cylindrical pressure vessel subjected to cyclic internal pressure and
temperature. The time-dependent stress distribution was obtained using a numerical model
on the basis of the forward finite difference technique. The influence of mean pressure
and mean temperature, pressure and temperature amplitudes, diameter ratio on the
effective stress was studied. The relation between the mean stress and stress amplitude
was obtained for different working conditions. An approximate expression for the relation
between the working parameters was introduced in a simple and direct form. The results
of the approximate solution are found to fit well with the numerical findings. It was
concluded that the internal surface of a cylinder subjected to cyclic pressure and cyclic

24
temperature is exposed always to maximum effective stress. The outside surface was
found to be exposed to the minimum effective stress.
The problem of thermally induced stresses in boilers has been apparent for many years.
These stresses can cause failures which can be abrupt, termed as "thermal shock", or over
a period of time, termed as fatigue failures. The latter are caused by repeated thermal
expansions and contractions within the boiler or its components such as the riser pipe. The
impact type failure "shock" is usually preceded by fatigue of the metal but it has been
observed to happen in short-term overheating. Sharp radius corners and abrupt changes in
thickness of metals can amplify thermally induced stresses. Another area of concern is the
failure of riser tubes due to stress corrosion and thermal stresses. Wolf and Neill [78]
presented some protective measures against thermally induced stress cycling. Among
these, the most important is the difference between boiler supply-water temperature and
the system return-water temperature. As a rule of thumb they suggest that this difference
shall not exceed 40ºF. Failure of boilers by cracking produced by fatigue stress has been
recognized for more than one century. This produces cyclic stresses that result in crack
propagations and failure of boilers. Design of boilers against failure due to thermal
stresses went through a number of improvements going from trial and error type
development to numerical and experimental analyses. Among the important experimental
works is that of Kudryavtseyet al. [48] who developed a method for an accelerated sample
testing of boiler materials. In their tests the experimental conditions were made similar to
the operating conditions. The results from fatigue testing of two different high strength
boiler steels exposed to different heats were used to compare the materials with regard to
their sensitivity to asymmetric loading. The authors recommended that boiler

25
manufacturers should perform similar tests on the materials they intend to use for building
boilers and components.
Kruger et al. [47] developed an optimal control for fast boiler startups. Noting that the
major limiting factor relevant to power plant start-ups is the thermal stress for thick
walled components, they have incorporated in their nonlinear model thermal stress
evaluation modules. They presented a startup control simulation in which drum and
superheater maximum thermal stresses are set as pre-defined constraints. They showed by
simulation that their model will result in drastic reduction of startup time. In a later work,
these same authors Kruger et al. [46] developed a simple equation for estimating thermal
stresses from temperature during boiler start-ups. They stated that the major limiting
factor relevant to fast power plant start-ups is the maximum admissible thermal stress for
thick-walled components such as headers of superheaters and reheaters, and boiler drum.
They suggested that the control task during the boiler start-up should consider the current
values of the thermal stress and coordinate the boiler inputs in order to avoid any violation
of the individual stress limits of each involved thick-walled component. Pronobis et al.
[63] used finite element method to calculate the equivalent stress distribution in the cross
section of the tubes of the superheater in a boiler having steam capacity of 1150t/h
considering non-uniform heat flux distribution resulting from radiation and convection.
The calculated stresses in the tube material result from the inner pressure and from local
temperature gradients. The authors used these stresses to estimate tube lives showing that
small increases in steam temperatures will reduce the tube life tremendously. They also
showed that the assumption of uniform heating of the tube leads to unrealistically long
expected lifetime.

26
2.4 Uncertainty Analysis for Boiler Swing Rate
It is well known that controlling boilers to reach high swing rates or quick startup is
hindered by the stress limits caused by high pressure and temperature of the produced
steam. In setting up controllers it is essential to model the boiler's physics properly.
Accuracy of the model greatly influences the control system design. Actually boiler
models are nonlinear and, consequently, the control parameters are normally sensitive to
the operating conditions. Many attempts have been made to improve the performance and
dynamics of boilers through improvements in modeling and controllers. To minimize
startup time and fuel consumption of drum-type boilers, Kruger et al. [47] developed
optimal control for fast startup based on a nonlinear model with constrains on the thermal
stress level of thick walled components. This was done through optimization of reference
values of rate of boiler heat input, steam pressure and temperature, positioning of the
control values and high pressure bypass. As an extended concept, they require repetition
of the optimization procedure under real time conditions which would require proper
uncertainty analysis. Later, Kruger et al. [46] used a multi-stage controller
parameterization method. Limits of the controller include stress levels for the drum and
header, and steam pressure and temperature overshoot. Pellegrinetti and Bentsman [61]
developed nonlinear control oriented boiler modeling. They indicated that uncertainty in
plant dynamics include drifting due to corrosion and wear in the system, transient
behavior due to inertia of moving fluids in pipes, and sensors noise. However uncertainty
analysis was not included in their research. Nanhua et al. [56] used an adaptive grey
predictor based algorithm to improve boiler drum level control. The method was able to
reduce the effect of false water level, controller parameters mismatch and signal noise of
the drum, but no uncertainty analysis was made. Nonlinear coordinated control of drum

27
boilers that is based on feedback linearization showed some improvement in the dispatch
rate of steam with tighter regulation of the pressure [Daren and Zhiqiang, 23]. Steam
temperature fluctuation was reduced through adaptive predictive control system [Silva et
al., 66]. Measured and controlled parameters include inflow of air to the furnace, spay
water flow rate, superheated steam flow rate, temperature and pressure, water level in the
drum and fuel flow. The experiment did not include uncertainty analysis of the results or
controls.
Uncertainty analysis has been applied successfully to contribute to the development of
designs, confidence level of thermal models, and facilitate risk assessment [Macdonald
and Strachan, 53]. Usually boiler manufacturers specify sub-critical steam pressure and
temperature to control fuel feed rate. The result is that "the reserve margins are not being
utilized" [Krüger and Rode, 46]. Uncertainty in monitoring different parameters such as
water drum level, fuel flow and caloric values, steam pressure and steam temperature, and
flow rate will definitely affect boiler control and allowable swing rates. Sources of error
include inherent sensors errors, installation errors, drifts, and operating environment.
Uncertainty analysis is a method that can be utilized to evaluate the sensitivity of boilers
performance to different parameters. This will aid also in determining uncertainty limits
for sensors and devices used for optimal control of boilers. To the best knowledge of the
researchers of the present project there is no disclosed literature that provides systematic
uncertainty analysis for boiler modeling or control.
28
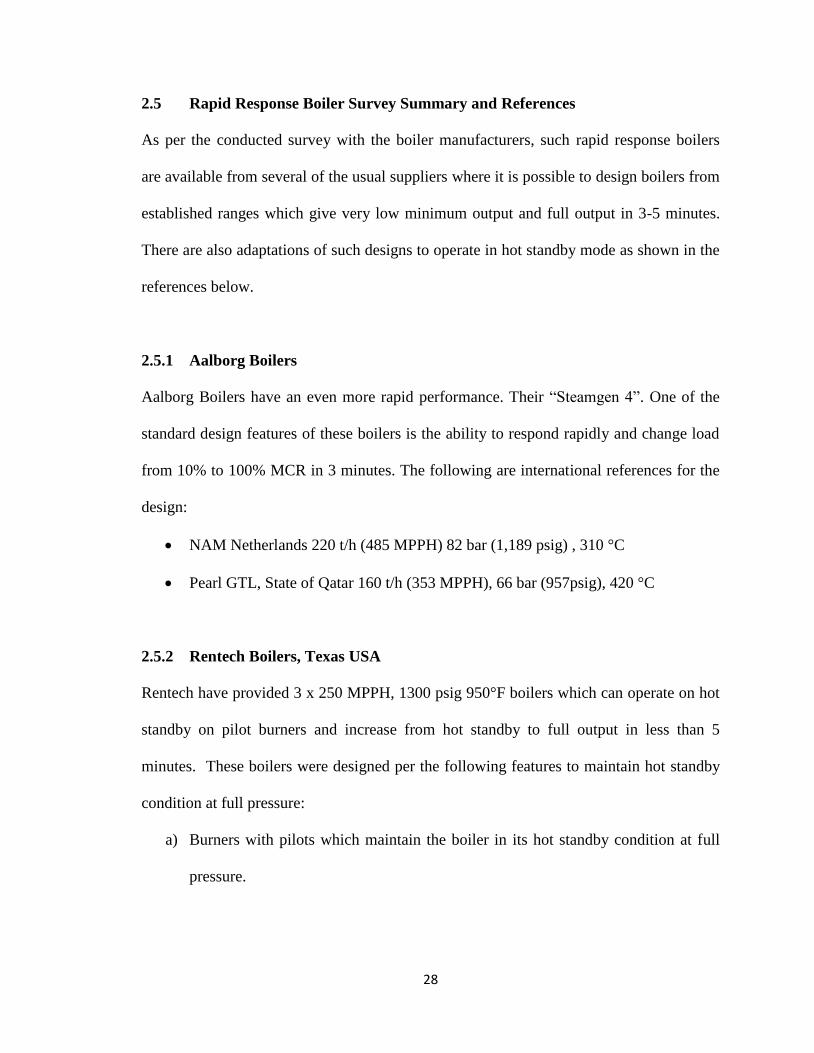
2.5 Rapid Response Boiler Survey Summary and References
As per the conducted survey with the boiler manufacturers, such rapid response boilers
are available from several of the usual suppliers where it is possible to design boilers from
established ranges which give very low minimum output and full output in 3-5 minutes.
There are also adaptations of such designs to operate in hot standby mode as shown in the
references below.
2.5.1 Aalborg Boilers
Aalborg Boilers have an even more rapid performance. Their “Steamgen 4”. One of the
standard design features of these boilers is the ability to respond rapidly and change load
from 10% to 100% MCR in 3 minutes. The following are international references for the
design:
NAM Netherlands 220 t/h (485 MPPH) 82 bar (1,189 psig) , 310 °C
Pearl GTL, State of Qatar 160 t/h (353 MPPH), 66 bar (957psig), 420 °C
2.5.2 Rentech Boilers, Texas USA
Rentech have provided 3 x 250 MPPH, 1300 psig 950°F boilers which can operate on hot
standby on pilot burners and increase from hot standby to full output in less than 5
minutes. These boilers were designed per the following features to maintain hot standby
condition at full pressure:
a) Burners with pilots which maintain the boiler in its hot standby condition at full
pressure.

29
b) The boiler has been designed to provide adequate water flow during rapid
increases in steam flow and the control of drum water level was a significant
consideration.
c) There was considerable attention paid to the design of the superheater to ensure
that it cannot be damaged by rapid increases in firing.
2.5.3 NEM Boilers
NEM design shows that it is reasonable to design a boiler which can operate economically
at low loads as a hot standby and ramp up from standby to full output in 5 minutes.
2.5.4 Cleaver Brooks Boilers USA
The boiler achieves hot standby to full output in 4-5 minutes which is similar to the other
examples.
2.5.5 Extracts from “Trends in Packaged Boiler Design”
Demand from the marketplace is increasing for special features including low emissions,
quick startup requirements, hot standby operation, heavy cycling ability, high turndown
and increased efficiency, to name a few.
The unit will be in standby condition most of the time, but must be able to achieve full
load within 4-5 minutes upon a system trip of the main HRSGs. This requirement was
achieved with some outside-of-the-box thinking. Cleaver-Brooks’ proprietary Natcom
burner includes a unique "Center Core" stabilizing gas injector that is usually used to

30
improve flame stability and turndown. For this application, the Center Core is also used as
a second smaller burner during hot standby. Heat input is approximately 5% MCR. This
maintains the boiler at pressure so it can be ramped to full load in a short period. A small
dedicated fan is used during hot standby to avoid operating the main FD Fan, which saves
considerable money over time. Once the main fan is started up, the main gas lances are lit
off and the unit can immediately begin ramping, which saves time. A lower drum steam
heating coil is also provided to further assist in maintaining the boiler in hot standby. [6]
2.5.6 Tioxide Calais Plant (SFL Boilers)
This plant was designed with a very fast acting standby steam supply should a cogen fail.
Standby steam is provided by two standby boilers operating at 580 psig 482 °F which are
maintained at pressure as hot standby by pilot burners which provide 5% heat input.
The180,000 Ib/hr boiler was constructed by SFL of the Netherlands. The following
extract from a report on the installation shows the operation of the pilot burners and the
extremely rapid increase of heat input into the boiler.
“In order to maintain the boilers in «stand-by» mode, permanent pilot burners for 5 % of
the max heat release have been installed. They allow maintaining the boiler ready to
immediately increase its load by lighting up the main burners, increasing their heat
release up to 100 % in about 30 seconds”.

31
2.6 Concluding Remarks
In summarizing the work published in the literature on the dynamics and control of drum
boilers, the literature review was divided into five main parts. The first four parts cover
theoretical and experimental investigations on dynamic and simulation models, boiler
control systems, thermal stresses, uncertainty analysis for boiler swing rate, and rapid
response boiler technology. The above examples clearly demonstrate the value of
dynamic simulation for the investigation and development of boiler control and enhanced
operational procedures of drum boilers. The ability to perform transient analysis on the
proposed equipment with the control algorithm prior to the finalization of the design
phase assures the satisfactory operation of boilers. The previous work does not provide
focused work on the boiler tubes rupture or root causes. As well, from the above literature
review, it can be seen also that none of the authors addressed the specific problem of
thermal stress variation in the bend of the boiler riser tubes. Furthermore, all the research
works that dealt with thermal stress variations in boilers and heaters have done it for start-
up operations only.
Water circulation control of steam generation is an important issue that must be
considered for plant safety and reliability. Poor control leads to frequent shutdown. Water
circulation in natural circulation drum-boilers is one of the critical problems in boiler
technology. Poor water circulation may cause tubes burnout resulting in unscheduled
boiler shutdown and interrupting plant operation. Such poor circulation may arise from
operational-type problems such as rapid changes in boiler load causing rapid changes in
the heat flux as a result of rapid changes in fuel flow rates.

32
CHAPTER 3
INTRODUCTION TO STEAM SYSTEM IN SAUDI
ARAMCO
The main purpose of a boiler is to supply steam to be used as a source of mechanical
energy such as for a steam turbine and a source of heat such as a steam reboiler on a
distillation column. This Chapter is introducing Saudi Aramco steam system which is
divided into four main sections covering steam generation systems, steam quality, types of
boilers, and major steam system components.
3.1 Steam Generation Systems
Steam is an energy source that is readily used for many applications. The pressure level of
the steam will depend on the application. Higher steam pressure levels allow more
mechanical energy to be extracted. Higher steam pressure levels also have higher
associated temperatures which may not be suitable for all applications. Most plants have
steam distribution at more than one pressure level. The key elements in this system are the

33
boilers, the distribution system, and the users. Supply of boiler water makeup to the
deaerator and recovery of condensate for recycling are also parts of the steam system. The
recovery of condensate significantly reduces the expense of treating boiler water makeup.
The steam distribution network consists of piping and valves that interconnect between
the boilers and the consumers of steam. Steam can be produced and consumed at various
pressure levels. These pressure levels are usually connected via pressure reducing and
steam de-superheating stations, so that the higher pressure steam can supplement the
supply of lower pressure levels. Although not standardized, Saudi Aramco plants
commonly use steam pressure levels range from 15 to 625 psig. Most plants have a high
pressure (HP) level of about 600 psig and one or more lower pressure levels. For example,
steam pressure levels at Abqaiq are 625 and 60 psig, and at Ras Tanura the steam pressure
levels are 600, 225, 150, and 60 psig. These 60 to 225psig levels are referred to as
medium pressure (MP) levels. Usually there is also a low pressure (LP) level at about 20
psig. Treated boiler water makeup and condensate are fed to a deaerator which strips out
gases such as oxygen and carbon dioxide prior to introduction of the water to the boiler.
These gases are undesirable because of their corrosive attack on metal surfaces. The water
is deaerated by heating the water to its saturation temperature (boiling point) to reduce the
oxygen solubility and stripping with steam to carry away the dissolved gases. The
deaerator operating temperature is usually the same as the LP steam system (15 psig).
Boiler feed water (BFW) pumps deliver BFW from the deaerator to the boiler. Two or
more pumps are provided to ensure a reliable supply of water to the boiler.

34
3.2 Steam Quality
There are two steam qualities: saturated steam and superheated steam. Saturated steam is
steam produced at its boiling point. At atmospheric pressure, this temperature is 100ºC
(212ºF). At 150psig, this temperature is 185ºC (366ºF). Saturated steam tables list the
pressure and temperature of saturated steam. These steam tables also list the enthalpy
(total heat content) of saturated liquid and steam and the heat of vaporization as well as
specific volume of saturated liquid and steam. Specific volume is the inverse of density.
Superheated steam is steam that has been heated above the boiling point at which it was
created. For example, if steam was at atmospheric pressure and 150ºC (302ºF) we would
say that it contains 50ºC (90ºF) superheat because it is 50ºC (90ºF) over the boiling point
of 100ºC (212ºF). There are also superheated steam book tables in the literature which list
the pressure, temperature, enthalpy, and specific volume of superheated steam.
Superheated steam has the advantage that cooling will only change the temperature of the
steam until it reaches the saturation temperature. Cooling saturated steam will result in
liquid water being produced. In many applications liquid water in the steam is undesirable
and can cause severe maintenance problems.
3.3 Types of Boilers
There are many types of boilers that are normally used for steam production. The
following main types of boilers will be discussed:
1. Package or field erected
2. Fire Tube Boiler
3. Water Tube Boiler

35
4. Natural or Forced Circulation
Several figures where illustrated that give some indication of the pressure and size for the
different types of boilers. Electric and fire tube boilers are small boilers and rarely used.
Large boilers are field erected and may have forced circulation. Package boilers fall in
between the very large and very small.
3.3.1 Packaged/Field Erected Boilers
The smaller sized boilers are usually shop assembled and delivered to the field as a
complete unit. Shop assembly reduces cost. These units are called packaged boilers. The
maximum size of package boilers depends largely on transportation limits. Larger units
can be shipped in a few modules which are assembled in the field. Many Saudi Aramco
boilers are packaged boilers, with the largest having a capacity of about 600,000 lb./hr of
steam at a design pressure of about880 psig. Larger sized boilers are field erected.
3.3.2 Fire Tube Boilers
In a fire tube boiler the fire and hot gasses are inside the tubes. Fire tube boilers are
generally of small size (under 100,000 lb./hr and more commonly under 50,000lb./hr) and
relatively low pressure (under 250 psig and more commonly under 150 psig). Fire tube
boilers are usually package boilers and skid mounted. An example of a fire tube boiler can
be found in the old steam railroad locomotives as shown in Figure 1.

36
Figure 1: Typical Fired Tube Boiler
Note: This photo is taken from Saudi Aramco encyclopedia
3.3.3 Water Tube Boilers
Most boilers are water tube boilers in which the water is in the tubes and the fire and hot
flue gases are outside the tubes. Figure 2 shows a typical water tube boiler that is
constructed like a process heater with the fire in a box and the water tubes along the sides,
bottom and top of the box. Water tube boilers have no real pressure or size limitations.
Figure 2: Typical Water Tube Boiler
Note: This photo is taken from Saudi Aramco encyclopedia

37
A drum known as the steam drum is located at the top of the water tube boiler in which
steam is separated from the water as shown in Figure 3. BFW is fed to the steam drum.
Water circulates from the steam drum down through down comer tubes to a drum at the
bottom of the boiler called the mud drum. The water then circulates up the riser tubes
where the steam is formed and returns to the steam drum where the steam is separated.
Figure 3: Water Tube Boiler Major Parts
Note: This photo is taken from Saudi Aramco encyclopedia
3.3.4 Natural/ Forced Circulation Boilers
All Saudi Aramco boilers are currently natural circulation boilers like those in Figure 2
and Figure 3. Natural circulation is caused by density differences in the fluid in the
downcomer and riser tubes. The down comer tubes are located in a cooler part of the
boiler and little boiling occurs in the down comer tubes. The riser tubes are located in a
hotter part of the boiler. Most boiling occurs in the riser tubes, resulting in a much lower
average density in the riser tubes than the water in the down comer tubes. Natural
circulation is similar to the flow in a coffee per collator. Some boilers have forced

38
circulation in which the circulation is pumped where the separator drum performs the
function of both the steam and mud drums and is outside the boiler shell.
3.4 Major Steam System Components
The steam system that is discussed below includes the following components:
3.4.1 Boiler feed water system
The boiler feed water system include: raw water treatment to the boiler makeup quality,
the deaerator, and the BFW pumps with associated piping to deliver BFW to the steam
drum. The raw water treatment includes removal of solids and dissolved impurities that
will concentrate in the boiler water as steam is formed, and cause scaling of the boiler.
The deaerator removes volatile compounds such as carbon dioxide and oxygen that would
cause corrosion in the steam system. The deaerator is also referred to as decarbonizes
because it removes carbon dioxide. The deaerator is usually located high above the boiler
feed water pump to provide sufficient Net Positive Suction Head (NPSH) since the water
in the deaerator is at its boiling point.
3.4.2 Steam Drum
The upper drum (steam drum) provides for separation of steam from water. Saudi Aramco
specifies a minimum liquid holdup of one minute, between a low water level and
shutdown, due to low-low water level with no makeup feedwater, when operating at
design steam rate. Low-low water level is specified at minimum of 50 mm (2 in.) above
the top of the highest downcomer tubes. The steam drum is specified to have a minimum
diameter of 1220 mm (48 in.). The actual size of the steam drum is determined by the

39
volume required to produce dry saturated steam containing no more than 0.1 ppm total
dissolved solids and no more than 0.02 ppm each of sodium and silica. Steam drum
internals for this type of boiler are shown in Figure 4. The internals include separation
devices to assist in separating small droplets of boiler water from the steam. Boiler water
in the steam will cause scaling of the superheater and steam turbines. In Figure 4, baffles
and demister pads are used to minimize boiler water carryover. The demisters coalesce the
smaller drops into larger drops so that they will settle back into the water phase. An
alternate separation uses cyclone separators as the first separating device followed by
demister pads. Figure 5 show is a typical steam drum cross section.
Other drum internals include feedwater piping, blowdown piping, and chemical injection
piping. The feedwater inlet must be baffled so that changes in BFW rate do not set up
waves that affect level measurement.
Figure 4: Steam Drum Internals Note: This photo is taken from Saudi Aramco encyclopedia

40
Figure 5: Typical Steam Drum Cross Section Note: This photo is taken from Saudi Aramco encyclopedia
3.4.3 Mud Drum ( Water Drum)
The mud drum is also known as the lower drum or the water drum. The mud drum is
liquid filled and allows settling of sediment and impurities so that they do not deposit in
the riser tubes. The mud drum is smaller than the steam drum. The downcomer and riser
tubes are also rolled into the plate of the mud drum. This plate must also be thicker than
the rest of the mud drum. The size of the mud drum is determined by the volume
(residence time) required for separation of sediment from the water.
3.4.4 Downcomer and Riser Tubes
The water circuit between the drums consists of downcomers and risers as shown in
Figure 4. The water flows down the downcomer tubes to the water drum. Steam is formed
in the riser tubes and the steam water mixture flows to the steam drum where the steam is
separated from the water. The water flows is typically through the riser tubes first, then
the superheat tubes, the downcomer tubes and finally through the economizer tubes. The
downcomer tubes are downstream of the riser and superheater tubes in a cooler section of

41
the boiler. Convection is the primary mechanism of heat transfer to the downcomer tubes.
Both radiation and convection heat transfer are important in transferring heat to the riser
tubes. Radiation is the primary heat transfer mechanism to the firebox riser tubes and
convection is the primary mechanism to the convection section riser tubes. Water flows
by natural circulation from the steam drum to the mud drum via the down comers and
then back to the steam drum via the risers. Vaporization takes place in the risers and the
steam/water mixture density is less than the water in the downcomers. This density
difference accounts for the natural circulation. Hot spots can develop in boiler riser tubes,
if there is insufficient circulation (flow) to remove the heat flux in the boiler. In some
boilers, circulation is forced by pumping. Forced circulation has the disadvantage of
additional equipment of a circulating pump. However, it has a heat transfer advantage of
higher circulation rates, which avoids any hot spots that could be caused by inadequate
circulation.
Most water-tube boilers have wall, floor, and roof riser tubes surrounding the firebox.
Radiation is the primary heat transfer mechanism for riser tubes surrounding the firebox.
The water/steam mixture flows in the riser tubes from the mud drum to the steam drum. In
addition to absorbing heat, these tubes cool the boiler enclosure and reduce the amount of
refractory required. The floor, front wall, and roof tubes are shown forming a continuous
flow path from the mud drum to the steam drum. A refractory layer is placed on the floor
tubes to reduce the heat transfer to these tubes because too much vaporization in the lower
tubes could result in reducing circulation. The side wall tubes are connected to bottom and
top headers, which in turn are connected to the drums by supply and relief tubes. Adjacent
tubes in the walls are often welded to connecting steel strips to form a continuous

42
membrane wall, which is illustrated in Figure 6. This construction permits a pressure-tight
enclosure.
Figure 6: Typical Water Wall Constructions Note: This photo is taken from Saudi Aramco encyclopedia
Typical Tube Material Selection: The heat transfer to water and/or boiling water is very
good and the wall temperature is no more than about 50ºF over the saturated steam
temperature. Tube material is selected based on the highest expected tube temperature.
The material for riser and downcomer tubes is typically steel. In some instances where
high tube temperature may be expected, an alloy may be used but this is unusual.
3.4.5 Superheater
Most water-tube boilers also have steam superheaters. When steam is separated from
water in the steam drum, it is saturated at the drum pressure. This steam is routed through
the superheater tubes to raise the steam temperature above saturation temperature. The
superheater is usually located between the riser and downcomer tubes, where the flue gas
temperature is high enough for efficient heat transfer. However, screen tubes are often
used just ahead of the superheater. The screen tubes shield the superheater from direct
radiation from the hot combustion gases. Convection is the primary heat transfer

43
mechanism for the superheater. Super heater tube metal temperatures will be hotter than
riser tubes and may require a different metallurgy. Headers are used to distribute the
steam to the parallel flow paths used in the superheater, and to collect it. These headers
are located at the bottom of the superheater so that the entire superheater coil is drainable.
Safety valves are usually installed both on the steam drum and at the boiler outlet to
protect both the boiler and the superheater from overpressure.
Typical Tube Material Selection: The superheater tubes have higher tube wall
temperatures than the riser tubes, because the steam inside the tubes is hotter and the heat
transfer to steam is not as good as the heat transfer to water in the riser tubes. Tube
material is selected based on the highest expected tube temperature. Superheater tube
material is usually an alloy like stainless steel that can withstand the higher temperatures.
3.4.6 Economizer
Most boilers have an economizer to cool hot flue gases and to raise the temperature of the
BFW. This utilizes the waste heat in the flue gas and improves the boiler thermal
efficiency. Convection is the primary heat transfer mechanism for the economizer.
Economizers are only added, if economically justified, and are designed to avoid steam
production.
3.4.7 Blowdown System
Blowdown (draining boiler water) is required to maintain boiler circulating water quality.
The blowdown system handles both the continuous blowdown from the steam drum and
the intermittent blowdown from the mud drum. The purpose of the blowdown system is to

44
safely dispose the steam produced when the pressure is reduced on the boiler water blown
down. This process by which this steam is produced is called flashing. When the pressure
is reduced on the blowdown water, its temperature is too hot to be in equilibrium with the
reduced pressure. Since no heat is added to the system, any steam formed must take its
heat of vaporization away from the water. The pressure reduction results in a flash, which
produces an amount of steam sufficient to reduce the blowdown water temperature to its
saturated temperature at the new pressure. The recovery of energy in flashed steam
increases the overall boiler efficiency.

45
CHAPTER 4
BOILER OPERATION AND CONTROL
In this Chapter, the major boiler operating variables and boiler control monitoring is
discussed in eight (8) main parts. The major boiler operating variables are:
1. Steam drum level/BFW rate
2. Shrink and Swell
3. Boiler blowdown
4. Steam drum pressure/steam production rate
5. Fuel flow/Pressure
6. Maximum metal temperatures
7. Minimum metal temperature
8. Interaction of Variables (Total System)
4.1 Steam Drum Level/BFW Rate
Boiler steam drum level control is required to maintain proper drum level to prevent
damage to the boiler. Boiler drum level is a critical variable in the safe operation of a
boiler. The objective of the steam drum level control is to:
Control the drum level to the set point

46
Minimize the interaction with the combustion control system
Make smooth changes in boiler water inventory as boiler load changes
(shrink/swell)
Properly balance the BFW input with boiler steam output
Compensate for BFW pressure variation without process upset
Most of the international codes and standards for safe operation on Water Tube Boilers
specify that the water level in the steam drum shall be measured by 3 independent
differential pressure type transmitters. Each transmitter is to have separate tap points. Two
transmitters will be connected to the same end of the steam drum. One will be used for
control and the other will be used for local and control room indication. The third
transmitter located on the other end of the steam drum will be used for control room
indication of low and high level alarms. In addition, two externally mounted level
switches directly connected to the drum with their own taps are required for high and low
drum level shutdown functions. The level switches are mounted on the same end of the
drum, just like the control transmitter. Level switches are dedicated to shutdown functions
only. Level gage glasses, with their own taps are also provided on each end of the steam
drum. While the level gage glass is the basic level measurement, the indication it provides
is usually in error. The reason for the error is that the level gage acts like a condenser
cooler for the boiler steam, thus causing circulation of condensate through the gage glass.
This cooling also cools the condensate to a lower temperature than the water in the steam
drum. The greater density of the cool water in the gage glass results in a level reading that
is often 1 to 3 inches lower than the actual level in the steam drum. These errors can be

47
corrected by installation and calibration of the gage glass to show the proper level at
operating conditions, but the level will be in error at atmospheric conditions.
Additionally, two parallel control valves are provided for BFW supply to the steam drum.
Only one valve is in service at one time. A Motor Operated Valve (MOV) located up
stream of each control valve selects which control valve is in service. Indication is
provided for the position of the MOVs. The BFW control valves remain in their last
position on air failure.
4.2 Shrink and Swell
When the steam load is increased more steam bubbles are generated in the riser tubes.
This results in some water being displaced in the tubes and results in an initial sudden rise
in water level. This swell effect that results in an increased water level normally would
decrease the BFW rate but the steam load indicates that the BFW rate should be increased.
When the steam load is decreased fewer bubbles are generated in the riser tubes. Water
then replaces the space formerly occupied by steam bubbles and results in an initial
sudden decrease in water level. The shrink effect, which results in a decreased water level
will increase BFW rate when the steam load indicates that the BFW rate should be
decreased. The increase in pressure on a load decrease can enhance shrink because the
steam bubbles get smaller due to the pressure change. Likewise, a decrease in pressure on
a load increase can enhance swell because the bubbles get larger due to the pressure
decrease. The amount of water in the boiler in any one time is called the water inventory.
Increasing boiler loads cause an apparent swell of this inventory. The increase in BFW
rate to supply increased steam production must be delayed due to the swell to maintain
level at its set point. The level effect of shrink and swell will decrease with larger steam

48
drums (less % volume change) and higher boiler operating pressure (the density
difference between water and steam is less).
The proper control action will balance the effect of swell and shrink with steam
production to minimize major swings in steam drum level and BFW rate. A high-high
steam drum level can result in boiler water being carried over into the steam system with
associated problems downstream especially in turbines. A low-low steam drum level will
result in inadequate water supply to some tubes, which can result in tube overheating and
possible rupture. Shutdown switches at high-high and low-low level shutdown the boiler,
when the level control system cannot adequately control the steam drum level.
The three-element control system takes into account the drum level and steam flow to
adjust the BFW rate as shown in the control schematic of Figure 7. The steam drum
pressure may also be used to avoid conflict with the firing control system. The control
system in the Figure 7 can be described as a combination feed forward plus feedback
cascade control. When boiler load increases the level control will delay a BFW rate
increase required by the steam rate increase until the level swell has been reduced by
boiling due to the load change. A similar control is initiated on a reduced load change
except the BFW continues at the original rate until the shrink has been reduced and then
the BFW is reduced to be proportional to the steam rate. Proper tuning of the control
system results in a desired response so that the control system meets all control objectives.

49
Figure 7: Three-Element Feedwater Control System Note: This photo is taken from Saudi Aramco encyclopedia
4.3 Boiler Blowdown
The boiler blowdown rate from the steam drum is continuous to control the circulating
boiler water quality. The continuous blowdown may be controlled by an on-line
conductivity analyzer. Conductivity is proportional to the total dissolved solids in the
boiler water but can be calibrated for any impurity. Mud drum blowdown is intermittent
based on experience for the required removal of sediment. Large rapid changes in the
steam or mud drum blowdown rate can adversely affect the steam drum level control.
4.4 Steam Drum Pressure/Steam Production Rate
The overall steam production rate is set by user demand. The steam production rate is
proportional to the firing rate. The steam pressure is the primary control of firing. As user
demand increases, there is a slight decrease in pressure until firing rate can be increased
so that steam production will match steam demand. The reverse holds true for a decrease

50
in steam demand. In a single boiler installation, the steam pressure controls the firing
directly. In multiple boiler installations a master firing rate pressure controller resets the
set point for the steam rate on individual boilers. The steam rate controls the firing rate on
each boiler. The master controller can allocate steam rate to individual boilers based on
the boiler size or on a least cost basis. Individual boilers may be base loaded by placing
them on a constant steam flow control with no adjustment by the master controller. Steam
production can drop off if the heating value of the fuel decreases. The reduced steam flow
will correct the boiler firing in a multiple boiler installation. In a single boiler installation,
the reduced steam flow will result in decreased steam pressure, which will correct the
firing if there are frequent fluctuations in fuel quality; firing controls can be made more
responsive by adding a fuel heating value feed-forward control component.
Saudi Aramco calls for smooth operation with demand changes in either direction of 20%
Maximum Rated Capacity (MCR) without actuating shutdown due to high-high or low-
low-level in the steam drum. Smooth operation includes a stable flame over the complete
operating range of 20% to 110% MCR rating.
4.5 Fuel Flow/Pressure
Fuel flow is controlled to meet a boiler demand by the firing control signal through the
combustion control system. Fuel flow can change due to boiler load changes and from
heating value changes in the fuel. Fuel flow should not be a function of fuel supply
pressure. Supply pressure to the control valve should have an independent control as
shown in the typical gas and fuel oil installation flow schematics.

51
4.6 Maximum Metal Temperatures
The metal temperature can drastically affect the strength of a material. If design metal
temperatures are exceeded the tubes can creep which can result in bending and bulging.
The tube metal temperatures are monitored by tube skin thermocouples.
4.7 Minimum Metal Temperature
When fuel is burned, water and carbon dioxide are the major products. When the fuel
contains sulfur, SO2 and SO3 are formed. If the flue gases encounter metal, cool the flue
gas to its dew point. At this point, SO2 and SO3 will combine with water to form sulfurous
and sulfuric acids. The dew point of flue gas mixtures as a function of SO3 in the flue gas
and water content of the flue gas. Saudi Aramco specifies that 5% of the sulfur in the fuel
should be calculated as SO3 in the flue gas. You will notice that the guideline of avoiding
metal temperatures below 300ºF is fairly safe. Minimum metal temperatures are
experienced in the economizer and in the stack. Economizers are designed to avoid the
minimum metal temperature problem. The coolest economizer tube metal temperature
may be monitored. The top part of the stack is usually an alloy to prevent sulfur acid
corrosion if the flue gas permeates in back of the refractory.
4.8 Interaction of Variables (Total System)
Tuning of the control system is very important to prevent unwanted system interaction.
For example the level control can affect the firing rate by swings of the cold BFW rate
into the steam drum. If the system is not properly tuned, swings in the BFW rate can
result in firing rate swings which will then affect the level control because of the changes
in shrink and swell and cause further swings in the BFW rate. This swinging could be

52
started by a change in steam demand. Interactions can also occur in other systems such as
the draft control and the firing system; blowdown and steam drum level control, etc.
Inadequate control can result in overheating of tubes with the results shown in Figure 8.
Other consequences of inadequate control include carryover of boiler water into the steam
system, boiler explosions, lifting safety valves, etc.
Figure 8: Boiler Furnace Tubes Rapture Note: Actual boiler tube rupture taken from Aramco boiler

53
CHAPTER 5
FIELD DATA COLLECTION
Collection of data related to the furnace construction and the tube geometry and
dimensions of one type of Saudi Aramco boiler was conducted. This construction will
form the base for the preliminary analysis and calculations. The data is required for the
determination of the limits of maximum boiler swing rates. The collected data from the
different sources are presented in the following sections.
5.1 Data of a Typical Saudi Aramco Boiler
Design data for one type of boiler produced by Mitsubishi Heavy Industries (MHI) were
collected and the corresponding constructional drawings were obtained. The collected
data include the construction of the boiler, the boiler dimensions and the design data. A
brief summary of the data is given in Tables 1, 2, 3 and 4. Table 1 and 2 provide the boiler
construction details including furnace volume and furnace heating surface areas of the
superheater, boiler bank, and economizer.

54
Table 1: Typical Boiler Data Sheet
Type Mitsubishi Water Tube Boiler
Maximum Continuous Rating 530,000 lbs/h (66.78 kg/s)
Superheater Outlet Steam Pressure at the
Discharge of the Non-return Valve
650 psig (4,582.9 kPa, abs)
Superheater Outlet Steam Temperature (at
MCR)
741°F (393.9°C)
Feed Water Temperature at Economizer Inlet 308°F (153.3°C)
Table 2: Construction Details
Furnace Volume 13,630 ft3 (385.96 m
3); projected H. S. (EPRS) 3,498 ft
2
(324.97 m2)
Furnace Heating Surface 5,447 ft2 (506.04 m
2)
Superheater Type Drainable
Superheater Arrangement Horizontal
Superheater Heating
Surface
3,735 ft2 (347.0 m
2)
Boiler Bank Arrangement In-line
Boiler Bank Heating
Surface
23,788 ft2 (2,210.0 m
2)
Economizer Bank Type Spiral Finned Tube
Economizer Arrangement Staggered
Economizer Heating
Surface
40,117 ft2 (3,727.0 m
2)
Table 3 provides the operating data for a boiler with an economizer. The data include the
flow rates of steam and water and drum pressure and temperature at the conditions of
100%, 75% and 50% of the maximum continuous rating (MCR). The data also include
temperatures and pressure at inlet and exit of economizer and superheater. A similar set of
data for the case of boiler without an economizer are shown in Table 4. The following
data were derived from the given raw data and drawings (also presented in Table 4:

55
Table 3: Typical Boiler: Anticipated Performance
[Superheater Heating Surface = 3,735 ft2 (347 m2)] (With Economizer).
Load %MCR 100 75 50
Fuel Sweet N. G. Sweet N. G. Sweet N. G.
Steam Flow Rate M∙lb/hr
(kg/s)
530
(66.8)
397.5
50.1)
265
(33.4)
Superheater Outlet
Pressure
psig
(kPa, abs)
650
(4,587.9)
650
(4,587.9)
650
(4,587.9)
Drum Pressure psig
(kPa, abs)
710
(4,996.6)
684
(4,817.3)
665
(4,686.3)
Feedwater Flow (with
3% blow)
M∙lb/hr
(kg/s)
545.9
(68.8)
409.4
(51.6)
272.95
(34.4)
Feedwater Temperature °F
(°C)
308
(153.3)
308
(153.3)
308
(153.3)
Economizer Water
Outlet Temperature
°F
(°C)
408
(208.9)
397
(202.8)
392
(200)
Saturation Temperature °F
(°C)
507
(263.9)
503
(261.7)
500
(260)
Steam Temperature
Leaving Superheater
°F
(°C)
741
(393.9)
726
(385.6)
711
(377.2)
Fuel Energy in SCF/hr
(MW)
629,760
(208.20)
464,930
(153.7)
306,380
(101.3)
Excess Air % 10 10 14
Air-to-Air Register M∙lb/hr
(kg/s)
575.80
(72.5)
425.1
(53.6)
290.5
(36.6)
Gas Leaving Boiler M∙lb/hr
(kg/s)
606.30
(76.4)
447.6
(56.4)
305.4
(38.5)
Furnace Exit Gas
Temperature
°F
(°C)
2,460
(1,348.9)
2,355
(1,290.6)
2,205
(1,207.2)
Boiler Outlet Gas
Temperature
°F
(°C)
757
(402.8)
700
(371.1)
644
(340)
Economizer Outlet Gas
Temperature
°F
(°C)
426
(218.9)
393
(200.6)
363
(183.9)
Furnace Net Heat
Liberation (EPRS)
Btu/ft2∙hr
(kW/m2)
203,080
(640.6)
149,950
(473)
98,800
(311.7)
Furnace Net heat
Liberation (EPRS)
Btu/ft3∙hr
(kW/m3)
52,120
(539.4)
38,480
(398.2)
25,360
(262.5)

56
Table 4: Typical Boiler: Anticipated Performance
[Superheater Heating Surface = 3,735 ft2 (347 m2)] (Without Economizer).
Load %MCR 100 75 50
Fuel Sour Gas
(Summer)
Sour Gas
(Summer)
Sour Gas
(Summer)
Steam Flow Rate M∙lb/hr
(kg/s)
477
(60.1)
386.9
(48.76)
265
(33.4)
Superheater Outlet Pressure psig
(kPa, abs)
650
(4,587.9)
650
(4,587.9)
650
(4,587.9)
Drum Pressure psig
(kPa, abs)
699
(4,920.2)
682
(4,803.5)
665
(4,585)
Feedwater Flow M∙lb/hr
(kg/s)
491.5
(61.9)
398.5
(50.23)
272.95
(34.4)
Feedwater Temperature °F
(°C)
308
(153.3)
308
(153.3)
308
(153.3)
Saturation Temperature °F
(°C)
505
(262.8)
503
(261.7)
500
(260)
Steam Temperature Leaving
Superheater
°F
(°C)
772
(411.1)
763
(406.1)
750
(398.9)
Fuel Energy in SCF/hr
(MW)
521,870
(190.1)
416,190
(151.6)
280,320
(102.1)
Excess Air % 10 10 14
Air-to-Air Register M∙lb/hr
(kg/s)
575.70
(71.5)
459.10
(57.86)
320.70
(40.4)
Gas Leaving Boiler M∙lb/hr
(kg/s)
D615.30
(77.5)
490.7
(61.85)
342.0
(43.1)
Furnace Exit Gas Temperature °F
(°C)
2,460
(1,348.9)
2,380
(1,304.4)
2,245
(1,229.4)
Boiler Outlet Gas Temperature °F
(°C)
762
(405.6)
718
(381.1)
660
(348.9)
Furnace Net Heat Liberation
(EPRS)
Btu/ft2∙hr
(kW/m2)
203,050
(640.5)
161,930
(510.8)
109,070
(344.1)
Furnace Net heat Liberation
(EPRS)
Btu/ft3∙hr
(kW/m3)
52,110
(539.3)
41,560
(430.1)
27,990
(289.7)
The collected data related to the furnace construction and the tube geometry and
dimensions are shown in Figures 9 and 10. The boiler has two burners on two levels.

57
Dimensions in mm
Figure 9: Boiler Furnace Water Circulation Loop
Dimensions are in mm
Figure 10: Boiler Furnace Plan of the Boiler Furnace

58
Figures 11 and 12 show the layout of the boiler furnace and the detailed construction of
the boiler tubes.
Figure 11: Layout of the Boiler Furnace

59
Figure 12: Detailed Construction of the Boiler Tubes
According to the data collected, it is found that the bottom of the boiler is well covered.
This indicates that evaporation may be assumed to start at the beginning of the sidewalls
of the riser tubes. The heat flux imparting on the sidewall causes the quality of the
water/steam mixture to increase as the mixture flows up the riser tubes and also at the top
part of the tubes.
Table 5 shows the deferent tubes of tubes sections within the packaged boiler were each
tube a number and location. Tubes quantities, sizes, and metrology are also specified in
this table.

60
Table 5: Boiler Tube Data (Boiler Type VP-26 W Tube Schedule)
.
5.2 Field Data Measurements
Field data of upset (disturbance in steam generation) of Shedgum plant at Aramco were
collected for two boilers; F103 and F104 on Sunday, June 22, 2008. The data include
drum pressure, feedwater flow rate, steam flow rate, fuel flow rate (firing rate) and drum
water level in response to time variations of steam demand.
The operating parameters of those typical MHI boilers are listed in Table 6 where drum
saturation pressure, temperature, and steam mass flown are indicated. The heat absorbed
by each boiler section is also listed with a total heat released (Energy Input) of 208.2 MW.

61
Table 6: Operating Parameters of Typical MHI Boiler at 100 % MCR
[Superheater Heating Surface = 3,735 ft2 (347 m2)] (With Economizer).
Operation data at MCR:
Drum Saturation Pressure 4996.6 kPa
Drum Saturation Temperature 263.9°C
Steam Mass Flow 66.5 kg/s
Total Energy Input 208.2 MW
This is distributed as follows:
Energy Absorption in Economizer 16.3 MW
Energy Absorption in Drum, Riser, Downcomer
Systems
126.9 MW
Energy Absorption in Superheater 26.3 MW
Energy Loss to Stack 38.5 MW
The experimental data is taken for a drum boiler having the operating conditions given in
Table 7. The operating parameters at the instant of the upset period are shown in Table 8.

62
Table 7: Physical and Steady State Boiler Operational Data
Drum Saturation Pressure (kPa) 4996.6
Drum Saturation Temperature (°C) 263.9
Steam Mass Flow (kg/s) 66.5
Total Energy Input (MW) 208.2
Vd= Volume of drum (m3) 40
Ad = Water surface area of drum (m2) 20
md = Mass of drum (kg) 140,000
Vr = Total volume of riser tubes (m3) 37
Di = Inner diameter of a riser tube 0.0672
Do = Outer diameter of a riser tube 0.0762
mr = Total mass of riser tubes (kg) 160,000
Vdc = Volume of downcomer tube (m3) 11
Cp= Specific heat of metal (kJ/kg.K) 0.5
Table 8: Operating Parameters of Typical Boiler at Steady State at the Instant of
Upset.
Operation data at MCR:
Drum Saturation Pressure 4480 kPa
Drum Saturation Temperature 263.9°C
Steam Mass Flow 44.7 kg/s
Results of the different operating boiler parameters were collected during boiler upsets
that occurred for boilers F103 and F104. Due to upset in the gas turbine cogeneration unit
on June 21, 2008, the header pressure was reduced. Accordingly the steam flow rates of
the boilers were increased as a response to the pressure drop in the header. The results of
, , ,s fm m P Q and drum water level were recorded. The response of variations in steam
flow rate to header pressure variations are shown in Figure 13.

63
Figure 13: Variations in Steam Flow for Boiler F103 of Shedgum Plant
The response of firing rate, drum pressure, feedwater flow rate and drum water level due
to variations in the boiler steam flow rate are shown in Figures, 14, 15 and 16 for boiler
F103.
Figure 14: Response of Firing Rate to Variations in Steam Flow for Boiler of
Shedgum Plant

64
Figure 15: Response of Drum Pressure to Variations in Steam Flow for Boiler of
Shedgum Plant
Figure 16: Response of Feedwater Flow Rate to Variations in Steam Flow for Boiler
of Shedgum Plant

65
a. Detailed data
b. Close-up view
Figure 17: Response of Drum Water Level to Variations in Steam Flow for Boiler
F103 of Shedgum Plant
As shown in Figure 13, the steam flow rate increased from 48.4 kg/s at 12083 s to 71.9
kg/s at 12830s (50 % increase in 747 seconds corresponding to 4% per minute). The
-0.10
-0.05
0.00
0.05
0.10
0 5000 10000 15000 20000
Time, s
Lev
el,
m
-0.10
-0.05
0.00
0.05
0.10
11000 11500 12000 12500 13000 13500 14000 14500 15000
Time, s
Le
ve
l, m

66
steam flow rate oscillates around a decreasing mean value up to 16632s. This is followed
by a drop in sm from 57.0 kg/s at 16632s to 43.4 kg/s at 16862s (-24%) and by an
increase to 64 kg/s at 17204s (48% increase corresponding to 5% per minute). Then, it
deceases to its initial value of 48.4 kg/s at around 21600s. Following the variations in
steam flow rate, the fuel flow rate (firing rate) varies as shown in Figure 14. As shown,
the firing rate increases from 103 MW at 12083s to 122.5 kg/s, then, to 159.5 MW at
12825s (54% increase in firing rate corresponding to 4% per minute). At 16620s, a
reduction from 144.5 MW to 114.3 MW, followed by increase to 145.6 (28% increase).
Figures 13 and 14 show that both of the steam flow and fuel flow rates exhibit sensitivity
oscillations. The corresponding variations in the drum pressure are shown in Figure 15
which shows that low amplitude oscillations are damped. At 12083s, the pressure starts
dropping from 4490 kPa to 4437 kPa at 12705s, then increases to 4720 kPa at 12865s,
then decreases to 4499 at 13073s, and then increases to 4685 kPa at 13275s. Monotonic
drop up to 13642s occurs to reach 4593 kPa. Another cycle occurs during the period
16000s to 18000s then, the pressure stabilizes at 21600s. The feedwater, Figure 16,
follows similar trends to that of smbut with larger oscillation amplitudes. Figure 17
presents the time variation of the drum level.
Figure 18 shows the variation of the water level in the drum and exhibits the allowable
limits of the low level (6 inches), low-low level (7 inches) and high level (6 inches) and
high-high level (10 inches). Compared to Figure 17, the levels are within the allowable
limits. As shown, the drum water level increases in response to drop in drum pressure. As

67
the pressure drops, more evaporation occurs producing more bubbles at the liquid free
surface causing swell or false rise in the drum water level.
Figure 18: Steam Drum Level Measurements for MHI Boiler 40 VP-26W
Similar performance figures for boiler F104 are shown in Figures 19 to 23. Figure 19
shows the rise in steam flow rate of more than 40% (3.3 % per minute) during the period
12060s to 12800s. The steam flow rate, then, oscillates with lower amplitudes to a lower
value. The steam flow rate decreases with oscillations. The fuel flow rate (Figure 20)
follows the steam flow at around 12500s. Then, it oscillates decreasing in the mean value
to the steady state at around 21600s.

68
Figure 19: Variations in Steam Flow for Boiler F104 of Shedgum Plant
Figure 20: Response of Firing Rate to Variations in Steam Flow for Boiler F104 of
Shedgum Plant
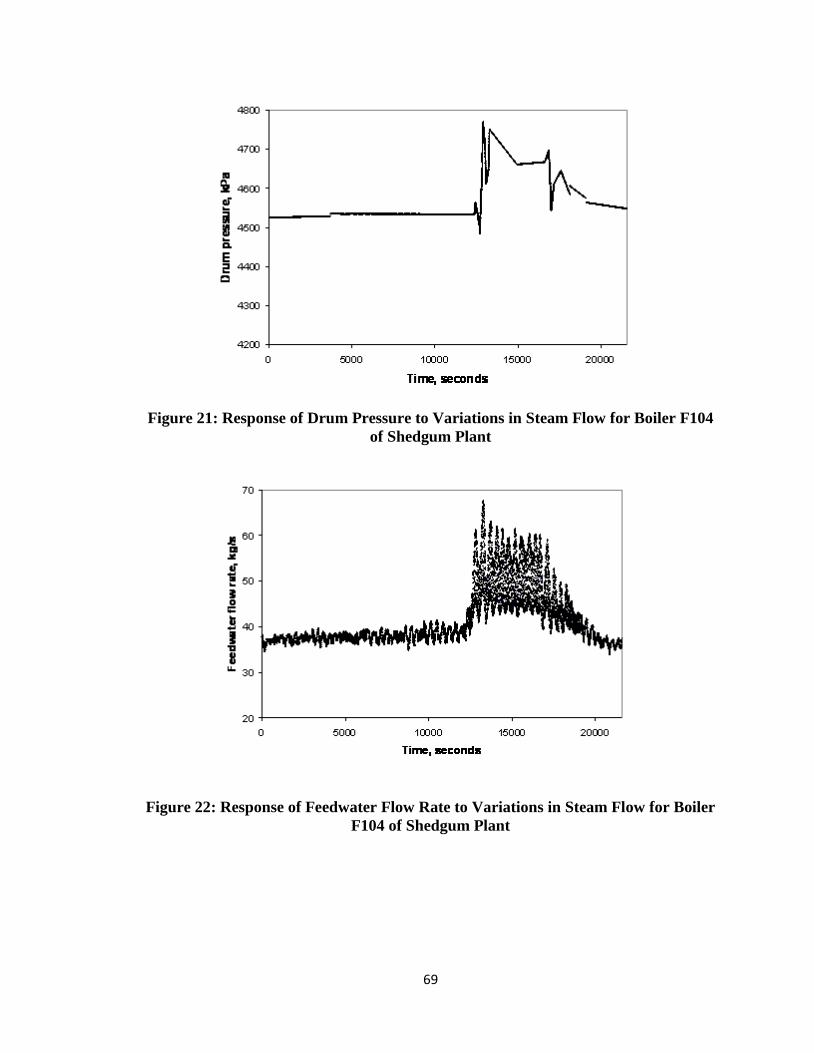
69
Figure 21: Response of Drum Pressure to Variations in Steam Flow for Boiler F104
of Shedgum Plant
Figure 22: Response of Feedwater Flow Rate to Variations in Steam Flow for Boiler
F104 of Shedgum Plant

70
Figure 23: Response of Feedwater Flow Rate to Variations in Steam Flow for Boiler
F104 of Shedgum Plant
The corresponding variations in the drum pressure are shown in Figure 21 which shows
that low amplitude oscillations are damped. The pressure drops and then increases to a
maximum value, then, decreases and increases during the period 12000 to 13000s.
Monotonic drop occurs up to around 16000s where another cycle occurs during the period
16000 to 18000 then stabilizes at 21600. The feedwater, Figure 22, follows similar trends
to that of sm but with larger oscillation amplitudes. Figure 23 presents the drum water
level and shows similar trends as in boiler F103.
In order to explain the behavior of the field data, a detailed analysis of the results was
performed. As the upset of gas turbine steam cogeneration unit occurs, the header pressure
drops. This is followed by increase in the steam flow rate from other boilers including
-0.1
-0.05
0
0.05
0.1
10000 11000 12000 13000 14000 15000
Time, s
Dru
m l
evel, m

71
boilers F103 and F104 which results in pressure drop in the steam drums of these boilers.
As the pressure drops in the steam drums of these boilers, the control system responds to
recover the pressure drop towards the set point pressure by increasing the fuel flow rate.
As well, due to steam flow rate increase and the following drop in the drum pressure, the
drum water level changes. This is attributed to the swell phenomenon in the drum. In
response to the changes in the water level, the feedwater control system responds by
increasing the feedwater as explained above.
In this regard, details of the upset period are investigated. The steam flow rate is shown in
Figure 24. The maximum ramp ratio is 7% (4.7% of MCR) per minute. This is followed
by a drop in the pressure (Figure 25) at a rate of 1.7 % (1.52% of MCR) per minute in the
vicinity of t= 12740s and 2.7 % (2.4% of MCR) in the vicinity of t= 13100s. The
controller responds by increasing the firing rate which results in increase in the drum
pressure.
Figure 24: Variations in Steam Flow for Boiler F103 of Shedgum Plant
50
60
70
80
12500 12620 12740 12860 12980 13100 13220 13340 13460
Time, s
Ste
am
mass f
low
rate
, kg
/s

72
Figure 25: Response of Drum Pressure to Variations in Steam Flow for Boiler F103
of Shedgum Plant.
The corresponding firing rate (Figure 26) shows 5.5 % per minute. The feed water flow
rate increases by 26.7 % (17.9% of MCR) per minute as shown in Figure 27. The cycle is
repeated between 130000 and 13500s. As indicated by Figure 23, the level increases as a
result of the pressure drop which causes high evaporation in the drum and riser tube which
leads to the swell phenomenon. This is followed by decrease in the water level. The
feedwater control responds by increasing feedwater between 12600s and around 13000s.
4200
4300
4400
4500
4600
4700
4800
12500 12620 12740 12860 12980 13100 13220 13340 13460
Time, s
Pre
ssu
re, kP
a

73
Figure 26: Response of Firing Rate to Variations in Steam Flow for Boiler F103 of
Shedgum Plant
Figure 27: Response of Feedwater Flow Rate to Variations in Steam Flow for Boiler
F103 of Shedgum Plant.
60000
70000
80000
90000
100000
110000
120000
130000
140000
12500 12620 12740 12860 12980 13100 13220 13340 13460
Time, s
Fir
ing
rate
, kW
35
45
55
65
75
85
12500 12620 12740 12860 12980 13100 13220 13340 13460
Time, s
Feed
wate
r f
low
rate
, kg
/s

74
CHAPTER 6
EVALUATION OF ACTUAL BOILER TUBE
FAILURE
Most of high steam pressure boilers installed at Aramco utility plants are packaged type
manufactured by Mitsubishi Heavy Industry (MHI) and built on 1976 that have been in
service for about 37 years. Those boilers were subjected to tube ruptures in firebox
location due to short and long terms overheating. In addition, some failures occurred due
to furnace tube rupture during the boiler start-up period. Below are three (3) failure cases
that show measurements and data collected during the boiler tubes ruptures.
6.1 Failure Analysis due to Flame Impingement
6.1.1 Introduction and Sequence of Events
The high pressure boiler F-109, tripped under investigation, is a packaged boiler that
consists of two burners supported by pilot system. As a normal operation practice, during
the boiler start up, the burner pilot should be started up first to have gradual heat release in
the fire box. The first burner pilot had started up at 11:40 PM using a sales gas which is

75
manly consist of C1 fuel (Methane is the main contributor) that has a heating value of
around 900 Btu/Ib and C2 fuel (Ethane is the main contributor) of heating value of 1600
Btu/Ib. This kind of non modern burner has a fuel gas selector switch that allows the
burner to operate using fuel gas of C1 or C2 only in order to have proper combustion.
Then, at 11:55 PM, the fuel gas selector switched from C1 into C2 as a result of receiving
a fuel gas which mainly consists of C2. At 02:50 PM the pilot 2 of the second burner
started up. After the preheating process was achieved by those two pilots, both burners
had started up, burner 1 at 05:09 AM followed by burner 2 at 05:20 AM. Accordingly, the
airflow controller was switched from manual into automated, and then at 05:22 PM, the
fuel flow controller was switched from manual into normal to start the boiler. At 05:30
AM the boiler was put in line with load 70,000 Ib/hr and after 30 min the boiler load was
increased to 200,000 Ib/hr to be linked to the steam production system where the boiler
master was at manual mode. After 8 minutes only, exactly at 06:08 AM, the boiler failed
due to low-low pressure emergency shutdown.
The high pressure boiler F-109 tripped down due to a furnace tube rupture during start-up.
The objective is to determine the root cause of the boiler tube failure and provide
recommendations to prevent a reoccurrence and to improve the reliability and
performance of the subject boiler and other operating boilers. Table 9 summarizes the
major events during HP Boiler F-109:

76
Table 9: Sequence of Events of Boiler F-109 (6/25/2012-6/26/2012)
Time Event
11:40 PM Pilot 1 switched on
11:55 PM Fuel Gas selector was switched from C1 into C2
2:50 AM Pilot 2 switched on
05:09 AM Burner 1 is completely on
05:20 AM Burner 2 is completely on
05:21 AM Airflow controller was switched at from manual into normal
05:22 AM Fuel flow controller was switched from manual into normal
05:30 AM Boiler operated with 70 MPPH
06:00 AM Boiler operated with 200 MPPH at boiler master is at Manual Mode
06:08 AM Boiler tripped on low -low level ( Emergency Shutdown)
6.1.2 Mechanical Inspection Findings
Field inspection findings were reported after opening of boiler and results revealed that
one tube in the middle of the area located between the top burner and the roof tubes
alongside with four back spots took place.
During boiler shutdown, a tube rupture in one of the boiler tubes above the top was
observed. The root cause analysis was that the boiler wall tube leaked due to short term
overheating which resulted in fish-mouth rupture as shown in Figure 28. Internal

77
inspection was carried-out for the ruptured area (In the boiler furnace) and the following
were inspection observations:
1. Rupture took place at furnace wall tube located at burner side of the furnace
(Rupture Dims: Length: 6.5” & Width: 3”) – Figure 28 shows tube rapture at the
boiler firebox.
2. The failed tube is not a straight tube, it is one of the bent tubes around the burner
and the failed part is towards the furnace side. These burn tubes may cause high
deferential pressure leading to lower flow rate that results in high heating rate.
3. Adherent scale layer can be seen inside the tube through the rupture and a white
color also observed at the fracture sides (externally) which indicates a short term
overheating as described in Nalco Guide to boiler failure analysis book [4].
Figure 28: MHI Boiler Tube Rapture at the Boiler Firebox
Note: Tube rupture taken from Aramco boiler

78
4. Tubes located at the fire box were found previously cut and replaced (at the same
ruptured area).
5. No bulges observed at the adjacent tubes.
6. Hardness and ultrasonic thickness measurements for the adjacent tubes found
satisfactory (Especially at the focus area where black spots located).
Figure 29: Tube Rapture Different Views
Note: Tube rupture taken from Aramco boiler
7. The failed tube section was cut to carry out metallographic examination and
analysis, also to determine the chemical composition and morphology of the
deposits and scale density.
6.1.3 Boiler Controls Observations
1. Fuel Gas selector was switched from Methane (C1) into Ethane (C2). The typical
heating value of C1 is round 900 Btu/Ib while C2 is around 1600 Btu/Ib. The
burner firing logic is usually adjusted manually through C1/C2 selector and it is

79
normally set on C1 and changed to C2 if the BTU value is higher than 1200
BTU/SCFH.
2. Boiler combustion was not stable during the boiler startup due to interruption in
fuel gas composition because of the Ethane injection while the boiler is under
manual start-up mode.
3. Airflow controller was switched from manual into automated. (The normal mode
for this point is automated).
4. Fuel flow controller was switched from manual into normal. (The normal mode for
this point is cascade).
5. The inlet air to boiler is monitored via air controller open percentage and not
through flow transmitter. Therefore, having a flow indicator will help boiler
operator to adjust the fuel/air ratio during the boiler startup.
6.1.4 Boiler Instrumentation Observations
All suspected instruments that might cause the tube rupture have been checked and the
results are summarized as follow:
1. It was noticed that the steam drum level transmitter was fluctuating and
mismatching with steam drum level transmitter A during the startup of boiler F-
109. Thus, both steam drum level transmitters A & B were checked and minor
sludge was found accumulated in their tubes. In addition, the calibration of both
transmitters was checked and slight deviation was found and corrected. Moreover,
the BFW level controls valves A & B were functionally tested and found
acceptable.

80
2. The furnace pressure did not increase during the boiler tube ruptured. However,
the functionality of the pressure switch was tested and found acceptable.
3. The air damper valve was checked and there was slight deviation in the calibration
which does not have any significant impact.
4. The air flow transmitter was checked and slight deviation was found in the
calibration.
5. The Low-Low level switches, which tripped the boiler, were tested and found
acceptable.
6. Both air registers were checked to assure their functionality and they were found
nonfunctioning well. The air register of the first burner was found with
nonfunctioning limit switch while for the second burner, the register was found
malfunctioning (jerking)
6.1.5 Failure Analysis
Figure 29 shows the time variation of fuel flow rate with air valve opening. The air flow is
following the fuel firing in case of increasing the boiler load. In boiler fire box operation,
the primary function of combustion control is to deliver air and fuel to the burner at a rate
that satisfies the firing rate demand and with a mixture (air/fuel ratio) that provides safe
and efficient combustion. Insufficient air flow wastes fuel due to incomplete combustion,
and it can cause an accumulation of combustible gases that can be ignited explosively by
hot spots in the furnace as shown in Figure 30 during the period 2:24 to 4:46, the
accumulation of fuel with less air can cause high temperature overheating. Excess air flow
wastes fuel by carrying excess heat up the stack.

81
Figure 30: Time Variation of Fuel Flow Rate and Air Valve Opening
Figure 31 shows time variation of fuel flow rates of Methane (C1) and Ethane (C2). This
kind of burner is not auto controlled and not supported by a burner management system
(BMS) and has a fuel gas selector switch that allows the burner to work using fuel gas of
C1 or C2 only in order to have proper combustion.
Figure 31: Time Variation of Fuel Flow Rates of Methane (C1) and Ethane (C2)

82
Figure 32 shows fuel gas heating value in BTU variation with time of both fuels Methane
(C1) and Ethane (C2). The change of fuel type can result in the change of the heating rate
due to differences in high heating value of the two fuels.
Figure 32: Fuel Gas Heating Value in BTU Variation with Time
Combustion controls are designed to achieve the optimum air/fuel ratio, while guarding
against the hazard caused by insufficient air flow. Figure 33 shows the excess oxygen
variation with time during the tube rupture time.

83
Figure 33: Excess Oxygen Variation with Time
Two combustion control methods are discussed in this chapter which are the most
commonly used in operating packaged type boiler: single point positioning control and
parallel positioning control.
1. Single Point Positioning Control
The simplest combustion control strategy that can be applied to boilers is single-point
positioning, often referred to as jackshaft control. It is commonly used on fire tube and
small water tube boilers. Figure 33 shows the feedback control scheme employed.
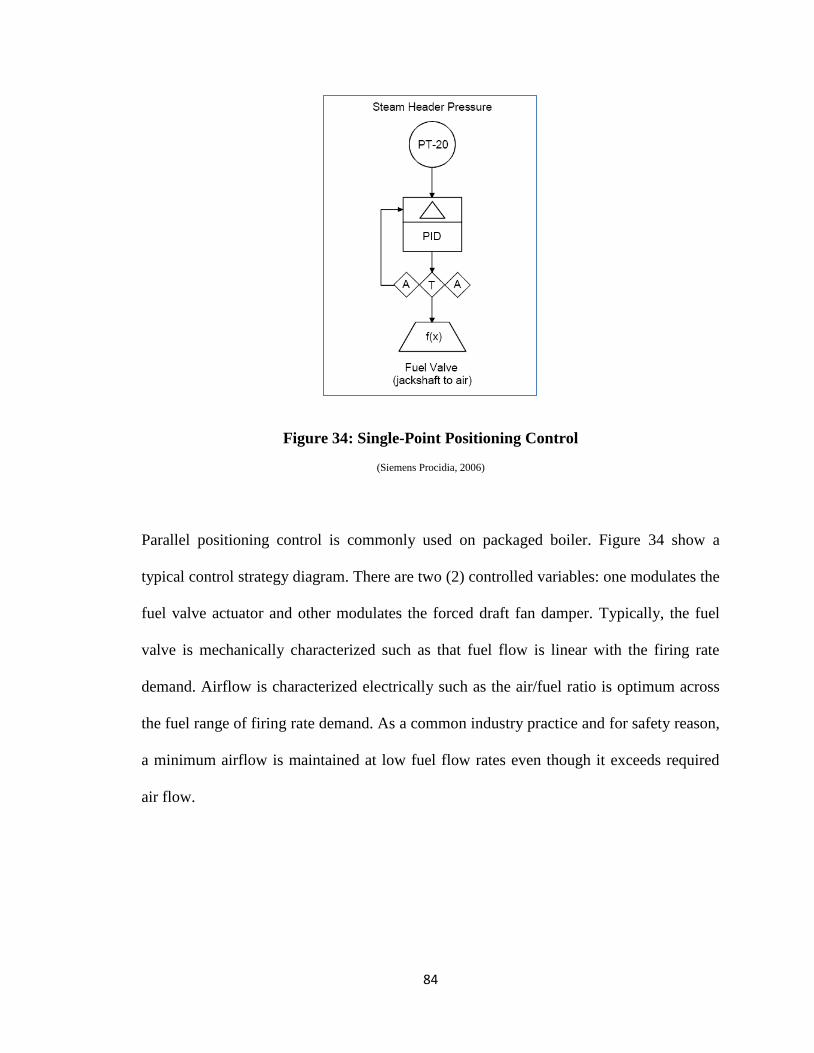
84
Figure 34: Single-Point Positioning Control
(Siemens Procidia, 2006)
Parallel positioning control is commonly used on packaged boiler. Figure 34 show a
typical control strategy diagram. There are two (2) controlled variables: one modulates the
fuel valve actuator and other modulates the forced draft fan damper. Typically, the fuel
valve is mechanically characterized such as that fuel flow is linear with the firing rate
demand. Airflow is characterized electrically such as the air/fuel ratio is optimum across
the fuel range of firing rate demand. As a common industry practice and for safety reason,
a minimum airflow is maintained at low fuel flow rates even though it exceeds required
air flow.

85
2. Parallel Positioning Control
To regulate the firing rate, parallel positioning control employs a strategy that is similar to
single-point positioning. Once again, only one measurement is used and this is either the
steam header pressure or the hot water outlet temperature, depending upon the type of
boiler. Both the fuel control valve and the air control damper are positioned based on this
signal. Unlike single-point positioning, parallel positioning has two control outputs. One
controls the fuel valve, the other controls the air damper position. Since both fuel flow and
air flow are non-linear, the fuel flow is mechanically linearized using a cam. Air flow is
linearized within a digital electronic controller. Parallel positioning permits the optimum
air/fuel ratio to be maintained across the entire firing rate. This control scheme is
commonly used on package boilers.
Figure 35: Parallel Positioning Control
(Siemens Procidia, 2006)

86
Figure 35 shows the parallel positioning control scheme. The two controller outputs go to
the fuel valve and the air damper. The jackshaft used in single-point positioning is
replaced by a characterizer within the controller.
Figure 36 shows a typical diagram that indicates the ‘causal factors’ associated with
immediate cause of the boiler tube failure.
Figure 36: Causal Factors Diagram Associated with Cause of Boiler Tube Failure
Boiler (F-109) experienced tube rupture in the middle of the area located between the top
burner and the roof tubes alongside with four hot black spots at adjacent tubes. This is
due to disturbance in the combustion during the boiler start-up because of injection of
ethane gas and improper controlling actions during boiler startup caused short term
overheating that lead to tube failure.

87
Boiler design parameters and operation trends were analyzed looking for abnormality in
water circulation and heat introduction to furnace. In overall, the analyzed parameters
were under normal condition in exception of poor start-up boiler condition due to
disturbance in fuel/air stoichmetric alongside with the sign of scale build up inside the
boiler tubes.
The investigation revealed that the failure was a typical short term overheating failure
with one major fish mouth and four black spots. The tube rapture mode where the fracture
surface is a thin edge which is a well-known terminology in industry called a “fish mouth”
as investigated by most papers of the boiler designers such as Siemens [5]. The failure is a
typical short term overheating failure with one major fish mouth and four black spots. The
tube failure occurred in the middle of the area located between the top burner and the roof
tubes together with four black spots at adjacent tubes. Analysis indicates that a flame
impingement occurred in the furnace tubes around the burners during the boiler start-
up. The primary cause of this flame interruption was due to disturbance in the fuel/air
ratio because of the injection of ethane gas during the boiler startup period.
6.2 Failure Analysis of Different Boilers
6.2.1 Introduction
Most of hydrocarbon facilities are designed to have a cogeneration system to produce both
power and steam for plant in addition to conventional packaged type boilers to work in a
standby mode. The current MHI boilers are not designed for the part load (very low load)
or standby role which they currently perform such facilities. They were designed for

88
steady state operation near their rated output. Currently, those boilers are operating at low
level rate. Figure 37 shows two cogeneration units that have a capacity of 650,000 Ib/hr
each to produce 625 psig superheated stream to main stream header.
During the cogeneration turnaround or unplanned shutdown, the standby boilers should
ramp up accordingly to provide the required steam for plant demand.
Figure 37: Causal Factors Diagram Associated with Cause of Boiler Tube Failure
With several parallel connected boilers supplying a common header, it is generally
desirable to provide a way to adjust the load distribution among the boilers. Depending on
the load and performance of the individual boilers, the most efficient operation may be
achieved with some boilers shut down, some boilers base loaded (constant firing rate), and
the remaining boilers allowed to swing with the load (variable firing rate). Figure 38
shows a boiler master control diagram to provide these adjustments. Each boiler master
has a bias adjustment and an auto/manual transfer switch. In manual, the operator can

89
reduce the firing rate to a low fire condition for shutdown, or hold the firing rate at any
appropriate base loading condition. In auto, the boiler master follows the master firing rate
demand signal except as altered by the bias adjustment. The operator can adjust each
boiler master bias up or down to increase or decrease its share of the total load.
Figure 38: Boiler Master Control
(Siemens Procidia, 2006)
In the plant master control, steam pressure is the key variable that indicates the state of
balance between the supply of steam and the demand for steam. If supply exceeds
demand, the pressure will rise. On the other hand, if demand exceeds supply, the pressure
will fall. Figure 39 shows a single loop control diagram that manipulates the firing rate
demand to control steam pressure at the desired set point.

90
Figure 39: Plant Master Controller
(Siemens Procidia, 2006)
Plants may experience fluctuations in demand due to batch processes or other process
changes. In this case, a steam flow feedforward signal is used with steam pressure control.
The term plant master can be applied when two or more boilers supply steam to a
common steam header. Here there are multiple boiler masters but only one plant master.
The plant master generates the master firing rate demand signal that drives the individual
boilers. With multiple boilers, the plant master is typically configured with a variable
gain, based on the number of boilers in automatic mode.
6.2.2 Furnace Pressure Control
A basic boiler has a steam water system and a fuel air-flue gas system. In the fuel-air-flue
gas system, the air and fuel are mixed and ignited in the furnace. Air and fuel flow into
the furnace and flue gas flows out.
The force driving this flow is the differential pressure between the gases inside the
furnace and those outside the furnace. Furnace pressure is commonly referred to as draft

91
or draft pressure. The draft is maintained slightly negative to prevent the combustion
products and ash from being discharged from the furnace into surrounding areas through
inspection ports, doors, feeders, etc. For greatest efficiency, the controlled pressure should
be as close as possible to atmosphere thereby minimizing the ingestion of “tramp air” or
excess air drawn through the openings in the furnace duct work that cool combustion
gases.
Furnaces are classified by the method for moving air and other gases through the system.
A forced draft (FD) furnace uses a fan or blower, force combustion air through the
system. Control is accomplished by regulating either fan speed or damper operation. This
type of furnace is operated slightly above atmospheric pressure.
6.2.3 Boilers Response Following the Congregation Unit Trip
During the congregation unit trip, three (3) high pressure boilers were tripped due to tube
ruptures. Below are the actual measurements of each boiler during the incident.
1. Boiler F-109:
The Maximum Continuous Rate (MCR) of boiler F-109 was at base load before incident
was 29% where the maximum load achieved after incident was 80%. Table 12 shows F-
109 boiler load and ramping rate variation with time during incident. The ramping rate is
calculated as difference between two loads such as at 12:07 the boiler load was 32.4 and
at 12:08 the boiler load was 45.5 % and hence the ramping rate percentage is (45.5-32.4 =
13.2) which means the boiler load ramped up 13.2 in one minute.

92
The old MHI boiler was designed with maximum ramping rate of 10% per minute in order
to have a reliable operation. However, the boiler ramped up more than this limit as
highlighted in red colour in Table 10 and the boiler response was excellent without a tube
rupture.
Table 10: F-109 Boiler Load and Ramping Rate Variation with Time
Figure 40 shows F-109 Boiler Ramping Rate MCR % with time variation was excellent.
However, as indicated on Table 10, the boiler exceeded the maximum allowable ramping
rate of 10% MCR. Sudden and sharp increase in the boiler load may lead to a tube
rupture.

93
Figure 40: F-109 Boiler Ramping Rate MCR % Variation with Time
Boiler F108
F-108 boiler MCR was at base load of 29% before incident where the maximum load
achieved after incident was 75%. Table 11 shows F-108 boiler load and ramping rate
variation with time during incident where the boiler had exceed the maximum ramping
limit tow time at 12:08 hr and 12:20 hr as highlighted in red colour.

94
Table 11: F-108 Boiler Ramping Rate during Incident
Figure 41 shows F-108 Boiler Ramping Rate MCR % with time variation was excellent.
However, as indicated on in table 10, the boiler exceeded the maximum allowable
ramping rate of 10% MCR. Sudden and sharp increase in the boiler load may lead to a
tube rupture.
Figure 41: F-108 Boiler Ramping Rate MCR % with Time Variation
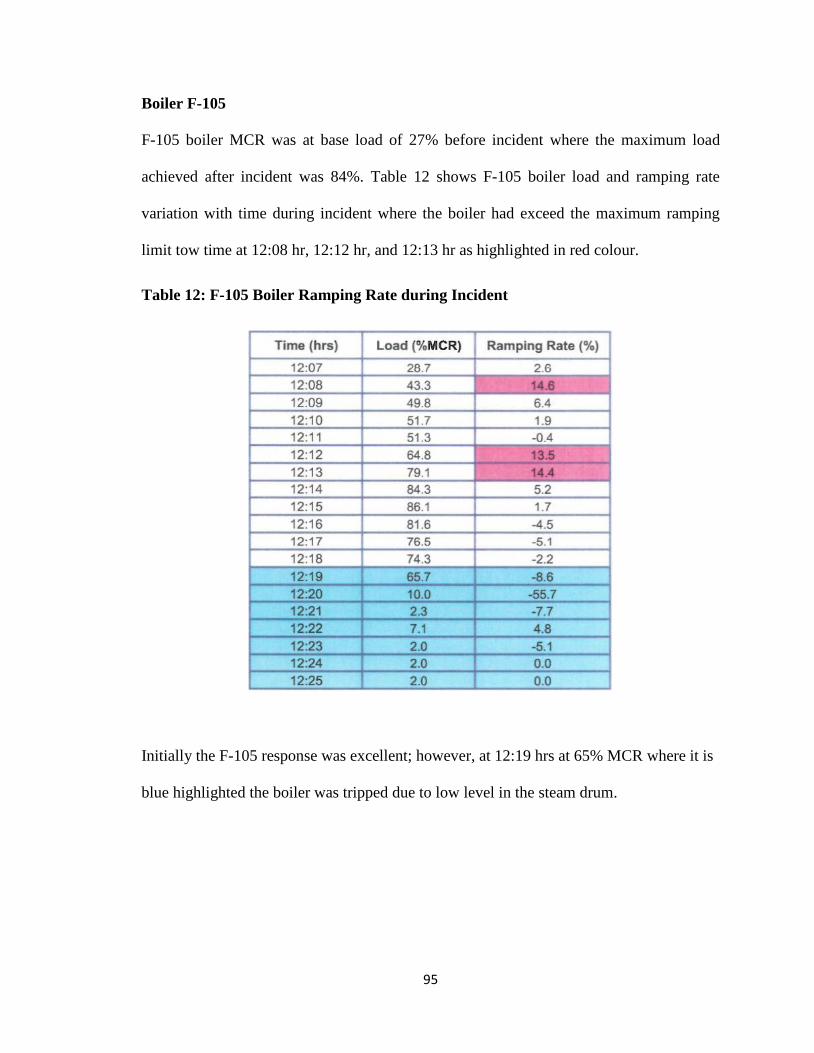
95
Boiler F-105
F-105 boiler MCR was at base load of 27% before incident where the maximum load
achieved after incident was 84%. Table 12 shows F-105 boiler load and ramping rate
variation with time during incident where the boiler had exceed the maximum ramping
limit tow time at 12:08 hr, 12:12 hr, and 12:13 hr as highlighted in red colour.
Table 12: F-105 Boiler Ramping Rate during Incident
Initially the F-105 response was excellent; however, at 12:19 hrs at 65% MCR where it is
blue highlighted the boiler was tripped due to low level in the steam drum.

96
Figure 42: F-108 Boiler Ramping Rate MCR %
Figure 42 shows F-105 Boiler Ramping Rate MCR % with Time variation. However, as
indicated on in table 12, the boiler exceeded the maximum allowable ramping rate of 10%
MCR.
Boiler F-105 Trip Analyses
Initially the F-105 response was excellent, however, at 12:19 hrs at 65% MCR the boiler
was tripped due to low level in the steam drum as shown in the Figure 43 where the boiler
Load and Steam Drum Level variation with Boiler Load and time.

97
Figure 43: F-105 Load and Steam Drum Level Vs. Boiler Load
At 12:19 hrs at 65% MCR the boiler was tripped due to low level in the steam drum
where the primary cause of the steam drum low level was a back presure on the main
steam header. This back pressure cuased the F-105 superheater relief valve to open.
Figure 44 shows the direct impact of the steam header back pressure on the steam drum
level of the boiler F-105. At 12:19 hrs where the tube rupture occurred, the steam header
pressure reached 688 Psig with steam drum level of 42.5%.
Load
Level

98
Figure 44: Main Steam Header Pressure & F-105 Steam Drum LVL
Figure 45 is a simplified flowchart that shows the immediate factors as well as other
contributing factors that led to trip boiler F-105. During the congregation trip, boiler F-
105 was at 65% MCR which is 344 MPPH out of 530MPPH. Then, suddenly the boiler
low steam drum level emergency shutdown (ESD) is activated as result of low steam
drum level. The other factor was the superheater relief valve opening due to a sudden
back pressure on the 625 Psig steam header due to sharp cut in the feed in hydrocarbon
fractionation plant resulting in low steam demanding.

99
Figure 45: Boiler F-105 Trip Factors Diagram
6.3 Boiler Tube Rupture due to Low Level in Steam Drum
Boiler F108 was started up in compliance with boiler Operation Instruction Manual
(OIM) after completion of its scheduled turnaround (cold startup). Two hours later, air
register failure alarm was received and outside operator noticed tube rupture on the front
wall tube above Burner 2. At 11:45 pm, the boiler tripped due to high furnace pressure
resulted from the ruptured tube.
Internal inspection showed that the boiler had one fish mouth tube rupture due to long
term overheating. However, the interruption of the combustion air flow caused flame
impingement which accelerated the tube rupture failure.

100
BFW 397 Mlb/hr HP Steam Flow 420 Mlb/hr
steam drum level 56%
0
10
20
30
40
50
60
70
80
0
100
200
300
400
500
600
10/12 10/14 10/16 10/18 10/20 10/22
Ste
am a
nd
BFW
Flo
w r
ate
, Mb
l/h
r
Date
Boiler Steam and BFW Operation
Boiler Feed Water, Mlb/hr HP Steam Flow, Mlb/hr
Steam Drum Level, %
Background
Boiler F-108 was started up smoothly following the normal operation procedures until it
reached normal operating conditions. The boiler reached normal operating conditions
with MCR at 75%, high pressure steam flow at 420 Mlb/hr, fuel gas supply flow at 327
MSCFH (Million Standard Cubic Feet per Hour), Oxygen content at 8% and overall
boiler efficiency at 84%. Furthermore, boiler was operating with 1618 BTU/SEC and the
selector was set at C2 firing mode.
Figure 46 shows boiler feed water, Steam flow rate, and steam drum level with time
variation.
Figure 46: Boiler Steam and BFW Operation
Chart Data Show
Operating parameters
just before the trip
Boiler
Steam
Drum
Level,
%

101
Boiler Efficency 84%
HP Steam Pressure 650 psig Boiler MCR, 75%
0
100
200
300
400
500
600
700
800
0
10
20
30
40
50
60
70
80
90
10/12 10/14 10/16 10/18 10/20 10/22
Bo
iler
MC
R a
nd
Eff
ice
ncy
, %
Date
Boiler Steam and BFW Operation
Boiler MCR, % Steam Pressure, PSIG Boiler Efficency, %
Figure 47 shows operating parameters just before the trip. The boiler was operated per
the listed parameters:
1. Boiler load was 75% MCR
2. Steam drums level was 56%
3. HP Steam Flow 420 Mlb/hr
4. Boiler Feed Water Flow Rate was 397 Mlb/hr
5. Boiler Efficiency was 84%
6. HP Steam Pressure 650 psig
Figure 47: Data Show Operating Parameters just before the Trip
Boiler
Steam
Pressure,
PSIG

102
Figure 48 shows the boiler fuel combustion operation just before the trip as listed below:
1. Fuel control valve opening was 50%
2. Excess oxygen O2 was 8%
3. Fuel firing heating value 1616 Btu/SCF which means the fuel firing was
mainly Ethane (C2).
4. Air control valve opening was 89%
5. Wind box pressure was 21.8 inches of water
Figure 48: Boiler Fuel Combustion Operation
50%
89%
8%
21.8 Inch Water
1616 BTU/SCF
600
800
1000
1200
1400
1600
1800
2000
0
10
20
30
40
50
60
70
80
90
100
10/17 10/18 10/18 10/19 10/19 10/20 10/20
Fue
l Co
mb
ust
ion
Pro
cess
Par
ame
ters
Date
Boiler Fuel Combustion Operation
Fuel Control Valve Opening, % Air Control Valve Opening, %Excess O2, % Wind Box Pressure, Inch WaterFuel BTU/SCF
Chart Data Show
Operating parameters
just before the trip
Boiler
BTU/SCF

103
Sequence of Events
As shown in Figure 49, the utility plant consist of tow cogeneration units that have a
capacity of 650, 000 Ib/hr each to produce 625 psig superheated steam to main high
pressure steam header. In addition to Five (5) high pressure conventional boilers that have
a capacity of 530, 000 Ib/hr each to produce 625 psig superheated steam during the
cogeneration turnaround or unplanned shutdown. Those boilers are in standby mode that
should ramp up accordingly to provide the required steam for plant demand in case of any
steam demand shortage.
Figure 49: Utility Plant Diagram
At 11:21 PM Cogeneration Unit-2 was stopped and accordingly the standby boilers
should compensate for the required steam. Boiler F-108 had reached 75% MCR, air
register failure alarm was received and the shift crew was informed to check it. Later,
outside operator noticed tube rupture on front wall tube on top of Burner 2. At 11:45 pm,
boiler F-108 tripped due to high furnace pressure which reached 25 inches of water while

104
the shutdown limit is 21 inches. The high furnace pressure was as a result of the furnace
higher pressure from the ruptured tube.
The effect of this trip had no impact on the plant operation and steam system since the
other boilers responded in timely manner to recover the loss of subject boiler steam
production.
Table 13: Sequence of Events of Boiler Tube Rupture
Time Event
05:05 PM High pressure Boiler F109 was started up
07:56 PM Cogeneration Unit-1 was stopped
09:25 PM High pressure Boiler F108 was started
11:21 PM Cogeneration Unit-2 was stopped
11:45 PM Air register alarm on F-108 was received and the shift crew was informed
11:45 PM F-108 tripped due to high furnace pressure
03:07 AM Cogeneration Unit-2 was started on base load (655 MLPH)
After shutting down boiler F-108 field findings revealed that boiler tubes had one fish
mouth tube rupture, hot black spot above the top burner and one bulged tube at the heat
affected zone as result of burner flame impingement due malfunctioning air register which
controls the flame pattern.

105
Internal Inspection Findings
After shutting down boiler F-108, internal inspection findings revealed that this boiler had
one fish mouth tube rupture, hot black spot above the top burner in addition to one bulged
tube at the heat affected zone as a result of burner flame impingement. See Figure 50 and
51.
Figure 50: Fish Mouth Ruptured Tube and Hot Black Spot
Figure 51: Bulged Tube
Note: Tube rupture taken from Aramco boiler

106
The long term overheating was attributed to heavy scale build up on the tube internal
diameter, approx. 2 mm in thickness. See Figure 52.
Figure 25: Heavy Scale Builds Up On the Tube Internal Diameter
Note: Tube rupture taken from Aramco boiler
Field findings revealed that boiler F-108 had one fish mouth tube rupture and one bulged
tube at the heat affected zone and hot black spot above the top burner. The primary root
cause of the tube rupture was “long term overheating”; however, the interruption of the
combustion air flow caused flame impingement which accelerated the tube rupture failure.
The long term overheating was attributed to heavy scale build up on the tube internal
diameter, approx. 2 mm in thickness. High scale build up confirmed that the boiler feed
water chemical treatment is ineffective in removing the scale from inside the tubes.

107
CHAPTER 7
DISCUSSION AND ANALYSIS
This chapter is analyzing the three (3) boilers failure discussed in the previous chapter.
Failure of boiler tubes has always been of serious concern in most of the process
industries including petrochemical plants. Since tubes are normally made of carbon or low
alloy steel and exposed to high furnace temperature with low coolant media and there is
potential of scales build up, the boiler tubes may bulged and rupture accordingly.
A tube failure is usually a symptom of other problems. In addition to evaluating the
failure itself, investigation of all aspects of boiler operation leading to the failure to fully
understand the cause. In many cases, the field investigation can isolate the root cause that
led to the tube failure.
7.1 Analysis of Tube Failure due To Flame Impingement and Fuel Firing Change
This section will analyze the tube failure discussed in section 6.1 which is occurred in the
middle of the area located between the top burner and the roof tubes. The investigation

108
revealed that the failure is a typical short term overheating failure with one major fish
mouth. The tube rapture mode where the fracture surface is a thin edge which is a well-
known terminology in industry called a “fish mouth” as investigated by most papers of the
boiler designers such as Siemens [5].
7.1.1 Tube Failure Main Cause
Analysis indicates that a flame impingement occurred in the furnace tubes around the
burners during the boiler start-up due to the following factors:
1. The primary cause of this flame interruption was due to disturbance in the fuel/air
ratio because of the injection of ethane gas during the boiler startup period.
2. Boiler combustion was not stable during the boiler startup due to interruption in fuel
gas composition because of the Ethane injection while the boiler is under manual
start-up mode.
3. The inlet air to boiler is monitored via air controller open percentage and not
through flow transmitter. Therefore, having a flow indicator will help boiler operator
to adjust the fuel/air ratio during the boiler startup.
Failure results in a ductile rupture of the tube metal. Short-term overheat failures are most
common during boiler start up. Failures result when the tube metal temperature is extremely
elevated from a lack of cooling steam or water flow. A typical example is when superheater
tubes have not cleared of condensation during boiler start-up, obstructing steam flow. Tube
metal temperatures reach combustion gas temperatures of 1600°F or greater which lead to

109
tube failure. Operations trends and actions were analyzed looking for abnormalities that
may lead:
1. Direct flame impingement
2. Lack of water circulation
3. Internal and external scales build up
7.1.2 Detailed Description of the Failure
Most of boiler tube ruptures recently recorded by utilities plants are caused by short term
overheating. The short-term overheating failures occurred when the tube metal
temperature increases beyond the design limit so that the hoop stress from the internal
steam pressure equals the tensile strength at elevated temperature. The unbalance between
heat flow and fluid flow can result in tube overheating. In a water wall tube, steam forms
as discrete bubbles, nucleate boiling. When the bubble is large enough, the bubble is
swept away by the moving fluid and the cycle repeats. At too high a heat flux or too low a
fluid flow, steam-bubble formation is too fast for removal by the moving fluid. Several
bubbles join to form a steam blanket, a departure from nucleate boiling, DNB as shown in
Figure 53. Heat transfer through the steam blanket is poor, steam is an excellent insulator,
and tube-metal temperatures rapidly rise and failure occurs quickly.
Failure results in a ductile rupture of the tube metal and is normally characterized by the
classic “fish mouth” opening in the tube where the fracture surface is a thin edge. Short-
term overheat failures are most common during boiler start up. Failures result when the
tube metal temperature is extremely elevated from a lack of cooling steam or water flow.

110
A typical example is when superheater tubes have not cleared of condensation during
boiler start-up, obstructing steam flow. Tube metal temperatures reach combustion gas
temperatures of 1600°F or greater which lead to tube failure.
Figure 53: DNB Formations on Boiler Tubes
The picture below depicts a tube suffered from short-term overheating failures which
resulted in tripping a boiler on high-high pressure in the boiler fire box. The picture below
is a fish moth type failure (short term overheating) that explains overheating phenomena
of boiler tube as shown in Figure 54.

111
Figure 54: Short-term Overheating of Roof Tube
Note: Tube rupture taken from Aramco boiler
7.1.3 How to avoid Failure
Such failure can be avoid by having the proper boiler combustion control. This is very
essential in boiler safe operation to deliver air and fuel to the burner at a rate that satisfies
the firing rate demand and with a mixture (air/fuel ratio) that provides safe and efficient
combustion. Four combustion control methods are discussed in this section: single point
positioning control, parallel positioning control, full-metered, cross-limited control, and
O2 trim control.
The single-point positioning control method uses a mechanical linkage to manipulate the
fuel control valve and the combustion air flow damper in a fixed relationship. In this
method, only one measurement is used: steam header pressure or hot water outlet
temperature, depending on the type of boiler. Both the fuel control valve and the air

112
damper are positioned based on this signal. It is commonly used on fire-tube and small
water-tube boilers. Unlike single-point positioning, parallel positioning has two control
outputs. One controls the fuel valve and the other controls the air damper position. Since
both fuel flow and air flow are non-linear, the fuel flow is mechanically linearized using a
cam. Air flow is linearized within a digital electronic controller. Parallel positioning
permits the optimum air/fuel ratio to be maintained across the entire firing rate. This
control scheme is commonly used in package boilers. The full-metered, cross-limited
control scheme is sometimes referred to as the standard control arrangement. Full metered
control measures both the fuel and air flows in order to improve control of the air to fuel
ratio. This control scheme compensates for fuel and combustion air flow variations and
provides active safety constraints to prevent hazardous conditions. In a metered control
system, three measurements are used to balance the air/fuel mixture. These are steam
header pressure, fuel flow and air flow. The cross-limiting (or lead-lag) circuit assures a
dynamic air-rich mixture since the air flow set point will always lead the fuel on an
increasing load and lag when the load is decreasing, thus preventing an excess fuel
situation.
Automatic air/fuel ratio adjustment is often based on the percentage of excess oxygen (O2)
in the flue gas. If the air and fuel are mixed in chemically correct (stoichiometric)
proportions, the theoretical products of combustion are carbon dioxide and water vapor.
Under ideal conditions, all of the oxygen supplied with the air would be consumed by the
combustion process. Due to the dynamic nature of combustion, it is necessary to provide
slightly more air than is theoretically required for the complete combustion of the fuel.
This ensures complete combustion and minimizes the formation of carbon monoxide. The
113
result is a small percentage of excess oxygen in the flue gas. A flue gas oxygen analyzer
supplies feedback on the combustion process and is the basis for trimming the air/fuel
ratio to maintain optimum combustion.
7.2 Failure Analysis of Different Boilers due to High Swing Rates
This section will analyze the tube failure discussed in section 6.2 where a boiler tube failure
occurred due to low level in the steam drum. The boiler tripped due to tube rupture in the
roof tubes. The investigation revealed that the failure is a typical short term overheating
failure with one major fish mouth. The tube rapture mode where the fracture surface is a
thin edge which is a well-known terminology in industry called a “fish mouth” as indicated
in section 7.1
7.2.1 Different Boilers Failures
The boiler control system manipulates the firing rate and the feedwater supply such that the
steam supply remains in balance with the demand over the full load range. This ensures
fixed drum pressure and drum water level. In addition, the correct air/fuel mixture must be
maintained for safe and economical combustion. In the plant master control, steam pressure
is the key variable that indicates the state of balance between the steam supply and demand.
If supply exceeds demand, the pressure will rise. Conversely, if demand exceeds supply, the
pressure will fall. Plants may experience fluctuations in demand due to process changes. In
this case, a steam flow feed forward signal is used with steam pressure control. The term
"plant master" is normally used when two or more boilers supply steam to a common steam
header. The plant master generates the master firing rate demand signal that drives

114
individual boilers. With multiple boilers, the plant master is typically configured with a
variable gain, based on the number of boilers in automatic mode.
With several parallel connected boilers supplying a common header, it is generally desirable
to provide a way to adjust the load distribution among the boilers. Depending on the load
and performance of the individual boilers, the most efficient operation may be achieved
with some boilers shut down, some boilers base loaded (constant firing rate), and the
remaining boilers allowed to swing with the load (variable firing rate).
7.2.2 Detailed Description of the Failure
Drum boilers for steam generation may experience rapid and dynamic changes in the
steam demand. Due to rapid rise in steam demand and consequent decrease in drum
pressure, firing rates are increased rapidly. Consequently, heat flux along the riser and
downcomer tubes are increased. If this is not matched by a parallel increase in feedwater
flow rate, these changes may result in serious tube overheating under some operational
conditions. The boiler tubes in natural circulation boilers may suffer tube overheating
because of rapid changes in boiler operating variables such as drum pressure and
steam/water ratio. These may result from high load swing rates caused by changes in
steam demand. Tube overheating may cause tube failure resulting in unscheduled boiler
shutdown that may interrupt plant operation. The importance of this problem is not only
due to the cost of replacing defective parts but also due to the frequent need of system
shutdown and the possible imminent safety hazards.

115
Tube overheating occurs when the actual quality of water exceeds the allowable values
known as the design values. The increase of the actual water quality over the allowable
values can be attributed to design or operation problems. The tube overheating due to
design problems is normally caused by increased pressure loss in some of the riser tubes
as a result of bends or extra length that makes the tube a special case not considered in the
calculation of pressure loss at the design stage. Operation problems are due to many
reasons such as scale formation or increased heat flux that is not coupled by increased
water flow rates. This occurs when sudden changes in the rate of firing exist. At any case,
to avoid burnout, the actual steam quality should be kept lower than the allowable limits.
Accordingly, to prevent tube overheating, limits of maximum boiler swing rates are
normally specified by boiler manufacturers.
The determination of the limits of boiler load swing rates requires the development of two
computational models. The first model predicts the heat flux along the riser tubes of the
main water circulation circuits. The second is a nonlinear dynamic model for investigating
the influence of changes in operating conditions on the response of natural circulation.
The dynamic response of the system state variables due to rapid changes in fuel flow rate,
feedwater flow rate and steam demand should be investigated. The state variables include
the pressure in the drum and the steam quality at exit of the riser tubes. The system under
consideration includes the drum, the riser and downcomer tubes of the main circuits of
natural circulation as its major components.
Based on the field test conducted for two boilers, maximum swing rates for such boilers
were obtained. Where the influence of the delay period of feedwater flow on the drum

116
water level was investigated entitled “Determination of Maximum Boiler Swing Rates"
[7]. Thus, for any tube of a given effective length and known heat flux as calculated by
the heat flux model, the maximum boiler swing rate that ensures safe operation can be
determined. The results indicate that the delay period for feedwater flow can affect the
maximum and minimum values of the water drum level significantly and cause the drum
water level to be a limiting factor for the swing rates.
As calculated in this research, the steam drum high level and high-high level are not the
same as the low level and low-low level. Therefore, calculations were conducted to
compare the two cases of rise or drop in steam flow rates. The results for time delay are
compiled in Figure 55 for the case of rise in steam flow rate and in Figure 56 for the case
of drop in steam flow rate.
Figure 55: Influence of Swing Rates on Maximum Limits of Drum Water Level in
Response to Rise in Steam Demand
(Determination of Maximum Boiler Swing Rates [7])
-0.2
-0.15
-0.1
-0.05
0
0.05
0.1
0.15
0.2
0.25
0.3
0 10 20 30 40 50 60
Swing rate, %
Maxim
um
an
d m
inim
um
level li
mit
s,
m
Upper
Lower
H
HH
L
LL

117
Figure 56: Influence of Swing Rates on Maximum Limits of Drum Water Level in
Response to Drop in Steam Demand.
(Determination of Maximum Boiler Swing Rates [7])
Figure 57 shows the maximum swing rates as limited by the coefficient of friction (k-
factor) of the riser tubes and heat flux factor (Q-factor) subjected to the riser tube. The
region below the curves refer to the safe operation and that above the curve refers to the
unsafe operation. For a certain tube of a fixed heat flux, as the k-factor increases due to
more bends in tube or blockage, in general, the maximum swing rate decreases. Also for a
certain tube with a given friction factor, as the heat flux increase the maximum swing rate
decreases. It should be noted that the swing rate is relative to the operating pressure and
not to maximum continuous rating (MCR). Figure 57 shows that, for a tube of a given
heat flux, the maximum swing rate decreases as the friction factor increases. Thus, as an
example, a tube having a heat flux factor of three and a friction factor of two (an effective
length of two times a regular riser tube) can withstand a maximum swing rate of 10 %.
[7]
-0.3
-0.2
-0.1
0
0.1
0.2
0.3
0 10 20 30 40 50 60
Swing rate, %
Ma
xim
um
an
d m
inim
um
le
ve
l li
mit
s,
m
Upper
Lower
High
HH
L
LL

118
Figure 57: limits of swing rate for different values of friction factor coefficient and
heat flux factor. Based on allowable steam quality of x = 0.1 at p = 4.48 Mpa
(Determination of Maximum Boiler Swing Rates [7])
For the case of rise in steam flow rate, Figure 55, the high level is reached at around
swing rate of 18% and the low level is reached at swing rate of 44% and the low-low level
at 47%. For the case of drop in steam flow rate, Figure 56, the high level is reached at
around swing rate of 17% and the low level is reached at swing rate of 16% and the low-
low level at 20%.
7.3 Boiler Tube Rupture due to Low Level in Steam Drum
This section will analyze the tube failure discussed in section 6.3 where a boiler tube failure
occurred on the furnace tubes. The primary root cause of the tube rupture was “long term
overheating”; however, the interruption of the combustion air flow caused flame
impingement which accelerated the tube rupture failure. The long term overheating was

119
attributed to heavy scale build up on the tube internal diameter, approx. 2 mm in thickness.
High scale build up confirmed that the boiler feed water chemical treatment is ineffective in
removing the scale from inside the tubes.
7.3.1 Detailed Description of Creep Failure (long Term Overheating)
The second boiler tube ruptures phenomena which is a long term overheating or called
creeping failure as shown in Figure 58. The root cause of the long term over heating is
either caused by a restriction of the tube coolant flow internally by hard scale, periodic over
heating due to fuel type variation or increase in stress due to tube wall thinning. Below
picture illustrates a bulged tube removed from:
Figure 58: Boiler Bulged Tube
Note: Tube rupture taken from Aramco boiler
The failed tube has minimal swelling and a longitudinal split that is narrow when
compared to short-term overheat. Tube metal often has heavy external scale build-up and
secondary cracking. Long-term overheat occurs over a period of months or years.
Superheater and reheat superheater tubes commonly fail after many years of service, as a
result of creep. During normal operation, alloy superheater tubes will experience
120
increasing temperature and strain over the life of the tube until the creep life is expended.
Furnace water wall tubes also can fail from long-term overheat. In the case of water wall
tubes, the tube temperature increases abnormally, most commonly from waterside
problems such as deposits, scale or restricted flow. In the case of either superheater or
water wall tubes, eventual failure is by creep rupture.
General Causes of High Temperature Creep
Restriction of the tube’s coolant flow internally by scale, debris, or condensate
Reduction of heat transfer capability due to internal (steam-side) surface oxide
scales or chemical deposits
Periodic Overfiring or uneven firing of fuel burners
Operation of a tube material at temperatures higher than allowable
Increases in stress due to wall thinning
7.3.2 How to Control Boiler Drum Level
Boiler drum level control is required to maintain proper drum level to prevent damage to
the boiler. Boiler drum level is a critical variable in the safe operation of a boiler.
Typically, the objective of the steam drum level control is to:
1. Control the drum level to the set point
2. Minimize the interaction with the combustion control system
3. Make smooth changes in boiler water inventory as boiler load changes
(shrink/swell)
4. Properly balance the BFW input with boiler steam output

121
5. Compensate for BFW pressure variation without process upset
A low drum level risks uncovering the water tubes and exposing them to heat stress and
damage. High drum level risks water carry over into the steam header and exposing steam
turbines or other equipment to corrosion and damage. The level problem is complicated
by inverse response transients of shrink and swell. Shrink and swell phenomena produce
level changes during boiler load changes in the opposite direction of what is expected
with a particular load change. These changes can cause severe control system overshoot
or undershoot. Different types of drum level control such as single-element, two-element,
and three-element are used in boiler control. The single-element system is the simplest
type used for controlling packaged fire-tube and water-tube boilers. In the single element
method, control is based on the boiler drum level measurement only. This does not allow
for compensation of shrink or swell and, therefore, is considered to be an acceptable
control method only for small boilers with slow load changes. In two-element control,
steam flow and boiler drum level are measured. The steam flow signal is used in a feed-
forward control loop to anticipate the need for an increase in feedwater to maintain a
constant drum level. This control system requires that the open loop relationship between
the steam flow transmitter signal and the feedwater flow remain constant. Boilers with
moderate load changes can usually be controlled with this control method. Three-element
drum level control adds a feedwater flow signal to the steam flow and boiler drum level
signals used in two-element drum level control. The drum level controller manipulates the
feedwater flow set point in conjunction with feed forward from the steam flow
measurement. The feed forward component keeps the feedwater supply in balance with
the steam demand. The drum level controller trims the feedwater flow set point to

122
compensate for errors in the flow measurements or any other unmeasured load
disturbances (e.g. blowdown) that may affect the drum level. Three-element control is
used in boilers that experience wide, fast load changes, and is the most widely used.
7.4 Other Tube failure Mechanisms
There are other failures mechanism that may affect the boiler integrity such as thermal
fatigue and tube internal corrosion.
7.4.1 Thermal Fatigue
Thermal cracking is another tube failure cause. These cracks are caused by heat stress due
to thermal cycling resulting from boilers frequent startups and shutdown. Thermal cycling
produces local stresses which may exceed the allowable yield stress of the boiler tube
material. In addition, the different thermal expansion of the weld attachments to tubes
where thermal expansion or contraction of one or both pieces of metal results in tensile
stresses (strain). Excessive cyclic stresses can result in predominantly cracking
mechanisms (e.g., thermal fatigue cracking or circumferential water wall cracking).
Tube damage occurs due to the combination of thermal fatigue and corrosion. Corrosion
fatigue is influenced by boiler design, water chemistry, boiler water oxygen content and
boiler operation. A combination of these effects leads to the breakdown of the protective
magnetite on the ID surface of the boiler tube. The loss of this protective scale exposes
tube to corrosion. The locations of attachments and external weldments, such as buckstay
attachments, seal plates and scallop bars, are most susceptible. The problem is most likely

123
to progress during boiler start-up cycles. Figure 59 shows a thermal fatigue cracking of
boiler tube.
Figure 59: Thermal Cracking
Note: Taken from Saudi Boiler
7.4.2 Boiler Tubes Internal Corrosion
The other common root cause of tube leak is occurred due to internal corrosion. These
pinholes usually occurred due to corrosion fatigue in the internal side of the boiler tubes.
This corrosion is either due to oxygen pitting or acid attack occurred during chemical
cleaning.
When the tube metal temperature is gradually increased beyond this temperature, then the
influence of combined effect of loop stress (related to internal pressure of steam and tube
dimension) and temperature will result into plastic deformation (swelling) and rupture of
the tube. Boiler tubes are overheated due to the internal deposits insulating the tube metal

124
from the cooling effect of steam. As the deposits do not form uniformly along the tube,
overheating is always localized in nature.
7.5 Concluding Remarks
In conclusion, the changes in steam demand are expected to result in changes in drum
pressure and water level. In order to retrofit these, changes in firing rate and feedwater
flow rate have to be performed. As shown in the above subsection, the pressure of the
drum is used as a signal to control the firing rate. The feedwater control is normally
achieved by utilizing signals representing the water level, steam flow rate and feedwater
flow rate. Thus, it was intended in the present study to develop control techniques in order
to achieve the control of drum pressure and water level under different operating
conditions of rise in steam demand.

125
CHAPTER 8
CONCLUSION AND RECOMMENDATIONS
This chapter is presenting the study conclusion that is divided into three sections. In the
first two sections, the results and recommendations recommendation in how to avoid tube
rupture are summarized. The last section presents the latest boiler technologies in the
market that can are design with a high ramping rate.
8.1 Conclusion
The investigation outcome revealed that the main most root causes are short and long term
overheating due to high heat flux affect and low water level in the steam drum. Tube
overheating occurs when the actual quality of water exceeds the allowable values known
as the design values. The increase of the actual water quality over the allowable values
can be attributed to design or operation problems. The tube overheating due to design
problems is normally caused by increased pressure loss in some of the riser tubes as a
result of bends or extra length that makes the tube a special case not considered in the
calculation of pressure loss at the design stage. Operation problems are due to many
reasons such as scale formation or increased heat flux that is not coupled by increased
water flow rates. This occurs when sudden changes in the rate of firing exist. At any case,

126
to avoid burnout, the actual steam quality should be kept lower than the allowable limits.
Accordingly, to prevent tube overheating, limits of maximum boiler swing rates are
normally specified by boiler manufacturers.
8.2 Recommendations
For safe boiler operation and to avoid costly outages and improve the reliability of the
boilers, below are a summary that need to be followed:
1. The boiler should be operated within its design parameters where the overheating
should be always avoid
2. The actual steam quality should be kept lower than the allowable limits.
3. The maximum boiler swing rates should be limited as specified by boiler
manufacturers.
4. Avoid bleeding with fuel firing or sudden fuel firing switching.
5. Enhanced water circulation arrangements will need to be made to allow rapid
ramp up when the boiler is required. This could be enhanced natural circulation
(corner tube boilers) or assistance by a circulation pump.
6. It’s always recommended designing new boilers at 20 to 25% per minute ramping
rate instead of 10% (the current ones that old boiler design have) to have faster
response to any decline in the steam system header pressure avoiding any
operation interruption.
7. Minimize unnecessary startups and shutdowns of the boilers to avoid thermal
cyclic stress which is one of the main reasons of the repetitive failures of the tubes.
This could be accomplished by reviewing the startups and shutdown procedures.
8. Avoid quick boiler startup (cold or hot) to avoid tube short-term or long-term tube

127
overheating which results in tube rapture. This could be accomplished by adhering
to the boiler general operation instruction.
9. Designers shall consider steam drum sizing and the control system for different
operating modes as rapid production of steam bubbles makes the steam drum
water level rise rapidly.
10. Maintain the boiler water chemistry within the recommended limits specified by
water treatment vender to avoid presence of corrosion elements inside the boiler
that lead to tubes failure and internal parts damage.
8.3 Rapid Response Boilers Technology
Most standard modern industrial boilers will improve the potential performance as
standby plant. There are therefore numerous examples of boilers which would perform
much better than the existing boiler plant. These boilers are not considered as particularly
special designs but may still have a minimum continuous load of about 10% MCR minute
ramp rates. As per the conducted survey with the boiler manufacturers, such boilers are
available from several of the usual suppliers and It is possible to have boilers that give
very low minimum output to full output in 3-5 minutes. There are also adaptations of such
designs to operate in hot standby mode as shown in the literature survey section.
Therefore, the industrial market has new boilers design up to 20 to 25% per minute
ramping rate instead of 10% (the current ones that old boiler design have) to have faster
response to any decline in the steam system header pressure avoiding any operation
interruption.

128
8.4 Future Research
In the last section, proposed directions for future research are presented to study boiler
operation under low operating load. Most of hydrocarbon facilities are designed to have a
cogeneration system to produce both power and steam for plant in addition to
conventional packaged type boilers to work in a standby mode. The current MHI boilers
are not designed for the part load (very low load) or standby role which they currently
perform such facilities. They were designed for steady state operation near their rated
output. Those boilers are operated at around 35%-40% output in order to have sufficient
boiler capacity to cover the potential loss of a cogeneration unit. Operating those boilers
with low water circulation and from high heat from burners creates high heat flux on the
tubes and hence failure. It is also important to emphasise that the boilers should be
designed to perform their role as part of the steam supply system. The steam supply
system will require a control system which can manage steam supply and demand.
Accordingly, studying the effect of boilers that are operated at low is recommended using
computer models and CFD techniques which can predict water circulation rates,
temperature transients, expansion and stresses.

129
NOMENCLATURE
A Cross sectional area of the tube
Ad Drum surface area at normal operating level
Adc Cross sectional area of the downcomers
D Diffusion coefficient
G Mass flux
g Acceleration due to gravity (= 9.81)
h Heat transfer coefficient
g Gravitational acceleration
k Dimensionless friction coefficient in the downcomer-riser loop
M Total mass of steam and water in the system
K Thermal conductivity
Kfactor Friction factor
L Drum water level
wL Level variations caused by changes of the amount of water in the
drum
sL Level variation caused by the steam in the drum.
Md Mass of the drum
Mf Mass of saturated liquid in water walls and drum
Mg Mass of saturated vapor in water walls and drum
Mt Total mass of metal (including tubes and drum)
Mmt Total mass of the metal
Mr Total mass of riser tubes
Ms Total mass of steam in the system .
m Mass flow rate
.
cdm
The condensation flow in the drum
.
dcm
The down comer mass flow rate
.
fm Mass flow rate of feedwater supplied to the drum
.
fwm Mass flow rate of feedwater supplied to the drum
.
rm The flow rate out of the risers
.
sm
Mass flow rate of steam exiting the boiler
.
sdm
Steam flow rate through the liquid surface in the drum
P Drum pressure, kPa

130
.
Q Heat flow rate to the risers
Qfactor Heat flux factor "q Heat flux
r Pipe radius
Tm Metal temperature
Ts Saturated steam temperature
t Time
T1 Dimensionless parameter
tm Metal temperature
ts Steam Saturation temperature
U Velocity
V Volume
Vd Drum volume
Vdc Downcomer volume
Vr Volume of riser tubes
Vsd Volume of steam under the liquid level in the drum
x Mass fraction of steam in the flow
xo Distance from bottom at which boiling starts
z Distance along the riser
x The mass fraction of steam in the riser
y Distance along the riser tubes
Greek Symbols
Thermal expansion coefficient
T Tmetal - Tsat
Dynamic viscosity
µf Liquid viscosity
µg Vapour viscosity
Density
s Density of saturated steam
w Saturated water Density
ρf Liquid density
ρg Vapour density
l Longitudinal stress
Tangential stress
r Radial stress

131
REFERENCES
[1] Habib M. A., Al-Zaharnah I., Ayinde T., Al-Anizi S., Al-Awwad M.. Influence of
boiler swing rate on dynamics of thermal and flow characteristics in water circulation
boilers. Computational Thermal Sciences 3 (6)
[2] Elshafei M., Habib M. A., Al-Zaharnah I., Al-Anizi S., Al-Awwad M. Y. , Hajji M.
Optimization of the swing rate of steam generation units using genetic algorithm.
Proceedings of the 12th IASTED International Conference 357697 (013), 15-17.
[3] Habib M. A., Al-Zaharnah I, El-Shafei M., Said S. A. M., Merah N., Al-Anizi S., Al-
Awwad M. Y and Hajji M.. Influence of boiler load swing rates on effective stresses of
drum boiler riser tubes Affiliation(s) du ou des auteurs / Author(s) Affiliation(s) Journal
of pressure vessel technology 132 (6).
[4] Robert D. Port and Harvey M. Herro, The Nalco Guide to Boiler Failure Analysis, the
Nalco Company, McGraq-Hil, inc., New York, 1991.
[5] Siemens Procidia™ Control Solutions Boiler Control Overview /AD353-132 Rev 1
March 2006.
[6] Jason Jacobi, Sales Manager, Cleaver-Brooks Engineered Boiler Systems V.
Ganapathy, Boiler Consultant, Cleaver-Brooks Engineered Boiler Systems, Published
November 2011.
[7] Habib M. A., Al-Zaharnah I, El-Shafei M., Said S. A. M., Al-Anizi S., Al-Awwad M.
Y., and Hajji M. Determination of Maximum Boiler Swing Rates.
[8] Salamah S. Al-Anizi, Simple and Clear Approach to Industrial Boiler Circulation
Analysis. 7th International Conference on Heat Transfer, Fluid Mechanics and
Thermodynamics July 2010, Antalya, Turkey
[9] Astrom K. J., R. D. Bell (1993). A nonlinear model for steam generation processes.
IFAC 12th Triennial World Congress, Sydney, Australia, pp. 649-652
[10] Astrom K. J. and R. D. Bell (1988).Simpl drum-boiler models. IFAC Power Systems
Modelling and Control Applications, Brussels, Belgium, pp. 123-127
[11] Astrom K. J., K.Eklund (1972). A simplified non-linear model of a drum boiler-
turbine unit. International Journal Control 16 (1), pp. 145-169
[12] Astrom K. J., and K. Eklund (1975). A simple non-linear drum boiler model.
International Journal of Control 22 (5), pp. 739-740

132
[13] Astrom, K. J. and R. D. Bell (2000).Drum-Boiler Dynamics, Automatica vol. 36, pp.
363-378.
[14] Bell, R. D. and K. J. Astrom (1996). A fourth order non-linear model for drum-
boilerdynamics. 13th Triennial World Congress, San Francisco, USA, pp. 31-36.
[15] Ben-Abdennour, A. and K. Y.Lee (1996). An Autonomous Control System for
Boiler- Turbine Units, IEEE Transactions on Energy Conversion, vol. 11, No.2, pp. 401-
406.
[16] Chang, C. and W.Chu(1954).Stresses in a Metal Tube Under Both High Radial
Temperature Variation and Internal Pressure, Journal of Applied Mechanics, pp. 101-108.
[17] Changliang L, L.Jizhen, N.Yuguang, L.Wiping (2001).Nonlinear boiler model of
300MWpower unit for system dynamic performance studies.ISIE, Pusan, Korea, pp.
1296-1300
[18] Chen, P. and, J. S. Shamma (2004). Gain-Scheduled L1–optimal Control for Boiler-
Trubine Dynamics with Actuator Saturation, Journal of Process Control vol. 14, pp. 263-
277.
[19] Cheng, C. M. and N. W.Rees(1997). Hierarchical and heuristical fuzzy model based
control of drum-boiler power plant, FUZZ-IEEE '97, pp. 629-634.
[20] Cheres, E., Z. J. Palmor, and, J. Tuch (1994).Drum type boiler following control
configuration. IEEE Transactions on Energy Conversion, vol. 9, No. 1, pp. 199-205.
[21] Cheung, K. P. and L.X.Wang (1998). Comparison of fuzzy and PI controllers for a
benchmark drum-boiler model. Proceedings of the 1998 IEEE International Conference
on Control Applications, Trieste, Italy 1-4 September 1998, pp. 958-962
[23] Daren, Y., and Zhiqiang, X., (2005). Nonlinear Coordinated Control of Drum Boiler
Power Unit Based on Feedback Linearization, IEEE Transactions on Energy Conversion,
vol. 20, No. 1, pp. 204-210.
[24] Davidenko, K. Y. and Rushchinskiy, V. M., (1975).An algorithm for numerical
determination of transient processes in supercritical boilers. Heat Transfer-Soviet
Research, vol. 7, No. 5, pp. 17-30.
[25] De Mello, F. P., (1991). Boiler models for system dynamic performance studies.
IEEE Transactions on Power Systems, vol. 6, No. 2, pp. 66-75.
[26] Dolezal, R. and Varcop, L., (1970). Process Dynamics, Elsevier, London.

133
[27] Dong Y. and C. Tingkuan (2001).HGSSP-A computer program for simulation of
once-through boiler start-up behavior, Heat Transfer Engineering, vol. 22, No. 5, pp. 50-
60.
[28] Fameliaris, A. K. and C. D.Vournas(1994). Inverse dynamics control of a system
power plant, Computer-Aided Control System Design, IEEE/AFAC Joint
Symposium,Tucson, AZ, USA, pp. 205-209.
[29] Farthing, D. C. (2001). Boiler drum level measurement and control: A seminar about
improving boiler room efficiencies, Tech. paper # 909.
[30] Farthing, D. C. (2002). Combustion control strategies for single and dual element
power burners. Steam Digest, pp. 29-34.
[31] Flynn, M. E. and, M. J. 0' Malley (1999). A Drum-Boiler Model for Long Term
Power System Dynamic Simulation, IEEE Transactions on Power Systems, vol. 14, No.1,
pp.209-217.
[32] Franke, R., Rode, M., Krüger, K., (2003). On-line Optimization of Drum Boiler
Startup, Proceedings of the 3rd International Modelica Conference, Linköping, November
3-4, pp.287-296, Peter Fritzson (editor).
[33] Garduno-Ramirez, R. and Lee, K. Y., (2001).Multiobjective Optimal Power Plant
Operation Through Coordinate Control with Pressure Set Point Scheduling, IEEE
Transactions on Energy Conversion, vol. 16, No.2, pp. 115-122.
[34] Gough, B. (2000). Advanced control of steam superheat temperature on a utility
boiler, ISA EXPO/2000 Technology Updates.
[35] Green, C.H., Lis, J. and Hitchcock, J. A.,(1985).Modeling of AGR boiler
thermal performance, Nucl. Energy,vol. 24, No. 6, pp. 367-380.
[36] Habbi, H., Zelma, M., and Bouamama, B., (2003).A dynamic fuzzy model for a
drum-boiler-turbine system, Automatica, vol. 39, pp. 1213-1219.
[37] Idemen., M., A. Kandil, A. A. El-Kady, and A. El-Kafrawy (1995). Transient
thermal stress analysis of thick-walled cylinders, International Journal of Mechanical
Sciences, Volume 37,No. 7, pp. 721-732.
[38] Joronen, T., (2002). A simple fuzzy statistical evaluation for process control
performance, Proceedings of the 2002 IEEE International Conference on Artificial
Intelligence Systems, pp. 75-77.
[39] Kalam, M. A.and T. R.Tauchert (1978).Stresses in an Orthotropic Elastic Cylinder
Due to A Plane Temperature Distribution T(r,), Journal of Thermal Stresses, vol. 1, pp.
13-24.

134
[40] Kandil, A. (1996).Analysis of thick-walled cylindrical pressure vessels under the
effect of cyclic internal pressure and cyclic temperature, International Journal of
Mechanical Sciences, vol. 38, No. 12, pp. 1319-1332.
[41] Kandil, A., El-Kady, A. A. and El-Kafrawy, A., (1995).Transient thermal stress
analysis of thick-walled cylinders, Int. J. Mech. Sci., vol. 37, No. 7, pp. 721-732.
[42] Kar, P. K., Kitscha, W. and Chou, Q.B., (1984).Validation of a fossil-fired power
plant simulation model (SOFPAC),ISA Transactions, vol. 23, No. 3, pp. 33-41.
[43] Kim, H., Choi, S. (2005). A Model on Water Level Dynamics in Natural Circulation
Drum-Type Boilers, International Communications in Heat and Mass Transfer vol. 32, pp.
786-796.
[44] Koutb, M. A., El-Rabaie, N. M., Awad, H. A. and Hewaidy, S. M., (2004).
Multivariable fuzzy control for a non-linear drum boiler process, IEEE, International
Conference on Electrical, Electronic and Computer Engineering, ICEEC’04, 5-7 Sept.
2004, pp. 3-9.
[45] Inoue, T., H. Taniguchi and Ikeguchi, Y. (2000). A model of fossil fueled plant with
once-through boiler for power system frequency simulation studies. IEEE Transactions on
Power Systems, vol. 15, No. 4, pp. 1322-1328.
[46] Kruger, K., Franke, R. and Rode, M., (2004).Optimization of boiler start-up using a
nonlinear boiler model and hard constraints, Energy, vol. 29, pp. 2239-2251.
[47] Kruger, K., Rode, M. and Franke, R., (2001).Optimal control for fast boiler start-up
based on a non-linear model and considering the thermal stress on thick-walled
components|, Proceedings of the IEEE International Conference on Control Applications,
September 5-7,Mexico City, Mexico, 2001, pp. 570-576.
[48] Kudryavtsev IV, Burmistrova LN, MaminovAS, Shkanov IN (1970).Fatigue testing
of boiler steels under an asymmetric stress range. Journal of Strength of Materials, vol. 2,
No. 2, pp. 183-186, (translated from ProblemyProchnosti (2), pp. 77-80
[49] Kwatny, H. G. and Berg, J. M., (1994). Variable Structure Regulation of Power Plant
Drum Level," in Systems and Control Theory for Power Systems, J.C. Chow, R. J.
Thomas and P. V. Kokotovic, editors, IMA Volumes in Mathematics and its Applications,
vol. 64,Springer-Verlag, NY, pp. 205-234.
[50] Kwatny, H. G. and Berg, J., (1993). Drum Level Regulation at All Load Levels,
Proceedings of the 12th IFAC World Congress, Sydney, Australia, vol. 3, pp. 405-408.
[51] Leva, A., Maffezzoni, C. and Benelli, G., (1999). Validation of drum boiler models
through complete dynamic tests, Control Engineering Practice, vol. 7, pp. 11-26.

135
[52] Li, B., Chen, T. and Yang, D., (2005).DBSSP-A computer program for simulation of
controlled circulation boiler and natural circulation boiler start up behavior, Energy
Conversion and Management, vol. 46, pp. 533-549.
[53] Macdonald, I., and Strachan, P., (2001).Practical application of uncertainty analysis,
Energy and Buildings, vol. 33, pp. 219-227.
[54] Merah, N., (1981).Computation of Stress Intensity Factors for Flawed Bodies with
Residual Stresses, MSc Thesis, University of Tulsa, OK, USA.
[55] Naga, S., (1986).Optimum Working Conditions in Thick Walled Cylinders, Journal
of Engineering Materials and Technology, vol. 108, pp. 374-376.
[56] Nanhua, Y., Wentong, M., and Ming, S., (2006). Application of adaptive Grey
predictor based algorithm to boiler drum level control, Energy Conversion &
Management, 47, pp.2999-3007.
[57] Nomura, M. and Sato, Y., (1989). Adaptive Optimal Control of Steam Temperatures
for Thermal Power Plants,IEEE Transactions on Energy Conversion, vol. 4, No. 1, pp. 25-
33.
[58] Obata, Y. and N. Noda, (1994)."Steady Thermal Stresses in A Hollow Circular
Cylinder and A Hollow Sphere of A Functionally Gradient Material", Journal of Thermal
Stresses, vol. 17,pp. 471-487.
[59] Pedersen, T. S, Hansen, T. and Hangstrup, M., (1996).Process-optimizing
multivariable control of a boiler system, UKACC International Conference on Control,
Proceedings of the IEEE Control Conference, pp. 787-792.
[60] Peet, W. J. and Leung, T. K. P., (1995). Development and Application of a Dynamic
Simulation Model for a Drum Type Boiler with Turbine Bypass System, International
Power Engineering Conference March, Singapore, pp. 1-6.
[61] Pellegrinetti, G., and, J.Bentsman (1996). Nonlinear control oriented boiler
modeling. A benchmark problem for controller design, IEEE Transactions on Control
Systems Technology,vol. 4, No. 1, pp. 57-64.
[62] Pereyra, E.J., Shah, B. A., and Edwards, L. L., (1989). Circulation Rates and Tube
Burnout in Natural Circulation Boilers, TappiJournal,vol. 72, pp. 143-148.
[63] Pronobis, M., Wojnar, W. and Czepelak, J., (2004). Influence of non-uniform heating
on the stresses in tubes of superheaters in boilers, ForschungimIngenieurwesen, vol. 68,
pp. 1-9.
[64] Rovnak, J. A., (1991). Dynamic Matrix Based Control of Fossil Power Plants, IEEE
Transactions on Energy Conversion,vol. 6, No.2, pp. 320-326.

136
[65] Shadley, J. R., Merah, N. and Rybicki, E., (1982). The Effect of Induction Heating
Stress Remedies on Existing Flaws in Pipes, 1.Pressure Vessel Technology, vol. 104,193-
197, 1982.
[66] Silva, R. N., Shirley, P. O., Lemos, J. M., Goncalves, A. C., (2000). Adaptive
regulation of super-heated steam temperature: a case study in an industrial boiler, Control
Engineering Practice, vol. 8, pp. 1405-1415.
[67] Sinha, R. (1978). Thermal Stress Analysis of A Hollow Thick Cylinder by the Finite
Element Method, J. Inst. Eng. (India) Mech. Eng., Division. 59, pp. 31-33.
[68] Sorensen K., Houbak, N., and, T.Condra (2006).Solving differential-algebraic
equation systems by means of index reduction methodology,Simulation Modeling
Practice and Theory, vol. 14, No. 3, pp. 224-236.
[69] Sreedhar, R., Fernandez, B. and Masada, G. Y., (1995). Sliding Control Retrofit for
aThermal Power Plant, Proceedings of the 4th IEEE Conference on Control Applications,
28-29 Sept. 1995, pp. 409 – 414.
[70] Stasyuk, S., Gromovyk, V. and Bihuya, A., (1979).Thermal-Stress Analysis of
HollowCylinder with Temperature-Dependent Thermal Conductivity, Institute of Applied
Problems of Mechanics and Mathematics, Academy of Sciences of The Ukrainian SSR,
Lvov. Translated from PriblemyProchnosti, No. 1, pp. 41-43.
[71] Tamma, K. K. and B. Rai1kar, (1987).Nonlinear/Linear Unified Thermal Stress
Formu1ations: Transfinite Element Approach, Computer Methods in Applied Mechanics
and Engineering, vol. 64, pp. 415-428.
[72] Tan, W., Liu, J., Fang, F. and Chen, Y., (2004).Tuning of PID controllers for boiler-
turbine units, ISA Transactions, vol. 43, pp. 571-583.
[73] Termuehlen, H. and, G. Gartner 1(981). Sustained fast turbine-generator load
response in fossil-fueled power plants, IEEE Transactions on Power Apparatus and
Systems,vol. 100, No. 5, pp. 2495-2503.
[74] Tucakovic, D. R., Stevanovic, V. D., Zivanovic, T., Jovovic, A., Ivanovic, V. B.,
(2007). Thermal-hydraulic analysis of a steam boiler with rifled evaporating tubes,
Applied Thermal Engineering, vol. 27,pp. 509-519.
[75] Unbehauen, H., Keuchel, U. and Kaaanlan, I., (1991). Real-Time Apadtive Control
of Electrical Power and Enthalpy for a 750 MW Once-Through Boiler, Control
1991,Control 9th International Conference on Publication, 25-28 Mar, vol.1,Edinburgh,
UK,pp.42-47.
[76] Wang, W., Li, H. X. and Zhang, J., (2002). Intelligence-based hybrid control for
power plant boiler, IEEE Transactions on Control Systems Technology,vol. 10, No. 2, pp.
280-287.

137
[77] Wigren, T. (2005). Recursive identification based on nonlinear state space models
applied to drum-boiler dynamics with nonlinear output equations. 2005 American Control
Conference, Portland, OR, USA, pp. 5066-5072.
[78] Wolf, A. L. and T. E.Neill (2006).Thermal shock, Application Engineering/Technical
Services, Heating and Cooling Technology, pp. 1-6.
[79] Xu, M., Li, S. and Cai, W., (2005). Cascade generalized predictive control strategy
for boiler drum level. ISA Transactions, vol. 44, pp. 399-411.
[80] Yang, P., Peng, D. G., Yang, Y.H. and Wang, Z. P., (2004). Neural networks internal
model control for water level of boiler drum in power station. Proceedings of the Third
International Conference on Machine Learning and Cybernetics, Shanghai, 26-29 August
2004, pp. 3300-3303.
[81] Yokokawa, S., Ueki, Y., Tanaka, H., Doi, H., Ueda, K. and Taniguchi, N., (1988).
Multivariable Adaptive Control for a Thermal Generator,' IEEE Transactions on Energy
Conversion,vol. 3, No.3, pp. 479-486.
[82] Yoon, D. J., Y. S. Kim, J. Y. Lee, Jun, H. Y., J. S.Kim (2005). Optimization for
setpoints of steam generator water level control systems in power-uprated YGN 1 & 2 and
Kori 3 & 4.J Nuclear Science &Technology,vol. 42, No. 12, pp. 1067-1076.
[83] Al-Zaharnah, I. T., B. S.Yilbas, M. S. J. Hashmi (2004). Study into thermal stresses
due to turbulent flow in pipes, Heat and Mass Transfer, vol. 40, pp. 191-202.

138
VITAE
Mossaed Yousif Al-Awwad
Born in July 23,1977
Received Bachelor’s degree in Mechanical Engineering from King Fahd
University of Petroleum and Minerals, Dhahran, Saudi Arabia.
Have joined a Saudi Aramco in Dhahran, Saudi Arabia.
Completed Master’s degree in Mechanical Engineering from King Fahd
University of Petroleum and Minerals, Dhahran, Saudi Arabia in December, 2013.
Email address : [email protected]
Technical Papers Published Out Of This Thesis
Three (3) technical papers were published so far out of this work, two published
are journal papers and one is conference paper:
1. Habib M. A., Al-Zaharnah I., Ayinde T., Al-Anizi S., Al-Awwad M. Influence of
boiler swing rate on dynamics of thermal and flow characteristics in water
circulation boilers. Computational Thermal Sciences 3 (6)
2. Elshafei M., Habib M. A., Al-Zaharnah I., Al-Anizi S., Al-Awwad M. Y. , Hajji
M. Optimization of the swing rate of steam generation units using genetic
algorithm. Proceedings of the 12th IASTED International Conference 357697
(013), 15-17.
3. Habib M. A., Al-Zaharnah I, El-Shafei M., Said S. A. M., Merah N., Al-Anizi S.,
Al-Awwad M. Y and Hajji M.. Influence of boiler load swing rates on effective
stresses of drum boiler riser tubes Affiliation(s) du ou des auteurs / Author(s)
Affiliation(s) Journal of pressure vessel technology 132 (6).
Top Related
Copyright © 2022 FDOKUMEN

