


Bahasa
Halaman
Hukum

THERMAL HISTORY OF LOWER PALEOZOIC ROCKS ON THE PERI-TORNQUIST
MARGIN OF THE EAST EUROPEAN CRATON (PODOLIA, UKRAINE) INFERRED
FROM COMBINED XRD, K-Ar, AND AFT DATA
JAN SRODON1 , MARIUSZ PASZKOWSKI
1 , DANIEL DRYGANT2, ANETA ANCZKIEWICZ
1 , AND MICHAŁ BANAS1
1 Institute of Geological Sciences, Polish Academy of Sciences – Research Centre in Krakow, ul. Senacka 1, 31-002 Krakow,Poland
2 Natural History Museum of National Academy of Sciences of Ukraine, 18 Teatralna St., 79008 L’viv, Ukraine
Abstract—The Upper Silurian�Lower Devonian section of the Dniester gorge in Podolia and samplesfrom boreholes located S and N of this area were studied in order to reconstruct the thermal history ofLower Paleozoic sedimentary rocks in the Dniester segment of the Peri-Tornquist margin of the EastEuropean Craton which is the most eastern part of a major shale-gas target in Europe. X-ray diffraction datafor illite-smectite from shales and carbonates indicate very advanced diagenesis and maximumpaleotemperatures of ~200ºC, higher than interpreted from the ‘conodont alteration index’ (CAI) data.Diagenesis of the Devonian section is slightly less advanced than that of the underlying Silurian section,indicating that it is a regional feature and the result of burial. The regional distribution of the diageneticgrade based on illite matches well with the pattern established from the CAI data. K-Ar dating of illite-smectite from Silurian bentonites and shales gave a consistent set of dates ranging from 390 to 312 Ma. Toexplain such advanced levels of diagenesis and such K-Ar dates, the extension of the Carboniferousforeland basin (which today is only preserved to the NW of L’viv) toward the SE on the craton margin hasto be assumed. The diagenetic zonation pattern of the Carboniferous coals supports this hypothesis. TheCarboniferous cover may have been either sedimentary or partially tectonic (Variscan intracratonicduplexes) in origin and the thickness, necessary for the observed level of diagenesis, may have beenreduced by an elevated heat flow along the major tectonic zone at the edge of the craton (TESZ). Thepresence of such cover is confirmed by completely reset Cretaceous apatite fission track (AFT) ages of theSilurian bentonites. The AFT dates also imply a Tertiary heating event in the area.The 10 A clay mineral present in the dolomitic part of the profile (Silurian), both in bentonites and in
other rocks, is aluminoceladonite or intermediate between illite and aluminoceladonite, while in theDevonian shale section only illite was documented. Chlorite is also common in the studied rocks and is atleast partially authigenic. It is non-expandable in the samples from boreholes, while often expandable tovariable extents in the samples from outcrops, which also contain goethite. Such variation in chlorite isattributed to contemporary weathering.
Key Words—AFT, Aluminoceladonite, Chlorite Weathering, Illite, K-Ar, Peri-Tornquist Margin,Podolia, Shale Gas, Silurian, Thermal History, Ukraine.
INTRODUCTION
The East European Craton (thereafter EEC), also
called Baltica, is a fragment of Archean–Mid-
Proterozoic crystalline continental crust, ~2500 km
across, acting as a separate block of the lithosphere
since the ca. 750 Ma (break-up of the Rodinia
megacontinent: cf. Nawrocki and Poprawa, 2006), with
the sedimentary cover starting in the Riphean and
preserved to different degrees mostly in intracratonic
and marginal basins (Nikishin et al., 1996). The 2000 km
long SW margin of the craton (called the Peri-Tornquist
margin) faces the Teisseyre-Tornquist Zone (TTZ), also
known as the Trans-European Suture Zone (TESZ: e.g.
Skompski et al., 2008; Drygant, 2011), which is the
major tectonic line dividing the European crust of
Precambrian age from that of younger consolidation
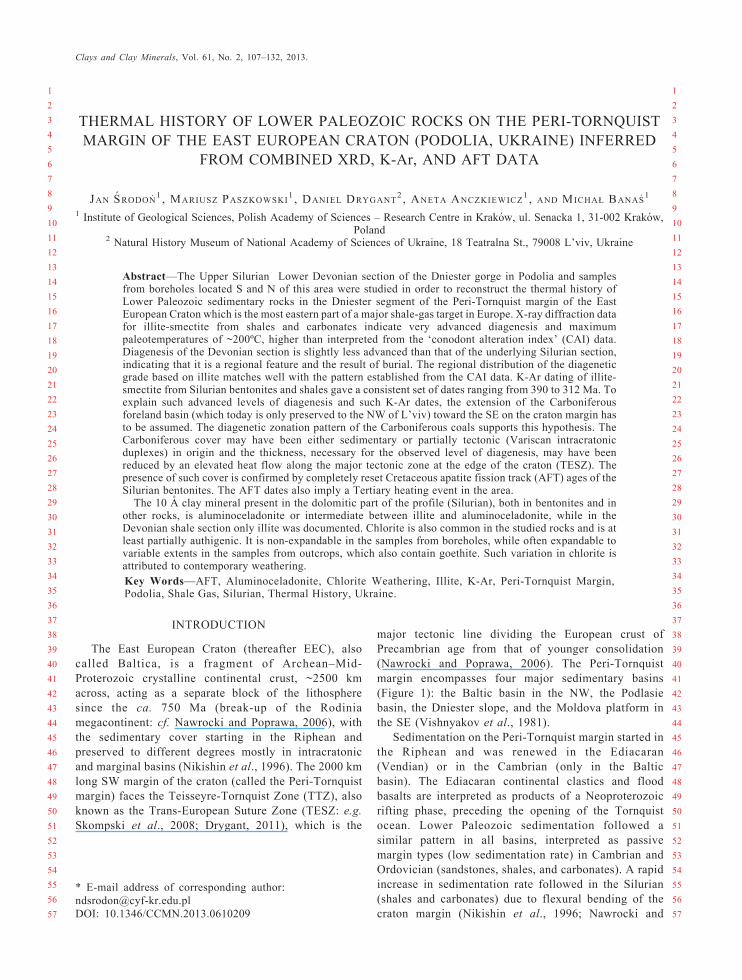
(Nawrocki and Poprawa, 2006). The Peri-Tornquist
margin encompasses four major sedimentary basins
(Figure 1): the Baltic basin in the NW, the Podlasie
basin, the Dniester slope, and the Moldova platform in
the SE (Vishnyakov et al., 1981).
Sedimentation on the Peri-Tornquist margin started in
the Riphean and was renewed in the Ediacaran
(Vendian) or in the Cambrian (only in the Baltic
basin). The Ediacaran continental clastics and flood
basalts are interpreted as products of a Neoproterozoic
rifting phase, preceding the opening of the Tornquist
ocean. Lower Paleozoic sedimentation followed a
similar pattern in all basins, interpreted as passive
margin types (low sedimentation rate) in Cambrian and
Ordovician (sandstones, shales, and carbonates). A rapid
increase in sedimentation rate followed in the Silurian
(shales and carbonates) due to flexural bending of the
craton margin (Nikishin et al., 1996; Nawrocki and
* E-mail address of corresponding author:
DOI: 10.1346/CCMN.2013.0610209
Clays and Clay Minerals, Vol. 61, No. 2, 107–132, 2013.
1
2
3
4
5
6
7
8
9
10
11
12
13
14
15
16
17
18
19
20
21
22
23
24
25
26
27
28
29
30
31
32
33
34
35
36
37
38
39
40
41
42
43
44
45
46
47
48
49
50
51
52
53
54
55
56
57
1
2
3
4
5
6
7
8
9
10
11
12
13
14
15
16
17
18
19
20
21
22
23
24
25
26
27
28
29
30
31
32
33
34
35
36
37
38
39
40
41
42
43
44
45
46
47
48
49
50
51
52
53
54
55
56
57

Poprawa, 2006; Sliaupa et al., 2006). The carbonate-
dominated sedimentation continued in the Silurian in the
shallowest NE zone of the craton margin (Garetsky et
al., 1981; figure 8 of Sliaupa et al., 2006; Drygant,
2011).
The Lower Paleozoic shales of the Peri-Tornquist
margin are currently the major shale-gas target in Europe
(Poprawa, 2010), which has led to an increased interest
in their diagenetic history. A synthetic study based on
the CAI and vitrinite reflectance (Ro; Nehring-Lefeld et
al., 1997) revealed a systematic zonation in the degree of
diagenesis along the entire margin, including its
Ukrainian part (CAI data from Drygant, 1993). The
interior of the craton has yielded CAI values of 1�1.5(for Ordovician�Devonian), indicative of paleotempera-
tures between 50 and 90ºC, according to the CAI
calibration of Epstein et al. (1977). Toward the SW
the CAI values (for the Ordovician) gradually increase
and reach 5 (300�480ºC) in the TESZ. This picture is
consistent with the parallel increase in Ro from 0.5 to
4.6. In addition, in the Baltic basin sector of the margin,
analogous zonation was established from the X-ray
diffraction (XRD) evaluation of the composition of
illite-smectite (percent smectite layers: %S) in shales
(Srodon et al., 2009a).
The Silurian and Ordovician rocks of the margin
contain numerous bentonite horizons with pure diage-
netic illite-smectite, which offer an opportunity for K-Ar
dating of the maximum paleotemperatures (Srodon et al.,
2002), i.e. dating the main episode of hydrocarbon
generation. In the Baltic basin the K-Ar ages of illite-
smectite from bentonites range from 404 to 294 Ma and
on the craton margin they are interpreted as indicative of
a deep burial under the Devonian and Carboniferous
sedimentary cover (Srodon et al., 2009a), which is
consistent with the geological data (Ulmishek, 1990).
Farther to the SE such data are lacking.
A unique opportunity for such a geochronological
study on the Dniester slope (Figures 1, 2a) is offered by
the ~250 m thick carbonate section of the Upper Silurian
(Ludlow and Pridoli), exposed in the banks of Dniester
gorge in the Kamyanets Podilsky area (Figure 2b), where
numerous bentonite beds can be sampled (Tsegelnjuk,
1980a, 1980b). The beds contain a typical bentonitic
mineral assemblage: highly illitic illite-smectite, some-
times of a 1M polytype, K-feldspar, quartz, biotite,
apatite and zircon (Huff et al., 2000; Kipli et al., 2000).
In this study these bentonite beds are used for K-Ar
dating of illite-smectite, and for AFT dating, while the
accompanying shales and overlying Lower Devonian
massive shales are used to evaluate the maximum
paleotemperatures based on %S (Srodon, 2007).
The combination of XRD, K-Ar, and AFT is a
powerful set of methods for basin history studies. The
maximum paleotemperatures estimated from XRD and
their ages measured by K-Ar have to be consistent with
the age and paleotemperature estimations from AFT.
The apatite fission tracks anneal completely above
120ºC (Naeser, 1981). Thus, the AFT measurement
indicates whether the sample has been buried to
temperatures >120ºC (total reset of the original age of
the apatite crystal) and when it passed the 120ºC
isotherm for the last time on its way to the surface.
Such an approach has produced very consistent results
Figure 1. Location of the Dniester slope on the Peri-Tornquist margin of the East European Craton. Map of SW part of the craton
(without late Paleozoic and younger cover) adapted from Sliaupa et al. (2006). TESZ � Trans European Suture Zone.
1
2
3
4
5
6
7
8
9
10
11
12
13
14
15
16
17
18
19
20
21
22
23
24
25
26
27
28
29
30
31
32
33
34
35
36
37
38
39
40
41
42
43
44
45
46
47
48
49
50
51
52
53
54
55
56
57
1
2
3
4
5
6
7
8
9
10
11
12
13
14
15
16
17
18
19
20
21
22
23
24
25
26
27
28
29
30
31
32
33
34
35
36
37
38
39
40
41
42
43
44
45
46
47
48
49
50
51
52
53
54
55
56
57
108 Srodon et al. Clays and Clay Minerals

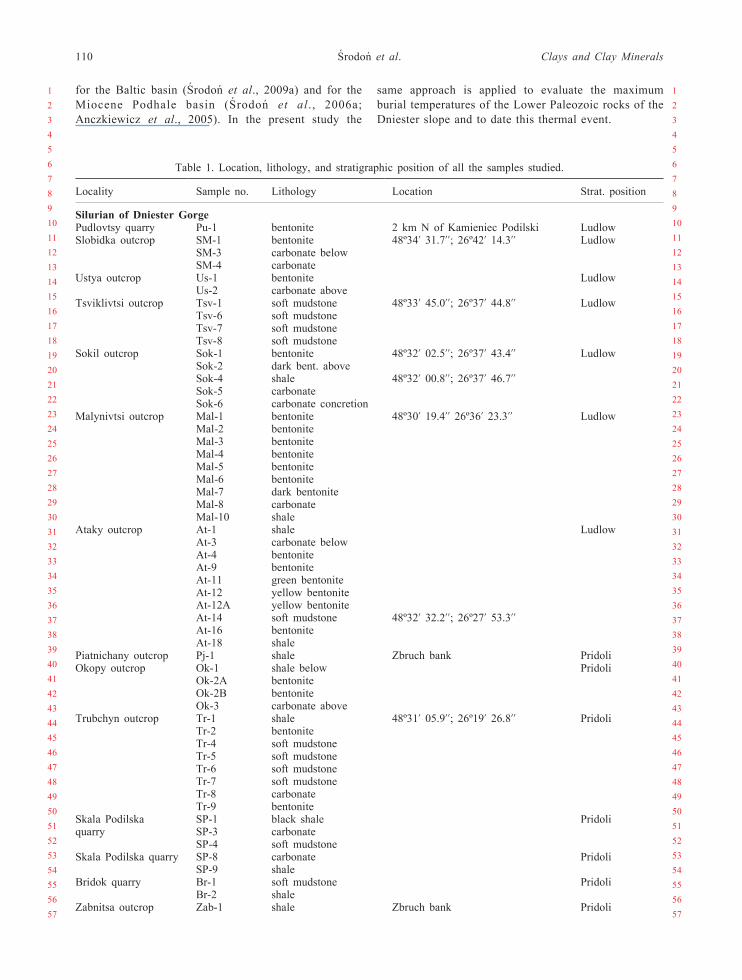
Figure 2. Sample location on the geological map without post-Paleozoic cover (a), compiled from Pozaryski and Dembowski (1983)
and Buła and Habryn (2011), and on detailed map of the Dniester gorge and its tributaries (b).
1
2
3
4
5
6
7
8
9
10
11
12
13
14
15
16
17
18
19
20
21
22
23
24
25
26
27
28
29
30
31
32
33
34
35
36
37
38
39
40
41
42
43
44
45
46
47
48
49
50
51
52
53
54
55
56
57
1
2
3
4
5
6
7
8
9
10
11
12
13
14
15
16
17
18
19
20
21
22
23
24
25
26
27
28
29
30
31
32
33
34
35
36
37
38
39
40
41
42
43
44
45
46
47
48
49
50
51
52
53
54
55
56
57
Vol. 61, No. 2, 2013 Thermal history of Lower Paleozoic rocks, East European Craton 109
for the Baltic basin (Srodon et al., 2009a) and for the
Miocene Podhale basin (Srodon et al. , 2006a;
Anczkiewicz et al., 2005). In the present study the
same approach is applied to evaluate the maximum
burial temperatures of the Lower Paleozoic rocks of the
Dniester slope and to date this thermal event.
Table 1. Location, lithology, and stratigraphic position of all the samples studied.
Locality Sample no. Lithology Location Strat. position
Silurian of Dniester GorgePudlovtsy quarry Pu-1 bentonite 2 km N of Kamieniec Podilski LudlowSlobidka outcrop SM-1 bentonite 48º34’ 31.7’’; 26º42’ 14.3’’ Ludlow
SM-3 carbonate belowSM-4 carbonate
Ustya outcrop Us-1 bentonite LudlowUs-2 carbonate above
Tsviklivtsi outcrop Tsv-1 soft mudstone 48º33’ 45.0’’; 26º37’ 44.8’’ LudlowTsv-6 soft mudstoneTsv-7 soft mudstoneTsv-8 soft mudstone
Sokil outcrop Sok-1 bentonite 48º32’ 02.5’’; 26º37’ 43.4’’ LudlowSok-2 dark bent. aboveSok-4 shale 48º32’ 00.8’’; 26º37’ 46.7’’Sok-5 carbonateSok-6 carbonate concretion
Malynivtsi outcrop Mal-1 bentonite 48º30’ 19.4’’ 26º36’ 23.3’’ LudlowMal-2 bentoniteMal-3 bentoniteMal-4 bentoniteMal-5 bentoniteMal-6 bentoniteMal-7 dark bentoniteMal-8 carbonateMal-10 shale
Ataky outcrop At-1 shale LudlowAt-3 carbonate belowAt-4 bentoniteAt-9 bentoniteAt-11 green bentoniteAt-12 yellow bentoniteAt-12A yellow bentoniteAt-14 soft mudstone 48º32’ 32.2’’; 26º27’ 53.3’’At-16 bentoniteAt-18 shale
Piatnichany outcrop Pj-1 shale Zbruch bank PridoliOkopy outcrop Ok-1 shale below Pridoli
Ok-2A bentoniteOk-2B bentoniteOk-3 carbonate above
Trubchyn outcrop Tr-1 shale 48º31’ 05.9’’; 26º19’ 26.8’’ PridoliTr-2 bentoniteTr-4 soft mudstoneTr-5 soft mudstoneTr-6 soft mudstoneTr-7 soft mudstoneTr-8 carbonateTr-9 bentonite
Skala Podilska SP-1 black shale Pridoliquarry SP-3 carbonate
SP-4 soft mudstoneSkala Podilska quarry SP-8 carbonate Pridoli
SP-9 shaleBridok quarry Br-1 soft mudstone Pridoli
Br-2 shaleZabnitsa outcrop Zab-1 shale Zbruch bank Pridoli
1
2
3
4
5
6
7
8
9
10
11
12
13
14
15
16
17
18
19
20
21
22
23
24
25
26
27
28
29
30
31
32
33
34
35
36
37
38
39
40
41
42
43
44
45
46
47
48
49
50
51
52
53
54
55
56
57
1
2
3
4
5
6
7
8
9
10
11
12
13
14
15
16
17
18
19
20
21
22
23
24
25
26
27
28
29
30
31
32
33
34
35
36
37
38
39
40
41
42
43
44
45
46
47
48
49
50
51
52
53
54
55
56
57
110 Srodon et al. Clays and Clay Minerals
MATERIALS AND METHODS
Samples of the Upper Silurian bentonites, carbonates,
soft mudstones, and shales were collected from eight
locations in the Dniester gorge and from one location in
its tributary Zbrutch gorge (Figure 2b; GPS locations
and stratigraphic position given in Table 1). Seven
additional samples from six locations nearby were
provided by S. Skompski. Fifty seven samples were
first investigated as random powders of the bulk rock by
XRD in order to identify and quantify their mineral
composition and to select samples for clay-fraction
separation. The technique of Srodon et al. (2001) and
QUANTA computer program (Mystkowski et al., 2002)
were used for the quantification.
Twenty one of the purest bentonite samples and 26
other rocks were selected for clay-fraction separation.
The full Jackson (1975) procedure was applied and the
<0.2 mm fractions were separated by centrifugation. The
<0.2 mm fractions of six bentonite samples underwent
further separation into 0.2�0.05, 0.05�0.02, and
<0.02 mm fractions by flow-through ultracentrifugation
(details in Srodon et al., 2006b). Both the <0.2 mm and
finer fractions, all in Na form, were subjected to K-Ar
dating, following the standard procedure (Srodon et al.,
2006b). Na-exchanged and not natural samples were
used for dating in order to avoid any exchangeable K,
which could potentially reduce the measured ages. %S
was measured by several peak-positions techniques
(Srodon, 1984; Dudek and Srodon, 1996; Srodon et al.,
2009b) from the XRD patterns of the random bulk-rock
air-dry preparations and from the glycolated oriented
preparations of the <0.2 mm fractions, recorded with
MoS2 as the internal standard:
(1) Two-peak technique (Dudek and Srodon, 1996,
Figure 5 [this article or D&S,96?]), which uses peaks of
the glycolated <0.2 mm fractions at 15.3�17.9 and
25.9�26.9º2y (CuKa).(2) Experimental regressions of %S vs. peak position,
established from the data of Srodon et al. (2009b, Table 6
[this article or S, 09?]). The %S from the D2 technique is
considered the most accurate and is used as the ‘true
value’ in the regressions. Such regressions are applied to
several reflections of the glycolated <0.2 mm fractions and
also to the low-angle reflection of the air-dry illite-
smectite, measured from the XRD patterns of the bulk
rocks, under the assumption that Ca is the dominant
natural exchange cation in these rocks with abundant
carbonates.
Ten shale samples were collected from the overlying
Lower Devonian (Lochkovian) shale and shale-carbo-
nate section, ~530 m thick (Drygant, 2010, figure 1.10),
exposed in the Dniester gorge between Dnistrove and
Zalishchyky (Figure 2b). They were processed in the
same way as the Silurian shales and their <0.2 mmfractions were investigated by XRD, in order to evaluate
the degree of diagenesis (%S). Additionally, the same
technique was applied to one sample of a Silurian shale
from the deeper, shale zone in the TESZ (borehole
Lishchyns’ka-1), one Lower Devonian shale from the
area north of the Dniester gorge (Chortkiv outcrop), and
five Lower Devonian plus one Silurian shale samples
from borehole 6618, located in the northernmost part of
the Dniester slope (Figure 2a).
Scanning electron microscopy (SEM) was used to
study the morphology and composition of adularia
identified by XRD in bentonites, to discriminate
Table 1 (contd)
Locality Sample no. Lithology Location Strat. position
Devonian of Dniester GorgeDnistrove Dn-1 shale 48º32’ 16.9’’; 26º14’ 21.4’’ S/D border
Dn-3 shale 1.5m aboveMykhalkiv Myk-1 shale 48º36’ 50.7’’; 26º05’ 17.2’’ Borshchiv Mb.Khudykivtsi Khud-3 shale 48º37’ 09.0’’, 26º07’ 29.1’’ Khudykivtsi Mb.Kryvche Kryv-3 shale 48º42’ 12.4’’; 26º05’ 59.1’’ Borshchiv Mb.Kolodribka Kolod-2 shale 48º33’ 48.9’’; 26º03’ 25.8’’ Borshchiv Mb.Chortkiv Chort-1 shale 48º58’ 15.5’’; 25º48’ 53.1’’ Chortkiv H.Horodok Hor-1 shale 48º37’ 30.3’’; 25º52’ 02.4’’ Chortkiv H.Dobrivlyany Dobr-1 shale 48º40’ 41.5’’; 25º36’ 41.0’’ Ivanie H.Zalishchyky Zalish-1 shale 48º37’ 50.8’’; 25º44’ 13.1’’ Ivanie H.
Zalish-3 shale Dniester ser.
Borehole samples depth (m)6618 6618/9 shale 146.2 Lower Devonian
6618/5 shale 155.8-158.7 Lower Devonian6618/6 shale 167.8-167.9 Lower Devonian6618/7 shale 172.55-172.65 Lower Devonian6618/10 shale 172.9 Lower Devonian6618/11 shale 179.5 Silurian
Lishchyns’ka-1 Lish-1 shale 3300-3306 Silurian
1
2
3
4
5
6
7
8
9
10
11
12
13
14
15
16
17
18
19
20
21
22
23
24
25
26
27
28
29
30
31
32
33
34
35
36
37
38
39
40
41
42
43
44
45
46
47
48
49
50
51
52
53
54
55
56
57
1
2
3
4
5
6
7
8
9
10
11
12
13
14
15
16
17
18
19
20
21
22
23
24
25
26
27
28
29
30
31
32
33
34
35
36
37
38
39
40
41
42
43
44
45
46
47
48
49
50
51
52
53
54
55
56
57
Vol. 61, No. 2, 2013 Thermal history of Lower Paleozoic rocks, East European Craton 111
between Ca-dolomite and ankerite, and to observe the
texture of soft mudstones.
Coarse, clay-free fractions of six bentonites were
separated for the adularia study. The other samples were
investigated by SEM as bulk rocks.
Apatites were separated for AFT dating from five
bentonite samples, using standard crushing, sieving,
magnetic, and heavy-liquid (tetrabromoethane and
diiodomethane) separation techniques. Polished grain
mounts were etched for 20 s in 5 N HNO3 at 20ºC. The
standard glass CN5 was used as a dosimeter to monitor
the neutron flux. Thin flakes of low-U muscovite were
used as external detectors. Samples together with age
standards (Fish Canyon, Durango, and Mount
Dromedary apatite) and Corning glass CN5 dosimeters
were irradiated with a thermal neutron nominal flux of
961015n/cm2 at the Oregon State University TRIGA
reactor (USA). After irradiation, muscovite external
detectors were etched for ~45 min in 40% HF in order to
reveal the induced tracks. Spontaneous and induced
tracks were counted by optical microscopy at 12506magnification using a NIKON Eclipse E-600, equipped
with motorized stage, digitizing tablet, and drawing tube
[Authors: what is a ‘‘drawing tube’’?] controlled by the
program FTStage 3.12 (Dumitru, 1993). Data analyses
and age calculations based on a z value for CN5 (zCN5)
of 344�5 were calculated using the program Trackkey
(Dunkl, 2002).
All quoted AFT ages are ‘central ages’ (weighted
mean ages) in the sense of Gailbraith and Laslett (1993)
�1s, and the variation of single-grain ages was assessed
using the chi-square test (Galbraith, 1981; Green, 1981).
The AFT dating followed the procedure described in
detail by Anczkiewicz (2005).
RESULTS
Mineral composition of the bulk rocks
The bulk-rock data were grouped by the type of rock
(Table 2). For each rock type the samples are arranged
by stratigraphic position, starting from the oldest. The
Silurian and Devonian shales are presented separately. In
the Silurian rocks, the component listed as dolomite is
either true dolomite or Ca-dolomite, as identified by
XRD and confirmed by energy dispersive X-ray spectro-
scopy (EDS). A ful l composi t ional range of
Ca-dolomites is present (104 reflection from 2.884 to
2.903 A: cf. McCarty et al., 2006).
Silurian bentonites. 1M or 1Md illite-smectite dominates
the composition: 64�99%. Calcite ranges from 0 to
24%, adularia from 0 to 14%, quartz from 1 to 7%. Other
minerals are traces, except of elevated chlorite and 2M1
mica content in At-16. No mineral compositional trend
was observed with respect to the stratigraphic position.
Silurian shales. In the Dniester gorge samples, 1Md illite
is the dominant component: 30�58%, but accompanied
by 6�14% of 2M1 mica and 4�10% of chlorite. Quartz
and K-feldspar increase down the section, 11�19% and
2�22%, respectively. Calcite and dolomite show oppo-
site trends: 0�3% and 34�1%, respectively, down the
section. Albite and pyrite are present, but as minor
components. Goethite was identified in only one sample.
The Silurian shale from the CAI = 5 zone (Lish-1)
differs from the Dniester samples in terms of elevated
chlorite and albite contents.
Devonian shales. 1Md illite is slightly less abundant than
in the Silurian section: 22�47%, accompanied by more
2M1 mica and chlorite: 5�19% and 4�13%, respec-
tively. Quartz is clearly more abundant: 11�26%, but
K-feldspar is low, only reaching the minimum levels of
the Silurian section at the base. Calcite and dolomite
both increase down the section, but, unlike the Silurian
shales, calcite is more abundant: 1�55% and 0�8%,
respectively. Albite and pyrite are present as minor
components as in the Silurian shales. Goethite is absent,
but hematite is present in the uppermost sample,
representing the Old Red facies (Dniester series).
Silurian carbonates. Calcite or dolomite are the
dominant minerals: 89�63% and 67�45%, respectively.
Admixtures of dolomite in limestone and calcite in
dolomite are very minor. Other major components are
2:1 clays (1Md illite +2M1 mica: 4�28%) and quartz
(2�23%). K-feldspar is more abundant than albite, and
goethite is absent. The only apparent correlation is that
of more chlorite in dolomites than in limestones.
Silurian soft mudstones. The mineral composition of
these rocks is intermediate between carbonates and
shales. Often both calcite and dolomite are present in
significant quantities. Quartz and K-feldspar increase
down the section, just as in the shales. Goethite is often
observed. As in the carbonates, a positive correlation of
chlorite and dolomite content is observed.
Mineral composition of the <0.2 mm fraction of
bentonites
The <0.2 mm fractions of all 21 bentonite samples are
essentially mono-mineral illite-smectite, without even
traces of other clays. The XRD patterns of all
Malinovtsy plus Ataki 12 and 12a samples contain a
trace of a 3.07 A peak (Figure 3, jarosite?). Glycolated
patterns provide evidence of highly illitic ordered illite-
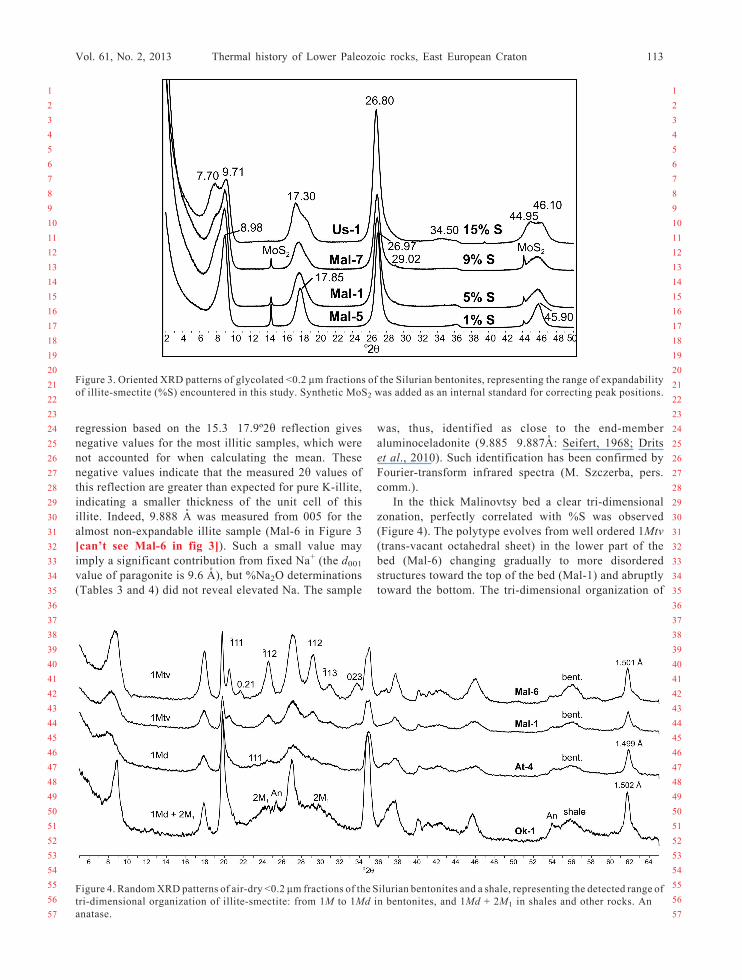
smectite, of ~1�15%S (Figure 3). The greatest degree of
illitization was recorded in the center of the thickest
bentonite bed (Malinovtsy).
The results for air-dry and glycolated samples are
well correlated, but not identical (Table 3). The air-dry
values are systematically higher. Differences between
values based on the reflections from glycolated patterns
are substantial for the most illite-rich compositions. The
1
2
3
4
5
6
7
8
9
10
11
12
13
14
15
16
17
18
19
20
21
22
23
24
25
26
27
28
29
30
31
32
33
34
35
36
37
38
39
40
41
42
43
44
45
46
47
48
49
50
51
52
53
54
55
56
57
1
2
3
4
5
6
7
8
9
10
11
12
13
14
15
16
17
18
19
20
21
22
23
24
25
26
27
28
29
30
31
32
33
34
35
36
37
38
39
40
41
42
43
44
45
46
47
48
49
50
51
52
53
54
55
56
57
112 Srodon et al. Clays and Clay Minerals
regression based on the 15.3�17.9º2y reflection gives
negative values for the most illitic samples, which were
not accounted for when calculating the mean. These
negative values indicate that the measured 2y values of
this reflection are greater than expected for pure K-illite,
indicating a smaller thickness of the unit cell of this
illite. Indeed, 9.888 A was measured from 005 for the
almost non-expandable illite sample (Mal-6 in Figure 3
[can’t see Mal-6 in fig 3]). Such a small value may
imply a significant contribution from fixed Na+ (the d001value of paragonite is 9.6 A), but %Na2O determinations
(Tables 3 and 4) did not reveal elevated Na. The sample
was, thus, identified as close to the end-member
aluminoceladonite (9.885�9.887A: Seifert, 1968; Dritset al., 2010). Such identification has been confirmed by
Fourier-transform infrared spectra (M. Szczerba, pers.
comm.).
In the thick Malinovtsy bed a clear tri-dimensional
zonation, perfectly correlated with %S was observed
(Figure 4). The polytype evolves from well ordered 1Mtv
(trans-vacant octahedral sheet) in the lower part of the
bed (Mal-6) changing gradually to more disordered
structures toward the top of the bed (Mal-1) and abruptly
toward the bottom. The tri-dimensional organization of
Figure 3. Oriented XRD patterns of glycolated <0.2 mm fractions of the Silurian bentonites, representing the range of expandability
of illite-smectite (%S) encountered in this study. Synthetic MoS2 was added as an internal standard for correcting peak positions.
Figure 4. RandomXRD patterns of air-dry <0.2 mm fractions of the Silurian bentonites and a shale, representing the detected range of
tri-dimensional organization of illite-smectite: from 1M to 1Md in bentonites, and 1Md + 2M1 in shales and other rocks. An �anatase.
1
2
3
4
5
6
7
8
9
10
11
12
13
14
15
16
17
18
19
20
21
22
23
24
25
26
27
28
29
30
31
32
33
34
35
36
37
38
39
40
41
42
43
44
45
46
47
48
49
50
51
52
53
54
55
56
57
1
2
3
4
5
6
7
8
9
10
11
12
13
14
15
16
17
18
19
20
21
22
23
24
25
26
27
28
29
30
31
32
33
34
35
36
37
38
39
40
41
42
43
44
45
46
47
48
49
50
51
52
53
54
55
56
57
Vol. 61, No. 2, 2013 Thermal history of Lower Paleozoic rocks, East European Craton 113

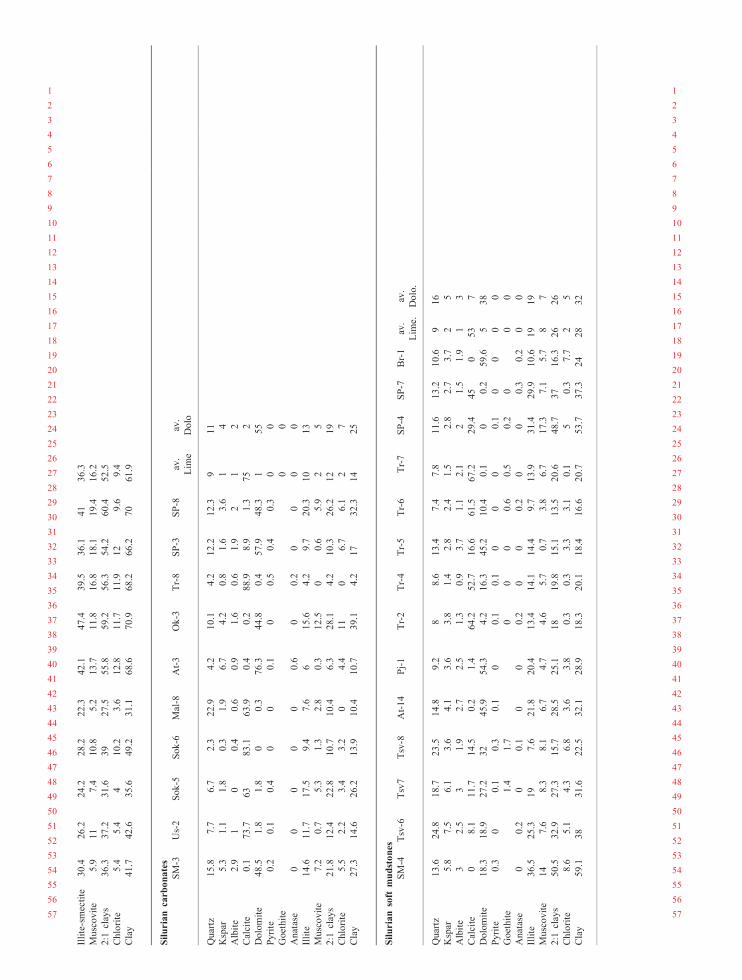
Table
2.Quantitativemineral
compositionoftherocksstudied.Dolomiteincludes
Ca-dolomiteif
present.H
inthegoethiterow
denoteshem
atite.
Silurianbentonites
Pu-1
SM-1
Us-1
Sok-1
Sok-2
Mal-1
Mal-2
Mal-3
Mal-4
Mal-5
Mal-6
Mal-7
At-4
At-9
At-11
At-12
At-12A
At-16
Ok.-2A
Ok.-2B
Tr-9
Av.
bentonite
Quartz
1.2
13.6
2.2
2.8
1.7
1.6
1.8
1.4
1.7
1.1
5.2
5.3
1.9
1.1
21.1
4.2
2.9
2.1
6.8
3
Kspar
10.5
4.9
4.9
7.3
8.9
3.9
21.6
2.3
3.2
3.7
5.7
6.1
00
0.2
04.5
14
10.6
4.7
5
Albite
00
00
00
00
00
00
3.6
00
00
2.4
00
00
Calcite
00
2.1
4.3
8.3
00
00
2.5
1.1
10.2
0.1
00
0.3
00
1.5
0.5
24.2
3
Dolomite
0.4
00
00
00
00
00.4
00
00
00
00
00
0
Pyrite
00.5
00
00
0.4
00.6
00
00
00
00
0.3
00
00
Goethite
1.8
00
00.7
0.1
00
00
00.1
0.2
00
00
00.7
0.6
0.6
0
Anatase
00.7
00
0.1
00
00
0.1
00
00
00
00
0.3
0.2
0.2
0
Illite-smectite
86.1
92.8
89.3
86.1
79.1
94.2
96
96.5
95.7
92.5
93.1
78.7
81.6
98
98.9
97.5
98.8
78.9
80.5
85.9
63.5
89
Muscovite
00
00
00
00
00
00
3.2
00
00
8.6
00
01
Chlorite
00
00
00
00
00
00
00
00
01.2
00
00
Biotite
trace
Silurianshales
Sok-4
Mal-10
At-1
Zab-1
Ok-1
Tr-1
SP-1
SP-9
Br-2
Lish-1
Quartz
19.2
17.6
8.9
10.5
12.3
11.7
12.1
10.6
11.5
22.8
Kspar
7.6
22.2
9.3
8.8
6.6
2.5
3.7
1.8
3.4
1.1
Albite
41.8
3.1
0.2
2.4
2.4
1.5
1.8
36.3
Calcite
3.4
2.3
0.1
0.3
00
00
0.1
3.9
Dolomite
3.1
1.3
36
12.8
5.6
30.3
33.6
34.3
34.2
1.2
Pyrite
0.2
0.5
0.1
0.7
0.1
0.4
00.1
0.4
1.6
Goethite
00.4
00
00
00
00
Anatase
0.2
0.3
00
00
00.4
00
Illite
48.4
39.8
30.9
45.4
58
35.3
30.1
35.7
33.1
34.4
Muscovite
6.3
9.6
614.3
11
710.1
9.4
6.3
14
2:1
clays
54.7
49.4
36.9
59.7
69
42.3
40.2
45.1
39.4
48.4
Chlorite
7.6
4.2
5.3
6.8
410.3
8.8
68
15
Clay
62.3
53.6
42.2
66.5
73
52.6
49
51.1
47.4
63.4
Devonianshales Dn-1
Dn-3
Kryv-3
Khud-3
Myk-1
Kolod-2
Chort-1
Hor-1
Dobr-1
Zalish-1
Zalish-3
Quartz
19.2
16.4
10.7
17.5
11.4
13.2
20.7
26.2
24.9
25.5
25.6
Kspar
3.6
3.8
0.5
0.9
00.1
1.5
00.1
0.9
0.9
Albite
5.2
3.7
2.2
3.5
1.8
0.5
4.2
4.6
6.4
2.5
5.9
Calcite
26.2
26.2
50.8
20.9
55.1
17
2.1
11.3
0.5
2
Dolomite
47
07.8
0.3
0.2
0.3
0.1
0.2
00
Pyrite
0.1
0.1
0.1
0.3
0.3
0.1
0.2
00.5
0.4
0
Goethite
00
00
00
00
00
3.6
(H)
Anatase
00.2
00
00.4
00
0.4
0.3
0
1
2
3
4
5
6
7
8
9
10
11
12
13
14
15
16
17
18
19
20
21
22
23
24
25
26
27
28
29
30
31
32
33
34
35
36
37
38
39
40
41
42
43
44
45
46
47
48
49
50
51
52
53
54
55
56
57
1
2
3
4
5
6
7
8
9
10
11
12
13
14
15
16
17
18
19
20
21
22
23
24
25
26
27
28
29
30
31
32
33
34
35
36
37
38
39
40
41
42
43
44
45
46
47
48
49
50
51
52
53
54
55
56
57
Illite-smectite
30.4
26.2
24.2
28.2
22.3
42.1
47.4
39.5
36.1
41
36.3
Muscovite
5.9
11
7.4
10.8
5.2
13.7
11.8
16.8
18.1
19.4
16.2
2:1
clays
36.3
37.2
31.6
39
27.5
55.8
59.2
56.3
54.2
60.4
52.5
Chlorite
5.4
5.4
410.2
3.6
12.8
11.7
11.9
12
9.6
9.4
Clay
41.7
42.6
35.6
49.2
31.1
68.6
70.9
68.2
66.2
70
61.9
Siluriancarbonates
SM-3
Us-2
Sok-5
Sok-6
Mal-8
At-3
Ok-3
Tr-8
SP-3
SP-8
av.
Lim
e
av.
Dolo
Quartz
15.8
7.7
6.7
2.3
22.9
4.2
10.1
4.2
12.2
12.3
911
Kspar
5.3
1.1
1.8
0.3
1.9
6.7
4.2
0.8
1.6
3.6
14
Albite
2.9
10
0.4
0.6
0.9
1.6
0.6
1.9
21
2
Calcite
0.1
73.7
63
83.1
63.9
0.4
0.2
88.9
8.9
1.3
75
2
Dolomite
48.5
1.8
1.8
00.3
76.3
44.8
0.4
57.9
48.3
155
Pyrite
0.2
0.1
0.4
00
0.1
00.5
0.4
0.3
00
Goethite
00
Anatase
00
00
00.6
00.2
00
00
Illite
14.6
11.7
17.5
9.4
7.6
615.6
4.2
9.7
20.3
10
13
Muscovite
7.2
0.7
5.3
1.3
2.8
0.3
12.5
00.6
5.9
25
2:1
clays
21.8
12.4
22.8
10.7
10.4
6.3
28.1
4.2
10.3
26.2
12
19
Chlorite
5.5
2.2
3.4
3.2
04.4
11
06.7
6.1
27
Clay
27.3
14.6
26.2
13.9
10.4
10.7
39.1
4.2
17
32.3
14
25
Siluriansoft
mudstones
SM-4
Tsv-6
Tsv7
Tsv-8
At-14
Pj-1
Tr-2
Tr-4
Tr-5
Tr-6
Tr-7
SP-4
SP-7
Br-1
av.
Lim
e.
av.
Dolo.
Quartz
13.6
24.8
18.7
23.5
14.8
9.2
88.6
13.4
7.4
7.8
11.6
13.2
10.6
916
Kspar
5.8
7.5
6.1
3.6
4.1
3.6
3.8
1.4
2.8
2.4
1.5
2.8
2.7
3.7
25
Albite
32.5
31.9
2.7
2.5
1.3
0.9
3.7
1.1
2.1
21.5
1.9
13
Calcite
08.1
11.7
14.5
0.2
1.4
64.2
52.7
16.6
61.5
67.2
29.4
45
053
7
Dolomite
18.3
18.9
27.2
32
45.9
54.3
4.2
16.3
45.2
10.4
0.1
00.2
59.6
538
Pyrite
0.3
00.1
0.3
0.1
00.1
0.1
00
00.1
00
00
Goethite
1.4
1.7
00
00.6
0.5
0.2
00
0
Anatase
00.2
00.1
00
0.2
00
0.2
00
0.3
0.2
00
Illite
36.5
25.3
19
7.6
21.8
20.4
13.4
14.1
14.4
9.7
13.9
31.4
29.9
10.6
19
19
Muscovite
14
7.6
8.3
8.1
6.7
4.7
4.6
5.7
0.7
3.8
6.7
17.3
7.1
5.7
87
2:1
clays
50.5
32.9
27.3
15.7
28.5
25.1
18
19.8
15.1
13.5
20.6
48.7
37
16.3
26
26
Chlorite
8.6
5.1
4.3
6.8
3.6
3.8
0.3
0.3
3.3
3.1
0.1
50.3
7.7
25
Clay
59.1
38
31.6
22.5
32.1
28.9
18.3
20.1
18.4
16.6
20.7
53.7
37.3
24
28
32
1
2
3
4
5
6
7
8
9
10
11
12
13
14
15
16
17
18
19
20
21
22
23
24
25
26
27
28
29
30
31
32
33
34
35
36
37
38
39
40
41
42
43
44
45
46
47
48
49
50
51
52
53
54
55
56
57
1
2
3
4
5
6
7
8
9
10
11
12
13
14
15
16
17
18
19
20
21
22
23
24
25
26
27
28
29
30
31
32
33
34
35
36
37
38
39
40
41
42
43
44
45
46
47
48
49
50
51
52
53
54
55
56
57

Table
3.XRD
dataforillite-smectite:
00lreflectionsfrom
air-dried
bulk
rock
andglycolated<0.2
mmfractionsofSilurian
bentonites:peakpositions(º2y)
andpercentsm
ectite
(%S)calculatedfrom
thesepeakpositionsusingexperim
entalregressionsderived
from
dataofSrodonet
al.(2009)orobtained
(%SDS)from
figure
5ofDudek
andSrodon(1996).
%Na 2O
refers
tothe<0.2
mmfraction.
Location
Sam
ple
no.
1AIR
%SAIR
1GLY
%S
3GLY
%S
5GLY
%SDS
6GLY
%S
7GLY
8GLY
8GLY-
7GLY
%S
Mean
%SGLY
%Na 2O
2y
2y
2y
2y
2y
2y
2y
2y
Pudlovtsy
Pu-1
8.08
17
8.1
917.58
726.82
634.92
10
8Slobidka
SM-1
8.18
14
7.9
12
17.5
10
26.8
834.85
11
10
Ustye
Us-1
819
7.7
16
17.3
16
26.8
13
34.5
18
44.95
46.1
1.15
14
15
0.15
Sokil
Sok-1
8.14
16
7.8
14
17.3
16
26.8
13
34.5
18
44.95
46.1
1.15
14
15
0.13
Sok-2
8.18
14
7.8
14
17.3
16
26.8
13
34.5
18
44.95
46.1
1.15
14
15
Malynivtsi
Mal-1
8.3
11
diffuse
17.73
126.89
234.77
13
5Mal-2
8.3
11
diffuse
17.73
126.95
234.77
13
50.11
Mal-3
8.52
517.85
-426.95
135.18
53
0.09
Mal-4
8.62
217.85
-426.97
11
0.13
Mal-5
8.74
017.85
-426.97
11
Mal-6
8.66
117.85
-426.97
11
0.07
Mal-7
8.3
11
7.93
12
17.61
626.89
534.77
13
9Ataky
At-4
8.06
18
7.8
14
17.42
12
26.78
10
34.68
15
13
At-9
8.2
14
7.96
11
17.58
726.84
634.9
10
90.13
At-11
8.16
15
7.9
12
17.42
12
26.78
10
34.68
15
12
0.09
At-12
8.14
16
7.9
12
17.42
12
26.78
10
34.68
15
12
At-12A
8.22
13
7.9
12
17.42
12
26.78
10
34.68
15
12
0.12
At-16
8.26
12
7.9
12
17.58
726.84
634.9
10
9Okopy
Ok-2A
8.26
12
8.02
10
17.48
10
26.82
934.84
11
10
Ok-2B
8.26
12
8.02
10
17.48
10
26.82
934.84
11
10
Trubchyn
Tr-9
8.36
98.08
917.76
026.82
24
0.13
Significance
ofbolding?
1
2
3
4
5
6
7
8
9
10
11
12
13
14
15
16
17
18
19
20
21
22
23
24
25
26
27
28
29
30
31
32
33
34
35
36
37
38
39
40
41
42
43
44
45
46
47
48
49
50
51
52
53
54
55
56
57
1
2
3
4
5
6
7
8
9
10
11
12
13
14
15
16
17
18
19
20
21
22
23
24
25
26
27
28
29
30
31
32
33
34
35
36
37
38
39
40
41
42
43
44
45
46
47
48
49
50
51
52
53
54
55
56
57
116 Srodon et al. Clays and Clay Minerals
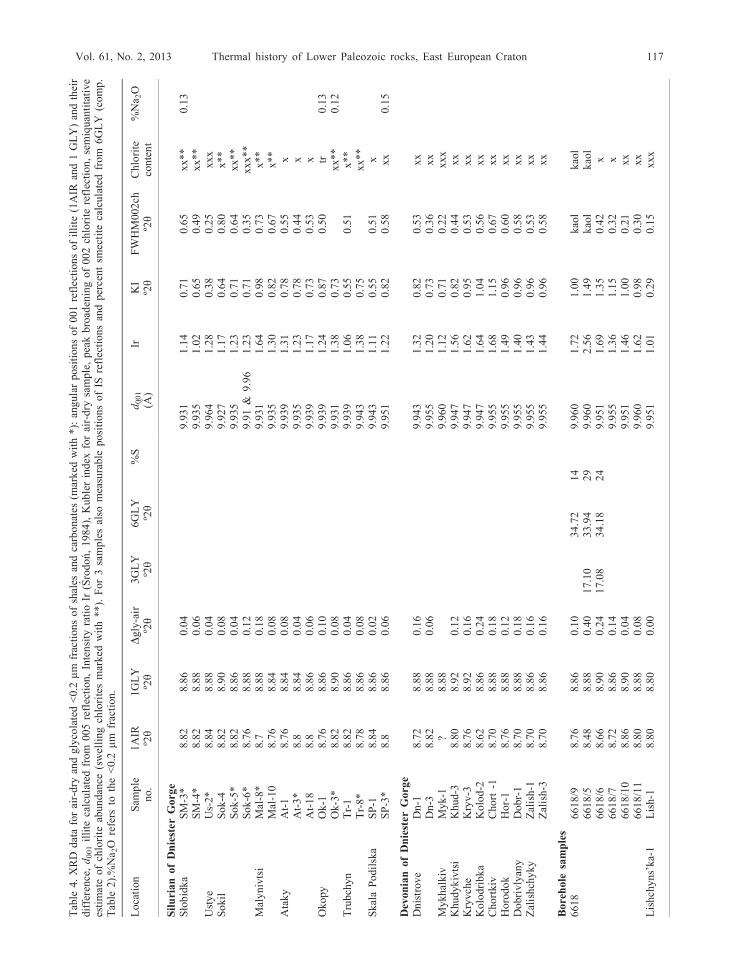
Table
4.XRD
dataforair-dry
andglycolated<0.2
mmfractionsofshales
andcarbonates(m
arked
with*):angularpositionsof001reflectionsofillite
(1AIR
and1GLY)andtheir
difference,d001illite
calculatedfrom
005reflection,Intensity
ratioIr
(Srodon,1984),Kublerindex
forair-dry
sample,peakbroadeningof002chlorite
reflection,semiquantitative
estimate
ofchlorite
abundance
(swellingchloritesmarkedwith**).For3samplesalso
measurable
positionsofIS
reflectionsandpercentsm
ectite
calculatedfrom
6GLY
(comp.
Table
2).%Na 2O
refers
tothe<0.2
mmfraction.
Location
Sam
ple
1AIR
1GLY
Dgly-air
3GLY
6GLY
%S
d001
IrKI
FWHM002ch
Chlorite
%Na 2O
no.
º2y
º2y
º2y
º2y
º2y
(A)
º2y
º2y
content
SilurianofDniesterGorge
Słobidka
SM-3*
8.82
8.86
0.04
9.931
1.14
0.71
0.65
xx**
0.13
SM-4*
8.82
8.88
0.06
9.935
1.02
0.65
0.49
xx**
Ustye
Us-2*
8.84
8.88
0.04
9.964
1.28
0.38
0.25
xxx
Sokil
Sok-4
8.82
8.90
0.08
9.927
1.17
0.64
0.80
x**
Sok-5*
8.82
8.86
0.04
9.935
1.23
0.71
0.64
xx**
Sok-6*
8.76
8.88
0.12
9.91&
9.96
1.23
0.71
0.35
xxx**
Malynivtsi
Mal-8*
8.7
8.88
0.18
9.931
1.64
0.98
0.73
x**
Mal-10
8.76
8.84
0.08
9.935
1.30
0.82
0.67
x**
Ataky
At-1
8.76
8.84
0.08
9.939
1.31
0.78
0.55
xAt-3*
8.8
8.84
0.04
9.935
1.23
0.78
0.44
xAt-18
8.8
8.86
0.06
9.939
1.17
0.73
0.53
xOkopy
Ok-1
8.76
8.86
0.10
9.939
1.24
0.87
0.50
tr0.13
Ok-3*
8.82
8.90
0.08
9.931
1.38
0.73
xx**
0.12
Trubchyn
Tr-1
8.82
8.86
0.04
9.939
1.06
0.55
0.51
x**
Tr-8*
8.78
8.86
0.08
9.943
1.38
0.75
xx**
SkalaPodilska
SP-1
8.84
8.86
0.02
9.943
1.11
0.55
0.51
xSP-3*
8.8
8.86
0.06
9.951
1.22
0.82
0.58
xx
0.15
DevonianofDniester
Gorge
Dnistrove
Dn-1
8.72
8.88
0.16
9.943
1.32
0.82
0.53
xx
Dn-3
8.82
8.88
0.06
9.955
1.20
0.73
0.36
xx
Mykhalkiv
Myk-1
?8.88
9.960
1.12
0.71
0.22
xxx
Khudykivtsi
Khud-3
8.80
8.92
0.12
9.947
1.56
0.82
0.44
xx
Kryvche
Kryv-3
8.76
8.92
0.16
9.947
1.62
0.95
0.53
xx
Kolodribka
Kolod-2
8.62
8.86
0.24
9.947
1.64
1.04
0.56
xx
Chortkiv
Chort
-18.70
8.88
0.18
9.955
1.68
1.15
0.67
xx
Horodok
Hor-1
8.76
8.88
0.12
9.955
1.49
0.96
0.60
xx
Dobrivlyany
Dobr-1
8.70
8.88
0.18
9.955
1.40
0.96
0.58
xx
Zalishchyky
Zalish-1
8.70
8.86
0.16
9.955
1.43
0.96
0.53
xx
Zalish-3
8.70
8.86
0.16
9.955
1.44
0.96
0.58
xx
Borehole
samples
6618
6618/9
8.76
8.86
0.10
34.72
14
9.960
1.72
1.00
kaol
kaol
6618/5
8.48
8.88
0.40
17.10
33.94
29
9.960
2.56
1.49
kaol
kaol
6618/6
8.66
8.90
0.24
17.08
34.18
24
9.951
1.69
1.35
0.42
x6618/7
8.72
8.86
0.14
9.955
1.36
1.15
0.32
x6618/10
8.86
8.90
0.04
9.951
1.46
1.00
0.21
xx
6618/11
8.80
8.88
0.08
9.960
1.62
0.98
0.30
xx
Lishchyns’ka-1
Lish-1
8.80
8.80
0.00
9.951
1.01
0.29
0.15
xxx
Vol. 61, No. 2, 2013 Thermal history of Lower Paleozoic rocks, East European Craton 117

illite-smectite from all thin bentonite beds is of the 1Md
type, without clear differences in terms of %S. A
significant displacement of the 112 peak toward lower
angles with respect to the tv peak position, a greater
relative intensity of 113, and the appearance of a 111
peak (At-4 in Figure 4) indicate ~50% of the cv
component (cis-vacant octahedral sheet: Moore and
Reynolds, 1997; figure 10.18). The 34�38º2y region
indicates clear domination of n·120º rotations (Moore
and Reynolds, 1997; figure 10.14). The d006 value (2yvalue normalized to a ZnO internal standard) evolves
systematically from 1.499 A for most random samples to
1.501 A for the most ordered structures.
Mineral composition of the <0.2 mm fraction of other
rocks
Silurian of the Dniester gorge. Twenty two samples of
the Silurian shales, carbonates, and soft mudstones
collected close to the bentonite beds were investigated
for their clay mineral composition. All <0.2 mm fractions
contain dominant illite and variable amounts of chlorite.
In a few carbonate and soft mudstone samples a
smectitic component was also detected.
The XRD characteristics of illite in all samples
except two (Us-2 and Sok-6) are very similar. Only a
trace amount (<<5%) of swelling layers can be detected
by comparing air-dry and glycolated patterns normalized
to the MoS2 internal standard (Table 4, Tr-8 in
Figure 5). The position of the 001 peak of the air-dry
illite moves by Dgly-air = 0.02�0.18º2y toward higher
angles after glycolation and its intensity decreases
slightly. The 002 and 005 peaks change very slightly
and the 003 increases in intensity and moves slightly
toward lower angles. The Ir index based on these
changes (Srodon, 1984) varies from 1.64 to 1.06,
which are values characteristic of almost non-expand-
able illites. The Kubler index (KI; Kubler, 1964),
measured for <0.2 mm air-dry Na-samples, ranges from
0.98 to 0.55º2y. The d001 value of these illites can be
evaluated from the 005 reflection as 9.91�9.95 A, i.e.
much lower than the standard K-illite value of 9.98 A
(Lindgeeen et al., 2000), but higher than the measured
bentonite value of 9.888 A, thus indicating an inter-
mediate illite-aluminoceladonite composition (Drits et
al., 2010).
Sample Us-2 contains illite, which is perfectly non-
expandable (no shift in peak positions after glycolation),
has thicker crystals (KI = 0.38), and d001 = 9.964 A
(Table 4, Figure 5). Sample Sok-6 is clearly hetero-
geneous, with both illitic (9.96 A) and aluminocelado-
nitic (9.91 A) components (Table 4, Figure 5).
The d006 values of illites in non-bentonitic samples
are ~1.502 A (Figure 4). Random XRD patterns of all
samples in the 20�38º2y range are very similar to
sample Ok-1 (Figure 4) and are indicative of the mixture
of dominant 1Md with minor 2M1 polytype, with more
n·60º rotations than the bentonitic samples (single peak
at 35 and increased intensity at 37.2º2y: Moore and
Reynolds, 1997; figure 10.14). The sample Us-2 contains
Figure 5. Oriented XRD patterns of air-dry (gray) and glycolated (black) <0.2 mm fractions of the Silurian non-bentonitic rocks,
representing the range of illite and chlorite crystal size and swelling encountered. KI � Kubler index.
1
2
3
4
5
6
7
8
9
10
11
12
13
14
15
16
17
18
19
20
21
22
23
24
25
26
27
28
29
30
31
32
33
34
35
36
37
38
39
40
41
42
43
44
45
46
47
48
49
50
51
52
53
54
55
56
57
1
2
3
4
5
6
7
8
9
10
11
12
13
14
15
16
17
18
19
20
21
22
23
24
25
26
27
28
29
30
31
32
33
34
35
36
37
38
39
40
41
42
43
44
45
46
47
48
49
50
51
52
53
54
55
56
57
118 Srodon et al. Clays and Clay Minerals

more 2M1 in the <0.2 mm fraction than other samples and
does not contain an increased number of n·60º rotations.
Chlorites are found in quite variable amounts (Table 4,
Figure 5). In some samples chlorites are perfectly non-
expandable: their d001 value is close to 14.1�14.3 A and
does not shift after glycolation. The intensity of the 001
and 002 reflections are very close, indicating Mg-chlorite
(Moore and Reynolds, 1997). Chlorite from sample Us-2
is exceptional: more Fe-rich (002 stronger than 001) and
coarser (narrower reflections: Figure 5). Broadening of
the 002 chlorite reflection, measured in air-dry state
(FWHM002ch in Table 4), is substantially smaller than
that of 001 illite (KI).
Most samples contain chlorite, which is slightly
expandable. Expandability is shown by a variable shift
of 001 (to 15.1 A in the extreme case: Table 4), by a
similar shift of 002, and by the shift of 004 in the
opposite direction (Sok-6 in Figure 5), which are
consistent (Mering rule) with interlayering of a minor
~17 A (smectitic) swelling component.
The d006 values of most chlorites vary in the
1.535�1.530 A range (Mg-chlorites), except for sample
Us-2 (1.542 A), which is consistent with more Fe
(Wiewiora and Wilamowski, 1996).
In four samples a phase with a dominant smectitic
swelling component occurs along with a separate
chloritic phase, both contributing to the 14 A reflection
in the air-dry state (Tr-8 in Figure 5). The presence of
both minerals becomes clearly visible after glycolation.
The smectitic phase is identified by its broad ~17.4 A
peak (Tr-2 and 8, Ok-3) or a diffuse band >14 A (SP-4)
and raised intensity after glycolation in the 9.5�11,15�17, and 25.5�26.5º2y range. The heterogeneous
nature of these minerals is supported by their poorly
defined peaks. For sample Tr-2 with the best-defined
peaks, the 15�17º2y band starts clearly from 5.67 A,
which is less than the 003 peak from 17.4 A, indicating
that even in this sample some degree of mixed-layering
is present. Mixed-layering of the expandable layers with
chlorite layers was also shown by a 300ºC heating test.
The low-angle peaks disappeared, but the intensity
increased (a raised ‘saddle’) between the chlorite and
illite 001 reflections.
Sample Tr-2 looks to be entirely dioctahedral, based
on the d006 region. In the other samples, weak tri-
octahedral reflections between 1.534 and 1.525 A are
visible.
Lower Devonian shales of the Dniester gorge. The XRD
characteristics of Lower Devonian shales are very
similar to the Silurian shales with non-expandable
chlorite. Illite is also almost non-expandable (<<5%S),
but all characteristics indicate slightly more expand-
ability than in the Silurian shales: Dgly-air from 0.06 to
0.24, Ir from 1.12 to 1.68, and KI from 0.71 to 1.15
(Table 4). The d001 value of these minerals ranges from
9.94 to 9.95 A, indicating a pure illitic composition. The
chlorites are non-expandable and Mg-rich. Sample
Myk-1 is exceptional, with more chlorite, which is
more coarse-grained and Fe-rich.
Borehole samples. The XRD characteristics of samples
from borehole 6618 indicate greater illite expandability
than the Lower Devonian shales of the Dniester gorge:
Dgly-air from 0.04 to 0.40, Ir from 1.36 to 2.56, and KI
from 0.98 to 1.49 (Table 4). For the three uppermost
samples, the diagnostic IS reflections were measurable,
allowing the estimation of %S from 14 to 29 (Table 4).
In two uppermost samples, kaolinite was identified. In
the remaining samples non-expandable chlorite is
present.
The single sample from borehole Lishchyns’ka-1
contains end-member non-expandable illite (Dgly-air =
0, Ir = 1.01, d001 = 9.95 A) with KI = 0.29 (Table 4) and
very abundant, extremely coarse-grained Fe-chlorite
(Figure 5).
K-Ar dating of illite
Twelve Silurian bentonite samples were dated: six as
0.2�0.05, 0.05�0.02, and <0.02 mm sub-fractions, and
six as <0.2 fractions (Table 5). The dates from the
subfractions range from 340 to 390 Ma and the dates of
the <0.2 mm fractions also fall within this range. The
oldest date was recorded for the finest fraction (Mal-5),
thus the whole range can be considered as representing
pure diagenetic ages (Srodon et al., 2002). No systematic
geographic variation of ages can be observed.
K-Ar dating was also performed for clay fractions of
six Silurian samples representing other lithologies:
limestones, a calcite concretion, and soft mudstones.
The <0.2 and 2�0.2 mm fractions were used for dating
(Table 5). All the dates are close to the bentonite ages
with most close to the highest value but three even lower
than the youngest bentonite age (312, 325 and 334 Ma).
The samples with the most coarse-grained illite (sharpest
XRD peaks: Us-2 and Sok-6) gave the oldest dates (378
and 397 Ma), but even those are much younger than the
stratigraphic age (417�423 Ma).
AFT dating
Five Silurian bentonite samples were examined by
AFT. The AFT data are listed (Table 6) and presented as
radial plots (Galbraith, 1990) (Figure 6). All analyzed
samples yielded Upper Cretaceous pooled ages
(63�107 Ma), significantly younger than the estimated
stratigraphic age (417�423 Ma). The dispersion of ages
between individual apatite crystals is large, as indicated
by small P(w2) values (Table 6). The measured ranges
(Figure 6) are quite similar (~210�40 Ma) for all
samples except for SM-1 (350�50 Ma). These measured
ages are younger than the stratigraphic age and younger
than the K-Ar ages of the maximum temperatures.
All of the samples examined provided small numbers
of confined (author: explain ‘‘confined’’ in this context)
1
2
3
4
5
6
7
8
9
10
11
12
13
14
15
16
17
18
19
20
21
22
23
24
25
26
27
28
29
30
31
32
33
34
35
36
37
38
39
40
41
42
43
44
45
46
47
48
49
50
51
52
53
54
55
56
57
1
2
3
4
5
6
7
8
9
10
11
12
13
14
15
16
17
18
19
20
21
22
23
24
25
26
27
28
29
30
31
32
33
34
35
36
37
38
39
40
41
42
43
44
45
46
47
48
49
50
51
52
53
54
55
56
57
Vol. 61, No. 2, 2013 Thermal history of Lower Paleozoic rocks, East European Craton 119

tracks (Table 6, Figure 7). The mean length of confined
tracks per sample ranges from 9.50 to 13.48 mm. The
track-length distributions are either symmetric (Mal-1
and Zab-1) or skewed toward small track length (Sok-1
and SM-1). The Pu-1 distribution is not reliable because
too small a number of tracks was available for the
measurement.
SEM observations and EDS analyses
In all six bentonite samples (Mal�2, 4, 6, Ok-2B,
Sok-1, Us-1), the separated coarse fraction is dominated
by adularia, with minor amounts of pyroclastic quartz,
biotite, apatite, and zircon. The adularia crystals are
isometric and range from 50 to 100 mm in diameter.
Growth features are common (Figure 8), but in the
Malynivtsi samples are less abundant, which gives these
crystals a more regular appearance.
Numerous EDS analyses performed for samples SP-3
and Tr-5 revealed that the carbonate mineral identified
by XRD is Ca-dolomite and not ankerite. The texture of
soft mudstone was observed in three samples (At-14,
SP-4, and Tr-5). The samples are very porous due to
partial dissolution of carbonate rhombohedra (Figure 8).
Table 5. K-Ar dates of fine fractions of bentonites and other Silurian rocks.
Sample no. Fraction(mm)
Weight(mg)
% K2O % 40Ar* 40Ar*(pmol/g)
Age(Ma)
Error (Ma)
Silurian bentonitesPu-1 0.2–0.05 39.75 7.35 89.41 4087.7 350 2Pu-1 0.05–0.02 71.35 7.18 86.08 3881.8 341 2Pu-1 <0.02 38.60 7.13 88.31 4012.6 354 2
SM-1 <0.2 24.38 6.73SM-1 0.2–0.05 62.50 6.87 92.26 4125.6 375 2SM-1 0.05–0.02 29.75 6.71 93.05 4113.5 382 2SM-1 <0.02 22.15 6.62 83.55 3581.9 341 2
Us-1 <0.2 20.1 6.53 85.16 3560.5 344 2Sok-1 <0.2 19.15 6.44 79.17 3558.4 348 2Sok-1 <0.2 20.9 6.44 78.53 3555.3 348 2
Mal-5 <0.2 30.01 7.56Mal-5 0.2–0.05 57.40 7.83 91.90 4273.5 344 2Mal-5 0.05–0.02 14.85 7.52 87.04 4547.9 378 2Mal-5 <0.02 47.40 7.31 90.97 4581.0 390 2
Mal-7 0.2–0.05 37.25 7.17 89.50 4098.5 359 2Mal-7 0.05–0.02 19.60 6.29 80.88 3383.2 340 2Mal-7 <0.02 31.45 6.94 90.91 3738.4 340 2
At-12 0.2–0.05 32.60 7.20 89.76 3936.3 345 2At-12 0.05–0.02 21.8 6.88 90.11 3902.6 356 2At-12 <0.02 34.1 6.89 87.62 3711.8 340 2At-4 <0.2 24.95 6.42 86.03 3506.6 344 2
Ok-2A 0.2–0.05 36.25 6.91 89.69 3704.6 339 2Ok-2A 0.05–0.02 22.70 6.89 91.19 4017.3 339 2Ok-2A <0.02 32.20 6.85 92.18 3721.2 339 2
Tr-9 <0.2 29.75 7.08 91.48 3795.6 339 2
Other Silurian rocksUs-2 2–0.2 42.65 5.5 89.93 3327.5 378 2Sok-6 <0.2 24.4 5.6 78.44 3415.8 381 2Sok-6 2–0.2 36.35 6.17 90.68 3942.9 397 2Mal-8 <0.2 9.04 5.87 80.39 3013.6 325 4Mal-8 2–0.2 27 3.37 67.95 1651.6 312 3Mal-10 <0.2 31.45 6.90 90.09 3388.9 313 2Tr-2 <0.2 15.65 6.14 78.38 3243.5 334 3SP-4 <0.2 13.35 6.13 80.92 3697.8 377 3
StandardGLO bulk 100.70 7.90 26.60 1104.8 95 1GLO bulk 127.35 7.90 79.15 1132.1 97 1GLO bulk 60.05 7.90 87.59 1128.3 97 1
1
2
3
4
5
6
7
8
9
10
11
12
13
14
15
16
17
18
19
20
21
22
23
24
25
26
27
28
29
30
31
32
33
34
35
36
37
38
39
40
41
42
43
44
45
46
47
48
49
50
51
52
53
54
55
56
57
1
2
3
4
5
6
7
8
9
10
11
12
13
14
15
16
17
18
19
20
21
22
23
24
25
26
27
28
29
30
31
32
33
34
35
36
37
38
39
40
41
42
43
44
45
46
47
48
49
50
51
52
53
54
55
56
57
120 Srodon et al. Clays and Clay Minerals

INTERPRETATION
Weathering overprint
Most of the samples studied come from natural
outcrops, thus some weathering features can be
expected. The dissolution of carbonate rhombohedra
detected by SEM, the presence of goethite and jarosite,
the swelling of some chlorites, and the mixed-layer
smectite-chlorite (Figure 5) are interpreted as products
of contemporary weathering. The association of smec-
tite-chlorite with chlorite, and the presence of swelling
chlorite in numerous samples indicate that the smectite-
chlorite is a chlorite weathering product. Based on the
d006 value, these minerals seem to have evolved toward a
dioctahedral composition.
Such interpretation is supported by peak broadening
of the 002 chlorite reflection (Figure 9) plotted vs. KI,
which is widely regarded as a key indicator of the degree
of deep diagenesis and anchimetamorphism. For a given
KI, the chlorites from boreholes have the narrowest
peaks. Next are the Devonian chlorites from outcrops
and the broadest are the Silurian chlorites from outcrops.
This sequence probably reflects the length of exposure to
weathering: none in the boreholes, and much shorter on
the Devonian shale slopes of Dniester than on the
Silurian carbonate vertical walls, which are expected to
be much more resistant to erosion (Figure 10). The
distribution of goethite (Table 2: common in the Silurian
most porous rocks, of mineral composition intermediate
between carbonates and shales, and as such the most
prone to weathering) supports this interpretation. Thus,
chlorite from outcrops should be excluded as an
indicator of the diagenetic grade, being non-resistant to
weathering.
The swelling minerals detected by Huff et al. (2000,
figure 6) in the outcrops of the same Silurian section are
also probably chlorite weathering products. On the other
hand, the core samples from the same stratigraphic
interval, farther NW on the Peri-Tornquist margin
(Baltic basin), and representing similar diagenetic
grade, contain only non-expandable chlorite (Srodon
and Clauer, 2001), like the borehole chlorites from this
study.
Provenance
The K-Ar dates of clay fractions from the Silurian
rocks other than bentonites are predominantly within the
values measured for bentonites (Table 5). This is not a
common situation: most often the detrital component of
epiclastic rocks results in dates significantly older than
the dates obtained from the clay fractions of pyroclastics
(e.g. Clauer et al., 1997). Such young ages imply a
combination of two factors: the detrital material on the
Silurian carbonate platform was predominantly pyro-
clastic, while the epiclastic component was minor and
young (Caledonian). Very similar results were obtained
for the Baltic basin segment of the Peri-TornquistTable
6.AFTresultsforPodoliaSilurian
bentonitesamples.No.crystalsis
thenumber
ofapatitecrystalsanalyzedfortracks.randN
aredensities
oftracks(6
106tracks/cm�2)
andnumbersofcountedtracks,
respectively,measuredfordosimeter,apatite(spontaneous),andexternal
detector(m
uscovite:induced).P(w
2)[%
]�
homogeneity
oftheapatite
populationexpressed
byw2
test
(Galbraith,1981;Green,1981).Central
ageandU
contentcalculatedusingtheprogram
Trackkey
4.2
(Dunkl,2002).Number
ofmeasuredconfined
tracksin
asample,andtheiraveragelength
arereported
also.
Sam
ple
no.
No.crystals
Dosimeter
Spontaneous
Induced
P(w
2)
Age
Agedistribution
UNo.conf.
Length
rdNd
rsNs
riNi
(%)
(Ma)
�1s
(Ma)
(ppm)
tracks
(mm)
Pu-1
13
1.15
5738
1.5618
198
2.9975
380
1.23
102.1�13.8
210�40
31.85
15
9.50�0.87
SM-1
26
1.141
5738
0.1843
120
0.3501
228
31.78
107.5�15.5
350�50
3.77
40
11.87�0.40
Sok-1
16
1.11
5738
0.6118
161
1.1096
292
40.43
105.0�13.5
210�65
12.45
22
12.52�0.28
Mal-1
to2
20
1.098
5611
0.8401
380
1.5784
714
0.54
99.7�11.4
220�50
17.39
29
13.48�0.30
Zab-1
11
1.155
5738
0.221
45
0.7023
143
49.95
63.1�11.2
200�30
7.41
47
12.08�0.30
1
2
3
4
5
6
7
8
9
10
11
12
13
14
15
16
17
18
19
20
21
22
23
24
25
26
27
28
29
30
31
32
33
34
35
36
37
38
39
40
41
42
43
44
45
46
47
48
49
50
51
52
53
54
55
56
57
1
2
3
4
5
6
7
8
9
10
11
12
13
14
15
16
17
18
19
20
21
22
23
24
25
26
27
28
29
30
31
32
33
34
35
36
37
38
39
40
41
42
43
44
45
46
47
48
49
50
51
52
53
54
55
56
57
Vol. 61, No. 2, 2013 Thermal history of Lower Paleozoic rocks, East European Craton 121

Figure 6. The distributions of AFT ages of individual apatite crystals and central ages of samples (weighted means) presented on the
radial plots of Galbraith (1990). The age of each crystal may be determined by extrapolating a line from 0 on the vertical scale of
standard deviation (s) for the sample through the crystal position on the plot (small rectangle) to the radial age scale. Central ages of
samples are defined by the dashed lines. The horizontal scale presents the relative error of age estimation for individual crystals,
related to the number of measured tracks.
1
2
3
4
5
6
7
8
9
10
11
12
13
14
15
16
17
18
19
20
21
22
23
24
25
26
27
28
29
30
31
32
33
34
35
36
37
38
39
40
41
42
43
44
45
46
47
48
49
50
51
52
53
54
55
56
57
1
2
3
4
5
6
7
8
9
10
11
12
13
14
15
16
17
18
19
20
21
22
23
24
25
26
27
28
29
30
31
32
33
34
35
36
37
38
39
40
41
42
43
44
45
46
47
48
49
50
51
52
53
54
55
56
57
122 Srodon et al. Clays and Clay Minerals

Figure 7. Track-length distributions and models of thermal history obtained using AFTSolve (Ketcham et al., 2000). In order to
explain the observed AFT length distributions, a post-Albian thermal episode has to be assumed.
1
2
3
4
5
6
7
8
9
10
11
12
13
14
15
16
17
18
19
20
21
22
23
24
25
26
27
28
29
30
31
32
33
34
35
36
37
38
39
40
41
42
43
44
45
46
47
48
49
50
51
52
53
54
55
56
57
1
2
3
4
5
6
7
8
9
10
11
12
13
14
15
16
17
18
19
20
21
22
23
24
25
26
27
28
29
30
31
32
33
34
35
36
37
38
39
40
41
42
43
44
45
46
47
48
49
50
51
52
53
54
55
56
57
Vol. 61, No. 2, 2013 Thermal history of Lower Paleozoic rocks, East European Craton 123
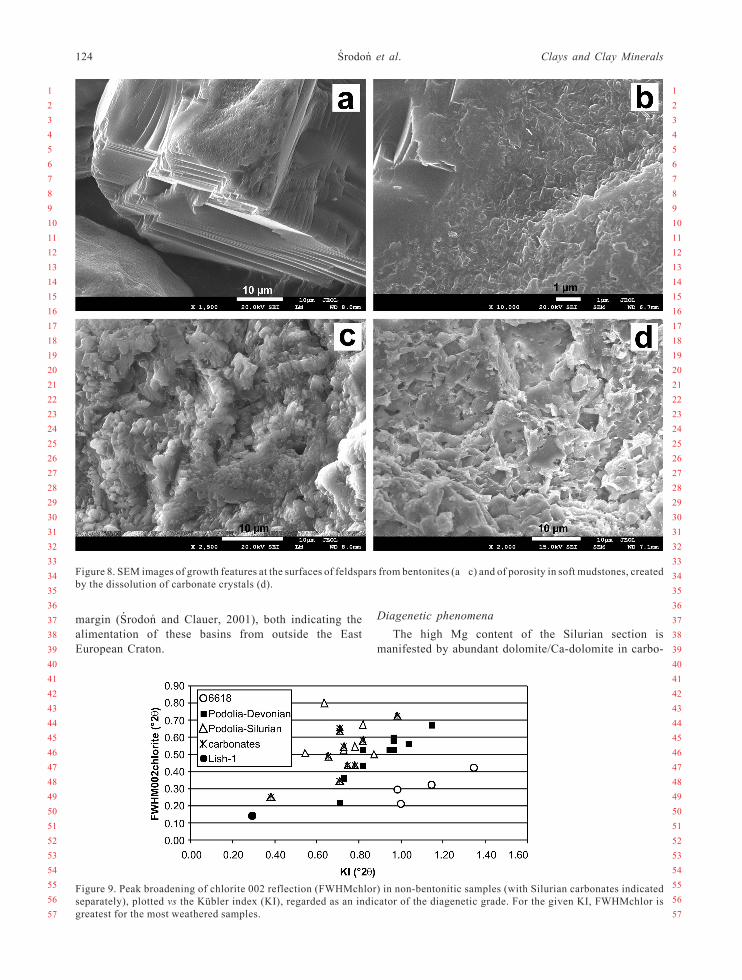
margin (Srodon and Clauer, 2001), both indicating the
alimentation of these basins from outside the East
European Craton.
Diagenetic phenomena
The high Mg content of the Silurian section is
manifested by abundant dolomite/Ca-dolomite in carbo-
Figure 8. SEM images of growth features at the surfaces of feldspars from bentonites (a�c) and of porosity in soft mudstones, created
by the dissolution of carbonate crystals (d).
Figure 9. Peak broadening of chlorite 002 reflection (FWHMchlor) in non-bentonitic samples (with Silurian carbonates indicated
separately), plotted vs the Kubler index (KI), regarded as an indicator of the diagenetic grade. For the given KI, FWHMchlor is
greatest for the most weathered samples.
1
2
3
4
5
6
7
8
9
10
11
12
13
14
15
16
17
18
19
20
21
22
23
24
25
26
27
28
29
30
31
32
33
34
35
36
37
38
39
40
41
42
43
44
45
46
47
48
49
50
51
52
53
54
55
56
57
1
2
3
4
5
6
7
8
9
10
11
12
13
14
15
16
17
18
19
20
21
22
23
24
25
26
27
28
29
30
31
32
33
34
35
36
37
38
39
40
41
42
43
44
45
46
47
48
49
50
51
52
53
54
55
56
57
124 Srodon et al. Clays and Clay Minerals

nates, soft mudstones, and shales; by the Mg-rich
composition of the 10 A mineral (intermediate illite-
aluminoceladonite composition) in these rocks; and by a
positive correlation of dolomite and Mg-chlorite in
carbonates, shales, and soft mudstones (Table 2). In
bentonites, both dolomite and chlorite are absent but the
illite-smectite is Mg rich and evolves toward pure
aluminoceladonite. In the Devonian shales, calcite is
abundant, dolomite scarce, and the 10 A mineral has
strictly illitic composition. The bulk-rock composition
control over the diagenetic products is, thus, clearly
evident.
Diagenetic zonation observed in a thick bentonite bed
(Malynivtsi) is the opposite of earlier reports of a lower
degree of illitization in the center of bentonite beds
(Srodon, 1976; Altaner et al., 1984). It resembles the
zonation in a sandstone bed (Whitney and Northop,
1987), interpreted as a result of fluid flow through the
bed; an explanation difficult to accept for an imperme-
able bentonite bed, unless it became a shear zone as the
least competent layer in this carbonate section, and this
zone became a conduit for migrating hot fluids.
Maximum burial temperatures
The %S in illite-smectite of the studied Silurian
section preserves the pattern typical of sedimentary
basins with the %S in bentonite beds greater than in
shales (cf. e.g. Sucha et al., 1993). Only the most
illitized samples of the thick bentonite bed (Malynivtsi)
reach the level of illitization typical of shales and other
non-bentonitic rocks from this section. Based on the
shale values of %S <<5 the maximum paleotemperatures
can be evaluated as 200ºC or even slightly higher
(Srodon, 2007). K-Ar dates and aluminoceladonitic
composition, restricted to the dolomite-dominated (cf.
Table 2) Silurian sequence, clearly prove that the shale
illitic material is predominantly diagenetic and not
detrital, and thus suitable for the paleotemperature
estimation.
To verify whether the illite-smectite paleotempera-
ture curve, calibrated for regular illite from shale
sequences (Srodon, 2007), can also be applied to
aluminoceladonite from carbonate sequences, the over-
lying Lower Devonian shale sequence was studied. The
data form trends consistent with the stratigraphic
position (more advanced diagenesis of the Silurian
rocks: Figure 11a,b), which are bracketed by the
Lish-1 anchimetamorphic sample (>250ºC, based on KI
= 0.29) and the 24%S sample from borehole 6618,
corresponding to 125ºC (Srodon, 2007). Deep burial of
both Silurian and Lower Devonian sections of the
Dniester gorge to the maximum temperatures of
Figure 10. Photos illustrating more stable Silurian carbonate slopes (a: near Ustya) and the Devonian shale slopes (b: near
Kolodribka) of the Dniester gorge.
Figure 11. Diagenetic trends in the non-bentonitic samples studied, illustrated by plots of Ir index (Srodon, 1984) and Kubler index
(KI) vs. difference in XRD 001 peak positions between glycolated and air-dried samples (Dgly-air).
1
2
3
4
5
6
7
8
9
10
11
12
13
14
15
16
17
18
19
20
21
22
23
24
25
26
27
28
29
30
31
32
33
34
35
36
37
38
39
40
41
42
43
44
45
46
47
48
49
50
51
52
53
54
55
56
57
1
2
3
4
5
6
7
8
9
10
11
12
13
14
15
16
17
18
19
20
21
22
23
24
25
26
27
28
29
30
31
32
33
34
35
36
37
38
39
40
41
42
43
44
45
46
47
48
49
50
51
52
53
54
55
56
57
Vol. 61, No. 2, 2013 Thermal history of Lower Paleozoic rocks, East European Craton 125

~200ºC has been confirmed by these data.
The alternative data for the maximum paleotempera-
ture estimation, available from the study area (cf.
Sachsenhofer and Koltun, 2012), are the CAI measure-
ments of Drygant (1993, and ten additional unpublished
measurements from this study area, which modify
slightly the original map: Figure 2a). The Dniester
section studied gave CAI = 2�3, which, according to
Drygant (1993), indicates paleotemperatures up to
200ºC. Nehring-Lefeld et al. (1997), who compiled
CAI data for the entire Peri-Tornquist margin, inter-
preted the CAI = 2�3 zone as corresponding to the
maximum paleotemperatures of 110�140ºC. Accordingto the authors of the CAI method (Epstein et al., 1977),
the color of conodonts depends heavily on the heating
time, thus the length of the heating period has to be
assumed. The K-Ar data indicate 10s of Ma, putting the
maximum CAI = 3 paleotemperature well below 150ºC.
An analogous discrepancy between %S and CAI
estimates of the maximum paleotemperatures has been
observed for the Baltic basin (compare figure 4 of
Srodon et al., 2009a and figure 7 of Bergstrom, 1980).
In Pomerania (Baltic basin), where both CAI and
vitrinite reflectance (Ro) data are available (Nehring-
Lefeld et al., 1997), the CAI = 2�3 zone corresponds to
Ro = 1�2, which indicates 140�200ºC maximum
paleotemperatures according to Suggate (1998) and
150�250ºC according to Barker and Pawlewicz (1986).
In the hot Miocene East Slovak Basin, used for the %S-
based paleothermometry (Srodon, 2007), ~5%S and Ro=
2 have been measured in shales currently at 200ºC, at a
depth of 4 km (Francu et al., 1990).
The AFT ages, which are completely reset (Table 6),
suggest that the maximum post-depositional paleo-
temperatures were >100�20ºC (Naeser, 1981), which is
consistent with both the clay and organic-based estimates.
Clay data tend to indicate that the maximum
paleotemperatures were slightly higher than the CAI-
based values, but the general regional pattern of
paleotemperatures recorded by CAI (Figure 2a) is
confirmed by the clay data. The Lish-1 anchimeta-
morphic illite comes from CAI zone 4�5, the samples in
the Dniester gorge section with <<5%S in IS correspond
to CAI = 2�3, and the samples from the top of 6618
borehole, with 24�29%S in IS, correspond to CAI = 1.5.
A Vendian Al-glauconite from Kytayhorod in the
Dniester gorge (15 km E and <200 m below the Silurian
in the section) was dated at 360�404 Ma (Gorokhov et
al., 1997). Those authors interpreted these dates,
following Morton and Long (1984), as indicative of
resetting due to oxidation during uplift and contact with
meteoric waters. These dates are coincident with the
illite-smectite diagenetic ages reported here, which
probably indicate total or almost total reset of the
stratigraphic ages during the deep burial event, suggest-
ing burial conditions close to 250ºC (reset temperature
for illite: Hunzicker et al., 1986) for the Cambrian-
Vendian part of the profile in the Dniester gorge.
Burial and thermal history
Bentonite K-Ar data constrain the age of maximum
paleotemperatures at 390�340 Ma (Middle Devonian-
Lower Carboniferous). The K-Ar data of clay fractions
from shale and limestone from the vicinity of a thick
bentonite bed (Malynivtsi) extend the lower limit to
310 Ma (Upper Carboniferous). Together they represent
the range of ages very close to those measured for
bentonites from Pomerania, i.e. another segment of the
Peri-Tornquist margin (294�382 Ma: Srodon et al.,
2009a).
In Pomerania these K-Ar ages are interpreted as
representing the maximum burial followed by a long-
lasting uplift, based on the regional geology and
confirmed by basin modeling (Poprawa et al., 2010).
The data collected for the Lower Devonian shales from
the Dniester gorge verify a deep burial of the section,
leading to an analogous conclusion of a long-lasting
uplift of the Podolia area, which is corroborated by the
available geological data. During the Permian and
Mesozoic the entire study area, along with the rest of
the Dniester slope, were parts of a much larger landmass,
undergoing uplift and erosion. During the late Albian/
early Cenomanian (~100 Ma ago) a few tens of meters of
shallow marine sediments were deposited in Podolia,
and are preserved in the area, though partially eroded
(Swidrowska et al., 2008). These data imply that the
Silurian rocks under study were uplifted from a depth
corresponding to 200ºC (5�10 km assuming a feasible
range of geothermal gradients from 40 to 20ºC/km) to
the surface between 300 and 100 Ma ago. These
estimates give the mean rates of uplift of the Dniester
gorge area in this period from 25 to 50 m/Ma.
Deep burial conditions during the Carboniferous and
Permian are consistent with the paleomagnetic measure-
ments from the Silurian of Podolia, performed on fine-
grained diagenetic magnetite, which indicate pervasive
remagnetization of this age (Jelenska et al., 2005). On
the other hand, the existing geological evidence does not
provide an explicit identification of the missing
5�10 km column of the eroded overburden. According
to the paleogeographic maps compiled by Nikishin et al.
(1996) the study area experienced only some coastal
zone sedimentation (alluvial-deltaic and shallow-marine
sands and shales) during the Early Devonian but became
land (no deposition) starting from the Middle Devonian.
This reconstruction would be consistent with the K-Ar
evidence only if 5�10 km of the Early Devonian cover
were originally deposited in this area. The preserved
sedimentary record makes such an assumption unlikely.
It consists of 530 m of Lochkovian marine shales,
siltstones, and limestones (Tyver Superhorizon) and
0�1194 m of Old Red Pragian-Emsian fluvial-estuarine
siliciclastics (Dniester Series) with an erosional upper
surface (Małkowski et al., 2009; Drygant, 2010).
1
2
3
4
5
6
7
8
9
10
11
12
13
14
15
16
17
18
19
20
21
22
23
24
25
26
27
28
29
30
31
32
33
34
35
36
37
38
39
40
41
42
43
44
45
46
47
48
49
50
51
52
53
54
55
56
57
1
2
3
4
5
6
7
8
9
10
11
12
13
14
15
16
17
18
19
20
21
22
23
24
25
26
27
28
29
30
31
32
33
34
35
36
37
38
39
40
41
42
43
44
45
46
47
48
49
50
51
52
53
54
55
56
57
126 Srodon et al. Clays and Clay Minerals

Tectonic burial under Caledonian nappes thrust onto
the craton margin from the SW similar to the sequence
of events recorded in the Polish sector of the Peri-
Tornquist slope (Znosko, 1970) can be excluded, based
on the cross-sections of the craton margin constructed
for the area (Drygant, 2010). A feasible scenario has to
assume that the Nikishin et al. (1996) reconstruction is
not correct and that the entire area of the Dniester slope
became a part of the Variscan foreland basin and was
cove red by a th i ck Uppe r Devon ian–Uppe r
Carboniferous (+Permian?) cover, the bottom part of
which is preserved today as an erosional remnant in the
Lublin–L’viv coal basin and farther NW on the Peri-
Tornquist slope (Figure 2a). The zonation of
Carboniferous coal grade corresponds perfectly to the
diagenetic zonation of the underlying Lower Paleozoic
strata, as it increases to the SW (Karnkowski 2003;
Shulga et al., 2007). Also, the thickness of subsequent
Carboniferous formations increases to the SW toward
the Rava Rus’ka Fault (Shulga et al., 2007, figure 34).
The SE border of the Lublin-L’viv Basin is erosional,
with younger strata intersecting the present-day surface
successively toward the NW (Figure 2a). Coals of the
Lublin-L’viv Basin are characterized by Ro = 0.55�1.0(Majorowicz et al., 1984), indicative of substantial
burial (1.5�3.0 km according to figure 5 of Suggate,
1998). The missing overburden probably included
Permian, as indicated by the Permian K-Ar ages of
illite-smectite from the Carboniferous sandstones of the
Lublin basin (Kozłowska, 2011). 120ºC or occasionally
even h ighe r d iagene t i c t empera tu re s in the
Carboniferous rocks were estimated from fluid inclu-
sions in sandstone cements (Kozłowska, 2002; Poprawa
and Zywiecki, 2005). Detrital micas, as well as monazite
and zircon from the Carboniferous sandstones of the
Lublin-L’viv coal basin, give distinctive Carboniferous
age cluster, documenting the Variscan source area
(Paszkowski and Kusiak, 2005). All these features are
consistent with the hypothesis of an asymmetric Upper
Paleozoic basin fill, thickest in the SW, extending
originally on the Dniester slope toward the SE, at least
as far as the Dniester gorge area. This was responsible
for the diagenesis of the underlying Lower Paleozoic
rocks, and was removed by erosion during the Mesozoic
uplift of the area.
Part of this Carboniferous basin, now destroyed by
erosion, was probably located in the present day Rava
Rus’ka tectonic zone, bordering the Lublin-L’viv basin
from the SW (Figure 2a). Such an hypothesis is
supported by the Silurian bentonite K-Ar dating from
the Wola Obszanska borehole (Kowalska, 2008), located
in this zone just W of the Polish-Ukrainian border
(Figure 2a). Four bentonite samples from this profile
gave 12�14%S, thus a similar level of burial as the
Dniester gorge area, and also a similar illite-smectite
K-Ar age range of 285�364 Ma. The %S determinations
in Silurian shales from several boreholes in this zone
(Kowalska, 2008) indicate a level of diagenesis similar
to well 6618, located on the NE edge of the Lublin-L’viv
basin (Figure 2a). These data allow speculation that the
depocenter of the Carboniferous basin ran NW�SE more
or less along the Rava Rus’ka fault, as recorded by the
highest CAI values of 5 (Figure 2a). Originally, the axis
of this basin may have deepened toward the SE, allowing
for thicker Upper Paleozoic overburden than known
from the NW (Warsaw-Lublin area), and the tectonic
inversion of this basin was stronger in the SE, resulting
in deeper exhumation. Such a sequence of events is
typical of basins controlled by major faults (e.g. Podhale
basin: Srodon et al., 2006a).
Such narrow depocenters, localized over major faults
(Figure 12a) filled with siliciclastics with very high
sedimentation rates and high thermal maturity, are
known from several parts of Larussia in front of the
Variscan orogen (Clare basin in Ireland: Croker, 1995;
Culm basin in Cornwall: Warr and Hecht, 1993; Reugen
basin in NE Germany: Kornpihl, 2005; Donbas basin in
the Ukraine: Reznikov, 1978).
An alternative feasible mechanism, which could have
produced excessive burial along the Rava Rus’ka fault is
a Variscan intracratonic duplex thrusting event. Such
structures have been recognized farther to the NW in
Poland along the Ursynow-Kazimierz fault, which is a
NW continuation of the Rava Rus’ka fault (Antonowicz
et al., 2003; Krzywiec, 2009). Similar transpressional
thrust duplexes form a newly described class of orogens
known as intracontinental transpressional thrust/fault
belts (Cunningham, 2005; Cunningham and Mann,
2007). The duplex overburden may have been removed
entirely by erosion, due to deeper exhumation of this
area (Figure 12b).
Theoretically, such differences in the level of
diagenesis could also be attributed to the variation in
paleo-heat flow between the platform and TESZ. The
thickness distribution of the Carboniferous formations in
the Lublin-L’viv Basin, correlating positively with the
coal grade, testifies against the heat flow variation as the
major factor. Analyses of contemporary heat-flow
patterns in Poland did not detect major differences
between TESZ and the craton (Majorowicz et al., 2003).
However, the analysis of vitrinite reflectance profiles
from the Lublin basin reveals a systematic increase of
the paleogeothermal gradient along the Peri-Tornquist
slope (Majorowicz et al., 1984, figure 7 [Authors:
confirm this figure is from reference?]) from the
region near Warsaw (27ºC/km, similar to a contempor-
ary gradient) to the Polish–Ukrainian border (50º/km,
twice the contemporary gradient: estimates based on
Suggate, 1998, in agreement with the estimates of
Majorowicz et al., 1984). Botor et al. (2002) detected
a similar trend in the area. If this trend in the
paleogeothermal gradient continued farther to the SE,
as implied by the modeling (Karnkowski, 2003), then the
estimates of the Carboniferous burial of the L’viv slope
1
2
3
4
5
6
7
8
9
10
11
12
13
14
15
16
17
18
19
20
21
22
23
24
25
26
27
28
29
30
31
32
33
34
35
36
37
38
39
40
41
42
43
44
45
46
47
48
49
50
51
52
53
54
55
56
57
1
2
3
4
5
6
7
8
9
10
11
12
13
14
15
16
17
18
19
20
21
22
23
24
25
26
27
28
29
30
31
32
33
34
35
36
37
38
39
40
41
42
43
44
45
46
47
48
49
50
51
52
53
54
55
56
57
Vol. 61, No. 2, 2013 Thermal history of Lower Paleozoic rocks, East European Craton 127
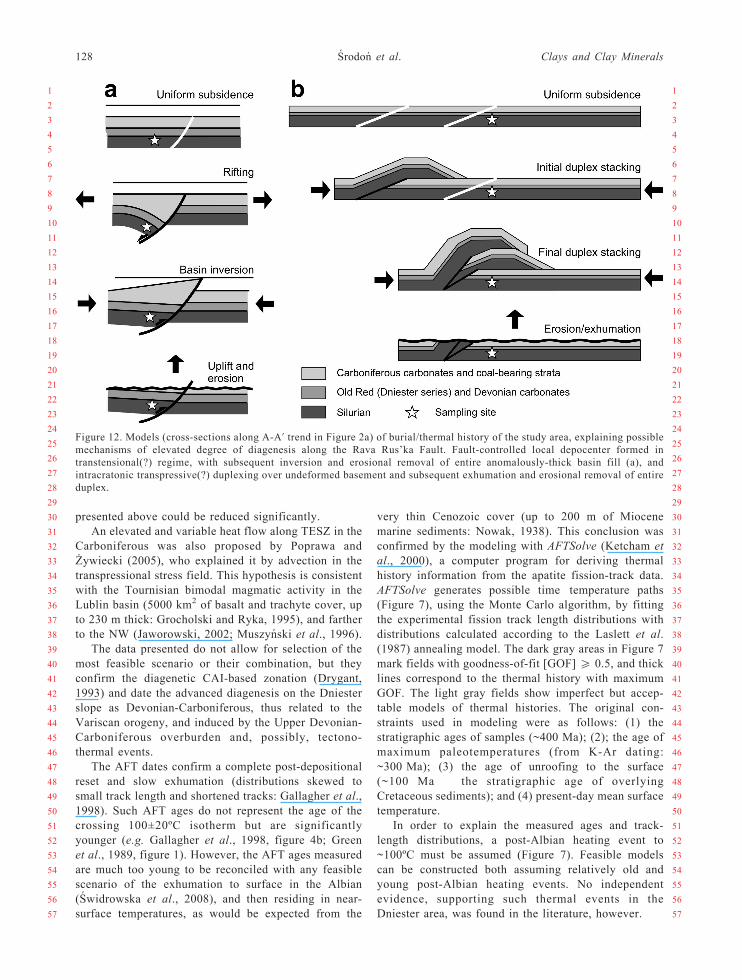
presented above could be reduced significantly.
An elevated and variable heat flow along TESZ in the
Carboniferous was also proposed by Poprawa and
Zywiecki (2005), who explained it by advection in the
transpressional stress field. This hypothesis is consistent
with the Tournisian bimodal magmatic activity in the
Lublin basin (5000 km2 of basalt and trachyte cover, up
to 230 m thick: Grocholski and Ryka, 1995), and farther
to the NW (Jaworowski, 2002; Muszynski et al., 1996).
The data presented do not allow for selection of the
most feasible scenario or their combination, but they
confirm the diagenetic CAI-based zonation (Drygant,
1993) and date the advanced diagenesis on the Dniester
slope as Devonian-Carboniferous, thus related to the
Variscan orogeny, and induced by the Upper Devonian-
Carboniferous overburden and, possibly, tectono-
thermal events.
The AFT dates confirm a complete post-depositional
reset and slow exhumation (distributions skewed to
small track length and shortened tracks: Gallagher et al.,
1998). Such AFT ages do not represent the age of the
crossing 100�20ºC isotherm but are significantly
younger (e.g. Gallagher et al., 1998, figure 4b; Green
et al., 1989, figure 1). However, the AFT ages measured
are much too young to be reconciled with any feasible
scenario of the exhumation to surface in the Albian
(Swidrowska et al., 2008), and then residing in near-
surface temperatures, as would be expected from the
very thin Cenozoic cover (up to 200 m of Miocene
marine sediments: Nowak, 1938). This conclusion was
confirmed by the modeling with AFTSolve (Ketcham et
al., 2000), a computer program for deriving thermal
history information from the apatite fission-track data.
AFTSolve generates possible time�temperature paths
(Figure 7), using the Monte Carlo algorithm, by fitting
the experimental fission track length distributions with
distributions calculated according to the Laslett et al.
(1987) annealing model. The dark gray areas in Figure 7
mark fields with goodness-of-fit [GOF] 5 0.5, and thick
lines correspond to the thermal history with maximum
GOF. The light gray fields show imperfect but accep-
table models of thermal histories. The original con-
straints used in modeling were as follows: (1) the
stratigraphic ages of samples (~400 Ma); (2); the age of
maximum paleotemperatures (from K-Ar dating:
~300 Ma); (3) the age of unroofing to the surface
(~100 Ma � the stratigraphic age of overlying
Cretaceous sediments); and (4) present-day mean surface
temperature.
In order to explain the measured ages and track-
length distributions, a post-Albian heating event to
~100ºC must be assumed (Figure 7). Feasible models
can be constructed both assuming relatively old and
young post-Albian heating events. No independent
evidence, supporting such thermal events in the
Dniester area, was found in the literature, however.
Figure 12. Models (cross-sections along A-A’ trend in Figure 2a) of burial/thermal history of the study area, explaining possible
mechanisms of elevated degree of diagenesis along the Rava Rus’ka Fault. Fault-controlled local depocenter formed in
transtensional(?) regime, with subsequent inversion and erosional removal of entire anomalously-thick basin fill (a), and
intracratonic transpressive(?) duplexing over undeformed basement and subsequent exhumation and erosional removal of entire
duplex.
1
2
3
4
5
6
7
8
9
10
11
12
13
14
15
16
17
18
19
20
21
22
23
24
25
26
27
28
29
30
31
32
33
34
35
36
37
38
39
40
41
42
43
44
45
46
47
48
49
50
51
52
53
54
55
56
57
1
2
3
4
5
6
7
8
9
10
11
12
13
14
15
16
17
18
19
20
21
22
23
24
25
26
27
28
29
30
31
32
33
34
35
36
37
38
39
40
41
42
43
44
45
46
47
48
49
50
51
52
53
54
55
56
57
128 Srodon et al. Clays and Clay Minerals
The burial history inferred here for the Dniester slope
bears some close similarities to the history of the
Carboniferous fill of Donbas, located 500 km to the
east within the Sarmatian Shield (Figure 1). Also, in
Donbas, the post-Carboniferous erosion is estimated to
have reached 10 km, numerous Cretaceous AFT cooling-
ages were measured (Danisik et al., 2010) and the
maximum level of alteration reached the anchimeta-
morphic stage in the axial zone of the basin (Srodon and
Paszkowski, 2011).
CONCLUSIONS
(1) The Silurian and Lower Devonian rocks in
Podolia underwent deep burial diagenesis, with max-
imum temperatures reaching 200ºC.
(2) This diagenetic event lasted from the Upper
Devonian to the end of the Carboniferous, based on K-Ar
dating of illite-smectite from bentonites and shales. This
result implies that the spatial distribution of shale gas vs.
shale oil rocks in the area is controlled by the Dniester
slope evolution during the Upper Paleozoic, which
constrains the basin history models for the area.
(3) The spatial pattern of diagenesis detected using
illite-smectite corresponds to the CAI data, and implies
that the highest diagenetic temperatures occurred along
the Rava Rus’ka Fault.
(4) To explain this pattern, the extension of the
Carboniferous Lublin-L’viv basin to the SE has to be
imagined, possibly with a narrow, fault-controlled
depocenter or a transpressional Variscan intracratonic
duplex thrust over the Rava Rus’ka Fault zone, which
produced anchimetamorphic temperatures. Elevated heat
flow may have also played a role.
(5) The long-lasting uplift of the Sarmatian Shield
destroyed this thick sedimentary cover in Podolia, as
proven by the Cretaceous AFT ages. An additional,
much weaker, post-Albian heating period has to be
assumed to explain the AFT data fully.
(6) At such a deep level of diagenesis, the bulk-rock
composition (carbonate vs. shale) does not measurably
affect the degree of smectite illitization, but a lower
degree in bentonites is still measurable. The bulk-rock
chemistry (elevated Mg) resulted in elevated contents of
chlorite and affected illite chemical composition,
producing aluminoceladonite in the Silurian dolomitic
section.
(7) The comparison of core and outcrop samples
indicates that chlorite is partially opened during
contemporary outcrop weathering and for this reason it
is unsuitable as an indicator of diagenetic degree.
ACKNOWLEDGMENTS
Małgorzata Zielinska and Tadeusz Kawiak are thankedfor sample preparation and XRD measurements, respec-tively. Leszek Chudzikiewicz helped with the figures.Stanisław Skompski supplied a set of his Silurian samples.
Chevron Laboratories in Houston are acknowledged forpermission to use their proprietary QUANTA program.Anonymous reviewers offered valuable comments andlanguage corrections, which helped to improve thepresentation.
REFERENCES
Altaner, S.P., Hower, J., Whitney, G., and Aronson, J.L. (1984)Model for K-bentonite formation: evidence from zoned K-bentonites in the disturbed belt, Montana. Geology, 12,412�415.
Anczkiewicz, A.A. (2005) Apatite fission track verification ofthe maximum paleotemperatures estimated from smectiteillitization for the Tatra Mts., Podhale Basin, and theadjacent area of the External Carpathians. PhD thesis,Institute of Geological Sciences PAN, Krakow, Poland, 126pp. (in Polish).
Anczkiewicz, A.A., Zattin, M., and Srodon, J. (2005) Cenozoicuplift of the Tatras and Podhale basin from the perspectiveof the apatite fission track analyses. Mineralogical Society
of Poland – Special Papers, 25, 261�264.Antonowicz, L., Hooper, R., and Iwanowska, E. (2003) Lublin
Syncline as a result of thin-skinned Variscan deformation(SE Poland). Przeglad Geologiczny, 51, 344�350 (in Polishwith English summary).
Barker, Ch.E. and Pawlewicz, M.J. (1986) The correlation ofvitrinite reflectance with maximum temperature in humicorganic matter. Pp. 79�93 in: Paleogeothermics (G.Buntebarth G. and L. Stegena, editors). Lecture Notes inEarth Sciences, Vol. 5, Springer-Verlag, Berlin.
Bergstrom, S.M. (1980) Conodonts as paleotemperature toolsin Ordovician rocks of the Caledonides and adjacent areas inScandinavia and the British Isles. Geologiska Foreningens i
Stockholm Forhandlingar, 102, 377�392.Botor, D., Kotarba, M., and Kosakowski, P. (2002) Petroleum
generation in the Carboniferous strata of the Lublin Trough(Poland): an integrated geochemical and numerical model-ling approach. Organic Geochemistry, 33, 461�476.
Buła, Z. and Habryn, R. (2011) Precambrian and Paleozoicbasement of the Carpathian Foredeep and the adjacent OuterCarpathians (SE Poland and Western Ukraine). Annales
Societatis Geologorum Poloniae, 81, 221�239.Clauer, N., Srodon, J., Francu, J., and Sucha, V. (1997) K-Ar
dating of illite fundamental particles separated from illite-smectite. Clay Minerals, 32, 181�196.
Croker, P.F. (1995) The Clare basin: a geological andgeophysical outline. Pp. 327�339 in: The Petroleum
Geology of Ireland’s Offshore (P.F. Croker and P.M.Shannon, editors). Special Publication 93, GeologicalSociety, London.
Cunningham, D. (2005) Active intracontinental transpressionalmountain building in the Mongolian Altai: Defining a newclass of orogen. Earth and Planetary Science Letters, 240,436�444.
Cunningham, D. and Mann, P. (2007) Tectonics of strike-sliprestraining and releasing bends. Pp. 1�12 in: Tectonics of
Strike-Slip Restraining and Releasing Bends (W.D.Cunningham and P. Mann, editors). Special Publication290, Geological Society, London.
Danisik, M., Sachsenhofer, R., Frisch, W., Privalov, V.,Panova, E., and Spiegel, C. (2010) Thermotectonic evolu-tion of the Ukrainian Donbas Foldbelt revisited: newconstraints from zircon and apatite fission track data.Basin Research, 22, 681�698.
Drits, V.A., Zviagina, B.B., McCarty, D.K., and Salyn, A.L.(2010) Factors responsible for crystal-chemical variations inthe solid solutions from illite to aluminoceladonite and fromglauconite to celadonite. American Mineralogist, 95,
1
2
3
4
5
6
7
8
9
10
11
12
13
14
15
16
17
18
19
20
21
22
23
24
25
26
27
28
29
30
31
32
33
34
35
36
37
38
39
40
41
42
43
44
45
46
47
48
49
50
51
52
53
54
55
56
57
1
2
3
4
5
6
7
8
9
10
11
12
13
14
15
16
17
18
19
20
21
22
23
24
25
26
27
28
29
30
31
32
33
34
35
36
37
38
39
40
41
42
43
44
45
46
47
48
49
50
51
52
53
54
55
56
57
Vol. 61, No. 2, 2013 Thermal history of Lower Paleozoic rocks, East European Craton 129

348�361.Drygant, D. (1993) Conodont colour as indicator of the
geological processes (Volyn-Podolia). Paleontologiceskij
Zbirnyk, 29, 35�37 (in Ukrainian).Drygant, D. (2010) Devonian Conodonts from South-West
Margin of the East European Platform (Volyn’-Podolian,
Ukraine). Academperiodyka, Kyiv, 156 pp (in Ukrainian).Drygant, D. (2011) Remarks on the geology of the Carpathian
Foredeep basement. Geology and Geochemistry of
Combustible Minerals, 3�4, 139�155 (in Ukrainian withEnglish summary).
Dudek, T. and Srodon, J. (1996) Identification of illite/smectiteby X-ray powder diffraction taking into account thelognormal distribution of crystal thickness. Geologica
Carpathica�Series Clays, 5, 21�32.Dumitru, T.A. (1993) A new computer automated microscope
stage system for fission-track analysis. Nuclear Tracks and
Radiation Measurements, 21, 575�580.Dunkl, I. (2002) TRACKKEY: A Windows program for
calculation and graphical presentation of fission track data.Computer Geoscience, 28, 3�12.
Epstein, A.G., Epstein, J.B., and Harris, L.D. (1977) ConodontColor Alteration � an Index to Organic Metamorphism.
U.S. Geol. Survey Prof. Paper 995, 27 pp.Francu, J., Muller, P., Sucha, V., and Zatkalikova, V. (1990)
Organic matter and clay minerals as indicators of thermalhistory in the Transcarpathian Depression (East SlovakianNeogene Basin) and the Vienna Basin. Geologica
Carpathica, 41, 535�546.Galbraith, R.F. (1981) On statistical models for fission track
counts. Mathematical Geology, 13, 471�438.Galbraith, R.F. (1990) The radial plot; graphical assessment of
sp read in ages . Nuclear Tracks and Radia t ion
Measurements, 17, 207�214.Galbraith, R.F. and Laslett, G.M. (1993) Statistical models for
mixed fission track ages. Nuclear Tracks and Radiation
Measurements, 21, 459�470.Gallagher, K., Brown, R., and Johnson, C. (1998) Fission track
analysis and its applications to geological problems. AnnualReview of Earth & Planetary Sciences, 26, 519�72.
Garetsky, R.G., Zinovenko, G.V., and Vishnyakov, I.B. (1981)Baltic-Dnestrian System of the Pericratonic Depressions.Pp. 44�61 in: Geology of the Western Part of the East
European Platform (R.G. Garetsky, editor). Minsk, Nauka iTekhnika.
Gorokhov, I.M., Yakovleva, O.V., Semikhatov, M.A.,Mel’nikov, N.N., Ivanovskaya, T.A., and Kutyavin, E.P.(1997) ‘‘Rejuvenated" Al-glauconite in Vendian-Cambriandeposits of Podolian Dniester region, Ukraine: Rb-Sr and K-Ar systematics and 57Fe Moessbauer spectra. Lithology and
Mineral Resources, 32, 541�558.Green, P.F. (1981) ‘Track-in track’ length measurements in
annealed apatites. Nuclear Tracks, 5, 12�18.Green, P.F., Duddy, I.R., Laslett, G.M., Hegarty, K.A.,
Gleadow, A.J.W., and Lovering, J.F. (1989) Thermalannealing of fission tracks in apatite 4. Quantitativemodelling techniques and extention to geological time-scales. Chemical Geology (Isotope Geoscience Section), 79,155�182.
Grocholski, A. and Ryka, W. (1995) Carboniferous magmatismof Poland. Pp. 181�190 in: The Carboniferous System in
Poland (A. Zdanowski and H. Zakowa, editors). PracePanstwowego Instytutu Geologicznego 148.
Huff, W.D., Bergstrom, S.M., and Kolata, D.R. (2000) SilurianK-bentonites of the Dnestr Basin, Podolia, Ukraine. Journalof the Geological Society London, 157, 493�504.
Hunziker, J.C., Frey, M., Clauer, N., Dallmeyer, R.D.,Friedr ichsen, H., Flehmig, W., Hochstrasser , K. ,Roggwiler, P., and Schwander, H. (1986) The evolution of
illite to muscovite: mineralogical and isotopic data from theGlarus Alps, Switzerland. Contributions to Mineralogy and
Petrology, 92, 157�180.Jackson, M.L. (1975) Soil Chemical Analysis � Advanced
Course. Published by the author, Madison, Wisconsin, USA.Jaworowski , K. (2002) Geotectonic significance of
Carboniferous deposits NW of the Holy Cross Mts. (centralPoland). Geological Quarterly, 46, 267�280.
Jelenska, M., Bakhmutov, V., and Konstantinienko, L. (2005)Paleomagnetic and rock magnetic data from the Siluriansuccession of the Dniester basin, Ukraine. Physics of the
Earth and Planetary Interiors, 149, 307�320.Karnkowski, P.H. (2003) Carboniferous time in the evolution
of the Lublin Basin as the main hydrocarbon formation stagein the Lublin area � results of the geological modelling(PetroMod). Przeglad Geologiczny, 51, 783�790 (inPolish).
Ketcham, R.A., Donelick, R.A., and Donelick, M.B. (2000)AFTSolve: A program for multi-kinetic modeling of apatitefission-track data. Geological Material Research, 2, 1�32.
Kipli, T., Tsegelnjuk, P.D., and Kollaste, T. (2000) Volcanicinterbeds in the Silurian of the southwestern part of the EastEuropean Platform. Proceedings Estonian Academy of
Sciences, Geology, 49, 163�176.Kornpihl, K. (2005) Tectono-sedimentary evolution of the NE
German Variscan foreland basin. PhD thesis, University ofBonn, Germany, 123 pp.
Kowalska, S. (2008) Border of diagenesis and anchimeta-morphism in Upper Proterozoic and Cambrian rocks of Epart of Małopolska block established by clay mineralstudies. PhD thesis, Institute of Geological Sciences PAN,Krakow, Poland, 238 pp.
Kozłowska, A. (2002) Upper Carboniferous sandstone diagen-esis in NW part of the Lublin trough. PhD thesis, PolishGeological Institute, Warsaw, Poland (in Polish).
Kozłowska, A. (2011) Clay minerals in the Carboniferoussandstones of the southeastern part of the Lublin basin aspaleotemperature indicators of diagenesis. Biuletyn
Panstwowego Instytutu Geologicznego, 444, 99�112 (inPolish).
Krzywiec, P. (2009) Devonian-Cretaceous repeated subsidenceand uplift along the Tornquist-Teisseyre Zone in SE Polandu insight from seismic data interpretation. Tectonophysics,475, 142�159.
Kubler, B. (1964) Le argiles, indicateurs de metamorphisme.Revue de l’Institut Francais du Petrole, 19, 1093�1112 (inFrench).
Lindgreen, H., Drits, V.A., Sakharov, B.A., Salyn, A.L.,Wrang, P., and Dainyak, L.G. (2000) Illite-smectitestructural changes during metamorphism in blackCambrian Alum shales from the Baltic area. American
Mineralogist, 85, 1223�1238.Majorowicz, J . , Marek, S. , and Znosko, J . (1984)
Paleogeothermal gradients by vitrinite reflectance data andtheir relation to the present geothermal gradient patterns ofthe Polish Lowland. Tectonophysics, 103, 141�156.
Majorowicz, J.A., Cermak, V., Safanda, J., Krzywiec, P.,Wroblewska, M., Guterch, A., and Grad, M. (2003) Heatflow models across the Trans-European Suture Zone in thearea of the POLONAISE’97 seismic experiment. Physics
and Chemistry of the Earth, 28, 375�391.Małkowski, K., Racki, G., Drygant, D., and Szaniawski, H.
( 2009 ) Ca rbon i so tope s t r a t i g raphy ac ro s s t heSilurian�Devonian transition in Podolia, Ukraine: evidencefor a global biogeochemical perturbation. Geological
Magazine, 146, 674�689.McCarty, D.K., Drits, V.A., and Sakharov, B. (2006)
Relationship between composition and lattice parametersof some sedimentary dolomite varieties. European Journal
1
2
3
4
5
6
7
8
9
10
11
12
13
14
15
16
17
18
19
20
21
22
23
24
25
26
27
28
29
30
31
32
33
34
35
36
37
38
39
40
41
42
43
44
45
46
47
48
49
50
51
52
53
54
55
56
57
1
2
3
4
5
6
7
8
9
10
11
12
13
14
15
16
17
18
19
20
21
22
23
24
25
26
27
28
29
30
31
32
33
34
35
36
37
38
39
40
41
42
43
44
45
46
47
48
49
50
51
52
53
54
55
56
57
130 Srodon et al. Clays and Clay Minerals

of Mineralogy, 18, 611�627.Moore, D.M. and Reynolds, R.C. (1997) X-ray Diffraction and
the Identification and Analysis of Clay Minerals. OxfordUniversity Press, Oxford-New York, 378 pp.
Morton, J.P. and Long, L.E. (1984) Rb-Sr ages of glauconiterecrystallization: dating times of regional emergence abovesea level. Journal of Sedimentary Petrology, 54, 495�506.
Muszynski A., Biernacka J., Lorenc S., Protas A., Urbanek Z.,and Wojewoda, J. (1996) Petrology and a depositionalenvironment of Lower Carboniferous rocks near Dygowoand Kłanino (the Koszalin-Chojnice zone), Geologos, 1,93�126.
Mystkowski, K., Srodon, J., and McCarty, D.K. (2002)Application of evolutionary programming to automaticXRD quantitative analysis of clay-bearing rocks. Abstractswith Programs, The Clay Minerals Society 39th AnnualMeeting, Boulder, CO., p. 134.
Naeser, C.W. (1981) The fading of fission tracks in thegeologic environment � data from deep drill holes. NuclearTracks, 5, 248�250.
Nawrocki, J. and Poprawa, P. (2006) Development of Trans-European Suture Zone in Poland: from Ediacaran rifting toEarly Palaeozoic accretion. Geological Quarterly, 50,59�76.
Nehring-Lefeld, M., Modlinski, Z., and Swadowska, E. (1997)Thermal evolution of the Ordovician in the western marginof the East-European Platform: CAI and Ro data. GeologicalQuarterly, 41, 129�138.
Nikishin, A.M., Ziegler, P.A., Stephenson, R.A., Cloetingh,S.A.P.L., Furne, A.V., Fokin, P.A., Ershov, A.V., Bolotov,S.N., Korotaev, M.V., Alekseev, A.S., Gorbachev, V.I.,Shipilov, E.V., Lankreijer, A., Bembinova, E.Yu., andShlimov, I.V. (1996) Late Precambrian to Triassic historyof the East European Craton: dynamics of sedimentary basinevolution. Tectonophysics, 268, 23�63.
Nowak, J. (1938) Dniestr a gipsy tortonskie. Rocznik PolskiegoTowarzystwa Geologicznego, 14, 155�194 (in Polish).
Paszkowski, M. and Kusiak, M. (2005) Geotectonic aspects ofdetritus provenance in some Paleozoic epiplatform basins ofPoland and adjacent countries. Pp. 11�12 in: 2005 Report of
the Institute of Geological Sciences PAS (in Polish).Poprawa, P. (2010) Shale gas potential of the Lower
Palaeozoic complex in the Baltic and Lublin-Podlasie basins(Poland). Przeglad Geologiczny, 58, 226�249 (in Polish).
Poprawa, P. and Zywiecki, M. (2005) Heat transfer duringdevelopment of the Lublin basin (SE Poland): maturitymodelling and fluid inclusion analysis. Mineralogical
Society of Poland � Special Papers, 26, 241�250.Poprawa, P., Kossakowski, P., and Wrobel, M. (2010) Burial
and thermal history of the Polish part of the Baltic region.Geological Quarterly, 54, 131�142.
Pozaryski, W. and Dembowski, Z., editors (1983) GeologicalMap of Poland and Adjoining Countries 1:1000000.Geological Institute, Warsaw, Poland.
Reznikov, A.I. (1978) Geological position and general featuresof flyshoid mass of the middle part of the Donbass.Geologicheskij Zhurnal, 38, 64�72 (in Russian).
Sachsenhofer, R.F and Koltun, Y.V. (2012) Black shales inUkraine � A review. Marine and Petroleum Geology, 31,125�136.
Seifert, F. (1968) X-ray powder data for Mg-Al-celadonite(leucophyllite) from Barcza, Poland. Contributions to
Mineralogy and Petrology, 19, 93�96.Shulga, V.F., Zdanowski, A., and Zajceva, L.B. (2007)
Correlation of Carboniferous Coal-bearing Formations of
the L’viv-Volyn and Lublin Basins. National Academy ofSciences of Ukraine and Polish State Geological Institute,Kiev, 427 pp.
Skompski, S., Łuczynski, P., Drygant, D., and Kozłowski, W.
(2008) High-energy sedimentary events in lagoonal succes-sions of Upper Silurian of Podolia, Ukraine. Facies, 54,277�296.
Sliaupa, S., Fokin, P., Lazauskiene, J., and Stephenson, R.A.(2006) The Vendian�Early Palaeozoic sedimentary basinsof the East European Craton. Pp. 449�462 in: European
Lithosphere Dynamics (D.G. Gee and R.A. Stephenson,editors). Memoir 32, Geological Society, London.
Srodon, J. (1976) Mixed-layer smectite/illites in the bentonitesand tonsteins of the Upper Silesian Coal Basin. Prace
Mineralogiczne, 49, 84 pp.Srodon, J. (1984) X-ray powder diffraction identification of
illitic materials. Clays and Clay Minerals, 32, 337�349.Srodon, J. (2007) Illitization of smectite and history of
sedimentary basins. Proceedings of the 11th EUROCLAY
Conference, Aveiro, Portugal, pp. 74�82.Srodon, J. and Clauer, N. (2001) Diagenetic history of Lower
Paleozoic sediments in Pomerania (northern Poland) tracedacross the Teisseyre-Tornquist tectonic zone using mixed-layer illite-smectite. Clay Minerals, 36, 15�27.
Srodon, J. and Paszkowski, M. (2011) Role of clays indiagenet ic history of boron and nitrogen in theCarboniferous of Donbas (Ukraine). Clay Minerals, 46,561�582.
Srodon, J., Drits, V.A., McCarty, D.K., Hsieh, J.C.C., andEberl, D.D. (2001) Quantitative XRD analysis of clay-richrocks from random preparations. Clays and Clay Minerals,49, 514�528.
Srodon, J., Clauer, N., and Eberl, D.D. (2002) Interpretation ofK-Ar dates of illitic clays from sedimentary rocks aided bymodeling. American Mineralogist, 87, 1528�1535.
Srodon, J., Kotarba, M., Biron, A., Sucha, P., Clauer, N., andWojtowicz, A. (2006a) Diagenetic history of the Podhale-Orava basin and the underlying Tatra sedimentary structuralunits (Western Carpathians): evidence from XRD and K-Arof illite-smectite. Clay Minerals, 41, 747�770.
Srodon, J., Clauer, N., Banas, M., and Wojtowicz, A. (2006b)K-Ar evidence for a Mesozoic thermal event superimposedon burial diagenesis of the Upper Silesia Coal Basin. ClayMinerals, 41, 671�692.
Srodon, J., Clauer, N., Huff, W., Dudek, T., and Banas, M.(2009a) K-Ar dating of Ordovician bentonites from theBaltic Basin and the Baltic Shield: implications for the roleof temperature and time in the illitization of smectite. ClayMinerals, 44, 361�387.
Srodon, J., Zeelmaekers, E., and Derkowski, A. (2009b) Thecharge of component layers of illite-smectite in bentonitesand the nature of end-member illite. Clays and Clay
Minerals, 57, 650�672.Sucha, V., Kraus, I., Gerthofferova, H., Petes, J., and
Serekova, M. (1993) Smectite to illite conversion inbentonites and shales of the East Slovak Basin. Clay
Minerals, 28, 243�253.Suggate, R.P. (1998) Relations between depth of burial,
vitrinite reflectance and geothermal gradient. Journal of
Petroleum Geology, 21, 5�32.Swidrowska, J., Hakenberg, M., Poluhtovie, B., Seghedi, A.,
and Visnakov, I. (2008) Evolution of the Mesozoic basins onthe southwestern edge of the East European Craton (Poland,Ukraine, Moldova, Romania). Studia Geologica Polonica,130, 3�130.
Tsegelnjuk, P.D. (1980a) Rukshin and Tsygan series
(Lower�Upper Silurian) of Podolia and Volynia. Preprint80-2, Inst. Geol. Nauk, Kiev (in Russian).
Tsegelnjuk, P.D. (1980b) Yaruga and Malinovtsy series (Upper
Silurian�Lower Devonian) of Podolia and Volynia. Preprint80-11, Inst. Geol. Nauk, Kiev (in Russian).
Ulmishek, G. (1990) Geologic evolution and petroleumresources of the Baltic Basin. American Association of
1
2
3
4
5
6
7
8
9
10
11
12
13
14
15
16
17
18
19
20
21
22
23
24
25
26
27
28
29
30
31
32
33
34
35
36
37
38
39
40
41
42
43
44
45
46
47
48
49
50
51
52
53
54
55
56
57
1
2
3
4
5
6
7
8
9
10
11
12
13
14
15
16
17
18
19
20
21
22
23
24
25
26
27
28
29
30
31
32
33
34
35
36
37
38
39
40
41
42
43
44
45
46
47
48
49
50
51
52
53
54
55
56
57
Vol. 61, No. 2, 2013 Thermal history of Lower Paleozoic rocks, East European Craton 131
Petroleum Geologists Memoir, 51, 603�632.Vishnjakov, I.B., Glushko, V.V., and Pomjanovskaja, G.M.
(1981) The South-Western Border of the East-EuropeanPlatform in the Ukraine and Moldavia. Baltic-DnestrianSystem of the Pericratonic Depressions. Pp. 22�35 in:Geology of the Western Part of the East-European Platform
(R.G. Garetsky, editor). Nauka i Tekhnika, Minsk.Warr, L.N. and Hecht, C.A. (1993) A clay mineral crystallinity
investigation of the Upper Carboniferous Culm Basin ofsouth-west England. Proceedings of the Ussher Society, 8,94�98.
Whitney, G. and Northop, H.R. (1987) Diagenesis and fluid
flow in the San Juan Basin, New Mexico � regionalzonation in the mineralogy and stable isotope compositionof clay minerals in sandstone. American Journal of Science,287, 253�282.
Wiewiora, A. and Wilamowski, A. (1996) The relationshipbetween composition and b for chlorite. Geologica
Carpathica � Series Clays, 5, 79�87.Znosko, J. (1970) Tectonic position of Poland in Europe.
Biuletyn Instytutu Geologicznego, 251, 45�70 (in Polish).
(Received 17 December 2012; revised 12 March 2013;
Ms. 735; AE: S. Petit)
1
2
3
4
5
6
7
8
9
10
11
12
13
14
15
16
17
18
19
20
21
22
23
24
25
26
27
28
29
30
31
32
33
34
35
36
37
38
39
40
41
42
43
44
45
46
47
48
49
50
51
52
53
54
55
56
57
1
2
3
4
5
6
7
8
9
10
11
12
13
14
15
16
17
18
19
20
21
22
23
24
25
26
27
28
29
30
31
32
33
34
35
36
37
38
39
40
41
42
43
44
45
46
47
48
49
50
51
52
53
54
55
56
57
132 Srodon et al. Clays and Clay Minerals
Top Related
Copyright © 2022 FDOKUMEN

