


Bahasa
Halaman
Hukum

IOSR Journal of Agriculture and Veterinary Science (IOSR-JAVS)
e-ISSN: 2319-2380, p-ISSN: 2319-2372. Volume 3, Issue 5 (May. - Jun. 2013), PP 74-84
www.iosrjournals.org
www.iosrjournals.org 74 | Page
The Role of Rapid Response Technique (Landsat 4 – 5 TM) in
Vegetation Change Detection. Case Study: Delta and Edo states of
the Niger Delta Area of Nigeria
Wokocha C.C ,Nicholas A, Jack,Kurotamunoye Alwell Department of Crop and Soil Science,Faculty of Agriculture,University of Port Harcourt,Rivers
state,Nigeria.P.M.B 5323
Abstract: This paper investigates the use of Rapid Reponse (Remote Sensing) Techniques and GIS in mapping
out vegetation land cover of Delta and Edo in Niger Delta region of Nigeria between 1990 and 1999.This was
done to determine the extent of changes which had occurred between that period of time. Landsat 4-5 of
December 1990 and December 1999 were used.Layer stacking of 1, 2, 3, 4, 5 and 7 were performed. Pre-
processing was performed to remove the hazy nature. The imageries were assigned using Signature Editor.
Supervised classification was performed using maximum likelihood operation to derive the vegetation land
cover map. NDVI was used to detect areas of vegetation decline, and Density Slice technique was applied to detect
vegetation change densities which were categorized on the bases of very-very high to very-very low density. The
study showed that the vegetation cover of the area has significant change between 1990 -1999.
Key Words;Vegetation,Change detection,Remote Sensing,GIS
I. Introduction The study of vegetation land cover is usually propelled by the desire to know, the nature, in
quantitative terms, extent and rate of their changes as well as the objective baseline information on which to
assess and plan for future environmental policy. Vegetation land cover pattern of an area is the consequences of
socio-economic and natural influences and the nature of usage by man in time and space. Forests are declining
as a result of severe agricultural and demographic pressure. For this reason, information on vegetation land
cover and the likelihood of their maximum use is very important for the selection, planning and implementation method in order to maximize the increasing desire for human needs and welfare. The information will also help
in monitoring the pattern of usage in vegetation and land which resulted from changing demands of population
growth. Vegetation land cover changes are always caused by anthropogenic pressure such as increase in
population and natural incidence related to inter-annual or decadal differences in climate and intrinsic vegetation
dynamics (Boakye et al., 2008).
Several areas of the World are currently passing through rapid and wide ranging changes in land use
and vegetation, especially the current rates of the World vegetation land cover changes are mostly affected in
the Africa forest and woodland where slash and burn agriculture is greatly practice ( Duaze, 2004). Forest is
exploited for different reasons such as logging for timber, slash and burning for farming, and pasture
development (Boakye et al., 2008). The spatial extent of vegetation land cover is necessary at all times in order
to equip scientist and policy maker in times of decision making.
According to (Boake, 2008) land use and land cover change in Niger Delta region is increasing in resent time and generating widespread environmental problems that required to be mapped. This is a serious
matter that should be look into because change in the pattern of vegetation land cover will also affect change in
socio-economic conditions, and monitoring such distortions is very useful for organized actions at the national
and international standard. For instance, mapping of reserved forests always and woodland with the use of
remote sensing is necessary for faster provision of information to government so as to enlighten them on the
level of encroachment. Vegetation is very important for human well being, because it is the foundations for
living in the World through the ecological functions which regulates the water and climate resources
(Lahaussois, 1997). If vegetation is seriously degraded, then the ability to work as the regulators of the
ecological system will also lost, resulting to food reduction, erosion hazards, soil fertility reduction, enhancing
the loss of animal life, and also resulting to danger in sustainability of goods and service. Increasing
deforestation will not only influence land degradation of the natural resource base but will also affect the degradation of biodiversity, if forests are adequately managed in a sustainable manner they will enhance several
benefits to human, to the national economies and to the environment by providing timber, fuelwood, oxygen,
protection of soil, water resources and habitat conservation (Lahaussois, 1997). But any refusal to carry out
The Role of Rapid Response Technique (Landsat 4 – 5 TM) in Vegetation Change Detection. Case
www.iosrjournals.org 75 | Page
adequate sustainability of forest management scheme and exercise will amount to major negative effects such as
climate change, landscape destruction, biodiversity loss, floods, pollution and acid rains (Lahaussois, 1997).
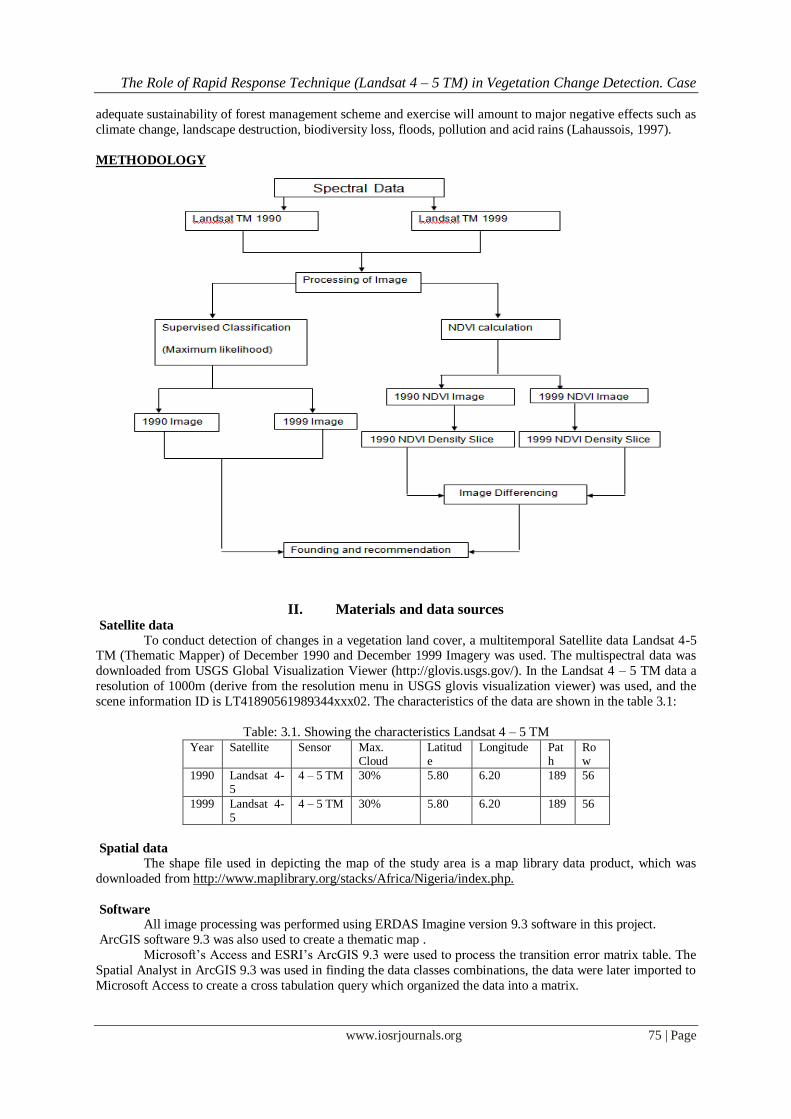
METHODOLOGY
II. Materials and data sources Satellite data
To conduct detection of changes in a vegetation land cover, a multitemporal Satellite data Landsat 4-5 TM (Thematic Mapper) of December 1990 and December 1999 Imagery was used. The multispectral data was
downloaded from USGS Global Visualization Viewer (http://glovis.usgs.gov/). In the Landsat 4 – 5 TM data a
resolution of 1000m (derive from the resolution menu in USGS glovis visualization viewer) was used, and the
scene information ID is LT41890561989344xxx02. The characteristics of the data are shown in the table 3.1:
Table: 3.1. Showing the characteristics Landsat 4 – 5 TM Year Satellite Sensor Max.
Cloud Latitude
Longitude Path
Row
1990 Landsat 4-5
4 – 5 TM 30% 5.80 6.20 189 56
1999 Landsat 4-5
4 – 5 TM 30% 5.80 6.20 189 56
Spatial data
The shape file used in depicting the map of the study area is a map library data product, which was
downloaded from http://www.maplibrary.org/stacks/Africa/Nigeria/index.php.
Software All image processing was performed using ERDAS Imagine version 9.3 software in this project.
ArcGIS software 9.3 was also used to create a thematic map .
Microsoft’s Access and ESRI’s ArcGIS 9.3 were used to process the transition error matrix table. The
Spatial Analyst in ArcGIS 9.3 was used in finding the data classes combinations, the data were later imported to
Microsoft Access to create a cross tabulation query which organized the data into a matrix.

The Role of Rapid Response Technique (Landsat 4 – 5 TM) in Vegetation Change Detection. Case
www.iosrjournals.org 76 | Page
In NDVI density slice, the Spatial Analyst tool in ArcGIS was also used to categorise the images into
different vegetation densities through the reclassification process.
Microsoft Excel office 2007 was used in conducting all the statistical functions such as percentage and values, and also for plotting of graphs and histograms for analysis and interpretations.
III. Methods of Data Analysis The methods used in the data analysis of this study are as follows:
Supervised Classification (Maximum Likelihood)
Normalized Difference Vegetation Index (NDVI)
Calculating and comparing the Area in hectares of the resultant vegetation land cover for each study
year.
Image Differencing. Comparing the transition error matrix of 1990 and 1999.
Supervised Classification (Maximum Likelihood)
The technique used in the vegetation land cover classification is the Maximum Likelihood supervised
classification. This is the most used supervised classification and it relies on the principle that the training data
statistics in each band are normally distributed. Supervised classification starts with defining the areas that will
be used as training sites for the various vegetation land cover, and the selected training sites are labeled pixel by
pixel (Omo-Irabor and Oduyenu, 2006).
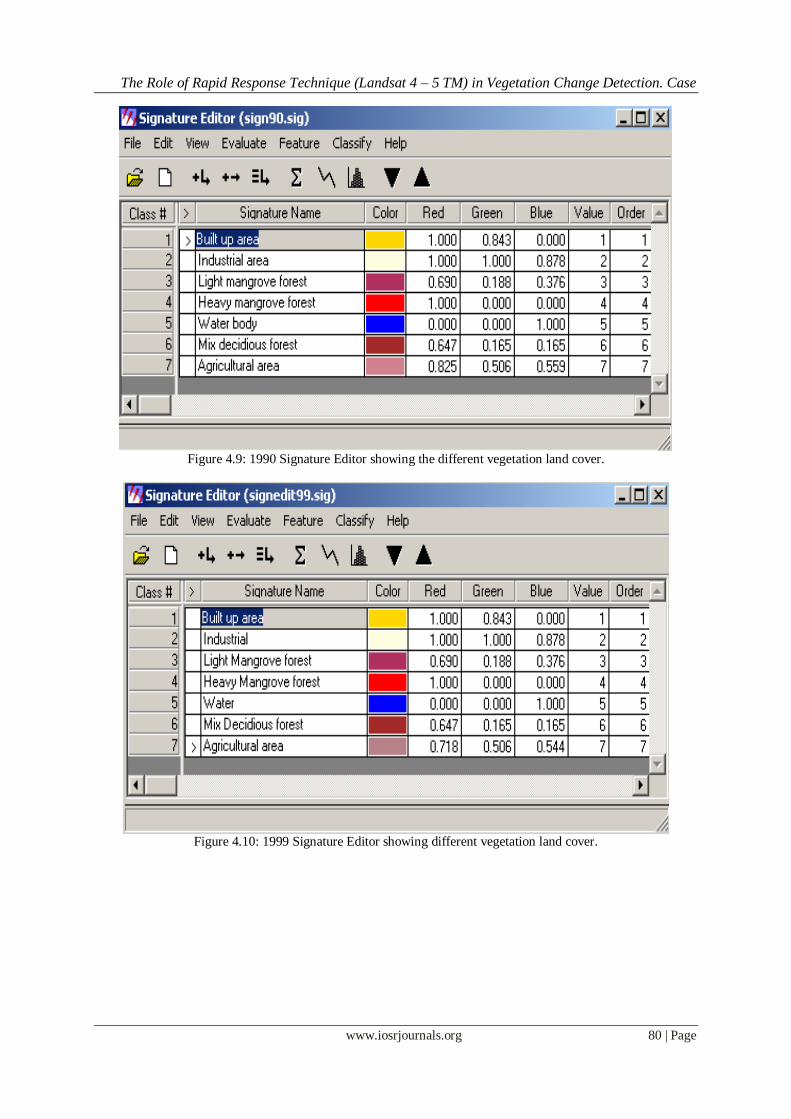
The training areas were classified based on 7 different vegetation and land cover classes namely: Built Up area,
Industrial area, Light Mangrove forest, Heavy Mangrove forest, Water, Mix Deciduous forest, and Agricultural
area.
Normalized Difference Vegetation Index (NDVI)
Normalized Difference Vegetation Index (NDVI) is an image transformation that depended on the
variance between the near-infrared and red wavelengths (e.g. Landsat TM bands 4 and 3, respectively).
The equation for NDVI = (NIR — R) / (NIR +R)
The result of spectral reflectance peak in the near-infrared range is seen in healthy vegetation, Normalized
Difference Vegetation Index (NDVI) is an important technique to assess and detect vegetation vigour and
health, and to calculating the biomass.
Calculating and comparing the Area in hectares of the resultant vegetation land cover for each study
year.
Between 1990 and 1999 the calculation and comparison of the vegetation land cover statistics helped in identification of the extent and percentage of change. This was done through creating a table indicating the area
in hectares and the percentage change for a given year (1990 and 1999) measured against each vegetation land
cover class.
The percentage change used in determining the extent of change was calculated by dividing observed change by
the sum of change multiplied by 100.
Observed change * 100
Percentage change =
Sum of change
Image Differencing Image differencing which is a change detection technique was used to determine the changes between
1990 – 1999 images. Image differencing is the process that involves the subtraction of digital pixel value of an
image from one date from the corresponding pixel values for a different date (Digirolamo, 2006). The 1990
image was subtracted from the 1999 image this was achieved by applying the operators’ tool.
Image Differencing = year 2 – year 1,
Where year 2 => 1999, and year 1 => 1990.
The Image Differencing method is favourable because of its simplicity of computation, accuracy, and ease of
interpretation (Hayes & Sader, 2001).
The Transition Error Matrix
The transition error matrix was used to compare the likelihood of change of pixel that might change
from one class to another class from 1990 to 1999.
The Role of Rapid Response Technique (Landsat 4 – 5 TM) in Vegetation Change Detection. Case
www.iosrjournals.org 77 | Page
Satellite Data Pre-processing
Pre-processing is the rectification procedures for the geometry and radiometry of raw satellite data and
the presence of noise (Gayer 2008). Various methods of correction have to be processed before images could be used for data analysis. Geometric distortions occur as a result of the earth’s curved surface, the satellites
movement and oblique viewing angles of the sensors. The purpose is to align all image elements into their
appropriate spatial position and, if need be, also be put into certain map projection such as Universal Mercator
Projection (UTM). Noise reduction is used to correct undesirable disturbance that came from malfunctions of
detectors or failures in the chain of analogue and digital signal processing.
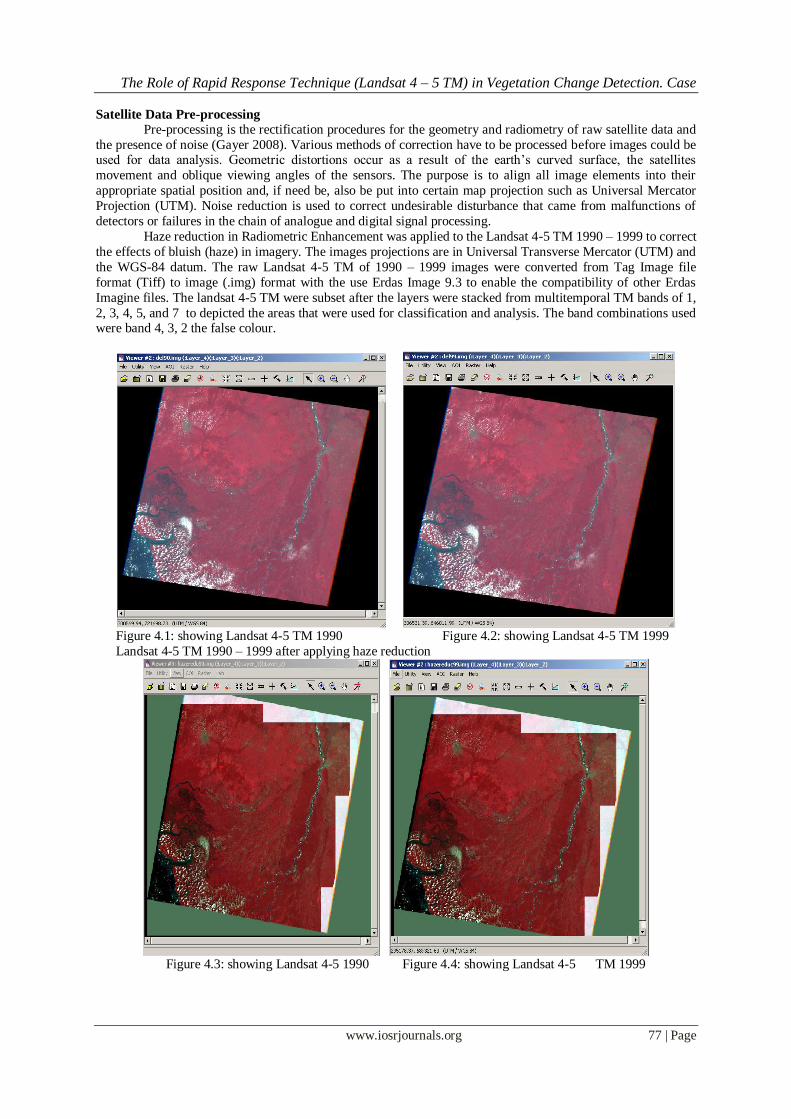
Haze reduction in Radiometric Enhancement was applied to the Landsat 4-5 TM 1990 – 1999 to correct
the effects of bluish (haze) in imagery. The images projections are in Universal Transverse Mercator (UTM) and
the WGS-84 datum. The raw Landsat 4-5 TM of 1990 – 1999 images were converted from Tag Image file
format (Tiff) to image (.img) format with the use Erdas Image 9.3 to enable the compatibility of other Erdas
Imagine files. The landsat 4-5 TM were subset after the layers were stacked from multitemporal TM bands of 1,
2, 3, 4, 5, and 7 to depicted the areas that were used for classification and analysis. The band combinations used were band 4, 3, 2 the false colour.
Figure 4.1: showing Landsat 4-5 TM 1990 Figure 4.2: showing Landsat 4-5 TM 1999
Landsat 4-5 TM 1990 – 1999 after applying haze reduction
Figure 4.3: showing Landsat 4-5 1990 Figure 4.4: showing Landsat 4-5 TM 1999

The Role of Rapid Response Technique (Landsat 4 – 5 TM) in Vegetation Change Detection. Case
www.iosrjournals.org 78 | Page
Figure 4.5: Haze reduction diologbox
Landsat 4-5 after appliing subsetting to remove the rough edges and ready for analysis
Figure: 4.6 Landsat 4-5 TM 1990 subset Figure: 4.7 1999 Landsat 4-5 TM subset
The Role of Rapid Response Technique (Landsat 4 – 5 TM) in Vegetation Change Detection. Case
www.iosrjournals.org 79 | Page
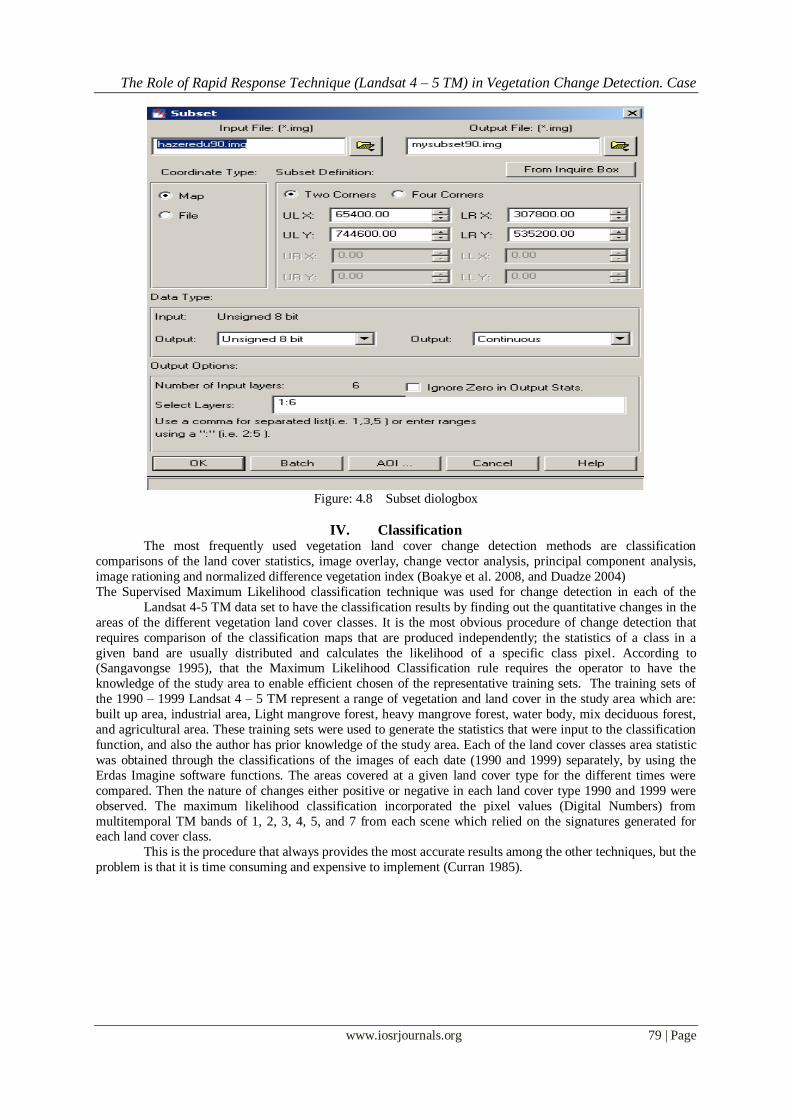
Figure: 4.8 Subset diologbox
IV. Classification The most frequently used vegetation land cover change detection methods are classification
comparisons of the land cover statistics, image overlay, change vector analysis, principal component analysis,
image rationing and normalized difference vegetation index (Boakye et al. 2008, and Duadze 2004)
The Supervised Maximum Likelihood classification technique was used for change detection in each of the
Landsat 4-5 TM data set to have the classification results by finding out the quantitative changes in the
areas of the different vegetation land cover classes. It is the most obvious procedure of change detection that
requires comparison of the classification maps that are produced independently; the statistics of a class in a
given band are usually distributed and calculates the likelihood of a specific class pixel. According to (Sangavongse 1995), that the Maximum Likelihood Classification rule requires the operator to have the
knowledge of the study area to enable efficient chosen of the representative training sets. The training sets of
the 1990 – 1999 Landsat 4 – 5 TM represent a range of vegetation and land cover in the study area which are:
built up area, industrial area, Light mangrove forest, heavy mangrove forest, water body, mix deciduous forest,
and agricultural area. These training sets were used to generate the statistics that were input to the classification
function, and also the author has prior knowledge of the study area. Each of the land cover classes area statistic
was obtained through the classifications of the images of each date (1990 and 1999) separately, by using the
Erdas Imagine software functions. The areas covered at a given land cover type for the different times were
compared. Then the nature of changes either positive or negative in each land cover type 1990 and 1999 were
observed. The maximum likelihood classification incorporated the pixel values (Digital Numbers) from
multitemporal TM bands of 1, 2, 3, 4, 5, and 7 from each scene which relied on the signatures generated for each land cover class.
This is the procedure that always provides the most accurate results among the other techniques, but the
problem is that it is time consuming and expensive to implement (Curran 1985).
The Role of Rapid Response Technique (Landsat 4 – 5 TM) in Vegetation Change Detection. Case
www.iosrjournals.org 80 | Page
Figure 4.9: 1990 Signature Editor showing the different vegetation land cover.
Figure 4.10: 1999 Signature Editor showing different vegetation land cover.
The Role of Rapid Response Technique (Landsat 4 – 5 TM) in Vegetation Change Detection. Case
www.iosrjournals.org 81 | Page
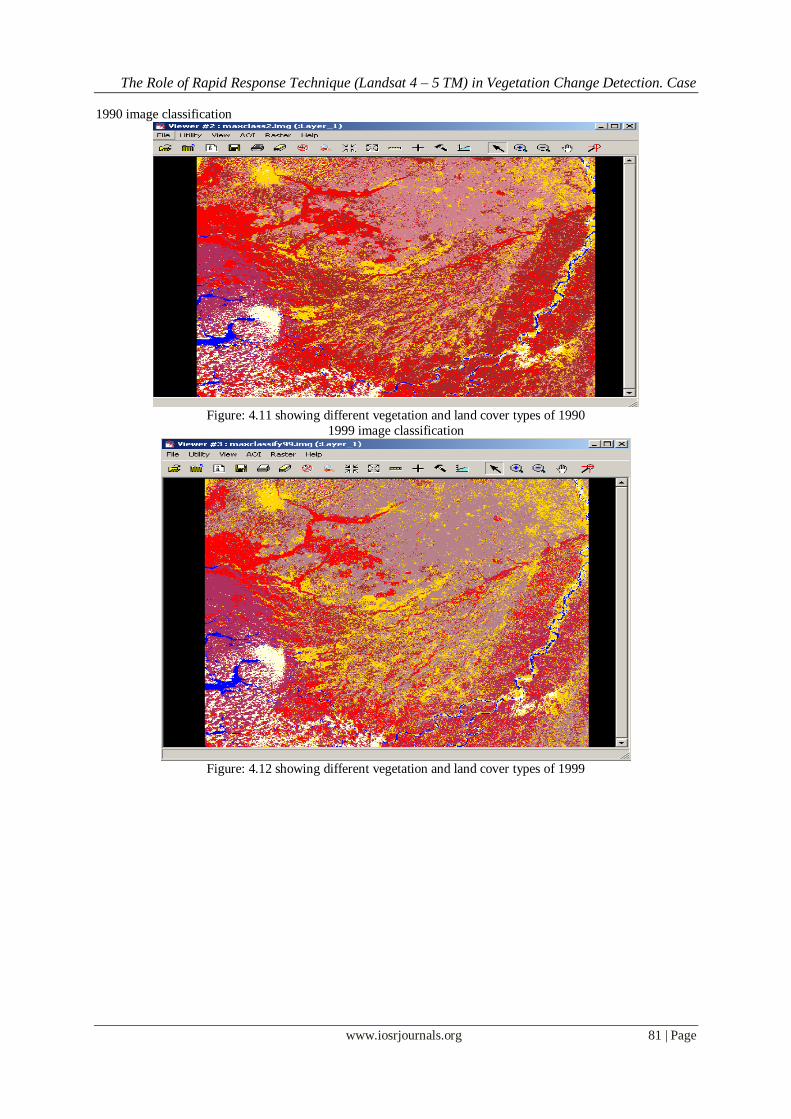
1990 image classification
Figure: 4.11 showing different vegetation and land cover types of 1990
1999 image classification
Figure: 4.12 showing different vegetation and land cover types of 1999
The Role of Rapid Response Technique (Landsat 4 – 5 TM) in Vegetation Change Detection. Case
www.iosrjournals.org 82 | Page
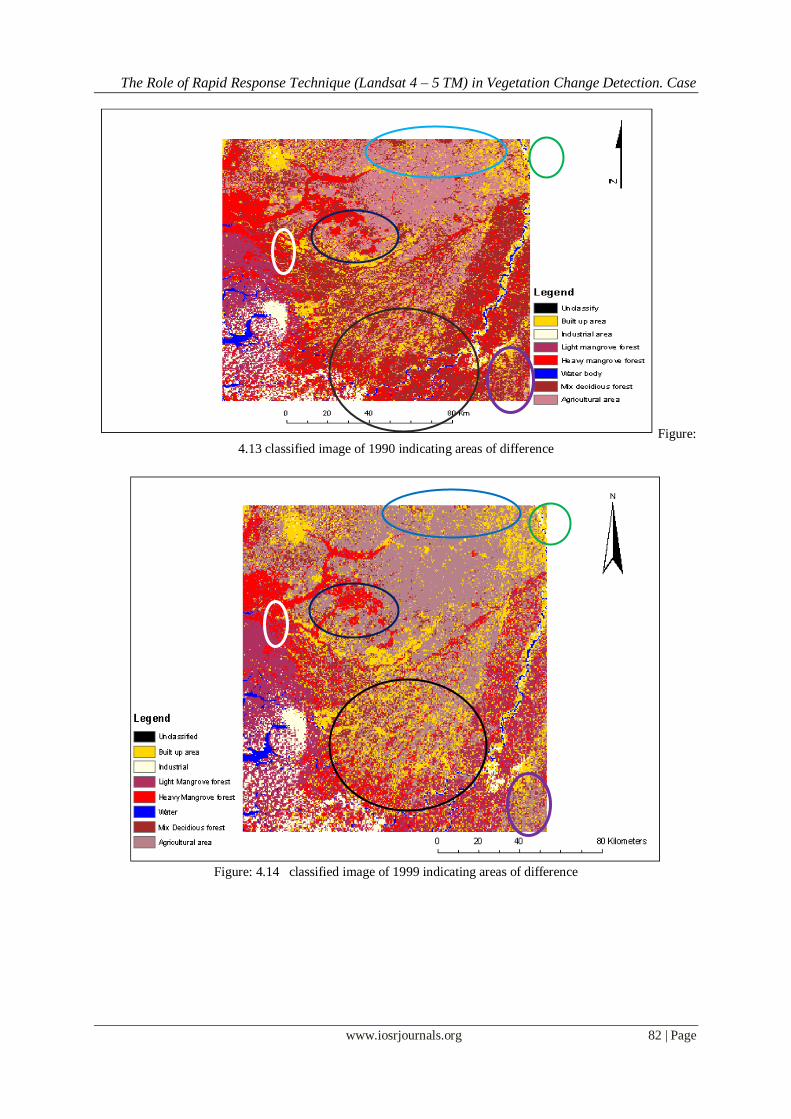
Figure: 4.13 classified image of 1990 indicating areas of difference
Figure: 4.14 classified image of 1999 indicating areas of difference

The Role of Rapid Response Technique (Landsat 4 – 5 TM) in Vegetation Change Detection. Case
www.iosrjournals.org 83 | Page
V. Ressults From the classified Landsat imageries of 1990 and 1999, the table 4.1 showed the changes in the spatial
extent of land covers after classification and table 4.2 showed the rate at which the changes where decreased and
increased. Four classes namely Industrial area, heavy mangrove forest, water body, and mix deciduous recorded
significant decrease. While three classes which are built up, light mangrove forest and agricultural area in the
other hand recorded significant increase during the study period. Industrial area depicted a decrease of -3427
hectares (-0.12%), heavy mangrove forest -102493 hectares (-4.46%), water body -520.4 hectares (-0.01%) and
mix deciduous forest with a significant decrease of -530789 hectares (-23.33%). The three other classes namely
built up showed an increase of 119991 hectares (5.38%), light mangrove forest with a significant increase of
294693 hectares (13.09%), and agricultural area 210616 hectares (9.46%).
This depletion of heavy mangrove forest and mix deciduous forest would amount to reduction of
natural cooling effects of evapotranspiration and shading of vegetation within the study area. Likewise the decrease in industrial area would result to loss of economic activities in the study area. Agricultural area
recorded an increase, this imply that there would be much food for the people, but if adequate measures are not
taken by appropriate authorities to control the rate of heavy mangrove forest and mix deciduous forest depletion.
The depletion rate will affect agricultural area and the subsequent result will amount to food reduction.
Figure 4.22 and figure 4.24 show the NDVI images of 1990 and 1999, bright areas indicate vegetative
areas, and tan areas depicted non vegetative areas. The areas with more bright colours indicate areas with more
vegetation or with more vegetative reflectance. From the NDVI images of 1990 and 1999 in the above mention
figures, the lower contrast of the bright colour areas is not quite distinguishable for visual analysis. Hence,
histogram equalizer contrast was applied to adjust the images contrast so as to have a uniform distribution of
intensities as shown in figure 4.22 and 4.24. From 4.22 and figure 4.26 images it would be easier to distinguish
areas with various degrees of vegetative reflectance from the highest to the lowest. Figure 4.23 and 4.25 show the thematic maps of NDVI vegetation reflectance which range from -1 –
0.667 in 1990, and -0.586 – 0.667 in 1999. The higher the green colour the higher the vegetation reflectance
vase versa. The values between -1 – -0.1652 indicate areas of no vegetation, while 0.166 – 0.667 indicate areas
with vegetation, based on the degree of vegetation reflectance.
Change of NDVI density during the period of 1990 – 1999 recorded increase from very high to very-
very low density exception of the very-very high density. The rate of decrease of the NDVI density is shown to
be higher than the total number of increase from very-high to very-very low density. The very-very high density
showed a decrease of 7.56%, while total increase from very high to very-very low was 7.55%. The low, very
low, and very-very low density are areas of no vegetation such as built up, industrial area, and water body. The
reduction of the very-very high density class which necessitated the increase of the other classes from very high
to very-very low is caused by human activities such as logging, clearing of land for farming, and increase in
population growth influencing the need to having new structures. The systematic surveys of the Niger Delta’s flora and fauna were carried out during the 1990s, the survey reviewed that the forest and animal populations are
under a great danger, the delta’s second most timber species abura (Hallea ledermannii) once common in the
area has been removed by extensive logging (Were 2001). Also pressure on the Niger Delta’s remaining forest
is due to increase in population and increase in infrastructure (Were 2001). The overcutting of the Niger Delta
forest by an increasing human population poses serious threats to the forest (Tognetti 2001).
In the image difference figure 4.29 and 4.30, it shows that there is a significant difference of vegetation
reduction most especially in the north-west area of the image and the area marked in yellow circle in the
thematic map. From the thematic map of NDVI change image showed in figure 4.30, one would observe that the
digital number (DN) value is -7 meaning a decrease in vegetation in 1999.
References [1]. Boakye, E. et al., (2008) Landsat Images for Assessment of the Impact of Land Use and Land Cover Changes on the Barekese
Catchment in Ghana: European Journal of Scientific Research. Vol. 22, No. 2, pp. 269 – 278. [Online]. Available from:
http://www.eurojournals.com/ejsr_22_2_12.pdf Accessed 31 August 2009.
[2]. Curran, P. J., (1985) Principal of Remote Sensing. London: Longman.
[3]. Duadze, S.E.K., (2004) Land-use and land cover study of the Savannah ecosystem in the Upper West region (Ghana) using remote
sensing: ZEF Bonn: University of Bonn, Germany FAO. [Online]. Available from: http//www.FAO.org Accessed 31st August
2009.
[4]. DIGIROLAMO, P. A., (2006) A Comparison Of Change Detection Methods In An Urban Environment Using Landsat TM and
ETM+ Satellite Imagery: A Multi-Temporal, Multi-Spectral Analysis of Gwinnett County, GA 1991-2000. [Online]. Available from:
http://etd.gsu.edu/theses/available/etd-07242006-110800/unrestricted/Digirolamo_Paul_A_200608_MA.pdf Accessed 14th August
2009.
[5]. Gayer, M., (2008) Advanced Methods for IDP and Refugee Camp Mapping with Very High Resolution Satellite Imagery. [Online]
Available from: http://www.freidok.uni-freiburg.de/volltexte/6333/pdf/Magisterarbeit_Martin_Gayer.pdf Accessed 28th August
2009.
[6]. Groeneveld, D. P., (2008) Remotely-sensed groundwater evapotranspiration from alkali scrub affected by declining water table:
Journal of Hydrology. Vol. 358, No. 2-3, pp. 294-303. [Online]. Available from:
http://www.sciencedirect.com/science?_ob=ArticleURL&_udi=B6V6C-4SRW18Y-
The Role of Rapid Response Technique (Landsat 4 – 5 TM) in Vegetation Change Detection. Case
www.iosrjournals.org 84 | Page
1&_user=10&_rdoc=1&_fmt=&_orig=search&_sort=d&_docanchor=&view=c&_searchStrId=978191429&_rerunOrigin=google&
_acct=C000050221&_version=1&_urlVersion=0&_userid=10&md5=7a2439fb741514589e0389337189f318 Accessed 12th August
2009.
[7]. Hayes, D.J., & Sader, S.A., (2001) Comparison of change-detection techniques for monitoring tropical forest clearing and
vegetation regrowth in a time series: Photogrammetric Engineering & Remote Sensing, vol. 67, no. 9, pp. 1067-1075. [Online].
Available from: http://cat.inist.fr/?aModele=afficheN&cpsidt=14062184 Accessed 8th
September 2009.
[8]. Lahaussois, J., (1997) XI WORLD FORESTRY CONGRESS: World Forestry Congress Coordinating Unit. Rome. FAO. [Online].
Available from: http://www.fao.org/docrep/W6127E/w6127e0r.htm#TopOfPage Accessed 20th September 2009.
[9]. Omo-Irabor, O. O. and Oduyenu K., (2006) A HYBRID IMAGE CLASSIFICATION APPROACH FOR THE SYSTEMATIC
ANALYSIS OF LAND COVER (LC) CHANGES IN THE NIGER DELTA REGION: A comparative study of classification
methods for monitoring land use/land cover (LULC) changes using remote sensing technology and GIS techniques. In: Proceedings
of the 6th
International Conference on Earth Observation & Geoinformation Sciences in Support of Africa’s Development. Cairo,
Egypt. [Online]. Available from: http://www.scribd.com/doc/6571415/A-Hybrid-Image-Classification-Approach-for-the-
Systematic-Analysis-of-Land-Cover-Lc-Changes-in-The Accessed 2nd August 2009.
[10]. Sangavongse, S., (1995) Land Use/Land Cover Change Detection in the Chiang Mai Area using Landsat TM: GISdevelopment.net.
[Online] Available from: http://www.gisdevelopment.net/aars/acrs/1995/ps4/ps4009.asp Accessed 29th August 2009.
[11]. Tognetti, S., (2001) Central African mangroves (AT1401): WildWord Full Report. [Online]. Available from:
http://www.worldwildlife.org/wildworld/profiles/terrestrial/at/at1401_full.html Accessed 19th September 2009.
[12]. Were, J. L. R., (2001) Niger Delta swamp forests (AT0122): World Wildlife Fund Report. [Online]. Available from:
http://www.worldwildlife.org/wildworld/profiles/terrestrial/at/at0122_full.html Accessed 10th August 2009.
Top Related
Copyright © 2022 FDOKUMEN

