


Bahasa
Halaman
Hukum


The Role of Information and Mobilization for
Redistributive Preferences:
A Survey Experiment in South Africa
Miquel Pellicer, Patrizio Piraino, and Eva Wegner∗
GIGA Hamburg and SALDRU, University of Cape Town†
First Draft
June 14, 2014
Abstract
This paper presents a survey experiment in South Africa that focuseson the role of mobilization for demand for redistribution. Previous liter-ature has found that providing information on inequality raises concernsabout inequality but does not lead to a change in tax preferences. We ar-gue that mobilization might provide the missing link between informationand political behavior regarding demand for redistribution. We opera-tionalize mobilization from an individual perspective as the belief thata decrease in inequality is a feasible enterprise. If this belief is absent,information about inequality might simply increase the pessimism of re-spondents and remain inconsequential for policy preferences. We test thisidea with a survey experiment in two townships in Cape Town, which in-cludes three treatments. The first treatment gives simply information onlocal inequality. The second treatment provides information on inequal-ity in comparative perspective, including information on the (much lowerinequality) in neighboring countries. The third is elite support for redis-tribution with video messages of South African leaders about the need tofight inequality. Consistent with previous literature, we find that informa-tion on local inequality increases concern for inequality but has no effectson tax preferences. Information on inequality in comparative perspectiveand the videos shake the belief that a decrease in inequality is feasibleand consequently lead to a change in tax preferences. While the mecha-nism regarding information on inequality in comparative perspective is as
∗Corresponding Author: [email protected]†We would like to acknowledge the funding of the EU’s Seventh Framework Programme
through the “NOPOOR - Enhancing knowledge for renewed policies against poverty” project.We would also like to thank Jan Schenk for his feedback on our questionnaire and treatmentdesign throughout this project and for the diligent work of his survey company ikapadata.
1
expected, the one for the videos is puzzling: videos make people believethat inequality is more, instead of less, inevitable, and this leads to lowertax preferences. We conjecture that this is due to a lack of credibility ofthe leaders considered which makes viewers more pessimistic and has ademobilizing effect.
1 Introduction
There is increasing concern with the rising income inequality observed duringrecent decades in many countries of the world. This concern has not been fol-lowed however by increasing levels of progressive redistribution. This is puzzlingbecause the standard framework for thinking about redistribution would suggestthat increasing inequality should lead to higher demand for redistribution and,ultimately, to more observed redistribution (Meltzer and Richard, 1981). In fact,this puzzle applies more generally, to comparisons between countries as much asto trends over time.
In response to these observations, a large literature has emerged trying torefine our understanding of how levels of redistribution are determined. Animportant part of that literature has focused on the demand side: on how pref-erences for redistribution are formed. In a recent review article, Alesina andGiuliano (2009) survey several models and theoretical arguments from this liter-ature. Starting with seminal contributions such as the role of expected upwardmobility (Benabou and Ok, 2001), the authors emphasize factors such as: per-ceptions on the fairness of the income distribution, political indoctrination, andperceptions regarding negative externalities of inequality, among others.
From an empirical point of view, the attempts to uncover the role of such fac-tors have been largely observational (for example Alesina and Ferrara (2005)).Acknowledging the difficulty to interpret these estimates causally, a strand ofstudies has emerged that provides experimental evidence bad on survey exper-iments. Survey experiments are particularly well suited to answer causal ques-tions about the role of information and perceptions. Thus, such experimentshave studied empirically the role of providing different types of information andpriming towards different types of perceptions on demand for redistribution andrelated social policy preferences. The type of information provided in theseexperiments include the true position of households in the income distribution(Cruces et al., 2013) and the demographic characteristics of welfare recipients(Kuklinski et al., 2000); the type of framing/priming concerns importantly theway taxes are presented to respondents (McCaffery and Baron, 2006) (McCafferyand Baron, 2004).
In an important recent contribution, Kuziemko et al. (2013) study the role ofproviding information on the income distribution for demand for redistributionin the US. Using a series of survey experiments the authors find that providinginformation on the increase in US inequality leads respondents to consider in-equality as a more serious problem. However, this change in perception does not
2
carry over to actual tax policy preferences.1 This holds true despite the fact thatthe information they provide includes evidence suggesting that inequality is notharmful for growth.
This paper presents a survey experiment on demand for redistribution inSouth Africa focusing on a factor so far disregarded by the literature on demandfor redistribution: the importance of mobilization. This concept is central in theliterature on sociology and social psychology of collective action which highlightthe fact that knowing about the extent of inequality or even being concerned byit is not enough to drive political behaviour: Individuals need to be mobilized.We operationalize the concept of “being mobilized” as the belief that a decreasein inequality is a feasible enterprise. This corresponds to the idea of “group effi-cacy” from the social psychology literature on collective action (see Tajfel (1974),Klandermans (1984) and Van Zomeren et al. (2008)).2 Mobilization in generaland beliefs regarding the inevitability of inequality in particular may provide ananswer to the puzzle from Kuziemko et al. (2013) that providing informationon inequality raises concerns about it, but does not lead to changes in tax pref-erences. We argue and test the idea that the missing link between informationand stated tax preferences is precisely the belief in the inevitability of inequality.If this belief is present, information about inequality might simply increase thepessimism of respondents and remain inconsequential for policy preferences.
Individuals might hold the belief that high inequality is inevitable particularlyin places where inequality and redistribution are not prominent in elite discourse,thus making it appear that there is no possibility of reducing it (see Bidneret al. (2013) for a model that could justify such mechanism). This channelpoints to the importance of (credible) leadership discourse for understandingchanges in preferences for redistribution and can thus help explain why increasesin inequality might not be accompanied by higher demand for redistribution.The importance of mobilization for demand for redistribution can also addressan additional puzzle in the context of South Africa: while having one of thelargest levels of inequality in the world, South Africa displays only average levelsof demand for redistribution. We argue this can be due to the shift in elitediscourse from a primarily redistributive one at the beginning of the transitionto one mainly focused on jobs and growth subsequently.
We present the results of a survey experiment conducted in two differenttownships in Cape Town: Khayelithsa, a ‘Black African” township, and Delft,a “Coloured” township. Black African and Coloured groups in Cape Town dif-fer on average in many respects and this is reflected in our two samples. TheKhayelithsa sample is poorer, more likely to live in informal settlements, andmore likely to feel politically close to the ANC, the party ruling South Africa
1The only tax preference that is affected concerns the estate tax, that apparently onlyaffects about affects the top one thousandth richest families
2Two types of mechanism could push such individuals to state low preferences for redistri-bution. First, the need to avoid cognitive dissonance can lead them to justify their inactionwith low stated preferences for redistribution (see Mullainathan et al.(2009)). Second, theemotional cost of perceiving the high inequality as inevitable may push individuals to justifyit as legitimate and thus demanding a lower tax (see Major et al. (2001)).
3

since the democratic transition with an overwhelming African Black base. Thefull study consists on two waves. The first wave, of 1,390 respondents was inter-viewed in March and April 2014 – just before the South African general elections.A second wave is planned for fall 2014. This will allow us to examine whether oursurvey yields different results in an environment with high political mobilization(i.e. pre-election) and one without.
Our survey includes three treatments. One treatment shows information onlocal inequality: differences in income and asset ownership between differentneighborhoods in Cape Town. This treatment is meant to capture the effectof local information on redistribution preferences in a way roughly comparableto Kuziemko et al. (2013). Our second and third treatments attempt to influ-ence the belief that a decrease in inequality is feasible in two ways. The firstis information on inequality in comparative perspective, including informationon neighboring countries. Through this treatment, we attempt to increase re-spondents’ perception that very high inequality is not a fact of life. The secondtreatment in this vein is elite support for redistribution with video messages ofSouth African leaders about the need to fight inequality. With this, we are at-tempting to counteract the dominant economic discourse in South Africa sincethe late 1990s which has emphasized growth, fiscal discipline, and employmentinstead of inequality and redistribution.
An important novelty of our survey is that it offers a real action component.Whereas some extant studies ask about impact on vote choice, or intention tosend a petition, our survey offers respondents the possibility to act on the spot,by signing a petition or by sending an sms to their ward councilor - at their owncost.
Our findings corroborate those of Kuziemko et al. (2013) regarding the roleof local information. We find that local information on inequality increases thechances of viewing it as a serious problem but has no effects on tax preferencesor support for redistributive policies. This evidence, emerging as it does in avastly different setting from the one in Kuziemko et al. (2013), provides strongsupport for the external validity of their findings.
The two treatments seeking to shake the belief that a decrease in inequalityis feasible do show large impacts on tax preferences, in the two townships. The“international inequality” treatment has the expected effects: a large negativeeffect on believing that the high level of inequality in South Africa is inevitable,leading to an increase in support for top taxes and for the introduction of a basicincome grant. In Khayelitsha, it also increases the willingness to take action. Thevideo messages with elite support for inequality have, in contrast, the oppositeeffect. They increase the perception that inequality is inevitable, and decreasesupport for top taxes as well as the willingness to take action.
The fact that tax preferences follow perceptions of inequality inevitability inthe expected direction in the two treatments and that this applies to the twotownships is quite strong evidence in favor of the relevance of the factor wepropose. The fact that elite discourse shows such as strong negative effect on theperceptions of individuals in the two townships is however puzzling. We might
4

have expected this to occur in Delft, where voters might feel distant from theleaders selected, but it was not expected for Khayelitsha. We conjecture thatthis is due to a lack of source credibility (Druckman, 2001) the size of which wehad somewhat underestimated. The divergence between policies and personallifestyle of certain South African leaders over the last decade on the one hand,and the messages shown in our experiment on the other, might have been toolarge for it to have the intended effect. Instead, it appears to have increased thepessimism of respondents.
The paper is organized as follows. Section 2 gives a short background ofinequality and redistribution in South Africa. Section 3 describes the survey andits design. Section 4 presents the data and descriptive statistics. Section 5 showsthe results and section 6 concludes.
2 Inequality and Demand for Redistribution in
South Africa
South Africa is one of the most unequal countries in the world. According tostandard political economy models (Meltzer and Richard, 1981) this would leadto very high levels of redistribution. As the origins of present-day inequality liein a colonial history and Apartheid institutional arrangements where a whiteminority enriched itself by denying political and economic rights to a black ma-jority, one might expect redistribution to be even higher since the democratictransition. However, fiscal redistribution is only slightly above the low LatinAmerican levels (Leibbrandt et al., 2011).3
The African National Congress (ANC) that came to power after the end ofApartheid and has governed with large majorities since made a strong emphasison redistributive justice only initially. In 1994, it was elected on a redistributionpromise in form of the reconstruction and development programme (RDP) (Nat-trass and Seekings, 2001). However, already in 1996, the government presenteda new economic policy strategy, ”Growth, Employment, and Redistribution”(GEAR). Its main emphasis – and the dominant economic policy discourse sinceits inception – is growth and employment. In contrast, the GEAR strategy docu-ment paid only scant attention to RDP issues and education, health and welfarepolicies (Michie and Padayachee, 1998). Both in practice and in discourse, theSouth African leadership has very strongly focused on employment generationinstead of redistribution. Only since 2013, there has been a growing discussionin the ANC leadership regarding the need for a “second” transition”, implyingthat the transition in 1994 had indeed been a political transition only. Thischange of mind is probably partly due to the emergence of the “Economic Free-dom Fighters”, a new party founded by Julius Malema, a former leader of the
3Leibbrandt et al. 2011 find that taxes and transfers decreased the Gini coefficient only byaround five points, which is only slightly better than redistribution in Latin America, wherethe average is a decrease of 2 percentage points for Argentina, Brazil, Chile, Columbia, andMexico (Goi et al., 2011). In contrast, in Europe the figure is close to 20 (ibid.).
5
ANC’s Youth League, that seeks to mobilize the large numbers of unemployedyouth. This party’s discourse questions strongly the post-Apartheid economicpolicies and demands the nationalization of mines and the redistribution of landwithout compensation.
Most of the ANC’s social policies have focused on the rolling out social grants,such as the pension fund and the child support grant, on which an increasingnumber of the population depends to make ends meet. While these have hadan effect on poverty, the income distribution remained largely unaffected (Leib-brandt et al., 2010) and continues to follow the Apartheid pattern with the whitepopulation still being predominantly in the top decile, followed by the Indians,the Coloureds, and the African blacks being at the bottom.4
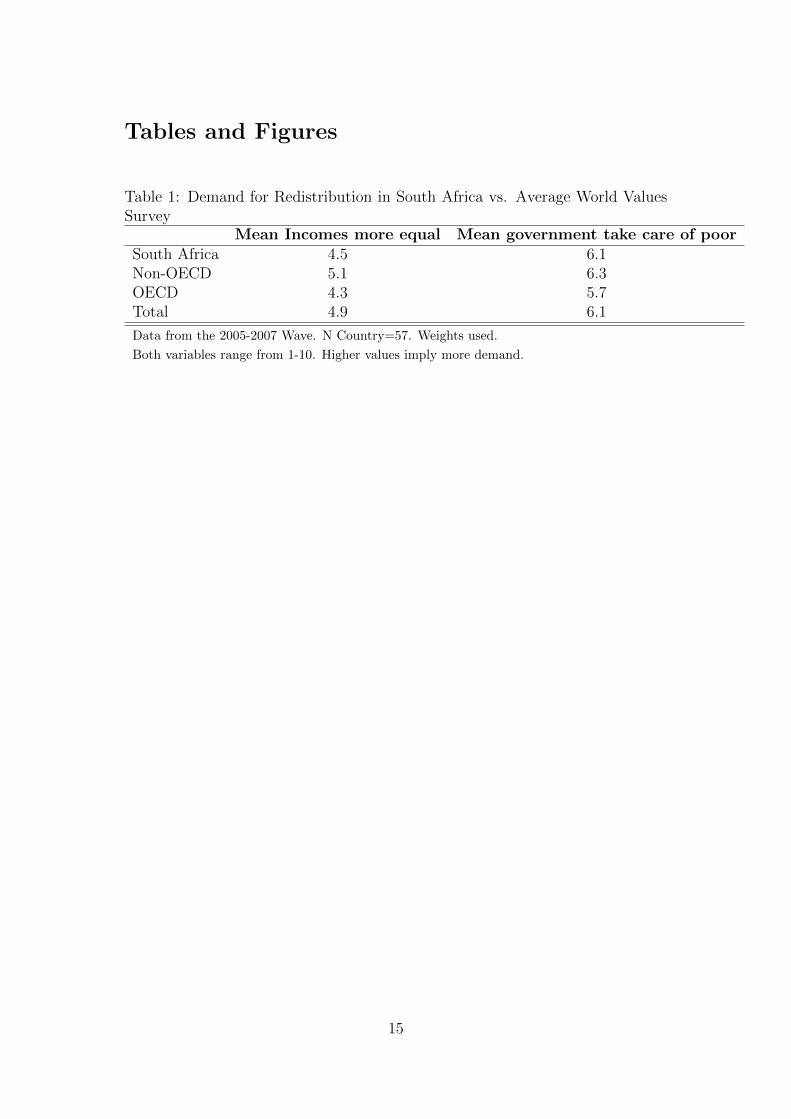
Against this background, it is surprising that South Africans do not havehigher levels of demand for redistribution, according to standard surveys. In-specting two variables from the 2007 World Value Survey, that are typically usedin cross country studies on demand for redistribution reveals that South Africandemand is generally average and in fact smaller than in other non-OECD coun-tries (see table1). Although an increasing number of service delivery protestsas well as generally low levels of trust suggest dissatisfaction with governmentperformance, this has not transformed in an increase in demand for redistribu-tion. This mixed picture was also confirmed in focus group discussions that werecarried out by the authors in June and October 2012 in preparation of this study.Although respondents were generally disappointed by the small economic returnsof the democratic transition, they generally demanded jobs from the government,not redistribution through social policies.
[Table 1 around here]
3 The Survey
3.1 Data Collection
The data presented in this paper consists of 1,390 respondents that were inter-viewed in March and April 2014 – just before the South African general electionsat the beginning of May. The sample consists of residents of two different town-ships in Cape Town: 956 African Blacks in Khayelitsha and 434 Coloureds inDelft. Both are poor townships with high levels of unemployment and low in-come. The Coloured parts of Delft are a bit better off than Khayelitsha butmuch worse off than the rich white parts of Cape Town. We used an Englishquestionnaire as basis that was translated in Xhosa and Afrikaans, a back trans-lation was done with the feedback of the fieldworkers. Respondents could choosethe questionnaire language at the beginning of the interview.5
4The key change in the income distribution since the end of Apartheid is the growingintragroup inequality.
5The surveyors’ population group corresponded to that one of the respective interviewees.The data was collected by a survey company, the authors provided training for the fieldworkers.
6

The data was captured on mobile devices and directly transmitted to theserver after the completion of the interview together with the gps location. Thisallowed for an immediate check of the accuracy of the interview location andfor the monitoring of data quality. Data quality was monitored throughout thesurvey by the survey company and the investigators who had access to the dataas it was coming in. About half way through the survey, we adapted the designto allow for a higher incidence of the international treatment alone. This changewill be controlled for in each of the OLS regressions below.
3.2 Treatments
The survey was designed to test different drivers of demand for redistributionthrough three types of treatment. A first type concerns information about in-equality, a second is a hybrid between information and mobilization, and a thirdis elite mobilization against inequality. (An overview of the survey design ispresented in figure 1 below.)
[Figure 1 around here]
The first set of treatments (“local”) presents information on inequality inSouth Africa in a variety of ways We focus on differences between neighborhoodsin Cape Town, that local residents automatically - and correctly - associate withdifferent population groups. This is so because of the Apartheid laws that as-signed population groups (“races”) specific areas of residence. Although theselaws were abolished in the early 1990s, income constraints have left the homo-geneity of neighborhoods induced by the Apartheid laws almost intact in mostareas.
In a first step, participants were asked to guess the median income in atypically white neighborhood of Cape Town. Subsequently, they were shownthe correct figure in comparison to typically Coloured areas such as Athloneand typically African areas such as Gugulethu. In a second step, differences inownership of assets in these neighborhoods were displayed. The objective was toinform participants about the high levels of inequality between neighborhoodsthat they associate with their own group vs. others. (See 2 for an example ofthis treatment).
[Figure 2 around here]
The second treatment “international” presents inequality in South Africa incomparison to other countries. It shows the rich-poor ratio in South Africa,as well as in some other developing and Western countries. Importantly, it in-cludes some neighboring countries of South Africa and shows that South Africa’srich:poor ratio is by far the worst among the countries presented. The treatmentis constructed so that respondents first see the rich:poor ratio in different coun-tries and then are asked to guess the figure for South Africa. The last screenshows them the correct bar for South Africa among the other countries as shownin figure 3. The treatment thus has two components. The first is informationabout inequality in South Africa, this time in international perspective. The
7

second component intents to suggest to respondents that South Africa’s level ofinequality is not a fact of life given that it is much lower in other countries.
[Figure 3 around here]
The third type of treatments “video” is elite support for redistribution. Weoperationalize this in form of three video speeches by members of the SouthAfrican elite, one by South Africa’s president Jacob Zuma, one by archbishopDesmond Tutu, and a third by the above mentioned Julius Malema.6 Thesespeeches are quite different in content and level of involvement of the speaker:Desmond Tutu condemns the gap between rich and poor in moral terms in an en-gaged way, Jacob Zuma is reading from a script that announces the government’sintention to decrease inequality, whereas Julius Malema aggressively speaks upagainst inequality mostly in racial terms and promises a variety of redistribu-tive policies. These speeches are intended influence respondents’ perceptions ofthe possibility of collective action for decreasing inequality. Importantly, thesespeeches are given in addition to either the “international” treatment or different“local” treatments.
4 Data
4.1 Descriptive Statistics
Table 2 shows some key descriptive statistics for the Delft and Khayelitsha samplecompared to the data from the 2011 population census, where available. Thesurvey’s aim was not to be fully representative of these two townships as weare not interested in them per se. However, we did want to avoid obtaining anoverly peculiar sample. In particular, we did want to include both formal andinformal dwellers. Our sampling strategy consisted of drawing randomly a setof Enumeration Areas, stratified by formality (EAs have around 200 householdeach) and then let fieldworkers choose every 12th house in a random walk in theEA.
[Table 2 around here]The key difference of our samples compared to the census is that we have more
women. This has to do with the fact that male are more likely to be employedand absent from the dwelling during daytime. Although we asked fieldworkersto schedule appointments with the potentially absent person selected for theinterview, we only asked them to return to the house prior to sunset, for securityreasons. To improve the sex ratio in our survey, we instructed fieldworkers to doas many interviews as possible during the weekends but this was only partiallypossible because alcohol abuse is a common problem in townships in the weekend.Given this, we are generally satisfied with the gender ratio. In Khayelitsha, thegender ratio carried over to having fewer employed persons that in the censusalthough this could also be the result of asking the question in a different way.
6The videos were available either in English or in dubbed Xhosa/Africaans versions to theparticipants.
8

The share of formal housing in perfectly in line with the census data and so ismedian income additionally increases our confidence in the data. The level ofhigh school graduates (“matric”) is roughly in line with census data.
There are some notable differences in our sample between Khayelitsha andDelft in terms of employment status, mean income, formal housing and the recep-tion of government grants. This is mainly the legacy of the Apartheid regime thatinvested slightly more in Coloured areas than in African areas. Although bothgroups were politically excluded and had no freedom of movement, Colouredshad some small privileges compared to Africans. In the post-Apartheid world,these carry over to better housing, employment and income. In this context, itis noteworthy that Delft is a relatively bad-off Coloured Area.
4.2 Outcome Variables
Table 3 shows the descriptive statistics of our outcomes variables for the controlgroup.. The first outcome variable of interest is a question about whether in-equality is a serious problem in South Africa, emulating the surveys in Kuziemkoet al. (2013).7 The second is whether the high level of inequality in South Africais inevitable. Third, we have two outcome questions about redistributive prefer-ences, one about the increase of the top marginal tax rate, and the second aboutthe introduction of a basic income grant in South Africa.8
The fourth type of outcomes are “action” outcomes where respondents cantransmit their redistributive preferences to politicians. Compared to other surveyexperiments, we believe that this is an important innovation of our survey. Atbest, other survey experiments ask whether respondents would be willing to takeaction but to the best of our knowledge have never followed up on this. In oursuvey, respondents can choose between sending an sms to their ward councillor(at a real cost) and signing an online petition on the surveyor’s tablet. In thepetition and sms they can express their opinion on tax increases and the basicincome grant.
[Table 3 around here.]
All variables are coded as binary variables so the values in table 3 are theshares in the two samples favouring a certain position/action. There are somenoticeable results in general as well as regarding differences between the groups.The first is the very high share in both groups agreeing with the statement thatinequality is a serious problem in South Africa. This contrasts sharply with thelow shares in the control group that would want to increase taxes for the rich.Support for the basic income grant is higher in comparison. This is generallyin line with the elite discourse in South Africa, where social grants have large
7The question is identical to that Kuziemko et al. survey with one exception: because ourpilots showed that respondents seem to confuse inequality with equality we replaced the wordwith “gap between rich and poor” throughout the survey.
8A discussion about the introduction of a basic income grant has been going on for yearsin South Africa, whereas there is no public debate about raising taxes for top earners Noticethat this latter group starts with around 60000 Zar per month
9
place in elite discourse but increasing taxes has not. Noteworthy is also thelarge amount of respondents willing to take action, especially through signing apetition. In general, demand for redistribution, willingness to take action, andconcern about inequality is higher in Delft than in Khayelitsha in the controlgroup.
4.3 Randomization
Tables 4 and 5 show the demographic characteristics and some pre-treatmentattitudinal variables in Khaylitsha and Delft by treatment arm. Each columncorresponds to a regression of the respective variable as outcome on the fourtreatments: local, loca+video, international, international+video. These and allregressions below are performed using OLS with robust standard errors; sinceoutcomes are binary this implies we use a linear probability model framework.
Because of the randomization, there should not be any significant differencesbetween the respondents in the various treatment groups and the control. Thisis generally correct but there are some relevant outliers. In Khayelitsha, respon-dents receiving the local and international treatments were slightly older thanthe control, There is also a relatively large difference in formal housing betweenthe international and the international treatment group, where the internationalgroup was less likely to live in formal housing than the control and the interna-tional video group more likely. In Delft, the only noteworthy difference is thatthe international video group had more males than the control.
With the exception of the differences in formal housing in Khayelitsha, therandomization looks generally fine but we will nevertheless control for demo-graphic characteristics and the attitudinal variables shown in tables 4 and 5when analysing our data below.
[Tables 4 and 5 around here]
5 Results
We will first look at the effects of our treatments in the full sample, shown intable 6, starting with the “local” treatment.9 As explained above this treatmentgave respondents information about the extent of income inequality in CapeTown. Consistent with the findings in (Kuziemko et al., 2013), informationabout inequality affects whether respondents see inequality as a problem buthas no bearing on their tax preferences (toptaxincrease) or other redistributivepolicies, such as the introduction of a basic income grant in South Africa (big).Confirming this finding in South Africa – a completely different context – suggeststhat this is a more general relationship. In our survey, information increases theshare of respondents viewing inequality as a problem by 5 per cent, a sizableeffect if one considers that already 87 per cent in the control group are of thisopinion.
9The results tables without controls are shown in the Appendix. All the core results hold.
10
We now inspect the effect of the two treatments supposed to affect whetherrespondents view inequality change as likely: The “international” treatment andthe video messages. Treatment variables are coded so that coeffficients for thevideo variables are to be interpreted as the effect of the video in addition to thatof the respective information on its own, which is in turn given by the coefficientof the information variables.
The international treatment alone has indeed a strong negative effect onbelieving that inequality in South Africa is inevitable. It also affects respondents’preferences for redistribution strongly, making them more likely to support anincrease in taxes for the rich and the introduction of a basic income grant.
The video messages have no effect or a positive effect on inevitability per-ceptions. In particular, watching one of the videos after the being providedwith local information has no effect, whereas watching a video after the “inter-national” treatment makes people pessimistic about the persistence of incomeinequality, i.e. they are more likely to think that inequality is inevitable. In fact,the size of the coefficients are such that the video essentially undoes the effect ofthe international information.
Importantly, the shock to inevitability perceptions carries over to tax pref-erences: Watching the video after the international treatment leads people bepessimistic and demand less redistribution. Watching the video after the localinformation treatment has no effect neither on inevitability nor on tax prefer-ences.
Tables 7 and 8 carry the analysis separately for the Khayelitsha and the Delftsample. Remarkably, all our main results are present in both samples.
The strong discouraging effect of the videos on the feasibility of inequalitychange was not expected. While we anticipated no or even a negative effect forDelft, where political preferences are generally against the leaders shown in thevideos, we expected a positive effect for Khayelitsha. We suspect that this is theeffect of credibility issues of the leaders shown in the video messages. Both JacobZuma and Julius Malema have been involved in corruption scandals and areknow for their lavish lifestyle and respondents appear to be unwilling to believetheir calls for redistribution. Interestingly, this happens only after receiving theinternational treatment before. A possible explanation is that whereas the localtreatment does not raise respondents’ hopes, the international treatment does.Seeing their (discredited) leaders talk about inequality only confirms reality tothe local treatment group, whereas it angers the international group (that hasjust seen that things are much better even in neighboring countries).
Finally, we move to the last type of outcomes, the “action” outcome. Consis-tent with the findings above, the local treatment has no action effects, whereasthe international increases the propensity to take action and the videos decreasethem. In the Khaylithsa sample (see table 7) the coefficients become significant.This is consistent with an interpretation that the international treatment oper-ates as a mobilizing force: as respondents see inequality as less inevitable, theyadapt their tax preferences and are willing to take action in favour of redistribu-tion.
11

6 Concluding Remarks
To be completed.
12
References
A. F. Alesina and P. Giuliano. Preferences for redistribution. Technical report,National Bureau of Economic Research Cambridge, Mass., USA, 2009.
Alberto Alesina and Eliana La Ferrara. Preferences for redistribution in the landof opportunities. Journal of Public Economics, 89(5-6):897–931, 2005.
R. Benabou and E. Ok. Social mobility and the demand for redistribution: Thepoum hypothesis. The Quarterly Journal of Economics, 116(2):447–487, 2001.
Chris Bidner and Patrick Francois. The emergence of political accountability*.The Quarterly Journal of Economics, 128(3):1397–1448, 2013. 00000.
Guillermo Cruces, Ricardo Perez-Truglia, and Martin Tetaz. Biased perceptionsof income distribution and preferences for redistribution: Evidence from asurvey experiment. Journal of Public Economics, 98:100–112, 2013. 00036.
James N. Druckman. On the limits of framing effects: who can frame? Journalof Politics, 63(4):1041–1066, 2001. 00632.
Edwin Goi, J. Humberto Lpez, and Luis Servn. Fiscal redistribution and incomeinequality in latin america. World Development, 39(9):1558–1569, 2011. 00042.
Bert Klandermans. Mobilization and participation: Social-psychological expan-sisons of resource mobilization theory. American sociological review, pages583–600, 1984. 00894.
James H. Kuklinski, Paul J. Quirk, Jennifer Jerit, David Schwieder, andRobert F. Rich. Misinformation and the currency of democratic citizenship.Journal of Politics, 62(3):790–816, 2000. 00277.
Ilyana Kuziemko, Michael I. Norton, Emmanuel Saez, and Stefanie Stantcheva.How elastic are preferences for redistribution? evidence from randomized sur-vey experiments. Technical report, National Bureau of Economic Research,2013.
Murray Leibbrandt, Eva Wegner, and Arden Finn. The policies for reducingincome inequality and poverty in south africa. 2011. 00005.
Murray V. Leibbrandt, Ingrid Woolard, Arden Finn, and Jonathan Argent.Trends in South African income distribution and poverty since the fall ofapartheid. OECD Paris, 2010. 00178.
Brenda Major and Toni Schmader. Legitimacy and the construal of social dis-advantage. The psychology of legitimacy: Emerging perspectives on ideology,justice, and intergroup relations, pages 176–204, 2001. 00079.
13

Edward J. McCaffery and Jonathan Baron. Framing and taxation: Evaluation oftax policies involving household composition. Journal of Economic Psychology,25(6):679–705, 2004. 00068.
Edward J. McCaffery and Jonathan Baron. Thinking about tax. Psychology,Public Policy, and Law, 12(1):106, 2006. 00074.
Allan H. Meltzer and Scott F. Richard. A rational theory of the size of govern-ment. Journal of Political Economy, 89(6):914–927, 1981. 02829.
Jonathan Michie and Vishnu Padayachee. Three years after apartheid: growth,employment and redistribution? Cambridge Journal of Economics, 22(5):623–636, 1998. 00062.
Sendhil Mullainathan and Ebonya Washington. Sticking with your vote: Cogni-tive dissonance and political attitudes. American Economic Journal: AppliedEconomics, 1(1):86–111, 2009. 00000.
Nicoli Nattrass and Jeremy Seekings. Democracy and distribution in highly un-equal economies: the case of south africa. Journal of Modern African Studies,39(3):471–498, 2001. 00081.
Henri Tajfel. Social identity and intergroup behaviour. Social Science Informa-tion/sur les sciences sociales, 1974. 01481.
Martijn Van Zomeren, Tom Postmes, and Russell Spears. Toward an integrativesocial identity model of collective action: a quantitative research synthesis ofthree socio-psychological perspectives. Psychological bulletin, 134(4):504, 2008.00311.
14
Tables and Figures
Table 1: Demand for Redistribution in South Africa vs. Average World ValuesSurvey
Mean Incomes more equal Mean government take care of poorSouth Africa 4.5 6.1Non-OECD 5.1 6.3OECD 4.3 5.7Total 4.9 6.1
Data from the 2005-2007 Wave. N Country=57. Weights used.
Both variables range from 1-10. Higher values imply more demand.
15

Table 2: Mean Demographic Characteristics, by area
area female employed age householdincome
matric formalhousing
governmentgrants
sample Khayelitsha 0.62 0.29 36.63 2,301 0.28 0.45 0.42census 2011 Khayelitsha 0.51 0.40 NA 1,706* 0.35 0.45 NA
Delft 0.64 0.42 40.31 2,584 0.22 0.85 0.33census 2011 Delft 0.51 0.38 NA * 0.19 0.85 NA* This is median instead of mean income. Median income is 1750 ZAR in the Khaylitsha sample and and 2500 ZAR in Delft
16

Table 3: Outcome Variables in Control Group, by area
area InequalityProblem
InequalityInevitable
Top taxIncrease
B. IncomeGrant
Action SMS sent Petition
Khayelitsha 0.85 0.57 0.21 0.52 0.44 0.11 0.57Delft 0.93 0.44 0.36 0.72 0.69 0.18 0.83Total 0.87 0.53 0.26 0.59 0.53 0.13 0.66
17

Table 4: Randomization Check Khayelitsha
(1) (2) (3) (4) (5) (6) (7) (8) (9) (10)age fem earn hhincome grants receive matric formal corrupt workvsluck lazyvsunfair
local 3.741∗∗∗ 0.0215 0.00343 -7.164 -0.00157 -0.000337 0.00751 0.0615 -0.666∗∗∗ -0.310(1.23) (0.04) (0.04) (220.61) (0.04) (0.04) (0.04) (0.09) (0.25) (0.23)
international 3.841∗∗ 0.0652 -0.0124 -24.44 0.0558 -0.0306 -0.157∗∗∗ 0.200 -0.533 0.107(1.84) (0.06) (0.06) (266.41) (0.06) (0.06) (0.06) (0.13) (0.33) (0.30)
videolocal -0.831 -0.000225 0.0390 299.8 0.00549 0.0248 -0.0298 -0.0388 0.190 0.360(1.29) (0.04) (0.04) (224.25) (0.04) (0.04) (0.04) (0.09) (0.24) (0.23)
videointernational -1.040 -0.135∗ 0.0632 561.6 0.00389 0.00975 0.226∗∗∗ -0.147 0.210 -0.523(2.11) (0.07) (0.07) (351.73) (0.07) (0.07) (0.07) (0.15) (0.40) (0.38)
cons 33.31∗∗∗ 0.601∗∗∗ 0.277∗∗∗ 1642.2∗∗∗ 0.400∗∗∗ 0.259∗∗∗ 0.396∗∗∗ 3.710∗∗∗ 5.117∗∗∗ 6.965∗∗∗
(1.02) (0.04) (0.04) (178.57) (0.04) (0.04) (0.04) (0.08) (0.22) (0.19)
N 950 956 956 793 956 955 956 862 942 945
Robust standard errors in parentheses. Control: Design Change
18
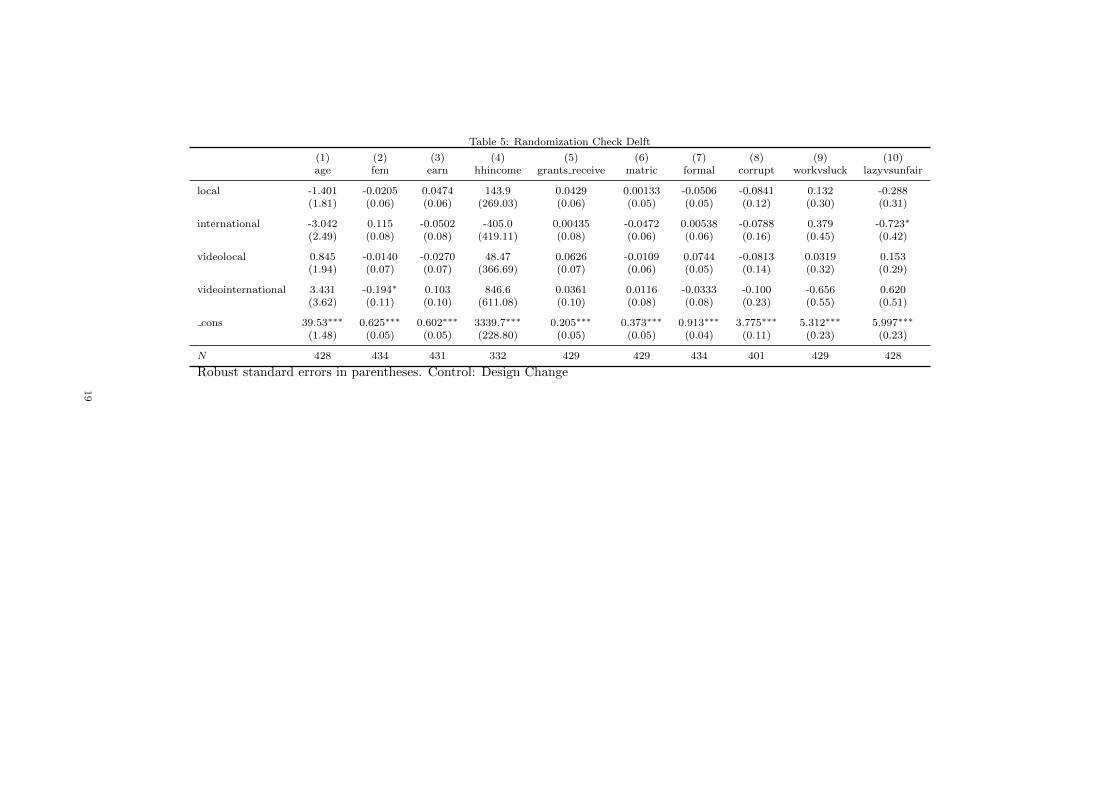
Table 5: Randomization Check Delft
(1) (2) (3) (4) (5) (6) (7) (8) (9) (10)age fem earn hhincome grants receive matric formal corrupt workvsluck lazyvsunfair
local -1.401 -0.0205 0.0474 143.9 0.0429 0.00133 -0.0506 -0.0841 0.132 -0.288(1.81) (0.06) (0.06) (269.03) (0.06) (0.05) (0.05) (0.12) (0.30) (0.31)
international -3.042 0.115 -0.0502 -405.0 0.00435 -0.0472 0.00538 -0.0788 0.379 -0.723∗
(2.49) (0.08) (0.08) (419.11) (0.08) (0.06) (0.06) (0.16) (0.45) (0.42)
videolocal 0.845 -0.0140 -0.0270 48.47 0.0626 -0.0109 0.0744 -0.0813 0.0319 0.153(1.94) (0.07) (0.07) (366.69) (0.07) (0.06) (0.05) (0.14) (0.32) (0.29)
videointernational 3.431 -0.194∗ 0.103 846.6 0.0361 0.0116 -0.0333 -0.100 -0.656 0.620(3.62) (0.11) (0.10) (611.08) (0.10) (0.08) (0.08) (0.23) (0.55) (0.51)
cons 39.53∗∗∗ 0.625∗∗∗ 0.602∗∗∗ 3339.7∗∗∗ 0.205∗∗∗ 0.373∗∗∗ 0.913∗∗∗ 3.775∗∗∗ 5.312∗∗∗ 5.997∗∗∗
(1.48) (0.05) (0.05) (228.80) (0.05) (0.05) (0.04) (0.11) (0.23) (0.23)
N 428 434 431 332 429 429 434 401 429 428
Robust standard errors in parentheses. Control: Design Change
19
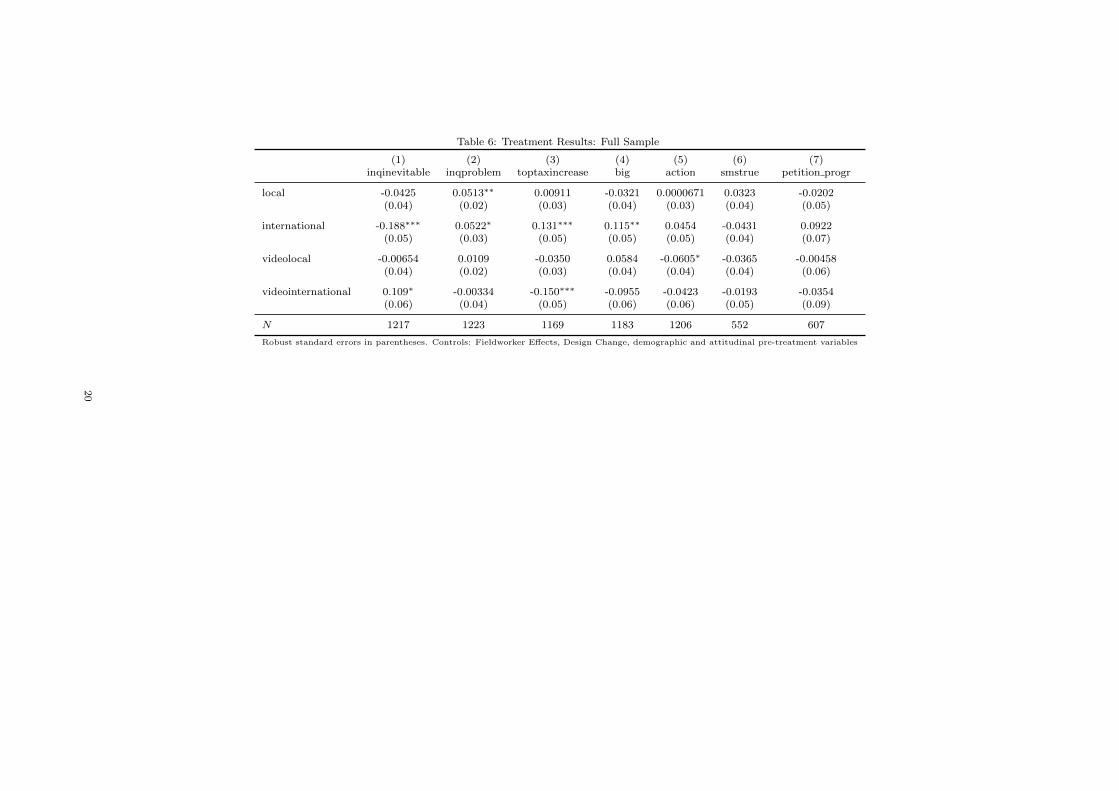
Table 6: Treatment Results: Full Sample
(1) (2) (3) (4) (5) (6) (7)inqinevitable inqproblem toptaxincrease big action smstrue petition progr
local -0.0425 0.0513∗∗ 0.00911 -0.0321 0.0000671 0.0323 -0.0202(0.04) (0.02) (0.03) (0.04) (0.03) (0.04) (0.05)
international -0.188∗∗∗ 0.0522∗ 0.131∗∗∗ 0.115∗∗ 0.0454 -0.0431 0.0922(0.05) (0.03) (0.05) (0.05) (0.05) (0.04) (0.07)
videolocal -0.00654 0.0109 -0.0350 0.0584 -0.0605∗ -0.0365 -0.00458(0.04) (0.02) (0.03) (0.04) (0.04) (0.04) (0.06)
videointernational 0.109∗ -0.00334 -0.150∗∗∗ -0.0955 -0.0423 -0.0193 -0.0354(0.06) (0.04) (0.05) (0.06) (0.06) (0.05) (0.09)
N 1217 1223 1169 1183 1206 552 607
Robust standard errors in parentheses. Controls: Fieldworker Effects, Design Change, demographic and attitudinal pre-treatment variables
20

Table 7: Treatment Results: Khayeltisha
(1) (2) (3) (4) (5) (6) (7)inqinevitable inqproblem toptaxincrease big action smstrue petition progr
local -0.0282 0.0658∗∗ 0.00601 -0.0599 -0.00541 0.0650 -0.0414(0.04) (0.03) (0.03) (0.04) (0.04) (0.04) (0.07)
international -0.196∗∗∗ 0.0579 0.115∗∗ 0.127∗∗ 0.119∗ -0.0757 0.160∗
(0.06) (0.04) (0.06) (0.06) (0.06) (0.05) (0.09)
videolocal -0.0329 0.0228 -0.0500 0.0684 -0.0629 -0.0701 -0.0225(0.04) (0.03) (0.04) (0.05) (0.04) (0.04) (0.07)
videointernational 0.116 0.0108 -0.126∗∗ -0.109 -0.127∗ 0.0396 -0.137(0.08) (0.05) (0.06) (0.08) (0.08) (0.06) (0.11)
N 833 836 816 823 833 405 417
Robust standard errors in parentheses. Controls: Fieldworker Effects, Design Change, demographic and attitudinal pre-treatment variables
21
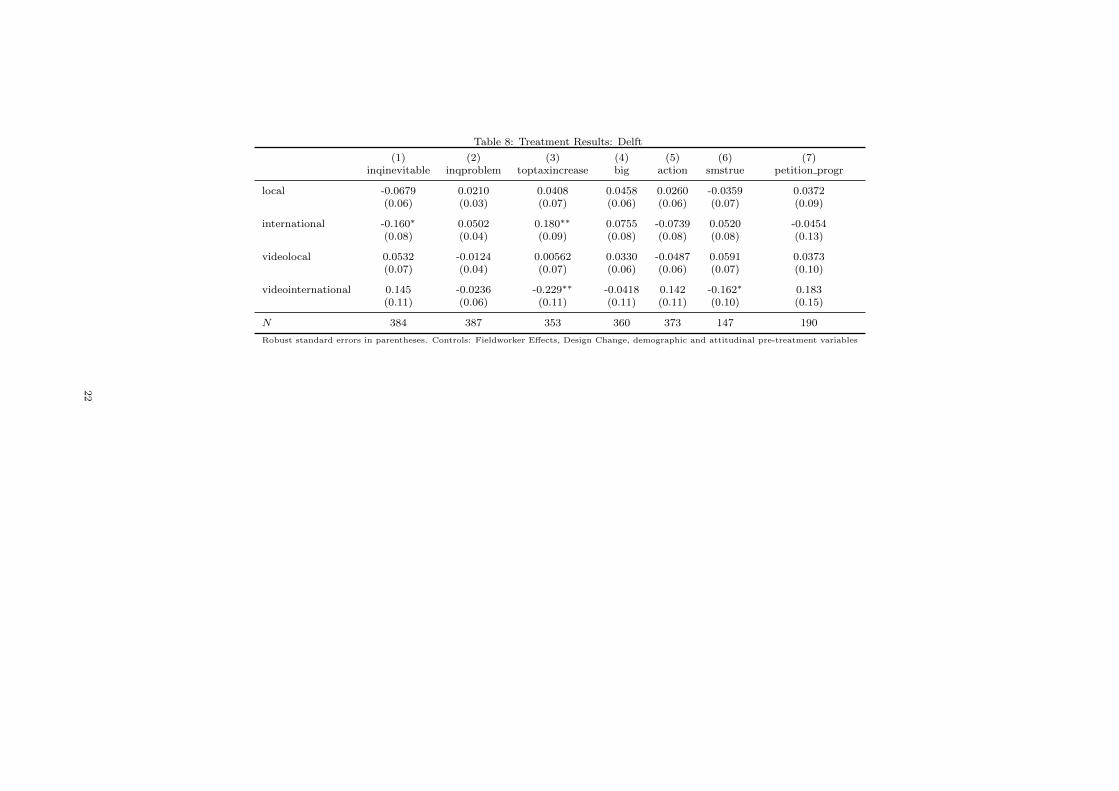
Table 8: Treatment Results: Delft
(1) (2) (3) (4) (5) (6) (7)inqinevitable inqproblem toptaxincrease big action smstrue petition progr
local -0.0679 0.0210 0.0408 0.0458 0.0260 -0.0359 0.0372(0.06) (0.03) (0.07) (0.06) (0.06) (0.07) (0.09)
international -0.160∗ 0.0502 0.180∗∗ 0.0755 -0.0739 0.0520 -0.0454(0.08) (0.04) (0.09) (0.08) (0.08) (0.08) (0.13)
videolocal 0.0532 -0.0124 0.00562 0.0330 -0.0487 0.0591 0.0373(0.07) (0.04) (0.07) (0.06) (0.06) (0.07) (0.10)
videointernational 0.145 -0.0236 -0.229∗∗ -0.0418 0.142 -0.162∗ 0.183(0.11) (0.06) (0.11) (0.11) (0.11) (0.10) (0.15)
N 384 387 353 360 373 147 190
Robust standard errors in parentheses. Controls: Fieldworker Effects, Design Change, demographic and attitudinal pre-treatment variables
22

Figure 1: Survey Design
23

Figure 2: Example local treamtent
24

Figure 3: International Treatment
25

Appendix
Table 9: Treatment Results: Full Sample Without controls
(1) (2) (3) (4) (5) (6) (7)inqinevitable inqproblem toptaxincrease big action smstrue petition progr
local -0.0214 0.0414∗ -0.0266 -0.0502 -0.0265 0.00347 -0.0318(0.04) (0.02) (0.03) (0.04) (0.04) (0.04) (0.05)
international -0.181∗∗∗ 0.0552∗ 0.125∗∗ 0.124∗∗ 0.0355 -0.0360 0.0578(0.05) (0.03) (0.05) (0.05) (0.05) (0.05) (0.07)
videolocal -0.0143 0.0171 -0.0182 0.0379 -0.0501 -0.0303 -0.0376(0.04) (0.02) (0.03) (0.04) (0.04) (0.04) (0.05)
videointernational 0.144∗∗ -0.0203 -0.170∗∗∗ -0.112∗ -0.00317 -0.00695 0.00905(0.06) (0.03) (0.06) (0.06) (0.06) (0.06) (0.09)
N 1352 1364 1295 1315 1354 621 671
Robust standard errors in parentheses
26

Table 10: Treatment Results: Khayeltisha Without controls
(1) (2) (3) (4) (5) (6) (7)inqinevitable inqproblem toptaxincrease big action smstrue petition progr
local -0.0116 0.0702∗∗ -0.0368 -0.0729∗ -0.0440 0.0263 -0.0581(0.04) (0.03) (0.04) (0.04) (0.04) (0.04) (0.06)
international -0.190∗∗∗ 0.0643∗ 0.102∗ 0.138∗∗ 0.108∗ -0.0376 0.120(0.06) (0.04) (0.06) (0.06) (0.06) (0.05) (0.09)
videolocal -0.0344 0.0219 -0.0219 0.0562 -0.0330 -0.0461 -0.0463(0.04) (0.02) (0.03) (0.04) (0.04) (0.04) (0.06)
videointernational 0.146∗∗ -0.00296 -0.134∗∗ -0.100 -0.0674 0.0244 -0.0536(0.07) (0.04) (0.06) (0.07) (0.07) (0.06) (0.10)
N 939 944 910 925 943 464 460
Robust standard errors in parentheses
27
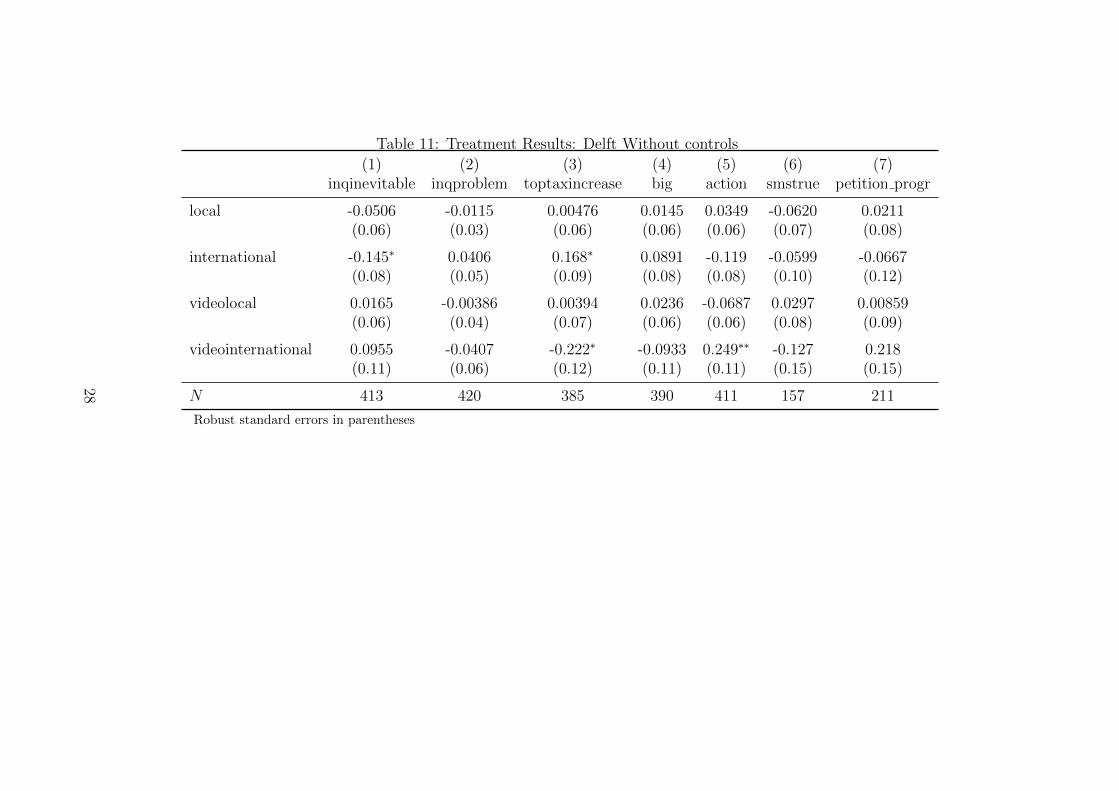
Table 11: Treatment Results: Delft Without controls
(1) (2) (3) (4) (5) (6) (7)inqinevitable inqproblem toptaxincrease big action smstrue petition progr
local -0.0506 -0.0115 0.00476 0.0145 0.0349 -0.0620 0.0211(0.06) (0.03) (0.06) (0.06) (0.06) (0.07) (0.08)
international -0.145∗ 0.0406 0.168∗ 0.0891 -0.119 -0.0599 -0.0667(0.08) (0.05) (0.09) (0.08) (0.08) (0.10) (0.12)
videolocal 0.0165 -0.00386 0.00394 0.0236 -0.0687 0.0297 0.00859(0.06) (0.04) (0.07) (0.06) (0.06) (0.08) (0.09)
videointernational 0.0955 -0.0407 -0.222∗ -0.0933 0.249∗∗ -0.127 0.218(0.11) (0.06) (0.12) (0.11) (0.11) (0.15) (0.15)
N 413 420 385 390 411 157 211
Robust standard errors in parentheses
28
Top Related
Copyright © 2022 FDOKUMEN

