


Bahasa
Halaman
Hukum


28-8-2015
An empirical study about the determinants of early stage IT
start-up success| Bryan Ruiter
GOLDEN
EGG
CHECK
B.V.
THE QUANTIFICATION OF START-UP
PERFORMANCE

i
DOCUMENT INFORMATION
Document information
Title: The quantification of start-up performance
Description: An empirical study about the determinants of
early stage IT start-up success
Tags: Business success, start-up success,
performance, progress, entrepreneurial team,
determinants, measure, monitor, IT,
information technology, Golden Egg Check
Type: Bachelor Thesis
Date: 28-8-2015
Version: Final version
Candidate
Name: Bryan Ruiter
Student number: s0141275
Study: Industrial Engineering and Management
E-mail: [email protected]
University
University: University of Twente
Faculty: Faculty of behavioral, management and social
sciences
Principal
Name: Golden Egg Check B.V.
Website: www.goldeneggcheck.com
Graduation committee
Dr. J.M.G. Heerkens University of Twente
Dr. P.C. Schuur University of Twente
G.B. Meijer MSc Golden Egg Check B.V.

ii
PREFACE
This research project is conducted to complete the author’s bachelor study Industrial
Engineering & Management at the University of Twente. The principal of this project, Golden Egg
Check B.V., developed a tool, the Golden Egg Check, to assess the potential and feasibility of a
business case. The tool is useful for assessing the start-up’s potential, but it is currently not
useful for monitoring the actual performance of a start-up. This research project aims to make
the actual performance of a start-up more insightful by offering a model that quantitatively
assesses the performance of a start-up.
I am very grateful to everyone that supported me with this project. I would like to thank the
employees of the Golden Egg Check B.V. for giving me a wonderful time. Special thanks goes out
to Gilles Meijer and Thomas Mensink who were closely involved with this project. And Jaap
Beernink for giving me this opportunity. I would also like to thank my supervisors, from the
University of Twente, Hans Heerkens and Peter Schuur for helping me with the structure of this
paper and for asking the right questions. Also thanks to all the organizations that participated in
this research project.
Bryan Ruiter
Enschede, 28 Augustus 2015

iii

iv
MANAGEMENT SUMMARY
Fifty percent of the start-ups survive the first three years. It is not sufficiently known how to
predict whether a start-up will become successful. In previous literature a lot has been written
on the determinants of business success and its correlation with output variables [e.g., revenue
and/or profit]. Unfortunately, early stage IT start-ups, often do not have any substantial revenue
or profit yet. Even when they do have revenue and profit these statistics do not necessarily
reflect how good the start-up process actually is because, these statistics are effects, often
lagging behind and are influenced by chance. The objective of this research is to create a model
to quantify start-up performance from a process perspective that is able to predict whether a
start-up is likely to become successful even when there is no reliable financial information
available. But before such a model can be generated the following information needs to be
known:
Which factors are determinants for early stage IT start-up success from a process perspective – and
what is the relative importance of each of the determinants?
Previous research is used to identify which determinants might be important for IT start-up
success and entrepreneurship experts are interviewed for their opinions on whether they think
these factors are indeed important, what their relative importance is and what ideal levels of
performance on these determinants are.
The identified determinants for IT start-up performance can be categorized between:
Business case determinants (how good is the business case?)
Entrepreneurial team determinants (how good is the entrepreneurial team?)
Progress determinants (which events did the organization undertake?)
TABLE I: MOST IMPORTANT FINDINGS: ENTREPRENEURIAL TEAM DETERMINANTS
Entrepreneurial team determinants
Rank (mean)
Ideal performance level
Entrepreneurial team determinants
Rank (mean)
Ideal performance level
Prior start-up experience
1 (2.6) 4 Prior start-ups
Helpful mentors 5 (5.0)
Industry specific experience
2 (3.6) 4-8 years of experience
Working long hours
5 (5.0) 45-50 hours a week
Multiple Founders
3 (4.1) Three founders
Managerial experience
7 (5.7) 4-8 years of managerial experience
Customer metrics
4 (4.3) Level of education
8 (5.8) Master’s degree
v
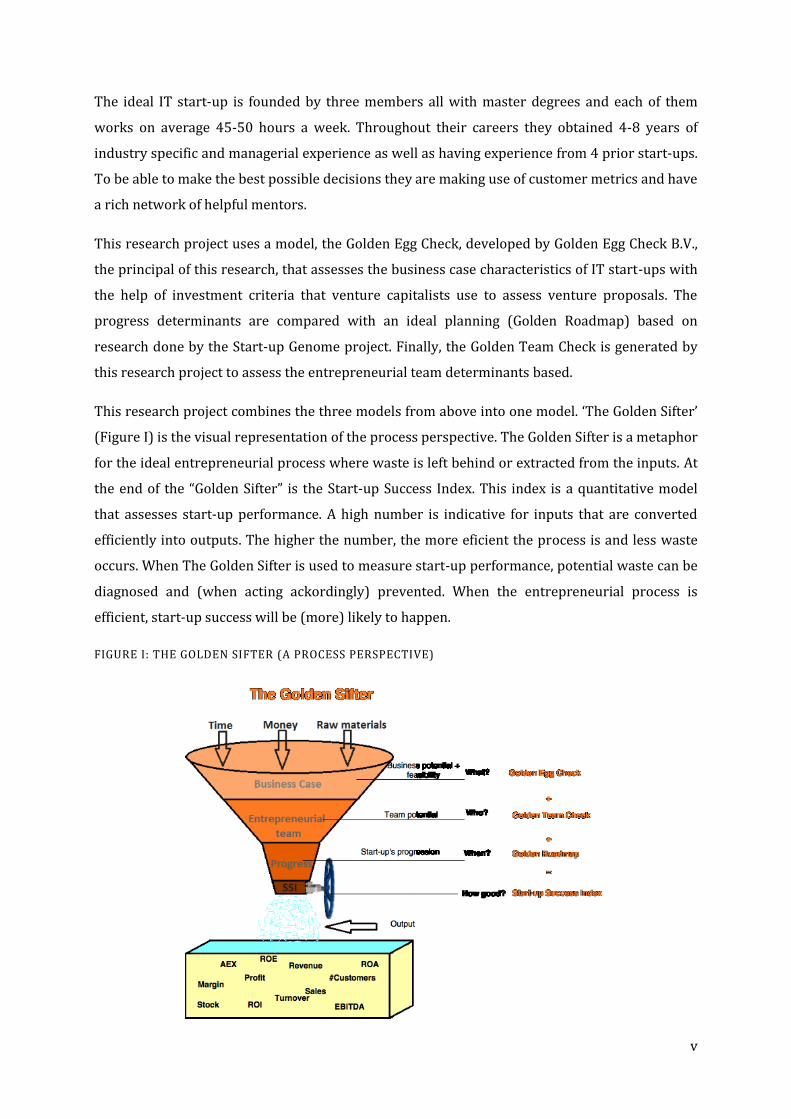
The ideal IT start-up is founded by three members all with master degrees and each of them
works on average 45-50 hours a week. Throughout their careers they obtained 4-8 years of
industry specific and managerial experience as well as having experience from 4 prior start-ups.
To be able to make the best possible decisions they are making use of customer metrics and have
a rich network of helpful mentors.
This research project uses a model, the Golden Egg Check, developed by Golden Egg Check B.V.,
the principal of this research, that assesses the business case characteristics of IT start-ups with
the help of investment criteria that venture capitalists use to assess venture proposals. The
progress determinants are compared with an ideal planning (Golden Roadmap) based on
research done by the Start-up Genome project. Finally, the Golden Team Check is generated by
this research project to assess the entrepreneurial team determinants based.
This research project combines the three models from above into one model. ‘The Golden Sifter’
(Figure I) is the visual representation of the process perspective. The Golden Sifter is a metaphor
for the ideal entrepreneurial process where waste is left behind or extracted from the inputs. At
the end of the “Golden Sifter” is the Start-up Success Index. This index is a quantitative model
that assesses start-up performance. A high number is indicative for inputs that are converted
efficiently into outputs. The higher the number, the more eficient the process is and less waste
occurs. When The Golden Sifter is used to measure start-up performance, potential waste can be
diagnosed and (when acting ackordingly) prevented. When the entrepreneurial process is
efficient, start-up success will be (more) likely to happen.
FIGURE I: THE GOLDEN SIFTER (A PROCESS PERSPECTIVE)

vi
DOCUMENT INFORMATION ............................................................................................................ I
PREFACE .............................................................................................................................................. II
MANAGEMENT SUMMARY ........................................................................................................... IV
1. INTRODUCTION ............................................................................................................................ 1
1.1 Introduction to the subject ......................................................................................................................... 1
1.2 The Golden Egg Check ................................................................................................................................ 1
1.3 The GEC and literature addressing this problem ......................................................................................... 3
1.4 Definitions .................................................................................................................................................. 5
1.5 Project scope and objectives ...................................................................................................................... 7
1.6 Problem statement and research questions ............................................................................................... 8
1.7 Report outline .......................................................................................................................................... 11
2. PREVIOUS RESEARCH ON BUSINESS SUCCESS AND ITS DETERMINANTS .............. 13
2.1 Previous research on business success ..................................................................................................... 13
2.2 Previous research on the determinants of business success ..................................................................... 14
2.3 Contributions of this chapter to the research questions ........................................................................... 19
3. METHODOLOGIES TO QUANTIFY START-UP PERFORMANCE.................................... 23
3.1 Indicators for the determinants of start-up success .................................................................................. 23
3.2 Methodologies to quantify start-up performance .................................................................................... 28
3.3 Contributions of this chapter to the research questions ........................................................................... 32
4. ANALYSIS: DETERMINANTS OF START-UP SUCCESS AND THEIR RELATIVE IMPORTANCE................................................................................................................................... 35
4.1 Data collection ......................................................................................................................................... 35
4.2 Sample size ............................................................................................................................................... 38
4.3 Findings .................................................................................................................................................... 39
4.4 Contributions of this chapter to the research questions ........................................................................... 47
5. IMPLEMENTATION: QUANTIFICATION OF START-UP PERFORMANCE .................. 49

vii
5.1 Golden Sifter ............................................................................................................................................ 49
5.2 Start-up success index .............................................................................................................................. 50
6. DISCUSSION ................................................................................................................................. 53
6.1 Conclusions .............................................................................................................................................. 53
6.2 Practical implication ................................................................................................................................. 55
6.3 Research limitations and recommendations for future research .............................................................. 56
REFERENCES .................................................................................................................................... 58
APPENDIX I: VENTURE CAPITALISTS’ INVESTMENT CRITERIA (GOLDEN EGG CHECK CRITERIA) ............................................................................................................................................A
APPENDIX II: QUESTIONNAIRES .................................................................................................. E
APPENDIX III INTERVIEW GUIDE ................................................................................................G
APPENDIX IV: UTILITY OF LEVELS OF PERFORMANCE ....................................................... N
APPENDIX V: SCOPUS SEARCH STRATEGY ............................................................................... P

1
1. INTRODUCTION
1.1 Introduction to the subject
In the Netherlands, in 2013, 237,340 firms were founded (CBS, 2015). Only around fifty percent
of the founded firms or ‘start-ups’ survive the first three years (Van Praag, 2003). Even venture
capitalists (VCs) who are choosing their investments carefully, are dealing with a complete loss
on 34.5% of their investments (Sahlman, 1990). Apparently some start-ups succeed while others
fail. This project assumes that when the determinants of success are known, entrepreneurs and
VCs can make a better prediction about whether the individual business case will lead to
business success. That is why this project desires to give the reader more insight into the
determinants of business success and how they can be used to monitor start-up performance.
1.2 The Golden Egg Check
1.2.1 The principal
The principal of this project is Golden Egg Check B.V. (GEC B.V.) located in Enschede, the
Netherlands. GEC B.V. is a software company founded in 2015 by Mr. Beernink and Mr. Meijer.
GEC B.V. originated from the service company B&M Business Development (B&M). B&M,
founded by Beernink and Meijer in 2006, is a company specialized in assisting start-up and
growth companies and performing market analysis for external parties. Five years ago, they
started with the development of an online software toolset named the Golden Egg Check (GEC).
First, the GEC was a product of B&M, but since 2015 it operates as the independent GEC B.V.
1.2.2 The Golden Egg Check
The GEC is an online platform for established entrepreneurs or start-ups that want to evaluate
and/or develop business cases. The GEC provides a framework to support the assessment of a
business case. This framework consists of 32 criteria to evaluate venture proposals (see
Appendix I: Venture capitalists’ investment criteria (The Golden Egg Check criteria)). These
criteria and their relative importance are based on research about venture capitalists’ product
and market related investment criteria (Mensink, 2010). This evaluation can be done by either
the entrepreneurial team, performing a self-assessment, or by external ‘checkers’ [e.g., an
industry expert, a business developer, a scientist].

2
In order to be able to assess a business case, sufficient information needs to be presented. This
information can be extracted from, for example, a business plan or a pitch. The entrepreneurial
team can present this information in the GEC software by filling in specific characteristics of the
business case [e.g., characteristics of the entrepreneurial team, the product, the market and the
financials]. This is especially useful for external checkers because they are not always familiar
with the business case yet (logically, the entrepreneurial team can assess their own business
case without presenting the information). The checker can then assess these business
characteristics with the help of the GEC framework (see also Figure 1.1). Every criterion is
assessed on whether the criterion is fully present, somewhat present, not present, or not able to
assess due to lack of information. By adding external expert checkers the accuracy of the
assessment can be enhanced.
FIGURE 1.1: THE GEC FRAMEWORK (2 OF 32 CRITERIA SHOWN)
FIGURE 1.2: THE OUTPUT OF AN ASSESSMENT (EXAMPLE)

3
The output of an assessment (see figure 1.2) is a GEC score and an investor interest score. The
GEC score is a summary of the criteria scores, multiplied with their relative importance..
𝐺𝐸𝐶 𝑠𝑐𝑜𝑟𝑒 = ∑ 𝑊𝑖 ∗ 𝑋𝑖32𝑖=1 , where Wi: Weight of criteria i, and Xi: score on criteria i.
A high score is indicative for potential business success and a low score is indicative for potential
business failure.
This research project aims to generate a model that can be used for the monitoring of start-up
performance. Section 1.3.2: The GEC and its shortcomings for addressing this problem,
addresses whether the GEC is a useful tool to monitor start-up performance.
1.3 The GEC and literature addressing this problem
In section 1.1: introduction to the subject, this research project has identified that society might
have a problem: “it is not sufficiently known yet how to predict whether a start-up will become
successful”. But why might it be a problem? And aren’t there already solutions available?
1.3.1 Why is it a problem for society?
Knowing the determinants of start-up success could prevent wasting a lot of time and money on
business cases that are not likely to succeed. Investigating the determinants of start-up success
is therefore relevant not only for the entrepreneurs and authorities, monitoring employment
rates, but also for commercially oriented institutions like a bank, providing a loan, and GEC B.V.,
providing start-ups with consultancy. If one could determine which factors are determinant for
the performance and are influencing the probability of start-up success, then these factors can
be monitored. The monitoring of these factors could then support the entrepreneurial team
whether to modify their plans or decide not to start the firm at that time (Cooper, 1993). More
insight into these issues would enable both entrepreneurs as supporting organizations to make a
better prediction for business success or failures (Van Praag, 2003).
1.3.2 The GEC and its shortcomings for addressing this problem
The GEC is one way of predicting start-up success, but the GEC score is only a snapshot of the
estimated business potential and the estimated feasibility of a specific business case. The
business characteristics [e.g., financial predictions, product idea and market] that the GEC
assesses are not useful for measuring current business performance. It only predicts how
successful a business case can potentially be, but it doesn’t monitor how well the business case is
exploited [e.g., it doesn’t monitor which events a start-up undertakes]. Even a periodical

4
assessment with the GEC will not lead to the desired result, because the business characteristics
that the GEC assesses are not often changing significantly over time.
The GEC often receives feedback from entrepreneurs and incubation managers/coaches saying
that the GEC is useful for assessing a business case but that they miss the opportunity to monitor
its progress and how well the entrepreneurial team is performing. Also venture capitalists are
struggling with the same problem to monitor the progress of ventures they have invested in
(Sahlman, 1990). But, to be able to get insight into the progress or performance of a firm, the
determinants of business success should be known. B&M would like to implement these features
into the GEC software but they do not have a scientific foundation for these features yet.
1.3.3 Previous research addressing this problem
In literature a lot has been written about the determinants of business success and how they can
be measured. A selection of relevant literature is stated in Table 1.1. The purpose of quantifying
or qualifying the performance of a firm is measuring whether a business is successful or not. The
performance of a business is often measured with financial indicators [e.g., revenue, profit,
return on investment] or with survival duration (Fried & Tauer, 2015; Bianchi & Biffignandi,
2012; Van Praag, 2003; Gimeno et al, 1997; Cooper et al., 1994, Duchesneau & Gartner, 1990;
Stuart & Abetti, 1990)..
TABLE 1.1: LITERATURE ADDRESSING THE DETERMINANTS OF BUSINESS SUCCESS
Literature source Subject of literature in key
words
Correlation with:
Fried & Tauer, 2015 Entrepreneur performance
index.
Revenue and survival
Bianchi & Biffignandi, 2012 Entrepreneur performance
index
Revenue
Marmer et al., 2012 Silicon Valley, IT start-ups,
addresses both progress and
team characteristics.
Multiple key metrics [e.g.,
number of pivots, money
raised, months to reach
scale stage etc.]
Van Praag, 2003 Person specific determinants Survival
Gimeno et al, 1997 Human capital determinants Survival
Cooper et al., 1994 Human capital success
determinants
Survival and growth
Duchesneau & Gartner, 1990 Success determinants Multiple financials
Stuart & Abetti, 1990 Success determinants Multiple financials

5
Unfortunately, many of the start-ups, the topic that this project is especially interested in, are
firms with little or no revenue. Even when there is profit or revenue, these statistics are effects.
They are not necessarily giving reliable information about how good a start-up is performing
from a process perspective.
So the above mentioned financial indicators are not sufficient for measuring the performance of
early stage start-ups. Survival duration solely is not a useful indicator for start-up success either,
because many business dissolutions are voluntarily, and not necessarily caused by business
failure. Furthermore start-ups that do exist are not necessarily successful (Van Praag, 2003).
The research done by Marmer et al., 2012 comes closest to what this project is looking for but it
did not investigate any product and market related success determinants.
In literature there has not been a satisfying study yet in the direction of measuring the business
performance of startups from a process perspective. Therefore it is interesting to solve this
information gap and expand literature with this study.
1.4 Definitions
In order to prevent any confusion about definitions used in the problem statement, project scope
and objectives it is necessary to give the following definitions of entrepreneurship and the
entrepreneurial process.
1.4.1 Definition of entrepreneurship
The Austrian economist Joseph Schumpeter (1911) is seen as the pioneer for the present
discipline of entrepreneurship. On the basis of Schumpeter’s work, many different
entrepreneurship definitions have been generated. However many definitions consists of the
following four characteristic elements: (1) identification of entrepreneurial opportunities, (2)
innovation and novelty, (3) securing of resources and formation of an enterprise/an
organization, and (4) Profit-orientation taking into account reasonable risks and uncertainties
(Volkmann, Tokarski, & Grünhagen, 2010). “Entrepreneurship is the process of creating
something of value by devoting the necessary time and effort, assuming the accompanying
financial, psychic, and social risks, and receiving the resulting rewards of monetary and personal
satisfaction and independence” (Hisrisch & Peters, 2002). The definition that Hisrich and Peters
generated is the definition used throughout this paper. Entrepreneurship does not necessarily
mean the creation of new organizations.
6
1.4.2 The entrepreneurial process
The entrepreneurial process consists of functions, activities and actions that are associated with
the recognition and evaluation of an entrepreneurial opportunity, the development of a business
idea and the writing of the business plan, the establishment of an organization and founding of
the enterprise itself, while taking into account the required resources in order to achieve and
sustain a viable market establishment of the enterprise and the achievement of growth (Katz &
Gartner, 1998; Shane & Venkataraman, 2000; Brush, 2001; Allen, 2003).
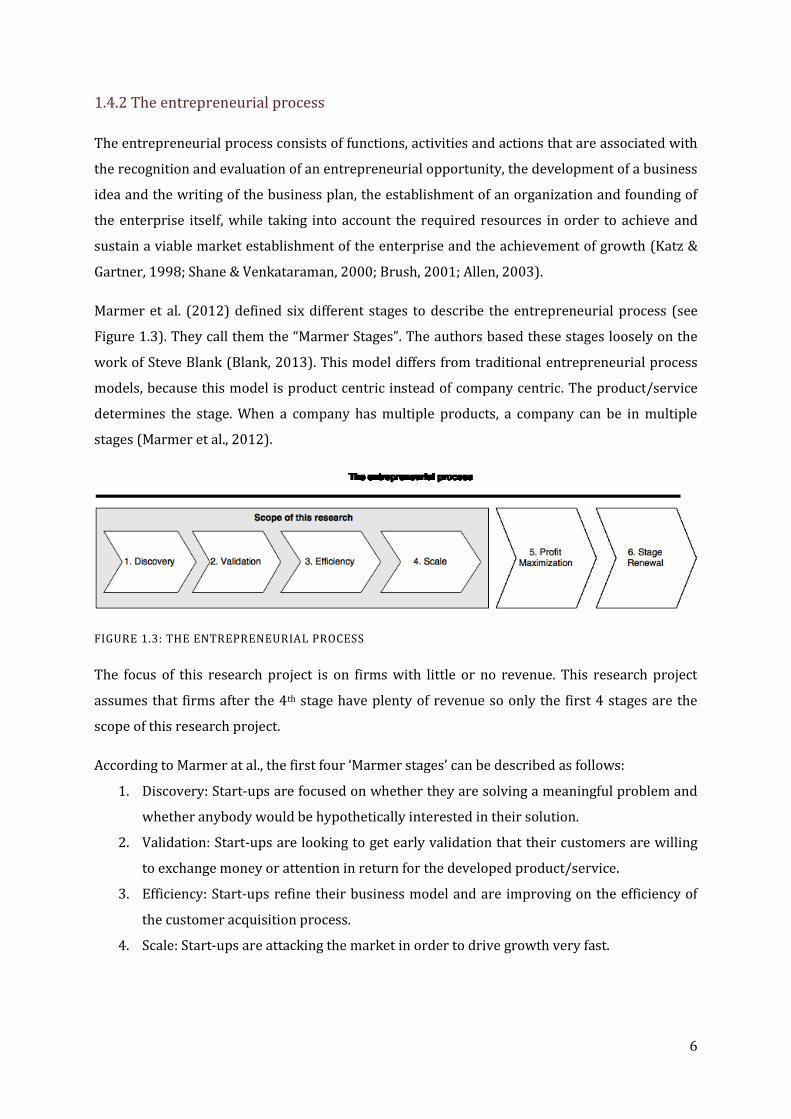
Marmer et al. (2012) defined six different stages to describe the entrepreneurial process (see
Figure 1.3). They call them the “Marmer Stages”. The authors based these stages loosely on the
work of Steve Blank (Blank, 2013). This model differs from traditional entrepreneurial process
models, because this model is product centric instead of company centric. The product/service
determines the stage. When a company has multiple products, a company can be in multiple
stages (Marmer et al., 2012).
FIGURE 1.3: THE ENTREPRENEURIAL PROCESS
The focus of this research project is on firms with little or no revenue. This research project
assumes that firms after the 4th stage have plenty of revenue so only the first 4 stages are the
scope of this research project.
According to Marmer at al., the first four ‘Marmer stages’ can be described as follows:
1. Discovery: Start-ups are focused on whether they are solving a meaningful problem and
whether anybody would be hypothetically interested in their solution.
2. Validation: Start-ups are looking to get early validation that their customers are willing
to exchange money or attention in return for the developed product/service.
3. Efficiency: Start-ups refine their business model and are improving on the efficiency of
the customer acquisition process.
4. Scale: Start-ups are attacking the market in order to drive growth very fast.

7
1.4.3 Implications for this project
Many different definitions of entrepreneurship are used throughout literature, the one used in
this project is as follows: “Entrepreneurship is the process of creating something of value by
devoting the necessary time and effort, assuming the accompanying financial, psychic, and social
risks, and receiving the resulting rewards of monetary and personal satisfaction and
independence” (Hisrisch & Peters, 2002). The entrepreneurial process consists of different
phases with their different activities. This project uses the four “Marmer Stages”: discovery,
validation, efficiency and scale to model the start-up process (Marmer et al., 2012).
1.5 Project scope and objectives
1.5.1 Project scope
Solving the problem identified in section 1.1: introduction to the subject, involves too many
factors for this project. Solving the problem with a general scope would consume too many
resources and/or would lead to results that are not concrete enough. For example the
mentioned problem does not discriminate between the types of industry and a certain phase of
the entrepreneurial process.
The focus of this project is on solving the problem for start-ups with little or no revenue. The
industry chosen is IT. IT ventures are moving relatively fast through the stages. For example,
compared to nanotechnology start-ups, IT start-ups have a lower time-to-market. IT start-ups
are often not able to protect their intellectual property with patents so they need to progress fast
in order to stay ahead of their competitors. A tool to monitor performance would be very
relevant, because these IT start-ups are then able to make adjustments quickly when the tool is
diagnosing to do so. Many customers of the GEC are IT ventures and this is also an industry
where the author of this project has much affinity with.
IT start-ups with little or no revenue could be somewhere in between the discovery phase and
the scale phase (early stage). Up to and including the scale phase, the business needs to work
towards successful market establishment and it is the monitoring of this process that is the
problem of this project.

8
TABLE 1.1: THE SCOPE OF THIS PROJECT
Variables Focus area of this project
The industry of the venture Internet start-ups / IT ventures
Phase of the entrepreneurial process Discovery phase – Scale phase (early stage)
Table 1.1 presents the chosen scope of this project.
1.5.2 Project objectives
In section 1.3.3: previous research addressing this problem, is stated that there is an information
gap in literature, there has not been a study yet in the direction of measuring business
performance with a scope on early stage IT firms that is sufficient.
The objective of this project is to create a model to assess the start-up performance from a
process perspective. In order to be able to develop such a model for firms with little or no
revenue, the determinants of start-up success and the relative importance of each of the
determinants are needed to be studied. When the determinants of start-up success are known,
these factors can be measured with indicators. The performance could then be quantified or
qualified with the help of a model. This model could lead to a feature implemented in the GEC
software. So solving this issue would be relevant for both GEC and society.
1.6 Problem statement and research questions
1.6.1 Problem statement
In section 1.3.3: previous research addressing this problem, is stated that there is a discrepancy
between (1) the knowledge that this project desires to have about how business performance of
IT start-ups (with little or no revenue) can be measured. (2) what is actually known about this
subject.
The problem statement of this project is with the area of focus elaborated in section 1.5.1 is:
Which factors are determinants for early stage IT start-up success from a process perspective –
and what is the relative importance of each of the determinants?

9
1.6.2 Research questions
To be able to solve the problem statement above, with the scope stated in 1.5.1, several aspects
of this statement should be known. Information extracted from the answers of the research
questions should cover these aspects. During this report the following research questions are to
be answered:
RQ1. Which definitions for business success are found in previous research – and which
definition(s) is/are suitable for IT start-ups?
This question strives to identify what business success is and how it is defined in
previous research. The previous research that is used to answer this question is found
with the methodology presented in Appendix V. From the identified definitions of
business success one definition will be chosen that is suitable for IT start-ups.
RQ2. Which factors are determinants for start-up success from a process perspective
according to previous research?
When a suitable definition of IT start-up success is chosen, RQ2 aims to answer which
factors are determinants for start-up success. This question will be answered with
literature found with the methodology used in Appendix V. The result of this question
should be a list of factors that are determinant for start-up success.
RQ3. What are suitable indicators for these identified determinants – and how can they be
measured?
The determinants identified in RQ2 are not necessarily measurable. To be able to make
these determinants measurable, indicators need to be found and a scale needs to be
defined. The result of RQ3 should be a list of how each identified factor from RQ2 could
be measured with the help of indicators.

10
RQ4. What is the relative importance of these factors that are determinant for IT start-up
success from a process perspective?
Probably not all determinants are contributing equally towards IT start-up success. In
order to be able to quantify start-up performance the relative importance of the factors
that are contributing to the success of IT start-ups need to be investigated. An often used
method to answer this question is by analyzing data from a dataset; the identified
determinants and their correlation to (financial) indicators for start-up success [e.g.,
profit, revenue, growth etc.] are analyzed . This project takes a different approach,
because the indicators of start-up success are often financial indicators or survival
duration and, as mentioned before, these are less useful for early stage IT start-ups.
Instead, this question is going to be answered with the help of data obtained from semi-
structured interviews with entrepreneurship experts. They are going to be asked
questions about what they think are the important factors that are contributing towards
IT start-up success and what their relative contribution is.
11
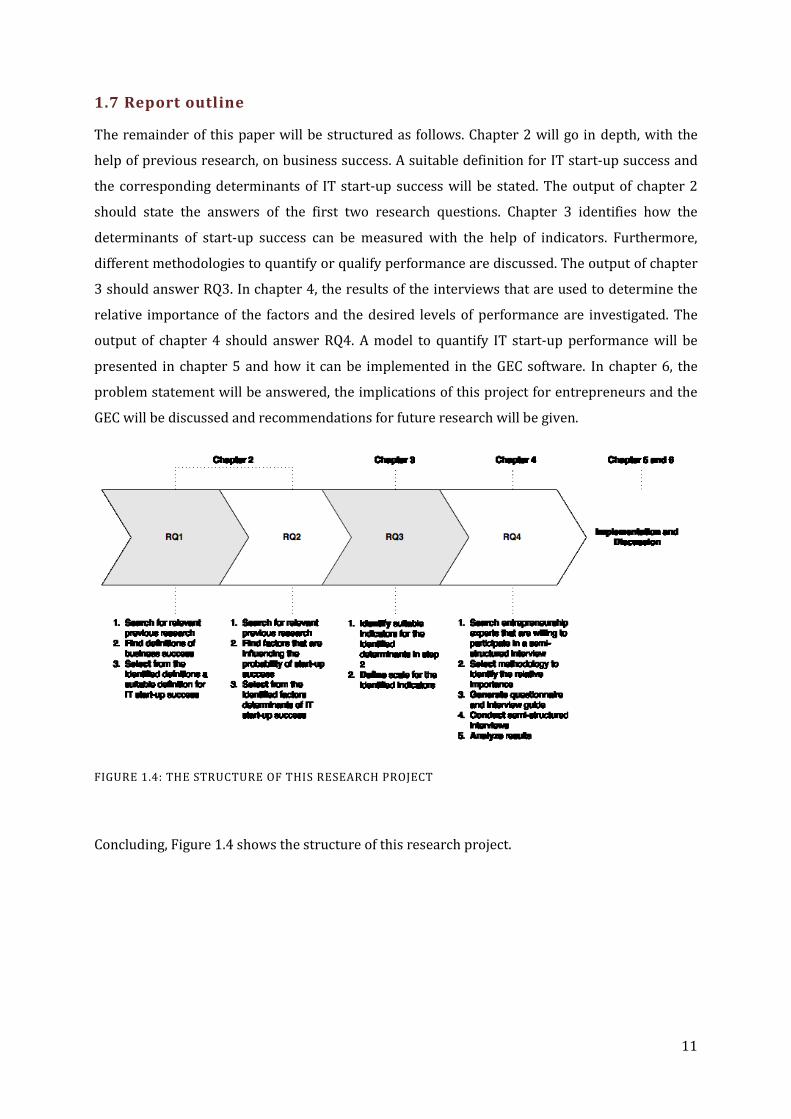
1.7 Report outline
The remainder of this paper will be structured as follows. Chapter 2 will go in depth, with the
help of previous research, on business success. A suitable definition for IT start-up success and
the corresponding determinants of IT start-up success will be stated. The output of chapter 2
should state the answers of the first two research questions. Chapter 3 identifies how the
determinants of start-up success can be measured with the help of indicators. Furthermore,
different methodologies to quantify or qualify performance are discussed. The output of chapter
3 should answer RQ3. In chapter 4, the results of the interviews that are used to determine the
relative importance of the factors and the desired levels of performance are investigated. The
output of chapter 4 should answer RQ4. A model to quantify IT start-up performance will be
presented in chapter 5 and how it can be implemented in the GEC software. In chapter 6, the
problem statement will be answered, the implications of this project for entrepreneurs and the
GEC will be discussed and recommendations for future research will be given.
FIGURE 1.4: THE STRUCTURE OF THIS RESEARCH PROJECT
Concluding, Figure 1.4 shows the structure of this research project.

12

13
2. PREVIOUS RESEARCH ON BUSINESS SUCCESS AND ITS
DETERMINANTS
This chapter aims to answer the first two research questions with the help of previous research.
In section 2.1 relevant previous research on business success is stated and discussed. This
information will be used to address RQ1: “Which definitions for business success are found in
previous research – and which definition(s) is/are suitable for IT start-ups?”. In section 2.2
previous research on determinants of business success is stated. This information is necessary in
order to be able to answer RQ2: “Which factors are determinants for IT start-up success from a
process perspective according to previous research?”. Finally, in section 2.3, the contributions of
this chapter to the research questions are stated and by doing so research question 1 and 2 are
answered.
2.1 Previous research on business success
Success in self-employment has no unique definition, and therefore has been defined differently
in business, psychology, and sociology (Van Praag, 2003). In business, success is seen as a
multidimensional construct determined by financial and operational performance. Indicators of
financial performance reflect the firms economic performance while indicators of operational
performance like innovativeness might influence the financial performance (Hill, 2013; Combs et
al, 2005; Venkatraman & Ramanujam, 1986).
In the past entrepreneurship research had an emphasis on the financial performance of a firm
and/or the achievement of company growth as a determinant of business success (Kiviluoto,
2013). But more recent studies criticizes the suggested positive relationship between sales
growth and profit. These studies indicate that instead of the achievement of growth, the
achievement of profitable growth should be regarded as business success (Brännback et al.,
2010; Davidsson, Steffens, & Fitzsimmons, 2009).
Several recent entrepreneurship studies are trying to connect entrepreneurship with the field of
production theory to measure operational performance (Fried & Tauer, 2015; Bianchi &
Biffignandi, 2012). They opt a production function approach that relies on the idea that a firm
transforms inputs into outputs. The more outputs a firm can produce with fewer inputs the
more successful the entrepreneurial team is (Fried & Tauer, 2015; Bianchi & Biffignandi, 2012).
So a successful firm produces some satisfying level of outputs compared to the inputs consumed in
this process.

14
In literature it is also suggested that the entrepreneur being satisfied about the business could
be regarded as business success (Cooper & Artz, 1995; Chandler & Hanks, 1993). Or the feelings
of satisfaction and completion when the business career is over (Hill, 2013).
As mentioned before, survival duration is often used as an indicator for business success.
However, solely focusing on the duration that a venture exists has little to do with the success in
business, firms that do exist are not necessarily successful and a large part of the business
dissolutions are voluntary instead of mandatory caused by business failure (Van Praag, 2003). A
business dissolution can either be a compulsory exit or a voluntary exit. The compulsory exit is
due to insufficient opportunity, often financial, to continue in business. Van Praag, 2013
associates this compulsory exit route with business failure. On the other hand business success
or entrepreneurial success is associated with whether a firm can stay in business without the
necessity of a compulsory exit (Van Praag, 2003).
Different definitions of business success are identified above, although not all definitions are
suitable for measuring IT start-up success. In section 2.3.1, research question 1 will be answered
and by doing so a suitable definition for IT start-up success will be stated. A suitable definition
for IT start-up success from a process perspective is (which will be further elaborated in section
2.3.1):
2.2 Previous research on the determinants of business success
In order to understand the determinants of business success, knowledge about what business
success is should be obtained first. Fortunately, in the previous section is stated which
definitions are found for business success from previous research.
A lot of research has been done about the determinants of entrepreneurial success, especially on
the topics addressing the characteristics of a successful business case, a successful
entrepreneurial team and successful progress. (Fried & Tauer, 2015; Marmer, Herrmann,
Dogrultan, & Berman, 2012; Van Praag, 2003; Gimeno et al, 1997; Cooper et al., 1994;
Duchesneau & Gartner, 1990; Stuart & Abetti, 1990). To be able to identify current and future
successful ventures it is important to determine the drivers of successful ventures (Fried &
Tauer, 2015).
Business success could be regarded as the entrepreneur or other key actors being satisfied about the level of outputs produced relative to the inputs consumed in this process (Fried & Tauer, 2015; Bianchi & Biffignandi, 2012; Cooper & Artz, 1995; Chandler & Hanks, 1993)
15
It is of no doubt that higher economic performance, when non-economic performance remains
equal, increases the likelihood of survival (Gimeno et al, 1997). But it is especially relevant for
start-ups or pre-revenue firms whether non-economic performance influences the likelihood of
survival as well. When comparing firms with the same economic performance, different
mortality rates for firms exists, indicating that firms have different minimum viable levels of
economic performance or that the non-economic performance is influencing the mortality rate.
According to Gimeno et al, 1997 organizational survival is influenced by both the determinants
of economic and non-economic performance and minimum viable levels of performance.
Above is identified that it is relevant to investigate the determinants of non-economic
performance, because these determinants are influencing the probability of business success. It
is also identified that the determinants of business success can be categorized from a process
perspective between:
Characteristics of a successful business case (How good is the idea?)
Characteristics of a successful entrepreneurial team (How good is the entrepreneurial
team that will be exploiting this idea?)
Characteristics of successful progress (How long does the organization exists, which
stage is the organization in, and which events did the organization complete?)
2.2.1 Determinants of a successful business case
As identified in Chapter 1.4.2: the entrepreneurial process, before a firm is founded, a business
opportunity is recognized based on a business idea and the corresponding market potential (the
business case characteristics) (Volkmann, Tokarski, & Grünhagen, 2010). Recognizing and
selecting the right opportunities is one of the most important abilities of a successful
entrepreneur (Stevenson et al., 1985). The existence of a right opportunity means there are also
opportunities that are less feasible. This process of recognizing and selecting an opportunity
could ultimately lead to a venture proposal. Each year venture capitalists screen hundreds of
venture proposals before deciding whether to invest or to not invest in a venture (Sahlman,
1990). Over the years, venture capitalists have obtained experience with which investment
criteria to assess in order to predict whether a business will become successful or not.
As mentioned before in section 1.2.2: The Golden Egg Check , research has been done about how
venture capitalists evaluate IT venture proposals (Mensink, 2010). It is this research that is used
as a base for the GEC criteria. The findings of that research, are stated in Appendix I, the GEC
criteria are highlighted. For example, according to Mensink’s research, the five most important
The next sections will go in depth on these three categories of determinants.

16
investment criteria used in the Netherlands are: (1) the revenue model is scalable, (2) the
technology is scalable, (3) the entrepreneur can demonstrate a market demand, (4) the target
market has a large growth potential and (5) people will pay for the product. These five
investment criteria belong to the thirty-two GEC criteria as well. The GEC is available for this
research project to assess a business case. In section 3.1.1 is explained which criteria belong the
GEC framework and why the GEC is a useful tool to assess a business case.
2.2.2 Determinants of the successful entrepreneurial team
Human capital plays a critical role in the success of a new venture. It is the entrepreneurial team
that gathers resources and develops strategies to move the product through the market.
Resources alone are not enough to achieve competitive advantages and above-average
performance (Kakati, 2003). In Table 2.1 human capital determinants for business success are
obtained from various sources. Often used performance indicators are for example: education
level, industry specific experience, managerial experience and prior start-up experience.
In addition the ability to learn from a best practice influences the probability of business success
(Marmer et al., 2012). Usually when venture capitalists invest in a company they become
actively involved in the management of the company (Sahlman, 1990). This increases the
company’s performance because companies with helpful mentors are for example more likely to
raise money than companies without a mentor (Marmer et al., 2012). Not only a venture
capitalists belongs to the group of possible helpful mentors but also an industry guru, innovation
coach, incubator and accelerator.
The ability to listen to customer feedback influences the probability of business success.
Companies that are monitoring customer metrics have higher growth rates than companies that
are not tracking customer metrics (Marmer et al., 2012). Firms that are not acting accordingly on
feedback tend to scale without validating the size and interest of the market. This results in the
need to pivot the product more often. Every pivot costs time and money, unnecessary pivots
should be prevented (Marmer et al., 2012).
A business opportunity is recognized based on a business idea and the corresponding market
potential. Recognizing and selecting the right opportunities is one of the most important abilities
of a successful entrepreneur.

17
TABLE 2.1: HUMAN CAPITAL DETERMINANTS FOR BUSINESS SUCCESS
Authors Focus Determinants of
business success
(positive effect)
Determinants of
business success
(negative effect)
Bosma et al., 2004 Dutch
entrepreneurs
Education level, Industry
specific experience, Male,
Working long hours
Outside job
Cooper et al., 1994 Worldwide
entrepreneurs
Education level , Industry
specific experience
Minority race
Duchesneau &
Gartner, 1990
US entrepreneurs Entrepreneurial parents,
Personal investment,
Prior-startup experience,
Risk reducing behavior,
Working long hours
Gimeno et al, 1997 US entrepreneurs Education level ,
Managerial experience,
Multiple founders, Prior-
startup experience
Outside job
Kakati, 2003 High-tech
entrepreneurs
Capability to act on
feedback , Creativity,
Industry specific
experience, Managerial
experience
Marmer et al., 2012 Internet start-ups
from Silicon
Valley (US)
Ability to learn from a best
practice, Ability to track
customer metrics,
Capability to act on
feedback, Helpful mentors,
Multiple founders
Nielsen, 2015 Danish academic
entrepreneurs
Education level, Industry
specific experience,
Multiple founders
Stuart & Abetti,
1990
Technical US
ventures
Managerial experience,
Prior start-up experience
When looking at Table 2.1, striking is that there are a lot more determinants identified with a
positive effect than there are determinants with a negative effect. This might be because the
focus in literature is often on business success rather than on business failure. The author
suggests that future research about business failure determinants would be very useful.
The human capital determinants stated in Tabel 2.1 will be used to answer research question 2 in
section 2.3.2.

18
2.2.3 Determinants of successful progress
What the entrepreneurial team is doing in their day-to-day activities matters (Carter, Gartner, &
Reynolds, 1996). The kinds of events they undertake, how many events, and the sequence of
these events have a significant influence on the ability to create a successful venture (Carter,
Gartner, & Reynolds, 1996; Marmer et al. 2012). Start-ups evolve through different stages of
development, all can be identified with specific milestones and thresholds (Marmer et al., 2012).
Start-ups that are not moving consistently through the stages are called inconsistent, this would
happen when the start-up is completing events from a stage, but has not achieved the
completion milestones from a previous stage. This often happens when firms scale prematurely
(Marmer et al., 2012). According to research done for the Start-up genome report, inconsistent
start-ups are pivoting very often, or not at all. Indicating they make a lot of costs, pivoting very
often, or aren’t aware of what the market demands when they aren’t pivoting at all (Marmer et
al., 2012). Consistent companies raise significant more money and grow their employees
significant faster than inconsistent companies (Marmer et al., 2012).
Marmer et al., 2012 defined 6 different stages, and their average duration, but only 4 of them are
within the scope of this research project (see section 1.4.2: the entrepreneurial process).
Marmer et al., 2012 identified events that are characteristic for a certain stage of an IT start-up.
These events and their corresponding stages and duration are stated in Figure 2.1.
FIGURE 2.1: EVENTS FOR CORRESPONDING MARMER STAGES FOR IT INDUSTRY
The in figure 2.1 presented events are used by this research project to generate an IT start-up
roadmap. The actual progress of an IT start-up can then be compared with this roadmap to
determine whether an IT start-up is “doing the right things” (this will be further elaborated in
section 3.2.3). This means: completing the right events, in the right phase en within the right

19
time. A start-up is not progressing optimal when it is not completing events, and/or taking a lot
more time than average, and/or completing events that are not consistent with the ‘Marmer
stage’ the start-up is in.
2.3 Contributions of this chapter to the research questions
This chapter has identified the definitions and conclusions of previous research about business
success. Furthermore, determinants of business success from a process perspective have been
identified. Now that this information is stated, the first and second research question can be
solved.
2.3.1 RQ1: What definitions are used for business success in previous literature – and
which definition(s) is/are suitable for start-ups?
This project has identified the following definitions of business success:
The achievement of profitable growth should be regarded as business success
(Brännback et al., 2010; Davidsson, Steffens, & Fitzsimmons, 2009).
A successful firm produces some satisfying level of outputs compared to the inputs
consumed in this process (Fried & Tauer, 2015; Bianchi & Biffignandi, 2012).
The entrepreneur being satisfied about the business could be regarded as business
success (Cooper & Artz, 1995; Chandler & Hanks, 1993).
The feelings of satisfaction and completion when the business career is over (Hill, 2013).
Business success is the ability to survive without the necessity of a compulsory exit (Van
Praag, 2003).
But not all definitions are suitable for the scope of this research: IT start-ups. These firms often
have costs that are exceeding the cash inflows. Therefore the achievement of profitable growth
is not a suitable definition for business success for these firms. Because by definition most start-
ups are then not able to be successful. The definition opted by Hill is not a suitable definition
Determinants of successful progress are:
Type of events that are completed
Whether the event that is completed is consistent with the ‘Marmer stage’ the start-up is in
Time (Time that is elapsed since the founding of the organization)
These identified determinants of successful progress will be used to answer research question 2
in section 2.3.2.

20
because the objective of this research is to measure the performance of still going companies. A
possible definition of business success is opted by van Praag, the definition is as follows:
Business success is the ability to survive without the necessity of a compulsory exit (Van Praag,
2003). But, as mentioned before, survival rate solely is not very useful for this research project.
A suitable definition of business success is when “a start-up produces a satisfying level of
outputs relative to the inputs consumed in this process”. This in combination with the definition
that “the entrepreneur or other key actors being satisfied about the business could be regarded
as business success” could be merged into one new definition for business success. The new
definition then is as follows: business success could be regarded as the entrepreneur or other
key actors being satisfied about the level of outputs produced relative to the inputs consumed in
this process.
This project has a focus on business success from a process perspective, so the transformation
process from inputs into outputs is very relevant. The definition for business success used in this
project is:
2.3.2 RQ2: Which factors are determinant for start-up success of IT start-ups according
to previous research?
In section 2.2 this project has identified that determinants of IT start-up success can be
categorized between determinants of a successful business case (Table 2.2), determinants of the
successful entrepreneurial team (Table 2.3) and determinants of successful progress (Table 2.4).
TABLE 2.2: DETERMINANTS OF THE SUCCESSFUL VENTURE
Determinants of a
successful business case
Selecting the right
opportunity
Stevenson et al., 1985
Characteristics of the business
case itself
Volkmann, Tokarski, &
Grünhagen, 2010
TABLE 2.3: DETERMINANTS OF THE SUCCESSFUL ENTREPRENEURIAL TEAM
Determinants of the
successful entrepreneurial
team
Ability to learn from best
practice
Marmer et al., 2012
Ability to track customer
metrics
Marmer et al., 2012
Capability to act on feedback Kakati, 2003; Marmer et al,
Business success could be regarded as the entrepreneur or other key actors being satisfied about the level of outputs produced relative to the inputs consumed in this process (Fried & Tauer, 2015; Bianchi & Biffignandi, 2012; Cooper & Artz, 1995; Chandler & Hanks, 1993)

21
2012
Creativity Kakati, 2003
Education level Bosma et al, 2004; Cooper et
al., 1994; Gimeno et al, 1997;
Nielsen, 2015
Entrepreneurial parents Duchesneau & Gartner, 1990
Industry specific experience Bosma et al, 2004; Cooper et
al., 1994; Kakati, 2003;
Nielsen, 2015; Mensink, 2010
Managerial experience Gimeno et al, 1997; Kakati,
2003; Stuart & Abetti, 1990
Gender Bosma et al, 2004
Helpful mentors Sahlman, 1990; Marmer et al.,
2012
Race Cooper et al., 1994
Multiple founders Duchesneau & Gartner, 1990;
Gimeno et al, 1997; Marmer et
al, 2012; Nielsen, 2015
Personal Investment Duchesneau & Gartner, 1990
Prior start-up experience Duchesneau & Gartner, 1990;
Stuart & Abetti, 1990
Risk reducing Duchesneau & Gartner, 1990
Working long hours Bosma et al., 2004
Duchesneau & Gartner, 1990
Mensink, 2010
TABLE 2.4: DETERMINANTS OF SUCCESSFUL PROGRESS
Determinants of successful
progress
Type of events that are
completed
Carter, Gartner, & Reynolds,
1996; Marmer et al., 2012
Whether the event that is
completed is consistent with
the ‘Marmer stage’ the IT
start-up is in
Time (time that is elapsed
since the founding of the
organization)
The above stated determinants are used by this research project to quantify IT start-up
performance. These determinants are not necessarily directly measurable. In order to be able to
measure these determinants indicators are needed to be found and a scale needs to be defined.
Chapter 3 will address these topics.

22

23
3. METHODOLOGIES TO QUANTIFY START-UP PERFORMANCE
In chapter 2, addressing RQ2, is identified that the determinants of start-up success from a
process perspective can be categorized between three categories: (1) determinants of a
successful business case, (2) determinants of a successful entrepreneurial team, (3)
determinants of successful progress. Before being able to quantify start-up performance, the
individual determinants extracted from RQ2 are needed to be studied further. This chapter aims
to answer RQ3: What are suitable indicators for these identified determinants (section 3.1)– and
how can they be measured (section 3.2)?
3.1 Indicators for the determinants of start-up success
3.1.1 Indicators for the determinants of a successful business case
In section 2.2.1: determinants of a successful business case, and Table 2.2 is stated that the
determinants of a successful business case are (1) selecting the right opportunity and (2) the
characteristics of the business case itself. It is also mentioned that “the GEC is already available
for this project to assess the quality of a business case”. However, in order to be able to identify
whether the GEC can be used as an indicator for (1) and (2); information needs to obtained
about what a “right opportunity” is – if it is selected by the entrepreneur and whether the GEC
assesses (1) and (2).
It is not so obvious what a right opportunity entails. An opportunity is a chance to meet a market
need by delivering a product of superior value through a creative combination of resources
(Schumpeter, 1934; Kirzner, 1973; Casson, 1982). In other words: whether the entrepreneur is
solving a meaningful problem and if there are enough people interested in the solution (Marmer
et al, 2012).
This research project will now state which GEC criteria (Appendix I) corresponds, according to
the author, with the determinants of a successful business case.
Meet a market need, solving a meaningful problem and whether there are enough people interested
in the solution corresponds with the following GEC criteria:
People will pay for the product.
The target market is clear and can be defined.
The entrepreneur can demonstrate a market demand.
There is a large total available market.

24
The target market has a large growth potential.
Delivering a product of superior value through a creative combination of resources corresponds
with the following GEC criteria:
The product has a strong value proposition for a specific market.
The venture chose the most attractive position in the value chain.
The technology provides a sustainable competitive edge.
So a right opportunity is determined by whether the individual criteria from above are from a
sufficient level. This project has identified above what a right opportunities entails. But also (2),
the characteristics of the opportunity itself, is an important determinant of a successful business
case. (Other) Business case characteristics correspond with the following GEC criteria:
The technology has IP protection.
The technology is scalable.
The product is ready to market or has short time to market.
The venture is able to (know how to) defend their market in 2-3 years.
The product is scalable across geographies and has international potential.
Uncertain political factors do/will not interfere the market.
Competitors are present and known.
Revenue model is scalable.
Revenue model is attractive.
The above mentioned individual criteria (see also Table 3.1) are not directly quantitatively
measurable indicators per se. But these GEC investment criteria are qualitatively assessed by
expert checkers to determine the potential and feasibility of a business case.

25
TABLE 3.1: DETERMINANTS OF A SUCCESSFUL BUSINESS CASE WITH INDICATORS
Determinants of a
successful business
case
Determinant GEC criteria
Selecting the right
opportunity,
characteristics of the
business case itself.
- People will pay for the product.
- The target market is clear and can be defined.
- The entrepreneur can demonstrate a market
demand.
- There is a large total available market.
- The target market has a large growth potential.
- The product has a strong value proposition for a
specific market.
- The venture chose the most attractive position in
the value chain.
- The technology provides a sustainable
competitive edge.
- The technology has IP protection.
- The technology is scalable.
- The product is ready to market or has short time
to market.
- The venture is able to (know how to) defend their
market in 2-3 years.
- The product is scalable across geographies and
has international potential.
- Uncertain political factors do/will not interfere
the market.
- Competitors are present and known.
- Revenue model is scalable.
- Revenue model is attractive.
Table 3.1 suggests that the GEC is a useful tool to determine whether a business case is likely to
become successful. The GEC criteria addresses both whether a business case is a right
opportunity and the characteristics of the business case itself. However, the author could be
biased; in order to be able to check whether this statement is a valid statement, data obtained from
entrepreneurship experts will be analyzed (this will be further elaborated in section 4.1.2: the semi-
structured interview).
This research project uses the GEC score as an indicator for the determinants of a successful
business case.

26
3.1.2 Indicators for the determinants of a successful entrepreneurial team
From information stated in section 2.2.2: determinants of the successful entrepreneurial team,
and Table 2.3, sixteen different determinants of the successful entrepreneurial team can be
obtained. These sixteen different determinants all have support from literature. This project
uses the determinants that are found to be significant determinants by at least two different
research papers; from the initial sixteen determinants, eight remain. These eight determinants
(see Table 3.2) are all enhancing the probability of start-up success. The 8 determinants that are
not in this table are: ability to learn from best practice (combined with helpful mentors), ability
to track customer metrics (combined with capability to act on feedback), creativity,
entrepreneurial parents, gender, race, personal investment and risk reducing.
TABLE 3.2: DETERMINANTS OF THE SUCCESSFUL ENTREPRENEURIAL TEAM WITH INDICATORS
Determinants of the successful entrepreneurial team
Determinant Indicator Scale Capability to act on feedback (customer metrics)
The use of customer metrics for supporting managerial decisions (Marmer et al., 2012).
0=Team is using customer metrics 1= Team is not using customer metrics
Education level Education level of entrepreneurial team members (Cooper et al., 1994; Nielsen, 2015).
0=Member has less than a high school diploma 1=Member has a high school diploma 2=Member did some college, but no degree 3=Member has an associate degree(MBO) 4=….. Bachelor’s degree 5=….. Professional degree 6=…. Master’s degree 7= ….. Doctoral degree
Industry specific experience
Number of years of industry specific experience of entrepreneurial team members (Nielsen, 2015).
0=Member has no experience 1=0-½ years of experience 2=½-1 years of experience 3=1-2 years of experience 4=2-4 years of experience 5=4-8 years of experience 6=8-16 years of experience 7=16+ years of experience
Managerial experience
Number of years of managerial experience of entrepreneurial team members (Stuart & Abetti, 1990).
0=Member has no experience 1=0-½ years of experience 2=½-1 years of experience 3=1-2 years of experience 4=2-4 years of experience 5=4-8 years of experience 6=8-16 years of experience 7=16+ years of experience

27
Prior start-up experience
Number of prior start-ups that the entrepreneurial team has experience with (Stuart & Abetti, 1990).
0=No prior experience 1=1 Prior start-up 2=2 Prior start-ups 3=3 Prior start-ups 4=4 Prior start-ups 5=5 Prior start-ups 6=6 Prior start-ups 7=7+ Prior start-ups
Multiple founders Number of founders (Duchesneau & Gartner, 1990; Nielsen, 2015).
0=1 Founder 1=2 Founders 2=3 Founders 3=4 Founders 4=5 Founders 5=6 Founders 6=7 Founders 7=8+ Founders
Helpful mentors (best-practice) Mentors involved with the entrepreneurial team (Marmer et al, 2012).
0=Team has no mentors 1= Team is using mentors
Working long hours (full-time or more)
Number of hours worked by the entrepreneurial team (Bosma et al, 2004).
0=0-20 hours per week 1=20-25 hours per week 2=25-30 hours per week 3=30-35 hours per week 4=35-40 hours per week 5=40-45 hours per week 6=45-50 hours per week 7=50+ hours per week
The indicators for the above identified determinants are not necessarily obvious. For example,
an indicator of the determinant ‘industry specific experience’ could also be ‘number of industry
specific firms the team member has experience with’, or ‘number of people the team member
knows in a specific type of industry’. The chosen indicator for industry specific experience, in
this research project, is: ‘number of years of industry specific experience of entrepreneurial
team members’. The author expects that with more years of experience in a certain type of
industry, the network size of the team member likely increases and it is more likely that the
member has experience with multiple firms.
The chosen indicators all have support from literature. However the defined scale is not always
the same. For example, this research project scaled on a specific type of degree while Cooper et
al, 1994 scaled as follows: 0 = lower than a bachelor degree, 1 = bachelor degree or higher. This
research project chose a more specific scale in order to be able to get more concrete results for
desired levels of these indicators.

28
The relative importance and desired levels of these indicators will be determined by an analysis
of the data obtained from interviews with entrepreneurship experts. The author expects that
more is not necessarily better. For example, there might be higher levels of experience or
education that perform worse than lower levels.
3.1.3 Indicators for the determinants of successful progress
The determinants of successful progress are already identified in section 2.2.3 and Table 2.4. The
determinants are (1) the type of events that are completed, (2) time elapsed since start-up and
whether (3) the completed events are consistent with the ‘Marmer stage’ the IT start-up is in.
TABLE 3.3: DETERMINANTS OF SUCCESSFUL PROGRESS WITH INDICATORS
Determinants of
successful progress
Determinant Indicator
Type of event that is
completed
Whether a specific event is completed on
the roadmap.
Time Time elapsed since start-up.
Consistency with phase Whether the completed event is
consistent with the ‘Marmer stage’ of the
IT start-up.
This research project desires to compare the actual progress of an IT start-up with a roadmap
(planning) to identify whether a start-up is doing “the right things” and whether it is
progressing. How the in Table 3.3 stated determinants with the corresponding indicators will be
of use will be further elaborated in section 3.2.3: The Golden Roadmap.
3.2 Methodologies to quantify start-up performance
So far, this project has identified the determinants of IT start-up success from previous research
and stated suitable indicators to measure these determinants. But in order to be able to quantify
start-up performance the individual indicators are needed to be measured and compared with
desired values. This section will cover how these indicators are going to be measured.
3.2.1 Monitoring business case success
In sections 1.2.2 and 1.3.2 is mentioned that the GEC is a tool for predicting the potential and the
feasibility of a business case. In section 3.1.1 is stated which criteria the GEC assesses and why
the author suggests that the GEC score is a usable indicator for the determinants of a successful
business case.

29
The GEC score is used by this research project to assess whether a business case has potential
and if it is feasible. This assessment should be done every time some characteristic of the
business case has significantly changed. Because it is very likely that the ‘checker’ will evaluate
the business case different than before. The progress on the business case characteristics can be
derived from the comparison of different check moments with each other.
FIGURE 3.1: MONITORING BUSINESS CASE SUCCESS (GOLDEN EGG CHECK)
3.2.2 Monitoring entrepreneurial team success
Indicators for the determinants of a successful entrepreneurial team are stated in Table 3.2.
These indicators [e.g., years of managerial experience and level of education] are not difficult to
measure. However it is difficult to define what desired levels of these measurements are. How
much managerial experience is desired? Is it ten years? Or is it some other number of years? Is
twenty years of managerial experience significantly worse than thirty years or maybe even
better? Or is there not much difference? In order to be able to make a prediction of
entrepreneurial team performance, questions like these are needed to be answered. This project
has asked several entrepreneurship experts for their professional opinion on desired levels of
these indicators. The methodology and results of this research will be presented in the next
chapter.
The performance on the team criteria can then be obtained from the utility functions that are
generated based on data obtained from the conducted interviews and questionnaires. The
performance on all of the individual criteria can then be multiplied with their relative
importance in order to be able to obtain a “Golden Team Check score”. The “Golden Team Check
(GTC)” is suggested by the author as a name for the team assessment.

30
When a (new) team member is added or removed, the GTC needs to be done again. The level of
progress can then be obtained from comparing the two check moments with each other (see
Figure 3.2).
FIGURE 3.2: MONITORING ENTREPRENEURIAL TEAM SUCCESS (GOLDEN TEAM CHECK)
3.2.3 Monitoring successful progress
In section 3.1.3: indicators for the determinants of successful progress, is stated that the
extraction of meaningful information from the identified indicators of successful progress is
difficult; and that it should be compared with a roadmap of ideal progression or desired levels of
indicators. An ideal roadmap can be created from the events identified by Marmer et al., these
events are stated in section 2.2 (see also Figure 3.3).

31
FIGURE 3.3: MONITORING SUCCESSFUL PROGRESS (GOLDEN ROADMAP)
The following indicators are identified in section 3.1.3: (1) whether a specific event is completed
on the roadmap, (2) time elapsed since start-up and (3) consistency with the ‘Marmer stage’ of
the IT start-up. The roadmap, which the author calls the “Golden Roadmap (GRM)”, stated in
Figure 3.3, is used by this research project to compare the actual progression of a start-up with
desired progression. In order to be able to monitor the progression of a start-up; a start-up
should mark an event as completed, when they have completed a specific event. When this is
done, metrics can be tracked; whether a firm is progressing at all, how fast, and how consistent
they are moving with what is perceived by the author, as ideal progression.
The GRM is used by this research project to track the progress of an IT start-up. When all
activities are completed within the right timeframe and in the right order an IT start-up scores
100%. But no matter how good an IT start-up performed in the past, stagnation means decline.
For more info on a possible scoring system used in the GRM see Table 3.4. See Figure 3.4 for an
example of how it could graphically look like.
TABLE 3.4: GOLDEN ROADMAP SCORING SYSTEM (EXAMPLE)
Minimum score 0%
Maximum score 100%
Decline rate/day 100/(total number of days in stage)%
Increase rate/completed event 100/(total number of events in stage)%
Penalty/completed event that is not
consistent with ‘Marmer stage’
10%
FIGURE 3.4: MONITORING SUCCESSFUL PROGRESS (GOLDEN ROADMAP) (EXAMPLE)
0
10
20
30
40
50
60
70
80
90
100
0 50
10
0
15
0
20
0
25
0
30
0
35
0
40
0
45
0
50
0
55
0
60
0
65
0
70
0
75
0
80
0
85
0
90
0
GRM SCORE
Days after founding team formed
Progress (Golden Roadmap)

32
3.3 Contributions of this chapter to the research questions
This chapter has identified what the indicators for the determinants of start-up success are. And
methods to quantify or qualify the start-up performance, using these indicators. This chapter
aims to present sufficient information to answer the following research question: What are
suitable indicators for these identified determinants – and how can they be measured?
The GEC score is an indicator for the determinants of a successful business case. The author
suggests that when a business case characteristic has significantly changed a new GEC needs
to be done.
Suitable indicators for the determinants of the successful entrepreneurial team are:
customer metrics used for supporting managerial decisions (yes/no), education level of
team members, number of years of industry specific experience of team members, number of
years of managerial experience of team members, number of prior start-ups, number of
founders, (best-practice) mentor (yes/no) and number of hours by founding team. The
entrepreneurial team indicators are individually assessed within the GTC. The author
suggests that when a team member is removed or added a new GTC needs to be done.
Suitable indicators for the determinants of successful progress are: time, whether a specific
event is completed on the roadmap and consistency with the ‘Marmer stage’ of the IT start-
up. The author suggests to measure progress continuously with the GRM.
TABLE 3.5: DETERMINANTS OF SUCCESSFUL IT START-UP SUCCESS AND INDICATORS
Determinants of a
successful
business case
Determinant Indicator Measured
with
Selecting the right
opportunity
#GEC Score
GEC The characteristics
of the successful
business
case/opportunity.
#GEC Score
Determinants of
the successful
entrepreneurial
team
Capability to act on
feedback (customer
metrics)
The use of customer metrics for
supporting managerial decisions
GTC
Education level Education level of team member
Industry specific
experience
Years of specific experience of team
member
Managerial
experience
Years of managerial experience of
team member
Prior start-up
experience
Number of prior start-ups of team
member

33
Multiple founders Number of founders
Helpful mentors (best-practice) Mentors involved with
the entrepreneurial team
Working long hours
(full-time or more)
Number of hours per week by team
members
Determinants of
successful
progress
Type of event that is
completed
Whether a specific event is completed
on the roadmap.
GRM Time Time (t) elapsed since start-up.
Consistency Whether the completed event is
consistent with the ‘Marmer stage’ of
the IT start-up.
The determinants and their corresponding indicators that are stated in table 3.5 are used to
answer RQ3 and ultimately will be used to quantify IT start-up performance. However, before it
is possible to quantify IT start-up performance, the relative importance of these factors are
needed to be determined. The next chapter will address the relative importance of these factors
by analyzing data obtained from interviews with entrepreneurship experts.

34

35
4. ANALYSIS: DETERMINANTS OF START-UP SUCCESS AND
THEIR RELATIVE IMPORTANCE
This project desires to quantify start-up performance. In order to being able to do this, the
relative importance of each of the determinants of IT start-up success are needed to be
determined first. Interviews with entrepreneurship experts are conducted to obtain relevant
data so that the relative importance can be deducted from the data. The methodology used for
the data collection is described in section 4.1. Section 4.2 will address the sample size of the data
collection. The findings of this research project will be presented in section 4.3. RQ4: “What is
the relative importance of these factors that are determinant for IT start-up success from a process
perspective?” is addressing the relative importance of these factors. This question will be
answered in section 4.4.
4.1 Data collection
This project has identified which factors are influencing the probability of IT start-up success.
But it is not clear yet to which extent these individual determinants are influencing the
probability of success. And how to rate the performance on these individual determinants. A
method that can be used to determine the value of certain levels of performance are ‘utility
functions’. With this method one has to rate the individual levels of the scale for their relative
contribution. The worst alternative always scores 0 and the best alternative always scores 100.
For example, for the performance of an IT start-up a bachelor’s degree (#4) might be
very important, scoring 90, while entrepreneurs with an associate degree (#3) are not so
likely to become successful, scoring 40. Entrepreneurs with a master’s degree (#5) are
the most likely to become successful and is the best alternative, scoring 100. Between
level #3 and #4 is a 50 point difference while from level #4 to #5 is only a 10 point
difference. Indicating that the step from an associate degree to a bachelor degree is a
huge step forward while the difference between a bachelor’s degree and a master’s
degree for the probability of IT start-up success is relatively small.
In order to being able to determine such utility functions, semi-structured interviews with
entrepreneurship experts are used. The entrepreneurship experts interviewed for this project
are VCs, business developers, one accelerator and successful IT entrepreneurs of ongoing IT
start-ups. The individual utility functions are all subjective estimates but the median estimate of
a group can be more accurate than estimates of an individual expert (Galton, 1907). This
phenomenon called “The wisdom of crowds” is also supported by examples from stock markets,

36
political elections, and quiz shows (Surowiecki, 2004). That’s why this project obtained data so
that statistics like median, mean and variance can be used to make conclusion about the relative
importance of each of the individual determinants. The relative importance of the determinants
are a necessity to quantify IT start-up performance. The conducted interviews are also a
resource to identify any shortcomings from the methodologies used.
4.1.1 Questionnaires
In order to be able to obtain relevant information from the interviews, the right questions are
needed to be asked. The interviews done with the entrepreneurship experts is a mix of a semi-
structured interview with questionnaires. The questionnaires are formulated in such way that
SMARTS (Edward & Barron, 1994), a simple multi-attribute utility measurement method, can be
used to calculate the weights of the individual determinants. The questionnaire (Appendix II) is
structured as follows:
Question 1: The entrepreneurship expert ranks the following entrepreneurial team criteria in order
of importance for the success of an IT start-up.
(1) is most important for the performance of an entrepreneurial IT team (8) is least important
TABLE 4.1: QUESTION 1 FROM THE QUESTIONNAIRE
# Use of customer metrics to support managerial decisions
# Level of education
# Industry specific experience
# Managerial experience
# Prior start-up experience
# Multiple founders (more than 1)
# Helpful mentors
# Working long hours (full-time or more dedication)
The objective of this question (Table 4.1) is to be able to give the relative importance of the
individual entrepreneurial team criteria. With this ranking methodology the entrepreneurship
expert is forced to make decisions about the individual importance of the criteria. This is
different from the often used methodology: 5-point Likert-scale. Where one could rank every
individual criteria as very important (creating less difference between the individual criteria).
Questions 2-7: The scale of the individual entrepreneurial team criteria (level of education, industry
specific experience, managerial experience, prior start-up experience, multiple founders, helpful
mentors and working long hours) are rated for their utility.

37
Please rate scale below to utility 0-100.. (0=minimum, 100=maximum) 0 and 100 are both
mandatory.
TABLE 4.2: QUESTION 2 FROM THE QUESTIONNAIRE (LEVEL OF EDUCATION (EXAMPLE))
# Level Utility (fill
in)
# Level Utility (fill
in)
0 Less than a high-school diploma 4 Bachelor’s degree
1 High school diploma 5 Master’s degree
2 Some college, no degree 6 Professional degree
3 Associate degree (MBO) 7 Doctoral degree
The objective of the questions 2-7 (example in Table 4.2) is to rate the scale of the individual
determinants for utility. This is necessary because the highest level, for example a doctoral
degree, is not necessarily the best level for the performance of an IT start-up. And the difference
between these individual levels might not be the same. The entrepreneurial team criteria: ‘use of
customer metrics to support managerial decisions’ and ‘helpful mentors’ do not have their own
utility question. This is because yes, the best alternative, is always scoring 100 points and no, the
worst alternative, 0 points. These indicators are less accurate.
Question 8: The three categories of determinants (business case, entrepreneurial team and
progress) are rated for their contribution to IT start-up success.
Please rate the contribution of the individual criteria towards a prediction for IT start-up
success: (Divide 100 points between the 3 criteria, higher number means more important)
TABLE 4.3: QUESTION 8 FROM THE QUESTIONNAIRE
Criteria Score
Characteristics of the business case
Characteristics of the entrepreneurial team
Characteristics of the progress of a start-up
Finally the last question of the questionnaire (Table 4.3), question 8, the entrepreneurship
experts needs to determine the relative importance of the three categories. 100 points can be
divided between the three categories. This methodology is chosen above a ranking method like
in question 1, because it is relatively easy to divide 100 points between 3 categories in contrast
to the 8 categories in question 1.

38
4.1.2 The semi-structured interview
The questionnaires are a part of the semi-structured interview (Appendix III). At the beginning
of the interview attention is dedicated to whether the GEC is a useful tool to assess if an IT
business case is likely to become successful or not. When the entrepreneurship expert is not
familiar with the GEC the most important investment criteria that the GEC assesses are shown.
The interviewee is then asked to identify whether each individual investment criteria are useful
criteria to assess if an IT business case is a good business case and whether there are criteria
that the interviewee would have expected but are not present. In the next part of the interview
the focus is with the entrepreneurial team criteria. Question 1-7 of the questionnaires are going
to be answered in this part of the interview. At every question the interviewer asked what a
desired level of performance is and whether the individual criteria is a ‘knock-out criteria’,
meaning that if the performance comes below a certain level the entrepreneurship expert thinks
that the start-up is doomed to fail. The interviewer will also ask whether there are
entrepreneurial team criteria missing that the interviewer would have expected. After the
entrepreneurial team questions it is time for addressing the determinants of successful progress.
To determine whether the determinants of successful progress are suitable “The Golden
Roadmap (Figure 3.3)” is shown and questions are asked about if an event is contributing to IT
start-up success. Questions are also asked about if there are events and determinants missing
and whether the duration of the stages are likely to be true. The answers of these questions will
be contributing to whether the identified determinants and identified indicators are suitable for
measuring IT start-up performance. And what the shortcomings from this project are.
4.2 Sample size
In total nine persons have participated in either a semi-structured interview or a questionnaire
(usually both, see table 4.4: sample size of this research project). The people interviewed can be
categorized between: entrepreneurs, accelerators, VCs and business developers. Only one
person participated in an online survey without participating in a semi-structured interview. All
participants belong to a specific company (see Table 4.5: participating companies to this
research project), the Golden Egg Check B.V had 3 employees participating to the interviews.
TABLE 4.4: SAMPLE SIZE OF THIS RESEARCH PROJECT
Entreprene
urs
Accelerator VCs Business
developers
Totals
Questionnaire 3 1 2 3 9
Semi-structured
interview
2 1 2 3 8

39
TABLE 4.5: PARTICIPATING COMPANIES TO THIS RESEARCH PROJECT
Participating company Category
MoneyBird Entrepreneur
Fortes Entrepreneur
Niles Entrepreneur
LLX² investments Accelerator
Value creation and company (VCXC) VC
Van den ende & Deitmers (Endeit) VC
Golden Egg Check B.V. Business developer
Entrepreneurship expertise is obtained from different angles, however the sample size is still
relative small. Keep this in mind when analyzing the results in section 4.3.
4.3 Findings
The questionnaires are used to gather information about the relative importance of the
identified determinants. Findings from these questionnaires are presented in section 4.3.1 and
4.3.2. The semi-structured interviews are used to identify shortcomings of the methodologies
used in this project and whether there are determinants that the participant had expected are
missing in this research project. Findings from the semi-structured interviews are presented in
section 4.3.3.
4.3.1 Findings from the questionnaires – importance of entrepreneurial team criteria
The first findings are about the relative importance of the entrepreneurial team determinants of
IT start-up success (presented in Table 4.6). The participant of the questionnaire is asked to
rank the entrepreneurial team determinants as follows: 1 is the most important determinant
and 8 is the least important determinant. The observations of individual determinants are
collected and combined, rank, mean, median and standard deviation (SD) are presented for all
individual determinants.

40
TABLE 4.6: IMPORTANCE OF ENTREPRENEURIAL TEAM CRITERIA RANKED (1 IS MOST IMPORTANT, 8 IS
LEAST IMPORTANT)
Determinants of entrepreneurial team
success
Rank (mean) Rank (median) SD
Prior start-up experience 1 (2.6) 1 (2) 1.9
Industry specific experience 2 (3.6) 2 (4) 1.1
Multiple Founders 3 (4.1) 2 (4) 2.8
Use of customer metrics to support
managerial decisions
4 (4.3) 2 (4) 2.2
Helpful mentors 5 (5.0) 5 (5) 2.1
Working long hours 5 (5.0) 7 (6) 2.1
Managerial experience 7 (5.7) 5 (5) 2.5
Level of education 8 (5.8) 7 (6) 2.2
When analyzing the mean statistics it can been seen that prior start-up experience is ranked as
the most important entrepreneurial team criteria and level of education the least important.
Also the median statistics confirm this statement.
The relative importance of each of the determinants can be deducted from the results presented
in Table 4.6 (This will be further elaborated in the next chapter). But, in order to be able to
quantify start-up performance the utility of levels of performance on these determinants are
needed to be presented and analyzed first.
4.3.2 Findings from the questionnaires – levels of performance on each individual
determinant
Entrepreneurship experts are asked to score the utility (0-100) of different levels of
performance on each individual determinant. Utility functions can be deducted from the results
of these questions. These (unnormalized) utility functions will be presented in this section. More
detailed information can be found in Appendix IV: utility of levels of performance. In this
Appendix there are tables of mean, median, standard deviation and 95%-confidence intervals of
the individual utility levels of performance.

41
FIGURE 4.1: PRIOR START-UP EXPERIENCE UTILITY FUNCTION
Entrepreneurship experts identified prior start-up experience as the most important criteria for
the performance of IT start-ups. The utility function is plotted in Figure 4.2. They identified that
four prior start-ups is the best level of performance (utility of 86.3) and no experience as the
worst level of performance (utility of 3.9). The step from no experience to 1 prior start-up
(utility of 66.5) is a huge leap forward, compared to the step from two prior start-ups (utility of
82.1) to the best level of four prior start-ups (utility of 86.3). The utility function is declining
after the fourth prior start-up, indicating that prior start-up experience after the fourth prior
start-up decreases the probability that an IT start-up becomes successful. Seven or more prior
start-ups (utility of 72.2) scores worse than two prior start-ups (utility of 82.1).
So entrepreneurship experts think that some prior start-up experience has a huge benefit to the
probability that an IT start-up will become successful but that too much experience decreases
the probability. “Serial entrepreneurs are not dedicated enough to a single start-up” or “serial
entrepreneurs are less likely to chase a dream or something they truly believe will change the
world” are some quotes heard during the semi-structured interviews.
0102030405060708090
100
Prior start-up experience

42
FIGURE 4.2: INDUSTRY SPECIFIC EXPERIENCE UTILITY FUNCTION
Four to eight years of industry specific experience is the most desired level of performance
(utility of 91.1), while no experience scores the worst (utility of 4.4). On first sight, the function
in Figure 4.3 looks linear, but the scale on the x-axis is logarithmic. After four to eight years of
experience the function declines, 16+ years of experience (utility of 64.1) scores worse than one
to two years of experience (utility of 65.2).
As is the case with prior start-up experience, some industry specific experience adds a lot of
utility while more is not necessarily better. Striking is, when an industry guru is the founder of
an IT start-up the probability of IT start-up success is not better than with one to two years of
experience. Experts might “associate being an industry guru with an older person as a founder” or
as being “crusted in the industry and not being able to ‘think outside of the box’”.
FIGURE 4.3: MULTIPLE FOUNDERS UTILITY FUNCTION
0102030405060708090
100
Industry specific experience:
0102030405060708090
100
Multiple founders

43
Three founders are regarded as the most optimal founding team size (utility of 91.9), while 8 or
more founders is a “recipe for disaster” (utility of 7.8). From a single founder start-up (utility of
43.2) to a two founder start-up (utility of 78.8) is the biggest possible improvement while from
three founders (utility of 91.9) to four founders (utility of 59.8) is the biggest possible decline. In
the end the utility function seems to flatten out.
When looking at the 95%-confidence interval (see Appendix IV) it can been seen that with 95%
certainty can be said that 3 founders have higher chances of IT start-up success than one or 4 or
more founders. Only the 95%-confidence interval of two founders are crossing the interval of
three founders, indicating that with 95% certainty not can be said that three founders have
higher probabilities of IT start-up success than two founders.
FIGURE 4.4: WORKING LONG HOURS UTILITY FUNCTION
The worst level of performance is the expected 0-20 hours (utility of 0), every single expert
rated the 0-20 level an utility of 0. The best level of performance is 45-50 worked hours (utility
of 92.5) while not showing a significant difference from the 50+ level (utility of 92.2).
Remarkably, the biggest increase in utility is from 30-35 worked hours (utility of 34.1) to 35-40
worked hours (utility of 62.2). This indicates that experts do not believe in founders that are not
working full time, and that the added hours in the 35-40 level are more efficient than hours
added above 40+ worked hours. With 95%-confidence (see appendix IV) can be said that
founders that are working 45+ hours have higher changes to succeed than founders that are
working less than 35 hours a week.
0
10
20
30
40
50
60
70
80
90
100
0-20hours
20-25hours
25-30hours
30-35hours
35-40hours
40-45hours
45-50hours
50+hours
Working long hours

44
FIGURE 4.5: MANAGERIAL EXPERIENCE UTILITY FUNCTION
Managerial experience has an odd looking utility function. This is also the determinant with the
highest standard deviations and the widest 95%-confidence intervals. Experts seems to be
uncertain how to rate managerial experience. The worst level of performance is no experience
(utility of 3.9), and the best level of performance 4-8 years of managerial experience (utility of
82.2). The biggest increase in utility can be obtained from an increase from 0-½ years of
experience (utility of 27.2) towards ½-1 years of experience (utility of 53.3). Some managerial
experience helps a lot, but 8-16 years of experience scores worse than 2-4 years of experience.
FIGURE 4.6: EDUCATION LEVEL UTILITY FUNCTION
Education level is identified as the level that is contributing the least towards IT start-up
success. Every expert rated less than a high-school degree with an utility of 0. A master’s degree
0102030405060708090
Managerial experience
0102030405060708090
100
Education level:

45
is the best alternative (utility of 94.8). The biggest improvement in utility is the step from an
associate’s degree (utility of 41.7) to a bachelor’s degree (utility of 84.9). Striking is that a
doctoral degree (utility of 63.1) scores significantly worse than a master’s degree.
“Entrepreneurs with a doctoral degree are too analytic”, “they are not leaving their basements”,
“they think that their product is never good enough to enter the market” are some quotes from
the experts. In fact with a 95%-confidence interval (see Appendix IV) can be said that founders
with a master’s degree are more likely to become successful than founders with a doctoral
degree or less than a bachelor’s degree.
4.3.3 Findings from the questionnaires – relative importance of categories of determinants
TABLE 4.7: DETERMINANTS OF IT START-UP SUCCESS AND THEIR CONTRIBUTION (DIVIDE 100 POINTS
BETWEEN 3 CATEGORIES)
Determinants Mean Median SD
Of a successful business case 25 25 8.9
Of a successful
entrepreneurial team
36.25 40 11.3
Or successful progress 38.75 42.5 13.8
FIGURE 4.7: IMPORTANCE OF THE DETERMINANTSS OF IT START-UP SUCCESS
Finally the last question of the questionnaire addresses the relative importance of the three
categories of determinants. When looking at Table 4.7 and Figure 4.7 it can been seen that the
determinants of successful progress (GRM) is seen as the most predicative for IT start-up
success (39%). While characteristics of the business case (25%) are the least predicative.
25; 25%
36,25; 36%
38,75; 39% Business case
Team
Progress

46
4.3.4 Findings from the semi-structured interviews – business case characteristics
When the business case characteristics were discussed, the most important GEC criteria are
used as a framework to discuss whether the individual criteria are predicative for IT start-up
success. The investment criteria the GEC assesses were indeed often seen as the most important
factors to determine whether an IT start-up will become successful.
The entrepreneurship experts did not have many critical notes on the GEC criteria. ‘Target
market and venture has large growth potential’ is identified as an important investment criteria
for VCs however, an “IT start-up could also become successful in a niche”.
The general consensus of the experts was that the GEC is a suitable tool to assess the business
case characteristics provided that the ‘checker’ is someone with know-how of the relevant
market and start-up scene. The GEC is a tool that qualitatively assesses criteria, so when an
checker has a sufficiently level of know-how it can put the critical notes from above in
perspective.
4.3.5 Findings from the semi-structured interviews – entrepreneurial team criteria
The entrepreneurship experts were asked whether the team criteria are all contributing to IT
start-up success and whether there are factors missing that they would have expected. They all
said that the factors were important and they ranked them accordingly. But, almost every expert
said that the biggest shortcoming from the entrepreneurial team criteria used in this research
project that the complementarity of the team members is not reflected. “A huge problem for IT
start-ups is that they often have excellent technical employees and/or founders but that they are
not able to sell their product, because they are missing excellent sales employees”. It is true that
this is not a criteria used for the Golden Team Check so it is not quantitatively assessed.
However, a GEC criteria is: “The team has complimentary skills and competences” which can be
qualitatively assessed. Experts also said they would have expected a criteria that assesses
whether the entrepreneurial team member has experience with each other. Because it happens
often that a recently founded team in reality has no synergy.
These two factors are shortcomings in the model, however it does not mean that the ‘golden
team check’ is not useable at all. Further research needs to be done about these two factors and
how they can be used in the GTC .

47
4.3.6 Findings from the semi-structured interviews – progress characteristics
In this part of the interview, the GRM was shown to the entrepreneurship experts. The
interviewee was asked whether each individual event contributed to IT start-up success. Most of
the experts said that the financial events (family & friends financing, seed funding and large A-
round) are not predicative for IT start-up success. They are only necessary when extra money is
needed. All experts said that joining an incubator or accelerator is definitely not necessarily,
especially when there are other mentors available. Viral growth is also something that is not
happening very often (especially not in business to business) and is not an indicator for IT start-
up success per se. All the other events were identified as being important factors. One major
factor that kept coming back that is missing from the golden roadmap is pricing model
validation. It appears to be a major concern for IT start-ups how to price their product.
In the end of the interview most of the experts were ecstatic about the GRM and said that it is an
excellent tool to diagnose whether an IT start-up is progressing.
4.4 Contributions of this chapter to the research questions
This chapter presented how data is collected with the help of questionnaires and semi-
structured interviews. Furthermore, the sample size of this research project is stated and with
whom the interviews are conducted. Finally the findings of these interviews are presented and
analyzed. This chapter aims to present sufficient information to answer RQ4: “What is the
relative importance of these factors that are determinant for IT start-up success from a process
perspective? “
This research question is answered with the help of the information that is presented in section
4.3. A summary from this information is stated in Table 4.9. The entrepreneurial team criteria
are ranked in Table 4.6. When applying the SMARTS method (Edward & Barron, 1994), weights
of the ranked entrepreneurial team criteria can be calculated with the following formula:
If K is the number of attributes then the weight of the kth (kth rank) attribute is:
wk = (1/K) ∑ (1/𝑖)𝐾𝑖=𝑘
𝑊hen applying this formula to the ranked entrepreneurial team determinants in Table 4.6, the
weights, according to data of this research project, can be determined (see Table 4.8). These
weights can be multiplied with the utility score of the performance on an individual determinant
in order to generate a total entrepreneurial team score.

48
TABLE 4.8: RELATIVE IMPORTANCE OF THE FACTORS THAT ARE DETERMINANT FOR IT START-UP
SUCCESS
Relative importance of the determinants
Business case
25%
Entrepreneurial team
36%
Progress
39%
GEC score
100%
U(Prior start-up experience) 33.97% GRM score
100% U(Industry specific experience) 21.47%
U(Multiple founders) 15.22%
U(Use of customer metrics) 11.06%
U(Helpful mentors) 6.68%
U(Working long hours) 6.68%
U(Managerial experience) 3.35%
U(Education level) 1.56%
In the next chapter, the relative importance identified above, will be implemented in a model
that is able to quantify IT start-up performance.

49
5. IMPLEMENTATION: QUANTIFICATION OF START-UP
PERFORMANCE
In the previous chapters is identified that IT start-up success from a process perspective is
determined by (1) the determinants of a successful business case, (2) the determinants of a
successful entrepreneurial team and (3) the determinants of successful business case progress.
This research project also identified how to measure these determinants and their relative
importance. This information can be used to generate a model to quantify start-up performance.
But before the final quantitative model is presented a visual presentation of the process
perspective is given in section 5.1. This process perspective is the foundation for the in section
5.2 presented start-up success index.
5.1 Golden Sifter
Before a useful model can be developed, it is necessary to create an understanding of how the
determinants, (1), (2) and (3) are related to each other and how these factors are going to be
used to monitor start-up performance. A process perspective (see figure 5.1) can be generated
with the help of the models stated in section 3.2.1 (Golden Egg Check), 3.2.2 (Golden Team
Check) and 3.2.3 (Golden Roadmap).
FIGURE 5.1: THE GOLDEN SIFTER
50
“The Golden Sifter”, referring to the currently available Golden Egg Check, is the name given to
this perspective by the author. The Golden Sifter is a metaphor for the ideal entrepreneurial
process where waste is left behind or extracted from the inputs. The different layers in The
Golden Sifter are representing the process questions: the what, the who and the when; or
respectively the business case potential/feasibility check (GEC), the entrepreneurial team check
(GTC) and the business progress check (GRM). Every layer questions a different aspect of
whether an IT start-up will be successful or not. These layers will reveal where potential waste
might occur and why it might occur. At the end of The Golden Sifter is the start-up success index
which will be explained in section 5.2. The start-up success index functions as a valve; it is
indicative for how well inputs are converted when flowing out of the sifter (outputs). A high
number is indicative for inputs that are converted efficiently into outputs, the process is flowing
well, without a lot of waste. On the other hand, a low number means that the process is not
flowing well, because of inputs that are converted into a lot of waste, instead of the desired
outputs.
The Golden Sifter should be a useful tool for predicting if and why waste will occur and whether
an IT start-up is likely to become successful or not. Instead of measuring performance with the
usual statistic [e.g., profit, ROI, revenue, churn], which are effects; performance is measured
from a process perspective which is the cause. These usual statistics are lagging and influenced
by chance. Measuring performance based on these statistics is “scoreboard journalism”,
referring to the fact that people are caring for results instead of the process of how it is achieved.
Of course results are important, but when The Golden Sifter is used to measure start-up
performance, waste can be prevented before it occured. And when an entrepreneurial process is
both efficient and effective start-up success will be very likely to happen.
5.2 Start-up success index
The start-up success index (SSI) that is already introduced in section 5.1 is the representative
quantitative model for IT start-up performance. This index is representative for the factors that
are determinant for start-up success; these factors are the business case potential and feasibility
(GEC), the entrepreneurial team is an indicator for how well the start-up is exploiting the
business case (GTC) and how fast the business case is progressing (GRM). A high number should
be indicative for IT start-up success and a low number should be indicative for start-up failure.
In other words the number should be a representative prediction of whether an IT start-up firm
is likely to be successful or not from a process perspective.

51
TABLE 5.1: START-UP SUCCESS INDEX
Start-up success index: 0.25 * GECscore + 0.36 * GTCscore + 0.39 * GRMscore
Business case
25%
Entrepreneurial team
36%
Progress
39%
GEC score
100%
GTC score 100% GRM score
100% U(Prior start-up experience) 33.97%
U(Industry specific experience) 21.47%
U(Multiple founders) 15.22%
U(Use of customer metrics) 11.06%
U(Helpful mentors) 6.68%
U(Working long hours) 6.68%
U(Managerial experience) 3.35%
U(Education level) 1.56%
In chapter 4 is identified what the relative importance of the determinants are (see also Table
5.1). This intelligence can be used to generate the final start-up success index. The start-up
success index is built from the three different layers of The Golden Sifter perspective. The GEC
score can be used multiplied by the relative importance of the business case determinants. The
performance on the entrepreneurial team determinants can be derived from the normalized
utility functions and multiplied by the relative importance of the entrepreneurial team
determinants. The GRM score can be multiplied by the relative importance of the progress
determinants. The following formula can then be created based on the dataset of this research
project: SSI = 0.25 * GECscore + 0.36 * GTCscore + 0.39 * GRMscore.
The above created index is an example of how a formula could look like (the current numbers are
based upon data obtained from this research project). The author suggests to do more research to
obtain a bigger sample size and a continuous learning model (for more information see section 6.3:
limitations and recommendations for future research).

52

53
6. DISCUSSION
The objective of this research project is to create an quantitative model that is representative for
IT start-up performance from a process perspective. This research project identified
performance determinants, their relative importance and presented the “Golden Sifter” and the
start-up success index (SSI) to quantify IT start-up performance. This chapter presents the
answer to the problem statement in section 6.1 and what it has for practical implications in
Section 6.2. Also some shortcomings and recommendations for future research are given in
Section 6.3.
6.1 Conclusions
The problem statement that this research project aimed to solve is: “Which factors are
determinants for early stage IT start-up success from a process perspective – and what is the
relative importance of each of the determinants?”
A number of determinants were identified with the help of previous literature. Semi-structured
interviews with entrepreneurship experts were conducted in order to be able to identify
whether the identified determinants from previous research are indeed important for IT start-
up success. Instead of comparing the correlation of these determinants with output variables
[e.g., profit or revenue], questionnaires were conducted to use the wisdom of the crowd about
desired values of these determinants. In order to be able to identify these desired values,
entrepreneurship experts had to scale the performance on these determinants for their utility to
IT start-up success.
An overview of the most important findings of this research project is presented in Table 6.1 and
Table 6.2.
TABLE 6.1: MAIN FINDINGS: RELATIVE IMPORTANCE OF DETERMINANTS
Determinants Relative importance for IT start-up success
Progress determinants 0.39
Entrepreneurial team determinants 0.36
Business Case determinants 0.25
Striking is that the business case determinants are the least predicative for IT start-up success.
Some entrepreneurship experts said that “an excellent business case exploited by a bad
entrepreneurial team is doomed to fail while an excellent entrepreneurial team will find a way to

54
make the business case work”. The most predicative effect for success was attributed to the
progress determinants.
In previous research entrepreneurial team criteria are seen as more important to VCs than
product and market related investment criteria (business case determinants) (Mensink, 2010).
This research shows that entrepreneurial team determinants are indeed seen as the
determinants with the most predicative effect for IT start-up success. In conclusion, VCs
justifiably assesses the entrepreneurial team criteria as the most important criteria.
TABLE 6.2: MAIN FINDINGS: ENTREPRENEURIAL TEAM DETERMINANTS
Rank (mean) Determinants of entrepreneurial team success
Level with highest utility
Biggest increase in utility
Biggest decrease in utility
1 (2.6) Prior start-up experience
4 Prior start-ups No experience to one prior start-up
6 prior start-ups to 7+ prior start-ups
2 (3.6) Industry specific experience
4-8 years of industry specific experience
0-½years of experience to ½-1 years of experience
8-16 years of experience to 16+ years of experience
3 (4.1) Multiple Founders
Three founders From one founder to two founders
From three founders to four founders
4 (4.3) Use of customer metrics to support managerial decisions
5 (5.0) Helpful mentors 5 (5.0) Working long
hours 45-50 hours a week
From 30-35 hours to 35-40 hours
From 45-50 hours to 50+ hours
7 (5.7) Managerial experience
4-8 years of managerial experience
0-½years of experience to ½-1 years of experience
4-8 years of experience to 8-16 years of experience
8 (5.8) Level of education
Master’s degree From an associate degree to a bachelor’s degree
From a professional degree to a doctoral degree
Prior start-up experience is seen as the determinant with the most positive effect on IT start-up
success by experts while level of education was generally seen as the least important contributor
for IT start-up success. All the experience curves showed a very steep utility gain in the
beginning while in the end it flattens out. Hence some experience helps a lot while more
experience is not necessary better. The ideal levels of performance on these determinants were

55
not the industry guru level or the managerial guru level. Thus according to these experts having
too much experience does exist. People with too much experience might be crusted and might
not be able to think outside of the box.
The ideal entrepreneurial team consists of three founders. This research project showed that
with 95% confidence can be said that three founders is better than one or four or more
founders. The biggest decrease in utility is when a fourth member is added and the biggest
possible increase is when one founder seeks an extra founder. The ideal entrepreneurial team
works 45-50 hours a week, this is more than the accepted 40 hour workweek but it is generally
accepted that entrepreneurs are making more hours than employees. The most effective hours
added are in the 35-40 hour interval.
Entrepreneurship experts believe that level of education is the least predicative from the
identified factors for IT start-up success. People with a doctoral degree are believed to be
significantly worse IT entrepreneurs than people with a master’s degree.
Concluding, in a perfect world, the business case of the IT start-ups scores 100% in the GEC, the
start-up is founded by three members all with master degrees and each of them works on average
45-50 hours a week. Throughout their careers they obtained 4-8 years of industry specific and
managerial experience as well as having experience from 4 prior start-ups. To be able to make the
best possible decisions they are making use of customer metrics and have a rich network of helpful
mentors. They are completing all the events, that are consistent with their corresponding stages, as
the Golden Roadmap suggests and that all within the right time frame.
6.2 Practical implication
6.2.1 For IT start-ups
This research project presented useful information for IT start-ups, for example, the ideal
founding team consists of three founders that are working 45-50 hours with a master’s degree.
So a single founder might want to look for 1 or two extra founders. Especially if these founders
bring some extra industry specific and prior start-up experience and a master’s degree. The IT
start-up entrepreneur can check with the presented start-up success index whether the IT start-
up is likely to become successful or not. The entrepreneur can then make adjustments based on
the score of the index. When making the correct adjustments the probability that the start-up
will become successful will be enhanced.

56
6.2.2 For consultancy organizations, innovation coaches and venture capitalists
Supporting organizations can also use the start-up success index as a tool to diagnose whether
an IT start-up is likely to become successful and whether an (portfolio) organization is making
progress. The results of this tool can be analyzed and used as the foundation for coaching or an
investment decision. Consultancy can be given based on the identified determinants and their
ideal performance levels.
6.2.3 For Golden Egg Check B.V.
Golden Egg Check B.V. can extent their GEC software with an implementation of The Golden
Sifter perspective and the Start-up success index. In addition to the already existing GEC, it will
add extra checks in the form of the Golden Team Check and the Golden Roadmap. Golden Egg
Check B.V. is then able to offer their customers a tool where they can also measure progress with
and provide customers with better consultancy.
6.3 Research limitations and recommendations for future research
This research project chose an unconventional approach to identify how performance on
individual determinants influences IT start-up success. This research did not do a statistical
analysis of how each level of performance correlates with actual output variables like revenue
and profit. Instead utility functions of expert opinions were generated by doing questionnaires
with entrepreneurship experts. But this unconventional approach was for a reason, early stage
IT start-ups often do not have any significant revenue or profit. Revenue and profit are effects,
the process of the IT start-up is the cause. That is why this research project chose a process
perspective.
But there might be some limitations on this methodology used. The experts based their opinions
on their own observations and experiences with IT start-ups. These observations are subjective
and experts might have answered the questionnaires with what they thought was beneficial for
this research topic. Although entrepreneurship experts from different type of stakeholders were
asked to participate in this research project, these experts are all men, from the Netherlands and
the sample size is relatively small. Female experts or experts from a different country might
have a totally different view on which factors are determinant for IT start-up success.
The determinants that are used in the start-up success index are not all the possible
determinants of IT start-up success. For example most experts said that “complementarity of the
founders and their experience together is an important determinant for IT start-up success”, these

57
determinants are in no way measured in the opted Golden Team Check. Future research can be
done for example in the direction of whether an entrepreneurial team is complementary. And
whether the entrepreneurial team’s experience with each other has a significant influence on IT
start-up success. This research project could be a framework for future research, but then with a
bigger sample size and/or with another type of industry and/or within another country. The
same approach as this research project could be used for any type of industry (e.g.,
nanotechnology, health care) and in any country.
Further research can be done whether the opted start-up success index is indeed predicative for
IT start-up success, investigating it’s correlation with different output variables. And how the
opted start-up success index could be a continuous learning model. The author suggests to do
additional research in the direction of business failure determinants.

58
REFERENCES
Allen, K. (2003). Launching new ventures - an entrepreneurial approach. Boston/New York.
Amit, R., Glosten, L., & Mueller, E. (1993). Challenges to theory development in entrepreneurship research. Journal of Management Studies, 30: 815-834.
Bianchi, A., & Biffignandi, S. (2012). A new index of entrepreneurship measure.
Blank, S. (2013). The four steps to the Epiphany.
Bosma et al. (2004). The value of human and social capital investments for the business performance of startups. Small business economics 23, 227-236.
Brännback et al. (2010). Much ado about nearly nothing? An exploratory study on the myth of high-growth technology start-up entrepreneurship. Frontiers of entrepreneurship research, Article 1.
Brush, C. (2001). From initial idea to unique advantage: the entrepreneurial challenge of constructing a resource base. Academy of Management Executive, 15: 64-81.
Carter, N. M., Gartner, W. M., & Reynolds, P. D. (1996). Exploring star-up event sequences. Journal of business venturing 11, 151-166.
Casson, M. (1982). The entrepreneur. Totowa: Barnes & Noble Books.
CBS. (2015). Statline. Retrieved mei 27, 2015, from Centraal bureau voor de statistiek: http://www.cbs.nl/nl-NL/menu/themas/bedrijven/cijfers/default.htm
Chandler, G. N., & Hanks, S. H. (1993). Measuring the performance of emerging businesses: a validation study. Journal of business venturing 8, 391-408.
Combs et al. (2005). The dimensionality of organizational performance and its implications for strategic management research. Research in methodology in strategic management, 259-286.
Cooper et al. (1994). Initial human and financial capital as predictors of new venture performance. Journal of business venturing 9, 371-395.
Cooper, A. C. (1993). Challenges in predicting new firm performance. Journal of business venturing 8, 241-253.
Cooper, A. C., & Artz, K. W. (1995). Determinants of satisfaction for entrepreneurs. Journal of Business Venturing, 439-457.
Davidsson, Steffens, & Fitzsimmons. (2009). Growing profitable or growing from profits: putting the horse in front of the cart? Journal of business venturing 24, 388-406.
Duchesneau, D. A., & Gartner, W. B. (1990). A Profile of new venture succes and failure in an emerging industry. Journal of Business Venturing 5, 297-312.
Edward, W., & Barron, H. F. (1994). SMARTS and SMARTER: Improved simple methods for multiattribute utility measurement. Organizational behavior and human decision processes 60, 306-325.

59
Fried, H. O., & Tauer, L. W. (2015). An entrepreneur performance index. Springer Science+Business Media New York.
Galton, F. (1907). Vox populi. Nature 75:7.
Gimeno et al. (1997). Survival of the fittest? Entrepreneurial human capital and the persistance of underperforming firms. Administrative science quarterly 42, 750-783.
Hill, B. (2013). Business success definition. Retrieved 6 4, 2015, from Small Business Chron: http://smallbusiness.chron.com/business-success-definition-3254.html
Hisrisch, R., & Peters, M. (2002). Entrepreneurship: international edition. Boston.
Kakati, M. (2003). Success criteria in high-tech new ventures. Technovation 23, 447-457.
Katz, J., & Gartner, W. B. (1998). Properties of emerging organizations. Academy of Management review, 13: 429-441.
Kirzner, I. (1973). Competition and Entrepreneurship. Chicago, IL.: University of Chicago.
Kiviluoto, N. (2013). Growth as evidence of firm succes: myth or a reality? Entrepreneurship & Regional development: An international edition 25:7, 569-586.
Marmer et al. (2012). Start-up genome report: A new framework for understanding why start-ups succeed.
Marmer et al. (2012). Start-up genome report: A new framework for understanding why start-ups succeed.
Mensink, T. (2010). An empirical study about early-stage IT and internet venture capitalists in the Netherlands, Singapore and Sweden. Enschede.
Nielsen, K. (2015). Human capital and new venture performance: the industry choice and performance of academic entrepreneurs. J Technol transf 40, 453-474.
Pinchot, G. I. (1985). Intrapreneuring. New York: Harper & Row.
Sahlman, W. A. (1990). The structure and governance of venture-capital organizations. Journal of financial economics 27, 473-521.
Schumpeter, J. (1934). Capitalism, Socialism, and Democracy. New York: Harper&Row.
Shane, S., & Venkataraman, S. (2000). The promise of entrepreneurship as a field of research. Academy of Management Review, 25: 217-226.
Stevenson et al. (1985). New business ventures and the entrepreneur. Illinois: Irwin Homewood.
Stuart, R. W., & Abetti, P. A. (1990). Impact of entrepreneurial and management experience on early performance. Journal of business venturing 5 , 151-162.
Surowiecki, J. (2004). The wisdom of crowds: Why the many are smarter than the few and how collective wisdom shapes business, economies, societies, and nations. New York: Doubleday Books.
Van Praag, C. M. (2003). Business survival and success of young small business owners. Small business economics, 21: 1-17.

60
Venkatraman, N., & Ramanujam, J. (1986). Measurement of business performance in strategy research: a comparison of approaches. Academy of management review, 801-814.
Volkmann, C., Tokarski, K., & Grünhagen, M. (2010). Entrepreneurship in a European perspective. Wiesbaden: Springer Fachmedien.

A
APPENDIX I: VENTURE CAPITALISTS’ INVESTMENT CRITERIA
(GOLDEN EGG CHECK CRITERIA)
Highlighted criteria: Criteria that the GEC assesses to determine the feasibility and business
potential of a business case. These criteria are a selection of the investment criteria that VCs use
to assess IT business propositions in the Netherlands, Singapore and Sweden (Mensink, 2010).
These criteria are assessed as one of the following options: fully present, somewhat present, not
present or unable to assess due to lack of information.
Criteria
The Netherlands Singapore Sweden
Mean SD Aver. Mean SD Aver. Mean SD Aver.
The entrepreneur's personality
Capable of sustained intense effort 4,17 0,72
3,68
4,45 0,52
4,02
4,10 0,74
3,60
Able to evaluate and react to risk well 4,25 0,62 4,27 0,65 4,00 0,47
Ability to articulate well when discussing the
venture 3,75 0,75 4,09 0,83 3,30 0,82
Attends to detail 3,55 0,69 3,91 0,30 3,50 0,53
Has a personality compatible with mine 2,67 0,98 3,36 0,81 3,10 0,88
The entrepreneur's experience
Thoroughly familiar with the market targeted
by venture 4,50 0,52
3,45
4,45 0,69
3,47
3,90 0,88
3,20
Demonstrated leadership ability in past 3,50 0,67 3,82 0,60 3,40 0,70
Has a track record relevant to venture 3,83 0,94 3,27 0,79 3,20 1,03
The entrepreneur was referred to me by a
trustworthy source 2,83 1,03 3,09 0,94 2,90 1,20
I am already familiar with the entrepreneur’s
reputation 2,58 0,67 2,73 0,47 2,56 1,24
Characteristics of the product or service and
business model
The product is new, unique, and has substantial
innovative content 3,75 0,62
3,69
3,55 1,04
3,75
3,60 0,97
3,41
A strategy is available to protect the products
uniqueness 3,42 0,51 4,45 0,69 3,50 0,53
The product or technology has IP protection 2,92 0,90 3,55 0,82 3,10 0,57
The technology provides a sustainable
competitive edge 4,25 0,75 4,45 0,52 4,40 0,84

B
The product is difficult to copy 3,67 0,49 4,09 0,70 3,50 0,53
The product has an evolving innovation 3,67 0,78 3,82 0,60 3,20 0,92
The product has a disruptive innovation 3,17 1,11 3,64 0,67 2,89 0,93
The technology is scalable 4,67 0,49 4,64 0,50 3,90 0,74
The technology is proven and validated 3,83 0,83 3,45 1,04 3,30 0,48
The product has been developed to the point of
a functioning prototype 4,17 0,83 3,55 1,29 3,60 1,26
The product is ready to market or has short
time to market 4,08 1,00 3,55 1,04 3,90 0,88
The product can be adopted by customers
without a significant behavioural change 3,67 0,65 3,55 0,82 3,80 0,42
The product enjoys demonstrated market
acceptance 3,67 0,89 3,36 1,12 3,10 0,57
The product solves a painful problem of a
customer 4,25 0,62 4,00 0,63 4,00 0,67
The product is involved in the core business of
the customer 3,50 1,00 3,36 0,81 2,60 0,84
The product is easy to understand and
communicate 3,42 0,90 3,91 0,70 3,30 0,67
The product performance is superior to
competitors' products 4,08 0,79 3,82 0,75 3,60 0,70
The product is consistent with corporate
strategy of my company 2,83 0,83 3,18 1,25 2,60 1,07
The product is resistant to economic cycles 3,00 0,63 3,27 0,65 2,80 0,63
Characteristics of the market
The target market is clear and can be defined 3,92 0,67
3,66
4,36 0,67
3,70
3,89 0,60
3,49
The entrepreneur can demonstrate a market
demand 4,67 0,65 4,27 0,79 4,22 0,44
The entrepreneur can demonstrate a market
gap 3,55 0,82 3,91 0,70 3,33 1,00
The venture is in a dynamic, disruptive market
with attractive patterns 3,33 0,98 3,73 0,79 3,00 0,87
The target market has a large growth potential 4,67 0,49 4,45 0,52 3,78 0,83
The implied growth rate between the ventures'
size today and in 3-5 years is realistic 4,33 0,49 4,00 0,89 4,22 0,67
The venture has a large growth potential 4,58 0,51 4,45 0,69 4,22 0,67
There is a large total available market 4,50 0,67 4,27 0,65 4,11 0,33
The total available market can be benchmarked
for an accurate prediction of the size 3,33 0,65 3,55 0,52 3,33 0,50

C
The venture is able to (know how to) defend
their market in 2-3 years 3,83 0,39 4,09 0,70 3,78 0,67
There is little threat of competition during the
first 2-3 years 2,83 0,39 3,09 1,04 2,89 0,78
The product has the competitive advantage to
be no. 1 or 2 in the market 3,83 0,72 3,91 0,54 3,56 0,73
An attractive position and/ or large potential
market share can be claimed in the market 4,00 0,74 4,09 0,70 3,44 0,73
The product is scalable across geographies and
has international potential 4,25 0,97 4,36 0,81 4,00 0,71
The venture can use its customer's international
network to enter new markets 3,33 0,65 3,36 0,81 3,00 0,50
(Uncertain) political factors do/ will not
interfere the market 3,17 0,94 3,09 0,54 3,44 0,73
The entrepreneurs' vision on market growth is
not too underestimated 3,27 1,01 3,55 0,69 3,44 1,01
The entrepreneurs' vision on market growth is
not too overestimated 3,45 1,04 3,55 0,93 3,00 0,71
Competitors are present and known 3,50 1,17 3,55 1,04 3,22 0,97
Customers are known and/ or there are already
some customers 4,00 0,74 3,36 1,03 3,89 0,93
I get good referrals from customers/
professionals/ competitors/ other VCs about
the venture 3,50 0,90 3,36 0,81 3,67 1,00
The venture has relations with stakeholders
(customers/ service providers/networks) 3,50 1,08 3,50 0,85 3,75 0,89
The venture enjoys a first mover advantage 3,08 0,67 3,18 0,75 2,67 1,00
The venture is able to maintain their first mover
advantage 3,42 0,67 3,60 0,84 3,11 1,17
The venture choose the most attractive position
in the value chain 3,58 0,67 3,55 0,52 3,56 0,73
The venture found a niche market 2,64 0,92 3,18 0,87 3,22 0,83
The product is different than the trend in the
market 1,92 0,79 2,82 1,08 2,13 1,25
The product is conform the trend in the market 2,83 1,11 3,00 0,94 2,63 0,92
Barriers to entry should not be too difficult for
the venture 3,00 1,28 3,10 0,88 3,13 0,83
The venture will stimulate an existing market 3,00 0,85 3,09 0,70 3,43 0,98
The venture will create a new market 2,33 0,78 2,91 0,70 2,38 0,92

D
The venture will transform the market 2,75 0,62 3,27 0,79 2,50 1,20
The venture is in an industry with which I am
familiar 4,00 1,10 3,36 1,21 3,00 0,50
The product has a strong value proposition for a
specific target market 4,58 0,67 4,27 1,01 4,22 0,83
The value proposition is different from
competitors 3,92 0,67 4,00 0,89 3,56 0,88
The value proposition provides barriers to entry 3,50 0,80 3,82 0,60 3,89 0,33
The value proposition fits in the value chain 3,64 0,81 4,18 0,60 3,78 0,67
The product is a 'must have' or 'need to have' 4,33 0,98 3,91 0,83 3,89 0,78
People will pay for the product 4,64 0,50 4,27 1,01 4,22 1,30
The revenue model is proven in small scale 4,08 0,67 3,36 1,03 3,78 0,83
The revenue model is proven internationally 2,83 0,72 2,91 0,70 3,11 0,93
The revenue model is attractive 4,42 0,51 4,45 0,52 4,11 0,78
The revenue models adds value 4,45 0,52 4,09 0,70 3,67 1,22
The revenue model is scalable 4,83 0,39 4,55 0,52 3,89 0,78
Financial considerations
I require a return equal to at least 10 times my
investment within 5-10 years* 4,08 0,90
3,56
4,00 0,89
3,82
3,56 1,01
3,37 I require an investment that can be easily made
liquid (e.g., taken public or acquired) 3,17 1,11 3,91 0,70 3,78 0,97
I require a return equal to at least 10 times my
investment within at least 5 years 3,42 0,67 3,55 0,82 2,78 0,83
*The GEC assesses: I require a return equal to at least 7 times my investment within 5-
10 years.
The Golden Egg Check also assesses criteria that are not from Mensink’s research:
The team has complimentary skills and competences.
There is a good organization in place that can support the team.
The venture is not highly dependent on a small number of customers.
The venture is not highly dependent on a small number of suppliers.
Alliances or partners are present that adds value to venture.
The venture aims at further development of the product or technology.
Assumptions with respect to costs are realistic and well defined.
Assumptions with respect to revenue are realistic and well defined.
A realistic exit strategy (buyout, IPO) can be defined.

E
APPENDIX II: QUESTIONNAIRES
1) Can you put the following entrepreneurial team criteria in order of importance: (1) is most important for the performance of an entrepreneurial IT team (8) is least important # Use of customer metrics to support managerial decisions # Level of education # Industry specific experience # Managerial experience # Prior start-up experience # Multiple founders (more than 1) # Helpful mentors # Working long hours (full-time or more dedication) 2) Education level: Please rate scale below to utility: 0-100.. (0=min, 100=max) # Level Utility (fill
in) # Level Utility (fill
in) 0 Less than a high-school diploma 4 Bachelor’s degree 1 High school diploma 5 Master’s degree
2 Some college, no degree 6 Professional degree 3 Associate degree (MBO) 7 Doctoral degree 3) Industry specific experience: Please rate scale below to utility: 0-100.. (0=min, 100=max) Years Level Utility (fill in) Years Level Utility (fill
in) 0 No experience 2-4 Decent amount of
experience
0-½ Very little experience 4-8 Experienced
½-1 Little experience 8-16 Very experienced 1-2 Some experience 16+ Industry guru 4) Managerial experience Please rate scale below to utility: 0-100.. (0=min, 100=max) Years Level Utility (fill in) Years Level Utility (fill
in) 0 No experience 2-4 Decent amount of
experience
0-½ Very little experience 4-8 Experienced
½-1 Little experience 8-16 Very experienced 1-2 Some experience 16+ Managerial guru

F
5) Prior start-up experience Please rate scale below to utility: 0-100.. (0=min, 100=max) # Level Utility (fill in) # Level Utility (fill
in) 0 No experience 4 Prior start-ups 1 Prior start-up 5 Prior start-ups
2 Prior start-ups 6 Prior start-ups 3 Prior start-ups 7+ Prior start-ups 6) Multiple founders Please rate scale below to utility: 0-100.. (0=min, 100=max) # Level Utility (fill in) # Level Utility (fill
in) 1 Founder 5 Founders 2 Founders 6 Founders
3 Founders 7 Founders 4 Founders 8+ Founders 7) Working long hours Please rate scale below to utility: 0-100.. (0=min, 100=max) # Level Utility (fill in) # Level Utility (fill
in) 0-20 Avg. hours per week 35-40 Avg. hours per week 20-25 Avg. hours per week 40-45 Avg. hours per week
25-30 Avg. hours per week 45-50 Avg. hours per week 30-35 Avg. hours per week 50+ Avg. hours per week 8) Importance: business case – team – progress
Please rate the contribution of the individual criteria towards a prediction for IT start-up success: (Divide 100 points between the 3 criteria, higher number means more important)
Criteria Score Characteristics of the business case Characteristics of the entrepreneurial team Characteristics of the progress of a start-up

G
APPENDIX III INTERVIEW GUIDE
Welkom bij het interview,
Allereerst wil ik zeggen dat het interview in het Nederlands zal verlopen hoewel veel begrippen
in het Engels zullen zijn. Uiteraard kan ik bij enig ontstane verwarring toelichting geven op deze
begrippen. Mijn scriptie is in het Engels en om de resultaten bruikbaar te maken zullen de
invuloefeningen ook in het Engels zijn. Het interview zal ongeveer anderhalf uur duren. Heeft u
er bezwaar bij dat het interview zal worden opgenomen? Het is enkel voor eigen gebruik, en zo
kan ik mijn aandacht voldoende bij het gesprek houden i.p.v. notulen te maken.
* Start opname
Met behulp van literatuur onderzoek is bepaald welke factoren een bijdragen hebben aan het
succes van een (IT) start-up vanuit een procesperspectief. Deze factoren komen uit drie
categorieën: eigenschappen van de business case (product en markt), eigenschappen van het
ondernemersteam (bijvoorbeeld opleidingsniveau en industrie specifieke ervaring) en
eigenschappen van de voortgang van een business case (welke events heeft het bedrijf
doorlopen).
Vaak is het zo met deze factoren dat het is vastgesteld dat een factor een positieve of negatieve
bijdrage heeft voor de prestaties van een ondernemersteam, maar het is niet duidelijk wat
gewenste hoogtes zijn en of bijvoorbeeld 20 jaar ervaring significant beter is dan bijvoorbeeld
25 jaar ervaring. Daarom probeer ik met behulp van interviews met o.a. investeerders,
ondernemers en wetenschappers een soort “wisdom of the crowd” te verkrijgen over gewenste
hoogtes van deze factoren.
Ook heeft het onderzoek een roadmap vastgesteld met fases en bijbehorende events
(bijvoorbeeld, minimum viable product, eerste betalende klant en wederkerende klanten) die
typerend zijn voor bijna elke IT Start-ups. Deze roadmap kan behulpzaam zijn voor het
monitoren van de progressie van een start-up. Het interview zal ook gebruikt worden voor de
validatie van deze roadmap (welke events missen er? draagt een bepaald event wel bij of niet bij
aan het succes van een start-up etc.).
Graag zou ik uw mening/kennis willen horen over wat u nou denkt dat cruciaal is voor het
succes van een start-up en welke van de geïdentificeerde factoren juist wel of juist niet bepalend
zijn.

H
Business case assessment:
Allereerst gaan we het hebben over de karakteristieken van een business case. Dit zijn
karakteristieken dat o.a. het product, de markt en de technologie betreft van een onderneming of
onderneming in wording.
1: Golden Egg Check: Bent u bekend met de Golden Egg Check en het gebruik van deze tool?
(Nee, ga verder naar vraag 2).
Zo ja: Vind u de Golden Egg Check een bruikbare tool om te bepalen of een IT business
opportunity een goede business case is?
Een business opportunity is een kans om te een vraag vanuit de markt te behoeven door het leveren
van een product dat toegevoegde waarde heeft en wat ontstaan is uit een creatieve combinatie van
grondstoffen.
- Wat mis je, of wat zijn de tekortkomingen van de Golden Egg Check voor het bepalen of
een business case een business case is die succesvol kan worden? (het gaat hier niet om
gebruiksissues)
2. De golden Egg Check is gebaseerd op investeringscriteria die Venture Capitalists uit
Singapore, Zweden en Nederland gebruiken tijdens het beoordelen van een business case. De
belangrijkste criteria die naar voren kwamen uit het onderzoek van Thomas Mensink zijn
gegeven in Appendix 1. Wilt u Appendix 1 even voor u nemen en de criteria even doornemen?
Vind u deze criteria bepalend voor het succes van een IT startup? (we kunnen ze even 1
voor 1 aflopen)
Mist er volgens u een belangrijk criteria waar u erg op let?
Zijn er voor u duidelijke tekortkomingen wanneer deze criteria worden gebruikt om te
bepalen of een IT bedrijf succesvol zou kunnen worden of niet?
Entrepreneurial team assessment
3. Ook het ondernemers team is bepalend voor het succes van een IT start-up. De volgende 9
vragen gaan over eigenschappen van het ondernemersteam. Op het blad voor u heeft u bij de
eerste invultabel een lijst met 8 criteria die belangrijk zijn voor de kans of een IT start-up
succesvol wordt of niet. Wilt u deze 8 criteria bestuderen en vervolgens op volgorde zette van

I
mate waarin u deze belangrijk acht voor het behalen van IT start-up succes. 1 is het meest
belangrijke criteria en 8 dus het minst belangrijke criteria.
(1) is most important for the performance of an entrepreneurial IT team (8) is least important
# Use of customer metrics to support managerial decisions
# Level of education
# Industry specific experience
# Managerial experience
# Prior start-up experience
# Multiple founders (more than 1)
# Helpful mentors
# Working long hours (full-time or more dedication)
4. Als u nog even terug gaat naar de lijst die u net heeft gezien. Zijn er in deze lijst criteria die u
wel had verwacht maar die er niet instaan?
5. Denk u dat de criteria in deze lijst allemaal bepalend zijn voor het behalen van IT start-up
succes of niet?
6. Education level Als er een ondernemersteam naar u toekomt en u krijgt de vraag om een
inschatting te maken over de succeskansen van dit ondernemersteam. Het gaat hierbij weer om
een ondernemersteam achter een IT start-up.
Wat zou voor u gemiddeld opleidingsniveau zijn van het ondernemersteam dat u graag
zou willen zien?
Vind u dat het opleidingsniveau een afvalcriteria is? D.w.z. dat als er bijvoorbeeld een
ondernemingsteam met een heel laag opleidingsniveau naar u toekomt dat u er geen
vertrouwen in heeft? Of zou u ongeacht het opleidingsniveau het toch een kans geven zolang de
rest maar goed is?
Zou u nu willen kijken naar invultabel 2 . U wordt geacht de volgende opleidingsniveaus een
cijfer te geven volgens een nutfunctie. D.w.z. U geeft het een cijfer waarin een bepaald
opleidingsniveau volgens u gevoel bijdrage heeft voor het succes van een IT start-up. Het
slechtste alternatief krijgt automatisch een 0, en het beste alternatief krijgt automatisch een 100.
Het zou bijvoorbeeld kunnen zijn dat u weinig verschil vind tussen een bepaald niveau van
opleiding en dat deze dus hetzelfde, of ongeveer hetzelfde scoren maar dat u wel heel graag een

J
minimum opleidingsnivau ziet. Het hoogste opleidingsniveau hoeft ook niet persee het beste te
zijn, het kan zijn dat u vindt dat deze juist niet goed is voor het succes van een IT start-up.
Please rate scale below to utility: 0-100.. (0=min, 100=max)
# Level Utility (fill
in)
# Level Utility (fill
in)
0 Less than a high-school diploma 4 Bachelor’s degree
1 High school diploma 5 Master’s degree
2 Some college, no degree 6 Professional degree
3 Associate degree (MBO) 7 Doctoral degree
7. Industry specific experience Dit is hetzelfde type vraag als de vorige vraag. Er is dus weer
een ondernemers team naar u toekomt om een inschatting te maken voor de succeskansen van
dit IT start-up team.
Wat zou u voor een gemiddeld industrie specifieke ervaringsniveau zien?
Vind u dat Industrie specifieke ervaringsniveau een afval criteria is?
Zou u nu willen kijken naar invultabel 3?
Years Level Utility (fill in) Years Level Utility (fill
in)
0 No experience 2-4 Decent amount of
experience
0-½ Very little experience 4-8 Experienced
½-1 Little experience 8-16 Very experienced
1-2 Some experience 16+ Industry guru
8. Managerial experience Dit is hetzelfde type vraag als de vorige vraag. Er is dus weer een
ondernemers team naar u toekomt om een inschatting te maken voor de succeskansen van dit IT
start-up team.
Wat zou u voor een gemiddeld managementervaringsniveau zien?
Vind u dat managementervaringsniveau zien een afval criteria is?
Zou u nu willen kijken naar invultabel 4?

K
Years Level Utility (fill in) Years Level Utility (fill
in)
0 No experience 2-4 Decent amount of
experience
0-½ Very little experience 4-8 Experienced
½-1 Little experience 8-16 Very experienced
1-2 Some experience 16+ Managerial guru
9. Prior start-up experience Dit is hetzelfde type vraag als de vorige vraag. Er is dus weer een
ondernemers team naar u toekomt om een inschatting te maken voor de succeskansen van dit IT
start-up team.
Wat zou u voor een gemiddeld ervaringsniveau met voorgaande start-ups zien?
Vind u dat ervaringsniveau met voorgaande start-ups een afval criteria is?
Zou u nu willen kijken naar invultabel 5?
# Level Utility (fill in) # Level Utility (fill
in)
0 No experience 4 Prior start-ups
1 Prior start-up 5 Prior start-ups
2 Prior start-ups 6 Prior start-ups
3 Prior start-ups 7+ Prior start-ups
10. Multiple founders Dit is hetzelfde type vraag als de vorige vraag. Er is dus weer een
ondernemers team naar u toekomt om een inschatting te maken voor de succeskansen van dit IT
start-up team.
Wat zou u voor een gemiddeld aantal oprichters zien?
Vind u dat het aantal oprichters een afval criteria is?

L
Zou u nu willen kijken naar invultabel 6?
# Level Utility (fill in) # Level Utility (fill
in)
1 Founder 5 Founders
2 Founders 6 Founders
3 Founders 7 Founders
4 Founders 8+ Founders
11. Working long hours Dit is hetzelfde type vraag als de vorige vraag. Er is dus weer een
ondernemers team naar u toekomt om een inschatting te maken voor de succeskansen van dit IT
start-up team.
Wat zou u voor een gemiddeld aantal werkuren per week van de oprichters zien?
Vind u dat het gemiddeld aantal werkuren per week van de oprichters een afval criteria
is?
Zou u nu willen kijken naar invultabel 7?
# Level Utility (fill in) # Level Utility (fill
in)
0-20 Avg. hours per week 35-40 Avg. hours per week
20-25 Avg. hours per week 40-45 Avg. hours per week
25-30 Avg. hours per week 45-50 Avg. hours per week
30-35 Avg. hours per week 50+ Avg. hours per week
Progress
12. Roadmap we gaan nu kijken naar de gecreëerde roadmap in Appendix 2. Dit is een lijst met
events en de bijbehorende fases en gem. tijd die voor deze fases nodig zijn om af te ronden. We
gaan deze events even 1 voor 1 door en het is aan u om te bepalen of een event bijdraagt aan het
succes van een IT start-up.
Mist u events voor een IT start-up die u wel had verwacht?

M
Vind u de tijdschaal voor de fases een realistische aanname voor IT start-ups?
13. We zijn nu bijna klaar, ik vraag u enkel om te kijken naar invultabel 8. Zou u daarin aan
willen geven hoe belangrijk u de 3 criteria vindt voor het succes van een IT start-up? U heeft 100
punten te verdelen tussen de 3 criteria.
Criteria Score
Characteristics of the business case
Characteristics of the entrepreneurial team
Characteristics of the progress of a start-up
Bedankt voor het interview!

N
APPENDIX IV: UTILITY OF LEVELS OF PERFORMANCE
Prior start-up experience Level Mean Median SD 95%-confidence
interval 0 – No experience 3.9 0 11.7 0 – 11.5 1 – 1 Prior start-up 66.5 54.5 30.1 46.9 – 86.2 2 – 2 Prior start-ups 82.1 90 24.8 65.9 – 98.2 3 – 3 Prior start-ups 85.9 90 18.6 73.7 – 98.0 4 – 4 Prior start-ups 86.3 90 16.4 75.6 – 97.1 5 – 5 Prior start-ups 84.0 100 22.5 69.3 – 98.7 6 – 6 Prior start-ups 79.5 90 32.3 58.4 – 100 7 – 7+ Prior start-ups 72.2 70 33.5 50.4 – 94.1
Industry Specific Experience Level Mean Median SD 95%-confidence
interval 0 – No experience 4.4 0 13.3 0 – 13.2 1 – 0 - ½ years of exp. 23.0 10 21.6 8.9 – 37.2 2 – ½ - 1 years of exp. 47.7 44.4 29.8 28.2- 67.2 3 – 1 – 2 years of exp. 65.2 66.7 22.9 50.2 – 80.2 4 – 2 – 4 years of exp. 80.0 80 19.4 67.3 – 92.7 5 – 4 – 8 years of exp. 91.1 100 15.4 81.1 – 100 6 – 8 – 16 years of exp 78.8 90 31.0 58.5 -99.0 7 – 16+ years of exp. 64.1 70 36.4 40.3 – 87.8
Multiple founders Level Mean Median SD 95%-confidence
interval 0 – 1 Founder 43.2 50 36.1 19.6 – 66.8 1 – 2 Founders 78.8 85.7 25.2 62.3 – 95.3 2 – 3 Founders 91.9 100 16.3 81.2 – 100 3 – 4 Founders 59.8 50 24.7 43.7 – 76.0 4 – 5 Founders 34.4 30 35.4 11.3 – 57.6 5 – 6 Founders 18.1 10 25.9 1.2 – 35.1 6 – 7 Founders 10.7 0 21.5 0 – 24.8 7 – 8+ Founders 7.8 0 23.3 0 – 23.0
Working long hours Level Mean Median SD 95%-confidence
interval 0 – 0-20 hours p. week 0 0 0 0 – 0 1 – 20-25 hours p. week 2.8 0 6.7 0 – 7.1 2 – 25-30 hours p. week 14.7 0 20 1.6 – 27.8 3 – 30-35 hours p. week 34.1 25 30.1 14.5 – 53.8 4 – 35-40 hours p. week 62.2 60 24.2 46.4 – 78.0 5 – 40-45 hours p. week 82.8 90 18.8 70.6 – 95.1 6 – 45-50 hours p. week 92.5 100 11.3 85.2 – 99.9 7 – 50+ hours p. week 92.2 100 10.9 85.1 – 99.4

O
Managerial experience Level Mean Median SD 95%-confidence
interval 0 – No experience 8.9 0 26.7 0 – 26.3 1 – 0 - ½ years of exp. 27.2 10 33.5 5.4 – 49.1 2 – ½ - 1 years of exp. 53.3 50 33.2 31.7 – 75.0 3 – 1 – 2 years of exp. 61.1 60 23.7 45.6 – 76.6 4 – 2 – 4 years of exp. 81.1 100 26.2 64.0 – 98.2 5 – 4 – 8 years of exp. 82.2 90 25.9 65.3 – 99.1 6 – 8 – 16 years of exp. 65.6 80 38.4 40.4 – 90.7 7 – 16+ years of exp. 64.4 70 39.4 38.7 – 90.2 Education level Level Mean Median SD 95%-confidence interval 0 – Less than a high school diploma
0 0 0 0 – 0
1 – High school diploma
18.5 10 22.9 3.5 – 33.4
2 – Some college, no degree
29.4 10 32.8 8.0 – 50.8
3 – Associate’s degree 41.7 30.8 24.6 25.5 – 57.7 4 – Bachelor’s degree 84.9 80 16.2 74.3 – 95.4 5 – Master’s degree 94.8 100 8.3 89.4 – 100 6 – Professional’s degree
82.4 80 19.0 70.0 – 94.8
7 – Doctoral degree 63.1 67 27.7 45.0 – 81.3
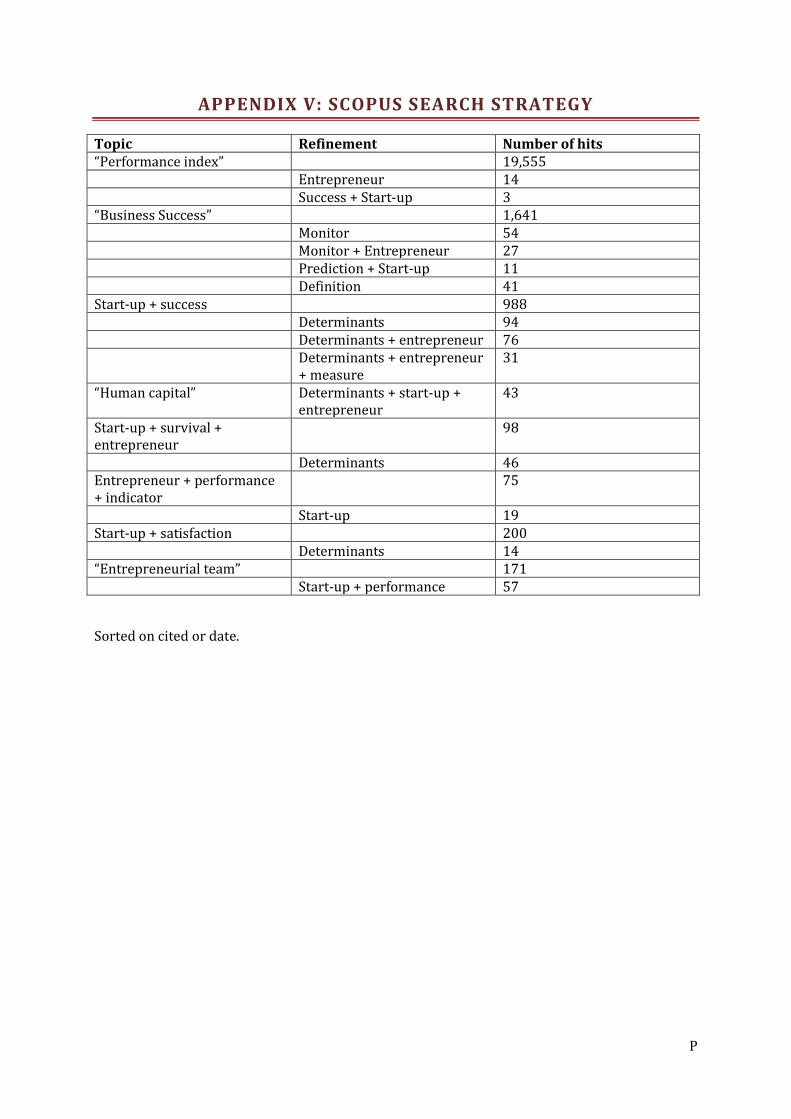
P
APPENDIX V: SCOPUS SEARCH STRATEGY
Topic Refinement Number of hits “Performance index” 19,555 Entrepreneur 14 Success + Start-up 3 “Business Success” 1,641 Monitor 54 Monitor + Entrepreneur 27 Prediction + Start-up 11 Definition 41 Start-up + success 988 Determinants 94 Determinants + entrepreneur 76 Determinants + entrepreneur
+ measure 31
“Human capital” Determinants + start-up + entrepreneur
43
Start-up + survival + entrepreneur
98
Determinants 46 Entrepreneur + performance + indicator
75
Start-up 19 Start-up + satisfaction 200 Determinants 14 “Entrepreneurial team” 171 Start-up + performance 57
Sorted on cited or date.
Top Related
Copyright © 2022 FDOKUMEN

