


Bahasa
Halaman
Hukum

ARTICLE IN PRESS
0967-0645/$ - se
doi:10.1016/j.ds
�Correspondifax: +1808 983
E-mail addre
Deep-Sea Research II 53 (2006) 326–339
www.elsevier.com/locate/dsr2
The Kuroshio Extension Bifurcation Region: A pelagichotspot for juvenile loggerhead sea turtles
Jeffrey Polovinaa,�, Itaru Uchidab, George Balazsa, Evan A. Howella,Denise Parkerc, Peter Duttond
aPacific Islands Fisheries Science Center, NOAA, 2570 Dole Street, Honolulu, HI 96822-2396, USAbPort of Nagoya Public Aquarium, Minato-ku, Nagoya, Japan
cJoint Institute for Marine and Atmospheric Research, University of Hawaii, Honolulu, HI, USAdSouthwest Fisheries Science Center, NOAA, 8604 La Jolla Shores Dr., La Jolla, CA 92037, USA
Received 14 March 2005; accepted 7 January 2006
Available online 3 may 2006
Abstract
Satellite telemetry of 43 juvenile loggerhead sea turtles (Caretta caretta) in the western North Pacific together with
satellite-remotely sensed oceanographic data identified the Kuroshio Extension Bifurcation Region (KEBR) as a forage
hotspot for these turtles. In the KEBR juvenile loggerheads resided in Kuroshio Extension Current (KEC) meanders and
the associated anti-cyclonic (warm core) and cyclonic (cold core) eddies during the fall, winter, and spring when the KEC
water contains high surface chlorophyll. Turtles often remained at a specific feature for several months. However, in the
summer when the KEC waters become vertically stratified and surface chlorophyll levels are low, the turtles moved north
up to 600 km from the main axis of KEC to the Transition Zone Chlorophyll Front (TZCF).
In some instances, the loggerheads swam against geostrophic currents, and seasonally all turtles moved north and south
across the strong zonal flow. Loggerhead turtles traveling westward in the KEBR had their directed westward movement
reduced 50% by the opposing current, while those traveling eastward exhibited an increase in directed zonal movement. It
appears, therefore, that these relatively weak-swimming juvenile loggerheads are not passive drifters in a major ocean
current but are able to move east, west, north, and south through this very energetic and complex habitat.
These results indicate that oceanic regions, specifically the KEBR, represent an important juvenile forage habitat for this
threatened species. Interannual and decadal changes in productivity of the KEBR may be important to the species’s
population dynamics. Further, conservation efforts should focus on identifying and reducing threats to the survival of
loggerhead turtles in the KEBR.
r 2006 Elsevier Ltd. All rights reserved.
Keywords: Loggerhead turtle; Transition Zone Chlorophyll Front; Kuroshio Extension Bifurcation Region; Satellite altimetry; Nursery
grounds habitat; Geostrophic flow
e front matter r 2006 Elsevier Ltd. All rights reserved
r2.2006.01.006
ng author. Tel.: +1 808 983 5390;
2902.
ss: [email protected] (J. Polovina).
1. Introduction
The loggerhead turtle (Caretta caretta) is athreatened and declining species in the NorthPacific, where its ecology and life history are not
.
ARTICLE IN PRESSJ. Polovina et al. / Deep-Sea Research II 53 (2006) 326–339 327
well known. Its only nesting beaches in the NorthPacific are located in southern Japan. Juvenileloggerheads are known to use pelagic habitat, andsome members of the population make trans-Pacificmigrations since, based on DNA, loggerheadshatched from the Japanese nesting beaches arefound in coastal habitat off Baja, Mexico (Bowenet al., 1995). Satellite telemetry of 26 loggerheads inthe central North Pacific has shown that juvenileloggerheads caught and released from longlinefishing gear appear to be long-term residents inthe oceanic North Pacific. They often travel west-ward from the central North Pacific toward thedateline, they travel seasonally north and southbetween 281 and 401N latitude, and they foragealmost exclusively in the top 50m (Polovina et al.,2004, 2003). Their most common prey are Janthina
spp., Carinara cithara, Vella vella, Lepas spp.,Planes spp., and pyrosomas (Parker et al., 2005).One feature in the central North Pacific that appearsto represent an important loggerhead forage andmigration habitat is the Transition Zone Chloro-phyll Front (TZCF) (Polovina et al., 2004). TheTZCF is identified from satellite-remotely sensedsurface chlorophyll data as a basin-wide surfacechlorophyll front. This front represents a boundarybetween vertically stratified warm, low-chlorophyllsubtropical waters on the south and verticallymixed, cool high- chlorophyll waters on the north(Polovina et al., 2004, 2001).
Our previous satellite telemetry work with logger-heads has focused on describing juvenile loggerheadforage and migration habitat primarily to the east ofthe international date line in the central NorthPacific. However, the Kuroshio Extension Current(KEC) lies west of the date line and is the dominantphysical and biological habitat in the North Pacific,recognized for its high eddy kinetic energy andhigh phytoplankton and zooplankton productivity(Komatsu et al., 2002, 2000; Qiu, 2001). Here, weinvestigate the role of the KEC region as foragehabitat for juvenile loggerheads with satellite tele-metry from two groups of turtles. One group iscomposed of 37, 1–3-yr-old loggerheads reared atthe Port of Nagoya Public Aquarium and releasedoff the coast of Japan on three dates: April 2003,November 2003, and April 2004. A second group iscomposed of six juvenile loggerheads, caught andreleased between 2000 and 2003 from longline gearin the central North Pacific; the turtles traveled westof the dateline into the KEC region. We use satelliteoceanographic data, especially sea-surface height
(SSH) from altimetry, and surface chlorophyll fromocean color data to describe the mesoscale habitatsthe turtles used.
2. Data and methods
2.1. Turtle data
Forty-three loggerhead turtles were equippedwith Telonics (Mesa, AZ, USA) model ST-18(n ¼ 9), ST-19 (n ¼ 7), ST-24 (n ¼ 6) or WildlifeComputers (Redmond, WA, USA) SDR-T10(n ¼ 2), SDR-T16 (n ¼ 6), or SPOT3 (n ¼ 13)Argos-linked satellite transmitters to record surfacelocation data of these animals. Fisheries observersattached six of these transmitters to turtles that werehooked by commercial fishing vessels. The remain-ing 37 transmitters were attached to juvenileloggerheads that were hatched and raised in thePort of Nagoya Public Aquarium and released offthe coast of Japan. All 37 transmitters were safelyand securely attached by the same person usingfiberglass cloth and polyester resin as recommendedby Balazs et al. (1996). The transmitters had fourduty cycles: 12 h on, 48 h off; 6 h on, 48 h off; 6 h on,42 h off; and 4 h on, 44 h off. The Argos transmis-sions ranged from 25 to 597 days and spanned theperiod from March 2000 to December 2004 for atotal of 5710 transmission days. Reasons for thetransmissions ending are not known, but thesecould have been caused by depletion of batterypower, electronic failure, natural predation mortal-ity, or detachment of the transmitter.
Service Argos provides location-accuracy classifi-cations for most turtle positions based on thenumber and configuration of satellites and numberof transmissions received. In our analyses we usedonly a single daily position when one was available.When there were multiple Argos positions atdifferent times of the day for the same turtle, weselected the most accurate position. If there weremultiple ‘‘most accurate’’ positions in the same day,we selected the position closest to noon. For the setof all of our daily turtle positions, Argos estimatedthat the distance between the reported and truepositions was o1 km for 44.92% of the positionsand at least 1 km for 39.76% of the positions. Theremaining 15.32% did not have sufficient data to beclassified by Argos, but we estimated that they werewithin several kilometers of their true positions.
The six turtles captured and released from long-line vessels in the central North Pacific ranged in
ARTICLE IN PRESSJ. Polovina et al. / Deep-Sea Research II 53 (2006) 326–339328
size from 55.5 to 66.5 cm straight carapace lengthand had transmission times ranging from 308 to 597days, with a mean of 434 days. They were releasedseparately in March 2000 and February, April,September, October, and November 2002, atvarious locations in the central North Pacific. Thehatchery-reared turtles released from Japan rangedin size from 25.6 to 64.8 cm straight carapace lengthand had transmission times ranging from 27 to 516days with a mean of 214 days. There were threerelease periods: April 2003, November 2003, andApril 2004, all approximately centered at 140.51Elongitude and 351N latitude in pelagic waters offJapan.
Turtle movement parameters u (east–west) and v
(north–south) were estimated along each turtletrack between sequential turtle locations based onthe straight line distance and elapsed time betweenthe position. For each track with n turtle positions,we estimated n–1 pairs of u and v. The totalmovement speed was estimated as
ffiffiffiffiffiffiffiffiffiffiffiffiffiffiffiffiffiffiu2 þ v2ð Þ
p.
Given the heavy-tailed distribution for u, v, andtotal movement speed, we used medians instead ofmeans from the empirical distribution as ourpopulation estimate. It is important to recognizethat these movement parameters measure the netmovement of the turtle that is a combination of theturtle’s swimming speed and its movement fromcurrents. Standard errors for the movement para-meter median estimates were computed by boot-strapping.
2.2. Satellite data
The SSH data are mapped at a global 0.3o by 0.3o
resolution with orbit error reduction (MSLA OER)provided by the Ssalto program of the CentreNational d’etudes Spatiales. This altimetry productis a weekly average of the measured along-track sea-level profiles incorporating the weighted previoussix weeks of data mapped to a mercator projection.For the time period October 1992 to July 2002 datafrom the TOPEX/POSEIDON satellite altimeterwere used. After July 2002 JASON-1 satellite wasput into operation along the same orbit as TOPEX/POSEIDON and from that date forward, its datawere used in the study. The 1994 NODC WorldOcean Atlas Levitus long-term mean 1000-mdynamic height dataset was added to the SSHanomaly files to approximate the geoid andcreate an ‘‘absolute’’ SSH. Geostrophic currentswere computed from satellite altimetry data from
TOPEX/Poseidon and JASON-1 with 7-day and0.51 latitude and longitude resolution (Polovinaet al., 1999).
Satellite-derived chlorophyll pigment concentra-tions were collected by the Moderate ResolutionImaging Spectroradiometer (MODIS), the keyinstrument aboard the Aqua satellite. The chlor-ophyll product is derived from the raw measuredwavelength bands using the SeaWiFS analog algo-rithm (OC3M algorithm) and distributed as Ver-sion 4. These data are a 4.89-km pixel resolutionlevel-3 product on an equidistant cylindrical projec-tion. MODIS primary productivity was estimated asan integrated value from the surface to the mixed-layer depth (MLD) using the Behrenfeld–Falkowskimodel (Behrenfeld and Falkowski, 1997). Thesedata are distributed as a 4.89-km pixel resolutionlevel-4 product on an equidistant cylindrical projec-tion. All MODIS chlorophyll and primary produc-tivity data were obtained from the GoddardDistributed Active Archive Center (DAAC) underthe auspices of the National Aeronautics and SpaceAgency.
3. Results
3.1. Turtle movements
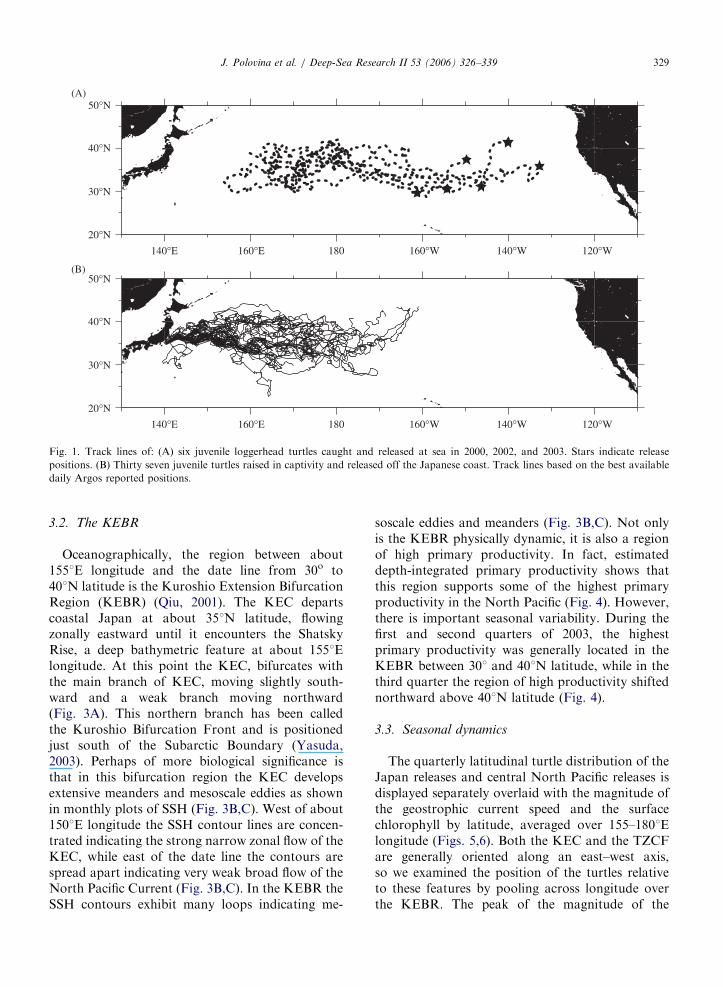
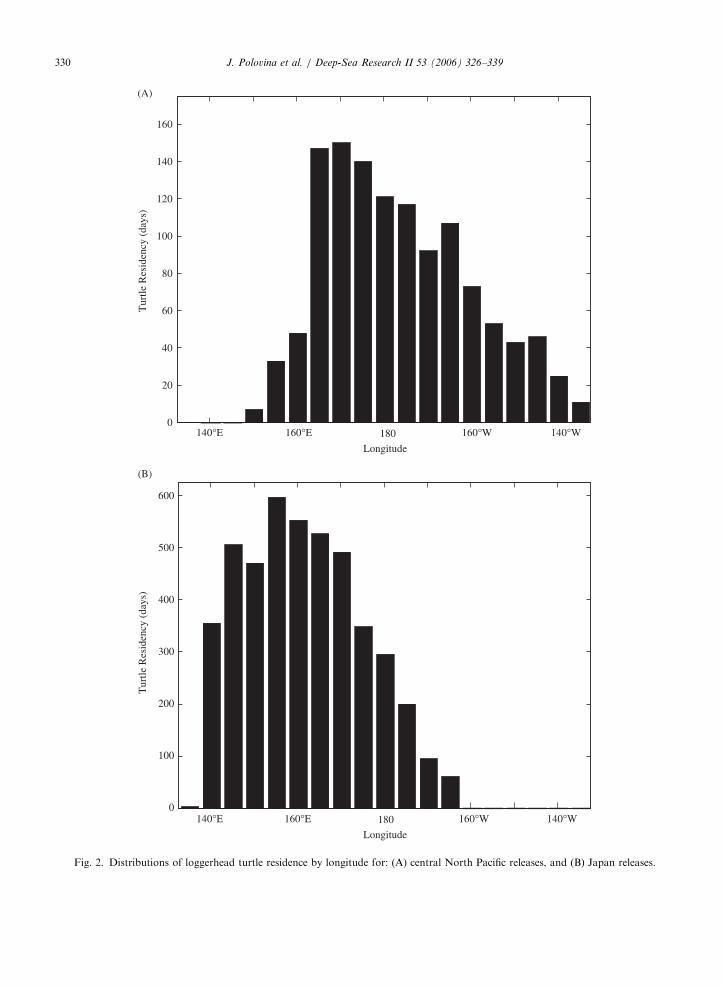
All six turtles released in the central North Pacifictraveled westward past the date line with severalreaching 1601E longitude (Fig. 1A). The turtlesreleased from Japan traveled eastward, with mostturtles remaining west of the date line but severalturtles reaching as far east as 1601W longitude(Fig. 1B). Generally the turtles in the central andwestern Pacific remained between 301 and 401Nlatitude (Fig. 1A,B). A distribution of the relativeturtle residency time computed as total number ofdaily transmission in 51 longitude bins for eachgroup of turtles shows that the region betweenabout 1501E longitude and the date line had highresidency for turtles released from Japan, while theregion from 1651E longitude and the date line hadhigh residency for the central Pacific releases(Fig. 2). This is particularly interesting because allthe turtles were released either to the east or west ofthese regions (Fig. 1). Thus it appears that turtleshad a high residency in the eastern portion of theKEC compared to the western portion of the KECor the region to the east of the date line, and thisstrongly suggests that this region is an importantforage habitat for juvenile loggerheads (Fig. 2).
ARTICLE IN PRESS
50°N
40°N
30°N
20°N
50°N
40°N
30°N
20°N
140°E 160°E 160°W 140°W 120°W180
140°E 160°E 160°W 140°W 120°W180
(A)
(B)
Fig. 1. Track lines of: (A) six juvenile loggerhead turtles caught and released at sea in 2000, 2002, and 2003. Stars indicate release
positions. (B) Thirty seven juvenile turtles raised in captivity and released off the Japanese coast. Track lines based on the best available
daily Argos reported positions.
J. Polovina et al. / Deep-Sea Research II 53 (2006) 326–339 329
3.2. The KEBR
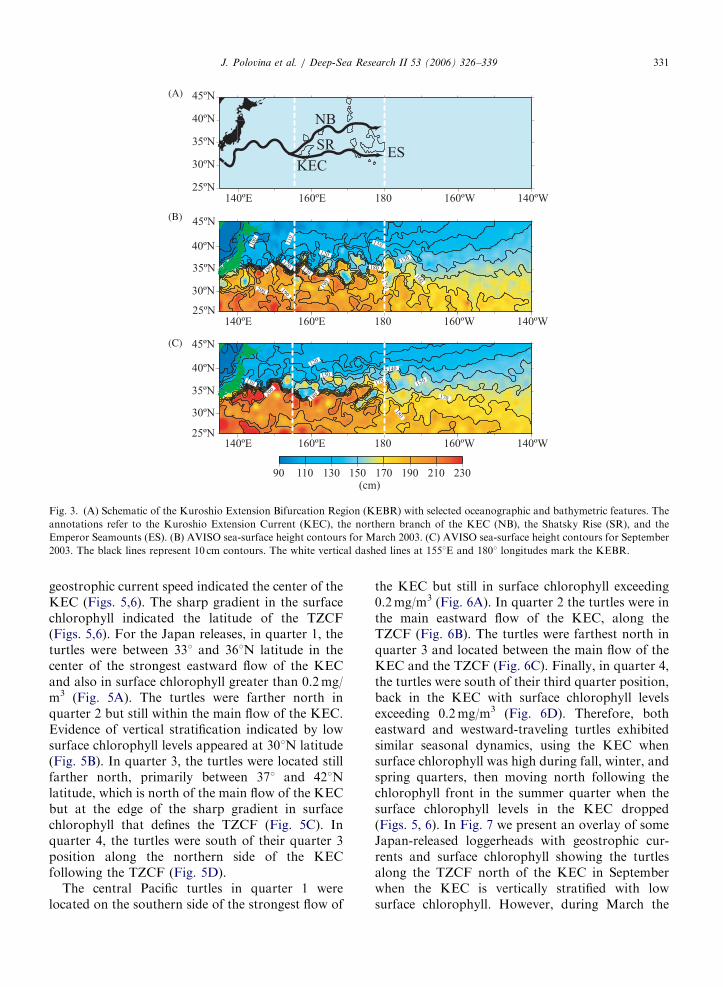
Oceanographically, the region between about1551E longitude and the date line from 30o to401N latitude is the Kuroshio Extension BifurcationRegion (KEBR) (Qiu, 2001). The KEC departscoastal Japan at about 351N latitude, flowingzonally eastward until it encounters the ShatskyRise, a deep bathymetric feature at about 1551Elongitude. At this point the KEC, bifurcates withthe main branch of KEC, moving slightly south-ward and a weak branch moving northward(Fig. 3A). This northern branch has been calledthe Kuroshio Bifurcation Front and is positionedjust south of the Subarctic Boundary (Yasuda,2003). Perhaps of more biological significance isthat in this bifurcation region the KEC developsextensive meanders and mesoscale eddies as shownin monthly plots of SSH (Fig. 3B,C). West of about1501E longitude the SSH contour lines are concen-trated indicating the strong narrow zonal flow of theKEC, while east of the date line the contours arespread apart indicating very weak broad flow of theNorth Pacific Current (Fig. 3B,C). In the KEBR theSSH contours exhibit many loops indicating me-
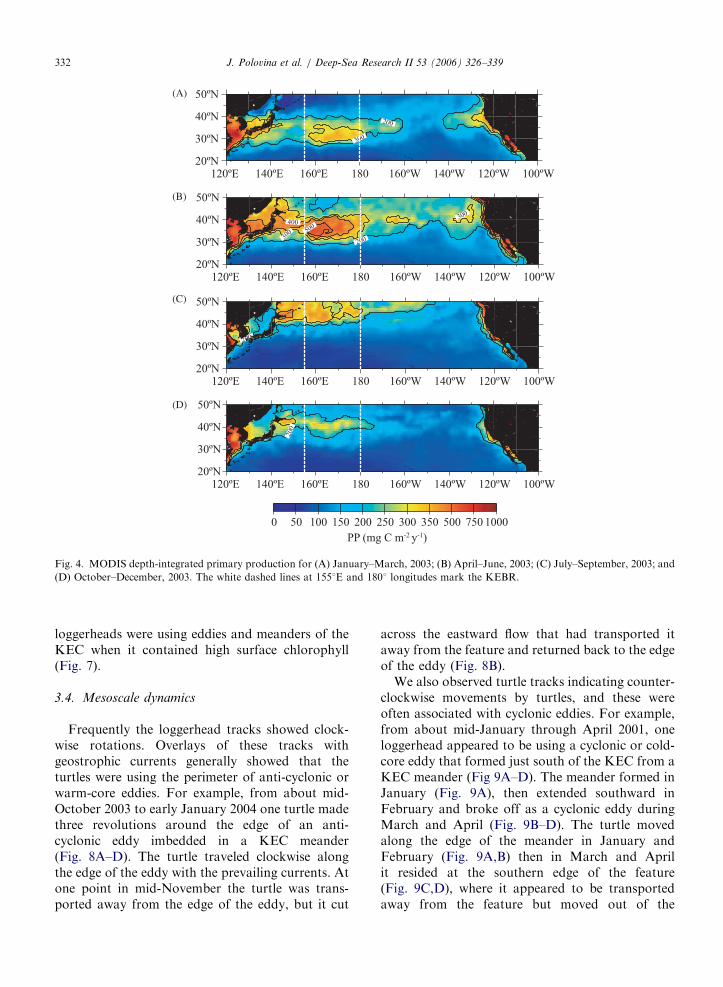
soscale eddies and meanders (Fig. 3B,C). Not onlyis the KEBR physically dynamic, it is also a regionof high primary productivity. In fact, estimateddepth-integrated primary productivity shows thatthis region supports some of the highest primaryproductivity in the North Pacific (Fig. 4). However,there is important seasonal variability. During thefirst and second quarters of 2003, the highestprimary productivity was generally located in theKEBR between 301 and 401N latitude, while in thethird quarter the region of high productivity shiftednorthward above 401N latitude (Fig. 4).
3.3. Seasonal dynamics
The quarterly latitudinal turtle distribution of theJapan releases and central North Pacific releases isdisplayed separately overlaid with the magnitude ofthe geostrophic current speed and the surfacechlorophyll by latitude, averaged over 155–1801Elongitude (Figs. 5,6). Both the KEC and the TZCFare generally oriented along an east–west axis,so we examined the position of the turtles relativeto these features by pooling across longitude overthe KEBR. The peak of the magnitude of the
ARTICLE IN PRESS
160
140
120
100
80
60
40
600
500
400
300
200
100
0
20
0140°E 160°E 160°W 140°W180
Longitude
140°E 160°E 160°W 140°W180
Longitude
Tur
tle R
esid
ency
(da
ys)
Tur
tle R
esid
ency
(da
ys)
(A)
(B)
Fig. 2. Distributions of loggerhead turtle residence by longitude for: (A) central North Pacific releases, and (B) Japan releases.
J. Polovina et al. / Deep-Sea Research II 53 (2006) 326–339330
ARTICLE IN PRESS
(A)
(B)
(C)
Fig. 3. (A) Schematic of the Kuroshio Extension Bifurcation Region (KEBR) with selected oceanographic and bathymetric features. The
annotations refer to the Kuroshio Extension Current (KEC), the northern branch of the KEC (NB), the Shatsky Rise (SR), and the
Emperor Seamounts (ES). (B) AVISO sea-surface height contours for March 2003. (C) AVISO sea-surface height contours for September
2003. The black lines represent 10 cm contours. The white vertical dashed lines at 1551E and 1801 longitudes mark the KEBR.
J. Polovina et al. / Deep-Sea Research II 53 (2006) 326–339 331
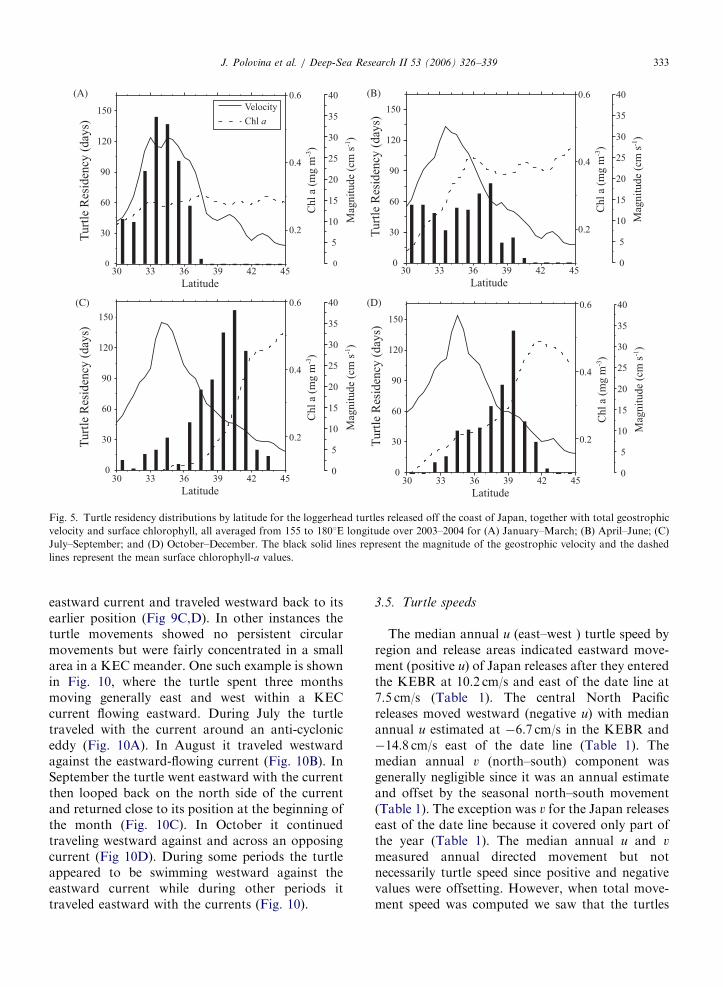
geostrophic current speed indicated the center of theKEC (Figs. 5,6). The sharp gradient in the surfacechlorophyll indicated the latitude of the TZCF(Figs. 5,6). For the Japan releases, in quarter 1, theturtles were between 331 and 361N latitude in thecenter of the strongest eastward flow of the KECand also in surface chlorophyll greater than 0.2mg/m3 (Fig. 5A). The turtles were farther north inquarter 2 but still within the main flow of the KEC.Evidence of vertical stratification indicated by lowsurface chlorophyll levels appeared at 301N latitude(Fig. 5B). In quarter 3, the turtles were located stillfarther north, primarily between 371 and 421Nlatitude, which is north of the main flow of the KECbut at the edge of the sharp gradient in surfacechlorophyll that defines the TZCF (Fig. 5C). Inquarter 4, the turtles were south of their quarter 3position along the northern side of the KECfollowing the TZCF (Fig. 5D).
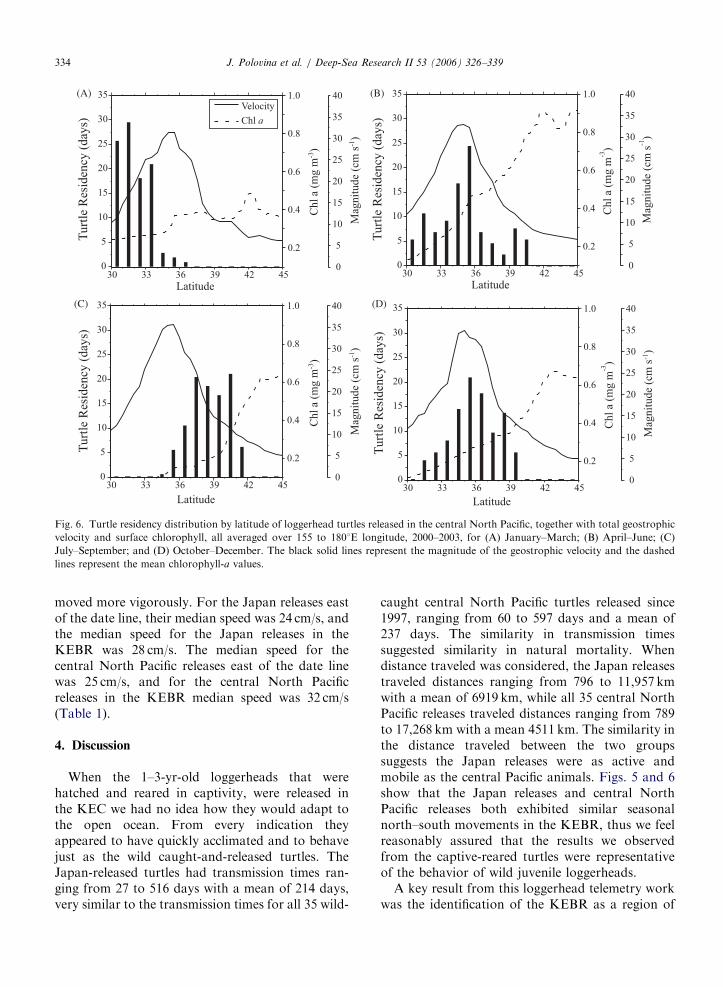
The central Pacific turtles in quarter 1 werelocated on the southern side of the strongest flow of
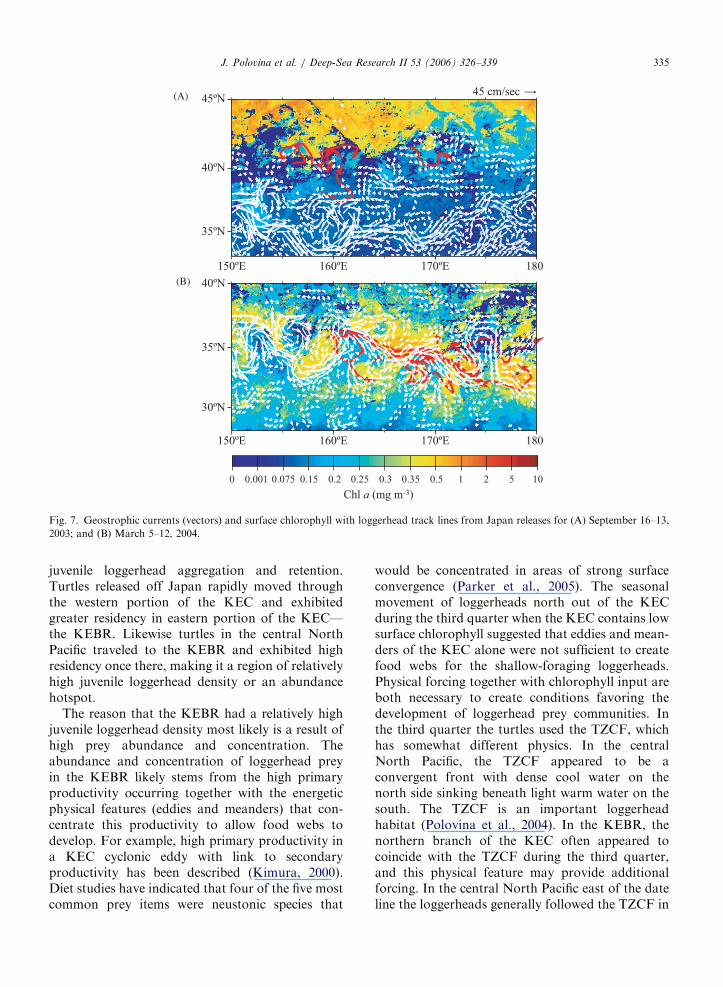
the KEC but still in surface chlorophyll exceeding0.2mg/m3 (Fig. 6A). In quarter 2 the turtles were inthe main eastward flow of the KEC, along theTZCF (Fig. 6B). The turtles were farthest north inquarter 3 and located between the main flow of theKEC and the TZCF (Fig. 6C). Finally, in quarter 4,the turtles were south of their third quarter position,back in the KEC with surface chlorophyll levelsexceeding 0.2mg/m3 (Fig. 6D). Therefore, botheastward and westward-traveling turtles exhibitedsimilar seasonal dynamics, using the KEC whensurface chlorophyll was high during fall, winter, andspring quarters, then moving north following thechlorophyll front in the summer quarter when thesurface chlorophyll levels in the KEC dropped(Figs. 5, 6). In Fig. 7 we present an overlay of someJapan-released loggerheads with geostrophic cur-rents and surface chlorophyll showing the turtlesalong the TZCF north of the KEC in Septemberwhen the KEC is vertically stratified with lowsurface chlorophyll. However, during March the
ARTICLE IN PRESS
(A)
(B)
(C)
(D)
Fig. 4. MODIS depth-integrated primary production for (A) January–March, 2003; (B) April–June, 2003; (C) July–September, 2003; and
(D) October–December, 2003. The white dashed lines at 1551E and 1801 longitudes mark the KEBR.
J. Polovina et al. / Deep-Sea Research II 53 (2006) 326–339332
loggerheads were using eddies and meanders of theKEC when it contained high surface chlorophyll(Fig. 7).
3.4. Mesoscale dynamics
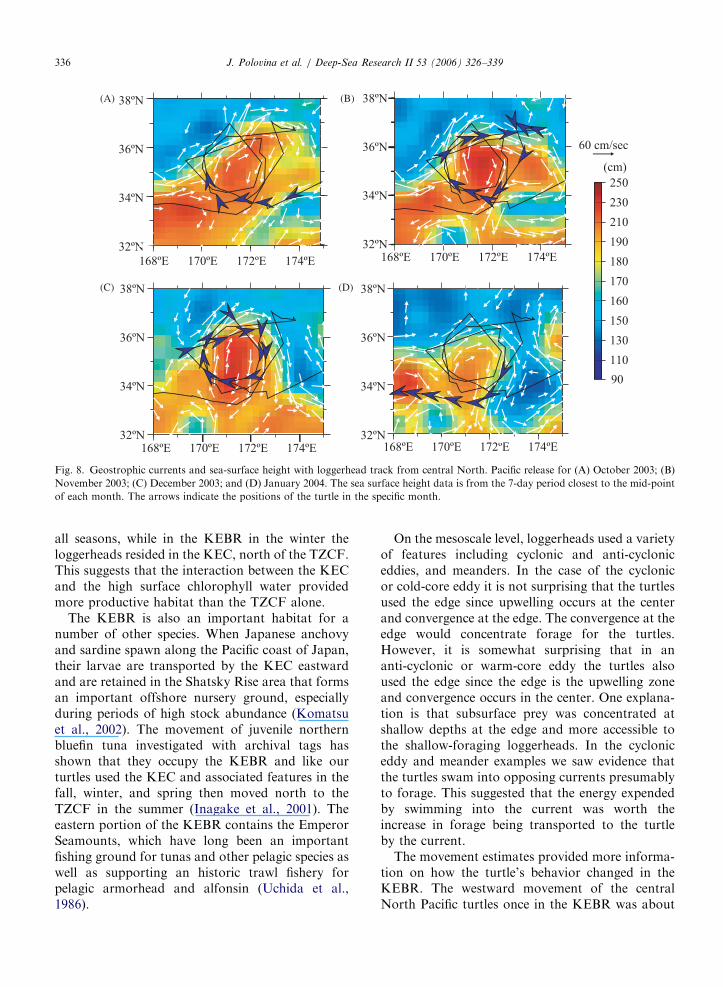
Frequently the loggerhead tracks showed clock-wise rotations. Overlays of these tracks withgeostrophic currents generally showed that theturtles were using the perimeter of anti-cyclonic orwarm-core eddies. For example, from about mid-October 2003 to early January 2004 one turtle madethree revolutions around the edge of an anti-cyclonic eddy imbedded in a KEC meander(Fig. 8A–D). The turtle traveled clockwise alongthe edge of the eddy with the prevailing currents. Atone point in mid-November the turtle was trans-ported away from the edge of the eddy, but it cut
across the eastward flow that had transported itaway from the feature and returned back to the edgeof the eddy (Fig. 8B).
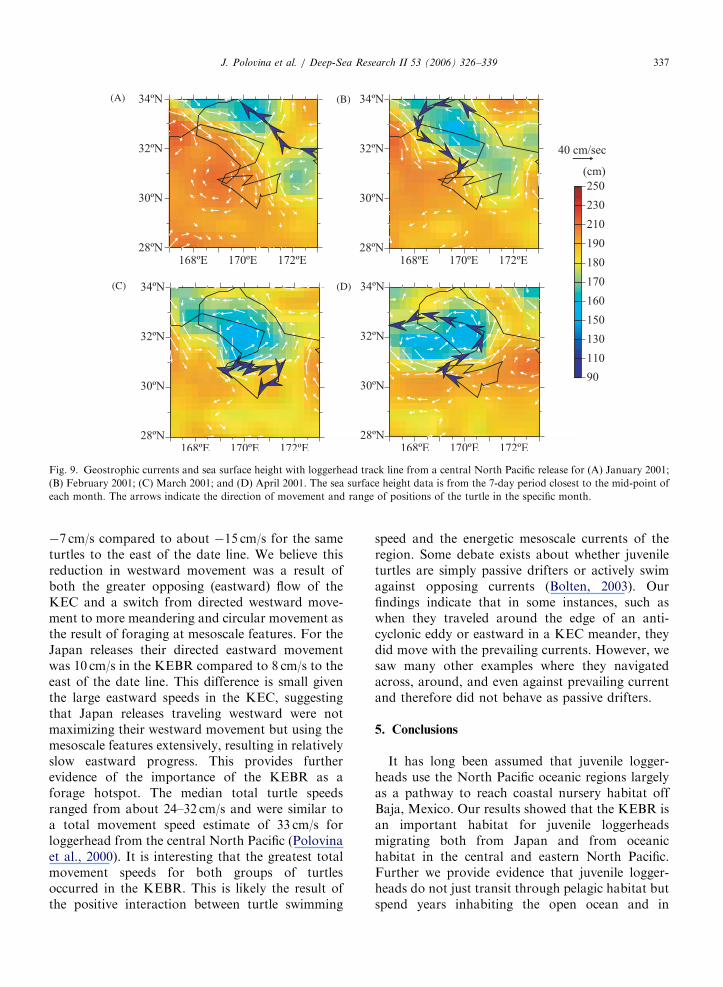
We also observed turtle tracks indicating counter-clockwise movements by turtles, and these wereoften associated with cyclonic eddies. For example,from about mid-January through April 2001, oneloggerhead appeared to be using a cyclonic or cold-core eddy that formed just south of the KEC from aKEC meander (Fig 9A–D). The meander formed inJanuary (Fig. 9A), then extended southward inFebruary and broke off as a cyclonic eddy duringMarch and April (Fig. 9B–D). The turtle movedalong the edge of the meander in January andFebruary (Fig. 9A,B) then in March and Aprilit resided at the southern edge of the feature(Fig. 9C,D), where it appeared to be transportedaway from the feature but moved out of the
ARTICLE IN PRESS
(A) (B)
(C) (D)
Fig. 5. Turtle residency distributions by latitude for the loggerhead turtles released off the coast of Japan, together with total geostrophic
velocity and surface chlorophyll, all averaged from 155 to 1801E longitude over 2003–2004 for (A) January–March; (B) April–June; (C)
July–September; and (D) October–December. The black solid lines represent the magnitude of the geostrophic velocity and the dashed
lines represent the mean surface chlorophyll-a values.
J. Polovina et al. / Deep-Sea Research II 53 (2006) 326–339 333
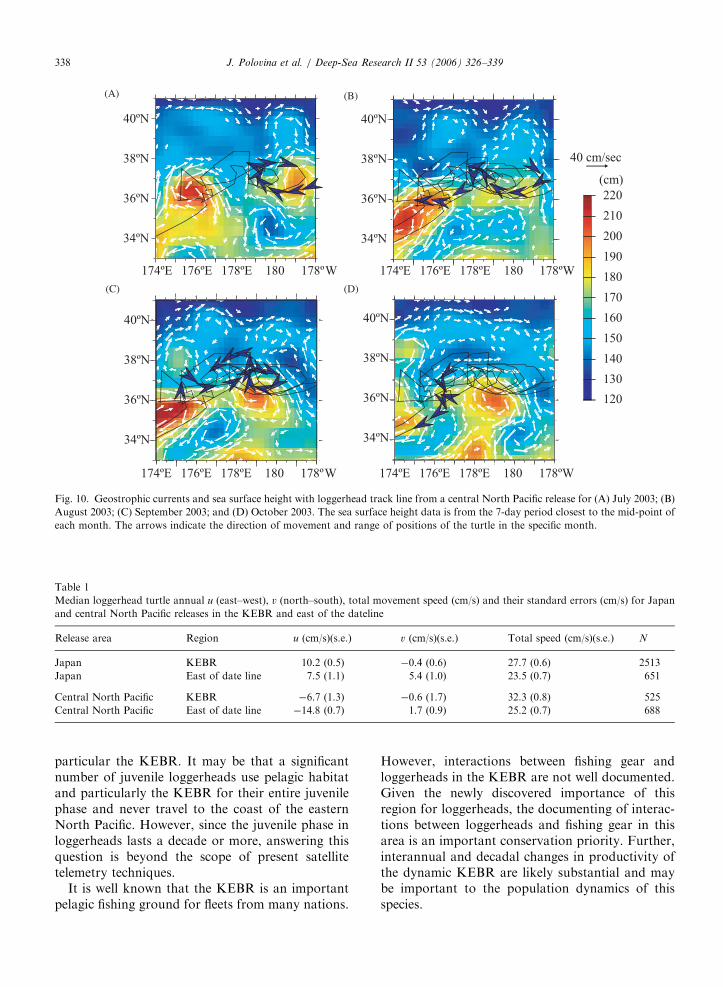
eastward current and traveled westward back to itsearlier position (Fig 9C,D). In other instances theturtle movements showed no persistent circularmovements but were fairly concentrated in a smallarea in a KEC meander. One such example is shownin Fig. 10, where the turtle spent three monthsmoving generally east and west within a KECcurrent flowing eastward. During July the turtletraveled with the current around an anti-cycloniceddy (Fig. 10A). In August it traveled westwardagainst the eastward-flowing current (Fig. 10B). InSeptember the turtle went eastward with the currentthen looped back on the north side of the currentand returned close to its position at the beginning ofthe month (Fig. 10C). In October it continuedtraveling westward against and across an opposingcurrent (Fig 10D). During some periods the turtleappeared to be swimming westward against theeastward current while during other periods ittraveled eastward with the currents (Fig. 10).
3.5. Turtle speeds
The median annual u (east–west ) turtle speed byregion and release areas indicated eastward move-ment (positive u) of Japan releases after they enteredthe KEBR at 10.2 cm/s and east of the date line at7.5 cm/s (Table 1). The central North Pacificreleases moved westward (negative u) with medianannual u estimated at �6.7 cm/s in the KEBR and�14.8 cm/s east of the date line (Table 1). Themedian annual v (north–south) component wasgenerally negligible since it was an annual estimateand offset by the seasonal north–south movement(Table 1). The exception was v for the Japan releaseseast of the date line because it covered only part ofthe year (Table 1). The median annual u and v
measured annual directed movement but notnecessarily turtle speed since positive and negativevalues were offsetting. However, when total move-ment speed was computed we saw that the turtles
ARTICLE IN PRESS
(A) (B)
(C) (D)
Fig. 6. Turtle residency distribution by latitude of loggerhead turtles released in the central North Pacific, together with total geostrophic
velocity and surface chlorophyll, all averaged over 155 to 1801E longitude, 2000–2003, for (A) January–March; (B) April–June; (C)
July–September; and (D) October–December. The black solid lines represent the magnitude of the geostrophic velocity and the dashed
lines represent the mean chlorophyll-a values.
J. Polovina et al. / Deep-Sea Research II 53 (2006) 326–339334
moved more vigorously. For the Japan releases eastof the date line, their median speed was 24 cm/s, andthe median speed for the Japan releases in theKEBR was 28 cm/s. The median speed for thecentral North Pacific releases east of the date linewas 25 cm/s, and for the central North Pacificreleases in the KEBR median speed was 32 cm/s(Table 1).
4. Discussion
When the 1–3-yr-old loggerheads that werehatched and reared in captivity, were released inthe KEC we had no idea how they would adapt tothe open ocean. From every indication theyappeared to have quickly acclimated and to behavejust as the wild caught-and-released turtles. TheJapan-released turtles had transmission times ran-ging from 27 to 516 days with a mean of 214 days,very similar to the transmission times for all 35 wild-
caught central North Pacific turtles released since1997, ranging from 60 to 597 days and a mean of237 days. The similarity in transmission timessuggested similarity in natural mortality. Whendistance traveled was considered, the Japan releasestraveled distances ranging from 796 to 11,957 kmwith a mean of 6919 km, while all 35 central NorthPacific releases traveled distances ranging from 789to 17,268 km with a mean 4511 km. The similarity inthe distance traveled between the two groupssuggests the Japan releases were as active andmobile as the central Pacific animals. Figs. 5 and 6show that the Japan releases and central NorthPacific releases both exhibited similar seasonalnorth–south movements in the KEBR, thus we feelreasonably assured that the results we observedfrom the captive-reared turtles were representativeof the behavior of wild juvenile loggerheads.
A key result from this loggerhead telemetry workwas the identification of the KEBR as a region of
ARTICLE IN PRESS
(B)
(A)
Fig. 7. Geostrophic currents (vectors) and surface chlorophyll with loggerhead track lines from Japan releases for (A) September 16–13,
2003; and (B) March 5–12, 2004.
J. Polovina et al. / Deep-Sea Research II 53 (2006) 326–339 335
juvenile loggerhead aggregation and retention.Turtles released off Japan rapidly moved throughthe western portion of the KEC and exhibitedgreater residency in eastern portion of the KEC—the KEBR. Likewise turtles in the central NorthPacific traveled to the KEBR and exhibited highresidency once there, making it a region of relativelyhigh juvenile loggerhead density or an abundancehotspot.
The reason that the KEBR had a relatively highjuvenile loggerhead density most likely is a result ofhigh prey abundance and concentration. Theabundance and concentration of loggerhead preyin the KEBR likely stems from the high primaryproductivity occurring together with the energeticphysical features (eddies and meanders) that con-centrate this productivity to allow food webs todevelop. For example, high primary productivity ina KEC cyclonic eddy with link to secondaryproductivity has been described (Kimura, 2000).Diet studies have indicated that four of the five mostcommon prey items were neustonic species that
would be concentrated in areas of strong surfaceconvergence (Parker et al., 2005). The seasonalmovement of loggerheads north out of the KECduring the third quarter when the KEC contains lowsurface chlorophyll suggested that eddies and mean-ders of the KEC alone were not sufficient to createfood webs for the shallow-foraging loggerheads.Physical forcing together with chlorophyll input areboth necessary to create conditions favoring thedevelopment of loggerhead prey communities. Inthe third quarter the turtles used the TZCF, whichhas somewhat different physics. In the centralNorth Pacific, the TZCF appeared to be aconvergent front with dense cool water on thenorth side sinking beneath light warm water on thesouth. The TZCF is an important loggerheadhabitat (Polovina et al., 2004). In the KEBR, thenorthern branch of the KEC often appeared tocoincide with the TZCF during the third quarter,and this physical feature may provide additionalforcing. In the central North Pacific east of the dateline the loggerheads generally followed the TZCF in
ARTICLE IN PRESS
(A) (B)
(C) (D)
Fig. 8. Geostrophic currents and sea-surface height with loggerhead track from central North. Pacific release for (A) October 2003; (B)
November 2003; (C) December 2003; and (D) January 2004. The sea surface height data is from the 7-day period closest to the mid-point
of each month. The arrows indicate the positions of the turtle in the specific month.
J. Polovina et al. / Deep-Sea Research II 53 (2006) 326–339336
all seasons, while in the KEBR in the winter theloggerheads resided in the KEC, north of the TZCF.This suggests that the interaction between the KECand the high surface chlorophyll water providedmore productive habitat than the TZCF alone.
The KEBR is also an important habitat for anumber of other species. When Japanese anchovyand sardine spawn along the Pacific coast of Japan,their larvae are transported by the KEC eastwardand are retained in the Shatsky Rise area that formsan important offshore nursery ground, especiallyduring periods of high stock abundance (Komatsuet al., 2002). The movement of juvenile northernbluefin tuna investigated with archival tags hasshown that they occupy the KEBR and like ourturtles used the KEC and associated features in thefall, winter, and spring then moved north to theTZCF in the summer (Inagake et al., 2001). Theeastern portion of the KEBR contains the EmperorSeamounts, which have long been an importantfishing ground for tunas and other pelagic species aswell as supporting an historic trawl fishery forpelagic armorhead and alfonsin (Uchida et al.,1986).
On the mesoscale level, loggerheads used a varietyof features including cyclonic and anti-cycloniceddies, and meanders. In the case of the cyclonicor cold-core eddy it is not surprising that the turtlesused the edge since upwelling occurs at the centerand convergence at the edge. The convergence at theedge would concentrate forage for the turtles.However, it is somewhat surprising that in ananti-cyclonic or warm-core eddy the turtles alsoused the edge since the edge is the upwelling zoneand convergence occurs in the center. One explana-tion is that subsurface prey was concentrated atshallow depths at the edge and more accessible tothe shallow-foraging loggerheads. In the cycloniceddy and meander examples we saw evidence thatthe turtles swam into opposing currents presumablyto forage. This suggested that the energy expendedby swimming into the current was worth theincrease in forage being transported to the turtleby the current.
The movement estimates provided more informa-tion on how the turtle’s behavior changed in theKEBR. The westward movement of the centralNorth Pacific turtles once in the KEBR was about
ARTICLE IN PRESS
(A) (B)
(C) (D)
Fig. 9. Geostrophic currents and sea surface height with loggerhead track line from a central North Pacific release for (A) January 2001;
(B) February 2001; (C) March 2001; and (D) April 2001. The sea surface height data is from the 7-day period closest to the mid-point of
each month. The arrows indicate the direction of movement and range of positions of the turtle in the specific month.
J. Polovina et al. / Deep-Sea Research II 53 (2006) 326–339 337
�7 cm/s compared to about �15 cm/s for the sameturtles to the east of the date line. We believe thisreduction in westward movement was a result ofboth the greater opposing (eastward) flow of theKEC and a switch from directed westward move-ment to more meandering and circular movement asthe result of foraging at mesoscale features. For theJapan releases their directed eastward movementwas 10 cm/s in the KEBR compared to 8 cm/s to theeast of the date line. This difference is small giventhe large eastward speeds in the KEC, suggestingthat Japan releases traveling westward were notmaximizing their westward movement but using themesoscale features extensively, resulting in relativelyslow eastward progress. This provides furtherevidence of the importance of the KEBR as aforage hotspot. The median total turtle speedsranged from about 24–32 cm/s and were similar toa total movement speed estimate of 33 cm/s forloggerhead from the central North Pacific (Polovinaet al., 2000). It is interesting that the greatest totalmovement speeds for both groups of turtlesoccurred in the KEBR. This is likely the result ofthe positive interaction between turtle swimming
speed and the energetic mesoscale currents of theregion. Some debate exists about whether juvenileturtles are simply passive drifters or actively swimagainst opposing currents (Bolten, 2003). Ourfindings indicate that in some instances, such aswhen they traveled around the edge of an anti-cyclonic eddy or eastward in a KEC meander, theydid move with the prevailing currents. However, wesaw many other examples where they navigatedacross, around, and even against prevailing currentand therefore did not behave as passive drifters.
5. Conclusions
It has long been assumed that juvenile logger-heads use the North Pacific oceanic regions largelyas a pathway to reach coastal nursery habitat offBaja, Mexico. Our results showed that the KEBR isan important habitat for juvenile loggerheadsmigrating both from Japan and from oceanichabitat in the central and eastern North Pacific.Further we provide evidence that juvenile logger-heads do not just transit through pelagic habitat butspend years inhabiting the open ocean and in
ARTICLE IN PRESS
(A) (B)
(C) (D)
Fig. 10. Geostrophic currents and sea surface height with loggerhead track line from a central North Pacific release for (A) July 2003; (B)
August 2003; (C) September 2003; and (D) October 2003. The sea surface height data is from the 7-day period closest to the mid-point of
each month. The arrows indicate the direction of movement and range of positions of the turtle in the specific month.
Table 1
Median loggerhead turtle annual u (east–west), v (north–south), total movement speed (cm/s) and their standard errors (cm/s) for Japan
and central North Pacific releases in the KEBR and east of the dateline
Release area Region u (cm/s)(s.e.) v (cm/s)(s.e.) Total speed (cm/s)(s.e.) N
Japan KEBR 10.2 (0.5) �0.4 (0.6) 27.7 (0.6) 2513
Japan East of date line 7.5 (1.1) 5.4 (1.0) 23.5 (0.7) 651
Central North Pacific KEBR �6.7 (1.3) �0.6 (1.7) 32.3 (0.8) 525
Central North Pacific East of date line �14.8 (0.7) 1.7 (0.9) 25.2 (0.7) 688
J. Polovina et al. / Deep-Sea Research II 53 (2006) 326–339338
particular the KEBR. It may be that a significantnumber of juvenile loggerheads use pelagic habitatand particularly the KEBR for their entire juvenilephase and never travel to the coast of the easternNorth Pacific. However, since the juvenile phase inloggerheads lasts a decade or more, answering thisquestion is beyond the scope of present satellitetelemetry techniques.
It is well known that the KEBR is an importantpelagic fishing ground for fleets from many nations.
However, interactions between fishing gear andloggerheads in the KEBR are not well documented.Given the newly discovered importance of thisregion for loggerheads, the documenting of interac-tions between loggerheads and fishing gear in thisarea is an important conservation priority. Further,interannual and decadal changes in productivity ofthe dynamic KEBR are likely substantial and maybe important to the population dynamics of thisspecies.
ARTICLE IN PRESSJ. Polovina et al. / Deep-Sea Research II 53 (2006) 326–339 339
Acknowledgments
We acknowledge the shipboard observers work-ing with the NMFS Observer Program whodeployed the transmitters on the central NorthPacific turtles. We thank Masanori Kurita, TomomiSaito and numerous other staff of the Port ofNagoya Public Aquarium for assistance in rearingand deploying the captive loggerheads. GeorgeBalazs coordinated all transmitter attachments andreleases of the captive loggerheads with assistancefrom Marc Rice of the Hawaii Preparatory Acad-emy. We also acknowledge discussions with DonKobayashi that contributed to this work. We thankthe Taiyo Ferry Co. for facilitating the safe releaseof loggerheads off Japan from their vessels Ishikari
and Kitakami.The MODIS ocean color and primary productiv-
ity data used in this study were produced by theMODIS Project at the Goddard Space FlightCenter. These data products were obtained fromthe Goddard Distributed Active Archive Center(DAAC) under the auspices of the NationalAeronautics and Space Agency. We acknowledgethe assistance of Lucas Moxey from the NOAACoastwatch Program, PIFSC, for his assistance inmaking the MODIS primary productivity dataavailable. Altimetry data used in this study wereproduced by the Ssalto program and obtained fromCollecte Localisation Satellites center under theauspices of the Centre National d’etudes Spatialesof France.
References
Balazs, G.H., Miya, R.K., Beavers, S.C., 1996. Procedures to
attach a satellite transmitter to the carapace of an adult green
turtle, Chelonia mydas. In: Keinath, J.A., Barnard, D.E.,
Musick, J.A., Bell, B.A., et al. (Eds.), Proceedings of the 15th
Annual Symposium on Sea Turtle Biology and Conservation.
US Department Commer., NOAA Tech. Memo. NOAA-TM-
NMFS-SWFSC-387, pp. 21–26.
Behrenfeld, M.J., Falkowski, P.G., 1997. Photosynthetic rates
derived from satellite-based chlorophyll concentration. Lim-
nology and Oceanography 42 (1), 1–20.
Bolten, A., 2003. Active swimmers-passive drifters: the oceanic
juvenile stage of loggerheads in the Atlantic system. In:
Bolten, A., Witherington, B.E. (Eds.), Loggerhead Sea
Turtles. Smithsonian Institution, Washington, DC, pp. 63–78.
Bowen, B.W., Abreu Grobois, F.A., Balazs, G.H., Kamezaki, N.,
Limpus, C.J., Ferl, R.J., 1995. Trans-Pacific migration of the
loggerhead turtle (Caretta caretta) demonstrated with mito-
chondrial DNA markers. Proceedings of the National
Academy of Sciences 92, 3731–3734.
Inagake, D., Yamada, H., Segawa, K., Okazaki, M., Nitta, A.,
Itoh, T., 2001. Migration of young bluefin tuna, Thunnus
orientalis, Temminck et Schlegel, through archival tagging
experiments and its relation with oceanographic conditions in
the western North Pacific. Bulletin of the National Research
Institute of Far Seas Fisheries 38, 37–52.
Kimura, S., Nakata, H., Okazaki, Y., 2000. Biological produc-
tion in meso-scale eddies caused by frontal disturbances of the
Kuroshio Extension. ICES Journal of Marine Science 57,
133–142.
Komatsu, T., Sugimoto, T., Isida, K., Mishra, P., Miura, T.,
2002. Importance of the Shatsky Rise area in the Kuroshio
Extension as an offshore nursery ground for Japanese
anchovy (Engraulis japonicus) and sardine (Sardinops mela-
nostictus). Fisheries Oceanography 11 (6), 354–360.
Polovina, J.J., Kleiber, P., Kobayashi, D.R., 1999. Application of
TOPEX/Poseidon satellite altimetry to simulate transport
dynamics of larvae of spiny lobster, Panulirus marginatus, in
the Northwestern Hawaiian Islands, 1993–1996. Fishery
Bulletin 97, 132–143.
Polovina, J.J., Kobayashi, D.R., Ellis, D.M., Seki, M.P.,
Balazs, G.H., 2000. Turtles on the edge: movement of
loggerhead turtles (Caretta caretta) along oceanic fronts in
the central North Pacific, 1997–1998. Fisheries Oceanography
9, 71–82.
Polovina, J.J., Howell, E., Kobayashi, D.R., Seki, M.P., 2001.
The Transition Zone Chlorophyll Front, a dynamic global
feature defining migration and forage habitat for marine
resources. Progress in Oceanography 49 (1–4), 469–483.
Polovina, J.J., Howell, E.A., Parker, D.M., Balazs, G.H., 2003.
Dive-depth distribution of loggerhead (Carretta carretta) and
olive ridley (Lepidochelys olivacea) sea turtles in the central
North Pacific Ocean: might deep longline sets catch fewer
turtles? Fishery Bulletin 101(1), 189–193.
Polovina, J.J., Balazs, G.H., Howell, E.A., Parker, D.M., Seki,
M.P., Dutton, P.H., 2004. Forage and migration habitat of
loggerhead (Caretta caretta) and olive ridley (Lepidochelys
olivacea) sea turtles in the central North Pacific Ocean.
Fisheries Oceanography 13 (1), 36–51.
Parker, D.M., Cooke, W.J., Balazs, G.H., 2005. Diet of oceanic
loggerhead sea turtles (Caretta caretta) in the central North
Pacific. Fishery Bulletin 103, 142–152.
Qiu, B., 2001. Kuroshio and Oyashio Currents. In: Encyclo-
pedia of Ocean Science. Academic Press, New york,
pp. 1413–1425.
Uchida, R., Hayasi, S., Boehlert, G.W. (Eds.), 1986. Environ-
ment and resources of seamounts in the North Pacific. NOAA
Technical Report 43, 105pp.
Yasuda, I., 2003. Hydrographic structure and variability in the
Kuroshio–Oyashio transition area. Journal of Oceanography
59, 389–402.
Top Related
Copyright © 2022 FDOKUMEN

