


Bahasa
Halaman
Hukum


[Salameh et al., Vol.3 (Iss.8): August, 2015] ISSN- 2350-0530(O) ISSN- 2394-3629(P)
Impact Factor: 1.597 (I2OR)
Http://www.granthaalayah.com ©International Journal of Research - GRANTHAALAYAH [1-13]
Management
THE INFLUENCE OF M-COMMERCE SERVICE AND SYSTEM
QUALITY DIMENSIONS ON OVERALL PERCEIVED SERVICE
QUALITY
Anas Abdelsatar Salameh*1, Shahizan Bin Hassan2, Jamal Mohammad Alekam3
*1Universiti Utara Malaysia, School of Technology Management & Logistics, Othman Yeop
Abdullah (OYA) Graduate School of Business, Box.06010. Kedah. Malaysia 2Universiti Utara Malaysia, School of Technology Management & Logistics, Othman Yeop
Abdullah (OYA) Graduate School of Business, Box.06010. Kedah. Malaysia 3Universiti Utara Malaysia, School of Business Management, Othman Yeop Abdullah (OYA)
Graduate School of Business, Box.06010. Kedah. Malaysia
ABSTRACT
Information Technology (IT) has an increasing importance and development in business life.
Nowadays, businesses have been seeking to reach their customers through m-services especially
m-commerce. The concern is to what extent this m-commerce system can satisfy the consumers’
needs and contributes to the overall online purchasing development. This study aims to examine
the effect of m-commerce service quality dimensions (website design, responsiveness, and trust),
and system quality dimension (accessibility) on overall perceived service quality in m-commerce
by customers. The data were collected from the Arab Open University in Jordan through a self-
administered questionnaire, in order to test the hypotheses of the proposed model. 618 of
questionnaires were used for analysis data, out of 870 distributed. The result of this study
revealed that there are a significant effect of responsiveness and accessibility on overall
perceived service quality. This study has some important implications for business practice and
research.
Keywords:
Service quality, system quality, m-services, mobile commerce, overall perceived service quality.
Cite This Article: Anas Abdelsatar Salameh, Shahizan Bin Hassan, and Jamal Mohammad
Alekam, “THE INFLUENCE OF M-COMMERCE SERVICE AND SYSTEM QUALITY
DIMENSIONS ON OVERALL PERCEIVED SERVICE QUALITY” International Journal of
Research – Granthaalayah, Vol. 3, No. 8(2015): 1-13.
1. INTRODUCTION
Most businesses nowadays depend on Information Technology (IT) to manage their operations.
With IT, it is easier and quicker to access the consumer and deliver what the consumer has ordered
for or meet their needs (Alfawaer, Awni, & Al-Zoubi, 2011). Companies are increasingly turning
to the Internet to market products and services. However, the effectiveness of such online

[Salameh et al., Vol.3 (Iss.8): August, 2015] ISSN- 2350-0530(O) ISSN- 2394-3629(P)
Impact Factor: 1.597 (I2OR)
Http://www.granthaalayah.com ©International Journal of Research - GRANTHAALAYAH [1-13]
commerce systems depends on the degree of comfort that customers feel with the technology-
based interactions between the customers and companies. Service in e-commerce is a function of
how the online store facilitates efficient and effective shopping, purchasing and delivery of
products and services.
Since e-commerce mostly depends on the availability of a wired network connection to the
Internet, there is still a limitation to this service among customers and corporate professionals who
are constantly on the move. In order to overcome such a limitation, there is an inclination to make
use of wireless networking technologies which can provide potential commerce at anytime and
anywhere. The move from wired to wireless services is a remarkable sign for the new millennium
(Landers, 2002). From the literature, it is evident that evolving m-commerce service has many
potential implications. According to Tiwari, Buse and Herstatt (2006), m-commerce, on the basis
of the features make provision for additional value-added utility particularly. This study aims to
examine the effect of m-commerce service quality dimensions (website design, responsiveness,
and trust), and system quality dimension (accessibility) on overall perceived service quality
(OPSQ) of m-commerce based on the perceptions of Arab Open University (AOU) students and
employees.
2. LITERATURE REVIEW, THEORETICAL FRAMEWORK AND HYPOTHESES
DEVELOPMENT
2.1. SERVICE QUALITY IN M-COMMERCE
Review of extant literature has shown that articles that measure the impact of Service Quality (SQ)
in m-service are scarce. Many of the few that are however available only studied m-commerce SQ
by examining the behavior of customers (Gerpott et al., 2001, Kim et al. 2004, Lim et al., 2006,
Seth et al., 2005, Turel and Serenko 2006). For instance, Turel and Serenko (2006) while studying
customer satisfaction in to m-services in Canada adapted the American Customer Satisfaction
Model (ACSM) (Fornell et al., 1996). In their study, the authors defined perceived quality, which
is also perceived SQ, as the served market’s evaluation of service usage experience in the recent
time after which personalization and service reliability were used for measurement (Turel and
Serenko 2006).
Studies by Kim et al. (2004) recognized six service quality measures (Gerpott et al. 2001, Lee et
al. 2001) such as pricing structure, call quality, mobile devices, convenient procedures, value
added services and customer support. However, factors, such as convenient procedures, customer
support and mobile devices were later removed because of items with low factor loadings using
exploratory factor analysis. Consequently, SQ was measured by the remaining three factors (Kim
et al. 2004). In the same vein, Lim et al., (2006) equally identified pricing plans, data services,
customer service, network quality and billing systems as the five dimensions of consumers’
perceived quality of m-services. These factors were confirmed through exploratory factor analysis
(Lim et al., 2006). Furthermore, there are other studies that examined how SQ relates to various
m-service applications (Kar et al., 2006, Rao and Minakakis 2003, Yun et al., 2005).
Chae et al., (2002) in the course of examining m-service information quality, extended a prior
framework of information quality of Dey (2001) and Wang (1998) by incorporating the features
[Salameh et al., Vol.3 (Iss.8): August, 2015] ISSN- 2350-0530(O) ISSN- 2394-3629(P)
Impact Factor: 1.597 (I2OR)
Http://www.granthaalayah.com ©International Journal of Research - GRANTHAALAYAH [1-13]
of m-commerce such as mobile context and devices. While measuring m-commerce information
quality they came up with four dimensions which include connection quality that eventually
influenced by responsiveness and stability, content quality as influenced by believability,
objectivity, interaction quality, amount and contextual quality which were determined by
navigation, structure, presentation, promptness and timeliness. Furthermore, the study maintained
that the relationship between the four major dimensions of information quality and user satisfaction
was moderated by a customer’s intended goal (Chae et al., 2002). In another study, Kar et al.
(2006) considered the unstable environment in which m-services were provided and adapted as the
quality dimensions of e-services. The models of Kaynama and Black (2000) and Liljander et al.
(2002) were developed using SERVQUAL for the purpose of aligning with the features of m-
services. In these studies, user interface, responsiveness, reliability, customization and trust were
identified as the five dimensions of SQ. Yun et al. (2005), in addition examined ring back tone,
SMS, melody ring, background image service, gaming context based services, video on demand
and multimedia message services as dimension of SQ in the context of mobile data services. The
core quality attributes identified are: sound quality, play time, and image quality.
2.2. ISSUES AND BARRIERS RELATED TO THE M-COMMERCE DEVELOPMENT
According to E-paymentsMerchantInitiative (2011); Euromonitor (2011); Jahanshahi, Mirzaie, &
Asadollahi (2011); and Goi & Ng (2011), there are many problems and obstacles in facing the
development of m-commerce service. Some of these problems listed as follows:
(i) Consumers are concerned with privacy in using the mobile device for transactions;
(ii) Consumers are still not confident in using mobile devices to make payment. Since some
personal data must be provided to enable the goods and services to be delivered, consumers
feel reluctant to engage in on-line transactions;
(iii)Consumers do not trust the web merchant; and
(iv) Security is also a concern for consumers.
2.3. SERVICE QUALITY DIMENSIONS
2.3.1. WEBSITE DESIGN
Website design refers to the appearance of mobile portal and is consistent with the tangibility
dimension in the SERVQUAL model. While Parasuraman et al., (1988) defined a tangible
dimension as the physical appearance, such as facilities, equipment, and personnel, many
researchers replaced this definition with the user website required for adapting to the e-service
context (O’Cass & Carlson, 2012; Udo, Bagchi & Kirs, 2010; Loiacono et al., 2002; Wolfinbarger
& Gilly, 2003; Lee & Lin, 2005; Aladwania & Palvia, 2002; Riel et al., 2001). Ghose and Dou
(1998) argued that greater attractiveness of a website increases the level of user satisfaction.
Website design is very important in the m-commerce service environment, because the website
substitutes the role of customers’ contact in the physical commercial companies. On the overview,
website design is a vital factor that determines the customer-perceived mobile commerce SQ. It
has significant and positive impacts on the customers' perceived SQ. The related hypothesis we
intend to test is stated as follows:
H1: There will be a significant positive relationship between website design and overall customer
perceived service quality.

[Salameh et al., Vol.3 (Iss.8): August, 2015] ISSN- 2350-0530(O) ISSN- 2394-3629(P)
Impact Factor: 1.597 (I2OR)
Http://www.granthaalayah.com ©International Journal of Research - GRANTHAALAYAH [1-13]
2.3.2. RESPONSIVENESS
The second dimension is responsiveness which is similar to the responsiveness dimension in the
SERVQUAL model. The SERVQUAL model (Parasuraman et al., 1988) defines responsiveness
as employees’ willingness in the provision of prompt service and dealing with consumer
complaints. Wang (2003) stated that: “responsiveness" is a measure for the company's ability in
supporting customers with the appropriate information when a problem occurs. It is also the
mechanism that handles returns, and has the capacity of executing arrangement for online
guarantees. Responding quickly to customers' request indicates that the company is customer-
oriented. Subsequently, this can subdue the issue of uncertainty and thus increase the perceived
convenience of customers (Gummerus et al., 2004; Wolfinbarger & Gilly, 2003). The
corresponding hypothesis is:
H2: There will be a significant positive relationship between responsiveness and overall customer
perceived service quality.
2.3.3. TRUST
According to Lynch and Lundquist (1996), e-service with much academic discourse surrounding
the security, privacy, and confidence centers on Trust. This is similar to the assurance dimension
in the SERVQUAL model. Kimery and McCard (2002) argued that "trust is the user’s willingness
to accept the vulnerability of an online transaction based on their positive expectations regarding
future online provider behaviors". Reichheld and Schefter (2000) pointed out that trust is a
significant antecedent of participation in online settings because of the increased ease with which
online transaction can behave opportunistically. Based on this prior support, we propose the
following:
H3: There will be a significant positive relationship between trust and overall customer perceived
service quality.
2.4. SYSTEM QUALITY DIMENSION
2.4.1. ACCESSIBILITY
In traditional marketing literature, speed of delivery is defined as the time it takes to actively
perform the service (Dabholkar, 1996). Maister (1985) argued that if consumers perceive that
service is delivered quickly, they are likely to evaluate the service more highly. In the e-services
environment, speed of access may also be an important factor to lure users to a particular website
(Cho & Park, 2001; Sohn, 2000).
However, accessibility in the m-commerce environment refers to the availability of the system,
where and when the customers need to conduct any kind of commercial transactions. The potential
benefit of using an m-commerce system cannot be successfully achieved without having reliable
speedy online access, because customers expect the m-commerce services to be available on
demand. M-commerce applications and services depend heavily on the underlying network
support. Two of the most significant factors that influence the development and the quality of m-
commerce services are the available bandwidth offered by the wireless networks as well as network
coverage (Papanikolaou & Mavromoustakos, 2006; Siau, Lim, & Shen, 2001). Thereafter,

[Salameh et al., Vol.3 (Iss.8): August, 2015] ISSN- 2350-0530(O) ISSN- 2394-3629(P)
Impact Factor: 1.597 (I2OR)
Http://www.granthaalayah.com ©International Journal of Research - GRANTHAALAYAH [1-13]
accessibility is one of the substantial dimensions of the mobile SQ, and has positive significant
impacts on the customers' perceived SQ. Building upon this prior work, we propose hypothesis H4
as follows:
H4: There will be a significant positive relationship between accessibility and overall customer
perceived service quality.
Figure 1: Proposed Research Framework
3. METHODOLOGY
3.1. RESEARCH GOAL
In this study, we aim to examine the effect of m-commerce service quality dimensions (website
design, responsiveness, and trust), and system quality dimension (accessibility) on overall
perceived service quality in m-commerce by customers. A structured questionnaire was used in
order to gather the data to develop the mobile service quality scale.
3.2. SAMPLE AND DATA COLLECTION
In the current study, the sample of this study was the university students and employees. The data
was collected via a self-administered questionnaire of AOU University. Previous studies revealed
that mobile services are popular among young students and people (Kinnally et al., 2008). The
questionnaire which is meant to measure the overall perceived service quality in m-commerce,
was distributed to 870 targeted respondents, randomly selected from colleges of AOU University.
Out of that number, 618 were returned and used for the analysis.
3.3. RESEARCH ANALYSIS AND RESULTS
PLS (partial least square) procedure which is Structural Equations Modeling SmartPLS 2.0 was
used for the purpose of developing the reliability prior to the evaluation of the model and PLS is
also used to test the hypotheses.
Trust
Responsiveness
Accessibility
Website Design
Service Quality Dimensions
System Quality Dimension
Overall Perceived Service
Quality in m-commerce
H1
H2
H3
H4
[Salameh et al., Vol.3 (Iss.8): August, 2015] ISSN- 2350-0530(O) ISSN- 2394-3629(P)
Impact Factor: 1.597 (I2OR)
Http://www.granthaalayah.com ©International Journal of Research - GRANTHAALAYAH [1-13]
3.3.1. THE MEASUREMENT MODEL
The content validity and the construct validity were confirmed, in order to establish the goodness
of measurement, as discussed below:
3.3.1.1. THE CONTENT VALIDITY
The content validity of a construct implies that all the items used to measure a construct should
show high loadings on their respective constructs. This is as defined in the multivariate analysis
literature. In other words, the measuring constructs must load higher comparing to other constructs
in the same column and row. Therefore, following the suggestion of Hair et al., (2010) and Chin
(1998), the factor loading should be used to evaluate the content validity. This implies that if some
items have higher loadings on other constructs that the ones they belong to, these items will be
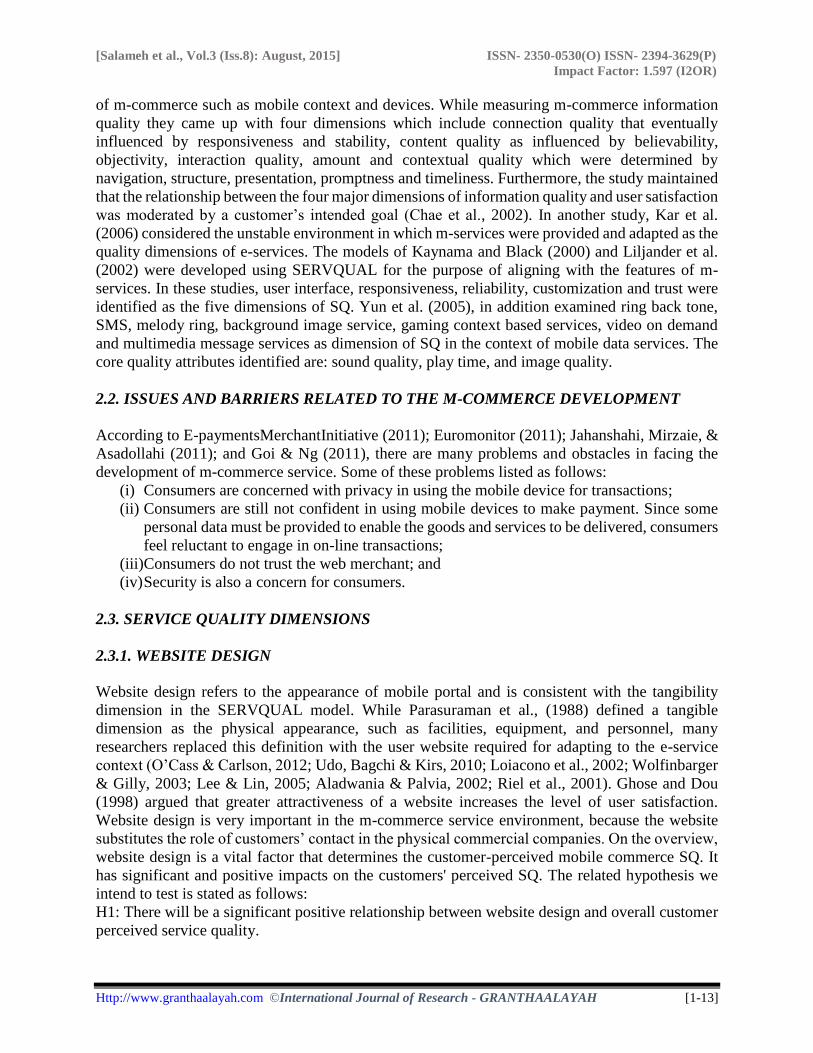
candidates for deletion. Tables 1 and 2 showed that all the variables significantly loaded on their
respective constructs and this confirmed that the measurement model used possesses the required
content validity.
Table1: Loading and cross-loadings of the items
Constructs Items WEB TRST RESP ACC OPSQ
Website Design
WEB1 0.574 0.379 0.158 0.253 0.217
WEB2 0.630 0.262 0.083 0.231 0.095
WEB3 0.804 0.387 0.188 0.277 0.276
WEB4 0.783 0.362 0.114 0.250 0.212
WEB5 0.717 0.495 0.260 0.358 0.316
Trust
TRST1 0.332 0.782 0.167 0.351 0.255
TRST2 0.288 0.802 0.159 0.460 0.316
TRST3 0.355 0.833 0.272 0.386 0.331
TRST4 0.355 0.630 0.356 0.321 0.324
TRST5 0.463 0.751 0.337 0.366 0.314
TRST6 0.327 0.690 0.247 0.391 0.199
Responsiveness
RESP1 0.412 0.478 0.775 0.279 0.334
RESP2 0.289 0.510 0.780 0.342 0.312
RESP3 0.361 0.450 0.817 0.317 0.297
RESP4 0.370 0.255 0.677 0.242 0.257
Accessibility
ACC1 0.444 0.538 0.451 0.766 0.518
ACC2 0.533 0.446 0.428 0.814 0.478
ACC3 0.417 0.309 0.323 0.691 0.305
ACC4 0.506 0.510 0.473 0.762 0.518
Overall Perceived
Service Quality
OPSQ1 0.510 0.404 0.404 0.397 0.760
OPSQ2 0.511 0.498 0.466 0.436 0.797
OPSQ3 0.584 0.521 0.548 0.555 0.828
OPSQ4 0.432 0.417 0.424 0.392 0.605
[Salameh et al., Vol.3 (Iss.8): August, 2015] ISSN- 2350-0530(O) ISSN- 2394-3629(P)
Impact Factor: 1.597 (I2OR)
Http://www.granthaalayah.com ©International Journal of Research - GRANTHAALAYAH [1-13]
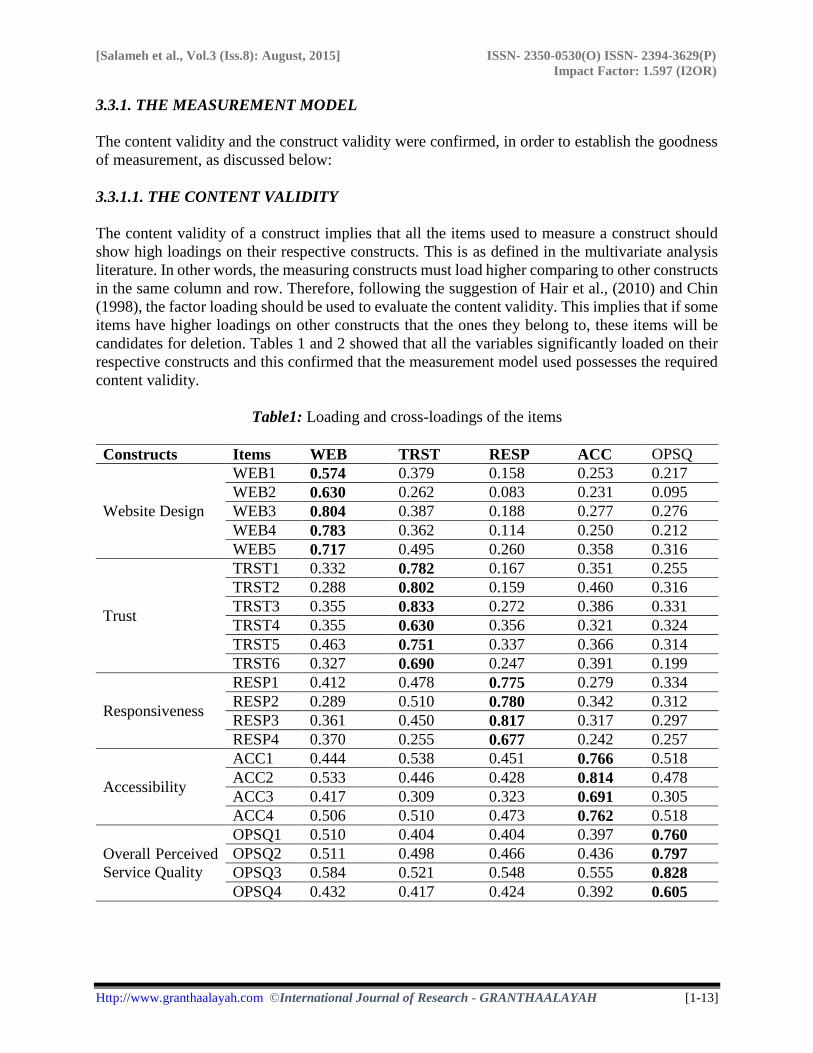
Table 2: T value results
Constructs Items Loadings Standard
Error T Value P Value
Website Design
WEB1 0.574 0.055 10.505 0.000
WEB2 0.630 0.049 12.877 0.000
WEB3 0.804 0.024 33.318 0.000
WEB4 0.783 0.025 31.410 0.000
WEB5 0.717 0.028 25.524 0.000
Trust
TRST1 0.782 0.020 39.028 0.000
TRST2 0.802 0.019 42.128 0.000
TRST3 0.833 0.017 48.798 0.000
TRST4 0.630 0.035 18.029 0.000
TRST5 0.751 0.022 33.976 0.000
TRST6 0.690 0.031 22.447 0.000
Responsiveness
RESP1 0.775 0.021 36.481 0.000
RESP2 0.780 0.019 41.218 0.000
RESP3 0.817 0.016 52.177 0.000
RESP4 0.677 0.032 21.243 0.000
Accessibility
ACC1 0.766 0.025 31.227 0.000
ACC2 0.814 0.018 45.821 0.000
ACC3 0.691 0.029 23.906 0.000
ACC4 0.762 0.021 36.754 0.000
Overall Perceived
Service Quality
OPSQ1 0.760 0.022 34.837 0.000
OPSQ2 0.797 0.024 33.716 0.000
OPSQ3 0.828 0.014 58.409 0.000
OPSQ4 0.605 0.037 16.337 0.000
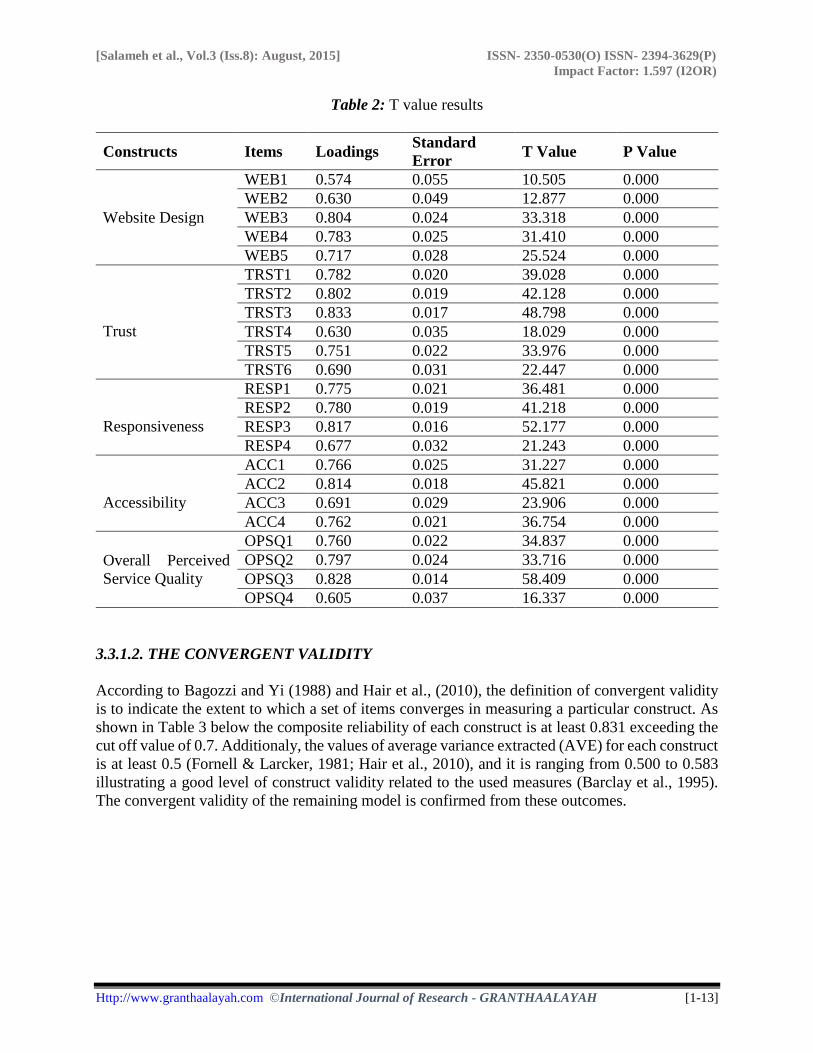
3.3.1.2. THE CONVERGENT VALIDITY
According to Bagozzi and Yi (1988) and Hair et al., (2010), the definition of convergent validity
is to indicate the extent to which a set of items converges in measuring a particular construct. As
shown in Table 3 below the composite reliability of each construct is at least 0.831 exceeding the
cut off value of 0.7. Additionaly, the values of average variance extracted (AVE) for each construct
is at least 0.5 (Fornell & Larcker, 1981; Hair et al., 2010), and it is ranging from 0.500 to 0.583
illustrating a good level of construct validity related to the used measures (Barclay et al., 1995).
The convergent validity of the remaining model is confirmed from these outcomes.
[Salameh et al., Vol.3 (Iss.8): August, 2015] ISSN- 2350-0530(O) ISSN- 2394-3629(P)
Impact Factor: 1.597 (I2OR)
Http://www.granthaalayah.com ©International Journal of Research - GRANTHAALAYAH [1-13]
Table 3: Convergent validity analysis
Constructs Items Loadings Cronbach's
Alpha CRa AVEb
Website Design
WEB1 0.574
0.757 0.831 0.500
WEB2 0.630
WEB3 0.804
WEB4 0.783
WEB5 0.717
Trust
TRST1 0.782
0.844 0.885 0.564
TRST2 0.802
TRST3 0.833
TRST4 0.630
TRST5 0.751
TRST6 0.690
Responsiveness
RESP1 0.775
0.760 0.848 0.583 RESP2 0.780
RESP3 0.817
RESP4 0.677
Accessibility
ACC1 0.766
0.755 0.845 0.577 ACC2 0.814
ACC3 0.691
ACC4 0.762
Overall Perceived
Service Quality
OPSQ1 0.760
0.738
0.837
0.566
OPSQ2 0.797
OPSQ3 0.828
OPSQ4 0.605
a: Composite Reliability: CR = (∑ factor loading)2 /{(∑ factor loading)2) + ∑ (variance of error)}
b: Average Variance Extracted: AVE = (∑ factor loading)2 / {∑(factor loading)2 + ∑ variance of
error)}
3.3.1.3. THE DISCRIMINATE VALIDITY
The definition of discriminate validity is the degree to which a set of items can distinguish a
construct from other constructs. Thus, according to Compeau et al., (1999) if compared the shared
variance of construct with the shared variance of other constructs is supposed to be greater value
comparing to other construct. Fornell and Larcker (1981) suggested a criterion to examine the
discriminant validity. As illustrated in Table 4, the square roots of AVE (average variance
extracted) are being considered diagonal elements and the variable correlation is given below the
diagonal elements. If the diagonal elements are being considered higher than the elements in other
off diagonal in their related columns and rows then we can make the comparison and assume the
discriminant validity. Furthermore, the results in the correlation matrix illustrated in Table 4 ensure
that the discriminant validity is confirmed.

[Salameh et al., Vol.3 (Iss.8): August, 2015] ISSN- 2350-0530(O) ISSN- 2394-3629(P)
Impact Factor: 1.597 (I2OR)
Http://www.granthaalayah.com ©International Journal of Research - GRANTHAALAYAH [1-13]
Table 4: The Discriminate Validity
Constructs (1)WEB (2)TRST (3)RESP (4)ACC (5)OPSQ
1) Website Design 0.707
2) Trust 0.546 0.751
3) Responsiveness 0.241 0.334 0.764
4) Accessibility 0.394 0.504 0.466 0.760
5) Overall Perceived Service
Quality 0.334 0.388 0.563 0.608 0.752
3.3.1.4. PREDICTIVE RELEVANCE OF THE MODEL
To gain the good assessing and predictive power of the proposed research model, R2 were used as
well as the Cross-Validated redundancy. R2 is defined as a value that indicates the amount of
variance in the endogenous variable that is explained by the exogenous variables. Table 5 showed
that R2 value is 57.5 % of the overall perceived service quality and was explained by website
design, trust, responsiveness, and accessibility dimensions. In this study, the results related to the
quality of prediction of the model, as discussed in Table 5 revealed that the Cross Validated
Communality related to overall perceived service quality (OPSQ) was 0.566. And the Cross
Validated Redundancy value was 0.321. And the Cross Validated Communality value was 0.566.
These values are more than zero indicating an adequate predictive validity of the model based on
the criteria mentioned by Fornell and Cha (1994). These values are more than zero indicating an
adequate predictive validity of the model based on the criteria mentioned by Fornell and Cha
(1994).
Table 5: Prediction Relevance of the Model
Constructs Variable Type R Square Cross-validated
Redundancy
Cross-validated
Communality
OPSQ Endogenous 0.575 0.321 0.566
3.3.1.5. (GoF) GOODNESS OF FIT OF THE MODEL
Unlike CB-SEM, PLS-SEM has only one measure of goodness of fit which was defined to be the
global fit measure by Tenenhaus et al. (2005). It is the geometric mean of the average variances
extracted and the average R2 for the endogenous variables as given in the following formula:
GoF = √(𝑅2 ∗ 𝐴𝑉𝐸)
Particularly, the GoF value of this model was found to be 0.657 which is considered large when
compared to the baseline values suggested by Wetzels et al., (2009)52 (small =0.1, medium =0.25,
large =0.36). The results showed that the model goodness of fit measure based on the average
variance explained is large which indicate an adequate level of global PLS model validity.

[Salameh et al., Vol.3 (Iss.8): August, 2015] ISSN- 2350-0530(O) ISSN- 2394-3629(P)
Impact Factor: 1.597 (I2OR)
Http://www.granthaalayah.com ©International Journal of Research - GRANTHAALAYAH [1-13]
3.3.2. THE HYPOTHESIS TESTING
After establishing the measurement model, the next step was to test the hypotheses of the study by
running PLS Bootstrapping in SmartPLS 2.0, the cases that were used for analysis in this study
was 618.
Table 6: The Results of the Hypothesis Testing
No Hypotheses Path
Coefficient
Standard
Error
(STERR)
T
value
P
value Decision
1 WEB -> OPSQ 0.010 0.034 0.293 0.385 Not
Supported
2 TRST -> OPSQ 0.003 0.033 0.100 0.460 Not
Supported
3 RESP -> OPSQ 0.106*** 0.041 2.573 0.005 Supported
4 ACC -> OPSQ 0.126*** 0.046 2.724 0.003 Supported
As shown in Table 6 the website design (WEB) has a positive and does not have a significant
effect on the overall perceived service quality (OPSQ) large of the 0.01 level of significance (β=
0.010, t= 0.293, p> 0.1). The results also show that trust (TRST) was has a positive and does not
have significant effect on the overall perceived service quality (OPSQ) large of the 0.01 level of
significance (β= 0.003, t= 0.100, p> 0.1). In addition, the results also show that responsiveness
(RESP) has a positive and there are a significant effect on the overall perceived service quality
(OPSQ) large of the 0.01 level of significance (β= 0.106, t= 2.573, p<0.01). Finally, the
accessibility (ACC) has a positive and significant effect on the levels of the overall perceived
service quality (OPSQ) at the 0.01 level of significance (β= 0.126, t= 2.724, p<0.01). Therefore,
these results supported the hypotheses of the study H3, and H4 and the result does not support
hypothesis H1, and H2 as reported in table 6 above.
4. DISCUSSION AND CONCLUSIONS
To examine the effect of m-commerce service quality dimensions (website design, responsiveness,
and trust), and system quality dimension (accessibility) on overall perceived service quality in m-
commerce by customers was the foremost purpose of the study. This research is important since it
extends the SERVQUAL model which has many similarities with IS model being used to
benchmark and compare several studies that have initially combined the two models. In addition,
the importance of this study cannot be overrated as its benefits’ cut across many stakeholders since
it can be regarded as among the initial studies that delve into the factors that helps to capture the
interest of customers towards using of mobile phone technology for the purpose of commercial
transactions.
This research has brought to light many practical and theoretical issues of m-commerce service
quality. Importantly, the research has discovered some possible and positive factors that make the
pursuance of m-commerce service quality to be a worthy exercise. In this respect, therefore, this

[Salameh et al., Vol.3 (Iss.8): August, 2015] ISSN- 2350-0530(O) ISSN- 2394-3629(P)
Impact Factor: 1.597 (I2OR)
Http://www.granthaalayah.com ©International Journal of Research - GRANTHAALAYAH [1-13]
research has therefore challenged the entire information system research to continue to investigate
into those factors that can influence mobile commerce service quality by applying new applications
that match background and preferences of users.
Future research could carry out similar studies with respect to OPSQ in developing countries
because only a few attempts of such have been made. Additionally, a comparative study between
developing and developed countries concerning OPSQ can be carried out. Moreover, this study
used only questionnaire to collect data, other researchers can use qualitative method - in-depth
interview – with a view of getting more suitable variables that could impact customers overall
perceived m-commerce. This can be better achieved when the researcher builds a trusted
relationship with them and speaks their language. The findings of this study might be of a great
value to creating new knowledge, awareness and benefits that can be derived from using mobile
transaction especially among customers and vendors. Creating such awareness will help to foster
a better understanding and practices of m-commerce and would help in increasing the agility in
power of purchasing of the customers and organizations business efficiency.
5. REFERENCES
[1] Aladwani, A. M., & Palvia, P. C. (2002). Developing and validating an instrument for
measuring user-perceived web quality. Information & Management, 39(6), 467-476.
[2] Alfawaer, Z. M., Awni, M., & Al-Zoubi, S. (2011). Mobile e-ticketing reservation system for
Amman International Stadium in Jordan. International Journal of Academic Research, 3(1), 848-
852.
[3] Bagozzi, R. P., & Yi, Y. (1988). On the evaluation of structural equation models. Journal of
the academy of Marketing Science, 16(1), 74-94.
[4] Barclay, D., Higgins, C., & Thompson, R. (1995). The partial least squares (PLS) approach
to causal modeling: Personal computer adoption and use as an illustration. Technology studies,
2(2), 285-309.
[5] Chae, M., Kim, J., Kim, H., & Ryu, H. (2002). Information quality for mobile Internet services:
A theoretical model with empirical validation. Electronic Markets, 12(1), 38-46.
[6] Chin, W. W. (1998). The partial least squares approach to structural equation modeling.
Modern methods for business research, 295(2), 295-336.
[7] Cho, N., & Park, S. (2001). Development of electronic commerce user-consumer satisfaction
index (ECUSI) for Internet shopping. Industrial Management & Data Systems, 101(8), 400-405.
[8] Gerpott, T. J., Rams, W., & Schindler, A. (2001). Customer retention, loyalty, and satisfaction
in the German mobile cellular telecommunications market. Telecommunications Policy, 25(4),
249-269.
[9] Compeau, D., Higgins, C. A., & Huff, S. (1999). Social cognitive theory and individual
reactions to computing technology: A longitudinal study. MIS quarterly, 23(2), 145-158.
[10] Dabholkar, P. A. (1996). Consumer evaluations of new technology-based self-service
options: an investigation of alternative models of service quality. International Journal of research
in Marketing, 13(1), 29-51.
[11] E-paymentsMerchantIntiative. (2011). Concept position paper: Online Payments in Europe
Key issues and requirements of Web Merchants in Europe (pp. 1-9).
[Salameh et al., Vol.3 (Iss.8): August, 2015] ISSN- 2350-0530(O) ISSN- 2394-3629(P)
Impact Factor: 1.597 (I2OR)
Http://www.granthaalayah.com ©International Journal of Research - GRANTHAALAYAH [1-13]
[12] Euromonitor. (2011). Starbucks Mobile App Has Ability to Change M-Commerce Landscape
in the U.S Retrieved March/30/2012, from http://blog.euromonitor.com/2011/06/starbucks-
mobile-app-has-ability-to-change-m-commerce-landscape-in-the-us.html
[13] Fornell, C., & Cha, J. (1994). Partial least squares. Advanced methods of marketing
research, 407(6), 52-78.
[14] Fornell, C., Johnson, M. D., Anderson, E. W., Cha, J., & Bryant, B. E. (1996). The American
customer satisfaction index: nature, purpose, and findings. The Journal of Marketing, 60(4), 7-18.
[15] Fornell, C., & Larcker, D. F. (1981). Evaluating structural equation models with
unobservable variables and measurement error. Journal of marketing research, 5(9), 39-50.
[16] Ghose, S., & Dou, W. (1998). Interactive functions and their impacts on the appeal of Internet
presence sites. Journal of Advertising Research, 38(2), 29-44.
[17] Goi, C. L., & Ng, P. Y. (2011). Perception of Young Consumers on Mobile Phone Applications
in Malaysia. World Applied Sciences Journal, 15(1), 47-55.
[18] Gummerus, J., Liljander, V., Pura, M., & Van Riel, A. (2004). Customer loyalty to content-
based web sites: the case of an online health-care service. Journal of Services Marketing, 18(3),
175-186.
[19] Hair, J. J. F., Black, W. C., Babin, B. J., & Anderson, R. E. (2010). Multivariate Data
Analysis. A Global Perspective. London: Pearson Education.
[20] Jahanshahi, A. A., Mirzaie, A., & Asadollahi, A. (2011). Mobile Commerce Beyond Electronic
Commerce: Issue And Challenges. Asian Journal of Business and Management Sciences, 1(2),
119-129.
[21] Kar, E., Muniafu, S., & Wang, Y. (2006). Mobile services used in unstable environments:
design requirements based on three case studies. Paper presented at the Proceedings of the 8th
international conference on Electronic commerce: The new e-commerce: innovations for
conquering current barriers, obstacles and limitations to conducting successful business on the
internet, Fredericton, Canada.
[22] Kaynama, D. S. A., & Black, C. I. (2000). A proposal to assess the service quality of online
travel agencies: An exploratory study. Journal of Professional Services Marketing, 21(1), 63-88.
[23] Kim, M. K., Park, M. C., & Jeong, D. H. (2004). The effects of customer satisfaction and
switching barrier on customer loyalty in Korean mobile telecommunication services.
Telecommunications Policy, 28(2), 145-159.
[24] Kimery, K. M., & McCard, M. (2002). Third-Party Assurance: Mapping the Road to Trust in
E-retailing. Journal of Information Technology Theory and Application, 4(2), 63-82.
[25] Kinnally, W., Lacayo, A., McClun, S. and Sapolsky, B. (2008), Getting up on the download:
college students' motivation for acquiring music via the web. New Media Society, 10(3), 893-913.
[26] Landers, P. (2002). From E-Learning to MLearning, Ericsson. 2002.
[27] Lee, G.-G., & Lin, H.-F. (2005). Customer perceptions of e-service quality in online shopping.
International Journal of Retail & Distribution Management, 33(2), 161-176.
[28] Lee, J., Lee, J., & Feick, L. (2001). The impact of switching costs on the customer satisfaction-
loyalty link: mobile phone service in France. Journal of Services Marketing, 15(1), 35-48.
[29] Liljander, V., Van Riel, A. C., & Pura, M. (2002). Customer satisfaction with e-services: the
case of an online recruitment portal. Yearbook of Services Management, 33(5), 407-432.
[30] Lim, H., Widdows, R., & Park, J. (2006). M-loyalty: winning strategies for mobile carriers.
Journal of Consumer Marketing, 23(4), 208-218.
[31] Loiacono, E. T., Watson, R. T., & Goodhue, D. L. (2002). WebQual: A measure of website
quality. Marketing theory and applications, 13(3), 432-438.

[Salameh et al., Vol.3 (Iss.8): August, 2015] ISSN- 2350-0530(O) ISSN- 2394-3629(P)
Impact Factor: 1.597 (I2OR)
Http://www.granthaalayah.com ©International Journal of Research - GRANTHAALAYAH [1-13]
[32] Lynch, D. C., & Lundquist, L. (1996). Digital money: the new era of Internet commerce. New
York, NY: John Wiley & Sons, Inc.
[33] Maister, D. H. (1985). The service encounter: Managing employee/customer interaction in
service business Lexington, MA: Lexington Books. Free Press.
[34] O’Cass, A., & Carlson, J. (2012). An e-retailing assessment of perceived website-service
innovativeness: Implications for website quality evaluations, trust, loyalty and word of mouth.
Australasian Marketing Journal (AMJ), 20(3), 28-36.
[35] Papanikolaou, K., & Mavromoustakos, S. (2006). Critical success factors for the development
of mobile learning applications. Paper presented at the 24th IASTED International Multi-
Conference Internet and Multimedia Systems and applications Innsbruck, Austria.
[36] Parasuraman, A., Zeithaml, V. A., & Berry, L. (1988). SERVQUAL: a multiple-item scale for
measuring consumer perceptions of service quality. Retailing: Crit Concepts Bk2, 64(1), 12-40.
[37] Rao, B., & Minakakis, L. (2003). Evolution of mobile location-based services.
Communications of the ACM, 46(12), 61-65.
[38] Riel, A. C., Liljander, V., & Jurriens, P. (2001). Exploring consumer evaluations of e-
services: a portal site. International Journal of Service Industry Management, 12(4), 359-377.
[39] Reichheld, F. F., & Schefter, P. (2000). E-loyalty: your secret weapon on the web. Harvard
business review, 78(4), 105-113.
[40] Seth, A., Momaya, K., & Gupta, H. (2005). An exploratory investigation of customer loyalty
and retention in cellular mobile communication. Journal of Services Research, 1(Special Issue),
173-185.
[41] Siau, K., Lim, E. P., & Shen, Z. (2001). Mobile commerce: Promises, challenges and research
agenda. Journal of Database Management (JDM), 12(3), 4-13.
[42] Sohn, C. S. (2000). Customer evaluation of Internet-based service quality and intention to re-
use internet-based services. Unpublished doctoral dissertation, Southern Illinois University,
Carbondale, Illinois.
[43] Tenenhaus, M., Vinzi, V. E., Chatelin, Y.-M., & Lauro, C. (2005). PLS path modeling.
Computational statistics & data analysis, 48(1), 159-205.
[44] Tiwari, R., Buse, S., & Herstatt, C. (2006). Mobile banking as business strategy: Impact of
mobile technologies on customer behaviour and its implications for banks. Paper presented at the
Technology Management for the Global Future, 2006. PICMET 2006.
[45] Turel, O., & Serenko, A. (2006). Satisfaction with mobile services in Canada: An empirical
investigation. Telecommunications Policy, 30(5-6), 314-331.
[46] Udo, G. J., Bagchi, K. K., & Kirs, P. J. (2010). An assessment of customers’e-service quality
perception, satisfaction and intention. International Journal of Information Management, 30(6),
481-492.
[47] Wang, Y. S. (2003). The adoption of electronic tax filing systems: an empirical study.
Government Information Quarterly, 20(4), 333-352.
[48] Wang, Y. S. (2003). Assessment of learner satisfaction with asynchronous electronic learning
systems. Information & Management, 41(1), 75-86.
[49] Wolfingbarger, M., & Gilly, M. (2003). eTailQ: dimensionalizing, measuring and predicting
etail quality. Journal of Retailing, 79(3), 183-198.
[50] Yun, D. K., Kim, K. Y., & Ko, H. S. (2005). Customer expectation level in mobile data services.
Paper presented at the Proceedings of the 7th international conference on Human computer
interaction with mobile devices & services. 259-262.
Top Related
Copyright © 2022 FDOKUMEN

