


Bahasa
Halaman
Hukum

com
ment
reviews
reports
deposited research
refereed researchinteractio
nsinfo
rmatio
n
Open Access2006Bonneauet al.Volume 7, Issue 5, Article R36MethodThe Inferelator: an algorithm for learning parsimonious regulatory networks from systems-biology data sets de novoRichard Bonneau*†, David J Reiss‡, Paul Shannon‡, Marc Facciotti‡, Leroy Hood‡, Nitin S Baliga‡ and Vesteinn Thorsson‡
Addresses: *New York University, Biology Department, Center for Comparative Functional Genomics, New York, NY 10003, USA. †Courant Institute, NYU Department of Computer Science, New York, NY 10003, USA. ‡Institute for Systems Biology, Seattle, WA 98103-8904, USA.
Correspondence: Richard Bonneau. Email: [email protected]
© 2006 Bonneau et al.; licensee BioMed Central Ltd This is an open access article distributed under the terms of the Creative Commons Attribution License (http://creativecommons.org/licenses/by/2.0), which permits unrestricted use, distribution, and reproduction in any medium, provided the original work is properly cited.Halobacterium interaction networks<p>The Inferelator, a method for deriving genome-wide transcriptional regulatory interactions, successfully predicted global expression in <it>Halobacterium </it>under novel perturbations.</p>
Abstract
We present a method (the Inferelator) for deriving genome-wide transcriptional regulatoryinteractions, and apply the method to predict a large portion of the regulatory network of thearchaeon Halobacterium NRC-1. The Inferelator uses regression and variable selection to identifytranscriptional influences on genes based on the integration of genome annotation and expressiondata. The learned network successfully predicted Halobacterium's global expression under novelperturbations with predictive power similar to that seen over training data. Several specificregulatory predictions were experimentally tested and verified.
BackgroundDistilling regulatory networks from large genomic, proteomicand expression data sets is one of the most important mathe-matical problems in biology today. The development of accu-rate models of global regulatory networks is key to ourunderstanding of a cell's dynamic behavior and its responseto internal and external stimuli. Methods for inferring andmodeling regulatory networks must strike a balance betweenmodel complexity (a model must be sufficiently complex todescribe the system accurately) and the limitations of theavailable data (in spite of dramatic advances in our ability tomeasure mRNA and protein levels in cells, nearly all biologicsystems are under-determined with respect to the problem ofregulatory network inference).
A major challenge is to distill, from large genome-wide datasets, a reduced set of factors describing the behavior of thesystem. The number of potential regulators, restricted here totranscription factors (TFs) and environmental factors, is
often on the same order as the number of observations in cur-rent genome-wide expression data sets. Statistical methodsoffer the ability to enforce parsimonious selection of the mostinfluential potential predictors of each gene's state. A furtherchallenge in regulatory network modeling is the complexity ofaccounting for TF interactions and the interactions of TFswith environmental factors (for example, it is known thatmany transcription regulators form heterodimers, or arestructurally altered by an environmental stimulus such aslight, thereby altering their regulatory influence on certaingenes). A third challenge and practical consideration in net-work inference is that biology data sets are often heterogene-ous mixes of equilibrium and kinetic (time series)measurements; both types of measurements can provideimportant supporting evidence for a given regulatory model ifthey are analyzed simultaneously. Last, but not least, is thechallenge resulting from the fact that data-derived networkmodels be predictive and not just descriptive; can one predictthe system-wide response in differing genetic backgrounds,
Published: 10 May 2006
Genome Biology 2006, 7:R36 (doi:10.1186/gb-2006-7-5-r36)
Received: 24 October 2005Revised: 13 February 2006Accepted: 30 March 2006
The electronic version of this article is the complete one and can be found online at http://genomebiology.com/2006/7/5/R36
Genome Biology 2006, 7:R36
R36.2 Genome Biology 2006, Volume 7, Issue 5, Article R36 Bonneau et al. http://genomebiology.com/2006/7/5/R36
or when the system is confronted with novel stimulatory fac-tors or novel combinations of perturbations?
A significant body of work has been devoted to the modelingand learning of regulatory networks [1-3]. In these studiesregulatory interactions and dynamics are modeled with vary-ing degrees of detail and model flexibility and, accordingly,such models can be separated into general classes based onthe level of detail with which they model individual regulatoryinteractions [1,2]. At the highest level of detail lie differentialequations and stochastic models, which provide detaileddescriptions of regulatory systems and can be used to simu-late systems dynamics, but they are computationallydemanding and require accurate measurement of a largenumber of parameters. Hence, these simulations have prima-rily been carried out for small-scale systems (relative to thefull, genome-wide, regulatory circuit for a given organism);often these studies model systems that have been studied ingreat detail for decades, such as the galactose utilization path-way in yeast and the early development of sea urchin. At theother end of the model complexity spectrum lie Boolean net-works [4], which assume that genes are simply on or off, andinclude standard logic interactions (AND, OR, XOR, and soon). Despite this simplification of regulatory dynamics andinteractions, these approaches have the advantages of sim-plicity, robustness (they can be learned with significantlyfewer data), and ease of interpretation [5]. Recent probabilis-tic approaches to modeling regulatory network on thegenome-wide scale use Bayesian networks to model regula-tory structure, de novo, at the Boolean level [6-11].
Additive linear or generalized linear models take an interme-diate approach, in terms of model complexity and robustness[12-15]. Such models describe each gene's expression level asa weighted sum of the levels of its putative predictors. Inclu-sion of functions that modify the linear response produced bythese additive methods (sometimes referred to as squashingfunctions) allows some biologically relevant nonlinear proc-esses (for example, promoter saturation) to be modeled. Anadvantage of linear and generalized linear models is that theydraw upon well developed techniques from the field of statis-tical learning for choosing among several possible models andefficiently fitting the parameters of those models.
Learning and/or modeling of regulatory networks can begreatly aided by reducing the dimensionality of the searchspace before network inference. Two ways to approach thisare limiting the number of regulators under considerationand grouping genes that are co-regulated into clusters. In theformer case, candidates can be prioritized based on theirfunctional role (for example, limiting the set of potential pre-dictors to include only TFs, and grouping together regulatorsthat are in some way similar). In the latter case, gene expres-sion clustering, or unsupervised learning of gene expressionclasses, is commonly applied. It is often incorrectly assumedthat co-expressed genes correspond to co-regulated genes.
However, for the purposes of learning regulatory networks itis desirable to cluster genes on the basis of co-regulation(shared transcriptional control) as opposed to simple co-expression. Furthermore, standard clustering proceduresassume that co-regulated genes are co-expressed across allobserved experimental conditions. Because genes are oftenregulated differently under different conditions, this assump-tion is likely to break down as the quantity and variety of datagrow.
Biclustering was developed to address better the full com-plexity of finding co-regulated genes under multifactor con-trol by grouping genes on the basis of coherence undersubsets of observed conditions [10,16-22]. We developed anintegrated biclustering algorithm, named cMonkey (Reiss DJ,Baliga NS, Bonneau R, unpublished data), which groupsgenes and conditions into biclusters on the basis of the follow-ing: coherence in expression data across subsets of experi-mental conditions; co-occurrence of putative cis-actingregulatory motifs in the regulatory regions of bicluster mem-bers; and the presence of highly connected subgraphs in met-abolic [23] and functional association networks [24-26].Because cMonkey was designed with the goal of identifyingputatively co-regulated gene groupings, we use it to 'pre-clus-ter' genes before learning regulatory influences in the presentstudy. cMonkey identifies relevant conditions in which thegenes within a given bicluster are expected to be co-regulated,and the inferred regulatory influences on the genes in eachbicluster pertain to (and are fit using) only those conditionswithin each bicluster. In principle, the algorithm described inthis work can be coupled with other biclustering and cluster-ing algorithms.
Here we describe an algorithm, the Inferelator, that infersregulatory influences for genes and/or gene clusters frommRNA and/or protein expression levels. The method usesstandard regression and model shrinkage (L1 shrinkage)techniques to select parsimonious, predictive models for theexpression of a gene or cluster of genes as a function of thelevels of TFs, environmental influences, and interactionsbetween these factors [27]. The procedure can simultaneouslymodel equilibrium and time course expression levels, suchthat both kinetic and equilibrium expression levels may bepredicted by the resulting models. Through the explicit inclu-sion of time and gene knockout information, the method iscapable of learning causal relationships. It also includes anovel solution to the problem of encoding interactionsbetween predictors into the regression. We discuss the resultsfrom an initial run of this method on a set of microarrayobservations from the halophilic archaeon HalobacteriumNRC-1.
Genome Biology 2006, 7:R36
http://genomebiology.com/2006/7/5/R36 Genome Biology 2006, Volume 7, Issue 5, Article R36 Bonneau et al. R36.3
com
ment
reviews
reports
refereed researchdepo
sited researchinteractio
nsinfo
rmatio
n
Results and discussionThe inferred global regulatory network for Halobacterium NRC-1We applied our method to the Halophilic archaeon Halobac-terium NRC-1. The Halobacterium genome contains 2,404nonredundant genes, of which 124 are annotated to be knownor putative TFs [28,29]. The biclustering and network infer-ence procedure were performed on a recently generated dataset containing 268 mRNA microarray measurements of thisarchaeon under a wide range of genetic and environmentalperturbations ('Kaur A, Pan M, Meislin M, El-Geweley R,Baliga NS' and 'Whitehead K, Kish A, Pan M, Kaur A, King N,Hohmann L, Diruggiero J, Baliga NS', personal communica-tions), [30,31]. Several TFs do not change significantly intheir expression levels in the data set; of the 124 identifiedTFs, 100 exhibited a significant change in expression levelsacross the data set, and the remaining 24 TFs were excludedfrom the set of potential influences (see Materials and meth-ods, below) [32]. Strongly correlated TFs (those with correla-tion greater than 0.85) were further grouped, yielding 72regulators (some representing multiple correlated regula-tors). To these 72 potential regulators were added 10 environ-mental factors for a total of 82 possible predictors for the1,934 genes with significant signal in the data set. In additionto this main data set, 24 new experiments (collected aftermodel fitting) were used for independent error estimationsubsequent to the network inference procedure.
The cMonkey method (Reiss DJ, Baliga NS, Bonneau R,unpublished data) was applied to this data set (original 268conditions) to bicluster genes and conditions, on the basis ofthe gene expression data, a network of functional associa-tions, and the occurrence and detection of cis-acting regula-tory motifs in bicluster upstream sequences. Biclusteringresulted in 300 biclusters covering 1,775 genes. An additional159 genes, which exhibited significant change relative to thecommon reference across the data set, were determined bycMonkey to have unique expression patterns and were thusnot included in biclusters; these 159 genes were inferredindividually.
The regulatory network inference procedure was then per-formed on these 300 biclusters and 159 individual genes,resulting in a network containing 1,431 regulatory influences(network edges) of varying strength. Of these regulatoryinfluences, 495 represent interactions between two TFs orbetween a TF and an environmental factor. We selected thenull model for 21 biclusters (no influences or only weak regu-latory influences found, as described in Materials and meth-ods, below), indicating that we are stringently excludingunder-determined genes and biclusters from our networkmodel. The ratio of data points to estimated parameters isapproximately 67 (one time constant plus three regulatoryinfluences, on average, from 268 conditions). Our data set isnot complete with respect to the full physiologic and environ-mental repertoire for Halobacterium NRC-1, and several TFs
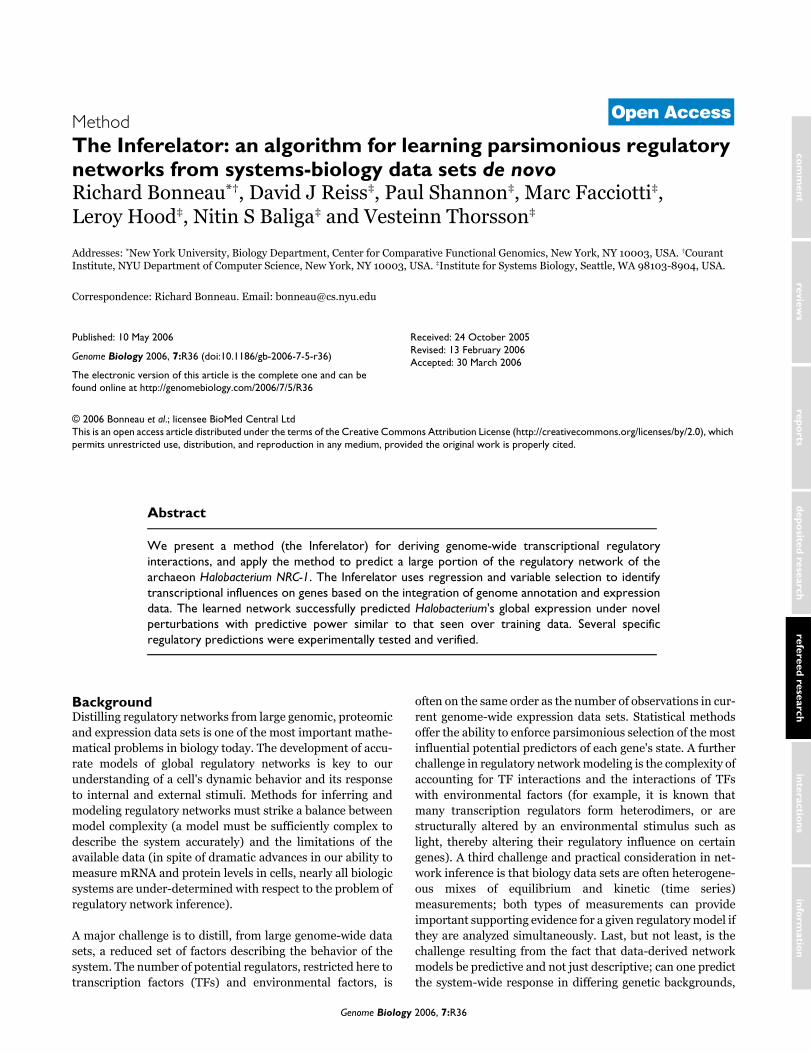
have their activity modulated by unobserved factors (forexample, post-translational modifications and the binding ofunobserved ligands); the regulatory relations for many genesare therefore not visible, given the current data set. Figure 1shows the resultant network for Halobacterium NRC-1 inCytoscape, available as a Cytoscape/Gaggle web start [33,34].
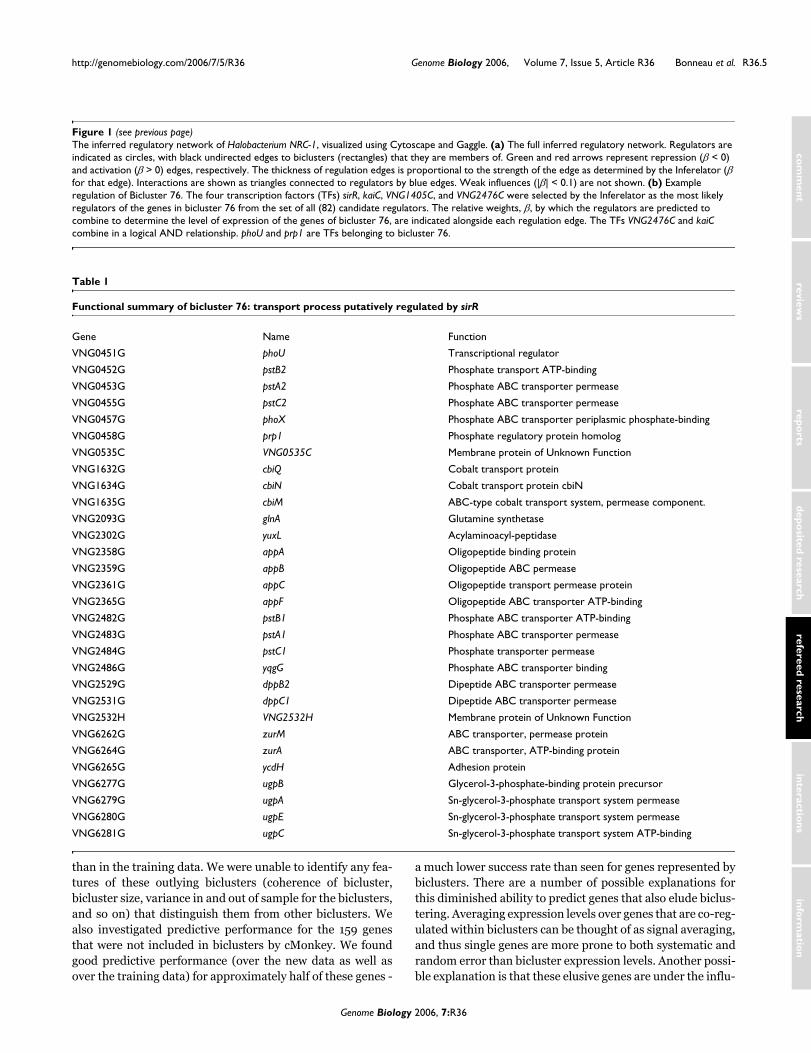
An example of the predicted regulation of a single bicluster,bicluster 76 (containing genes involved in the transport of Feand Mn; Table 1), is shown in Figure 1b. Among the 82 possi-ble regulators, four were selected as the most likely regulatorsof this bicluster. The learned function of these TFs allows pre-diction of the bicluster 76 gene expression levels under novelconditions, including genetic perturbations (for example, topredict the expression levels in a kaiC knockout strain, theinfluence of kaiC can be removed from the equation by settingits weight to zero). We discuss the predicted regulatory modelfor bicluster 76 further below.
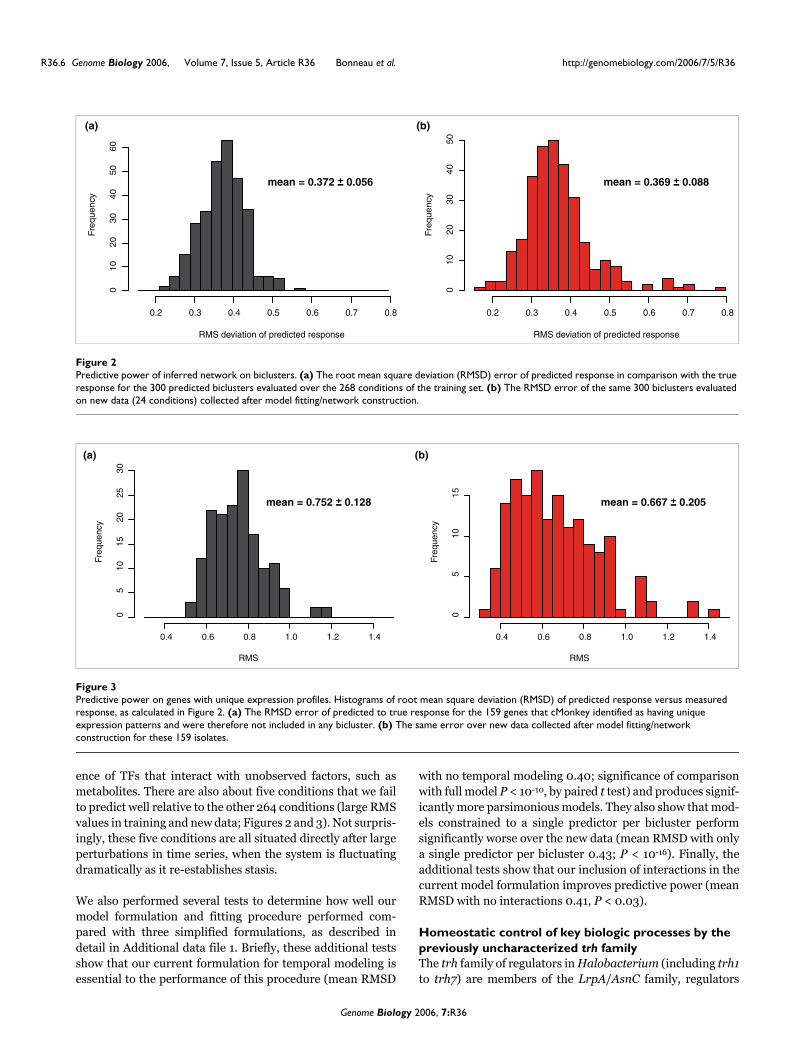
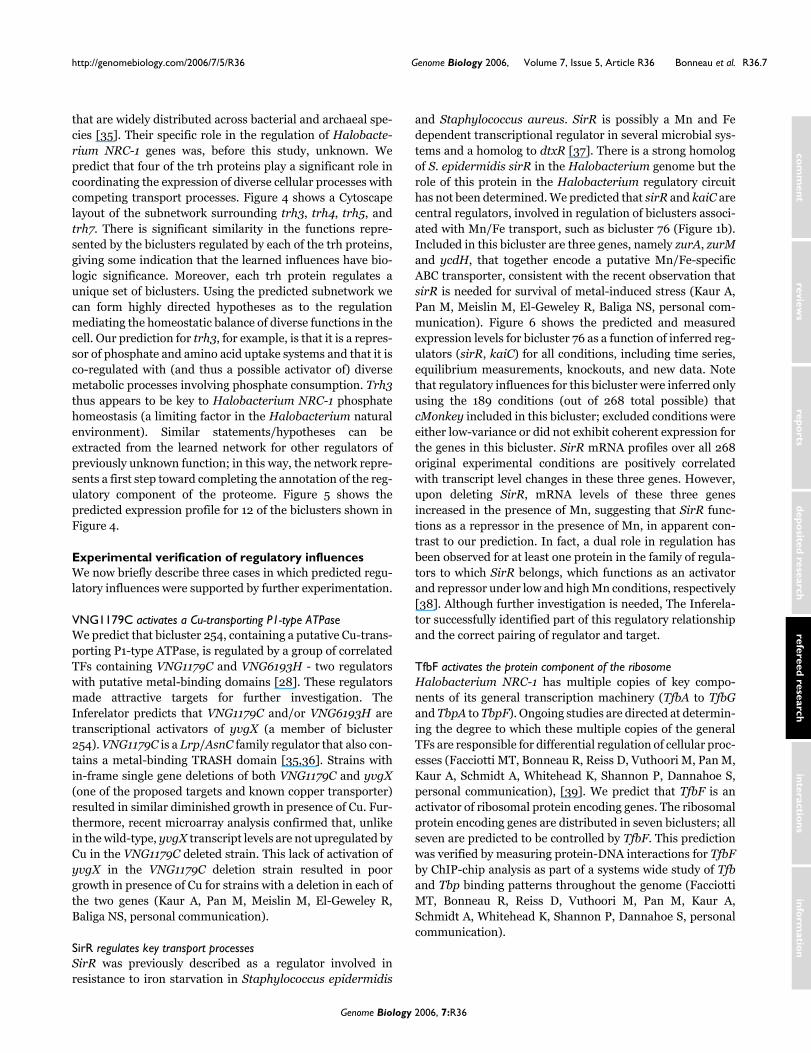
We evaluated the ability of the inferred network model to pre-dict the expression state of Halobacterium NRC-1 on agenome-wide basis. For each experimental condition, wemade predictions of each bicluster state, based on the levels ofregulators and environmental factors, and compared pre-dicted expression values with the corresponding measuredstate (using root mean square deviation [RMSD] to evaluatethe difference, or error, as described under Materials andmethods, below). In this way we evaluated the predictive per-formance of the inferred network both on experiments in thetraining data set and on the 24 experiments in the independ-ent test set (which we refer to as the newly collected data set).The expression level of a bicluster is predicted from the levelof TFs and environmental factors that influence it in the net-work, at the prior time point (for time course conditions) orthe current condition (for steady state conditions). The errorestimates for the 300 biclusters and 159 single genes areshown in Figures 2 and 3. For the biclusters, the mean errorof 0.37 is significantly smaller than the range of ratiosobserved in the data (because all biclusters were normalizedto have variances of about 1.0 before model fitting), indicatingthat the overall global expression state is well predicted. Ourpredictive power on the new data (Figures 2 and 3, right pan-els) is similar to that on the training data (the mean RMS overthe training set is within 1 standard deviation of the meanRMS over the new data), indicating that our procedure isenforcing reasonable parsimony upon the models (using L1shrinkage coupled with tenfold cross-validation [CV], asdescribed under Materials and methods, below) and accu-rately estimating the degree to which we can predict theexpression levels of biclusters as a function of TF and envi-ronmental factor levels.
Although the majority of biclusters have new data RMS valueswell matched by the training set RMS values, there are alsonine biclusters (biclusters 1, 37, 77, 82, 99, 137, 161, 165, and180) with RMS values significantly higher in the new data
Genome Biology 2006, 7:R36
R36.4 Genome Biology 2006, Volume 7, Issue 5, Article R36 Bonneau et al. http://genomebiology.com/2006/7/5/R36
Figure 1 (see legend on next page)
cspd1
tfbf
VNG0424C
VNG0703H
191
1
nirh
AND
nusa
98
AND
illuminationboa2
gamma
319
AND
388AND
cspd2
3
7
12
16
VNG0194H
25
49
50
55
71
79
tfbg
113123
2
VNG0040C
tbpe
19
24
29
67
VNG0066H
128
VNG5075C263
VNG0039H
AND
rhl
VNG0320H
tfbb
VNG1029C
59
170
283
kaic
AND
trh7
156
tbpd
89
219
416
423
432
449
4
5
8
gvpe2
28
oxygen
141
148
182
188
200
338
AND
tbpc
210
6
phou
prp1
arsr
sirr
76
124
163
174
205
226
397
VNG2476C
VNG0293H
9
VNG1405C
imd1
11
VNG0462C
VNG6288C
42
57
68
bat
73
84
86
125
139
151
162
trh3
208
209
223
238
244
246
257
266
273
289
298
AND
Zn
322
375
Cu
427AND
458
ANDrad3b
184
gvpe1
VNG0156C
nusg
253
VNG5050H
430AND
AND
AND
VNG2641H
136
275
trh5
215312
AND
10
AND
AND
VNG0826C VNG5130H
264
AND
VNG2163H
175
AND
13
VNG0511H
196
30914
15
17
18
AND
20
21
22
23
AND
snp
27
VNG0389C
195269
274
imd2
334
357
AND
380
AND
AND
idr2
258
26
asnc
VNG1845C
255
VNG5009H
296
437
AND
VNG0176H
AND
VNG5176C
boa3
268
30
31
pai1
boa4
VNG2020C
VNG2126C
252
260
422
AND
32
boa1
251
267
33
AND
34
35
36
37
38
39
AND
40
AND
VNG2614H
tror
259
282
41
VNG0147C194
224
43
44
45
AND
46
47 48
AND
AND
AND
51
52
AND
53
54
56
58
60
AND
61
AND
62
63
64
65
66
AND
69
70
AND
72
Fe
AND
74
75
AND
AND
77
AND
78
AND
80
81
AND
AND
82
AND
83
VNG1483C
193
85
AND
87
88
90
AND
91
92
93
94
95
AND
96
97
99
AND
100
101
102
103
104
105
106
107
108
109
AND
110
AND
111
112
AND
114
AND
115
116
117
118
trh4
270
AND
119
AND
120
121
122
AND
AND
126
127
AND
129
130
AND
131
132
133
134
135
AND
137
138
140
142
143
144
145
146
147
149
150
AND
152
153
154
155
157
158
159
AND
160
AND
161
AND
164
165
AND
AND
166
167
168
169171
172
173
AND
176
AND
177
178
179
180
AND
181
183
AND
185
186
AND
187
189
190
AND
192AND
AND
AND
AND
AND
198
201
202203
204
AND
AND
206
207
AND
AND
AND
211
212
213
214
216
217
AND
218
220
221
222
AND
AND
225
AND
AND
227
228
231
232
AND
233
234
235
237
AND
239
240
241
243
AND
AND
245
247
248
249
250
254
VNG0471C
256
AND
265
271
272
AND
AND
276
277
278
AND
279
280
281
284
VNG0019H
AND
285
286
287
VNG5144H
AND
288
AND
AND
290
291
292
293295
AND
297
299
300
301
302
303
AND
AND
304
AND
306
307
AND
Ni
308
310
AND
AND
311
313
AND
314
315
317
AND
318
AND
320
AND
AND
321
324
325
AND
AND
326
329
AND
AND
330
AND
331
332
AND
AND
335
336
AND
337AND
AND
339
AND
340
AND
341
342
AND
AND
343
AND
344
345
AND
346
AND
AND
347
AND
AND
348
349
AND
AND
350
351
352
AND
353
AND
354
355
NA
AND
356
AND
AND
358
359
360
361
362
AND
AND
363
AND
364
AND
365
AND
366
367
AND
368
AND
369
372
373
374
376
AND
377
378
AND
AND
381
AND
382
384
385
AND
AND
386
387
389
390
391
AND
392
393
AND
AND
394
395
AND396
398
399
400
AND
401
402
AND
403
AND
404
AND
405
406
AND
AND
407
408
AND
409
410
411
412
415
AND
417
AND
418
AND
420
AND
AND
421
424
425
426
AND
AND
AND
AND
428
AND
429
AND
431
AND
AND
AND
433
AND
434
AND
AND
435
436
AND
438
AND
439 AND
440
AND
441
442
AND
443
444
AND
445 AND
AND
446
AND
447AND
AND
448
AND
451
AND
452
AND
453
AND
454
AND
455
AND
456
AND
457
AND
AND
459
AND
AND
AND
AND
AND
ANDAND
AND
AND
AND
AND
AND
AND
AND
ANDAND
AND
AND
AND
AND
AND
AND
AND
AND
AND
AND
AND
AND
AND
AND
AND
AND
AND
AND
AND
AND
AND
AND
AND
AND
AND
AND
AND
AND
AND
AND
AND
(a)
kaiC
VNG2476C
phoU
VNG1405C
prp1
sirR
76: Mn/Fe transport Phosphate and Cobalt transport
AND
(b)-0.14
+0.15
+0.12
+0.12
Genome Biology 2006, 7:R36
http://genomebiology.com/2006/7/5/R36 Genome Biology 2006, Volume 7, Issue 5, Article R36 Bonneau et al. R36.5
com
ment
reviews
reports
refereed researchdepo
sited researchinteractio
nsinfo
rmatio
n
than in the training data. We were unable to identify any fea-tures of these outlying biclusters (coherence of bicluster,bicluster size, variance in and out of sample for the biclusters,and so on) that distinguish them from other biclusters. Wealso investigated predictive performance for the 159 genesthat were not included in biclusters by cMonkey. We foundgood predictive performance (over the new data as well asover the training data) for approximately half of these genes -
a much lower success rate than seen for genes represented bybiclusters. There are a number of possible explanations forthis diminished ability to predict genes that also elude biclus-tering. Averaging expression levels over genes that are co-reg-ulated within biclusters can be thought of as signal averaging,and thus single genes are more prone to both systematic andrandom error than bicluster expression levels. Another possi-ble explanation is that these elusive genes are under the influ-
The inferred regulatory network of Halobacterium NRC-1, visualized using Cytoscape and GaggleFigure 1 (see previous page)The inferred regulatory network of Halobacterium NRC-1, visualized using Cytoscape and Gaggle. (a) The full inferred regulatory network. Regulators are indicated as circles, with black undirected edges to biclusters (rectangles) that they are members of. Green and red arrows represent repression (β < 0) and activation (β > 0) edges, respectively. The thickness of regulation edges is proportional to the strength of the edge as determined by the Inferelator (β for that edge). Interactions are shown as triangles connected to regulators by blue edges. Weak influences (|β| < 0.1) are not shown. (b) Example regulation of Bicluster 76. The four transcription factors (TFs) sirR, kaiC, VNG1405C, and VNG2476C were selected by the Inferelator as the most likely regulators of the genes in bicluster 76 from the set of all (82) candidate regulators. The relative weights, β, by which the regulators are predicted to combine to determine the level of expression of the genes of bicluster 76, are indicated alongside each regulation edge. The TFs VNG2476C and kaiC combine in a logical AND relationship. phoU and prp1 are TFs belonging to bicluster 76.
Table 1
Functional summary of bicluster 76: transport process putatively regulated by sirR
Gene Name Function
VNG0451G phoU Transcriptional regulator
VNG0452G pstB2 Phosphate transport ATP-binding
VNG0453G pstA2 Phosphate ABC transporter permease
VNG0455G pstC2 Phosphate ABC transporter permease
VNG0457G phoX Phosphate ABC transporter periplasmic phosphate-binding
VNG0458G prp1 Phosphate regulatory protein homolog
VNG0535C VNG0535C Membrane protein of Unknown Function
VNG1632G cbiQ Cobalt transport protein
VNG1634G cbiN Cobalt transport protein cbiN
VNG1635G cbiM ABC-type cobalt transport system, permease component.
VNG2093G glnA Glutamine synthetase
VNG2302G yuxL Acylaminoacyl-peptidase
VNG2358G appA Oligopeptide binding protein
VNG2359G appB Oligopeptide ABC permease
VNG2361G appC Oligopeptide transport permease protein
VNG2365G appF Oligopeptide ABC transporter ATP-binding
VNG2482G pstB1 Phosphate ABC transporter ATP-binding
VNG2483G pstA1 Phosphate ABC transporter permease
VNG2484G pstC1 Phosphate transporter permease
VNG2486G yqgG Phosphate ABC transporter binding
VNG2529G dppB2 Dipeptide ABC transporter permease
VNG2531G dppC1 Dipeptide ABC transporter permease
VNG2532H VNG2532H Membrane protein of Unknown Function
VNG6262G zurM ABC transporter, permease protein
VNG6264G zurA ABC transporter, ATP-binding protein
VNG6265G ycdH Adhesion protein
VNG6277G ugpB Glycerol-3-phosphate-binding protein precursor
VNG6279G ugpA Sn-glycerol-3-phosphate transport system permease
VNG6280G ugpE Sn-glycerol-3-phosphate transport system permease
VNG6281G ugpC Sn-glycerol-3-phosphate transport system ATP-binding
Genome Biology 2006, 7:R36
R36.6 Genome Biology 2006, Volume 7, Issue 5, Article R36 Bonneau et al. http://genomebiology.com/2006/7/5/R36
ence of TFs that interact with unobserved factors, such asmetabolites. There are also about five conditions that we failto predict well relative to the other 264 conditions (large RMSvalues in training and new data; Figures 2 and 3). Not surpris-ingly, these five conditions are all situated directly after largeperturbations in time series, when the system is fluctuatingdramatically as it re-establishes stasis.
We also performed several tests to determine how well ourmodel formulation and fitting procedure performed com-pared with three simplified formulations, as described indetail in Additional data file 1. Briefly, these additional testsshow that our current formulation for temporal modeling isessential to the performance of this procedure (mean RMSD
with no temporal modeling 0.40; significance of comparisonwith full model P < 10-10, by paired t test) and produces signif-icantly more parsimonious models. They also show that mod-els constrained to a single predictor per bicluster performsignificantly worse over the new data (mean RMSD with onlya single predictor per bicluster 0.43; P < 10-16). Finally, theadditional tests show that our inclusion of interactions in thecurrent model formulation improves predictive power (meanRMSD with no interactions 0.41, P < 0.03).
Homeostatic control of key biologic processes by the previously uncharacterized trh familyThe trh family of regulators in Halobacterium (including trh1to trh7) are members of the LrpA/AsnC family, regulators
Predictive power of inferred network on biclustersFigure 2Predictive power of inferred network on biclusters. (a) The root mean square deviation (RMSD) error of predicted response in comparison with the true response for the 300 predicted biclusters evaluated over the 268 conditions of the training set. (b) The RMSD error of the same 300 biclusters evaluated on new data (24 conditions) collected after model fitting/network construction.
Predictive power on genes with unique expression profilesFigure 3Predictive power on genes with unique expression profiles. Histograms of root mean square deviation (RMSD) of predicted response versus measured response, as calculated in Figure 2. (a) The RMSD error of predicted to true response for the 159 genes that cMonkey identified as having unique expression patterns and were therefore not included in any bicluster. (b) The same error over new data collected after model fitting/network construction for these 159 isolates.
RMS deviation of predicted response
Fre
quen
cy
0.2 0.3 0.4 0.5 0.6 0.7 0.8
010
2030
4050
60
RMS deviation of predicted response
Fre
quen
cy
0.2 0.3 0.4 0.5 0.6 0.7 0.8
010
2030
4050
mean = 0.369 0.088mean = 0.372 0.056 +- +-
(a) (b)
RMS
Freq
uenc
y
0.4 0.6 0.8 1.0 1.2 1.4
05
1015
2025
30
RMS
Freq
uenc
y
0.4 0.6 0.8 1.0 1.2 1.4
05
1015
mean = 0.667 0.205mean = 0.752 0.128 +- +-
(b)(a)
Genome Biology 2006, 7:R36
http://genomebiology.com/2006/7/5/R36 Genome Biology 2006, Volume 7, Issue 5, Article R36 Bonneau et al. R36.7
com
ment
reviews
reports
refereed researchdepo
sited researchinteractio
nsinfo
rmatio
n
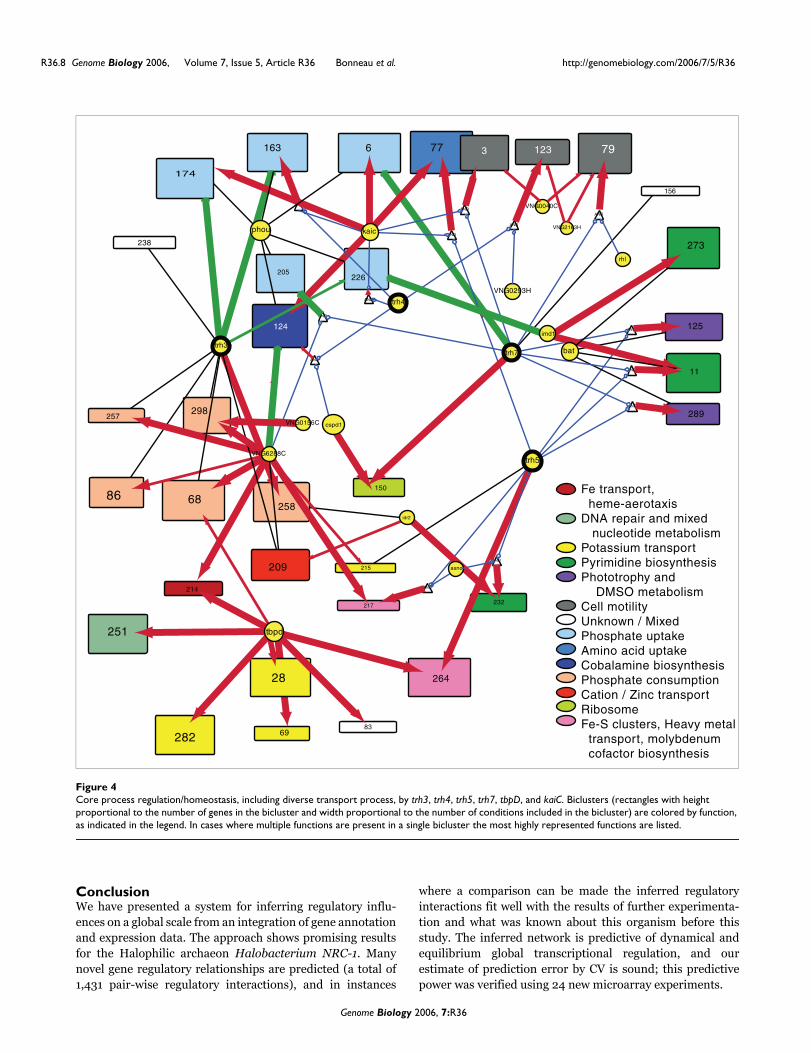
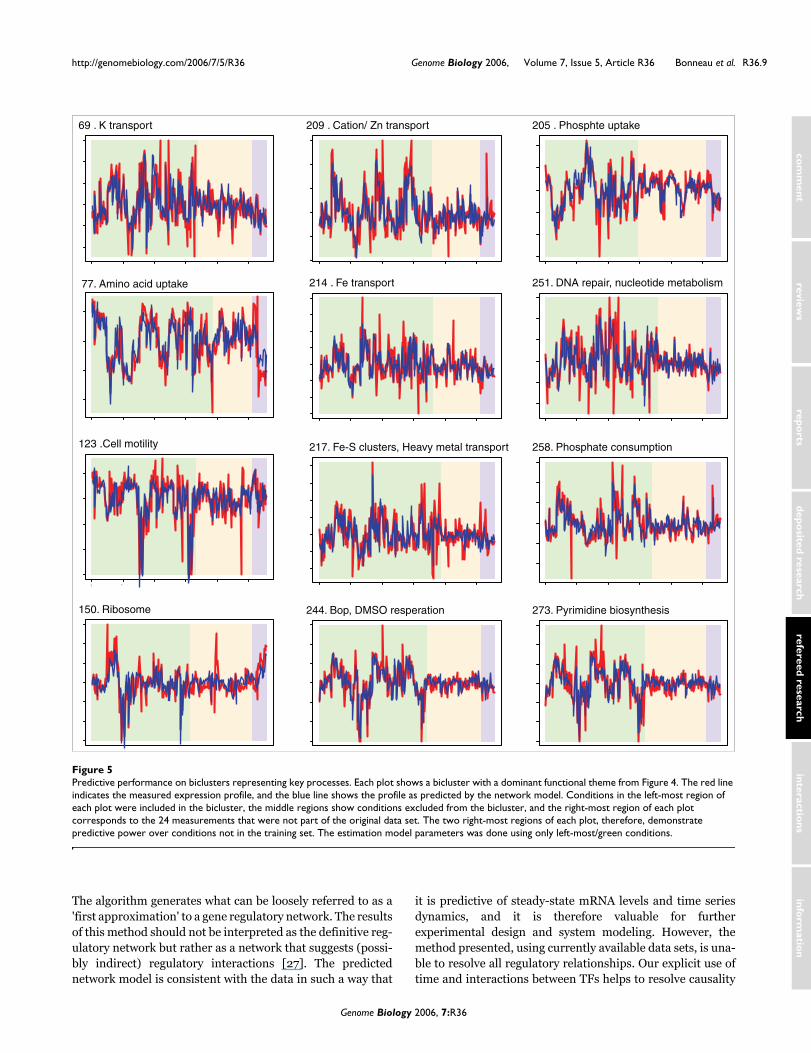
that are widely distributed across bacterial and archaeal spe-cies [35]. Their specific role in the regulation of Halobacte-rium NRC-1 genes was, before this study, unknown. Wepredict that four of the trh proteins play a significant role incoordinating the expression of diverse cellular processes withcompeting transport processes. Figure 4 shows a Cytoscapelayout of the subnetwork surrounding trh3, trh4, trh5, andtrh7. There is significant similarity in the functions repre-sented by the biclusters regulated by each of the trh proteins,giving some indication that the learned influences have bio-logic significance. Moreover, each trh protein regulates aunique set of biclusters. Using the predicted subnetwork wecan form highly directed hypotheses as to the regulationmediating the homeostatic balance of diverse functions in thecell. Our prediction for trh3, for example, is that it is a repres-sor of phosphate and amino acid uptake systems and that it isco-regulated with (and thus a possible activator of) diversemetabolic processes involving phosphate consumption. Trh3thus appears to be key to Halobacterium NRC-1 phosphatehomeostasis (a limiting factor in the Halobacterium naturalenvironment). Similar statements/hypotheses can beextracted from the learned network for other regulators ofpreviously unknown function; in this way, the network repre-sents a first step toward completing the annotation of the reg-ulatory component of the proteome. Figure 5 shows thepredicted expression profile for 12 of the biclusters shown inFigure 4.
Experimental verification of regulatory influencesWe now briefly describe three cases in which predicted regu-latory influences were supported by further experimentation.
VNG1179C activates a Cu-transporting P1-type ATPaseWe predict that bicluster 254, containing a putative Cu-trans-porting P1-type ATPase, is regulated by a group of correlatedTFs containing VNG1179C and VNG6193H - two regulatorswith putative metal-binding domains [28]. These regulatorsmade attractive targets for further investigation. TheInferelator predicts that VNG1179C and/or VNG6193H aretranscriptional activators of yvgX (a member of bicluster254). VNG1179C is a Lrp/AsnC family regulator that also con-tains a metal-binding TRASH domain [35,36]. Strains within-frame single gene deletions of both VNG1179C and yvgX(one of the proposed targets and known copper transporter)resulted in similar diminished growth in presence of Cu. Fur-thermore, recent microarray analysis confirmed that, unlikein the wild-type, yvgX transcript levels are not upregulated byCu in the VNG1179C deleted strain. This lack of activation ofyvgX in the VNG1179C deletion strain resulted in poorgrowth in presence of Cu for strains with a deletion in each ofthe two genes (Kaur A, Pan M, Meislin M, El-Geweley R,Baliga NS, personal communication).
SirR regulates key transport processesSirR was previously described as a regulator involved inresistance to iron starvation in Staphylococcus epidermidis
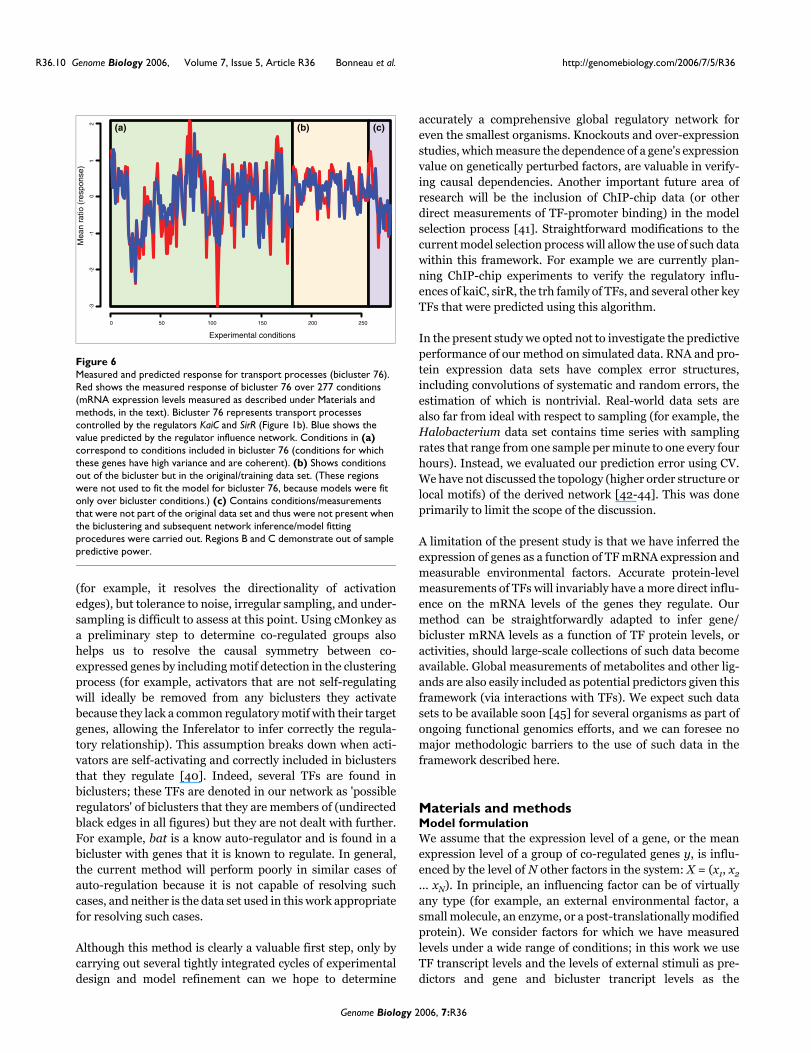
and Staphylococcus aureus. SirR is possibly a Mn and Fedependent transcriptional regulator in several microbial sys-tems and a homolog to dtxR [37]. There is a strong homologof S. epidermidis sirR in the Halobacterium genome but therole of this protein in the Halobacterium regulatory circuithas not been determined. We predicted that sirR and kaiC arecentral regulators, involved in regulation of biclusters associ-ated with Mn/Fe transport, such as bicluster 76 (Figure 1b).Included in this bicluster are three genes, namely zurA, zurMand ycdH, that together encode a putative Mn/Fe-specificABC transporter, consistent with the recent observation thatsirR is needed for survival of metal-induced stress (Kaur A,Pan M, Meislin M, El-Geweley R, Baliga NS, personal com-munication). Figure 6 shows the predicted and measuredexpression levels for bicluster 76 as a function of inferred reg-ulators (sirR, kaiC) for all conditions, including time series,equilibrium measurements, knockouts, and new data. Notethat regulatory influences for this bicluster were inferred onlyusing the 189 conditions (out of 268 total possible) thatcMonkey included in this bicluster; excluded conditions wereeither low-variance or did not exhibit coherent expression forthe genes in this bicluster. SirR mRNA profiles over all 268original experimental conditions are positively correlatedwith transcript level changes in these three genes. However,upon deleting SirR, mRNA levels of these three genesincreased in the presence of Mn, suggesting that SirR func-tions as a repressor in the presence of Mn, in apparent con-trast to our prediction. In fact, a dual role in regulation hasbeen observed for at least one protein in the family of regula-tors to which SirR belongs, which functions as an activatorand repressor under low and high Mn conditions, respectively[38]. Although further investigation is needed, The Inferela-tor successfully identified part of this regulatory relationshipand the correct pairing of regulator and target.
TfbF activates the protein component of the ribosomeHalobacterium NRC-1 has multiple copies of key compo-nents of its general transcription machinery (TfbA to TfbGand TbpA to TbpF). Ongoing studies are directed at determin-ing the degree to which these multiple copies of the generalTFs are responsible for differential regulation of cellular proc-esses (Facciotti MT, Bonneau R, Reiss D, Vuthoori M, Pan M,Kaur A, Schmidt A, Whitehead K, Shannon P, Dannahoe S,personal communication), [39]. We predict that TfbF is anactivator of ribosomal protein encoding genes. The ribosomalprotein encoding genes are distributed in seven biclusters; allseven are predicted to be controlled by TfbF. This predictionwas verified by measuring protein-DNA interactions for TfbFby ChIP-chip analysis as part of a systems wide study of Tfband Tbp binding patterns throughout the genome (FacciottiMT, Bonneau R, Reiss D, Vuthoori M, Pan M, Kaur A,Schmidt A, Whitehead K, Shannon P, Dannahoe S, personalcommunication).
Genome Biology 2006, 7:R36
R36.8 Genome Biology 2006, Volume 7, Issue 5, Article R36 Bonneau et al. http://genomebiology.com/2006/7/5/R36
ConclusionWe have presented a system for inferring regulatory influ-ences on a global scale from an integration of gene annotationand expression data. The approach shows promising resultsfor the Halophilic archaeon Halobacterium NRC-1. Manynovel gene regulatory relationships are predicted (a total of1,431 pair-wise regulatory interactions), and in instances
where a comparison can be made the inferred regulatoryinteractions fit well with the results of further experimenta-tion and what was known about this organism before thisstudy. The inferred network is predictive of dynamical andequilibrium global transcriptional regulation, and ourestimate of prediction error by CV is sound; this predictivepower was verified using 24 new microarray experiments.
Core process regulation/homeostasis, including diverse transport process, by trh3, trh4, trh5, trh7, tbpD, and kaiCFigure 4Core process regulation/homeostasis, including diverse transport process, by trh3, trh4, trh5, trh7, tbpD, and kaiC. Biclusters (rectangles with height proportional to the number of genes in the bicluster and width proportional to the number of conditions included in the bicluster) are colored by function, as indicated in the legend. In cases where multiple functions are present in a single bicluster the most highly represented functions are listed.
VNG0040C
AND
AND
217
AND
AND
VNG2163HAND
AND
69
AND
AND
AND
VNG0293H
125
257
214
289
251
282
86
205
150
264
232
77 3
238
6
11
215
273
174
163
124
209
79
68258
AND
83
123
298
226
AND
AND
28
AND
trh3
trh5
trh7
trh4
tbpd
cspd1
phou kaic
rhl
imd1
bat
idr2
asnc
Fe transport, heme-aerotaxisDNA repair and mixed nucleotide metabolism Potassium transportPyrimidine biosynthesisPhototrophy and DMSO metabolismCell motilityUnknown / MixedPhosphate uptakeAmino acid uptakeCobalamine biosynthesis Phosphate consumptionCation / Zinc transportRibosomeFe-S clusters, Heavy metal transport, molybdenum cofactor biosynthesis
VNG6 88C2
156
VNG0156C
Genome Biology 2006, 7:R36
http://genomebiology.com/2006/7/5/R36 Genome Biology 2006, Volume 7, Issue 5, Article R36 Bonneau et al. R36.9
com
ment
reviews
reports
refereed researchdepo
sited researchinteractio
nsinfo
rmatio
n
The algorithm generates what can be loosely referred to as a'first approximation' to a gene regulatory network. The resultsof this method should not be interpreted as the definitive reg-ulatory network but rather as a network that suggests (possi-bly indirect) regulatory interactions [27]. The predictednetwork model is consistent with the data in such a way that
it is predictive of steady-state mRNA levels and time seriesdynamics, and it is therefore valuable for furtherexperimental design and system modeling. However, themethod presented, using currently available data sets, is una-ble to resolve all regulatory relationships. Our explicit use oftime and interactions between TFs helps to resolve causality
Predictive performance on biclusters representing key processesFigure 5Predictive performance on biclusters representing key processes. Each plot shows a bicluster with a dominant functional theme from Figure 4. The red line indicates the measured expression profile, and the blue line shows the profile as predicted by the network model. Conditions in the left-most region of each plot were included in the bicluster, the middle regions show conditions excluded from the bicluster, and the right-most region of each plot corresponds to the 24 measurements that were not part of the original data set. The two right-most regions of each plot, therefore, demonstrate predictive power over conditions not in the training set. The estimation model parameters was done using only left-most/green conditions.
77. Amino acid uptake
! "
123 .Cell motility
150. Ribosome
205 . Phosphte uptake209 . Cation/ Zn transport
214 . Fe transport
217. Fe-S clusters, Heavy metal transport
244. Bop, DMSO resperation
251. DNA repair, nucleotide metabolism
258. Phosphate consumption
273. Pyrimidine biosynthesis
69 . K transport
Genome Biology 2006, 7:R36
R36.10 Genome Biology 2006, Volume 7, Issue 5, Article R36 Bonneau et al. http://genomebiology.com/2006/7/5/R36
(for example, it resolves the directionality of activationedges), but tolerance to noise, irregular sampling, and under-sampling is difficult to assess at this point. Using cMonkey asa preliminary step to determine co-regulated groups alsohelps us to resolve the causal symmetry between co-expressed genes by including motif detection in the clusteringprocess (for example, activators that are not self-regulatingwill ideally be removed from any biclusters they activatebecause they lack a common regulatory motif with their targetgenes, allowing the Inferelator to infer correctly the regula-tory relationship). This assumption breaks down when acti-vators are self-activating and correctly included in biclustersthat they regulate [40]. Indeed, several TFs are found inbiclusters; these TFs are denoted in our network as 'possibleregulators' of biclusters that they are members of (undirectedblack edges in all figures) but they are not dealt with further.For example, bat is a know auto-regulator and is found in abicluster with genes that it is known to regulate. In general,the current method will perform poorly in similar cases ofauto-regulation because it is not capable of resolving suchcases, and neither is the data set used in this work appropriatefor resolving such cases.
Although this method is clearly a valuable first step, only bycarrying out several tightly integrated cycles of experimentaldesign and model refinement can we hope to determine
accurately a comprehensive global regulatory network foreven the smallest organisms. Knockouts and over-expressionstudies, which measure the dependence of a gene's expressionvalue on genetically perturbed factors, are valuable in verify-ing causal dependencies. Another important future area ofresearch will be the inclusion of ChIP-chip data (or otherdirect measurements of TF-promoter binding) in the modelselection process [41]. Straightforward modifications to thecurrent model selection process will allow the use of such datawithin this framework. For example we are currently plan-ning ChIP-chip experiments to verify the regulatory influ-ences of kaiC, sirR, the trh family of TFs, and several other keyTFs that were predicted using this algorithm.
In the present study we opted not to investigate the predictiveperformance of our method on simulated data. RNA and pro-tein expression data sets have complex error structures,including convolutions of systematic and random errors, theestimation of which is nontrivial. Real-world data sets arealso far from ideal with respect to sampling (for example, theHalobacterium data set contains time series with samplingrates that range from one sample per minute to one every fourhours). Instead, we evaluated our prediction error using CV.We have not discussed the topology (higher order structure orlocal motifs) of the derived network [42-44]. This was doneprimarily to limit the scope of the discussion.
A limitation of the present study is that we have inferred theexpression of genes as a function of TF mRNA expression andmeasurable environmental factors. Accurate protein-levelmeasurements of TFs will invariably have a more direct influ-ence on the mRNA levels of the genes they regulate. Ourmethod can be straightforwardly adapted to infer gene/bicluster mRNA levels as a function of TF protein levels, oractivities, should large-scale collections of such data becomeavailable. Global measurements of metabolites and other lig-ands are also easily included as potential predictors given thisframework (via interactions with TFs). We expect such datasets to be available soon [45] for several organisms as part ofongoing functional genomics efforts, and we can foresee nomajor methodologic barriers to the use of such data in theframework described here.
Materials and methodsModel formulationWe assume that the expression level of a gene, or the meanexpression level of a group of co-regulated genes y, is influ-enced by the level of N other factors in the system: X = (x1, x2
... xN). In principle, an influencing factor can be of virtuallyany type (for example, an external environmental factor, asmall molecule, an enzyme, or a post-translationally modifiedprotein). We consider factors for which we have measuredlevels under a wide range of conditions; in this work we useTF transcript levels and the levels of external stimuli as pre-dictors and gene and bicluster trancript levels as the
Measured and predicted response for transport processes (bicluster 76)Figure 6Measured and predicted response for transport processes (bicluster 76). Red shows the measured response of bicluster 76 over 277 conditions (mRNA expression levels measured as described under Materials and methods, in the text). Bicluster 76 represents transport processes controlled by the regulators KaiC and SirR (Figure 1b). Blue shows the value predicted by the regulator influence network. Conditions in (a) correspond to conditions included in bicluster 76 (conditions for which these genes have high variance and are coherent). (b) Shows conditions out of the bicluster but in the original/training data set. (These regions were not used to fit the model for bicluster 76, because models were fit only over bicluster conditions.) (c) Contains conditions/measurements that were not part of the original data set and thus were not present when the biclustering and subsequent network inference/model fitting procedures were carried out. Regions B and C demonstrate out of sample predictive power.
0 50 100 150 200 250
-3-2
-1
Experimental conditions
Mea
n ra
tio (
resp
onse
)
(a) (b) (c)
01
2
Genome Biology 2006, 7:R36
http://genomebiology.com/2006/7/5/R36 Genome Biology 2006, Volume 7, Issue 5, Article R36 Bonneau et al. R36.11
com
ment
reviews
reports
refereed researchdepo
sited researchinteractio
nsinfo
rmatio
n
response. Methods for selecting which of these factors are themost likely regulators, among all possible regulatory influ-ence factors, are described below.
The relation between y and X is given by the kinetic equation:
Here, Z = (z1[X], z2[X] ... zP[X]) is a set of functions of the reg-ulatory factors X. The coefficients βj, for {j = 1,2,...,P},describe the influence of each element of Z, with positive coef-ficients corresponding to inducers of transcription and nega-tive coefficients to transcriptional repressors. The choicezj(X) = xj for (j = 1, 2 ... P = N} amounts to the simple weightedlinear combination of influencing factors β•Z = Σβjxj [46]. Toaccommodate combinatorial logic for transcriptional control,we shall use a more general form for the function Z (described
below). The constant τ is the time constant of the level y in theabsence of external determinants.
Various functional forms can be adopted for the function g,called the 'nonlinearity' or 'activation' function for artificialneural networks, and the 'link' function in statistical mode-ling. The function g often takes the form of a sigmoidal, orlogistic, activation function:
This form has been used successfully in models of develop-mental biology [47]. In this work we employ a truncated lin-ear form for g:
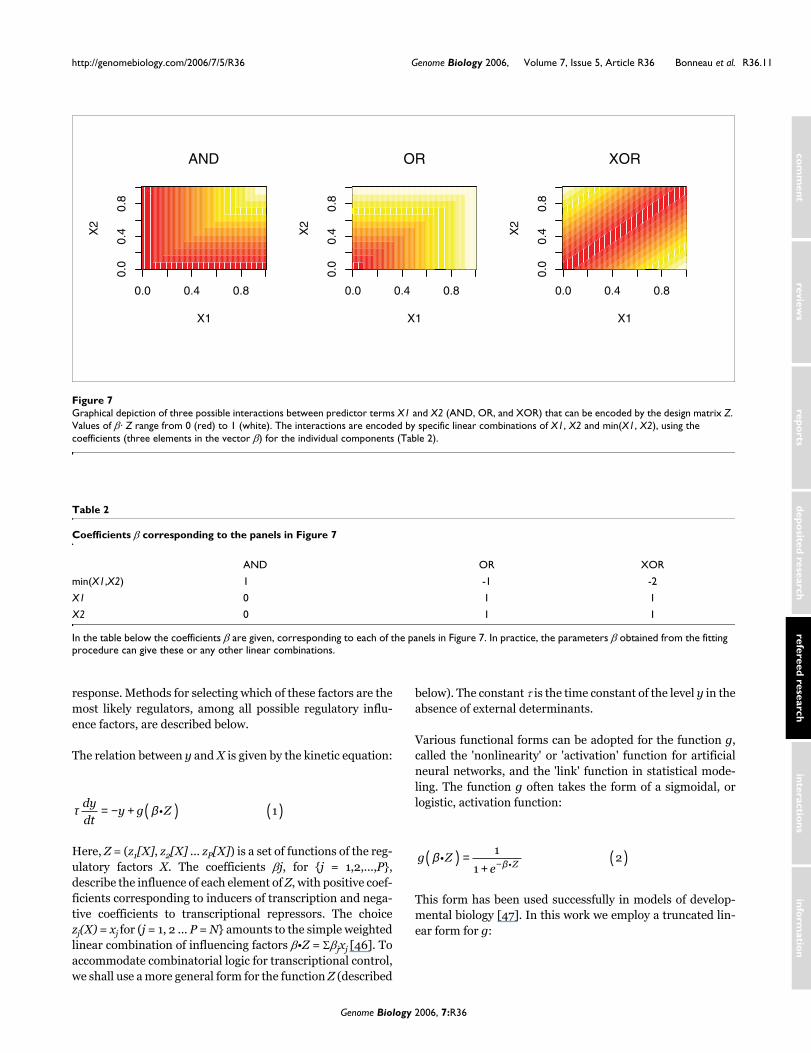
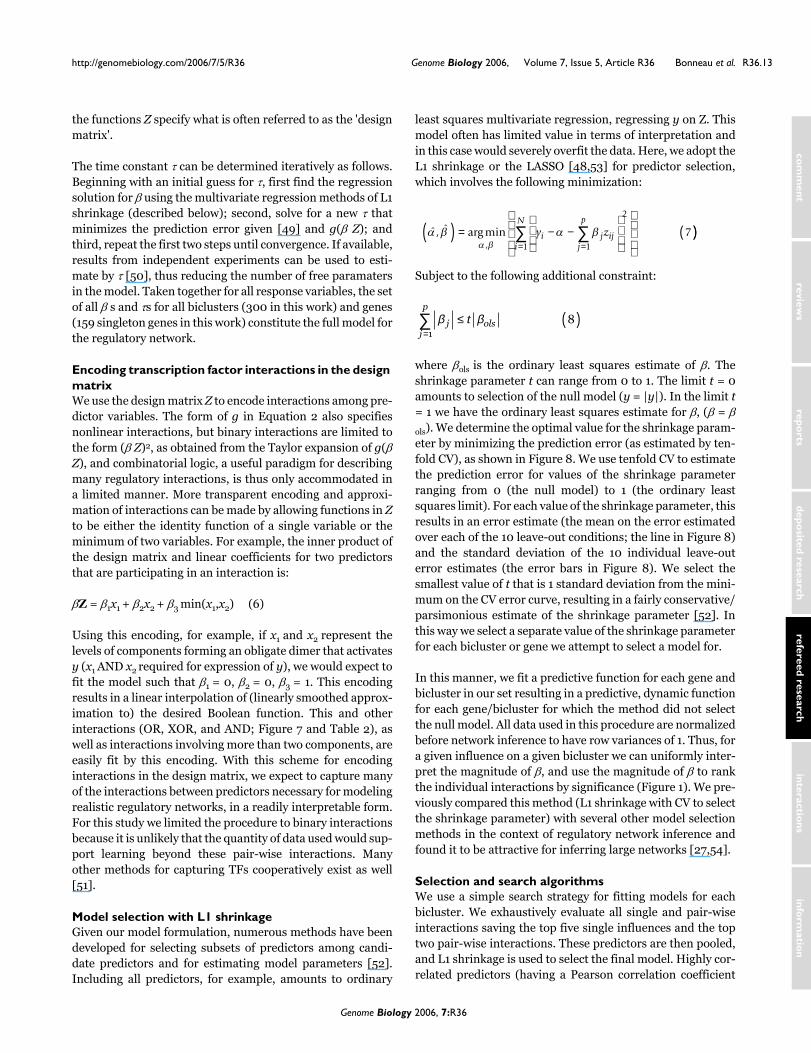
Graphical depiction of three possible interactions between predictor terms X1 and X2 (AND, OR, and XOR) that can be encoded by the design matrix ZFigure 7Graphical depiction of three possible interactions between predictor terms X1 and X2 (AND, OR, and XOR) that can be encoded by the design matrix Z. Values of β· Z range from 0 (red) to 1 (white). The interactions are encoded by specific linear combinations of X1, X2 and min(X1, X2), using the coefficients (three elements in the vector β) for the individual components (Table 2).
Table 2
Coefficients β corresponding to the panels in Figure 7
AND OR XOR
min(X1,X2) 1 -1 -2
X1 0 1 1
X2 0 1 1
In the table below the coefficients β are given, corresponding to each of the panels in Figure 7. In practice, the parameters β obtained from the fitting procedure can give these or any other linear combinations.
0.0 0.4 0.8
0.0
0.4
0.8
AND
X1
X2
0.0 0.4 0.8
0.0
0.4
0.8
OR
X1X
20.0 0.4 0.8
0.0
0.4
0.8
XOR
X1
X2
τ βdy
dty g Z= − + ( ) ( )i 1
g Ze Z
β βi i( ) =+
( )−1
12
Genome Biology 2006, 7:R36
R36.12 Genome Biology 2006, Volume 7, Issue 5, Article R36 Bonneau et al. http://genomebiology.com/2006/7/5/R36
Both Equations 2 and 3 allow for computationally efficientdetermination of β and are compatible with L1 shrinkage(described below). In this study we use Equation 3 because itallows for simultaneous determination of β at several valuesof the shrinkage parameter (LARS) [48]. Previous studiessuggest that the distinction between these two forms is incon-sequential given the expected error in the data [12,13].
The simplified kinetic description of Equation 1 encompassesessential elements to describe gene transcription, such ascontrol by specific transcriptional activators (or repressors),activation kinetics, and transcript decay, while at the sametime facilitating access to computationally efficient methodsfor searching among a combinatorially large number of possi-ble regulators. To better understand specific details of regula-tion, it will almost certainly be required to follow up onspecific regulatory hypotheses using more mechanisticallydetailed descriptions.
Fitting of model parametersThe experimental conditions (individual global gene expres-sion measurements within the data set used in this study) areclassified either as belonging to a steady-state experiment ora time series experiment. In some cases, we refer to condi-tions as 'equilibrium' or 'steady-state' measurements out ofconvenience, but cannot know whether the system, in anystrict sense, is at equilibrium; we imply only that an attemptwas made to allow the system to reach equilibrium and thatwe have no knowledge of prior time-points within the samestudy. By a suitable reformulation of the kinetic equation(Equation 1) for each of these two data classes, we can com-bine both types of measurements into a single expression tofit the model parameters β and τ.
In a steady-state, dy/dt = 0 and Equation 1 reduces to thefollowing:
y = g(β•ZSS) (4)
where Zss is the measured value of Z in the steady state. Fortime series measurements, taken at times (t1,t2 ... tT), Equa-tion 1 may be approximated as follows:
where ∆tm= tm+1 - tm is the time interval between consecutivemeasurements, and ym and zmj are, respectively, the measuredvalue of y and zj at time tm. In this formulation, we place no
requirements on the regularity of ∆tm, and can readily usedata with differing time intervals between measurements. Itis important to note, however, that if sampling is performedat intervals that are longer than the time scales at which spe-cific regulatory interactions act, those regulatory interactionswill be missed in the data sampling and, correspondingly, bythe model inference method. In most cases, we have littleprior information on the regulation time scale, and hence useEquation 5 for all conditions that were sampled during a partof a time course. A possible limitation is that the inferenceprocedure may misinterpret or miss entirely a regulatoryinteraction that actually occurs at a faster time scale. Underthe stimuli we have considered, steady state is reached by sixhours post-stimulation, and samples collected in that timerange are therefore analyzed using Equation 4. In short, thismethod does not lessen the need for correct experimentaldesign, but it facilitates using data with reasonable variationin sampling structure as well as the combination of data fromdifferent experiments.
In comparing Equations 4 and 5, it can be seen that the righthand sides are identical, allowing for simultaneous model fit-ting using equilibrium and time series data. Taking togetherall steady-state measurements and time course measure-ments, the left hand sides of Equations 4 and 5 can be com-bined into a single response vector, allowing β to be fit withone of the many available methodologies for multivariateregression. In regression terminology, the influencing fac-tors, X, are referred to as regressors or predictors, whereas
g Z
Z Z
y Z
y Z
β
β β
β
β( ) =
( ) < < ( )( ) > ( )( )
: max
max : max
min :
if min y y
if y
if << ( )
( )min y
3
τ βy y
ty g z for m Tm m
mm j mj
j
P+
=
−+ = = − ( )∑1
1
1 2 1 5∆
( ) , , ,…
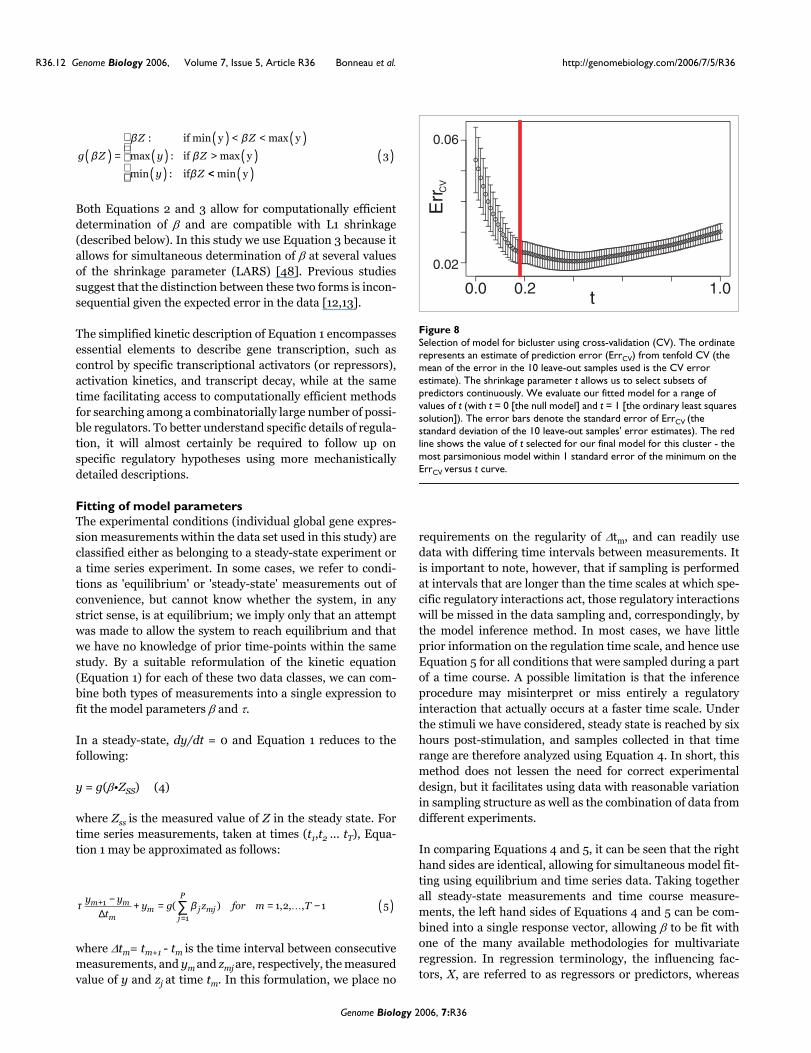
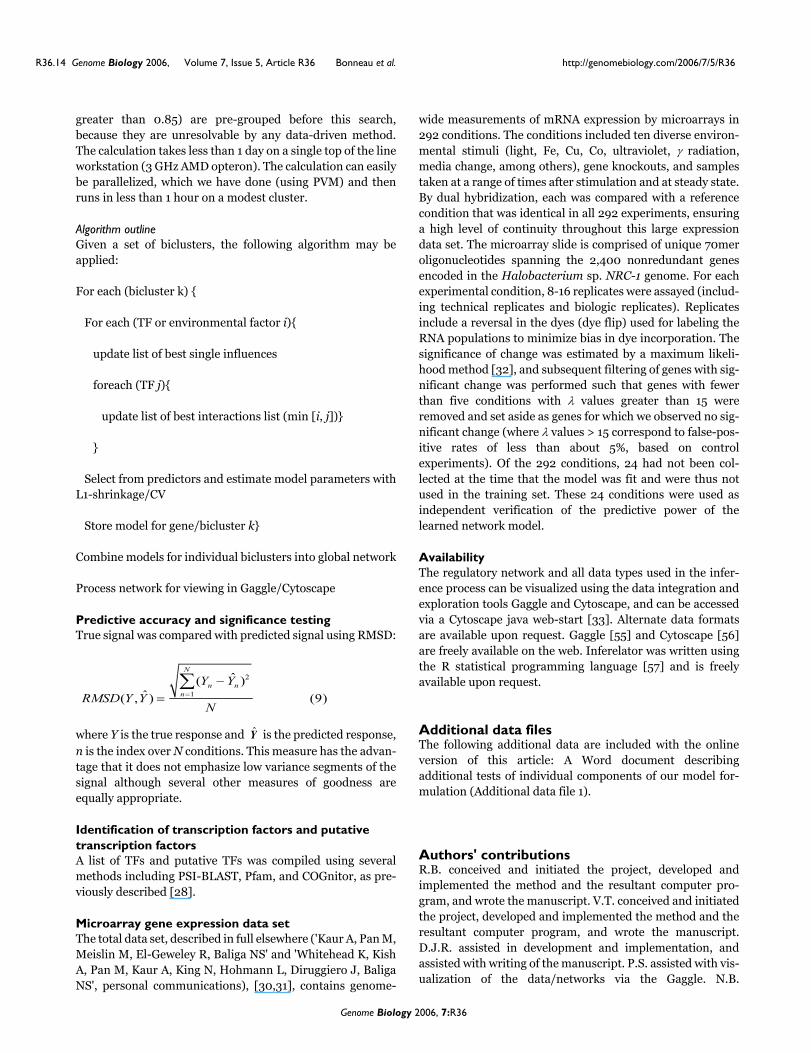
Selection of model for bicluster using cross-validation (CV)Figure 8Selection of model for bicluster using cross-validation (CV). The ordinate represents an estimate of prediction error (ErrCV) from tenfold CV (the mean of the error in the 10 leave-out samples used is the CV error estimate). The shrinkage parameter t allows us to select subsets of predictors continuously. We evaluate our fitted model for a range of values of t (with t = 0 [the null model] and t = 1 [the ordinary least squares solution]). The error bars denote the standard error of ErrCV (the standard deviation of the 10 leave-out samples' error estimates). The red line shows the value of t selected for our final model for this cluster - the most parsimonious model within 1 standard error of the minimum on the ErrCV versus t curve.
0.02
0.06
0.0 1.00.2 t
Err C
V
Genome Biology 2006, 7:R36
http://genomebiology.com/2006/7/5/R36 Genome Biology 2006, Volume 7, Issue 5, Article R36 Bonneau et al. R36.13
com
ment
reviews
reports
refereed researchdepo
sited researchinteractio
nsinfo
rmatio
n
the functions Z specify what is often referred to as the 'designmatrix'.
The time constant τ can be determined iteratively as follows.Beginning with an initial guess for τ, first find the regressionsolution for β using the multivariate regression methods of L1shrinkage (described below); second, solve for a new τ thatminimizes the prediction error given [49] and g(β Z); andthird, repeat the first two steps until convergence. If available,results from independent experiments can be used to esti-mate by τ [50], thus reducing the number of free paramatersin the model. Taken together for all response variables, the setof all β s and τs for all biclusters (300 in this work) and genes(159 singleton genes in this work) constitute the full model forthe regulatory network.
Encoding transcription factor interactions in the design matrixWe use the design matrix Z to encode interactions among pre-dictor variables. The form of g in Equation 2 also specifiesnonlinear interactions, but binary interactions are limited tothe form (β Z)2, as obtained from the Taylor expansion of g(βZ), and combinatorial logic, a useful paradigm for describingmany regulatory interactions, is thus only accommodated ina limited manner. More transparent encoding and approxi-mation of interactions can be made by allowing functions in Zto be either the identity function of a single variable or theminimum of two variables. For example, the inner product ofthe design matrix and linear coefficients for two predictorsthat are participating in an interaction is:
βZ = β1x1 + β2x2 + β3 min(x1,x2) (6)
Using this encoding, for example, if x1 and x2 represent thelevels of components forming an obligate dimer that activatesy (x1 AND x2 required for expression of y), we would expect tofit the model such that β1 = 0, β2 = 0, β3 = 1. This encodingresults in a linear interpolation of (linearly smoothed approx-imation to) the desired Boolean function. This and otherinteractions (OR, XOR, and AND; Figure 7 and Table 2), aswell as interactions involving more than two components, areeasily fit by this encoding. With this scheme for encodinginteractions in the design matrix, we expect to capture manyof the interactions between predictors necessary for modelingrealistic regulatory networks, in a readily interpretable form.For this study we limited the procedure to binary interactionsbecause it is unlikely that the quantity of data used would sup-port learning beyond these pair-wise interactions. Manyother methods for capturing TFs cooperatively exist as well[51].
Model selection with L1 shrinkageGiven our model formulation, numerous methods have beendeveloped for selecting subsets of predictors among candi-date predictors and for estimating model parameters [52].Including all predictors, for example, amounts to ordinary
least squares multivariate regression, regressing y on Z. Thismodel often has limited value in terms of interpretation andin this case would severely overfit the data. Here, we adopt theL1 shrinkage or the LASSO [48,53] for predictor selection,which involves the following minimization:
Subject to the following additional constraint:
where βols is the ordinary least squares estimate of β. Theshrinkage parameter t can range from 0 to 1. The limit t = 0amounts to selection of the null model (y = |y|). In the limit t= 1 we have the ordinary least squares estimate for β, (β = βols). We determine the optimal value for the shrinkage param-eter by minimizing the prediction error (as estimated by ten-fold CV), as shown in Figure 8. We use tenfold CV to estimatethe prediction error for values of the shrinkage parameterranging from 0 (the null model) to 1 (the ordinary leastsquares limit). For each value of the shrinkage parameter, thisresults in an error estimate (the mean on the error estimatedover each of the 10 leave-out conditions; the line in Figure 8)and the standard deviation of the 10 individual leave-outerror estimates (the error bars in Figure 8). We select thesmallest value of t that is 1 standard deviation from the mini-mum on the CV error curve, resulting in a fairly conservative/parsimonious estimate of the shrinkage parameter [52]. Inthis way we select a separate value of the shrinkage parameterfor each bicluster or gene we attempt to select a model for.
In this manner, we fit a predictive function for each gene andbicluster in our set resulting in a predictive, dynamic functionfor each gene/bicluster for which the method did not selectthe null model. All data used in this procedure are normalizedbefore network inference to have row variances of 1. Thus, fora given influence on a given bicluster we can uniformly inter-pret the magnitude of β, and use the magnitude of β to rankthe individual interactions by significance (Figure 1). We pre-viously compared this method (L1 shrinkage with CV to selectthe shrinkage parameter) with several other model selectionmethods in the context of regulatory network inference andfound it to be attractive for inferring large networks [27,54].
Selection and search algorithmsWe use a simple search strategy for fitting models for eachbicluster. We exhaustively evaluate all single and pair-wiseinteractions saving the top five single influences and the toptwo pair-wise interactions. These predictors are then pooled,and L1 shrinkage is used to select the final model. Highly cor-related predictors (having a Pearson correlation coefficient
ˆ , ˆ arg min,
α β α βα β
( ) = − −
(
==∑∑ y zi j ijj
p
i
N
11
2
7 ))
β βj olsj
p
t≤ ( )=∑
1
8
Genome Biology 2006, 7:R36
R36.14 Genome Biology 2006, Volume 7, Issue 5, Article R36 Bonneau et al. http://genomebiology.com/2006/7/5/R36
greater than 0.85) are pre-grouped before this search,because they are unresolvable by any data-driven method.The calculation takes less than 1 day on a single top of the lineworkstation (3 GHz AMD opteron). The calculation can easilybe parallelized, which we have done (using PVM) and thenruns in less than 1 hour on a modest cluster.
Algorithm outlineGiven a set of biclusters, the following algorithm may beapplied:
For each (bicluster k) {
For each (TF or environmental factor i){
update list of best single influences
foreach (TF j){
update list of best interactions list (min [i, j])}
}
Select from predictors and estimate model parameters withL1-shrinkage/CV
Store model for gene/bicluster k}
Combine models for individual biclusters into global network
Process network for viewing in Gaggle/Cytoscape
Predictive accuracy and significance testingTrue signal was compared with predicted signal using RMSD:
where Y is the true response and is the predicted response,n is the index over N conditions. This measure has the advan-tage that it does not emphasize low variance segments of thesignal although several other measures of goodness areequally appropriate.
Identification of transcription factors and putative transcription factorsA list of TFs and putative TFs was compiled using severalmethods including PSI-BLAST, Pfam, and COGnitor, as pre-viously described [28].
Microarray gene expression data setThe total data set, described in full elsewhere ('Kaur A, Pan M,Meislin M, El-Geweley R, Baliga NS' and 'Whitehead K, KishA, Pan M, Kaur A, King N, Hohmann L, Diruggiero J, BaligaNS', personal communications), [30,31], contains genome-
wide measurements of mRNA expression by microarrays in292 conditions. The conditions included ten diverse environ-mental stimuli (light, Fe, Cu, Co, ultraviolet, γ radiation,media change, among others), gene knockouts, and samplestaken at a range of times after stimulation and at steady state.By dual hybridization, each was compared with a referencecondition that was identical in all 292 experiments, ensuringa high level of continuity throughout this large expressiondata set. The microarray slide is comprised of unique 70meroligonucleotides spanning the 2,400 nonredundant genesencoded in the Halobacterium sp. NRC-1 genome. For eachexperimental condition, 8-16 replicates were assayed (includ-ing technical replicates and biologic replicates). Replicatesinclude a reversal in the dyes (dye flip) used for labeling theRNA populations to minimize bias in dye incorporation. Thesignificance of change was estimated by a maximum likeli-hood method [32], and subsequent filtering of genes with sig-nificant change was performed such that genes with fewerthan five conditions with λ values greater than 15 wereremoved and set aside as genes for which we observed no sig-nificant change (where λ values > 15 correspond to false-pos-itive rates of less than about 5%, based on controlexperiments). Of the 292 conditions, 24 had not been col-lected at the time that the model was fit and were thus notused in the training set. These 24 conditions were used asindependent verification of the predictive power of thelearned network model.
AvailabilityThe regulatory network and all data types used in the infer-ence process can be visualized using the data integration andexploration tools Gaggle and Cytoscape, and can be accessedvia a Cytoscape java web-start [33]. Alternate data formatsare available upon request. Gaggle [55] and Cytoscape [56]are freely available on the web. Inferelator was written usingthe R statistical programming language [57] and is freelyavailable upon request.
Additional data filesThe following additional data are included with the onlineversion of this article: A Word document describingadditional tests of individual components of our model for-mulation (Additional data file 1).
Additional File 1Additional tests of individual components of our model formulationAdditional tests of individual components of our model formulation.Click here for file
Authors' contributionsR.B. conceived and initiated the project, developed andimplemented the method and the resultant computer pro-gram, and wrote the manuscript. V.T. conceived and initiatedthe project, developed and implemented the method and theresultant computer program, and wrote the manuscript.D.J.R. assisted in development and implementation, andassisted with writing of the manuscript. P.S. assisted with vis-ualization of the data/networks via the Gaggle. N.B.
RMSD(Y ,Y )
(YnYn)2
n 1
N
N(9)
Y
Genome Biology 2006, 7:R36
http://genomebiology.com/2006/7/5/R36 Genome Biology 2006, Volume 7, Issue 5, Article R36 Bonneau et al. R36.15
com
ment
reviews
reports
refereed researchdepo
sited researchinteractio
nsinfo
rmatio
n
conceived and initiated the project, provided feedback on thequality of results, and initiated verification of results with fur-ther experimentation. M.F. performed experimental verifica-tion. L.H. provided guidance at project inception and assistedin writing the manuscript.
AcknowledgementsWe thank Michael Johnson for his improvements to the LIMS/data stand-ards system used to keep track of environmental factors. We thank AmySchmid, Kenia Whitehead, and all members of Baliga lab for helpful discus-sions. We thank Erik Schweighofer, Andrew Peabody, and Kerry Deutschfor administration of the resources needed to carry out this work. Wethank Werner Stuetzle and Ingo Ruczinski for helpful discussions. V.T. wassupported by NIH Grant P20 GM64361. This work was supported by NSF(MCB-045825, EIA-0220153, EF-0313754), DoD (DAAD13-03-O-0057)and DoE (DE-FG02-04ER63807).
References1. Herrgard MJ, Covert MW, Palsson BO: Reconstruction of micro-
bial transcriptional regulatory networks. Curr Opin Biotechnol2004, 15:70-77.
2. De Jong H: Modeling and simulation of genetic regulatory sys-tems: a literature review. J Comput Biol 2002, 9:67-103.
3. Alm E, Arkin AP: Biological networks. Curr Opin Struct Biol 2003,13:193-202.
4. Hashimoto RF, Kim S, Shmulevich I, Zhang W, Bittner ML, DoughertyER: Growing genetic regulatory networks from seed genes.Bioinformatics 2004, 20:1241-1247.
5. Shmulevich I, Kauffman SA: Activities and sensitivities inBoolean network models. Phys Rev Lett 2004, 93:048701.
6. Friedman N: Probabilistic models for identifying regulationnetworks. Bioinformatics 2003:II57.
7. Bar-Joseph Z, Gerber GK, Lee TI, Rinaldi NJ, Yoo JY, Robert F, Gor-don DB, Fraenkel E, Jaakkola TS, Young RA, Gifford DK: Computa-tional discovery of gene modules and regulatory networks.Nat Biotechnol 2003, 21:1337-1342.
8. Segal E, Taskar B, Gasch A, Friedman N, Koller D: Rich probabilis-tic models for gene expression. Bioinformatics 2001, 17(Suppl1):S243-S252.
9. Stuart JM, Segal E, Koller D, Kim SK: A gene-coexpression net-work for global discovery of conserved genetic modules. Sci-ence 2003, 302:249-255.
10. Segal E, Shapira M, Regev A, Pe'er D, Botstein D, Koller D, FriedmanN: Module networks: identifying regulatory modules andtheir condition-specific regulators from gene expressiondata. Nat Genet 2003, 34:166-176.
11. Friedman N, Linial M, Nachman I, Pe'er D: Using Bayesian net-works to analyze expression data. J Comput Biol 2000, 7:601-620.
12. van Someren EP, Wessels LF, Reinders MJ: Linear modeling ofgenetic networks from experimental data. Proc Int Conf IntellSyst Mol Biol 2000, 8:355-366.
13. van Someren EP, Wessels LF, Backer E, Reinders MJ: Genetic net-work modeling. Pharmacogenomics 2002, 3:507-525.
14. Weaver DC, Workman CT, Stormo GD: Modeling regulatorynetworks with weight matrices. Pac Symp Biocomput1999:112-123.
15. D'Haeseleer P, Wen X, Fuhrman S, Somogyi R: Linear modeling ofmRNA expression levels during CNS development andinjury. Pac Symp Biocomput 1999:41-52.
16. Cheng Y, Church GM: Biclustering of expression data. Proc IntConf Intell Syst Mol Biol 2000, 8:93-103.
17. Kluger Y, Basri R, Chang JT, Gerstein M: Spectral biclustering ofmicroarray data: coclustering genes and conditions. GenomeRes 2003, 13:703-716.
18. Sheng Q, Moreau Y, De Moor B: Biclustering microarray data byGibbs sampling. Bioinformatics 2003, 19(Suppl 2):II196-II205.
19. Tanay A, Sharan R, Kupiec M, Shamir R: Revealing modularity andorganization in the yeast molecular network by integratedanalysis of highly heterogeneous genomewide data. Proc NatlAcad Sci USA 2004, 101:2981-2986.
20. Tanay A, Sharan R, Shamir R: Discovering statistically significant
biclusters in gene expression data. Bioinformatics 2002,18(Suppl 1):S136-S144.
21. Yang J, Wang W, Wang H, Yu P: [delta]-clusters: capturing sub-space correlation in a large data set. 3rd IEEE International Sym-posium on BioInformatics and BioEngineering 2002:517-528.
22. Yang J, Wang H, Wang W, Yu P: Enhanced biclustering onexpression data. Third IEEE Symposium on BioInformatics and BioEn-gineering: March 10-12 2003; Bethesda 2003:321-327.
23. Kanehisa M: The KEGG database. Novartis Found Symp 2002,247:91-101. discussion 101-103, 119-128, 244-152.
24. Bowers PM, Pellegrini M, Thompson MJ, Fierro J, Yeates TO, Eisen-berg D: Prolinks: a database of protein functional linkagesderived from coevolution. Genome Biol 2004, 5:R35.
25. Mellor JC, Yanai I, Clodfelter KH, Mintseris J, DeLisi C: Predictome:a database of putative functional links between proteins,.Nucleic Acids Res 2002, 30:306-309.
26. Price MN, Arkin AP, Alm EJ: OpWise: operons aid the identifica-tion of differentially expressed genes in bacterial microarrayexperiments. BMC Bioinformatics 2006, 7:19.
27. Thorsson V, Hörnquist M, Siegel AF, Hood L: Reverse engineeringgalactose regulation in yeast through model selection. StatAppl Genet Mol Biol 2005, 1:Article 28.
28. Bonneau R, Baliga NS, Deutsch EW, Shannon P, Hood L: Compre-hensive de novo structure prediction in a systems-biologycontext for the archaea Halobacterium sp. NRC-1. Genome Biol2004, 5:R52.
29. Ng WV, Kennedy SP, Mahairas GG, Berquist B, Pan M, Shukla HD,Lasky SR, Baliga NS, Thorsson V, Sbrogna J, et al.: Genomesequence of Halobacterium species NRC-1. Proc Natl Acad SciUSA 2000, 97:12176-12181.
30. Baliga NS, Pan M, Goo YA, Yi EC, Goodlett DR, Dimitrov K, ShannonP, Aebersold R, Ng WV, Hood L: Coordinate regulation ofenergy transduction modules in Halobacterium sp. analyzedby a global systems approach. Proc Natl Acad Sci USA 2002,99:14913-14918.
31. Baliga NS, Bjork SJ, Bonneau R, Pan M, Iloanusi C, Kottemann MC,Hood L, DiRuggiero J: Systems level insights into the stressresponse to UV radiation in the halophilic archaeon Halo-bacterium NRC-1. Genome Res 2004, 14:1025-1035.
32. Ideker T, Thorsson V, Siegel AF, Hood LE: Testing for differen-tially-expressed genes by maximum-likelihood analysis ofmicroarray data. J Comput Biol 2000, 7:805-817.
33. The Inferelator Cytoscape web start. [http://halo.systemsbiology.net/inferelator]
34. Shannon P, Reiss DJ, Bonneau R, Baliga NS: The Gaggle: a systemfor intergating bioinformatics and computational biologysoftware and data sources. BMC Bioinformatics in press.
35. Bateman A, Coin L, Durbin R, Finn RD, Hollich V, Griffiths-Jones S,Khanna A, Marshall M, Moxon S, Sonnhammer EL, et al.: The Pfamprotein families database. Nucleic Acids Res 2004:D138-D141.
36. Ettema TJ, Huynen MA, de Vos WM, van der Oost J: TRASH: anovel metal-binding domain predicted to be involved inheavy-metal sensing, trafficking and resistance. Trends Bio-chem Sci 2003, 28:170-173.
37. Hill PJ, Cockayne A, Landers P, Morrissey JA, Sims CM, Williams P:SirR, a novel iron-dependent repressor in Staphylococcusepidermidis. Infect Immun 1998, 66:4123-4129.
38. Que Q, Helmann JD: Manganese homeostasis in Bacillus subtilisis regulated by MntR, a bifunctional regulator related to thediphtheria toxin repressor family of proteins. Mol Microbiol2000, 35:1454-1468.
39. Baliga NS, Goo YA, Ng WV, Hood L, Daniels CJ, DasSarma S: Is geneexpression in Halobacterium NRC-1 regulated by multipleTBP and TFB transcription factors? Mol Microbiol 2000,36:1184-1185.
40. Shen-Orr SS, Milo R, Mangan S, Alon U: Network motifs in thetranscriptional regulation network of Escherichia coli. NatGenet 2002, 31:64-68.
41. Lee TI, Rinaldi NJ, Robert F, Odom DT, Bar-Joseph Z, Gerber GK,Hannett NM, Harbison CT, Thompson CM, Simon I, et al.: Tran-scriptional regulatory networks in Saccharomyces cerevisiae.Science 2002, 298:799-804.
42. Shmulevich I, Lahdesmaki H, Dougherty ER, Astola J, Zhang W: Therole of certain Post classes in Boolean network models ofgenetic networks. Proc Natl Acad Sci USA 2003, 100:10734-10739.
43. Barabasi AL, Albert R: Emergence of scaling in randomnetworks. Science 1999, 286:509-512.
44. Wuchty S, Oltvai ZN, Barabasi AL: Evolutionary conservation of
Genome Biology 2006, 7:R36
R36.16 Genome Biology 2006, Volume 7, Issue 5, Article R36 Bonneau et al. http://genomebiology.com/2006/7/5/R36
motif constituents in the yeast protein interaction network.Nat Genet 2003, 35:176-179.
45. Dunn WB, Bailey NJ, Johnson HE: Measuring the metabolome:current analytical technologies. Analyst 2005, 130:606-625.
46. Wahde M, Hertz J: Modeling genetic regulatory dynamics inneural development. J Comput Biol 2001, 8:429-442.
47. von Dassow G, Meir E, Munro EM, Odell GM: The segment polar-ity network is a robust developmental module. Nature 2000,406:188-192.
48. Efron B, Johnstone I, Hastie T, Tibshirani R: Least angleregression. Ann Stat 2003, 32:407-499.
49. Clementi C, Nymeyer H, Onuchic JN: Topological and energeticfactors: what determines the structural details of the transi-tion state ensemble and 'en-route' intermediates for proteinfolding? An investigation for small globular proteins. J Mol Biol2000, 298:937-953.
50. Bernstein JA, Khodursky AB, Lin PH, Lin-Chao S, Cohen SN: Globalanalysis of mRNA decay and abundance in Escherichia coli atsingle-gene resolution using two-color fluorescent DNAmicroarrays. Proc Natl Acad Sci USA 2002, 99:9697-9702.
51. Das D, Banerjee N, Zhang MQ: Interacting models of coopera-tive gene regulation. Proc Natl Acad Sci USA 2004,101:16234-16239.
52. Hastie T, Tibshirani R, Friedman JH: The Elements of Statistical LearningNew York: Springer-Verlag; 2001.
53. Tibshirani R: Regression shrinkage and selection via the lasso.J Royal Statist Soc B 1996, 58:267-288.
54. Gustafsson M, Hornquist M, Lombardi A: Constructing and ana-lyzing a large-scale gene-to-gene regulatory network. IEEE/ACM Trans Comput Biol 2005, 2:254-261.
55. Halobacterium research at the institute for systems biology.[http://halo.systemsbiology.net]
56. Cytoscape [http://cytoscape.org]57. R-Project [http://www.r-project.org/]
Genome Biology 2006, 7:R36
Copyright © 2022 FDOKUMEN

