


Bahasa
Halaman
Hukum

DOI: 10.1007/s10967-007-6878-8 Journal of Radioanalytical and Nuclear Chemistry, Vol. 273, No.2 (2007) 363–370
0236–5731/USD 20.00 Akadémiai Kiadó, Budapest © 2007 Akadémiai Kiadó, Budapest Springer, Dordrecht
The function of radon in curing respiratory diseases in the therapeutic cave of Tapolca
J. Somlai,1 N. Kávási,1 T. Szabó,2 A. Várhegyi,3 T. Kovács1* 1 Department of Radiochemistry, University of Pannonia, P.O. Box 158, 8201 Veszprém, Hungary
2 Department of Allergy, Hospital of Tapolca, Ady u.1-3, 8300 Tapolca, Hungary 3 Mecsek-Öko Environmental Protection Co., H-7614 Pécs, P.O. Box 121, Hungary
(Received June 8, 2006)
It is suggested to spend some time in a cave for curing respiratory diseases. Some ascribe the healing effect partly to radon. In Hungary in the Hospital Cave of Tapolca the mean radon concentration shows 17 times difference in the winter and in the summer period. The change of the forced exhaled volume in 1 s (FEV1) values was examined measured by 1824 patients in this cave. By 70% of the patients the FEV1 value improved, by 30% it became worse but these were independent from the radon concentration of the cave. Therefore, radon concentration has no positive effect during the treatments performed in Tapolca.
Introduction
222Rn is the gaseous radioactive products of the decay of the 226Ra. Some of the atoms of this radon isotope are released from the solid matrix of the material by recoil when the 226Ra decays. Radon atoms with a half-life of 3.8 days entering the pore space and transported by different way (diffusion or advection) through the space until they in turn decay or are released into the atmosphere. Radon quickly blends in free air but it accumulates in closed spaces.1
In the 1970s it was realized that high radon concentrations may be found in caves. Environmental studies have revealed that a strong spatial variability of radon concentrations in a cave is often found2 and also that values measured in individual caves can differ significantly from each other.3–6
In the majority of caves studied, considerable seasonal variations, variations in different weather conditions and diurnal variations were observed.6–9
Atmospheric pressure changes and the temperature differences between the atmosphere and cave interior can result in spatial and seasonal variability of the radon concentration.2,7,10,11
This radioactive noble gas (222Rn) together with its short-lived decay products, is responsible fore more than half of the natural dose in the population.12
High radon concentration causes a remarkable dose. Most of the radiation dose is received in the tracheo-bronchial region of the lungs by inhaled 222Rn daughters and in particular the short-lived alpha emitters 218Po and 214Po. The risk of exposure to high doses of radiation exist most of all in caves.13,14
On the other hand caves are often used for curing bronchial and asthmatic diseases of children and adults in several places.6,15–17 Some ascribe the positive effect of cave treatment partly to radon. * E-mail: [email protected]
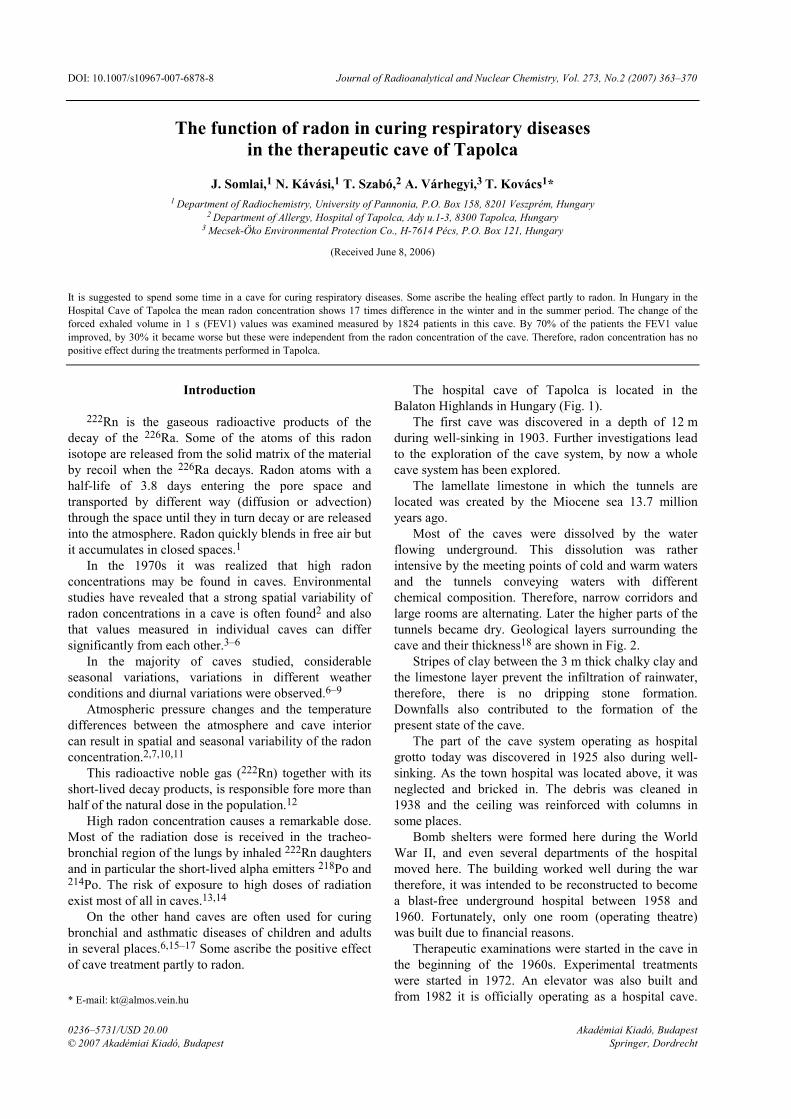
The hospital cave of Tapolca is located in the Balaton Highlands in Hungary (Fig. 1).
The first cave was discovered in a depth of 12 m during well-sinking in 1903. Further investigations lead to the exploration of the cave system, by now a whole cave system has been explored.
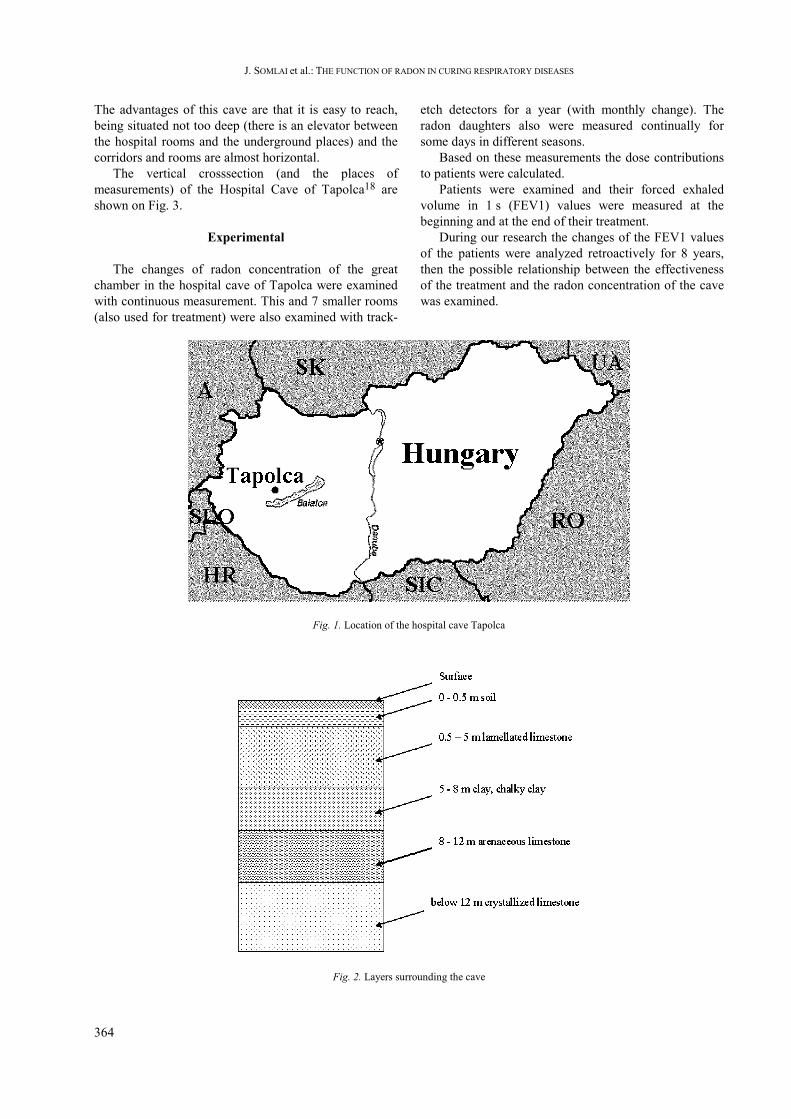
The lamellate limestone in which the tunnels are located was created by the Miocene sea 13.7 million years ago.
Most of the caves were dissolved by the water flowing underground. This dissolution was rather intensive by the meeting points of cold and warm waters and the tunnels conveying waters with different chemical composition. Therefore, narrow corridors and large rooms are alternating. Later the higher parts of the tunnels became dry. Geological layers surrounding the cave and their thickness18 are shown in Fig. 2.
Stripes of clay between the 3 m thick chalky clay and the limestone layer prevent the infiltration of rainwater, therefore, there is no dripping stone formation. Downfalls also contributed to the formation of the present state of the cave.
The part of the cave system operating as hospital grotto today was discovered in 1925 also during well-sinking. As the town hospital was located above, it was neglected and bricked in. The debris was cleaned in 1938 and the ceiling was reinforced with columns in some places.
Bomb shelters were formed here during the World War II, and even several departments of the hospital moved here. The building worked well during the war therefore, it was intended to be reconstructed to become a blast-free underground hospital between 1958 and 1960. Fortunately, only one room (operating theatre) was built due to financial reasons.
Therapeutic examinations were started in the cave in the beginning of the 1960s. Experimental treatments were started in 1972. An elevator was also built and from 1982 it is officially operating as a hospital cave.
J. SOMLAI et al.: THE FUNCTION OF RADON IN CURING RESPIRATORY DISEASES
364
The advantages of this cave are that it is easy to reach, being situated not too deep (there is an elevator between the hospital rooms and the underground places) and the corridors and rooms are almost horizontal.
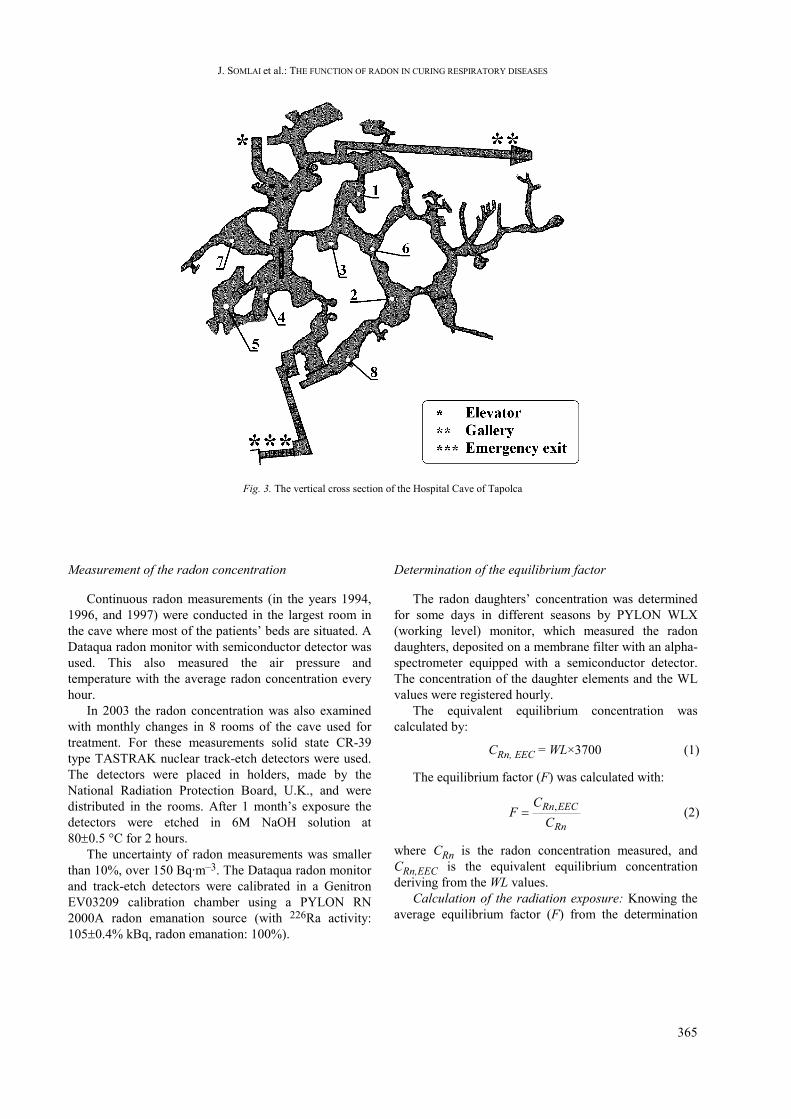
The vertical crosssection (and the places of measurements) of the Hospital Cave of Tapolca18 are shown on Fig. 3.
Experimental
The changes of radon concentration of the great chamber in the hospital cave of Tapolca were examined with continuous measurement. This and 7 smaller rooms (also used for treatment) were also examined with track-
etch detectors for a year (with monthly change). The radon daughters also were measured continually for some days in different seasons.
Based on these measurements the dose contributions to patients were calculated.
Patients were examined and their forced exhaled volume in 1 s (FEV1) values were measured at the beginning and at the end of their treatment.
During our research the changes of the FEV1 values of the patients were analyzed retroactively for 8 years, then the possible relationship between the effectiveness of the treatment and the radon concentration of the cave was examined.
Fig. 1. Location of the hospital cave Tapolca
Fig. 2. Layers surrounding the cave
J. SOMLAI et al.: THE FUNCTION OF RADON IN CURING RESPIRATORY DISEASES
365
Fig. 3. The vertical cross section of the Hospital Cave of Tapolca
Measurement of the radon concentration
Continuous radon measurements (in the years 1994, 1996, and 1997) were conducted in the largest room in the cave where most of the patients’ beds are situated. A Dataqua radon monitor with semiconductor detector was used. This also measured the air pressure and temperature with the average radon concentration every hour.
In 2003 the radon concentration was also examined with monthly changes in 8 rooms of the cave used for treatment. For these measurements solid state CR-39 type TASTRAK nuclear track-etch detectors were used. The detectors were placed in holders, made by the National Radiation Protection Board, U.K., and were distributed in the rooms. After 1 month’s exposure the detectors were etched in 6M NaOH solution at 80±0.5 °C for 2 hours.
The uncertainty of radon measurements was smaller than 10%, over 150 Bq.m–3. The Dataqua radon monitor and track-etch detectors were calibrated in a Genitron EV03209 calibration chamber using a PYLON RN 2000A radon emanation source (with 226Ra activity: 105±0.4% kBq, radon emanation: 100%).
Determination of the equilibrium factor
The radon daughters’ concentration was determined for some days in different seasons by PYLON WLX (working level) monitor, which measured the radon daughters, deposited on a membrane filter with an alpha-spectrometer equipped with a semiconductor detector. The concentration of the daughter elements and the WL values were registered hourly.
The equivalent equilibrium concentration was calculated by:
CRn, EEC = WL×3700 (1)
The equilibrium factor (F) was calculated with:
Rn
EECRnC
CF ,= (2)
where CRn is the radon concentration measured, and CRn,EEC is the equivalent equilibrium concentration deriving from the WL values.
Calculation of the radiation exposure: Knowing the average equilibrium factor (F) from the determination
J. SOMLAI et al.: THE FUNCTION OF RADON IN CURING RESPIRATORY DISEASES
366
above mentioned and the measured radon concentration (CRn) the effective dose was calculated by:
E = CRn×F×t×K (3)
where E is the effective dose (mSv), CRn is the average radon concentration (Bq.m–3), F is the average equilibrium factor, t is the time spent inside in the investigated period (h), K is the dose conversion factor.
Examining the effect of the treatment
Patients with respiratory diseases are assigned to the cave. The average length of a treatment in the cave is three weeks, including about 4 hours’ stay per day in the cave. The cave is pollen-free, has constant temperature, and its special air has an effect on the patients’ respiratory system. The patients’ breathing functions before and after the treatment were examined.
During our research the relative changes of the FEV1 values of the patients during the treatment were analyzed retroactively for 8 years:
)(1FEV
)(1FEV)(1FEVB
BEET −=
The effect of the treatment (ET) was calculated, where FEV1 (B) is the value measured at the beginning, FEV1 (E) is the value measured at the end of the patient’s treatment. The cause of the change may be relaxation, the mostly stress-free environment, the special treatment and staying in the cave, etc.
Results and discussion
Radon concentration
The mean yearly temperature in the cave is 13.9 °C (13.2–14.8), the pressure is 1004 kPa (997–1014), it is considered to be very stable. The three years’ average of the radon concentration is 4.59±0.12 kBq.m–3.
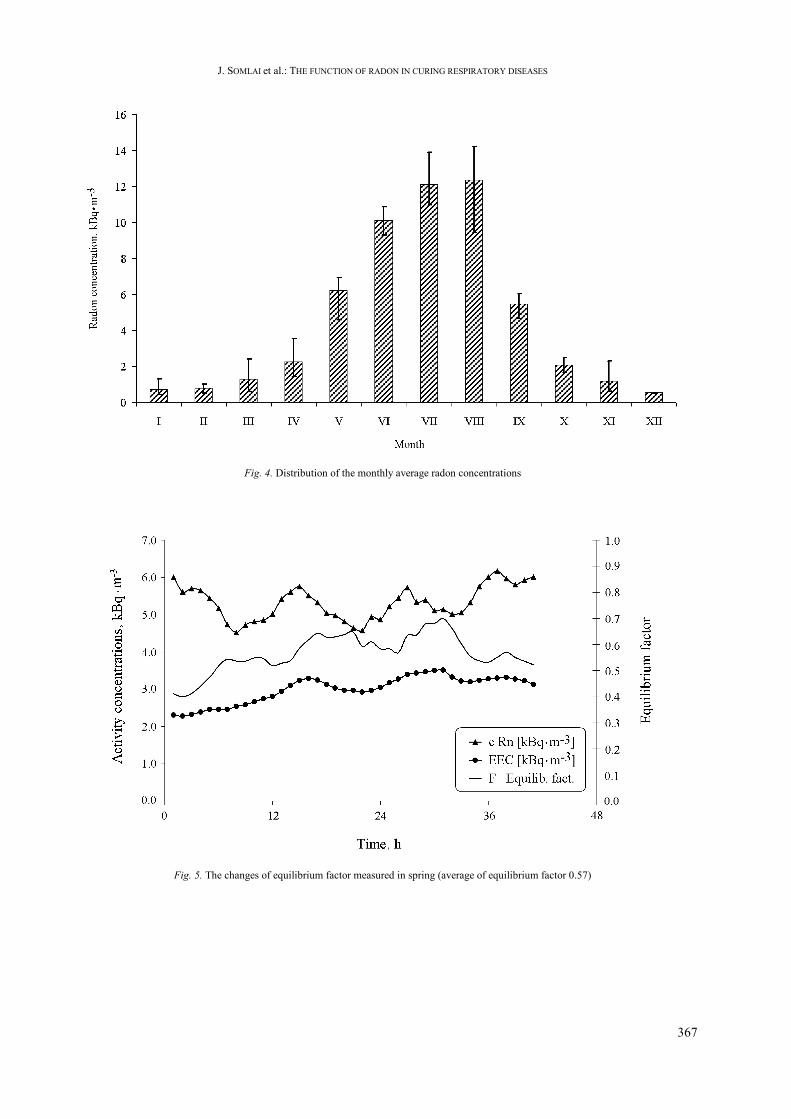
Figure 4 shows the change of the monthly mean radon concentration (min-max value) over three years. As Fig. 4 shows, the radon concentration is relatively low (0.66 kBq.m–3 on average) in the winter months (December, January, February), while in the three hottest months (June, July, August) it is high (11.5 kBq.m–3 on average).
Measurements with track detectors provided similar results. The annual average values measured in 8 rooms of the hospital cave in the year 2003 altered between 4.39 and 5.50 kBq.m–3, and the annual average radon concentration was 4.66 kBq.m–3. This is in accordance with the average of the measurements of 3 years (4.59±0.12 kBq.m–3), therefore hereafter the data of the measurements of 3 years were used for calculations. The radon concentration in the rooms is almost homogeneous; it may differ from the annual average of the cave by a maximum of 15%.
Equilibrium factor
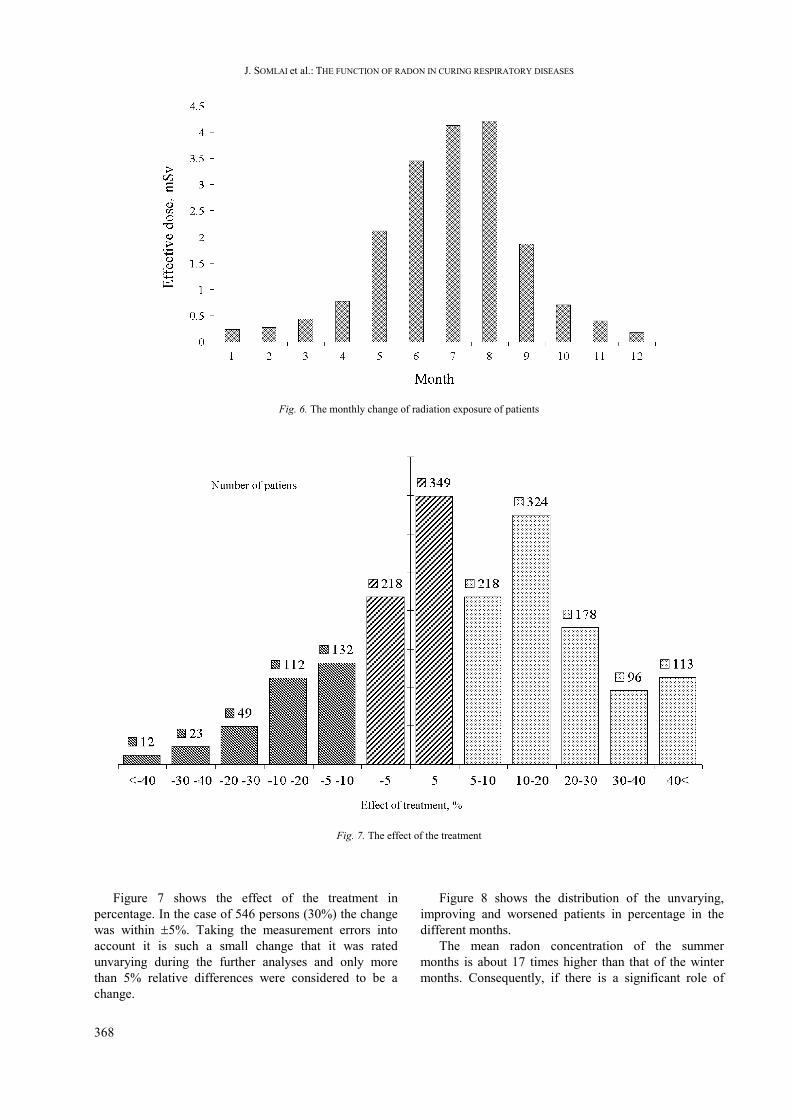
In Fig. 5 the changes of the equilibrium factor coming from the radon and radon daughters measured in spring are presented. The average of equilibrium factor measured in different seasons was 0.6, which is 50% higher than the 0.4 value in the Hungarian directive.19 It means 50% higher dose contribution at the same radon concentration.
Radiation exposure
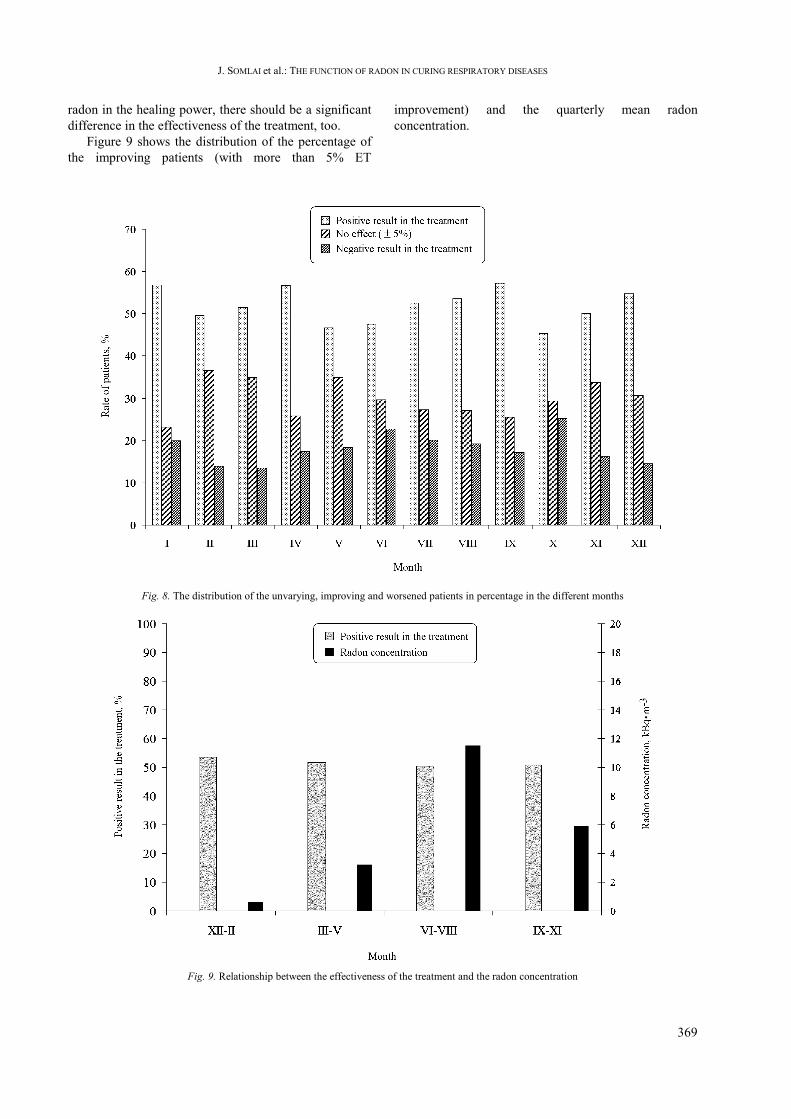
Considering the monthly average radon concentration, the 0.6 equilibrium factor and one treatment was calculated which lasted 3 weeks 6 times per week and 4 h.day–1 (Fig. 6).
The patients get 0.18–4.22 mSv effective dose during the treating period depending on the season of the cure.
The effect of the treatment
The data of 1824 patients altogether were examined. The FEV1 data of a total of 1824 patients were examined. By the statistic analysis of FEV1 values, first the impact of the treatment on the FEV1 values was examined. According to the Kormogolov-Smirnov test the differences between the FEV1 values are not distributed in a normal way, but it is very similar to it. Therefore the Wilcoxon test and the T-test were also carried out, and based on these two tests it can be stated that the changes in FEV1 values resulted in the expected values, which means that the cave therapy has a positive effect on the FEV1 value of the patients.
J. SOMLAI et al.: THE FUNCTION OF RADON IN CURING RESPIRATORY DISEASES
367
Fig. 4. Distribution of the monthly average radon concentrations
Fig. 5. The changes of equilibrium factor measured in spring (average of equilibrium factor 0.57)
J. SOMLAI et al.: THE FUNCTION OF RADON IN CURING RESPIRATORY DISEASES
368
Fig. 6. The monthly change of radiation exposure of patients
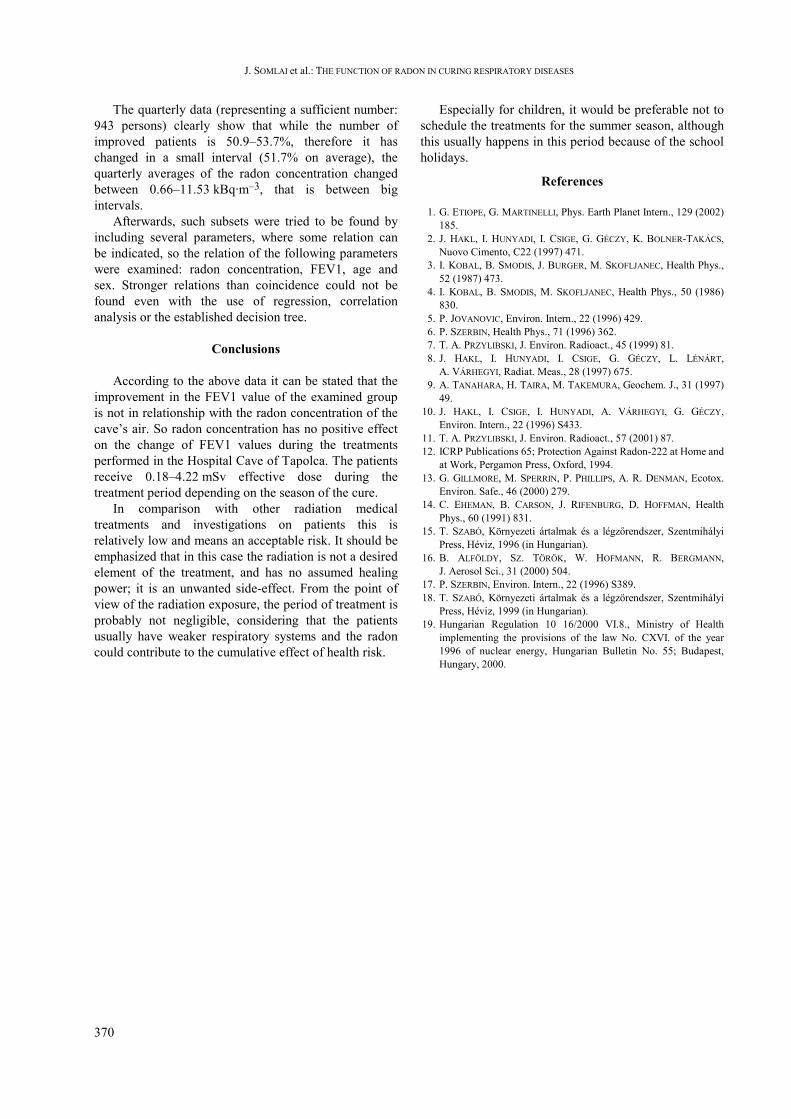
Fig. 7. The effect of the treatment
Figure 7 shows the effect of the treatment in
percentage. In the case of 546 persons (30%) the change was within ±5%. Taking the measurement errors into account it is such a small change that it was rated unvarying during the further analyses and only more than 5% relative differences were considered to be a change.
Figure 8 shows the distribution of the unvarying, improving and worsened patients in percentage in the different months.
The mean radon concentration of the summer months is about 17 times higher than that of the winter months. Consequently, if there is a significant role of
J. SOMLAI et al.: THE FUNCTION OF RADON IN CURING RESPIRATORY DISEASES
369
radon in the healing power, there should be a significant difference in the effectiveness of the treatment, too.
Figure 9 shows the distribution of the percentage of the improving patients (with more than 5% ET
improvement) and the quarterly mean radon concentration.
Fig. 8. The distribution of the unvarying, improving and worsened patients in percentage in the different months
Fig. 9. Relationship between the effectiveness of the treatment and the radon concentration
J. SOMLAI et al.: THE FUNCTION OF RADON IN CURING RESPIRATORY DISEASES
370
The quarterly data (representing a sufficient number: 943 persons) clearly show that while the number of improved patients is 50.9–53.7%, therefore it has changed in a small interval (51.7% on average), the quarterly averages of the radon concentration changed between 0.66–11.53 kBq.m–3, that is between big intervals.
Afterwards, such subsets were tried to be found by including several parameters, where some relation can be indicated, so the relation of the following parameters were examined: radon concentration, FEV1, age and sex. Stronger relations than coincidence could not be found even with the use of regression, correlation analysis or the established decision tree.
Conclusions
According to the above data it can be stated that the improvement in the FEV1 value of the examined group is not in relationship with the radon concentration of the cave’s air. So radon concentration has no positive effect on the change of FEV1 values during the treatments performed in the Hospital Cave of Tapolca. The patients receive 0.18–4.22 mSv effective dose during the treatment period depending on the season of the cure.
In comparison with other radiation medical treatments and investigations on patients this is relatively low and means an acceptable risk. It should be emphasized that in this case the radiation is not a desired element of the treatment, and has no assumed healing power; it is an unwanted side-effect. From the point of view of the radiation exposure, the period of treatment is probably not negligible, considering that the patients usually have weaker respiratory systems and the radon could contribute to the cumulative effect of health risk.
Especially for children, it would be preferable not to schedule the treatments for the summer season, although this usually happens in this period because of the school holidays.
References
1. G. ETIOPE, G. MARTINELLI, Phys. Earth Planet Intern., 129 (2002) 185.
2. J. HAKL, I. HUNYADI, I. CSIGE, G. GÉCZY, K. BOLNER-TAKÁCS, Nuovo Cimento, C22 (1997) 471.
3. I. KOBAL, B. SMODIS, J. BURGER, M. SKOFLJANEC, Health Phys., 52 (1987) 473.
4. I. KOBAL, B. SMODIS, M. SKOFLJANEC, Health Phys., 50 (1986) 830.
5. P. JOVANOVIC, Environ. Intern., 22 (1996) 429. 6. P. SZERBIN, Health Phys., 71 (1996) 362. 7. T. A. PRZYLIBSKI, J. Environ. Radioact., 45 (1999) 81. 8. J. HAKL, I. HUNYADI, I. CSIGE, G. GÉCZY, L. LÉNÁRT,
A. VÁRHEGYI, Radiat. Meas., 28 (1997) 675. 9. A. TANAHARA, H. TAIRA, M. TAKEMURA, Geochem. J., 31 (1997)
49. 10. J. HAKL, I. CSIGE, I. HUNYADI, A. VÁRHEGYI, G. GÉCZY,
Environ. Intern., 22 (1996) S433. 11. T. A. PRZYLIBSKI, J. Environ. Radioact., 57 (2001) 87. 12. ICRP Publications 65; Protection Against Radon-222 at Home and
at Work, Pergamon Press, Oxford, 1994. 13. G. GILLMORE, M. SPERRIN, P. PHILLIPS, A. R. DENMAN, Ecotox.
Environ. Safe., 46 (2000) 279. 14. C. EHEMAN, B. CARSON, J. RIFENBURG, D. HOFFMAN, Health
Phys., 60 (1991) 831. 15. T. SZABÓ, Környezeti ártalmak és a légzőrendszer, Szentmihályi
Press, Héviz, 1996 (in Hungarian). 16. B. ALFÖLDY, SZ. TÖRÖK, W. HOFMANN, R. BERGMANN,
J. Aerosol Sci., 31 (2000) 504. 17. P. SZERBIN, Environ. Intern., 22 (1996) S389. 18. T. SZABÓ, Környezeti ártalmak és a légzőrendszer, Szentmihályi
Press, Héviz, 1999 (in Hungarian). 19. Hungarian Regulation 10 16/2000 VI.8., Ministry of Health
implementing the provisions of the law No. CXVI. of the year 1996 of nuclear energy, Hungarian Bulletin No. 55; Budapest, Hungary, 2000.
Top Related
Copyright © 2022 FDOKUMEN

