


Bahasa
Halaman
Hukum

HAL Id: hal-02101392https://hal.archives-ouvertes.fr/hal-02101392
Submitted on 16 Apr 2019
HAL is a multi-disciplinary open accessarchive for the deposit and dissemination of sci-entific research documents, whether they are pub-lished or not. The documents may come fromteaching and research institutions in France orabroad, or from public or private research centers.
L’archive ouverte pluridisciplinaire HAL, estdestinée au dépôt et à la diffusion de documentsscientifiques de niveau recherche, publiés ou non,émanant des établissements d’enseignement et derecherche français ou étrangers, des laboratoirespublics ou privés.
The Effect of the Arab Spring on the Preferences forRedistribution in EgyptBilal El Rafhi, Alexandre Volle
To cite this version:Bilal El Rafhi, Alexandre Volle. The Effect of the Arab Spring on the Preferences for Redistributionin Egypt. ADRES Doctoral conference 2019, AMSE. Aix-Marseille School of Economics, Feb 2019,Marseille, France. �hal-02101392�
The Effect of the Arab Spring on the Preferences forRedistribution in Egypt∗
Bilal El Rafhi †1 and Alexandre Volle ‡1
1CEE-M, Univ.Montpellier, CNRS, INRA, SupAgro, Montpellier, France
December 4, 2018
Abstract
The present paper investigates the effect of the revolution occurred in January 2011in Egypt on the Preferences of Redistribution. This shock has been an important eventenhancing the freedom situation and political structure. In a first step taking into accountthe main determinants explaining Preferences of Redistribution displayed in literature,our results differ showing a positive impact of the religion and a negative impact of thealtruistic attitude. In a second step, we rely on a diff-in-diff approach to estimate theeffect of the revolution using as control group three similar countries. We find that Egyp-tians became much more favorable to redistribution after the Arab Spring. Moreover, therevolution effect is stronger for the poorest people and those who are interested in politics.
JEL Classification: H23, D74.Keywords: Redistributive preferences, Revolution, Arab spring, Freedom, Political situ-ation.
1 Introduction
As shown in the world inequality report (W.I.R) the income inequality measured by the con-centration of income in the hands of the wealthiest 10% has increased since 1980 in nearly∗This paper forms part of the research project RediPref (Contract ANR-15-CE26-0004) of the French Na-
tional Agency for Research (ANR) whose financial support is gratefully acknowledged. It has also been supportedby LabEx Entrepreneurship (Contract ANR-10-LABX-11-01).†Email : [email protected]‡Email : [email protected]
1
all world regions (Alvaredo, Chancel, Piketty, Saez, and Zucman (2018)). Understanding thedeterminants of the preferences for redistribution presents a key topic in the fight against theseinequalities. Many motivations drive this attitude as explained by many scholars (Fong, 2001;Corneo and Grüner, 2002; Alesina and Giuliano, 2009). One of the interest aspects in this topicis the political regime under which individuals can express their preferences (Acemoglu, Naidu,Restrepo, and Robinson (2015)). Schläpfer, Schmitt, and Roschewitz (2008) showed how thepreferences of citizens could be influenced by political institutions, Kymlicka (2004) in turnstresses the importance of the political liberties in the individual economic attitudes.
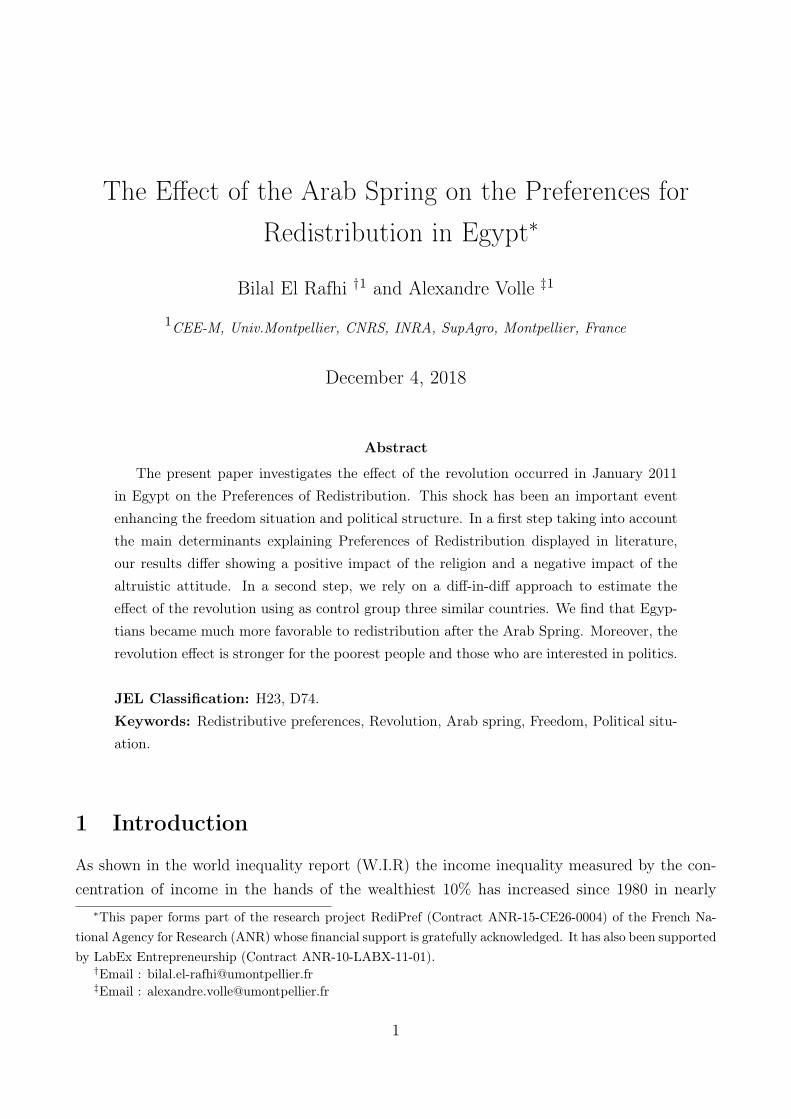
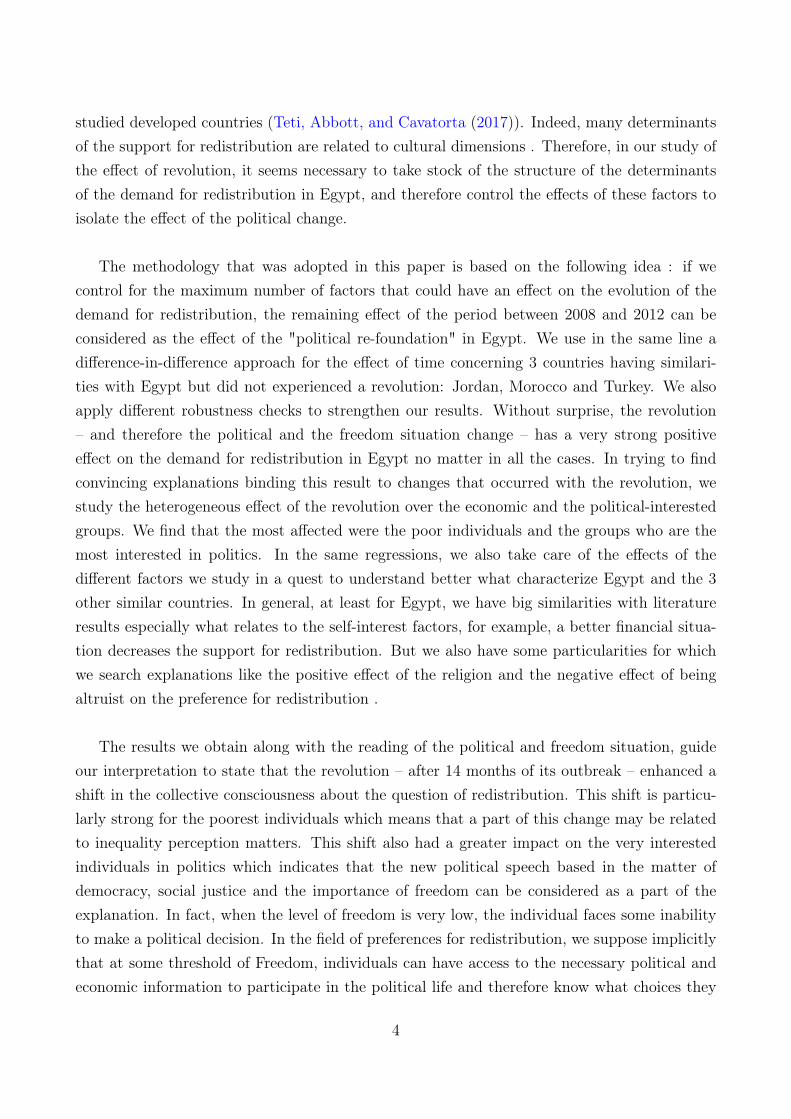
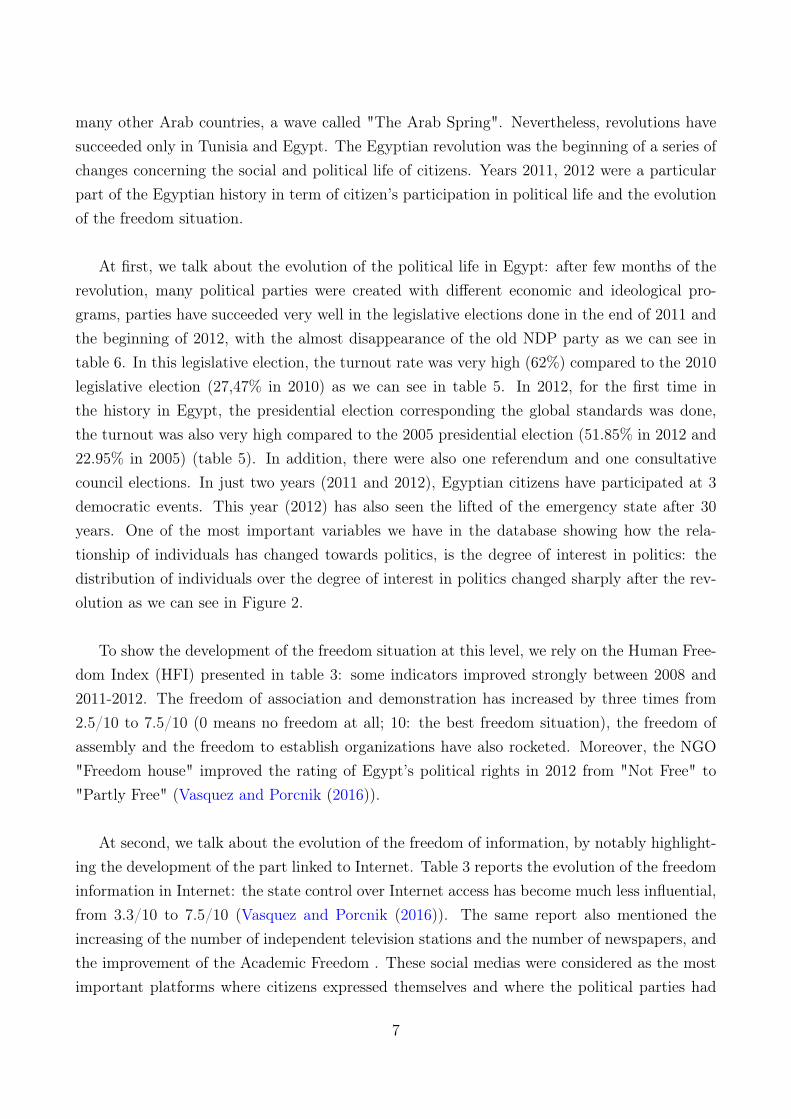
In this paper, we are interested in the possible impact of a change in the political regimeand in the level of political and informational freedom on the preferences for redistribution,with an application in the case of the Egyptian Revolution. The 25 January revolution whichbelongs to the Arab Spring, has been an important part of a revolutionary wave where manydemocratic ideas were spreading. This wave started on 17 December 2010 in Tunisia and hasbeen spread in different forms in many Arab countries like Egypt, Yemen, Libya, Morocco,Jordan and Lebanon. In Egypt, where the most popular slogan was "Bread, Freedom, SocialJustice", the revolution succeed, the political regime changed and many shifts occurred at thefreedom and political levels. Between 2011 and the first half of 2012 a lot of new politicalparties were created, and many elections were held. If we look to the evolution of the attitudestowards redistribution between 2008 and 2012 in Egypt in Figure 1, we see that the distributionof the variable presenting the demand for redistribution increased drastically between the twoperiods. Based on World Values Survey (WVS) data, 22% of the Egyptian population wasin favor of the redistribution in 2008, this percentage rose to 59 % in 2012 (Table 2). Thisevolution not only impacted the poor people but also the rich: for people belonging to the firstquintile (the poorest), this percentage increased by 46%, and for people belonging to the fifthquintile (the richest) this percentage increased by 18%.
Individual preferences for redistribution change over time for many reasons, some are relatedto personal life evolution, others are related to broader events. The subject of the evolutionof the demand for redistribution over a short period constitutes one of the most interestingresearch quests, especially when what we called a "shock" happens whose effects on the de-mand for redistribution are anticipated. In the field of the study of the shock effect on theredistribution attitude, Olivera (2014) and Kroeger (2014) showed how the European economiccrisis increased the support for redistribution. Margalit (2013) was interested in the AmericanGreat recession leading to conclude that a personal economic shock like a job loss has a positiveeffect on the demand for redistribution. Dahlberg, Edmark, and Lundqvist (2012) showed howincreasing the number of immigrants to Europe lead to reduce support for redistribution among
2
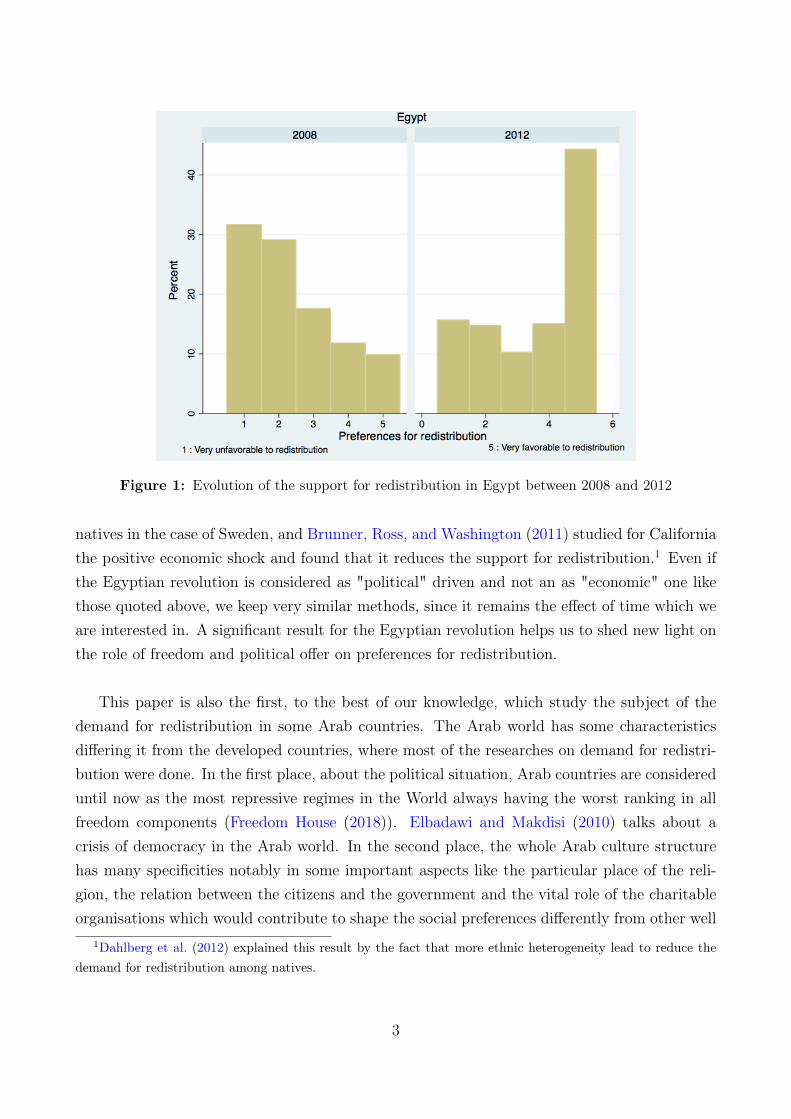
Figure 1: Evolution of the support for redistribution in Egypt between 2008 and 2012
natives in the case of Sweden, and Brunner, Ross, and Washington (2011) studied for Californiathe positive economic shock and found that it reduces the support for redistribution.1 Even ifthe Egyptian revolution is considered as "political" driven and not an as "economic" one likethose quoted above, we keep very similar methods, since it remains the effect of time which weare interested in. A significant result for the Egyptian revolution helps us to shed new light onthe role of freedom and political offer on preferences for redistribution.
This paper is also the first, to the best of our knowledge, which study the subject of thedemand for redistribution in some Arab countries. The Arab world has some characteristicsdiffering it from the developed countries, where most of the researches on demand for redistri-bution were done. In the first place, about the political situation, Arab countries are considereduntil now as the most repressive regimes in the World always having the worst ranking in allfreedom components (Freedom House (2018)). Elbadawi and Makdisi (2010) talks about acrisis of democracy in the Arab world. In the second place, the whole Arab culture structurehas many specificities notably in some important aspects like the particular place of the reli-gion, the relation between the citizens and the government and the vital role of the charitableorganisations which would contribute to shape the social preferences differently from other well
1Dahlberg et al. (2012) explained this result by the fact that more ethnic heterogeneity lead to reduce thedemand for redistribution among natives.
3
studied developed countries (Teti, Abbott, and Cavatorta (2017)). Indeed, many determinantsof the support for redistribution are related to cultural dimensions . Therefore, in our study ofthe effect of revolution, it seems necessary to take stock of the structure of the determinantsof the demand for redistribution in Egypt, and therefore control the effects of these factors toisolate the effect of the political change.
The methodology that was adopted in this paper is based on the following idea : if wecontrol for the maximum number of factors that could have an effect on the evolution of thedemand for redistribution, the remaining effect of the period between 2008 and 2012 can beconsidered as the effect of the "political re-foundation" in Egypt. We use in the same line adifference-in-difference approach for the effect of time concerning 3 countries having similari-ties with Egypt but did not experienced a revolution: Jordan, Morocco and Turkey. We alsoapply different robustness checks to strengthen our results. Without surprise, the revolution– and therefore the political and the freedom situation change – has a very strong positiveeffect on the demand for redistribution in Egypt no matter in all the cases. In trying to findconvincing explanations binding this result to changes that occurred with the revolution, westudy the heterogeneous effect of the revolution over the economic and the political-interestedgroups. We find that the most affected were the poor individuals and the groups who are themost interested in politics. In the same regressions, we also take care of the effects of thedifferent factors we study in a quest to understand better what characterize Egypt and the 3other similar countries. In general, at least for Egypt, we have big similarities with literatureresults especially what relates to the self-interest factors, for example, a better financial situa-tion decreases the support for redistribution. But we also have some particularities for whichwe search explanations like the positive effect of the religion and the negative effect of beingaltruist on the preference for redistribution .
The results we obtain along with the reading of the political and freedom situation, guideour interpretation to state that the revolution – after 14 months of its outbreak – enhanced ashift in the collective consciousness about the question of redistribution. This shift is particu-larly strong for the poorest individuals which means that a part of this change may be relatedto inequality perception matters. This shift also had a greater impact on the very interestedindividuals in politics which indicates that the new political speech based in the matter ofdemocracy, social justice and the importance of freedom can be considered as a part of theexplanation. In fact, when the level of freedom is very low, the individual faces some inabilityto make a political decision. In the field of preferences for redistribution, we suppose implicitlythat at some threshold of Freedom, individuals can have access to the necessary political andeconomic information to participate in the political life and therefore know what choices they
4
dispose of. It can be considered the case in most of the countries when studies about preferencesfor redistribution have been lead (mainly in Europe and USA), which was by far not the casein Egypt. In the absence of a minimum level of political and civil liberties, it becomes difficultfor individuals to decide how to lead their lives (Kymlicka (2004)). Karshenas, Moghadam,and Alami (2014) stress the attention to the "democratic-developmental social contract" whereinterest groups discuss on the social justice system, and show how the Arab spring created theconditions for that.
By focusing on the Arab countries and especially Egypt, our study contributes to the grow-ing literature on the determinants of preferences for redistribution by providing the first analysisof these preferences for this region of the world. The second contribution lies in showing thecritical role of the informational and political freedom on shaping the support for redistribu-tion. This is achieved by evaluating the effect of the Egyptian revolution on this attitude. Weunderline that this phenomenon has been rarely studied because the difficulty to have data justbefore and after a big event like a revolution, which is the case for Egypt.
The remainder of the paper is organized as follows. Section 2 lays out the description of theeconomic, political and freedom situation before and after the revolution. Section 3 presentsthe data and the descriptive statistics concerning Egypt and some other Arab countries. InSection 4 we posit the empirical strategy to obtain the results we are looking for. Section5 presents all results concerning the determinants for demand for redistribution in Egypt, theeffect of revolution controlled for these factors, the differential effect of revolution, and the effectof revolution controlled for the Arab trend. In Section 6 we provide some explanations aboutwhy the revolution had a positive impact on preferences for redistribution. Finally, Section 7concludes.
2 Context : Egypt before and after revolution
The revolution is a broad popular movement outside the existing constitutional structure, oroutside the legitimacy, whose aim is to change the system of government existing in the stateas was defined by Azmi Bishara in his book “Revolution and the ability to revolution” writtenafter Arab Spring (Bishara (2009)). According to this definition and other studies Brownlee,Masoud, and Reynolds (2015), the Egyptian social movement was one. This revolution createda strong conscience among Egyptians that the suffering they endure is a result of injustice andit is not a given social situation, and that it is essential to be a free citizen involved in thepolitical life (Bishara (2009)). We are trying in this Section to find what factors could haveenough strength to shift the preferences of the individuals as we see for Egypt. For that, we
5
will expose the economic, political and freedom situations before and after January 2011, whiledepicting essentially the consequences the revolution had on two vectors: the political life andthe freedom of information.
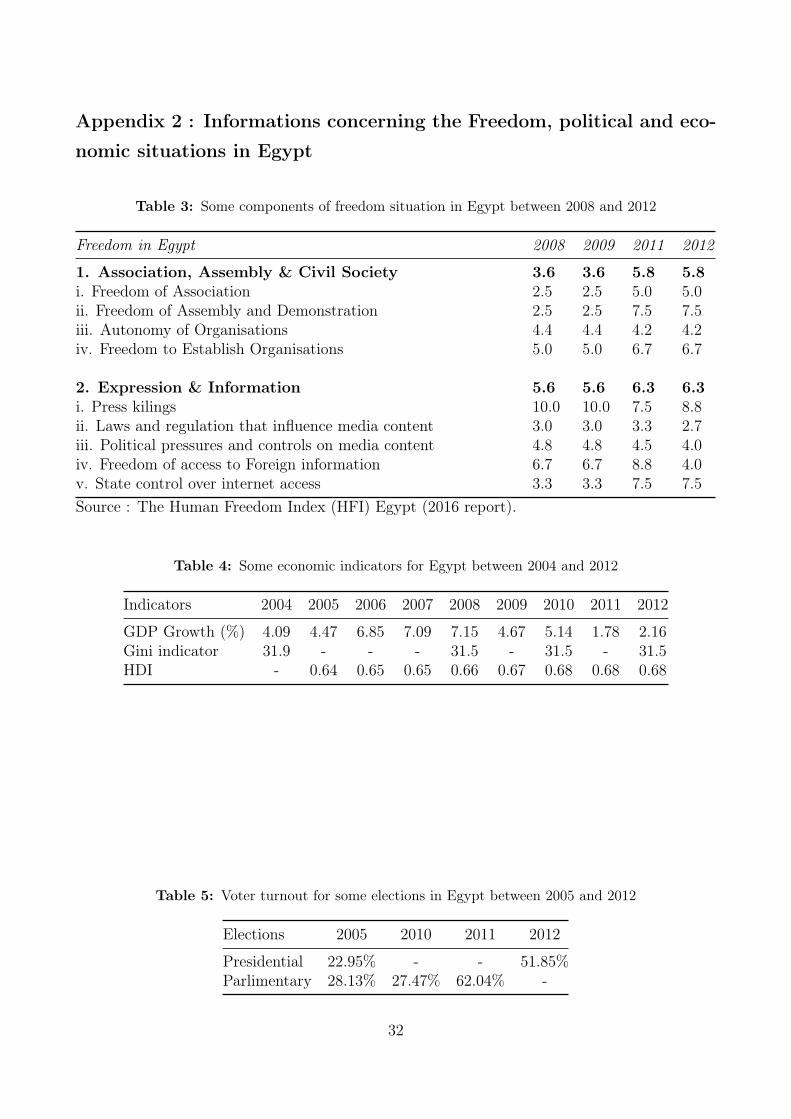
At the level of the economic situation, we are interested in the most important economicindexes. If we look at the growth rate in table 4, we read that it was increasing since 2004(The World Bank (2018))(table 4). We take an inequality indicator, the Gini index was slightlyimproving as we can see in table 4. We note the same trend for the Human Development IndexHDI. In the few months directly after the revolution, as Abdou, Salman, and Zaazou (2013)presented in their document, the economic situation was damaged, but apparently not to thepoint of having an effect on people’s financial feelings. Indeed, in our data, the percentage ofindividuals unsatisfied with their financial situation in 2012 compared to 2008 was almost thesame: 42% in 2008 and 44%. Costello, Jenkins, and Aly (2015) showed in their discussion onthe determinants of the Arab awakenings protests, the limited role of the economic factors onthese revolutions, and they found rather good support for the effect of the "state terror", animportant element of the freedom, which we discuss in the next paragraphs.
On the eve of the Arab Spring, the Arab world was considered as the most repressive regionin the world. Egypt was a part of this reality: from 1981 until the revolution in 2011, Egypt wasalways considered one of the least free countries. Egyptians were chaired all this time by thesame person, the ex-general "Hosni Mubarak". Amnesty international (2011) criticized severaltimes Mubarak administration, for reasons linked to restrictions on freedom of expression andassembly, and also for political censorship. In the political field, only one political party was re-ally existing, the National Democratic Party (NDP), considered as a single party, authoritarianand centrist (El-Mikawy (1999)). The emergency law was maintained during all the durationof Mubarak presidential (Othman (2012)). Freedoms of assembly and association in 2008,2009 and 2010 were heavily restricted (Freedom house, 2008, 2009, 2010). We also rely on ta-ble 3 where is presented the ratings of some freedom components in these years (2008 and 2010).
On 25 January 2011, the 6 April youth movement and others opposition groups called toprotest for a day called the "Day of Anger". Demonstrations were maintained in different cities,and the government took a set of steps to fight against it. After 16 days of demonstrations,Hosni Mubarak Vice resigned as president. One of the characteristics of this revolution is thatit was popular, people from all social spheres participated (Bishara, 2009; Costello, Jenkins,and Aly, 2015). One of the first claims of the Egyptian people was about restoring dignityand get rid of the restriction of liberties (Dabashi, 2012; Telhami, 2013). This revolution wasin line with the revolutionary wave that began in Tunisia in December 2010 and stretched to
6
many other Arab countries, a wave called "The Arab Spring". Nevertheless, revolutions havesucceeded only in Tunisia and Egypt. The Egyptian revolution was the beginning of a series ofchanges concerning the social and political life of citizens. Years 2011, 2012 were a particularpart of the Egyptian history in term of citizen’s participation in political life and the evolutionof the freedom situation.
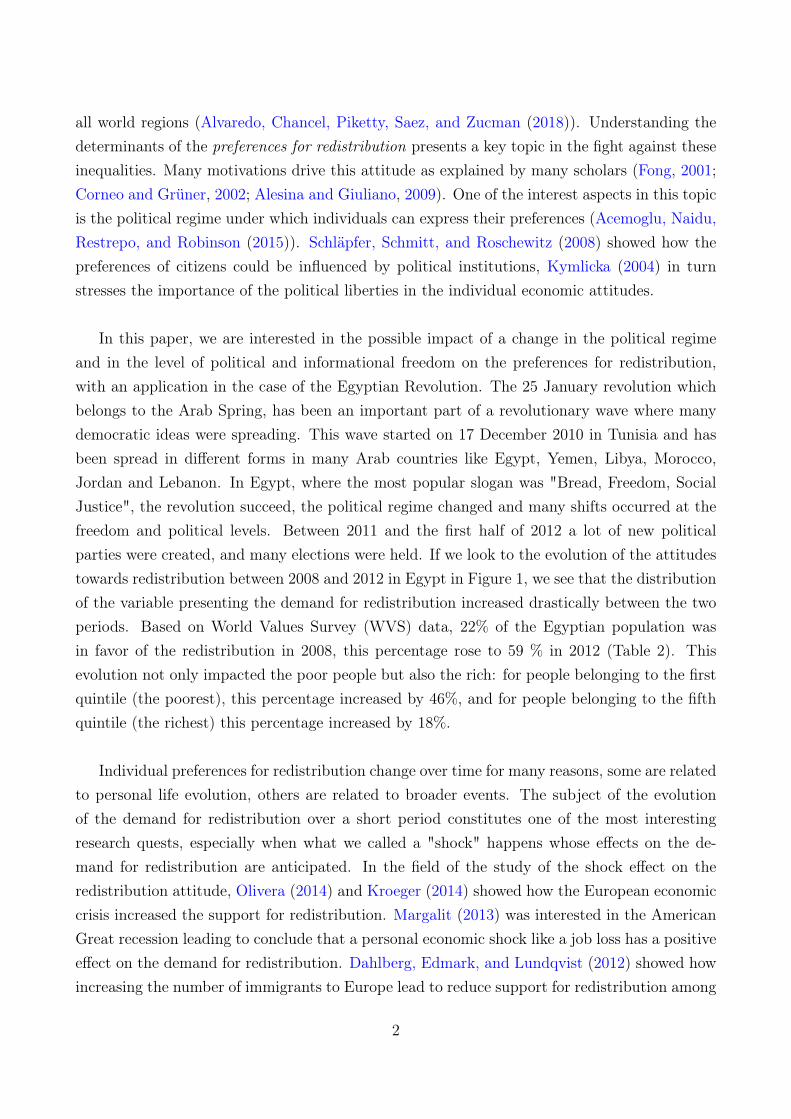
At first, we talk about the evolution of the political life in Egypt: after few months of therevolution, many political parties were created with different economic and ideological pro-grams, parties have succeeded very well in the legislative elections done in the end of 2011 andthe beginning of 2012, with the almost disappearance of the old NDP party as we can see intable 6. In this legislative election, the turnout rate was very high (62%) compared to the 2010legislative election (27,47% in 2010) as we can see in table 5. In 2012, for the first time inthe history in Egypt, the presidential election corresponding the global standards was done,the turnout was also very high compared to the 2005 presidential election (51.85% in 2012 and22.95% in 2005) (table 5). In addition, there were also one referendum and one consultativecouncil elections. In just two years (2011 and 2012), Egyptian citizens have participated at 3democratic events. This year (2012) has also seen the lifted of the emergency state after 30years. One of the most important variables we have in the database showing how the rela-tionship of individuals has changed towards politics, is the degree of interest in politics: thedistribution of individuals over the degree of interest in politics changed sharply after the rev-olution as we can see in Figure 2.
To show the development of the freedom situation at this level, we rely on the Human Free-dom Index (HFI) presented in table 3: some indicators improved strongly between 2008 and2011-2012. The freedom of association and demonstration has increased by three times from2.5/10 to 7.5/10 (0 means no freedom at all; 10: the best freedom situation), the freedom ofassembly and the freedom to establish organizations have also rocketed. Moreover, the NGO"Freedom house" improved the rating of Egypt’s political rights in 2012 from "Not Free" to"Partly Free" (Vasquez and Porcnik (2016)).
At second, we talk about the evolution of the freedom of information, by notably highlight-ing the development of the part linked to Internet. Table 3 reports the evolution of the freedominformation in Internet: the state control over Internet access has become much less influential,from 3.3/10 to 7.5/10 (Vasquez and Porcnik (2016)). The same report also mentioned theincreasing of the number of independent television stations and the number of newspapers, andthe improvement of the Academic Freedom . These social medias were considered as the mostimportant platforms where citizens expressed themselves and where the political parties had
7
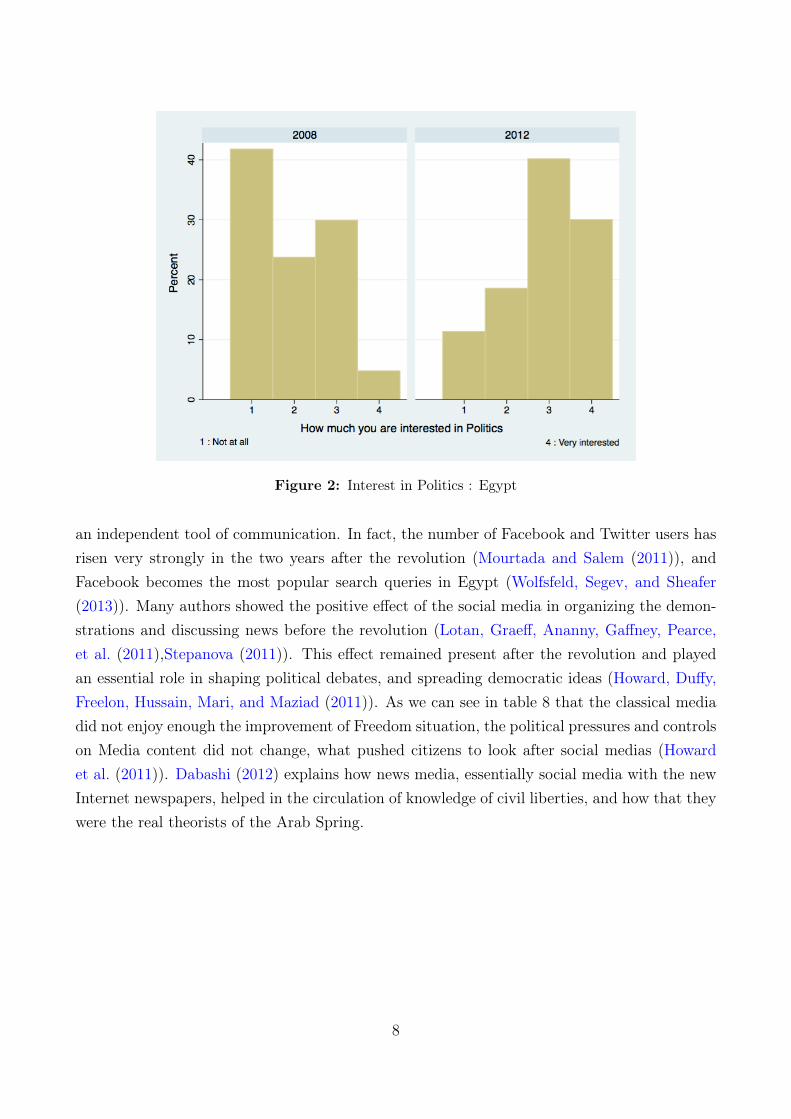
Figure 2: Interest in Politics : Egypt
an independent tool of communication. In fact, the number of Facebook and Twitter users hasrisen very strongly in the two years after the revolution (Mourtada and Salem (2011)), andFacebook becomes the most popular search queries in Egypt (Wolfsfeld, Segev, and Sheafer(2013)). Many authors showed the positive effect of the social media in organizing the demon-strations and discussing news before the revolution (Lotan, Graeff, Ananny, Gaffney, Pearce,et al. (2011),Stepanova (2011)). This effect remained present after the revolution and playedan essential role in shaping political debates, and spreading democratic ideas (Howard, Duffy,Freelon, Hussain, Mari, and Maziad (2011)). As we can see in table 8 that the classical mediadid not enjoy enough the improvement of Freedom situation, the political pressures and controlson Media content did not change, what pushed citizens to look after social medias (Howardet al. (2011)). Dabashi (2012) explains how news media, essentially social media with the newInternet newspapers, helped in the circulation of knowledge of civil liberties, and how that theywere the real theorists of the Arab Spring.
8
3 Data and descriptive statistics
3.1 Data
The data come from the World Values Survey data (WVS). These data consist of nationallyrepresentative surveys conducted in almost 100 countries on six waves between 1981 and 2014.The first wave including Arab countries was the fourth wave (1999-2014). Since we are onlyinterested in the change due to revolutions, we limit our interest on the wave before the ArabSpring and the wave after, to know the wave 5 (2005-2009) and the wave 6 (2010-2014). ForEgypt, the wave 5 was conducted between 15 March 2008 and 05 April 2008, and the wave 6between 01 March 2012 and 30 April 2012.
We can see in table 7 the availability of data for several Arab countries in the waves 5 and6. We also add Turkey even if it is not an Arab country for the religion, geographical andhistorical similarities. We can see that we have the data simultaneity before and after Arabrevolutions only for five countries: Egypt, Iraq, Jordan, Morocco and Turkey.
For the first part of the study concerning the determinants of preferences for redistributionin Egypt, we rely on the data available for Egypt in the waves 5 and 6. We also test the effectsof these factors on demand for redistribution for other Arab countries in order to help us toexplain the results we find for Egypt. For the second part of the study concerning the effectof the Egyptian revolution on demand for redistribution in Egypt, we are relying on the datacollected for Egypt, Morocco, Jordan, Turkey for the same period.
3.2 Descriptive statistics
In tables 1, 8, 9 and 10, we represent some information about the main individual characteris-tics of the individuals in the sample before and after January 2011 for Egypt, Jordan, Turkeyand Morocco, as well as the financial situation and the attitudinal variables. In table 1, the firstthree columns refer to the period before the revolution for Egypt (at the beginning of 2008)and the three last columns refer to the period after the revolution for Egypt (14 months afterthe revolution). The last column in table 1 refers to the maximum value of the correspondentvariable, besides the binary variables the minimum value is always 1. The same design is madefor Jordan, Morocco and Turkey with different fieldwork periods. More details can be found inAppendix A.
The size of the samples is between 1000 and 1500, except the 2008 sample for Egypt which
9
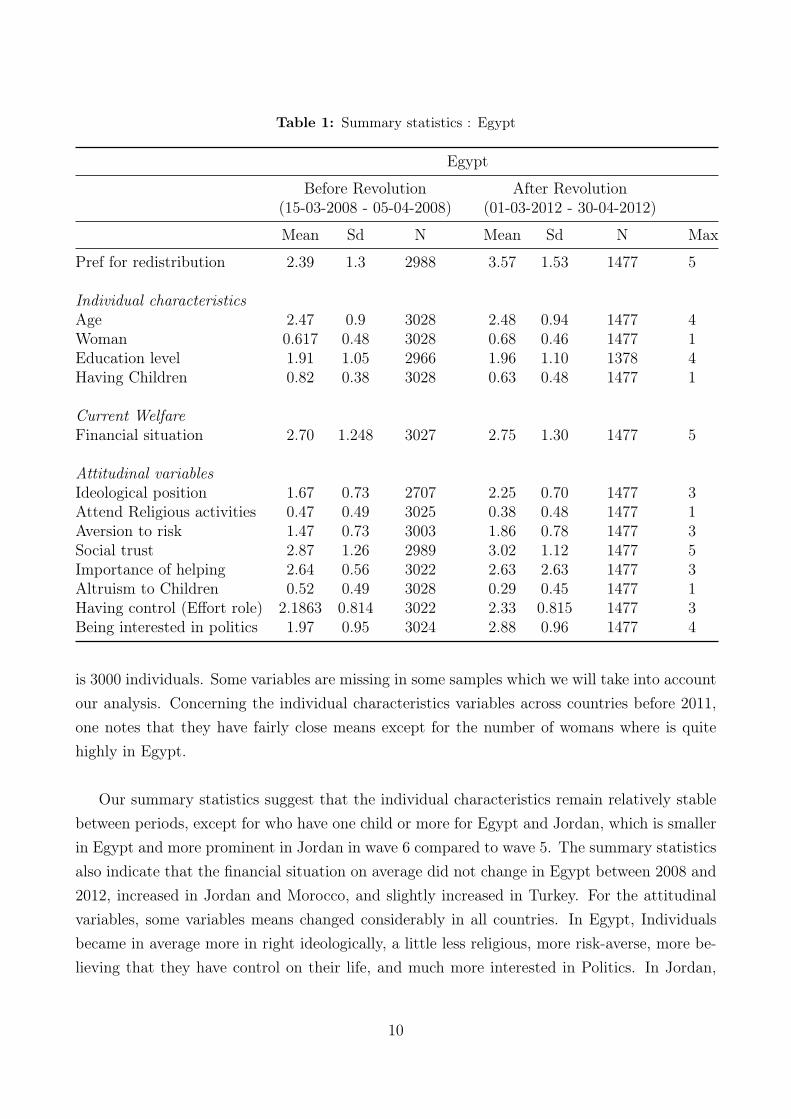
Table 1: Summary statistics : Egypt
Egypt
Before Revolution(15-03-2008 - 05-04-2008)
After Revolution(01-03-2012 - 30-04-2012)
Mean Sd N Mean Sd N Max
Pref for redistribution 2.39 1.3 2988 3.57 1.53 1477 5
Individual characteristicsAge 2.47 0.9 3028 2.48 0.94 1477 4Woman 0.617 0.48 3028 0.68 0.46 1477 1Education level 1.91 1.05 2966 1.96 1.10 1378 4Having Children 0.82 0.38 3028 0.63 0.48 1477 1
Current WelfareFinancial situation 2.70 1.248 3027 2.75 1.30 1477 5
Attitudinal variablesIdeological position 1.67 0.73 2707 2.25 0.70 1477 3Attend Religious activities 0.47 0.49 3025 0.38 0.48 1477 1Aversion to risk 1.47 0.73 3003 1.86 0.78 1477 3Social trust 2.87 1.26 2989 3.02 1.12 1477 5Importance of helping 2.64 0.56 3022 2.63 2.63 1477 3Altruism to Children 0.52 0.49 3028 0.29 0.45 1477 1Having control (Effort role) 2.1863 0.814 3022 2.33 0.815 1477 3Being interested in politics 1.97 0.95 3024 2.88 0.96 1477 4
is 3000 individuals. Some variables are missing in some samples which we will take into accountour analysis. Concerning the individual characteristics variables across countries before 2011,one notes that they have fairly close means except for the number of womans where is quitehighly in Egypt.
Our summary statistics suggest that the individual characteristics remain relatively stablebetween periods, except for who have one child or more for Egypt and Jordan, which is smallerin Egypt and more prominent in Jordan in wave 6 compared to wave 5. The summary statisticsalso indicate that the financial situation on average did not change in Egypt between 2008 and2012, increased in Jordan and Morocco, and slightly increased in Turkey. For the attitudinalvariables, some variables means changed considerably in all countries. In Egypt, Individualsbecame in average more in right ideologically, a little less religious, more risk-averse, more be-lieving that they have control on their life, and much more interested in Politics. In Jordan,
10
Individuals became on average less risk-averse, less trustful in society. In Turkey, the Individ-uals became in average more in right politically, slightly more averse to risk, more trustful insociety, more interested in politics. In Morocco, Individuals became on average more trustfulin society, less believing that they have control on their life, a little more interested in Politics.We can draw for this changes, that Egypt experienced more changes than the other countries,and especially at the level of the degree of interest in politics compared to the other countriesas we can in figures 2 and 4. The number of individuals interested in politics has increasedenormously in 2012. The different trajectories concerning the evolution of these variables inthe time, show the need to take control for these variables in the coming sections.
Table 2: Percentages of individuals who are favorable for redistribution before and after January 2011in the four countries
% Individuals favorable for redistribution
2007-2008 2011-2012
Egypt 22% 59%Jordan 25% 12%Morocco 36% 40%Turkey 49% 55%
We focus now on our explained variable, the one indicating namely the individual preferencefor redistribution. We rely on this following question in the survey: " I’d like you to tellme your views on various issues. How would you place your views on this scale? 1 meansyou agree completely with the statement on the left (Incomes should be made more equal); 10 means you agree completely with the statement on the right (We need larger incomedifferences as incentives for individual effort); and if your views fall somewhere in between,you can choose any number in between". Responses were coded on a scale of 1 through 5,with 5 representing being very favorable to the statement "Incomes should be made moreequal" (i.e. More favorable to redistribution). This variable was used many times to measuresupport for redistribution (Murthi and Tiongson, 2008; Shayo, 2009; Klor and Shayo, 2010).As we can see in Figure 1, the distribution of the individuals over the choices concerningthe demand for redistribution, changed drastically after the revolution : based on these data,21.65% of the Egyptian population was in favor of the redistribution in 2008 (responded 4or 5), this percentage rose to 59.31% in 2012. If we look at figure 3 to the evolution of thispercentage in Morocco and Turkey, we found that there was a slight increase, especially if welook to the means of this variable in these two countries. In Jordan, the mean of the demandfor redistribution decreased very slightly in 2014, even if the number of individuals declaring
11
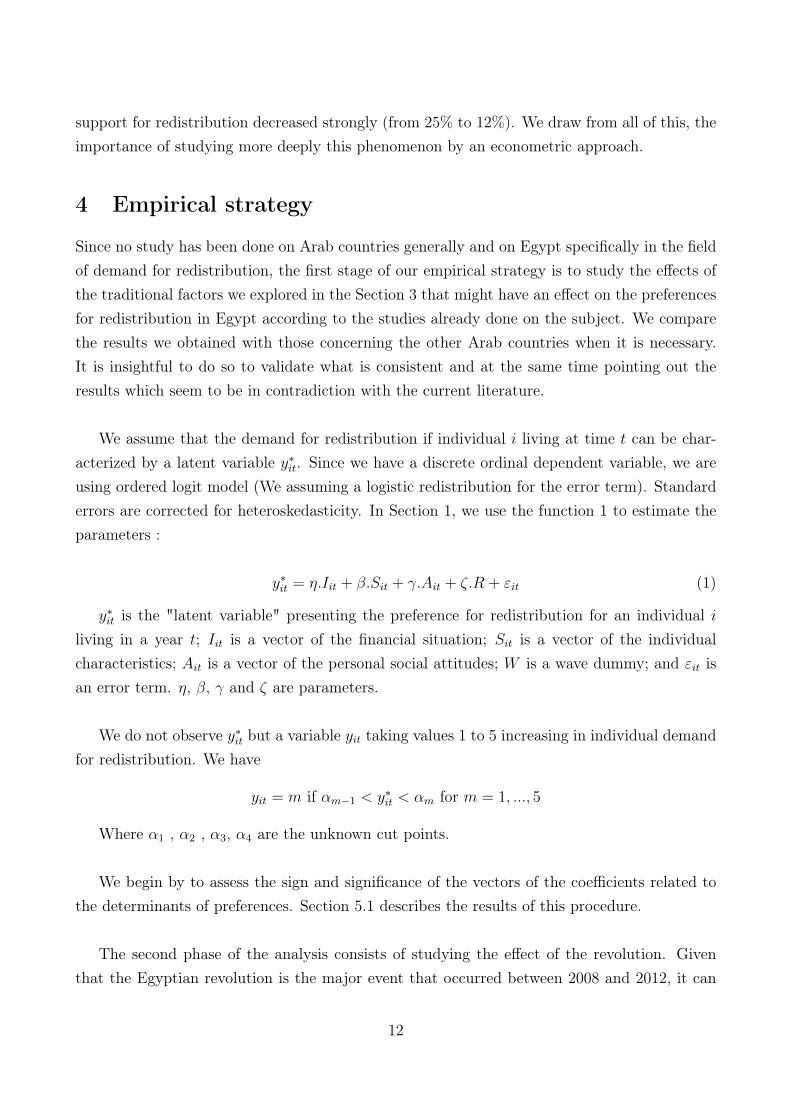
support for redistribution decreased strongly (from 25% to 12%). We draw from all of this, theimportance of studying more deeply this phenomenon by an econometric approach.
4 Empirical strategy
Since no study has been done on Arab countries generally and on Egypt specifically in the fieldof demand for redistribution, the first stage of our empirical strategy is to study the effects ofthe traditional factors we explored in the Section 3 that might have an effect on the preferencesfor redistribution in Egypt according to the studies already done on the subject. We comparethe results we obtained with those concerning the other Arab countries when it is necessary.It is insightful to do so to validate what is consistent and at the same time pointing out theresults which seem to be in contradiction with the current literature.
We assume that the demand for redistribution if individual i living at time t can be char-acterized by a latent variable y∗it. Since we have a discrete ordinal dependent variable, we areusing ordered logit model (We assuming a logistic redistribution for the error term). Standarderrors are corrected for heteroskedasticity. In Section 1, we use the function 1 to estimate theparameters :
y∗it = η.Iit + β.Sit + γ.Ait + ζ.R + εit (1)
y∗it is the "latent variable" presenting the preference for redistribution for an individual iliving in a year t; Iit is a vector of the financial situation; Sit is a vector of the individualcharacteristics; Ait is a vector of the personal social attitudes; W is a wave dummy; and εit isan error term. η, β, γ and ζ are parameters.
We do not observe y∗it but a variable yit taking values 1 to 5 increasing in individual demandfor redistribution. We have
yit = m if αm−1 < y∗it < αm for m = 1, ..., 5
Where α1 , α2 , α3, α4 are the unknown cut points.
We begin by to assess the sign and significance of the vectors of the coefficients related tothe determinants of preferences. Section 5.1 describes the results of this procedure.
The second phase of the analysis consists of studying the effect of the revolution. Giventhat the Egyptian revolution is the major event that occurred between 2008 and 2012, it can
12
be hypothesized that, at least partially, this is what the dummy year is capturing. In first weuse the function 1 to evaluate the sign and the significance of ζ the coefficient capturing theeffect of time, which is here the effect of the revolution. In second, we move to study the effectof the revolution in Egypt but this time we include a control group, which is not affected bythe revolution, and therefore make a difference in difference. In order to do this, we use the twowaves data for the four countries: Egypt, Turkey, Jordan and Morocco. To estimate the effectof the revolution on the Egyptian people in this case we use the function 2 where the demandfor redistribution of individual i living in the country c at period t can be characterized by a"latent variable" :
y∗ict = β1.Iict + β2.Sict + β3.Aict + β4.R + β5.E + β6.W.E + εict (2)
E is a country dummy equal to 1 if the individual lives in Egypt and 0 if he is living oth-erwise; W.E represents the interaction between W and E. β6 is the difference-in-differenceestimator. We conduct robustness checks using two waves before the revolution instead of 1.
Finally, we are interested in estimating the differential effect of the revolution on the differentsocio-economic and attitudinal groups in Egypt by adding the interactions between these groupsand the period dummy W. We use the function 3 :
y∗it = γ1.Iit + γ2.Sit + γ3.Ait + γ4.W + γ5W.Iit + γ6W.Sit + γ7W.Ait + εit (3)
Where γ5, γ6 and γ7 are parameters for interaction groups.
5 Results
5.1 Determinants of preferences for redistribution in Egypt
Individual characteristics
We start our analysis by examining the effect of some individual characteristics on supportfor redistribution in Egypt . In the existing literature, the older the individual is, the less heis likely to support redistribution (Alesina and La Ferrara, 2005; Alesina and Giuliano, 2009;Busemeyer, 2013). Alesina and Giuliano (2009) found an inverted U curve effect, the demandfor redistribution decline in advanced stages of the life-cycles. In the tables 12,13 and 14, wefound that the younger people are less favorable to redistribution compared to others, especiallycompared to the older individuals where the effect is significant.
13
Across regressions, we see that being female enhance the desire for redistribution which isconsistent with what can be found in the literature (Alesina and Giuliano (2009)).
For the education level, we find that being illiterate or having a very low education levelincrease the demand for redistribution compared to others (Alesina and Giuliano (2009)). Fi-nally having a child or more, yields no significant effect once controlled by the financial situation(Neher (2011)).
Financial situation
A large body of empirical evidence shows that the financial situation is one of the most im-portant determinants. The richer a person is, the more he is supposed to be favorable toredistribution (Corneo and Grüner, 2002; Guillaud, 2013). In all columns in table 12 and 13and 14 we see that individuals living in a good or very good financial situation are much lessfavorable to the redistribution compared to those living in a bad financial situation.2
Health situation
Being in bad health means more health-related expenses, and puts individuals in a risky situa-tion regarding their future. Therefore this variable can be a proxy for the risk exposure. Theseelements push individuals to be more favorable to redistribution (Olivera (2015)), which wefound in table 13 (column 1).
Ideological position
In column 2 in table 13, we add an important variable in the literature, the ideological po-sitioning (left-center-right). Being leftist enhance the demand for redistribution compared tothose being rightist even if we control it with the financial situation (Busemeyer (2013), Pittau,Farcomeni, and Zelli (2016)).
Reciprocity (Trust)
We include the variable stating if the individual thinks that the most people can be trusted asa proxy for the reciprocity attitude of the individual. Trusting others will push the individualto think that others will not take something is not their right legally and therefore being morefavorable to redistribution compared to those having the opposite attitude (Fong, 2001; Fatica,
2Variable Financial sit : the felt familial financial situation. 1: Very bad 5: Very good. We have tried twoother variables of the financial situation and we had the same results.
14
2011). The column 3 of table 13, shows that, as expected, that trusting other yields a significantand strong positive effect.
Religion
In column 4, we talk about being an active participant in religious activities. In the literature,religious people compared to others are less favorable to the redistribution, one of the expla-nations are that religious people profit more from the services provided by religious helpingnetworks (Luttmer and Singhal, 2011; Neustadt, 2011). In our study, attending religious activ-ities has the opposite effect, the coefficient is positive. One of the explanations remains in thefact that Egyptian society is a very religious one, so we do not have this community effect wecan find in the developed countries. Therefore another component of being religious appears,which is the religious education focusing on the importance of asceticism and altruism. In thiscase, we can understand why the religious persons tend to be more favorable to redistribution.One has to underline we find the same positive effect in many other Arab countries (table45,46,47) like Algeria, Iraq (significant), Bahrain, Morocco, Lebanon (significant).
Risk aversion
We also study the effect of the risk attitude, Beck (1994) run an experimental study and foundhow risk aversion can make the individual more favorable to the redistribution based on an"insurance motive". Rehm (2009) explains by an empirical study how a risky job (where thepercentage of unemployment is high) has a positive effect on the demand for redistribution,Alesina and La Ferrara (2005) use proxies like self-employment, that yields a negative effect.In this study, we use individual answers to a question that would elicit the aversion risk: "Is itimportant to this person adventure and taking risks? 1: Very much like me; 6: Not at all likeme. We re-coded it in an increasing way that 1 represents the risk-averse individuals, and the3 the risk-seeking individuals. We see in column 5 in table 13 that the coefficients are negativewhich is why it is expected, but the coefficients are insignificant. We tried to study the effectof the risk attitude by taking the institution occupation (if the individual is self-employment orworking in public sector or public sector) but only for the wave 6 since we do not have this datafor the two waves: the effect still insignificant. We explain this insignificant effect by the factthat the labor market structure is very different in Egypt compared to the developed countries,being in a public institution may do not offer the same insurance that offers the same positionin the developed countries. 3 If we look at the tables 39, 40 and 41, only in Turkey and Iranwe have a significant negative coefficient.
3, For example, a big part of the Egyptian people still lives in rural areas, where most of the jobs areconsidered as self-employment.
15
Altruism
To test the effect of altruism, we use a proxy indicates if the individual finds that the unselfish-ness is an important quality for a child, and another proxy indicates if the person thinks thatis it important to help people. In the literature, being altruistic has a positive effect Alesinaand La Ferrara (2005). We find in column 1 and 2 of table 14 that for the two proxies, beingaltruistic has a negative effect and it is very significant. The reason these variable yields theopposite effect, maybe yields in the fact that in a society like the Egyptian one, having an altru-istic attitude, reflects that this person is living in an altruistic environment where individualsare less dependent on state help. Indeed, an altruistic behavior in some societies (especiallyin a rural society like Egypt4) may reveal a closer social life, where in the case of a financialproblem, the individual will in first place ask his entourage for help. Karshenas et al. (2014)explained how in the Arab countries residual forms of social transfers based on the ethnic andreligious groups cover the needs not covered by the social state. In other countries like OECDcountries or the United-States (countries where most studies have been done), we are talkingabout different types of society where the requested help is –very often– addressed to the State.If we look to the effect of these variables in other Arab countries (tables 51,52,53,54,55 and 56),we find that the first proxy coefficient is negative and significant in Iraq, Lebanon and Tunisialike in Egypt. We found a positive significant coefficient only in Yemen and Jordan. For thesecond proxy only in Tunisia, we found a positive effect of being altruism. Which indicatesthat the explanation of this result lies in something specific to the Arab social structure.
Role of effort : Autonomy freedom
In column 4 in table 13, we add an important factor considered as one of the most influentialdeterminants of the preferences for redistribution: the belief about the role of effort and chancein determining the success in life. In literature, the more the respondent believes the effort isessential, the more he is against the redistribution compared to the respondent who believesluck is more important. It is also called the fairness attitude. The explanation behind it is thatif the effort is what determines our success in life, there is no need anymore for the incomesto be equal : if the individual is in a bad situation, then that is the result of what he sowed(Piketty, 1995; Fong, 2001; Ravallion and Lokshin, 2000) .In our study we take as a proxy forthis attitude, the following question: "How much freedom of choice and control you feel youhave over the way your life turns out". In fact, if individuals consider that they have control ontheir life, they will be more able to accept their financial situation as a result of their effort, and
456% of the population are living in rural areas.
16
then less favorable to redistribution. In the last column, we find the expected result: the effectis negative, significant and progressive. We found the same result in almost all Arab countries(table 57,58,59).
5.2 The effect of the revolution
Like we stated in the third Section, the distribution of the respondents over the demand forredistribution has changed drastically. To estimate and quantify the effect of this revolutioncorrectly, we control this effect in first for the classical determinants of demand for redistribu-tion within the Egyptian people, and in second for the effect of time that concerns the Arabworld generally. We are interested also to see if we have differential revolution effect by groupswe choose.
To estimate the effect of revolution, we estimate the effect of time, the effect of living afterJanuary 2011 (2012 for Egypt) compared to living before January 2011 (2008 for Egypt). Thevariable "After revolution" represents a dummy where after=1 if the respondent was questionedin the wave 6 and after=0 if the respondent was questioned in the wave 5.
Table 12, 13 and 14 represent the results we obtain by estimating the effect of the Egyptianrevolution on demand for redistribution in Egypt adding variables one by one. The variables weadd are the same we The baseline estimate (Column [1]), without any controls, shows that onaverage, living in 2012 is associated with a 0.296 increase in the probability of identifying as veryfavorable to redistribution and a 0.0183 decrease in identifying as very unfavorable comparedwith an individual living in 2008. This effect is still significant, very strong and having nearlythe same marginal effects after the introduction of each of the variables. We can conclude thatchanges in individual characteristics, financial situation and the attitude variables, are not ableto explain the shift in the redistributive support after the revolution.
Robustness : Diff-in-Diff analysis
Is the effect of time peculiar to Egypt to say that it was the revolution that caused this change?Or is we can find the same effect for all Arab countries? To answer this question, we rely onthe data of Egypt, Jordan, Morocco and Turkey. These countries are quite close at the politicaland economic level, which provide us a very good control group, and therefore allow us to takeinto account the parallel trend.
17
In first we run the regression following the function 1 for each of these four countries (ta-ble 15), and we calculate the marginal effects (table 16). We found that the effect of timein the other countries is very significant. However, once we look at the marginal effects, wenotice the immense difference between the values of Egypt and those of other countries. Forexample, the probability of being very favorable to redistribution in Egypt in 2008 comparedto 2012 is 26.8% higher, only 4.5% higher in Jordan, 4.3% in Morocco and 5.5% in Turkey.This means that to obtain the proper effect of the Egyptian revolution, it will be necessary toisolate the effect of time which affects all countries in consideration. These positive effects ofcoefficients of time variable indicate that there is a tendency towards more redistribution in theArab Zone. One of the explanations is that the Arab Spring has touched the majority of thecountries slightly even if there was no revolution. The second explanation is that between 2008and 2012, there was more openness to the international due to the development of the level ofeducation and access to the Internet, and then better information on the situation of inequality.
To obtain the proper effect of the revolution, we calculate the diff-in-diff estimator repre-senting the proper effect of time concerning Egypt based on the function 2. The diff-in-diffestimator is obtained by the interaction between the dummy variable equal to 1 if individuallives in Egypt and 0 otherwise and the number of the wave as we can see in table 17 and 18. Weare looking for the diff-in-diff estimators by taking each time Egypt with one of the countriesalone. Even if is the magnitude of the coefficient became smaller, as we can see in the table,the diff-in-diff estimator is very significant and remains strong in any case. In table 18, we cansee the coefficient of the diff-in-diff estimator, taking as a control group this time the threecountries together. The coefficient is very significant and big. We conclude that even if there isa part of the effect of time is unspecific to Egypt, the effect of the revolution remains very strong.
The second placebo test consists of comparing the effect of time between the waves 5 and 6to the one we obtain between the waves 4 and 5. Between 2001 and 2008, there was no revolu-tion, the expected result for the effect of time is to have a marginal effect small enough to becompared to that of the period of the revolution. We run the same regression we did (function1) for the wave 4 and 5. The coefficient is very significant: being in 2008 has a positive effect onthe support for redistribution compared to being in 2001 (Table 19). However, we calculate themarginal effects (Table 20), and we found that probabilities of being very favorable or favorablefor more redistribution are very different between those of 2008-2012 and those of 2000-2008.It is 11.6% between 2000 and 2008, and 30.3% between 2008 and 2012. While taking intoconsideration that we do not have the same duration between these periods. The probabilitiesof being very unfavorable or unfavorable for more redistribution (or more precisely favorable tothe idea we need larger income differences as incentives for individual effort) are also different
18
to those of 2008-2012. There is 18% less chance that an individual takes this position in 2008compared to 2000, this percentage is 35,5% in 2012 compared to 2008.
Heterogeneous treatment effects
In this extension we want to shed light on which groups have the most forceful response to therevolution. We test this differential effect on each one of the variables we tested. We found thatthe heterogeneous effect exists only over the financial situation groups, over the health situationgroups, and over the degree of interest in politics groups. We start by testing the effect of timeproper to Egypt (effect of revolution) on the support for redistribution over the financial situa-tion groups. In table 21 we estimate the equation (3), where we interact the financial situationindex with wave change. The analysis indicates, relative to the lowest financial situation group,that the effect of the revolution becomes smaller and smaller each time the financial situationis better.
To obtain the marginal effects concerning every financial situation group, we re-estimatethe equation (1) separately for each group. Like we find in table 22, the heterogeneity of theeffect goes in the direction of having a weaker positive effect for the higher financial situationgroup compared to the middle and the lower financial situations groups. The probability to bevery favorable increasing after the revolution by 0.349 (marginal effects) for the low financialsituation, by 0.301 for the average financial situation, and by 0.237 for the high financial sit-uation. In turn, suggesting that the revolution increased the gap in demand for redistributionacross wealth groups. One potential explanation for these heterogeneous effects could be thatthe revolution, was more concerning the low and medium category than the high category, likethe spreading of ideas about social inequality.
In column 2 in table 21, we include the interaction between the number of the wave andthe health situation. We conclude that the effect of the revolution differs significantly betweenindividuals having good health and those having bad health: the positive effect of the revolutionon demand for redistribution affected much more the people in poor health than the people ingood health. Insofar as the state of health is one of the components of well-being as the finan-cial situation, this result joined the previous one. This variable also reflects a part of the riskexposure: A lousy health exposes the individual’s future to more risk compared to healthy ones.
In table 22, we include in column 1 the interaction between the number of wage (date ofsurvey) and the categorical variable indicating the degree of interest in politics the individual
19
gives. We found that the individuals who are very interested in politics were impacted posi-tively by the revolution on those preferences for redistribution much more than individuals notinterested at all in politics. This result shows that a part of the positive revolution effect of therevolution lies in the considerable change in the new political scene after the revolution thatwe explained in Section 2. We add in column 2 in the same table the interaction between thenumber of wave and effect and the individual age group. The youngest category seems to bethe less group infected by the positive effect of the revolution on demand for redistribution,even if these coefficients are weakly significant.
After all these regressions, we can conclude that the 25 January revolution had an enormouseffect on the demand for redistribution in Egypt. Our results concerning the interactions andwhat changed as a result of the revolution can help us explain this effect. The fact that the mostunfortunate individuals were more affected than the richest prove that the new political offerwas relying effectively on what touches more this group, namely for example inequality andsocial justice. The fact that the most interested individuals in politics were the most affectedby this positive effect prove that the improvement of the freedom situation was an essential partof this positive effect: the most interested in politics benefited the most from this situation.Admittedly, these arguments cannot in themselves explain the overall effect, we still have asubstantial part not explained that we do not pretend to be able to explain it entirely.
6 Discussion
We showed in Section 5 how we managed to isolate the effect of the political and informationalfreedom change, and then emphasized the substantial positive impact of these latter on thepreferences for redistribution. The question that comes naturally is why the revolution hadthis strong effect on people’s preferences concerning redistribution? How can a change in thepolitical sphere along with an improvement of the freedom lead to enhance the support for re-distribution? By what channels (mediators) could this effect pass? Unfortunately, the limitedset of information in our database limits our ability to dig further to explain this effect, but inthe other side, many elements the literature allows us to set some assumptions in this direction.
Since the revolution is considered as a “shock” (we mean by a shock a major event thathappens all of a sudden), we look first at the literature dealing with the effects of shocks. Inthis literature the shocks (we mean by a shock a major event that happens all of a sudden)that were explored in the context of the demand for redistribution are in the vast majority eco-nomic shocks, especially the recent economic crises that have hit the European countries and
20
the United states (Margalit, 2013; Olivera, 2014; Kroeger, 2014).5 In our case, this shock doesnot seem to have economic consequences: Section 3 has established that the basic economicindicators up to the eve of the revolution were not deteriorating, and that after revolutionbased on data that we study, the composition of individuals concerning the economic situationwas the same. It is also shown in the regressions that the perception of the economic situationdid not explain this change. Once the possibility that the revolution is an economic shock hasbeen ruled out, it remains to be known what kind of shock is more like the revolution. We willuse all that we have discussed in Section 3 about the Egyptian revolution to propose our ownhypothesis on the subject.
As explained in Section 3, in first individual freedoms have undergone a major change mainlyregarding freedom of information through the evolution of the role of the Internet and the highflow of news that has been exposed to the Egyptians. The other change was at the level of po-litical life, Egyptians experienced the emergence of a new political class from elections deemedfree and with a very high participation rate. Schläpfer, Schmitt, and Roschewitz (2008) showedhow the preferences of citizens could be influenced by political institutions and especially byparty programs, Ford (2016) explains in turn how moral narratives adopted by political andmedia elites can manipulate the individual perceptions about welfare. We then have a peopleafter the revolution that is very interested in politics, which is facing a new political discourseinspired by the revolution whose term of social justice was one of the central themes, and whichhas new sources of information. All of this leads us to believe that the shock that the revolu-tion caused was an "information" shock that largely targets the economic reality of the country.
In fact, Individual perceptions of the personal or general economic situation may be sub-ject to many misconceptions. Hauser and Norton (2017) and Kuziemko, Norton, Saez, andStantcheva (2015) showed that it exists a substantial difference between the actual levels of in-equality and the person’s (mis)perception of those levels. The individual’s perceptions of theirequality of opportunity or the future income can also be different from the objective measures(Alesina and La Ferrara (2005)). Fulfilling this gaps may lead to a correction of the demandfor redistribution attitude: Cruces, Perez-Truglia, and Tetaz (2013) and Karadja, Mollerstrom,and Seim (2017) provide evidence on the significant biases in individuals’ evaluations of theirrelative position in the income distribution and showed how individuals modify their prefer-ences as soon as they have the right information. Kuziemko et al. (2015) found a significantbut weak effect on the individuals’ preferences when they learn the actual level of inequality.Cruces et al. (2013) found that this perception is a statistical inference problem, a reference
5We can find Dahlberg et al. (2012) who studied the effect of the large immigration on the support forredistribution considered then as a "social" shock.
21
group bias. Diermeier, Goecke, Niehues, and Thomas (2017) showed that one of the mispercep-tions of the level of inequality sources was the media coverage on the perceptions of the levelof inequality not only between Egyptians themselves but compared to the rest of the world.6
In Egypt, it can be supposed that the shock of information allowed the people to have morecorrect information about their income position and the level of inequality. A change of thegroup inference or a different media coverage can be the source of these perceptions changes.The unique prove in our study is - as we showed in the heterogeneous effect section - that thepeople most interested in politics were more concerned about the positive effect of the revolutionon people’s preferences, which means the new political environment is a part of the explanation.
Other kinds of information different than those cited in the literature may also have aneffect on individuals’ preferences for redistribution. One element that is thought to be inter-esting and which is induced by the new political discourse is the development of the politicalculture on the question of the distributive role of the state. In developed countries where mostof the literature on the demand for redistribution has been made, it is implicitly assumed thatindividuals are aware of all the options available to them, including the option of reducinginequalities through a redistribution of the state from the rich to the poor. Difficult access toinformation and a repressive political system for decades, as was the case for Egypt, and formany other countries in the Middle East, may have the consequence of plunging the countryinto a position of ignorance, even of the most fundamental rights. This situation can imposeincomplete preferences, or a bounded rationality, in the sense that the set of choices is morelimited compared to a more democratic society.7 The revolution then allowed people to opentheir eyes to new possibilities such as improving the economic situation through less inequality.
7 Conclusion
This document addresses two important issues: the determinants of the support for redistri-bution in Egypt, and the effect of the Egyptian revolution occurred in 2011 on this support.In the first part of the results Section, although many of the factors have the expected effectson demand for redistribution, including the financial situation, some factors stand out. Beingricher, more educated, young, in a bad health, in left decrease the individual demand for redis-tribution. Attend religious activities enhance the individual support for redistribution contraryto the classical finding in the literature. An another surprisingly result is the negative effect of
6A big shift in the "reference point" as has been explained by Charité, Fisman, and Kuziemko (2015).7Hong, Ding, and Yao (2015) showed how unfounded beliefs or the erroneous processing of information could
generate the "irrationality" of individual social welfare preferences
22
having an altruistic attitude. Our explanations for these results put the accent on the specificcultural and social structure of the Egyptian society specially and the Arab one more generally.The strong presence of religion and the sustenance of alternative forms of social transfers seemto weigh on the formation of individual attitudes.
The second part of the results deals with the effect of time between 2008 and 2012. Sincethe only major event happened between these years was the Egyptian revolution, we supposethat the effect of time controlled by the appropriate factors is the effect of the revolution. TheEgyptian revolution is not only the event itself but all the consequences that followed. Thisstudy provides compelling evidence of the substantial positive impact of the revolution on in-dividuals’ preferences for redistribution. It has been shown that none of the factors consideredas determinants of redistribution preference can explain this time effect. A diff-in-diff analysisalso showed that this effect persists even if we control it with the effect of time proper to thecountries we take into account (Jordan, Morocco and Turkey). We also showed that even ifa positive trend existed between 2000 and 2008, the marginal effects are much smaller thanthe ones we obtained for the revolution period. This positive effect was mostly homogeneousbetween the different individuals, except for those who differ in their financial situation andtheir degree of interest in politics : Individuals who feel financially challenged, and who are veryinterested in politics have seen their support for redistribution increase more sharply comparedrespectively to those in a more comfortable financial situation and the individuals who are notinterested at all in politics.
The limits of this study are numerous. The first one is the difficulty of analyzing a rathercomplex and multidimensional phenomenon that a revolution. We do not pretend to be ableto explain everything, we are just interested in a part that we consider to be important inthe process. The second is the control group with which Egypt is compared. Although thereare significant similarities between the countries chosen at the political and economic levels,the trends over time were not the same, and several non-measurable differences can be hiddenplaying a role in the evolution of preferences. The third limitation concerns the limited numberof variables available to explain the preference of the individual. Further information on theindividuals such as their entourage for example, or their attitudes as well as their perceptionsof social inequalities and mobility will have been very useful. The fourth limitation is the lackof documentation that can help us build the foundation of our assumptions presented aboutthe mechanisms generating the redistribution attitude evolution as a result of the political andinformational change.
Our work opens a big door for studying the preferences for redistributions intensely for the
23
Arab countries: shedding light on the specificities of this environment, especially on all whatcan be related to the social transfer and religion. In this paper, we limited our analysis on theessential of this topic, but much more can be done. Our study also draws the attention to theimportance of the level of freedom and the political institutions on the formation of individualssupport for redistribution. This theme is gaining in importance since the deteriorating of thestate of democracy in the world as mentioned in the report named "Democracy in crisis" byFreedom House (2018). The factor of freedom – in the broader sense of the term – is until nowvery little exploited concerning its effect on the individual’s preferences for the redistribution.
References
Facundo Alvaredo, Lucas Chancel, Thomas Piketty, Emmanuel Saez, and Gabriel Zucman.World inequality report 2018. Belknap Press of Harvard University Press, 2018.
Christina Fong. Social preferences, self-interest, and the demand for redistribution. Journal ofPublic economics, 82(2):225–246, 2001.
Giacomo Corneo and Hans Peter Grüner. Individual preferences for political redistribution.Journal of public Economics, 83(1):83–107, 2002.
Alberto F Alesina and Paola Giuliano. Preferences for redistribution. Technical report, NationalBureau of Economic Research, 2009.
Daron Acemoglu, Suresh Naidu, Pascual Restrepo, and James A Robinson. Democracy, redis-tribution, and inequality. In Handbook of income distribution, volume 2, pages 1885–1966.Elsevier, 2015.
Felix Schläpfer, Marcel Schmitt, and Anna Roschewitz. Competitive politics, simplified heuris-tics, and preferences for public goods. Ecological economics, 65(3):574–589, 2008.
Will Kymlicka. Dworkin on freedom and culture. Wiley Online Library, 2004.
Javier Olivera. Preferences for redistribution after the economic crisis. Economics and BusinessLetters, 3(3):137–145, 2014.
Philipp Kroeger. Demand for redistribution in the wake of the economic crisis. Economics andBusiness Letters, 3(3):156–165, 2014.
Yotam Margalit. Explaining social policy preferences: Evidence from the great recession. Amer-ican Political Science Review, 107(1):80–103, 2013.
24
Matz Dahlberg, Karin Edmark, and Heléne Lundqvist. Ethnic diversity and preferences forredistribution. Journal of Political Economy, 120(1):41–76, 2012.
Eric Brunner, Stephen L Ross, and Ebonya Washington. Economics and policy preferences:causal evidence of the impact of economic conditions on support for redistribution and otherballot proposals. Review of Economics and Statistics, 93(3):888–906, 2011.
Freedom House. Freedom in the world 2018. democracy in crisis. Freedom House, 2018.
Ibrahim Elbadawi and Samir Makdisi. Democracy in the Arab world: explaining the deficit.Routledge, 2010.
Andrea Teti, Pamela Abbott, and Francesco Cavatorta. The Arab Uprisings in Egypt, Jordanand Tunisia: Social, Political and Economic Transformations. Springer, 2017.
Massoud Karshenas, Valentine M Moghadam, and Randa Alami. Social policy after the arabspring: States and social rights in the mena region. World Development, 64:726–739, 2014.
Azmi Bishara. Being arab in nowdays. 2009.
Jason Brownlee, Tarek E Masoud, and Andrew Reynolds. The Arab Spring: Pathways ofRepression and Reform. Oxford University Press, 2015.
The World Bank. Gdp growth egypt between 2001 and 2016. https://data.worldbank.
org/indicator/NY.GDP.MKTP.KD.ZG?end=2016&locations=EG&start=2001, 2018. [Online;accessed 23-July-2018].
Prof Abdou, Doaa Salman, and Zeinab Zaazou. The egyptian revolution and post socio-economic impact. 2013.
Matthew Costello, J Craig Jenkins, and Hassan Aly. Bread, justice, or opportunity? thedeterminants of the arab awakening protests. World Development, 67:90–100, 2015.
Amnesty international. Egypt : Abuses under state of emergency. http://archive.is/91ixu#selection-391.0-391.38, 2011. [Online; accessed 23-July-2018].
Noha El-Mikawy. The building of consensus in Egypt’s transition process. American Univ inCairo Press, 1999.
Dalia Othman. State of emergency ends, military council says will not renew. http://www.
egyptindependent.com/military-council-says-no-extension-emergency-law/, 2012.[Online; accessed 23-July-2018].
25
Freedom house. Freedom situation in egypt in 2008. https://freedomhouse.org/report/
freedom-world/2008/egypt, 2008.
Freedom house. Freedom situation in egypt in 2009. https://freedomhouse.org/report/
freedom-world/2009/egypt, 2009.
Freedom house. Freedom situation in egypt in 2010. https://freedomhouse.org/report/
freedom-world/2010/egypt, 2010.
Hamid Dabashi. The Arab Spring: the end of postcolonialism. Zed Books Ltd., 2012.
Shibley Telhami. The world through Arab eyes: Arab public opinion and the reshaping of theMiddle East. Basic Books (AZ), 2013.
Ian Vasquez and Tanja Porcnik. The Human Freedom Index 2016: A Global Measurement ofPersonal, Civil, and Economic Freedom. Cato Institute, 2016.
Racha Mourtada and Fadi Salem. Civil movements: The impact of facebook and twitter. ArabSocial Media Report, 1(2):1–30, 2011.
Gadi Wolfsfeld, Elad Segev, and Tamir Sheafer. Social media and the arab spring: Politicscomes first. The International Journal of Press/Politics, 18(2):115–137, 2013.
Gilad Lotan, Erhardt Graeff, Mike Ananny, Devin Gaffney, Ian Pearce, et al. The arab spring|the revolutions were tweeted: Information flows during the 2011 tunisian and egyptian rev-olutions. International journal of communication, 5:31, 2011.
Ekaterina Stepanova. The role of information communication technologies in the “arab spring”.Ponars Eurasia, 15:1–6, 2011.
Philip N Howard, Aiden Duffy, Deen Freelon, Muzammil M Hussain, Will Mari, and MarwaMaziad. Opening closed regimes: what was the role of social media during the arab spring?2011.
M Murthi and ER Tiongson. Attitudes to equality: the ‘socialist legacy’revisited policy. WorldBank Research Working Paper, 4529, 2008.
Moses Shayo. A model of social identity with an application to political economy: Nation,class, and redistribution. American Political Science Review, 103(2):147–174, 2009.
Esteban F Klor and Moses Shayo. Social identity and preferences over redistribution. Journalof Public Economics, 94(3):269–278, 2010.
26
Alberto Alesina and Eliana La Ferrara. Preferences for redistribution in the land of opportu-nities. Journal of public Economics, 89(5):897–931, 2005.
Marius R Busemeyer. Education funding and individual preferences for redistribution. EuropeanSociological Review, 29(6):1122–1133, 2013.
Frank Neher. Preferences for redistribution across the world. School of Business & EconomicsDiscussion Paper: Economics, (2012/2), 2011.
Elvire Guillaud. Preferences for redistribution: an empirical analysis over 33 countries. TheJournal of Economic Inequality, 11(1):57–78, 2013.
Javier Olivera. Preferences for redistribution in europe. IZA Journal of European Labor Studies,4(1):14, 2015.
Maria Grazia Pittau, Alessio Farcomeni, and Roberto Zelli. Has the attitude of us citizenstowards redistribution changed over time? Economic Modelling, 52:714–724, 2016.
Serena Fatica. Preferences for redistribution, the size of government and the tax system. 2011.
Erzo FP Luttmer and Monica Singhal. Culture, context, and the taste for redistribution.American Economic Journal: Economic Policy, 3(1):157–179, 2011.
Ilja Neustadt. Do religious beliefs explain preferences for income redistribution? experimentalevidence. CESifo Economic Studies, 57(4):623–652, 2011.
John H Beck. An experimental test of preferences for the distribution of income and individualrisk aversion. Eastern Economic Journal, 20(2):131–145, 1994.
Philipp Rehm. Risks and redistribution: An individual-level analysis. Comparative politicalstudies, 42(7):855–881, 2009.
Thomas Piketty. Social mobility and redistributive politics. The Quarterly journal of economics,110(3):551–584, 1995.
Martin Ravallion and Michael Lokshin. Who wants to redistribute?: The tunnel effect in 1990srussia. Journal of public Economics, 76(1):87–104, 2000.
Robert Ford. Who should we help? an experimental test of discrimination in the british welfarestate. Political Studies, 64(3):630–650, 2016.
Oliver P Hauser and Michael I Norton. (mis) perceptions of inequality. Current opinion inpsychology, 18:21–25, 2017.
27
Ilyana Kuziemko, Michael I Norton, Emmanuel Saez, and Stefanie Stantcheva. How elastic arepreferences for redistribution? evidence from randomized survey experiments. The AmericanEconomic Review, 105(4):1478–1508, 2015.
Guillermo Cruces, Ricardo Perez-Truglia, and Martin Tetaz. Biased perceptions of incomedistribution and preferences for redistribution: Evidence from a survey experiment. Journalof Public Economics, 98:100–112, 2013.
Mounir Karadja, Johanna Mollerstrom, and David Seim. Richer (and holier) than thou? theeffect of relative income improvements on demand for redistribution. Review of Economicsand Statistics, 2017.
Matthias Diermeier, Henry Goecke, Judith Niehues, and Tobias Thomas. Impact of inequality-related media coverage on the concerns of the citzens. Number 258. DICE Discussion Paper,2017.
Jimmy Charité, Raymond Fisman, and Ilyana Kuziemko. Reference points and redistribu-tive preferences: Experimental evidence. Technical report, National Bureau of EconomicResearch, 2015.
Hao Hong, Jianfeng Ding, and Yang Yao. Individual social welfare preferences: An experimentalstudy. Journal of Behavioral and Experimental Economics, 57:89–97, 2015.
28
Appendix 1: Description of variables
The following is a list of the variables we use and their sources, followed by summary statistics.Unless otherwise stated, the source of a variable is author’s calculation on WVS data.
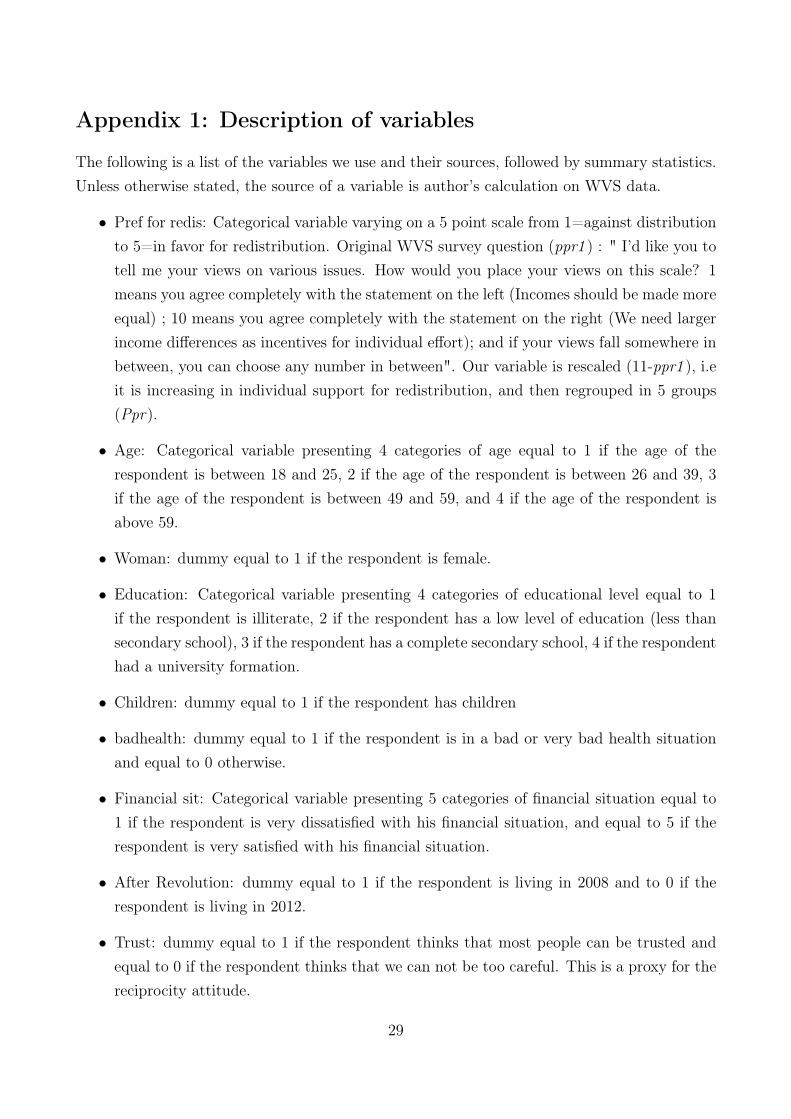
• Pref for redis: Categorical variable varying on a 5 point scale from 1=against distributionto 5=in favor for redistribution. Original WVS survey question (ppr1 ) : " I’d like you totell me your views on various issues. How would you place your views on this scale? 1means you agree completely with the statement on the left (Incomes should be made moreequal) ; 10 means you agree completely with the statement on the right (We need largerincome differences as incentives for individual effort); and if your views fall somewhere inbetween, you can choose any number in between". Our variable is rescaled (11-ppr1 ), i.eit is increasing in individual support for redistribution, and then regrouped in 5 groups(Ppr).
• Age: Categorical variable presenting 4 categories of age equal to 1 if the age of therespondent is between 18 and 25, 2 if the age of the respondent is between 26 and 39, 3if the age of the respondent is between 49 and 59, and 4 if the age of the respondent isabove 59.
• Woman: dummy equal to 1 if the respondent is female.
• Education: Categorical variable presenting 4 categories of educational level equal to 1if the respondent is illiterate, 2 if the respondent has a low level of education (less thansecondary school), 3 if the respondent has a complete secondary school, 4 if the respondenthad a university formation.
• Children: dummy equal to 1 if the respondent has children
• badhealth: dummy equal to 1 if the respondent is in a bad or very bad health situationand equal to 0 otherwise.
• Financial sit: Categorical variable presenting 5 categories of financial situation equal to1 if the respondent is very dissatisfied with his financial situation, and equal to 5 if therespondent is very satisfied with his financial situation.
• After Revolution: dummy equal to 1 if the respondent is living in 2008 and to 0 if therespondent is living in 2012.
• Trust: dummy equal to 1 if the respondent thinks that most people can be trusted andequal to 0 if the respondent thinks that we can not be too careful. This is a proxy for thereciprocity attitude.
29
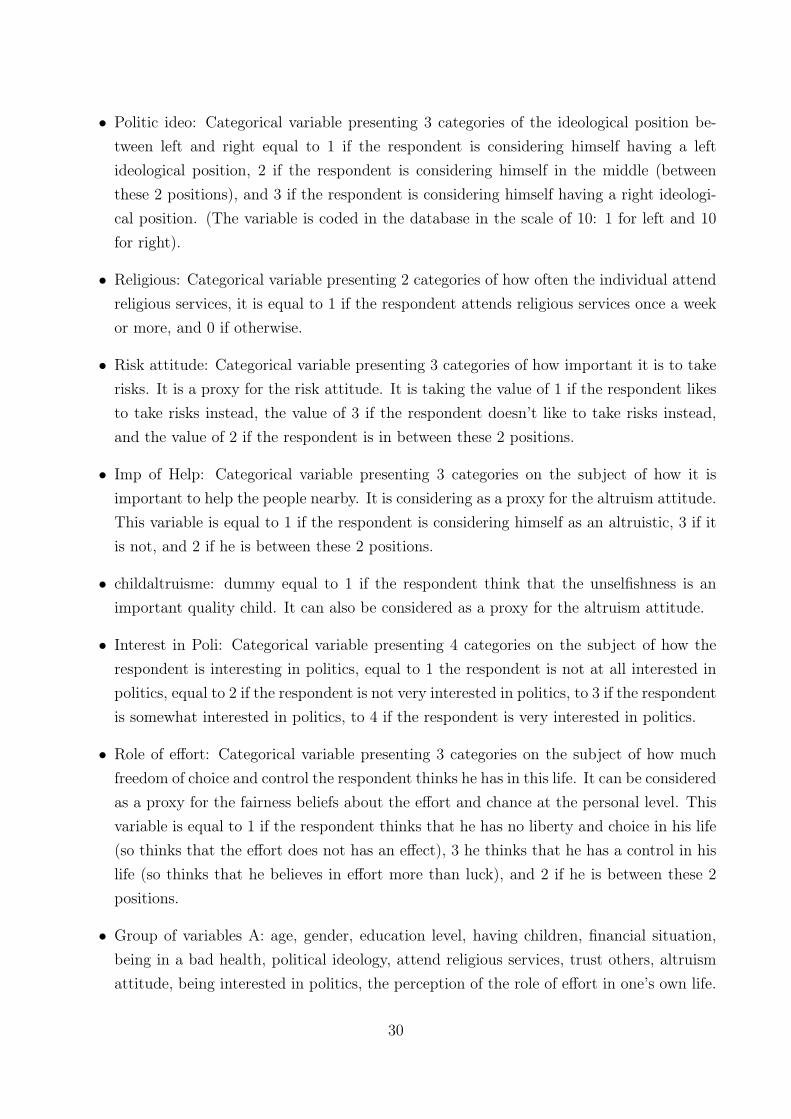
• Politic ideo: Categorical variable presenting 3 categories of the ideological position be-tween left and right equal to 1 if the respondent is considering himself having a leftideological position, 2 if the respondent is considering himself in the middle (betweenthese 2 positions), and 3 if the respondent is considering himself having a right ideologi-cal position. (The variable is coded in the database in the scale of 10: 1 for left and 10for right).
• Religious: Categorical variable presenting 2 categories of how often the individual attendreligious services, it is equal to 1 if the respondent attends religious services once a weekor more, and 0 if otherwise.
• Risk attitude: Categorical variable presenting 3 categories of how important it is to takerisks. It is a proxy for the risk attitude. It is taking the value of 1 if the respondent likesto take risks instead, the value of 3 if the respondent doesn’t like to take risks instead,and the value of 2 if the respondent is in between these 2 positions.
• Imp of Help: Categorical variable presenting 3 categories on the subject of how it isimportant to help the people nearby. It is considering as a proxy for the altruism attitude.This variable is equal to 1 if the respondent is considering himself as an altruistic, 3 if itis not, and 2 if he is between these 2 positions.
• childaltruisme: dummy equal to 1 if the respondent think that the unselfishness is animportant quality child. It can also be considered as a proxy for the altruism attitude.
• Interest in Poli: Categorical variable presenting 4 categories on the subject of how therespondent is interesting in politics, equal to 1 the respondent is not at all interested inpolitics, equal to 2 if the respondent is not very interested in politics, to 3 if the respondentis somewhat interested in politics, to 4 if the respondent is very interested in politics.
• Role of effort: Categorical variable presenting 3 categories on the subject of how muchfreedom of choice and control the respondent thinks he has in this life. It can be consideredas a proxy for the fairness beliefs about the effort and chance at the personal level. Thisvariable is equal to 1 if the respondent thinks that he has no liberty and choice in his life(so thinks that the effort does not has an effect), 3 he thinks that he has a control in hislife (so thinks that he believes in effort more than luck), and 2 if he is between these 2positions.
• Group of variables A: age, gender, education level, having children, financial situation,being in a bad health, political ideology, attend religious services, trust others, altruismattitude, being interested in politics, the perception of the role of effort in one’s own life.
30

• Group of variables B: age, gender, education level, having children and financial situation.
• Group of variables C: Age, Woman, Children, Finan sit, badhealth, trust people, childal-truisme, Interest in Poli and Role of effort..
31
Appendix 2 : Informations concerning the Freedom, political and eco-
nomic situations in Egypt
Table 3: Some components of freedom situation in Egypt between 2008 and 2012
Freedom in Egypt 2008 2009 2011 2012
1. Association, Assembly & Civil Society 3.6 3.6 5.8 5.8i. Freedom of Association 2.5 2.5 5.0 5.0ii. Freedom of Assembly and Demonstration 2.5 2.5 7.5 7.5iii. Autonomy of Organisations 4.4 4.4 4.2 4.2iv. Freedom to Establish Organisations 5.0 5.0 6.7 6.7
2. Expression & Information 5.6 5.6 6.3 6.3i. Press kilings 10.0 10.0 7.5 8.8ii. Laws and regulation that influence media content 3.0 3.0 3.3 2.7iii. Political pressures and controls on media content 4.8 4.8 4.5 4.0iv. Freedom of access to Foreign information 6.7 6.7 8.8 4.0v. State control over internet access 3.3 3.3 7.5 7.5Source : The Human Freedom Index (HFI) Egypt (2016 report).
Table 4: Some economic indicators for Egypt between 2004 and 2012
Indicators 2004 2005 2006 2007 2008 2009 2010 2011 2012
GDP Growth (%) 4.09 4.47 6.85 7.09 7.15 4.67 5.14 1.78 2.16Gini indicator 31.9 - - - 31.5 - 31.5 - 31.5HDI - 0.64 0.65 0.65 0.66 0.67 0.68 0.68 0.68
Table 5: Voter turnout for some elections in Egypt between 2005 and 2012
Elections 2005 2010 2011 2012
Presidential 22.95% - - 51.85%Parlimentary 28.13% 27.47% 62.04% -
32
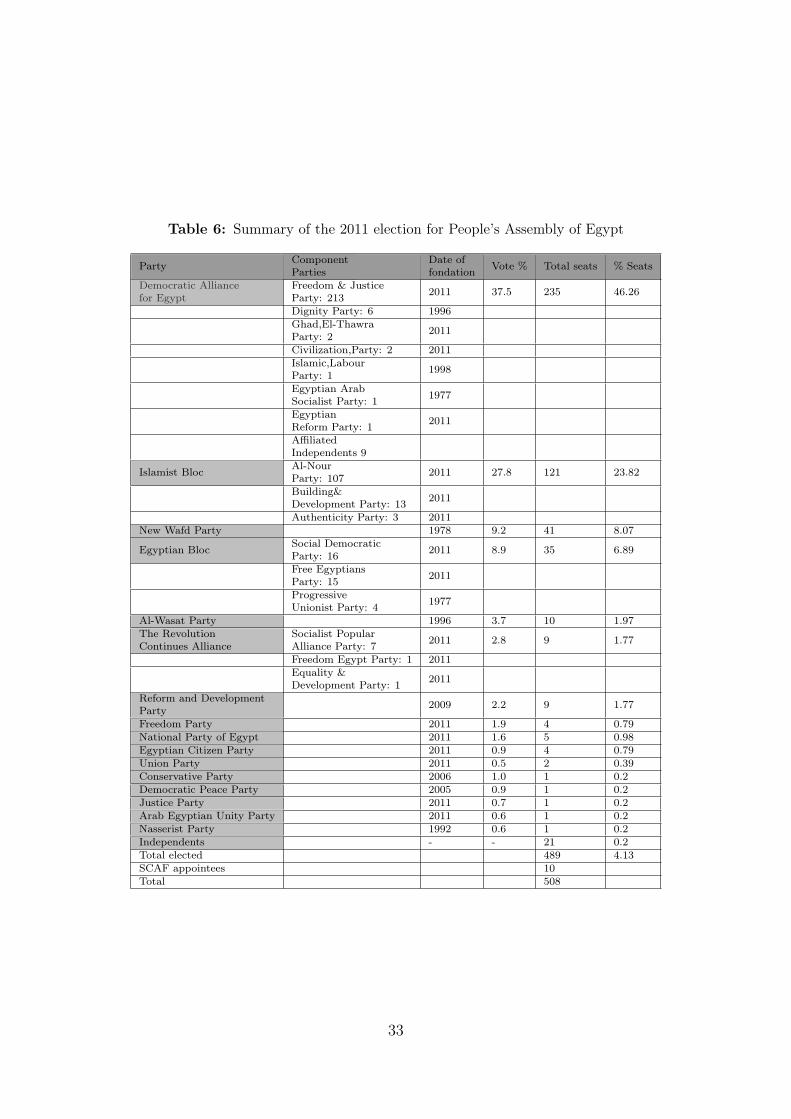
Table 6: Summary of the 2011 election for People’s Assembly of Egypt
Party ComponentParties
Date offondation Vote % Total seats % Seats
Democratic Alliancefor Egypt
Freedom & JusticeParty: 213 2011 37.5 235 46.26
Dignity Party: 6 1996Ghad,El-ThawraParty: 2 2011
Civilization,Party: 2 2011Islamic,LabourParty: 1 1998
Egyptian ArabSocialist Party: 1 1977
EgyptianReform Party: 1 2011
AffiliatedIndependents 9
Islamist Bloc Al-NourParty: 107 2011 27.8 121 23.82
Building&Development Party: 13 2011
Authenticity Party: 3 2011New Wafd Party 1978 9.2 41 8.07
Egyptian Bloc Social DemocraticParty: 16 2011 8.9 35 6.89
Free EgyptiansParty: 15 2011
ProgressiveUnionist Party: 4 1977
Al-Wasat Party 1996 3.7 10 1.97The RevolutionContinues Alliance
Socialist PopularAlliance Party: 7 2011 2.8 9 1.77
Freedom Egypt Party: 1 2011Equality &Development Party: 1 2011
Reform and DevelopmentParty 2009 2.2 9 1.77
Freedom Party 2011 1.9 4 0.79National Party of Egypt 2011 1.6 5 0.98Egyptian Citizen Party 2011 0.9 4 0.79Union Party 2011 0.5 2 0.39Conservative Party 2006 1.0 1 0.2Democratic Peace Party 2005 0.9 1 0.2Justice Party 2011 0.7 1 0.2Arab Egyptian Unity Party 2011 0.6 1 0.2Nasserist Party 1992 0.6 1 0.2Independents - - 21 0.2Total elected 489 4.13SCAF appointees 10Total 508
33
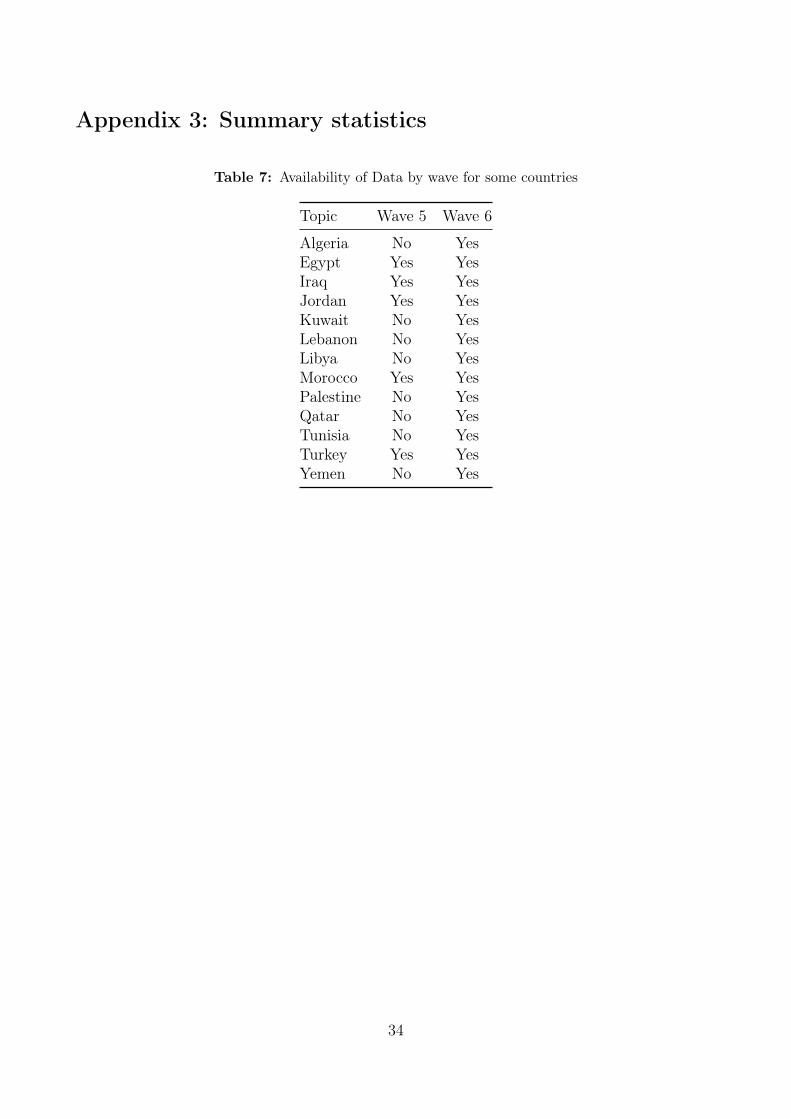
Appendix 3: Summary statistics
Table 7: Availability of Data by wave for some countries
Topic Wave 5 Wave 6
Algeria No YesEgypt Yes YesIraq Yes YesJordan Yes YesKuwait No YesLebanon No YesLibya No YesMorocco Yes YesPalestine No YesQatar No YesTunisia No YesTurkey Yes YesYemen No Yes
34

Table 8: Summary statistics : Jordan
Jordan
Before Revolution(01-05-2007 - 30-06-2007)
After Revolution(19-02-2014 - 01-03-2014)
Mean Sd N Mean Sd N Max
Pref for redistribution 2.27 1.62 1101 2.19 1.15 1127 5
Individual characteristicsAge 2.28 0.9 1159 2.44 0.92 1130 4Woman 0.51 0.5 1159 0.51 0.49 1130 1Education level 2.37 1.07 1067 2.16 1.12 1120 4Having Children 0.68 0.46 1159 0.76 0.42 1128 1
Current WelfareFinancial situation 3.44 1.3 1149 2.93 1.15 1130 5
Attitudinal variablesIdeological position 2.06 0.845 318 - - - 3Attend Religious activities - - - 0.52 0.49 1130 1Aversion to risque 2.41 0.63 1122 1.94 0.87 1125 3Social trust 3.44 1.57 1141 3.02 1.48 1125 5Importance of helping 2.86 0.35 1132 2.78 0.46 1125 3Altruism to Children 0.55 0.49 1159 0.36 0.48 1130 1Having control (Effort role) 2.61 0.68 1148 2.58 0.64 1130 3Being interested in politics 2.18 0.98 1151 2.14 0.96 1130 4
35
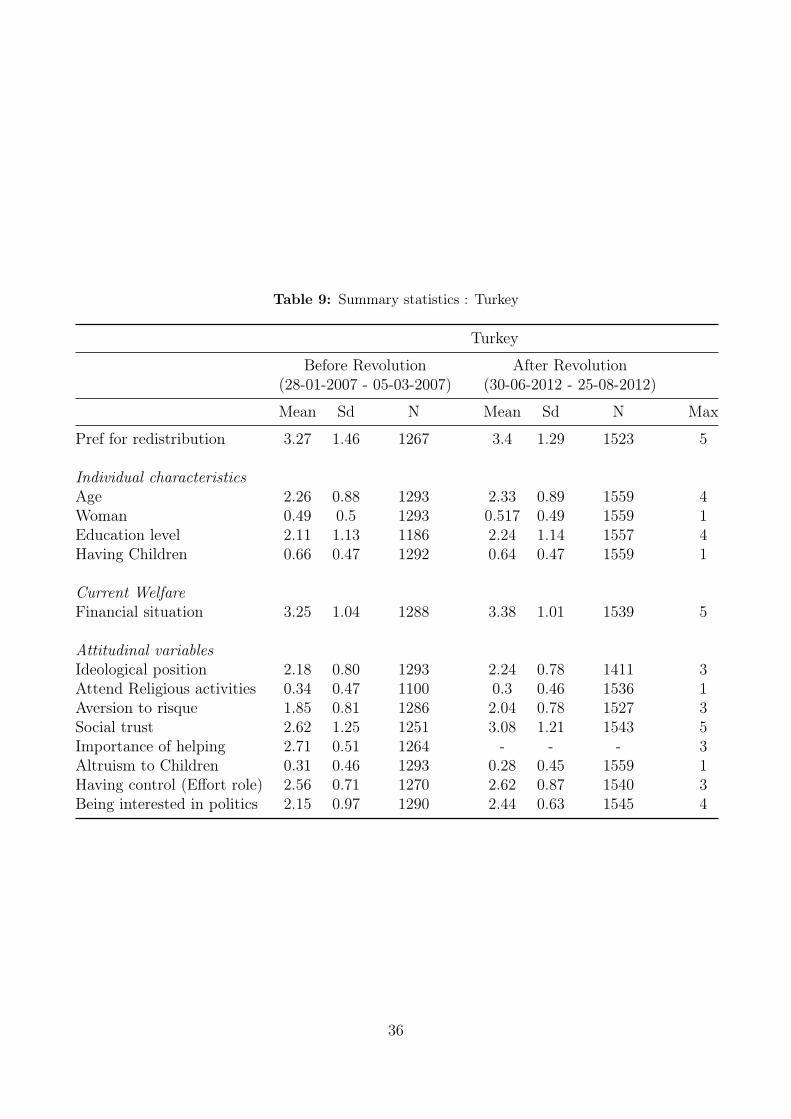
Table 9: Summary statistics : Turkey
Turkey
Before Revolution(28-01-2007 - 05-03-2007)
After Revolution(30-06-2012 - 25-08-2012)
Mean Sd N Mean Sd N Max
Pref for redistribution 3.27 1.46 1267 3.4 1.29 1523 5
Individual characteristicsAge 2.26 0.88 1293 2.33 0.89 1559 4Woman 0.49 0.5 1293 0.517 0.49 1559 1Education level 2.11 1.13 1186 2.24 1.14 1557 4Having Children 0.66 0.47 1292 0.64 0.47 1559 1
Current WelfareFinancial situation 3.25 1.04 1288 3.38 1.01 1539 5
Attitudinal variablesIdeological position 2.18 0.80 1293 2.24 0.78 1411 3Attend Religious activities 0.34 0.47 1100 0.3 0.46 1536 1Aversion to risque 1.85 0.81 1286 2.04 0.78 1527 3Social trust 2.62 1.25 1251 3.08 1.21 1543 5Importance of helping 2.71 0.51 1264 - - - 3Altruism to Children 0.31 0.46 1293 0.28 0.45 1559 1Having control (Effort role) 2.56 0.71 1270 2.62 0.87 1540 3Being interested in politics 2.15 0.97 1290 2.44 0.63 1545 4
36
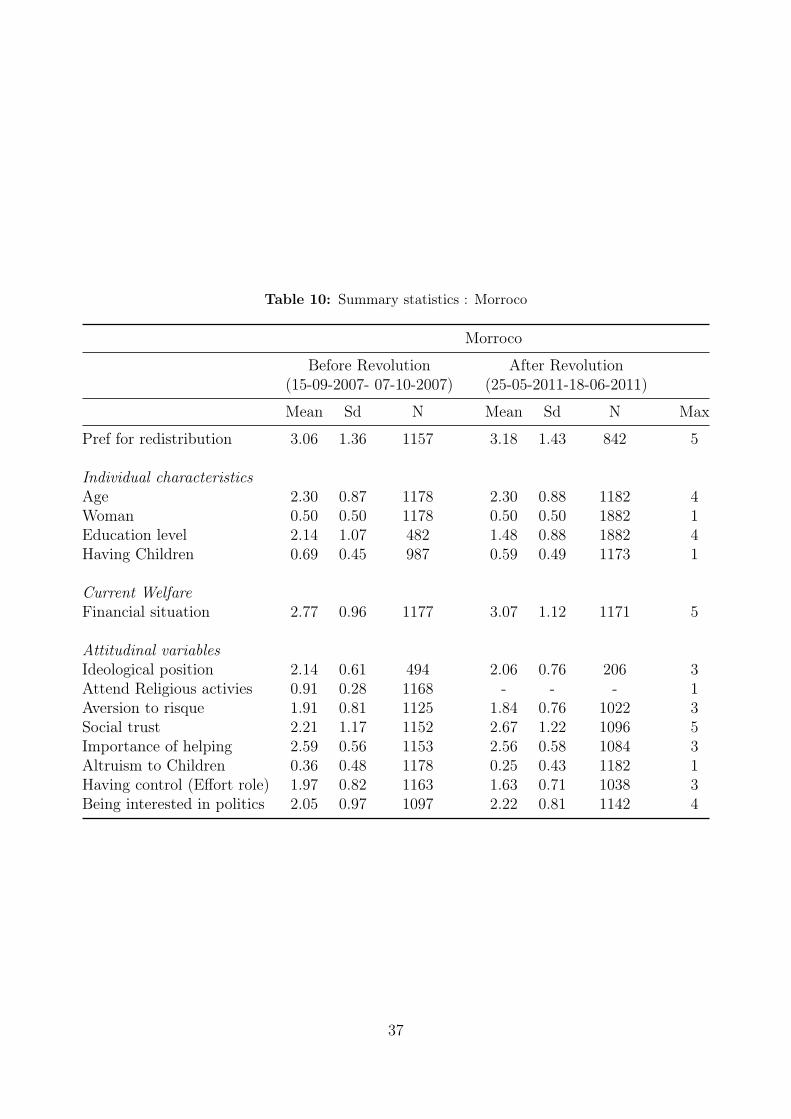
Table 10: Summary statistics : Morroco
Morroco
Before Revolution(15-09-2007- 07-10-2007)
After Revolution(25-05-2011-18-06-2011)
Mean Sd N Mean Sd N Max
Pref for redistribution 3.06 1.36 1157 3.18 1.43 842 5
Individual characteristicsAge 2.30 0.87 1178 2.30 0.88 1182 4Woman 0.50 0.50 1178 0.50 0.50 1882 1Education level 2.14 1.07 482 1.48 0.88 1882 4Having Children 0.69 0.45 987 0.59 0.49 1173 1
Current WelfareFinancial situation 2.77 0.96 1177 3.07 1.12 1171 5
Attitudinal variablesIdeological position 2.14 0.61 494 2.06 0.76 206 3Attend Religious activies 0.91 0.28 1168 - - - 1Aversion to risque 1.91 0.81 1125 1.84 0.76 1022 3Social trust 2.21 1.17 1152 2.67 1.22 1096 5Importance of helping 2.59 0.56 1153 2.56 0.58 1084 3Altruism to Children 0.36 0.48 1178 0.25 0.43 1182 1Having control (Effort role) 1.97 0.82 1163 1.63 0.71 1038 3Being interested in politics 2.05 0.97 1097 2.22 0.81 1142 4
37
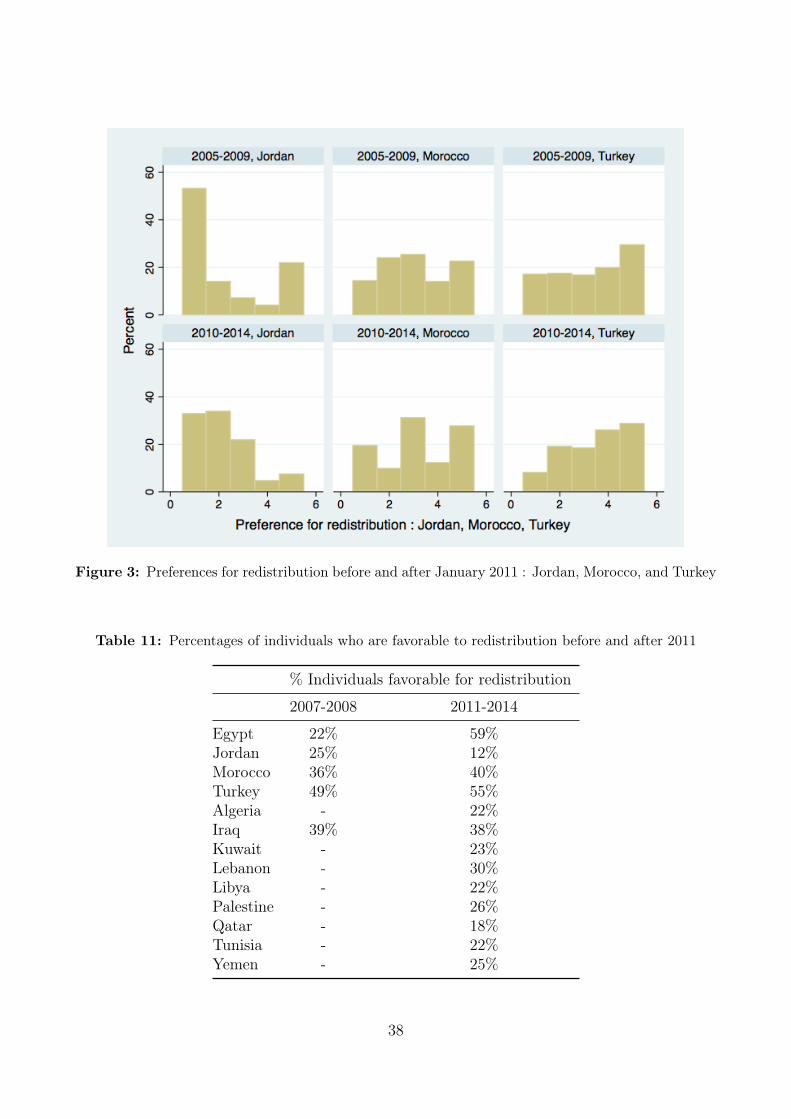
Figure 3: Preferences for redistribution before and after January 2011 : Jordan, Morocco, and Turkey
Table 11: Percentages of individuals who are favorable to redistribution before and after 2011
% Individuals favorable for redistribution
2007-2008 2011-2014
Egypt 22% 59%Jordan 25% 12%Morocco 36% 40%Turkey 49% 55%Algeria - 22%Iraq 39% 38%Kuwait - 23%Lebanon - 30%Libya - 22%Palestine - 26%Qatar - 18%Tunisia - 22%Yemen - 25%
38
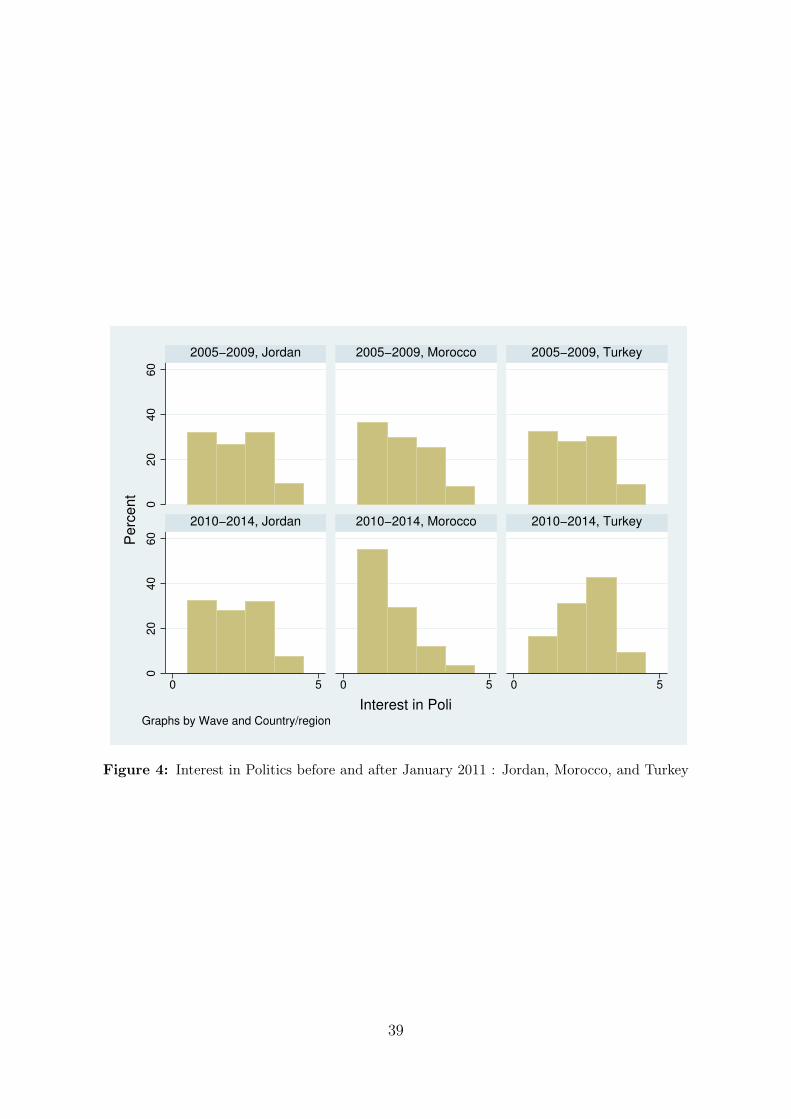
02
04
06
00
20
40
60
0 5 0 5 0 5
2005−2009, Jordan 2005−2009, Morocco 2005−2009, Turkey
2010−2014, Jordan 2010−2014, Morocco 2010−2014, Turkey
Perc
ent
Interest in PoliGraphs by Wave and Country/region
Figure 4: Interest in Politics before and after January 2011 : Jordan, Morocco, and Turkey
39
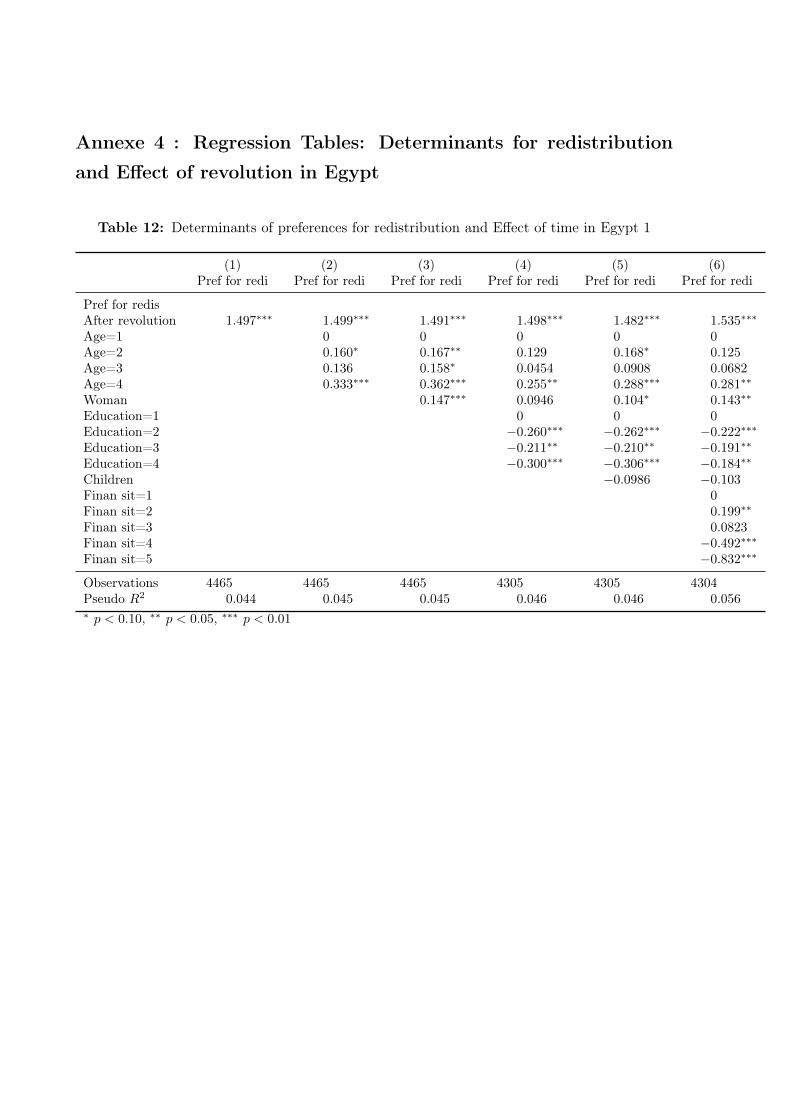
Annexe 4 : Regression Tables: Determinants for redistribution
and Effect of revolution in Egypt
Table 12: Determinants of preferences for redistribution and Effect of time in Egypt 1
(1) (2) (3) (4) (5) (6)Pref for redi Pref for redi Pref for redi Pref for redi Pref for redi Pref for redi
Pref for redisAfter revolution 1.497∗∗∗ 1.499∗∗∗ 1.491∗∗∗ 1.498∗∗∗ 1.482∗∗∗ 1.535∗∗∗
Age=1 0 0 0 0 0Age=2 0.160∗ 0.167∗∗ 0.129 0.168∗ 0.125Age=3 0.136 0.158∗ 0.0454 0.0908 0.0682Age=4 0.333∗∗∗ 0.362∗∗∗ 0.255∗∗ 0.288∗∗∗ 0.281∗∗
Woman 0.147∗∗∗ 0.0946 0.104∗ 0.143∗∗
Education=1 0 0 0Education=2 −0.260∗∗∗ −0.262∗∗∗ −0.222∗∗∗Education=3 −0.211∗∗ −0.210∗∗ −0.191∗∗Education=4 −0.300∗∗∗ −0.306∗∗∗ −0.184∗∗Children −0.0986 −0.103Finan sit=1 0Finan sit=2 0.199∗∗
Finan sit=3 0.0823Finan sit=4 −0.492∗∗∗Finan sit=5 −0.832∗∗∗
Observations 4465 4465 4465 4305 4305 4304Pseudo R2 0.044 0.045 0.045 0.046 0.046 0.056∗ p < 0.10, ∗∗ p < 0.05, ∗∗∗ p < 0.01
40
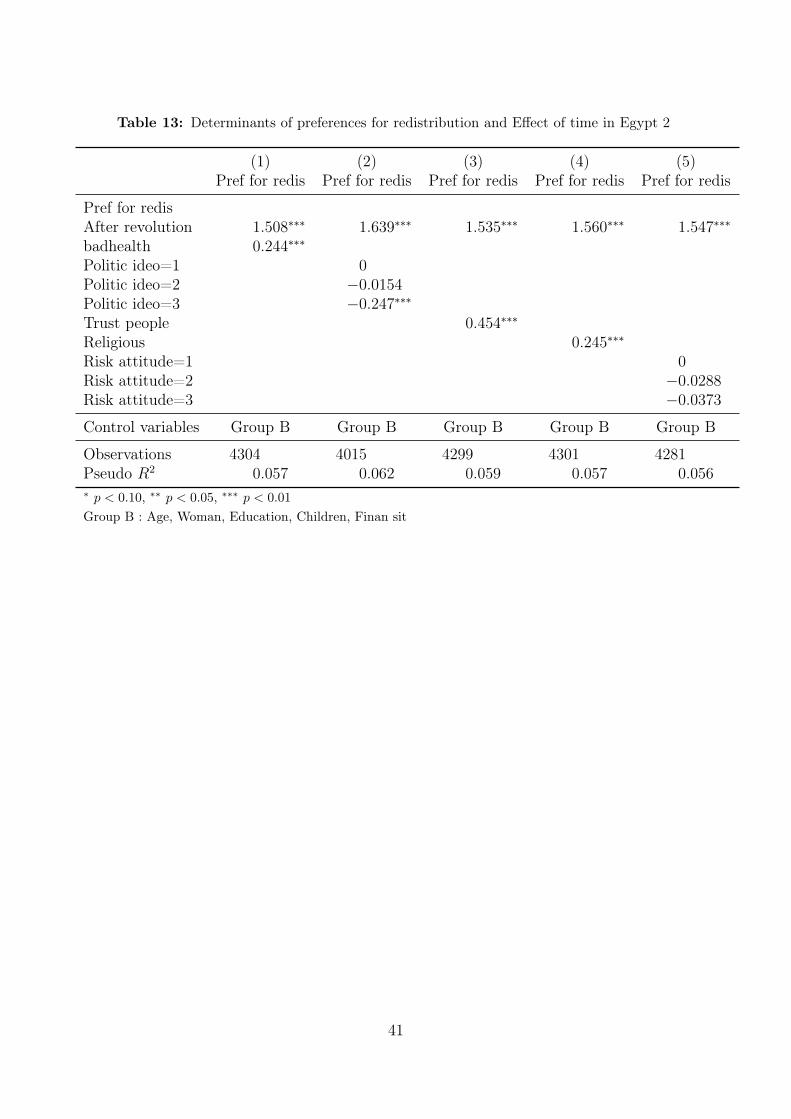
Table 13: Determinants of preferences for redistribution and Effect of time in Egypt 2
(1) (2) (3) (4) (5)Pref for redis Pref for redis Pref for redis Pref for redis Pref for redis
Pref for redisAfter revolution 1.508∗∗∗ 1.639∗∗∗ 1.535∗∗∗ 1.560∗∗∗ 1.547∗∗∗
badhealth 0.244∗∗∗
Politic ideo=1 0Politic ideo=2 −0.0154Politic ideo=3 −0.247∗∗∗Trust people 0.454∗∗∗
Religious 0.245∗∗∗
Risk attitude=1 0Risk attitude=2 −0.0288Risk attitude=3 −0.0373
Control variables Group B Group B Group B Group B Group B
Observations 4304 4015 4299 4301 4281Pseudo R2 0.057 0.062 0.059 0.057 0.056∗ p < 0.10, ∗∗ p < 0.05, ∗∗∗ p < 0.01
Group B : Age, Woman, Education, Children, Finan sit
41
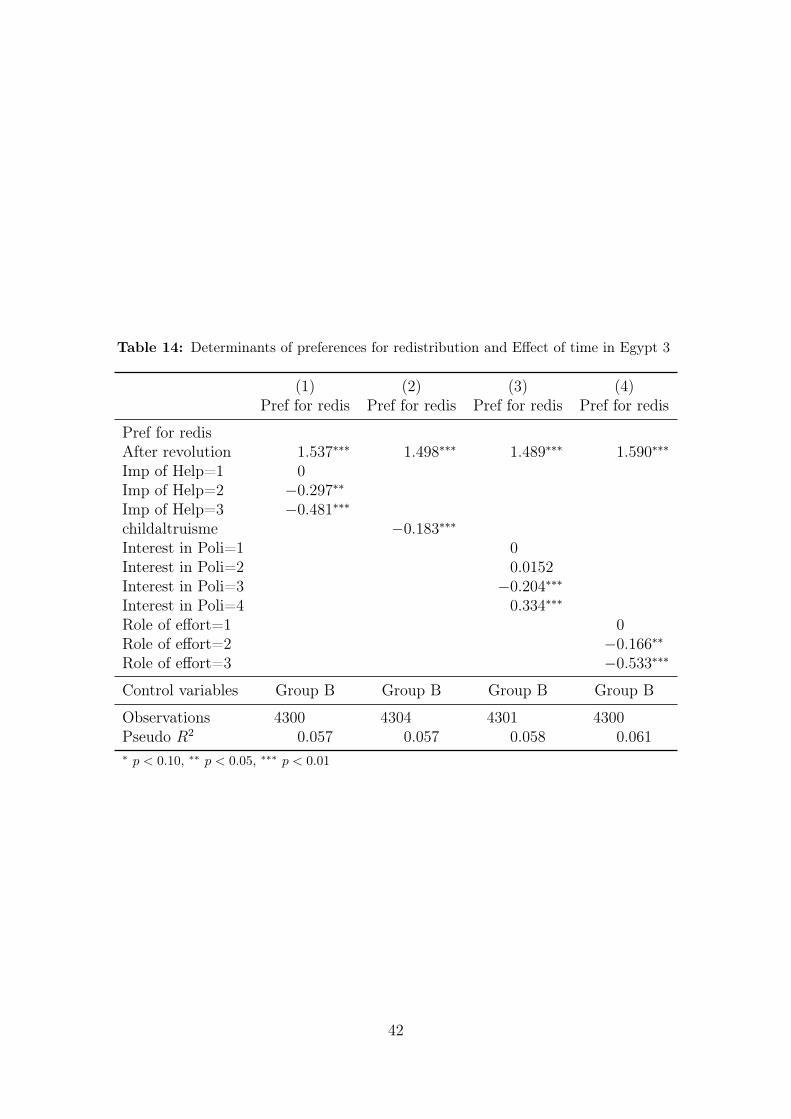
Table 14: Determinants of preferences for redistribution and Effect of time in Egypt 3
(1) (2) (3) (4)Pref for redis Pref for redis Pref for redis Pref for redis
Pref for redisAfter revolution 1.537∗∗∗ 1.498∗∗∗ 1.489∗∗∗ 1.590∗∗∗
Imp of Help=1 0Imp of Help=2 −0.297∗∗Imp of Help=3 −0.481∗∗∗childaltruisme −0.183∗∗∗Interest in Poli=1 0Interest in Poli=2 0.0152Interest in Poli=3 −0.204∗∗∗Interest in Poli=4 0.334∗∗∗
Role of effort=1 0Role of effort=2 −0.166∗∗Role of effort=3 −0.533∗∗∗
Control variables Group B Group B Group B Group B
Observations 4300 4304 4301 4300Pseudo R2 0.057 0.057 0.058 0.061∗ p < 0.10, ∗∗ p < 0.05, ∗∗∗ p < 0.01
42
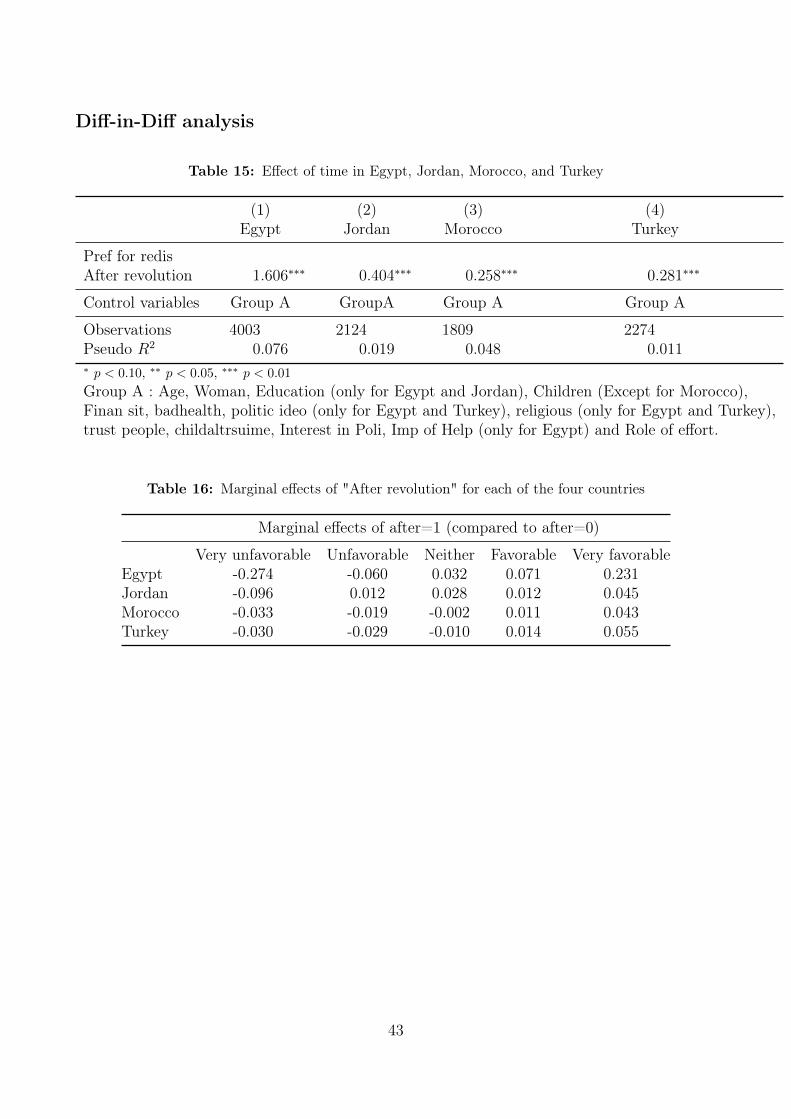
Diff-in-Diff analysis
Table 15: Effect of time in Egypt, Jordan, Morocco, and Turkey
(1) (2) (3) (4)Egypt Jordan Morocco Turkey
Pref for redisAfter revolution 1.606∗∗∗ 0.404∗∗∗ 0.258∗∗∗ 0.281∗∗∗
Control variables Group A GroupA Group A Group A
Observations 4003 2124 1809 2274Pseudo R2 0.076 0.019 0.048 0.011∗ p < 0.10, ∗∗ p < 0.05, ∗∗∗ p < 0.01
Group A : Age, Woman, Education (only for Egypt and Jordan), Children (Except for Morocco),Finan sit, badhealth, politic ideo (only for Egypt and Turkey), religious (only for Egypt and Turkey),trust people, childaltrsuime, Interest in Poli, Imp of Help (only for Egypt) and Role of effort.
Table 16: Marginal effects of "After revolution" for each of the four countries
Marginal effects of after=1 (compared to after=0)
Very unfavorable Unfavorable Neither Favorable Very favorableEgypt -0.274 -0.060 0.032 0.071 0.231Jordan -0.096 0.012 0.028 0.012 0.045Morocco -0.033 -0.019 -0.002 0.011 0.043Turkey -0.030 -0.029 -0.010 0.014 0.055
43
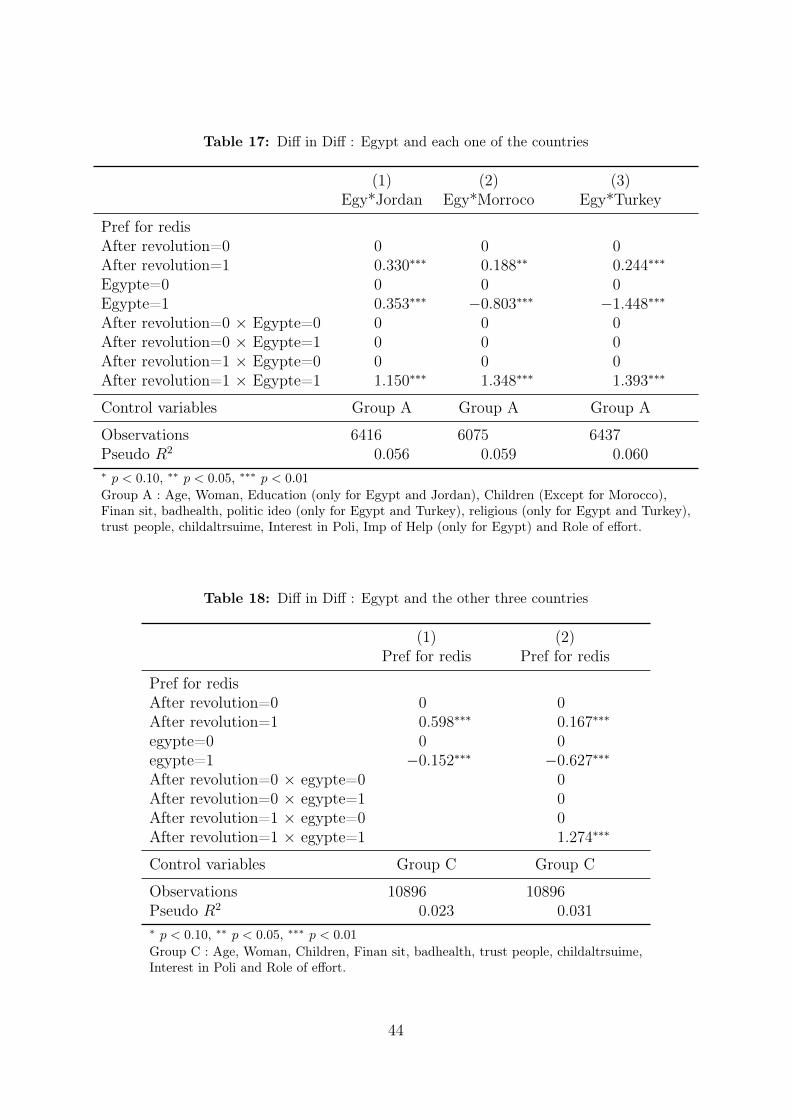
Table 17: Diff in Diff : Egypt and each one of the countries
(1) (2) (3)Egy*Jordan Egy*Morroco Egy*Turkey
Pref for redisAfter revolution=0 0 0 0After revolution=1 0.330∗∗∗ 0.188∗∗ 0.244∗∗∗
Egypte=0 0 0 0Egypte=1 0.353∗∗∗ −0.803∗∗∗ −1.448∗∗∗After revolution=0 × Egypte=0 0 0 0After revolution=0 × Egypte=1 0 0 0After revolution=1 × Egypte=0 0 0 0After revolution=1 × Egypte=1 1.150∗∗∗ 1.348∗∗∗ 1.393∗∗∗
Control variables Group A Group A Group A
Observations 6416 6075 6437Pseudo R2 0.056 0.059 0.060∗ p < 0.10, ∗∗ p < 0.05, ∗∗∗ p < 0.01
Group A : Age, Woman, Education (only for Egypt and Jordan), Children (Except for Morocco),Finan sit, badhealth, politic ideo (only for Egypt and Turkey), religious (only for Egypt and Turkey),trust people, childaltrsuime, Interest in Poli, Imp of Help (only for Egypt) and Role of effort.
Table 18: Diff in Diff : Egypt and the other three countries
(1) (2)Pref for redis Pref for redis
Pref for redisAfter revolution=0 0 0After revolution=1 0.598∗∗∗ 0.167∗∗∗
egypte=0 0 0egypte=1 −0.152∗∗∗ −0.627∗∗∗After revolution=0 × egypte=0 0After revolution=0 × egypte=1 0After revolution=1 × egypte=0 0After revolution=1 × egypte=1 1.274∗∗∗
Control variables Group C Group C
Observations 10896 10896Pseudo R2 0.023 0.031∗ p < 0.10, ∗∗ p < 0.05, ∗∗∗ p < 0.01
Group C : Age, Woman, Children, Finan sit, badhealth, trust people, childaltrsuime,Interest in Poli and Role of effort.
44
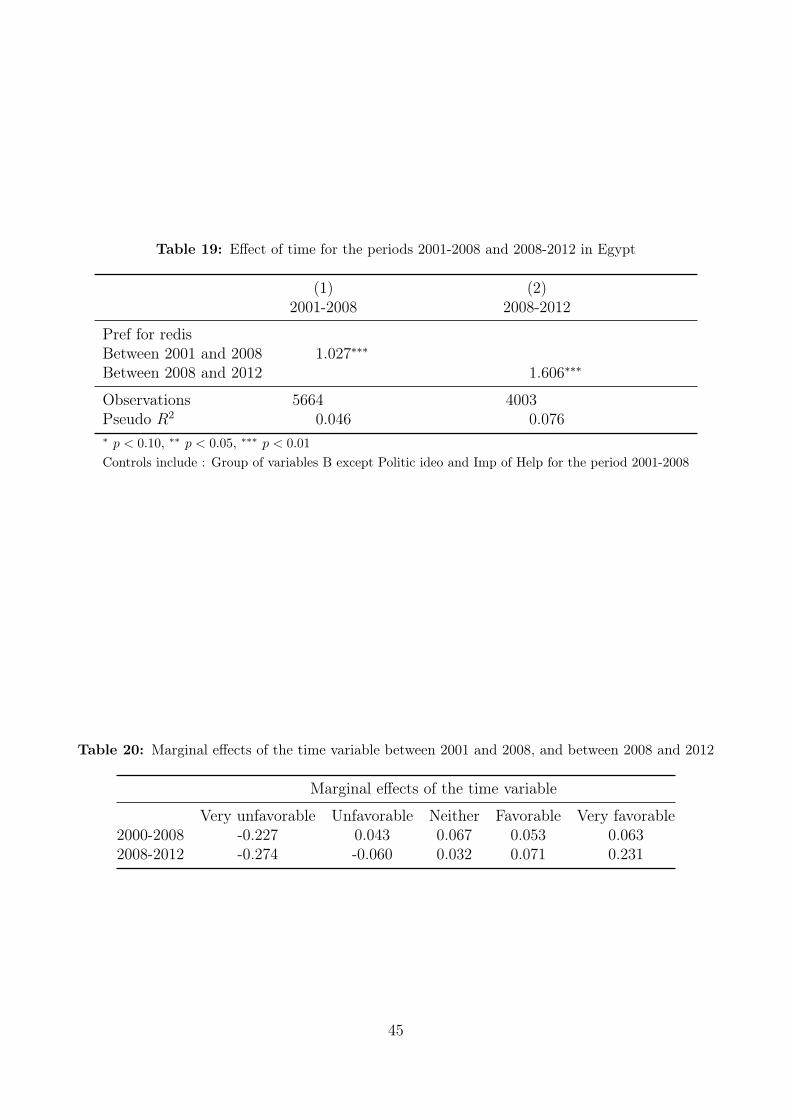
Table 19: Effect of time for the periods 2001-2008 and 2008-2012 in Egypt
(1) (2)2001-2008 2008-2012
Pref for redisBetween 2001 and 2008 1.027∗∗∗
Between 2008 and 2012 1.606∗∗∗
Observations 5664 4003Pseudo R2 0.046 0.076∗ p < 0.10, ∗∗ p < 0.05, ∗∗∗ p < 0.01
Controls include : Group of variables B except Politic ideo and Imp of Help for the period 2001-2008
Table 20: Marginal effects of the time variable between 2001 and 2008, and between 2008 and 2012
Marginal effects of the time variable
Very unfavorable Unfavorable Neither Favorable Very favorable2000-2008 -0.227 0.043 0.067 0.053 0.0632008-2012 -0.274 -0.060 0.032 0.071 0.231
45
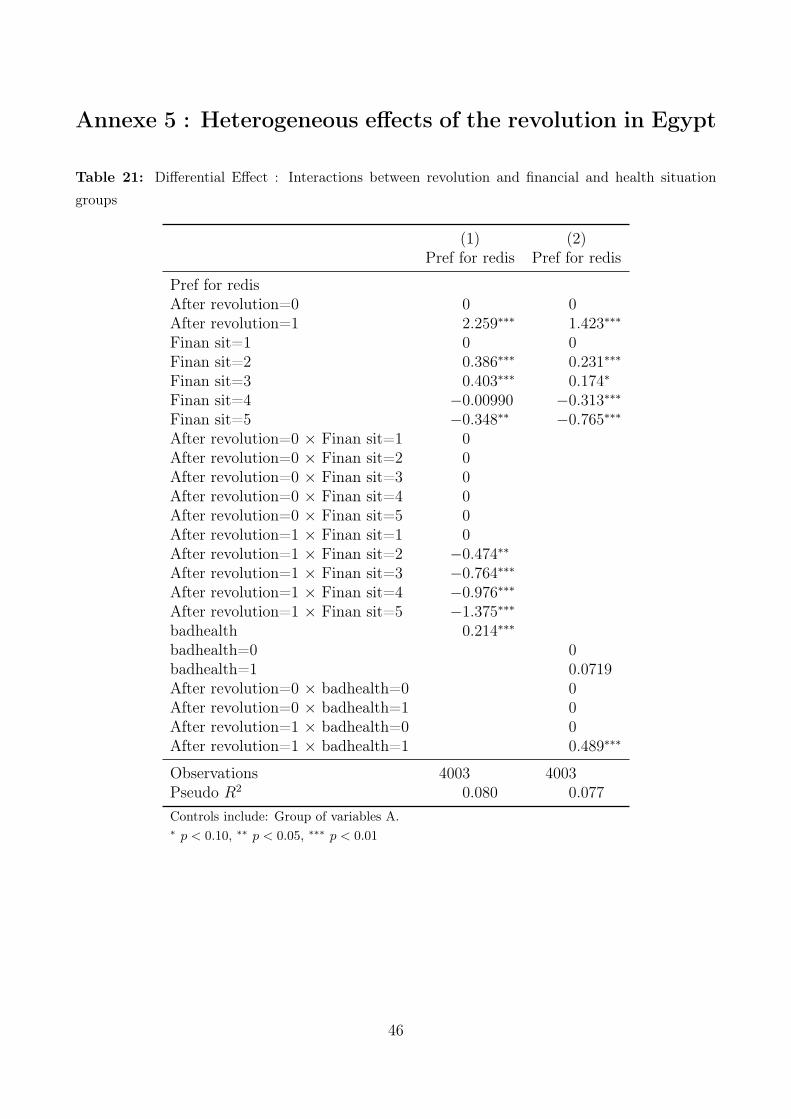
Annexe 5 : Heterogeneous effects of the revolution in Egypt
Table 21: Differential Effect : Interactions between revolution and financial and health situationgroups
(1) (2)Pref for redis Pref for redis
Pref for redisAfter revolution=0 0 0After revolution=1 2.259∗∗∗ 1.423∗∗∗
Finan sit=1 0 0Finan sit=2 0.386∗∗∗ 0.231∗∗∗
Finan sit=3 0.403∗∗∗ 0.174∗
Finan sit=4 −0.00990 −0.313∗∗∗Finan sit=5 −0.348∗∗ −0.765∗∗∗After revolution=0 × Finan sit=1 0After revolution=0 × Finan sit=2 0After revolution=0 × Finan sit=3 0After revolution=0 × Finan sit=4 0After revolution=0 × Finan sit=5 0After revolution=1 × Finan sit=1 0After revolution=1 × Finan sit=2 −0.474∗∗After revolution=1 × Finan sit=3 −0.764∗∗∗After revolution=1 × Finan sit=4 −0.976∗∗∗After revolution=1 × Finan sit=5 −1.375∗∗∗badhealth 0.214∗∗∗
badhealth=0 0badhealth=1 0.0719After revolution=0 × badhealth=0 0After revolution=0 × badhealth=1 0After revolution=1 × badhealth=0 0After revolution=1 × badhealth=1 0.489∗∗∗
Observations 4003 4003Pseudo R2 0.080 0.077
Controls include: Group of variables A.∗ p < 0.10, ∗∗ p < 0.05, ∗∗∗ p < 0.01
46
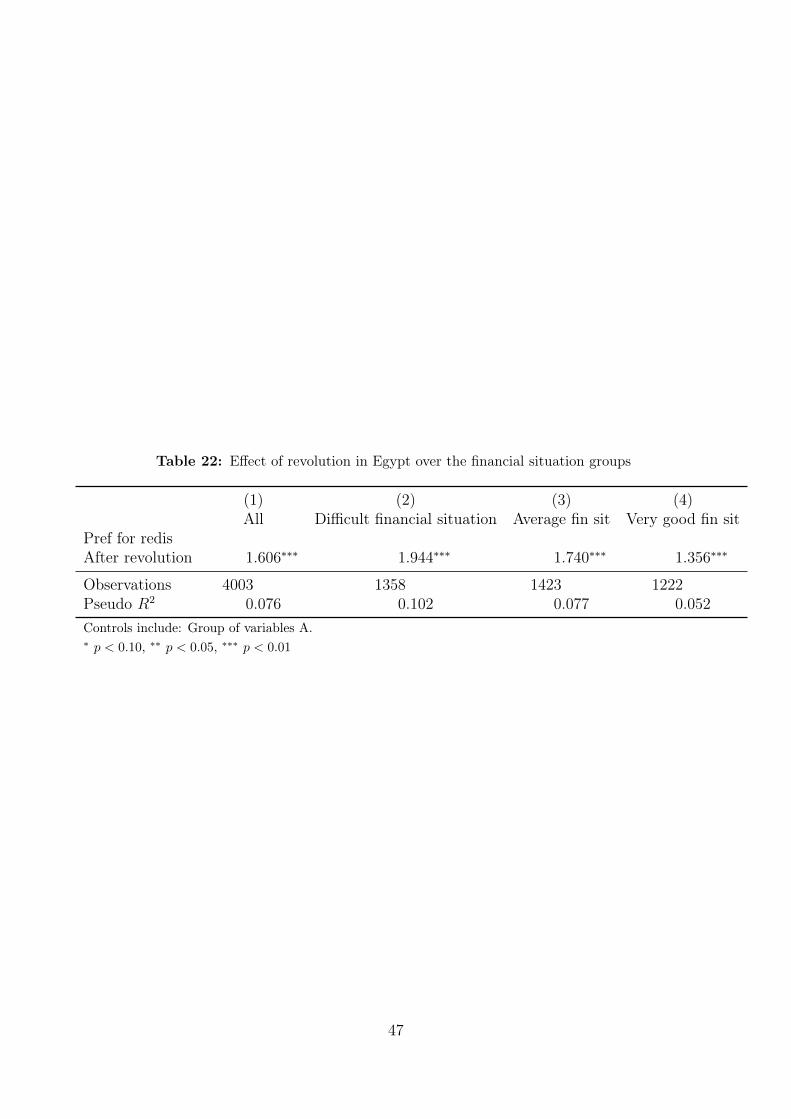
Table 22: Effect of revolution in Egypt over the financial situation groups
(1) (2) (3) (4)All Difficult financial situation Average fin sit Very good fin sit
Pref for redisAfter revolution 1.606∗∗∗ 1.944∗∗∗ 1.740∗∗∗ 1.356∗∗∗
Observations 4003 1358 1423 1222Pseudo R2 0.076 0.102 0.077 0.052
Controls include: Group of variables A.∗ p < 0.10, ∗∗ p < 0.05, ∗∗∗ p < 0.01
47
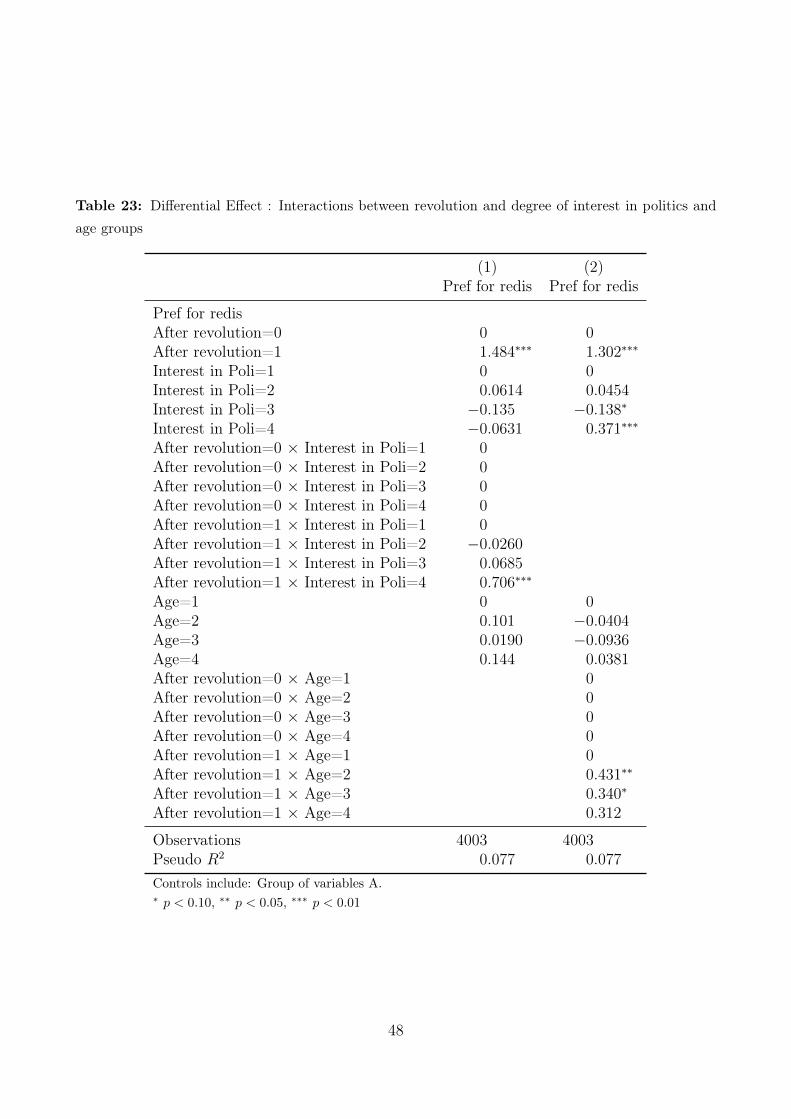
Table 23: Differential Effect : Interactions between revolution and degree of interest in politics andage groups
(1) (2)Pref for redis Pref for redis
Pref for redisAfter revolution=0 0 0After revolution=1 1.484∗∗∗ 1.302∗∗∗
Interest in Poli=1 0 0Interest in Poli=2 0.0614 0.0454Interest in Poli=3 −0.135 −0.138∗Interest in Poli=4 −0.0631 0.371∗∗∗
After revolution=0 × Interest in Poli=1 0After revolution=0 × Interest in Poli=2 0After revolution=0 × Interest in Poli=3 0After revolution=0 × Interest in Poli=4 0After revolution=1 × Interest in Poli=1 0After revolution=1 × Interest in Poli=2 −0.0260After revolution=1 × Interest in Poli=3 0.0685After revolution=1 × Interest in Poli=4 0.706∗∗∗
Age=1 0 0Age=2 0.101 −0.0404Age=3 0.0190 −0.0936Age=4 0.144 0.0381After revolution=0 × Age=1 0After revolution=0 × Age=2 0After revolution=0 × Age=3 0After revolution=0 × Age=4 0After revolution=1 × Age=1 0After revolution=1 × Age=2 0.431∗∗
After revolution=1 × Age=3 0.340∗
After revolution=1 × Age=4 0.312
Observations 4003 4003Pseudo R2 0.077 0.077
Controls include: Group of variables A.∗ p < 0.10, ∗∗ p < 0.05, ∗∗∗ p < 0.01
48
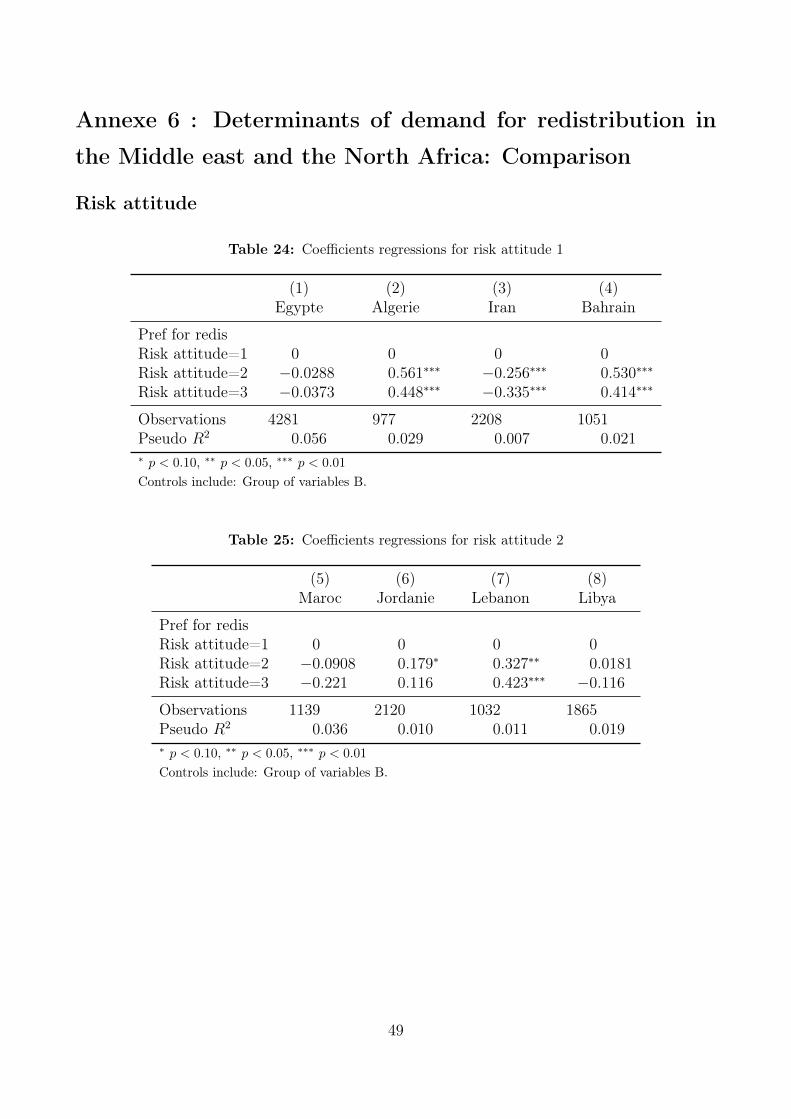
Annexe 6 : Determinants of demand for redistribution in
the Middle east and the North Africa: Comparison
Risk attitude
Table 24: Coefficients regressions for risk attitude 1
(1) (2) (3) (4)Egypte Algerie Iran Bahrain
Pref for redisRisk attitude=1 0 0 0 0Risk attitude=2 −0.0288 0.561∗∗∗ −0.256∗∗∗ 0.530∗∗∗
Risk attitude=3 −0.0373 0.448∗∗∗ −0.335∗∗∗ 0.414∗∗∗
Observations 4281 977 2208 1051Pseudo R2 0.056 0.029 0.007 0.021∗ p < 0.10, ∗∗ p < 0.05, ∗∗∗ p < 0.01
Controls include: Group of variables B.
Table 25: Coefficients regressions for risk attitude 2
(5) (6) (7) (8)Maroc Jordanie Lebanon Libya
Pref for redisRisk attitude=1 0 0 0 0Risk attitude=2 −0.0908 0.179∗ 0.327∗∗ 0.0181Risk attitude=3 −0.221 0.116 0.423∗∗∗ −0.116
Observations 1139 2120 1032 1865Pseudo R2 0.036 0.010 0.011 0.019∗ p < 0.10, ∗∗ p < 0.05, ∗∗∗ p < 0.01
Controls include: Group of variables B.
49
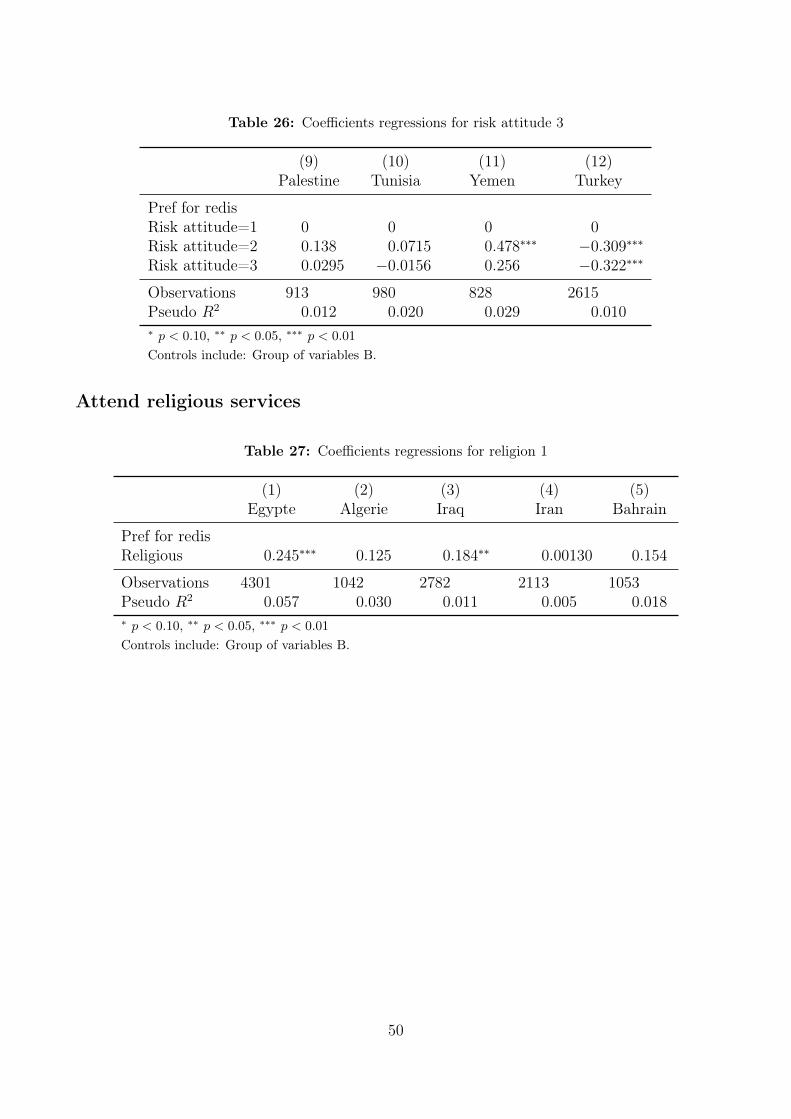
Table 26: Coefficients regressions for risk attitude 3
(9) (10) (11) (12)Palestine Tunisia Yemen Turkey
Pref for redisRisk attitude=1 0 0 0 0Risk attitude=2 0.138 0.0715 0.478∗∗∗ −0.309∗∗∗Risk attitude=3 0.0295 −0.0156 0.256 −0.322∗∗∗
Observations 913 980 828 2615Pseudo R2 0.012 0.020 0.029 0.010∗ p < 0.10, ∗∗ p < 0.05, ∗∗∗ p < 0.01
Controls include: Group of variables B.
Attend religious services
Table 27: Coefficients regressions for religion 1
(1) (2) (3) (4) (5)Egypte Algerie Iraq Iran Bahrain
Pref for redisReligious 0.245∗∗∗ 0.125 0.184∗∗ 0.00130 0.154
Observations 4301 1042 2782 2113 1053Pseudo R2 0.057 0.030 0.011 0.005 0.018∗ p < 0.10, ∗∗ p < 0.05, ∗∗∗ p < 0.01
Controls include: Group of variables B.
50
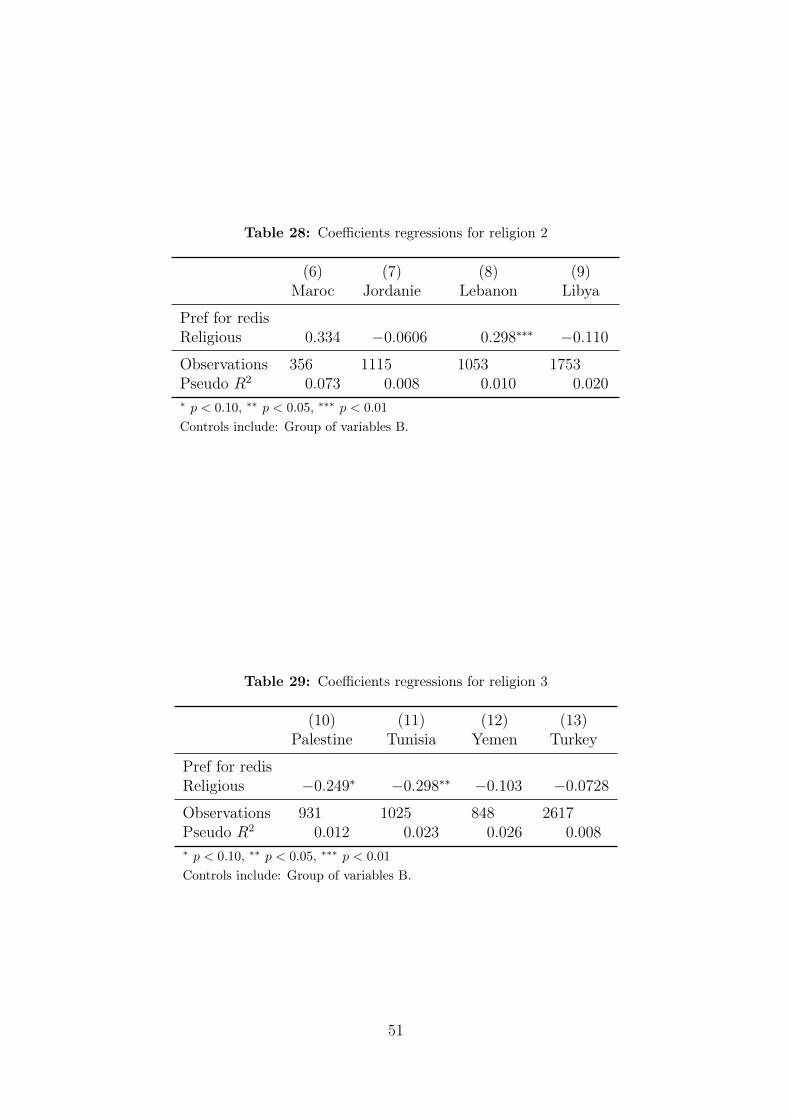
Table 28: Coefficients regressions for religion 2
(6) (7) (8) (9)Maroc Jordanie Lebanon Libya
Pref for redisReligious 0.334 −0.0606 0.298∗∗∗ −0.110
Observations 356 1115 1053 1753Pseudo R2 0.073 0.008 0.010 0.020∗ p < 0.10, ∗∗ p < 0.05, ∗∗∗ p < 0.01
Controls include: Group of variables B.
Table 29: Coefficients regressions for religion 3
(10) (11) (12) (13)Palestine Tunisia Yemen Turkey
Pref for redisReligious −0.249∗ −0.298∗∗ −0.103 −0.0728
Observations 931 1025 848 2617Pseudo R2 0.012 0.023 0.026 0.008∗ p < 0.10, ∗∗ p < 0.05, ∗∗∗ p < 0.01
Controls include: Group of variables B.
51
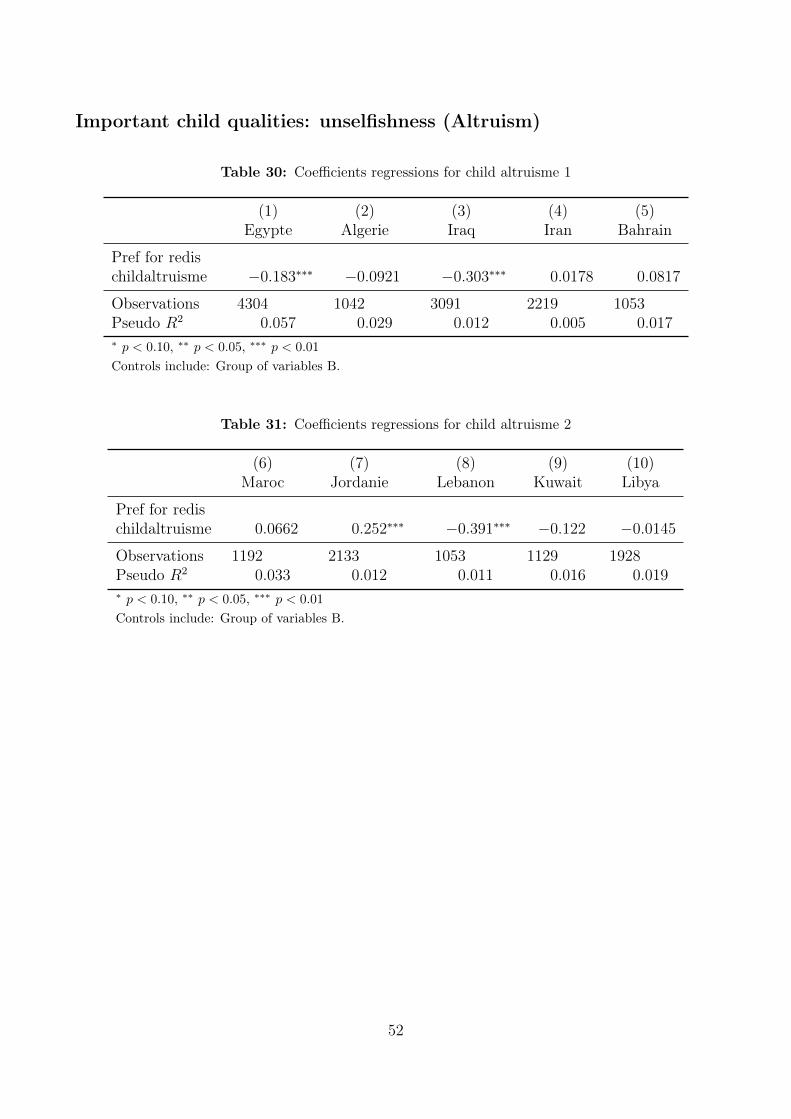
Important child qualities: unselfishness (Altruism)
Table 30: Coefficients regressions for child altruisme 1
(1) (2) (3) (4) (5)Egypte Algerie Iraq Iran Bahrain
Pref for redischildaltruisme −0.183∗∗∗ −0.0921 −0.303∗∗∗ 0.0178 0.0817
Observations 4304 1042 3091 2219 1053Pseudo R2 0.057 0.029 0.012 0.005 0.017∗ p < 0.10, ∗∗ p < 0.05, ∗∗∗ p < 0.01
Controls include: Group of variables B.
Table 31: Coefficients regressions for child altruisme 2
(6) (7) (8) (9) (10)Maroc Jordanie Lebanon Kuwait Libya
Pref for redischildaltruisme 0.0662 0.252∗∗∗ −0.391∗∗∗ −0.122 −0.0145
Observations 1192 2133 1053 1129 1928Pseudo R2 0.033 0.012 0.011 0.016 0.019∗ p < 0.10, ∗∗ p < 0.05, ∗∗∗ p < 0.01
Controls include: Group of variables B.
52
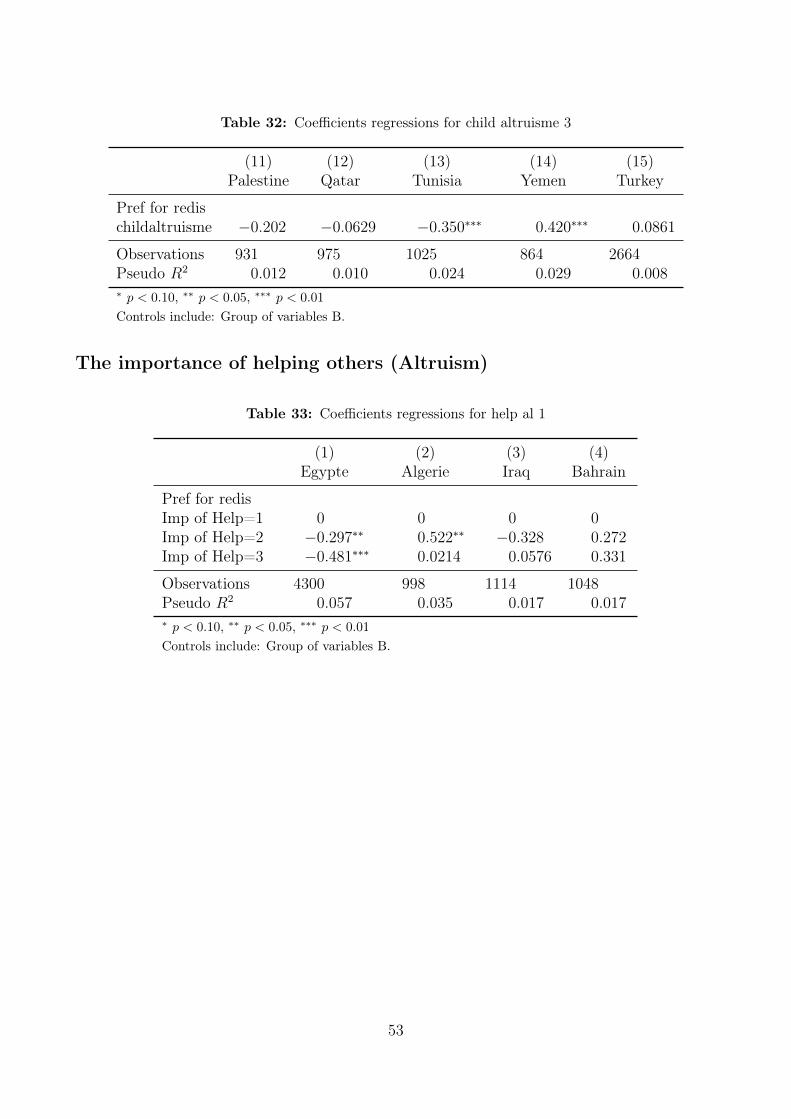
Table 32: Coefficients regressions for child altruisme 3
(11) (12) (13) (14) (15)Palestine Qatar Tunisia Yemen Turkey
Pref for redischildaltruisme −0.202 −0.0629 −0.350∗∗∗ 0.420∗∗∗ 0.0861
Observations 931 975 1025 864 2664Pseudo R2 0.012 0.010 0.024 0.029 0.008∗ p < 0.10, ∗∗ p < 0.05, ∗∗∗ p < 0.01
Controls include: Group of variables B.
The importance of helping others (Altruism)
Table 33: Coefficients regressions for help al 1
(1) (2) (3) (4)Egypte Algerie Iraq Bahrain
Pref for redisImp of Help=1 0 0 0 0Imp of Help=2 −0.297∗∗ 0.522∗∗ −0.328 0.272Imp of Help=3 −0.481∗∗∗ 0.0214 0.0576 0.331
Observations 4300 998 1114 1048Pseudo R2 0.057 0.035 0.017 0.017∗ p < 0.10, ∗∗ p < 0.05, ∗∗∗ p < 0.01
Controls include: Group of variables B.
53
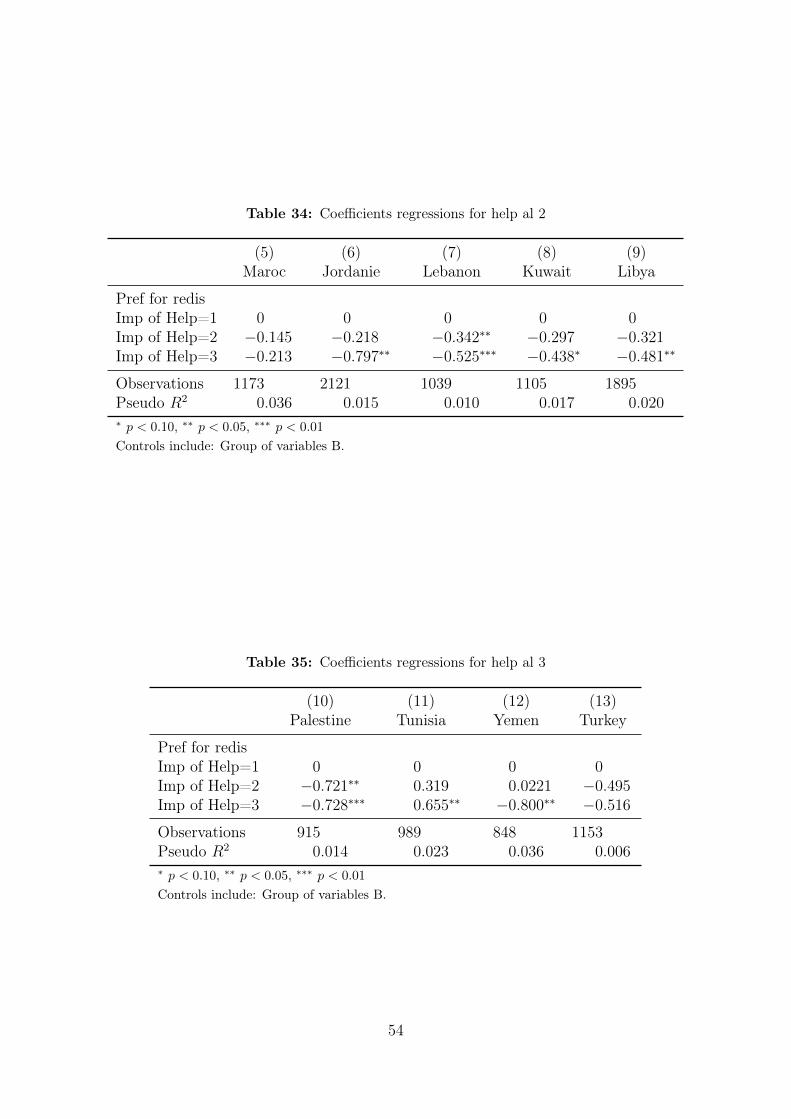
Table 34: Coefficients regressions for help al 2
(5) (6) (7) (8) (9)Maroc Jordanie Lebanon Kuwait Libya
Pref for redisImp of Help=1 0 0 0 0 0Imp of Help=2 −0.145 −0.218 −0.342∗∗ −0.297 −0.321Imp of Help=3 −0.213 −0.797∗∗ −0.525∗∗∗ −0.438∗ −0.481∗∗
Observations 1173 2121 1039 1105 1895Pseudo R2 0.036 0.015 0.010 0.017 0.020∗ p < 0.10, ∗∗ p < 0.05, ∗∗∗ p < 0.01
Controls include: Group of variables B.
Table 35: Coefficients regressions for help al 3
(10) (11) (12) (13)Palestine Tunisia Yemen Turkey
Pref for redisImp of Help=1 0 0 0 0Imp of Help=2 −0.721∗∗ 0.319 0.0221 −0.495Imp of Help=3 −0.728∗∗∗ 0.655∗∗ −0.800∗∗ −0.516
Observations 915 989 848 1153Pseudo R2 0.014 0.023 0.036 0.006∗ p < 0.10, ∗∗ p < 0.05, ∗∗∗ p < 0.01
Controls include: Group of variables B.
54
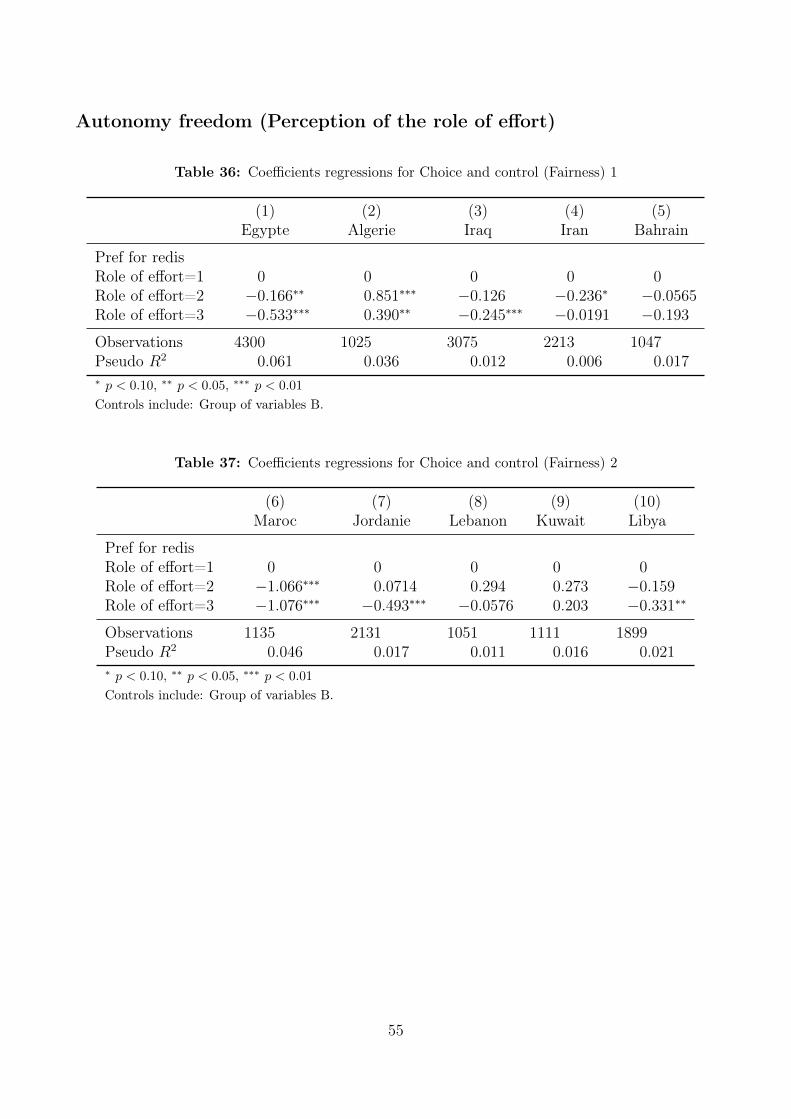
Autonomy freedom (Perception of the role of effort)
Table 36: Coefficients regressions for Choice and control (Fairness) 1
(1) (2) (3) (4) (5)Egypte Algerie Iraq Iran Bahrain
Pref for redisRole of effort=1 0 0 0 0 0Role of effort=2 −0.166∗∗ 0.851∗∗∗ −0.126 −0.236∗ −0.0565Role of effort=3 −0.533∗∗∗ 0.390∗∗ −0.245∗∗∗ −0.0191 −0.193
Observations 4300 1025 3075 2213 1047Pseudo R2 0.061 0.036 0.012 0.006 0.017∗ p < 0.10, ∗∗ p < 0.05, ∗∗∗ p < 0.01
Controls include: Group of variables B.
Table 37: Coefficients regressions for Choice and control (Fairness) 2
(6) (7) (8) (9) (10)Maroc Jordanie Lebanon Kuwait Libya
Pref for redisRole of effort=1 0 0 0 0 0Role of effort=2 −1.066∗∗∗ 0.0714 0.294 0.273 −0.159Role of effort=3 −1.076∗∗∗ −0.493∗∗∗ −0.0576 0.203 −0.331∗∗
Observations 1135 2131 1051 1111 1899Pseudo R2 0.046 0.017 0.011 0.016 0.021∗ p < 0.10, ∗∗ p < 0.05, ∗∗∗ p < 0.01
Controls include: Group of variables B.
55
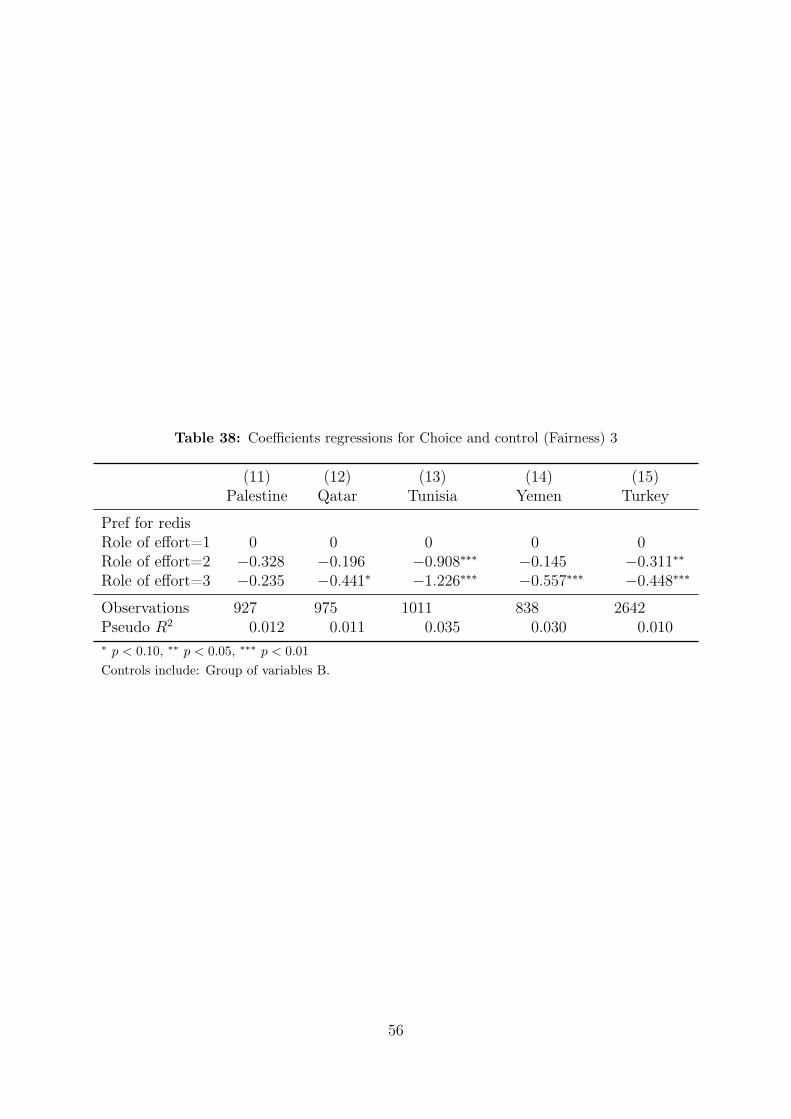
Table 38: Coefficients regressions for Choice and control (Fairness) 3
(11) (12) (13) (14) (15)Palestine Qatar Tunisia Yemen Turkey
Pref for redisRole of effort=1 0 0 0 0 0Role of effort=2 −0.328 −0.196 −0.908∗∗∗ −0.145 −0.311∗∗Role of effort=3 −0.235 −0.441∗ −1.226∗∗∗ −0.557∗∗∗ −0.448∗∗∗
Observations 927 975 1011 838 2642Pseudo R2 0.012 0.011 0.035 0.030 0.010∗ p < 0.10, ∗∗ p < 0.05, ∗∗∗ p < 0.01
Controls include: Group of variables B.
56
Top Related
Copyright © 2022 FDOKUMEN

