


Bahasa
Halaman
Hukum

PRELIMINARY DRAFT NOT FOR CITATION
The Economic Impact of EPAs in SADC Countries
Alexander Keck and Roberta Piermartini WTO, Economic Research and Statistics Division1
May 2005
Abstract The Cotonou Agreement introduces new fundamental principles with respect to trade between the European Union (EU) and African, Carribean and Pacific (ACP) countries relative to the Lomé Convention: in particular, negotiations on the basis of different regional groupings and reciprocity are now important pillars of EU-ACP co-operation. Non-reciprocal preferential market access for ACP economies will only last until 1 January 2008. After that date, it will be replaced by a string of Economic Partnership Agreements (EPAs) meant to progressively liberalise trade in a reciprocal way. The progressive removal of barriers to trade is expected to result in the establishment of Free Trade Areas (FTAs) between the EU and ACP regional groups in accordance with the relevant WTO rules and help further existing regional integration efforts among the ACP. An applied general equilibrium model (15 regions, 9 sectors) is used to simulate the impact of EPAs for countries of the Southern African Development Community (SADC), some of which are part of the SADC negotiating group, while others are part of the Eastern and Southern African (ESA) group, which includes members of the Common Market for Eastern and Southern Africa (COMESA). The standard Global Trade Analysis Project (GTAP) model has been extended to include the elimination of textile quotas, EU enlargement to 25 members as well as tax revenue sharing and a common external tariff among Southern African Customs Union (SACU) countries. A number of comparisons between different scenarios are undertaken, in particular: (i) the EPA scenario is compared to the multilateral liberalization scenario; (ii) SADC liberalization with the EU only is compared to a scenario with simultaneous regional integration among African economies and to the case of the EU also signing an FTA with Mercosur; and (iii) a complete reduction of import barriers is contrasted with partial liberalization (i.e. only 50 per cent tariff reductions in agriculture) and with full trade liberalization that includes the elimination of subsidies. The issue of tariff revenue loss is also addressed and the required tax replacement is calculated. Selected experiments are re-run under an unemployment closure. Simulation results show that an EPA with the EU is welfare-enhancing for SADC, leading also to substantive increases in real GDP. Estimated gains for the region as a whole are of the order of 1.5 billion dollars (constant 2001 $), but there is some evidence of trade diversion from the rest of developing countries. For most countries further gains may arise from intra-SADC liberalization. The possibility of the EU entering an FTA with other countries, such as Mercosur, reduce estimated gains, but they still remain largely positive. Similarly, estimated gains need to be revised downwards if agriculture liberalization is not as far reaching as a reduction of import barriers for manufactures. At the sectoral level, the largest expansions in SADC economies take place in the animal agriculture and processed food sectors, while manufacturing becomes comparatively less attractive following EU-SADC liberalization. Interestingly, multilateral liberalization would instead foster some of the manufacturing sectors (textile and clothing and light manufacturing). Results also show the need for the SACU tariff pooling formula to be adjusted to reflect new import patterns as tariffs are removed. Key words: Cotonou, SADC, regionalism, CGE modelling. JEL classification: F15, F17, O55.
1 This is a working paper and represents research in progress. The paper should be attributed to the authors,
and is the product of professional research. It has been prepared under the authors' own responsibility and is without prejudice to Members' rights and obligations under the WTO. It is not meant to represent the positions or opinions of the WTO or its Members, nor the official position of any WTO staff members. Any errors are the fault of the authors.
2
2
I. INTRODUCTION ....................................................................................................................3 II. DATA AND MODELLING STRATEGY ..............................................................................5 A. DATA...........................................................................................................................................5 B. MODIFICATIONS OF THE STANDARD GTAP MODEL..................................................................12 III. POLICY EXPERIMENTS.....................................................................................................13 IV. RESULTS ................................................................................................................................14 A. WELFARE EFFECTS....................................................................................................................15 1. Regional or multilateral trade liberalization?......................................................................16 (a) Allocative efficiency and terms of trade effects .......................................................................16 (b) Changes in real GDP.................................................................................................................18 (c) Sensitivity analysis ...................................................................................................................19 2. Multiple regional free trade agreements...............................................................................19 3. Partial or full trade liberalization?........................................................................................20 B. RESOURCE REALLOCATION.......................................................................................................21 1. Resource reallocation across sectors .....................................................................................21 2. Income redistribution effects .................................................................................................23 C. CHANGES IN TRADE PATTERNS .................................................................................................24 D. EMPLOYMENT EFFECTS.............................................................................................................25 E. IMPACT ON TARIFF REVENUE ....................................................................................................28 V. CONCLUSIONS .....................................................................................................................31 VI. REFERENCES........................................................................................................................32
3
3
I. INTRODUCTION
Relations between the African, Caribbean and Pacific (ACP) countries and the EU go back more than 50 years. For most of the time, trade relations were characterized by non-reciprocal duty-free access to the EU market for most ACP exports with the exception of certain agricultural products facing positive tariffs and quotas. Before the Cotonou Agreement, the EU-ACP relationship was governed by successive agreements under the Lomé Convention. Throughout this long-lasting process, both sides showed dissatisfaction with certain aspects of these agreements. Some of the recurrent ACP demands were duty-free access for products covered by the Common Agricultural Policy (CAP), simplified rules of origin as well as increased aid and faster disbursement. The EU seemed increasingly dissatisfied with the slow progress in terms of good governance, human rights and democratisation as well as the use of its development funds. In addition, Lomé preferences, with few exceptions, seemed to have done little to help expand and diversify ACP exports. The Cotonou Agreement redefines the relationship between the EU and the ACP. While the performance of Lomé may have been an important factor leading to this change in course, external developments have also played a role, not least the enlargement of the EU to include Eastern European countries, the interest by the EU in trade relations with other regions and the unwillingness of other developing countries to agree to waivers from WTO rules for EU-ACP non-reciprocal preferences. With respect to trade, the Cotonou Agreement introduces some major changes: Preferential market access commitments are to be made on the basis of reciprocity, with the terms and conditions to be negotiated in the context of so-called Economic Partnership Agreement (EPAs) between the EU and different country groupings within the ACP. These negotiations are to be concluded by 1 January 2008, until which date non-reciprocal preferences under the Cotonou Agreement will be preserved. Least-Developed Countries (LDCs) from the ACP region are part of the negotiation process, while continuing to enjoy duty- and quota-free market access under the EU's unilateral Everything But Arms (EBA) initiative given to all LDCs. The progressive removal of trade barriers after 2008 is to lead to Free Trade Agreements (FTAs) between the EU and ACP regional groupings in conformity with WTO rules. The Cotonou Agreement also addresses the issue of trade-related aid, in particular to address supply-side constraints. The EU is set to negotiate with six regional groupings of the ACP group of countries:
• West Africa group: Economic Community of Western African States (ECOWAS) and Mauritania;
• Central Africa group: Communauté Economique et Monétaire de l'Afrique Centrale (CEMAC) and São Tomé and Príncipe;
• Eastern and Southern Africa (ESA) group: Eligible members of the Common Market for Eastern and Southern Africa (COMESA), with the exception of certain Southern African Development Community (SADC) members;
• SADC group: Angola, Mozambique, Tanzania as well as Botswana, Lesotho, Namibia, Swaziland (BLNS) that together with South Africa (observer to the SADC negotiating group) belong to the Southern African Customs Union (SACU); other SADC members form part of the ESA group;
• Caribbean: 14 ACP members of the Caribbean Community (CARICOM) and the Dominican Republic;
• Pacific: Pacific ACP members; negotiations not yet underway. In this paper, we analyse the impact of the creation of an FTA between the EU and SADC countries, whether or not the latter belong to the SADC or ESA negotiating groups. SADC is more than a trade arrangement, encompassing also areas, such as public health, infrastructure development and defence. It comprises the following 14 countries, which are quite heterogeneous in both size and economic performance: Angola, Botswana, the Democratic Republic of Congo, Lesotho, Malawi, Mauritius,
4
4
Mozambique, Namibia, Seychelles, South Africa, Swaziland, Tanzania, Zambia and Zimbabwe. In 2000, agreement was reached to create a SADC Free Trade Area. SADC countries undertook to phase out tariffs on "non-sensitive" products by 2008 with the remaining items to be liberalized by 2012. Besides the staggered implementation and exempted products, the accord also contains special flexibilities for certain members, for instance special transitory preferences for Malawi, Mozambique, Tanzania and Zimbabwe in the area of textiles and clothing. Angola, the Democratic Republic of Congo (DRC) and the Seychelles so far have not signed the trade protocol.2 The Southern African Customs Union (SACU) came into being already in 1910. Its members are Botswana, Lesotho, Namibia, Swaziland (BLNS) as well as South Africa. The five countries have a common external tariff (CET), and proceeds go to a common revenue pool. In its long history, the SACU Agreement has undergone various re-negotiations, with the most recent Agreement of 2002 being even more comprehensive than earlier versions. Most notably for the purposes of this paper, new revenue sharing arrangements have been made, which include a separate formula for excise duties that previously had been excluded. Also the formula for the distribution of the customs component has been revised on the basis of each country's share in total intra-SACU imports (Botswana: 27 per cent; Lesotho: 13 per cent; Namibia: 25 per cent; Swaziland: 15 per cent; and South Africa: 20 per cent). These arrangements are meant to compensate for the cost-raising effects of the customs union and, by including excise duties, ensure greater stability of revenues for the BLNS countries, when tariff income will decline over time. The new accord also provides for a development component, funded out of the excise duty pool, which results in higher transfers to the lesser developed SACU members (Kirk and Stern, 2003). In our model, we only take account of the customs component of the new tariff revenue sharing arrangements. We have decided to do so, as GTAP protection data based on MAcMAP appears to contain the statutory tariffs without excise duty components, where applicable. In our experiments, despite phase-ins and product exclusions that are usually part of international trade agreements, we also assume immediate and complete liberalization (unless stated otherwise) in order to obtain an upper bound benchmark of trade liberalization effects, as they eventually may be expected to occur. We also include Angola, the DRC and the Seychelles as part of the "Rest of SADC" region (together with Mauritius) in all simulations. The analysis is comparative static and does not take account of dynamic effects triggered by further liberalization through, for instance, increased competition, economies of scale, improvements of the investment climate and technological change. In that sense, the simulations provide a lower bound estimate of the impact of trade liberalization on the economy. The paper explores a number of issues in particular: What are the effects of an FTA between the EU and SADC countries on SADC members? What would be the consequences of an EU-SADC agreement that does not include agriculture? Should SADC countries simultaneously proceed with further intra-SADC liberalization? Our analysis not only focuses on the effects in terms of real GDP increases, but also stresses redistribution effects and cost of adjustments. It looks at resource reallocation across sectors, variations in the remuneration of factors of production and changes in trade patterns. The paper uses the final GTAP 6 Data Base. The main advantage of using this Data Base is that it includes a wider range of preferences than previous versions. Since some countries enjoy preferential access to certain markets, multilateral liberalization may represent a cost to them as it leads to preference erosion (i.e. a reduction of the competitive advantage owing to preference margins). It is important to stress that preference erosion does not only occur as a consequence of multilateral liberalization. Preference erosion also takes place when preferential treatment is extended to more trading partners through other FTAs. When the impact of the creation of an FTA on trading partners is analysed, the consideration of other FTAs is often neglected. That said, our paper goes further than previous studies on the effects of free trade arrangements between the EU and southern African
2 For a more detailed discussion of the SADC trade protocol, see Chauvin and Gaulier (2002).
5
5
countries (notably Lewis et al., 2003; and McDonald and Walmsley, 2001)3 in a number of respects: First, it uses the final version of the GTAP 6 Data Base that provides a more extensive coverage of preferences than previous versions. Second, it takes into account the formation of the EU-25 and the resulting free access of the ten new members to the EU market. Third, the paper takes into account ongoing FTA negotiations by the EU with other regional groups outside Africa, notably Mercosur, and seeks to determine how results on expected gains from trade liberalization in Southern Africa are affected. Another new feature of this paper is the focus on the fiscal impact of the EU-SADC FTA. Tsikata (1999) uses a partial equilibrium model to estimate revenue losses from intra-SADC liberalization. She finds that the countries with the highest tariffs and whose total fiscal revenue is more trade-dependent are more likely to suffer from revenue losses. Like McDonald and Walmsley (2001) we include considerations of the consequences of revenue sharing conditions for Botswana and the Rest of SACU region in the analysis of the various policy scenarios and highlight the need for a reform of the revenue sharing formula to avoid unwanted consequences. In addition, we look at the possibility to substitute tariffs with various forms of taxation. Finally, we assess how results change when alternative values for key parameters of the model are postulated and when some of the assumptions are changed. In particular, we perform a sensitivity analysis on the variation of the parameter values for the Armington elasticities, and we look at how outcomes change when the assumption of full factor employment is dropped. The rest of the paper is organised as follows. Section II provides a description of the data and the modelling strategy. Section III describes the policy scenarios we have analysed and Section IV reports the results. Section V concludes. II. DATA AND MODELLING STRATEGY
The data and the model used in this paper are derived from the GTAP 6 Data Base. GTAP 6 (i.e. its sixth release) includes 87 regions, 57 sectors and 5 factors of production (natural resources, land, unskilled labour, skilled labour and capital). The underlying model is a Computable General Equilibrium (CGE) model that uses variants of the Armington assumption. It is important to keep in mind that as a consequence of the Armington assumption, the results of the simulations will be driven to a large extent by the term-of-trade change and will be sensitive to both substitution elasticities and trade shares. In this Section we provide a description of the specific regional and sectoral specification adopted in this paper and an explanation of the assumptions introduced in the model. A. DATA
The GTAP 6 Data Base is well-suited to examine the consequences of free trade areas (FTA) among SADC countries as well as between them and the EU-25 both in terms of country and sector coverage. We aggregate the GTAP Data Base into 15 regions and 9 sectors. This Subsection provides the background for our aggregation strategy and descriptive statistics of the data on production, trade patterns and import tariff protection resulting from the aggregation. Country Aggregation All SADC countries are detailed in the data with the exception of Lesotho, Namibia and Swaziland
3 Earlier CGE studies on the regional trade options for Southern Africa, such as Masters et al. (1999)
and Lewis et al. (1999) are based on the GTAP Data Base version 4. In this version of the GTAP Data Base, SADC countries are aggregated as a region. Consequently, these studies only analyze the impact of the formation of a regional trade agreement on South Africa and the SADC region, without distinguishing across SADC members. Version 5 disaggregated Malawi, Mozambique, Tanzania, Zambia and Zimbabwe.
6
forming the "Rest of SACU" region, and Angola, the DRC, Mauritius and the Seychelles which make up the "Rest of SADC". The remaining SADC countries are kept as separate regions in order to distinguish the welfare, trade and unemployment effects of trade policy changes by country and highlight the importance of certain sectors to specific countries. South Africa also features as an individual region due to its economic importance in southern Africa and its membership in SACU. Madagascar has been kept as a separate region, as it is our understanding that it may join SADC at some future date. All ten countries that have acceded to the EU in May 2004 as well as the original 15 EU members are detailed separately in the Data Base, but have been aggregated into the EU region "eu" and the EU accession region "eua" respectively. The Mercosur region has been singled out in order to simulate a possible EU-Mercosur FTA and gain an idea of the effects on SADC economies of other FTAs concluded by the EU. However, it only combines Argentina, Brazil and Uruguay, since the Data Base does not contain country data for Paraguay. With Paraguay being rather small in relation to the other Mercosur partners, this seems a reasonable approximation allowing for a lower bound estimate of the effects on SADC countries. Finally, given the potential for trade diversion from other countries following an EU-SADC FTA, we split the rest of the world in separate developing and developed country groups in order to see whether other developing countries may be particularly disadvantaged. The following 15-region aggregation was employed: eua EU accession countries (10) eu EU-15 bwa Botswana zaf South Africa SACU xsc Rest of SACU moz Mozambique mwi Malawi SADC zmb Zambia zwe Zimbabwe tza Tanzania xsd Rest of SADC mdg Madagascar mrc Mercosur xdd Rest of developed countries xdg Rest of developing countries Sector Aggregation Traded commodities are divided in the following nine sectors: AnAg Animal agriculture, i.e. animal products nec; raw milk; wool, silkworm
cocoons; cattle etc.; meat; meat products Sugar Sugar cane and beet Crops Paddy rice; wheat; cereal grains nec; oil seeds; crops nec; vegetables, fruit, nuts FoodP Food products, i.e. vegetable oils and fats; dairy products; processed rice; food
products nec; sugar; beverages and tobacco products FuelMin Fuels and minerals, i.e. coal; oil; gas; minerals nec; TexClo Textiles and clothing, i.e. textiles; plant-based fibers, e.g. cotton; wearing
apparel; leather products HMnfcs Heavy manufactures and metals, i.e. chemical, rubber and plastic products;
paper products and publishing; wood products; petroleum, coal products; mineral products nec; metals; ferrous metals; metals nec; metal products
Agricultural commodities
6
7
LMnfcs Light manufactures, i.e. motor vehicles and parts; transport equipment nec; electronic equipment; machinery and equipment nec; forestry; fishing; manufactures nec
Svces Services, i.e. electricity; gas manufacture, distribution; water; construction; trade; transport nec; sea transport; air transport; communication; financial services nec; insurance; business services nec; recreation and other services; public administration, defence, health, education; dwellings
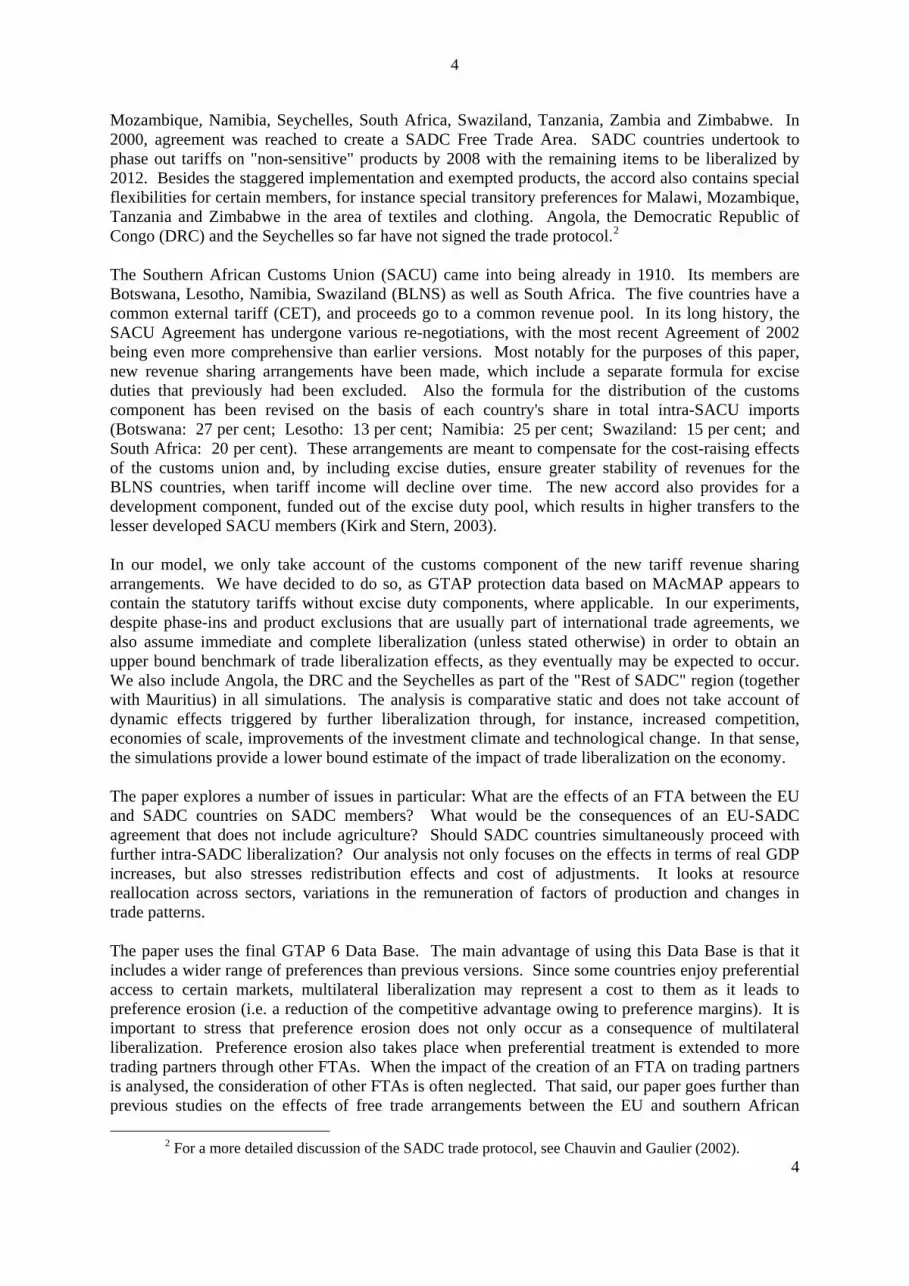
While this nine-commodity grouping still remains at a fairly high level of aggregation, it captures the most important sectoral impacts of different policy scenarios. We had experimented with more disaggregated versions of the Data Base (up to 15 sectors), but did not find the trade-off between more detailed results and the additional complexity involved worth our while. Production Structure, Trade Patterns and Tariff Protection Chart 1 provides a cross country comparison of the relative size of SADC economies. South Africa is by far the largest SADC country. The "Rest of SADC" region is also relatively important, being twice as large as Tanzania and Zimbabwe. Chart 1: Relative Size of SADC countries (based on value added)
bwa3%
zaf66%
xsc3%
moz2%
mwi1%
zmb2%
zwe5%
tza6%
xsd12%
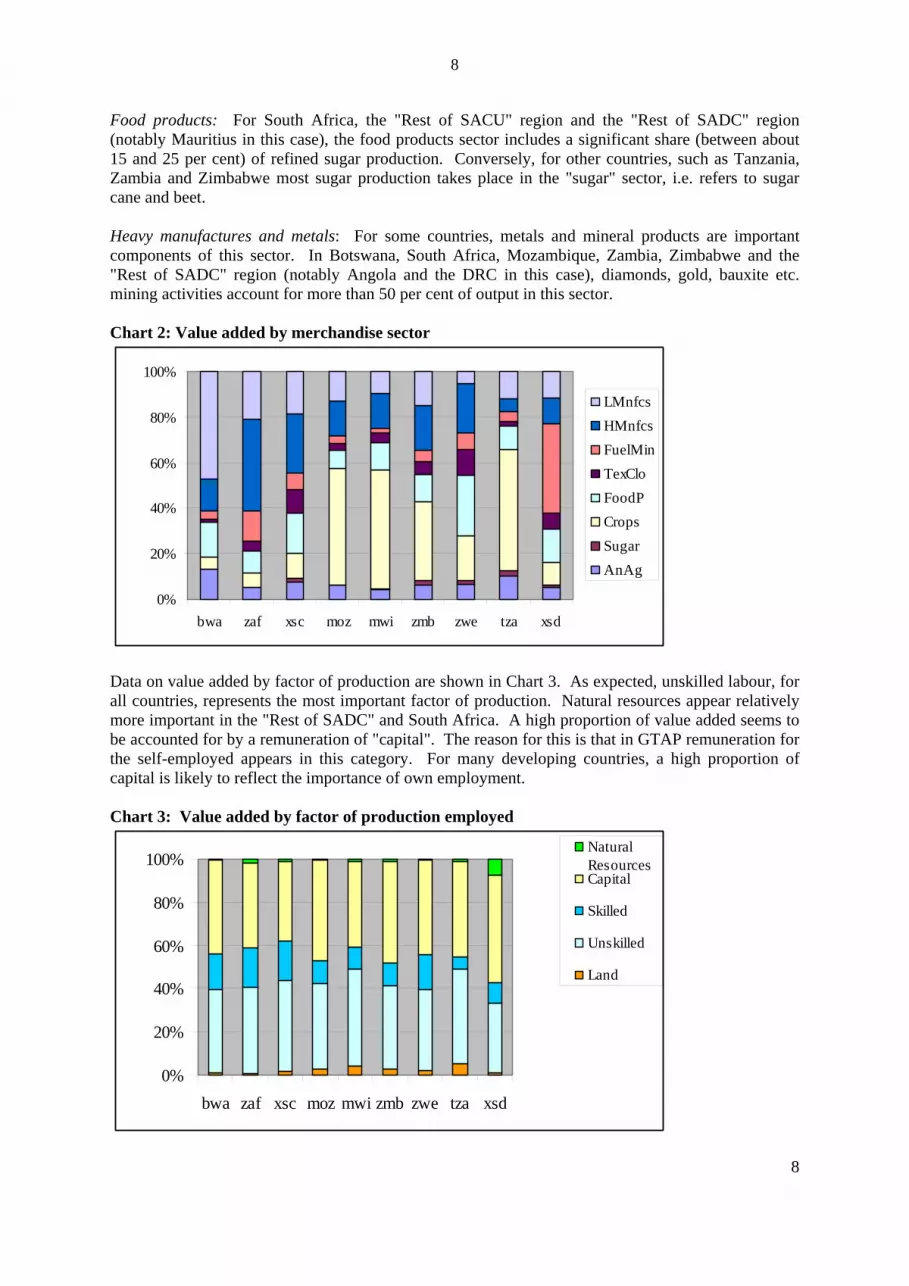
Turning to the production structure of SADC countries, it is important to stress that services constitute the largest share of value added for most SADC countries. It represents less than 50 per cent of value added only for the "Rest of SADC" and Tanzania. Chart 2 shows the production structure for merchandise sectors. It appears that crops production is very important in Mozambique, Tanzania and Malawi, fuel and mineral production in the "Rest of SADC", heavy manufacturing in South Africa, processed food in Zimbabwe and light manufacturing and animal agriculture in Botswana. A few interesting sectoral characteristics that may be hidden in the aggregated data should be kept in mind: Animal agriculture: For several countries, this sector is dominated by meat and meat products, in particular in Botswana, where it accounts for almost 90 per cent of total animal agriculture output, as well as in South Africa, the Rest of SACU and Zimbabwe where meat and meat products represent about three quarters of output in that sector. 7
8
8
Food products: For South Africa, the "Rest of SACU" region and the "Rest of SADC" region (notably Mauritius in this case), the food products sector includes a significant share (between about 15 and 25 per cent) of refined sugar production. Conversely, for other countries, such as Tanzania, Zambia and Zimbabwe most sugar production takes place in the "sugar" sector, i.e. refers to sugar cane and beet. Heavy manufactures and metals: For some countries, metals and mineral products are important components of this sector. In Botswana, South Africa, Mozambique, Zambia, Zimbabwe and the "Rest of SADC" region (notably Angola and the DRC in this case), diamonds, gold, bauxite etc. mining activities account for more than 50 per cent of output in this sector. Chart 2: Value added by merchandise sector
0%
20%
40%
60%
80%
100%
bwa zaf xsc moz mwi zmb zwe tza xsd
LMnfcsHMnfcsFuelMinTexCloFoodPCropsSugarAnAg
Data on value added by factor of production are shown in Chart 3. As expected, unskilled labour, for all countries, represents the most important factor of production. Natural resources appear relatively more important in the "Rest of SADC" and South Africa. A high proportion of value added seems to be accounted for by a remuneration of "capital". The reason for this is that in GTAP remuneration for the self-employed appears in this category. For many developing countries, a high proportion of capital is likely to reflect the importance of own employment. Chart 3: Value added by factor of production employed
0%
20%
40%
60%
80%
100%
bwa zaf xsc moz mwi zmb zwe tza xsd
NaturalResourcesCapital
Skilled
Unskilled
Land
PRELIMINARY DRAFT NOT FOR CITATION
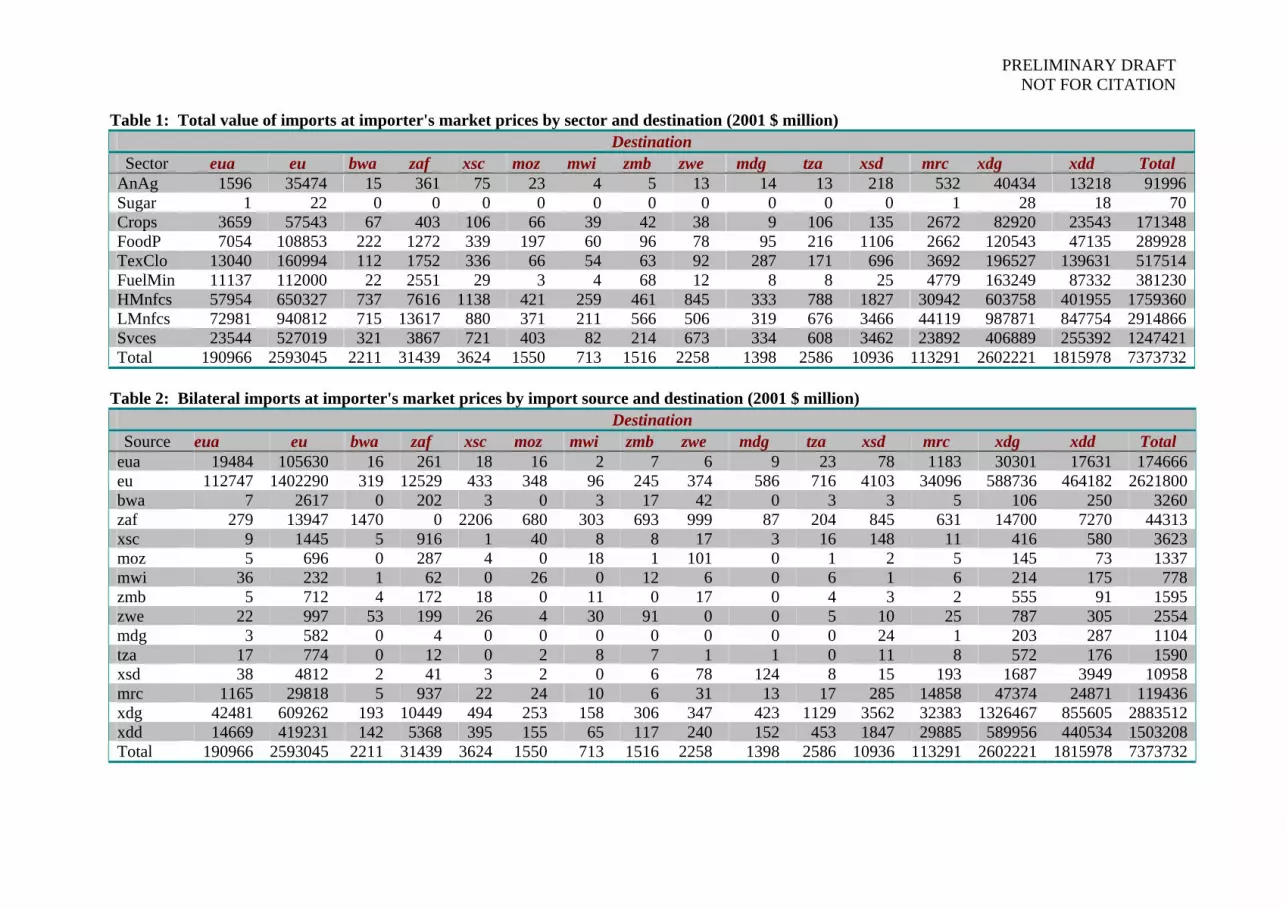
Table 1: Total value of imports at importer's market prices by sector and destination (2001 $ million) Destination
Sector eua eu bwa zaf xsc moz mwi zmb zwe mdg tza xsd mrc xdg xdd Total AnAg 1596 35474 15 361 75 23 4 5 13 14 13 218 532 40434 13218 91996 Sugar 1 22 0 0 0 0 0 0 0 0 0 0 1 28 18 70 Crops 3659 57543 67 403 106 66 39 42 38 9 106 135 2672 82920 23543 171348 FoodP 7054 108853 222 1272 339 197 60 96 78 95 216 1106 2662 120543 47135 289928 TexClo 13040 160994 112 1752 336 66 54 63 92 287 171 696 3692 196527 139631 517514 FuelMin 11137 112000 22 2551 29 3 4 68 12 8 8 25 4779 163249 87332 381230 HMnfcs 57954 650327 737 7616 1138 421 259 461 845 333 788 1827 30942 603758 401955 1759360 LMnfcs 72981 940812 715 13617 880 371 211 566 506 319 676 3466 44119 987871 847754 2914866 Svces 23544 527019 321 3867 721 403 82 214 673 334 608 3462 23892 406889 255392 1247421 Total 190966 2593045 2211 31439 3624 1550 713 1516 2258 1398 2586 10936 113291 2602221 1815978 7373732
Table 2: Bilateral imports at importer's market prices by import source and destination (2001 $ million)
Destination Source eua eu bwa zaf xsc moz mwi zmb zwe mdg tza xsd mrc xdg xdd Total
eua 19484 105630 16 261 18 16 2 7 6 9 23 78 1183 30301 17631 174666 eu 112747 1402290 319 12529 433 348 96 245 374 586 716 4103 34096 588736 464182 2621800 bwa 7 2617 0 202 3 0 3 17 42 0 3 3 5 106 250 3260 zaf 279 13947 1470 0 2206 680 303 693 999 87 204 845 631 14700 7270 44313 xsc 9 1445 5 916 1 40 8 8 17 3 16 148 11 416 580 3623 moz 5 696 0 287 4 0 18 1 101 0 1 2 5 145 73 1337 mwi 36 232 1 62 0 26 0 12 6 0 6 1 6 214 175 778 zmb 5 712 4 172 18 0 11 0 17 0 4 3 2 555 91 1595 zwe 22 997 53 199 26 4 30 91 0 0 5 10 25 787 305 2554 mdg 3 582 0 4 0 0 0 0 0 0 0 24 1 203 287 1104 tza 17 774 0 12 0 2 8 7 1 1 0 11 8 572 176 1590 xsd 38 4812 2 41 3 2 0 6 78 124 8 15 193 1687 3949 10958 mrc 1165 29818 5 937 22 24 10 6 31 13 17 285 14858 47374 24871 119436 xdg 42481 609262 193 10449 494 253 158 306 347 423 1129 3562 32383 1326467 855605 2883512 xdd 14669 419231 142 5368 395 155 65 117 240 152 453 1847 29885 589956 440534 1503208 Total 190966 2593045 2211 31439 3624 1550 713 1516 2258 1398 2586 10936 113291 2602221 1815978 7373732
PRELIMINARY DRAFT NOT FOR CITATION
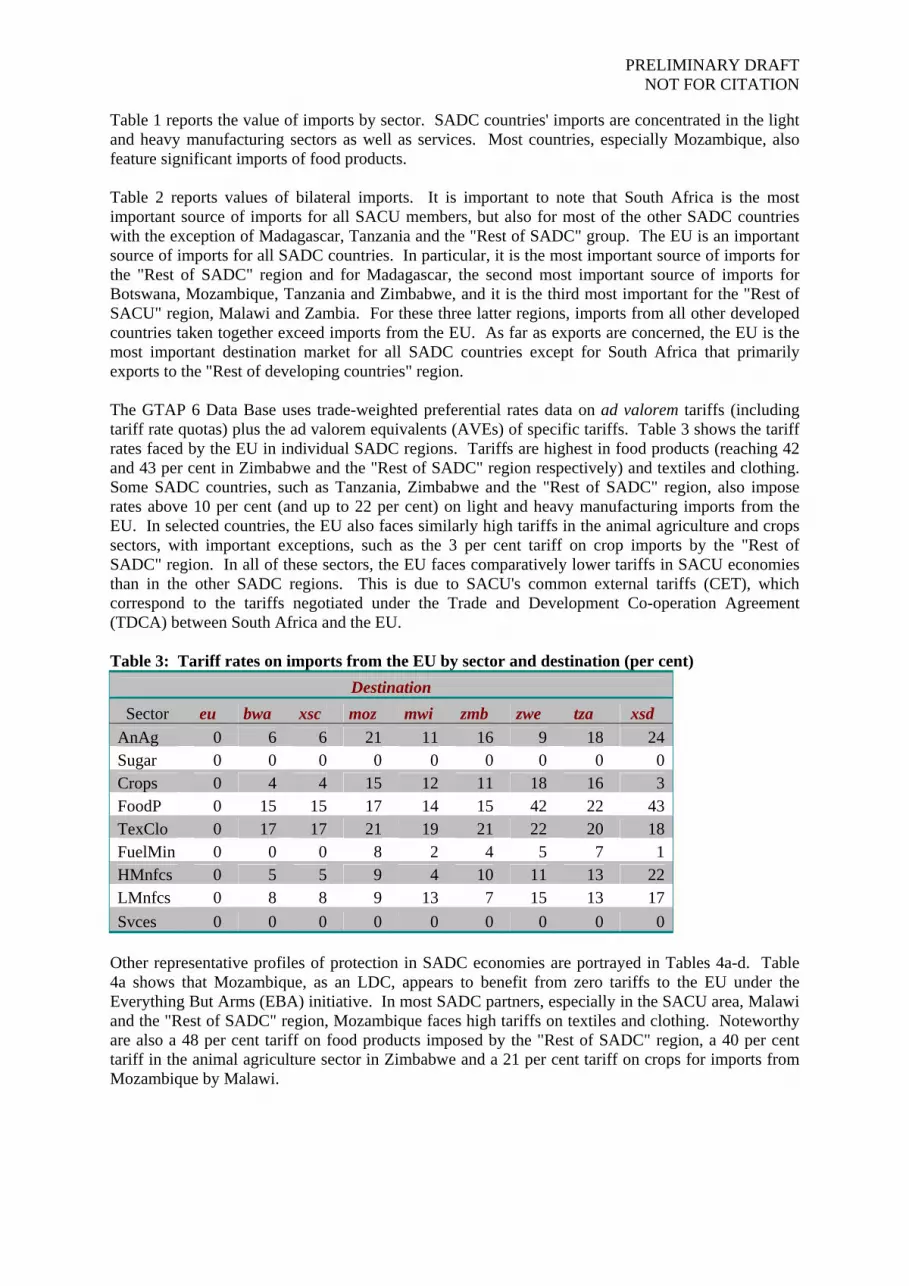
Table 1 reports the value of imports by sector. SADC countries' imports are concentrated in the light and heavy manufacturing sectors as well as services. Most countries, especially Mozambique, also feature significant imports of food products. Table 2 reports values of bilateral imports. It is important to note that South Africa is the most important source of imports for all SACU members, but also for most of the other SADC countries with the exception of Madagascar, Tanzania and the "Rest of SADC" group. The EU is an important source of imports for all SADC countries. In particular, it is the most important source of imports for the "Rest of SADC" region and for Madagascar, the second most important source of imports for Botswana, Mozambique, Tanzania and Zimbabwe, and it is the third most important for the "Rest of SACU" region, Malawi and Zambia. For these three latter regions, imports from all other developed countries taken together exceed imports from the EU. As far as exports are concerned, the EU is the most important destination market for all SADC countries except for South Africa that primarily exports to the "Rest of developing countries" region. The GTAP 6 Data Base uses trade-weighted preferential rates data on ad valorem tariffs (including tariff rate quotas) plus the ad valorem equivalents (AVEs) of specific tariffs. Table 3 shows the tariff rates faced by the EU in individual SADC regions. Tariffs are highest in food products (reaching 42 and 43 per cent in Zimbabwe and the "Rest of SADC" region respectively) and textiles and clothing. Some SADC countries, such as Tanzania, Zimbabwe and the "Rest of SADC" region, also impose rates above 10 per cent (and up to 22 per cent) on light and heavy manufacturing imports from the EU. In selected countries, the EU also faces similarly high tariffs in the animal agriculture and crops sectors, with important exceptions, such as the 3 per cent tariff on crop imports by the "Rest of SADC" region. In all of these sectors, the EU faces comparatively lower tariffs in SACU economies than in the other SADC regions. This is due to SACU's common external tariffs (CET), which correspond to the tariffs negotiated under the Trade and Development Co-operation Agreement (TDCA) between South Africa and the EU. Table 3: Tariff rates on imports from the EU by sector and destination (per cent)
Destination Sector eu bwa xsc moz mwi zmb zwe tza xsd
AnAg 0 6 6 21 11 16 9 18 24 Sugar 0 0 0 0 0 0 0 0 0 Crops 0 4 4 15 12 11 18 16 3 FoodP 0 15 15 17 14 15 42 22 43 TexClo 0 17 17 21 19 21 22 20 18 FuelMin 0 0 0 8 2 4 5 7 1 HMnfcs 0 5 5 9 4 10 11 13 22 LMnfcs 0 8 8 9 13 7 15 13 17 Svces 0 0 0 0 0 0 0 0 0
Other representative profiles of protection in SADC economies are portrayed in Tables 4a-d. Table 4a shows that Mozambique, as an LDC, appears to benefit from zero tariffs to the EU under the Everything But Arms (EBA) initiative. In most SADC partners, especially in the SACU area, Malawi and the "Rest of SADC" region, Mozambique faces high tariffs on textiles and clothing. Noteworthy are also a 48 per cent tariff on food products imposed by the "Rest of SADC" region, a 40 per cent tariff in the animal agriculture sector in Zimbabwe and a 21 per cent tariff on crops for imports from Mozambique by Malawi.
11
11
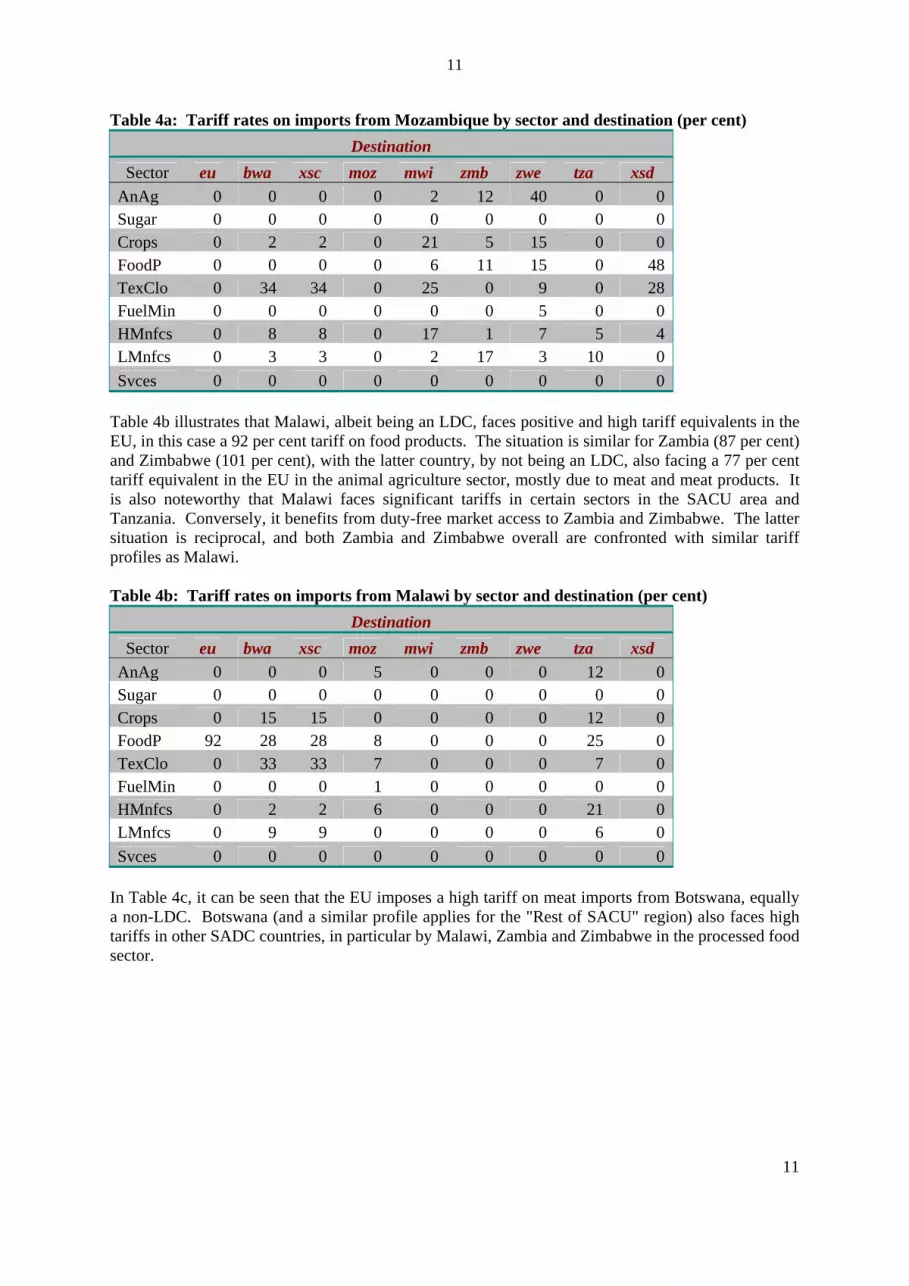
Table 4a: Tariff rates on imports from Mozambique by sector and destination (per cent) Destination
Sector eu bwa xsc moz mwi zmb zwe tza xsd AnAg 0 0 0 0 2 12 40 0 0 Sugar 0 0 0 0 0 0 0 0 0 Crops 0 2 2 0 21 5 15 0 0 FoodP 0 0 0 0 6 11 15 0 48 TexClo 0 34 34 0 25 0 9 0 28 FuelMin 0 0 0 0 0 0 5 0 0 HMnfcs 0 8 8 0 17 1 7 5 4 LMnfcs 0 3 3 0 2 17 3 10 0 Svces 0 0 0 0 0 0 0 0 0
Table 4b illustrates that Malawi, albeit being an LDC, faces positive and high tariff equivalents in the EU, in this case a 92 per cent tariff on food products. The situation is similar for Zambia (87 per cent) and Zimbabwe (101 per cent), with the latter country, by not being an LDC, also facing a 77 per cent tariff equivalent in the EU in the animal agriculture sector, mostly due to meat and meat products. It is also noteworthy that Malawi faces significant tariffs in certain sectors in the SACU area and Tanzania. Conversely, it benefits from duty-free market access to Zambia and Zimbabwe. The latter situation is reciprocal, and both Zambia and Zimbabwe overall are confronted with similar tariff profiles as Malawi. Table 4b: Tariff rates on imports from Malawi by sector and destination (per cent)
Destination Sector eu bwa xsc moz mwi zmb zwe tza xsd
AnAg 0 0 0 5 0 0 0 12 0 Sugar 0 0 0 0 0 0 0 0 0 Crops 0 15 15 0 0 0 0 12 0 FoodP 92 28 28 8 0 0 0 25 0 TexClo 0 33 33 7 0 0 0 7 0 FuelMin 0 0 0 1 0 0 0 0 0 HMnfcs 0 2 2 6 0 0 0 21 0 LMnfcs 0 9 9 0 0 0 0 6 0 Svces 0 0 0 0 0 0 0 0 0
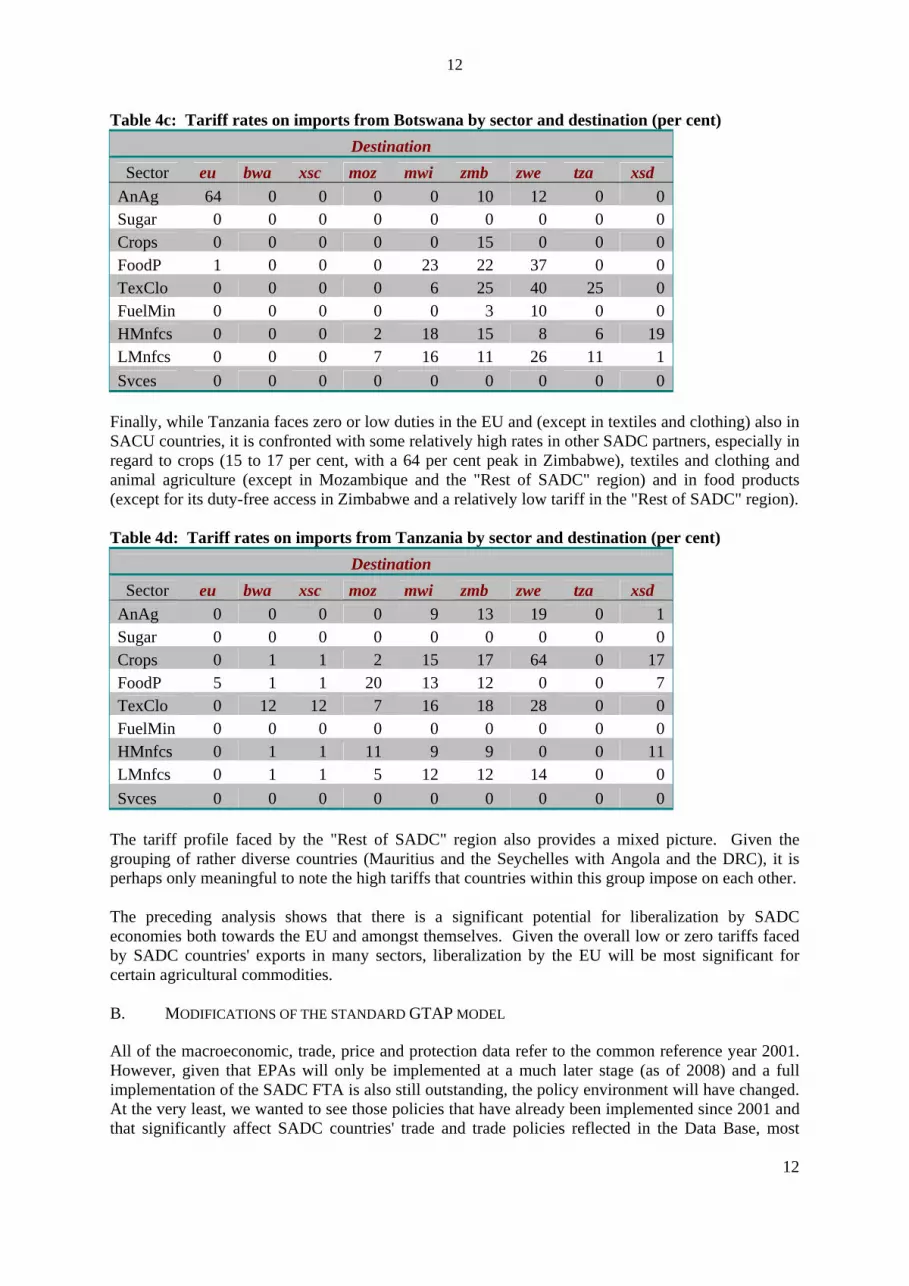
In Table 4c, it can be seen that the EU imposes a high tariff on meat imports from Botswana, equally a non-LDC. Botswana (and a similar profile applies for the "Rest of SACU" region) also faces high tariffs in other SADC countries, in particular by Malawi, Zambia and Zimbabwe in the processed food sector.
12
12
Table 4c: Tariff rates on imports from Botswana by sector and destination (per cent) Destination
Sector eu bwa xsc moz mwi zmb zwe tza xsd AnAg 64 0 0 0 0 10 12 0 0 Sugar 0 0 0 0 0 0 0 0 0 Crops 0 0 0 0 0 15 0 0 0 FoodP 1 0 0 0 23 22 37 0 0 TexClo 0 0 0 0 6 25 40 25 0 FuelMin 0 0 0 0 0 3 10 0 0 HMnfcs 0 0 0 2 18 15 8 6 19 LMnfcs 0 0 0 7 16 11 26 11 1 Svces 0 0 0 0 0 0 0 0 0
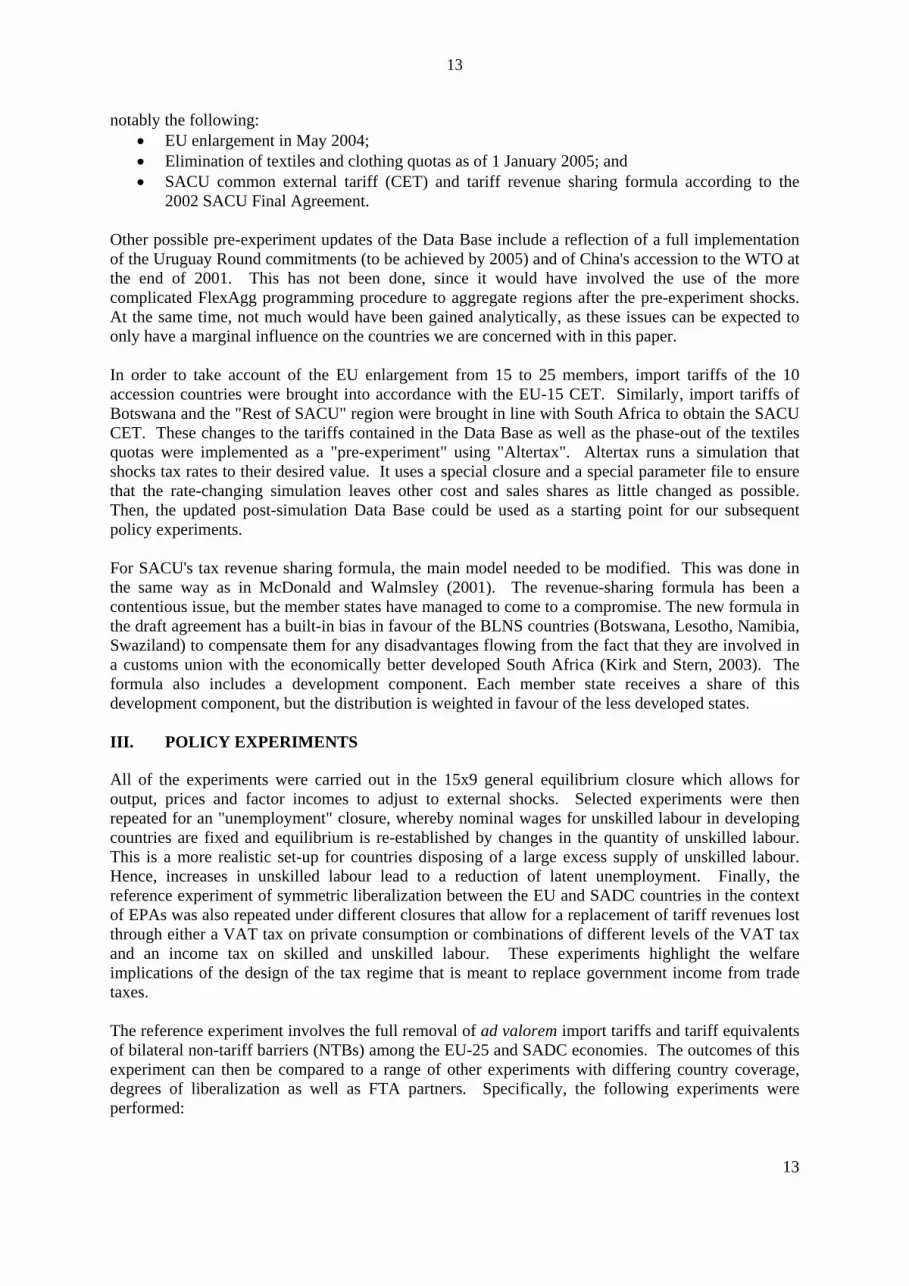
Finally, while Tanzania faces zero or low duties in the EU and (except in textiles and clothing) also in SACU countries, it is confronted with some relatively high rates in other SADC partners, especially in regard to crops (15 to 17 per cent, with a 64 per cent peak in Zimbabwe), textiles and clothing and animal agriculture (except in Mozambique and the "Rest of SADC" region) and in food products (except for its duty-free access in Zimbabwe and a relatively low tariff in the "Rest of SADC" region). Table 4d: Tariff rates on imports from Tanzania by sector and destination (per cent)
Destination Sector eu bwa xsc moz mwi zmb zwe tza xsd
AnAg 0 0 0 0 9 13 19 0 1 Sugar 0 0 0 0 0 0 0 0 0 Crops 0 1 1 2 15 17 64 0 17 FoodP 5 1 1 20 13 12 0 0 7 TexClo 0 12 12 7 16 18 28 0 0 FuelMin 0 0 0 0 0 0 0 0 0 HMnfcs 0 1 1 11 9 9 0 0 11 LMnfcs 0 1 1 5 12 12 14 0 0 Svces 0 0 0 0 0 0 0 0 0
The tariff profile faced by the "Rest of SADC" region also provides a mixed picture. Given the grouping of rather diverse countries (Mauritius and the Seychelles with Angola and the DRC), it is perhaps only meaningful to note the high tariffs that countries within this group impose on each other. The preceding analysis shows that there is a significant potential for liberalization by SADC economies both towards the EU and amongst themselves. Given the overall low or zero tariffs faced by SADC countries' exports in many sectors, liberalization by the EU will be most significant for certain agricultural commodities. B. MODIFICATIONS OF THE STANDARD GTAP MODEL
All of the macroeconomic, trade, price and protection data refer to the common reference year 2001. However, given that EPAs will only be implemented at a much later stage (as of 2008) and a full implementation of the SADC FTA is also still outstanding, the policy environment will have changed. At the very least, we wanted to see those policies that have already been implemented since 2001 and that significantly affect SADC countries' trade and trade policies reflected in the Data Base, most
13
13
notably the following: • EU enlargement in May 2004; • Elimination of textiles and clothing quotas as of 1 January 2005; and • SACU common external tariff (CET) and tariff revenue sharing formula according to the
2002 SACU Final Agreement. Other possible pre-experiment updates of the Data Base include a reflection of a full implementation of the Uruguay Round commitments (to be achieved by 2005) and of China's accession to the WTO at the end of 2001. This has not been done, since it would have involved the use of the more complicated FlexAgg programming procedure to aggregate regions after the pre-experiment shocks. At the same time, not much would have been gained analytically, as these issues can be expected to only have a marginal influence on the countries we are concerned with in this paper. In order to take account of the EU enlargement from 15 to 25 members, import tariffs of the 10 accession countries were brought into accordance with the EU-15 CET. Similarly, import tariffs of Botswana and the "Rest of SACU" region were brought in line with South Africa to obtain the SACU CET. These changes to the tariffs contained in the Data Base as well as the phase-out of the textiles quotas were implemented as a "pre-experiment" using "Altertax". Altertax runs a simulation that shocks tax rates to their desired value. It uses a special closure and a special parameter file to ensure that the rate-changing simulation leaves other cost and sales shares as little changed as possible. Then, the updated post-simulation Data Base could be used as a starting point for our subsequent policy experiments. For SACU's tax revenue sharing formula, the main model needed to be modified. This was done in the same way as in McDonald and Walmsley (2001). The revenue-sharing formula has been a contentious issue, but the member states have managed to come to a compromise. The new formula in the draft agreement has a built-in bias in favour of the BLNS countries (Botswana, Lesotho, Namibia, Swaziland) to compensate them for any disadvantages flowing from the fact that they are involved in a customs union with the economically better developed South Africa (Kirk and Stern, 2003). The formula also includes a development component. Each member state receives a share of this development component, but the distribution is weighted in favour of the less developed states. III. POLICY EXPERIMENTS
All of the experiments were carried out in the 15x9 general equilibrium closure which allows for output, prices and factor incomes to adjust to external shocks. Selected experiments were then repeated for an "unemployment" closure, whereby nominal wages for unskilled labour in developing countries are fixed and equilibrium is re-established by changes in the quantity of unskilled labour. This is a more realistic set-up for countries disposing of a large excess supply of unskilled labour. Hence, increases in unskilled labour lead to a reduction of latent unemployment. Finally, the reference experiment of symmetric liberalization between the EU and SADC countries in the context of EPAs was also repeated under different closures that allow for a replacement of tariff revenues lost through either a VAT tax on private consumption or combinations of different levels of the VAT tax and an income tax on skilled and unskilled labour. These experiments highlight the welfare implications of the design of the tax regime that is meant to replace government income from trade taxes. The reference experiment involves the full removal of ad valorem import tariffs and tariff equivalents of bilateral non-tariff barriers (NTBs) among the EU-25 and SADC economies. The outcomes of this experiment can then be compared to a range of other experiments with differing country coverage, degrees of liberalization as well as FTA partners. Specifically, the following experiments were performed:
14
14
Reference experiment • Free trade agreement between the EU-25 and SADC in the context of the EPA negotiations:
This experiment simulates a complete, symmetrical removal of import protection at a given point in time in the future. Although a complete removal of import protection is unlikely, commitments are expected to be asymmetrical (with a larger number of exceptions for SADC countries) and their implementation by SADC countries is to be staggered over a longer time-period, this experiment provides a useful upper bound estimate of trade and output effects in SADC economies.
Country coverage
• Free trade agreement between the EU-25 and SADC and preferential free trade area among SADC economies: In addition to the reference scenario, import protection (both tariffs and NTBs) within the SADC region are removed, but external protection by each country against the rest of the world is maintained. Again, an upper bound estimate is given. A comparison to the reference experiment provides an important indication of the extent to which trade diversion from other SADC partners to the EU can be avoided through simultaneous intra-SADC liberalization.
• SADC free trade area: This experiment serves to isolate the effects of exclusive liberalization among SADC economies.
• Full multilateral trade liberalization: This experiment simulates a hypothetical scenario of a Doha Round that would eliminate all import barriers by all regions. It gives a useful benchmark of how various regional integration efforts measure up to a total multilateral removal of import protection.
Degree of liberalization
• Partial liberalization (excluding agriculture): In such experiments, import protection is removed for manufactures only. The results can be compared to scenarios that include agricultural liberalization in order to estimate the importance of the latter for individual SADC economies.
• Total liberalization of not only import barriers, but also of export subsides and taxes as well as product-specific domestic support and taxes: This experiment can be used to identify those countries in the SADC region that would particularly benefit from a simultaneous elimination of agricultural subsidies in the context of the Doha negotiations.
FTA partners
• EU-25 FTA with Mercosur: These experiments contain the complete removal of import barriers between the EU-25 and Mercosur. Although an unlikely outcome of the on-going EU-Mercosur negotiations, this experimental set-up can be used to show how benefits from an EU-SADC FTA following the EPA negotiations or from non-reciprocal preferences given by the EU to SADC countries may be affected by a simultaneous engagement of the EU-25 with other FTA partners.
IV. RESULTS
This Section analyses the results of the experiments described above. It is organised in four Subsections. The first one (Subsection A) focuses on the welfare effects for SADC countries of different liberalization policies. On the basis of the payoffs estimated in the simulations of different scenarios of liberalization, the benefits of further intra-SADC liberalization, EPAs and multilateral liberalization relative to one another will be discussed for each SADC region. In this context, the consequences for SADC countries of the EU signing multiple regional agreements with different partners will be analysed by including an EU-Mercusur FTA in the simulations. Moreover, separate experiments will attempt to isolate the importance of agriculture in the negotiations and, in particular, the removal of subsidies.
15
Subsection B analyses the redistributive effects of liberalization. Specialization impacts on the production structure and factor incomes (of skilled and unskilled labour, capital, land and natural resources) will be highlighted. Subsections C and D focus on the impact of the EU-SADC free trade agreement on trade patterns and the rate of unemployment in SADC economies respectively. Finally, the effects of trade liberalization on tax revenue will be highlighted, and the relative merits of different tax replacement scenarios will be examined. In order to provide the reader with a clear message, each Subsection only compares a subset of experiments. A. WELFARE EFFECTS
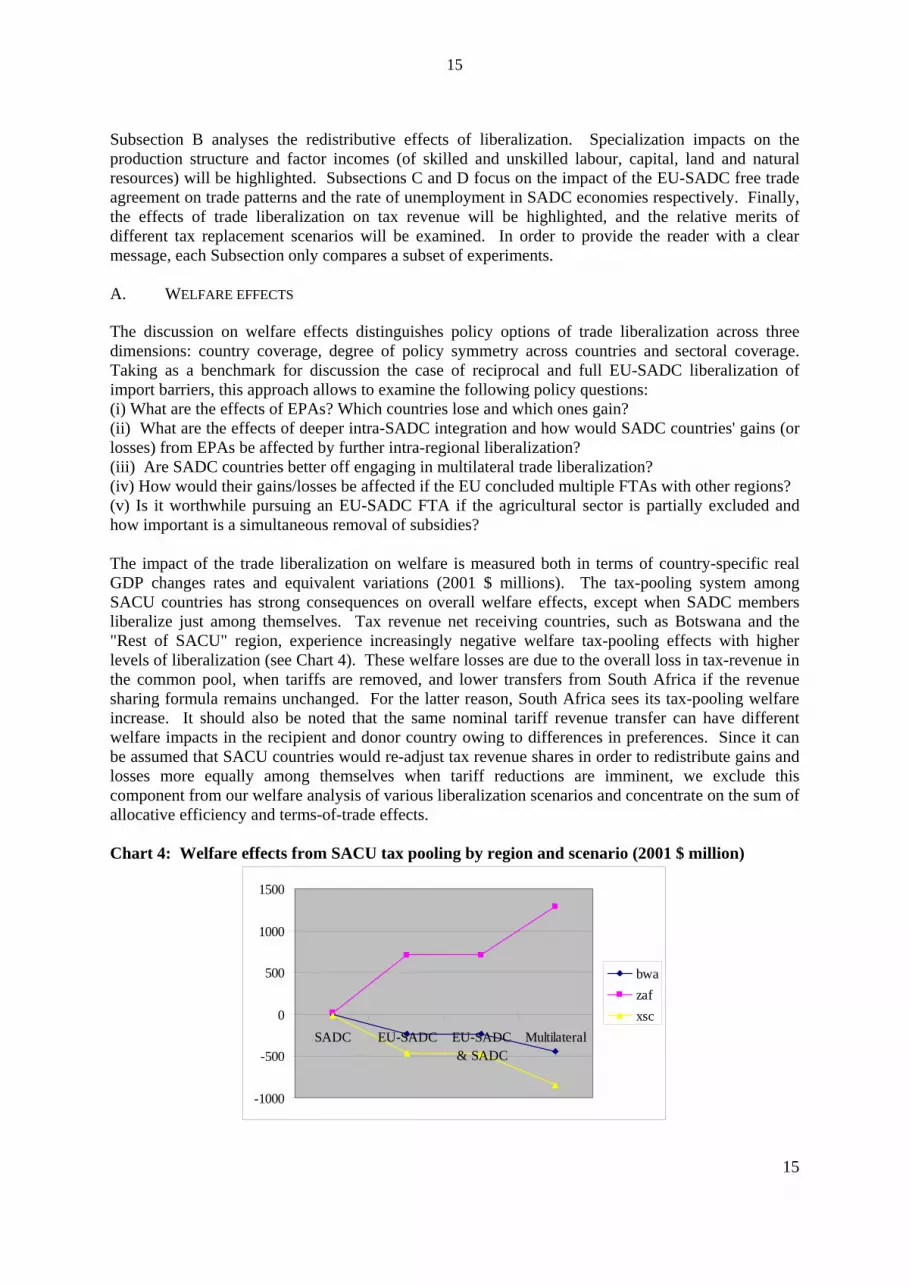
The discussion on welfare effects distinguishes policy options of trade liberalization across three dimensions: country coverage, degree of policy symmetry across countries and sectoral coverage. Taking as a benchmark for discussion the case of reciprocal and full EU-SADC liberalization of import barriers, this approach allows to examine the following policy questions: (i) What are the effects of EPAs? Which countries lose and which ones gain? (ii) What are the effects of deeper intra-SADC integration and how would SADC countries' gains (or losses) from EPAs be affected by further intra-regional liberalization? (iii) Are SADC countries better off engaging in multilateral trade liberalization? (iv) How would their gains/losses be affected if the EU concluded multiple FTAs with other regions? (v) Is it worthwhile pursuing an EU-SADC FTA if the agricultural sector is partially excluded and how important is a simultaneous removal of subsidies? The impact of the trade liberalization on welfare is measured both in terms of country-specific real GDP changes rates and equivalent variations (2001 $ millions). The tax-pooling system among SACU countries has strong consequences on overall welfare effects, except when SADC members liberalize just among themselves. Tax revenue net receiving countries, such as Botswana and the "Rest of SACU" region, experience increasingly negative welfare tax-pooling effects with higher levels of liberalization (see Chart 4). These welfare losses are due to the overall loss in tax-revenue in the common pool, when tariffs are removed, and lower transfers from South Africa if the revenue sharing formula remains unchanged. For the latter reason, South Africa sees its tax-pooling welfare increase. It should also be noted that the same nominal tariff revenue transfer can have different welfare impacts in the recipient and donor country owing to differences in preferences. Since it can be assumed that SACU countries would re-adjust tax revenue shares in order to redistribute gains and losses more equally among themselves when tariff reductions are imminent, we exclude this component from our welfare analysis of various liberalization scenarios and concentrate on the sum of allocative efficiency and terms-of-trade effects. Chart 4: Welfare effects from SACU tax pooling by region and scenario (2001 $ million)
-1000
-500
0
500
1000
1500
SADC EU-SADC EU-SADC& SADC
Multilateral
bwazafxsc
15
16
16
1. Regional or multilateral trade liberalization?
(a) Allocative efficiency and terms of trade effects
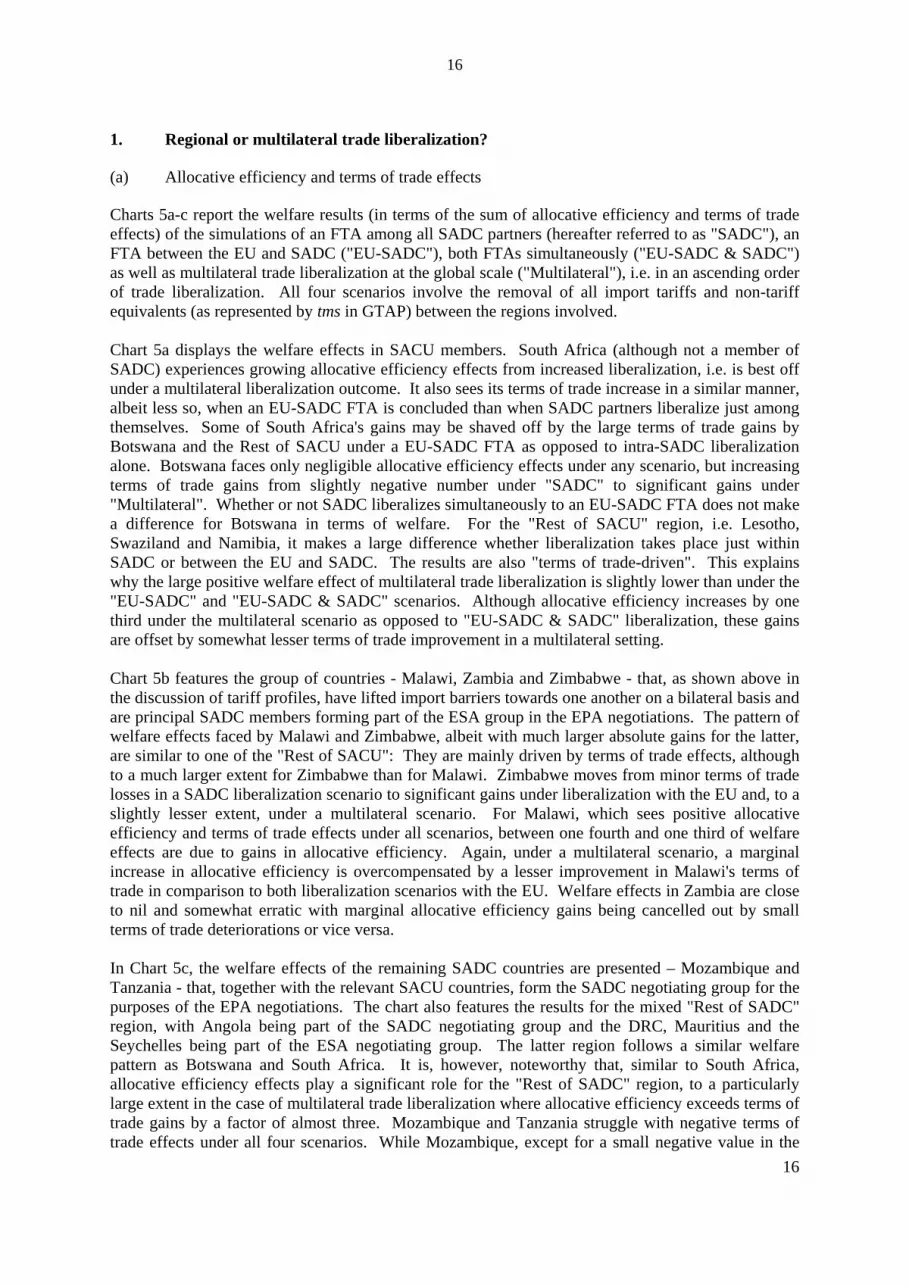
Charts 5a-c report the welfare results (in terms of the sum of allocative efficiency and terms of trade effects) of the simulations of an FTA among all SADC partners (hereafter referred to as "SADC"), an FTA between the EU and SADC ("EU-SADC"), both FTAs simultaneously ("EU-SADC & SADC") as well as multilateral trade liberalization at the global scale ("Multilateral"), i.e. in an ascending order of trade liberalization. All four scenarios involve the removal of all import tariffs and non-tariff equivalents (as represented by tms in GTAP) between the regions involved. Chart 5a displays the welfare effects in SACU members. South Africa (although not a member of SADC) experiences growing allocative efficiency effects from increased liberalization, i.e. is best off under a multilateral liberalization outcome. It also sees its terms of trade increase in a similar manner, albeit less so, when an EU-SADC FTA is concluded than when SADC partners liberalize just among themselves. Some of South Africa's gains may be shaved off by the large terms of trade gains by Botswana and the Rest of SACU under a EU-SADC FTA as opposed to intra-SADC liberalization alone. Botswana faces only negligible allocative efficiency effects under any scenario, but increasing terms of trade gains from slightly negative number under "SADC" to significant gains under "Multilateral". Whether or not SADC liberalizes simultaneously to an EU-SADC FTA does not make a difference for Botswana in terms of welfare. For the "Rest of SACU" region, i.e. Lesotho, Swaziland and Namibia, it makes a large difference whether liberalization takes place just within SADC or between the EU and SADC. The results are also "terms of trade-driven". This explains why the large positive welfare effect of multilateral trade liberalization is slightly lower than under the "EU-SADC" and "EU-SADC & SADC" scenarios. Although allocative efficiency increases by one third under the multilateral scenario as opposed to "EU-SADC & SADC" liberalization, these gains are offset by somewhat lesser terms of trade improvement in a multilateral setting. Chart 5b features the group of countries - Malawi, Zambia and Zimbabwe - that, as shown above in the discussion of tariff profiles, have lifted import barriers towards one another on a bilateral basis and are principal SADC members forming part of the ESA group in the EPA negotiations. The pattern of welfare effects faced by Malawi and Zimbabwe, albeit with much larger absolute gains for the latter, are similar to one of the "Rest of SACU": They are mainly driven by terms of trade effects, although to a much larger extent for Zimbabwe than for Malawi. Zimbabwe moves from minor terms of trade losses in a SADC liberalization scenario to significant gains under liberalization with the EU and, to a slightly lesser extent, under a multilateral scenario. For Malawi, which sees positive allocative efficiency and terms of trade effects under all scenarios, between one fourth and one third of welfare effects are due to gains in allocative efficiency. Again, under a multilateral scenario, a marginal increase in allocative efficiency is overcompensated by a lesser improvement in Malawi's terms of trade in comparison to both liberalization scenarios with the EU. Welfare effects in Zambia are close to nil and somewhat erratic with marginal allocative efficiency gains being cancelled out by small terms of trade deteriorations or vice versa. In Chart 5c, the welfare effects of the remaining SADC countries are presented – Mozambique and Tanzania - that, together with the relevant SACU countries, form the SADC negotiating group for the purposes of the EPA negotiations. The chart also features the results for the mixed "Rest of SADC" region, with Angola being part of the SADC negotiating group and the DRC, Mauritius and the Seychelles being part of the ESA negotiating group. The latter region follows a similar welfare pattern as Botswana and South Africa. It is, however, noteworthy that, similar to South Africa, allocative efficiency effects play a significant role for the "Rest of SADC" region, to a particularly large extent in the case of multilateral trade liberalization where allocative efficiency exceeds terms of trade gains by a factor of almost three. Mozambique and Tanzania struggle with negative terms of trade effects under all four scenarios. While Mozambique, except for a small negative value in the
17
EU-SADC scenario, always faces positive allocative efficiency effects, this is the case for Tanzania only when multilateral liberalization is achieved at the global level. Charts 5a, 5b and 5c: Welfare effects by country and scenario (2001 $ million)
-200
0
200
400
600
800
1000
1200
1400
1600
SADC EU-SADC EU-SADC &SADC
Multilateral
bwaxsczaf
-50
0
50
100
150
200
250
300
SADC EU-SADC EU-SADC &SADC
Multilateral
mwizmbzwe
-100
0
100
200
300
400
500
600
SADC EU-SADC EU-SADC &SADC
Multilateral
moztzaxsd
Note: Welfare is calculated as the sum of allocative efficiency and terms of trade effect. The overall negative values for these two countries seem worrying, but may be due to inherent limitations of concept of "equivalent variation" used to measure welfare. In our study, the main
17problem appears to relate to the importance of terms of trade changes. The GTAP model
18
18
) Changes in real GDP
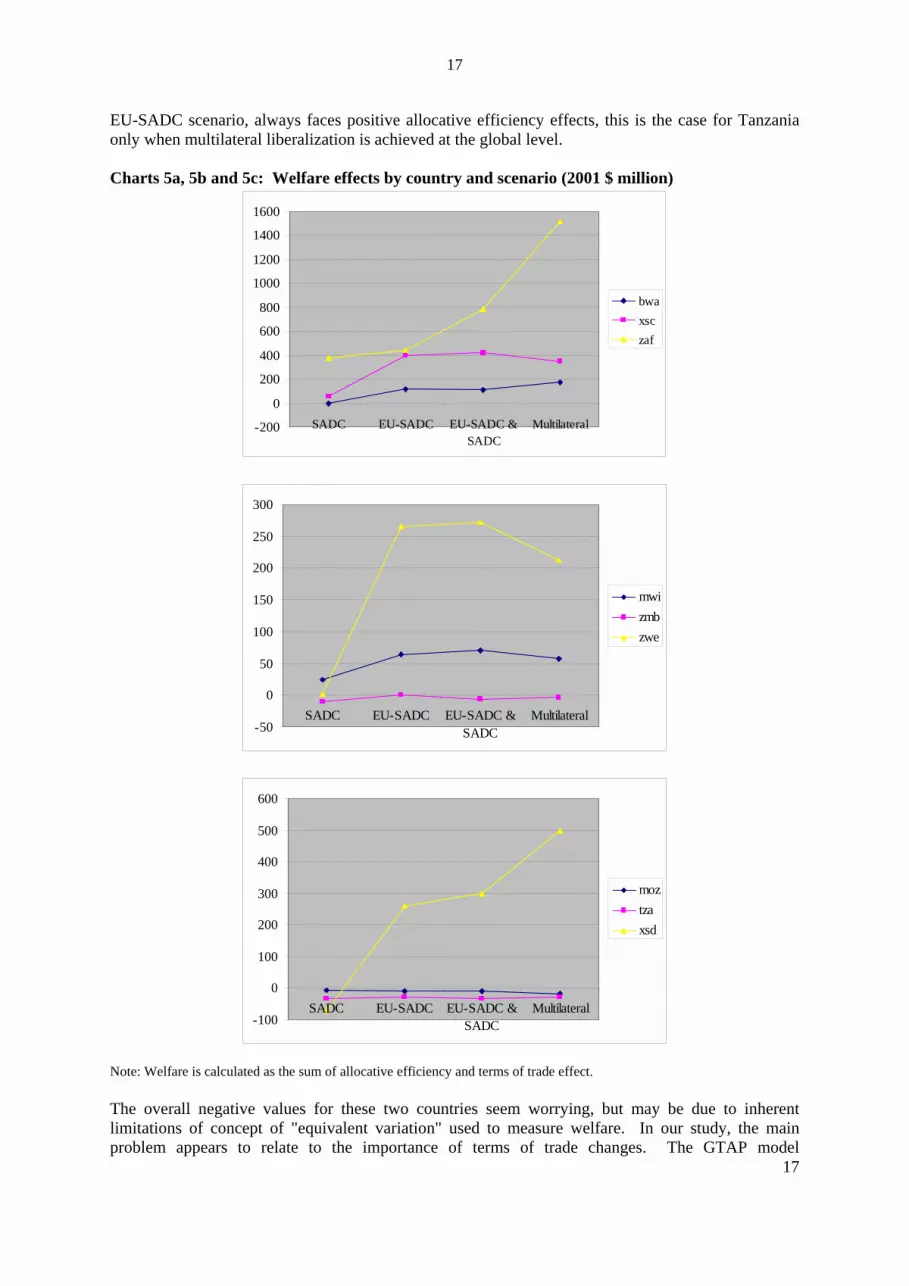
From Chart 6, it can be seen that all countries register positive changes in real GDP under the
evertheless, it should also be noted that EU-SADC liberalization is the only scenario (except for
hart 6: Changes in real GDP by country and scenario (per cent)
differentiates products by country of origin ("Armington" assumption). Changes in the terms of trade can come about from changes in the relative prices of different source-specific varieties of the same commodity, as every region in the model acts as a "large" country that can influence prices. For instance, a region will tend to experience a terms of trade deterioration if it imports source-specific varieties that rise in price relative to prices of the same commodity from other sources. This may lead to an exaggeration of terms of trade effects, as, in reality, a country may import at a world price that remains largely unaffected by other "small" countries. It is therefore useful to look at the sensitivity of welfare results in response to alternative values for key parameters, in particular the Armington elasticities. Also, as another way to look at the real impact of trade liberalization on a country, changes in real GDP can be analyzed. Policy-makers can be expected to be more interested in real output changes than in equivalent variation as a money-metric expression of consumer utility. Real GDP changes in the four scenarios will be examined in the following, before a sensitivity analysis is carried out for the EU-SADC FTA scenario. (b
multilateral scenario. Moreover, for all regions of the model, except Malawi featuring slightly higher rates under an EU-SADC FTA, multilateral trade liberalization results in the highest real GDP increases (with a maximum 1.9 per cent in the "Rest of SADC" region). It is also noteworthy that the EU cannot expect major growth impacts from liberalization with SADC, with its real GDP barely rising by 0.01 per cent. Conversely, South Africa, the "Rest of SACU" region, Malawi, Zimbabwe, Mozambique and the "Rest of SADC" region are the major beneficiaries from liberalization with the EU in terms of real GDP expansion. It is important to note that for Mozambique and the "Rest of SADC" region, simultaneous liberalization within SADC is crucial in order to reap these benefits. NTanzania, which experiences a positive development in real GDP only for multilateral trade liberalization), in which some countries face real GDP reductions. These are relatively small though (ranging from 0.06 per cent in Botswana to 0.17 per cent in Zambia), especially in comparison to the increases achieved by other SADC members under an EU-SADC FTA, amounting to 0.22 per cent for Zimbabwe, 0.28 per cent for the "Rest of SACU" region and 0.87 per cent for Malawi. For Malawi and Zimbabwe, the difference between an FTA with the EU plus intra-SADC liberalization and multilateral trade liberalization is almost negligible. These results reflect the relatively high proportion of trade by these two countries accounted for by the EU and other SADC partners.
-0.4
-0.2
0
0.2
0.4
0.6
0.8
1
bwa zaf xsc mwi zmb zwe moz tza xsd
SADC
EU-SADC
EU-SADC & SADC
Multilateral
C
19
(c) Sensitivity analysis
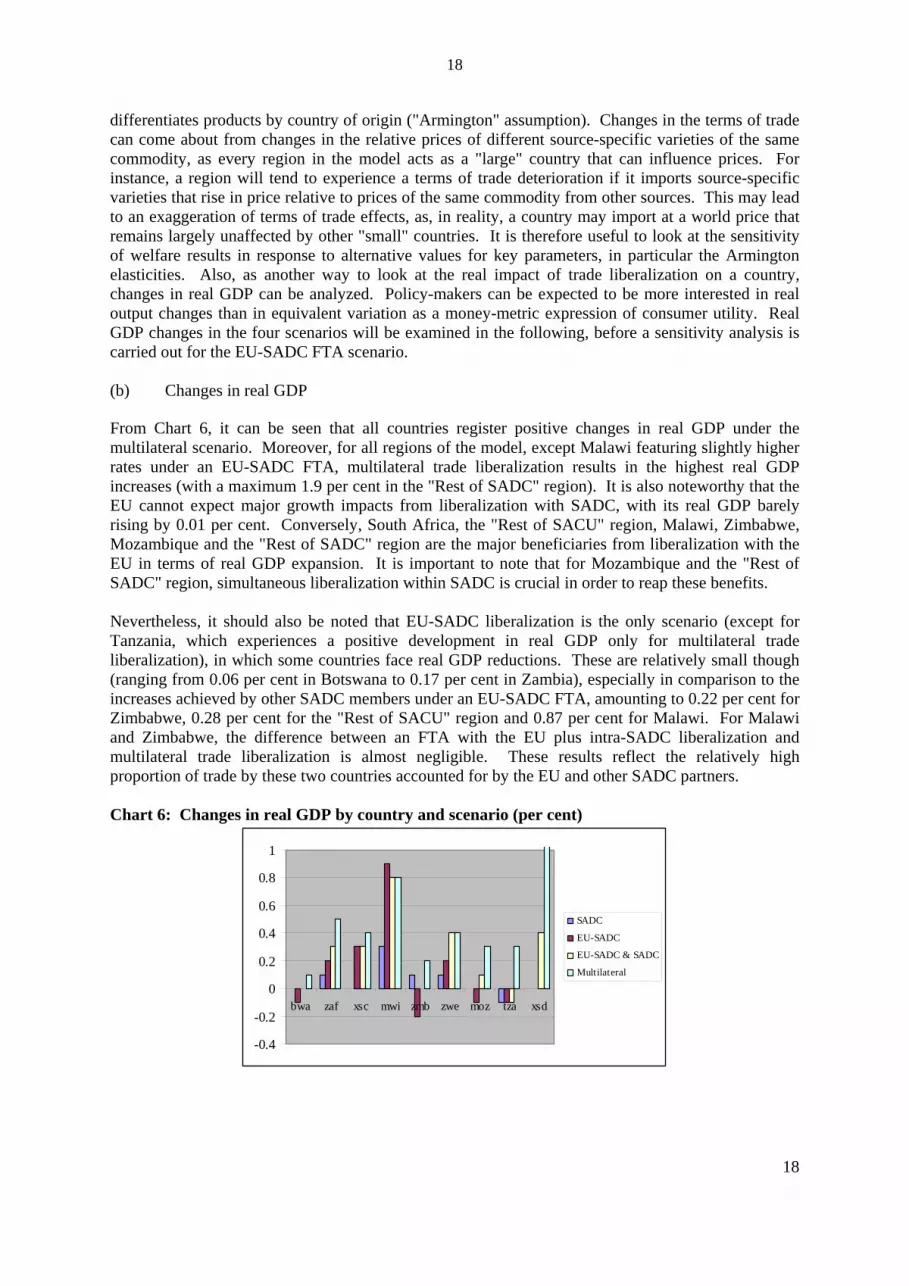
Given the our positive assessment of all four liberalization scenarios in terms of real GDP developments, how reliable are these results? In particular, given the model set-up, as discussed earlier, how sensitive are they to the assumed values for the Armington parameters? We have carried out a sensitivity analysis by solving the model several times (for different values of the Armington parameters within a range of +/- 50 per cent of the original value). The distributions of the values of each endogenous variable, including the one of our interest, changes in real GDP, are summarised by their means and standard deviations. From these, it is possible to infer information about the likely values and range of the endogenous variables and to attach confidence intervals depending on the assumed shape of the distribution of the respective endogenous variable.4 If no assumptions about its distribution are made, according to Chebyshev’s inequality, one can be about 75 per cent confident that the values for real GDP changes lie within two standard deviations of the mean (when the Armington parameters vary as indicated above). These estimates are wider than they would be if the distribution was known and, hence, probably too pessimistic. If the assumption is made that the results are approximately normally distributed, the confidence level rises to 95 per cent that the true value lies two standard deviations above or below the mean. The estimated mean values and standard deviations of real GDP changes under an EU-SADC FTA assuming a plus/minus 50 per cent variation in the Armington parameters are given below in Chart X. For most SADC regions, variability, as displayed by plus/minus two standard deviations in the Chart, is quite large, in particular for Malawi with a lower bound of 0.18 per cent and an upper bound of 1.6 per cent (not shown in the Chart). With the exception of the "Rest of SADC" region, variation as given in the Chart does not tend to lead to a change in sign. If (despite any theoretical foundation) a normal distribution is assumed, Malawi, for instance, has only a 1.24 per cent risk that real GDP changes will be negative. It is also noteworthy that for most countries, the estimated mean real GDP changes, despite large variations in the Armington parameters, are higher than in the original scenario. Chart 7: Sensitivity of real GDP changes to 50 per cent variations in Armington parameters (per cent)
-0.4
-0.2
0
0.2
0.4
0.6
0.8
1
bwa zaf xsc mwi zmb zwe moz tza xsd
qgdp Mean witn +/- 2*SD interval
2. Multiple regional free trade agreements
When economists analyze the impact of the formation of a preferential FTA on a country's welfare, they usually perform their analysis ceteris paribus, with everything else unchanged. This is what we have done so far when examining the impact of the formation of an FTA between the EU and SADC. But we have neglected that the EU is currently negotiating an FTA with Mercusur countries as well, which could be assumed to be implemented at the same time as its FTA with SADC. The EU is the most important source of imports for Mercosur but it is also an important destination for Mercosur countries' exports (second only to the aggregate of the "Rest of developing countries" region in our
19
4 One cannot assume that an endogenous variable is uniformly or symmetrically distributed (even when the varied parameter is so distributed).
20
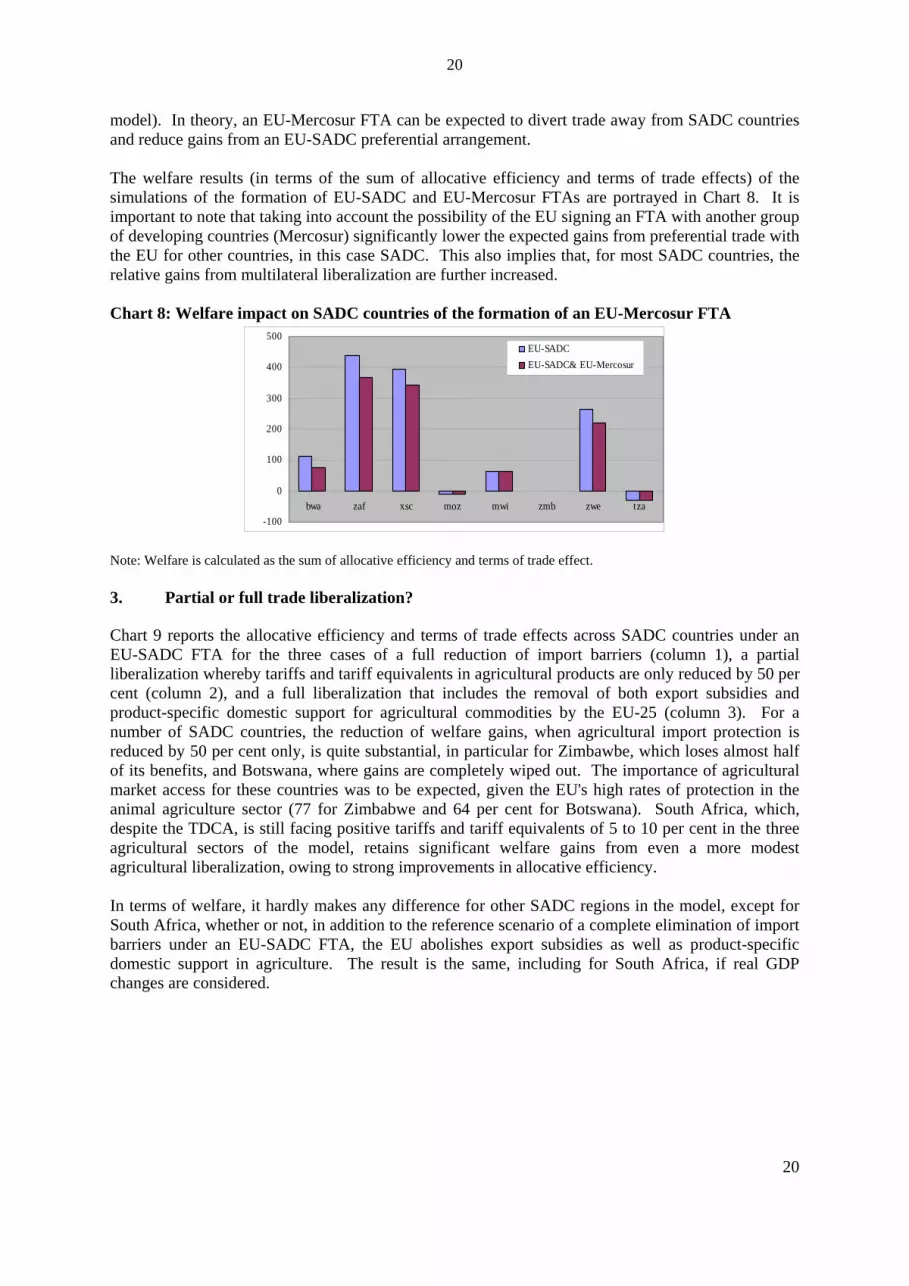
model). In theory, an EU-Mercosur FTA can be expected to divert trade away from SADC countries and reduce gains from an EU-SADC preferential arrangement. The welfare results (in terms of the sum of allocative efficiency and terms of trade effects) of the simulations of the formation of EU-SADC and EU-Mercosur FTAs are portrayed in Chart 8. It is important to note that taking into account the possibility of the EU signing an FTA with another group of developing countries (Mercosur) significantly lower the expected gains from preferential trade with the EU for other countries, in this case SADC. This also implies that, for most SADC countries, the relative gains from multilateral liberalization are further increased. Chart 8: Welfare impact on SADC countries of the formation of an EU-Mercosur FTA
-100
0
100
200
300
400
500
bwa zaf xsc moz mwi zmb zwe tza
EU-SADCEU-SADC& EU-Mercosur
Note: Welfare is calculated as the sum of allocative efficiency and terms of trade effect. 3. Partial or full trade liberalization?
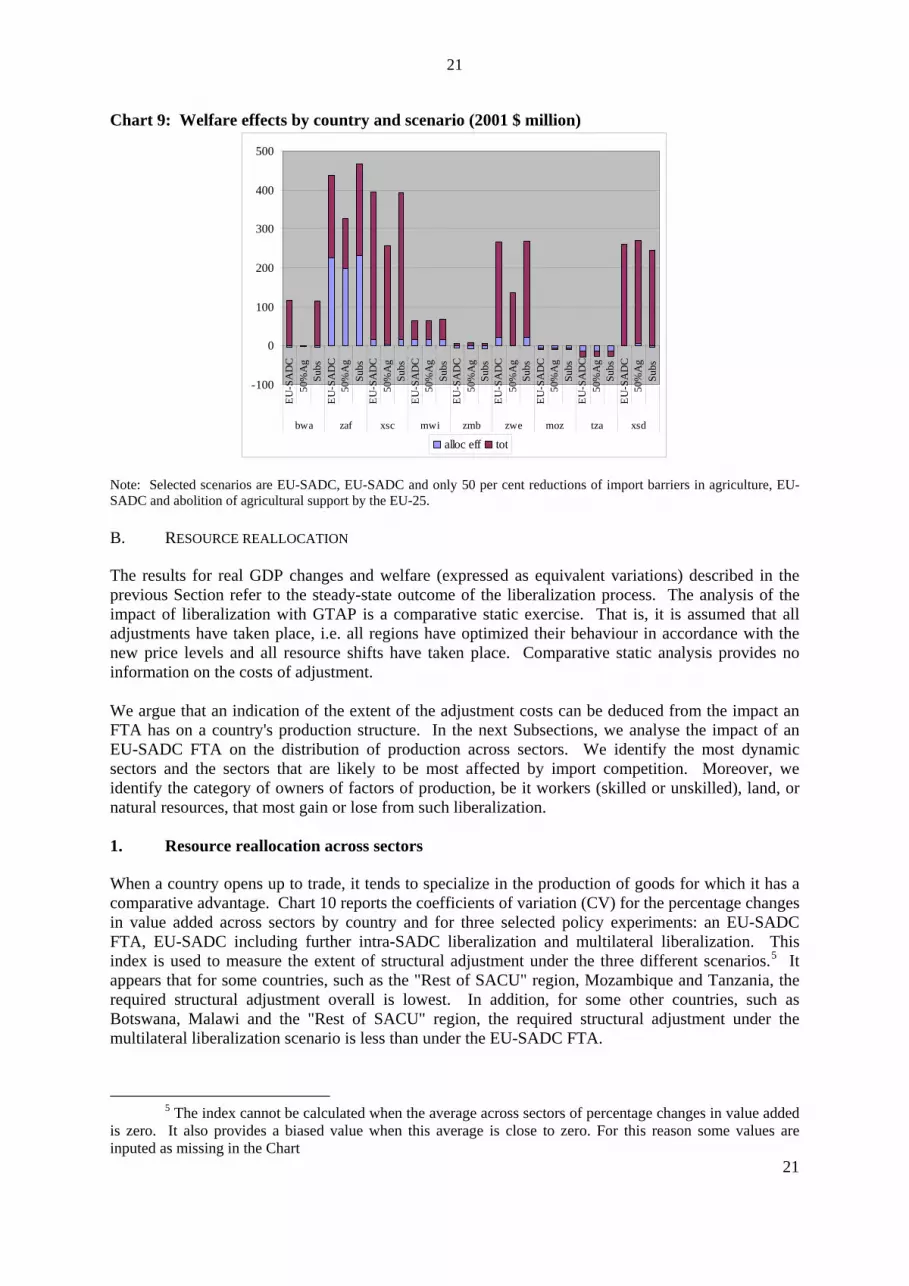
Chart 9 reports the allocative efficiency and terms of trade effects across SADC countries under an EU-SADC FTA for the three cases of a full reduction of import barriers (column 1), a partial liberalization whereby tariffs and tariff equivalents in agricultural products are only reduced by 50 per cent (column 2), and a full liberalization that includes the removal of both export subsidies and product-specific domestic support for agricultural commodities by the EU-25 (column 3). For a number of SADC countries, the reduction of welfare gains, when agricultural import protection is reduced by 50 per cent only, is quite substantial, in particular for Zimbawbe, which loses almost half of its benefits, and Botswana, where gains are completely wiped out. The importance of agricultural market access for these countries was to be expected, given the EU's high rates of protection in the animal agriculture sector (77 for Zimbabwe and 64 per cent for Botswana). South Africa, which, despite the TDCA, is still facing positive tariffs and tariff equivalents of 5 to 10 per cent in the three agricultural sectors of the model, retains significant welfare gains from even a more modest agricultural liberalization, owing to strong improvements in allocative efficiency. In terms of welfare, it hardly makes any difference for other SADC regions in the model, except for South Africa, whether or not, in addition to the reference scenario of a complete elimination of import barriers under an EU-SADC FTA, the EU abolishes export subsidies as well as product-specific domestic support in agriculture. The result is the same, including for South Africa, if real GDP changes are considered.
20
21
Chart 9: Welfare effects by country and scenario (2001 $ million)
-100
0
100
200
300
400
500
EU-S
AD
C50
%A
gSu
bsEU
-SA
DC
50%
Ag
Subs
EU-S
AD
C50
%A
gSu
bsEU
-SA
DC
50%
Ag
Subs
EU-S
AD
C50
%A
gSu
bsEU
-SA
DC
50%
Ag
Subs
EU-S
AD
C50
%A
gSu
bsEU
-SA
DC
50%
Ag
Subs
EU-S
AD
C50
%A
gSu
bs
bwa zaf xsc mwi zmb zwe moz tza xsd
alloc eff tot
Note: Selected scenarios are EU-SADC, EU-SADC and only 50 per cent reductions of import barriers in agriculture, EU-SADC and abolition of agricultural support by the EU-25. B. RESOURCE REALLOCATION
The results for real GDP changes and welfare (expressed as equivalent variations) described in the previous Section refer to the steady-state outcome of the liberalization process. The analysis of the impact of liberalization with GTAP is a comparative static exercise. That is, it is assumed that all adjustments have taken place, i.e. all regions have optimized their behaviour in accordance with the new price levels and all resource shifts have taken place. Comparative static analysis provides no information on the costs of adjustment. We argue that an indication of the extent of the adjustment costs can be deduced from the impact an FTA has on a country's production structure. In the next Subsections, we analyse the impact of an EU-SADC FTA on the distribution of production across sectors. We identify the most dynamic sectors and the sectors that are likely to be most affected by import competition. Moreover, we identify the category of owners of factors of production, be it workers (skilled or unskilled), land, or natural resources, that most gain or lose from such liberalization. 1. Resource reallocation across sectors
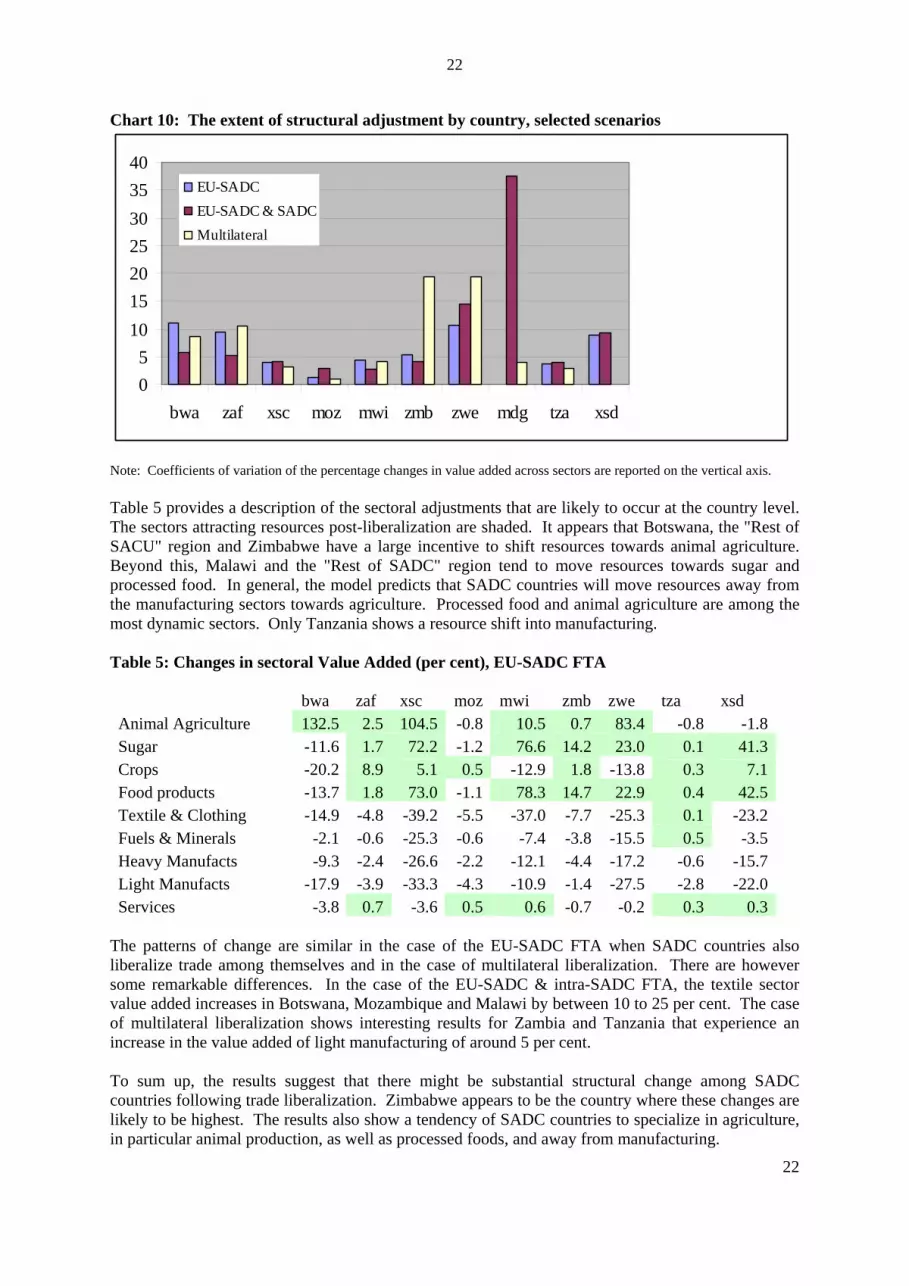
When a country opens up to trade, it tends to specialize in the production of goods for which it has a comparative advantage. Chart 10 reports the coefficients of variation (CV) for the percentage changes in value added across sectors by country and for three selected policy experiments: an EU-SADC FTA, EU-SADC including further intra-SADC liberalization and multilateral liberalization. This index is used to measure the extent of structural adjustment under the three different scenarios.5 It appears that for some countries, such as the "Rest of SACU" region, Mozambique and Tanzania, the required structural adjustment overall is lowest. In addition, for some other countries, such as Botswana, Malawi and the "Rest of SACU" region, the required structural adjustment under the multilateral liberalization scenario is less than under the EU-SADC FTA.
21
5 The index cannot be calculated when the average across sectors of percentage changes in value added is zero. It also provides a biased value when this average is close to zero. For this reason some values are inputed as missing in the Chart
22
Chart 10: The extent of structural adjustment by country, selected scenarios
05
10152025303540
bwa zaf xsc moz mwi zmb zwe mdg tza xsd
EU-SADCEU-SADC & SADCMultilateral
Note: Coefficients of variation of the percentage changes in value added across sectors are reported on the vertical axis. Table 5 provides a description of the sectoral adjustments that are likely to occur at the country level. The sectors attracting resources post-liberalization are shaded. It appears that Botswana, the "Rest of SACU" region and Zimbabwe have a large incentive to shift resources towards animal agriculture. Beyond this, Malawi and the "Rest of SADC" region tend to move resources towards sugar and processed food. In general, the model predicts that SADC countries will move resources away from the manufacturing sectors towards agriculture. Processed food and animal agriculture are among the most dynamic sectors. Only Tanzania shows a resource shift into manufacturing. Table 5: Changes in sectoral Value Added (per cent), EU-SADC FTA bwa zaf xsc moz mwi zmb zwe tza xsd Animal Agriculture 132.5 2.5 104.5 -0.8 10.5 0.7 83.4 -0.8 -1.8Sugar -11.6 1.7 72.2 -1.2 76.6 14.2 23.0 0.1 41.3Crops -20.2 8.9 5.1 0.5 -12.9 1.8 -13.8 0.3 7.1Food products -13.7 1.8 73.0 -1.1 78.3 14.7 22.9 0.4 42.5Textile & Clothing -14.9 -4.8 -39.2 -5.5 -37.0 -7.7 -25.3 0.1 -23.2Fuels & Minerals -2.1 -0.6 -25.3 -0.6 -7.4 -3.8 -15.5 0.5 -3.5Heavy Manufacts -9.3 -2.4 -26.6 -2.2 -12.1 -4.4 -17.2 -0.6 -15.7Light Manufacts -17.9 -3.9 -33.3 -4.3 -10.9 -1.4 -27.5 -2.8 -22.0Services -3.8 0.7 -3.6 0.5 0.6 -0.7 -0.2 0.3 0.3
The patterns of change are similar in the case of the EU-SADC FTA when SADC countries also liberalize trade among themselves and in the case of multilateral liberalization. There are however some remarkable differences. In the case of the EU-SADC & intra-SADC FTA, the textile sector value added increases in Botswana, Mozambique and Malawi by between 10 to 25 per cent. The case of multilateral liberalization shows interesting results for Zambia and Tanzania that experience an increase in the value added of light manufacturing of around 5 per cent. To sum up, the results suggest that there might be substantial structural change among SADC countries following trade liberalization. Zimbabwe appears to be the country where these changes are likely to be highest. The results also show a tendency of SADC countries to specialize in agriculture, in particular animal production, as well as processed foods, and away from manufacturing.
22
23
2. Income redistribution effects
Liberalization also affects a country's income distribution. Shifts of resources across sectors also bring about variations in the demand for different factors. The demand for the factor of production used intensively in the sectors in which a country tends to specialize will increase and so will the remuneration of this factor. Table 6 reports the estimated impact on real wages of skilled and unskilled labour as well as on the real remuneration of capital, land and natural resources across countries for the case of the EU-SADC FTA. The results suggest that real remunerations for land owners increase in most SADC countries. In particular, the figures show a significant increase in the remuneration of land in Botswana and the "Rest of SACU" region. This is consistent with tendency of these countries to specialize in animal agriculture. A special case is represented by Malawi. Here, the model predicts a redistribution of income from unskilled workers and land owners toward skilled workers and owners of capital. This is likely to be an implication of Malawi's tendency to specialize in the processed food sector after liberalization. The case of the "Rest of SADC" region is similar, as it also moves resources towards food products. A comparison across different scenarios demonstrates that results are quite robust. The patterns of income redistribution are similar in the case of the EU-SADC FTA with intra-SADC liberalization and in the case of multilateral liberalization. Significant differences only emerge for Mozambique and Zambia where the remuneration for capital and skilled labour is expected to increase relatively more both in the case of the EU-SADC & intra-SADC FTA and in the case of multilateral liberalization. This is consistent with the results for changes in value added, and it is likely to be driven by Mozambique's move towards textile production and Zambia's increase in the value added of light manufacturing. Table 6: Changes in real production factors remunerations (per cent), EU-SADC FTA
bwa zaf xsc mwi zmb zwe moz tza xsd Unskilled -1.6 0.8 4.1 1.7 0.9 3.0 0.1 0.1 6.6 Skilled -4.3 1.1 1.6 7.0 0.1 2.6 0.6 0.6 7.0 Land 267.2 25.9 245.2 -37.1 8.9 28.0 1.3 1.1 33.1 Capital -0.1 0.9 8.1 9.3 -0.3 3.9 0.5 0.5 7.9 Natural Resources -14.0 -3.8 -55.2 -18.5 -6.0 -57.4 -3.9 -1.6 -16.7
A close-up of the labour market shows that for most of SADC countries (South Africa, Mozambique, Malawi, Tanzania and the "Rest of SADC" region) real wages for skilled worker tend to increase relatively more than those for unskilled workers. This implies that an EU-SADC FTA entails an incentive for people to educate their children. The standard GTAP model does not allow to measure the dynamic impact of trade liberalization. However, the economic literature provides some evidence of a positive impact of education on growth. Moreover, GTAP does not allow for an analysis of the impact of trade liberalization on inequality within a country or on poverty, and household survey data would be required for such analysis. The GTAP Data Base does not contain information on the number of poor people. However, assuming that most of the poor population falls in the category "unskilled workers", the results of this Section seem to hint to a positive impact of liberalization on poverty. The net effect of liberalization on the income of the poor will depend on the impact on their wages (if that it is their only source of income), but also on the employment effects. The analysis of wage variations of this Section is carried out under the assumption of full employment. An analysis of the effects of liberalization in the case of unemployment is reported in Section D.
23
24
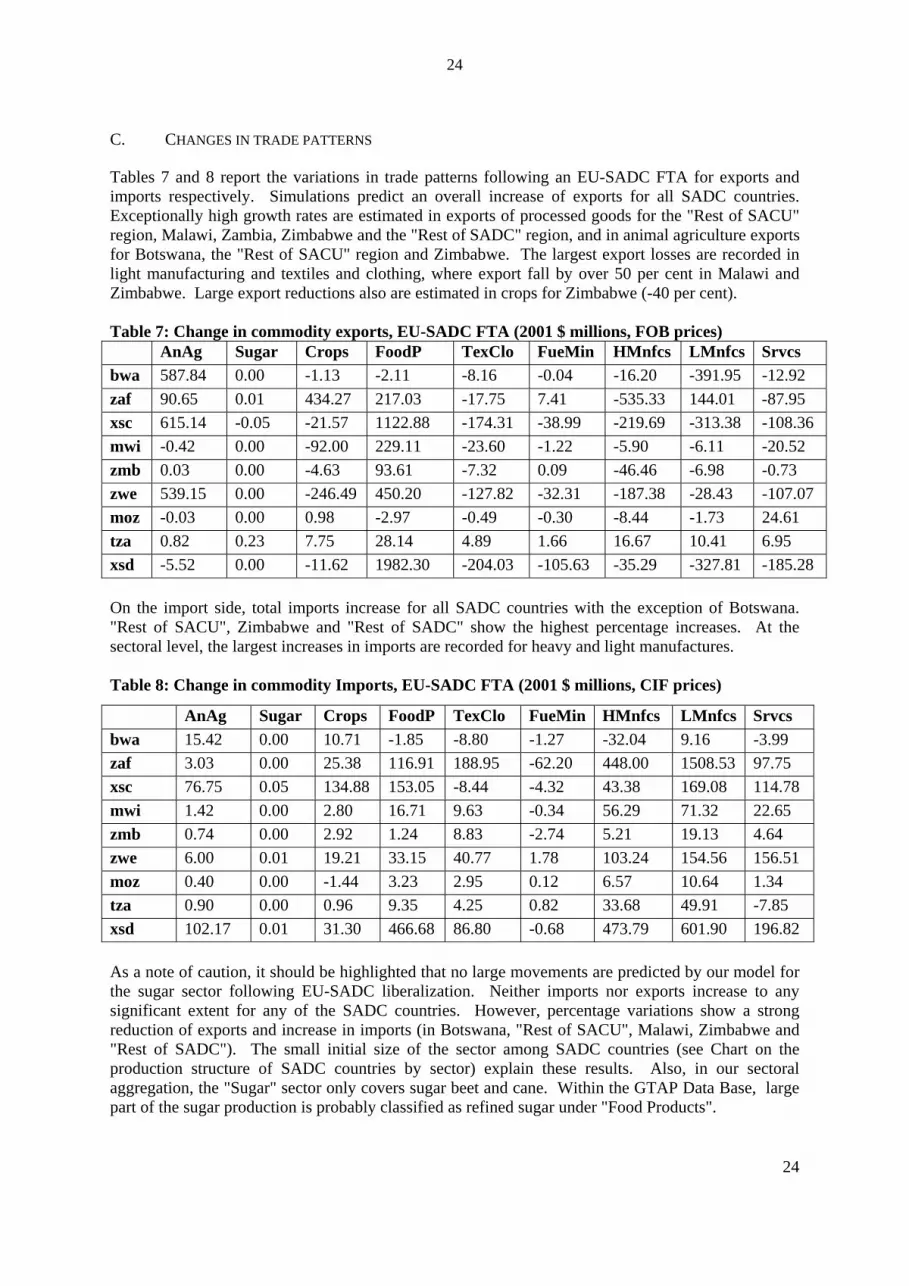
C. CHANGES IN TRADE PATTERNS
Tables 7 and 8 report the variations in trade patterns following an EU-SADC FTA for exports and imports respectively. Simulations predict an overall increase of exports for all SADC countries. Exceptionally high growth rates are estimated in exports of processed goods for the "Rest of SACU" region, Malawi, Zambia, Zimbabwe and the "Rest of SADC" region, and in animal agriculture exports for Botswana, the "Rest of SACU" region and Zimbabwe. The largest export losses are recorded in light manufacturing and textiles and clothing, where export fall by over 50 per cent in Malawi and Zimbabwe. Large export reductions also are estimated in crops for Zimbabwe (-40 per cent). Table 7: Change in commodity exports, EU-SADC FTA (2001 $ millions, FOB prices) AnAg Sugar Crops FoodP TexClo FueMin HMnfcs LMnfcs Srvcs bwa 587.84 0.00 -1.13 -2.11 -8.16 -0.04 -16.20 -391.95 -12.92 zaf 90.65 0.01 434.27 217.03 -17.75 7.41 -535.33 144.01 -87.95 xsc 615.14 -0.05 -21.57 1122.88 -174.31 -38.99 -219.69 -313.38 -108.36 mwi -0.42 0.00 -92.00 229.11 -23.60 -1.22 -5.90 -6.11 -20.52 zmb 0.03 0.00 -4.63 93.61 -7.32 0.09 -46.46 -6.98 -0.73 zwe 539.15 0.00 -246.49 450.20 -127.82 -32.31 -187.38 -28.43 -107.07 moz -0.03 0.00 0.98 -2.97 -0.49 -0.30 -8.44 -1.73 24.61 tza 0.82 0.23 7.75 28.14 4.89 1.66 16.67 10.41 6.95 xsd -5.52 0.00 -11.62 1982.30 -204.03 -105.63 -35.29 -327.81 -185.28 On the import side, total imports increase for all SADC countries with the exception of Botswana. "Rest of SACU", Zimbabwe and "Rest of SADC" show the highest percentage increases. At the sectoral level, the largest increases in imports are recorded for heavy and light manufactures. Table 8: Change in commodity Imports, EU-SADC FTA (2001 $ millions, CIF prices)
AnAg Sugar Crops FoodP TexClo FueMin HMnfcs LMnfcs Srvcs bwa 15.42 0.00 10.71 -1.85 -8.80 -1.27 -32.04 9.16 -3.99 zaf 3.03 0.00 25.38 116.91 188.95 -62.20 448.00 1508.53 97.75 xsc 76.75 0.05 134.88 153.05 -8.44 -4.32 43.38 169.08 114.78 mwi 1.42 0.00 2.80 16.71 9.63 -0.34 56.29 71.32 22.65 zmb 0.74 0.00 2.92 1.24 8.83 -2.74 5.21 19.13 4.64 zwe 6.00 0.01 19.21 33.15 40.77 1.78 103.24 154.56 156.51 moz 0.40 0.00 -1.44 3.23 2.95 0.12 6.57 10.64 1.34 tza 0.90 0.00 0.96 9.35 4.25 0.82 33.68 49.91 -7.85 xsd 102.17 0.01 31.30 466.68 86.80 -0.68 473.79 601.90 196.82
As a note of caution, it should be highlighted that no large movements are predicted by our model for the sugar sector following EU-SADC liberalization. Neither imports nor exports increase to any significant extent for any of the SADC countries. However, percentage variations show a strong reduction of exports and increase in imports (in Botswana, "Rest of SACU", Malawi, Zimbabwe and "Rest of SADC"). The small initial size of the sector among SADC countries (see Chart on the production structure of SADC countries by sector) explain these results. Also, in our sectoral aggregation, the "Sugar" sector only covers sugar beet and cane. Within the GTAP Data Base, large part of the sugar production is probably classified as refined sugar under "Food Products".
24
25
25
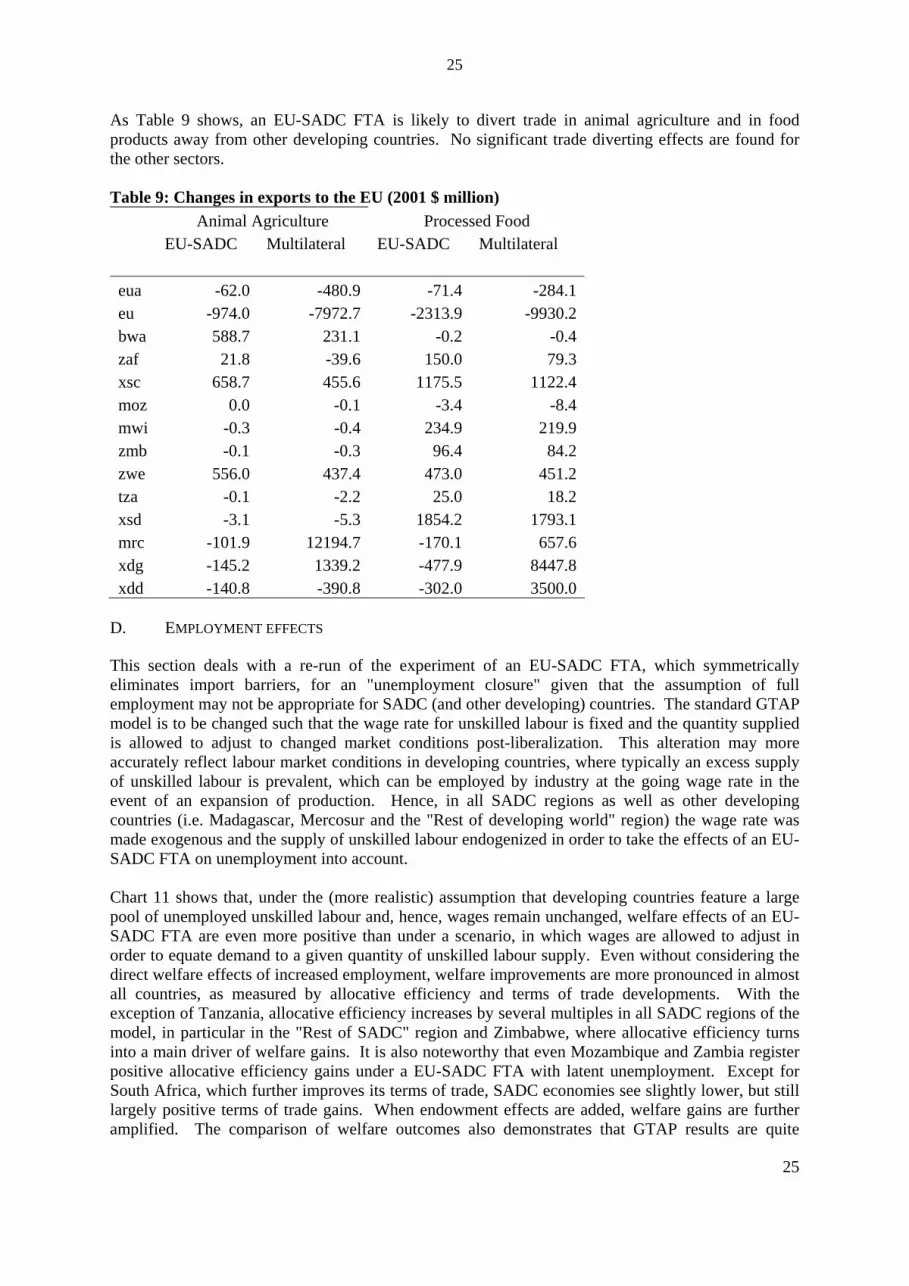
As Table 9 shows, an EU-SADC FTA is likely to divert trade in animal agriculture and in food products away from other developing countries. No significant trade diverting effects are found for the other sectors. Table 9: Changes in exports to the EU (2001 $ million) Animal Agriculture Processed Food EU-SADC Multilateral EU-SADC Multilateral eua -62.0 -480.9 -71.4 -284.1 eu -974.0 -7972.7 -2313.9 -9930.2 bwa 588.7 231.1 -0.2 -0.4 zaf 21.8 -39.6 150.0 79.3 xsc 658.7 455.6 1175.5 1122.4 moz 0.0 -0.1 -3.4 -8.4 mwi -0.3 -0.4 234.9 219.9 zmb -0.1 -0.3 96.4 84.2 zwe 556.0 437.4 473.0 451.2 tza -0.1 -2.2 25.0 18.2 xsd -3.1 -5.3 1854.2 1793.1 mrc -101.9 12194.7 -170.1 657.6 xdg -145.2 1339.2 -477.9 8447.8 xdd -140.8 -390.8 -302.0 3500.0
D. EMPLOYMENT EFFECTS
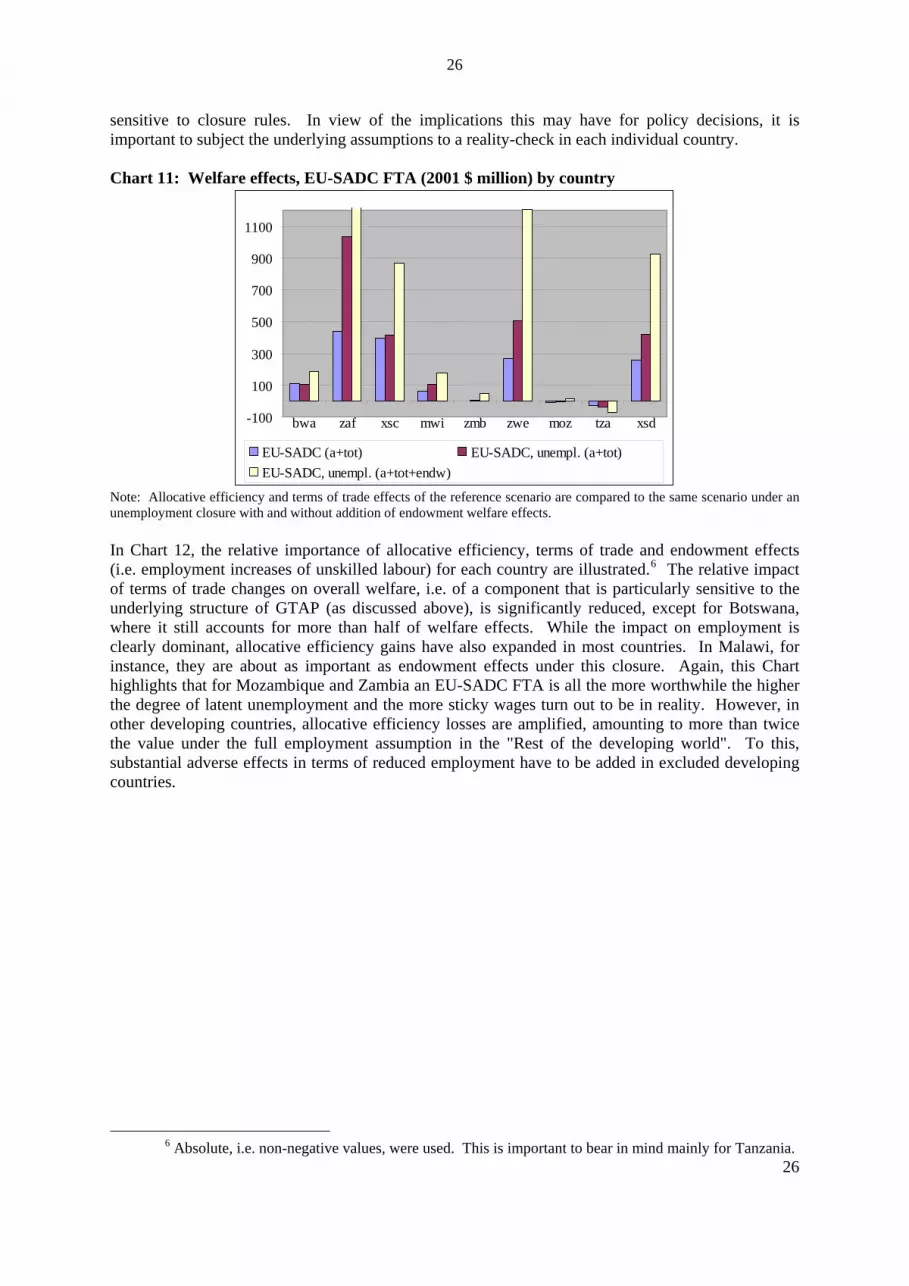
This section deals with a re-run of the experiment of an EU-SADC FTA, which symmetrically eliminates import barriers, for an "unemployment closure" given that the assumption of full employment may not be appropriate for SADC (and other developing) countries. The standard GTAP model is to be changed such that the wage rate for unskilled labour is fixed and the quantity supplied is allowed to adjust to changed market conditions post-liberalization. This alteration may more accurately reflect labour market conditions in developing countries, where typically an excess supply of unskilled labour is prevalent, which can be employed by industry at the going wage rate in the event of an expansion of production. Hence, in all SADC regions as well as other developing countries (i.e. Madagascar, Mercosur and the "Rest of developing world" region) the wage rate was made exogenous and the supply of unskilled labour endogenized in order to take the effects of an EU-SADC FTA on unemployment into account. Chart 11 shows that, under the (more realistic) assumption that developing countries feature a large pool of unemployed unskilled labour and, hence, wages remain unchanged, welfare effects of an EU-SADC FTA are even more positive than under a scenario, in which wages are allowed to adjust in order to equate demand to a given quantity of unskilled labour supply. Even without considering the direct welfare effects of increased employment, welfare improvements are more pronounced in almost all countries, as measured by allocative efficiency and terms of trade developments. With the exception of Tanzania, allocative efficiency increases by several multiples in all SADC regions of the model, in particular in the "Rest of SADC" region and Zimbabwe, where allocative efficiency turns into a main driver of welfare gains. It is also noteworthy that even Mozambique and Zambia register positive allocative efficiency gains under a EU-SADC FTA with latent unemployment. Except for South Africa, which further improves its terms of trade, SADC economies see slightly lower, but still largely positive terms of trade gains. When endowment effects are added, welfare gains are further amplified. The comparison of welfare outcomes also demonstrates that GTAP results are quite
26
sensitive to closure rules. In view of the implications this may have for policy decisions, it is important to subject the underlying assumptions to a reality-check in each individual country.
26
Chart 11: Welfare effects, EU-SADC FTA (2001 $ million) by country
-100
100
300
500
700
900
1100
bwa zaf xsc mwi zmb zwe moz tza xsd
EU-SADC (a+tot) EU-SADC, unempl. (a+tot)EU-SADC, unempl. (a+tot+endw)
Note: Allocative efficiency and terms of trade effects of the reference scenario are compared to the same scenario under an unemployment closure with and without addition of endowment welfare effects. In Chart 12, the relative importance of allocative efficiency, terms of trade and endowment effects (i.e. employment increases of unskilled labour) for each country are illustrated.6 The relative impact of terms of trade changes on overall welfare, i.e. of a component that is particularly sensitive to the underlying structure of GTAP (as discussed above), is significantly reduced, except for Botswana, where it still accounts for more than half of welfare effects. While the impact on employment is clearly dominant, allocative efficiency gains have also expanded in most countries. In Malawi, for instance, they are about as important as endowment effects under this closure. Again, this Chart highlights that for Mozambique and Zambia an EU-SADC FTA is all the more worthwhile the higher the degree of latent unemployment and the more sticky wages turn out to be in reality. However, in other developing countries, allocative efficiency losses are amplified, amounting to more than twice the value under the full employment assumption in the "Rest of the developing world". To this, substantial adverse effects in terms of reduced employment have to be added in excluded developing countries.
6 Absolute, i.e. non-negative values, were used. This is important to bear in mind mainly for Tanzania.
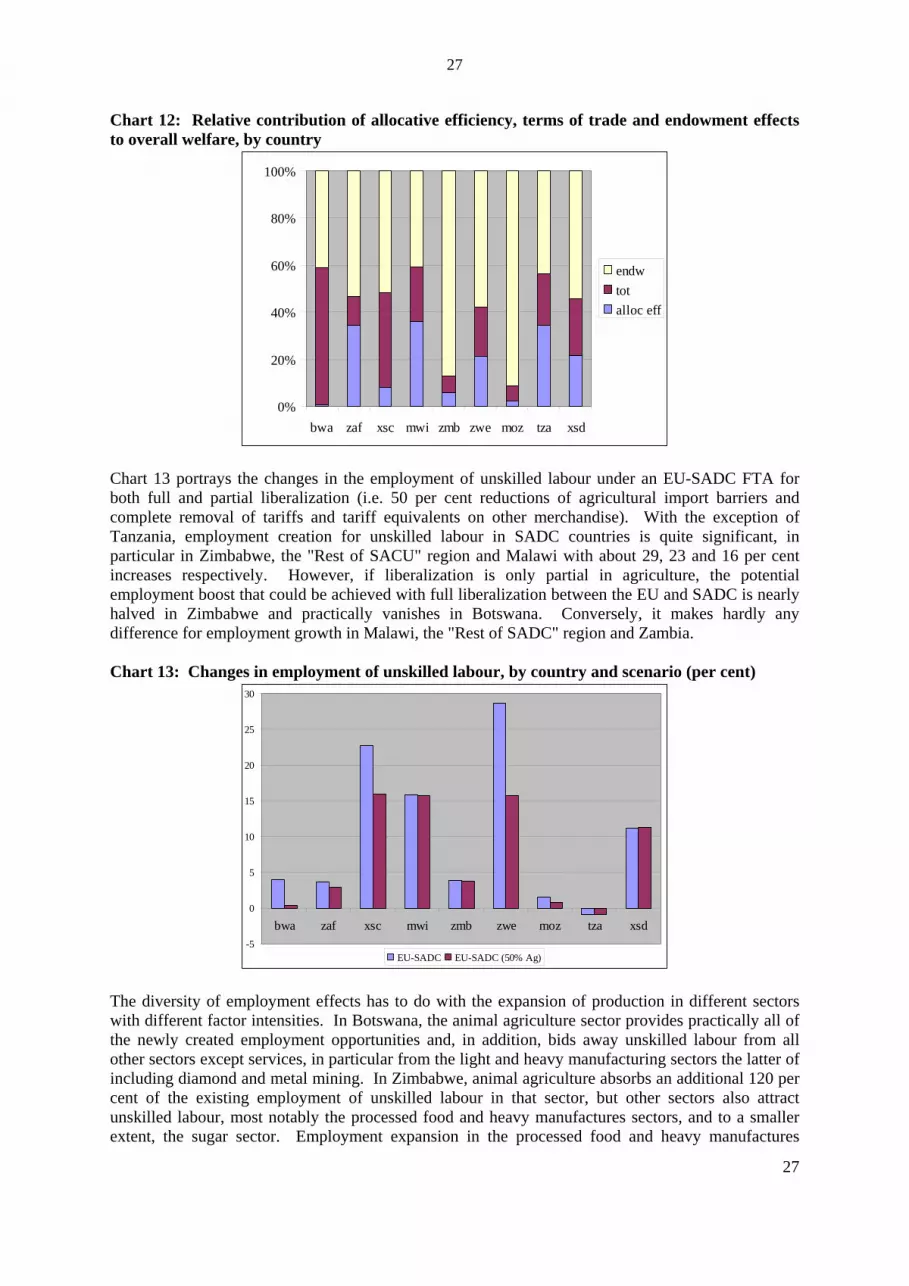
27
Chart 12: Relative contribution of allocative efficiency, terms of trade and endowment effects to overall welfare, by country
0%
20%
40%
60%
80%
100%
bwa zaf xsc mwi zmb zwe moz tza xsd
endwtotalloc eff
Chart 13 portrays the changes in the employment of unskilled labour under an EU-SADC FTA for both full and partial liberalization (i.e. 50 per cent reductions of agricultural import barriers and complete removal of tariffs and tariff equivalents on other merchandise). With the exception of Tanzania, employment creation for unskilled labour in SADC countries is quite significant, in particular in Zimbabwe, the "Rest of SACU" region and Malawi with about 29, 23 and 16 per cent increases respectively. However, if liberalization is only partial in agriculture, the potential employment boost that could be achieved with full liberalization between the EU and SADC is nearly halved in Zimbabwe and practically vanishes in Botswana. Conversely, it makes hardly any difference for employment growth in Malawi, the "Rest of SADC" region and Zambia. Chart 13: Changes in employment of unskilled labour, by country and scenario (per cent)
-5
0
5
10
15
20
25
30
bwa zaf xsc mwi zmb zwe moz tza xsd
EU-SADC EU-SADC (50% Ag) The diversity of employment effects has to do with the expansion of production in different sectors with different factor intensities. In Botswana, the animal agriculture sector provides practically all of the newly created employment opportunities and, in addition, bids away unskilled labour from all other sectors except services, in particular from the light and heavy manufacturing sectors the latter of including diamond and metal mining. In Zimbabwe, animal agriculture absorbs an additional 120 per cent of the existing employment of unskilled labour in that sector, but other sectors also attract unskilled labour, most notably the processed food and heavy manufactures sectors, and to a smaller extent, the sugar sector. Employment expansion in the processed food and heavy manufactures
27
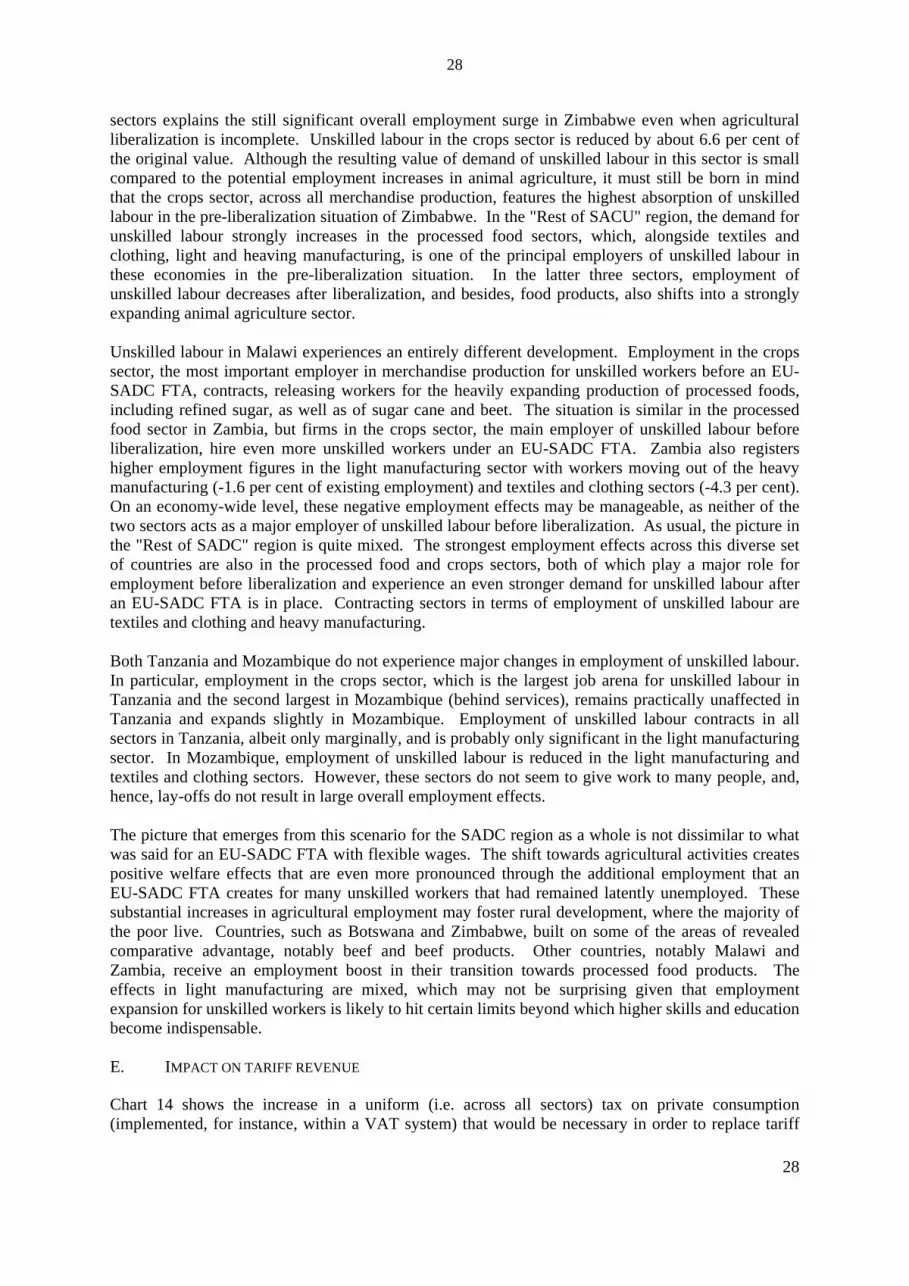
28
28
sectors explains the still significant overall employment surge in Zimbabwe even when agricultural liberalization is incomplete. Unskilled labour in the crops sector is reduced by about 6.6 per cent of the original value. Although the resulting value of demand of unskilled labour in this sector is small compared to the potential employment increases in animal agriculture, it must still be born in mind that the crops sector, across all merchandise production, features the highest absorption of unskilled labour in the pre-liberalization situation of Zimbabwe. In the "Rest of SACU" region, the demand for unskilled labour strongly increases in the processed food sectors, which, alongside textiles and clothing, light and heaving manufacturing, is one of the principal employers of unskilled labour in these economies in the pre-liberalization situation. In the latter three sectors, employment of unskilled labour decreases after liberalization, and besides, food products, also shifts into a strongly expanding animal agriculture sector. Unskilled labour in Malawi experiences an entirely different development. Employment in the crops sector, the most important employer in merchandise production for unskilled workers before an EU-SADC FTA, contracts, releasing workers for the heavily expanding production of processed foods, including refined sugar, as well as of sugar cane and beet. The situation is similar in the processed food sector in Zambia, but firms in the crops sector, the main employer of unskilled labour before liberalization, hire even more unskilled workers under an EU-SADC FTA. Zambia also registers higher employment figures in the light manufacturing sector with workers moving out of the heavy manufacturing (-1.6 per cent of existing employment) and textiles and clothing sectors (-4.3 per cent). On an economy-wide level, these negative employment effects may be manageable, as neither of the two sectors acts as a major employer of unskilled labour before liberalization. As usual, the picture in the "Rest of SADC" region is quite mixed. The strongest employment effects across this diverse set of countries are also in the processed food and crops sectors, both of which play a major role for employment before liberalization and experience an even stronger demand for unskilled labour after an EU-SADC FTA is in place. Contracting sectors in terms of employment of unskilled labour are textiles and clothing and heavy manufacturing. Both Tanzania and Mozambique do not experience major changes in employment of unskilled labour. In particular, employment in the crops sector, which is the largest job arena for unskilled labour in Tanzania and the second largest in Mozambique (behind services), remains practically unaffected in Tanzania and expands slightly in Mozambique. Employment of unskilled labour contracts in all sectors in Tanzania, albeit only marginally, and is probably only significant in the light manufacturing sector. In Mozambique, employment of unskilled labour is reduced in the light manufacturing and textiles and clothing sectors. However, these sectors do not seem to give work to many people, and, hence, lay-offs do not result in large overall employment effects. The picture that emerges from this scenario for the SADC region as a whole is not dissimilar to what was said for an EU-SADC FTA with flexible wages. The shift towards agricultural activities creates positive welfare effects that are even more pronounced through the additional employment that an EU-SADC FTA creates for many unskilled workers that had remained latently unemployed. These substantial increases in agricultural employment may foster rural development, where the majority of the poor live. Countries, such as Botswana and Zimbabwe, built on some of the areas of revealed comparative advantage, notably beef and beef products. Other countries, notably Malawi and Zambia, receive an employment boost in their transition towards processed food products. The effects in light manufacturing are mixed, which may not be surprising given that employment expansion for unskilled workers is likely to hit certain limits beyond which higher skills and education become indispensable. E. IMPACT ON TARIFF REVENUE
Chart 14 shows the increase in a uniform (i.e. across all sectors) tax on private consumption (implemented, for instance, within a VAT system) that would be necessary in order to replace tariff
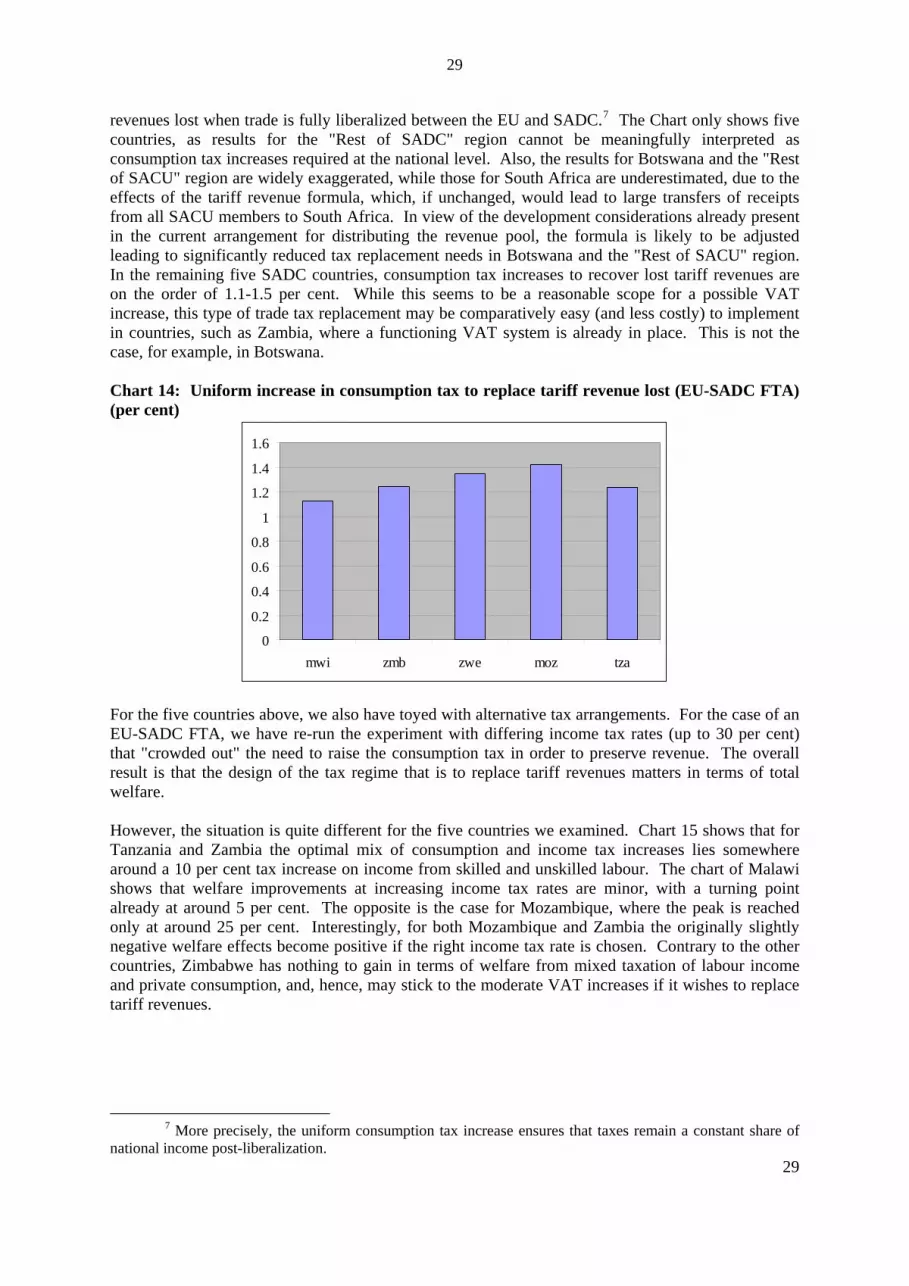
29
revenues lost when trade is fully liberalized between the EU and SADC.7 The Chart only shows five countries, as results for the "Rest of SADC" region cannot be meaningfully interpreted as consumption tax increases required at the national level. Also, the results for Botswana and the "Rest of SACU" region are widely exaggerated, while those for South Africa are underestimated, due to the effects of the tariff revenue formula, which, if unchanged, would lead to large transfers of receipts from all SACU members to South Africa. In view of the development considerations already present in the current arrangement for distributing the revenue pool, the formula is likely to be adjusted leading to significantly reduced tax replacement needs in Botswana and the "Rest of SACU" region. In the remaining five SADC countries, consumption tax increases to recover lost tariff revenues are on the order of 1.1-1.5 per cent. While this seems to be a reasonable scope for a possible VAT increase, this type of trade tax replacement may be comparatively easy (and less costly) to implement in countries, such as Zambia, where a functioning VAT system is already in place. This is not the case, for example, in Botswana. Chart 14: Uniform increase in consumption tax to replace tariff revenue lost (EU-SADC FTA) (per cent)
0
0.2
0.4
0.6
0.8
1
1.2
1.4
1.6
mwi zmb zwe moz tza
For the five countries above, we also have toyed with alternative tax arrangements. For the case of an EU-SADC FTA, we have re-run the experiment with differing income tax rates (up to 30 per cent) that "crowded out" the need to raise the consumption tax in order to preserve revenue. The overall result is that the design of the tax regime that is to replace tariff revenues matters in terms of total welfare. However, the situation is quite different for the five countries we examined. Chart 15 shows that for Tanzania and Zambia the optimal mix of consumption and income tax increases lies somewhere around a 10 per cent tax increase on income from skilled and unskilled labour. The chart of Malawi shows that welfare improvements at increasing income tax rates are minor, with a turning point already at around 5 per cent. The opposite is the case for Mozambique, where the peak is reached only at around 25 per cent. Interestingly, for both Mozambique and Zambia the originally slightly negative welfare effects become positive if the right income tax rate is chosen. Contrary to the other countries, Zimbabwe has nothing to gain in terms of welfare from mixed taxation of labour income and private consumption, and, hence, may stick to the moderate VAT increases if it wishes to replace tariff revenues.
29
7 More precisely, the uniform consumption tax increase ensures that taxes remain a constant share of national income post-liberalization.
30
Chart 15: Total welfare (2001 $ million) for various tax rates on labour income (per cent) to replace tariff revenue lost (EU-SADC FTA)
tza
-51
-50.5
-50
-49.5
-49
-48.50 5 10 15 20
zmb
-2.5
-2
-1.5
-1
-0.5
0
0.5
1
0 5 10 15 20
mwi
64.65
64.67
64.69
64.71
64.73
64.75
64.77
64.79
64.81
64.83
64.85
0 5 10
moz
-12
-10
-8
-6
-4
-2
0
2
4
0 5 10 15 20 25 30
zwe
235
240
245
250
255
260
0 5 10 15 20
How can the possible welfare improvements through different combinations of taxes (entirely driven by allocative efficiency aspects) be explained? One possibility is the reflection in the GTAP model of the non-homotheticity of final demand. This means that income elasticities are not necessarily equal to unity and are different across products. If private spending decreases (due to higher levels of income taxes), with prices unchanged, quantity demanded of different commodities still varies. This means that budget shares for different commodities change in the household consumption bundle. In other words, households do not continue to consume the same mix of products when they get richer or poorer. For instance, in our model, private consumers in SADC countries tend to spend less on manufactures and more on crops and food products when the have less money to spend. Private consumers may thereby increase the consumption of goods with higher consumption taxes. An 30
31
31
expansion of production in taxed sectors, in turn, reduces excess burden and, hence, improves welfare. This is the case, for instance, for food products in which face relative high consumption taxes in Mozambique, Malawi and Zambia. However, the higher the income tax, the lower consumption tax increases are needed to safeguard government revenues. Tax increases on labour income, at a certain point, not only reduce consumption taxes, but may turn some of them into subsidies for certain products. Welfare subsequently deteriorates again owing to reduced consumption taxes and the distortions subsidization introduces in the economy. This explanation may also hold for Zimbabwe which experiences a decline in welfare for all levels of income tax and for which no consumption taxes are given in the GTAP Data Base. V. CONCLUSIONS
This paper has developed a CGE model that focuses on the potential impact of EPAs with the EU on SADC countries. The model has also been employed to assess the effects on SADC economies of simultaneous progress in regional integration within SADC and of further trade liberalization activities by the EU, using the example of Mercosur. Multilateral trade liberalization at the global level has been simulated as an important benchmark. More than the absolute levels, the relative impact of different scenarios in terms of welfare, economic structure and trade may provide useful guidance to policy-makers in SADC countries. In particular, the empirical simulations lead us to the following set of conclusions:
• SACU revenue sharing arrangements may require further adjustments to ensure a net transfer of resources to lesser developed members post-liberalization.
• SADC countries overall benefit most from multilateral trade liberalization. Due to the importance of the EU as a trading partner for many SADC economies, liberalization in the context of EPAs already goes a long way towards realizing such gains. For some, however, it is crucial to seek further integration within SADC at the same time in order to reap these benefits. The positive results of an EU-SADC FTA are robust to variations in key assumptions, notably the Armington parameters.
• The possibility of the EU signing an FTA with another group of developing countries (Mercosur) significantly lowers the expected gains from preferential trade with the EU for SADC. This implies that, for most SADC countries, the relative gains from multilateral liberalization are more pronounced.
• For a number of SADC countries, meaningful liberalization of agricultural import barriers explains large part of the expected gains from an EU-SADC FTA. Conversely, SADC economies are hardly affected by the abolishment of agricultural subsidies on the part of the EU.
• All liberalization scenarios lead to significant structural change in SADC countries. For some of them, the required structural adjustment under the multilateral liberalization scenario is less than under an EU-SADC FTA. In particular, under the latter scenario agricultural sectors expand at the expense of manufacturing in most SADC economies, whereas multilateral liberalization, for some of them, fosters manufacturing, leading to higher levels of diversification. Trade patterns follow this trend in production: Overall imports, especially of manufactures, and exports, notably of agricultural and processed food products, increase. Part of this increased trade can be explained by trade diversion away from other developing countries.
• Workers, both skilled and unskilled, in SADC economies experience real wage increases under an EU-SADC FTA. In several SADC countries, wage increases for skilled workers are even higher, implying stronger incentives to seek higher levels of education.
• If the existence of a large pool of unemployed unskilled labour in SADC countries is assumed, the positive welfare effects of an EU-SADC FTA are even more pronounced. In many SADC countries more jobs are created in agricultural sectors that are already major employers of unskilled labour. Others receive an employment boost in their transition
32
32
towards processed food products. Employment expansion in manufacturing seems to be limited by increasing skill requirements.
• Tariff revenue losses can be replaced by moderate increases of, for instance, consumption taxes. However, the design of the tax regime appears to matter if tariff revenues are to be replaced: For certain SADC countries, a mix of higher income and consumption taxes proves to be superior in terms of welfare.
VI. REFERENCES
Chauvin, S. and G. Gaulier (2002) "Regional Trade Integration in Southern Africa", CEPII Working Paper No 2002-12. Kirk, R. and M. Stern (2003) "The New Southern African Customs Union Agreement", African Region Working Paper Series No. 57. Lewis J.D., S. Robinson and K. Thierfelder (2003) "Free Trade Agreements and the SADC Economies", Journal of African Economies, Vol. 12(2): 156-206. Lewis J.D., S. Robinson and K. Thierfelder (1999) "After the Negotiations: Assessing the Impact of Regional Trade Agreements in Southern Africa", Trade and Macroeconomics Division Working Paper N. 46, Washington DC: International Food Policy Research institute. Masters W., R. Davies, T.W. Hertel (1999) "Europe, South Africa and Southern Africa: Regional Integration in a Global Context", African Economic Policy Discussion Paper N. 30. McDonald S. and T. Walmsley (2001) "Bilateral Free Trade Agreements and Customs Unions: The Impact of the EU - Republic of South Africa Free Trade Agreement on Botswana", Paper presented at the Annual Conference on Global Economic Analysis, Purdue University. Tsikata Y.M. (1999) " Southern Africa: Trade Liberalization and Implication for a Free Trade Area", Washington DC: World Bank.
Top Related
Copyright © 2022 FDOKUMEN

