


Bahasa
Halaman
Hukum


RESEARCH ARTICLE
The Burden of Disease and Health CareUse among Pertussis Cases in School AgedChildren and Adults in England and Wales;A Patient SurveyAlbert Jan van Hoek1*, Helen Campbell1, Nick Andrews2, Mariza Vasconcelos1,Gayatri Amirthalingam1, Elizabeth Miller1
1. Immunisation, Hepatitis and Blood Safety Department, Public Health England, London, England, 2.Statistics and modelling unit, Public Health England, London, England
Abstract
Background: In 2011–2012 a large pertussis outbreak occurred in England. This
provided an opportunity to estimate the disease burden in those aged 5 years and
over. As pertussis is likely to be under reported both laboratory-confirmed and non-
confirmed cases were included.
Methods: Laboratory-confirmed cases of pertussis, as well as their coughing but
non-confirmed household members, were sent a questionnaire that collected
information on clinical features and quality of life for the most severe day of disease
and the day the patient filled in the questionnaire. The EuroQol-5 dimension
questionnaire (EQ-5D) was used to evaluate quality of life. The duration of
symptoms was obtained by contacting the patient every two weeks until symptoms
stopped.
Results: Data for 535 (out of 1262) laboratory confirmed pertussis patients and 44
(out of 140) coughing household contacts was available for analysis. On the most
severe day, 56% of laboratory-confirmed cases reported they had 20+ more
paroxysms, 58% reported they had a severe cough and 46% reported disruption of
sleep for more than 4 hours. For non-confirmed coughing household contacts there
were a similar number of coughing spells per day at the height, though the cough
was reported to be less severe and to cause less sleep disruption. The main clinical
symptoms on the worst day for both were shortness of breath, tiredness, sore ribs
and vomiting. The duration of symptoms for both patient groups was around 160
days (162 and 168 days). Under base case assumptions the overall loss of quality
of life was 0.097 QALY (0.089–0.106) for confirmed pertussis cases and 0.0365
QALY (0.023–0.054) for coughing household contacts.
OPEN ACCESS
Citation: van Hoek AJ, Campbell H, Andrews N,Vasconcelos M, Amirthalingam G, et al. (2014) TheBurden of Disease and Health Care Use amongPertussis Cases in School Aged Children andAdults in England and Wales; A PatientSurvey. PLoS ONE 9(11): e111807. doi:10.1371/journal.pone.0111807
Editor: James M. McCaw, University of Melbourne,Australia
Received: May 15, 2014
Accepted: October 8, 2014
Published: November 25, 2014
Copyright: � 2014 van Hoek et al. This is anopen-access article distributed under the terms ofthe Creative Commons Attribution License, whichpermits unrestricted use, distribution, and repro-duction in any medium, provided the original authorand source are credited.
Funding: The study was funded by Public HealthEngland. The funders had no role in study design,data collection and analysis, decision to publish, orpreparation of the manuscript.
Competing Interests: AJvH, HC, NA, MV and EMhave no relevant financial relationships. GA didattend an advisory board on pertussis atGlaxoSmithKline (2010). This does not alter theauthors’ adherence to PLOS ONE policies onsharing data and materials.
PLOS ONE | DOI:10.1371/journal.pone.0111807 November 25, 2014 1 / 14

Conclusion: Pertussis is a serious disease in those aged 5 years and over,
causing disruption of sleep and daily activities over long period of time. The burden
of illness due to undiagnosed pertussis is also considerable.
Background
Pertussis is a highly infectious bacterial disease that characteristically results in a
prolonged spasmodic cough, often followed by vomiting or a high-pitched
whooping sound as air is inhaled after the paroxysm. In young infants the illness is
clinically severe, frequently resulting in hospital admission and sometimes death.
However, in older children and adults the disease burden is more difficult to
quantify as the symptoms are less clear and can be of a milder nature.
In the 1950s pertussis vaccines were introduced into the national childhood
immunisation programme of many developed countries and, where coverage was
high, were successful in controlling disease. However, in the last decade an
increasing number of countries have observed pertussis outbreaks and report a
resurgence in pertussis [1]. As the main aim of vaccination is to reduce morbidity
and mortality in young infants, additional vaccination strategies are now being
considered to protect this vulnerable age group. These strategies include
vaccination of new-borns, vaccination of pregnant and lactating mothers,
vaccination of adolescents and adults and ‘‘cocooning’’ which involves the
vaccination of close family contacts of the neonate [1].
To enhance rational and transparent decision making, possible interventions
are frequently compared in a cost-effectiveness analysis. This requires quantifi-
cation of disease burden in terms of health related quality of life measures. To date
only one published paper has attempted this for pertussis [2]. The authors used a
method where putative pertussis-related disease states were evaluated by a panel of
patients who had previously had pertussis. However, this approach has the major
limitation that no actual disease states of patients were evaluated. Actual diseases
seldom conform to standard clinical descriptions and therefore these estimates
may not reflect reality.
In 2011–2012 a large pertussis outbreak occurred in England, with the highest
incidence for over a decade and 16 related deaths [3]. This outbreak provided an
opportunity to estimate the disease burden in those aged 5 years and older and
obtain health related quality of life estimates for cost-effectiveness modelling.
Pertussis is likely to be under reported [4], therefore we tried to capture both
confirmed disease and non-confirmed disease. We performed a study in which
patients with laboratory-confirmed pertussis, or household contacts of these cases
who had a cough but no laboratory confirmation of pertussis, were asked to
complete the 5 dimensional EuroQol questionnaire (EQ-5D) [5]. The EQ-5D, in
combination with information on illness duration, can provide an estimate of the
overall reduction in quality of life associated with a disease episode. We also
The Burden of Disease and Health Care Use among Pertussis Cases
PLOS ONE | DOI:10.1371/journal.pone.0111807 November 25, 2014 2 / 14

measured utilisation of health care, drug use, time off work, and documented
clinical symptoms in the study population.
Methods
Cases of pertussis in patients aged 5 years and over in England and Wales who met
the following criteria were included in the study: positive culture for Bordetella
pertussis, or a positive serology test by the Bordetella Reference Laboratory at
Public Health England (PHE); and where written permission from the treating
General Practitioner (GP) to send the patient a questionnaire was obtained.
Information on dates of pertussis vaccination were obtained from the GP.
Confirmed cases were asked to report household contacts with symptoms of
pertussis; these household contacts were also included as a proxy for non-
confirmed pertussis in order to collect information on disease that is not reported.
All patients meeting the inclusion criteria between September 2011 and January
2013 were sent a questionnaire and a prepaid envelope to return completed forms.
The questionnaire had three sections; the first collected background information
on sex, age, vaccine history, date of onset, health care use, antibiotic use,
hospitalisation, and time off work/school due to the pertussis infection. The
second section focussed on disease severity on the day they filled in the
questionnaire including information on the cough (number of cough spells,
cough severity, and whether or not the cough kept them awake) and any other
reported symptoms, as well a quality of life questionnaire. The quality of life was
investigated using questionnaires developed by EuroQol, which is age dependent;
the EQ-5D-Y by proxy for those aged 5–7, a EQ-5D-Y for those aged 7–11 and a
EQ-5D-3L questionnaire for those aged 12 and above. Each version included a
Visual Analog Score (VAS). The third section was similar to the second section,
but focussed on the worst day of the disease. The questionnaires are available on
request.
According to the guidelines of the National Research Ethics Service [6]
collection of quality of life information from patients comes within the remit of
the enhanced surveillance activities of Public Health England (PHE) and is thus
deemed service evaluation rather than research for which ethics approval is not
required. Participants were aware that obtained information would inform clinical
practice and public health decisions. The data was anonymised before analysis.
Responders were followed-up every two to four weeks for as long as they
reported pertussis- related symptoms to determine the duration of illness. To
optimise the response rate the respondents were only required to answer ‘‘yes’’ or
‘‘no’’ to the question ‘‘Is your cough still affecting your usual health and/or
sleep?’’ using their preferred method of communication for follow up; letter, text
or phone. Therefore we only know between which dates the symptoms subsided
(the last contact date and the date of the previous ‘‘yes’’ answer). The base case
results are based on the midpoints between these two dates, but in the sensitivity
The Burden of Disease and Health Care Use among Pertussis Cases
PLOS ONE | DOI:10.1371/journal.pone.0111807 November 25, 2014 3 / 14

analysis the outcomes using the minimum and the maximum duration of disease
are shown.
Some of the laboratory confirmed cases were tested not because they visited the
GP with symptoms, but as a part of an outbreak investigation, and could therefore
be asymptomatic or have very mild symptoms. To measure the impact on the
quality of life of symptomatic pertussis only we excluded laboratory confirmed
cases who did not report pertussis-like symptoms on the worst day of their illness
or who had not consulted a health professional. From the sample of non-
confirmed pertussis we excluded those who were tested for pertussis (irrespective
of test result) and those who did not cough on the worst day of disease.
The socio-economic status of responders and non-responders was based on the
Index of Multiple Deprivation (2010) and assigned to residential postcode based
on the Lower Super Output statistics, using the Lower Super Output Area
boundaries of 2001.
Calculating the loss in Quality Adjusted Life Years (QALY)
To calculate the overall QALY loss the total area under the curve given the disease
severity over time was used. Due to the relatively few data points we divided the
disease course into four stages, described by six parameters (four different
durations and two severity states). The first stage was the period between disease
onset and the period of most severe symptoms, the second stage was the period
during which the patient experienced the most severe symptoms followed by the
third stage, a period where the symptoms improved but did not disappear. The
fourth stage was a relatively long period where the patient remained symptomatic
but the cough was relatively mild and slowly subsided. See (figure 1) for a
graphical representation of the disease stages.
The level of the disease severity during the worst period (stage two) was
informed by the mean quality of life on the worst day. The severity of the mild
symptoms (stage four) was informed by the mean quality of life as measured on
the day when the patient completed the questionnaire. Disease severity for stage
one was assumed to increase linearly from onset to start of stage two, and for stage
three, severity was assumed to decline linearly from the end of stage two to the
start of stage four.
The duration of the stages was informed by the timing of the worst day, the
timing after onset that the questionnaire was filled in and the duration of
symptoms. The period of severe cough (stage two) was based on the inter quartile
range of the timings of the worst day. The beginning of stage four was the lowest
quartile of the day the questionnaire filled in. The end of stage four was the
average total duration of having symptoms using a Kaplan-Meier survival curve to
correct for censoring due to the patients lost to follow up. The method is fully
described in supporting information S1.
The largest assumptions in the approach are the durations of the different
disease states. Therefore the following sensitivity analysis was performed: we
shortened the duration of the severe symptoms to one day (average day which was
The Burden of Disease and Health Care Use among Pertussis Cases
PLOS ONE | DOI:10.1371/journal.pone.0111807 November 25, 2014 4 / 14

the most severe), and after the worst day there was no period of transitions to
mild symptoms, but an immediate start of mild symptoms. In other words this
eliminated stage two and three, and is therefore referred to as the 2-stage scenario.
This approach should produce the lower boundary of the QALY loss estimate.
Data analysis was performed in R 3.02 using R studio. Confidence intervals
were obtained by bootstrapping the original data (1000 samples).
Results
Response
The questionnaire was sent to 1262 laboratory confirmed pertussis patients aged
between 6 and 90 years and 140 of their coughing household contacts aged
between 7 and 74 years (Table 1). Of the laboratory confirmed cases 576
responded (48% response rate) of whom 41 met the exclusion criteria leaving 535
(42%) for the analysis. Of these 37% were reported by their GP to have received at
least 3 doses of pertussis vaccine prior to onset. All but three were confirmed by
serology (single high titre antibodies to pertussis toxin). For the household
contacts there were 63 responders (45% response rate) of whom 19 were excluded,
leaving 44. Based on the post code there were more patients from deprived areas
compared to affluent areas. The response by age varied little, with the lowest
Figure 1. The data and the overall QALY loss as used in this analysis. The dots are the QALY weight bytime after onset for the worst day (blue) and the day of the questionnaire (red). The black line represents theprogression of disease severity over time, including the 4 stages (numbered 1,2,3 & 4), see text for anexplanation. The dotted line shows the disease progression under the 2 stage approach.
doi:10.1371/journal.pone.0111807.g001
The Burden of Disease and Health Care Use among Pertussis Cases
PLOS ONE | DOI:10.1371/journal.pone.0111807 November 25, 2014 5 / 14
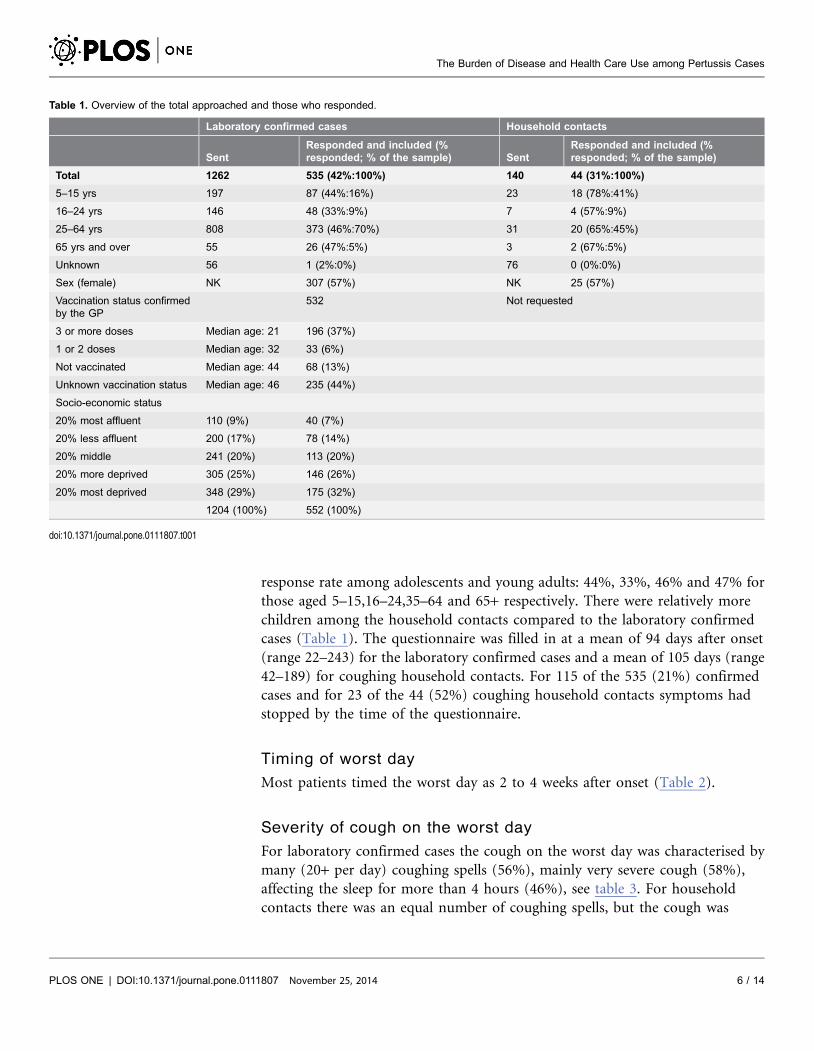
response rate among adolescents and young adults: 44%, 33%, 46% and 47% for
those aged 5–15,16–24,35–64 and 65+ respectively. There were relatively more
children among the household contacts compared to the laboratory confirmed
cases (Table 1). The questionnaire was filled in at a mean of 94 days after onset
(range 22–243) for the laboratory confirmed cases and a mean of 105 days (range
42–189) for coughing household contacts. For 115 of the 535 (21%) confirmed
cases and for 23 of the 44 (52%) coughing household contacts symptoms had
stopped by the time of the questionnaire.
Timing of worst day
Most patients timed the worst day as 2 to 4 weeks after onset (Table 2).
Severity of cough on the worst day
For laboratory confirmed cases the cough on the worst day was characterised by
many (20+ per day) coughing spells (56%), mainly very severe cough (58%),
affecting the sleep for more than 4 hours (46%), see table 3. For household
contacts there was an equal number of coughing spells, but the cough was
Table 1. Overview of the total approached and those who responded.
Laboratory confirmed cases Household contacts
SentResponded and included (%responded; % of the sample) Sent
Responded and included (%responded; % of the sample)
Total 1262 535 (42%:100%) 140 44 (31%:100%)
5–15 yrs 197 87 (44%:16%) 23 18 (78%:41%)
16–24 yrs 146 48 (33%:9%) 7 4 (57%:9%)
25–64 yrs 808 373 (46%:70%) 31 20 (65%:45%)
65 yrs and over 55 26 (47%:5%) 3 2 (67%:5%)
Unknown 56 1 (2%:0%) 76 0 (0%:0%)
Sex (female) NK 307 (57%) NK 25 (57%)
Vaccination status confirmedby the GP
532 Not requested
3 or more doses Median age: 21 196 (37%)
1 or 2 doses Median age: 32 33 (6%)
Not vaccinated Median age: 44 68 (13%)
Unknown vaccination status Median age: 46 235 (44%)
Socio-economic status
20% most affluent 110 (9%) 40 (7%)
20% less affluent 200 (17%) 78 (14%)
20% middle 241 (20%) 113 (20%)
20% more deprived 305 (25%) 146 (26%)
20% most deprived 348 (29%) 175 (32%)
1204 (100%) 552 (100%)
doi:10.1371/journal.pone.0111807.t001
The Burden of Disease and Health Care Use among Pertussis Cases
PLOS ONE | DOI:10.1371/journal.pone.0111807 November 25, 2014 6 / 14

reported to be less severe and affected sleep less (p,0.05 for the worst two
categories, Chi-square test).
Clinical symptoms on the worst day
The main clinical symptoms on the worst day for both confirmed cases and
household contacts were shortness of breath, tiredness, sore ribs and vomiting
(table 4). The household contacts had fewer symptoms per patient.
Quality of life on the worst day
The dimensions most affected for laboratory confirmed contacts were ‘anxiety’
(17% severely affected) and ‘mobility’ (14% severely affected). In contrast, the
Table 2. Timing of the worst day.
Weeks after onset Laboratory confirmed cases Household contacts
Day of onset 7 (3%) 0 (0%)
1st week 44 (18%) 3 (20%)
2nd week 64 (26%) 4 (27%)
3rd week 43 (17%) 2 (13%)
4th week 30 (12%) 5 (33%)
5th week 26 (11%) 0 (0%)
6th week 13 (5%) 0 (0%)
7th week 7 (3%) 1 (7%)
8th week or over 13 (5%) 0 (0%)
247 15
doi:10.1371/journal.pone.0111807.t002
Table 3. Patient’s assessment of the severity of cough on the worst day and the day of the questionnaire (later day) measured by the number of paroxysms,self assigned severity and duration of sleep disturbance.
Laboratory confirmed cases Household contacts
Coughing spells Cough severity Affects sleep Coughing spells Cough severity Affects sleep
Spells/severity/sleepWorstday
Laterday
Worstday
Laterday
Worstday
Laterday
Worstday
Laterday
Worstday
Laterday
Worstday
Laterday
0–1/very mild/not at all 1 (0%) 65 (17%) 1 (0%) 73 (19%) 8 (2%) 252(66%)
0 (0%) 12 (35%) 0 (0%) 12 (39%) 5 (11%) 23(70%)
2–5/mild/20 min–1 hr 13 (2%) 174(45%)
3 (1%) 119(32%)
55 (10%) 96 (25%) 1 (2%) 14 (41%) 2 (5%) 7 (23%) 11 (25%) 9(27%)
6–10/moderate/1–2 hrs
50 (9%) 85 (22%) 29 (5%) 150(40%)
88 (17%) 20 (5%) 8 (18%) 5 (15%) 11 (25%) 11 (35%) 10 (23%) 1 (3%)
11–20/severe/2–4 hrs 172(32%)
44 (11%) 193(36%)
30 (8%) 136(26%)
8 (2%) 13 (30%) 2 (6%) 16 (36%) 1 (3%) 7 (16%) 0 (0%)
20+/very severe/4+hrs 295(56%)
17 (4%) 307(58%)
3 (1%) 241(46%)
6 (2%) 22 (50%) 1 (3%) 15 (34%) 0 (0%) 11 (25%) 0 (0%)
Responders whoanswered the question
530 385 533 375 528 382 44 34 44 31 44 33
doi:10.1371/journal.pone.0111807.t003
The Burden of Disease and Health Care Use among Pertussis Cases
PLOS ONE | DOI:10.1371/journal.pone.0111807 November 25, 2014 7 / 14

most affected dimensions for the coughing household contacts were ‘usual
activities’ and ‘pain/discomfort’ with 16% and 9% each severely affected
respectively, see table 5.
For laboratory confirmed patients the average QALY weight based on the EQ-
5D for the worst day of disease was 0.46 with a median of 0.54 and a minimum
and maximum of 20.513 and 1. Unfortunately for 81 patients there was one or
more missing answers in the EQ-5D. The average QALY weight based on the VAS
was 35, with a median of 30 and minimum and maximum of 0 and 100; the VAS
only had 19 missing values.
Table 4. Clinical symptoms on the worst day and on the day the patients completed the questionnaire.
Laboratory confirmed cases Household contacts
Worst day Day of the questionnaire Worst day Day of the questionnaire
No additional clinical symp-toms
0 36 (8%) 1 (2%) 7 (19%)
Short of breath after cough 444 (84%) 239 (50%) 28 (64%) 7 (19%)
Tiredness 416 (79%) 202 (43%) 32 (73%) 10 (28%)
Cough with ‘whoop’ 398 (75%) 120 (25%) 30 (68%) 5 (14%)
Sore ribs after cough 327 (62%) 104 (22%) 18 (41%) 2 (6%)
Vomiting after cough 321 (61%) 68 (14%) 22 (50%) 2 (6%)
Sore throat 310 (59%) 107 (23%) 22 (64%) 3 (8%)
Headache 297 (56%) 101 (21%) 20 (45%) 4 (11%)
Blood shot eyes 189 (36%) 63 (13%) 6 (14%) 3 (8%)
Weight loss 96 (18%) 28 (6%) 4 (9%) 1 (3%)
Pneumonia 49 (9%) 3 (1%) 1 (2%) 1 (3%)
Responders who answeredthe question
529 (5.5 symptoms perpatient)
475 (2.4 symptoms per patient) 44 (4.2 symptoms perpatient)
36 (1.3 symptoms per patient)
doi:10.1371/journal.pone.0111807.t004
Table 5. Scores for the individual 5 dimensions of the EQ-5D for the worst day and the day of the questionnaire.
Worst day Day of the questionnaire
Laboratory confirmedcases N No problems Some problems
Severeproblems N No problems Some problems
Severeproblems
Self care 521 421 (81%) 80 (15%) 20 (4%) 418 409 (98%) 8 (2%) 1 (0%)
Mobility 523 245 (46%) 205 (39%) 73 (14%) 416 385 (93%) 30 (7%) 1 (0%)
Usual activities 526 269 (51%) 204 (39%) 53 (10%) 418 288 (69%) 120 (29%) 10 (2%)
Pain/discomfort 524 327 (62%) 149 (28%) 48 (9%) 415 280 (67%) 122 (29%) 13 (3%)
Anxiety depression 463 204 (44%) 182 (39%) 77 (17%) 414 317 (77%) 91 (22%) 6 (1%)
Household contacts
Self care 44 43 (98%) 1 (2%) 0 (0%) 27 27 (100%) 0 (0%) 0 (0%)
Mobility 44 35 (80%) 9 (20%) 0 (0%) 27 25 (93%) 2 (7%) 0 (0%)
Usual activities 44 18 (41%) 19 (43%) 7 (16%) 27 20 (74%) 7 (26%) 0 (0%)
Pain/discomfort 43 16 (37%) 23 (53%) 4 (9%) 27 20 (74%) 7 (26%) 0 (0%)
Anxiety depression 41 30 (73%) 11 (27%) 0 (0%) 27 26 (96%) 1 (4%) 0 (0%)
doi:10.1371/journal.pone.0111807.t005
The Burden of Disease and Health Care Use among Pertussis Cases
PLOS ONE | DOI:10.1371/journal.pone.0111807 November 25, 2014 8 / 14

The coughing household contacts had an average QALY weight for the worst
day of 0.80 with a median of 0.88 and maximum and minimum of 0.007 to 1.
There were only 4 patients with missing information. Using the VAS, the median
and the average were the same at 50 with a range of 15 to 100. There were no
missing values for the VAS.
Disease severity at a later stage
Although the timing after onset was not the same for each patient, by the day of
the questionnaire cough severity had lessened (only 4% 20+ paroxysms a day),
was milder in nature (only 1% very severe) and affected sleep less (2% affecting
4+hrs) in both laboratory confirmed cases and household contacts, see (table 3).
Overall patients had fewer clinical symptoms (see table 4); the biggest decline
was in the most severe clinical symptoms such as pneumonia and bloodshot eyes;
in 25% of confirmed cases, and 14% of household contacts a ‘whoop’ was still
present.
The quality of life on the day of the questionnaire
Of the five dimensions included in the EQ-5D, usual activities and pain and
discomfort were the most affected on the day of the questionnaire, see table 5. In
both confirmed cases and household contacts over 25% had one or more
dimensions still affected. The QALY weight on the day of the questionnaire was
0.89 (0.065–1) for the laboratory confirmed cases and 0.9244 (0.70–1) for the
household contacts. However the patient received the questionnaire at different
times after disease onset. To test if there was a relation between time and QALY
weight a linear regression model was fitted. For both the confirmed cases and the
household contacts the factor for the slope was non-significant though the
relation was positive (the later after onset the higher the QALY weight).
Duration of symptoms
The duration of symptoms was estimated with a Kaplan-Meier survival curve.
This was because despite a high response rate on our follow-up questionnaire in
over 80% there was a significant drop out due to the long term follow-up, as
patients answered up-to 16 times (maximum for any patient) that they still had
symptoms.
There are three estimates of the duration; the mid and the minimum and
maximum. For laboratory confirmed cases this was 162 days (minimum 152–
maximum 174) for the household contacts 168 days (minimum 155–maximum
182).
Health care seeking behaviour
Health care advice was sought by all confirmed cases and some had multiple
forms of contact. Not all visited the GP, as some went to the A&E or other sources
The Burden of Disease and Health Care Use among Pertussis Cases
PLOS ONE | DOI:10.1371/journal.pone.0111807 November 25, 2014 9 / 14

of care. Of the non-confirmed coughing household contacts 30% did not seek any
health care advice. The average cost of care based on the survey was estimated to
be £55.55 for confirmed cases and £25.63 for the household contacts (including
those who did not seek care). Of the laboratory confirmed cases 60% took time off
school or work, with a median duration of 7 days, for coughing household
members only 41% took time off school or work with a median of 4.5 days
(Table 6).
Quality of life and cough severity
Pooling the data of the laboratory cases for both the worst day and the day of the
questionnaire shows that there was a relation between the measured quality of life
detriment and the severity of the cough (Figure 2). The QALY weight decreased
from an average of 0.96 for a very mild cough to 0.33 for a very severe cough.
There was however a great variety in QALY weight scores, spanning 1 to 20.5 for
a severe cough.
Loss of quality of life
The overall loss of quality of life is presented in table 7 and was 0.097 QALY
(0.089–0.106) for confirmed pertussis cases using the four stage approach, with
the two stage approach it was 0.055 QALY (0.048–0.062). Coughing household
contacts had a lower loss of quality of life with 0.0365 QALY (0.023–0.054) for the
four stage approach and 0.020 QALY (0.012–0.032) for the two stage approach.
Expressed in quality adjusted life days (QALY*365 days) this is 35.5 QALD and
19.9 QALD for the two measurements for confirmed cases and 13.3 QALD and 7.5
QALD for household contacts.
Table 6. Health care use* and time off work.
Laboratory confirmed cases Household contacts
None 0 (0%) 13 (30%)
Visits GP (£36 [11]) 499 (93%) 25 (57%)
Call receptionist (£22 [11]) 68 (13%) 3 (7%)
Call GP (£22 [11]) 116 (22%) 9 (20%)
Call NHS direct (£27.42 [12]) 62 (12%) 3 (7%)
Visits Hospital/A&E (£32 [11]) 84 (16%) 3 (7%)
Other (£36 same as GP visit) 44 (8%) 1 (2%)
Average overall costs £55.55 (SD 1.594) £25.63 (SD 4.81)
Time off work/school 507 filled in the question 39 filled in the question
No time off work/school 204 (40%; 42 indicated a reason e.g. being retiredor it was holiday)
23 (59%; 2 indicated an excuse)
Yes 303 (60%; median:7 days, mean:13 days, min-max:1–80 days)
16 (41%; median:4.5 days, mean:4.3 days,min-max:0.5–10)
*Each patient can have multiple health care visits.
doi:10.1371/journal.pone.0111807.t006
The Burden of Disease and Health Care Use among Pertussis Cases
PLOS ONE | DOI:10.1371/journal.pone.0111807 November 25, 2014 10 / 14

Vaccination status
There were no differences in QALY loss, duration of cough, presence of vomiting
or whooping in patients recorded as having received at least three doses of
pertussis vaccine prior to onset compared with those who had not; even though
those fully vaccinated were younger than those without.
Discussion
Pertussis in young infants is recognised to be a severe illness, resulting in hospital
admission and sometimes death. Our patient survey among those aged 5 and over
reveals that pertussis causes a severe and prolonged cough, even in those who have
been vaccinated in the past. In laboratory confirmed cases, a pertussis episode is
associated with a QALY loss of around 0.055–0.097 or between 20 and 36 of
quality adjusted life days. Pertussis in older age groups is therefore a serious
disease. For example compared with influenza these scores are very high, as in
Figure 2. The boxplot of the QALY weight split by the severity of cough for laboratory confirmed caseswith pooled data from both the worst day and the day of the questionnaire. Above the plot the meanvalues are presented.
doi:10.1371/journal.pone.0111807.g002
Table 7. The overall QALY loss using the four stage approach or the two stage approach, the standard deviation of the mean overall QALY loss is shown inbrackets.
Laboratory confirmed cases Household contacts
4 stages 2 stages 4 stages 2 stages
QALY loss base 0.09724 (0.0044) 0.05450 (0.0037) 0.03645 (0.00772) 0.02042 (0.00507)
QALY loss min 0.09453 (0.0043) 0.05179 (0.0035) 0.03500 (0.00747) 0.01870 (0.00478)
QALY loss max 0.1002 (0.0055) 0.05758 (0.0038) 0.0380 (0.00797) 0.02196 (0.00533)
doi:10.1371/journal.pone.0111807.t007
The Burden of Disease and Health Care Use among Pertussis Cases
PLOS ONE | DOI:10.1371/journal.pone.0111807 November 25, 2014 11 / 14

confirmed influenza patients the overall loss in quality of life was estimated to be
just under 3 days, almost 10 times less [7]. The main cause of the high QALY loss
in pertussis is the long duration and severity of the cough, which affects sleep,
induces vomiting and tiredness, and impacts the quality of life in dimensions such
as mobility, daily activities and inducing anxiety/depression. For coughing
household contacts the loss in quality of life, though lower, was still greater than
that of an influenza episode. Interestingly the data suggests that the number of
coughing spells and the duration of symptoms is not less in non-confirmed cases
compared to confirmed cases, but that cough severity is less.
In all but three of the confirmed cases in our study laboratory diagnosis of
pertussis was based on a single high antibody titre to pertussis toxin in a blood
sample taken some weeks after onset, a method that has high specificity in patients
with symptoms of pertussis infection [8]. Although many of the patients in our
study had classic pertussis symptoms, as evidenced by a prolonged paroxysmal
cough with vomiting and whooping, very few would have been confirmed as
pertussis without the availability of serology as the diagnosis is rarely considered
in adults until late in the course of the illness when culture and PCR methods are
unlikely to yield positive results. While some of the increases in the serologically
confirmed cases recently reported in the UK [9] may be due to increased
awareness, it is clear that the endemic incidence of pertussis in adolescents and
adults, even prior to the recent resurgence, is considerably higher than estimated
from confirmed cases. One study of patients presenting in general practice in
England with acute spasmodic cough of at least 3 weeks duration in 1996/7
estimated an incidence of serologically confirmed pertussis of 330 per 100,000,
whereas statutory notifications of pertussis in England and Wales suggested an
incidence of less than 4 per 100,000 in the same period [10]. Even patients with a
prolonged cough accompanied by whooping may not seek health care or if they
do, they may not be investigated for pertussis, as shown by our study in coughing
household contacts of confirmed cases.
In the previous quality of life study on pertussis in the US [2] QALY weights
were obtained for different pertussis-related health states as described to adults
who had recovered from pertussis, or the parents of adolescent pertussis cases.
The QALY weight obtained for mild cough was 0.87 for adolescents and 0.85 for
adults and 0.67 and 0.81 respectively for severe cough. In comparison, the QALY
weight for mild and severe cough was 0.94 and 0.64 respectively in our study.
Although the studies used very different methodological approaches, it suggests
that the mild cough in our study was in particular linked to less loss in quality of
life, perhaps highlighting the drawbacks of measuring QALY weights for very mild
disease states by time-trade-off methods as used in the US study.
Our study has a number of methodological limitations. First, there may be
selection bias, as the patients with the most severe disease may be the most likely
to respond, and keep responding during the follow-up. Another limitation is the
lack of information on the exact duration of the various stages of the disease
which necessitated assumptions about the time course, albeit based on the data
provided by respondents. Another potential problem is recall bias given the long
The Burden of Disease and Health Care Use among Pertussis Cases
PLOS ONE | DOI:10.1371/journal.pone.0111807 November 25, 2014 12 / 14

interval between onset and completion of the questionnaire. Also, the sample size
for estimating QALY loss in non-confirmed cases was relatively small and
consisted mainly of children. Due consideration needs to be given to these
limitations when conducting analyses of the cost effectiveness of the different
vaccination strategies that could reduce the current burden of morbidity and
mortality from pertussis in the UK.
In conclusion, our study shows that the impact on the quality of life of
confirmed pertussis disease in those aged 5 years and above is considerable when
compared with other acute respiratory infections such as influenza. The overall
burden of pertussis illness at a population level is likely to be considerably
underestimated due to failure of patients with prolonged cough to seek medical
care and under investigation of pertussis in those that do.
Supporting Information
Supporting Information S1.
doi:10.1371/journal.pone.0111807.s001 (DOCX)
Acknowledgments
We want to thank Adolphe Bukasa for support with the data entry.
Author ContributionsConceived and designed the experiments: AJvH HC GA EM. Analyzed the data:
AJvH NA. Contributed reagents/materials/analysis tools: NA MV. Wrote the
paper: AJvH EM.
References
1. Chiappini E, Stival A, Galli L, de Martino M (2013) Pertussis re-emergence in the post-vaccination era.BMC Infect Dis 13: 151.
2. Lee GM, Salomon JA, LeBaron CW, Lieu TA (2005) Health-state valuations for pertussis: methods forvaluing short-term health states. Health Qual Life Outcomes 3: 17. doi:10.1186/1477-7525-3-17.
3. Amirthalingam G, Gupta S, Campbell H (2013) Pertussis immunisation and control in England andWales, 1957 to 2012: a historical review. Euro Surveill 18: 1–9.
4. De Greeff SC, de Melker HE, van Gageldonk PGM, Schellekens JFP, van der Klis FRM, et al. (2010)Seroprevalence of pertussis in The Netherlands: evidence for increased circulation of Bordetellapertussis. PLoS One 5: e14183. doi:10.1371/journal.pone.0014183.
5. Szende A, Oppe M, Devlin N (2007) EQ-5D value sets. Dordrecht, The Netherlands: Springer.Available: http://www.euroqol.org/.
6. National Research Ethics Service (2013) Defining Research Available: http://www.nres.nhs.uk/EasySiteWeb/GatewayLink.aspx?alId5355. Accessed 30 April 2014.
7. Van Hoek AJ, Underwood A, Jit M, Miller E, Edmunds WJ (2011) The impact of pandemic influenzaH1N1 on health-related quality of life: a prospective population-based study. PLoS One 6: e17030.doi:10.1371/journal.pone.0017030.
The Burden of Disease and Health Care Use among Pertussis Cases
PLOS ONE | DOI:10.1371/journal.pone.0111807 November 25, 2014 13 / 14

8. De Greeff SC, Teunis P, de Melker HE, Mooi FR, Notermans DW, et al. (2012) Two-component clusteranalysis of a large serodiagnostic database for specificity of increases of IgG antibodies againstpertussis toxin in paired serum samples and of absolute values in single serum samples. Clin VaccineImmunol 19: 1452–1456. doi:10.1128/CVI.00229-12.
9. Public Health England (2013) Enhanced Pertussis Surveillance. Available: http://www.hpa.org.uk/webc/HPAwebFile/HPAweb_C/1317133571358. Accessed 26 January 2014.
10. Miller E, Fleming DM, Ashworth LA, Mabbett DA, Vurdien JE, et al. (2000) Serological evidence ofpertussis in patients presenting with cough in general practice in Birmingham. Commun Dis PublicHealth 3: 132–134.
11. Curtis L (2011) Unit Costs of Health & Social Care 2011. Canterbury. Available: http://www.pssru.ac.uk/project-pages/unit-costs/2011/index.php.
12. Daily Hansard written answers House of commons (2008) Column 314W NHS Direct: OperatingCosts. Available: http://www.publications.parliament.uk/pa/cm200708/cmhansrd/cm081021/text/81021w0033.htm.
The Burden of Disease and Health Care Use among Pertussis Cases
PLOS ONE | DOI:10.1371/journal.pone.0111807 November 25, 2014 14 / 14
Top Related
Copyright © 2022 FDOKUMEN

