


Bahasa
Halaman
Hukum

The Balanced Scorecard as a Strategy-Evaluation Tool:
The Effects of Responsibility and Causal-Chain Focus
William B. Tayler
January 31, 2007
*S.C. Johnson Graduate School of Management, Cornell University, Ithaca, NY 14853-6201,
607-255-7139. I thank the members of my dissertation committee: Rob Bloomfield (chair), Tom
Gilovich, Bob Libby, and Mark Nelson, as well as workshop participants at Cornell University
and the 2006 Brigham Young University Accounting Research Symposium for comments. I
gratefully acknowledge the financial support from the Institute of Management Accountants
Doctoral Student Grant Program and from Cornell University’s Johnson Graduate School of
Management.
The Balanced Scorecard as a Strategy-Evaluation Tool:
The Effects of Responsibility and Causal-Chain Focus
Abstract
This paper uses an experiment to examine whether involvement in scorecard
implementation can mitigate the effects of motivated reasoning when the scorecard is framed as
a strategic tool, rather than merely as a balanced set of measures. Psychological research on
motivated reasoning suggests that managers will evaluate and interpret data in ways consistent
with their preferences, increasing the tendency for managers to arrive at conclusions that are
consistent with their preferences (Kunda 1990). Accordingly, results show that managers who
are involved in selecting strategic initiatives perceive those initiatives as having been more
successful than managers who are not involved in the strategy-selection process (holding
constant actual scorecard performance). The effects of motivated reasoning are mitigated by
giving managers responsibility for the selection of scorecard measures; but this mitigation only
occurs if the balanced scorecard is framed as a hypothesized causal chain of performance, rather
than as the classic four separate balanced-scorecard performance perspectives.

1
The Balanced Scorecard as a Strategy-Evaluation Tool:
The Effects of Responsibility and Causal-Chain Focus
I. Introduction
Early writings on the balanced scorecard emphasized the importance of using multiple
measures to provide a balanced perspective of firms’ performance, and established one of the
most salient features of balanced scorecards: the grouping of measures into four distinct
categories of performance (financial, customer, internal processes, and learning and growth) (see
Kaplan and Norton 1992). More recently, balanced-scorecard proponents have focused on the
need to tie measures together into a causal chain of performance, and to test the validity of these
hypothesized effects to guide the development of strategy. Kaplan and Norton (2001) argue that
one of the primary benefits of the balanced scorecard is its use in gauging the success of strategy.
Archival and field research has yielded mixed results on the benefits of balanced-
scorecard usage for strategy-evaluation purposes. One potential factor limiting the benefits of
scorecard usage is the propensity of decision makers to be influenced by motivations to arrive at
particular conclusions. Research in psychology suggests that this “motivated reasoning” begins
with the manner in which evidence is assembled and evaluated (Kunda 1990; Gilovich 1991;
Ditto and Lopez 1992; Ditto et al. 1998; Dawson et al. 2002; Ditto et al. 2003; Dawson et al.
2006a). Settings where information is noisy, ambiguous, or complex provide fertile ground for
motivated reasoning processes, because evaluators can more easily rely primarily on preference-
consistent information while maintaining a semblance of objectivity. The balanced scorecard,
with its emphasis on the use of multiple (often noisy) measures of performance, provides just
such a setting.

2
This paper uses an experiment to examine whether involvement in scorecard
implementation can limit the effect of motivated reasoning when the scorecard is framed as a
causal chain, rather than merely as a balanced set of measures. Psychological research on
motivated reasoning suggests that managers who are involved in selecting strategic initiatives are
likely to perceive those initiatives as more successful. However, I predict that if the scorecard is
framed as a causal chain, managers will be less susceptible to motivated reasoning because
success becomes more clearly defined: an initiative must not only improve the measure on which
it should have a direct effect (such as customer satisfaction), but also must improve the measures
on which it should have an indirect effect (such as gross profit). This more structured view
reduces managers’ “wiggle room” to see unsuccessful initiatives they selected as successful
(Kunda 1990).
I also predict that involvement in measure selection will offset tendencies to assess
outcomes too favorably, but only when managers are taking a causal perspective. Managers who
are involved in selecting a performance measure related to a strategic initiative they selected (and
who understand the predicted causal chain of performance) are motivated to perceive positive
effects of the performance they opted to measure on performance further down the causal chain
(a lead-lag relationship). If managers cannot find sufficient evidence to support their preferred
belief, the discovered non-effect will diminish managers’ enthusiasm for the strategic initiative
upon which their measure is based.
In my experiment, MBA students with a basic understanding of balanced-scorecard
concepts play the role of managers whose task it is to evaluate a new strategic initiative in place
at their firm. Participants are provided with balanced-scorecard data on which to base their
analyses, and answer questions regarding the success of the strategy and the process by which
3
they performed their assessment. In all experimental settings, scorecard data indicates a strong
direct effect of the new initiative on customer satisfaction, but a weak indirect effect of the new
initiative on financial performance (gross margin). This structure provides latitude for
participants to form conclusions consistent with their preferences. Participants with motivation
to perceive the strategy as successful can focus on the strong direct effects of their initiative and
deemphasize or ignore the lack of hypothesized indirect effects.
The experimental design consists of two levels of scorecard framing crossed with three
levels of scorecard responsibility (creating six between-subjects conditions). The scorecard is
framed either in the traditional “four groups” format, focusing on the grouping of performance
measures into the four classic scorecard perspectives (Kaplan and Norton 1992), or in a “causal
chain” format, where measures are still categorized by scorecard perspective, but hypothesized
causal linkages between measures are emphasized (Kaplan and Norton 1996b, 2000). The three
levels of scorecard responsibility are cumulative in nature, with some participants making no
decisions regarding strategic initiatives or scorecard measures, some selecting the strategic
initiative to be pursued, and some selecting both the initiative and a measure of performance tied
to that initiative.
Results indicate that initiative responsibility leads participants to perceive the strategy as
more successful, based on their propensity to recommend rolling the strategy out firm-wide
(holding constant performance results). Results further suggest that imbuing managers with a
causal-chain focus is not sufficient to mitigate motivated-reasoning processes, even in this
simple setting. However, when managers who understand the hypothesized causal chain are
given responsibility for a measure of performance further down the causal chain, the effects of
motivated reasoning related to managers’ responsibility for the strategic initiative are diminished.
4
Debriefing data help to establish the process underlying these effects by providing insight
into what information participants emphasized in their evaluations. Results indicate that
participants with greater motivation to perceive the initiative as successful place less emphasis
on scorecard data indicating otherwise. This differential focus on preference-inconsistent
information partially mediates the primary results of the paper. Additional mediation analyses
surrounding participants’ perception of measure quality further support these results, as do data
from a follow-up survey administered one week following the experiment.
These results contribute to research on the balanced scorecard in multiple ways. First, the
study demonstrates the effects of a causal view of the balanced scorecard in a strategy-evaluation
task. Though proponents of the balanced scorecard emphasize the importance of tying all
performance measures to strategy and of hypothesizing a testable causal chain of performance
(in part, to ensure that important indirect results follow the more direct successes (Kaplan and
Norton 2001)), empirical evidence suggests that, in many firms, explicit causal chains are non-
existent (Ittner and Larcker 2003; Malina and Selto 2004). My study provides evidence that a
causal view of the scorecard, in conjunction with involvement in scorecard measure selection,
helps overcome psychological forces that are likely to limit the usefulness of the scorecard.
Second, this study contributes to the performance-evaluation literature by demonstrating
that additional involvement of managers in scorecard implementation can help mitigate
motivated reasoning. Performance-evaluation research often focuses on managerial “buy-in,”
suggesting that responsibility for scorecard measures among those affected by the scorecard will
affect the impact of the scorecard (e.g., see Cokins 2005). The current study suggests that
another important benefit derived from increased managerial responsibility of scorecard

5
measures is that it counters motivated reasoning, and thereby reduces the chances that managers
view unsuccessful strategies as successful.
Finally, this study provides insight on the balanced-scorecard implementation process
and on the use of the scorecard for strategy-evaluation purposes (which Kaplan and Norton
(2001) cite as one of the primary benefits of scorecard usage). Scorecard proponents have begun
to address issues that arise when trying to implement scorecards, such as which parties should be
involved with the selection of scorecard measures (e.g., see Frigo and Krumwiede (2000) and
Niven (2002)). Research has also begun to examine how firms use the scorecard in the selection
of strategy (Campbell et al. 2006). However, most prior balanced-scorecard research has
focused on the technical attributes of the scorecard itself, and on managers’ use of the scorecard
for performance evaluations.
This study contributes to psychological research on motivated reasoning by
demonstrating how the effects motivated reasoning can be diminished through a logical
modification of decision-maker motivations. This “fighting fire with fire” approach essentially
accepts motivated reasoning as given, but adds motivations through adjusting decision-maker
involvement in the task to help balance prior motivations to arrive at certain conclusions (see
Bonner (2007, section 10-1) for a discussion of the importance of investigating the effects of
conflicting motivators in accounting).
The remainder of this paper proceeds as follows. Section II provides the background and
hypotheses. Section III describes the experimental design and related procedures. Section IV
discusses results. Section V summarizes results and discusses implications, limitations, and
directions for future research.

6
II. Background
The Balanced Scorecard
The balanced scorecard has been heralded as one of the most significant developments in
management accounting (Atkinson et al. 1997). A recent study by Bain & Company indicates
that 57 percent of firms worldwide use the balanced scorecard, including 75 percent of large
firms and 64 percent of firms in North America (Rigby and Bilodeau 2005).1 Further, greater
scorecard usage is associated with improved performance, regardless of firm size and product
life cycle (Hoque and James 2000).
Early writings on the balanced scorecard focused on the ability of multiple measures to
provide a more balanced perspective of firms’ performance (Kaplan and Norton 1992). Under
this view, the four scorecard categories (financial, customer, internal processes, and learning and
growth) keep managers from focusing solely on financial performance measures. Kaplan and
Norton (1992) also emphasize balance between internal and external measures, between outcome
measures and drivers of success, and between objective and subjective measures of performance.
More recently, scorecard proponents have shifted their emphasis from balance to the
strategy, arguing that the scorecard serves as a tool for defining strategic objectives and
communicating them throughout the organization, identifying initiatives to achieve those
objectives, and evaluating whether those objectives have been achieved (Kaplan and Norton
2000, 2001; Niven 2002; Buytendijk et al. 2004; Kaplan and Norton 2004a, 2004b, 2006).2
Scorecards are tied to strategy through the “strategy map” (Kaplan and Norton 2000), also called
a “value driver map” (Ittner and Larcker 2003). Strategy maps translate expected results into
1 960 survey respondents from around the world answered questions regarding usage of 25 of the most popular
managerial tools (Rigby and Bilodeau 2005). Respondent firms covered a broad range of industries and firm sizes. 2 Scorecard objectives are statements that define the purpose of actions taken and form the basis of measures used in
performance and strategy evaluation. Scorecard initiatives are actionable plans intended to affect performance in
targeted objectives.
7
testable hypotheses to enhance “strategic learning,” the process of using the strategically aligned
scorecard measures as a way of measuring the success of strategy (Kaplan and Norton 2001).3 If
linkages in the hypothesized causal chain of performance prove spurious, the scorecard, or the
strategy that drives it, can be adjusted.
Balanced-scorecard implementation issues have also received increased emphasis in
recent years (e.g., see Niven (2002) and Kaplan and Norton (2006)). Viewed narrowly,
scorecard implementation involves (among other things) the selection of measures, the collection
of scorecard-related data, the formatting of scorecard reports, and the dissemination of scorecard
information. When the scorecard is viewed as a tool for defining, executing, and measuring
strategy, scorecard implementation also involves the allocation of decision rights regarding
strategy selection and plans for achieving those strategic objectives. Kaplan and Norton (1996a)
recommend that scorecard development be a joint effort of unit managers and upper
management. Cokins (2005) suggests that manager involvement in scorecard implementation
generates “buy-in and ownership of the scorecard and key performance indicators.”
Prior Academic Research on the Balanced Scorecard
In this study, I examine the importance of emphasizing the strategic aspects of the
balanced scorecard (rather than simply emphasizing “balance”), and investigate how that
emphasis can influence the effect of key implementation-related choices. Specifically, I show
that evaluator involvement in the selection of strategic initiatives and scorecard measures affects
the way in which a strategy is evaluated and perceived, and demonstrate how a causal-chain
focus interacts with scorecard responsibility to influence these judgments.
3 Kaplan and Norton (2001) call strategic learning one of the primary benefits of balanced-scorecard use.
8
The majority of prior balanced-scorecard research has emphasized balance over strategy,
investigating how managers use the variety of scorecard measures to evaluate performance. For
example, Lipe and Salterio (2000) show that, for performance-evaluation purposes, measures
that are common among divisions tend to be weighted more heavily than unique measures, even
though the unique measures may be informationally superior in terms of predicting future
performance.4 Lipe and Salterio (2002) show that simply organizing performance measures by
the four scorecard perspectives can affect evaluator judgments. Ittner et al. (2003b) provide
evidence that evaluators reduce the intended balance in scorecard measures by basing
subjectively determined bonuses primarily on financial measures and incorporate measures other
than those on the scorecard in their decisions (even though discretion to do so was not part of
stated bonus plans).
Recent studies have investigated the use of the balanced scorecard in strategy
development (Malina and Selto 2001; Ittner et al. 2003a; Ittner and Larcker 2003; Campbell et
al. 2006). Malina and Selto (2001) show evidence that many scorecards do not have explicitly
defined causal linkages. Ittner and Larcker (2003) corroborate this finding (showing that less
than 30 percent of firms they surveyed that use the balanced scorecard have explicitly-stated
causal chains), and further show that when strategy maps are used, managers often fail to test the
hypothesized causal chain (in their study, only 21 percent of firms with explicitly-stated causal
chains go on to test the validity of the hypothesized effects). However, Campbell et al. (2006)
4 Other studies confirm and extend this finding. Dilla and Steinbart (2005) show that this “common-measure bias”
persists in knowledgeable decision makers. Libby et al. (2004), show that increasing process accountability and the
perceived quality of balanced-scorecard measures helps to reduce the common-measure bias. Krumwiede et al.
(2002) show that outcome feedback over multiple periods can lead to greater focus on unique measures. Roberts et
al. (2004) find that mechanical aggregation of individual measure evaluations can reduce the common-measure bias
seen when evaluators instead make holistic judgments. Banker et al. (2004) show that the intensity of the bias
depends on the strategic linkages of measures, and on decision makers’ knowledge of strategy. Salterio et al. (2005)
examine auditors’ use of clients’ scorecards to assess engagement risk, and show that benchmark usage and the
provision of an extensive strategic analysis can affect auditors’ relative weighting of common and unique measures.
9
provide field evidence from a firm that appears to have successfully tested the hypothesized
causal chain and adjusted its strategy accordingly. I use a controlled experiment to investigate
possible factors hindering the success of balanced-scorecard usage for strategy-evaluation
purposes, as well as potential methods for improving strategic learning when balanced
scorecards are utilized.
Little research has been done on balanced-scorecard implementation issues. However,
Lipe and Salterio (2000) point out that scorecard-related judgments may be influenced by
evaluator involvement in the implementation process. Manager involvement in scorecard
implementation varies between firms. Kaplan and Norton (2001) cite evidence of heavy
involvement in strategy and measure selection on the part of unit managers; but Malina and Selto
(2001) provide evidence suggesting that some firms impose measures on units without seeking
input from those affected.
Motivated Reasoning
Prior research in accounting has demonstrated the tendency for judgments to be
influenced by motivations to arrive at particular conclusions.5 Research in psychology has
helped clarify the process behind the effects of motivations on judgments, showing that
individuals tend to evaluate and interpret data in ways consistent with their preferences. This
pervasive tendency has come to be known as “motivated reasoning” (Kunda 1990).
Gilovich (1991) proposes that motivated reasoning is driven by the way in which
evaluators approach evidence. When encountering a disagreeable proposition, people tend to ask
5 See Cuccia et al. (1995) and Cloyd and Spilker (1999) with respect to tax professionals, Hackenbrack and Nelson
(1996), Bazerman et al. (1997), Bazerman et al. (2002), Phillips (2002), Beeler and Hunton (2002), Wilks (2002),
Kadous et al. (2003), Moore et al. (2006), and Nelson (2006) with respect to auditors, Maines (1996) and Hunton
and McEwen (1997) with respect to analysts, Hales (2006) and Seybert and Bloomfield (2006) with respect to
investors, and Boiney et al. (1997) and Bloomfield and Luft (2006) with respect to management accountants.

10
“Must I believe this?” and pursue information in an attempt to disconfirm or cast doubt on the
validity of the bad news (Ditto and Lopez 1992; Ditto et al. 1998; Dawson et al. 2002; Ditto et al.
2003; Dawson et al. 2006a). This high standard for acceptance leads to a more thorough
information search and a stringent interpretation of evidential weaknesses, thus increasing the
likelihood that an individual will find and accept evidence disconfirming the bad news.
However, when encountering an agreeable proposition, people ask “Can I believe this?” and
pursue information in an attempt to validate the good news. This more permissive acceptance
standard allows for a more superficial evaluation of evidence (Ditto et al. 1998; Dawson et al.
2006a; Dawson et al. 2006b), biased compilation of data (Lord et al. 1979; Dunning et al. 1989),
and earlier truncation of information search (Ditto and Lopez 1992; Ditto et al. 1998; Ditto et al.
2003; Dawson et al. 2006a). Acceptance of preference-consistent information is constrained,
however, by the reasonableness of the data (Kunda 1990). Even when succumbing to motivated
reasoning, decision-makers attempt to maintain an “illusion of objectivity” (Pyszczynski and
Greenberg 1987).
A number of institutional features of the balanced scorecard make it fertile ground for
motivated reasoning processes. A common criticism of the balanced scorecard revolves around
its emphasis on nonfinancial performance measures, which are typically more noisy, subjective,
and ambiguous than traditional financial measures (Ittner and Larcker 2003). This decrease in
precision and clarity provides managers with additional latitude in their interpretations of
evidence. Further, even the most basic of performance-measurement systems provide multiple
forms of performance feedback; the balanced scorecard is no exception. A manager in search of
preference-consistent information has multiple potential sources of agreeable data. Once a
11
reasonable level of supportive data is accumulated, managers are likely to stop searching,
disregard disconfirming evidence, or completely overlook conflicting data.
Managers who use balanced-scorecard feedback to evaluate a strategic initiative they
selected would prefer to discover that the selected strategy is successful. Holding constant actual
scorecard performance, if scorecard evidence is ambiguous or sufficiently complex or noisy to
allow different assessments of the success of the strategic initiative, managers with different
preferences will likely reach different conclusions. Thus, I predict that managers who have
responsibility for strategic-initiative selection will interpret balanced-scorecard data as indicating
the initiative is more successful than managers who are not responsible for initiative selection.
H1: Managers using the balanced scorecard to analyze the success of a new initiative will
see the initiative as more successful (i.e., they will be more likely to roll out the initiative
firm-wide) if they were responsible for the selection of the initiative.
Causal Chain
One potential method for reducing motivated reasoning among balanced-scorecard
evaluators is to increase emphasis on the hypothesized causal chain. As noted above, despite the
growing consensus that a causal-chain framing of the balanced scorecard is imperative for
strategic learning, many firms that utilize the scorecard fail to explicitly state hypothesized
causal linkages (Malina and Selto 2001; Ittner et al. 2003a; Ittner and Larcker 2003).
Framing the scorecard as a causal chain may decrease motivated reasoning by focusing
managers’ attention on the need to test hypothesized linkages between scorecard components in
making an assessment of the success of strategy, reducing managers “wiggle room” to perceive
data in a manner consistent with their preferences (Kunda 1990). Additionally, providing
managers with a predicted causal model should reduce the cognitive complexity of evaluation
tasks where multiple measures of performance are available for use (Morecroft et al. 2002;
12
Malina and Selto 2004; Krishnan et al. 2005), reducing ambiguity in feedback and further
restricting managers’ ability to see only what they want to see in the data. Further, when
managers understand all of the anticipated cause-and-effect linkages that follow from a strategic
initiative, managers may be less persuaded by individual instances of apparent success (e.g., an
increase in customer satisfaction) when other hypothesized effects do not follow (e.g., an
increase in financial performance). Because decision makers that succumb to motivated
reasoning are constrained in their acceptance of good news (and their rejection of bad news) by
their ability to construct an argument based on available evidence that could “persuade a
dispassionate observer” (Kunda 1990) or that maintains an “illusion of objectivity” (Pyszczynski
and Greenberg 1987), a clearly defined causal chain may limit evaluators’ ability to arrive at a
preference-consistent conclusion if some of the linkages deriving from an initiative they are
responsible for prove spurious.
H2: Framing the scorecard as a causal chain of performance will mitigate the effects of
motivated reasoning of managers who use the balanced scorecard to analyze the success
of an initiative they selected.
Measure Responsibility
A major aspect of the balanced-scorecard implementation process is the selection of
performance measures. Niven (2002, p. 146) calls scorecard measures the “centerpiece of the
scorecard system.” Frigo and Krumwiede (2000) emphasize the importance of involving middle
management in measure selection, noting that “departments know their key performance
measures and key success factors better than anyone else…and therefore, they are in the best
position to develop their own scorecards.”

13
Just as managers who have responsibility for the selection of initiatives are motivated to
perceive the initiatives as successful, managers who have responsibility for measure selection are
motivated to perceive that their choice of performance to measure is a good one. For example,
managers who understand the hypothesized causal chain of performance are motivated to
perceive that the performance that they opted to measure drives performance further down the
causal chain. For example, if a manager who believes that customer satisfaction affects financial
performance elects to monitor customer satisfaction through a measure of customer retention, the
manager would prefer to discover that increases in customer retention lead to improved financial
performance.
The motivated reasoning generated by manager involvement in measure selection has the
potential to mitigate the effects of managers’ motivated reasoning in strategy evaluation. Many
initiatives—though successful in terms of their direct effects—fail to drive performance further
down the causal chain. For example, an initiative can improve customer satisfaction (a direct
effect) without increasing financial performance (the ultimate, but indirect, goal). If managers in
this setting are motivated to perceive an initiative they selected as successful, and are also
motivated to perceive the measure they selected as driving financial performance (for example),
their evaluation of the evidence is likely to reveal the disappointing disconnect in the causal
chain.
As noted earlier, managers are constrained in their ability to arrive at preference-
consistent conclusions by the availability of sufficient evidence to reasonably support such an
inference (Pyszczynski and Greenberg 1987; Kunda 1990). Thus, the inability to support a
preferred belief of a causal link between the selected measure and performance further down the

14
causal chain will cast doubt on the viability of the initiative upon which the measure is based.
Importantly, this is only true if managers have an understanding of the causal chain.
H3: Responsibility for the selection of a measure of an initiative managers selected will
mitigate the effects of motivated reasoning when the scorecard is framed as a causal
chain rather than merely as a set of balanced measures.
III. Method
Task and Design
Participants played the role of managers over Paladin Pizza, a fictitious pizza chain
(hereafter referred to as the “firm”) whose task it was to use balanced-scorecard data to evaluate
a new strategic initiative to determine whether that initiative should be rolled out firm-wide. All
participants were provided background information for the firm and were told that the firm was
considering two different initiatives for implementation: 1) the “side order strategy,” where
stores give a free side order for every five pizzas purchased, and 2) the “quality ingredients
strategy,” where stores use high-quality ingredients (relative to current quality) for pizzas.6
Participants were also told that the firm was considering two different measures relating to the
new initiative: 1) the “customer survey score,” which is based on a customer survey measure of
customer intentions to return to order pizza, and 2) the “returning customer score,” which is
based on the actual number of return customers (based on credit card data).
The experiment crossed two types of scorecard framing with three levels of scorecard
responsibility. To manipulate scorecard framing, half of the participants received background
information that described the scorecard as being composed of four categories of performance
(financial, customer, internal processes, and learning and growth). Thus, these participants were
6 Participants were told that both initiatives would generate equivalent increases in variable costs, and that prices
would not be increased in conjunction with either of the initiatives.
15
in the “four groups” (FG) scorecard-framing setting. The other half of the participants received
background information that expanded on this description, emphasizing hypothesized cause-and-
effect relationships between scorecard components. These participants were in the “causal
chain” (CC) scorecard-framing setting. To reinforce the written description of the scorecard-
framing manipulation, participants were also presented with a graphical depiction of the four
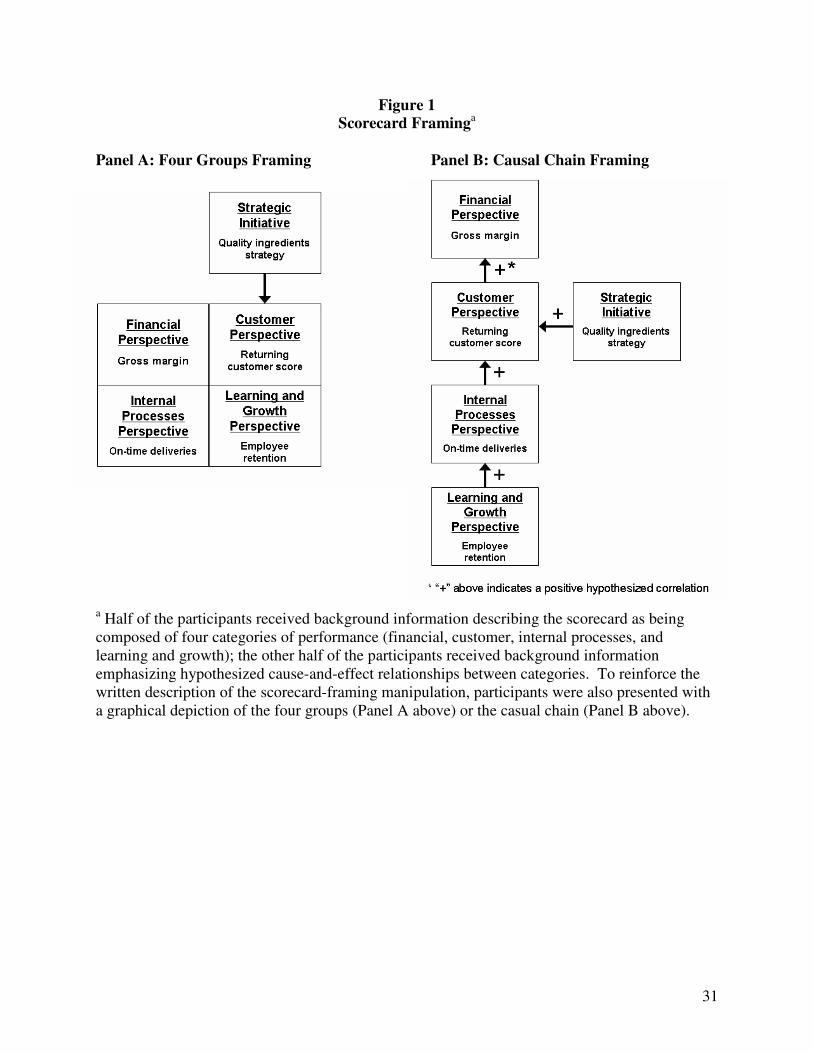
groups or casual chain, similar to Banker et al. (2004), as shown in Figure 1.
[Insert Figure 1 here]
Responsibility was manipulated at three levels. One-third of the participants received
case materials that presented the two initiatives under consideration, followed by a sentence
indicating that top management decided to pursue the “quality ingredients strategy.” Next, these
participants were presented with the two measures under consideration, followed by a sentence
indicating that the accounting department decided to use the “returning customer score.” These
participants were in the “low responsibility” (LR) condition, because they made no decisions
regarding components of the balanced scorecard. Another third of the participants were
presented with the initiatives under consideration, followed by a sentence indicating that the final
selection of which strategic initiative to pursue was theirs. Participants were then asked to select
which of the strategies they believed the firm should pursue by placing a checkmark next to their
choice and providing a brief explanation for their selection. These participants were then
presented with the two measures under consideration, followed by a sentence indicating that the
accounting department decided to use the “returning customer score.” Thus, these participants
were in the “initiative responsibility” (IR) condition. The remaining third of the participants
were presented with identical information as “initiative responsibility” participants, except that
following the presentation of the two measures under consideration, participants were told that
16
the final decision regarding which measure to implement was theirs. Participants were then
asked to select which of the measures they believed the firm should use by placing a checkmark
next to their choice and providing a brief explanation for their selection. Thus, these participants
were in the “initiative and measure responsibility” (IMR) condition.
Procedure
Participants began the session by filling out an informed-consent human-subjects-
approval form. They then read brief instructions and were directed to open an envelope
containing case materials. Participants then read background information for the firm and
information regarding the initiatives and measures under consideration (with some participants
making initiative and measure selections, depending on which responsibility condition they were
randomly assigned to). Next, participants were directed to open another envelope containing
background information on the balanced scorecard for the firm (participants in the “initiative
responsibility” (“initiative and measure responsibility”) condition were directed to open one of
two (four) envelopes, based on their scorecard-component selection(s), so that the information
provided reflected participants’ actual scorecard-component choices). Background information
was held constant across responsibility conditions, varying only in the labels applied to the
scorecard components (depending on the strategy or measure selected; e.g., a participant who
selected the “returning customer score” would see this label reflected on the scorecard, rather
than “customer survey score”). For simplicity, only the customer perspective had a stated
objective (“Delight the customer”) beyond that implied by the perspective title and associated
measures. Also for simplicity, each perspective had only one measure of performance.7
7 Many scorecards have multiple objectives in each of the scorecard perspectives, and each objective can have
multiple performance measures. Further, firms can opt to divide scorecards into more (or less) than four

17
After reading background information regarding the firm’s scorecard, participants were
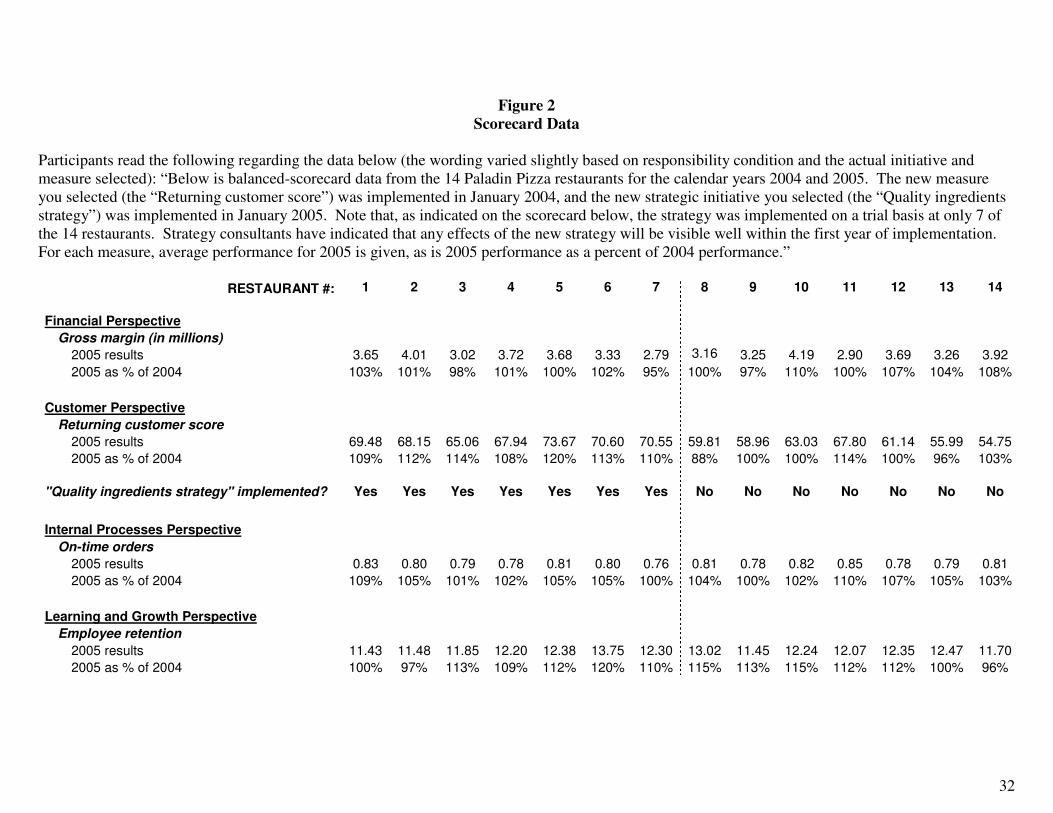
presented with balanced-scorecard data from 14 restaurants, as shown in Figure 2. To avoid a
feedback confound, scorecard data was identical regardless of experimental condition, initiative
choice, or measure choice (aside from the labels applied to the specific scorecard components).8
Scorecard data for an entire calendar year following initiative implementation was presented,
along with results as a percentage of the previous year’s results. Participants were told that the
new initiative was implemented on a trial basis at only 7 of the 14 restaurants and that “strategy
consultants have indicated that any effects of the new strategy will be visible well within the first
year of implementation.”
[Insert Figure 2 here]
As seen in Figure 2, balanced-scorecard feedback indicated a strong causal relationship
between implementation of the initiative and the measure of customer satisfaction (t = 4.69, p <
0.001), but no relationship between implementation of the initiative and gross margin (t = -0.917,
NS), and no relationship between the measure of customer satisfaction and gross margin (r =
-0.098, NS).9 Thus, participants motivated to perceive the new initiative as successful (i.e.,
participants who were responsible for the selection of the initiative), would be able to collect
evidence in favor of their preferred outcome (the strong causal link between implementation and
the measure of customer satisfaction); but data was also present that should cast doubt on the
preferred conclusion (e.g., the lack of a relationship between initiative implementation or the
measure of customer satisfaction and gross margin).
perspectives—deviating from the classic format originally prescribed by Kaplan and Norton (1992), and can provide
performance targets or benchmarks for some (or all) of the measures. Though technical attributes of the scorecard
may affect the levels of the effects examined in this study, they are unlikely to affect the directional results (Libby et
al. 2002). 8 Realizations of both the “customer survey score” and the “returning customer score” use the same scale, allowing
all numerical data to be held constant, regardless of initiative and measure selections. 9 The link between customer satisfaction and financial performance has been investigated with varying results in
prior studies (e.g., see American Quality Foundation (1992), Anderson et al. (1994), and Banker et al. (2000)).
18
After reviewing the balanced-scorecard data, participants were asked to rate the success
of the new initiative, as well as how likely they would be to recommend rolling out the new
initiative to the remainder of the restaurants (on a scale of 0 to 100). Participants then responded
to debriefing and demographic questions.
Participants
Students in an MBA-level management accounting course at a Business Week top-20
MBA program participated in the study as part of an in-class exercise. Prior to data collection,
participants had all participated in class sessions dealing with the use of management-accounting
data in decision making, and had been exposed to the balanced scorecard and some of its basic
features (e.g., the division of performance measures into four perspectives). Participants were
not taught in class about cause-and-effect relationships among scorecard components until after
they had taken part in the experiment. Thus, participants represented an ideal subject pool for
the current study, in part due to the nature of their interests and abilities, but also due to their
limited exposure to some of the specific features of the balanced scorecard (specifically, strategy
maps), the provision of which was manipulated in the experiment. This approach follows in a
tradition of utilizing classroom instruction to control for knowledge (Butt 1988; Nelson 1993;
Nelson et al. 1995; Bonner et al. 1996; Bonner et al. 1997; Nelson and Tayler 2006).10
In all, 135 participants provided data during three successive sections of the same
accounting course. On average, participants had 5.3 years of work experience and were 28.4
years old. 60 percent of the participants were male.
10
As part of their debriefing, participants were asked if they had previous experience with the balanced scorecard.
15 participants acknowledged having prior scorecard experience. Inferences are unchanged if data from these
participants are omitted.

19
IV. Results
Panel A of Table 1 shows the mean and standard deviation of rollout judgments by
experimental cell. Panel B of Table 1 shows the results of planned comparisons.
H1 predicts that managers who select a strategic initiative are more likely to roll out the
new initiative firm-wide than managers who did not select the initiative. To test H1, I compare
rollout judgments between the “low-responsibility, four groups” condition and the “initiative
responsibility, four groups” condition. Results indicate a significant simple effect, with a mean
rollout judgment is 52.0 when participants have low responsibility and 66.4 when participants
have responsibility for the initiative, a difference of 14.4 (t = 2.03, p = 0.022).11, 12
These results
support H1.13
The main effect of initiative responsibility is also significant (t = 3.45, p = 0.001)).
[Insert Table 1 here]
H2 predicts an interaction between scorecard framing and initiative responsibility, in
which the increase in managers’ propensity to roll out the new initiative when they are
responsible for initiative selection will be smaller when the scorecard is framed as a causal chain.
To test H2, I compare rollout judgments of participants in the four “low responsibility” and
“initiative responsibility” cells. As previously noted, when the scorecard is framed as four
11
All p-values presented are one-sided unless otherwise indicated. 12
In addition to the rollout decision, participants were asked to rate the success of the new initiative. Similar to the
rollout results, participants rated the initiative as more successful if they selected the initiative (t = 1.60, p = 0.052);
however, no other effects based on this question are significant. Interpreting responses to this question is difficult,
because the definition of what constitutes “success” of the initiative is not provided to participants, whereas the
rollout question is less ambiguous. For example, a manager might rate the initiative as successful based on its effect
on customer satisfaction, but choose not to roll out the strategy for the lack of the expected effects on financial
performance. For this reason, analyses and interpretation of results in the paper focus on the rollout decision, and
the success rating is not discussed further. 13
Consistent with pilot study results, the majority of participants (72 percent) selected the “quality ingredients”
initiative. For cells in which participants could select the initiative to be implemented, judgments regarding the
propensity to roll out the initiative firm-wide were not affected by which initiative participants selected (F = 1.55,
NS). Also consistent with pilot study results, the majority of participants (70 percent) selected the “returning
customer” measure. For cells in which participants could select the measure to be implemented, subsequent roll-out
judgments were not affected by which measure participants selected (F = 0.21, NS), nor by the combination
(interaction) of their specific measure and initiative selection (F = 0.17, NS).
20
groups, the mean rollout judgment is 52.0 when participants have low responsibility and 66.4
when participants have responsibility for the initiative. When the scorecard is framed as a causal
chain, the mean rollout judgment is 51.5 when participants have low responsibility and 70.7
when participants have responsibility for the initiative. The interaction is not significant (t =
0.50, NS). These results do not support H2, but instead indicate that regardless of scorecard
framing, participants with responsibility for initiative selection are more likely to arrive at a
preference-consistent conclusion (i.e., that the new initiative should be rolled out firm-wide).
H3 predicts that managers’ propensity to roll out the new initiative will decrease when
managers are responsible for measure selection and the scorecard is framed as a causal chain
(holding constant that participants have responsibility for the initiative). To test H3, I compare
rollout judgments in the four cells where participants had responsibility for the initiative (the
“initiative responsibility” and “initiative and measure responsibility” cells). When the scorecard
is framed as four groups, the mean rollout judgment is 66.4 when participants only have
responsibility for the initiative and 65.7 when participants have responsibility for both the
initiative and the measure (the difference of -0.7 is not significant (t = -0.09, NS)). When the
scorecard is framed as a causal chain, the mean rollout judgment is 70.7 when participants only
have responsibility for the initiative and 53.2 when participants have responsibility for both the
initiative and the measure (the difference of -17.5 is significant (t = -2.53, p = 0.006)).
Additionally, the simple effect of scorecard framing when participants have responsibility for
both the initiative and the measure is significant (difference = -12.5, t = -1.79, p = 0.038); and the
simple effect of scorecard framing when participants only have initiative responsibility is not
significant (difference = 4.4, t = 0.63, NS). A contrast comparing participants with initiative and
measure responsibility where the scorecard is framed as a causal chain to all other participants
21
who had initiative responsibility is significant (difference = -14.4, t = -2.53, p = 0.006). The
interaction is also significant (t = -1.71, p = 0.044). These results indicate that participants with
responsibility for the initiative and the measure of that initiative are less likely to roll out the
initiative than participants who only have responsibility for the initiative, but only if the
scorecard is framed as a causal chain. Interestingly, rollout judgments of participants in the
causal-chain setting with initiative and measure responsibility are not statistically different from
those of participants with low responsibility (t = 0.24, NS). These results support H3.14
Financial-Perspective Emphasis
Prior literature suggests that motivated reasoning leads individuals to stop their search
once they have collected sufficient preference-consistent data (e.g., that the new initiative
increased customer satisfaction), or to perform only a superficial analysis or a biased compilation
of additional data (Lord et al. 1979; Dunning et al. 1989; Ditto and Lopez 1992; Ditto et al.
1998; Ditto et al. 2003; Dawson et al. 2006a; Dawson et al. 2006b). Because financial
performance was not affected by the new initiative (constituting bad news for those motivated to
perceive the initiative as successful), participants with initiative responsibility will likely place
less emphasis on the financial perspective. To test this conjecture, participants were asked the
following: “Please rate how important each of the following perspectives on the balanced
scorecard was in your assessment of the success of the strategy at Paladin Pizza by allocating
100 points among the four perspectives, allocating more points to perspectives that were more
important in your assessment.” The names of the four scorecard perspectives were then provided
14
Three participants opened the wrong envelope (based on the initiative and/or measure selection they checked).
Inferences are unchanged if data from these participants are omitted.
22
with a blank next to each perspective for participants’ point allocations. Following the list of
perspectives, participants were reminded to ensure that their point allocations totaled to 100.15
Consistent with motivated reasoning processes, when the scorecard is framed as four
groups, participants with initiative responsibility placed less emphasis on the financial
perspective than participants with low responsibility. The mean financial-focus emphasis is 44.6
when participants have low responsibility and 31.7 when participants have responsibility for the
initiative, a difference of -12.9 (t = -2.81, p = 0.003). As with the rollout judgment, the framing
by initiative responsibility interaction does not significantly affect financial-perspective
emphasis (t = 1.28, NS).
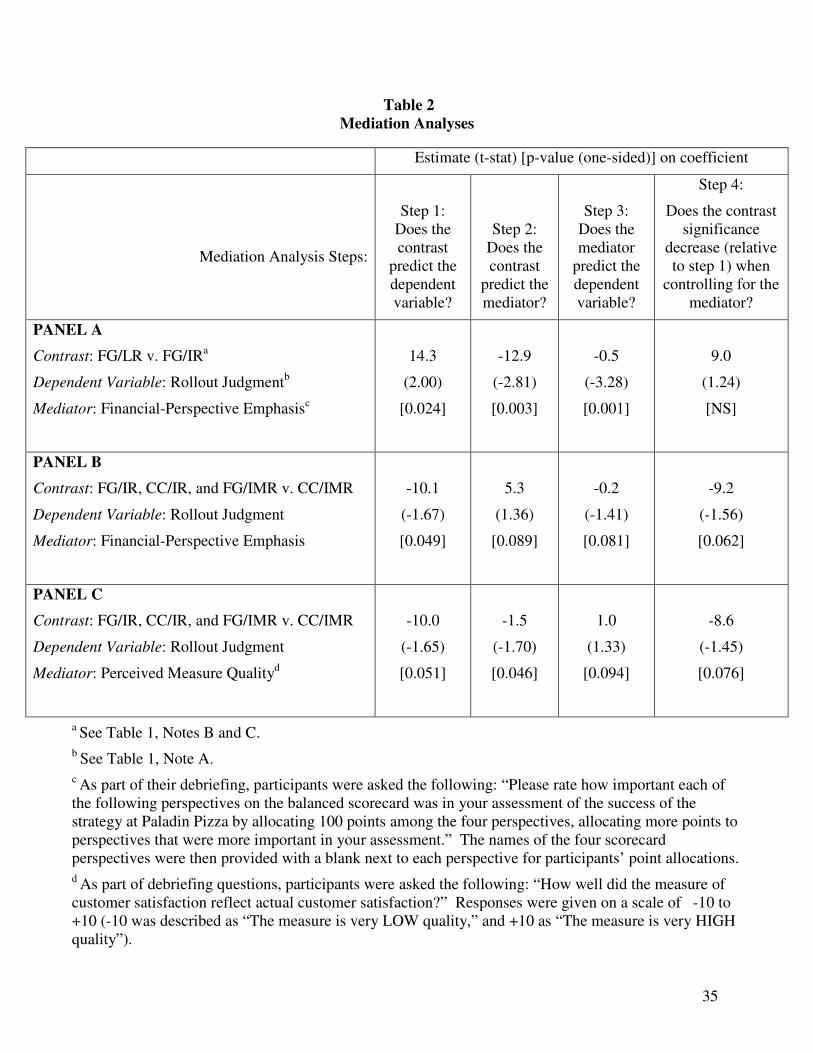
The significant effect of initiative responsibility on financial-perspective emphasis
suggests a possible mediation of financial-perspective emphasis on the rollout judgment.
Mediation requires that the following conditions hold: (1) a significant relation between the
contrast of interest and the dependent variable (e.g., the rollout judgment), (2) a significant
relation between the contrast and the potential mediator (e.g., financial-perspective emphasis),
(3) a significant relation between the potential mediator and the dependent variable, and (4) a
decline in the significance of the relation between the contrast and the dependent variable when
controlling for the effect of the potential mediator (James and Brett 1984; Baron and Kenny
1986; James et al. 2006).
Panel A of Table 2 presents evidence that the effect of initiative responsibility on the
rollout judgment is mediated by financial-perspective emphasis. Step 1 shows the significant
contrast (t = 2.00, p = 0.024). Step 2 shows the negative effect of the contrast on financial-
perspective emphasis (t = -12.9, p = 0.003). Step 3 shows a negative effect of financial-
15
The point allocations of four participants did not sum to exactly 100. Allocations for these participants were
normalized by dividing 100 by the point allocation sum and multiplying by the actual allocations. All analyses use
the normalized allocations; however, inferences are unchanged using raw point allocations.

23
perspective emphasis on the rollout judgment (t = -3.28, p = 0.001). And Step 4 shows that the
effect of the contrast on the rollout judgment is no longer significant when financial-perspective
emphasis is accounted for (t = 1.24, NS). Thus, the effect of initiative responsibility on the
rollout judgment works through the extent to which initiative responsibility leads participants to
emphasize financial performance in their strategy evaluation.
These findings suggest that financial-perspective emphasis may help explain managers’
decreased propensity to roll out the new initiative when managers are responsible for measure
selection and the scorecard is framed as a causal chain (holding constant that participants have
responsibility for the initiative). Just as participants with initiative responsibility are motivated
to perceive the initiative they selected as successful, participants with measure responsibility are
motivated to perceive positive effects of the performance they opted to measure. Thus,
participants who are provided with the hypothesized causal chain should be more likely to look
for a positive effect of their measure of customer satisfaction on financial performance,
increasing their emphasis on the financial perspective (and decreasing their likelihood of
recommending the initiative be rolled out firm-wide).
Panel B of Table 2 provides a breakdown of the analysis of mediation of financial-
perspective emphasis on H3 results (the decreased propensity of managers with responsibility for
the initiative to roll out the new initiative when managers are also responsible for measure
selection and the scorecard is framed as a causal chain). Step 1 shows the significant contrast
comparing participants with initiative and measure responsibility in the causal-chain setting to all
other participants with initiative responsibility (t = -1.67, p = 0.049).16
Step 2 shows the positive
16
Seven participants did not answer the debriefing question regarding their balanced-scorecard perspective
emphasis, and therefore should not be included in any portion of the mediation analysis. When data from these
participants are omitted, the significance of the contrast effect in this analysis (when not controlling for financial-
perspective emphasis) is p = 0.049 rather than p = 0.006 as reported on Table 1. Similarly, as shown in Panel A of
24
effect of this contrast on financial-perspective emphasis (t = 1.36, 0.089). Step 3 shows the
negative effect of financial-perspective emphasis on the rollout judgment (t = -1.41, p = 0.081).
And Step 4 shows that the effect of the contrast on the rollout judgment is less significant when
controlling for financial-perspective emphasis (t = -1.56, 0.062). Thus, H3 results appear to
work at least in part through participants’ emphasis on financial performance in their strategy
evaluation.
Perceived Measure Quality
Research in psychology suggests that participants who are responsible for measure
selection will perceive measure quality as higher than participants without measure
responsibility, as long as these participants are able to assemble a reasonable argument to that
end (Pyszczynski and Greenberg 1987; Kunda 1990; Gilovich 1991). However, when
participants responsible for measure selection are provided the causal chain, they may be limited
in their ability to perceive the new measure as high quality, due to their increased propensity to
examine financial-performance results, which are unaffected by the new measure. To test this
conjecture, participants were asked “How well did the measure of customer satisfaction reflect
actual customer satisfaction?” Responses were given on a scale of -10 to +10 (-10 was
described as “The measure is very LOW quality,” and +10 as “The measure is very HIGH
quality”).
Consistent with motivated reasoning processes, participants with both initiative and
measure responsibility perceive the new measure as being of higher quality than do participants
Table 2, dropping data from these participants changes the significance of the simple effect of initiative
responsibility to p = 0.024, rather than p = 0.022 as reported on Table 1.
25
with only initiative responsibility, unless the scorecard is framed as a causal chain.17
When the
scorecard is framed as four groups, the average perceived measure quality is 0.8 when
participants have responsibility for the initiative and 2.0 when participants have responsibility for
both the initiative and the measure (an increase of 1.2). When the scorecard is framed as a causal
chain, average perceived measure quality is 0.9 when participants have responsibility for the
initiative and -0.3 when participants have responsibility for both the initiative and the measure (a
decrease of 1.2). The interaction is significant (t = -1.62, p = 0.054).
The significant interactive effect of scorecard framing and measure responsibility on
perceived measure quality (holding constant that participants are responsible for the initiative)
suggests a possible mediation of perceived measure quality on the rollout judgment. If
participants determine that the measure does not affect financial performance as anticipated, this
may cast doubt on the link between the strategic objective the measure is based on and financial
performance—potentially decreasing participants’ enthusiasm for rolling out the new initiative.
Panel C of Table 2 provides a breakdown of the analysis of mediation of perceived
measure quality on H3 results (the decreased propensity of managers with responsibility for the
initiative to roll out the new initiative when managers are also responsible for measure selection
and the scorecard is framed as a causal chain). Step 1 shows the significant contrast comparing
participants with initiative and measure responsibility in the causal-chain setting to all other
participants with initiative responsibility (t = -1.65, p = 0.051).18
Step 2 shows the negative
effect of this contrast on perceived measure quality (t = -1.70, p = 0.046). Step 3 shows the
17
Eight participants did not answer the debriefing question regarding their perception of measure quality. Thus,
observations from these participants are omitted from analyses involving this data. 18
Eight participants did not answer the debriefing question regarding their perception of measure quality, and
therefore should not be included in any portion of the mediation analysis. When data from these participants are
omitted, the significance of the contrast effect in this analysis (when not controlling for perceived measure quality)
is p = 0.051 rather than p = 0.006 as reported on Table 1.
26
positive effect of perceived measure quality on the rollout judgment (t = 1.33, p = 0.094). And
Step 4 shows that the effect of the contrast on rollout judgment is less significant when
controlling for perceived measure quality (t = -1.45, 0.076). Thus, H3 results work at least in
part through participants’ perception of measure quality.
Additional analyses (untabulated) show that perceived measure quality and financial
perspective-emphasis capture different constructs which both mediate H3 results. Using both
variables to predict rollout judgment, perceived measure quality has a significant positive effect
(t = 1.37, p = 0.088) and financial perspective focus has a significant negative effect (t = -1.43, p
= 0.079). Controlling for these variables, the effect of the contrast on rollout judgment is no
longer significant (t = -1.27, NS).
Follow-up Survey
Motivated reasoning could affect participants’ information acquisition, leading them to
truncate their information search before acquiring preference-inconsistent data, and could also
lead participants to dismiss or disbelieve preference-inconsistent data they acquire. If scorecard
framing and degree of responsibility affected participants’ acquisition of or reliance upon
financial data, this should be reflected in participants’ ability to recall details of the scorecard
data. Participants who acquire or rely on financial data will be more likely to recall causal
effects in the data than participants who did not acquire or rely on this data.
One week following the experiment, participants responded to a brief survey to assess
their recollection of key aspects of the scorecard they used in their evaluations. 121 participants
responded to the survey, which first asked four multiple-choice questions testing participants’
recall of the initiative and measure implemented. Responses were coded as either correct (1) or

27
incorrect (0), and total recall for a participant was coded as the sum of the four recall scores.
Participants were also asked: “Did the restaurants that implemented the new initiative have
better/the same/worse gross margins than restaurants that did not implement the new initiative?”
Answers were provided on a scale from -5 (“Much worse”) to +5 (“Much better”), with 0 labeled
as “The same.” Responses were again coded as either correct or incorrect (with scale responses
less than or equal to zero coded as correct and responses greater than zero coded as incorrect,
since initiative implementation had a non-significant, negative effect on gross margin).
As expected, controlling for recall of the specific initiative and measure implemented (as
described above), participants with initiative responsibility said that the new initiative had a
greater positive effect on gross margin than did participants with low responsibility when the
scorecard was framed as four groups (Wald chi-square = 2.51, p = 0.057). The main effect of
initiative responsibility is also significant (Wald chi-square = 3.24, p = 0.036). Using the non-
transformed scale responses as the dependent variable, the simple effect of initiative
responsibility is also significant (t = 1.66, p = 0.050), as is the main effect of initiative
responsibility (t = 1.96, p = 0.026). These results suggest that participants with initiative
responsibility were less likely to acquire preference-inconsistent information, providing further
insight into the motivated reasoning process. A contrast comparing responses of participants
with initiative and measure responsibility where the scorecard is framed as a causal chain to all
other participants who had initiative responsibility is not significant, nor is the interactive effect
of scorecard framing and measure responsibility (though differences are in the expected
directions). These results are consistent with participants with initiative responsibility being less
likely to acquire financial-perspective data than participants who are not responsible for the
initiative, regardless of measure responsibility. However, participants with initiative
28
responsibility who do acquire this data may be more likely to rely on the data if they understand
the causal chain and have measure responsibility.
V. Conclusion
This paper reports the results of an experiment that shows that involving managers in the
selection of scorecard measures, and inducing them to frame the balanced scorecard as a causal
chain, can mitigate optimistic assessments of strategies the managers hope to see as successful.
When managers use balanced-scorecard data to evaluate the success of a strategic initiative they
were involved in selecting, managers perceive the strategy as more successful than managers
who were not involved in the strategy-selection process. However, managers who are involved
in measure selection and who understand the predicted causal chain of performance appear less
affected by their involvement in strategy selection when assessing the effectiveness of strategy.
These results highlight the importance of a causal-chain framing of the scorecard, which
balanced-scorecard proponents emphasize, but practitioners often fail to implement. These
results also indicate that managers’ motivated reasoning can be mitigated by giving managers
responsibility for measure selection.
I find no evidence that a causal-chain focus, by itself, is sufficient to overcome managers’
motivated reasoning in a strategy-evaluation task. This non-effect suggests that, even in this
simple setting, the causal chain does not provide enough guidance to overcome motivated
reasoning. It seems unlikely that it would do so in more realistic settings, in which greater
complexity would allow managers even more flexibility to interpret results favorably. However,
involving managers in the selection of performance measures provides a strong countervailing
29
form of motivated reasoning that, when managers have a causal-chain focus, is able to improve
strategy evaluation.
Results from my experiment suggest that motivated reasoning affects managers’
emphasis on preference-inconsistent information, but information acquisition and information
reliance (given information acquisition) could both drive these results. Future research could
examine the process through which managers’ motivated reasoning works, examining whether
measure responsibility, coupled with a causal chain framing, increases managers’ reliance on
preference-inconsistent information they encounter or their acquisition of that information.
Another useful direction for future research would be to examine how different aspects of
involvement in scorecard implementation affect strategy-evaluation judgments. For example,
managers could be given responsibility for the assignment of performance targets, the selection
of strategic objectives, or the development of the hypothesized causal chain itself. Further,
whereas my experiment held constant that scorecard feedback indicated a strong direct
performance link and no indirect link, future studies might investigate the effects of different
feedback realizations. Future research could also examine whether the effects of a causal-chain
focus are stronger when managers are given additional instructions on using the causal chain and
when managers are provided with additional causal-chain-related data (e.g., correlations).
Future archival and field work could also look for the effects of a causal-chain focus in
real-world balanced-scorecard settings, controlling for manager involvement in initiative and
measure selection. Effects demonstrated in the paper may also motivate additional experimental,
archival, and field studies that focus on scorecard use for performance evaluations, where
employees’ performance is subjectively evaluated by managers who were involved in the

30
scorecard implementation process and whose access to hypothesized causal chains of
performance varies.
31
Figure 1
Scorecard Framinga
Panel A: Four Groups Framing Panel B: Causal Chain Framing
a Half of the participants received background information describing the scorecard as being
composed of four categories of performance (financial, customer, internal processes, and
learning and growth); the other half of the participants received background information
emphasizing hypothesized cause-and-effect relationships between categories. To reinforce the
written description of the scorecard-framing manipulation, participants were also presented with
a graphical depiction of the four groups (Panel A above) or the casual chain (Panel B above).
32
Figure 2
Scorecard Data
Participants read the following regarding the data below (the wording varied slightly based on responsibility condition and the actual initiative and
measure selected): “Below is balanced-scorecard data from the 14 Paladin Pizza restaurants for the calendar years 2004 and 2005. The new measure
you selected (the “Returning customer score”) was implemented in January 2004, and the new strategic initiative you selected (the “Quality ingredients
strategy”) was implemented in January 2005. Note that, as indicated on the scorecard below, the strategy was implemented on a trial basis at only 7 of
the 14 restaurants. Strategy consultants have indicated that any effects of the new strategy will be visible well within the first year of implementation.
For each measure, average performance for 2005 is given, as is 2005 performance as a percent of 2004 performance.”
RESTAURANT #: 1 2 3 4 5 6 7 8 9 10 11 12 13 14
Financial Perspective
Gross margin (in millions)
2005 results 3.65 4.01 3.02 3.72 3.68 3.33 2.79 3.16 3.25 4.19 2.90 3.69 3.26 3.92
2005 as % of 2004 103% 101% 98% 101% 100% 102% 95% 100% 97% 110% 100% 107% 104% 108%
Customer Perspective 61.80 60.37
Returning customer score 63.97 60.85 57.07 62.71 61.39 62.48 64.14 68.08 58.92 63.21 59.38 61.34 58.49 53.14
2005 results 69.48 68.15 65.06 67.94 73.67 70.60 70.55 59.81 58.96 63.03 67.80 61.14 55.99 54.75
2005 as % of 2004 109% 112% 114% 108% 120% 113% 110% 88% 100% 100% 114% 100% 96% 103%
"Quality ingredients strategy" implemented? Yes Yes Yes Yes Yes Yes Yes No No No No No No No
Internal Processes Perspective 0.77 0.77
On-time orders 0.76 0.76 0.78 0.77 0.77 0.76 0.76 0.78 0.79 0.81 0.78 0.73 0.75 0.78
2005 results 0.83 0.80 0.79 0.78 0.81 0.80 0.76 0.81 0.78 0.82 0.85 0.78 0.79 0.81
2005 as % of 2004 109% 105% 101% 102% 105% 105% 100% 104% 100% 102% 110% 107% 105% 103%
Learning and Growth Perspective 11.24 11.20
Employee retention 11.43 11.84 10.49 11.19 11.06 11.46 11.20 11.34 10.09 10.64 10.78 11.02 12.43 12.13
2005 results 11.43 11.48 11.85 12.20 12.38 13.75 12.30 13.02 11.45 12.24 12.07 12.35 12.47 11.70
2005 as % of 2004 100% 97% 113% 109% 112% 120% 110% 115% 113% 115% 112% 112% 100% 96%

33
Table 1
Rollouta
Decision
Panel A: Mean Rollout Decision (Standard Deviation)
Responsibilityc
Scorecard
Framingb
Low
Responsibility (LR)
Initiative
Responsibility (IR)
Initiative and Measure
Responsibility (IMR)
All
Four
Groups
(FG)
N=21
52.0
(20.9)
N=22
66.4
(22.5)
N=22
65.7
(23.8)
61.5
(23.1)
Causal
Chain
(CC)
N=25
51.5
(26.8)
N=23
70.7
(21.7)
N=22
53.2
(22.5)
58.3
(25.1)
All 51.7
(24.0)
68.6
(22.0)
59.4
(23.8)
59.9
(24.1)
Panel B: Results of Planned Comparisons
Planned Comparisons
Estimate
t
p value (one-
sided)
H1: FG/LR v. FG/IR 14.4 2.03 0.022
H2: Framing by Initiative Responsibility Interaction 2.4 0.50 NS
H3: FG/IR, CC/IR, and FG/IMR v. CC/IMR -14.4 -2.53 0.006
Framing by Measure Responsibility Interaction -8.4 -1.71 0.044
Simple effect: FG/IR v. FG/IMR -0.7 -0.09 NS
Simple effect: CC/IR v. CC/IMR -17.5 -2.53 0.006
Simple effect: FG/IR v. CC/IR 4.4 0.63 NS
Simple effect: FG/IMR v. CC/IMR -12.5 -1.79 0.038
a Participants rated how likely they would be to recommend rolling out the new initiative to the
remainder of the Paladin Pizza restaurants, on a scale of 0 to 100. On the scale, 0 was described as
“Very unlikely to recommend further implementation,” and 100 as “Very likely to recommend further
implementation.”
b Half of the participants received background information describing the scorecard as being composed
of four categories of performance (financial, customer, internal processes, and learning and growth), and
were provided a simple diagram depicting these four categories. Thus, these participants are in the “four
groups” (FG) scorecard-framing setting. The other half of the participants received background
information that expanded on this description, emphasizing hypothesized cause-and-effect relationships
34
between categories, and were provided a diagram depicting the categories and the causal chain they
form. These participants are in the “causal chain” (CC) scorecard-framing setting.
c One-third of the participants received case materials that described a new initiative and a new measure
of customer satisfaction that would be implemented. These participants had “low responsibility” (LR),
in that they made no decisions regarding strategy or the composition of the balanced scorecard. One-
third of the participants were asked to select a new initiative to implement, and were informed of a
measure of customer satisfaction that would be implemented. Thus, these participants had “initiative
responsibility” (IR). One-third of the participants were asked to select a new initiative and a measure of
customer satisfaction for implementation. Thus, these participants had “initiative and measure
responsibility” (IMR).
35
Table 2
Mediation Analyses
Estimate (t-stat) [p-value (one-sided)] on coefficient
Mediation Analysis Steps:
Step 1:
Does the
contrast
predict the
dependent
variable?
Step 2:
Does the
contrast
predict the
mediator?
Step 3:
Does the
mediator
predict the
dependent
variable?
Step 4:
Does the contrast
significance
decrease (relative
to step 1) when
controlling for the
mediator?
PANEL A
Contrast: FG/LR v. FG/IRa
Dependent Variable: Rollout Judgmentb
Mediator: Financial-Perspective Emphasisc
14.3
(2.00)
[0.024]
-12.9
(-2.81)
[0.003]
-0.5
(-3.28)
[0.001]
9.0
(1.24)
[NS]
PANEL B
Contrast: FG/IR, CC/IR, and FG/IMR v. CC/IMR
Dependent Variable: Rollout Judgment
Mediator: Financial-Perspective Emphasis
-10.1
(-1.67)
[0.049]
5.3
(1.36)
[0.089]
-0.2
(-1.41)
[0.081]
-9.2
(-1.56)
[0.062]
PANEL C
Contrast: FG/IR, CC/IR, and FG/IMR v. CC/IMR
Dependent Variable: Rollout Judgment
Mediator: Perceived Measure Qualityd
-10.0
(-1.65)
[0.051]
-1.5
(-1.70)
[0.046]
1.0
(1.33)
[0.094]
-8.6
(-1.45)
[0.076]
a See Table 1, Notes B and C.
b See Table 1, Note A.
c As part of their debriefing, participants were asked the following: “Please rate how important each of
the following perspectives on the balanced scorecard was in your assessment of the success of the
strategy at Paladin Pizza by allocating 100 points among the four perspectives, allocating more points to
perspectives that were more important in your assessment.” The names of the four scorecard
perspectives were then provided with a blank next to each perspective for participants’ point allocations.
d As part of debriefing questions, participants were asked the following: “How well did the measure of
customer satisfaction reflect actual customer satisfaction?” Responses were given on a scale of -10 to
+10 (-10 was described as “The measure is very LOW quality,” and +10 as “The measure is very HIGH
quality”).

36
References
American Quality Foundation. 1992. Best Practices Report. Cleveland: Ernst & Young.
Anderson, E. W., C. Fornell, and D. R. Lehmann. 1994. Customer Satisfaction, Market Share,
and Profitability - Findings from Sweden. Journal of Marketing 58 (3):53-66.
Atkinson, A. A., R. Balakrishnan, P. Booth, J. M. Cote, T. Groot, T. Malmi, H. Roberts, E.
Uliana, and A. Wu. 1997. New directions in management accounting research. Journal of
Management Accounting Research 9:79-108.
Banker, R. D., H. Chang, and M. J. Pizzini. 2004. The Balanced Scorecard: Judgmental Effects
of Performance Measures Linked to Strategy. The Accounting Review 79 (1):1-23.
Banker, R. D., G. Potter, and D. Srinivasan. 2000. An empirical investigation of an incentive
plan that includes nonfinancial performance measures. The Accounting Review 75 (1):65-
92.
Baron, R. M., and D. A. Kenny. 1986. The Moderator Mediator Variable Distinction in Social
Psychological-Research - Conceptual, Strategic, and Statistical Considerations. Journal
of Personality and Social Psychology 51 (6):1173-1182.
Bazerman, M. H., G. Loewenstein, and D. A. Moore. 2002. Why good accountants do bad
audits. Harvard Business Review 80 (11):96-102.
Bazerman, M. H., K. P. Morgan, and G. F. Loewenstein. 1997. The impossibility of auditor
independence. Sloan Management Review 38 (4):89-94.
Beeler, J. D., and J. E. Hunton. 2002. Contingent Economic Rents: Insidious Threats to Audit
Independence. Advances in Accounting Behavioral Research 5:21-50.
Bloomfield, R. J., and J. L. Luft. 2006. Responsibility for Cost Management Hinders Learning to
Avoid the Winner's Curse. The Accounting Review 81 (1):29-47.
Boiney, L. G., J. Kennedy, and P. Nye. 1997. Instrumental Bias in Motivated Reasoning: More
When More Is Needed. Organizational Behavior and Human Decision Processes 72
(1):1-24.
Bonner, S. E. 2007. Judgment and Decision Making in Accounting. Upper Saddle River, New
Jersey: Prentice-Hall.
Bonner, S. E., R. Libby, and M. W. Nelson. 1996. Using decision aids to improve auditors'
conditional probability judgments. The Accounting Review 71 (2):221-240.
———. 1997. Audit category knowledge as a precondition to learning from experience.
Accounting, Organizations & Society 22 (5):387-410.
37
Butt, J. L. 1988. Frequency Judgments in an Auditing-Related Task. Journal of Accounting
Research 26 (2):315-330.
Buytendijk, F., B. Wood, and L. Geishecker. 2004. Drivers and Challenges of Corporate
Performance Measurement: Gartner, Inc., Report R-22-0730.
Campbell, D., S. M. Datar, S. L. Kulp, and V. G. Narayanan. 2006. The Strategic Information
Content of Non-financial Performance Measures. Working Paper, Harvard Business
School.
Cloyd, C. B., and B. C. Spilker. 1999. The influence of client preferences on tax professionals'
search for judicial precedents, subsequent judgments and recommendations. The
Accounting Review 74 (3):299-322.
Cokins, G. 2005. Performance Management: Making It Work: The Promise and Perils of the
Balanced Scorecard. DM Review Online August 2005.
Cuccia, A. D., K. Hackenbrack, and M. W. Nelson. 1995. The Ability of Professional Standards
to Mitigate Aggressive Reporting. The Accounting Review 70 (2):227-248.
Dawson, E., T. Gilovich, and D. T. Regan. 2002. Motivated reasoning and performance on the
Wason selection task. Personality and Social Psychology Bulletin 28 (10):1379-1387.
———. 2006a. Motivated Reasoning and Susceptibility to the "Cell A" Bias. Working Paper,
Yale University and Cornell University.
Dawson, E., K. Savitsky, and D. Dunning. 2006b. "Don't Tell Me, I Don't Want to Know":
Understanding People's Reluctance to Obtain Medical Diagnostic Information. Working
Paper, Yale University, Williams College, and Cornell University.
Dilla, W. N., and P. J. Steinbart. 2005. Relative Weighting of Common and Unique Balanced
Scorecard Measures by Knowledgeable Decision Makers. Behavioral Research in
Accounting 17:43-53.
Ditto, P. H., and D. F. Lopez. 1992. Motivated Skepticism - Use of Differential Decision Criteria
for Preferred and Nonpreferred Conclusions. Journal of Personality and Social
Psychology 63 (4):568-584.
Ditto, P. H., G. D. Munro, A. M. Apanovitch, J. A. Scepansky, and L. K. Lockhart. 2003.
Spontaneous skepticism: The interplay of motivation and expectation in responses to
favorable and unfavorable medical diagnoses. Personality and Social Psychology Bulletin
29 (9):1120-1132.
Ditto, P. H., J. A. Scepansky, G. D. Munro, A. M. Apanovitch, and L. K. Lockhart. 1998.
Motivated sensitivity to preference-inconsistent information. Journal of Personality and
Social Psychology 75 (1):53-69.
38
Dunning, D., J. A. Meyerowitz, and A. D. Holzberg. 1989. Ambiguity and Self-Evaluation - the
Role of Idiosyncratic Trait Definitions in Self-Serving Assessments of Ability. Journal of
Personality and Social Psychology 57 (6):1082-1090.
Frigo, M. L., and K. R. Krumwiede. 2000. The balanced scorecard. Strategic Finance 81 (7):50-
54.
Gilovich, T. 1991. How we know what isn't so: the fallibility of human reason in everyday life.
New York, N.Y.: Free Press.
Hackenbrack, K., and M. W. Nelson. 1996. Auditors' incentives and their application of financial
accounting standards. The Accounting Review 71 (1):43-59.
Hales, J. 2006. Directional Preferences, Information Processing, and Investors' Forecasts of
Earnings. Working Paper, The University of Texas at Austin.
Hoque, Z., and W. James. 2000. Linking Balanced Scorecard Measures to Size and Market
Factors: Impact on Organizational Performance. (Cover story). Journal of Management
Accounting Research 12:1-17.
Hunton, J. E., and R. A. McEwen. 1997. An assessment of the relation between analysts'
earnings forecast accuracy, motivational incentives and cognitive information search
strategy. The Accounting Review 72 (4):497-515.
Ittner, C. D., R. A. Lambert, and D. F. Larcker. 2003a. The structure and performance
consequences of equity grants to employees of new economy firms. Journal of
Accounting & Economics 34 (1-3):89-127.
Ittner, C. D., and D. F. Larcker. 2003. Coming Up Short on Nonfinancial Performance
Measurement. Harvard Business Review 81 (11):88-95.
Ittner, C. D., D. F. Larcker, and M. W. Meyer. 2003b. Subjectivity and the Weighting of
Performance Measures: Evidence from a Balanced Scorecard. The Accounting Review 78
(3):725-758.
James, L. R., and J. M. Brett. 1984. Mediators, Moderators, and Tests for Mediation. Journal of
Applied Psychology 69 (2):307-321.
James, L. R., S. A. Mulaik, and J. M. Brett. 2006. A tale of two methods. Organizational
Research Methods 9 (2):233-244.
Kadous, K., S. J. Kennedy, and M. E. Peecher. 2003. The Effect of Quality Assessment and
Directional Goal Commitment on Auditors' Acceptance of Client-Preferred Accounting
Methods. The Accounting Review 78 (3):759-778.
Kaplan, R. S., and D. P. Norton. 1992. The Balanced Scorecard - Measures That Drive
Performance. Harvard Business Review 70 (1):71-79.
39
———. 1996a. The balanced scorecard: translating strategy into action. Boston, Mass.:
Harvard Business School Press.
———. 1996b. Using the balanced scorecard as a strategic management system. Harvard
Business Review 74 (1):75-85.
———. 2000. Having trouble with your strategy? Then map it. Harvard Business Review 78
(5):167-176.
———. 2001. The strategy-focused organization: how balanced scorecard companies thrive in
the new business environment. Boston, Mass.: Harvard Business School Press.
———. 2004a. Measuring the strategic readiness of intangible assets. Harvard Business Review
82 (2):52-63.
———. 2004b. Strategy maps: converting intangible assets into tangible outcomes. Boston:
Harvard Business School Press.
———. 2006. How to Implement a New Strategy without Disrupting Your Organization.
Harvard Business Review.
Krishnan, R., J. Luft, and M. D. Shields. 2005. Effects Accounting-Method Choices on
Subjective Performance-Measure Weighting Decisions: Experimental Evidence on
Precision and Error Covariance. The Accounting Review 80 (4):1163-1192.
Krumwiede, K. R., M. R. Swain, and D. L. Eggett. 2002. The Effects of Task Outcome Feedback
and Broad Domain Evaluation Experience on the Use of Unique Scorecard Measures.
Working Paper, Boise State University and Brigham Young University.
Kunda, Z. 1990. The Case for Motivated Reasoning. Psychological Bulletin 108 (3):480-498.
Libby, R., R. Bloomfield, and M. W. Nelson. 2002. Experimental research in financial
accounting. Accounting Organizations and Society 27 (8):777-812.
Libby, T., S. E. Salterio, and A. Webb. 2004. The balanced scorecard: The effects of assurance
and process accountability on managerial judgment. The Accounting Review 79 (4):1075-
1094.
Lipe, M. G., and S. E. Salterio. 2000. The balanced scorecard: Judgmental effects of common
and unique performance measures. The Accounting Review 75 (3):283-298.
———. 2002. A note on the judgmental effects of the balanced scorecard's information
organization. Accounting, Organizations & Society 27 (6):531-540.
Lord, C. G., L. Ross, and M. R. Lepper. 1979. Biased Assimilation and Attitude Polarization -
Effects of Prior Theories on Subsequently Considered Evidence. Journal of Personality
and Social Psychology 37 (11):2098-2109.
40
Maines, L. A. 1996. An experimental examination of subjective forecast combination.
International Journal of Forecasting 12 (2):223-233.
Malina, M. A., and F. H. Selto. 2001. Communicating and Controlling Strategy: An Empirical
Study of the Effectiveness of the Balanced Scorecard. Journal of Management
Accounting Research 13:47.
———. 2004. Causality in a Performance Measurement Model. Working Paper, The University
of Vermont and The University of Colorado at Boulder.
Moore, D. A., P. E. Tetlock, L. Tanlu, and M. H. Bazerman. 2006. Conflicts of Interest and the
Case of Auditor Independence: Moral Seduction and Strategic Issue Cycling. Academy of
Management Review 31 (1):10-29.
Morecroft, J. D. W., R. Sanchez, and A. Heene. 2002. Systems perspectives on resources,
capabilities, and management processes. 1st ed. Amsterdam; New York: Pergamon.
Nelson, M. W. 1993. The Effects of Error Frequency and Accounting Knowledge on Error
Diagnosis in Analytical Review. Accounting Review 68 (4):804-824.
———. 2006. Ameliorating conflicts of interest in auditing: Effects of recent reforms on
auditors and their clients. Academy of Management Review 31 (1):30-42.
Nelson, M. W., R. Libby, and S. E. Bonner. 1995. Knowledge Structure and the Estimation of
Conditional Probabilities in Audit Planning. Accounting Review 70 (1):27-47.
Nelson, M. W., and W. B. Tayler. 2006. Information Pursuit in Financial-Statement Analysis:
Effects of Disaggregation, Choice and Effort. The Accounting Review, forthcoming.
Niven, P. R. 2002. Balanced scorecard step by step: maximizing performance and maintaining
results. New York: Wiley.
Phillips, F. 2002. The distortion of criteria after decision-making. Organizational Behavior and
Human Decision Processes 88 (2):769-784.
Pyszczynski, T., and J. Greenberg. 1987. Toward an Integration of Cognitive and Motivational
Perspectives on Social Inference - a Biased Hypothesis-Testing Model. Advances in
Experimental Social Psychology 20:297-340.
Rigby, D., and B. Bilodeau. 2005. Management Tools and Trends 2005: Bain & Company.
Roberts, M. L., T. L. Albright, and A. R. Hibbets. 2004. Debiasing Balanced Scorecard
Evaluations. Behavioral Research in Accounting 16:75-88.
Salterio, S., W. R. Knechel, and N. Kotchetova. 2005. Performance Measurement Systems and
Strategic Analysis Extensiveness: Auditor's Usage of Balanced Scorecards and
Performance Benchmarks. Working Paper, Queens University, The University of Florida,
and The University of Waterloo.

41
Seybert, N., and R. Bloomfield. 2006. Wishful Thinking in Laboratory Markets. Working Paper,
Cornell University.
Wilks, T. J. 2002. Predecisional distortion of evidence as a consequence of real-time audit
review. The Accounting Review 77 (1):51-71.
Top Related
Copyright © 2022 FDOKUMEN

