


Bahasa
Halaman
Hukum


Full Paper
1712
Synthesis and Characterization of NewPolyurea Elastomers by Sol/Gel Chemistrya
Antoni Sanchez-Ferrer,* Daniel Rogez, Philippe Martinoty
A series of elastomers based on polyurea chemistry is synthesized by crosslinking amino-terminated polyethers with a triisocyanate using an appropriate solvent, which slowed downthe reactivity of the amino groups. Control of the reactivity allows the shaping of thematerial,and films of defined thickness can be achievedfor mechanical testing. The strength of thefinal network can be tuned by the crosslinkingdensity of the network chemical constitution.The resulting materials show a good thermalstability and promising mechanical enhance-ment.
Introduction
Polyurea chemistry is a relatively new synthetic process,
similar to the one used for the synthesis of polyurethanes.
But unlike the polyurethanes, polyureas do not require a
catalyst to accelerate the chemical reaction, due to the
high nucleophilicity of amines.[1] The relative reactivity
Dr. A. Sanchez-FerrerFood and Soft Materials Science, Institute of Food, Nutrition andHealth, ETH Zurich,Schmelzbergstrasse 9, 8092 Zurich, SwitzerlandFax: þ41 44 632 1603.; E-mail: [email protected]. A. Sanchez-FerrerInstitute of Supramolecular Science and Engineering, UniversityLouis Pasteur, 8 alleeGaspard Monge, 67083 Strasbourg, FranceE-mail: [email protected]. D. Rogez, Dr. P. MartinotyInstitute Charles Sadron, UPR 22 CNRS, 23 rue du Loess, 67034Strasbourg Cedex, France
a : Supporting information for this article is available at the bottomof the article’s abstract page, which can be accessed from thejournal’s homepage at http://www.mcp-journal.de, or from theauthor.
Macromol. Chem. Phys. 2010, 211, 1712–1721
� 2010 WILEY-VCH Verlag GmbH & Co. KGaA, Weinheim
of isocyanates with primary amines to form polyureas is
1 000 times faster than that of alcohols to form poly-
urethanes, or water to hydrolyze isocyanates, and thus
foaming is almost impossible. This fast reactivity leads to
the fact that curing of polyureas is not affected by moisture
or temperature.[2]
Polyurea systems are the result of a chemical reaction
between a polyisocyanate and a polyamine to form urea
groups that can interact by hydrogen bonding. These
systems have better resistance to high pH, far superior
thermal properties and much higher melting points than
hybrids, polyurethane systems or other polymers.[3–9] The
urea linkage found in polyureas is more resistant to
hydrolysis than the urethane linkage because of its
bidentate nature.[10] The greatest advantages of polyureas
are extreme resistance to abrasion and chemicals, and also
service temperatures from �60 to þ200 8C. Polyurethanes
and polyurea block copolymers have acceptance in
biomedical applications, as implants or medical
devices,[11,12] due to their good biocompatibility and their
excellent physical properties.[13,14]
Generally, the reaction for obtaining linear polymers
(thermoplastic block copolymers) takes place between
a diisocyanate (aromatic or aliphatic) with an amino-
terminated prepolymer or resin (generally aliphatic).[8,10,14–23]
DOI: 10.1002/macp.201000117

Synthesis and Characterization of New Polyurea Elastomers by Sol/Gel . . .
The prepolymer or resins contains both soft segments with
low glass transition temperatures and amorphous melts,
and hard domains with high glass transition and high
melting temperatures due to hydrogen bonding[24,25] as
physical crosslinks. Little work has been done for the
synthesis and study of polymer networks because of the
fast reactivity during chemical crosslinking, except by
using spray or reaction injection molding. Because of this
fast reaction, polyureas can be used in sprayable systems
for coatings.[26] The spray technology was not developed
until the 1990s,[27,28] following the reaction injection
molding technique.[29–31]
In both techniques, the two components are processed
using specialized industrial equipment at high pressure and
mixed either i) directly prior to surface coating, or, ii) in
a mold cavity to obtain coatings, membranes or various
different shapes. Elastomeric systems based on polyurea
chemistry have been formulated to produce high perfor-
mance, rapid curing coatings and caulks.[32] Because of their
fast gelation[1] (typically 2 to 3 s gelation time) and curing
process (dry time of less than 10 s), polyureas can be applied
in adverse warm and humid conditions that would
normally inhibit the use of conventional chemistries like
polyurethanes.
The most common chemicals used are aromatic iso-
cyanates [4,40-dicyclohexylmethane diisocyanate (HMDI),
1,4-diphenylmethane diisocyanate (MDI), toluene diiso-
cyanate (TDI), or p-phenylene diisocyanate (pPDI)] and
aliphatic isocyanates [1,6-hexane diisocyanate (HDI) or
isophorone diisocyanate (IPDI)] together with diamino-
terminated prepolymers, such as polyesters (polycaprolac-
tone), polyethers [poly(ethylene oxide), poly(propylene
oxide), or poly(tetramethylene oxide)], polycarbonates
(hexamethylene polycarbonate), and polydimethylsilox-
anes, which lead to aromatic polyureas that are sensitive to
light and atmospheric degradation and are also difficult to
be dissolved and processed.[29,33–34]
In this paper, the synthesis of a new kind of polyurea
elastomer by sol-gel chemistry is presented, where the
reactivity of the amino-terminated polymers is reduced by
the capping of the amines by reaction with ketones. This
process allows control of the gelation time from seconds
to minutes or hours. Upon drying the gel, an elastomeric
film of well-defined thickness is obtained by controlling
the concentrations of the polymer and crosslinker, the
volume of the reacting mixture and the area of the mold.
The post-drying formation of hydrogen bonds between
the urea motifs, as well as their effect on the elastomeric
systems, is analyzed in terms of chemical composition of
the studied samples. These systematic changes allow
the observation of the mechanical behavior of networks
with physical and chemical crosslinks as a function of
the segmental molecular weights and the nature of the
crosslinkers.
Macromol. Chem. Phys. 2010, 211, 1712–1721
� 2010 WILEY-VCH Verlag GmbH & Co. KGaA, Weinheim
Experimental Part
Materials
The three linear diamino-terminated polyetheramines AD-400, AD-
2000 and AD-4000 (Jeffamine1 D-400, Mn ¼400 Da; Jeffamine1
D-2000, Mn ¼ 2 000 Da; Jeffamine1 D-4000, Mn ¼ 4 000 Da), the
three star-like triamino-terminated polyetheramines AT-403,
AT-3000 and AT-5000 (Jeffamine1 T-403,Mn ¼440 Da; Jeffamine1
T-3000, Mn ¼3 000 Da; Jeffamine1 T-5000, Mn ¼5 000 Da) were
supplied by Huntsman International LLC. The triisocyanate cross-
linker BHI-100 (Basonat1 HI-100, Mn ¼ 505 Da) was provided by
BASF SE. All chemicals were used as received. Acetone and butan-2-
one (Aldrich) were used without further purification for the
crosslinking of the polyetheramines.
Characterization Techniques
1H NMR, 13C NMR, 1H-1H homocorrelation and 1H-13C hetero-
correlation experiments were carried out at room temperature on
a Bruker DPX-360 spectrometer operating at 360 and 90 MHz,
respectively, for each spin, and using CDCl3 or acetone-d6 as
solvents and as the internal standards.1H high-resolution magic-angle spinning (HR-MAS) NMR
measurements were carried out on the swollen samples at room
temperature – before and after thermal treatment at 200 8C for 24 h
in an oven – on a Bruker Avance DSX-500 spectrometer operating
at 500 MHz and using CDCl3 as solvent.
Differential scanning calorimetry (DSC) experiments were
carried out on a Netzsch DSC 200F3 Maia apparatus with heating-
and cooling-rates of 5, 10 and 20 K �min�1 under nitrogen
atmosphere, using 20mL aluminum pans with holes. The first
heating run was use to remove all effects due to thermal history of
the sample and only second, third and fourth heating and cooling
runs were used at different rates on the same piece of sample.
Fourier-transform infrared (FTIR) spectra of solid samples were
recorded at room temperature with a Bruker Tensor 27 FTIR
spectrometer and using a MKII golden gate single attenuated total
reflection (ATR) system.
Thermal gravimetric analysis (TGA) experiments were per-
formed using a TGA/SDTA851e apparatus from Mettler Toledo
equipped with an autosampler TS0801R0, and 70mL aluminum
oxide crucibles. Measurements were performed at a temperature
rate of 5 K �min�1 from 25 up to 600 8C with an air flow of
300 mL �min�1.
Swelling experiments were performed in pure acetone, water
and mixtures of acetone/water at 25 8C for 24 h, to obtain
information on the effective crosslinking density as compared to
other elastomers. The sizes of the dry and swollen elastomer sample
were determined using a Will Strubin-Wetzlar optical microscope,
and their respective weight by using a Mettler Toledo AT250
analytical balance. The volumetric swelling parameter (Qx¼a3x) is
the ratio of the volume of the swollen to dry elastomer, where ax is
the volumetric linear swelling parameter. The mass-uptaking
swelling parameter (Qm¼a3m) is the ratio of the mass of the swollen
to dry elastomer, where am is the mass-uptaking linear swelling
parameter.
Stress/strain measurements were performed with a self-
constructed apparatus. In a cell controlled by a Haake-F6
www.mcp-journal.de 1713

A. Sanchez-Ferrer, D. Rogez, P. Martinoty
1714
thermostat and equipped with a Pt100 thermoresistor, the sample
was stretched by one Owis SM400 microstep motor and controlled
by an Owis SMK01 microstep controller. The stress was measured
by a HBM PW4FC3 transducer load cell (300 g) and analyzed by an
HBM KW3073 high-performance strain gage indicator. All relevant
data such as temperature, uniaxial strain ratio (l¼ L/L0, where L
and L0 are the lengths of the film in the stretched and unstretched
states) and uniaxial stress (s) were continuously logged. A personal
computer controlled the deformation stepwise as specified by a
script file. After each deformation step, the uniaxial stress was
recorded at equilibrium (determined by the slope and the standard
deviation of the continuously logged data).
Simultaneous small- and wide-angle X-ray scattering (SAXS
and WAXS) experiments were performed using a Philips PW 1730
rotating anode (4 kW) in order to obtain direct information on the
SAXS and WAXS reflections. Cu Ka radiation (l¼1.5418 A) filtered
by a graphite monochromator and collimated by a 0.8 mm
collimator was used. The incident beam was normal to the surface
of the film. The scattered X-ray intensity was detected by a
Schneider image plate system (700� 700 pixels, 250mm resolu-
tion). Samples were placed in a self-constructed holder where
temperature was controlled by a Haake-F3 thermostat. An effective
scattering-vector range of 0.2 nm�1< q<30 nm�1 is obtained,
where q is the scattering wave-vector defined as q¼ 4p sin(u)/l,
with a scattering angle of 2u.
Preparation of Gels and Films
The capping process of the amines was done following the same
procedure as the preparation of gels and films but using acetone-d6,
and registering the 1H NMR spectra every 0.5 h, when the full
capping of the amines was observed after 1.5 h of mixing.
The typical procedure to obtain networks with 15% (w/v) of solid
content is described next, giving as an example the synthesis of the
elastomer ED-2000. In two separate 30 mL flasks, the polyether-
amine (3.850 g in 8.78 g of acetone) and the crosslinker (0.651 g in
11.41 g of acetone) were dissolved. After 2 h with occasional
shaking of the solutions, the contents of the two flasks were mixed
Scheme 1. Chemical representation of the capping process of amines whydrogen bonding between urea (bidentate) and urethane (monode
Macromol. Chem. Phys. 2010, 211, 1712–1721
� 2010 WILEY-VCH Verlag GmbH & Co. KGaA, Weinheim
and ready to put in a glass capsule. The cast sample was ambient
dried after 24 h of reaction at room temperature to make sure a good
crosslinking process took place.
Results and Discussion
Synthesis of Polyetherurea Elastomers
As mentioned in the introduction, amines are much more
reactive than alcohols in the presence of isocyanates, and
the aim of this work was to achieve a slowed reactivity of
the amino groups by capping them, with the ultimate
purpose of obtaining pure polyurea elastomers by the sol/
gel chemistry procedure. It is well known that amines can
condensate with ketones and aldehydes to form imines –
ketimines or aldimines (Scheme 1). Since aldehydes are
quite toxic and difficult to handle, acetone and butan-2-one
were chosen to carry out the capping process for their
availability, low toxicity and easy evaporation. Solutions of
the polyetheramines in acetone (alternatively, also butan-
2-one) reduced drastically the reactivity of the amino
polymers when reacting with isocyanates.1H NMR and 13C NMR spectra were measured on the
solution of these amino compounds in a non-capping
solvent (CDCl3), and in a ketone (acetone-d6). The results are
shown in Figure 1. The formation of the imine can be
monitored from the 1H NMR spectrum, as well as from the
corresponding 13C NMR spectrum. The chemical shift of
the two methyl groups neighboring both terminal amines
in CDCl3 is d(CH3CHNH2)¼ 0.97 (d, J¼ 6.2 Hz), while in
acetone-d6 it is d(CH3CHNH2)¼ 0.95 (d, J¼ 6.4 Hz). After the
formation of the imine, these two methyl groups have a
chemical shift of d(CH3CHNH2)¼ 0.99 (d, J¼ 6.3 Hz). The two
protons neighboring the methyl group and in thea-position
to the amine have a chemical shift in CDCl3 of
d(CH3CHNH2)¼ 2.96–3.08 (m), but in acetone-d6 this is
ith ketones or aldehydes, formation of urea or urethane linkage, andntate) motifs.
DOI: 10.1002/macp.201000117

Synthesis and Characterization of New Polyurea Elastomers by Sol/Gel . . .
Figure 1. 1H and 13C NMR spectra of the amine AD-2000 in CDCl3 and acetone-d6 (5 and 120 min after solution preparation).
d(CH3CHNH2)¼ 2.90–3.05 (m). The same protons following
imine formation have a new chemical shift of
d(CH3CHN¼C)¼ 3.56–3.66 (m). One interesting sign of
the formation of the imines is the appearance of two
multiplets (almost quintuplets) in acetone-d6 at d¼ 1.75–
1.84 and 1.84–1.93 that correspond to one proton in cis or
transposition to the condensed acetone with the amine. All
these results were confirmed by 1H-1H homocorrelation
and 1H-13C heterocorrelation experiments. The two carbon
atoms in the a-position to the nitrogen show a clearly
different chemical shift in CDCl3 of d(CHNH2)¼ 46.3 and
46.8, with respect to in acetone-d6: d(CHNH2)¼ 48.4 and
48.7. The formation of the imine compound is detected by
the presence in acetone-d6 of two peaks at d(CHN¼C)¼ 57.0
and 57.1. To conclude, the carbon corresponding to the
condensed acetone to the amine appears as a broad peak at
d(C2D6 C¼N)¼ 166.0 (see the Supporting Information).
After the optimization of the capping process of the
amines in acetone, a final 15% (w/v) of solid content was
chosen to prevent both precipitation among higher
concentrations and incomplete crosslinking in more dilute
systems. Commonly, amines (�NH2) react in the presence
of isocyanates (�NCO) resulting in the formation of a urea
linkage, in the same manner that alcohols (�OH) form a
urethane linkage (Scheme 1). Thus, since polymers with
amino-terminated functionalities are present and the final
repeating unit is a urea, the term polyurea then applies, as
polyurethane applies in the case of hydroxyl-terminated
polymers.
For the polyetherdiamines AD-400, AD-2000 and AD-
4000, the corresponding polyurea elastomers ED-400,
ED-2000 and ED-4000 contain only crosslinking points that
come from the triisocyanate crosslinker. Similarly, the
polyethertriamines AT-403, AT-3000 and AT-5000 led to
the corresponding polyurea elastomers ET-403, ET-3000
and ET-5000 with two different crosslinkings: one from the
triisocyanate and the other already present glycerol unit in
the polyethertriamines (Scheme 2).
Macromol. Chem. Phys. 2010, 211, 1712–1721
� 2010 WILEY-VCH Verlag GmbH & Co. KGaA, Weinheim
Hydrogen Bonding in Polyetherurea Elastomers
It was expected that the polyureas would be mechanically
stronger than the corresponding polyurethanes. The main
reason is the presence of higher number of hydrogen bonds
between the urea motifs and the localization of up to two
per carbonyl group between two urea units (Scheme 1).
Polyurethanes have fewer chances to build hydrogen bonds
and they are not well-localized, and allow more freedom
during the linkage of the carbamates.[35]
As mentioned above, in polyurea elastomers intermole-
cular hydrogen bonds are formed between the active
hydrogen atoms of one urea donor group (�NH�) and the
acceptor carbonyl group from another urea motif (�CO�).
The formation of hydrogen bonds with other carbonyl-type
groups like esters, amides and carbamates, and rarely with
alcohols or ethers, is also possible. Infrared investigations of
N�H stretching-related adsorptions showed that more
than 90% of the �NH� from urea or from urethane forms
hydrogen bonds, representing a larger content than other
functionalities.[18] Other studies showed that the formation
of hydrogen bonds depends on the size of the segments at
both sides of the urea linkage.[17] In polymers with high
urea concentration, hydrogen bonds between �NH� and
�CO� groups are more frequent. When the urea concen-
tration is reduced, connections between �NH� and �CO�groups become less effective.
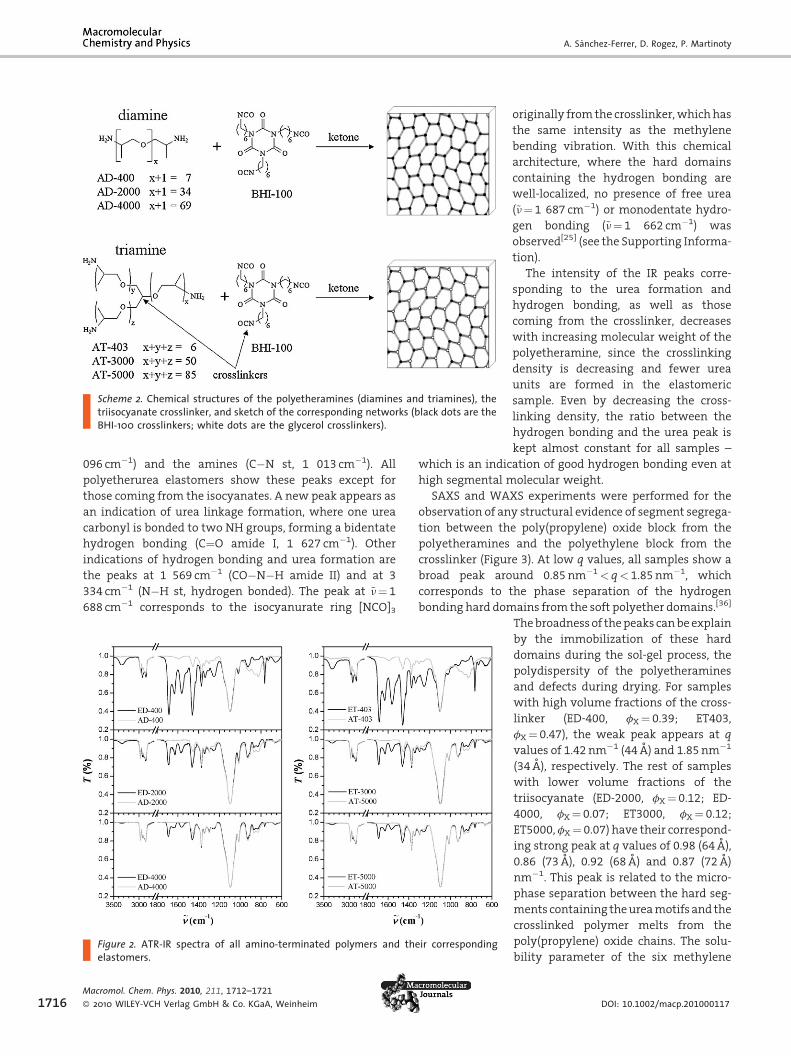
IR spectroscopic analyses of all the initial polyether-
amines and their corresponding elastomers were per-
formed in order to establish possible differences and predict
the mechanical properties of the networks (Figure 2). The
isocyanate crosslinker has some specific adsorption bands
that correspond to the methylene groups (CH2 g 767 cm�1;
CH2 d, 1 456 cm�1), the isocyanates (N¼C¼O st sym, 1 374–1
336 cm�1; N¼C¼O st as, 2 258 cm�1), and the isocyanurate
ring ([NCO]3, 1 679 cm�1). The polyetheramines have some
specific adsorption bands from the ether groups
(CH�O�CH2 st sym, 926 cm�1; CH�O�CH2 st as, 1
www.mcp-journal.de 1715
A. Sanchez-Ferrer, D. Rogez, P. Martinoty
Scheme 2. Chemical structures of the polyetheramines (diamines and triamines), thetriisocyanate crosslinker, and sketch of the corresponding networks (black dots are theBHI-100 crosslinkers; white dots are the glycerol crosslinkers).
1716
096 cm�1) and the amines (C�N st, 1 013 cm�1). All
polyetherurea elastomers show these peaks except for
those coming from the isocyanates. A new peak appears as
an indication of urea linkage formation, where one urea
carbonyl is bonded to two NH groups, forming a bidentate
hydrogen bonding (C¼O amide I, 1 627 cm�1). Other
indications of hydrogen bonding and urea formation are
the peaks at 1 569 cm�1 (CO�N�H amide II) and at 3
334 cm�1 (N�H st, hydrogen bonded). The peak at ~n¼ 1
688 cm�1 corresponds to the isocyanurate ring [NCO]3
Figure 2. ATR-IR spectra of all amino-terminated polymers and their correspondingelastomers.
Macromol. Chem. Phys. 2010, 211, 1712–1721
� 2010 WILEY-VCH Verlag GmbH & Co. KGaA, Weinheim
originally from the crosslinker, which has
the same intensity as the methylene
bending vibration. With this chemical
architecture, where the hard domains
containing the hydrogen bonding are
well-localized, no presence of free urea
(~n¼ 1 687 cm�1) or monodentate hydro-
gen bonding (~n¼ 1 662 cm�1) was
observed[25] (see the Supporting Informa-
tion).
The intensity of the IR peaks corre-
sponding to the urea formation and
hydrogen bonding, as well as those
coming from the crosslinker, decreases
with increasing molecular weight of the
polyetheramine, since the crosslinking
density is decreasing and fewer urea
units are formed in the elastomeric
sample. Even by decreasing the cross-
linking density, the ratio between the
hydrogen bonding and the urea peak is
kept almost constant for all samples –
which is an indication of good hydrogen bonding even at
high segmental molecular weight.
SAXS and WAXS experiments were performed for the
observation of any structural evidence of segment segrega-
tion between the poly(propylene) oxide block from the
polyetheramines and the polyethylene block from the
crosslinker (Figure 3). At low q values, all samples show a
broad peak around 0.85 nm�1 < q< 1.85 nm�1, which
corresponds to the phase separation of the hydrogen
bonding hard domains from the soft polyether domains.[36]
The broadness of the peaks can be explain
by the immobilization of these hard
domains during the sol-gel process, the
polydispersity of the polyetheramines
and defects during drying. For samples
with high volume fractions of the cross-
linker (ED-400, fX¼ 0.39; ET403,
fX ¼ 0.47), the weak peak appears at q
values of 1.42 nm�1 (44 A) and 1.85 nm�1
(34 A), respectively. The rest of samples
with lower volume fractions of the
triisocyanate (ED-2000, fX ¼ 0.12; ED-
4000, fX ¼ 0.07; ET3000, fX ¼ 0.12;
ET5000, fX ¼ 0.07) have their correspond-
ing strong peak at q values of 0.98 (64 A),
0.86 (73 A), 0.92 (68 A) and 0.87 (72 A)
nm�1. This peak is related to the micro-
phase separation between the hard seg-
ments containing the urea motifs and the
crosslinked polymer melts from the
poly(propylene) oxide chains. The solu-
bility parameter of the six methylene
DOI: 10.1002/macp.201000117

Synthesis and Characterization of New Polyurea Elastomers by Sol/Gel . . .
1 10
q (nm-1)
Inte
nsity
(a.u
.)
T = 25 ºC
ED-4000
ED-2000
ED-400
T = 90 ºC
T = 90 ºC
T = 25 ºC
T = 90 ºC
T = 25 ºC
011
q (nm-1)
Inte
nsity
(a.u
.)T = 90 ºC
T = 25 ºC
T = 90 ºC
T = 25 ºCET-5000
ET-3000
ET-403
T = 90 ºC
T = 25 ºC
Figure 3. SAXS and WAXS curves of all elastomers at 25 8C (filled symbols) and 90 8C(empty symbols).
carbons from the crosslinker (d¼ 16.2 MPa1/2) is not that
different from the corresponding solubility parameter of
the poly(propylene oxide) chains (d¼ 17.2 MPa1/2),[37]
which are soluble in acetone (d¼ 19.7 MPa1/2). However,
as soon as the urea linkage is formed the solubility of the
hard segment becomes too different to keep both segments
together (d¼ 45.6 MPa1/2).[38–40] This might explain why all
samples – even those having different volume fractions of
the crosslinker – do show the same scattering pattern due to
the localization of the hard segments in the crosslinking
points. In Table 1, the comparison between the calculated
full stretched segmental length (lc) and the persistence
length from the broad scattering peak calculated by SAXS
(d) is presented, where one can observe that the latter are
Table 1. Number-average molecular weight (Mn) of the polyetheramines; segmental degreweight (Mc), segmental length (lc), persistence length (d), volume fraction of the crosslinkerall polyetherurea elastomers.
Sample Mn DPc Mc lc d
g �mol�1 g �mol�1 A A
ED-400 428 13 691 52 44
ED-2000 1 991 40 2 259 149 64
ED-4000 4 024 75 4 292 274 73
ET-403 480 5 258 20 34
ET-3000 3 007 20 1 110 74 68
ET-5000 5 040 31 1 788 114 72
Macromol. Chem. Phys. 2010, 211, 1712–1721
� 2010 WILEY-VCH Verlag GmbH & Co. KGaA, Weinheim
below the simulated value (lc) expected in
an isotropic polymer network.
At high q values, two different dis-
tributions are observed; the first one, at
q¼ 7.7 to 10.1 nm�1 (8.1 or 6.3 A), is
related to the chain distance when two
methyl groups from different propylene
units see each other; the second one, at
q¼ 14.0 nm�1 (4.5 A), is the chain dis-
tance when no methyl steric hindrance is
present and the polymer backbones
interact with each other in the molten
state. Surprisingly, for the highly cross-
linked samples the first peak is shifted
more to lowerqvalues with respect to the
rest of the samples or the polymers
themselves. The explanation lays in the
fact that the short number of repeating
units in the segments between cross-
linking points, DPc (Table 1), forces the
interaction between methyl groups
located close in space, and a big steric
effect appears and shifts the distance to
higher values.
In order to check whether these net-
works have hydrogen bonding, X-ray experiments were
also performed at higher temperature. In Figure 3, the
experiments at 25 at 90 8C are shown, – a shift to higher q
values and a decrease in the intensity of the peaks at low q
values (SAXS) is observed, with changes in the relative
intensity up to 80% of the initial value. This effect is
reversible, and after cooling the samples the intensity of the
peak increases as a sign of the restored hydrogen bonds.
Thermal Properties of Polyetherurea Elastomers
Aliphatic polyurea systems have a low glass transition
temperature,Tg, lower than the aromatic polyurea systems,
e of polymerization (DPc), segmental molecular(fX), crosslinking density (CD), and density (r) of
fX CD r
v/v mol-% g �mL�1
0.39 8.7 1.05
0.12 1.9 1.01
0.07 1.0 1.01
0.47 25.0 1.07
0.12 3.8 1.02
0.07 2.3 1.01
www.mcp-journal.de 1717
A. Sanchez-Ferrer, D. Rogez, P. Martinoty
100 200 300 400 5000.0
0.1
0.2
0.3
0.4
0.5
0.6
0.7
0.8
0.9
1.0
50 100 150 2000.97
0.98
0.99
1.00
ED-400ED-2000
ED-4000 ET-403 ET-3000ET-5000
m/m
25
T (°C)
ED-2000
m/m
25
T (°C)
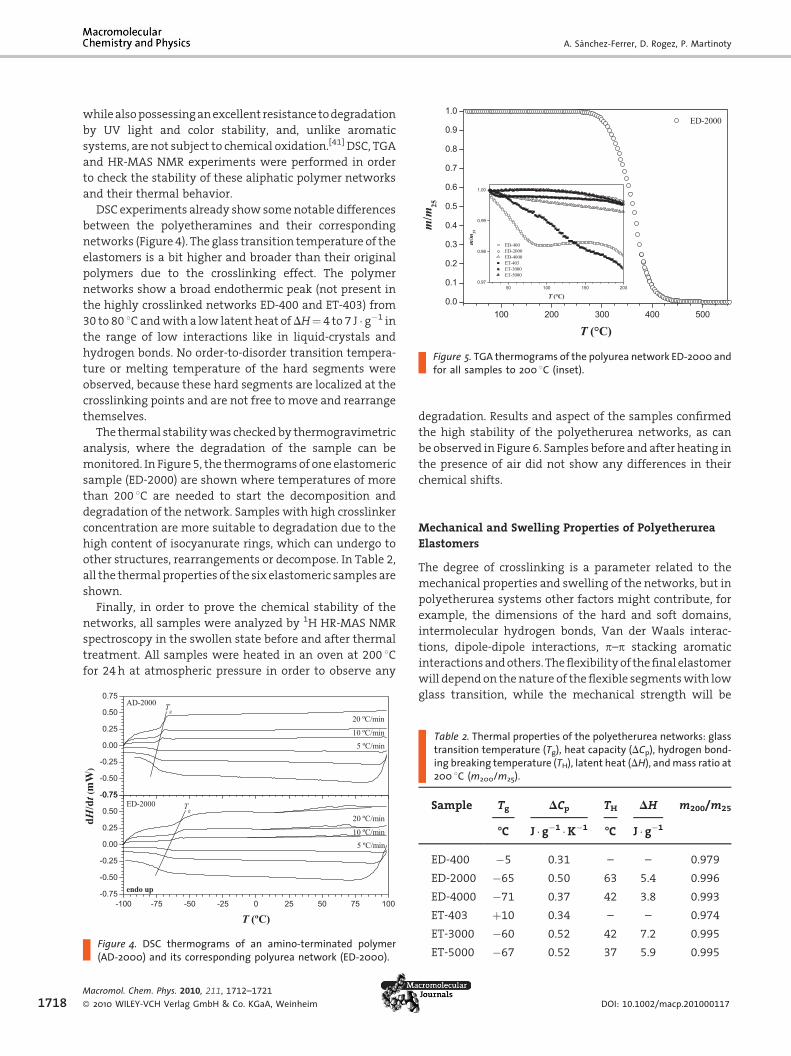
Figure 5. TGA thermograms of the polyurea network ED-2000 andfor all samples to 200 8C (inset).
1718
while also possessing an excellent resistance to degradation
by UV light and color stability, and, unlike aromatic
systems, are not subject to chemical oxidation.[41] DSC, TGA
and HR-MAS NMR experiments were performed in order
to check the stability of these aliphatic polymer networks
and their thermal behavior.
DSC experiments already show some notable differences
between the polyetheramines and their corresponding
networks (Figure 4). The glass transition temperature of the
elastomers is a bit higher and broader than their original
polymers due to the crosslinking effect. The polymer
networks show a broad endothermic peak (not present in
the highly crosslinked networks ED-400 and ET-403) from
30 to 80 8C and with a low latent heat ofDH¼ 4 to 7 J � g�1 in
the range of low interactions like in liquid-crystals and
hydrogen bonds. No order-to-disorder transition tempera-
ture or melting temperature of the hard segments were
observed, because these hard segments are localized at the
crosslinking points and are not free to move and rearrange
themselves.
The thermal stability was checked by thermogravimetric
analysis, where the degradation of the sample can be
monitored. In Figure 5, the thermograms of one elastomeric
sample (ED-2000) are shown where temperatures of more
than 200 8C are needed to start the decomposition and
degradation of the network. Samples with high crosslinker
concentration are more suitable to degradation due to the
high content of isocyanurate rings, which can undergo to
other structures, rearrangements or decompose. In Table 2,
all the thermal properties of the six elastomeric samples are
shown.
Finally, in order to prove the chemical stability of the
networks, all samples were analyzed by 1H HR-MAS NMR
spectroscopy in the swollen state before and after thermal
treatment. All samples were heated in an oven at 200 8Cfor 24 h at atmospheric pressure in order to observe any
1007550250-25-50-75-100-0.75
-0.50
-0.25
0.00
0.25
0.50
0.75
dH/d
t(m
W)
T (ºC)
-0.75
-0.50
-0.25
0.00
0.25
0.50
0.75
endo up
ED-2000
5 ºC/min10 ºC/min
Tg
Tg20 ºC/min
AD-2000
5 ºC/min10 ºC/min
20 ºC/min
Figure 4. DSC thermograms of an amino-terminated polymer(AD-2000) and its corresponding polyurea network (ED-2000).
Macromol. Chem. Phys. 2010, 211, 1712–1721
� 2010 WILEY-VCH Verlag GmbH & Co. KGaA, Weinheim
degradation. Results and aspect of the samples confirmed
the high stability of the polyetherurea networks, as can
be observed in Figure 6. Samples before and after heating in
the presence of air did not show any differences in their
chemical shifts.
Mechanical and Swelling Properties of PolyetherureaElastomers
The degree of crosslinking is a parameter related to the
mechanical properties and swelling of the networks, but in
polyetherurea systems other factors might contribute, for
example, the dimensions of the hard and soft domains,
intermolecular hydrogen bonds, Van der Waals interac-
tions, dipole-dipole interactions, p–p stacking aromatic
interactions and others. The flexibility of the final elastomer
will depend on the nature of the flexible segments with low
glass transition, while the mechanical strength will be
Table 2. Thermal properties of the polyetherurea networks: glasstransition temperature (Tg), heat capacity (DCp), hydrogen bond-ing breaking temperature (TH), latent heat (DH), and mass ratio at200 8C (m200/m25).
Sample Tg DCp TH DH m200/m25
-C J � g�1 �K�1 -C J � g�1
ED-400 �5 0.31 – – 0.979
ED-2000 �65 0.50 63 5.4 0.996
ED-4000 �71 0.37 42 3.8 0.993
ET-403 þ10 0.34 – – 0.974
ET-3000 �60 0.52 42 7.2 0.995
ET-5000 �67 0.52 37 5.9 0.995
DOI: 10.1002/macp.201000117

Synthesis and Characterization of New Polyurea Elastomers by Sol/Gel . . .
1234
Inte
nsity
(a.u
.)
δ (ppm)
AD-2000
BHI-100
ED-2000 (25 ºC)
ED-2000 (200 ºC)
Figure 6. 1H NMR (HR-MAS) spectra of the amino-terminatedpolymer (AD-2000), the crosslinker (BHI-100) and the correspond-ing elastomer (ED-2000) at 25 8C and after 24 h at 200 8C.
given by the hard segments with high melting points
(for thermoplastic block copolymers)[42] or the number of
crosslinking points (for polymer networks).
One important parameter to be measured before any
swelling or mechanical experiments is the analysis of the
soluble content (sc) of the network. This quantity is related
to small fragments that were not attached to the polymer
matrix. The values obtained for the soluble content are
listed in Table 3, where values below 10% indicate
well-defined networks through crosslinking.
The swelling process is the result of the equilibrium
between the two forces involved between the solvent
molecules solvating the polymer chains of the network
(mixing) and the retractive elastic force of those chains
tending to keep their original conformation (elasticity).
Thus, samples that show higher degrees of crosslinking
should present lower degrees of swelling, and vice versa.
In Table 3, the linear swelling parameter (ax¼ x/x0,
where x and x0 are the dimensions of the elastomer after
Table 3. Swelling parameters (ax and am), crosslinking density(CD) soluble content (sc), segmental molecular weights (Mc), andYoung’s modulus (E).
Sample ax am CD sc Mc E
mol-% wt.-% g �mol�1 MPa
ED-400 1.19 1.22 8.7 2.4 691 5.0
ED-2000 1.87 1.94 1.9 5.8 2 259 0.8
ED-4000 2.00 2.11 1.0 6.3 4 292 0.2
ET-403 1.08 1.17 25.0 4.1 258 10.5
ET-3000 1.69 1.71 3.8 2.2 1 110 2.3
ET-5000 1.80 1.86 2.3 6.1 1 788 2.0
Macromol. Chem. Phys. 2010, 211, 1712–1721
� 2010 WILEY-VCH Verlag GmbH & Co. KGaA, Weinheim
and before swelling) and the mass-uptaking linear swelling
parameter (am¼m1=3s =m
1=3e � r1=3
e =r1=3s , where ms and rs are
the mass-uptaking and density of the solvent, andme andre
the mass and density of the elastomer) are shown for all
elastomers when swollen in acetone at 25 8C. For better
visualization, in Figure 7a, the linear mass-uptaking
swelling parameter (am) is plotted as a function of the
linear swelling parameter (ax), and the resulting fitted curve
shows good agreement with both techniques when
evaluating the swelling behavior of all networks. Thus,
samples with higher degree of crosslinking or shorter
segmental molecular weight (ET-403) swell less than those
with lower crosslinker content or longer segmental
molecular weight (ED-4000).
The estimation of the Flory-Huggins parameter (x) for
poly(propylene oxide), polyethylene, and polyurea when
mixed with acetone by using their Hildebrand solubility
parameters (d) gave values of xPPO¼ 0.266, xPE ¼ 0.237 and
xpolyurea ¼ 1.106, showing that the first two polymers are
mixable with acetone but not the polyurea. By using the
relation ax¼ [Mc (0.5 – x)/RT]1/5 (from Flory’s swelling
theory;[43–44] where ax is the linear swelling parameter and
Mc is the segmental molecular weight) (Table 3), the Flory-
Huggins parameter for the obtained elastomers is esti-
mated as x¼ 0.323. This value is a bit higher than the
corresponding parameter of poly(propylene oxide), with
the difference being due to the presence of urea motifs in
the network.
The swelling of the networks strongly depends on the
nature of the solvent.[45–46] Thus, for a good solvent the
network will swell to a certain limit depending on the
equilibrium of forces, but for a bad solvent no swelling
is expected. Acetone was chosen as a good solvent
(d¼ 19.7 MPa1/2) and water as a bad one (d¼ 48.0 MPa1/2)
for the poly(propylene oxide) chains (d¼ 17.2 MPa1/2).
Mixtures of both solvents at different proportions were
used in order to observe the degree of swelling at different
solubilities. By decreasing the volume fraction of the good
solvent all networks should swell less but still inversely
proportional to the degree of crosslinking. In Figure 7b, the
degree of swelling as function of the volume fraction of
acetone is shown, where mixtures with less than 25%
acetone no longer swell. These elastomers are useful as
sealants against water.
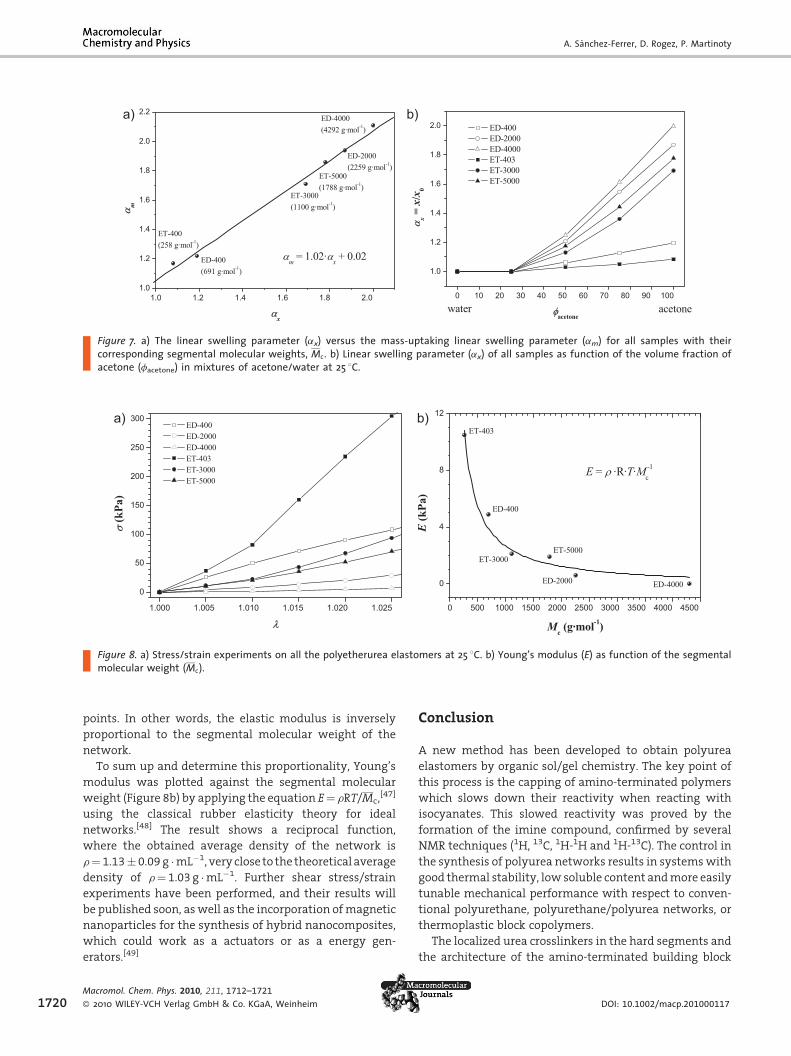
Finally, the mechanical behavior of all elastomers was
determined and correlated to the segmental molecular
weight (Mc) by performing stress/strain experiments.
In the elastic region – for small deformations – the linear
behavior between the true stress and the applied strain
allows the calculation of Young’s modulus (E). In Figure 8,
the stress/strain curves are plotted. The data corresponds
to the elastic moduli collected in Table 3. Young’s modulus
increases with increasing crosslinking density or decreas-
ing number of repeating units between crosslinking
www.mcp-journal.de 1719
A. Sanchez-Ferrer, D. Rogez, P. Martinoty
2.01.81.61.41.21.01.0
1.2
1.4
1.6
1.8
2.0
2.2ED-4000(4292 g·mol-1)
ED-2000(2259 g·mol-1)
ET-5000(1788 g·mol-1)
ET-3000(1100 g·mol-1)
ED-400(691 g·mol-1)
α m
αx
ET-400(258 g·mol-1)
αm = 1.02·αx + 0.02
1009080706050403020100
1.0
1.2
1.4
1.6
1.8
2.0 ED-400ED-2000 ED-4000 ET-403 ET-3000ET-5000
α x = x
/x0
φacetonewater acetone
a) b)
Figure 7. a) The linear swelling parameter (ax) versus the mass-uptaking linear swelling parameter (am) for all samples with theircorresponding segmental molecular weights, Mc. b) Linear swelling parameter (ax) of all samples as function of the volume fraction ofacetone (facetone) in mixtures of acetone/water at 25 8C.
1.0251.0201.0151.0101.0051.000
0
50
100
150
200
250
300
σ (k
Pa)
λ
ED-400 ED-2000 ED-4000 ET-403 ET-3000 ET-5000
450040003500300025002000150010005000
0
4
8
12
ET-5000ET-3000
ED-4000ED-2000
ET-403
Mc (g·mol-1)
E (k
Pa)
ED-400
E = ρ ·R·T·M -1c
b)a)
Figure 8. a) Stress/strain experiments on all the polyetherurea elastomers at 25 8C. b) Young’s modulus (E) as function of the segmentalmolecular weight (Mc).
1720
points. In other words, the elastic modulus is inversely
proportional to the segmental molecular weight of the
network.
To sum up and determine this proportionality, Young’s
modulus was plotted against the segmental molecular
weight (Figure 8b) by applying the equation E¼ rRT/Mc,[47]
using the classical rubber elasticity theory for ideal
networks.[48] The result shows a reciprocal function,
where the obtained average density of the network is
r¼ 1.13� 0.09 g �mL�1, very close to the theoretical average
density of r¼ 1.03 g �mL�1. Further shear stress/strain
experiments have been performed, and their results will
be published soon, as well as the incorporation of magnetic
nanoparticles for the synthesis of hybrid nanocomposites,
which could work as a actuators or as a energy gen-
erators.[49]
Macromol. Chem. Phys. 2010, 211, 1712–1721
� 2010 WILEY-VCH Verlag GmbH & Co. KGaA, Weinheim
Conclusion
A new method has been developed to obtain polyurea
elastomers by organic sol/gel chemistry. The key point of
this process is the capping of amino-terminated polymers
which slows down their reactivity when reacting with
isocyanates. This slowed reactivity was proved by the
formation of the imine compound, confirmed by several
NMR techniques (1H, 13C, 1H-1H and 1H-13C). The control in
the synthesis of polyurea networks results in systems with
good thermal stability, low soluble content and more easily
tunable mechanical performance with respect to conven-
tional polyurethane, polyurethane/polyurea networks, or
thermoplastic block copolymers.
The localized urea crosslinkers in the hard segments and
the architecture of the amino-terminated building block
DOI: 10.1002/macp.201000117

Synthesis and Characterization of New Polyurea Elastomers by Sol/Gel . . .
play an important role in the elastomeric behavior, where
physical (hydrogen bonding) and chemical (urea linkage)
networks work together in one system. Only bidentate
hydrogen bonding has been found by ATR-IR spectroscopy.
The micro-phase separated domains were confirmed by
SAXS, where embedded hard domains in a soft polymer
matrix are present. The aliphatic polyurea networks show a
good resistance to degradation and high transparency
stability due to the absence of aromatic moieties. This
stability was analyzed and confirmed by DSC, TGA and
HR-MAS NMR experiments, showing a large operational
temperature window from �60 up to þ200 8C or more.
Finally, stress/strain and swelling experiments demon-
strated the correlation between the crosslinking density
and the mechanical properties of the samples, showing
that lower swelling ratios and higher Young’s moduli are
observed with high crosslinked samples (low segmental
molecular weight), and vice versa.
Acknowledgements: We are grateful to Prof. Heino Finkelmann(Institute for Macromolecular Chemistry, Freiburg, Germany) forallowing some measurements in his research group, Dr. LauraRamon-Gimenez and Dr. Patrick Heinze (Institute for Macromo-lecular Chemistry, Freiburg, Germany) for their support and helpduring some experiments, and Huntsman International LLC andBASF SE for kindly providing all the chemicals.
Received: March 4, 2010; Revised: April 6, 2010; Published online:June 30, 2010; DOI: 10.1002/macp.201000117
Keywords: crosslinking; elastomers; gels; polyurea; sol-gel
[1] D. M. Berger, D. .J Primeaux, II, ‘‘Thick-Film Elastomeric Poly-urethanes and Polyureas’’, in: The Inspection of Coatings andLinings, 2nd edition, The Society for Protective Coatings,Pittsburgh 2003, Chapter 5.3.
[2] W. D. Vilar, Chemistry and Technology of Polyurethanes, 2nd
edition, Vilar Polyurethanes, Rio de Janeiro 2002.[3] R. Hill, E. E. Walker, J. Polym. Sci. 1948, 3, 609.[4] I. A. Mahammad, V. Mahadevan, M. Srinivasan, Eur. Polym. J.
1989, 25, 427.[5] X. T. Tao, T. Watanabe, D. C. Zou, S. Shimoda, H. Sato, S. Miyata,
Macromolecules 1995, 28, 2637.[6] J. L. Stanford, R. H. Still, A. N. Wilkinson, Polym. Int. 1996, 41,
283.[7] S. Wataru, C. Koki, T. Naoto, J. Polym. Sci., Part B: Polym. Phys.
2001, 39, 247.[8] I. Yilgor, E. Yilgor, S. Das, G. L. Wilkes, J. Polym. Sci., Part B:
Polym. Phys. 2009, 47, 471.[9] S. K. Jewrajka, J. Kang, G. Erdodi, J. P. Kennedy, E. Yilgor,
I. Yilgor, J. Polym. Sci., Part A: Polym. Chem. 2009, 47, 2787.[10] S. Das, I. Yilgor, E. Yilgor, G. L. Wilkes, Polymer 2008, 49, 174.
Macromol. Chem. Phys. 2010, 211, 1712–1721
� 2010 WILEY-VCH Verlag GmbH & Co. KGaA, Weinheim
[11] S. Braley, J. Macromol. Sci.: Chem. 1970, A4, 529.[12] P. K. Weathersby, T. Kolobow, E. W. Stool, J. Biomed. Mater.
Res. 1975, 9, 561.[13] J. H. Boretos, W. S. Pierce, Science 1967, 158, 1481.[14] R. W. Hergenrother, X. H. Yut, S. L. Cooper, Biomaterials 1994,
15, 635.[15] L. Ning, W. De-Ning, Y. Sheng-Kangt, Polymer 1996, 37, 3577.[16] N. Samson, F. Mechin, J. P. Pascault, J. Appl. Polym. Sci. 1997,
65, 2265.[17] S. Das, I. Yilgor, E. Yilgor, B. Inci, O. Tezgel, F. L. Beyer, G. L.
Wilkes, Polymer 2007, 48, 290.[18] J. Mattia, P. Painter, Macromolecules 2007, 40, 1546.[19] X. L. Li, D. J. Chen, J. Appl. Polym. Sci. 2008, 109, 897.[20] J. A. Pathak, J. N. Twigg, K. E. Nugent, D. L. Ho, E. K. Lin, P. H.
Mott, C. G. Robertson, M. K. Vukmir, T. H. Epps, III, C. M.Roland, Macromolecules 2008, 41, 7543.
[21] J. B. Dai, H. C. Kuan, X. S. Du, S. C. Dai, J. Ma, Polym. Int. 2009,58, 838.
[22] S. K. Jewrajka, E. Yilgor, I. Yilgor, J. P. Kennedy, J. Polym. Sci.,Part A: Polym. Chem. 2009, 47, 38.
[23] D. Fragiadakis, R. Gamache, R. B. Bogoslovov, C. M. Roland,Polymer 2010, 51, 178.
[24] S. L. Cooper, A. V. Tobolsky, J. Appl. Polym. Sci. 1966, 10, 1837.[25] M. M. Coleman, M. Sobkowiak, G. J. Pehlert, P. C. Painter,
Macromol. Chem. Phys. 1997, 198, 117.[26] R. L. Rowton, J. Elastom. Plast. 1977, 9, 365.[27] M. Munstermann, T. Buchan, K. Von Diest, Kunstst. Plast. Eur.
2001, 91, 11.[28] K. Buecking, Eur. Coat. J. 1998, 10, 730.[29] W. R. Willkomm, Z. S. Chen, C. W. Macosko, D. A. Gobran, E. L.
Thomas, Polym. Eng. Sci. 1988, 28, 888.[30] J. L. Stanford, A. N. Wilkinson, D. K. Lee, A. J. Ryan, Plast.
Rubber Proc. Appl. 1990, 13, 111.[31] A. J. Ryan, J. L. Stanford, A. J. Birch, Polymer 1993, 34, 4874.[32] D. .J Primeaux, II, J. Prot. Coat. Linings 2001, 18, 26.[33] A. J. Ryan, J. L. Stanford, A. N. Wilkinson, Polym. Bull. 1987, 18,
517.[34] A. J. Ryan, Polymer 1990, 31, 707.[35] B. D. Kaushiva, S. R. McCartney, G. R. Rossmy, G. L. Wilkes,
Polymer 2000, 41, 285.[36] G. L. Wilkes, S. Abouzahr, Macromolecules 1981, 14, 458.[37] E. Morales, J. L. Acosta, Polym. J. 1996, 28, 127.[38] D. W. van Krevelen, Properties of Polymers, Elsevier, Amster-
dam 1992, Chapter 8.[39] A. F. M. Barton, Handbook of Polymer–Liquid Interaction
Parameters and Solubility Parameters, CRC Press, EnglewoodCliffs, 1990.
[40] A. M. F. Barton, Handbook of Solubility Parameters and OtherCohesiona Parameters, 2nd edition, CRC Press, New York 1991.
[41] D. .J Primeaux, II, J. Elastom. Plast. 1992, 24, 323.[42] M. Furukawa, T. Shiiba, Polymer 1999, 40, 1791.[43] B. Erman, B. M. Baysal, Macromolecules 1985, 18, 1696.[44] N. A. Neuburger, B. E. Eichunger, Macromolecules 1988, 21,
3060.[45] P. J. Flory, J. Chem. Phys. 1977, 66, 5720.[46] P. J. Flory, Principles of Polymer Chemistry, Cornell University
Press, New York 1983, Chapter XIII.[47] J. Schatzle, W. Kaufhold, H. Finkelmann, Makromol. Chem.
1989, 190, 3269.[48] R. A. Orwell, Rubber Chem. Technol. 1977, 50, 451.[49] A. Sanchez-Ferrer, M. Reufer, R. Mezzenga, P. Schurtenberger,
H. Dietsch, Nanotechnology 2010, 21, P 185603/1-7.
www.mcp-journal.de 1721
Top Related
Copyright © 2022 FDOKUMEN

