


Bahasa
Halaman
Hukum


S1
Supporting information
Efficient photocatalytic carbon monoxide production
from ammonia and carbon dioxide by the aid of artificial
photosynthesis
Zeai Huang,a Kentaro Teramura,a,b* Hiroyuki Asakura,a,b Saburo
Hosokawa,a,b Tsunehiro Tanakaa,b*
aDepartment of Molecular Engineering, Graduate School of Engineering, Kyoto
University, Kyoto 615-8510, Japan
bElements Strategy Initiative for Catalysts and Batteries, Kyoto University, Kyoto 615-
8510, Japan
Corresponding Author
*Dr. Kentaro Teramura. Tel: +81-75-383-2559, Fax: +81-75-383-2561, E-mail address: [email protected];*Professor Tsunehiro Tanaka. Tel: +81-75-383-2558, Fax: +81-75-383-2561, E-mail address: [email protected]
Electronic Supplementary Material (ESI) for Chemical Science.This journal is © The Royal Society of Chemistry 2017
S2
Experiment section
Catalysts preparation
Sr1.6K0.35Na1.45Ta5O15 was fabricated using a flux method. KCl (99.8%, Wako) and NaCl
(99.9%, Wako) in a molar ratio of 55:45 were used as flux. A stoichiometric mixture of
K2CO3 (99.5%, Wako), SrCO3 (99.9%, Wako), and Ta2O5 (99.9%, Kojundo) was ground
with flux in an Al2O3 mortar for 5 min. The total mass ratio of flux to precursors (K2CO3,
SrCO3, and Ta2O5) was fixed at 1.0. The mixture was transferred to a 50 mL Al2O3 crucible
and calcined at 1173 K for 3 h in air. After cooling to room temperature, the mixture was
washed three times with distilled water at 358 K, to remove any residual salts, then dried
in air at 353 K. Elemental analysis was conducted using ICP-OES (iCAP7400 Duo, Thermo
Fisher Scientific, Inc.) to determine the chemical formula of the catalyst;
Sr1.6K0.35Na1.45Ta5O15. Other photocatalysts were fabricated according to the reported
papers in our previous works.1-4 The Ag cocatalyst was deposited onto the fabricated
samples using a chemical reduction method. Specifically, an aqueous NaPH2O2 solution
(0.33 M) was added to a 50-mL suspension containing the photocatalyst (1.5 g) and
AgNO3 (0.1 M). After stirring at 358 K for 1.5 h, the suspension was filtered and the
catalyst was dried in air at room temperature before use.
Characterization
The structures and crystallinities of the samples were characterized by X-ray
diffraction (XRD) using a Rigaku Multiflex powder X-ray diffractometer. SEM images
were obtained using a field emission scanning electron microscope (FE-SEM, SU-8220,
Hitachi High-Technologies). The XPS measurement was acquired using an X-ray
photoelectron spectrometer (ESCA 3400, Shimadzu Corp.), and calibrated by the peak
that can be assigned to C 1s.

S3
Photocatalytic activity test
Photocatalytic conversions of CO2 by H2O were carried out in a flow system using an
inner-irradiation-type reaction vessel at room temperature and ambient pressure. The
photocatalyst (0.5 g) was dispersed in aqueous solution (1.0 L) with different additives,
and CO2 gas (99.999%) was bubbled into the solution at a flow rate of 30 mL min−1. The
suspension was irradiated using a 400 W high-pressure Hg lamp with a quartz filter
connected to a water cooling system. The gaseous products generated in the reaction
(such as H2, O2, N2, and CO) were analyzed by thermal conductivity detector-gas
chromatography (TCD-GC) using a GC-8A chromatograph (Shimadzu Corp.) equipped
with a Molecular Sieve 5A column using Ar as the carrier gas, and by flame ionization
detector-gas chromatography (FID-GC) with a methanizer and a ShinCarbon ST column
using N2 as the carrier gas. In the isotopic experiment, 12CO2 gas was replaced with
13CO2. The formation of 13CO and 12CO was analyzed using a quadrupole mass
spectrometer (BEL Japan, Inc., BEL Mass) combined with TCD-GC using Ar as the carrier
gas.
Calculation of selectivity toward CO evolution and consumed e−/h+
In a photocatalytic reaction, charge separation takes place inside a bulk of photocatalyst, in which electron and hole pairs are generated. Electrons and holes that are not deactivated by recombination move separately to the surface of the photocatalyst. As a result, reduction and oxidation occur at the surface electrons and holes, respectively. Reduction process
Two reduction reactions take place in our system: (1) reduction of CO2 into CO and (2) production of H2 for the photocatalytic conversion of CO2 by H2O. These are both 2-electrons reduction processes, as shown below. Reduction of CO2: CO2 + 2H+ + 2e− → CO + H2O (1) Production of H2: 2H+ + 2e− → H2 (2)

S4
In the photocatalytic conversion of CO2 by H2O, H2 can be produced from water splitting, which competes with the reduction of CO2. However, this H2 production is not a favorable reaction. Therefore, the fraction of electrons used for the reduction of CO2 should be considered. The selectivity of the generated electrons toward CO evolution can be calculated using Eq. 3. Selectivity (%) = 100 × 2RCO / (2RCO + 2RH2) (3)
where RCO and RH2 represent the formation rates of CO and H2, respectively. Oxidation process
Generally, O2 is generated when H2O functions as an electron donor, as in Eq. 4. Oxidation of H2O: 2H2O → O2 + 4H+ + 4e− (4)
The oxidation of H2O is a typical 4-electron oxidation process. We found that NH3 and/or NH4
+ functioned as electron donors in our system, as shown below. Oxidation of NH3: 2NH3 → N2 + 6H+ + 6e− (5) Oxidation of NH4
+: 2NH4+ → N2 + 8H+ + 6e− (6)
Six electrons are produced in the oxidation of either NH3 or NH4+ to N2. Thus, six
holes should be consumed. The formations of H2 and CO are both 2-electron reduction processes, as shown in Eqs. 1 and 2. Thus, the ratio of electrons consumed by holes can be calculated from the formation rates of each gas, as shown below. Consumed e−/h+ = (2RCO + 2RH2) / (4RO2 + 6RN2)
where RCO, RH2, RO2, and RN2 represent the formation rates of CO, H2, O2, and N2, respectively. The number of electrons generated by charge transfer is strictly equal to that of holes. When the photocatalytic reaction proceeds stoichiometrically, the ratio of electrons to holes will be equal to 1 (e−/h+ = 1).
Total processThe total chemical formulae in cases where only NH3 or NH4
+ acts as the electron donor (therefore, O2 is not evolved) are as follows: xCO2 + yNH3 → (y/2)N2 + (1.5y − x)H2 + xCO + xH2O (7) xCO2 + yNH4
+ → (y/2)N2 + (1.5y − x)H2 + xCO + xH2O + yH+ (8)For example, if no H2 is generated, 1 mol of N2, 3 mol of CO, and 3 mol of H2O will be generated from 2 mol of CO2 and 3 mol of NH3 or NH4
+. The ratio of H2 to CO (H2/CO) can be controlled by tuning the decomposition of NH3 or NH4
+ in the photocatalytic system, for instance, by changing the concentration of NH4HCO3.

S5
Figure S1 XRD pattern (A) and SEM image (B) of Sr1.6K0.35Na1.45Ta5O15 prepared using a
modified flux method and calcined at 1173 K for 3 h.

S6
2200
2000
1800
1600
1400
1200
1000
800
600
400
200
0
Am
ount
of e
volv
ed p
rodu
cts
/ µm
ol
543210
Photoirradiation time / h
(A) 2200
2000
1800
1600
1400
1200
1000
800
600
400
200
0 A
mou
nt o
f evo
lved
pro
duct
s / µ
mol
543210Photoirradiation time / h
(B)
2200
2000
1800
1600
1400
1200
1000
800
600
400
200
0
Am
ount
of e
volv
ed p
rodu
cts
/ µm
ol
543210Photoirradiation time / h
(C)
2200
2000
1800
1600
1400
1200
1000
800
600
400
200
0
Am
ount
of e
volv
ed p
rodu
cts
/ µm
ol
543210Photoirradiation time / h
(D)
Figure S2 Time courses of CO (circle), O2 (square), N2 (lozenge), and H2 (triangle) evolutions during the photocatalytic conversion of CO2 over Ag-modified Sr1.6K0.35Na1.45Ta5O15. (A) Without photocatalyst, (B) without photoirradiation, (C) without Ag cocatalyst, and (D) without CO2 flow.

S7
Int
ensi
ty (a
.u.)
109876543210 Retention time / min
(a)(b)(c)
(d)(e)(f)(g)(h)
Figure S3 HPLC chromatograms of reaction solutions after photoirradiation for (a) 0.5 h, (b) 1.0 h, (c) 2.0 h, (d) 3.0 h, (e) 4.0 h, and (f) 5.0 h over 1.0 wt.% Ag-modified Sr1.6K0.35Na1.45Ta5O15. (g) and (h) are 100 ppm NaNO3 and NaNO2, respectively.

S8
800
600
400
200
0
Rat
e of
evo
lved
pro
duct
s / µ
mol
h-1
543210Photoirradiation time / h
2.0
1.5
1.0
0.5
0.0
Elec
ron
bala
nce
(e- /
h+ )
Figure S4 Time course of CO (circle), N2 (lozenge), and H2 (triangle) evolutions and electron balance (e−/h+) (square) during the photocatalytic conversion of CO2 over 1.0 wt.% Ag-modified Sr1.6K0.35Na1.45Ta5O15.

S9
Inte
nsity
(a.u
.)
380 376 372 368 364 360Binding Energy / eV
(a)
(b)
Figure S5 X-ray photoelectron spectra of Ag3d before (a) and after (b) the photocatalytic conversion of CO2 over Sr1.6K0.35Na1.45Ta5O15.

S10
1000
800
600
400
200
0
Am
ount
of p
rodu
ct /
µmol
1.51.00.50.0
Photoirradiation time / h
Figure S6 Time course of CO (circle) and 13CO (triangle) determined by FID-GC and MS, respectively, during the photocatalytic conversion of CO2 over 5.0 wt.% Ag-modified Sr1.6K0.35Na1.45Ta5O15.

S11
3000
2500
2000
1500
1000
500
0
Am
ount
of e
volv
ed p
rodu
cts
/ µm
ol
Irradiation time / h0 1 2 3 4 5 1 2 3 4 5 1 2 3 4 5
1st cycle 2nd cycle 3rd cycle
Figure S7 Time course of CO (circle), N2 (lozenge), and H2 (triangle) evolutions during three cycles of the photocatalytic conversion of CO2 over Ag-modified Sr1.6K0.35Na1.45Ta5O15. Amount of catalyst: 0.5 g; cocatalyst loading: 5.0 wt.% Ag; light source: 400 W high-pressure Hg lamp; water volume: 1.0 L; CO2 flow rate: 30 mL min−1; additive: 0.5 M NH4HCO3.
S12
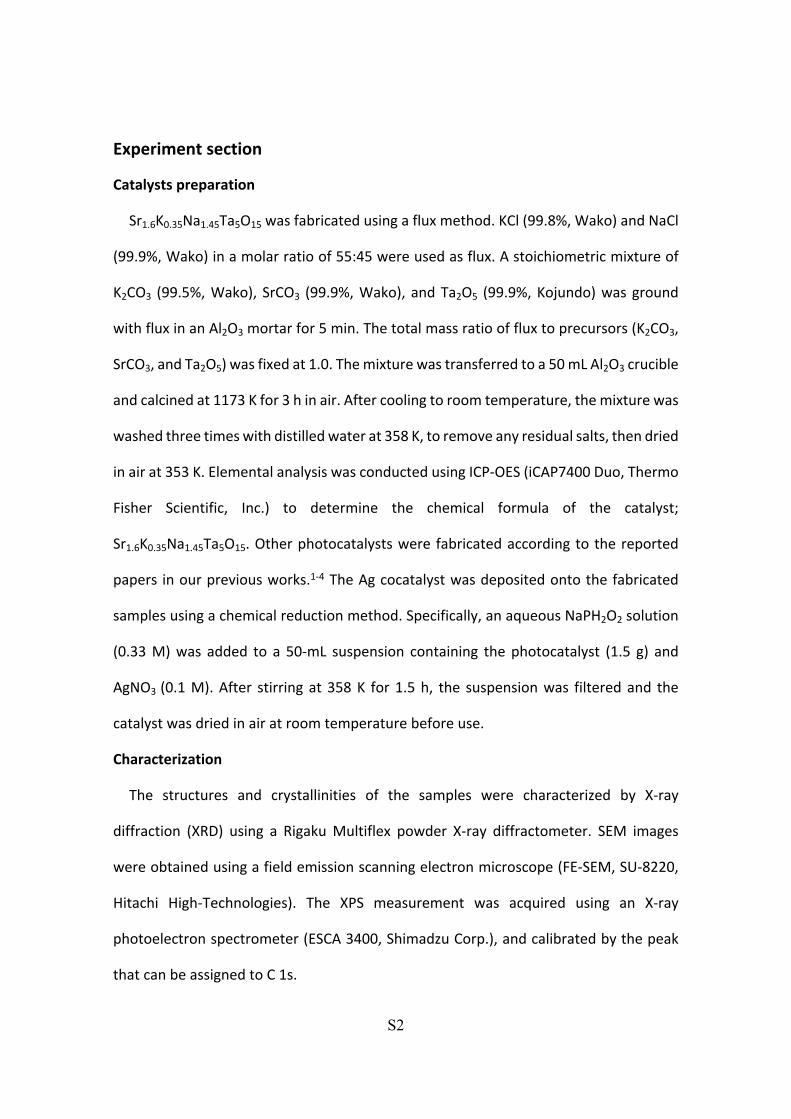
Inte
nsity
(cps
)
706560555045403530252015102degree
3000
(a)
(b)
(c)
Figure S8 XRD patterns of Sr1.6K0.35Na1.45Ta5O15 after (a) first, (b) second and (c) third cycle.

S13
Refences1. Wang, Z.; Teramura, K.; Hosokawa, S.; Tanaka, T., Appl Catal B-Environ 2015, 163,
241-247.2. Teramura, K.; Tatsumi, H.; Wang, Z.; Hosokawa, S.; Tanaka, T., Bulletin of the
Chemical Society of Japan 2015, 88 (3), 431-437.3. Teramura, K.; Wang, Z.; Hosokawa, S.; Sakata, Y.; Tanaka, T., Chemistry–A European
Journal 2014, 20 (32), 9906-9909.4. Wang, Z.; Teramura, K.; Hosokawa, S.; Tanaka, T., J. Mater. Chem. A 2015, 3 (21),
11313-11319.
Top Related
Copyright © 2022 FDOKUMEN

