

![Early identification and phenetic analysis of eight species of subtribe Cassiineae [Leguminosae : Caesalpinioidae] found in Tripura in relation to their seedling morphology.](https://static.fdokumen.com/doc/165x107/6322bbe8050768990e0ffde2/early-identification-and-phenetic-analysis-of-eight-species-of-subtribe-cassiineae.jpg)


Bahasa
Halaman
Hukum


*Corresponding Author Address: TALLA EmmanueL, Department of chemistry, Faculty of Sciences, University of Ngaoundere, POBOX
454, Ngaoundere, Cameroon
World Journal of Pharmaceutical Sciences ISSN (Print): 2321-3310; ISSN (Online): 2321-3086
Published by Atom and Cell Publishers © All Rights Reserved
Available online at: http://www.wjpsonline.org/
Original Article
Study of the Anti-Anxiety Properties of the Phaseollidin, An Isoflavonoid Isolated from
Erythrina droogmansiana (Leguminosae)
Talla Emmanuel2*, Hadidjatou Dairou1, Njapdounke Jacqueline1, Nkantchoua Gisèle1, Yaya Gbaweng Abel
Joël3, Ngah Esther5, Ngo Bum Elisabeth1, Mbafor Tanyi Joseph4
1Département of Biological Science, Faculty of Sciences, University of Ngaoundere, POBOX 454, Ngaoundere,
Cameroon 2Department of Chemistry, Faculty of Science, University of Ngaoundere, POBOX 454, Ngaoundere, Cameroon 3 Institute of Medical Research and Medicinal plants Studies (IMPM), POBOX 6163, Yaounde, Cameroon 4Department of Organic Chemistry, Faculty of Science, University of Yaounde 1, POBOX 812, Yaounde,
Cameroon 5Department of Applied Chemistry, National School of Sciences Agribusiness, PO Box 454, Ngaoundere,
Cameroon
Received: 31-07-2015 / Revised: 11-08-2015 / Accepted: 20-08-2015
ABSTRACT
The anti-anxiety properties of the phaseollidin, isoflavonoid isolated from Erythrina droogmansiana, were
studied in the white mice. Various experimental models (Elevated Plus-Maze, Open-Field, Hole-Board,
Hyperthermia Induced Stress), were used to highlight these properties. The results showed that the phaseollidin
involved a significant increase of the time spent in the open arms of the raised labyrinth in cross, with 97.8 ±
21.64 seconds for a dose of 50 mg/kg and 115.4 ± 34.03 seconds for the dose 25 mg/kg. These results thus
testify to the fall of the aversion of the rodents for enlightened spaces. In the tests of the hole-board and open-
field, used to evaluate the exploration and locomotion activities of mice, the results showed a significant
increase of the locomotion (crossing) with 42.2 ± 10.30 for the dose 25 mg/kg and 60 ± 9.05 for the dose 100
mg/kg of the phaseollidin. The doses 25 mg/kg and 100 mg/kg of the phaseollidin also showed a significant
increase of “rearing”. These results show that the phaseollidin has anti-anxiety properties.
Keywords: phaseollidin, Erythrina droogmansiana, Anxiety.
INTRODUCTION
In Africa, phytotherapy plays a significant role in
the treatment of diseases and the use of medicinal
herbs by the world populations has greatly
increased with time because of their proven
effectiveness (Ngo Bum and al., 2009b; WHO,
2008). Numerous species of plant and molecules
coming from plants, have already shown their
healing power on many ailments. More and more
plants are introduced in the treatment of psychiatric
diseases like alternative or complementary drugs
(Woode and al., 2010).
A good amount of these drugs of vegetable origin
were tested on animal models, which made it
possible to understand their biological activity.
Concerning the therapeutic interests, the barks and
the roots of Erythrina plants gender, play a part in
the traditional pharmacopeia, where they are used
in form of infusion, of paste or decoction for the
treatment of various diseases such as rheumatism,
cognition, fever, cough, tooth ache (Wandji, 1987).
Abyssinone V-4'-methyl ether, a flavonoid isolated
from Erythrina droogmansiana, showed its anti-
inflammatory (Sokeng et al., 2013) and
antioxidative (Yaya and al., 2014) properties. The
phaseollidin secondary metabolite also isolated
from Erythrina droogmansiana, is an isoflavonoid
whose anti-anxiety properties are studied here. In
parallel, the exploring and locomotor activities of
the mice are also evaluated.
MATERIAL AND METHODS
Plant Material: The phaseollidin, secondary
metabolite of Erythrina droogmansiana De Willd

Talla et al., World J Pharm Sci 2015; 3(9): 1763-1775
1764
and T. Durand, were isolated at the University of
Yaounde I starting from the barks from the trunk,
the barks of the roots, wood from the roots and
sheets collected in Nkomekoui in the center region
of Cameroon in August 2010 and, preserved in the
form of crystals at room temperature in a
hermetically closed tube.
Extraction and isolation of the compound: The
powders of the barks of the roots and the barks of
the trunk separately underwent extractions by
simple maceration at room temperature. The
extraction for each powder was initially done with
ethyl acetate during 72 hours three times. The
extract obtained was concentrated dry under
reduced pressure by means of a rotary evaporator.
The dried powder residue was extracted with
methanol during 72 hours three times and 225
grams of acetic extract was obtained from the barks
of the roots, 185 grams of methanolic extract from
the barks of the roots. Then 175 grams of this
powder, were fixed on average grain sand and
series 1 obtained was chromatographied on silica
gel column (granulometry….) and eluted with
hexane, the hexane / ethyl acetate and the ethyl
methanol acetate mixtures. After evaporation,
several fractions crystallized and then washed with
hexane, the compound YG7 was obtained as a
reddish amorphous (80mg).
Experimental Animals: The experimentation was
carried out on white mice Mus musculus Swiss of
the family of Muridae. The mice weighing between
24 to 26 ± 2 grs and approximately 2 months old
were provided by the National Veterinary
Laboratory (LANAVET) of Garoua. . Mice were
taken along to the laboratory 72 hours before the
experimentation for acclimatization.
Drugs and Chemicals: The chemical substances of
reference used were Diazepam (Valium ®) 5
mg/mL in the form of bulbs and phenobarbital
(Phenobarbitone ®) 200 mg/mL in the form of
bulbs.
PHARMACOLOGICAL TESTS
Elevated plus-maze test (Rodgers and al, 1997):
Anxiety in animals is evaluated by the elevated
plus-maze test. It is baised on the innate aversion of
the rodents for open and lit spaces, vacuum and
innovations (Handley and al, 1984; pellow and al.,
1985). The experiment was carried out on five
groups of mouse comprising five mice each. The
mice were led to the laboratory 48 hours before the
test for acclimatization. The positive control group
received diazepam at a dose of 3 mg/kg intra-
peritoneally, while the negative control group
received distilled water (p.o) and the three test
groups received the different doses of phaseollidin,
25 mg/kg, 50 mg/kg and 100 mg/kg (p.o)
respectively. One hour after administration, each
mouse was placed in the central zone of the
labyrinth, the head directed towards an open arm,
and left to freely explore the labyrinth for 5
minutes. During the five minutes of observation,
we noted the number of visits and time spent in
each type of arm, the number of “rearing” (the
mouse draws up itself in driving position, resting
against its rear limbs and the forelimbs are placed
on the edge of the device), the number of grooming
(the mouse puts itself in ball and is cleaned), the
number of head-dipping (the mouse leans and
passes its head over the edge of an open arm of the
labyrinth).
Hole-Board (Takeda et al., 1998): Five groups of
five mice each were constituted. The positive
control group received diazepam at the dose of 0.5
mg/kg intra-peritoneally and the negative control
received distilled water (p.o), the remaining three
group received three different doses of phaseollidin
: 25 mg/kg, 50 mg/kg and 100 mg/kg respectively
(p.o). After each treatment, the mice were put in
their cages and an interval of approximately thirty
minutes was respected between administrations to
two consecutives groups. One hour after
administration, each mouse was placed in the
central zone, and was left freely explore the surface
for 5 minutes. During the five minutes of
observation, parameters such as the latency time
for the appearance of the 1st head-dipping, the
number of head-dippings (the mouse leans and
passes its head by one of the holes of the device),
the number of rearing, the number of crossings (the
mouse crosses lines during the exploration of the
surface) and the number of grooming (the mouse
puts itself in ball and is cleaned) were noted.
Open-Field (Belzung, 1999): The rodents tend to
avoid enlightened and open spaces. When they are
placed in the luminous enclosure of the arena, the
rats and the mice prefer to move at the level of the
periphery against the ramparts of the device. The
activity in the arena represents for this reason, a
valid measure of the anxious behavior in the
laboratory animals (Tronche, 2009). For the
experimentation, twenty-five mice were distributed
in five homogeneous groups. Two controls groups
in which the positive control group received
diazepam at the dose of 0.3 mg/kg intra-
peritoneally and the negative control group
received distilled water (p.o). The three remaining
groups received three doses of phaseollidin (25, 50
and 100 mg/kg, p.o) respectively. After each
treatment, the mice were kept in their cages and an
interval of thirty minutes was respected between
the administrations in two consecutive groups. One

Talla et al., World J Pharm Sci 2015; 3(9): 1763-1775
1765
hour after administration, each mouse was placed
in the central zone of the arena, and was let to
explore it during 5 minutes (Royce, 1977). During
the observation, parameters such as the time spent
in the center, the number of rearing (the mouse
draws up itself in driving position, resting against
its rear limbs and the forelimbs are posed on the
edge of the device), the number of crossing (the
mouse crosses lines during the exploration of
surface) and the number of grooming.
Stress Induced hyperthermia test (Borsini and
al., 1989): The stress induced hyperthermia test is a
simple and fast measurement of anxiety. For the
realization of this test, fifty mice were distributed
homogeneously in five groups. Two controls
groups in which positive control group received
Phenobarbital at the dose of 20 mg/kg intra-
peritoneally and the negative control group
received distilled water by cramming. The
remaining three test groups received three different
doses of phaseollidin 25, 50 and 100 mg/kg; p.o.
After each treatment, the mice were kept in their
cages and interval of thirty minutes was respected
between the administrations in two consecutive
groups. One hour after administration, they were
withdrawn, one after the other at a rate of one
mouse per minute. The rectal temperature was
taken by introduction of a probe (2 mms diameter
and 2 cm length) into the rectum of the mouse.
Before each temperature recording, the probe was
maintained in NaCl 9 ‰. The hyperthermia
induced by stress (HIS) was given by making the
difference between the rectal temperature of the
three last mice and those of the three first of each
group.
Statistical analysis: Calculation of the percentage
time and number of entries on the open arms with
95% confidence limits and comparisons of the
results were performed using computerized linear
regression analysis, using GraphPad Prism (version
4.00, GraphPad Soft- ware Inc., San Diego, CA,
USA). The statistical analysis of data was
performed by one-way analysis of variance
(ANOVA) followed by dunnet’s multiple
comparison test. In all cases differences were
considered significant if p < 0.05.
RESULTS
Structure elucidation of phaseollidin: The
compound responds positively to the test of
phenolic and cyanhydrinic compounds, that which
is characteristic of flavonoids. After rigourous
analysis of the different spectral data, the formular
C20H20O4 with 11 insaturations was attributed to
this compound.
The presence of aliphatic signals on its RMN1H
spectrum has 3,45 (1H, dd, J = 9,6 ; 10,7 Hz); 3,43
(1H, ddd, J = 4,5 ; 6,5 ; 10,7 Hz); 4,17 (1H, dd, J =
4,5 ; 9,6 Hz) and 5,38 (1H, d ; J = 6,5 Hz), which
we can deduce that this compound is a pterocarpan.
The appearance at 6.49 ppm (1H,dd, J= 8.3Hz)
which couples in COSY through an AB system
with on aromatic proton at 7.30 ppm of the cycle A
of pterocarpans. and this cycle is monosubstituted.
The appearance of signals at 1.72 and 1.63 ppm,
3.23 and 5.33 ppm indicating the presence of a
unique isoprenic unit.
Its RMN13C spectrum reveals: Quatenary
carbons: 159.5; 156.7; 159.4; 112.3; 157.5; 112.9
and 132.8 which are amongst others are carbons
carrying hydroxylgroups or linked to oxygen
atoms, ethylinic carbons and carbons with aromatic
rings. Tertiary carbons: 40.9; 78.9; 131.3; 110.1;
103.6; 118.7; 122.2; 107.9 and 123.4 ppm which
correspond to methines and oxymethines of the
cycle B of pterocarpans, to ethylinic methines of
the isoprenyl group and to methines of the A and D
aromatic rings. Secondary carbons: 23.2 and 67.2
ppm which correspond to methylenes of the
isoprene group and to cycle B pterocarpans.
Primary carbons: 17.4 and 25.5 ppm corresponding
to the methyl groups of the two isoprene groups.
The comparison of these data with those reported
in the literature permits that we attribute the
structure of YG7 to phaseollidin recently isolated
from Erythrina addisoniae by Watjen and al.,
2007.
Elevated Plus-Maze test
Effects of the phaseollidin on the percentage of the
number of entries in the open arms. The doses 25,
50 and 100 mg/kg of the phaseollidin and
diazepam, increased the percentage of number of
entries in the open arms. The percentage of number
of entries in the open arms increased from 19 ± 7,
87 for the negative control group to 50.3±4.35,
47.9±5.78 and 40.7±5.74% at the doses of 25; 50
and 100 mg/kg of phaseollidin, respectively. This
value is 44.8±6.73 for the positive control (fig 1).
Effects of the phaseollidin on the percentage of the
time spent in the open arms. The amounts 25
mg/kg and 50 mg/kg of the phaseollidin as well as
Diazepam, increase the percentage of time spent in
the open arms. The percentage of time spent in the
open arms varies from 7.53±2.6 for negative
control group to 38.5±5.07 and 32.6±3.23 % at the
dose of 25 and 50 mg/kg of phaseollidin (fig 2).
This value is of 32.7±8.41 % for diazepam (3
mg/kg).
Effects of phaseollidin on the percentage of the
number of entries in the closed arms.

Talla et al., World J Pharm Sci 2015; 3(9): 1763-1775
1766
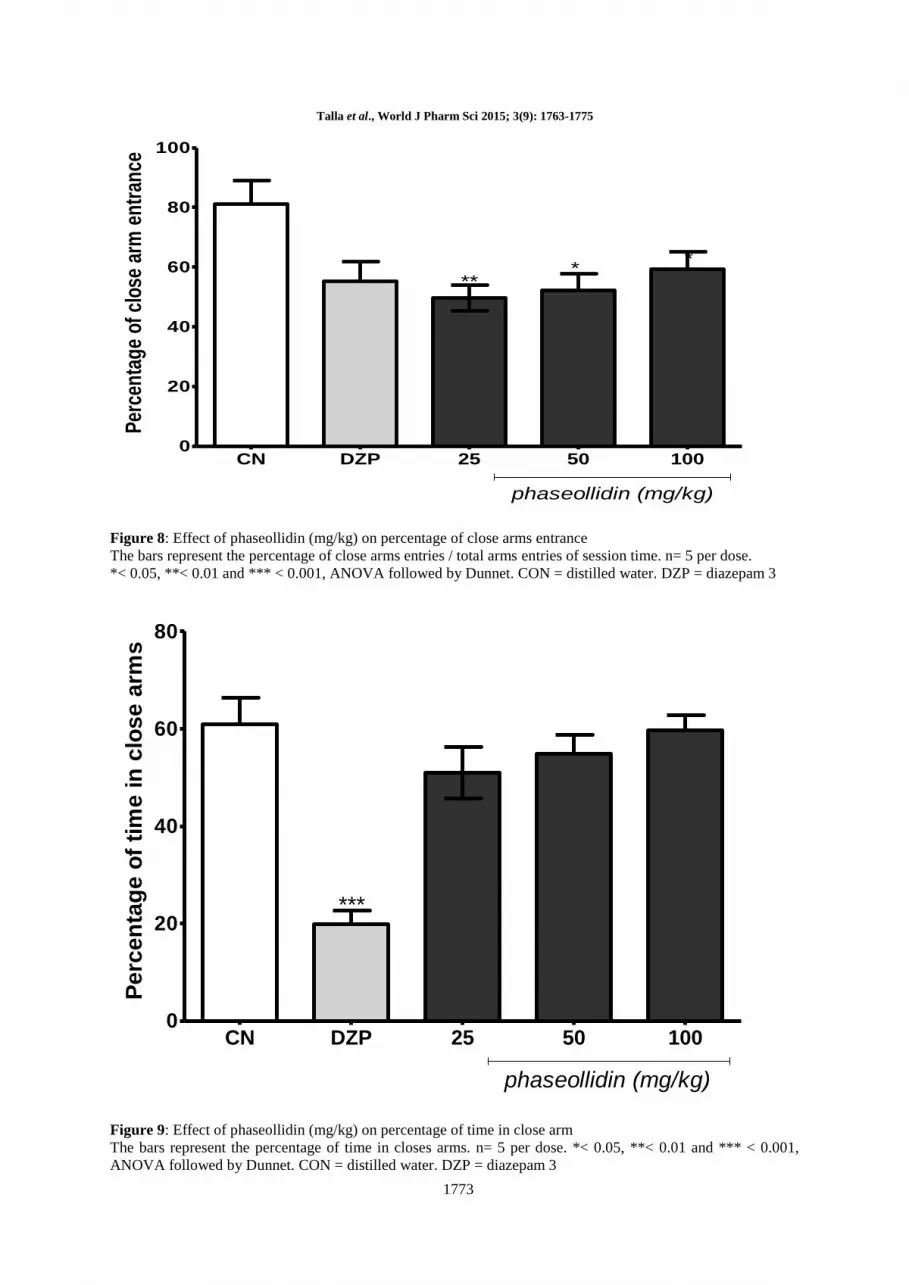
The dose of 25 and 50 mg/kg of phaseollidin and
Diazepam (3 mg/kg), decrease the percentage of
the number of entries in the closed arms of the
labyrinth compared to negative control. The
percentage of entrance in closed arms is 49.7±4.35,
52.1±5.78 and 55.2±6.73 % at the doses of 25, 50
mg/kg of phaseollidin and diazepam, respectively.
This value is 81±7.87 for negative control.
Effects of phaseollidin on number an time in open
and closed arms, Head-dipping, rearing, stretched
attend posture (SAP) and grooming. The
administration of extract results in the significant
increase of the number of entries into open arms
from 2.25 in the control group to 9.20 at the dose of
25 mg/ kg (table 1). Diazepam and phaseollidin (50
mg/kg) also induced significant reduction in the
close arms entries from 8.2±1.3 in the negative
control group to 5.2±1.5 and 5.0±1.58 %
respectively. The number of rearing and stretched
attend posture were reduced both by diazepam and
the extract (table 1). The number of grooming was
increased by the extract from 0.6 for the negative
control to 1.6±0.8, 1.6±0.49 and 1.6±0.49 at the
dose of 25, 50 and 100 mg/kg of phaseollidin
solution (table 1).
Hole-Board test: The doses 25, 50 and 100 mg/kg
of phaseollidin and Diazepam decreased the latency
time of appearance of the 1st head-dipping. The
latency time of appearance of the 1st head-dipping
is 10.2 ± 2.28 sec, , 9.8 ± 2.28 sec and 8 ± 1.58 sec
at the dose 25 mg/kg,50 mg/kg, and 100 mg/kg of
phaseollidin, respectively and 20.6±5.13. This
value is of 7.8 ± 1.64 for positive control.
The doses of 25 mg/kg and 100 mg/kg of
phaseollidin increased the number of crossing
compared to the negative control. The number of
crossing varies from 18.2±2.77 for negative control
group to 42.2 ±10.3 and 60±9.06 at the dose of 25
and 100 mg/kg of phaseollidin. The number of
rearing was also increased in animal treated with
phaseollidin and diazepam. This number went from
5.4±3.5 for the negative control group to
14.2±4.02, 6.8±1.33, 14.6±2.42 and 14.4±1.42 for
the doses 25, 50, 100 mg/kg of phaseollidin and
diazepam (0.5 mg/kg) (table 2).
Open-Field test: The doses of 25 mg/kg and 50
mg/kg of the phaseollidin, increased the number of
crossings compared to the negative control. The
number of crossing varied from 38.3±5.4 for
negative control group to 62.2 ± 18.8 for the dose
of 50 mg/kg and 71.2 ± 11.84 for the dose of 25
mg/kg of phaseollidin. The number of crossing was
55.2±10.2 for positive control group. The doses of
25 mg/kg of the phaseollidin, increased the time
spent in the center compared to negative control.
The time spent in the center is 6.4 ± 1.67 for the
amount 25 mg/kg of the phaseollidin and 2.8±0.86
for the negative control group (table 3).
Hyperthermia Induced Stress: The doses 50
mg/kg and 100 mg/kg of phaseollidin decreased the
hyperthermia induced by the stress. This value is of
0.63 for the dose of 50 mg/kg and of 0.06 for the
dose of 100 mg/kg of the phaseollidin compared to
the negative control group in which HIS is 1.23 (fig
5). The temperature is reduced in the group who
received phenobarbital compared to the negative
control group; 33:7±0:270 and 36.0±0.306
respectively (fig 6).
DISCUSSION
The elevated plus-maze test is one of the models of
anxiety most used in the study of anxiety in
animals (Pitchaiah and al., 2008). phaseollidin
increases the number of entries and the percentage
of time spent in the open arms and, decreases the
number of entries in the closed arms. The increase
in the number of entries and the percentage of time
spent in the open arms and the reduction in the
number of entries in the closed arms, indicate the
increase in exploration and aversion of the animal
drops for the open arms of the labyrinth. These
results suggest the presence of anxiolytic properties
(Pitchaiah and al., 2008).
The hole-board test is a simple method of
measurement of the response of the animals ina
new environment and, is generally used to
understand the emotional anxiety and/or reactions
to the stress of the animals (Nolan and al, 1973;
Takeda and al, 1998). The phaseollidin decreases
the latency time of appearance of the 1st head-
dippingand increases the number of crossing. This
reduction in the latency time of appearance of the
1st head-dipping and the increase of crossings,
shows an increase in the locomotory and
exploratory activities in the animal. These results
suggest that the phaseollidin would act on the
exiting neuronal systems such as the glutaminergic
system, by inhibiting them or would act by exciting
the inhibiting neuronal ways via the γ-aminobutyric
acid (GABA) (Moses and al., 2011). Knowing that
the drugs which help to control the disorders of the
anxiety modify the concentration of the principal
chemical messengers such as gamma-aminobutyric
acid or GABA which play a part in anxiety
(Boulenger, 2007), the phaseollidin would thus
have anxiolytic properties. The open-field test is
today one of the most popular methods used to
study the emotional and psychological variation in
animals. Indeed, the anxious behavior in the open-
field is reflected by two factors: the separation of
the animal from its social group and agoraphobia

Talla et al., World J Pharm Sci 2015; 3(9): 1763-1775
1767
(Prut and al, 2003). The number of crossing carried
out in the open one, would make it possible to
measure the exploratory behavior and the level of
anxiety in the animal (Brown and al., 1999). The
phaseollidin increases the number of crossing and
the time spent in the center of the open-field. This
increase of crossing and the time spent in the center
of the open-field indicates the increase in
exploration and the locomotion in animal. As the
tranquillizers reduce the aversion of the rodents for
enlightened spaces and increase the number of
crossing and /or the time spent in the center of the
open-field (Oliver and al., 2000), this result
suggests the presence of the anti-anxiety properties.
The hyperthermia induced stress test offers a better
parametric analysis of the physiological reaction of
the anxiety (Cryan and al., 2003). The rectal
temperature of the rodents tends to increase in
situation of stress (Cryan and al., 2003). The
phaseollidin involves a fall of hyperthermia in the
mice. This result suggests that phaseollidin would
have antipyretic properties.
STATISTICAL ANALYSIS
For the statistical analysis of the effects of the
phaseollidin, an analysis of variance (ANOVA)
followed by the multiple comparison test of
Dunnett (bilateral) was carried out to compare the
values of the various parameters obtained in the
mice of the various test batches and those of the
negative control batch. From p ≤ 0.05, the values
were regarded as significant.
CONCLUSION
The study conducted on the phaseollidin, secondary
metabolite isolated from Erythrina droogmansiana,
made it possible to highlight its effects on the
central nervous system of the white mice. This
secondary metabolite have an effect in the anxious
state on elevated plus maze test, increased
locomotory and exploratory activities of the mice.
These results revealed the anti-anxiety properties of
phaseollidin.
ACKNOWLEDGEMENTS
The authors thank the Faculty of Science,
University of Ngaoundere and Yaounde 1,
Cameroon, for providing the necessary support for
this study.
Table 1: 1H, 13C NMR and HMBC data of compound 1 in CDCl3-MeOD
Carbon N° 13C (δ in ppm) 1H (δ in ppm)
1 131,3 (d) 7,30 (1H, d, J=8,3 Hz)
2 110,1 (d) 6,49 (1H, dd, J=8,3 ; 2,3)
3 159,5 (s)
4 103,6 (d) 6,31 (1H, d, J=2,3Hz)
4a 156,7 (s)
6 67,2 (t)
6ax 3,45 (1H, dd, J=9,6 ; 10,7 Hz)
6eq 4,17 (1H, dd, J=4,5 ; 9,6 Hz)
6a 40,9 (d) 3,43 (1H, ddd, J=4,5 ; 6,5 ; 10,7 Hz)
6b 118,7 (d)
7 122,2 (d) 6,86 (1H, d, J=8,4 Hz)
8 107,9 (d) 6,30 (1H, d ; J=8,4)
9 159,4 (s)
10 112,3 (s)
10a 157,5 (s)
11a 78,9 (d) 5,38 (1H, d ; J=6,5)
11b 112,9 (s)
1’ 23,2 (t) 3,23 (2H, d ; J=7,1 Hz)
2’ 123,4 (d) 5,33 (1H, t ; J=7,1 Hz)
3’ 132,8 (s)
4’ 25,5 (q) 1,72 (3H, s)
5’ 17,4 (q) 1,63 (3H, s)

Talla et al., World J Pharm Sci 2015; 3(9): 1763-1775
1768
O
O
OH
CH3 CH3
OH
1
2
34
4a6
6b6a 7
8
910
10a
11a11b
1'2'
3'
4' 5'
Figure 1 : RMN1H Spectrum (500 MHz, MeOD) de YG7

Talla et al., World J Pharm Sci 2015; 3(9): 1763-1775
1769
Figure 2 : COSY Spectrum (500 MHz, MeOD) de YG7
Figure 3 : HSQC Spectrum (1H : 500 MHz, 13C : 125 MHz, MeOD) de YG7

Talla et al., World J Pharm Sci 2015; 3(9): 1763-1775
1770
Figure 4 : RMN13C Spectrum type DEPT (125 MHz, MeOD)
Figure 5 : HMBC Spectrum (1H : 500 MHz, 13C : 125 MHz, MeOD)

Talla et al., World J Pharm Sci 2015; 3(9): 1763-1775
1771
Table 2: The number of open arms entries, closes arms entries, rearing, head- dipping and grooming and SAP
on EPM
( mg/kg)
Distilled water
Diazepam
25
50
100
Open arms entries 2.25± 2.39 5.20 ± 3.11 9.20 ±2.77**
5.20 ± 3.56 4.60± 1.97
Closes arms entries 8.20 ± 1.30
5.6 ± 1.52* 8.83 ± 1.3 5.00 ± 1.52** 6.40±1.41
Rearing
12.2 ± 2.59 2.0 ± 2.12*** 12.8 ± 1.79 8.00 ± 1.41* 11.2 ± 2.28
Head- dipping
15.8 ± 5.45 12.8 ± 2.77 21 ± 2.4 17.4 ± 3.85 10.0 ±1.41*
Grooming
0.6 ± 0.49 2.00 ± 2.12*** 1.6 ± 0.8* 1.6 ± 0.49* 1.6 ± 0.49*
SAP
20.6 ± 6.66 7.80 ± 1.92*** 10.2 ± 2.28*** 9.80 ± 2.28*** 9.8 ± 1.58***
Data are mean, S.E.M., n= 5, *< 0.05, ** < 0.01, ***< 0.001, ANOVA following by Dunnett
Table 3: The number of crossing, rearing, grooming and center time on OF
Crossing
Rearing
grooming
Time in center (sec)
Distilled water ( 10
mg/kg)
38.80 ±2.24 23.2±5.67 1.8±0.88
2.8 ± 0.85
Diazepam
52.80 ±10.04 11.2 ±2.77* 0.80±0.80*** 1.8 ± 0.837
25 ( mg/kg)
71.2 ± 11.8*** 24.2± 6.76 1.40 ± 0.55 6.40 ± 1.67***
50 ( mg/kg)
62.2± 18.8*** 18.6 ± 8.66 2.60 ±1.14 2.80 ± 0.447
100 ( mg/kg)
49.4 ± 5.73 15.8 ±16*** 3.20 ± 1.30 1.66 ± 0.548
Data are mean, S.E.M., n= 6, *< 0.05, ** < 0.01, ***< 0.001, ANOVA following by Dunnett
Table 4: The number of crossing, rearing, head-dipping and first head-dippings(sec) on HB
Crossing
Head-dipping
First head-dipping
(sec)
rearing
Distilled water ( 10
mg/kg)
12.80 ±2.77 17.0±4.30 20.6 ± 5.13
5.4 ± 3.35
Diazepam
30.80 ±8.44 19.6 ± 2.70* 7.8 ± 1.64*** 14.4 ± 2.42*
25 ( mg/kg)
42.2 ± 10.3*** 17.6± 2.70 10.2 ± 2.28*** 14.2 ± 4.02***
50 ( mg/kg)
18.2± 5.54 14.4 ± 3.91 9.8 ± 2.28*** 6.0 ± 1.33
100 ( mg/kg)
60 ± 9.06*** 18.6 ± 2.97 8.0 ± 1.58*** 14.6 ± 2.37***
Data are mean, S.E.M., n= 5, *< 0.05, ** < 0.01, ***< 0.001, ANOVA following by Dunnett

Talla et al., World J Pharm Sci 2015; 3(9): 1763-1775
1772
Per
cent
age
of o
pen
arm
ent
ranc
e
CN DZP 25 50 1000
20
40
60
phaseollidin (mg/kg)
** **
Figure 6: Effect of phaseollidin (mg/kg) on percentage of open arm entrance. The bar represents the percentage
of open arms entries / total arms entries of session time. n= 5 per dose. *< 0.05, **< 0.01 and *** < 0.001,
ANOVA followed by Dunnet. CON = distilled water. DZP = diazepam 3
Perc
en
tag
e o
f ti
me i
n o
pen
arm
CN DZP 25 50 1000
10
20
30
40
50
phaseollidin (mg/kg)
**
**
**
Figure 7: Effect of phaseollidin (mg/kg) on percentage of time in open arms.
The bars represent the percentage of time in open arms. n= 5 per dose. *< 0.05, **< 0.01 and *** < 0.001,
ANOVA followed by Dunnet. CON = distilled water. DZP = diazepam 3
Talla et al., World J Pharm Sci 2015; 3(9): 1763-1775
1773
Per
cen
tag
e of
clo
se a
rm e
ntr
ance
CN DZP 25 50 1000
20
40
60
80
100
phaseollidin (mg/kg)
***
*
Figure 8: Effect of phaseollidin (mg/kg) on percentage of close arms entrance
The bars represent the percentage of close arms entries / total arms entries of session time. n= 5 per dose.
*< 0.05, **< 0.01 and *** < 0.001, ANOVA followed by Dunnet. CON = distilled water. DZP = diazepam 3
Pe
rce
nta
ge
of
tim
e i
n c
los
e a
rms
CN DZP 25 50 1000
20
40
60
80
phaseollidin (mg/kg)
***
Figure 9: Effect of phaseollidin (mg/kg) on percentage of time in close arm
The bars represent the percentage of time in closes arms. n= 5 per dose. *< 0.05, **< 0.01 and *** < 0.001,
ANOVA followed by Dunnet. CON = distilled water. DZP = diazepam 3

Talla et al., World J Pharm Sci 2015; 3(9): 1763-1775
1774
St
ress
Indu
ced
Hyp
erth
erm
ia
CN PHENO 25 50 1000.0
0.5
1.0
1.5
Hallea ciliata (mg/kg)
***
******
***
Figure10: Effects of phaseollidin on the stress induced hyperthermia. Each bar represents hyperthermia. n=6.
*** p≤ 0,001 significant difference compared to PHENO group. CN: negative control made up by the mice
having received distilled water, PHENO: positive control made up by the mice having received Phenobarbital
(20 mg/kg).
Mea
n te
mpe
ratu
re (
C)
H2O PHENO D3 D2 D10
10
20
30
40
***
phaseollidin (mg/kg)
Figure 11: Effects of phaseollidin on mean temperature in HIS test. Each bar represents mean temperature ±
ESM. n=10. *** p≤ 0,001 significant difference compare to CN group. CN: negative control made up by the
mice having received distilled water, PHENO: positive control made up by the mice having received
Phenobarbital (20 mg/kg).

Talla et al., World J Pharm Sci 2015; 3(9): 1763-1775
1775
REFERENCES
1. Belzung C. Measuring rodent exploratory behavior. In Crusio W. E., and Gerlai (eds), Handbook of
Molecular-Genetic techniques. Brain and Behavioural Research 1999; 11: 738-49.
2. Borsini F and al. A model to measure anticipatory anxiety in mice. Psychopharmacology 1989; 98:207-11.
3. Boulenger J., De L'anxiété Normale Aux Troubles Anxieux, Programme 2e Cycle Psychiatrie; Faculté De
Médecine Montpellier-Nîmes 2007 ; pp.15.
4. Brown R. and al. Differences in measures of exploration and fear in MHC-congenic C57BL/6J and B6-H-
2K mice. Behavior Genetics 1999; 26:263-71.
5. Cryan F. and al. Antidepressant and anxiolytic-like effects in mice lacking the group III metabotropic
glutamate receptor mGluR7. European Journal of Neuroscience 2003; 17: 2409-17.
6. File E.and al. Raised corticostérone in the rat afterexposure to the elevated plus-maze.
Psychopharmacology (Berl) 1994; 113(3-4):543-6.
7. Handley S.and Mithani S., Effects of alpha-adrenoceptor agonists and antagonists in a maze -exploration
model of 'fear'-motivated behaviour. Naunyn Schmiedebergs Arch. Pharmacol 1984; 327(1):1-5.
8. Moses and al. Neuropharmacological Effects of Nigerian Honey in Mice. Afr J Tradit Complement Altern
Med. 2011; 8(3): 230–49.
9. Ngo Bum and al. Anticonvulsivant, anxiolytic, and sedative properties of the roots of Nauclea latifolia
Smith in mice. Epilepsy Behav 2009b; 15:434-40.
10. Nolan N. and Parks W., The effects of benzodiazepines on the behavior of mice on hole-board.
Psychopharmacologia 1973 ; 29:277-86.
11. Oliver B.and al. 5-HT3 receptor antagonists and anxiety; a preclinical and clinical review. Eur
Neuropsychopharmacol 2000; 10: 77-95.
12. World organization of Health., 2008. Strategy of the WHO on the traditional medecine; Geneva ,65p.
13. Pellow S. and al. Validation of open: closed arm entries in an elevate plus-maze as a mesure of anxiety in
the rat. J Neurosci Methods 1985; 14(3):149-67.
14. Pitchaiah G. and al. Pharmacological Evaluation Of Alcoholic Extract Of Stem Bark Of Erythrina
Variegata For Anxiolytic And Anticonvulsant Activity In Mice. Pharmacology Online 2008; 3: 934-47.
15. Prut L. and Belzung C., The open field as a paradigm to measure the effects of drugs on anxiety-like
behaviours: a review. Euro J Pharmacol, 2003; 463:3-33.
16. Rodgers R. J. and Dalvi A., Anxiety Defence and the Elevated Plus Maze. Neuroscience and
Biobehavioural Reviews 1997: 21 (6): 801-10.
17. Royce R., On the construct validity of open-field measures. Psychological Bulletin 1977; 84, 1098–106.
18. Sokeng D. and al. Anti-inflammatory effect of abyssinone V-4'-methyl ether on acute and chronic
inflammation models. Hygeia.J.D.Med. 2013; 5 (1): 121-8.
19. Takeda M. and Matsumiya T., Changes in head-dipping behavior in the hole-board test reflect the
anxiogenic and/or anxiolytic state in mice. Eur. J. Pharmacol. 1998; 350:21-29.
20. Tronche C., Effets d'un stress aigu sur le rappel mnésique : approches comportementale et endocrinienne
chez la souris jeune et âgée. Thèse de doctorat de l'Université Bordeaux I; Ecole doctorale : Sciences de la
vie et de la santé; Spécialité Neurosciences, 2009 ; pp.205.
21. Wandji J., 1987. Thèse de Doctorat de 3ème cycle, (1987), Université de Yaoundé, Cameroun.
22. Watjen, W. and al. Pterocarpans phaseollin and neorautenol isolated from Erythrina addisoniae induce
apotopic cell death accompanied by inhibition of ERK phosphorylation. Toxicology 2007; 242: 71-9.
23. Woode E. and al. Anxiolytic and antidepressant effects of a leaf extract of Palisota hirsute K. schum.
(Commelinaceae) in mice. Int. J. Pharmacol. 2010; 6: 1-17.
24. Yaya A. and al. Antioxidant activity of compounds isolated from the root woods of Erythrina
droogmansiana. International Journal of Pharmaceutical Sciences and Drug Research 2014; 6 (2): 160-3.
Top Related
Copyright © 2022 FDOKUMEN

