


Bahasa
Halaman
Hukum


SOCIO-ECONOMIC, FINANCIAL, AND ENVIRONMENTAL
ASSESSMENT OF THE REHABILITATION OF
BAYBAYOG-APANBERANG-TIMBAC FARM-TO-MARKET ROAD
IN BARANGAY CATTUBO, ATOK, BENGUET
TECHNICAL REPORT
Lumbres, Almira Geles B.
Team Leader
TEAM MEMBERS:
Erro, Maria Erina G.
Sadili, Diana Rose A.
Sale, Erica Kristel A.
Supervised Field Experience in Human Settlements Planning
Department of Community and Environmental Resource Planning
College of Human Ecology
University of the Philippines Los Baños
April 2011
In cooperation with
Cordillera Highland Agricultural Resource Management Project 2
Province of Benguet
And the Municipality of Atok, Benguet

2011 SOCIO-ECONOMIC, FINANCIAL AND ENVIRONMENTAL ASSESSMENT OF THE
REHABILITATION OF BAYBAYOG-APANBERANG-TIMBAC FARM-TO-MARKET ROAD IN
BARANGAY CATTUBO, ATOK, BENGUET
Erro, M.E.G; Lumbres, A.G.B.; Sadili, D.R.A; Sale, E.K.A.
Page i
EXECUTIVE SUMMARY
This study focused on the farm-to-market access, as part of the RID component of
CHARM2, which aims to uplift the economic condition of farming communities in the
influenced areas. Its primary objective was to assess the social, economic, financial, and
environmental impacts of the road rehabilitation of Baybayog-Apanberang-Timbac Farm-
to-Market Road in Barangay Cattubo, Atok, Benguet.
The study was conducted from January to March 2011. Social, financial,
economic, and environmental data were gathered through primary and secondary data
gathering. The methods used were key informant interviews and household survey, where
in a purposive sampling of 50 households was done. Descriptive analysis was used for
both social and environmental data while BCR, IRR, and NPV/NPW were used to
analyze the economic and financial data gathered.
Based on the results of the study, the road rehabilitation project was feasible and
beneficial for the influenced areas. The project is deemed to be beneficial as reflected by
the positive impacts perceived by the respondents such as decrease in travel time,
increase in income, and ease in access to social services. There were also perceived
favorable environmental impacts such as decrease in the incidence of soil erosion,
improved air quality, and decrease flooding incidence. In terms of economic and financial
aspects, all the indicators yielded positive values which denoted that the project was
feasible and worthwhile to undertake. A sensitivity analysis for financial and economic
aspect was also done to determine the viability of the project and the results also
indicated that the project would still be feasible under various circumstances.
Suggestions coming from the household respondents were also reflected in the
study. Furthermore, the researchers gave their recommendations based on the results of
the study.
2011 SOCIO-ECONOMIC, FINANCIAL AND ENVIRONMENTAL ASSESSMENT OF THE
REHABILITATION OF BAYBAYOG-APANBERANG-TIMBAC FARM-TO-MARKET ROAD IN
BARANGAY CATTUBO, ATOK, BENGUET
Erro, M.E.G; Lumbres, A.G.B.; Sadili, D.R.A; Sale, E.K.A.
Page ii
ACKNOWLEDGEMENT
This study would not be possible if not for the following individuals who gave all
their full support, trust, and encouragement:
Dr. Walfredo Rola, Practicum adviser, for preparing the team, giving his
guidance, sharing his knowledge, and equipping them with skills that are necessary for
the study.
CHARM
Dr. Cameron Odsey, Project Director, for giving the students the opportunity to
be part of CHARM2 project.
Rowena Bilig, Field Supervisor, for the team’s board and lodging,
communicating with the LGU involved in the study, and making necessary arrangements
during the training.
LOCAL GOVERNMENT UNIT
People from the Provincial Planning and Development Office; Tita Susan, Tita
Diane, Tita Joan, Tita Rose, Sir Rowan, and Manong Tam for their guidance and
cooperation during the data gathering, for assisting in transportation during the field
work, and for their support even beyond their call of duty.
The Officials of the Municipality of Atok for providing secondary data needed for
the study, most especially to Ate Cynthia Backian who helped and assisted the team
during the field work.

2011 SOCIO-ECONOMIC, FINANCIAL AND ENVIRONMENTAL ASSESSMENT OF THE
REHABILITATION OF BAYBAYOG-APANBERANG-TIMBAC FARM-TO-MARKET ROAD IN
BARANGAY CATTUBO, ATOK, BENGUET
Erro, M.E.G; Lumbres, A.G.B.; Sadili, D.R.A; Sale, E.K.A.
Page iii
Barangay Cattubo; specifically the presence of Brgy. Capt. Eduard Beliano,
Brgy. Councilor Terte Vicente, Pedro Kisim, and Tony Senio, for the accommodation,
service vehicles, ensuring the safety of the team, and their assistance during data
gathering.
To the people from the Municipality of Kabayan; Mayor Faustino Aquisan,
Engr. Berry Sangao, Kuya Nover, and Kuya Hueler, for providing necessary data
needed for the study, for their warm accommodation, and assistance during data
gathering.
To the Barangay Captain of Natubleng and Pacso, Brgy. Capt. Camotiao Alinso
Jr. and Cipriano Baucas, for supplementing data gaps.
To the people from National Irrigation Administration – Canteen for all the fun
and friendship they gave to the team.
The team’s family and friends for their financial, emotional, and moral support.
Above all, to the Lord Almighty, for His guidance and for keeping them safe
throughout the practicum duration.

2011 SOCIO-ECONOMIC, FINANCIAL AND ENVIRONMENTAL ASSESSMENT OF THE
REHABILITATION OF BAYBAYOG-APANBERANG-TIMBAC FARM-TO-MARKET ROAD IN
BARANGAY CATTUBO, ATOK, BENGUET
Erro, M.E.G; Lumbres, A.G.B.; Sadili, D.R.A; Sale, E.K.A.
Page iv
TABLE OF CONTENTS
PAGE NUMBER
Executive Summary i
Acknowledgement ii
List of Tables vi
List of Figures ix
List of Plates xi
List of Acronyms xiii
INTRODUCTION 1
Background of the Study 2
Rationale 5
Objectives 5
Significance 6
Scope and Limitation 7
GENERAL APPROACH AND METHODOLOGY 8
Conceptual Framework of the Study 9
Analytical Framework of the Study 11
Study Approach 13
Data and Data Sources 15
Data Collection 16
Data Analysis 17
RESULTS AND DISCUSSION 22
Project Profile 23
Description of the Project Area 24
Socio-Demographic Profile of the Respondents 51

2011 SOCIO-ECONOMIC, FINANCIAL AND ENVIRONMENTAL ASSESSMENT OF THE
REHABILITATION OF BAYBAYOG-APANBERANG-TIMBAC FARM-TO-MARKET ROAD IN
BARANGAY CATTUBO, ATOK, BENGUET
Erro, M.E.G; Lumbres, A.G.B.; Sadili, D.R.A; Sale, E.K.A.
Page v
Project Impacts 58
Social Impacts 58
Financial-Economic Impacts 75
Environmental Impacts 86
CONCLUSION 95
RECOMMENDATIONS 104
REFERENCES 111
APPENDICES 113
Appendix A: Gantt Chart
Appendix B: Key Informants Guide Questions
Appendix C: Survey Instrument
Appendix D: LGU Profile and Project Information Sheets
Appendix E: Budget Allocation
Appendix F: Financial Computations
Appendix G: Economic Computations
Appendix H: Documentation
2011 SOCIO-ECONOMIC, FINANCIAL AND ENVIRONMENTAL ASSESSMENT OF THE
REHABILITATION OF BAYBAYOG-APANBERANG-TIMBAC FARM-TO-MARKET ROAD IN
BARANGAY CATTUBO, ATOK, BENGUET
Erro, M.E.G; Lumbres, A.G.B.; Sadili, D.R.A; Sale, E.K.A.
Page vi
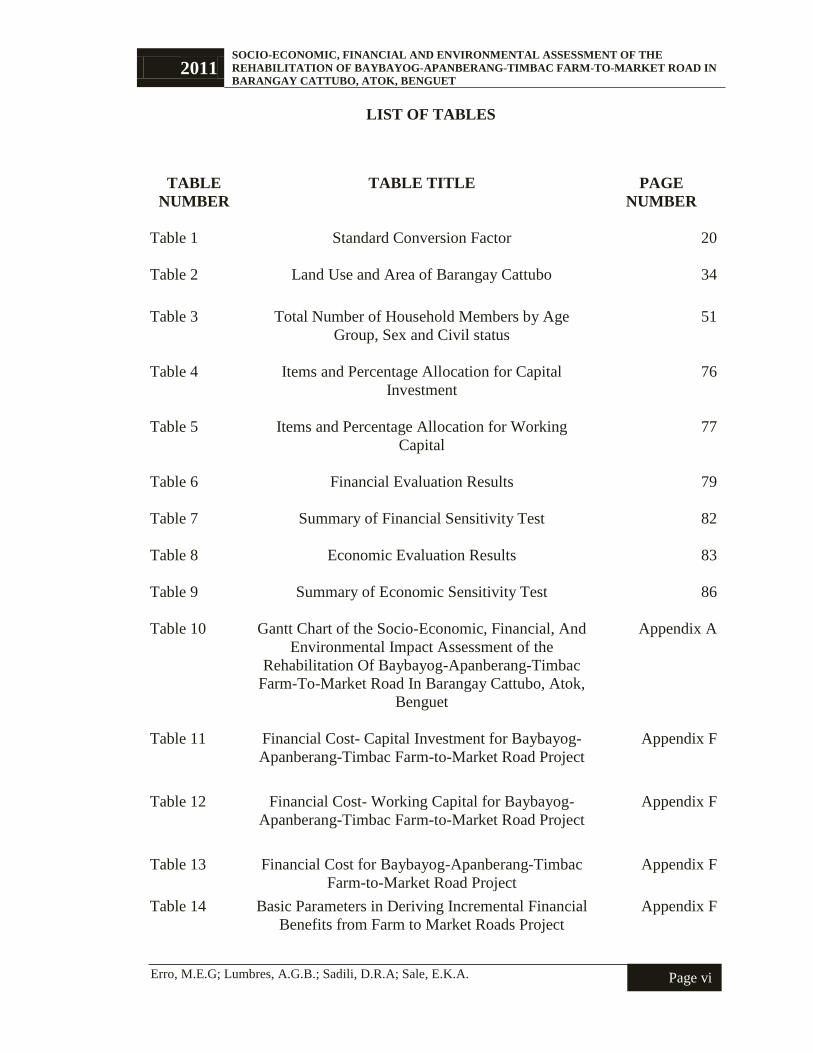
LIST OF TABLES
TABLE
NUMBER
TABLE TITLE
PAGE
NUMBER
Table 1 Standard Conversion Factor
20
Table 2 Land Use and Area of Barangay Cattubo
34
Table 3 Total Number of Household Members by Age
Group, Sex and Civil status
51
Table 4 Items and Percentage Allocation for Capital
Investment
76
Table 5 Items and Percentage Allocation for Working
Capital
77
Table 6 Financial Evaluation Results
79
Table 7 Summary of Financial Sensitivity Test
82
Table 8 Economic Evaluation Results
83
Table 9 Summary of Economic Sensitivity Test
86
Table 10 Gantt Chart of the Socio-Economic, Financial, And
Environmental Impact Assessment of the
Rehabilitation Of Baybayog-Apanberang-Timbac
Farm-To-Market Road In Barangay Cattubo, Atok,
Benguet
Appendix A
Table 11 Financial Cost- Capital Investment for Baybayog-
Apanberang-Timbac Farm-to-Market Road Project
Appendix F
Table 12 Financial Cost- Working Capital for Baybayog-
Apanberang-Timbac Farm-to-Market Road Project
Appendix F
Table 13 Financial Cost for Baybayog-Apanberang-Timbac
Farm-to-Market Road Project
Appendix F
Table 14 Basic Parameters in Deriving Incremental Financial
Benefits from Farm to Market Roads Project
Appendix F

2011 SOCIO-ECONOMIC, FINANCIAL AND ENVIRONMENTAL ASSESSMENT OF THE
REHABILITATION OF BAYBAYOG-APANBERANG-TIMBAC FARM-TO-MARKET ROAD IN
BARANGAY CATTUBO, ATOK, BENGUET
Erro, M.E.G; Lumbres, A.G.B.; Sadili, D.R.A; Sale, E.K.A.
Page vii
Table 15 Incremental Freight Financial Benefits from VOCs
for Farm to Market Road
Appendix F
Table 16 Incremental Passenger Financial Benefits from
VOCs for Farm to Market Road –Cattubo
Appendix F
Table 17 Incremental Passenger Financial Benefits from
VOCs for Farm to Market Road- Natubleng
Appendix F
Table 18 Incremental Passenger Financial Benefits from
VOCs for Farm to Market Road-Pacso
Appendix F
Table 19 Total Incremental Passenger Financial Benefits from
VOCs for Farm to Market Road
Appendix F
Table 20 Computation for Financial Internal Rate of Return
for the Baybayog- Apanberang-Timbac Farm-to-
Market Road
Appendix F
Table 21 Computation for Financial Internal Rate of Return
for the Baybayog- Apanberang-Timbac Farm-to-
Market Road with 10% Decrease in Benefits
Appendix F
Table 22 Computation for Financial Internal Rate of Return
for the Baybayog- Apanberang-Timbac Farm-to-
Market Road with 10% Increase in Cost
Appendix F
Table 23 Computation for Financial Internal Rate of Return
for the Baybayog- Apanberang-Timbac Farm-to-
Market Road with Two Years Project Delay
Appendix F
Table 24 Computation for Financial Internal Rate of Return
for the Baybayog- Apanberang-Timbac Farm-to-
Market Road with 10% Decrease in Benefit, 10%
Increase in Cost, and Two Years Project Delay
Appendix F
Table 25 Economic Cost- Capital Investment for Baybayog-
Apanberang-Timbac Farm-to-Market Road Project
Appendix G
Table 26 Economic Cost- Working Capital for Baybayog-
Apanberang-Timbac Farm-to-Market Road Project
Appendix G
Table 27 Economic Cost for Baybayog-Apanberang-Timbac
Farm-to-Market Road Project
Appendix G
2011 SOCIO-ECONOMIC, FINANCIAL AND ENVIRONMENTAL ASSESSMENT OF THE
REHABILITATION OF BAYBAYOG-APANBERANG-TIMBAC FARM-TO-MARKET ROAD IN
BARANGAY CATTUBO, ATOK, BENGUET
Erro, M.E.G; Lumbres, A.G.B.; Sadili, D.R.A; Sale, E.K.A.
Page viii
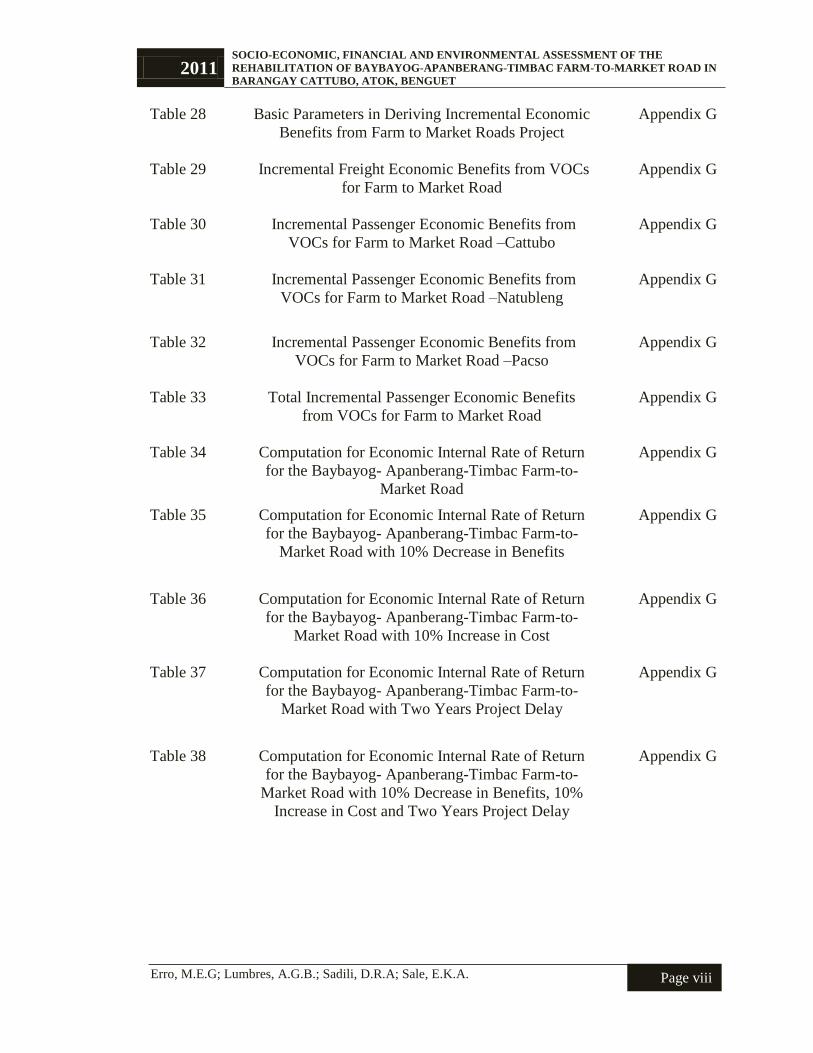
Table 28 Basic Parameters in Deriving Incremental Economic
Benefits from Farm to Market Roads Project
Appendix G
Table 29 Incremental Freight Economic Benefits from VOCs
for Farm to Market Road
Appendix G
Table 30 Incremental Passenger Economic Benefits from
VOCs for Farm to Market Road –Cattubo
Appendix G
Table 31 Incremental Passenger Economic Benefits from
VOCs for Farm to Market Road –Natubleng
Appendix G
Table 32 Incremental Passenger Economic Benefits from
VOCs for Farm to Market Road –Pacso
Appendix G
Table 33 Total Incremental Passenger Economic Benefits
from VOCs for Farm to Market Road
Appendix G
Table 34 Computation for Economic Internal Rate of Return
for the Baybayog- Apanberang-Timbac Farm-to-
Market Road
Appendix G
Table 35 Computation for Economic Internal Rate of Return
for the Baybayog- Apanberang-Timbac Farm-to-
Market Road with 10% Decrease in Benefits
Appendix G
Table 36 Computation for Economic Internal Rate of Return
for the Baybayog- Apanberang-Timbac Farm-to-
Market Road with 10% Increase in Cost
Appendix G
Table 37 Computation for Economic Internal Rate of Return
for the Baybayog- Apanberang-Timbac Farm-to-
Market Road with Two Years Project Delay
Appendix G
Table 38 Computation for Economic Internal Rate of Return
for the Baybayog- Apanberang-Timbac Farm-to-
Market Road with 10% Decrease in Benefits, 10%
Increase in Cost and Two Years Project Delay
Appendix G
2011 SOCIO-ECONOMIC, FINANCIAL AND ENVIRONMENTAL ASSESSMENT OF THE
REHABILITATION OF BAYBAYOG-APANBERANG-TIMBAC FARM-TO-MARKET ROAD IN
BARANGAY CATTUBO, ATOK, BENGUET
Erro, M.E.G; Lumbres, A.G.B.; Sadili, D.R.A; Sale, E.K.A.
Page ix
LIST OF FIGURES
FIGURE
NUMBER
FIGURE TITLE
PAGE
NUMBER
Figure 1 Conceptual Framework for the Socio-Economic,
Financial, and Environmental Assessment of the
Road Rehabilitation Project in Atok, Benguet
10
Figure 2 Analytical Framework for the Socio-Economic,
Financial, and Environmental Assessment of the
Road Rehabilitation Project in Atok, Benguet.
12
Figure 3 General Approach for the Feasibility Study of the
Road Rehabilitation Project
14
Figure 4 Map of Atok
32
Figure 5 Sketch Map of Cattubo
33
Figure 6 Distribution of Male and Female Household
Members
51
Figure 7 Frequency Distribution of Male and Female
Household Members by Age Group
52
Figure 8 Distribution of Household Member’s Civil Status
53
Figure 9 Educational Attainment of the Household Population
54
Figure 10 Frequency Distribution of Household Members
According to their Occupation
55
Figure 11 Frequency Distribution of the Annual Income of the
Household Members
56
Figure 12 Religious Affiliations of the Household Members
57
Figure 13 Places Visited by Household Members
59
Figure 14 Frequency of Visit to Social Services and Facilities
60
Figure 15 Perceived Reduction in Travel Time
61
Figure 16 Average Travel Time (in hour) per Kilometer With
and Without the Project
62
2011 SOCIO-ECONOMIC, FINANCIAL AND ENVIRONMENTAL ASSESSMENT OF THE
REHABILITATION OF BAYBAYOG-APANBERANG-TIMBAC FARM-TO-MARKET ROAD IN
BARANGAY CATTUBO, ATOK, BENGUET
Erro, M.E.G; Lumbres, A.G.B.; Sadili, D.R.A; Sale, E.K.A.
Page x
Figure 17 Perceived Effects on the Traffic Volume/Pattern of
the Road Rehabilitation Project
63
Figure 18 Perceived Effects on the Traffic Accident on the Area
64
Figure 19 Income and Other Perceived Impacts on the
Community
65
Figure 20 Perceived Impact on Social and Daily Activity
Patterns
67
Figure 21 Perceived Impact on Sub-cultural Variation
68
Figure 22 Perceived Impact on Leisure and Cultural
Opportunities
69
Figure 23 Perceived Impacts on the Present Ethnicity of the
Road Rehabilitation Project
69
Figure 24 Distance of Household Respondents to Social
Services
72
Figure 25 Means of Transportation With and Without the
Project
73
Figure 26 Other Possible Social Benefits of the Road
Rehabilitation Project
75
Figure 27 Scenic Spots in Barangay Cattubo
89
Figure 28 Perceived Impact on the Aesthetic Quality of the
Area
90
Figure 29 Perceived Impact on Air Quality
91
Figure 30 Perceived Incidence of Soil Erosion
92
Figure 31 Perceived Flooding Incidence
93
Figure 32 Potential Health Hazards
94
2011 SOCIO-ECONOMIC, FINANCIAL AND ENVIRONMENTAL ASSESSMENT OF THE
REHABILITATION OF BAYBAYOG-APANBERANG-TIMBAC FARM-TO-MARKET ROAD IN
BARANGAY CATTUBO, ATOK, BENGUET
Erro, M.E.G; Lumbres, A.G.B.; Sadili, D.R.A; Sale, E.K.A.
Page xi
LIST OF PLATES
NUMBER TITLE
PAGE
NUMBER
Plate 1 Current Condition of Baybayog-Apanberang-Timbac
Road.
25
Plate 2 Identification of Road Project
Appendix H
Plate 3 Dialogue with the CHARM Officials
Appendix H
Plate 4 Leveling-off Training on Data Analyses
Appendix H
Plate 5 Hands-on Training
Appendix H
Plate 6 Benguet Provincial Capitol
Appendix H
Plate 7 Practicumers with Field Supervisors
Appendix H
Plate 8 Vegetable Terraces in Cattubo, Atok
Appendix H
Plate 9 Barangay Hall of Cattubo
Appendix H
Plate 10 Key Informant Interview
Appendix H
Plate 11 Municipal Hall of Atok
Appendix H
Plate 12 Data Gathering
Appendix H
Plate 13 Bayanihan of Farmers
Appendix H
Plate 14 Transportation of Vegetables to Market
Appendix H
Plate 15 Dinner with the Barangay Cattubo Officials
Appendix H
Plate 16 Data Processing
Appendix H
Plate 17 Secondary Data
Appendix H
Plate 18 Computation for Financial and Economic Analyses
Appendix H
Plate 19 Analysis of Financial Feasibility
Appendix H
Plate 20 Analysis of Economic Feasibility
Appendix H
2011 SOCIO-ECONOMIC, FINANCIAL AND ENVIRONMENTAL ASSESSMENT OF THE
REHABILITATION OF BAYBAYOG-APANBERANG-TIMBAC FARM-TO-MARKET ROAD IN
BARANGAY CATTUBO, ATOK, BENGUET
Erro, M.E.G; Lumbres, A.G.B.; Sadili, D.R.A; Sale, E.K.A.
Page xii
Plate 21 Preparation for Presentation in Benguet
Appendix H
Plate 22 Presentation of Report Output
Appendix H
Plate 23 Presentation of the Results and Discussion
Appendix H
Plate 24 Open Forum
Appendix H
Plate 25 Giving Token of Appreciation
Appendix H
2011 SOCIO-ECONOMIC, FINANCIAL AND ENVIRONMENTAL ASSESSMENT OF THE
REHABILITATION OF BAYBAYOG-APANBERANG-TIMBAC FARM-TO-MARKET ROAD IN
BARANGAY CATTUBO, ATOK, BENGUET
Erro, M.E.G; Lumbres, A.G.B.; Sadili, D.R.A; Sale, E.K.A.
Page xiii
LIST OF ACRONYMS
AAIGA- Agriculture, Agribusiness and Income Generating Activities
ADB- Asian Development Bank
BCR- Benefit- Cost Ratio
BENECO- Benguet Electric Cooperative Inc
BNRMP- Barangay Natural Resource Management Plan
CAR- Cordillera Administrative Region
CHARM- Cordillera Highland Agricultural Resource Management
CLUP- Comprehensive Land Use Plan
CWCFMA- Community Watershed Conservation, Forest Management and Agroforestry
DA- Department of Agriculture
DPWH- Department of Public Works and Highway
EIRR- Economic Internal Rate of Return
FACOMA- Farmer's Cooperative and Marketing Association
FIRR- Financial Internal Rate of Return
FMR- Farm-to-Market Road
HADP- Highland Agriculture Development Project
IFAD- International Fund for Agricultural Development
LGU- Local Government Unit
MAO- Municipal Agriculture Office
MENRO- Municipal Environment and Natural Resource Office
2011 SOCIO-ECONOMIC, FINANCIAL AND ENVIRONMENTAL ASSESSMENT OF THE
REHABILITATION OF BAYBAYOG-APANBERANG-TIMBAC FARM-TO-MARKET ROAD IN
BARANGAY CATTUBO, ATOK, BENGUET
Erro, M.E.G; Lumbres, A.G.B.; Sadili, D.R.A; Sale, E.K.A.
Page xiv
MSWD- Municipal Social and Welfare Development
NEDA- National Economic and Development Authority
NCIP- National Commission on Indigenous Peoples
NGO- Non-Government Organization
NIPAS- National Integrated Protected Area System
NPV- Net Present Value
NPW- Net Present Worth
NRM- Natural Resource Management
PMC- Project Management and Coordination
PPIP- Participatory Project Investment Plan
RHU- Rural Health Unit
RID- Rural Infrastructure Development
SCF- Standard Conversion Factor
SERF- Shadow Exchange Rate Factor
SI- Sensitivity Index
SMPIPLT- Social Mobilization, Participatory Investment Planning and Land Tilting
SWRF- Shadow Wage Rate Factor
VOC- Vehicle Operating Cost

2011 SOCIO-ECONOMIC, FINANCIAL AND ENVIRONMENTAL ASSESSMENT OF THE
REHABILITATION OF BAYBAYOG-APANBERANG-TIMBAC FARM-TO-MARKET ROAD IN
BARANGAY CATTUBO, ATOK, BENGUET
Erro, M.E.G; Lumbres, A.G.B.; Sadili, D.R.A; Sale, E.K.A.
Page 1
INTRODUCTION
2011 SOCIO-ECONOMIC, FINANCIAL AND ENVIRONMENTAL ASSESSMENT OF THE
REHABILITATION OF BAYBAYOG-APANBERANG-TIMBAC FARM-TO-MARKET ROAD IN
BARANGAY CATTUBO, ATOK, BENGUET
Erro, M.E.G; Lumbres, A.G.B.; Sadili, D.R.A; Sale, E.K.A.
Page 2
Background of the Study
Highland Agriculture Development Project (HADP) was funded by the
International Fund for Agriculture Development, and co-financed by Asian Development
Bank and the Philippine Government (Asian Development Bank, 1994). The project was
revised thrice to change the project scope and to respond to the effects of natural
calamities that happened during the project planning. The changes made contributed to
the high cost and difficulties in construction, and poor performance of the contractors.
Otherwise, the project was implemented according to the revised plan. The access of the
beneficiaries to market and services was improved as a result of infrastructure facilities
included under the project.
Based on HADP, the Cordillera Highland Agricultural Resource Management
(CHARM) project was conceptualized. CHARM was also co-financed by Asian
Development Bank, the Philippine Government and other beneficiaries. Its primary aim
was to increase average annual farm family incomes of indigenous communities through
agricultural productivity improvements and sustainable natural resource management
(NRM). The CHARM Project design was highly relevant to the needs of the targeted
communities. It adopted the participatory approach in conducting Participatory
Investment Planning as a management tool towards development (International Fund for
Agricultural Development, 2007). It was a basic step towards any development effort as
it provided the road maps in the development process. The project was effective and
contributed to the reduction of poverty in the project area (Asian Development Bank,
2011 SOCIO-ECONOMIC, FINANCIAL AND ENVIRONMENTAL ASSESSMENT OF THE
REHABILITATION OF BAYBAYOG-APANBERANG-TIMBAC FARM-TO-MARKET ROAD IN
BARANGAY CATTUBO, ATOK, BENGUET
Erro, M.E.G; Lumbres, A.G.B.; Sadili, D.R.A; Sale, E.K.A.
Page 3
2006). However, some issues were raised in the evaluation, and it was recommended to
have a follow-up project.
The Second Cordillera Highland Agricultural Resource Management (CHARM 2)
Project is a special project implemented by the Department of Agriculture. It is the
continuation of the CHARM 1 Project that was implemented in 1998 to 2004.
The Second Cordillera Highland Agricultural Resource Management (CHARM 2)
has five components:
a. Social Mobilization, Participatory Investment Planning and Land Tilting
(SMPIPLT)
The first component aims to promote active participation of the
communities which includes the target groups in planning; implementation; and
monitoring and evaluation of community development plans. It has two major
sub-components: 1) Community mobilization; and 2) Facilitation of Ancestral
Domain Tilting.
b. Community Watershed Conservation, Forest Management and Agroforestry
(CWCFMA)
This component aims to promote the rehabilitation of watersheds in the
target areas to enhance conservation of major watersheds in CAR considering that
the region is the watershed cradle of Northern Luzon; and to provide the
indigenous communities with opportunities to improve their socio-economic well-
being. Its sub-components are composed of: 1) Community watershed
conservation and reforestation; 2) Promotion of Agroforestry; 3) Development of
innovative watershed conservation.

2011 SOCIO-ECONOMIC, FINANCIAL AND ENVIRONMENTAL ASSESSMENT OF THE
REHABILITATION OF BAYBAYOG-APANBERANG-TIMBAC FARM-TO-MARKET ROAD IN
BARANGAY CATTUBO, ATOK, BENGUET
Erro, M.E.G; Lumbres, A.G.B.; Sadili, D.R.A; Sale, E.K.A.
Page 4
c. Agriculture, Agribusiness and Income Generating Activities (AAIGA)
It aims to improve the production of crops in the area through the use of
sustainable and ecologically friendly farming systems; promote agribusiness
improvement of value chains; and introduce or improve non-farm rural small
enterprises as income generating activities to increase family income in the target
communities.
d. Rural Infrastructure Development (RID)
RID aims to improve rural infrastructure essential for the promotion of
agricultural production and rural-based livelihood through mobilization of the
beneficiaries.
e. Project Management and Coordination (PMC)
The Project Support Office (PSO) shall assist in the coordination of the
project and management through the following sub-components: 1)
Operationalization of Project Management Structures; 2) Participatory Project
Planning Monitoring and Evaluation; 3) Strengthen Capacity and Effectiveness of
Project Staff; 4) Project Administration.
The CHARM II Project areas involved 170 barangays in 37 municipalities in six
provinces. It includes 32 barangays from Abra; 15 from Apayao; 35 from Benguet; 20
from Ifugao; 20 from Kalinga and 48 from Mountain Province.
2011 SOCIO-ECONOMIC, FINANCIAL AND ENVIRONMENTAL ASSESSMENT OF THE
REHABILITATION OF BAYBAYOG-APANBERANG-TIMBAC FARM-TO-MARKET ROAD IN
BARANGAY CATTUBO, ATOK, BENGUET
Erro, M.E.G; Lumbres, A.G.B.; Sadili, D.R.A; Sale, E.K.A.
Page 5
Rationale
One of the main components of CHARM2 is the Rural Infrastructure
Development (RID). RID focuses on four sub-components, namely: Farm-to-Market
Access, Community Irrigation, Domestic Water Supply, and Social Infrastructure.
Land is the most commonly used medium in transporting agricultural products,
especially in highland agriculture. The condition of the road, then, is imperative to the
transportation of various crops. Poor condition of roads in highland areas critically affects
the economy through high vehicle operating cost and long travel time. Crops that are
highly perishable are mostly affected in the long travel time which contributes to the loss
of income for the farmers.
NEDA reported that infrastructure development such as farm-to-market roads
stimulates economic growth through easier access to markets (NEDA Development
Advocacy Sheet, 2008). The rehabilitation of roads is perceived to reduce the average
travel time and vehicle operating cost. Moreover, it can result to an increase in rural
income in the project areas.
Objectives
The main objective of the study was to assess the social, economic, financial, and
environmental impacts of rehabilitation of Baybayog-Apanberang-Timbac Farm-to-
Market Road in Barangay Cattubo, Atok, Benguet.
Specifically, it aimed to:
Describe the biophysical, social, and economic conditions of the barangay;
Identify and quantify the capital investment and maintenance, and
operating cost of the proposed projects;

2011 SOCIO-ECONOMIC, FINANCIAL AND ENVIRONMENTAL ASSESSMENT OF THE
REHABILITATION OF BAYBAYOG-APANBERANG-TIMBAC FARM-TO-MARKET ROAD IN
BARANGAY CATTUBO, ATOK, BENGUET
Erro, M.E.G; Lumbres, A.G.B.; Sadili, D.R.A; Sale, E.K.A.
Page 6
Identify the benefits of the proposed projects;
Compare the benefits and the cost of the road project ;
Identify and assess other social and environmental impacts of the projects;
and
Provide conclusions and recommendations based on the findings of the
study.
Significance of the Project
The road rehabilitation project is significant, especially for the influenced farming
communities, in making the transportation of agricultural products from farm to market
easier and in reducing the travel time to ensure the freshness of their products. This will
ensure food security in the area to avoid hunger and poverty and will increase the
farmers’ income to support their own families. For the non-farming communities, the
road rehabilitation project can provide them quick access to different social
infrastructures and services in the influenced areas.
At the local and provincial government, the project is important because it can
help increase farm production, which in turn can lead to an increase in the local and
provincial funding for the development of their area. With the project, the local and
provincial government will strengthen their capacity in mobilization and improvement of
agricultural land security in the area.
The road rehabilitation project is also significant at the national level as
improvement in rural infrastructures can lead in uplifting the economy. Also, the
construction of farm-to-market roads will strengthen agricultural production not only in
the Cordilleras but in the entire country.

2011 SOCIO-ECONOMIC, FINANCIAL AND ENVIRONMENTAL ASSESSMENT OF THE
REHABILITATION OF BAYBAYOG-APANBERANG-TIMBAC FARM-TO-MARKET ROAD IN
BARANGAY CATTUBO, ATOK, BENGUET
Erro, M.E.G; Lumbres, A.G.B.; Sadili, D.R.A; Sale, E.K.A.
Page 7
The study will serve as baseline information for feasibility studies of other rural
infrastructure development of the CHARM projects.
Scope and limitations
The study was conducted in Barangay Cattubo, Atok, Benguet as previously
selected from the priority list of CHARM projects. Other road projects of the CHARM
were not included in the scope of the study area. The study focused on the social,
financial, economic, and environmental feasibility of the proposed road project. The
environmental aspect was only based on the perceptions of the respondents.
The study was conducted in 1 ½ -month’s time since the study team needed to
accomplish the requirements for graduation. The time frame for primary data gathering
allotted was limited due to this time constraint.
2011 SOCIO-ECONOMIC, FINANCIAL AND ENVIRONMENTAL ASSESSMENT OF THE
REHABILITATION OF BAYBAYOG-APANBERANG-TIMBAC FARM-TO-MARKET ROAD IN
BARANGAY CATTUBO, ATOK, BENGUET
Erro, M.E.G; Lumbres, A.G.B.; Sadili, D.R.A; Sale, E.K.A.
Page 8
GENERAL APPROACH
AND
METHODOLOGY

2011 SOCIO-ECONOMIC, FINANCIAL AND ENVIRONMENTAL ASSESSMENT OF THE
REHABILITATION OF BAYBAYOG-APANBERANG-TIMBAC FARM-TO-MARKET ROAD IN
BARANGAY CATTUBO, ATOK, BENGUET
Erro, M.E.G; Lumbres, A.G.B.; Sadili, D.R.A; Sale, E.K.A.
Page 9
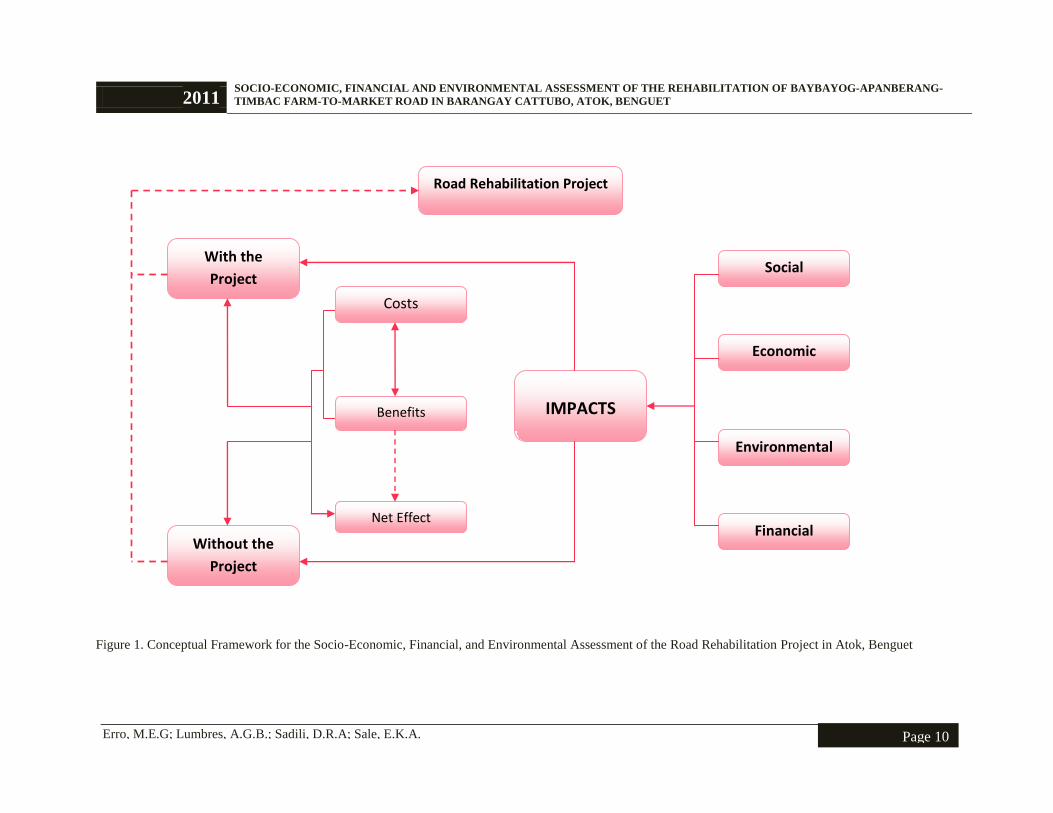
Conceptual Framework
Before starting a project such as construction or rehabilitation of roads, it
undergoes an assessment first. This is to determine whether the project will bring positive
impacts on the project location. It is a must to determine the costs and benefits so as to
decide on the implementation of the project.
Figure 1 shows the components for Socio-Economic, Financial, and
Environmental Assessment of the farm-to-market road in Atok, Benguet. The impacts of
the project were categorized into four groups; social, economic, financial, and
environmental. Each group was given specific indicators that will help in measuring the
probable impacts of the road rehabilitation project. Moreover, the possible scenarios of
with and without the project for each group were identified. After which, the costs and
benefits of with and without the project were quantified thus determining the net effect of
the project. After the gathering of all the necessary data following the framework,
analysis was made.
2011 SOCIO-ECONOMIC, FINANCIAL AND ENVIRONMENTAL ASSESSMENT OF THE REHABILITATION OF BAYBAYOG-APANBERANG-
TIMBAC FARM-TO-MARKET ROAD IN BARANGAY CATTUBO, ATOK, BENGUET
Erro, M.E.G; Lumbres, A.G.B.; Sadili, D.R.A; Sale, E.K.A.
Page 10
Figure 1. Conceptual Framework for the Socio-Economic, Financial, and Environmental Assessment of the Road Rehabilitation Project in Atok, Benguet
Road Rehabilitation Project
Without the
Project
With the
Project
Financial
Environmental
IMPACTS
Economic
Social
Costs
Benefits
Net Effect
2011 SOCIO-ECONOMIC, FINANCIAL AND ENVIRONMENTAL ASSESSMENT OF THE
REHABILITATION OF BAYBAYOG-APANBERANG-TIMBAC FARM-TO-MARKET ROAD IN
BARANGAY CATTUBO, ATOK, BENGUET
Erro, M.E.G; Lumbres, A.G.B.; Sadili, D.R.A; Sale, E.K.A.
Page 11
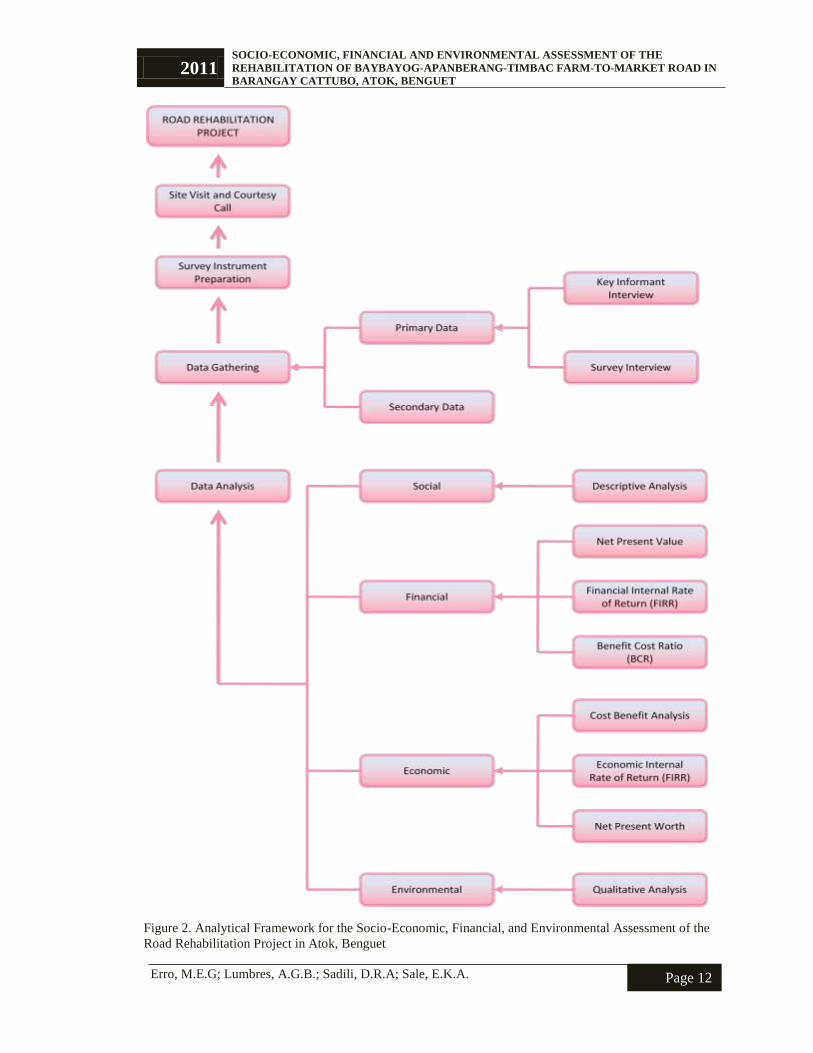
Analytical Framework
Figure 2 illustrates how the assessment proceeded. Initial site visit and courtesy
call were conducted first. Then, the preparation for the data gathering instrument
employed in the study was done. These were the interview schedule and survey
questionnaire. After which, data gathering was conducted. There were two major data
gathered, the primary and secondary data. Primary data were gathered from key
informant interviews and survey, while secondary data were obtained from existing
records coming from different agencies involved in the project.
After all the data were gathered, data analysis was made. Data were divided into
subgroups; social, economic, financial, and environmental. For each subgroup, there were
corresponding data analyses used. For the social domain, descriptive analysis was used.
As for the financial aspect, net present value, financial internal rate of return, and benefit
cost ratio analysis were computed. Economic data were then analyzed through cost-
benefit analysis, economic internal rate of return, and net present worth. The
environmental data gathered were analyzed through qualitative analysis since
environmental impacts are hard to quantify.
The economic and financial subgroups were analyzed quantitatively as they can
be measured easily in terms of numbers. Social and environmental impacts were analyzed
qualitatively since more often the data gathered from these domains cannot be easily
quantified. These mentioned data analysis methods were the most efficient and effective
for the assessment of the road rehabilitation project.
2011 SOCIO-ECONOMIC, FINANCIAL AND ENVIRONMENTAL ASSESSMENT OF THE
REHABILITATION OF BAYBAYOG-APANBERANG-TIMBAC FARM-TO-MARKET ROAD IN
BARANGAY CATTUBO, ATOK, BENGUET
Erro, M.E.G; Lumbres, A.G.B.; Sadili, D.R.A; Sale, E.K.A.
Page 12
Figure 2. Analytical Framework for the Socio-Economic, Financial, and Environmental Assessment of the
Road Rehabilitation Project in Atok, Benguet

2011 SOCIO-ECONOMIC, FINANCIAL AND ENVIRONMENTAL ASSESSMENT OF THE
REHABILITATION OF BAYBAYOG-APANBERANG-TIMBAC FARM-TO-MARKET ROAD IN
BARANGAY CATTUBO, ATOK, BENGUET
Erro, M.E.G; Lumbres, A.G.B.; Sadili, D.R.A; Sale, E.K.A.
Page 13
Study Approach
The study approach followed an input-process-output framework. The inputs were
the resources utilized to perform specific tasks or the outputs from the activities under
taken that were employed for the next segment of the project. Processes were the
activities performed in order to obtain the desired outcome while outputs were the
physical outcomes of the project activities. These three elements were important to
ensure that the objective of the study was accomplished.
Figure 3 is a representation of the study approach from initial site visit up to the
revision of the final report.

2011 SOCIO-ECONOMIC, FINANCIAL AND ENVIRONMENTAL ASSESSMENT OF THE
REHABILITATION OF BAYBAYOG-APANBERANG-TIMBAC FARM-TO-MARKET ROAD IN
BARANGAY CATTUBO, ATOK, BENGUET
Erro, M.E.G; Lumbres, A.G.B.; Sadili, D.R.A; Sale, E.K.A.
Page 14
INPUT PROCESS OUTPUT
Figure 3. General Approach for the Feasibility Study of the Road Rehabilitation Project
CHARM Data about the Road Project
Document Review/Dialogues/Field
Visits
Knowledgeable Study Team
Terms of Reference/ Study Proposal
Preparation of LGU Profile and Project
Information Sheets/ Calendar of Activities/ Formation of Survey instrument/ Guide
Questionnaire
Final Form of LGU
Profile and Project Information Sheets
Finalized Calendar of Activities/ Survey
Instrument/ Guide Questionnaire
Accomplished LGU Profile and Project Information Sheets
Training on Data Analyses
Skilled Study Team
Survey Instrument Field interviews/ Key Informant Interview
Completed/ Accomplished Survey
Instrument
Raw Data from Field interview/ Key Informant
Interview Data Processing Consolidated Data
Processed Data by Component
Analysis of Data Component
Draft Assessment Report
Draft Report Report Presentation to LGUs and DA officials
Comments on the Report
List of Comments Revision of Draft Report Final Report
2011 SOCIO-ECONOMIC, FINANCIAL AND ENVIRONMENTAL ASSESSMENT OF THE
REHABILITATION OF BAYBAYOG-APANBERANG-TIMBAC FARM-TO-MARKET ROAD IN
BARANGAY CATTUBO, ATOK, BENGUET
Erro, M.E.G; Lumbres, A.G.B.; Sadili, D.R.A; Sale, E.K.A.
Page 15
Data and data sources
The socio-economic, financial and environmental assessment of the rehabilitation
of Baybayog-Apanberang-Timbac Farm-to-Market Road at Cattubo, Atok, Benguet used
primary and secondary data as main sources of information.
Primary Data
a. Population of the Study
“In 2009, Barangay Cattubo has a household number of 567 with the total
population of 2,727. The total population is composed of 1,413 males and 1,314 females.
The barangay covering 2,414 hectares of land has an appropriated density of 1.13 persons
per hectares. It has an average household size of 4.8” (Draft Barangay Cattubo Profile,
2010).
The influence areas of the project which includes Barangay Natubleng, Buguias
and Barangay Pacso, Kabayan, have a total household number of 520 and 240,
respectively. Barangay Natubleng has a total population of 2,351 and an average
household size of 5 (Barangay Profile of Natubleng Executive Summary, 2011).
Barangay Pacso, on the other hand, has a total population of 1,220 and an average
household size of 5.08 (Draft Participatory Project Investment Plan of Barangay Pacso,
2011-2015).
b. Sampling Size
Fifty households were used as the sampling size as greater than 30 is statistically
acceptable to represent the population. Purposive sampling was used to determine the
selected household samples. It is a technique that involves taking a random sample of a
2011 SOCIO-ECONOMIC, FINANCIAL AND ENVIRONMENTAL ASSESSMENT OF THE
REHABILITATION OF BAYBAYOG-APANBERANG-TIMBAC FARM-TO-MARKET ROAD IN
BARANGAY CATTUBO, ATOK, BENGUET
Erro, M.E.G; Lumbres, A.G.B.; Sadili, D.R.A; Sale, E.K.A.
Page 16
small number of units from a larger population (Kemper et al., 2003 as cited by Teddlie
et al., 2007).
On the other hand, key informants were purposively selected based on their
relevance to the study.
Secondary data
The sources of secondary data included the CHARM, Local Government Unit
from the barangay up to the provincial level, internet, thesis, previous practicum reports,
and books related to the study. Project information sheet and LGU profile sheet (See
Appendix D) were used to gather significant secondary data from the local government
office and from CHARM.
Data Collection
a. Key Informant Interview
Key informant interview was vital in extracting qualitative data that are
significant to the study. This method was used to verify secondary data on the field. Key
informants were chosen based on three aspects of the study such as economic, social, and
environment. The economic aspect included the MAO department head, and the
municipal engineer; the social aspect was the concern of MSWD department head; while
the environmental aspects came from the MENRO department head. Guide questions
(See Appendix B) were utilized for the key informant interviews.
b. Interview-schedule
An interview-schedule was conducted for the households through the use of a
survey form (See Appendix C). The survey form is divided into seven sections such as
2011 SOCIO-ECONOMIC, FINANCIAL AND ENVIRONMENTAL ASSESSMENT OF THE
REHABILITATION OF BAYBAYOG-APANBERANG-TIMBAC FARM-TO-MARKET ROAD IN
BARANGAY CATTUBO, ATOK, BENGUET
Erro, M.E.G; Lumbres, A.G.B.; Sadili, D.R.A; Sale, E.K.A.
Page 17
demographic profile, passenger related-information, freight related- information, socio-
cultural impact information, environmental (public health and safety) impacts
information, and benefits information.
Data Analysis
Social
To determine the social impacts of the proposed farm-to-market road in the
municipality of Atok, descriptive analysis was used.
Descriptive Analysis
Descriptive analysis was used in explaining non-quantifiable data that were
derived from key informants’ and respondents’ descriptive responses. It is a qualitative
way of presenting information for the social impacts.
Financial
Benefit cost ratio (BCR), financial internal rate of return (FIRR) and net present
value (NPV) were utilized in analyzing the financial aspect of the road rehabilitation
project as components of the financial benefit-cost analysis. “The purpose of the financial
benefit-cost analysis is to assess the financial viability of the proposed project whether it
is financially attractive or not. In this, the unit of analysis is the project and not the entire
economy” (ADB, 2006).
Benefit-Cost Ratio
The benefit cost ratio is defined as the ratio of the possible gains that would be
provided by the project over the projected cost of proposed project. A result greater than
2011 SOCIO-ECONOMIC, FINANCIAL AND ENVIRONMENTAL ASSESSMENT OF THE
REHABILITATION OF BAYBAYOG-APANBERANG-TIMBAC FARM-TO-MARKET ROAD IN
BARANGAY CATTUBO, ATOK, BENGUET
Erro, M.E.G; Lumbres, A.G.B.; Sadili, D.R.A; Sale, E.K.A.
Page 18
one reflects that the project is beneficial, while a result less than one reflects that the
project is costly. Benefit-cost ratio was computed as:
BCR = Total Financial Benefits
Total Financial Costs
Net Present Value and Financial Rate of Return
NPV and FIRR were used to determine “the profitability of the road project. “The
difference between the present value of cash inflows and the present value of cash
outflows equates to NPV. NPV is sensitive to the reliability of future cash inflows that
the project will yield” (Investopedia, 2010). On the other hand, FIRR is the discount rate
at which the present value of the net benefit stream in financial terms becomes zero”
(ADB, 2006). These were measured in monetary terms through comparison of with and
without the road project scenarios. The NPV and FIRR were computed using the
formulas:
NPV =
Where: i –Discount Rate (15%)
t –time (in years)
FIRR
NPV= 0
0 =
Where: t –time (in years)
Economic
Subsequent to the analysis of financial viability of the project, the data were
analyzed for its economic viability. In economic analysis, the true value to the society of
2011 SOCIO-ECONOMIC, FINANCIAL AND ENVIRONMENTAL ASSESSMENT OF THE
REHABILITATION OF BAYBAYOG-APANBERANG-TIMBAC FARM-TO-MARKET ROAD IN
BARANGAY CATTUBO, ATOK, BENGUET
Erro, M.E.G; Lumbres, A.G.B.; Sadili, D.R.A; Sale, E.K.A.
Page 19
the project can be showed. The financial values used for the financial analysis were
converted into economic values through shadow-pricing of the project inputs or through
the standard conversion factor (ADB, 2006).
Benefit-Cost Ratio
The initial step done was the identification of economic cost and benefit. In
economic benefit-cost analysis, two important principles are to be followed (ADB, 2006).
First is the comparison of the situation with the project and the situation without the
project. Second is the distinction between non-incremental and incremental inputs, and
non-incremental and incremental outputs. Compared to the financial benefit-cost ratio
which is concerned with the project unit, economic benefit-cost ratio is concerned with
the entire economy. The formula used for economic benefit-cost ratio was:
BCR = Total Economic Benefits
Total Economic Costs
Net Present Worth
Net Present Worth is defined as the difference between the present worth of all
cash inflows and outflows of a project. This method of analysis allows the selection of
the most economically sound project from a list of more than one alternative. The
formula used to compute for the NPW was:
NPW =
Where: i –Discount Rate (15%)
t –time (in years)
Economic Internal Rate of Return

2011 SOCIO-ECONOMIC, FINANCIAL AND ENVIRONMENTAL ASSESSMENT OF THE
REHABILITATION OF BAYBAYOG-APANBERANG-TIMBAC FARM-TO-MARKET ROAD IN
BARANGAY CATTUBO, ATOK, BENGUET
Erro, M.E.G; Lumbres, A.G.B.; Sadili, D.R.A; Sale, E.K.A.
Page 20
IRR is the primary measure of the value of investment. EIRR is the discount rate
base on the economy which equates the net present worth of all cash flows of the project
to zero. The EIRR was computed using the formula:
EIRR
NPW= 0
0 =
Where: t –time (in years)
Conversion of Financial to Economic
Financial prices were converted to economic prices using standard conversion
factors for wage rates and exchange rates. Table 1 shows the computed standard
conversion factors.
Table 1. Standard Conversion Factors
Items Conversion Factor Used Conversion Value
Unskilled Labor Shadow Wage Rate 0.92
Skilled Shadow Wage Rate 1.00
All Other Inputs and
Outputs Standard Conversion Factor 0.98
The standard conversion factor using wage rates was used in converting unskilled
labor costs from financial to economic prices for the capital investment and working
capital. On the other hand, the cost of materials (supplies and equipment) for both the
capital investment and working capital used the exchange rates standard conversion
factor.

2011 SOCIO-ECONOMIC, FINANCIAL AND ENVIRONMENTAL ASSESSMENT OF THE
REHABILITATION OF BAYBAYOG-APANBERANG-TIMBAC FARM-TO-MARKET ROAD IN
BARANGAY CATTUBO, ATOK, BENGUET
Erro, M.E.G; Lumbres, A.G.B.; Sadili, D.R.A; Sale, E.K.A.
Page 21
Environmental
Environmental impact of the project was examined through a qualitative analysis.
Questions about the possible impacts of the road rehabilitation to the environment were
included in the survey, along with the collection of other primary data. Qualitative
analysis was used since environmental impacts were hard to measure quantitatively.

2011 SOCIO-ECONOMIC, FINANCIAL AND ENVIRONMENTAL ASSESSMENT OF THE
REHABILITATION OF BAYBAYOG-APANBERANG-TIMBAC FARM-TO-MARKET ROAD IN
BARANGAY CATTUBO, ATOK, BENGUET
Erro, M.E.G; Lumbres, A.G.B.; Sadili, D.R.A; Sale, E.K.A.
Page 22
RESULTS AND DISCUSSION

2011 SOCIO-ECONOMIC, FINANCIAL AND ENVIRONMENTAL ASSESSMENT OF THE
REHABILITATION OF BAYBAYOG-APANBERANG-TIMBAC FARM-TO-MARKET ROAD IN
BARANGAY CATTUBO, ATOK, BENGUET
Erro, M.E.G; Lumbres, A.G.B.; Sadili, D.R.A; Sale, E.K.A.
Page 23
PROJECT PROFILE
Project Title: Baybayog- Apanberang- Timbac Farm-to-Market Road Improvement
Location: Cattubo, Atok, Benguet
Proponent/ Implementing Agency: Municipal Engineers Office- Atok, Benguet
Estimated Project Cost: Php. 8,360,043.30
Source of Fund: ADB Loan Proceeds
DA-CAR = 40%
LGU - Municipality of Atok
- Benguet Province = 60%
Project Profile:
The proposed project was identified by the community as the top priority among
other identified projects during the barangay/ community assembly, and through series of
planning conducted at the barangay hall of Cattubo, Atok, Benguet in coordination and
assistance of the provincial and municipal working group and other national line agencies
such as the DA-CHARMP 2, NCIP, NGO, Barangay officials and other stakeholders.
The proposed project subject for improvement is a farm-to-market road (FMR)
utilized by farmers in the area that needs improvement due to its present poor condition
which is muddy and slippery especially during rainy season. Hence, as a result, farmers
in the area find difficulty in transporting their farm inputs as well as farm produced to and
from the market. More so, they spend more on hauling cost and transportation expenses.
Vegetables being planted and harvested are cabbages, potatoes, peas, carrots, radish,
Chinese cabbage and other highland vegetables. Likewise, farm inputs used in the farm
being hauled are chicken manure and organic/inorganic fertilizers and others.
2011 SOCIO-ECONOMIC, FINANCIAL AND ENVIRONMENTAL ASSESSMENT OF THE
REHABILITATION OF BAYBAYOG-APANBERANG-TIMBAC FARM-TO-MARKET ROAD IN
BARANGAY CATTUBO, ATOK, BENGUET
Erro, M.E.G; Lumbres, A.G.B.; Sadili, D.R.A; Sale, E.K.A.
Page 24
The improvement or maintenance made along the road stretch were minimal due
to insufficient resources of the local government unit and considering also the various
roads and other infrastructure facilities being attended by the local government.
The proposed project entails the improvement of Baybayog- Apanberang- Timbac
farm-to-market road consisting of four kilometers length and 3 to 3.5 meters wide.
Although, the existing improvements made were concrete pavement/ tire path with total
length of 525 meters, other improvements are still needed on the road.
DESCRIPTION OF THE PROJECT AREA
Location of the Project
The Baybayog-Apanberang-Timbac farm-to-market road is located at Sitio
Calasipan, Barangay Cattubo, Atok, Benguet Province. It traversed farm lots from three
sitios in the barangay namely Timbac, Apanberang, and Calasipan. It was identified as
the top priority among the lists of projects for Barangay Cattubo based on the series of
participatory planning conducted in the barangay. The road existed for more than ten
years and served as a short cut way for residents of Baybayog, an alternate route going to
Pacso, Kabayan which is a neighboring barangay, and an alternate access road when
portions along Halsema Highway, particularly between kilometer 55 to kilometer 60 were
closed due to slides and traffic (Project Proposals, 2010).
Existing Road Condition
The Baybayog-Apanberang-Timbac farm-to-market road was generally unpaved,
narrow, tortuous, and rugged. There were portions that were already cemented or made as

2011 SOCIO-ECONOMIC, FINANCIAL AND ENVIRONMENTAL ASSESSMENT OF THE
REHABILITATION OF BAYBAYOG-APANBERANG-TIMBAC FARM-TO-MARKET ROAD IN
BARANGAY CATTUBO, ATOK, BENGUET
Erro, M.E.G; Lumbres, A.G.B.; Sadili, D.R.A; Sale, E.K.A.
Page 25
tire path which when combined represent only 13 % of the total length of road. From the
ocular visit conducted, no fencing, road signs, and riprap were found on the peripheral of
the road. (Plate 1)
Plate 1. Current Condition of Baybayog-Apanberang-Timbac Road
Engineer Ernesto Dela Torre, the municipal engineer of Atok, described the road
as passable but uncomfortable to traverse. The road restricted the kind of vehicles that
can pass through it. More so, Barangay Chairman Eduard Beliano said that the road is
very risky especially during typhoon.
Barangay Served
Based from the interviews of key informants and from the use of Barangay
Cattubo road map, the identified directly influenced areas were Barangay Cattubo, Atok,
2011 SOCIO-ECONOMIC, FINANCIAL AND ENVIRONMENTAL ASSESSMENT OF THE
REHABILITATION OF BAYBAYOG-APANBERANG-TIMBAC FARM-TO-MARKET ROAD IN
BARANGAY CATTUBO, ATOK, BENGUET
Erro, M.E.G; Lumbres, A.G.B.; Sadili, D.R.A; Sale, E.K.A.
Page 26
Barangay Natubleng, Buguias and Barangay Pacso, Kabayan. The barangay chairman of
Cattubo Mr. Eduard Beliano said that 40% of the total household population of Atok will
be the potential users of the Baybayog-Apanberang-Timbac farm-to-market road. This
included residents from Timbac, Apanberang, and Calasipan. According to Mr. Camotiao
Alinso Jr., the barangay chairman of Natubleng, only 35% of the total household
population will use the farm-to-market road. But this will gradually increase through
time. In Barangay Pacso, Barangay Chairman Cipriano Baucas estimated that about 60%
of the total household population as potential users of the road.
Aside from the identified influenced areas, there were also other indirectly
influenced barangays that can be possible users of the road. Some of these barangays
were Barangay Gusaran, Kabayan Barrio, Kabayan Poblacion, and others.
Proposed Improvements
In accordance with the project proposal forwarded to CHARM DA-CAR, the
proposed improvements included the following:
1. Construction of about 500 meters concrete pavement specially along curve
sections of the road;
2. Construction of about 1.1 km. concrete tire path along other road sections;
3. Construction of drainage canal and cross drainage canal;
4. Construction of riprap and slope protection;
5. Construction of “waiting bay” considering that most of the road sections are
narrow with 3 meters wide and about 60 to 80 degrees elevation; and

2011 SOCIO-ECONOMIC, FINANCIAL AND ENVIRONMENTAL ASSESSMENT OF THE
REHABILITATION OF BAYBAYOG-APANBERANG-TIMBAC FARM-TO-MARKET ROAD IN
BARANGAY CATTUBO, ATOK, BENGUET
Erro, M.E.G; Lumbres, A.G.B.; Sadili, D.R.A; Sale, E.K.A.
Page 27
6. Gravelling of about 1.875 km. along other sections of the road with almost flat
elevation; and
7. Other improvement needed shall be determined upon actual inspection and
preparation of detailed engineering design.
Historical Background
Province of Benguet
Before the colonization of Spaniards, inhabitants of Benguet lived in the Southern
Cordillera mountain range, sea coasts of Ilocos Sur, Pangasinan and La Union, and in the
early trading centers of Ituy in northern plains of Luzon. People then, wandered for a
place suitable for hunting, rich in resources, and a place for barter and trade. As reported
in genealogical histories, the earliest settlements included the following twin settlements:
Chuco and Tonglo in Baguio-Tuba; Darew and Palaypay in Kapangan-Tublay; Imbose
and Amlimay in Kabayan-Buguias; and Namiligan and Palatang in Mankayan-Bakun.
The gold and copper settlement working sites were located at Pancutcutan, Acupan,
Apaiao, Penas and Locjo, all over Benguet. The centers of barter and trade between the
people in highland and lowland of Northern Luzon were located in Ituy, presently known
as Aritao in Nueva Viscaya, Tagudin and Vigan in Ilocos, and Manaoag and Lingayen in
Pangasinan. Products of Benguet comprised gold, copper, iron, honey, and bees wax.
These were traded for lowland products which included salt, livestock, cotton clothing or
blankets, and wares from other countries. Aside from the materials and food items, slaves
were also traded during this period.
The name “Benguet” came from the western colonizers who mispronounced the
word “benget” because of the western accent. “Benget” is the cloth coverings wrapped
2011 SOCIO-ECONOMIC, FINANCIAL AND ENVIRONMENTAL ASSESSMENT OF THE
REHABILITATION OF BAYBAYOG-APANBERANG-TIMBAC FARM-TO-MARKET ROAD IN
BARANGAY CATTUBO, ATOK, BENGUET
Erro, M.E.G; Lumbres, A.G.B.; Sadili, D.R.A; Sale, E.K.A.
Page 28
several time around the head of people living in La Trinidad. It was used as a protection
from searing cold and winds. Eventually, “Benguet” became a general reference of the
people to the territories.
Municipality of Atok
Municipality of Atok houses the main source of the Amburayan River, which
waters the fields of three barangays –Pasdong, Naguey, Poblacion. The river also waters
some parts of Municipality of Kapangan and La Union. Along the river were early
settlements with interesting stories. By word of mouth, the story about the two-headed
snake named “Balatek” became known to the people of Atok and other neighboring
towns. The two-headed snake which caused the death of many people was killed by the
inhabitants of Atok through the use of “vat and fire”. Other stories such as banditry and
cattle rusting were also known to the people. It is believed that the leader of the bandit-
rustlers named Chamikday was also killed by the residents of Atok.
During the World War II, Atok became the venue of battles between the guerilla
of the 66th
infantry battalion and the Japanese Imperial Army. The guerillas hide along
the Halsema Road as they waited for the Japanese army. The intrusion of the guerillas
resulted casualties to the men of General Yamashita. The 66th
infantry was then called to
reinforce the Filipino soldiers in Ilocos Sur. Atok was named as the “Vanguard of
Freedom” because of this historical event.
The early residents of Atok originated from two settlements –the agriculturists
and the miners. The first settlers were known as the agriculturists since they lived along
the river banks, and cultivated rice, camote, root crops and vegetables. The second
settlers were known as the miners but later on shifted to agriculture. Agriculture in the

2011 SOCIO-ECONOMIC, FINANCIAL AND ENVIRONMENTAL ASSESSMENT OF THE
REHABILITATION OF BAYBAYOG-APANBERANG-TIMBAC FARM-TO-MARKET ROAD IN
BARANGAY CATTUBO, ATOK, BENGUET
Erro, M.E.G; Lumbres, A.G.B.; Sadili, D.R.A; Sale, E.K.A.
Page 29
area was when colonizers came in the country. Spaniards introduced coffee production,
while the Americans intensified the production of different crops. After World War II,
large scale farming was introduced at Barangay Paoay by Chinese businessmen. This has
enticed the farmers because of its economic returns.
The municipality is presently inhabited by Igorots particularly the Ibalois and the
Kankana-eys. The Ibalois were migrants from the Municipality of Kabayan. Most of the
Ibalois settled in the low-lying barangays of Pasdong, Naguey, Poblacion, Lower Abiang,
and Caliking. The Kankana-eys, on the other hand settled in the high-elevated Barangays
of Cattubo, Paoay, Upper Abiang, and Upper Tobiac. This explains why the people in
Atok can speak two dialects.
On November 22, 1900, Atok was declared as a municipality. It was considered
as the most important historical event to the Local Government Unit.
Barangay Cattubo
The name CATTUBO was formed from the acronym of the six sitios of the
barangay, namely: Calasipan, Apanberang, Timbac, Tulodan, Botiao, and Oyusan. The
name also originated from the word Cattubo which means young. Barangay Cattubo was
previously a part of Barangay Paoay. On January 21, 1972 by virtue of Municipal
Ordinance No. 08, and on February 29, 1972 by virtue of Benguet Resolution No. 198,
Cattubo was declared as a separate barangay. Barangay Cattubo was born out of
separation of the five sitios of Paoay.
According to the elders, the ancestors of the people living in Cattubo came from
the Municipalities of Tinoc, Buguias, Kabayan, Palatang, and Kibungan. The people from
the different municipalities wandered for a permanent settlement that can be suitable for

2011 SOCIO-ECONOMIC, FINANCIAL AND ENVIRONMENTAL ASSESSMENT OF THE
REHABILITATION OF BAYBAYOG-APANBERANG-TIMBAC FARM-TO-MARKET ROAD IN
BARANGAY CATTUBO, ATOK, BENGUET
Erro, M.E.G; Lumbres, A.G.B.; Sadili, D.R.A; Sale, E.K.A.
Page 30
agriculture until they found their “boton” in the mountain of Atok. The original settlers
were Wala and Decmaney, Socpoten, Capan, Pingi and Tindaan, Balicdang, Angdas,
Ngolob, Kiling, Basatan, Umod, Dapyawen, and Tikyaw. During the aftermath of World
War II, the population began to increase as people from Abiang, Pasdong, and other
nearby municipalities migrated to Cattubo.
In 1910 to 1915, the first American type of vehicle was used to transport goods
and people to and from Baguio City. The old folks locally called the vehicle, “Tungabel”.
After the Tungabel, Dangwa Tranco was used for transportation.
In 1917, during the American colonization, inhabitants of Cattubo were required
to get cedula from the Municipal Hall located in Sayangan.
In 1936, a Turkish named Cairus conducted a survey of trees for lumber, after
which, lumber concession and road opening started. It was followed by vegetable
gardening in 1938. In 1946, a certain Alfredo Alumno, one of the first settlers in the sitio,
started vegetable gardening at Calasipan. He was the first to produce potato in the
barangay in 1948. The same year, the FACOMA started shipping vegetables to Manila. It
was also during this time that farmers started terracing their uma (garden).
To improve literacy of children, Mr. Malameon established the Calasipan
Elementary School in the barangay while the Tulodan Elementary School was established
years later in 1968.
In 1955 to 1957, the logging concession of Cairus stopped and the road from
Halsema to Tulodan was made passable. Migrants from Pasdong started vegetable
gardening at Calasipan, Oyusan, Timbac, and Apanberang. It was also during this period
that Chinese migrants started to rent lands for vegetable gardening.
2011 SOCIO-ECONOMIC, FINANCIAL AND ENVIRONMENTAL ASSESSMENT OF THE
REHABILITATION OF BAYBAYOG-APANBERANG-TIMBAC FARM-TO-MARKET ROAD IN
BARANGAY CATTUBO, ATOK, BENGUET
Erro, M.E.G; Lumbres, A.G.B.; Sadili, D.R.A; Sale, E.K.A.
Page 31
In 1996 and 1997, the Barangay Hall and the Oyusan Primary School building
were constructed with the help of concerned agencies. In 1999, the Day Care Center was
constructed at Tulodan.
Barangay Cattubo was covered by the Highland Agricultural Development
Project (HADP) after the 1990 earthquake. Subsequently in 1997, Cattubo was also
covered by the First Cordillera Highland Agricultural Resource Management Project
(CHARM 1).
Biophysical Characteristics
Province of Benguet
Benguet lies southernmost in the Cordillera Administrative Region with Mountain
Province on the north, Pangasinan on the south, Ifugao and Nueva Viscaya on the east,
and La Union and Ilocos Sur on the west. It has an estimated land area of 253,244 to
293,000 hectares based on the on-going boundary settlements claims with nearby
provinces and among municipalities. Moreover, the province serves as a gateway to
Baguio City and other Cordillera Provinces.
Municipality of Atok
The municipality of Atok is geographically located at the central portion of
Benguet Province, on coordinates at 16030’ to 16
042’ latitude and 120
038’ to 120
047’
longitude. It is bounded on the west by Kapangan, on the south by Tublay, on the north
by Kibungan and Buguias and on the east by Kabayan and Bokod.

2011 SOCIO-ECONOMIC, FINANCIAL AND ENVIRONMENTAL ASSESSMENT OF THE
REHABILITATION OF BAYBAYOG-APANBERANG-TIMBAC FARM-TO-MARKET ROAD IN
BARANGAY CATTUBO, ATOK, BENGUET
Erro, M.E.G; Lumbres, A.G.B.; Sadili, D.R.A; Sale, E.K.A.
Page 32
Figure 4. Map of Atok
Atok has a total land area of 21,912 hectares which represents 8.73% of the total
land area of Benguet. It is divided into eight Barangays namely Abiang, Caliking,
Cattubo, Naguey, Paoay, Pasdong, Poblacion, and Topdac. Barangay Poblacion, with a
total land area of 4426 hectares representing 20.20% of the total land area in Atok, is the
largest barangay in terms of geographical size. On the other hand, Barangay Naguey,
with 1635 hectares representing 7.46% of the total land area in Atok, is smallest in size.
Barangay Cattubo
Geographical Location
Barangay Cattubo is in the northernmost part of the municipality of Atok. It is
bounded on the north by Municipality of Buguias and Kibungan, on the east by
Municipality of Kabayan, on the west by Barangay Pasdong, and on the south by
Barangay Paoay. It is accessible through land transportation via the Halsema highway.
2011 SOCIO-ECONOMIC, FINANCIAL AND ENVIRONMENTAL ASSESSMENT OF THE
REHABILITATION OF BAYBAYOG-APANBERANG-TIMBAC FARM-TO-MARKET ROAD IN
BARANGAY CATTUBO, ATOK, BENGUET
Erro, M.E.G; Lumbres, A.G.B.; Sadili, D.R.A; Sale, E.K.A.
Page 33
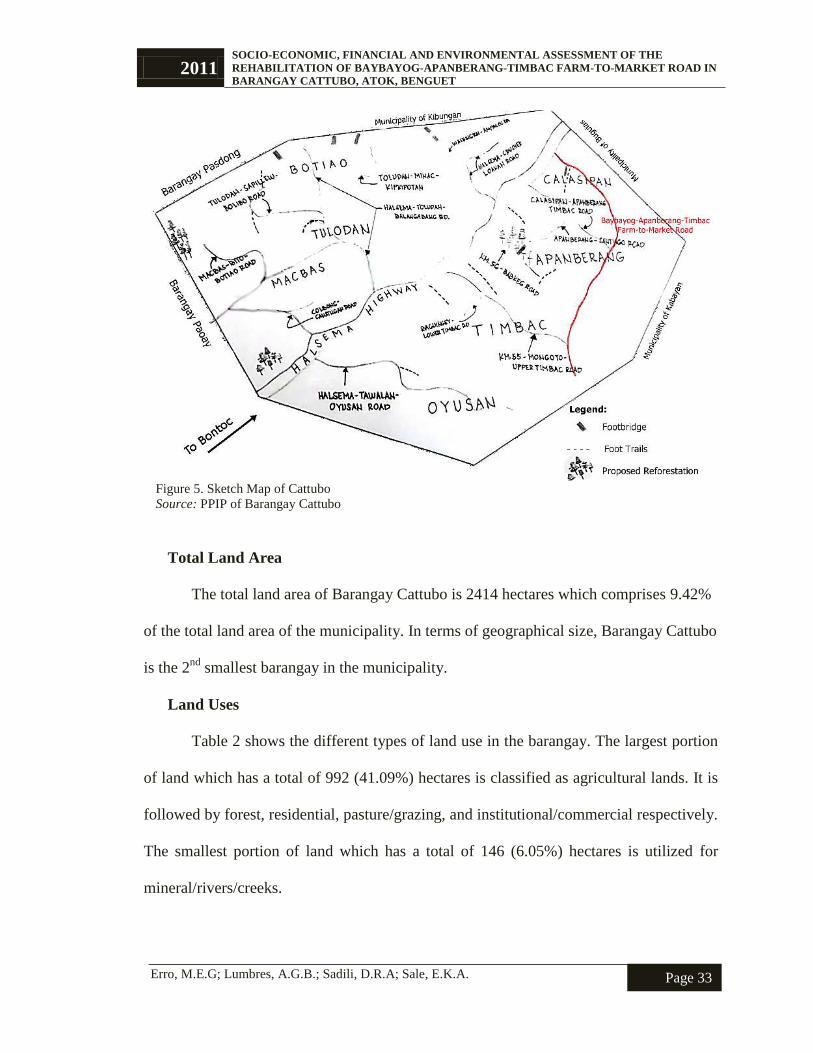
Figure 5. Sketch Map of Cattubo
Source: PPIP of Barangay Cattubo
Total Land Area
The total land area of Barangay Cattubo is 2414 hectares which comprises 9.42%
of the total land area of the municipality. In terms of geographical size, Barangay Cattubo
is the 2nd
smallest barangay in the municipality.
Land Uses
Table 2 shows the different types of land use in the barangay. The largest portion
of land which has a total of 992 (41.09%) hectares is classified as agricultural lands. It is
followed by forest, residential, pasture/grazing, and institutional/commercial respectively.
The smallest portion of land which has a total of 146 (6.05%) hectares is utilized for
mineral/rivers/creeks.

2011 SOCIO-ECONOMIC, FINANCIAL AND ENVIRONMENTAL ASSESSMENT OF THE
REHABILITATION OF BAYBAYOG-APANBERANG-TIMBAC FARM-TO-MARKET ROAD IN
BARANGAY CATTUBO, ATOK, BENGUET
Erro, M.E.G; Lumbres, A.G.B.; Sadili, D.R.A; Sale, E.K.A.
Page 34
Table 2. Land Use and Area of Barangay Cattubo
Land Use Land Area (Hectare) Percentage (%)
Agricultural 992 41.09
Pasture/Grazing 320 13.26
Forest 423 17.52
Residential 338 14.00
Institutional/Commercial 195 8.08
Mineral/Rivers/Creeks 146 6.05
Total 2414 100 Data Source: NPC-Agrarian Reform Community as cited in Participatory Project Investment Plan, 2011-2015.
Agricultural lands are planted to a variety of vegetable and ornamental crops
which the farmers sell in La Trinidad and Baguio City. With the vast area devoted to
agricultural production, agriculture serves as the major source of income for the residents.
Forestlands of the barangay are classified as either protected areas or production
areas. Protected areas include national parks, nature reserves and wildlife sanctuaries in
the area. The Municipality of Atok which includes Barangay Cattubo is covered by
Republic Act No. 7586 which provides for the establishment and management of the
National Integrated Protected Area System (NIPAS) as well as Government Reservations
like Mount Data National Park. On the other hand, production areas cover an area of 423
(17.52%) hectares and serve as watershed; wildlife habitat; and source of timber, herbal
medicines, resin, and other forest products. For some, the forest also serves as their
source of income. However, the forestlands are being denuded and are being converted
into agricultural and residential lands.
Residential, pasture, and institutional lands cover an area of 338 (14%) hectares,
320 (13.26) hectares, and 195 (8.08%) hectares respectively. Pasture lands are used for
grazing cattle and other ruminants as well as source of cogon for housing and cattle
manure for organic farming. Institutional lands, on the other hand, are mainly for
government establishments like school buildings, health centers, etc.

2011 SOCIO-ECONOMIC, FINANCIAL AND ENVIRONMENTAL ASSESSMENT OF THE
REHABILITATION OF BAYBAYOG-APANBERANG-TIMBAC FARM-TO-MARKET ROAD IN
BARANGAY CATTUBO, ATOK, BENGUET
Erro, M.E.G; Lumbres, A.G.B.; Sadili, D.R.A; Sale, E.K.A.
Page 35
The rivers and creeks that abound in the area are potential sources of river fishes,
and sand and gravel.
Forestry and Community Watershed
Some floras found in the barangay are balyonet, ferns, orchids and other
indigenous plants that are still thriving in the surroundings of Cattubo. The Faunas are
however, disappearing due to the encroachment and destruction of their habitats. The
bowet, wigit which is like a rat with white tail and amkis are just some of the examples of
wild animals found in the remaining forests of Cattubo.
Barangay Cattubo has identified its own watershed areas like the Colbong
Watershed, the Macbas Watershed and the Babkeg Watershed. The identified watersheds
of the barangay are the water sources for its different sitios. Water from these sources
was tapped by the farmers for irrigating their rice fields and vegetable farms. These also
supply safe and potable water for the residents.
Topography, Slope, Elevation
Barangay Cattubo is considered upland with sloping vegetable terraces in most of
the sitios and with plateau on the other sitios. The Highest Point, which is 7000 ft. above
sea level, is found at Km. 54. It serves as a stopover for travelers and as a viewpoint for
Mount Pulag National Park, the second highest mountain in the Philippines.
Vegetation
The vegetative cover of the barangay consists of natural growth of pine trees,
shrubs, blade grass, and a variety of planted trees such as alnus. The pine trees as well as
the shrubs are all second generation due to logging that happened in 1930’s to 1950’s.
Vegetables and grasses also abundantly grow in the surroundings.

2011 SOCIO-ECONOMIC, FINANCIAL AND ENVIRONMENTAL ASSESSMENT OF THE
REHABILITATION OF BAYBAYOG-APANBERANG-TIMBAC FARM-TO-MARKET ROAD IN
BARANGAY CATTUBO, ATOK, BENGUET
Erro, M.E.G; Lumbres, A.G.B.; Sadili, D.R.A; Sale, E.K.A.
Page 36
Climate
Barangay Cattubo belongs to the first type of climate characterized by two
pronounced seasons of the year. The dry season starts in November and ends in April
while the wet season starts in the month of May and ends in October.
During the wet season, fog development usually takes place at any time of the day
lasting from several hours to several days. Sometimes, even visibility is impaired. The
coolest months of the year are December, January, and February.
Soil Types
The Atok clay loam is the only soil type in the barangay. Its relief is from steep to
very steep, excessive external and good internal drainages. The surface soil is dark
brown, medium granular friable firm sandy loam, slightly hard when dry, and slightly
sticky when wet. The crops commonly produced from this soil type are coffee, rice,
cabbage, and sayote.
Socio- Economic Profile
Agriculture
a. Food Sufficiency
Benguet is largely an agricultural land. It supplies 86% of the country’s
need for vegetable products. Most of the municipalities in the province of
Benguet produce vegetables and one of which is the Municipality of Atok. The
municipality has an estimated 9,803.45 hectares of land devoted for agricultural
production. Barangay Cattubo, being covered by Atok municipality, also has a
large area used for agriculture.

2011 SOCIO-ECONOMIC, FINANCIAL AND ENVIRONMENTAL ASSESSMENT OF THE
REHABILITATION OF BAYBAYOG-APANBERANG-TIMBAC FARM-TO-MARKET ROAD IN
BARANGAY CATTUBO, ATOK, BENGUET
Erro, M.E.G; Lumbres, A.G.B.; Sadili, D.R.A; Sale, E.K.A.
Page 37
Consequently, hunger incidence is not observed since there is a sufficient
food supply in the barangay. However, hunger may occur during natural
calamities such as typhoons since vegetable produce would be destroyed, roads
would be closed, and thus food supply would run out.
People in the barangay eat rice and a viand, usually fried or served with
soup. Households also include to their meal coffee or milk as a drink. Some also
eat snacks in between meals.
b. Production
Average Household Farm Size
- Farming Systems Zone Profile
The province of Benguet has an average annual effective area of
36,032.93 hectares of cultivated land for vegetables which generates an average
of 701,292.63 metric tons. The province also has flower plantations and fruit
farms. From 2003 to 2006, the total land area devoted to crop/vegetable
production was significantly reduced to 6,221.60 hectares. However, it made a
turnaround in 2007 wherein the area had increased to 7,352.32 hectares.
As previously stated, Atok Benguet has a large area devoted to agriculture.
Its major crops are cabbage, potatoes, chayote, and rice.
The major crops raised in the six sitios of Barangay Cattubo were
cabbage, potato, and carrot. Minor crops were also produced such as celery,
radish, and beans while a scattering of backyard floriculture ventures were
observed growing calla lilies, Shasta daisies, and carnations.
2011 SOCIO-ECONOMIC, FINANCIAL AND ENVIRONMENTAL ASSESSMENT OF THE
REHABILITATION OF BAYBAYOG-APANBERANG-TIMBAC FARM-TO-MARKET ROAD IN
BARANGAY CATTUBO, ATOK, BENGUET
Erro, M.E.G; Lumbres, A.G.B.; Sadili, D.R.A; Sale, E.K.A.
Page 38
The barangay surveyed 45 households in 2009 and based on the result, the
total land area planted with cabbage, potato, and carrots is 11 hectares, 15
hectares, and 5 hectares respectively.
Crop Production
The major crops in Barangay Cattubo are white potato, cabbage and carrot
while its minor crops are celery, Chinese cabbage, sweet potato, ornamental crops
and gabi which the farmers sell in Baguio and La Trinidad. However, sweet
potato and gabi, identified as indigenous crops, were only used for personal
consumption thus it is not planted in hectares of land. At present, rice is no longer
being cultivated in the barangay (PPIP, 2011-2015).
Furthermore, major crops were planted on a relay cropping system. Land
preparation takes two months while it takes 3 to 4 months before the crops can be
harvested. There are only two cropping seasons in a year since one cropping
season takes six months. In addition, cabbage is harvested on a staggered basis
depending on the variety’s heading and maturity.
In terms of irrigation, fifty-three percent (53%) of the land is irrigated and
47% is rain fed (Cattubo BNRMP).

2011 SOCIO-ECONOMIC, FINANCIAL AND ENVIRONMENTAL ASSESSMENT OF THE
REHABILITATION OF BAYBAYOG-APANBERANG-TIMBAC FARM-TO-MARKET ROAD IN
BARANGAY CATTUBO, ATOK, BENGUET
Erro, M.E.G; Lumbres, A.G.B.; Sadili, D.R.A; Sale, E.K.A.
Page 39
Livestock, Poultry, and Fishery Production
- Livestock Production
Currently, farmers from the Municipality of Atok started livestock farming
as their other source of income. According to their CLUP, there are carabaos
(488), cattles (1,113), swine (2,060), goats (148), and chickens (5,925) being
raised.
Particularly Barangay Cattubo has a livestock production but is generally
for home consumption only. It is usually being placed at the backyard of the
households. Most commonly raised animals were pigs and dogs while there were
few who raise cows/cattles, goats, and carabaos. Some households sell their pigs
in the neighborhood or to nearby stores.
Cattle, goat, and carabao were being fed with grasses daily, while swine
were being fed with pure mash called starter during the first month; a grower
mash after two months; and finisher mash with some additional foods like rice,
sayote, camote leaves, and ubbak when the pig is already at least 3 to 4 months.
Sometimes, the swine were also given snacks which could be pure ubbak or
sayote.
- Poultry Production
Similarly, poultry animals were also being raised at their backyard and for
personal consumption only. Chicken is the most common poultry animal being
raised. Only few households raise ducks and geese.
The livestock and poultry products were usually butchered during family
events like weddings, deaths and burials, and blow-outs.

2011 SOCIO-ECONOMIC, FINANCIAL AND ENVIRONMENTAL ASSESSMENT OF THE
REHABILITATION OF BAYBAYOG-APANBERANG-TIMBAC FARM-TO-MARKET ROAD IN
BARANGAY CATTUBO, ATOK, BENGUET
Erro, M.E.G; Lumbres, A.G.B.; Sadili, D.R.A; Sale, E.K.A.
Page 40
- Fishery Production
In terms of fishery production, the municipality is currently developing
and encouraging people to have backyard fish production. The local government
constructed a demonstration farm of Tilapia production in Barangay Pasdong.
They are also giving free fingerlings to those people who are interested in such
venture.
At present, there is no existing fishery production in Barangay Cattubo.
However, the barangay has potential for such production since there are creeks
and rivers located in Sitio Calasipan.
Since the Barangay has no existing fishery production, there were no
records for production inputs and costs.
Production Inputs and Costs
There were no available data on production inputs and costs of the above
livestock/ poultry since these are being used commonly for home consumption
and rarely being marketed to the neighborhood.
c. Farming Practices
Traditional Farming/ Indigenous Farming
The barangay uses traditional farming activities, which are being done
manually, such as land preparation, planting, crop care, threshing, harvesting,
hauling, and storage. Locally available materials and equipment were being used
for these activities which includes grub hoes and spades. Sometimes, land

2011 SOCIO-ECONOMIC, FINANCIAL AND ENVIRONMENTAL ASSESSMENT OF THE
REHABILITATION OF BAYBAYOG-APANBERANG-TIMBAC FARM-TO-MARKET ROAD IN
BARANGAY CATTUBO, ATOK, BENGUET
Erro, M.E.G; Lumbres, A.G.B.; Sadili, D.R.A; Sale, E.K.A.
Page 41
preparation and crop care/ maintenance were being done with the aid of fuel-feed
equipment like hand tractor and power sprayer.
Organic Farming
Most of the farmers use organic and inorganic fertilizers in vegetable
production. There were only more than three farmers who are using 100% organic
fertilizers at present. Chicken dung is widely used as organic fertilizer and applied
only once per cropping.
Farming Technology Adapted
There were a number of farming technologies that had been introduced to
the farmers of Cattubo through trainings and seminars such as crop programming,
Integrated Pest and Management Technology, and organic farming. However,
these technologies could not be applied in the farms. Only organic farming, using
chicken manure as fertilizer, was being adapted in the barangay. Unfortunately,
there were times when proper application of chicken manure was not practiced by
the farmers. They applied chicken manure to crops without being composted.
d. Pests, Diseases and Control
Crops
According to the PPIP of Barangay Cattubo, the farmers were dependent
on chemical inputs in controlling pests and diseases. Most commonly used were
green labeled insecticides which include Dithane, Vondozeb, Elosal and Rover
which were sprayed only when necessary. In addition, the frequency of
application or spraying depended on the type of disease, the degree of infestation,
and the type of crop.

2011 SOCIO-ECONOMIC, FINANCIAL AND ENVIRONMENTAL ASSESSMENT OF THE
REHABILITATION OF BAYBAYOG-APANBERANG-TIMBAC FARM-TO-MARKET ROAD IN
BARANGAY CATTUBO, ATOK, BENGUET
Erro, M.E.G; Lumbres, A.G.B.; Sadili, D.R.A; Sale, E.K.A.
Page 42
Livestock
The barangay was highly dependent to the MAO for pests and disease
control of livestock. There were various actions done by the MAO to prevent the
occurrence of diseases in livestocks such as deworming and delousing,
vaccination, and hygiene and sanitation. However, livestock raisers seldom attend
seminars and trainings to update their knowledge on pest and disease control.
e. Facilities
Production Facilities
All of the production facilities in the barangay are privately owned. There
are a total of twenty (20) water pumps, four (4) of which are for public use and
the rest is privately owned. Furthermore, most of these equipments are also for
hire.
Post-Harvest Facilities
According to the Cattubo Barangay Profile of 2009 as cited in the PPIP
2011-2015, there are 10 tramlines, 49 small farm reservoirs, 40 pump and engine
sets, 14 power tillers, 3 tractors and 45 green houses. There are also three Seed
Potato Storage Houses at Tulodan that were funded by the Department of
Agriculture.
f. Marketing and Product Flow
Market outlets
Vegetable products in large quantities were being sold at trading posts
located in Baguio City and La Trinidad, Benguet while vegetable products of
2011 SOCIO-ECONOMIC, FINANCIAL AND ENVIRONMENTAL ASSESSMENT OF THE
REHABILITATION OF BAYBAYOG-APANBERANG-TIMBAC FARM-TO-MARKET ROAD IN
BARANGAY CATTUBO, ATOK, BENGUET
Erro, M.E.G; Lumbres, A.G.B.; Sadili, D.R.A; Sale, E.K.A.
Page 43
small quantities were being sold at Atok Public Market located in Sayangan,
which is considered as the growth center of the municipality.
Traders
The farmers in the barangay are being referred to as traders since they
themselves sell their own crops to middlemen at the trading posts located in La
Trinidad, and Baguio City.
Trade and Industry
a. Agri-Based Industries
There were no agri-based industries present in the barangay.
b. Micro-enterprises, Cottage and Small Scale Enterprises
There were 44 types of business establishments distributed in the six sitios
of the barangay. These include several sari-sari stores, 2 cooperatives, a bakery
and a restaurant. All business establishments except for the cooperatives were
privately owned (Barangay Profile, 2009 as cited in PPIP, 2011-2015).
c. Micro-Finance and Credit
There are currently no lending institutions in the barangay. However, there
is an existing informal credit and market system in the locality called the Supply
System where in suppliers, usually traders or small stall owners located in
Trading Post at La Trinidad, provide all inputs and to some extent household
needs of the farmers. There are also cooperatives and a women’s association that
provide financial assistance, in small amount, to their members.

2011 SOCIO-ECONOMIC, FINANCIAL AND ENVIRONMENTAL ASSESSMENT OF THE
REHABILITATION OF BAYBAYOG-APANBERANG-TIMBAC FARM-TO-MARKET ROAD IN
BARANGAY CATTUBO, ATOK, BENGUET
Erro, M.E.G; Lumbres, A.G.B.; Sadili, D.R.A; Sale, E.K.A.
Page 44
d. Other Livelihood Activities
Farming is the major source of income in the community. However, there
are also other livelihood activities in the barangay like, carpentry, vending,
poldiya, among others.
Tourism
The Province of Benguet focuses on eco-tourism. Their tourism spots are
basically natural and cultural heritage areas which are widely spread out in the
province. In the municipality of Atok, specifically in Barangay Cattubo some of
the potential tourist attractions in the Barangay are the Loacan River and the St.
Teresita Mine or most commonly known as the Quadselm located in Sitio Botiao
while the Highest Point View Deck can also be considered as a tourist attraction.
Status of Land Tenure in the Community
Agricultural Status
Based on the Barangay Cattubo survey conducted in 2009, majority of the
households in the barangay owned the farms they were working on. However,
there were eighteen (18) households who do not have their own agricultural land
while one (1) household was working on a farm without the consent of its owner.
Education
a. Community Education Profile
Literacy Rate
Barangay Cattubo has a literacy rate of 99%. The 1% remaining,
considered as illiterates, consist of people belonging to the old age group as well
2011 SOCIO-ECONOMIC, FINANCIAL AND ENVIRONMENTAL ASSESSMENT OF THE
REHABILITATION OF BAYBAYOG-APANBERANG-TIMBAC FARM-TO-MARKET ROAD IN
BARANGAY CATTUBO, ATOK, BENGUET
Erro, M.E.G; Lumbres, A.G.B.; Sadili, D.R.A; Sale, E.K.A.
Page 45
as those who did not attend any formal education due to distant location of
schools from their houses.
Educational Attainment by Sex
As of school year 2009-2010, a total of 58 were enrolled in Grade 1, 44 in
Grade II, 45 in Grade III, 39 in Grade IV, 42 in Grade V, and 31 in Grade VI.
Thus, a total of 259 children aged 6 to 13 years old had reached and/or graduated
from elementary.
Furthermore, according to the assessment of the educational profile of the
barangay as per educational attainment based on age, 98% of children ages 6 to
12, 95% of those in 13 to 16 years old, and 75% of the population ages 17 to 23
years were in the elementary, high school, and college level respectively.
For the population ages 24 to 94, 15% of which have attained elementary
level while 20% were able to graduate from elementary, 15% have attained high
school level and only 10% of which were able to graduate from high school. Only
9% of the population has attained college level or vocational and 6% were able to
finish college.
b. Educational Facilities
Barangay Cattubo has a total of three elementary schools, including one
primary school, and it has two (2) pre-schools and four (4) day care centers. High
school students were studying at Saint Paul’s Academy located at Sayangan,
Paoay. Furthermore, non-formal education was no longer offered in the barangay
and those who were interested to attend the Alternative Learning System would
enroll in Sayangan.
2011 SOCIO-ECONOMIC, FINANCIAL AND ENVIRONMENTAL ASSESSMENT OF THE
REHABILITATION OF BAYBAYOG-APANBERANG-TIMBAC FARM-TO-MARKET ROAD IN
BARANGAY CATTUBO, ATOK, BENGUET
Erro, M.E.G; Lumbres, A.G.B.; Sadili, D.R.A; Sale, E.K.A.
Page 46
Health and Sanitation
a. General Community and Health Sanitation
In general, the community was considered to have a healthy and sanitary
condition. As per assessment by the midwife of the barangay, health condition of
the community was rated as 95%, which means that there were no major threats
on the health of the people such as dengue and other diseases caused by mosquito.
On the other hand, the sanitary condition of the barangay was rated as 90% due to
absence of dumping sites which lead some people to burn and dump their garbage
anywhere.
b. Leading Causes of Death
According to the PPIP, the top leading cause of mortality in the barangay
was Cardio Vascular Disease with 24 cases recorded. The least was on chemical
poisoning with only one case recorded (Barangay Profile, 2009).
c. Domestic Water Supply and Waterborne- diseases
Currently, there are potable water reaching a number of households
through installation of GI pipes and plastic hose which are unaffordable to some
household due to high cost of installing such pipes.
As a result, 40% of the residents in the barangay depend on water being
provided by the LGU. However, this water service cannot reach all the sitios thus
they have to fetch water from sources.
Additionally, there were also existing open wells and springs but these
water sources can easily be contaminated especially during rainy season. Harmful
effects of water contamination were widely known in the community.

2011 SOCIO-ECONOMIC, FINANCIAL AND ENVIRONMENTAL ASSESSMENT OF THE
REHABILITATION OF BAYBAYOG-APANBERANG-TIMBAC FARM-TO-MARKET ROAD IN
BARANGAY CATTUBO, ATOK, BENGUET
Erro, M.E.G; Lumbres, A.G.B.; Sadili, D.R.A; Sale, E.K.A.
Page 47
d. Incidence of Malnutrition
According to Cattubo Barangay Profile of 2009, there were some
incidences of malnutrition in the barangay. There were 78 children who were
diagnosed as malnourished as per the record of the Rural Health Unit, but due to
supplemental feeding and continuous monitoring, the total number of
malnourished children eventually decreased.
e. Health Programs and Services
Health services and programs present in the barangay were coming from
Atok District Hospital; the RHU located in Sitio Sayangan, which renders
immunization for children and mothers, conduct/ facilitate household survey,
health status monitoring and sanitation, operation timbang to children and health
education; and the SLU Mobile Clinic, which also helps the barangay in
providing the health services. There is also a Botika sa Barangay located in
Tulodan Proper which provides medicines at a lower cost.
Housing and Ownership
According to the PPIP, 99.9% of the households own their houses.
Majority of these houses were made of half galvanized iron or half concrete.
Household Assets/ Properties
a. Transportation
There are no public utility vehicles in the barangay. However, there are a
total of 142 different transportation facilities; which includes jeepneys, trucks,
vans, and cars; which were privately owned by different individuals.
2011 SOCIO-ECONOMIC, FINANCIAL AND ENVIRONMENTAL ASSESSMENT OF THE
REHABILITATION OF BAYBAYOG-APANBERANG-TIMBAC FARM-TO-MARKET ROAD IN
BARANGAY CATTUBO, ATOK, BENGUET
Erro, M.E.G; Lumbres, A.G.B.; Sadili, D.R.A; Sale, E.K.A.
Page 48
Residents in the barangay only take a ride in public utility transportation
like buses or vans plying the Halsema Highway when they go to Baguio, La
Trinidad or anywhere outside the barangay.
b. Communication
More than 90% of the household uses cellphone as their major means of
communication while another form of communication is thru radio, which
provides update and current event information for the community. There are 325
households recorded to have this item.
Another traditional form of communication widely used in the barangay,
and even to the whole municipality of Atok, is the paw-it or bilin system where
one hands over or entrusts verbal messages to one person and the same is relayed
or delivered to the receiver.
Likewise, newspapers and other reading materials are bought outside the
barangay.
Social Infrastructures
a. Government Facilities
Majority of the government facilities are found at Barangay Paoay. The
only government facility in the area is the barangay hall which also houses the
clinic.

2011 SOCIO-ECONOMIC, FINANCIAL AND ENVIRONMENTAL ASSESSMENT OF THE
REHABILITATION OF BAYBAYOG-APANBERANG-TIMBAC FARM-TO-MARKET ROAD IN
BARANGAY CATTUBO, ATOK, BENGUET
Erro, M.E.G; Lumbres, A.G.B.; Sadili, D.R.A; Sale, E.K.A.
Page 49
b. Schools
Barangay Cattubo has a total of seven school infrastructures - elementary
and day care. These schools were located in the sitios of Calasipan, Oyusan,
Tulodan and Timbac.
c. Health Centers, Hospitals and Clinics
There were no other health facilities/ infrastructures in the barangay
except for the barangay clinic which was located in the barangay hall. Residents
usually bring their patients to Atok District Hospital located at Barangay Paoay
specifically at Sitio Sayangan, which is more than 5.5 kilometers away, or to other
hospitals in Baguio City and La Trinidad.
d. Utilities (electricity, water, communication)
BENECO serves as the barangay’s source of electricity. As per barangay
data (2009), more than 50% of the total households have electricity while the
other half of the household population use kerosene/ petroleum, gas and candles
as their source of lightning. There were some households who do not have
electricity service due to distant location to the BENECO mainline.
e. Finance (banks, credit, microfinance, coop)
There are no financial institutions located in the barangay as well as
lending institutions, as mentioned earlier. There is only one bank in the
Municipality of Atok which is located in Sitio Sayangan. Most financial
institutions in the municipality are found at Barangay Paoay, this includes
cooperatives which provide credit to farmers.
2011 SOCIO-ECONOMIC, FINANCIAL AND ENVIRONMENTAL ASSESSMENT OF THE
REHABILITATION OF BAYBAYOG-APANBERANG-TIMBAC FARM-TO-MARKET ROAD IN
BARANGAY CATTUBO, ATOK, BENGUET
Erro, M.E.G; Lumbres, A.G.B.; Sadili, D.R.A; Sale, E.K.A.
Page 50
Community Infrastructures
Based on the update of the Barangay Council, there were almost 21
existing farm-to-market roads and barangay roads, and one provincial/ national
road in the area. In terms of road maintenance, DPWH was responsible for the
national road, Provincial Government for the provincial roads, and the residents
of the community for the barangay roads. The residents of the community make
use of the aduyan or bayanihan system in maintaining the barangay roads as well
as for foot trails and foot paths.
There are four (4) existing foot bridges in the barangay, two of which
needs reconstruction. Three (3) of the foot bridges are located in Sitio Botiao and
one (1) can be found in Sitio Calasipan. The longest foot bridge is Gusaran while
the shortest is the Pad-el foot bridge.
Furthermore, Barangay Cattubo has four (4) irrigation systems servicing a
total of 80 hectares. However, three (3) of these are in need of rehabilitation.
In addition, all sitios in the barangay have their own water sources which
have been serving the area for a long time, may it be for domestic or agricultural
use.
Community Development Interventions
For many years now, the barangay has been a beneficiary of different
projects or programs coming from the local, national, as well as international
agencies such as HADP, CHARM 1 and from other non-government
organizations.
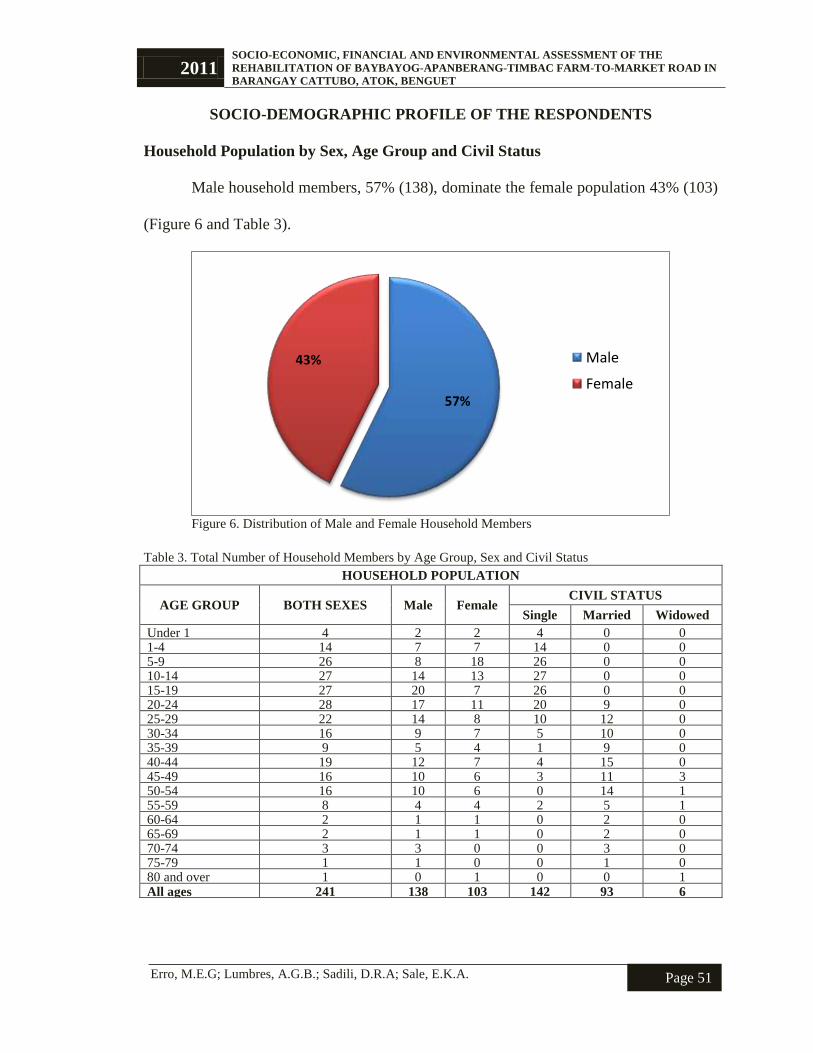
2011 SOCIO-ECONOMIC, FINANCIAL AND ENVIRONMENTAL ASSESSMENT OF THE
REHABILITATION OF BAYBAYOG-APANBERANG-TIMBAC FARM-TO-MARKET ROAD IN
BARANGAY CATTUBO, ATOK, BENGUET
Erro, M.E.G; Lumbres, A.G.B.; Sadili, D.R.A; Sale, E.K.A.
Page 51
SOCIO-DEMOGRAPHIC PROFILE OF THE RESPONDENTS
Household Population by Sex, Age Group and Civil Status
Male household members, 57% (138), dominate the female population 43% (103)
(Figure 6 and Table 3).
Figure 6. Distribution of Male and Female Household Members
Table 3. Total Number of Household Members by Age Group, Sex and Civil Status
HOUSEHOLD POPULATION
AGE GROUP BOTH SEXES Male Female CIVIL STATUS
Single Married Widowed
Under 1 4 2 2 4 0 0 1-4 14 7 7 14 0 0 5-9 26 8 18 26 0 0 10-14 27 14 13 27 0 0 15-19 27 20 7 26 0 0 20-24 28 17 11 20 9 0 25-29 22 14 8 10 12 0 30-34 16 9 7 5 10 0 35-39 9 5 4 1 9 0 40-44 19 12 7 4 15 0 45-49 16 10 6 3 11 3 50-54 16 10 6 0 14 1 55-59 8 4 4 2 5 1 60-64 2 1 1 0 2 0 65-69 2 1 1 0 2 0 70-74 3 3 0 0 3 0 75-79 1 1 0 0 1 0 80 and over 1 0 1 0 0 1 All ages 241 138 103 142 93 6
57%
43% Male
Female
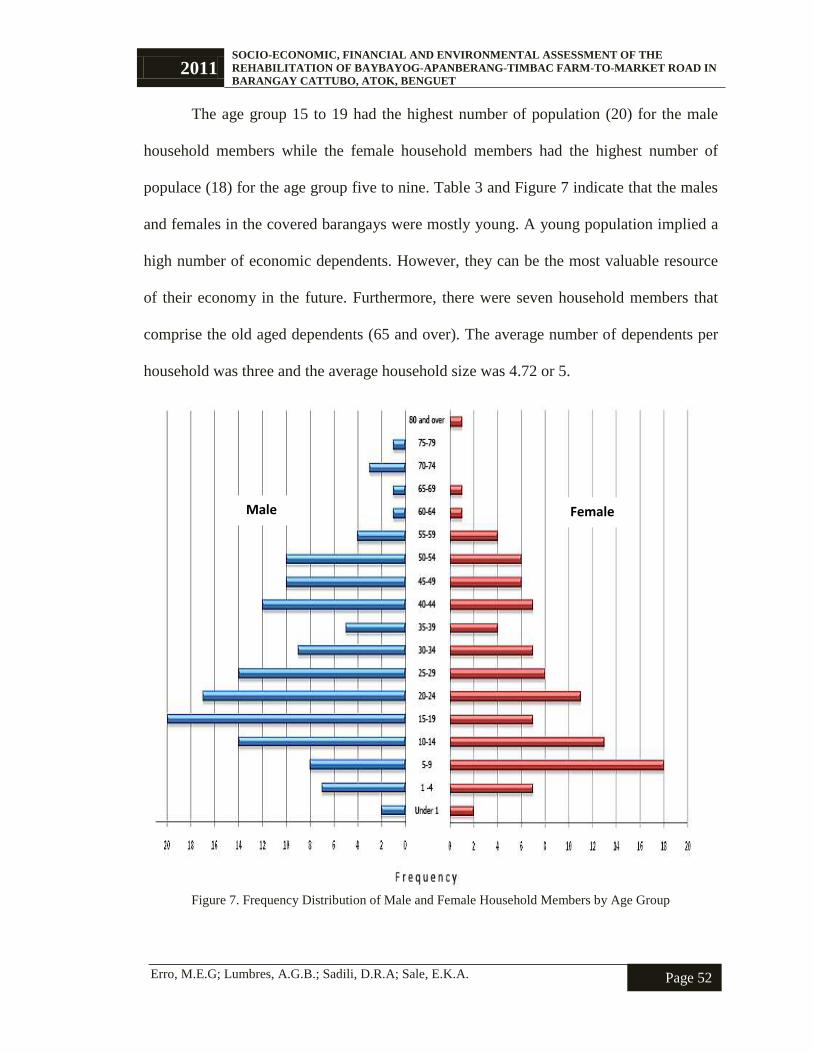
2011 SOCIO-ECONOMIC, FINANCIAL AND ENVIRONMENTAL ASSESSMENT OF THE
REHABILITATION OF BAYBAYOG-APANBERANG-TIMBAC FARM-TO-MARKET ROAD IN
BARANGAY CATTUBO, ATOK, BENGUET
Erro, M.E.G; Lumbres, A.G.B.; Sadili, D.R.A; Sale, E.K.A.
Page 52
The age group 15 to 19 had the highest number of population (20) for the male
household members while the female household members had the highest number of
populace (18) for the age group five to nine. Table 3 and Figure 7 indicate that the males
and females in the covered barangays were mostly young. A young population implied a
high number of economic dependents. However, they can be the most valuable resource
of their economy in the future. Furthermore, there were seven household members that
comprise the old aged dependents (65 and over). The average number of dependents per
household was three and the average household size was 4.72 or 5.
Figure 7. Frequency Distribution of Male and Female Household Members by Age Group
Female Male

2011 SOCIO-ECONOMIC, FINANCIAL AND ENVIRONMENTAL ASSESSMENT OF THE
REHABILITATION OF BAYBAYOG-APANBERANG-TIMBAC FARM-TO-MARKET ROAD IN
BARANGAY CATTUBO, ATOK, BENGUET
Erro, M.E.G; Lumbres, A.G.B.; Sadili, D.R.A; Sale, E.K.A.
Page 53
Fifty-nine percent (142) of the household population was single, while only 2%
(6) of the population was already widowed, as shown in Figure 8. Most of them were still
single since majority of the residents were in their adolescence. Based on the interview,
there were no recorded households wherein the parents were separated. Results also
showed that 39% of the population was married. Table 3 indicates that age group 20 to 24
years old is the starting age of marriage.
Figure 8. Distribution of Household Member’s Civil Status
Educational Attainment
Figure 9 shows that there were 62 household members who were enrolled at the
elementary level followed by 56 and 42 household members who were currently enrolled
at high school and college levels, respectively. However, in terms of the number of
elementary, high school, and college graduates, there was a big difference when
compared to those who are currently attending elementary, high school, and college
levels. This was due to the significant high number of young population as shown in the
59%
39%
2%
Single
Married
Widowed
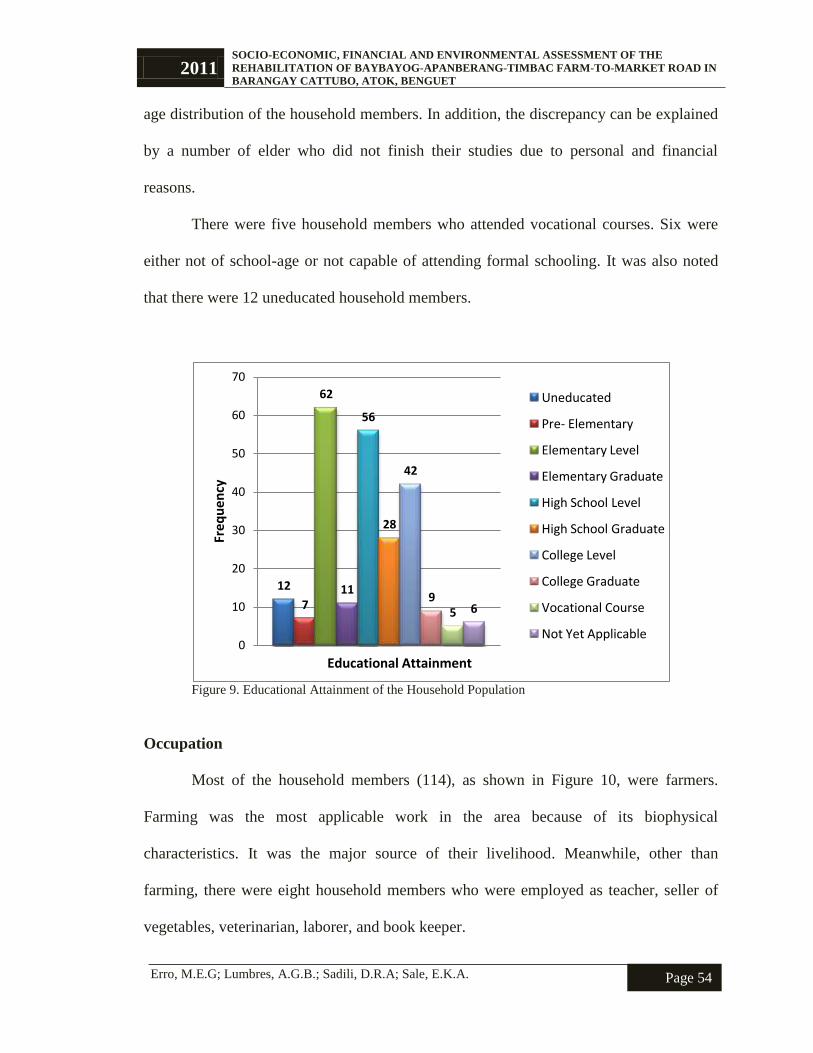
2011 SOCIO-ECONOMIC, FINANCIAL AND ENVIRONMENTAL ASSESSMENT OF THE
REHABILITATION OF BAYBAYOG-APANBERANG-TIMBAC FARM-TO-MARKET ROAD IN
BARANGAY CATTUBO, ATOK, BENGUET
Erro, M.E.G; Lumbres, A.G.B.; Sadili, D.R.A; Sale, E.K.A.
Page 54
age distribution of the household members. In addition, the discrepancy can be explained
by a number of elder who did not finish their studies due to personal and financial
reasons.
There were five household members who attended vocational courses. Six were
either not of school-age or not capable of attending formal schooling. It was also noted
that there were 12 uneducated household members.
Figure 9. Educational Attainment of the Household Population
Occupation
Most of the household members (114), as shown in Figure 10, were farmers.
Farming was the most applicable work in the area because of its biophysical
characteristics. It was the major source of their livelihood. Meanwhile, other than
farming, there were eight household members who were employed as teacher, seller of
vegetables, veterinarian, laborer, and book keeper.
12
7
62
11
56
28
42
9 5 6
0
10
20
30
40
50
60
70
Fre
qu
en
cy
Educational Attainment
Uneducated
Pre- Elementary
Elementary Level
Elementary Graduate
High School Level
High School Graduate
College Level
College Graduate
Vocational Course
Not Yet Applicable
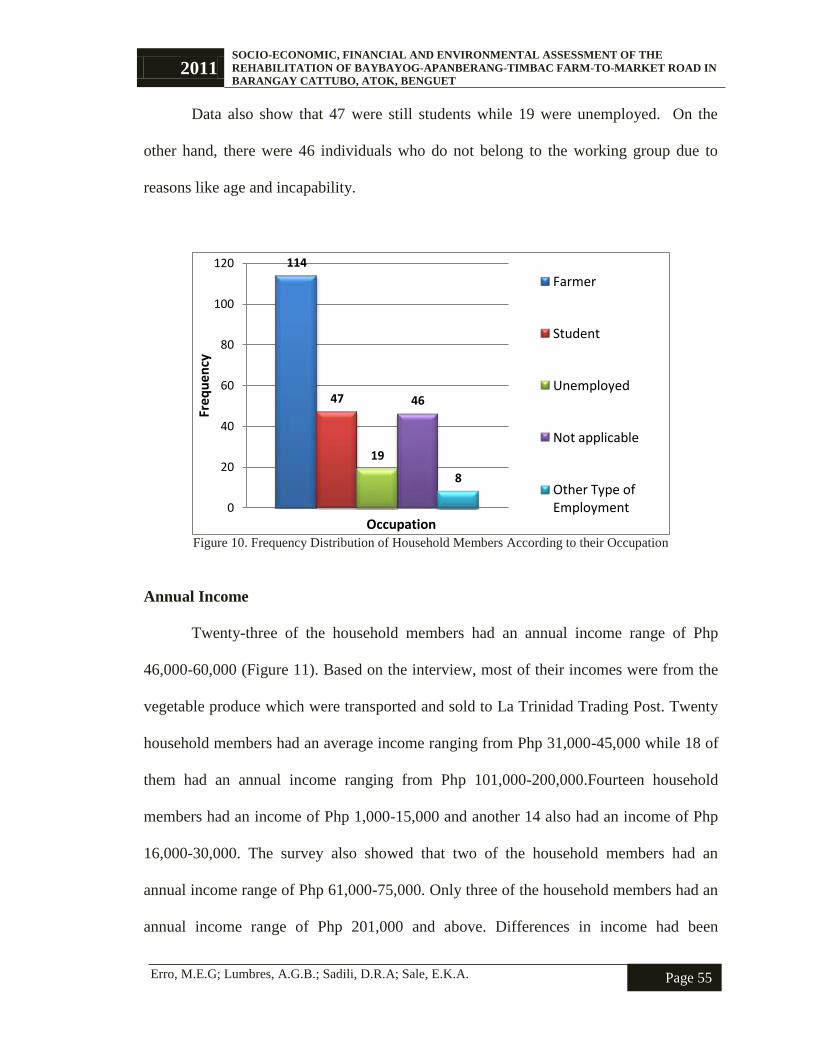
2011 SOCIO-ECONOMIC, FINANCIAL AND ENVIRONMENTAL ASSESSMENT OF THE
REHABILITATION OF BAYBAYOG-APANBERANG-TIMBAC FARM-TO-MARKET ROAD IN
BARANGAY CATTUBO, ATOK, BENGUET
Erro, M.E.G; Lumbres, A.G.B.; Sadili, D.R.A; Sale, E.K.A.
Page 55
Data also show that 47 were still students while 19 were unemployed. On the
other hand, there were 46 individuals who do not belong to the working group due to
reasons like age and incapability.
Figure 10. Frequency Distribution of Household Members According to their Occupation
Annual Income
Twenty-three of the household members had an annual income range of Php
46,000-60,000 (Figure 11). Based on the interview, most of their incomes were from the
vegetable produce which were transported and sold to La Trinidad Trading Post. Twenty
household members had an average income ranging from Php 31,000-45,000 while 18 of
them had an annual income ranging from Php 101,000-200,000.Fourteen household
members had an income of Php 1,000-15,000 and another 14 also had an income of Php
16,000-30,000. The survey also showed that two of the household members had an
annual income range of Php 61,000-75,000. Only three of the household members had an
annual income range of Php 201,000 and above. Differences in income had been
114
47
19
46
8
0
20
40
60
80
100
120
Fre
qu
en
cy
Occupation
Farmer
Student
Unemployed
Not applicable
Other Type of Employment

2011 SOCIO-ECONOMIC, FINANCIAL AND ENVIRONMENTAL ASSESSMENT OF THE
REHABILITATION OF BAYBAYOG-APANBERANG-TIMBAC FARM-TO-MARKET ROAD IN
BARANGAY CATTUBO, ATOK, BENGUET
Erro, M.E.G; Lumbres, A.G.B.; Sadili, D.R.A; Sale, E.K.A.
Page 56
attributed for their differences in jobs and farm productions. The overall average annual
income of the households respondents was estimated at Php. 68, 645.00.
Figure 11. Frequency Distribution of the Annual income of the Household Members
Religion
Figure 12 shows that most of the households were Roman Catholics (70.2%). The
result supported the fact that Catholicism is still the most influential religion in the
Philippines. Few household members were Pagan (1.6%). According to the survey, 9.6%
of them were from the Christian Spiritists in the Philippines Inc. while 5.9% were
Protestants. Other religions were Baptist, Christian, Pentecostal and Jehovah’s Witnesses.
Religious affiliation is an important part of a society. This may affect the frequency and
distance of travel of the household members to their respective place of worship which
will be discussed in the later part of the study.
14 14
20
23
2
0
6
18
3
0
5
10
15
20
25 Fr
equ
en
cy
Annual Income
1,000-15,000
16,000-30,000
31,000-45,000
46,000-60,000
61,000-75,000
76,000-90,000
91,000-100,000
101,000-200,000
201,000 and above

2011 SOCIO-ECONOMIC, FINANCIAL AND ENVIRONMENTAL ASSESSMENT OF THE
REHABILITATION OF BAYBAYOG-APANBERANG-TIMBAC FARM-TO-MARKET ROAD IN
BARANGAY CATTUBO, ATOK, BENGUET
Erro, M.E.G; Lumbres, A.G.B.; Sadili, D.R.A; Sale, E.K.A.
Page 57
Figure 12. Religious Affiliations of the Household Members
70
10 6 4 3 3 3 2
0
10
20
30
40
50
60
70
80
Religion
Pe
rcen
tage
Roman Catholic
Christian Spiritists in the Philippines Inc. Protestant
Baptist
Christian
Pentecostal
Jehova's Witness
Pagan
2011 SOCIO-ECONOMIC, FINANCIAL AND ENVIRONMENTAL ASSESSMENT OF THE
REHABILITATION OF BAYBAYOG-APANBERANG-TIMBAC FARM-TO-MARKET ROAD IN
BARANGAY CATTUBO, ATOK, BENGUET
Erro, M.E.G; Lumbres, A.G.B.; Sadili, D.R.A; Sale, E.K.A.
Page 58
PROJECT IMPACTS
SOCIAL IMPACTS
According to Mrs. Julie Sabado, head of the Municipal Social Welfare and
Development Office, ninety percent of the population in Atok was able to access social
services available in the municipality. This was said to be due to the awareness of the
people on the services and programs by the local government unit. This was supported by
Mrs. Juana Bamaue, head of the Provincial Social Welfare and Development Office. She
said that there were no issues regarding the accessibility of social services. Social
services were made available to the residents as long as they fit in the requirements. But
she added that road is very vital in the provision of these services. There were places that
social services are still inaccessible because of poor road conditions.
Mrs. Sabado said that the road rehabilitation project will bring easy access to
social services in the areas influenced by the road. She emphasized on the provision of
health services especially in cases of emergency. More so, the road rehabilitation can
affect the livelihood of the people in terms of transporting their products. She added that
the rehabilitation of road can bring safety for the residents in the area particularly for the
youth sector. She said that maximum social benefits of the road can be achieved if the
implementers will include riprap, canals, pedestrian lanes, and railings on the road
project.

2011 SOCIO-ECONOMIC, FINANCIAL AND ENVIRONMENTAL ASSESSMENT OF THE
REHABILITATION OF BAYBAYOG-APANBERANG-TIMBAC FARM-TO-MARKET ROAD IN
BARANGAY CATTUBO, ATOK, BENGUET
Erro, M.E.G; Lumbres, A.G.B.; Sadili, D.R.A; Sale, E.K.A.
Page 59
Places Visited
In terms of social facilities, results showed (Figure 13) that most of the people in
the barangay go to church (24.9%). This indicates that most number of household
members go to their respective houses of worship than any other social facilities available
in the community. There is also a large number of household population that utilizes the
market located in Sitio Sayangan (18.2%). Furthermore, seventeen percent of the
household members go to school. This is due to the fact that, as mentioned earlier, most
of the household population belongs to the school age group.
Figure 13 also shows that most of the households frequently travel to La Trinidad
(15.9%) relative to than Baguio City (4.3%) to market their crops because of the distance
to their barangay and travel time spent.
Figure 13. Places Visited by Household Members
Figure 14 revealed that places of work were the most frequently visited. A
household’s average frequency of visit to their place of work is 29 times per month.
17.2 18.2
24.9
8.7 10.3
15.9
4.3
0.2 0.2 0.0
5.0
10.0
15.0
20.0
25.0
30.0
Pe
rce
nta
ge
Places Visited
School
Market
Church
Hospital
Place of Work
La Trinidad
Baguio
Bunglo
Itogon
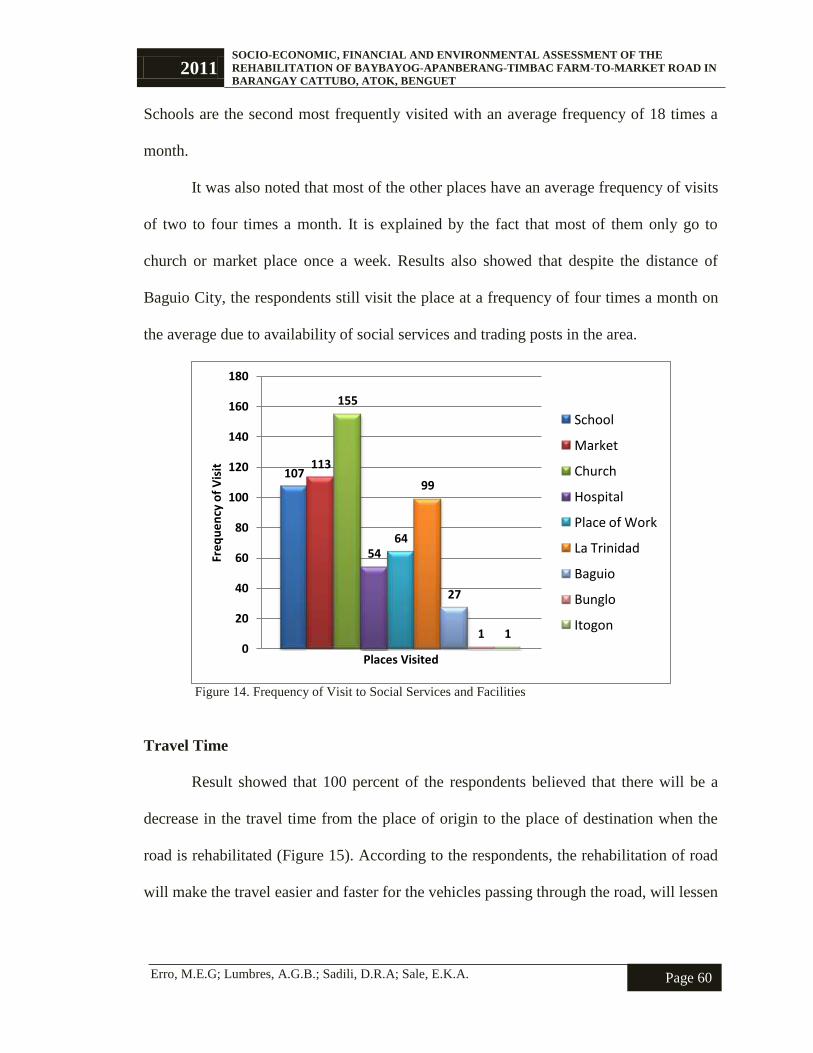
2011 SOCIO-ECONOMIC, FINANCIAL AND ENVIRONMENTAL ASSESSMENT OF THE
REHABILITATION OF BAYBAYOG-APANBERANG-TIMBAC FARM-TO-MARKET ROAD IN
BARANGAY CATTUBO, ATOK, BENGUET
Erro, M.E.G; Lumbres, A.G.B.; Sadili, D.R.A; Sale, E.K.A.
Page 60
Schools are the second most frequently visited with an average frequency of 18 times a
month.
It was also noted that most of the other places have an average frequency of visits
of two to four times a month. It is explained by the fact that most of them only go to
church or market place once a week. Results also showed that despite the distance of
Baguio City, the respondents still visit the place at a frequency of four times a month on
the average due to availability of social services and trading posts in the area.
Figure 14. Frequency of Visit to Social Services and Facilities
Travel Time
Result showed that 100 percent of the respondents believed that there will be a
decrease in the travel time from the place of origin to the place of destination when the
road is rehabilitated (Figure 15). According to the respondents, the rehabilitation of road
will make the travel easier and faster for the vehicles passing through the road, will lessen
107 113
155
54 64
99
27
1 1 0
20
40
60
80
100
120
140
160
180
Fre
qu
en
cy o
f V
isit
Places Visited
School
Market
Church
Hospital
Place of Work
La Trinidad
Baguio
Bunglo
Itogon
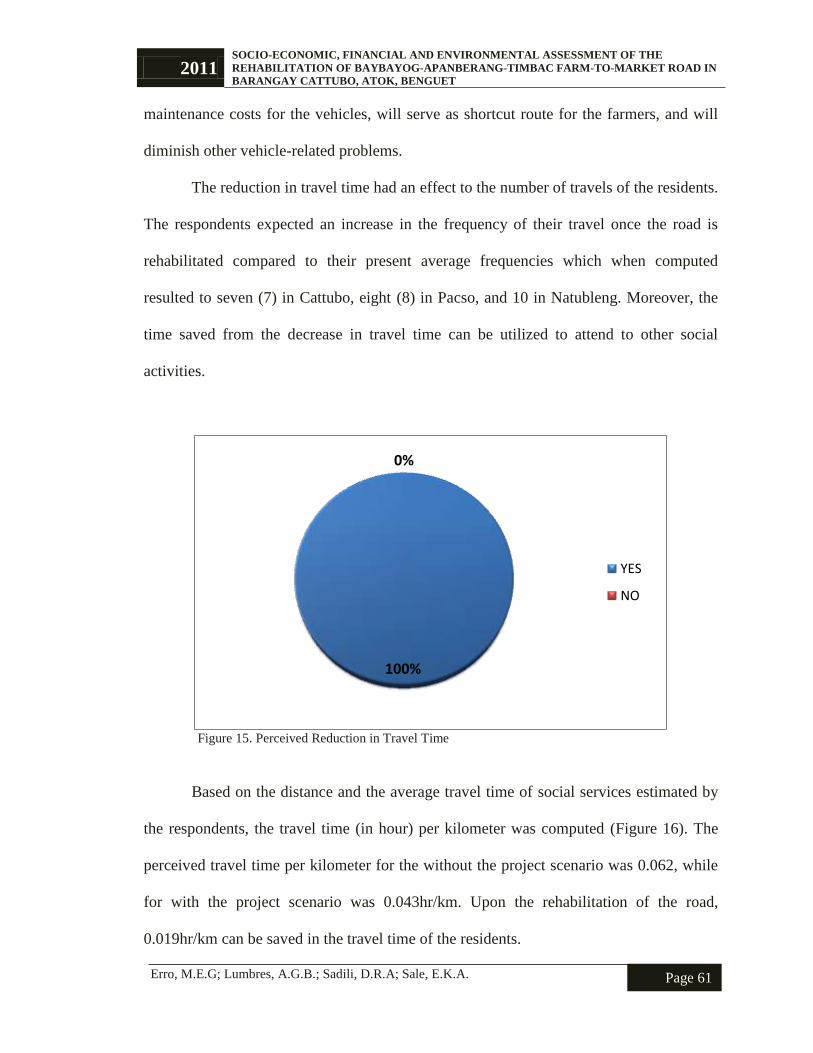
2011 SOCIO-ECONOMIC, FINANCIAL AND ENVIRONMENTAL ASSESSMENT OF THE
REHABILITATION OF BAYBAYOG-APANBERANG-TIMBAC FARM-TO-MARKET ROAD IN
BARANGAY CATTUBO, ATOK, BENGUET
Erro, M.E.G; Lumbres, A.G.B.; Sadili, D.R.A; Sale, E.K.A.
Page 61
maintenance costs for the vehicles, will serve as shortcut route for the farmers, and will
diminish other vehicle-related problems.
The reduction in travel time had an effect to the number of travels of the residents.
The respondents expected an increase in the frequency of their travel once the road is
rehabilitated compared to their present average frequencies which when computed
resulted to seven (7) in Cattubo, eight (8) in Pacso, and 10 in Natubleng. Moreover, the
time saved from the decrease in travel time can be utilized to attend to other social
activities.
Figure 15. Perceived Reduction in Travel Time
Based on the distance and the average travel time of social services estimated by
the respondents, the travel time (in hour) per kilometer was computed (Figure 16). The
perceived travel time per kilometer for the without the project scenario was 0.062, while
for with the project scenario was 0.043hr/km. Upon the rehabilitation of the road,
0.019hr/km can be saved in the travel time of the residents.
100%
0%
YES
NO
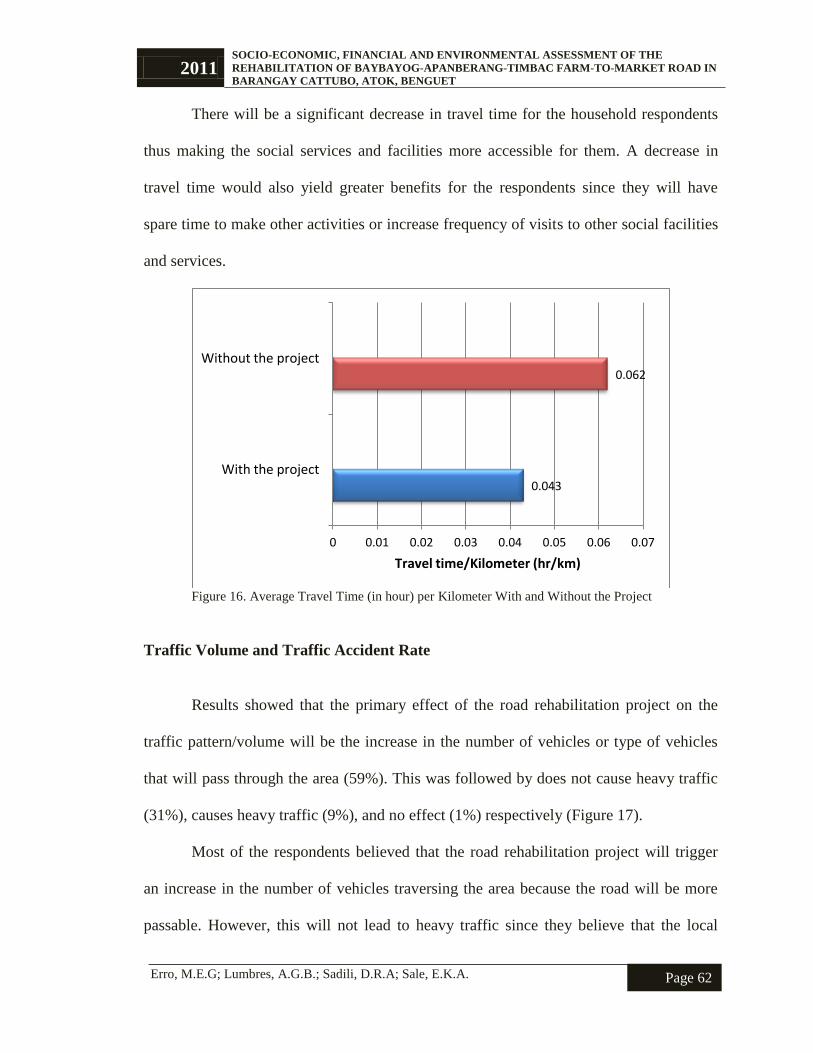
2011 SOCIO-ECONOMIC, FINANCIAL AND ENVIRONMENTAL ASSESSMENT OF THE
REHABILITATION OF BAYBAYOG-APANBERANG-TIMBAC FARM-TO-MARKET ROAD IN
BARANGAY CATTUBO, ATOK, BENGUET
Erro, M.E.G; Lumbres, A.G.B.; Sadili, D.R.A; Sale, E.K.A.
Page 62
There will be a significant decrease in travel time for the household respondents
thus making the social services and facilities more accessible for them. A decrease in
travel time would also yield greater benefits for the respondents since they will have
spare time to make other activities or increase frequency of visits to other social facilities
and services.
Figure 16. Average Travel Time (in hour) per Kilometer With and Without the Project
Traffic Volume and Traffic Accident Rate
Results showed that the primary effect of the road rehabilitation project on the
traffic pattern/volume will be the increase in the number of vehicles or type of vehicles
that will pass through the area (59%). This was followed by does not cause heavy traffic
(31%), causes heavy traffic (9%), and no effect (1%) respectively (Figure 17).
Most of the respondents believed that the road rehabilitation project will trigger
an increase in the number of vehicles traversing the area because the road will be more
passable. However, this will not lead to heavy traffic since they believe that the local
0.043
0.062
0 0.01 0.02 0.03 0.04 0.05 0.06 0.07
With the project
Without the project
Travel time/Kilometer (hr/km)
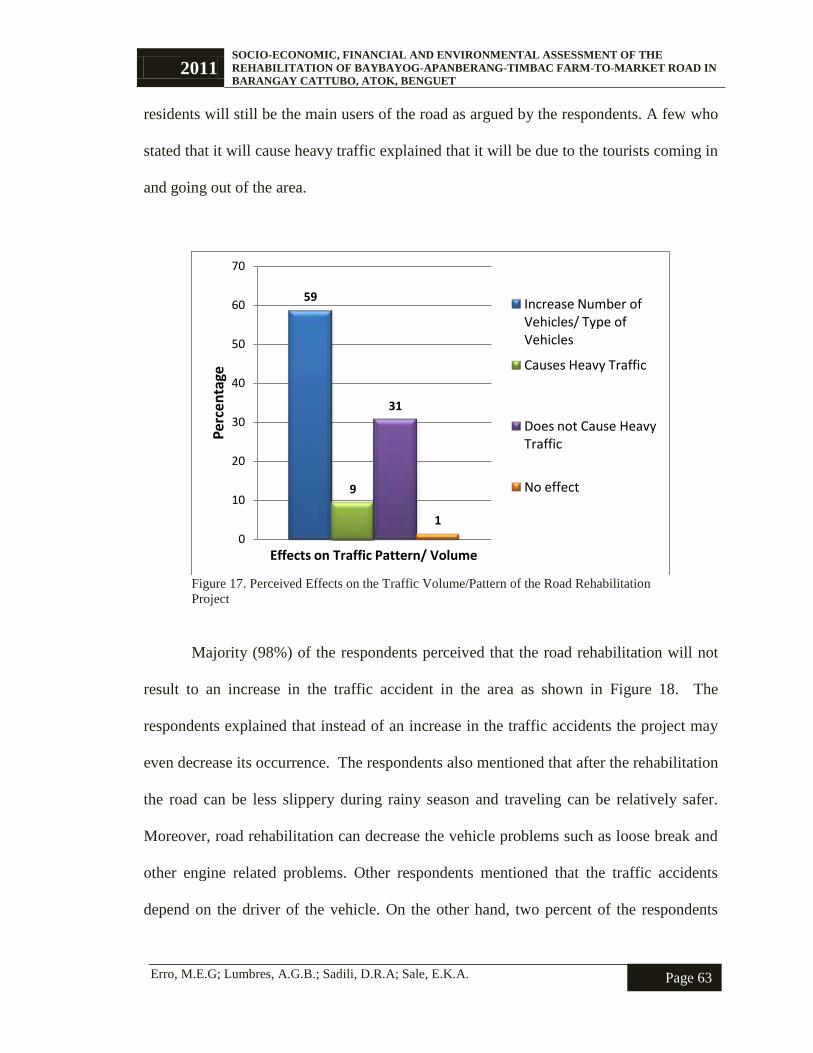
2011 SOCIO-ECONOMIC, FINANCIAL AND ENVIRONMENTAL ASSESSMENT OF THE
REHABILITATION OF BAYBAYOG-APANBERANG-TIMBAC FARM-TO-MARKET ROAD IN
BARANGAY CATTUBO, ATOK, BENGUET
Erro, M.E.G; Lumbres, A.G.B.; Sadili, D.R.A; Sale, E.K.A.
Page 63
residents will still be the main users of the road as argued by the respondents. A few who
stated that it will cause heavy traffic explained that it will be due to the tourists coming in
and going out of the area.
Figure 17. Perceived Effects on the Traffic Volume/Pattern of the Road Rehabilitation
Project
Majority (98%) of the respondents perceived that the road rehabilitation will not
result to an increase in the traffic accident in the area as shown in Figure 18. The
respondents explained that instead of an increase in the traffic accidents the project may
even decrease its occurrence. The respondents also mentioned that after the rehabilitation
the road can be less slippery during rainy season and traveling can be relatively safer.
Moreover, road rehabilitation can decrease the vehicle problems such as loose break and
other engine related problems. Other respondents mentioned that the traffic accidents
depend on the driver of the vehicle. On the other hand, two percent of the respondents
59
9
31
1
0
10
20
30
40
50
60
70
Per
cen
tage
Effects on Traffic Pattern/ Volume
Increase Number of Vehicles/ Type of Vehicles
Causes Heavy Traffic
Does not Cause Heavy Traffic
No effect

2011 SOCIO-ECONOMIC, FINANCIAL AND ENVIRONMENTAL ASSESSMENT OF THE
REHABILITATION OF BAYBAYOG-APANBERANG-TIMBAC FARM-TO-MARKET ROAD IN
BARANGAY CATTUBO, ATOK, BENGUET
Erro, M.E.G; Lumbres, A.G.B.; Sadili, D.R.A; Sale, E.K.A.
Page 64
perceived that the project can lead to more accidents since more vehicles may pass the
road after rehabilitation.
Figure 18. Perceived Effects on the Traffic Accident on the Area
Income and Other Perceived Impacts
On the income and other perceived impacts, results showed that increase in
income (53%) is the most frequently mentioned impact of the road rehabilitation project.
This was followed by more job opportunities (21%), decrease in transportation
cost/decrease in maintenance cost (7%), no impact at all (6%), no change in income
(4%), and increase in travel frequency of crops/ increase in number of crops transported
(1%) respectively (Figure 19).
According to the respondents, the increase in income will not only be for the
farmers but also for the other residents in the area. Increased income was also perceived
to be directly related to increase in job opportunities in the area where the local residents
2%
98%
INCREASE
DECREASE
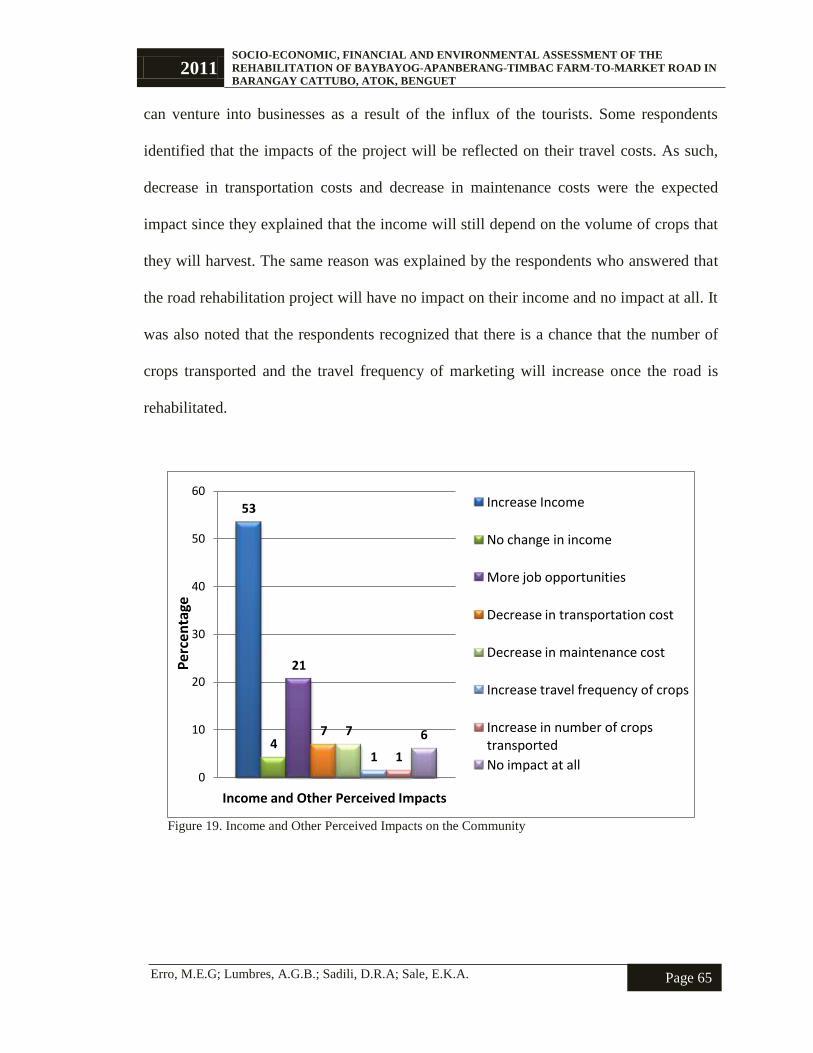
2011 SOCIO-ECONOMIC, FINANCIAL AND ENVIRONMENTAL ASSESSMENT OF THE
REHABILITATION OF BAYBAYOG-APANBERANG-TIMBAC FARM-TO-MARKET ROAD IN
BARANGAY CATTUBO, ATOK, BENGUET
Erro, M.E.G; Lumbres, A.G.B.; Sadili, D.R.A; Sale, E.K.A.
Page 65
can venture into businesses as a result of the influx of the tourists. Some respondents
identified that the impacts of the project will be reflected on their travel costs. As such,
decrease in transportation costs and decrease in maintenance costs were the expected
impact since they explained that the income will still depend on the volume of crops that
they will harvest. The same reason was explained by the respondents who answered that
the road rehabilitation project will have no impact on their income and no impact at all. It
was also noted that the respondents recognized that there is a chance that the number of
crops transported and the travel frequency of marketing will increase once the road is
rehabilitated.
Figure 19. Income and Other Perceived Impacts on the Community
53
4
21
7 7
1 1
6
0
10
20
30
40
50
60
Per
cen
tage
Income and Other Perceived Impacts
Increase Income
No change in income
More job opportunities
Decrease in transportation cost
Decrease in maintenance cost
Increase travel frequency of crops
Increase in number of crops transported
No impact at all

2011 SOCIO-ECONOMIC, FINANCIAL AND ENVIRONMENTAL ASSESSMENT OF THE
REHABILITATION OF BAYBAYOG-APANBERANG-TIMBAC FARM-TO-MARKET ROAD IN
BARANGAY CATTUBO, ATOK, BENGUET
Erro, M.E.G; Lumbres, A.G.B.; Sadili, D.R.A; Sale, E.K.A.
Page 66
Employment Impact
The project is expected to generate jobs for 11 skilled and 44 unskilled laborers,
based on the individual project program of work prepared by the municipal engineer of
Atok. It will cover 53 working days during the construction phase.
For the maintenance of the road, it was estimated that the project can generate
jobs for 38 skilled laborers in a day or 38 working days for a laborer annually. In terms of
unskilled laborers, the project can create jobs for 86 laborers in a day or 86 working days
for a single laborer every year. The number of skilled and unskilled workers was derived
from the financial maintenance labor cost computed and the DPWH basic daily wage
rates of Php 221.40 and Php 205.00, respectively.
The road rehabilitation project will increase local employment in the area if the
local residents will be hired as laborers. In effect, this will serve as an additional source
of income other than farming.
Social Patterns, Culture and Ethnicity
According to the results of the survey, 68% of the respondents believed that the
project will influence their social patterns/daily activity patterns while the remaining 32%
believed otherwise (Figure 20). The social patterns/daily activity patterns will be
influenced by the increase in the number of vehicles passing the area resulting to the
augmentation in the frequency of travel of the residents. The increase in travel frequency
will trigger increase in the activities of the residents, since the work in the transportation
of crops will be faster and easier which can save time. There will also have a possibi
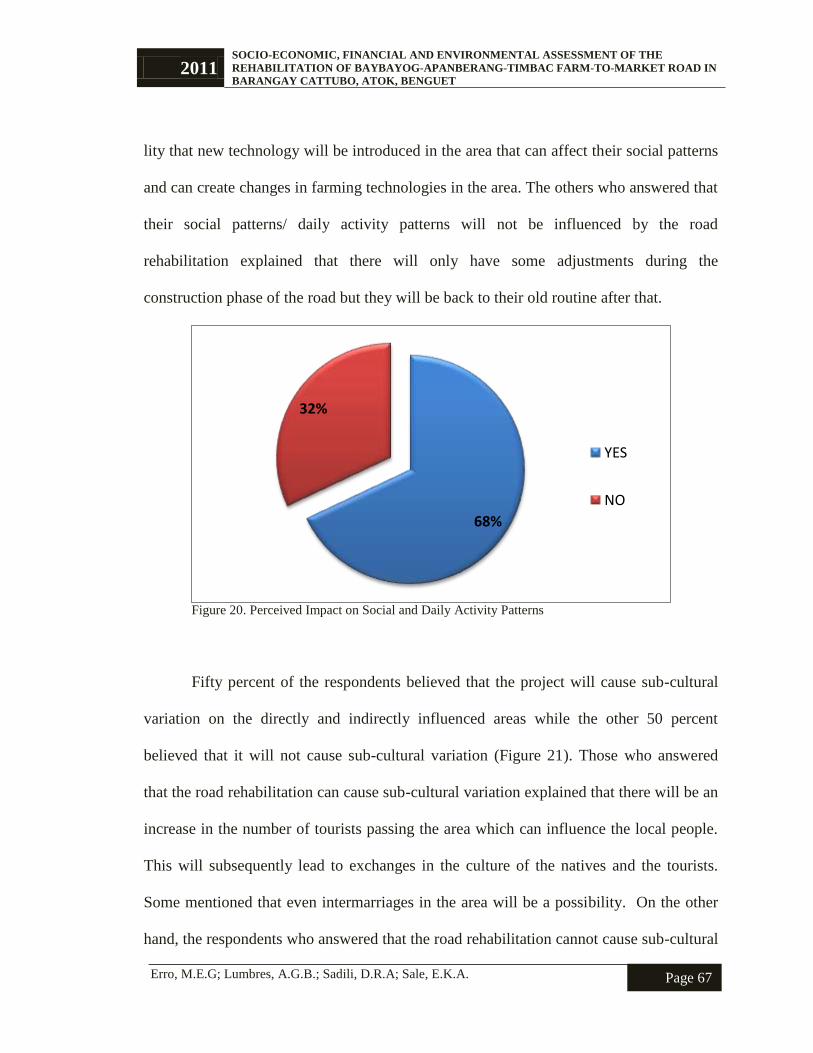
2011 SOCIO-ECONOMIC, FINANCIAL AND ENVIRONMENTAL ASSESSMENT OF THE
REHABILITATION OF BAYBAYOG-APANBERANG-TIMBAC FARM-TO-MARKET ROAD IN
BARANGAY CATTUBO, ATOK, BENGUET
Erro, M.E.G; Lumbres, A.G.B.; Sadili, D.R.A; Sale, E.K.A.
Page 67
lity that new technology will be introduced in the area that can affect their social patterns
and can create changes in farming technologies in the area. The others who answered that
their social patterns/ daily activity patterns will not be influenced by the road
rehabilitation explained that there will only have some adjustments during the
construction phase of the road but they will be back to their old routine after that.
Figure 20. Perceived Impact on Social and Daily Activity Patterns
Fifty percent of the respondents believed that the project will cause sub-cultural
variation on the directly and indirectly influenced areas while the other 50 percent
believed that it will not cause sub-cultural variation (Figure 21). Those who answered
that the road rehabilitation can cause sub-cultural variation explained that there will be an
increase in the number of tourists passing the area which can influence the local people.
This will subsequently lead to exchanges in the culture of the natives and the tourists.
Some mentioned that even intermarriages in the area will be a possibility. On the other
hand, the respondents who answered that the road rehabilitation cannot cause sub-cultural
68%
32%
YES
NO

2011 SOCIO-ECONOMIC, FINANCIAL AND ENVIRONMENTAL ASSESSMENT OF THE
REHABILITATION OF BAYBAYOG-APANBERANG-TIMBAC FARM-TO-MARKET ROAD IN
BARANGAY CATTUBO, ATOK, BENGUET
Erro, M.E.G; Lumbres, A.G.B.; Sadili, D.R.A; Sale, E.K.A.
Page 68
variation stated that there will also have an increase in the number of tourists but these
tourists will just pass by and will only serve as observers of the natives’ culture. The local
culture will become a tourist attraction and thus the tourist shall adapt to their culture.
Furthermore, they said that instead of the local culture being affected, it is more probable
that they can affect the culture of the tourists.
Figure 21. Perceived Impact on Sub-cultural Variation
Ninety-four percent of the respondents answered that the road rehabilitation
project can increase leisure and cultural opportunities for the residents in the area while
only six percent of the respondents said that the project will not increase their leisure and
cultural opportunities (Figure 22). The increase in leisure and cultural opportunities shall
be influenced by the perceived increase in the number of tourists in the area, the possible
increase in travel frequency of the residents to other places, and lesser time spent for
travelling. On the other hand, those who answered that there will be no increase in leisure
and cultural opportunities explained that it will depend on the income of the people and
50% 50%
YES
NO
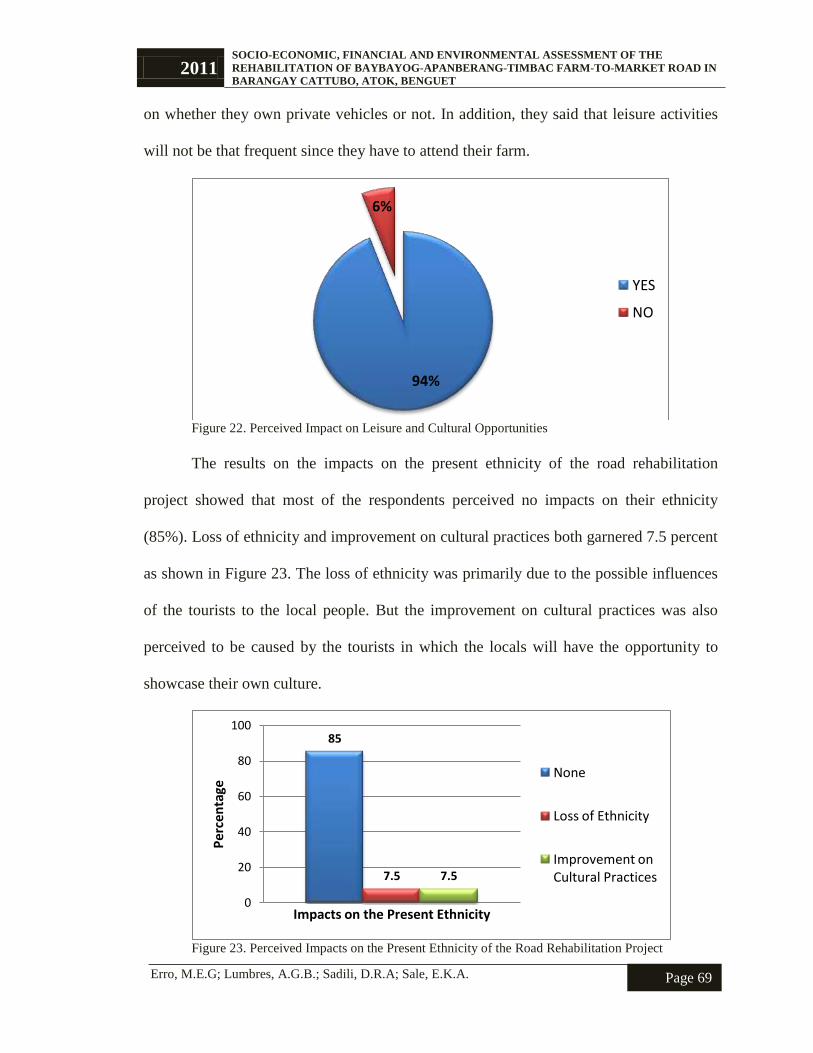
2011 SOCIO-ECONOMIC, FINANCIAL AND ENVIRONMENTAL ASSESSMENT OF THE
REHABILITATION OF BAYBAYOG-APANBERANG-TIMBAC FARM-TO-MARKET ROAD IN
BARANGAY CATTUBO, ATOK, BENGUET
Erro, M.E.G; Lumbres, A.G.B.; Sadili, D.R.A; Sale, E.K.A.
Page 69
on whether they own private vehicles or not. In addition, they said that leisure activities
will not be that frequent since they have to attend their farm.
Figure 22. Perceived Impact on Leisure and Cultural Opportunities
The results on the impacts on the present ethnicity of the road rehabilitation
project showed that most of the respondents perceived no impacts on their ethnicity
(85%). Loss of ethnicity and improvement on cultural practices both garnered 7.5 percent
as shown in Figure 23. The loss of ethnicity was primarily due to the possible influences
of the tourists to the local people. But the improvement on cultural practices was also
perceived to be caused by the tourists in which the locals will have the opportunity to
showcase their own culture.
Figure 23. Perceived Impacts on the Present Ethnicity of the Road Rehabilitation Project
94%
6%
YES
NO
85
7.5 7.5
0
20
40
60
80
100
Per
cen
tage
Impacts on the Present Ethnicity
None
Loss of Ethnicity
Improvement on Cultural Practices

2011 SOCIO-ECONOMIC, FINANCIAL AND ENVIRONMENTAL ASSESSMENT OF THE
REHABILITATION OF BAYBAYOG-APANBERANG-TIMBAC FARM-TO-MARKET ROAD IN
BARANGAY CATTUBO, ATOK, BENGUET
Erro, M.E.G; Lumbres, A.G.B.; Sadili, D.R.A; Sale, E.K.A.
Page 70
Access to Social Services
In terms of distances to social services, the household respondents are grouped
according to their location. The average distances from the different social services were
computed for every site. For Barangay Pacso, the farthest are the trading posts. These
trading posts can be found in La Trinidad (93.2 km) and Baguio City (94.22 km). In
terms of the market and hospital, both have the same average distance of seven kilometer
from Pacso, while their place of worship is six kilometer away from their residence. The
social service nearest to the people of Pacso was the school which is five kilometer far.
Likewise, La Trinidad (58 km) and Baguio City (62.55 km) trading posts are
farthest from Barangay Natubleng. Their worship area is 16.56 km away from the
barangay while their hospital and market are 12.6 and 12.75 km away, respectively.
Locations of their schools are 6.62 km from their residences relatively farther compared
with Barangay Pacso. Their places of work are the nearest to their barangay at only 0.5
km. It is relatively nearer compared to the places of work in the other barangay.
For Sitio Calasipan, trading posts located in Baguio City and La Trinidad are the
two farthest. Baguio City and La Trinidad had an average distance of 58 and 55.67 km
from the area, respectively. Additionally, schools in Calasipan are relatively farther
compared to the two other barangays. On the average, schools were 35.7 km away from
the area. Similarly, the households’ location was far from the hospital at 19.75 km. The
market, which is 14.03 km away, is also relatively farther from the households in the area
compared to the two other barangays mentioned earlier. On the other hand, their places of
worship and the places of work which are only 1.07 km and 0.65 km respectively are the
nearest places from the households.
2011 SOCIO-ECONOMIC, FINANCIAL AND ENVIRONMENTAL ASSESSMENT OF THE
REHABILITATION OF BAYBAYOG-APANBERANG-TIMBAC FARM-TO-MARKET ROAD IN
BARANGAY CATTUBO, ATOK, BENGUET
Erro, M.E.G; Lumbres, A.G.B.; Sadili, D.R.A; Sale, E.K.A.
Page 71
Households from Sitio Baybayog were not visiting Baguio for trading of crops
and other social activities. They only go to La Trinidad as their place for trading goods.
La Trinidad is 59.43 km away from the households’ locations. The place also had the
same average distance to their market and hospital (10 km) while their places of worship
were nearer, which is 1.2 km on the average. Similar to the three other places mentioned
above, households from Baybayog also live near their places of work which is only 0.1
km far.
In the case of Sitio Timbac, Baguio (60 km) and La Trinidad (57 km) were the
farthest. In addition, distances of the hospital, market, and places of work have almost the
same average distance to the households at 7.67, 7.14, and 7.13 km, respectively. For
their places of worship, an average of 3.04 km was estimated. The nearest of all the social
services being used by the respondents were the schools (0.69 km).
In Sitio Apanberang, Baguio and La Trinidad are about 57.5 and 55.25 km away,
correspondingly. It was noted that Itogon was the farthest, which is 75 km away from the
households. It was not that significant since as discussed earlier, only one household
member regularly visits the place. The same is true for Bunglo which is 8 km away from
Apanberang. It was also found out that the market is relatively far from the households
(15.14 km). The hospital was just 8.2 km away from the household respondents while
their places of worship were near at only 5.57 km. Similarly, the schools are also nearer
to the respondents (2.83 km). There was no distance indicated for the workplace since it
is located where the respondents’ houses were built.
It can be noted that most of the respondents visited Baguio and La Trinidad
despite its far location from the households. Only respondents from Sitio Baybayog did

2011 SOCIO-ECONOMIC, FINANCIAL AND ENVIRONMENTAL ASSESSMENT OF THE
REHABILITATION OF BAYBAYOG-APANBERANG-TIMBAC FARM-TO-MARKET ROAD IN
BARANGAY CATTUBO, ATOK, BENGUET
Erro, M.E.G; Lumbres, A.G.B.; Sadili, D.R.A; Sale, E.K.A.
Page 72
not go to Baguio for trading and other social services. Schools, market, places of work,
hospitals, and places of worship are relatively near the respondents’ residences
consequently making them visit and use those social facilities more frequently. In
general, social services available are near to the respondents’ place which makes them
accessible; nonetheless, accessibility of social services can be further improved if the
road will be rehabilitated.
Figure 24. Distance of Household Respondents to Social Services
2.83
0.69
2
35.7
6.62
5
15.14
7.14
10
14.03
12.75
7
5.57
3.04
1.2
1.07
16.56
6
8.2
7.67
10
19.75
12.6
7
7.13
0.1
0.65
0.5
2
55.25
57
59.43
55.67
58
93.2
57.5
60
58
62.55
94.22
8 75
0 20 40 60 80 100
Apanberang
Timbac
Baybayog
Calasipan
Natubleng
Pacso
Distance (km)
Itugun
Bunglo
Baguio
La Trinidad
Place of Work
Hospital
Church
Market
School
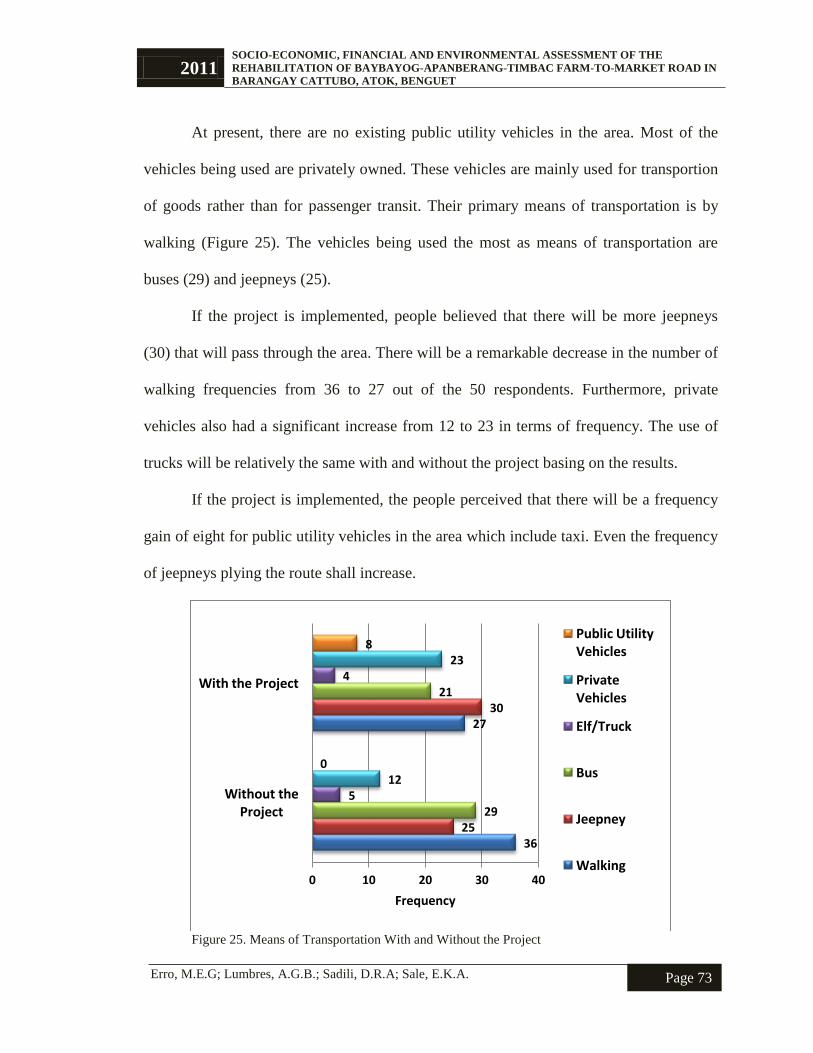
2011 SOCIO-ECONOMIC, FINANCIAL AND ENVIRONMENTAL ASSESSMENT OF THE
REHABILITATION OF BAYBAYOG-APANBERANG-TIMBAC FARM-TO-MARKET ROAD IN
BARANGAY CATTUBO, ATOK, BENGUET
Erro, M.E.G; Lumbres, A.G.B.; Sadili, D.R.A; Sale, E.K.A.
Page 73
At present, there are no existing public utility vehicles in the area. Most of the
vehicles being used are privately owned. These vehicles are mainly used for transportion
of goods rather than for passenger transit. Their primary means of transportation is by
walking (Figure 25). The vehicles being used the most as means of transportation are
buses (29) and jeepneys (25).
If the project is implemented, people believed that there will be more jeepneys
(30) that will pass through the area. There will be a remarkable decrease in the number of
walking frequencies from 36 to 27 out of the 50 respondents. Furthermore, private
vehicles also had a significant increase from 12 to 23 in terms of frequency. The use of
trucks will be relatively the same with and without the project basing on the results.
If the project is implemented, the people perceived that there will be a frequency
gain of eight for public utility vehicles in the area which include taxi. Even the frequency
of jeepneys plying the route shall increase.
Figure 25. Means of Transportation With and Without the Project
36
27
25
30
29
21
5
4
12
23
0
8
0 10 20 30 40
Without the Project
With the Project
Frequency
Public Utility Vehicles
Private Vehicles
Elf/Truck
Bus
Jeepney
Walking

2011 SOCIO-ECONOMIC, FINANCIAL AND ENVIRONMENTAL ASSESSMENT OF THE
REHABILITATION OF BAYBAYOG-APANBERANG-TIMBAC FARM-TO-MARKET ROAD IN
BARANGAY CATTUBO, ATOK, BENGUET
Erro, M.E.G; Lumbres, A.G.B.; Sadili, D.R.A; Sale, E.K.A.
Page 74
Other Social Benefits
When asked about the other possible social benefits of the road rehabilitation
project, majority of the respondents (41 %) answered ease in the access to social services
(Figure 26). Other benefits of the project that are mentioned are business opportunities,
travel safety, lighter workload for the farmers, modernization or introduction of new
technology, easy implementation of the laws in the area, health benefits, and existence of
public vehicles. The least mentioned benefits (2%) are decrease vehicle damages,
improvement on the quality of life, improve communication, and higher possibility of
electric supply provision.
Since the project is on road rehabilitation, the respondents said that it can result to
quick access to social services especially the basic ones like market, schools, and
hospitals. Travel safety was mentioned as another social benefit since they argue that the
road rehabilitation project will lessen the occurrence of accidents in the area as risk-prone
spots will be identified and improved. Moreover, the respondents said that the
rehabilitation of the road can make the work of the farmers easier since there will be less
hassle in transporting their products, and thus it can save time which they can allocate for
other activities. For the local residents, the increment on the number of tourists passing
through the area will generate business opportunities. Another notable social benefit was
the possible existence of public vehicles in the area since there are no public utility
vehicles traversing the farm-to-market road.

2011 SOCIO-ECONOMIC, FINANCIAL AND ENVIRONMENTAL ASSESSMENT OF THE
REHABILITATION OF BAYBAYOG-APANBERANG-TIMBAC FARM-TO-MARKET ROAD IN
BARANGAY CATTUBO, ATOK, BENGUET
Erro, M.E.G; Lumbres, A.G.B.; Sadili, D.R.A; Sale, E.K.A.
Page 75
Figure 26. Other Possible Social Benefits of the Road Rehabilitation Project
FINANCIAL AND ECONOMIC IMPACTS
Project Cost
Based from the financial cost computation of the proposed Baybayog-
Apanberang- Timbac Farm-to-Market road rehabilitation project, the total cost amounted
to Php. 8,360,043.30 within the project span of 20 years. The total cost figure is derived
by getting the sum of capital investment which is the total costs from the construction
phase, and working capital which is the expected costs for the road maintenance once it is
completed. The road rehabilitation estimated to be finished by the first year of the project
while the maintenance operation is expected to start on the second year and end on the
twentieth year. Replacement cost was excluded since the project is on road rehabilitation.
The detailed computation for the project costs is shown in Appendix F.
41
12 11 11
5 4 4 4
2 2 2 2
0
5
10
15
20
25
30
35
40
45
Pe
rce
nta
ge
Perceived Social Benefits
Ease in Access to Social Services
Business Opportunities
Safety
Lighter Workload for the Farmers
Modernization/ Access to New Technology Easy Implementation of Laws
Health Benefits
Existence of Public Vehicles
Decrease Vehicle Damages
Improvement on the Quality of Life Improve Communication
Possibility of Electric Supply Provision

2011 SOCIO-ECONOMIC, FINANCIAL AND ENVIRONMENTAL ASSESSMENT OF THE
REHABILITATION OF BAYBAYOG-APANBERANG-TIMBAC FARM-TO-MARKET ROAD IN
BARANGAY CATTUBO, ATOK, BENGUET
Erro, M.E.G; Lumbres, A.G.B.; Sadili, D.R.A; Sale, E.K.A.
Page 76
The capital investment for the project amounted to Php. 3,500,000 based from the
individual project program of work prepared by the Office of the Municipal Engineer in
Atok. The table below shows the distribution of estimated expenditures for the project.
Table 4. Items and Percentage Allocation for Capital Investment
ITEM PERCENT OF
TOTAL
AMOUNT
1. Direct Costs
a. Total Cost of Materials 68.22 Php 2,390,140
b. Labor Cost
- Skilled (20.50%)
- Unskilled (79.50%)
8.54 299,150
c. Equipment Expense 2.06 72,000.00
2. Indirect Costs
a. 7% Tax 7.00 245,263
b. 18% Mark Up (CP & Con) 14.19 497,032
c. Engineering/Administration 0.00
3. TOTAL Estimated Cost 100.00 Php 3,503,305
A large portion (68.22%) of the total estimated cost was devoted to the cost of
materials to be used in the road rehabilitation project. This was followed by mark up
(14.19%) which is added onto the total cost of the project to cope with the possible losses
during the project implementation. Labor cost which is divided into skilled and unskilled
laborers only represents 8.54% of the total capital investment cost. It was noted that the
engineering and administration has zero percent of the total cost.
The working capital was estimated at Php. 4,858,700 during the 20-year project
span. This included labor cost, cost of materials, and management and supervision. The
working capital is projected using linear projection method. Table 5 shows the
distribution of maintenance cost on the project.
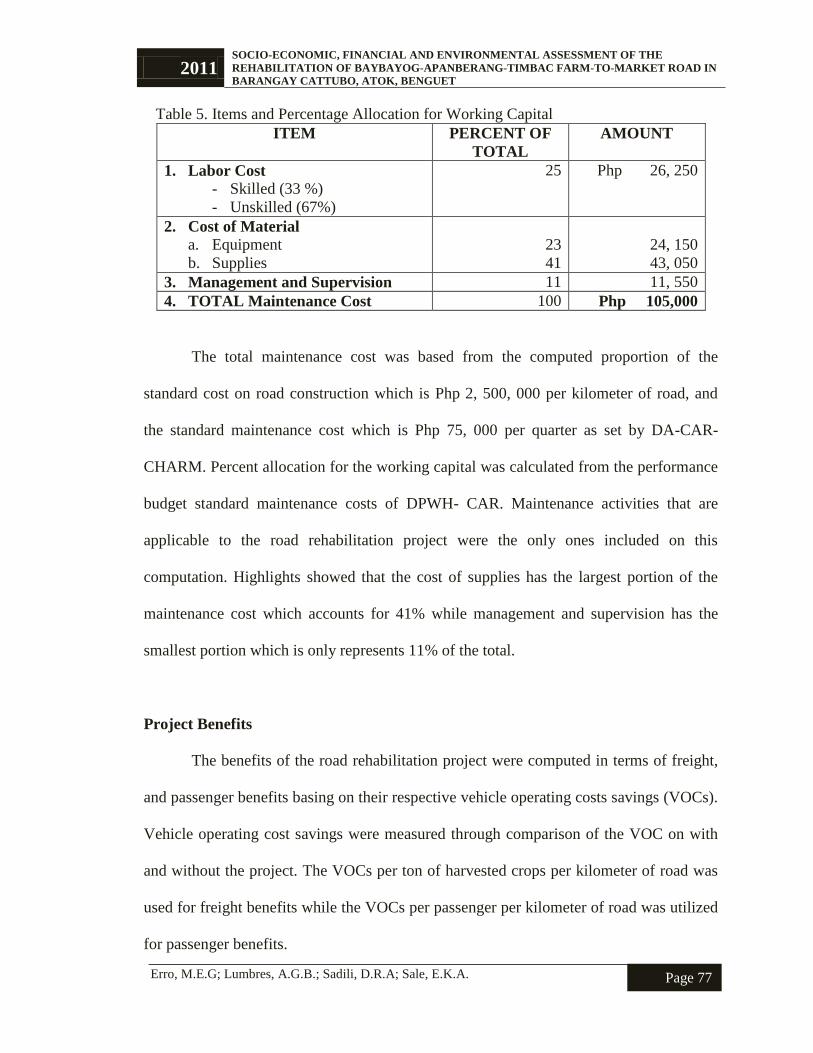
2011 SOCIO-ECONOMIC, FINANCIAL AND ENVIRONMENTAL ASSESSMENT OF THE
REHABILITATION OF BAYBAYOG-APANBERANG-TIMBAC FARM-TO-MARKET ROAD IN
BARANGAY CATTUBO, ATOK, BENGUET
Erro, M.E.G; Lumbres, A.G.B.; Sadili, D.R.A; Sale, E.K.A.
Page 77
Table 5. Items and Percentage Allocation for Working Capital
ITEM PERCENT OF
TOTAL
AMOUNT
1. Labor Cost
- Skilled (33 %)
- Unskilled (67%)
25 Php 26, 250
2. Cost of Material
a. Equipment
b. Supplies
23
41
24, 150
43, 050
3. Management and Supervision 11 11, 550
4. TOTAL Maintenance Cost 100 Php 105,000
The total maintenance cost was based from the computed proportion of the
standard cost on road construction which is Php 2, 500, 000 per kilometer of road, and
the standard maintenance cost which is Php 75, 000 per quarter as set by DA-CAR-
CHARM. Percent allocation for the working capital was calculated from the performance
budget standard maintenance costs of DPWH- CAR. Maintenance activities that are
applicable to the road rehabilitation project were the only ones included on this
computation. Highlights showed that the cost of supplies has the largest portion of the
maintenance cost which accounts for 41% while management and supervision has the
smallest portion which is only represents 11% of the total.
Project Benefits
The benefits of the road rehabilitation project were computed in terms of freight,
and passenger benefits basing on their respective vehicle operating costs savings (VOCs).
Vehicle operating cost savings were measured through comparison of the VOC on with
and without the project. The VOCs per ton of harvested crops per kilometer of road was
used for freight benefits while the VOCs per passenger per kilometer of road was utilized
for passenger benefits.

2011 SOCIO-ECONOMIC, FINANCIAL AND ENVIRONMENTAL ASSESSMENT OF THE
REHABILITATION OF BAYBAYOG-APANBERANG-TIMBAC FARM-TO-MARKET ROAD IN
BARANGAY CATTUBO, ATOK, BENGUET
Erro, M.E.G; Lumbres, A.G.B.; Sadili, D.R.A; Sale, E.K.A.
Page 78
Freight benefits were also based on the crops that are commonly planted in the
three directly influenced areas, and the total area allotted for these crops. It was identified
that the most common crops in the barangay are radish, carrots, potato, and cabbage.
Other crops that are mentioned from the survey were grouped together which include
Chinese cabbage, garden peas, beans, rice, tomato, cauliflower, broccoli and celery. The
estimated freight benefit is Php 1,239,338 per year. (Appendix F, Table 15). A total of
Php. 24,786,772 will be the freight benefit within 20 years time.
Passenger benefits were also based from the number of household travels per
month and the total household population in the three directly influenced areas. The
household populations of Barangay Cattubo, Natubleng, and Pacso were projected using
the linear function technique. The values were determined to project the number of
passenger that will utilize the road given the future time. Passenger benefits amounted to
Php. 113, 021 on the initial year after road completion. The project will yield an
aggregated total of Php. 2,958,649 passenger benefit within 20 years time. Appendix F
(Table 19) provides the detailed computation for the passenger benefits. The total benefit
of the project is estimated at Php.27,745,422 within the project span of 20 years.
Financial Evaluation
Table 6 shows that the Net Present Value (NPV) obtained is 3,129,865 pesos
given a discount rate of 15%. The NPV computed indicates that the project is worthwhile
to undertake since a positive result would mean that the project benefits shall exceed
costs given the 20-year accounting period.
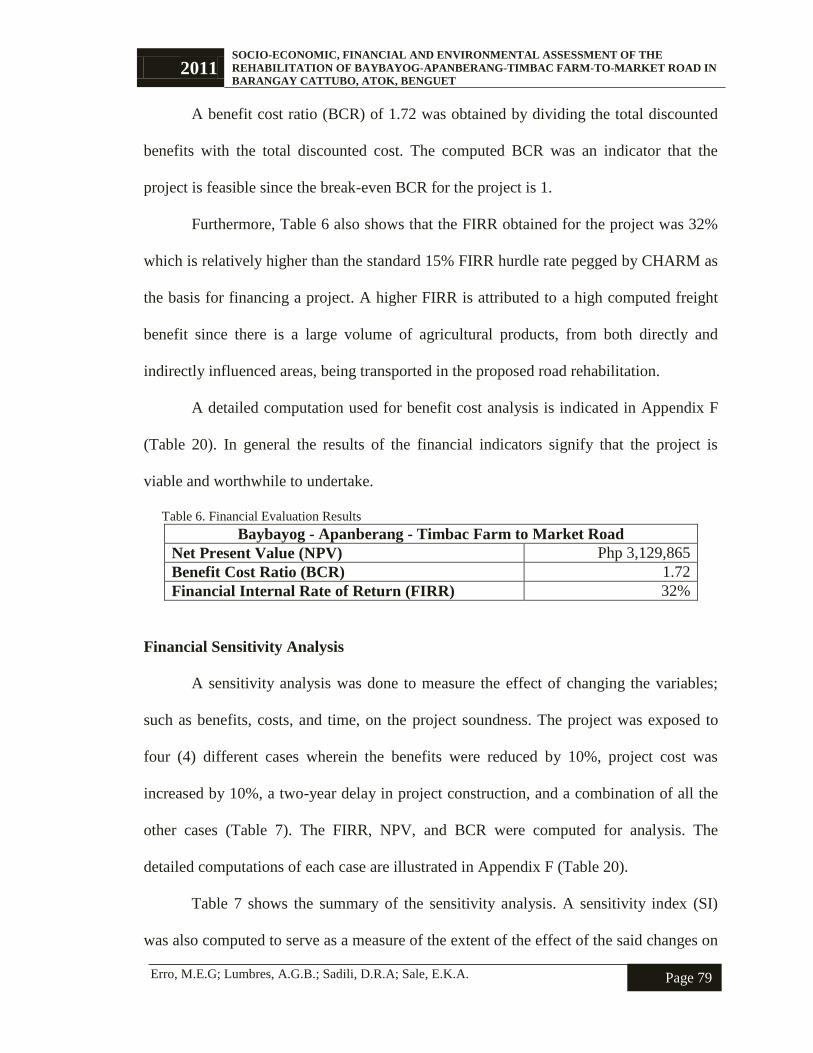
2011 SOCIO-ECONOMIC, FINANCIAL AND ENVIRONMENTAL ASSESSMENT OF THE
REHABILITATION OF BAYBAYOG-APANBERANG-TIMBAC FARM-TO-MARKET ROAD IN
BARANGAY CATTUBO, ATOK, BENGUET
Erro, M.E.G; Lumbres, A.G.B.; Sadili, D.R.A; Sale, E.K.A.
Page 79
A benefit cost ratio (BCR) of 1.72 was obtained by dividing the total discounted
benefits with the total discounted cost. The computed BCR was an indicator that the
project is feasible since the break-even BCR for the project is 1.
Furthermore, Table 6 also shows that the FIRR obtained for the project was 32%
which is relatively higher than the standard 15% FIRR hurdle rate pegged by CHARM as
the basis for financing a project. A higher FIRR is attributed to a high computed freight
benefit since there is a large volume of agricultural products, from both directly and
indirectly influenced areas, being transported in the proposed road rehabilitation.
A detailed computation used for benefit cost analysis is indicated in Appendix F
(Table 20). In general the results of the financial indicators signify that the project is
viable and worthwhile to undertake.
Table 6. Financial Evaluation Results
Baybayog - Apanberang - Timbac Farm to Market Road
Net Present Value (NPV) Php 3,129,865
Benefit Cost Ratio (BCR) 1.72
Financial Internal Rate of Return (FIRR) 32%
Financial Sensitivity Analysis
A sensitivity analysis was done to measure the effect of changing the variables;
such as benefits, costs, and time, on the project soundness. The project was exposed to
four (4) different cases wherein the benefits were reduced by 10%, project cost was
increased by 10%, a two-year delay in project construction, and a combination of all the
other cases (Table 7). The FIRR, NPV, and BCR were computed for analysis. The
detailed computations of each case are illustrated in Appendix F (Table 20).
Table 7 shows the summary of the sensitivity analysis. A sensitivity index (SI)
was also computed to serve as a measure of the extent of the effect of the said changes on

2011 SOCIO-ECONOMIC, FINANCIAL AND ENVIRONMENTAL ASSESSMENT OF THE
REHABILITATION OF BAYBAYOG-APANBERANG-TIMBAC FARM-TO-MARKET ROAD IN
BARANGAY CATTUBO, ATOK, BENGUET
Erro, M.E.G; Lumbres, A.G.B.; Sadili, D.R.A; Sale, E.K.A.
Page 80
the project’s financial soundness. Sensitivity index were computed for each FIRR, NPV,
and BCR results.
For Case A, the total benefit was reduced by 10%. The total benefit from the base
case was reduced from Php 27,745,422 to Php 24,970,880. A reduction of 10% of the
total benefit resulted to an NPV of Php 2,380,187 with a sensitivity index of 23.95%.
Meanwhile, the FIRR computed for this case was 28% and the BCR value was 1.55.
FIRR and BCR had a sensitivity index of 71.85% and 10.00% respectively.
For Case B, the project cost was increased by 10%. This resulted to an increase in
total cost from Php. 8,360,043 to Php. 9,196,047. Increasing the cost of the project lead to
a decrease in FIRR from 32% to 29% and an SI of 71.49%. Furthermore, the BCR for
this case was 1.56 and an SI of 9.09% while the NPV was Php 2693173.69 with an SI of
13.95%.
In Case C, wherein the project will be subjected a two year delay in construction,
both the total project benefits (Php 25,012,995) and costs decreased (Php 7,874,173).
This resulted to lower FIRR of 24% and an SI of 76.09%. It also yielded an NPV of Php
1,826,932 with an SI of 41.6%3 while its BCR was 1.49. The SI computed for BCR was
13.28%.
In Case D, the sensitivity of the project was tested through a combination of all
three other cases. Case D resulted to a decrease in total benefits (Php 22,511,696) and an
increase in total cost (Php 8,661,590). Such combination led to an FIRR of only 19%
with an SI of 80.75% and an NPV of Php 896,520 with an SI of 71.36%. In addition, the
BCR obtained was 1.22 and its SI was 29.05%.
2011 SOCIO-ECONOMIC, FINANCIAL AND ENVIRONMENTAL ASSESSMENT OF THE
REHABILITATION OF BAYBAYOG-APANBERANG-TIMBAC FARM-TO-MARKET ROAD IN
BARANGAY CATTUBO, ATOK, BENGUET
Erro, M.E.G; Lumbres, A.G.B.; Sadili, D.R.A; Sale, E.K.A.
Page 81
It can be noted that all the cases obtained smaller FIRR compared to the 32%
FIRR of the base case. All the FIRR results were greater than the hurdle FIRR rate, which
is 15%. Given this, the project is still considered viable. Among the four cases, an
increase in project cost by 10%, Case B, yielded the largest FIRR (29%). Case B also had
the smallest SI which means that such case will have lesser effect on the project viability
among other cases. On the other hand, Case D yielded the smallest FIRR (19%), which is
nearer the hurdle rate. Similarly, it also revealed the largest SI (80.75), which implies that
this case will greatly affect the project compared to other cases.
Likewise, the same result was obtained for the NPV. All cases had lower values
of NPVs compared to the base case (Php3,129,865). Case B also had the largest NPV
(Php 2,693,173) among all cases while it also registered the smallest SI, which is 13.95;
whereas, for combination of all the cases, Case D expectedly had the least NPV (Php
896,520) and the largest SI at 29.05. This means that the project is least sensitive to an
increase of 10% in cost and most sensitive to a combination of all such cases.
Furthermore, the result in BCR is just the same as for the FIRR and NPV. BCR of
the four cases were smaller compared to the base BCR (1.72). A project cost increase of
10%, again had the largest BCR value (1.56) compared to other cases and at the same
time recorded the smallest SI of 9.09. Case D had the least BCR and largest SI, which are
1.22 and 29.05 respectively.
It was noted that the project would still be viable even if such cases would occur
due to the positive results of the indicators. In general, the project is least sensitive to an
increase in cost by 10% compared to other cases. A combination of a decrease in benefits

2011 SOCIO-ECONOMIC, FINANCIAL AND ENVIRONMENTAL ASSESSMENT OF THE
REHABILITATION OF BAYBAYOG-APANBERANG-TIMBAC FARM-TO-MARKET ROAD IN
BARANGAY CATTUBO, ATOK, BENGUET
Erro, M.E.G; Lumbres, A.G.B.; Sadili, D.R.A; Sale, E.K.A.
Page 82
by 10%, an increase in cost of 10%, and a delay in construction for two years would have
greater effect on the financial viability indicators of the project.
Table 7. Summary of Financial Sensitivity Test
aThe sensitivity indicator (SI) is the ratio of percentage change in FIRR in response to a percentage change in a given variable. A high
value of SI implies that the Project is sensitive to a change in that variable and vice versa.
Economic Evaluation
Based on the financial values, economic computations were derived using the
shadow prices. The shadow wage used to convert the unskilled labor cost was 0.92 and
the SCF used to convert the cost of equipments and supplies was 0.98.
The computed economic freight benefit per year is Php 1,214,250 (Appendix G,
Table 29). The 20-year project was expected to generate a total of 24,285,015 freight
benefits in economic terms. On the other hand, the computed economic passenger benefit
for the initial year of road operation is Php 123, 685. The passenger benefits for the
subsequent years were projected by incorporating the effects of the population growth
rate of Benguet. The project is expected to yield a total of 2,911,307 passenger benefit
within 20 years time. In general, the project recorded a total benefit of Php 27,196,323
within the span of 20 years.
Item Appraisal
FIRR SIa NPV SI
a BCR SI
a
Base Case 32% Php3,129,865.34 1.72
A. Benefits reduced by
10% 28% 71.85 2380187.16 23.95 1.55 10.00
B. Project Cost
increased by 10% 29% 71.49 2693173.69 13.95 1.56 9.09
C. Two- years Delay in
Construction 24% 76.09 1826932.03 41.63 1.49 13.28
D. Combination of A,
B, and C. 19% 80.75 896520.22 71.36 1.22 29.05
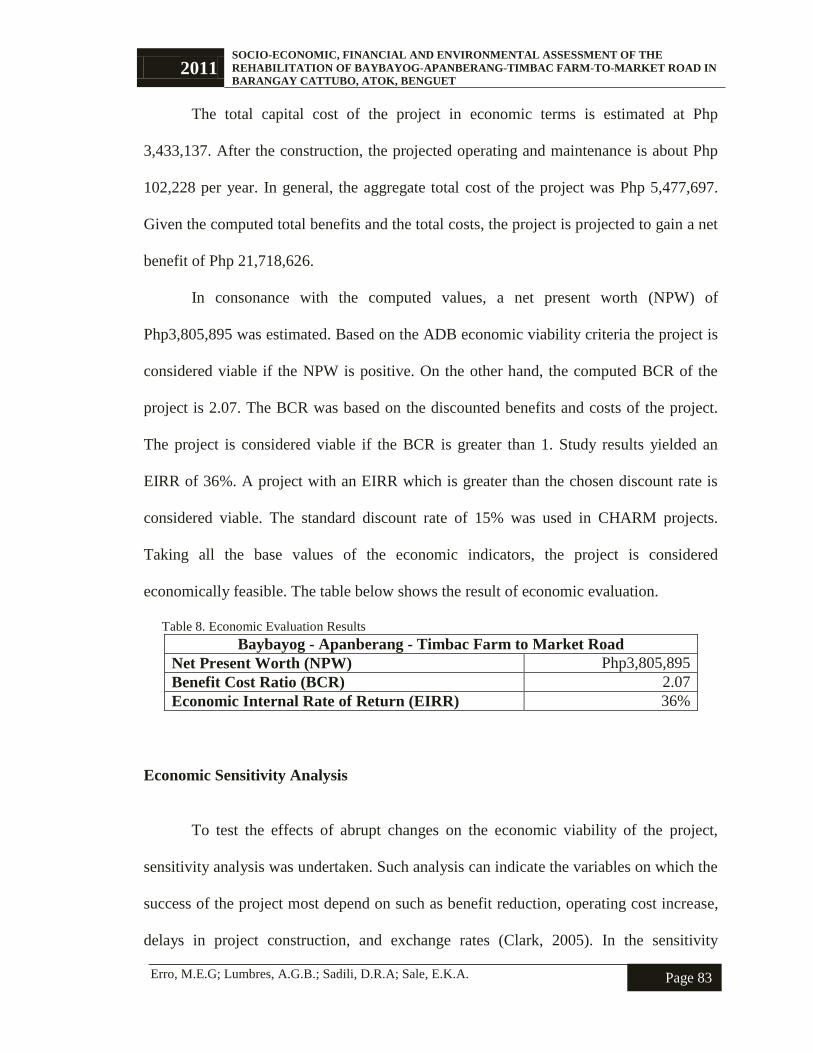
2011 SOCIO-ECONOMIC, FINANCIAL AND ENVIRONMENTAL ASSESSMENT OF THE
REHABILITATION OF BAYBAYOG-APANBERANG-TIMBAC FARM-TO-MARKET ROAD IN
BARANGAY CATTUBO, ATOK, BENGUET
Erro, M.E.G; Lumbres, A.G.B.; Sadili, D.R.A; Sale, E.K.A.
Page 83
The total capital cost of the project in economic terms is estimated at Php
3,433,137. After the construction, the projected operating and maintenance is about Php
102,228 per year. In general, the aggregate total cost of the project was Php 5,477,697.
Given the computed total benefits and the total costs, the project is projected to gain a net
benefit of Php 21,718,626.
In consonance with the computed values, a net present worth (NPW) of
Php3,805,895 was estimated. Based on the ADB economic viability criteria the project is
considered viable if the NPW is positive. On the other hand, the computed BCR of the
project is 2.07. The BCR was based on the discounted benefits and costs of the project.
The project is considered viable if the BCR is greater than 1. Study results yielded an
EIRR of 36%. A project with an EIRR which is greater than the chosen discount rate is
considered viable. The standard discount rate of 15% was used in CHARM projects.
Taking all the base values of the economic indicators, the project is considered
economically feasible. The table below shows the result of economic evaluation.
Table 8. Economic Evaluation Results
Baybayog - Apanberang - Timbac Farm to Market Road
Net Present Worth (NPW) Php3,805,895
Benefit Cost Ratio (BCR) 2.07
Economic Internal Rate of Return (EIRR) 36%
Economic Sensitivity Analysis
To test the effects of abrupt changes on the economic viability of the project,
sensitivity analysis was undertaken. Such analysis can indicate the variables on which the
success of the project most depend on such as benefit reduction, operating cost increase,
delays in project construction, and exchange rates (Clark, 2005). In the sensitivity
2011 SOCIO-ECONOMIC, FINANCIAL AND ENVIRONMENTAL ASSESSMENT OF THE
REHABILITATION OF BAYBAYOG-APANBERANG-TIMBAC FARM-TO-MARKET ROAD IN
BARANGAY CATTUBO, ATOK, BENGUET
Erro, M.E.G; Lumbres, A.G.B.; Sadili, D.R.A; Sale, E.K.A.
Page 84
analysis used to test the economic viability of the road project, three parameters were
modified –project benefit, project cost, and delay in construction.
For Case A, the benefits of the project were reduced by 10%. Given this scenario,
the total benefits from the base case decreased from Php 27,196,323 to Php 24,476,691.
The reduction in total benefits lead to the decrease of net benefits from Php 21,718,626 to
Php 18,998,994. Likewise, the EIRR decreased from 36% to 32%. The sensitivity index
of EIRR was 67.85%, which reflects the project’s sensitivity to the decrease in benefits.
Moreover, the NPW of the project decreased from Php 3,805,895 to Php3,071,130, which
can be attributed to the decreased in the net benefits. A 19.31 sensitivity index was
computed which indicates the percentage change in NPW. Consequently, the 10%
decrease in the benefits leads to the decrease in the BCR values from 2.07 to 1.87. The
sensitivity index computed for the BCR was 10. Based on the economic viability criteria,
the NPW, BCR, and EIRR reflected that the project is still feasible, though the benefits
derived has been reduced by 10%.
For Case B, the project cost was increased by 10%. From the total cost of Php
5,477,697 in the base case, it increased to Php 6,025,466. Due to the increased in the total
cost, the net benefit decreased from Php 21,718,626 to Php 21,170,856. As expected, the
EIRR, NPW, and BCR of the project also decreased. The EIRR decreased from 36% in
the base case to 33%. The sensitivity index computed for the EIRR was 67.49% which
reflects the project’s sensitivity to the increase in project cost. The NPW decreased from
Php 3,805,895 to Php 3,451,719. The percentage change in the NPW was 9.31. The BCR,
on the other hand, decreased from 2.07 to 1.89. The sensitivity index computed for the
BCR was 9.09. The sensitivity indices that were computed for EIRR, NPV, and BCR of

2011 SOCIO-ECONOMIC, FINANCIAL AND ENVIRONMENTAL ASSESSMENT OF THE
REHABILITATION OF BAYBAYOG-APANBERANG-TIMBAC FARM-TO-MARKET ROAD IN
BARANGAY CATTUBO, ATOK, BENGUET
Erro, M.E.G; Lumbres, A.G.B.; Sadili, D.R.A; Sale, E.K.A.
Page 85
case B were lower compared to case A. This shows that the project can be more
susceptible to the 10% decrease in the benefits than the 10% increase in the cost. Thus,
the increase in cost by 10 % is still feasible.
For Case C, the construction of the project was subjected to a two-year delay. Due
to the delay in the completion of the project, both the project benefits and costs
decreased. The total project benefits decreased from Php 27,196,323 to Php 24,518,373
while the total cost decreased from Php 5,477,697 to Php 5,273,241. The decrease in the
project benefits and costs leads to the decrease in the net benefit from Php 21,718,626 to
Php 19,245,132. The two years delay in the construction resulted to decreases in EIRR,
NPW, and BCR values. The EIRR decreased to 26% compared to the 36% from the base
case. The sensitivity index computed for the EIRR was 73.73%, which is relatively
higher compared to the indices for case A and B. The percentage change in NPW was
38.60 decreasing from Php 3,805,895 to 2,337,004. The BCR declined to 1.75 with a
sensitivity index of 15.67. In general, the sensitivity indices computed for case C were
relatively higher than the first two cases, which show that the project is more vulnerable
to a delay in road construction than on the decrease in benefits and increase in project
cost. Nevertheless, the project is still feasible with the two years delay in construction.
For Case D, all the parameters used in the three other cases were combined. Given
this worst case scenario, the total benefit decreased to Php 22,066,536 while the total cost
increased to Php 6,744,678. Subsequently, the net benefit was down at Php 15,321,858. It
also resulted to significant decreases in the EIRR, NPW, and BCR values. The EIRR was
estimated at 18% with a sensitivity index of 81. 93%. Moreover, the computed
percentage change in NPW was 79.88%. The NPW declined to Php 765,840.55.

2011 SOCIO-ECONOMIC, FINANCIAL AND ENVIRONMENTAL ASSESSMENT OF THE
REHABILITATION OF BAYBAYOG-APANBERANG-TIMBAC FARM-TO-MARKET ROAD IN
BARANGAY CATTUBO, ATOK, BENGUET
Erro, M.E.G; Lumbres, A.G.B.; Sadili, D.R.A; Sale, E.K.A.
Page 86
Furthermore, the computed BCR also lowered to 1.18 while the computed sensitivity
index was 42.89%.
Generally, the project can be most sensitive when all the factors were combined in
case D as illustrated in Table 9. However, if the factors were treated individually, the
project is most sensitive in a two years delay of project construction. Hence, the delay in
the schedule should be the most avoided in this particular road project. Nevertheless,
decreases in benefit and increases in cost should also be monitored since it can also affect
the economic rate of return.
Table 9. Summary of Economic Sensitivity Tests
Item Appraisal
EIRR SI NPW SI BCR SI
Base Case
36%
Php3,805,895.17
2.07
A. Benefits reduced by
10% 32% 67.85 3,071,130.33 19.31 1.87 10.00
B. Project Cost increased
by 10% 33% 67.49 3,451,719.85 9.31 1.89 9.09
C. Two- years Delay in
Construction 26% 73.73 2,337,004.10 38.60 1.75 15.67
D. Combination of A, B,
and C. 18% 81.93 765,840.55 79.88 1.18 42.89
ENVIRONMENTAL IMPACTS
The peripheral environment of the Baybayog-Apanberang-Timbac farm-to-market
road was described by Mrs. Pedrina Elias, the Municipal Environment and Natural
Resource officer-in-charge, as generally agricultural lands. She said that both sides of the
road are devoted to agriculture which is planted with major crops being produced in the
locality such as cabbage, potatoes, and carrots. Furthermore, some portions especially at
the edge of the vegetable gardens were planted with cutflowers such as calla lilies and
Shasta daisies. There were limited shrubs and bushes in the area and the upper portions of
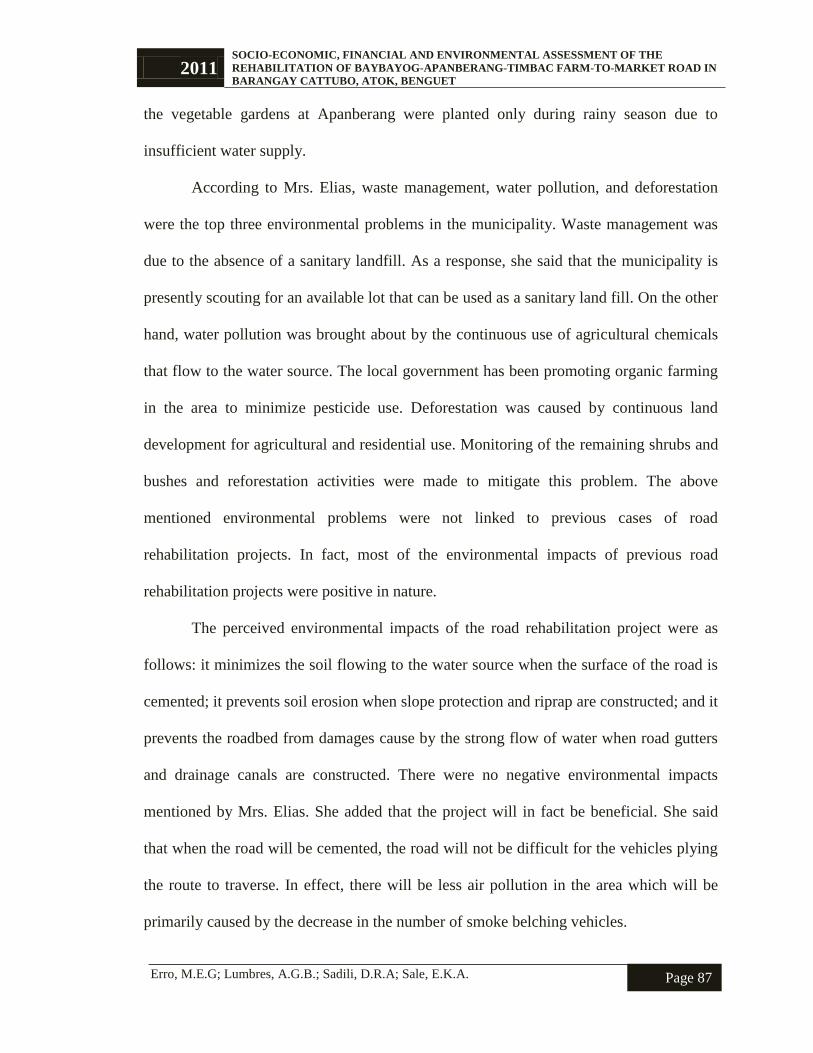
2011 SOCIO-ECONOMIC, FINANCIAL AND ENVIRONMENTAL ASSESSMENT OF THE
REHABILITATION OF BAYBAYOG-APANBERANG-TIMBAC FARM-TO-MARKET ROAD IN
BARANGAY CATTUBO, ATOK, BENGUET
Erro, M.E.G; Lumbres, A.G.B.; Sadili, D.R.A; Sale, E.K.A.
Page 87
the vegetable gardens at Apanberang were planted only during rainy season due to
insufficient water supply.
According to Mrs. Elias, waste management, water pollution, and deforestation
were the top three environmental problems in the municipality. Waste management was
due to the absence of a sanitary landfill. As a response, she said that the municipality is
presently scouting for an available lot that can be used as a sanitary land fill. On the other
hand, water pollution was brought about by the continuous use of agricultural chemicals
that flow to the water source. The local government has been promoting organic farming
in the area to minimize pesticide use. Deforestation was caused by continuous land
development for agricultural and residential use. Monitoring of the remaining shrubs and
bushes and reforestation activities were made to mitigate this problem. The above
mentioned environmental problems were not linked to previous cases of road
rehabilitation projects. In fact, most of the environmental impacts of previous road
rehabilitation projects were positive in nature.
The perceived environmental impacts of the road rehabilitation project were as
follows: it minimizes the soil flowing to the water source when the surface of the road is
cemented; it prevents soil erosion when slope protection and riprap are constructed; and it
prevents the roadbed from damages cause by the strong flow of water when road gutters
and drainage canals are constructed. There were no negative environmental impacts
mentioned by Mrs. Elias. She added that the project will in fact be beneficial. She said
that when the road will be cemented, the road will not be difficult for the vehicles plying
the route to traverse. In effect, there will be less air pollution in the area which will be
primarily caused by the decrease in the number of smoke belching vehicles.

2011 SOCIO-ECONOMIC, FINANCIAL AND ENVIRONMENTAL ASSESSMENT OF THE
REHABILITATION OF BAYBAYOG-APANBERANG-TIMBAC FARM-TO-MARKET ROAD IN
BARANGAY CATTUBO, ATOK, BENGUET
Erro, M.E.G; Lumbres, A.G.B.; Sadili, D.R.A; Sale, E.K.A.
Page 88
Environmental Quality
Majority of the respondents (32%) identified the mummies as a tourist destination
near Cattubo (Figure 27). Centuries old mummies can be found in the neighboring town
of Kabayan. The mummies showcased the history and traditions of the early inhabitants
of the town. Three other scenic spots identified by the respondents were Mt. Timbac,
Timbac Caves, and Mt. Pulag which can also be found in the Municipality of Kabayan.
Timbac caves house some of the centuries old mummies that can be found in Benguet.
Mt. Pulag was also mentioned by the respondents. It is the second highest mountain in
the Philippines, next only to Mt. Apo. The respondents as well identified their local
vegetable gardens as an emerging tourist spot. They explained that there are some tourists
that occasionally visit the vegetable terraces. There can be a potential for the local
tourism industry to develop upon the rehabilitation of the road. Four lakes, bendian
dancers, station of the cross, highest point view, and view of Benguet were also cited by
the respondents. Highest point view is located along Halsema Highway. It is the highest
point under the Philippine highway system at an elevation of 7,400 feet above sea level
(Natural Attractions handout, Atok-MENRO).
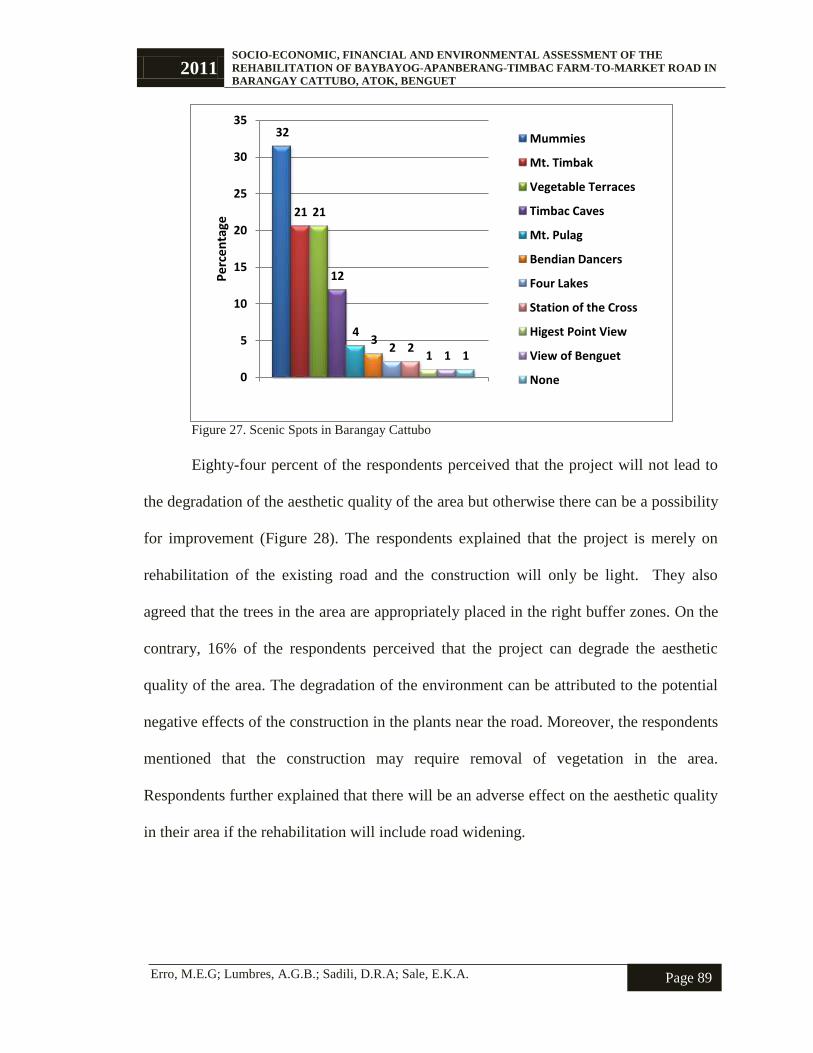
2011 SOCIO-ECONOMIC, FINANCIAL AND ENVIRONMENTAL ASSESSMENT OF THE
REHABILITATION OF BAYBAYOG-APANBERANG-TIMBAC FARM-TO-MARKET ROAD IN
BARANGAY CATTUBO, ATOK, BENGUET
Erro, M.E.G; Lumbres, A.G.B.; Sadili, D.R.A; Sale, E.K.A.
Page 89
Figure 27. Scenic Spots in Barangay Cattubo
Eighty-four percent of the respondents perceived that the project will not lead to
the degradation of the aesthetic quality of the area but otherwise there can be a possibility
for improvement (Figure 28). The respondents explained that the project is merely on
rehabilitation of the existing road and the construction will only be light. They also
agreed that the trees in the area are appropriately placed in the right buffer zones. On the
contrary, 16% of the respondents perceived that the project can degrade the aesthetic
quality of the area. The degradation of the environment can be attributed to the potential
negative effects of the construction in the plants near the road. Moreover, the respondents
mentioned that the construction may require removal of vegetation in the area.
Respondents further explained that there will be an adverse effect on the aesthetic quality
in their area if the rehabilitation will include road widening.
32
21 21
12
4 3
2 2 1 1 1
0
5
10
15
20
25
30
35
Pe
rce
nta
ge
Mummies
Mt. Timbak
Vegetable Terraces
Timbac Caves
Mt. Pulag
Bendian Dancers
Four Lakes
Station of the Cross
Higest Point View
View of Benguet
None
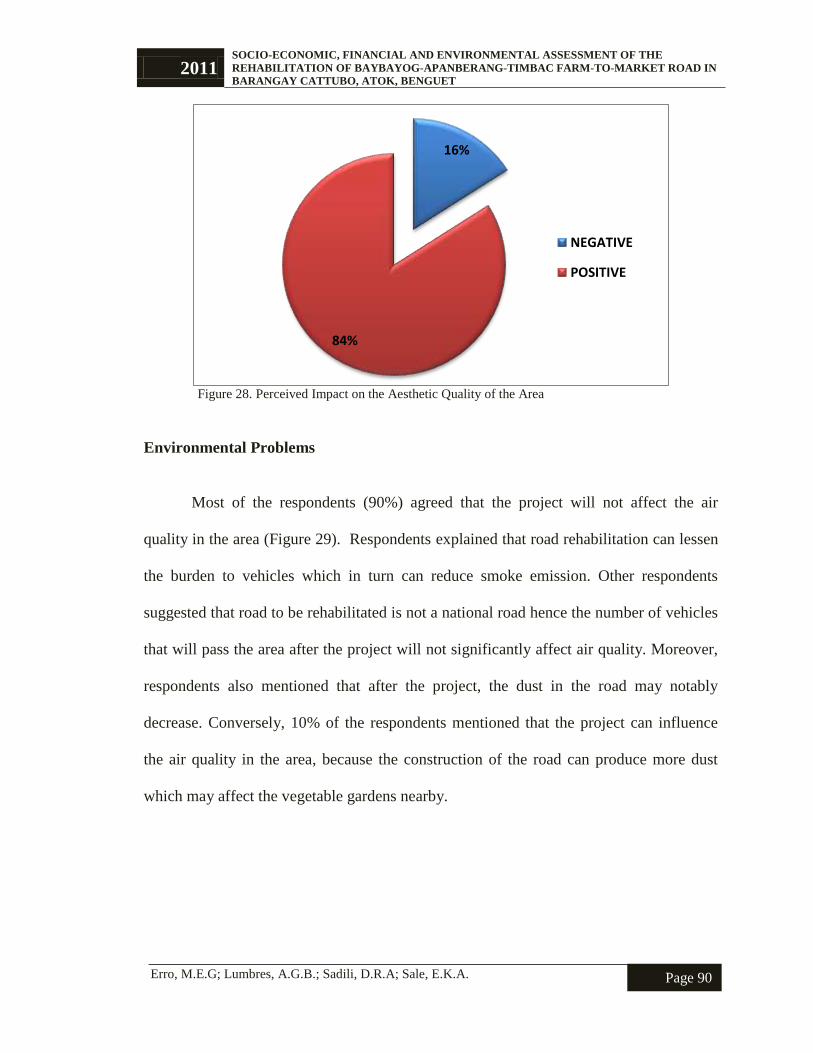
2011 SOCIO-ECONOMIC, FINANCIAL AND ENVIRONMENTAL ASSESSMENT OF THE
REHABILITATION OF BAYBAYOG-APANBERANG-TIMBAC FARM-TO-MARKET ROAD IN
BARANGAY CATTUBO, ATOK, BENGUET
Erro, M.E.G; Lumbres, A.G.B.; Sadili, D.R.A; Sale, E.K.A.
Page 90
Figure 28. Perceived Impact on the Aesthetic Quality of the Area
Environmental Problems
Most of the respondents (90%) agreed that the project will not affect the air
quality in the area (Figure 29). Respondents explained that road rehabilitation can lessen
the burden to vehicles which in turn can reduce smoke emission. Other respondents
suggested that road to be rehabilitated is not a national road hence the number of vehicles
that will pass the area after the project will not significantly affect air quality. Moreover,
respondents also mentioned that after the project, the dust in the road may notably
decrease. Conversely, 10% of the respondents mentioned that the project can influence
the air quality in the area, because the construction of the road can produce more dust
which may affect the vegetable gardens nearby.
16%
84%
NEGATIVE
POSITIVE
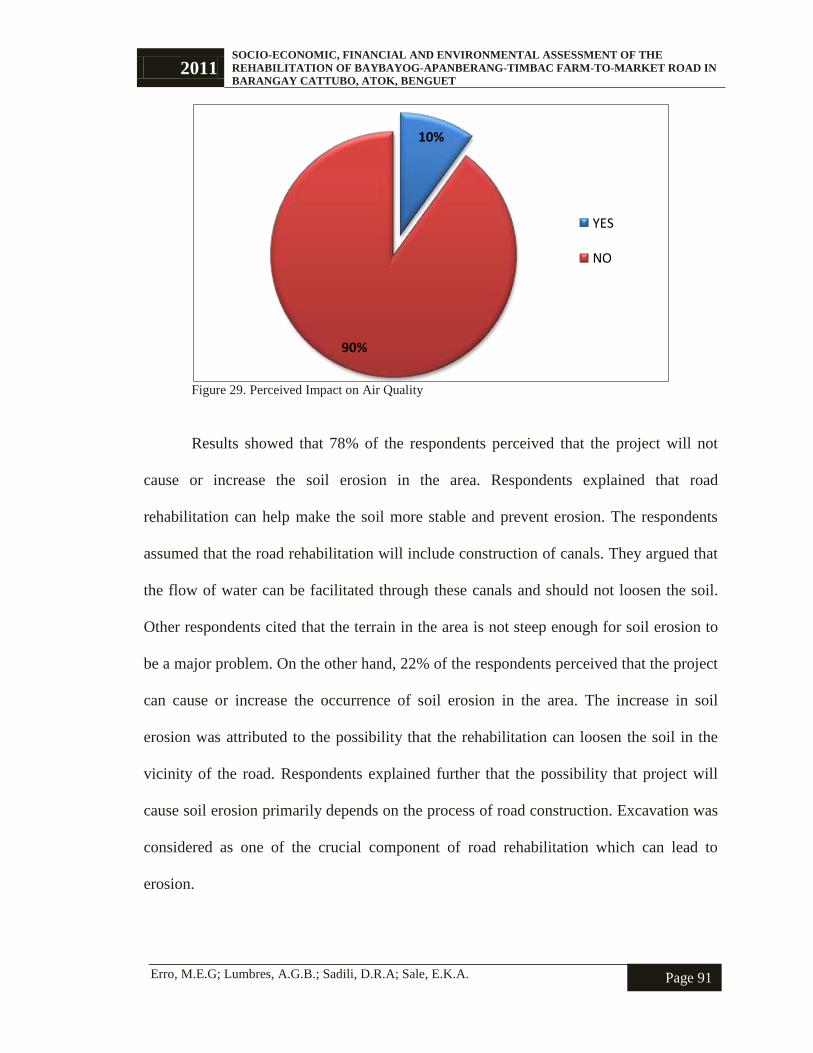
2011 SOCIO-ECONOMIC, FINANCIAL AND ENVIRONMENTAL ASSESSMENT OF THE
REHABILITATION OF BAYBAYOG-APANBERANG-TIMBAC FARM-TO-MARKET ROAD IN
BARANGAY CATTUBO, ATOK, BENGUET
Erro, M.E.G; Lumbres, A.G.B.; Sadili, D.R.A; Sale, E.K.A.
Page 91
Figure 29. Perceived Impact on Air Quality
Results showed that 78% of the respondents perceived that the project will not
cause or increase the soil erosion in the area. Respondents explained that road
rehabilitation can help make the soil more stable and prevent erosion. The respondents
assumed that the road rehabilitation will include construction of canals. They argued that
the flow of water can be facilitated through these canals and should not loosen the soil.
Other respondents cited that the terrain in the area is not steep enough for soil erosion to
be a major problem. On the other hand, 22% of the respondents perceived that the project
can cause or increase the occurrence of soil erosion in the area. The increase in soil
erosion was attributed to the possibility that the rehabilitation can loosen the soil in the
vicinity of the road. Respondents explained further that the possibility that project will
cause soil erosion primarily depends on the process of road construction. Excavation was
considered as one of the crucial component of road rehabilitation which can lead to
erosion.
10%
90%
YES
NO
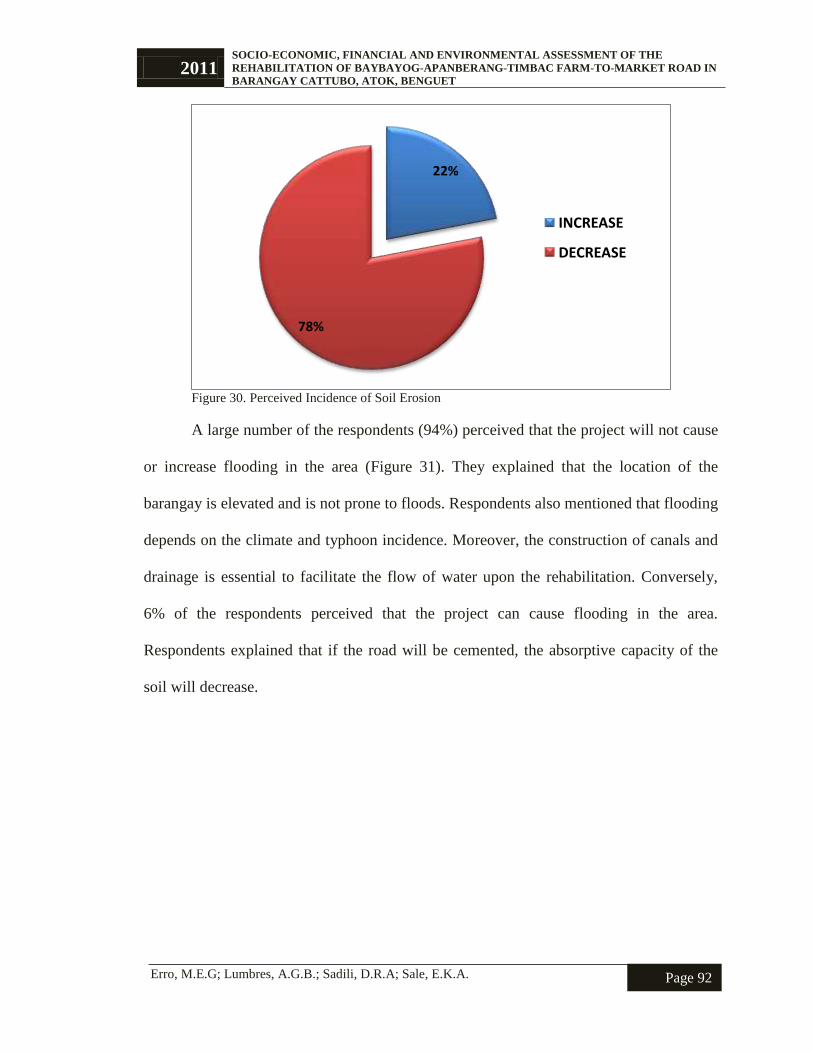
2011 SOCIO-ECONOMIC, FINANCIAL AND ENVIRONMENTAL ASSESSMENT OF THE
REHABILITATION OF BAYBAYOG-APANBERANG-TIMBAC FARM-TO-MARKET ROAD IN
BARANGAY CATTUBO, ATOK, BENGUET
Erro, M.E.G; Lumbres, A.G.B.; Sadili, D.R.A; Sale, E.K.A.
Page 92
Figure 30. Perceived Incidence of Soil Erosion
A large number of the respondents (94%) perceived that the project will not cause
or increase flooding in the area (Figure 31). They explained that the location of the
barangay is elevated and is not prone to floods. Respondents also mentioned that flooding
depends on the climate and typhoon incidence. Moreover, the construction of canals and
drainage is essential to facilitate the flow of water upon the rehabilitation. Conversely,
6% of the respondents perceived that the project can cause flooding in the area.
Respondents explained that if the road will be cemented, the absorptive capacity of the
soil will decrease.
22%
78%
INCREASE
DECREASE
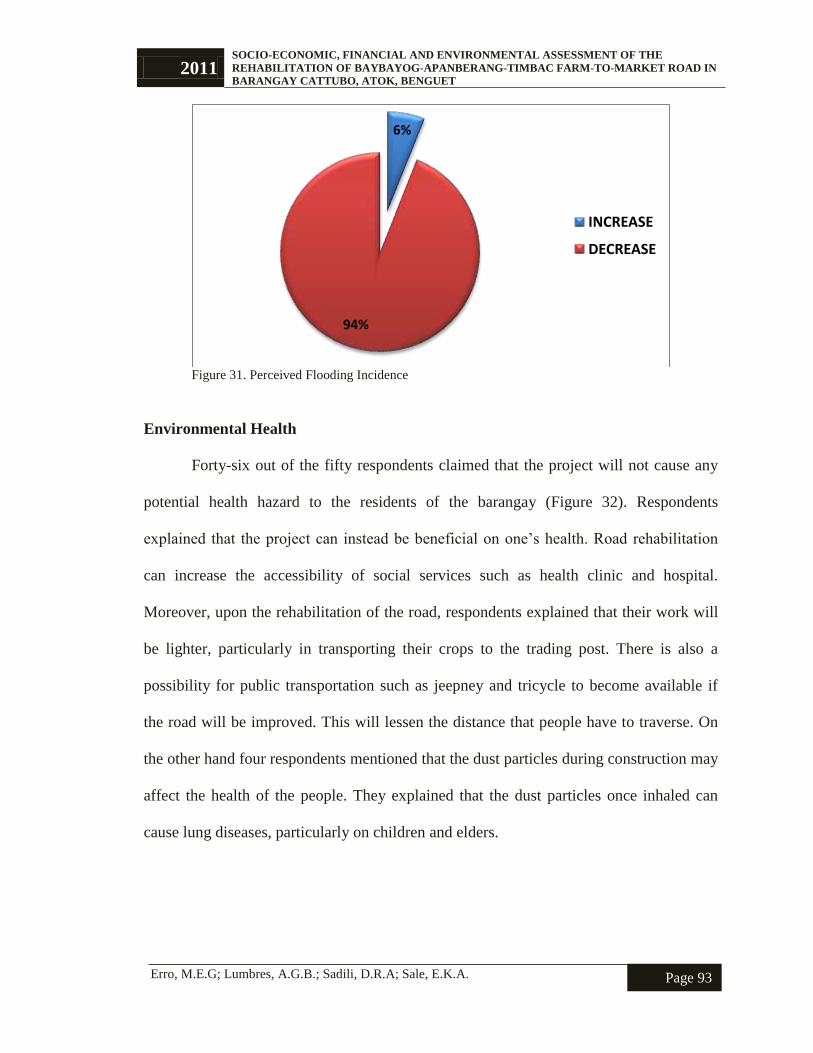
2011 SOCIO-ECONOMIC, FINANCIAL AND ENVIRONMENTAL ASSESSMENT OF THE
REHABILITATION OF BAYBAYOG-APANBERANG-TIMBAC FARM-TO-MARKET ROAD IN
BARANGAY CATTUBO, ATOK, BENGUET
Erro, M.E.G; Lumbres, A.G.B.; Sadili, D.R.A; Sale, E.K.A.
Page 93
Figure 31. Perceived Flooding Incidence
Environmental Health
Forty-six out of the fifty respondents claimed that the project will not cause any
potential health hazard to the residents of the barangay (Figure 32). Respondents
explained that the project can instead be beneficial on one’s health. Road rehabilitation
can increase the accessibility of social services such as health clinic and hospital.
Moreover, upon the rehabilitation of the road, respondents explained that their work will
be lighter, particularly in transporting their crops to the trading post. There is also a
possibility for public transportation such as jeepney and tricycle to become available if
the road will be improved. This will lessen the distance that people have to traverse. On
the other hand four respondents mentioned that the dust particles during construction may
affect the health of the people. They explained that the dust particles once inhaled can
cause lung diseases, particularly on children and elders.
6%
94%
INCREASE
DECREASE
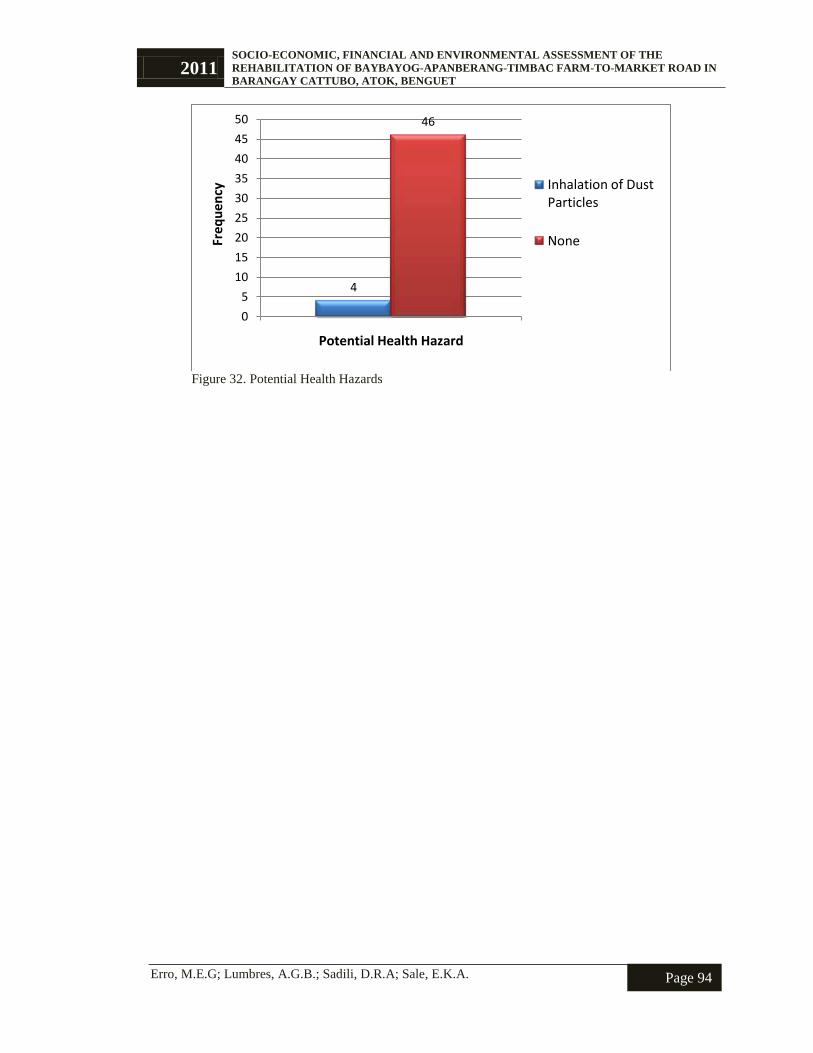
2011 SOCIO-ECONOMIC, FINANCIAL AND ENVIRONMENTAL ASSESSMENT OF THE
REHABILITATION OF BAYBAYOG-APANBERANG-TIMBAC FARM-TO-MARKET ROAD IN
BARANGAY CATTUBO, ATOK, BENGUET
Erro, M.E.G; Lumbres, A.G.B.; Sadili, D.R.A; Sale, E.K.A.
Page 94
Figure 32. Potential Health Hazards
4
46
0
5
10
15
20
25
30
35
40
45
50
Fre
qu
ency
Potential Health Hazard
Inhalation of Dust Particles
None

2011 SOCIO-ECONOMIC, FINANCIAL AND ENVIRONMENTAL ASSESSMENT OF THE
REHABILITATION OF BAYBAYOG-APANBERANG-TIMBAC FARM-TO-MARKET ROAD IN
BARANGAY CATTUBO, ATOK, BENGUET
Erro, M.E.G; Lumbres, A.G.B.; Sadili, D.R.A; Sale, E.K.A.
Page 95
CONCLUSION

2011 SOCIO-ECONOMIC, FINANCIAL AND ENVIRONMENTAL ASSESSMENT OF THE
REHABILITATION OF BAYBAYOG-APANBERANG-TIMBAC FARM-TO-MARKET ROAD IN
BARANGAY CATTUBO, ATOK, BENGUET
Erro, M.E.G; Lumbres, A.G.B.; Sadili, D.R.A; Sale, E.K.A.
Page 96
The Baybayog – Apanberang – Timbac farm-to-market road is located at Sitio
Calasipan Barangay Cattubo, Atok, Benguet. This road served as a short cut way and an
alternate route for the Cattubo and the neighboring barangays.
Atok, one of the municipalities in Benguet, has a total land area of 21,912
hectares and part of it was Cattubo with a total land area of 2,414. A large portion of
Cattubo, 992 hectares, is classified and used as an agricultural land.
Cattubo used to be part of Barangay Paoay but due to Benguet Resolution No.
198 on February 29, 1972 five sitios were separated. The name Cattubo was an acronym
for its five sitios namely; Calasipan, Apanberang, Timbac, Tulodan, Botiao, and Oyusan.
Further, the barangay was covered by the HADP and later was included in CHARM 1.
In terms of the biophysical characteristics of the barangay, it is said to have three
watersheds namely: Colbong, Macbas, and Bakbeg Watershed. These were the sources of
water for the sitios in the barangay. However, Cattubo have few remaining forests due to
deforestation. Furthermore, the vegetative cover of the barangay consists of natural
growth of pine trees, shrubs, blade grass, and a variety of planted trees such as alnus; and
there were also vegetables and grasses abundant in the area. Additionally, Barangay
Cattubo was considered as upland with sloping vegetable terraces and plateau in some
sitios. Its highest point is 7,000 ft which can be found at Km. 54, which also serves as a
tourist spot. Moreover, the only soil type in the barangay is clay loam.
2011 SOCIO-ECONOMIC, FINANCIAL AND ENVIRONMENTAL ASSESSMENT OF THE
REHABILITATION OF BAYBAYOG-APANBERANG-TIMBAC FARM-TO-MARKET ROAD IN
BARANGAY CATTUBO, ATOK, BENGUET
Erro, M.E.G; Lumbres, A.G.B.; Sadili, D.R.A; Sale, E.K.A.
Page 97
Furthermore, food is sufficient enough for the residents of the barangay due to the
existence of vast agricultural land areas; where cabbage, potatoes, carrots, and the like are
being planted. Majority of the households own the land they were cultivating. The
barangay has a total of 992 hectares of land devoted to agricultural production where in
53% is irrigated while 47% is rain fed. Likewise, households from the barangay also have
poultry and livestock production which were primarily meant for personal consumption.
Their livestock and poultry products were sometimes being sold to the neighborhood and
small stores in the barangay. Nevertheless, there was no existing fish production in the
barangay though it has potential for such since there are lakes and rivers located in Sitio
Calasipan.
Since Barangay Cattubo is a farming community, there were various farming
practices being used like traditional/indigent farming practices, organic farming, and
other farming technologies which were hardly being used by the farmers. The only
farming technology being adapted by the farmers of the barangay was the use of chicken
manure as fertilizer although proper utilization of such is not being practiced.
For their farming facilities, there were 10 tramlines, 49 small farm reservoirs, 40
pump and engine sets, 14 power tillers, 3 tractors and 45 green houses. There were also
three Seed Potato Storage Houses at Tulodan that were funded by the Department of
Agriculture. Vegetable products in large volume were being sold both in La Trinidad and
Baguio Trading Posts while small quantities were being sold in Atok Public Market.
Other than farming, the residents also engage themselves in carpentry, vending, poldiya,
among others.

2011 SOCIO-ECONOMIC, FINANCIAL AND ENVIRONMENTAL ASSESSMENT OF THE
REHABILITATION OF BAYBAYOG-APANBERANG-TIMBAC FARM-TO-MARKET ROAD IN
BARANGAY CATTUBO, ATOK, BENGUET
Erro, M.E.G; Lumbres, A.G.B.; Sadili, D.R.A; Sale, E.K.A.
Page 98
Barangay Cattubo has no agri-based industries however; there were forty four
(44) different business establishments present. Unfortunately, there were no lending
institutions in Cattubo but there was an informal credit and market system in the locality
called the Supply System.
In addition, there were some potential tourist attractions in the Barangay which
were the Loacan River and the St. Teresita Mine or most commonly known as the
Quadselm located in Sitio Botiao.
Cattubo had a high literacy rate which is 99% and the barangay also have pre
schools, day care centers, and elementary schools. On the other hand, there were no high
schools and college level educational institutions in the barangay thus students have to
enroll to nearby schools to other barangays.
As for the house tenure, 99.9% of the households own their houses and their
means of transportation were thru private vehicles since there were no public utility
vehicles present in the barangay.
There were no hospitals in Barangay Cattubo but they have their own clinic which
was located at their barangay hall. In terms of electric current, more than 50% of the
residents have electricity while the others depend on using kerosene and the likes.
Likewise, there were also no available financial institutions on the barangay. The
barangay also have 21 farm-to-market roads, 4 foot bridges, and 4 irrigation systems
which were being used by the residents.
2011 SOCIO-ECONOMIC, FINANCIAL AND ENVIRONMENTAL ASSESSMENT OF THE
REHABILITATION OF BAYBAYOG-APANBERANG-TIMBAC FARM-TO-MARKET ROAD IN
BARANGAY CATTUBO, ATOK, BENGUET
Erro, M.E.G; Lumbres, A.G.B.; Sadili, D.R.A; Sale, E.K.A.
Page 99
The barangay, based on the survey conducted, had a young population which
denotes a high number of economically dependent population. Most of the households’
source of income was farming, comprising 114 household members, since the land is
suitable for agricultural purposes. Meanwhile, an average household annual income of
Php 68,465 was expected to increase upon rehabilitation of the road.
The Baybayog – Apanberang – Timbac farm-to-market road rehabilitation was
expected to be completed in one year period. This road will influence three barangays;
Pacso, Cattubo, and Natubleng. The total project cost was estimated Php. 8,360,043 for a
20 year span. The total capital investment, subdivided into direct and indirect cost,
amounted to Php 3,503,305. For the direct cost, 68.22% was allotted to total cost of
materials, 8.54% for the labor cost, and 2.06% was appropriated for equipment expenses.
Moreover, as part of the indirect cost, tax and 18% mark up had allotments of 7% and
14.19% respectively. However, there was no allotment made for
engineering/administration.
Working capital was estimated at Php. 4,858,700 during the 20-year project span.
The total maintenance cost, allocations of 25% for labor, 23% for equipment, 41% for
supplies, and 11% for management and supervision were assumed.
To determine the passenger and freight benefits, VOCs was used. Freight benefits
were based from the major crops being planted while the passenger benefits were based
from the number of household travels per month and the total household population in the
three directly influenced areas. Freight benefits yielded a total of Php 1,239,339 whereas
the passenger benefits were estimated at Php. 113, 022 on the initial year. Conversion of

2011 SOCIO-ECONOMIC, FINANCIAL AND ENVIRONMENTAL ASSESSMENT OF THE
REHABILITATION OF BAYBAYOG-APANBERANG-TIMBAC FARM-TO-MARKET ROAD IN
BARANGAY CATTUBO, ATOK, BENGUET
Erro, M.E.G; Lumbres, A.G.B.; Sadili, D.R.A; Sale, E.K.A.
Page 100
financial prices to economic prices, were undertaken by using standard conversion
factors.
A financial net present value of Php 3,129,865 was estimated for the project while
economic net present value derived was Php3,805,895. In addition, the base BCR
computed for both financial (1.72) and economic (2.07) aspects were greater than one.
The base FIRR of 32% and an EIRR of 36% were computed. These results were higher
than the accepted IRR which was 15%. The results of the NPV, BCR, and IRR implied
that the project was feasible and worthwhile to undertake.
Moreover, the project was exposed to four different cases where in variables from
the base case such as benefits, costs, and time were modified. When the total benefit was
reduced by 10%, lower FIRR, NPV, and BCR were computed. Same was true when the
cost was increased by 10%. Even in cases where there was a two year delay in
construction and the combination of all cases, the result of FIRR, NPV, and BCR were
lower than the base case.
Although all the FIRR of the four cases were lower than the base case, the results
were still greater than 15% thus the project would still be feasible. Likewise, all the NPV
results yielded positive values and the BCR were all greater than one; hence the project
would still be worthwhile to undertake.
To convert financial prices to economic prices, standard conversion factors were
used. The EIRR, NPW, and BCR results were smaller compared to the base case. EIRR
computed for all cases were higher than the acceptable 15% and all the NPW gained were
positive. Likewise, the economic BCR computed for all four cases were greater than one;
2011 SOCIO-ECONOMIC, FINANCIAL AND ENVIRONMENTAL ASSESSMENT OF THE
REHABILITATION OF BAYBAYOG-APANBERANG-TIMBAC FARM-TO-MARKET ROAD IN
BARANGAY CATTUBO, ATOK, BENGUET
Erro, M.E.G; Lumbres, A.G.B.; Sadili, D.R.A; Sale, E.K.A.
Page 101
thus the project would still be feasible if such cases would occur. Nevertheless, the results
obtained on the economic indicators were higher than the financial indicators.
A sensitivity index was computed to measure the effect of such changes in
variables. A high value of SI implies that the project would be more sensitive to changes
in such variable. In this regard, the project was less sensitive to increase in project cost by
10% while it was highly sensitive to the combination of all cases. This means that the
project should avoid the combination of reduction in benefits, increase in cost, and two-
year delay in construction than all other cases.
In terms of social benefits, results showed that the road rehabilitation project
would be beneficial for the households of the influenced areas. All the respondents
agreed that the rehabilitation of the road will lead to a reduction of travel time, thus the
respondents were expected to increase frequency of their travel. This was also supported
by the results on the comparison of the average travel time with and without the project.
There was a significant decrease in the average travel time for all social services being
accessed by the respondents.
The road rehabilitation project was expected to bring increase in the number/type
of vehicles that would pass through. It was also noted that there were more respondents
who said that road rehabilitation would not cause heavy traffic. In addition, the
respondents believed that the rehabilitation will not result to an increase in traffic related
accidents instead; an improved road will be less prone to accidents.
The road rehabilitation would also impact the type of work and income in the
area. The respondents perceived that improvement of the road would increase their

2011 SOCIO-ECONOMIC, FINANCIAL AND ENVIRONMENTAL ASSESSMENT OF THE
REHABILITATION OF BAYBAYOG-APANBERANG-TIMBAC FARM-TO-MARKET ROAD IN
BARANGAY CATTUBO, ATOK, BENGUET
Erro, M.E.G; Lumbres, A.G.B.; Sadili, D.R.A; Sale, E.K.A.
Page 102
income, provide more job opportunities, decrease in maintenance cost, decrease in
transportation cost, increase in number of crops transported, and increase travel
frequency of crops. However, there were few who believed that the road rehabilitation
would not have any impact at all and it would not bring change in income.
Moreover, a large portion of the respondents believed that the rehabilitation of the
road will influence their social patterns since there would be an increase in the number of
vehicles passing the road, thus increase their travel frequency and be able to do more
activities. Exposure to new technologies will also be an impact of the road rehabilitation
that said to cause change in the respondents’ social activity patterns. Also, based on the
survey conducted, half of the respondents believed that the project will cause sub-cultural
variation while the other half believed otherwise. On the other hand, most of the
respondents perceived that there will be no impacts on their present ethnicity.
Additionally, the respondents agreed that there will be more leisure and cultural
opportunities upon rehabilitation of the road.
The road will also provide ease of access to social services like schools and places
of work. A comparison of the means of transportation with and without the project was
made and a significant increase in the frequency of jeepney usage while a decrease in
walking was noted. There was also a significant increase in privately owned vehicles due
to rehabilitation of the road.
Aside from ease of access to social facilities, the respondents perceived other
social benefits like business opportunities, lighter workload for farmers, safety,
modernization/access to technology, easy implementation of laws, health benefits,
2011 SOCIO-ECONOMIC, FINANCIAL AND ENVIRONMENTAL ASSESSMENT OF THE
REHABILITATION OF BAYBAYOG-APANBERANG-TIMBAC FARM-TO-MARKET ROAD IN
BARANGAY CATTUBO, ATOK, BENGUET
Erro, M.E.G; Lumbres, A.G.B.; Sadili, D.R.A; Sale, E.K.A.
Page 103
probable existence of PUVs, decrease vehicle damage, increase quality of life, improve
communication, and electricity supply.
For the impacts of the road rehabilitation to the environmental quality of the
influenced areas, most of the respondents believed that such will not cause degradation of
the aesthetic quality of the area but will further cause improvement. Most of them also
agreed that the project will not degrade the air quality nor increase soil erosion; thus most
of them believed that the rehabilitation pose no threat to their health. Furthermore, the
household respondents believed that that the rehabilitation of the road will not cause and
lessen incidence of flooding. Lastly, the project may also be a good way to promote
tourism in the influenced areas based on the results.
Generally, the project is worthwhile to undertake since the financial and economic
computation of the costs and benefits resulted to positive outcomes. Based from the
computations, the project is feasible and worthwhile to undertake. The respondents also
perceived greater benefits if the road will be rehabilitated. It will bring more social
benefits than harm. More so, there were more perceived positive impacts to the
environment when the project is pursued. A positive feedback of the road project from its
beneficiaries would also be a good indicator to pursue the project.
2011 SOCIO-ECONOMIC, FINANCIAL AND ENVIRONMENTAL ASSESSMENT OF THE
REHABILITATION OF BAYBAYOG-APANBERANG-TIMBAC FARM-TO-MARKET ROAD IN
BARANGAY CATTUBO, ATOK, BENGUET
Erro, M.E.G; Lumbres, A.G.B.; Sadili, D.R.A; Sale, E.K.A.
Page 104
RECOMMENDATIONS
2011 SOCIO-ECONOMIC, FINANCIAL AND ENVIRONMENTAL ASSESSMENT OF THE
REHABILITATION OF BAYBAYOG-APANBERANG-TIMBAC FARM-TO-MARKET ROAD IN
BARANGAY CATTUBO, ATOK, BENGUET
Erro, M.E.G; Lumbres, A.G.B.; Sadili, D.R.A; Sale, E.K.A.
Page 105
The study on the proposed rehabilitation of the Baybayog-Apanberang-Timbac
farm-to-market road has identified both positive and negative impacts of the project. To
ensure the positive impacts and to mitigate the negative impacts, the project
administrators have to consider several factors in order to guarantee its success. The
researchers have grouped the recommendations into two major parts- from the
respondents and from the researchers. Recommendations coming from the researchers
were also subdivided into three parts- social, financial and economic, and environmental.
RECOMMENDATIONS FROM THE RESPONDENTS
SUGGESTIONS
Based on the study, respondents suggested that the road project should be of good
quality to maximize the benefits. They explained that Class A materials should be used in
the construction. Respondents also suggested that the participation of local residents can
maximize the benefits from the project. They explained that it is important for local
residents to partake in the road rehabilitation. Informing the people about the details of
the project can lead to their active participation. Moreover, details of the schedule of the
project should be conveyed to the people since they will be affected, particularly during
the construction. Likewise, respondents perceived that employing the local workers can
maximize the benefits. This can provide additional income for the local residents, though
the employment will be for a short period of time. Selecting the contractor is also crucial
to maximize the benefits. The respondents also explained that the contractor should be
knowledgeable about the project. The bidding for the contractor should be transparent
among the local residents. They also suggested concreting of the road will most likely

2011 SOCIO-ECONOMIC, FINANCIAL AND ENVIRONMENTAL ASSESSMENT OF THE
REHABILITATION OF BAYBAYOG-APANBERANG-TIMBAC FARM-TO-MARKET ROAD IN
BARANGAY CATTUBO, ATOK, BENGUET
Erro, M.E.G; Lumbres, A.G.B.; Sadili, D.R.A; Sale, E.K.A.
Page 106
increase the benefit of the project. They perceived that concreting the road will
significantly reduce the burden of travelling, in particular during transportation of crops.
Following the standards of road rehabilitation and following the project plan were also
suggested by the respondents while explained that the standards set by the government
should be strictly followed by the contractor to ensure the quality of road. In addition,
household respondents recommended that the schedule of the construction as indicated in
the project plan should be strictly followed. Delay in the construction of the road can
affect the benefits of the project. More so, the delay can also be a hindrance in the
transportation of crops. Respondents also suggested that producing more harvests and
ensuring that farm to market road funds will be used exclusively for the project can
maximize the benefits of the project.
Majority of the respondents also suggested that proper maintenance of the road
can reduce the possible negative impacts of the project. Respondents explained that
proper maintenance is essential upon the rehabilitation to sustain the condition of the
road. Through proper road maintenance, the deterioration of the road due to the damage
caused by vehicles and other emerging environmental factors can be addressed. On the
other hand, construction of canal and drainage beside the road was suggested by the
respondents. Canal and drainage can facilitate the flow of water and prevent the possible
run-off of water particularly during rainy season. Riprap was also suggested by some.
Ripraps are being used to prevent soil erosion and slides in the area. Installation of road
signs was also suggested to prevent possible road accidents in the area. They explained
that installation of road signs is necessary since the road has many curves. Likewise,
respondents even suggested the installation of streetlights aside from the road signs, to

2011 SOCIO-ECONOMIC, FINANCIAL AND ENVIRONMENTAL ASSESSMENT OF THE
REHABILITATION OF BAYBAYOG-APANBERANG-TIMBAC FARM-TO-MARKET ROAD IN
BARANGAY CATTUBO, ATOK, BENGUET
Erro, M.E.G; Lumbres, A.G.B.; Sadili, D.R.A; Sale, E.K.A.
Page 107
avoid accidents at night. Road expansion was also mentioned to reduce the accident in
the area. The respondents explained further that the road is accident prone because it is
narrow and one-way. Conversely, respondents suggested tree planting and active
campaign against illegal logging. The vegetation that can be affected by the road
rehabilitation should be replaced through tree planting as explained by the respondents, to
mitigate the possible effect on the environment. Moreover, respondents suggested the
installation of box culvert and fencing.
Furthermore, in order to maximize the benefits of the project, it was suggested
that the issues in political boundaries be settled among the municipalities. This is needed
to clarify the scope of the project and the immediate local government that will be
responsible for co-funding of the project.
RECOMMENDATIONS FROM THE RESEARCHERS
SOCIAL
The assessment on the perceived social impacts of the road rehabilitation has
recognized various social benefits of the project such as accessibility to social services,
decrease in travel time, higher income for the people and preservation of their culture.
For the implementers
The implementers of the project, specifically the Barangay Unit, should organize
and inform their people about the road project. Cultural programs should be promoted in
the barangay not only as a tourist attraction but also as a way to develop their culture. In
terms of maximizing the benefit on the accessibility to different social services, the
2011 SOCIO-ECONOMIC, FINANCIAL AND ENVIRONMENTAL ASSESSMENT OF THE
REHABILITATION OF BAYBAYOG-APANBERANG-TIMBAC FARM-TO-MARKET ROAD IN
BARANGAY CATTUBO, ATOK, BENGUET
Erro, M.E.G; Lumbres, A.G.B.; Sadili, D.R.A; Sale, E.K.A.
Page 108
implementers should provide and maintain well-built fences, road signs and other safety
tools to make sure that the residents and the users of the road will be secured.
For the beneficiaries
The beneficiaries of the project are recommended to maintain and preserve their
ethnicity by showcasing their culture to the tourists. The time saved from transporting
their crops can be utilized in other social events or other income generating activities.
More so, the people should help in monitoring and maintenance of the road to ensure its
safety.
FINANCIAL AND ECONOMIC
The financial and economic aspects are critical in the execution of the road
project. These aspects are the deciding factors whether the project will push through or
not.
For the implementers
On-time provision of budget should be ensured by the implementers to avoid
project delays. The items and percentage allocation of the allotted project fund for the
road rehabilitation must be strictly followed and properly utilized to avoid unwanted
expenses and investment losses. During the construction phase, it is suggested that the
implementers employ local residents in the area. The local government should create
complementing projects vis-à-vis the road rehabilitation to increase the income of the
farmers and to maximize other potential benefits. An irrigation project is advised since
most of the farmers have only one cropping season. This will eventually reflect on the
local economy of the region.
2011 SOCIO-ECONOMIC, FINANCIAL AND ENVIRONMENTAL ASSESSMENT OF THE
REHABILITATION OF BAYBAYOG-APANBERANG-TIMBAC FARM-TO-MARKET ROAD IN
BARANGAY CATTUBO, ATOK, BENGUET
Erro, M.E.G; Lumbres, A.G.B.; Sadili, D.R.A; Sale, E.K.A.
Page 109
For the beneficiaries
Most of the beneficiaries of the project are farmers since the project is on the
rehabilitation of a farm-to-market road. It is recommended that the farmers should
attempt to increase their volumes of production, the kind of crops that they produce and
market to increase their income.
ENVIRONMENTAL
The environmental impact assessment of the road rehabilitation identifies the
perceived environmental effects of the project which are either positive or negative
depending on how the rehabilitation will be implemented and on how the road will be
maintained. Although, most of the perceived environmental effects are positive in nature,
recommendations are still added to enhance the success of the project.
For the implementers
First and foremost, the implementers should strictly comply with the standards set
by the DPWH and DENR regarding road rehabilitation. Canals, riprap, box culvert, road
signs, streetlights and other protective paraphernalia should be created immediately after
the rehabilitation. The tourist spots and the remaining forestlands should be preserved by
the concerning agencies as it is vital in improving the local tourism and the aesthetic
quality of the road’s peripheral environment. Funds for the maintenance of the road
should be provided so that the unperceived negative impacts on the environment can be
instantaneously mitigated.
2011 SOCIO-ECONOMIC, FINANCIAL AND ENVIRONMENTAL ASSESSMENT OF THE
REHABILITATION OF BAYBAYOG-APANBERANG-TIMBAC FARM-TO-MARKET ROAD IN
BARANGAY CATTUBO, ATOK, BENGUET
Erro, M.E.G; Lumbres, A.G.B.; Sadili, D.R.A; Sale, E.K.A.
Page 110
For the beneficiaries
The residents should be the main actors in maintaining the road and their
environment since they are the most affected people on whatever they do on their
surroundings. In case environmental problems arise in the area, the people should report
these observed conditions to the barangay or any concerning agencies so that it can be
monitored and/or prevented immediately.
2011 SOCIO-ECONOMIC, FINANCIAL AND ENVIRONMENTAL ASSESSMENT OF THE
REHABILITATION OF BAYBAYOG-APANBERANG-TIMBAC FARM-TO-MARKET ROAD IN
BARANGAY CATTUBO, ATOK, BENGUET
Erro, M.E.G; Lumbres, A.G.B.; Sadili, D.R.A; Sale, E.K.A.
Page 111
REFERENCES
Asian Development Bank. 2006. Handbook for the Economic Analysis of Water Supply
Projects. pp. 140-142 and 133-135.
Asian Development Bank. 1994. Project Completion Report of the Highland Agriculture
Development Project. Pp. 15-16
Asian Development Bank. 2006. Completion Report, Philippines: Cordillera Highland
Agricultural Management Project. Pp. 9-11
Barangay Natural Resource Management Plan. 2000-2006. Barangay Natubleng,
Buguias, Benguet.
Barangay Profile of Natubleng Executive Summary.2011. Barangay Natubleng, Buguias,
Benguet.
Benguet Socio- Economic Profile. 2007. Province of Benguet
Clark, Robert Francis. 2005. Victory Deferred: The war on Global Poverty. University
Press America; Maryland. P. 183
Comprehensive Land Use Plan. 2001-2011. Municipality of Atok.
Draft Barangay Cattubo Profile.2010. Cattubo, Atok, Benguet
Draft Participatory Project Investment Plan. 2011-2015. Barangay Pacso, Kabayan,
Benguet.
Golder, B. and M. Gawler, 2000. Cross-Cutting Tool Stakeholder Analysis. ARTEMIS
Services.WWF.
Individual Project Program of Work. 2011. Office of the Municipal Engineer. Atok,
Benguet.
International Fund for Agricultural Development. 2007. Cordillera Highland Agricultural
Management Project Completion Evaluation. Pp. 27-30
Investopedia. 2010. Net Present Value. Retrieved at http://www.investopedia.com
National Economic and Development Authority. 2008. NEDA Development Advocacy
Fact Sheet (Vol XII No.7). p.1
Net Present Worth.2010. Retrieved at http://coen.boisestate.edu/mkhanal/net.htm
Retrieved from https://intranet.panda.org/documents/folder.cfm?uFolderID=6097

2011 SOCIO-ECONOMIC, FINANCIAL AND ENVIRONMENTAL ASSESSMENT OF THE
REHABILITATION OF BAYBAYOG-APANBERANG-TIMBAC FARM-TO-MARKET ROAD IN
BARANGAY CATTUBO, ATOK, BENGUET
Erro, M.E.G; Lumbres, A.G.B.; Sadili, D.R.A; Sale, E.K.A.
Page 112
Pakpakan-Taliboy-Oc-Lamut Farm-to-Market Road Feasibility Study. 2000. Benguet
Province.
Participatory Project Investment Plan. 2011-2015. Barangay Cattubo, Atok, Benguet.
Project Proposals.2010. Province of Benguet.
Teddlie, Charles and Fen Yu. 2007. Mixed Methods Sampling. Louisiana State
University, Baton Rouge. Pp. 12-13

2011 SOCIO-ECONOMIC, FINANCIAL AND ENVIRONMENTAL ASSESSMENT OF THE
REHABILITATION OF BAYBAYOG-APANBERANG-TIMBAC FARM-TO-MARKET ROAD IN
BARANGAY CATTUBO, ATOK, BENGUET
Erro, M.E.G; Lumbres, A.G.B.; Sadili, D.R.A; Sale, E.K.A.
Page 113
APPENDICES

APPENDIX A
Table 10. Gantt Chart Of The Socio-Economic, Financial, And Environmental Assessment Of The Rehabilitation Of Baybayog-Apanberang-Timbac Farm-To-Market Road In
Barangay Cattubo, Atok, Benguet.
Activities Involved Group
November December January February March
Output
3rd
4th
1st
2nd
3rd
4th
1st
2n
d
3rd
4th
1st
2n
d
3rd
4th
1st
2n
d
3rd
4th
1. Administrative Arrangements
Meeting with the Project Manager Practicum Team
CHARM
Memorandum of
Understanding
Initial Secondary Data Acquisition Practicum Team
CHARM Secondary Data
2. Preparation and Finalization of
Technical Proposal Practicum Team Technical Proposal
3. Conduct of Leveling-off Training
LGU, CHARM,
Practicum Team
Knowledge and
Skills in Data
Analysis
4. Reproduction of Survey instrument Practicum Team Questionnaires
5. Data Gathering
Practicum Team,
Stakeholders
Primary Data,
Secondary Data
6. Analysis of Data
Practicum Team Information
7. 1st Draft Technical Paper
Practicum Team Draft Technical
Paper

Activities Involved Group November December January February March Expected Output
3rd
4th
1st
2n
d
3rd
4th
1st
2n
d
3rd
4th
1st
2n
d
3rd
4th
1st
2n
d
3rd
4th
8. Presentation of draft
CHARM,
Practicum Team,
Stakeholders
Final Draft
9. Submission of final draft Practicum Team Technical Report
10. Presentation of Final Report to
DCERP
Practicum Team,
DCERP Faculty Technical Report
11. Production of Final Report Practicum Team
Team and
Technical Report
12. Distribution of Final Report Practicum Team
Team and
Technical Report

APPENDIX B
Socio-Economic, Financial, and Environmental Assessment of Rehabilitation of
Baybayog-Apanberang-Timbac Farm-to-Market Road at Cattubo, Atok, Benguet
Key Informant Profile
(FOR MAO)
1. What are top three problems related to agriculture in your municipality?
a.
b.
c.
2. What do you think are the reasons for the occurrence of these problems?
________________________________________________________________________
________________________________________________________________________
3. How do you address these problems?
________________________________________________________________________
________________________________________________________________________
4. Are there any previously rehabilitated farm-to-market roads in your municipality? What
do you think are the benefits of the said project in terms of agricultural production?
________________________________________________________________________
________________________________________________________________________
5. Do you think that the rehabilitation project of Baybayog-Apanberang-Timbac Farm-to-
Market Road will be beneficial for the farmers? If so, what are the possible benefits?
________________________________________________________________________
________________________________________________________________________
Name:
Last: First: Middle:
Address:
No. of Street:
Village/Subdivision: Barangay: Town/City: Province:
Sex: Age: Civil Status: Educational Attainment:
Sources of Income: Religion: Language: Years of Residency: Monthly Income:

(FOR Municipal Engineer/Provincial Engineer)
1. How will you describe the current situation of the Baybayog-Apanberang-Timbac Farm-
to-Market Road?
________________________________________________________________________
________________________________________________________________________
2. Are there any previously rehabilitated farm-to-market roads in your
municipality?__________________
a. What do you think are the benefits of the said project?
________________________________________________________________
________________________________________________________________
b. What are the problems encountered?
________________________________________________________________
________________________________________________________________
3. What do you think will be the benefits of the rehabilitation project of Baybayog-
Apanberang-Timbac Farm-to-Market Road for the people in your municipality?
________________________________________________________________________
________________________________________________________________________
(FOR M/PENRO)
1. How will you describe the current situation of Baybayog-Apanberang-Timbac Farm-to-
Market peripheral environment?
________________________________________________________________________
________________________________________________________________________
2. What do you think are the top three environmental problems in your municipality?
a.
b.
c.
3. How do you address these problems?
________________________________________________________________________
________________________________________________________________________
4. Are there any previously rehabilitated farm-to-market roads in your
municipality?__________________
a. What do you think are the impacts of the said project in the environment?
________________________________________________________________
________________________________________________________________
b. If there are negative impacts, what measures were taken to minimize its effect?
________________________________________________________________
________________________________________________________________
5. Do you think that the rehabilitation project of Baybayog-Apanberang-Timbac Farm-to-
Market Road will be beneficial for the environment? If so, what are the possible benefits?
If not, why?
________________________________________________________________________
________________________________________________________________________

(FOR M/PSWD)
1. What are the social services offered in your municipality?
________________________________________________________________________
________________________________________________________________________
2. What are the most common services utilized by the residents?
________________________________________________________________________
_____________________________________________________________________
Why do you think so?
________________________________________________________________________
________________________________________________________________________
3. How many residents accessed the social services?
________________________________________________________________________
_____________________________________________________________________
4. Are there any existing issues regarding accessibility of social services? Please enumerate.
________________________________________________________________________
________________________________________________________________________
5. How will you resolve the issues?
________________________________________________________________________
_____________________________________________________________________
6. What way/s will help you improve those services?
________________________________________________________________________
_____________________________________________________________________
7. What do you think will be the impact/s of road rehabilitation in the accessibility of social
services? Why?
________________________________________________________________________
________________________________________________________________________
(FOR DPWH)
1. What is the standard cost of a road rehabilitation project per kilometer?
________________________________________________________________________
________________________________________________________________________
2. How much of the budget is allotted for labor cost (skilled and unskilled), equipments,
supplies, management and supervision, maintenance, and other cost?
________________________________________________________________________
________________________________________________________________________
3. What/ who is/are the source of budget for road rehabilitation?
________________________________________________________________________
________________________________________________________________________
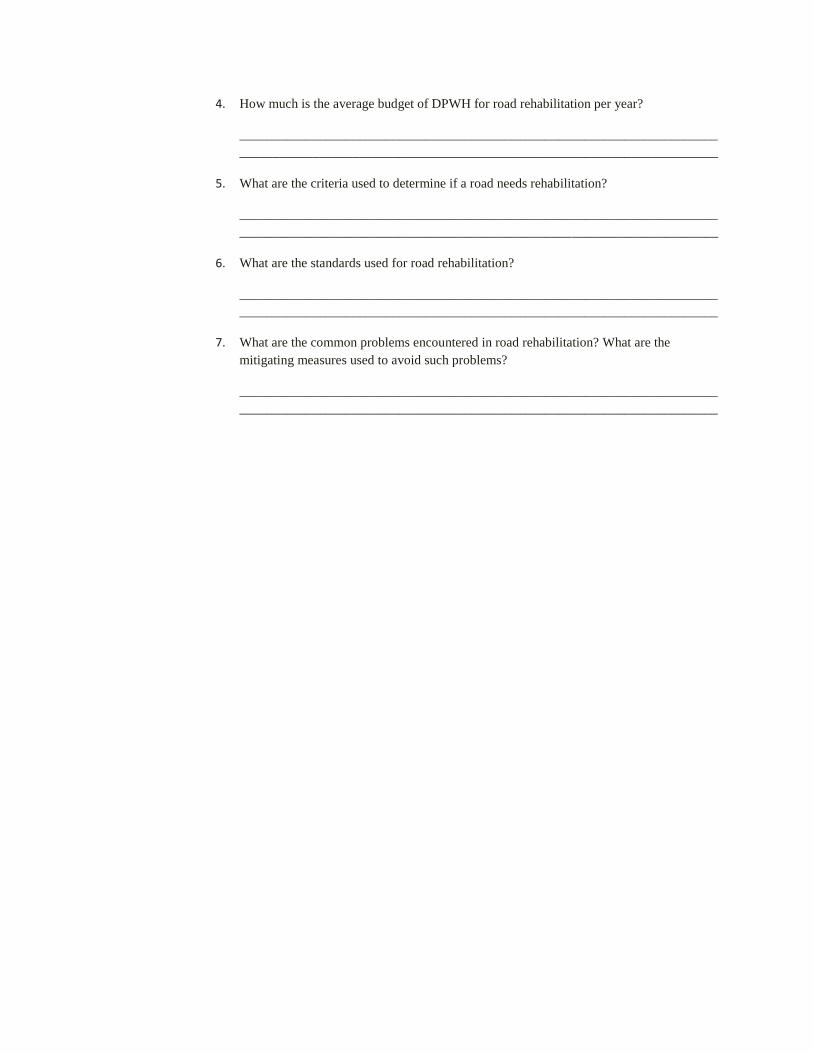
4. How much is the average budget of DPWH for road rehabilitation per year?
________________________________________________________________________
________________________________________________________________________
5. What are the criteria used to determine if a road needs rehabilitation?
________________________________________________________________________
________________________________________________________________________
6. What are the standards used for road rehabilitation?
________________________________________________________________________
________________________________________________________________________
7. What are the common problems encountered in road rehabilitation? What are the
mitigating measures used to avoid such problems?
________________________________________________________________________
________________________________________________________________________
APPENDIX C
SOCIO- ECONOMIC AND ENVIRONMENTAL IMPACTS SURVEY FORM
SOCIO-ECONOMIC, FINANCIAL, AND ENVIRONMENTAL ASSESSMENT
OF THE PROPOSED FARM-TO-MARKET ROAD PROJECT IN BARANGAY CATTUBO, ATOK, BENGUET
INFRASTRUCTURE COMPONENT
CHARM 2 PROJECT
University of the Philippines Los Baños
College of Human Ecology
Department of Community and Environmental Resource Planning
In cooperation with the
Cordillera Highland Agricultural Resource Management Project 2
And
The Provincial Government of Benguet and Municipal Government of Atok.

Questionnaire No.____
Socio-Economic and Environmental Impacts Survey Form
A. Demographic Profile
1. Respondent Profile
Name:
Address:
No. of Street:
Village/Subdivision: Barangay: Town/City: Province:
Sex: Age: Civil Status: Educational Attainment:
Occupation:
Household Size: Monthly Income: Number of Dependents:
2. Profile of Household Members
NAME RELATIONSHIP
TO THE
RESPONDENT
SEX AGE C/S EDUCATIONAL
ATTAINMENT
SOURCE OF
INCOME
ANNUAL
INCOME
RELIGION LANGUAGE
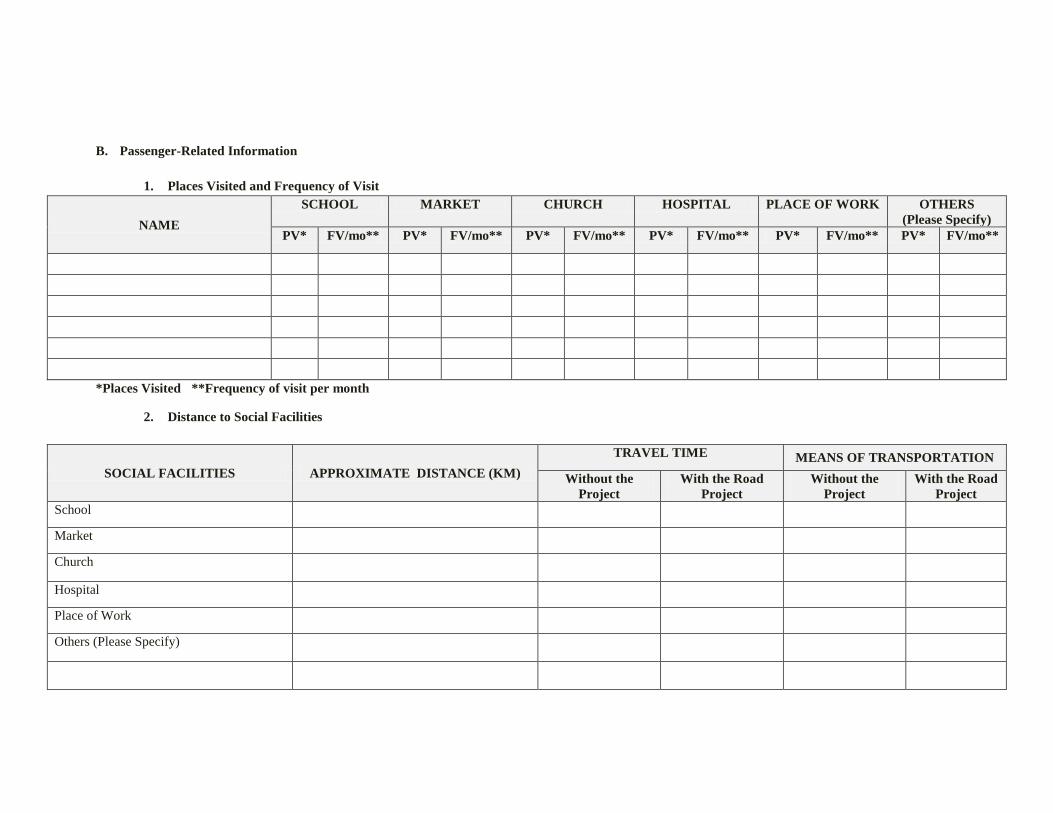
B. Passenger-Related Information
1. Places Visited and Frequency of Visit
NAME
SCHOOL MARKET CHURCH HOSPITAL PLACE OF WORK OTHERS
(Please Specify)
PV* FV/mo** PV* FV/mo** PV* FV/mo** PV* FV/mo** PV* FV/mo** PV* FV/mo**
*Places Visited **Frequency of visit per month
2. Distance to Social Facilities
SOCIAL FACILITIES APPROXIMATE DISTANCE (KM)
TRAVEL TIME MEANS OF TRANSPORTATION
Without the
Project
With the Road
Project
Without the
Project
With the Road
Project
School
Market
Church
Hospital
Place of Work
Others (Please Specify)

C. Freight-Related Information
1. Do you have a farm?
( ) Yes ( ) No
If yes, answer the table below.
If no, proceed to part D.
2. Where is the location of your farm? ____________________________________________________________________________________
(If the same as home address, proceed to question 3)
i. How far is your farm to the market (in km)? _______________________________________________________________________
ii. How long does it take you to bring your crops from your farm to the market (hrs)? ________________________________________
3. What means of transportation do you use to transport your crops? (Please Check)
( ) Tricycle ( ) Jeepney ( ) Truck ( ) Others, Please Specify ______________
TYPE OF CROP AREA OF LAND PLANTED
PER YEAR (HAS)
VOLUME OF YIELD PER
YEAR
PERCENT MARKETED FREQUENCY OF TRAVEL
WHEN SELLING HARVEST PER
YEAR

4. What problems related to transportation of crops do you encounter?
_____________________________________________________________________________________________________________________
_____________________________________________________________________________________________________________________
5. What suggestions can you give in order to solve such problems?
__________________________________________________________________________________________________________________
__________________________________________________________________________________________________________________
D. Socio-Cultural Impact Information
a. Will there be a decrease in the travel distance or time from the place of origin to the place of destination?
( ) Yes ( ) No
Explain your answer:
______________________________________________________________________________________________________________________
______________________________________________________________________________________________________________________
b. What is/are the effect(s) of the road rehabilitation on the traffic volume or pattern in the influenced area?
______________________________________________________________________________________________________________________
______________________________________________________________________________________________________________________
c. Will there be sub-cultural variation once road rehabilitation is completed in the affected area?
( ) Yes ( ) No
Explain your answer:
______________________________________________________________________________________________________________________
______________________________________________________________________________________________________________________
d. What is/are the impact(s) of the road rehabilitation project on the present ethnicity in the affected area?
______________________________________________________________________________________________________________________
______________________________________________________________________________________________________________________

e. What is/are the impact(s) of the road rehabilitation project on the type of work and income of the residents?
______________________________________________________________________________________________________________________
______________________________________________________________________________________________________________________
f. Will the proposed road rehabilitation influence the social patterns or daily activity patterns in the affected area?
( ) Yes ( ) No
Explain your answer:
______________________________________________________________________________________________________________________
______________________________________________________________________________________________________________________
g. Will the proposed road rehabilitation create leisure and cultural opportunities for the people living in the area?
( ) Yes ( ) No
Explain your answer:
______________________________________________________________________________________________________________________
______________________________________________________________________________________________________________________
h. What are the other possible social benefits when road is rehabilitated?
______________________________________________________________________________________________________________________
______________________________________________________________________________________________________________________
E. Environmental (Public Health and Safety) Impacts Information
a. What are the scenic spots near the rehabilitated road of Cattubo? Please enumerate.
_____________________________________________________________________________________________________________________
_____________________________________________________________________________________________________________________
_____________________________________________________________________________________________________________________

b. How will you describe the current situation of your environment?
_____________________________________________________________________________________________________________________
_____________________________________________________________________________________________________________________
_____________________________________________________________________________________________________________________
c. What are the potential health hazards of the road rehabilitation on the construction workers and the nearby residents during the project’s
construction phase?
_____________________________________________________________________________________________________________________
_____________________________________________________________________________________________________________________
_____________________________________________________________________________________________________________________
d. Will the road rehabilitation create increase traffic accident rate in the affected area?
( ) Yes ( ) No
Explain your answer:
_____________________________________________________________________________________________________________________
_____________________________________________________________________________________________________________________
e. Will the road rehabilitation influence air quality in the area?
( ) Yes ( ) No
Explain your answer:
_____________________________________________________________________________________________________________________
_____________________________________________________________________________________________________________________
f. Will the rehabilitated road degrade the aesthetic quality of the area?
( ) Yes ( ) No
Explain your answer:
_____________________________________________________________________________________________________________________
_____________________________________________________________________________________________________________________
g. Will the rehabilitation of road cause/increase incidence of soil erosion in the area?
( ) Yes ( ) No
Explain your answer:
_____________________________________________________________________________________________________________________
_____________________________________________________________________________________________________________________
h. Will the rehabilitation of road cause/increase incidence of flooding in the area?
( ) Yes ( ) No
Explain your answer:
_____________________________________________________________________________________________________________________
_____________________________________________________________________________________________________________________
F. Enumerate measures to maximize benefits and mitigate negative impacts of the project
a. Maximize benefits:
_____________________________________________________________________________________________________________________
_____________________________________________________________________________________________________________________
a. Minimize negative impacts:
_______________________________________________________________________________________________________________
_______________________________________________________________________________________________________________
~THANK YOU! ~
Name of Interviewer: Date of interview:
Signature:
Name of encoder: Date encoded:

Second Cordillera Highland Agricultural Resource Management Project
Socio-Economic, Financial, and Environmental Assessment
of FMR Rehabilitation Project in Barangay Cattubo, Atok, Benguet
PROJECT INFORMATION SHEET 1
(LGU PROFILE)
A. Demographic Profile
B. Socio-Economic Profile
Local Government Unit (LGU) Profile Provincial Municipality Barangay
A. Demographic Profile
i. Population size
ii. Population Density
iii. Average HH Size
iv. Number of HH
v. Labor Force and Employment
vi. Average Income per HH per Month
Data Provincial Municipality Barangay
1. Agriculture
Production per year Area Planted
Average Farm Size
2. Employment
Number of Under-employed Number of Unemployed
Number of Employed:
a. Agriculture
b. Commerce
c. Industrial
d. Construction
e. Others
3. Wage Rate
a. Agriculture
i. Skilled
ii. Unskilled
b. Construction
i. Skilled
ii. Unskilled
4. Source of Income
5. Education
6. Literacy Rate 7. Illiteracy Rate
8. Out-of-School Youth (School-Age)
C. Physical Infrastructure
D. Land Area
E. Maps
1. Road systems Map
2. Land use Map
3. Resource Map
4. Topographic Map
5. Location Map
Data Provincial Municipality Barangay
1. Social infrastructures
a. Number of schools
b. Government/religious Group Facilities
c. Health Centers, Hospitals and Clinics
d. Other, specify
2. Road Infrastructures
a. Roads and bridges
b. Footpaths and foot bridges
Data Provincial Municipality Barangay
Land Classification
a. Agricultural
b. Vegetation
c. Residential
d. Commercial
e. Industrial
f. Forestry
g. Others
Total land area
PROJECT INFORMATION SHEET 2
(ROAD PROJECT PROFILE)
A. Location of the Road Project: __________________________________________________ Barangay Municipality
B. Duration of Road Construction: _________________________________
C. Length of Road Project (km): ___________________________________
D. Influence Area:
a. Immediate Barangays (Please enumerate): ____________________________
b. Neighboring Barangays (Please enumerate):___________________________
Data Values
Agricultural Area (ha)
Distance from the market of agricultural products (km)
Population/Household
1. Immediate Barangay
a. Actual Population
b. No. of Households
c. Average No. of Trips / Household / month
2. Neighboring Barangay
a. No. of Barangays
b. Actual Population per Barangay
c. No. of Households per Barangay
d. Average No. of Trips / Household / month
E. Type of Crops Harvested, Yields and Volume marketed
Type of Crops Area Harvested/Planted per
Year
Total Harvest/ Year
(tons) Percent Marketed
Cabbage
Potato
Carrots
Wongbok
Others
F. Detailed Cost Per Km of Road Rehabilitation (attach copy of specific items and prices)
G. Cost of Road Construction
FINANCIAL COST OF THE ROAD REHABILITATION PROJECT
Capital Investment
(Percent Allocation from the Total
Cost)
Working Capital
(Percent Allocation from the
Total Cost)
TOTAL COST
1. Labor Cost
a. Unskilled
b. Skilled
2. Cost of Materials
a. Equipment
b. Supplies
c. Others
3. Management and Supervision
4. Other Cost
*REPLACEMENT COST (if any):
H. Utility Vehicles Operators
UTILITY VEHICLES OPERATORS MUNICIPALITY BARANGAY
a. Number of Truck Operators:
b. Number of Jeepney Operators:
c. Number of Tricycle Operators:
d. Others (Please specify):

I. Vehicle Operating Costs for Freight (Php/ton-km) (Benguet province)**
TYPE OF VEHICLE
KIND OF ROAD CURRENT
PERCENT
UTILITIZATION All-weather
Rehabilitated (Php)
All-weather
Unrehabilitated (Php)
1. Truck
2. Jeepney
3. Tricycle
4. Others
(Please specify):
J. Vehicle Operating Costs for Passenger (Php/passenger-km) (Benguet province)**
TYPE OF VEHICLE
KIND OF ROAD CURRENT
PERCENT
UTILITIZATION All-weather
Rehabilitated (Php)
All-weather
Unrehabilitated (Php)
1. Truck
2. Jeepney
3. Tricycle
4. Others
(Please specify):
** May be obtained from DPWH
K. Travel Time from Farm to Market:
a. With the Road Project: _______________
b. Without the Road Project:_____________
L. Existing Farm-to-Market Road Network
Name of Roads Type of Roads Length of Road (km)
M. Other Information
a. Official Exchange Rate: _______________________________
b. Shadow Exchange Rate: _______________________________
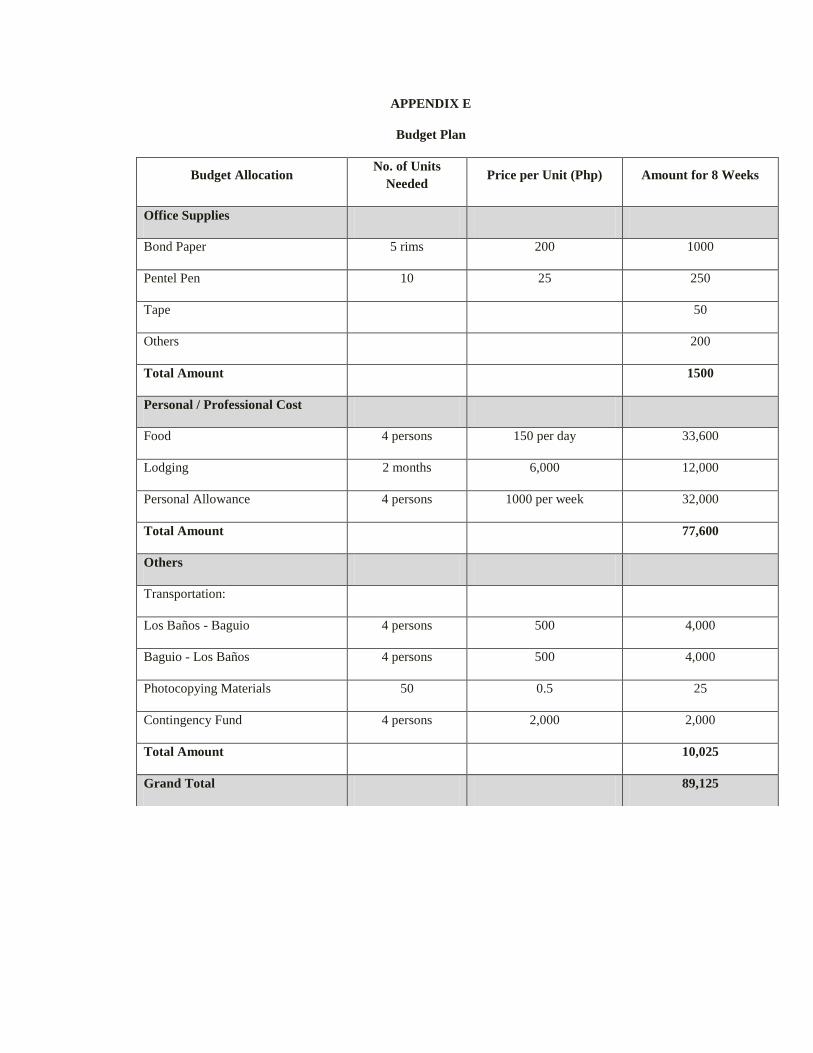
APPENDIX E
Budget Plan
Budget Allocation No. of Units
Needed Price per Unit (Php) Amount for 8 Weeks
Office Supplies
Bond Paper 5 rims 200 1000
Pentel Pen 10 25 250
Tape 50
Others 200
Total Amount 1500
Personal / Professional Cost
Food 4 persons 150 per day 33,600
Lodging 2 months 6,000 12,000
Personal Allowance 4 persons 1000 per week 32,000
Total Amount 77,600
Others
Transportation:
Los Baños - Baguio 4 persons 500 4,000
Baguio - Los Baños 4 persons 500 4,000
Photocopying Materials 50 0.5 25
Contingency Fund 4 persons 2,000 2,000
Total Amount 10,025
Grand Total 89,125

APPENDIX F
Financial Computations
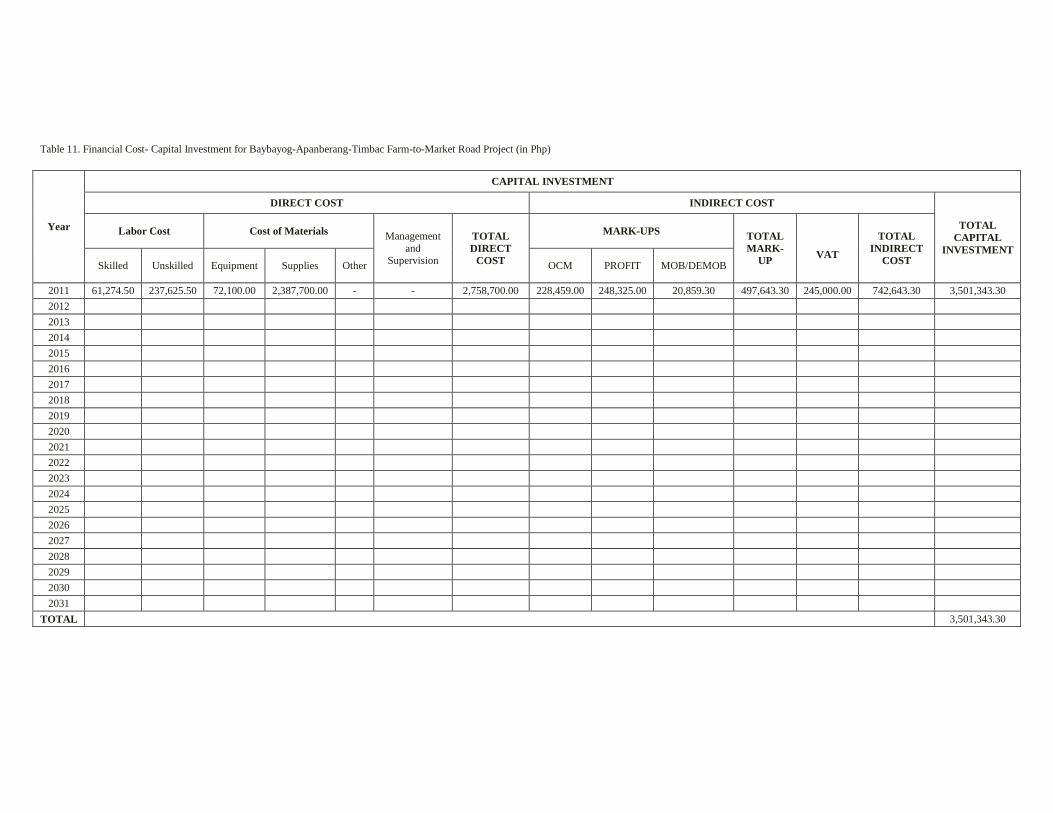
Table 11. Financial Cost- Capital Investment for Baybayog-Apanberang-Timbac Farm-to-Market Road Project (in Php)
Year
CAPITAL INVESTMENT
DIRECT COST INDIRECT COST
TOTAL
CAPITAL
INVESTMENT
Labor Cost Cost of Materials Management
and Supervision
TOTAL
DIRECT
COST
MARK-UPS TOTAL
MARK-
UP
VAT
TOTAL
INDIRECT
COST Skilled Unskilled Equipment Supplies Other OCM PROFIT MOB/DEMOB
2011 61,274.50 237,625.50 72,100.00 2,387,700.00 - - 2,758,700.00 228,459.00 248,325.00 20,859.30 497,643.30 245,000.00 742,643.30 3,501,343.30
2012
2013
2014
2015
2016
2017
2018
2019
2020
2021
2022
2023
2024
2025
2026
2027
2028
2029
2030
2031
TOTAL
3,501,343.30
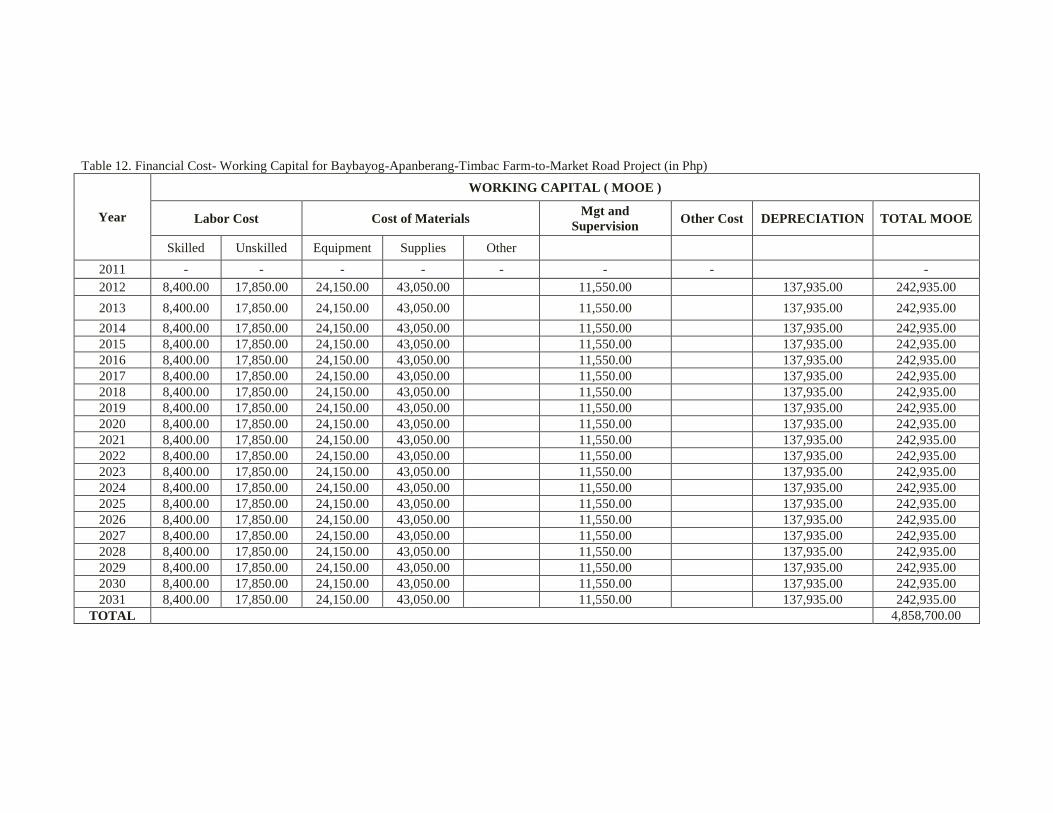
Table 12. Financial Cost- Working Capital for Baybayog-Apanberang-Timbac Farm-to-Market Road Project (in Php)
Year
WORKING CAPITAL ( MOOE )
Labor Cost Cost of Materials Mgt and
Supervision Other Cost DEPRECIATION TOTAL MOOE
Skilled Unskilled Equipment Supplies Other
2011 - - - - - - -
-
2012 8,400.00 17,850.00 24,150.00 43,050.00
11,550.00
137,935.00 242,935.00
2013 8,400.00 17,850.00 24,150.00 43,050.00
11,550.00
137,935.00 242,935.00
2014 8,400.00 17,850.00 24,150.00 43,050.00
11,550.00
137,935.00 242,935.00
2015 8,400.00 17,850.00 24,150.00 43,050.00
11,550.00
137,935.00 242,935.00
2016 8,400.00 17,850.00 24,150.00 43,050.00
11,550.00
137,935.00 242,935.00
2017 8,400.00 17,850.00 24,150.00 43,050.00
11,550.00
137,935.00 242,935.00
2018 8,400.00 17,850.00 24,150.00 43,050.00
11,550.00
137,935.00 242,935.00
2019 8,400.00 17,850.00 24,150.00 43,050.00
11,550.00
137,935.00 242,935.00
2020 8,400.00 17,850.00 24,150.00 43,050.00
11,550.00
137,935.00 242,935.00
2021 8,400.00 17,850.00 24,150.00 43,050.00
11,550.00
137,935.00 242,935.00
2022 8,400.00 17,850.00 24,150.00 43,050.00
11,550.00
137,935.00 242,935.00
2023 8,400.00 17,850.00 24,150.00 43,050.00
11,550.00
137,935.00 242,935.00
2024 8,400.00 17,850.00 24,150.00 43,050.00
11,550.00
137,935.00 242,935.00
2025 8,400.00 17,850.00 24,150.00 43,050.00
11,550.00
137,935.00 242,935.00
2026 8,400.00 17,850.00 24,150.00 43,050.00
11,550.00
137,935.00 242,935.00
2027 8,400.00 17,850.00 24,150.00 43,050.00
11,550.00
137,935.00 242,935.00
2028 8,400.00 17,850.00 24,150.00 43,050.00
11,550.00
137,935.00 242,935.00
2029 8,400.00 17,850.00 24,150.00 43,050.00
11,550.00
137,935.00 242,935.00
2030 8,400.00 17,850.00 24,150.00 43,050.00
11,550.00
137,935.00 242,935.00
2031 8,400.00 17,850.00 24,150.00 43,050.00
11,550.00
137,935.00 242,935.00
TOTAL
4,858,700.00
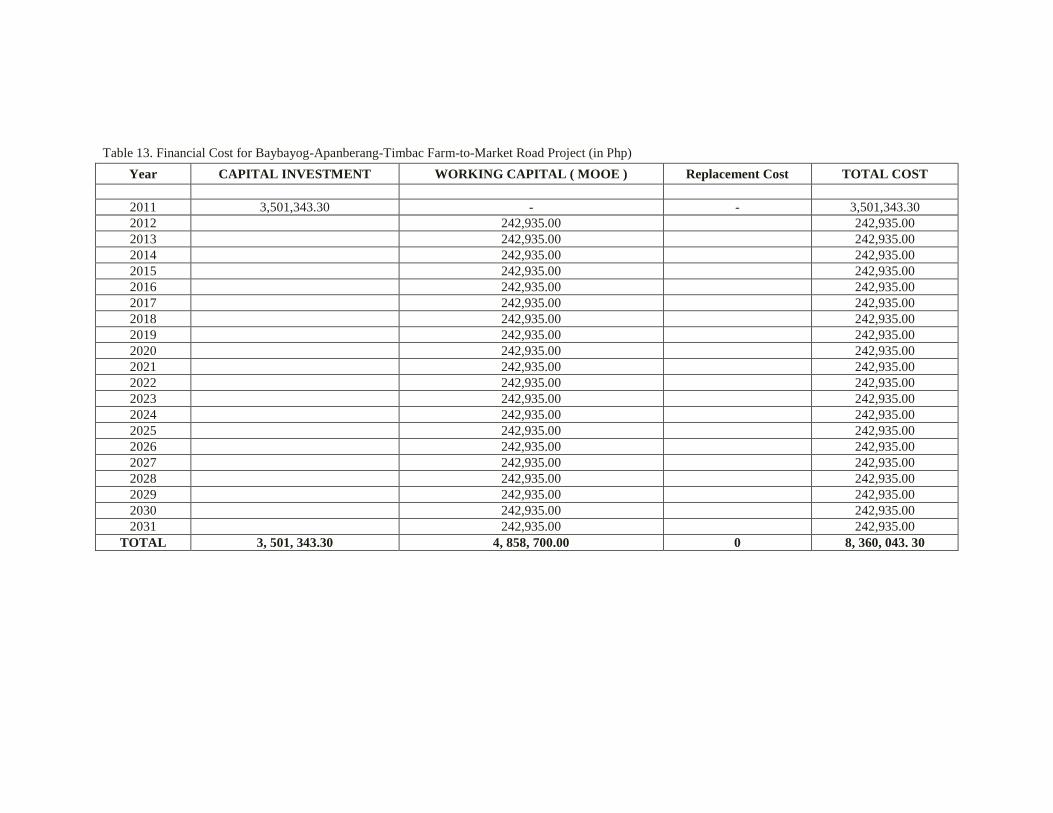
Table 13. Financial Cost for Baybayog-Apanberang-Timbac Farm-to-Market Road Project (in Php)
Year CAPITAL INVESTMENT WORKING CAPITAL ( MOOE ) Replacement Cost TOTAL COST
2011 3,501,343.30 - - 3,501,343.30
2012
242,935.00
242,935.00
2013
242,935.00
242,935.00
2014
242,935.00
242,935.00
2015
242,935.00
242,935.00
2016
242,935.00
242,935.00
2017
242,935.00
242,935.00
2018
242,935.00
242,935.00
2019
242,935.00
242,935.00
2020
242,935.00
242,935.00
2021
242,935.00
242,935.00
2022
242,935.00
242,935.00
2023
242,935.00
242,935.00
2024
242,935.00
242,935.00
2025
242,935.00
242,935.00
2026
242,935.00
242,935.00
2027
242,935.00
242,935.00
2028
242,935.00
242,935.00
2029
242,935.00
242,935.00
2030
242,935.00
242,935.00
2031
242,935.00
242,935.00
TOTAL 3, 501, 343.30 4, 858, 700.00 0 8, 360, 043. 30

Table 14. Basic Parameters in Deriving Incremental Financial Benefits from Farm to Market Roads Project
ITEM WITHOUT THE PROJECT WITH THE PROJECT
VOC SAVINGS
Percent VOC/Ton/km Percent VOC/Ton/km
(i) Freight
Jeepney 70 22.51* 30 6.753*
Truck 30 12* 70 3.6*
VOC (Weighted Average)
9.68
2.27 7.41
(ii) Passenger
Jeepney 70 2.7* 30 0.81*
Truck 30 1.44* 70 0.43*
VOC (Weighted Average)
0.77
0.18 0.59
* Data obtained from DPWH-CAR , 2009
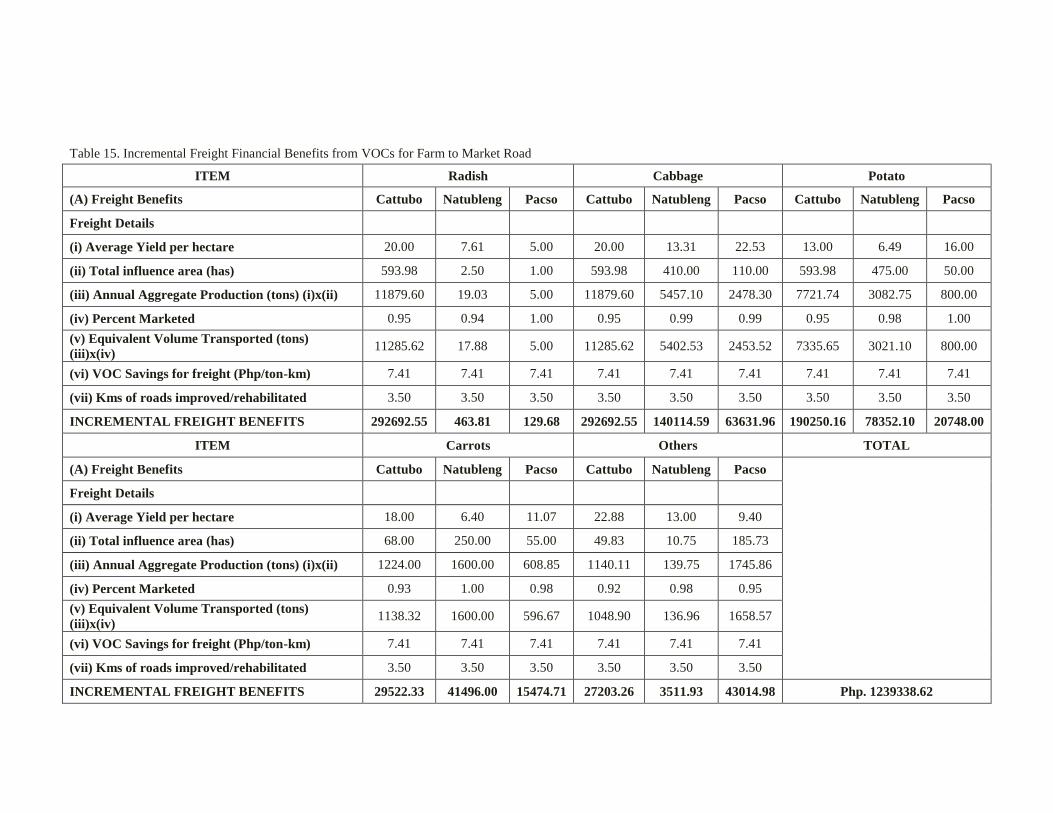
Table 15. Incremental Freight Financial Benefits from VOCs for Farm to Market Road
ITEM Radish Cabbage Potato
(A) Freight Benefits Cattubo Natubleng Pacso Cattubo Natubleng Pacso Cattubo Natubleng Pacso
Freight Details
(i) Average Yield per hectare 20.00 7.61 5.00 20.00 13.31 22.53 13.00 6.49 16.00
(ii) Total influence area (has) 593.98 2.50 1.00 593.98 410.00 110.00 593.98 475.00 50.00
(iii) Annual Aggregate Production (tons) (i)x(ii) 11879.60 19.03 5.00 11879.60 5457.10 2478.30 7721.74 3082.75 800.00
(iv) Percent Marketed 0.95 0.94 1.00 0.95 0.99 0.99 0.95 0.98 1.00
(v) Equivalent Volume Transported (tons)
(iii)x(iv) 11285.62 17.88 5.00 11285.62 5402.53 2453.52 7335.65 3021.10 800.00
(vi) VOC Savings for freight (Php/ton-km) 7.41 7.41 7.41 7.41 7.41 7.41 7.41 7.41 7.41
(vii) Kms of roads improved/rehabilitated 3.50 3.50 3.50 3.50 3.50 3.50 3.50 3.50 3.50
INCREMENTAL FREIGHT BENEFITS 292692.55 463.81 129.68 292692.55 140114.59 63631.96 190250.16 78352.10 20748.00
ITEM Carrots Others TOTAL
(A) Freight Benefits Cattubo Natubleng Pacso Cattubo Natubleng Pacso
Freight Details
(i) Average Yield per hectare 18.00 6.40 11.07 22.88 13.00 9.40
(ii) Total influence area (has) 68.00 250.00 55.00 49.83 10.75 185.73
(iii) Annual Aggregate Production (tons) (i)x(ii) 1224.00 1600.00 608.85 1140.11 139.75 1745.86
(iv) Percent Marketed 0.93 1.00 0.98 0.92 0.98 0.95
(v) Equivalent Volume Transported (tons)
(iii)x(iv) 1138.32 1600.00 596.67 1048.90 136.96 1658.57
(vi) VOC Savings for freight (Php/ton-km) 7.41 7.41 7.41 7.41 7.41 7.41
(vii) Kms of roads improved/rehabilitated 3.50 3.50 3.50 3.50 3.50 3.50
INCREMENTAL FREIGHT BENEFITS 29522.33 41496.00 15474.71 27203.26 3511.93 43014.98 Php. 1239338.62
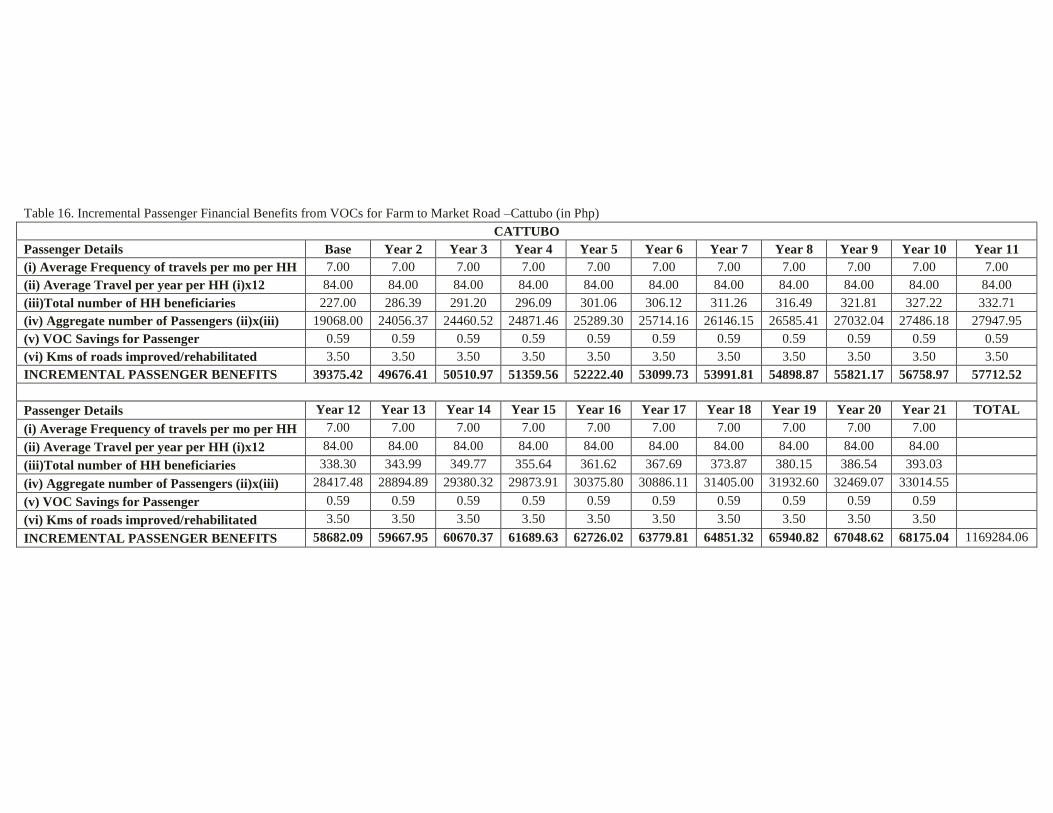
Table 16. Incremental Passenger Financial Benefits from VOCs for Farm to Market Road –Cattubo (in Php)
CATTUBO
Passenger Details Base Year 2 Year 3 Year 4 Year 5 Year 6 Year 7 Year 8 Year 9 Year 10 Year 11
(i) Average Frequency of travels per mo per HH 7.00 7.00 7.00 7.00 7.00 7.00 7.00 7.00 7.00 7.00 7.00
(ii) Average Travel per year per HH (i)x12 84.00 84.00 84.00 84.00 84.00 84.00 84.00 84.00 84.00 84.00 84.00
(iii)Total number of HH beneficiaries 227.00 286.39 291.20 296.09 301.06 306.12 311.26 316.49 321.81 327.22 332.71
(iv) Aggregate number of Passengers (ii)x(iii) 19068.00 24056.37 24460.52 24871.46 25289.30 25714.16 26146.15 26585.41 27032.04 27486.18 27947.95
(v) VOC Savings for Passenger 0.59 0.59 0.59 0.59 0.59 0.59 0.59 0.59 0.59 0.59 0.59
(vi) Kms of roads improved/rehabilitated 3.50 3.50 3.50 3.50 3.50 3.50 3.50 3.50 3.50 3.50 3.50
INCREMENTAL PASSENGER BENEFITS 39375.42 49676.41 50510.97 51359.56 52222.40 53099.73 53991.81 54898.87 55821.17 56758.97 57712.52
Passenger Details Year 12 Year 13 Year 14 Year 15 Year 16 Year 17 Year 18 Year 19 Year 20 Year 21 TOTAL
(i) Average Frequency of travels per mo per HH 7.00 7.00 7.00 7.00 7.00 7.00 7.00 7.00 7.00 7.00
(ii) Average Travel per year per HH (i)x12 84.00 84.00 84.00 84.00 84.00 84.00 84.00 84.00 84.00 84.00
(iii)Total number of HH beneficiaries 338.30 343.99 349.77 355.64 361.62 367.69 373.87 380.15 386.54 393.03
(iv) Aggregate number of Passengers (ii)x(iii) 28417.48 28894.89 29380.32 29873.91 30375.80 30886.11 31405.00 31932.60 32469.07 33014.55
(v) VOC Savings for Passenger 0.59 0.59 0.59 0.59 0.59 0.59 0.59 0.59 0.59 0.59
(vi) Kms of roads improved/rehabilitated 3.50 3.50 3.50 3.50 3.50 3.50 3.50 3.50 3.50 3.50
INCREMENTAL PASSENGER BENEFITS 58682.09 59667.95 60670.37 61689.63 62726.02 63779.81 64851.32 65940.82 67048.62 68175.04 1169284.06
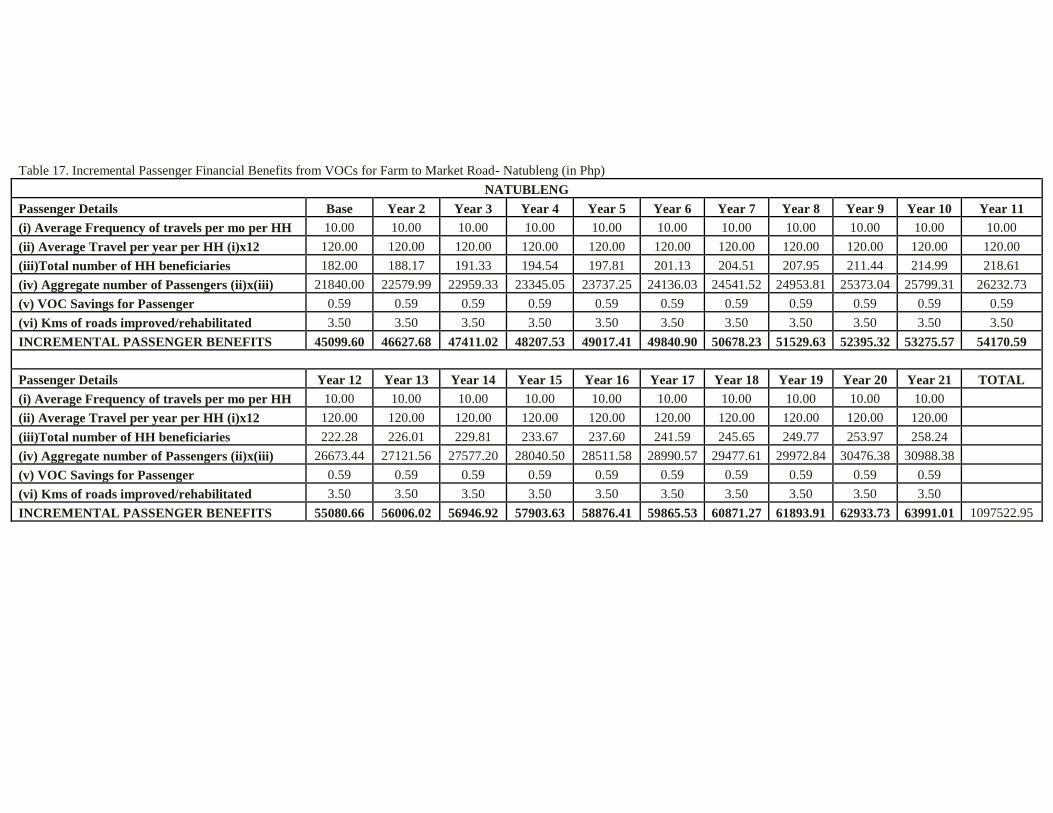
Table 17. Incremental Passenger Financial Benefits from VOCs for Farm to Market Road- Natubleng (in Php)
NATUBLENG
Passenger Details Base Year 2 Year 3 Year 4 Year 5 Year 6 Year 7 Year 8 Year 9 Year 10 Year 11
(i) Average Frequency of travels per mo per HH 10.00 10.00 10.00 10.00 10.00 10.00 10.00 10.00 10.00 10.00 10.00
(ii) Average Travel per year per HH (i)x12 120.00 120.00 120.00 120.00 120.00 120.00 120.00 120.00 120.00 120.00 120.00
(iii)Total number of HH beneficiaries 182.00 188.17 191.33 194.54 197.81 201.13 204.51 207.95 211.44 214.99 218.61
(iv) Aggregate number of Passengers (ii)x(iii) 21840.00 22579.99 22959.33 23345.05 23737.25 24136.03 24541.52 24953.81 25373.04 25799.31 26232.73
(v) VOC Savings for Passenger 0.59 0.59 0.59 0.59 0.59 0.59 0.59 0.59 0.59 0.59 0.59
(vi) Kms of roads improved/rehabilitated 3.50 3.50 3.50 3.50 3.50 3.50 3.50 3.50 3.50 3.50 3.50
INCREMENTAL PASSENGER BENEFITS 45099.60 46627.68 47411.02 48207.53 49017.41 49840.90 50678.23 51529.63 52395.32 53275.57 54170.59
Passenger Details Year 12 Year 13 Year 14 Year 15 Year 16 Year 17 Year 18 Year 19 Year 20 Year 21 TOTAL
(i) Average Frequency of travels per mo per HH 10.00 10.00 10.00 10.00 10.00 10.00 10.00 10.00 10.00 10.00
(ii) Average Travel per year per HH (i)x12 120.00 120.00 120.00 120.00 120.00 120.00 120.00 120.00 120.00 120.00
(iii)Total number of HH beneficiaries 222.28 226.01 229.81 233.67 237.60 241.59 245.65 249.77 253.97 258.24
(iv) Aggregate number of Passengers (ii)x(iii) 26673.44 27121.56 27577.20 28040.50 28511.58 28990.57 29477.61 29972.84 30476.38 30988.38
(v) VOC Savings for Passenger 0.59 0.59 0.59 0.59 0.59 0.59 0.59 0.59 0.59 0.59
(vi) Kms of roads improved/rehabilitated 3.50 3.50 3.50 3.50 3.50 3.50 3.50 3.50 3.50 3.50
INCREMENTAL PASSENGER BENEFITS 55080.66 56006.02 56946.92 57903.63 58876.41 59865.53 60871.27 61893.91 62933.73 63991.01 1097522.95

Table 18. Incremental Passenger Financial Benefits from VOCs for Farm to Market Road-Pacso (in Php)
PACSO
Passenger Details Base Year 2 Year 3 Year 4 Year 5 Year 6 Year 7 Year 8 Year 9 Year 10 Year 11
(i) Average Frequency of travels per mo per HH 8.00 8.00 8.00 8.00 8.00 8.00 8.00 8.00 8.00 8.00 8.00
(ii) Average Travel per year per HH (i)x12 96.00 96.00 96.00 96.00 96.00 96.00 96.00 96.00 96.00 96.00 96.00
(iii)Total number of HH beneficiaries 144.00 148.88 151.38 153.92 156.51 159.14 161.81 164.53 167.29 170.11 172.96
(iv) Aggregate number of Passengers (ii)x(iii) 13824.00 14292.39 14532.50 14776.65 15024.89 15277.31 15533.97 15794.94 16060.30 16330.11 16604.46
(v) VOC Savings for Passenger 0.59 0.59 0.59 0.59 0.59 0.59 0.59 0.59 0.59 0.59 0.59
(vi) Kms of roads improved/rehabilitated 3.50 3.50 3.50 3.50 3.50 3.50 3.50 3.50 3.50 3.50 3.50
INCREMENTAL PASSENGER BENEFITS 28546.56 29513.78 30009.61 30513.77 31026.41 31547.65 32077.65 32616.55 33164.51 33721.68 34288.20
Passenger Details Year 12 Year 13 Year 14 Year 15 Year 16 Year 17 Year 18 Year 19 Year 20 Year 21 TOTAL
(i) Average Frequency of travels per mo per HH 8.00 8.00 8.00 8.00 8.00 8.00 8.00 8.00 8.00 8.00
(ii) Average Travel per year per HH (i)x12 96.00 96.00 96.00 96.00 96.00 96.00 96.00 96.00 96.00 96.00
(iii)Total number of HH beneficiaries 175.87 178.82 181.83 184.88 187.99 191.15 194.36 197.62 200.94 204.32
(iv) Aggregate number of Passengers (ii)x(iii) 16883.41 17167.05 17455.46 17748.71 18046.89 18350.08 18658.36 18971.82 19290.54 19614.63
(v) VOC Savings for Passenger 0.59 0.59 0.59 0.59 0.59 0.59 0.59 0.59 0.59 0.59
(vi) Kms of roads improved/rehabilitated 3.50 3.50 3.50 3.50 3.50 3.50 3.50 3.50 3.50 3.50
INCREMENTAL PASSENGER BENEFITS 34864.24 35449.96 36045.52 36651.09 37266.82 37892.91 38529.51 39176.80 39834.97 40504.20 694695.84

Table 19. Total Incremental Passenger Financial Benefits from VOCs for Farm to Market Road (in Php)
INCREMENTAL
PASSENGER BENEFITS Base Year 2 Year 3 Year 4 Year 5 Year 6 Year 7 Year 8 Year 9 Year 10 Year 11
Cattubo 39375.42 49676.41 50510.97 51359.56 52222.40 53099.73 53991.81 54898.87 55821.17 56758.97 57712.52
Natubleng 45099.60 46627.68 47411.02 48207.53 49017.41 49840.90 50678.23 51529.63 52395.32 53275.57 54170.59
Pacso 28546.56 29513.78 30009.61 30513.77 31026.41 31547.65 32077.65 32616.55 33164.51 33721.68 34288.20
TOTAL 113021.58 125817.86 127931.61 130080.86 132266.21 134488.29 136747.69 139045.05 141381.01 143756.21 146171.31
INCREMENTAL
PASSENGER BENEFITS Year 12 Year 13 Year 14 Year 15 Year 16 Year 17 Year 18 Year 19 Year 20 Year 21 TOTAL
Cattubo 58682.09 59667.95 60670.37 61689.63 62726.02 63779.81 64851.32 65940.82 67048.62 68175.04 1169284.06
Natubleng 55080.66 56006.02 56946.92 57903.63 58876.41 59865.53 60871.27 61893.91 62933.73 63991.01 1097522.95
Pacso 34864.24 35449.96 36045.52 36651.09 37266.82 37892.91 38529.51 39176.80 39834.97 40504.20 694695.84
TOTAL 148626.99 151123.92 153662.81 156244.34 158869.25 161538.25 164252.09 167011.53 169817.32 172670.25 2961502.86
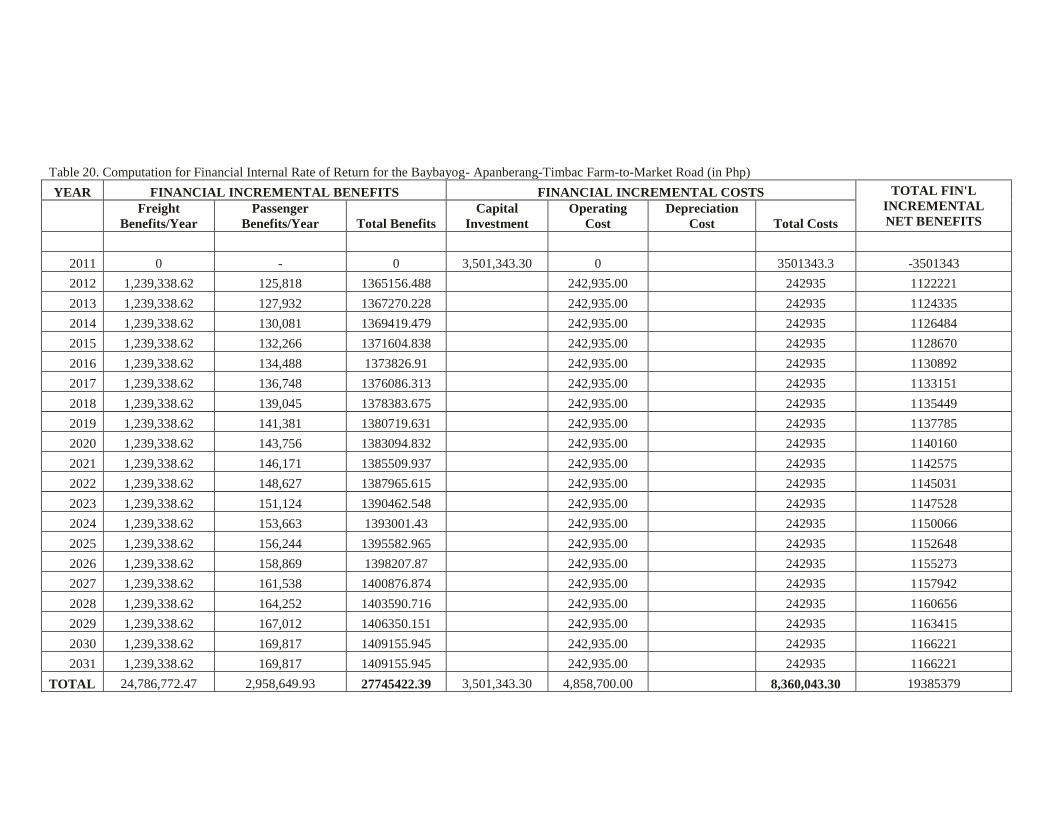
Table 20. Computation for Financial Internal Rate of Return for the Baybayog- Apanberang-Timbac Farm-to-Market Road (in Php)
YEAR FINANCIAL INCREMENTAL BENEFITS FINANCIAL INCREMENTAL COSTS TOTAL FIN'L
INCREMENTAL
NET BENEFITS
Freight
Benefits/Year
Passenger
Benefits/Year Total Benefits
Capital
Investment
Operating
Cost
Depreciation
Cost Total Costs
2011 0 - 0 3,501,343.30 0
3501343.3 -3501343
2012 1,239,338.62 125,818 1365156.488
242,935.00
242935 1122221
2013 1,239,338.62 127,932 1367270.228
242,935.00
242935 1124335
2014 1,239,338.62 130,081 1369419.479
242,935.00
242935 1126484
2015 1,239,338.62 132,266 1371604.838
242,935.00
242935 1128670
2016 1,239,338.62 134,488 1373826.91
242,935.00
242935 1130892
2017 1,239,338.62 136,748 1376086.313
242,935.00
242935 1133151
2018 1,239,338.62 139,045 1378383.675
242,935.00
242935 1135449
2019 1,239,338.62 141,381 1380719.631
242,935.00
242935 1137785
2020 1,239,338.62 143,756 1383094.832
242,935.00
242935 1140160
2021 1,239,338.62 146,171 1385509.937
242,935.00
242935 1142575
2022 1,239,338.62 148,627 1387965.615
242,935.00
242935 1145031
2023 1,239,338.62 151,124 1390462.548
242,935.00
242935 1147528
2024 1,239,338.62 153,663 1393001.43
242,935.00
242935 1150066
2025 1,239,338.62 156,244 1395582.965
242,935.00
242935 1152648
2026 1,239,338.62 158,869 1398207.87
242,935.00
242935 1155273
2027 1,239,338.62 161,538 1400876.874
242,935.00
242935 1157942
2028 1,239,338.62 164,252 1403590.716
242,935.00
242935 1160656
2029 1,239,338.62 167,012 1406350.151
242,935.00
242935 1163415
2030 1,239,338.62 169,817 1409155.945
242,935.00
242935 1166221
2031 1,239,338.62 169,817 1409155.945
242,935.00
242935 1166221
TOTAL 24,786,772.47 2,958,649.93 27745422.39 3,501,343.30 4,858,700.00
8,360,043.30 19385379

Table 21. Computation for Financial Internal Rate of Return for the Baybayog- Apanberang-Timbac Farm-to-Market Road with 10% Decrease in Benefits (in Php)
YEAR FINANCIAL INCREMENTAL BENEFITS FINANCIAL INCREMENTAL COSTS
TOTAL FIN'L
INCREMENTAL
Freight
Benefits/Year
Passenger
Benefits/Year
Total
Benefits
Capital
Investment
Operating
Cost
Depreciation
Cost Total Costs NET BENEFITS
2011 0 0 0 3,501,343.30 0 3501343.3 -3501343.3
2012 1,239,338.62 125,818 1228640.8 242,935.00 242935 985705.8395
2013 1,239,338.62 127,932 1230543.2 242,935.00 242935 987608.2056
2014 1,239,338.62 130,081 1232477.5 242,935.00 242935 989542.5315
2015 1,239,338.62 132,266 1234444.4 242,935.00 242935 991509.354
2016 1,239,338.62 134,488 1236444.2 242,935.00 242935 993509.2192
2017 1,239,338.62 136,748 1238477.7 242,935.00 242935 995542.6821
2018 1,239,338.62 139,045 1240545.3 242,935.00 242935 997610.3071
2019 1,239,338.62 141,381 1242647.7 242,935.00 242935 999712.6683
2020 1,239,338.62 143,756 1244785.3 242,935.00 242935 1001850.349
2021 1,239,338.62 146,171 1246958.9 242,935.00 242935 1004023.943
2022 1,239,338.62 148,627 1249169.1 242,935.00 242935 1006234.053
2023 1,239,338.62 151,124 1251416.3 242,935.00 242935 1008481.293
2024 1,239,338.62 153,663 1253701.3 242,935.00 242935 1010766.287
2025 1,239,338.62 156,244 1256024.7 242,935.00 242935 1013089.669
2026 1,239,338.62 158,869 1258387.1 242,935.00 242935 1015452.083
2027 1,239,338.62 161,538 1260789.2 242,935.00 242935 1017854.186
2028 1,239,338.62 164,252 1263231.6 242,935.00 242935 1020296.645
2029 1,239,338.62 167,012 1265715.1 242,935.00 242935 1022780.136
2030 1,239,338.62 169,817 1268240.4 242,935.00 242935 1025305.351
2031 1,239,338.62 169,817 1268240.4 242,935.00 242935 1025305.351
TOTAL 24,786,772.47 2,958,649.93 24970880 3,501,343.30 4,858,700.00 8,360,043.30 16610836.85
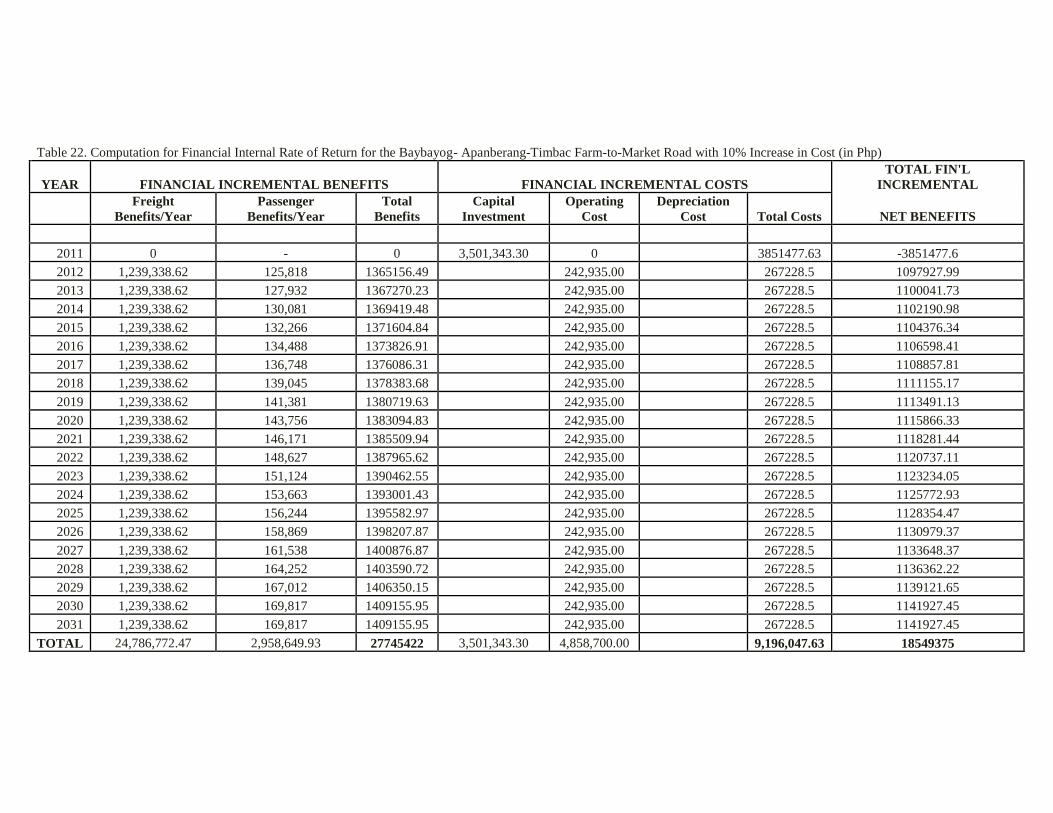
Table 22. Computation for Financial Internal Rate of Return for the Baybayog- Apanberang-Timbac Farm-to-Market Road with 10% Increase in Cost (in Php)
YEAR FINANCIAL INCREMENTAL BENEFITS FINANCIAL INCREMENTAL COSTS
TOTAL FIN'L
INCREMENTAL
Freight
Benefits/Year
Passenger
Benefits/Year
Total
Benefits
Capital
Investment
Operating
Cost
Depreciation
Cost Total Costs NET BENEFITS
2011 0 - 0 3,501,343.30 0 3851477.63 -3851477.6
2012 1,239,338.62 125,818 1365156.49 242,935.00 267228.5 1097927.99
2013 1,239,338.62 127,932 1367270.23 242,935.00 267228.5 1100041.73
2014 1,239,338.62 130,081 1369419.48 242,935.00 267228.5 1102190.98
2015 1,239,338.62 132,266 1371604.84 242,935.00 267228.5 1104376.34
2016 1,239,338.62 134,488 1373826.91 242,935.00 267228.5 1106598.41
2017 1,239,338.62 136,748 1376086.31 242,935.00 267228.5 1108857.81
2018 1,239,338.62 139,045 1378383.68 242,935.00 267228.5 1111155.17
2019 1,239,338.62 141,381 1380719.63 242,935.00 267228.5 1113491.13
2020 1,239,338.62 143,756 1383094.83 242,935.00 267228.5 1115866.33
2021 1,239,338.62 146,171 1385509.94 242,935.00 267228.5 1118281.44
2022 1,239,338.62 148,627 1387965.62 242,935.00 267228.5 1120737.11
2023 1,239,338.62 151,124 1390462.55 242,935.00 267228.5 1123234.05
2024 1,239,338.62 153,663 1393001.43 242,935.00 267228.5 1125772.93
2025 1,239,338.62 156,244 1395582.97 242,935.00 267228.5 1128354.47
2026 1,239,338.62 158,869 1398207.87 242,935.00 267228.5 1130979.37
2027 1,239,338.62 161,538 1400876.87 242,935.00 267228.5 1133648.37
2028 1,239,338.62 164,252 1403590.72 242,935.00 267228.5 1136362.22
2029 1,239,338.62 167,012 1406350.15 242,935.00 267228.5 1139121.65
2030 1,239,338.62 169,817 1409155.95 242,935.00 267228.5 1141927.45
2031 1,239,338.62 169,817 1409155.95 242,935.00 267228.5 1141927.45
TOTAL 24,786,772.47 2,958,649.93 27745422 3,501,343.30 4,858,700.00 9,196,047.63 18549375

Table 23. Computation for Financial Internal Rate of Return for the Baybayog- Apanberang-Timbac Farm-to-Market Road with Two Years Project Delay (in Php)
YEAR FINANCIAL INCREMENTAL BENEFITS FINANCIAL INCREMENTAL COSTS
TOTAL FIN'L
INCREMENTAL
Freight
Benefits/Year
Passenger
Benefits/Year
Total
Benefits
Capital
Investment
Operating
Cost
Depreciation
Cost Total Costs NET BENEFITS
2011 0 0 0 1,750,671.65 0 1750671.65 -1750671.7
2012 0.00 0 0 875335.825 0.00 875335.825 -875335.83
2013 0.00 0 0 875335.825 0.00 875335.825 -875335.83
2014 1,239,338.62 130,081 1369419.5 242,935.00 242935 1126484.5
2015 1,239,338.62 132,266 1371604.8 242,935.00 242935 1128669.8
2016 1,239,338.62 134,488 1373826.9 242,935.00 242935 1130891.9
2017 1,239,338.62 136,748 1376086.3 242,935.00 242935 1133151.3
2018 1,239,338.62 139,045 1378383.7 242,935.00 242935 1135448.7
2019 1,239,338.62 141,381 1380719.6 242,935.00 242935 1137784.6
2020 1,239,338.62 143,756 1383094.8 242,935.00 242935 1140159.8
2021 1,239,338.62 146,171 1385509.9 242,935.00 242935 1142574.9
2022 1,239,338.62 148,627 1387965.6 242,935.00 242935 1145030.6
2023 1,239,338.62 151,124 1390462.5 242,935.00 242935 1147527.5
2024 1,239,338.62 153,663 1393001.4 242,935.00 242935 1150066.4
2025 1,239,338.62 156,244 1395583 242,935.00 242935 1152648
2026 1,239,338.62 158,869 1398207.9 242,935.00 242935 1155272.9
2027 1,239,338.62 161,538 1400876.9 242,935.00 242935 1157941.9
2028 1,239,338.62 164,252 1403590.7 242,935.00 242935 1160655.7
2029 1,239,338.62 167,012 1406350.2 242,935.00 242935 1163415.2
2030 1,239,338.62 169,817 1409155.9 242,935.00 242935 1166220.9
2031 1,239,338.62 169,817 1409155.9 242,935.00 242935 1166220.9
TOTAL 22,308,095.22 2,704,900.46 25012996 3,501,343.30 4,372,830.00 7,874,173.30 17138822
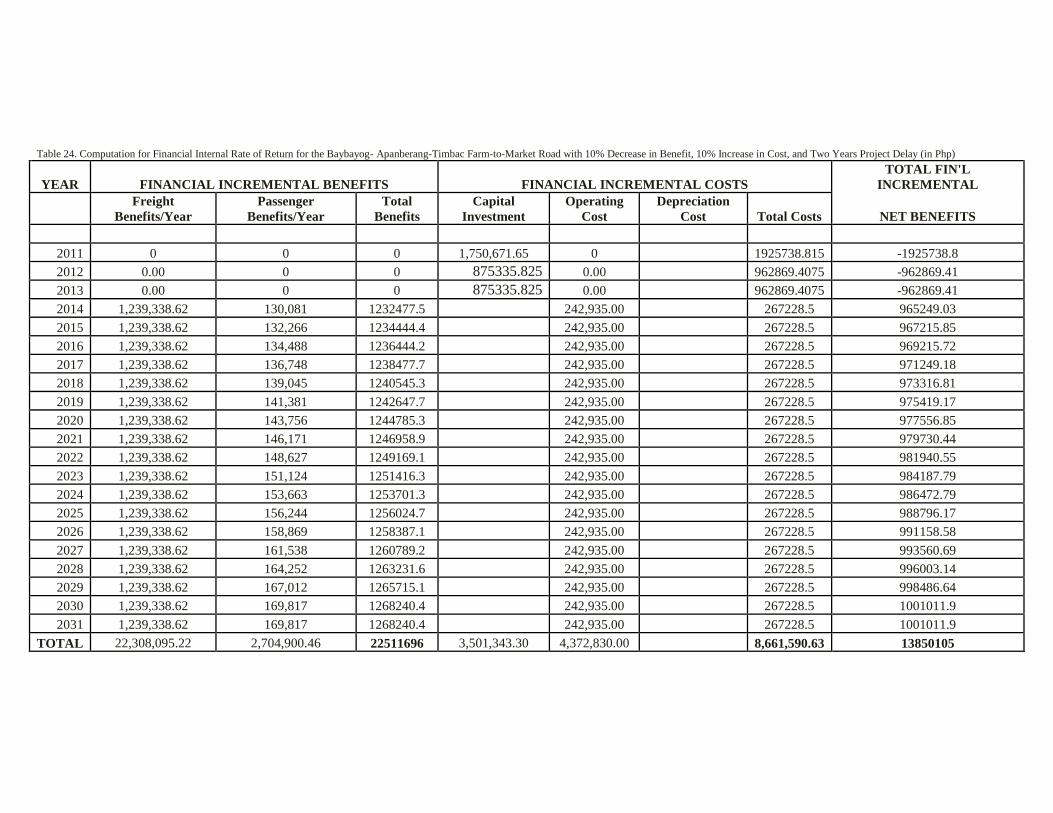
Table 24. Computation for Financial Internal Rate of Return for the Baybayog- Apanberang-Timbac Farm-to-Market Road with 10% Decrease in Benefit, 10% Increase in Cost, and Two Years Project Delay (in Php)
YEAR FINANCIAL INCREMENTAL BENEFITS FINANCIAL INCREMENTAL COSTS
TOTAL FIN'L
INCREMENTAL
Freight
Benefits/Year
Passenger
Benefits/Year
Total
Benefits
Capital
Investment
Operating
Cost
Depreciation
Cost Total Costs NET BENEFITS
2011 0 0 0 1,750,671.65 0 1925738.815 -1925738.8
2012 0.00 0 0 875335.825 0.00 962869.4075 -962869.41
2013 0.00 0 0 875335.825 0.00 962869.4075 -962869.41
2014 1,239,338.62 130,081 1232477.5 242,935.00 267228.5 965249.03
2015 1,239,338.62 132,266 1234444.4 242,935.00 267228.5 967215.85
2016 1,239,338.62 134,488 1236444.2 242,935.00 267228.5 969215.72
2017 1,239,338.62 136,748 1238477.7 242,935.00 267228.5 971249.18
2018 1,239,338.62 139,045 1240545.3 242,935.00 267228.5 973316.81
2019 1,239,338.62 141,381 1242647.7 242,935.00 267228.5 975419.17
2020 1,239,338.62 143,756 1244785.3 242,935.00 267228.5 977556.85
2021 1,239,338.62 146,171 1246958.9 242,935.00 267228.5 979730.44
2022 1,239,338.62 148,627 1249169.1 242,935.00 267228.5 981940.55
2023 1,239,338.62 151,124 1251416.3 242,935.00 267228.5 984187.79
2024 1,239,338.62 153,663 1253701.3 242,935.00 267228.5 986472.79
2025 1,239,338.62 156,244 1256024.7 242,935.00 267228.5 988796.17
2026 1,239,338.62 158,869 1258387.1 242,935.00 267228.5 991158.58
2027 1,239,338.62 161,538 1260789.2 242,935.00 267228.5 993560.69
2028 1,239,338.62 164,252 1263231.6 242,935.00 267228.5 996003.14
2029 1,239,338.62 167,012 1265715.1 242,935.00 267228.5 998486.64
2030 1,239,338.62 169,817 1268240.4 242,935.00 267228.5 1001011.9
2031 1,239,338.62 169,817 1268240.4 242,935.00 267228.5 1001011.9
TOTAL 22,308,095.22 2,704,900.46 22511696 3,501,343.30 4,372,830.00 8,661,590.63 13850105

APPENDIX G
Economic Computations

Table 25. Economic Cost- Capital Investment for Baybayog-Apanberang-Timbac Farm-to-Market Road Project (in Php)
Year
CAPITAL INVESTMENT
DIRECT COST INDIRECT COST TOTAL
Labor Cost Cost of Materials Management
and
Supervision
TOTAL
DIRECT
COST
MARK-UPS TOTAL TOTAL
INDIRECT
COST
CAPITAL
Skilled Unskilled Equipment Supplies Other OCM PROFIT MOB/DEMOB MARK-
UP VAT INVESTMENT
2011 61,274.50 218,615.46 70,658.00 2,339,946.00 - - 2,690,493.96 228,459.00 248,325.00 20,859.30 497,643.30 245,000.00 742,643.30 3,433,137.26
2012
2013
2014
2015
2016
2017
2018
2019
2020
2021
2022
2023
2024
2025
2026
2027
2028
2029
2030
2031
TOTAL 3,433,137.26
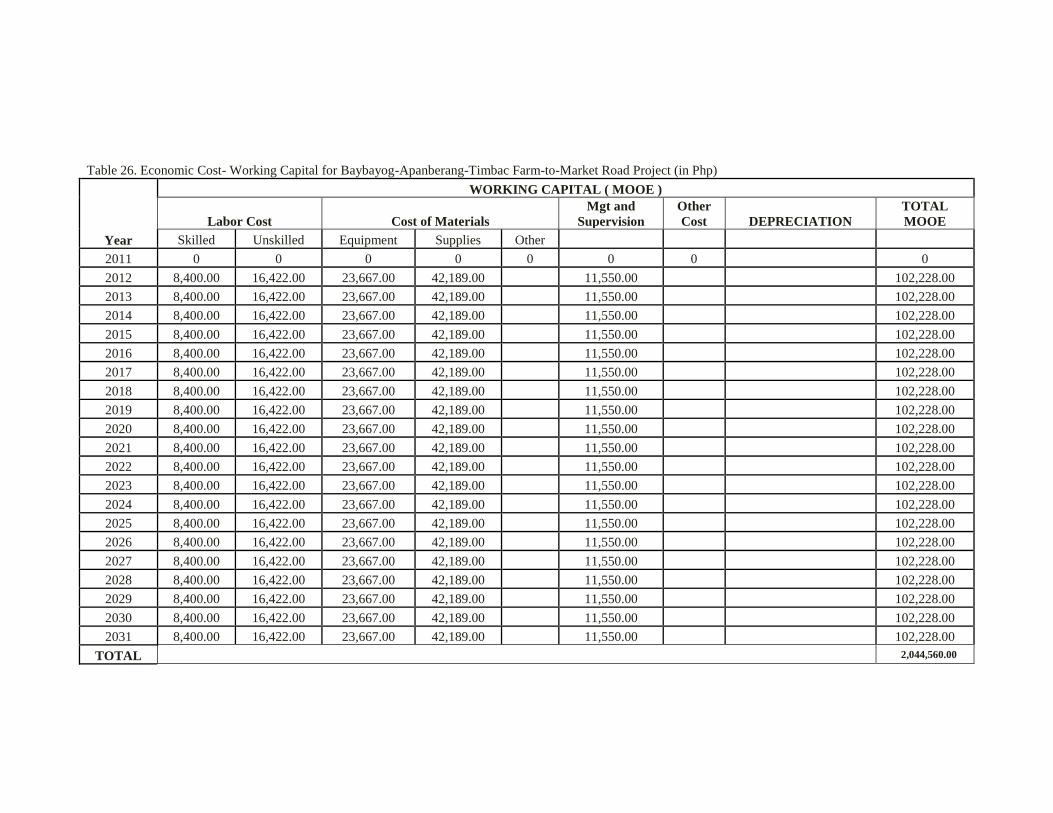
Table 26. Economic Cost- Working Capital for Baybayog-Apanberang-Timbac Farm-to-Market Road Project (in Php)
Year
WORKING CAPITAL ( MOOE )
Labor Cost Cost of Materials
Mgt and
Supervision
Other
Cost DEPRECIATION
TOTAL
MOOE
Skilled Unskilled Equipment Supplies Other
2011 0 0 0 0 0 0 0 0
2012 8,400.00 16,422.00 23,667.00 42,189.00 11,550.00 102,228.00
2013 8,400.00 16,422.00 23,667.00 42,189.00 11,550.00 102,228.00
2014 8,400.00 16,422.00 23,667.00 42,189.00 11,550.00 102,228.00
2015 8,400.00 16,422.00 23,667.00 42,189.00 11,550.00 102,228.00
2016 8,400.00 16,422.00 23,667.00 42,189.00 11,550.00 102,228.00
2017 8,400.00 16,422.00 23,667.00 42,189.00 11,550.00 102,228.00
2018 8,400.00 16,422.00 23,667.00 42,189.00 11,550.00 102,228.00
2019 8,400.00 16,422.00 23,667.00 42,189.00 11,550.00 102,228.00
2020 8,400.00 16,422.00 23,667.00 42,189.00 11,550.00 102,228.00
2021 8,400.00 16,422.00 23,667.00 42,189.00 11,550.00 102,228.00
2022 8,400.00 16,422.00 23,667.00 42,189.00 11,550.00 102,228.00
2023 8,400.00 16,422.00 23,667.00 42,189.00 11,550.00 102,228.00
2024 8,400.00 16,422.00 23,667.00 42,189.00 11,550.00 102,228.00
2025 8,400.00 16,422.00 23,667.00 42,189.00 11,550.00 102,228.00
2026 8,400.00 16,422.00 23,667.00 42,189.00 11,550.00 102,228.00
2027 8,400.00 16,422.00 23,667.00 42,189.00 11,550.00 102,228.00
2028 8,400.00 16,422.00 23,667.00 42,189.00 11,550.00 102,228.00
2029 8,400.00 16,422.00 23,667.00 42,189.00 11,550.00 102,228.00
2030 8,400.00 16,422.00 23,667.00 42,189.00 11,550.00 102,228.00
2031 8,400.00 16,422.00 23,667.00 42,189.00 11,550.00 102,228.00
TOTAL 2,044,560.00

Table 27. Economic Cost for Baybayog-Apanberang-Timbac Farm-to-Market Road Project (in Php)
Year CAPITAL INVESTMENT WORKING CAPITAL ( MOOE ) Replacement Cost TOTAL COST
2011 3,433,137.26 0 - 3,433,137.26
2012 102,228.00 102,228.00
2013 102,228.00 102,228.00
2014 102,228.00 102,228.00
2015 102,228.00 102,228.00
2016 102,228.00 102,228.00
2017 102,228.00 102,228.00
2018 102,228.00 102,228.00
2019 102,228.00 102,228.00
2020 102,228.00 102,228.00
2021 102,228.00 102,228.00
2022 102,228.00 102,228.00
2023 102,228.00 102,228.00
2024 102,228.00 102,228.00
2025 102,228.00 102,228.00
2026 102,228.00 102,228.00
2027 102,228.00 102,228.00
2028 102,228.00 102,228.00
2029 102,228.00 102,228.00
2030 102,228.00 102,228.00
2031
102,228.00
102,228.00
TOTAL 3,433,137.26 2,044,560.00 0 5477697.26

Table 28. Basic Parameters in Deriving Incremental Economic Benefits from Farm to Market Roads Project
ITEM
WITHOUT THE
PROJECT WITH THE PROJECT
VOC SAVINGS
Percent VOC/Ton/km Percent VOC/Ton/km
(i) Freight
Jeepney 70 22.0598 30 6.61794
Truck 30 11.76 70 3.528
VOC (Weighted Average) 9.48 2.23 7.26
(ii) Passenger
Jeepney 70 2.646 30 0.7938
Truck 30 1.4112 70 0.4214
VOC (Weighted Average) 0.76 0.18 0.58

Table 29. Incremental Freight Economic Benefits from VOCs for Farm to Market Road
ITEM Radish Cabbage Potato
(A) Freight Benefits Cattubo Natubleng Pacso Cattubo Natubleng Pacso Cattubo Natubleng Pacso
Freight Details
(i) Average Yield per hectare 20 7.61 5 20 13.31 22.53 13 6.49 16
(ii) Total influence area (has) 593.98 2.5 1 593.98 410 110 593.98 475 50
(iii) Annual Aggregate Production (tons) (i)x(ii) 11879.6 19.025 5 11879.6 5457.1 2478.3 7721.74 3082.75 800
(iv) Percent Marketed 0.95 0.94 1 0.95 0.99 0.99 0.95 0.98 1
(v) Equivalent Volume Transported (tons) (iii)x(iv) 11285.62 17.8835 5 11285.62 5402.529 2453.517 7335.653 3021.095 800
(vi) VOC Savings for freight (Php/ton-km) 7.26 7.26 7.26 7.26 7.26 7.26 7.26 7.26 7.26
(vii) Kms of roads improved/rehabilitated 3.5 3.5 3.5 3.5 3.5 3.5 3.5 3.5 3.5
INCREMENTAL FREIGHT BENEFITS 286767.6 454.4197 127.05 286767.6 137278.3 62343.87 186398.9 76766.02 20328
ITEM Carrots Others TOTAL
(A) Freight Benefits Cattubo Natubleng Pacso Cattubo Natubleng Pacso
Freight Details
(i) Average Yield per hectare 18 6.4 11.07 22.88 13 9.4
(ii) Total influence area (has) 68 250 55 49.83 10.75 185.73
(iii) Annual Aggregate Production (tons) (i)x(ii) 1224 1600 608.85 1140.11 139.75 1745.862
(iv) Percent Marketed 0.93 1 0.98 0.92 0.98 0.95
(v) Equivalent Volume Transported (tons) (iii)x(iv) 1138.32 1600 596.673 1048.902 136.955 1658.569
(vi) VOC Savings for freight (Php/ton-km) 7.26 7.26 7.26 7.26 7.26 7.26
(vii) Kms of roads improved/rehabilitated 3.5 3.5 3.5 3.5 3.5 3.5
INCREMENTAL FREIGHT BENEFITS 28924.71 40656 15161.46 26652.59 3480.027 42144.24 Php. 1214250.79694688
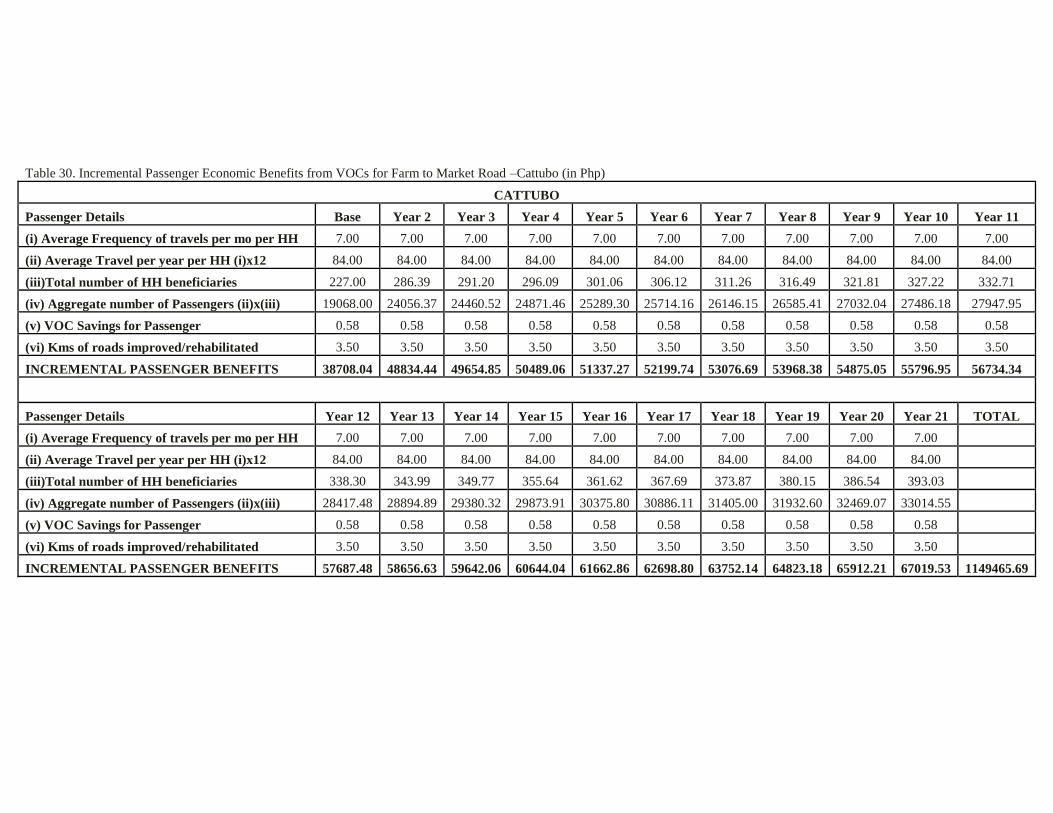
Table 30. Incremental Passenger Economic Benefits from VOCs for Farm to Market Road –Cattubo (in Php)
CATTUBO
Passenger Details Base Year 2 Year 3 Year 4 Year 5 Year 6 Year 7 Year 8 Year 9 Year 10 Year 11
(i) Average Frequency of travels per mo per HH 7.00 7.00 7.00 7.00 7.00 7.00 7.00 7.00 7.00 7.00 7.00
(ii) Average Travel per year per HH (i)x12 84.00 84.00 84.00 84.00 84.00 84.00 84.00 84.00 84.00 84.00 84.00
(iii)Total number of HH beneficiaries 227.00 286.39 291.20 296.09 301.06 306.12 311.26 316.49 321.81 327.22 332.71
(iv) Aggregate number of Passengers (ii)x(iii) 19068.00 24056.37 24460.52 24871.46 25289.30 25714.16 26146.15 26585.41 27032.04 27486.18 27947.95
(v) VOC Savings for Passenger 0.58 0.58 0.58 0.58 0.58 0.58 0.58 0.58 0.58 0.58 0.58
(vi) Kms of roads improved/rehabilitated 3.50 3.50 3.50 3.50 3.50 3.50 3.50 3.50 3.50 3.50 3.50
INCREMENTAL PASSENGER BENEFITS 38708.04 48834.44 49654.85 50489.06 51337.27 52199.74 53076.69 53968.38 54875.05 55796.95 56734.34
Passenger Details Year 12 Year 13 Year 14 Year 15 Year 16 Year 17 Year 18 Year 19 Year 20 Year 21 TOTAL
(i) Average Frequency of travels per mo per HH 7.00 7.00 7.00 7.00 7.00 7.00 7.00 7.00 7.00 7.00
(ii) Average Travel per year per HH (i)x12 84.00 84.00 84.00 84.00 84.00 84.00 84.00 84.00 84.00 84.00
(iii)Total number of HH beneficiaries 338.30 343.99 349.77 355.64 361.62 367.69 373.87 380.15 386.54 393.03
(iv) Aggregate number of Passengers (ii)x(iii) 28417.48 28894.89 29380.32 29873.91 30375.80 30886.11 31405.00 31932.60 32469.07 33014.55
(v) VOC Savings for Passenger 0.58 0.58 0.58 0.58 0.58 0.58 0.58 0.58 0.58 0.58
(vi) Kms of roads improved/rehabilitated 3.50 3.50 3.50 3.50 3.50 3.50 3.50 3.50 3.50 3.50
INCREMENTAL PASSENGER BENEFITS 57687.48 58656.63 59642.06 60644.04 61662.86 62698.80 63752.14 64823.18 65912.21 67019.53 1149465.69
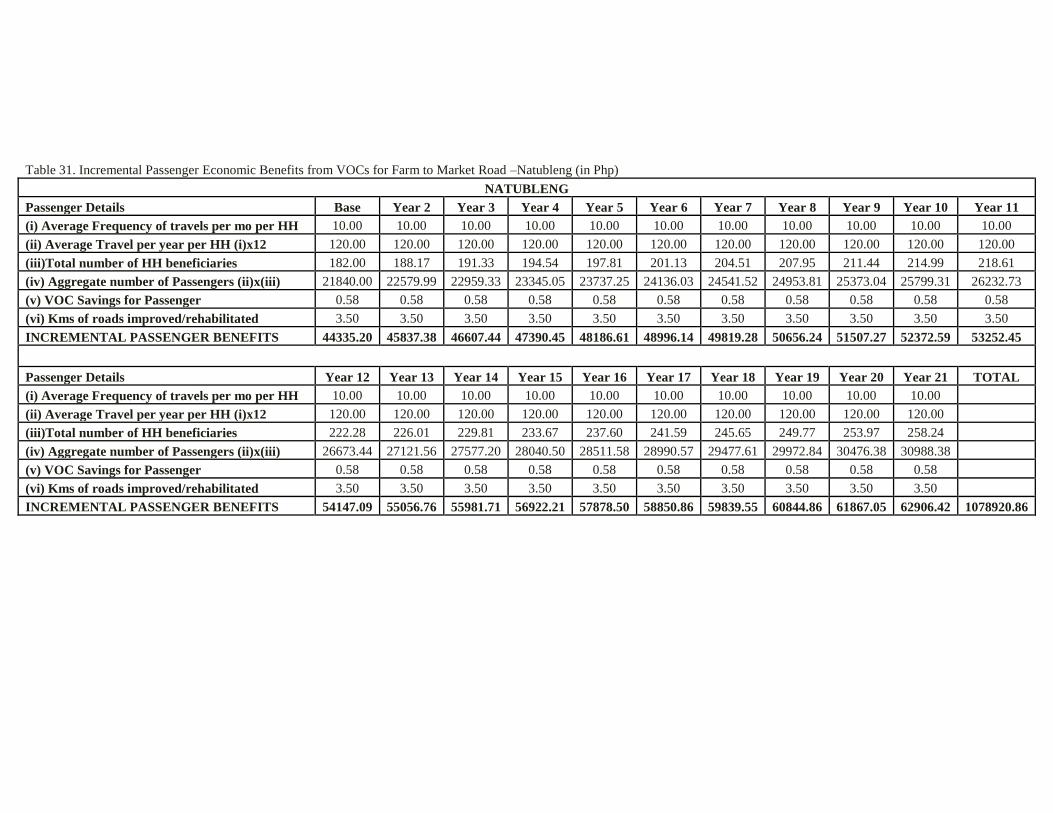
Table 31. Incremental Passenger Economic Benefits from VOCs for Farm to Market Road –Natubleng (in Php)
NATUBLENG
Passenger Details Base Year 2 Year 3 Year 4 Year 5 Year 6 Year 7 Year 8 Year 9 Year 10 Year 11
(i) Average Frequency of travels per mo per HH 10.00 10.00 10.00 10.00 10.00 10.00 10.00 10.00 10.00 10.00 10.00
(ii) Average Travel per year per HH (i)x12 120.00 120.00 120.00 120.00 120.00 120.00 120.00 120.00 120.00 120.00 120.00
(iii)Total number of HH beneficiaries 182.00 188.17 191.33 194.54 197.81 201.13 204.51 207.95 211.44 214.99 218.61
(iv) Aggregate number of Passengers (ii)x(iii) 21840.00 22579.99 22959.33 23345.05 23737.25 24136.03 24541.52 24953.81 25373.04 25799.31 26232.73
(v) VOC Savings for Passenger 0.58 0.58 0.58 0.58 0.58 0.58 0.58 0.58 0.58 0.58 0.58
(vi) Kms of roads improved/rehabilitated 3.50 3.50 3.50 3.50 3.50 3.50 3.50 3.50 3.50 3.50 3.50
INCREMENTAL PASSENGER BENEFITS 44335.20 45837.38 46607.44 47390.45 48186.61 48996.14 49819.28 50656.24 51507.27 52372.59 53252.45
Passenger Details Year 12 Year 13 Year 14 Year 15 Year 16 Year 17 Year 18 Year 19 Year 20 Year 21 TOTAL
(i) Average Frequency of travels per mo per HH 10.00 10.00 10.00 10.00 10.00 10.00 10.00 10.00 10.00 10.00
(ii) Average Travel per year per HH (i)x12 120.00 120.00 120.00 120.00 120.00 120.00 120.00 120.00 120.00 120.00
(iii)Total number of HH beneficiaries 222.28 226.01 229.81 233.67 237.60 241.59 245.65 249.77 253.97 258.24
(iv) Aggregate number of Passengers (ii)x(iii) 26673.44 27121.56 27577.20 28040.50 28511.58 28990.57 29477.61 29972.84 30476.38 30988.38
(v) VOC Savings for Passenger 0.58 0.58 0.58 0.58 0.58 0.58 0.58 0.58 0.58 0.58
(vi) Kms of roads improved/rehabilitated 3.50 3.50 3.50 3.50 3.50 3.50 3.50 3.50 3.50 3.50
INCREMENTAL PASSENGER BENEFITS 54147.09 55056.76 55981.71 56922.21 57878.50 58850.86 59839.55 60844.86 61867.05 62906.42 1078920.86
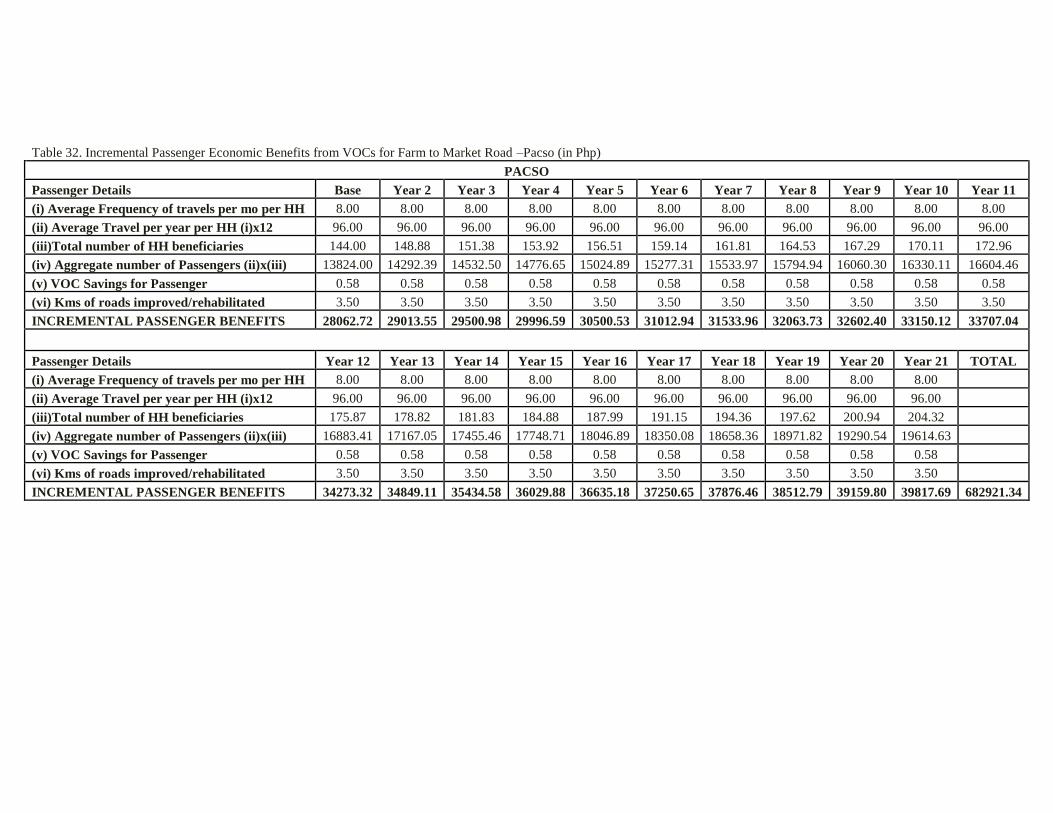
Table 32. Incremental Passenger Economic Benefits from VOCs for Farm to Market Road –Pacso (in Php)
PACSO
Passenger Details Base Year 2 Year 3 Year 4 Year 5 Year 6 Year 7 Year 8 Year 9 Year 10 Year 11
(i) Average Frequency of travels per mo per HH 8.00 8.00 8.00 8.00 8.00 8.00 8.00 8.00 8.00 8.00 8.00
(ii) Average Travel per year per HH (i)x12 96.00 96.00 96.00 96.00 96.00 96.00 96.00 96.00 96.00 96.00 96.00
(iii)Total number of HH beneficiaries 144.00 148.88 151.38 153.92 156.51 159.14 161.81 164.53 167.29 170.11 172.96
(iv) Aggregate number of Passengers (ii)x(iii) 13824.00 14292.39 14532.50 14776.65 15024.89 15277.31 15533.97 15794.94 16060.30 16330.11 16604.46
(v) VOC Savings for Passenger 0.58 0.58 0.58 0.58 0.58 0.58 0.58 0.58 0.58 0.58 0.58
(vi) Kms of roads improved/rehabilitated 3.50 3.50 3.50 3.50 3.50 3.50 3.50 3.50 3.50 3.50 3.50
INCREMENTAL PASSENGER BENEFITS 28062.72 29013.55 29500.98 29996.59 30500.53 31012.94 31533.96 32063.73 32602.40 33150.12 33707.04
Passenger Details Year 12 Year 13 Year 14 Year 15 Year 16 Year 17 Year 18 Year 19 Year 20 Year 21 TOTAL
(i) Average Frequency of travels per mo per HH 8.00 8.00 8.00 8.00 8.00 8.00 8.00 8.00 8.00 8.00
(ii) Average Travel per year per HH (i)x12 96.00 96.00 96.00 96.00 96.00 96.00 96.00 96.00 96.00 96.00
(iii)Total number of HH beneficiaries 175.87 178.82 181.83 184.88 187.99 191.15 194.36 197.62 200.94 204.32
(iv) Aggregate number of Passengers (ii)x(iii) 16883.41 17167.05 17455.46 17748.71 18046.89 18350.08 18658.36 18971.82 19290.54 19614.63
(v) VOC Savings for Passenger 0.58 0.58 0.58 0.58 0.58 0.58 0.58 0.58 0.58 0.58
(vi) Kms of roads improved/rehabilitated 3.50 3.50 3.50 3.50 3.50 3.50 3.50 3.50 3.50 3.50
INCREMENTAL PASSENGER BENEFITS 34273.32 34849.11 35434.58 36029.88 36635.18 37250.65 37876.46 38512.79 39159.80 39817.69 682921.34
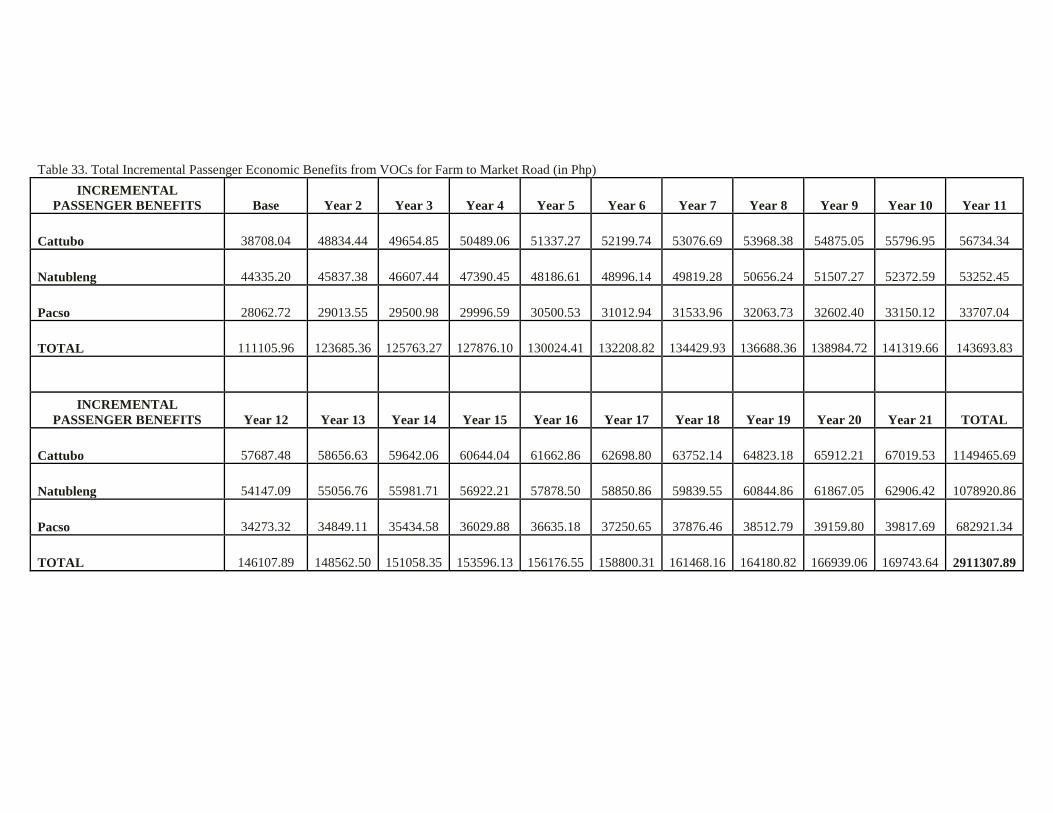
Table 33. Total Incremental Passenger Economic Benefits from VOCs for Farm to Market Road (in Php)
INCREMENTAL
PASSENGER BENEFITS Base Year 2 Year 3 Year 4 Year 5 Year 6 Year 7 Year 8 Year 9 Year 10 Year 11
Cattubo 38708.04 48834.44 49654.85 50489.06 51337.27 52199.74 53076.69 53968.38 54875.05 55796.95 56734.34
Natubleng 44335.20 45837.38 46607.44 47390.45 48186.61 48996.14 49819.28 50656.24 51507.27 52372.59 53252.45
Pacso 28062.72 29013.55 29500.98 29996.59 30500.53 31012.94 31533.96 32063.73 32602.40 33150.12 33707.04
TOTAL 111105.96 123685.36 125763.27 127876.10 130024.41 132208.82 134429.93 136688.36 138984.72 141319.66 143693.83
INCREMENTAL
PASSENGER BENEFITS Year 12 Year 13 Year 14 Year 15 Year 16 Year 17 Year 18 Year 19 Year 20 Year 21 TOTAL
Cattubo 57687.48 58656.63 59642.06 60644.04 61662.86 62698.80 63752.14 64823.18 65912.21 67019.53 1149465.69
Natubleng 54147.09 55056.76 55981.71 56922.21 57878.50 58850.86 59839.55 60844.86 61867.05 62906.42 1078920.86
Pacso 34273.32 34849.11 35434.58 36029.88 36635.18 37250.65 37876.46 38512.79 39159.80 39817.69 682921.34
TOTAL 146107.89 148562.50 151058.35 153596.13 156176.55 158800.31 161468.16 164180.82 166939.06 169743.64 2911307.89

Table 34. Computation for Economic Internal Rate of Return for the Baybayog- Apanberang-Timbac Farm-to-Market Road (in Php)
YEAR ECONOMIC INCREMENTAL BENEFITS ECONOMIC INCREMENTAL COSTS
TOTAL ECONOMIC
INCREMENTAL
Freight
Benefits/Year
Passenger
Benefits/Year
Total
Benefits
Capital
Investment
Operating
Cost
Depreciation
Cost Total Costs NET BENEFITS
2011 0 0 0 3,433,137.26 0 3433137.26 -3433137.26
2012 1,214,250.80 123,685 1337936.2 102,228.00 102228 1235708.156
2013 1,214,250.80 125,763 1340014.1 102,228.00 102228 1237786.07
2014 1,214,250.80 127,876 1342126.9 102,228.00 102228 1239898.893
2015 1,214,250.80 130,024 1344275.2 102,228.00 102228 1242047.211
2016 1,214,250.80 132,209 1346459.6 102,228.00 102228 1244231.621
2017 1,214,250.80 134,430 1348680.7 102,228.00 102228 1246452.73
2018 1,214,250.80 136,688 1350939.2 102,228.00 102228 1248711.152
2019 1,214,250.80 138,985 1353235.5 102,228.00 102228 1251007.517
2020 1,214,250.80 141,320 1355570.5 102,228.00 102228 1253342.46
2021 1,214,250.80 143,694 1357944.6 102,228.00 102228 1255716.63
2022 1,214,250.80 146,108 1360358.7 102,228.00 102228 1258130.687
2023 1,214,250.80 148,563 1362813.3 102,228.00 102228 1260585.299
2024 1,214,250.80 151,058 1365309.1 102,228.00 102228 1263081.149
2025 1,214,250.80 153,596 1367846.9 102,228.00 102228 1265618.93
2026 1,214,250.80 156,177 1370427.3 102,228.00 102228 1268199.345
2027 1,214,250.80 158,800 1373051.1 102,228.00 102228 1270823.111
2028 1,214,250.80 161,468 1375719 102,228.00 102228 1273490.956
2029 1,214,250.80 164,181 1378431.6 102,228.00 102228 1276203.621
2030 1,214,250.80 166,939 1381189.9 102,228.00 102228 1278961.859
2031 1,214,250.80 169,744 1383994.4 102,228.00 102228 1281766.435
TOTAL 24,285,015.94 2,911,307.89 27196324 3,433,137.26 2,044,560.00 5,477,697.26 21718626.6

Table 35. Computation for Economic Internal Rate of Return for the Baybayog- Apanberang-Timbac Farm-to-Market Road with 10% Decrease in Benefits (in Php)
YEAR ECONOMIC INCREMENTAL BENEFITS ECONOMIC INCREMENTAL COSTS
TOTAL ECONOMIC
INCREMENTAL
Freight
Benefits/Year
Passenger
Benefits/Year
Total
Benefits
Capital
Investment
Operating
Cost
Depreciation
Cost Total Costs NET BENEFITS
2011 0 0 0 3,433,137.26 0 3433137.26 -3433137.3
2012 1,214,250.80 123,685 1204142.54 102,228.00 102228 1101914.5
2013 1,214,250.80 125,763 1206012.663 102,228.00 102228 1103784.7
2014 1,214,250.80 127,876 1207914.203 102,228.00 102228 1105686.2
2015 1,214,250.80 130,024 1209847.69 102,228.00 102228 1107619.7
2016 1,214,250.80 132,209 1211813.659 102,228.00 102228 1109585.7
2017 1,214,250.80 134,430 1213812.657 102,228.00 102228 1111584.7
2018 1,214,250.80 136,688 1215845.237 102,228.00 102228 1113617.2
2019 1,214,250.80 138,985 1217911.965 102,228.00 102228 1115684
2020 1,214,250.80 141,320 1220013.414 102,228.00 102228 1117785.4
2021 1,214,250.80 143,694 1222150.167 102,228.00 102228 1119922.2
2022 1,214,250.80 146,108 1224322.818 102,228.00 102228 1122094.8
2023 1,214,250.80 148,563 1226531.969 102,228.00 102228 1124304
2024 1,214,250.80 151,058 1228778.234 102,228.00 102228 1126550.2
2025 1,214,250.80 153,596 1231062.237 102,228.00 102228 1128834.2
2026 1,214,250.80 156,177 1233384.61 102,228.00 102228 1131156.6
2027 1,214,250.80 158,800 1235746 102,228.00 102228 1133518
2028 1,214,250.80 161,468 1238147.06 102,228.00 102228 1135919.1
2029 1,214,250.80 164,181 1240588.459 102,228.00 102228 1138360.5
2030 1,214,250.80 166,939 1243070.873 102,228.00 102228 1140842.9
2031 1,214,250.80 169,744 1245594.992 102,228.00 102228 1143367
TOTAL 24,285,015.94 2,911,307.89 24476691.45 3,433,137.26 2,044,560.00 5,477,697.26 18998994
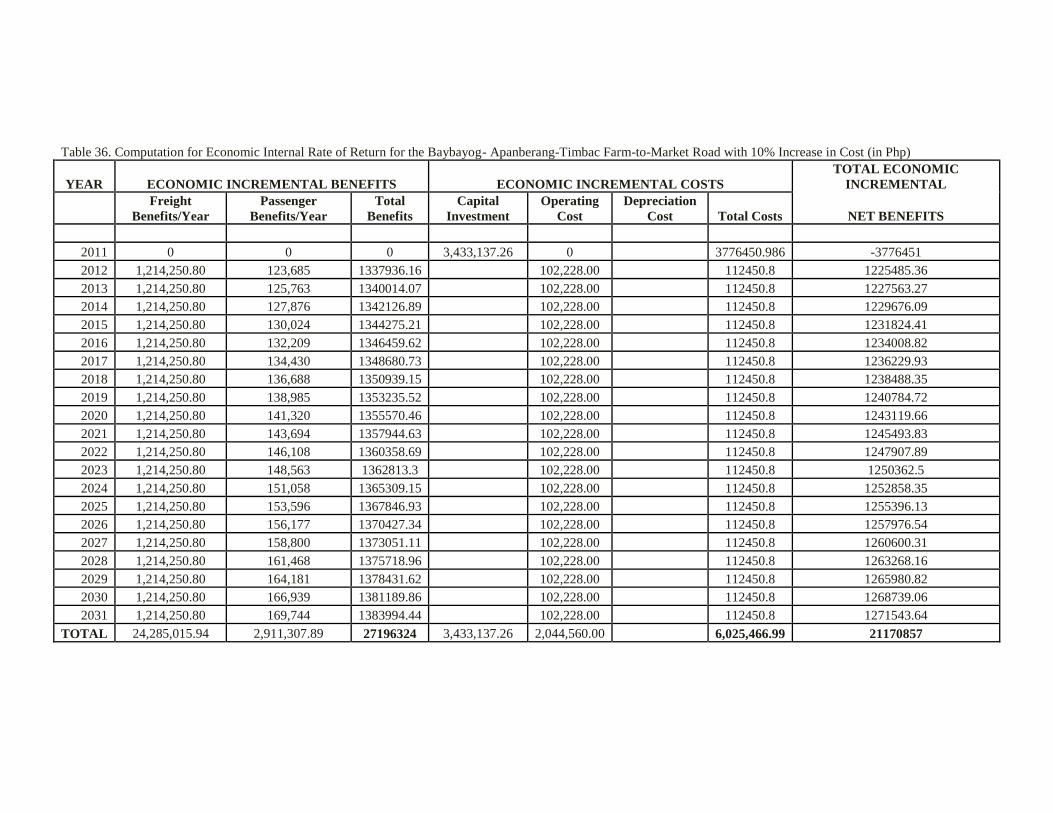
Table 36. Computation for Economic Internal Rate of Return for the Baybayog- Apanberang-Timbac Farm-to-Market Road with 10% Increase in Cost (in Php)
YEAR ECONOMIC INCREMENTAL BENEFITS ECONOMIC INCREMENTAL COSTS
TOTAL ECONOMIC
INCREMENTAL
Freight
Benefits/Year
Passenger
Benefits/Year
Total
Benefits
Capital
Investment
Operating
Cost
Depreciation
Cost Total Costs NET BENEFITS
2011 0 0 0 3,433,137.26 0 3776450.986 -3776451
2012 1,214,250.80 123,685 1337936.16 102,228.00 112450.8 1225485.36
2013 1,214,250.80 125,763 1340014.07 102,228.00 112450.8 1227563.27
2014 1,214,250.80 127,876 1342126.89 102,228.00 112450.8 1229676.09
2015 1,214,250.80 130,024 1344275.21 102,228.00 112450.8 1231824.41
2016 1,214,250.80 132,209 1346459.62 102,228.00 112450.8 1234008.82
2017 1,214,250.80 134,430 1348680.73 102,228.00 112450.8 1236229.93
2018 1,214,250.80 136,688 1350939.15 102,228.00 112450.8 1238488.35
2019 1,214,250.80 138,985 1353235.52 102,228.00 112450.8 1240784.72
2020 1,214,250.80 141,320 1355570.46 102,228.00 112450.8 1243119.66
2021 1,214,250.80 143,694 1357944.63 102,228.00 112450.8 1245493.83
2022 1,214,250.80 146,108 1360358.69 102,228.00 112450.8 1247907.89
2023 1,214,250.80 148,563 1362813.3 102,228.00 112450.8 1250362.5
2024 1,214,250.80 151,058 1365309.15 102,228.00 112450.8 1252858.35
2025 1,214,250.80 153,596 1367846.93 102,228.00 112450.8 1255396.13
2026 1,214,250.80 156,177 1370427.34 102,228.00 112450.8 1257976.54
2027 1,214,250.80 158,800 1373051.11 102,228.00 112450.8 1260600.31
2028 1,214,250.80 161,468 1375718.96 102,228.00 112450.8 1263268.16
2029 1,214,250.80 164,181 1378431.62 102,228.00 112450.8 1265980.82
2030 1,214,250.80 166,939 1381189.86 102,228.00 112450.8 1268739.06
2031 1,214,250.80 169,744 1383994.44 102,228.00 112450.8 1271543.64
TOTAL 24,285,015.94 2,911,307.89 27196324 3,433,137.26 2,044,560.00 6,025,466.99 21170857

Table 37. Computation for Economic Internal Rate of Return for the Baybayog- Apanberang-Timbac Farm-to-Market Road with Two Years Project Delay (in Php)
YEAR ECONOMIC INCREMENTAL BENEFITS ECONOMIC INCREMENTAL COSTS
TOTAL ECONOMIC
INCREMENTAL
Freight
Benefits/Year
Passenger
Benefits/Year
Total
Benefits
Capital
Investment
Operating
Cost
Depreciation
Cost Total Costs NET BENEFITS
2011 0.00 0.00 0.00 1,716,568.63 0 1716568.63 -1716568.6
2012 0.00 0.00 0.00 858284.315 0.00 858284.315 -858284.32
2013 0.00 0.00 0.00 858284.315 0.00 858284.315 -858284.32
2014 1214250.80 127876.10 1342126.89 102,228.00 102228 1239898.9
2015 1214250.80 130024.41 1344275.21 102,228.00 102228 1242047.2
2016 1214250.80 132208.82 1346459.62 102,228.00 102228 1244231.6
2017 1214250.80 134429.93 1348680.73 102,228.00 102228 1246452.7
2018 1214250.80 136688.36 1350939.15 102,228.00 102228 1248711.2
2019 1214250.80 138984.72 1353235.52 102,228.00 102228 1251007.5
2020 1214250.80 141319.66 1355570.46 102,228.00 102228 1253342.5
2021 1214250.80 143693.83 1357944.63 102,228.00 102228 1255716.6
2022 1214250.80 146107.89 1360358.69 102,228.00 102228 1258130.7
2023 1214250.80 148562.50 1362813.30 102,228.00 102228 1260585.3
2024 1214250.80 151058.35 1365309.15 102,228.00 102228 1263081.1
2025 1214250.80 153596.13 1367846.93 102,228.00 102228 1265618.9
2026 1214250.80 156176.55 1370427.34 102,228.00 102228 1268199.3
2027 1214250.80 158800.31 1373051.11 102,228.00 102228 1270823.1
2028 1214250.80 161468.16 1375718.96 102,228.00 102228 1273491
2029 1214250.80 164180.82 1378431.62 102,228.00 102228 1276203.6
2030 1214250.80 166939.06 1381189.86 102,228.00 102228 1278961.9
2031 1214250.80 169743.64 1383994.44 102,228.00 102228 1281766.4
TOTAL 21,856,514.35 2,661,859.26 24518374 3,433,137.26 1,840,104.00 5,273,241.26 19245132

Table 38. Computation for Economic Internal Rate of Return for the Baybayog- Apanberang-Timbac Farm-to-Market Road with 10% Decrease in Benefits, 10% Increase in Cost and Two Years Project Delay (in Php)
YEAR ECONOMIC INCREMENTAL BENEFITS ECONOMIC INCREMENTAL COSTS
TOTAL ECONOMIC
INCREMENTAL
Freight
Benefits/Year
Passenger
Benefits/Year
Total
Benefits
Capital
Investment
Operating
Cost
Depreciation
Cost Total Costs NET BENEFITS
2011 0.00 0.00 0.00 1,716,568.63 0 1888225.493 -1888225.493
2012 0.00 0.00 0.00 858284.315 0.00 944112.7465 -944112.7465
2013 0.00 0.00 0.00 858284.315 0.00 944112.7465 -944112.7465
2014 1214250.80 127876.10 1207914.20 102,228.00 112450.8 1095463.403
2015 1214250.80 130024.41 1209847.69 102,228.00 112450.8 1097396.89
2016 1214250.80 132208.82 1211813.66 102,228.00 112450.8 1099362.859
2017 1214250.80 134429.93 1213812.66 102,228.00 112450.8 1101361.857
2018 1214250.80 136688.36 1215845.24 102,228.00 112450.8 1103394.437
2019 1214250.80 138984.72 1217911.97 102,228.00 112450.8 1105461.165
2020 1214250.80 141319.66 1220013.41 102,228.00 112450.8 1107562.614
2021 1214250.80 143693.83 1222150.17 102,228.00 112450.8 1109699.367
2022 1214250.80 146107.89 1224322.82 102,228.00 112450.8 1111872.018
2023 1214250.80 148562.50 1226531.97 102,228.00 112450.8 1114081.169
2024 1214250.80 151058.35 1228778.23 102,228.00 112450.8 1116327.434
2025 1214250.80 153596.13 1231062.24 102,228.00 112450.8 1118611.437
2026 1214250.80 156176.55 1233384.61 102,228.00 112450.8 1120933.81
2027 1214250.80 158800.31 1235746.00 102,228.00 112450.8 1123295.2
2028 1214250.80 161468.16 1238147.06 102,228.00 112450.8 1125696.26
2029 1214250.80 164180.82 1240588.46 102,228.00 112450.8 1128137.659
2030 1214250.80 166939.06 1243070.87 102,228.00 112450.8 1130620.073
2031 1214250.80 169743.64 1245594.99 102,228.00 112450.8 1133144.192
TOTAL 21,856,514.35 2,661,859.26 22066536 3,433,137.26 1,840,104.00 5,800,565.39 16265970.86
APPENDIX H
DOCUMENTATION
Plate 2. Identification of Road Project
Plate 4. Leveling-off Training on Data Analyses
Plate 6. Benguet Provincial Capitol
Plate 3. Dialogue with the CHARM Officials
Plate 5. Hands-on Training
Plate 7. Practicumers with Field Supervisors

Plate 8. Vegetable Terraces in Cattubo, Atok
Plate 10. Key Informant Interview
Plate 12. Data Gathering
Plate 9. Barangay Hall of Cattubo
Plate 11. Municipal Hall of Atok
Plate 13. Bayanihan of Farmers

Plate 14. Transportation of Vegetables to Market
Plate 16. Data Processing
Plate 18. Computation for Financial and
Economic Analyses
Plate 15. Dinner with the Barangay Cattubo Officials
Plate 17. Secondary Data
Plate 19. Analysis of Financial Feasibility
Plate 20. Analysis of Economic Feasibility
Plate 22. Presentation of Report Output
Plate 24. Open Forum
Plate 21. Preparation for Presentation in Benguet
Plate 23. Presentation of the Results and Discussion
Plate 25. Giving Token of Appreciation

Top Related
Copyright © 2022 FDOKUMEN

