


Bahasa
Halaman
Hukum


www.elsevier.com/locate/micromeso
Microporous and Mesoporous Materials 62 (2003) 191–200
Siting and coordination of cobalt in ferrierite:XRD and EXAFS studies at different Co loadings
M.C. Dalconi a,*, A. Alberti a, G. Cruciani a, P. Ciambelli b, E. Fonda c
a Dipartimento di Scienze della Terra, Sez. di Mineralogia, Universit�aa di Ferrara, Corso Ercole I d’Este 32, 44100 Ferrara, Italyb Dipartimento di Ingegneria Chimica e Alimentare, Universit�aa di Salerno, Salerno, Italy
c Dipartimento di Scienze Chimiche, Universit�aa di Trieste, Trieste, Italy
Received 29 January 2003; received in revised form 7 May 2003; accepted 10 May 2003
Abstract
The crystal structure of three synthetic ferrierite samples loaded with different amounts of Co cations (2.5 wt.%, 4.3
wt.% and 13.7 wt.% respectively) were refined by means of synchrotron X-ray powder diffraction data. The unit cell
content of cobalt exchanged ferrierites resulted: jNa0:18K0:03Co1:12H1:36(H2O)17:2j[Al3:81Si32:19O72]––FER, jNa0:18K0:03-Co1:89(H2O)17:2j[Al3:81Si32:19O72]––FER, and jNa0:18K0:03Co1:89(H2O)17:2j[Al3:81Si32:19O72]––FER respectively. In the
overloaded sample the excess of Co (9.4 wt.%) is located outside the zeolite structure as cobalt oxide phases. After
cation exchange the space group, which was P21=n in the as-synthesised form, becomes Immm. The crystal structure of
the three synthetic samples is characterised by the presence of a Co(H2O)2þ6 polyhedron inside the ferrierite cage. The
occupancy of this polyhedron varies as a function of the Co amount in the extra-framework sites of the ferrierite
structure: up to 50% for a complete ion-exchange. The residual cobalt occupies two further cation sites.
� 2003 Elsevier Inc. All rights reserved.
Keywords: Ferrierite; Metal ion-exchanged zeolite; Co2þ ions; Rietveld refinement
1. Introduction
In the last decades, zeolites exchanged with
transition metal ions have received increasing in-terest as promising catalysts for a variety of im-
portant reactions [1]. Zeolites can serve as hosts to
activate transition metal ions, offering a unique
ligand system with multiple types of coordination
for cations. Zeolite topology, type of cation, its
location and coordination are among the factors
* Corresponding author. Tel.: +39-532-293-752; fax: +39-
532-293-760.
E-mail address: [email protected] (M.C. Dalconi).
1387-1811/$ - see front matter � 2003 Elsevier Inc. All rights reserve
doi:10.1016/S1387-1811(03)00404-9
controlling catalytic activity. It has recently been
shown that transition metal ion-exchanged zeolites
with low Al content and pentasil rings in their
frameworks (FER, MOR, MFI) display high ac-tivity and selectivity towards nitrogen in selective
catalytic reduction of nitrogen oxides (NOx) with
methane (CH4-SCR) [2]. Co-exchanged ferrierites
in particular have been found to exhibit high ac-
tivity towards the decomposition of NOx with
methane in the presence of excess oxygen [3].
Ciambelli et al. (personal communication) showed
that Co-ferrierite displays different catalytic ac-tivity depending on the loading of Co ions in zeo-
lite. Stakheev et al. [4] reported that the presence
of dispersed cobalt oxide species in addition to the
d.
192 M.C. Dalconi et al. / Microporous and Mesoporous Materials 62 (2003) 191–200
Co ions increase the rate of the CH4-SCR of NO
by enhancing the rate of NO2 formation. The Co-
ferrierite catalyst and its interaction with nitrogen
oxides, CH4, and SO2 has been studied by several
spectroscopic techniques (FTIR, UV–vis spec-
troscopy, EXAFS, temperature programmed de-sorption, X-ray photoelectron spectroscopy,
magnetic susceptibility measurements) [5–7], but
there are no reported diffraction studies on the
locations of extra-framework cobalt ions in fer-
rierite.
The aim of this study is to investigate the
structural modifications undergone by ferrierite
when loaded with different amounts of Co2þ ca-tions, and to localize the extra-framework sites by
high-resolution X-ray powder diffraction.
2. Experimental
2.1. Sample preparation
The synthetic ferrierite Engelhard EZTM-500
jK2:7Na1:1(H2O)12j[Al3:8Si32:2O72]––FER was ion-
exchanged to ammonium form by exhaustive ex-
change with aqueous solutions of ammonium
nitrate. Co-ferrierite samples (Co-FER) were pre-
pared by exchanging, at 80 �C, the ammoniumform of ferrierite with Co(CH3COO)2 aqueous
solutions. By varying the exchange time (18, 46 and302 h for samples named Co-FER18, Co-FER46
and Co-FER302 respectively) and renewing the
exchange solution many times, different cobalt ion
contents were obtained: 2.5 wt.% in sample Co-
FER18, 4.3 wt.% in Co-FER46 and 13.7 wt.% in
Co-FER302. After calcination at 550 �C for 2 h,the three samples were rehydrated at room condi-
tions. The cation content after exchange was de-
Table 1
Chemical formulae of as-synthesised (AS-FER) and Co-exchanged fe
Sample Co wt.%
AS-FER –
Co-FER18 2.5
Co-FER46 4.3
Co-FER302 Extra-zeolite Co 4.3+ 9.4 tot¼ 13.7*E% ¼ f½Al� ðNaþKþ 2 CoþHÞ�=ðNaþKþ 2 CoþHÞg 10
termined by atomic absorption spectroscopy
(AAS), whereas the water content was determined
by thermogravimetric analysis only for sample Co-
FER46; the same water content was attributed to
the other two samples. Assuming the framework
composition of the as-synthesised ferrierite(Engelhard EZTM-500), in the Co-FER18 sample
the Co2þ cations are not sufficient to counterbal-
ance the framework charge (see Table 1); the re-
mainder of the charge is probably compensated by
the presence of Brønsted acid sites produced during
thermal decomposition of the residual NHþ4 ca-
tions [8]. In the case of the Co-FER46 sample the
ion-exchange is complete, confirming an almostmonocationic Co-form (Table 1). The Co-FER302
sample indicated an overloading of cobalt ions
which could only in part (1.89 cations per unit cell)
be hosted in the extra-framework sites of ferrierite;
the excess of cobalt (9.39 wt.%) is probably located
outside the zeolite structure (see Table 1).
2.2. X-ray diffraction
High-resolution, room temperature synchrotron
X-ray powder diffraction data of the hydrated
samples were collected at the Swiss–Norwegian
beamline (SNBL) at ESRF (Grenoble), using a
Si(1 1 1) monochromator and a Si(1 1 1) analyser,
with a scintillation counter as detector. The sam-
ple, placed in a capillary tube 0.7 mm in diameter,was spun during data collection to minimise its
preferred orientation. Experimental and refine-
ment details are reported in Table 2.
Close inspection of the diffraction patterns of
Co-exchanged ferrierite did not show the presence
of any reflections of the type hþ k þ l ¼ 2nþ 1,which are forbidden in the Immm space group; this
space group was therefore adopted in the refine-
rrierites
Chemical formula E (%)�
jNa1:10K2:71(H2O)11:8j[Al3:81Si32:19O72] 0.0
jNa0:18K0:03Co1:12H1:36(H2O)17:2j[Al3:81Si32:19O72] 0.0
jNa0:18K0:03Co1:89(H2O)17:2j[Al3:81Si32:19O72] )4.5jNa0:18K0:03Co1:89(H2O)17:2j[Al3:81Si32:19O72] )4.5
0.
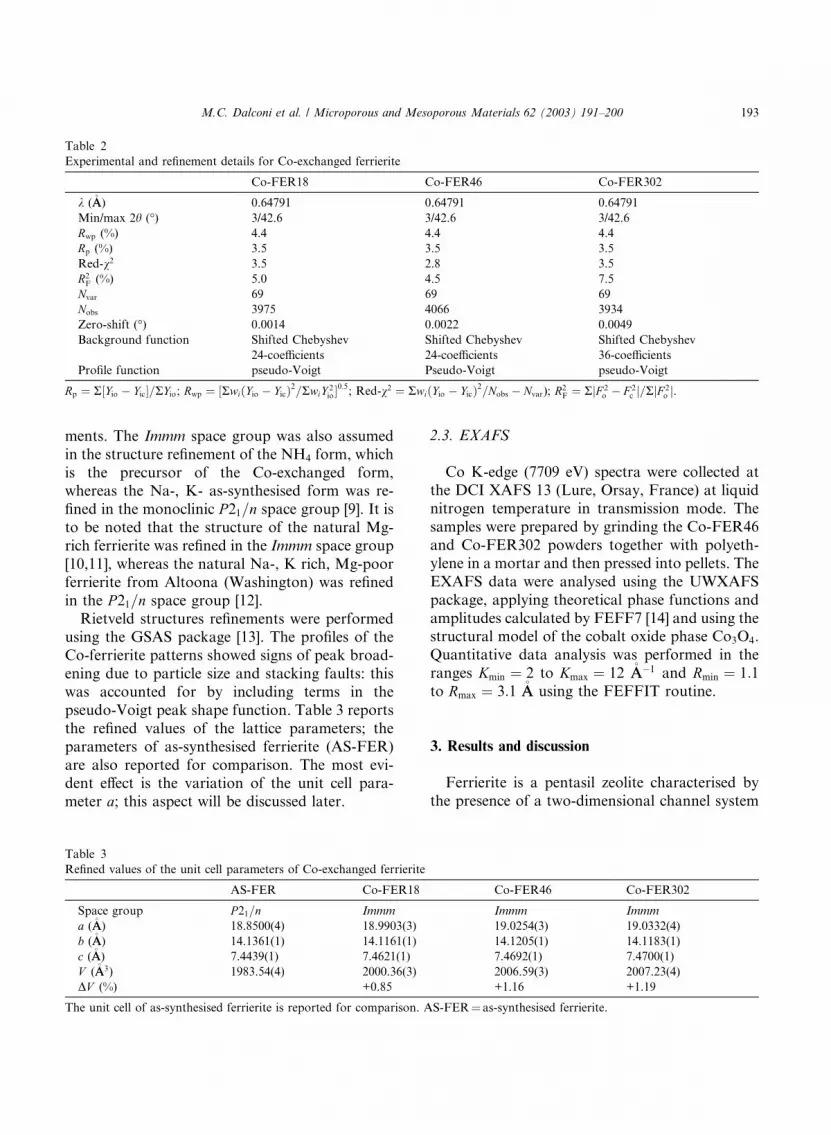
Table 2
Experimental and refinement details for Co-exchanged ferrierite
Co-FER18 Co-FER46 Co-FER302
k (�AA) 0.64791 0.64791 0.64791
Min/max 2h (�) 3/42.6 3/42.6 3/42.6
Rwp (%) 4.4 4.4 4.4
Rp (%) 3.5 3.5 3.5
Red-v2 3.5 2.8 3.5
R2F (%) 5.0 4.5 7.5
Nvar 69 69 69
Nobs 3975 4066 3934
Zero-shift (�) 0.0014 0.0022 0.0049
Background function Shifted Chebyshev
24-coefficients
Shifted Chebyshev
24-coefficients
Shifted Chebyshev
36-coefficients
Profile function pseudo-Voigt Pseudo-Voigt pseudo-Voigt
Rp ¼ R½Yio � Yic�=RYio; Rwp ¼ ½RwiðYio � YicÞ2=RwiY 2io�0:5; Red-v2 ¼ RwiðYio � YicÞ2=Nobs � Nvar); R2F ¼ RjF 2o � F 2c j=RjF 2o j.
M.C. Dalconi et al. / Microporous and Mesoporous Materials 62 (2003) 191–200 193
ments. The Immm space group was also assumed
in the structure refinement of the NH4 form, which
is the precursor of the Co-exchanged form,whereas the Na-, K- as-synthesised form was re-
fined in the monoclinic P21=n space group [9]. It isto be noted that the structure of the natural Mg-
rich ferrierite was refined in the Immm space group
[10,11], whereas the natural Na-, K rich, Mg-poor
ferrierite from Altoona (Washington) was refined
in the P21=n space group [12].Rietveld structures refinements were performed
using the GSAS package [13]. The profiles of the
Co-ferrierite patterns showed signs of peak broad-
ening due to particle size and stacking faults: this
was accounted for by including terms in the
pseudo-Voigt peak shape function. Table 3 reports
the refined values of the lattice parameters; the
parameters of as-synthesised ferrierite (AS-FER)
are also reported for comparison. The most evi-dent effect is the variation of the unit cell para-
meter a; this aspect will be discussed later.
Table 3
Refined values of the unit cell parameters of Co-exchanged ferrierite
AS-FER Co-FER18
Space group P21=n Immm
a (�AA) 18.8500(4) 18.9903(3)
b (�AA) 14.1361(1) 14.1161(1)
c (�AA) 7.4439(1) 7.4621(1)
V (�AA3) 1983.54(4) 2000.36(3)
DV (%) +0.85
The unit cell of as-synthesised ferrierite is reported for comparison. A
2.3. EXAFS
Co K-edge (7709 eV) spectra were collected atthe DCI XAFS 13 (Lure, Orsay, France) at liquid
nitrogen temperature in transmission mode. The
samples were prepared by grinding the Co-FER46
and Co-FER302 powders together with polyeth-
ylene in a mortar and then pressed into pellets. The
EXAFS data were analysed using the UWXAFS
package, applying theoretical phase functions and
amplitudes calculated by FEFF7 [14] and using thestructural model of the cobalt oxide phase Co3O4.
Quantitative data analysis was performed in the
ranges Kmin ¼ 2 to Kmax ¼ 12 �AA�1 and Rmin ¼ 1:1to Rmax ¼ 3:1 �AA using the FEFFIT routine.
3. Results and discussion
Ferrierite is a pentasil zeolite characterised by
the presence of a two-dimensional channel system
Co-FER46 Co-FER302
Immm Immm
19.0254(3) 19.0332(4)
14.1205(1) 14.1183(1)
7.4692(1) 7.4700(1)
2006.59(3) 2007.23(4)
+1.16 +1.19
S-FER¼ as-synthesised ferrierite.
194 M.C. Dalconi et al. / Microporous and Mesoporous Materials 62 (2003) 191–200
parallel to the (1 0 0) plane. An 8-membered ring
channel develops along the [0 1 0] direction,
whereas a 10-membered ring channel is parallel to
the [0 0 1] direction and alternates along the b axiswith the so-called ferrierite cage, namely a
[82626458] cage.
3.1. Co-FER18
The crystal structure of Ni-exchanged ferrierite
[15] was adopted as starting model for Rietveld
refinement. As for Ni-ferrierite, the framework of
Co-FER18 did not show any noticeable difference
with respect to the framework of natural Mg-rich
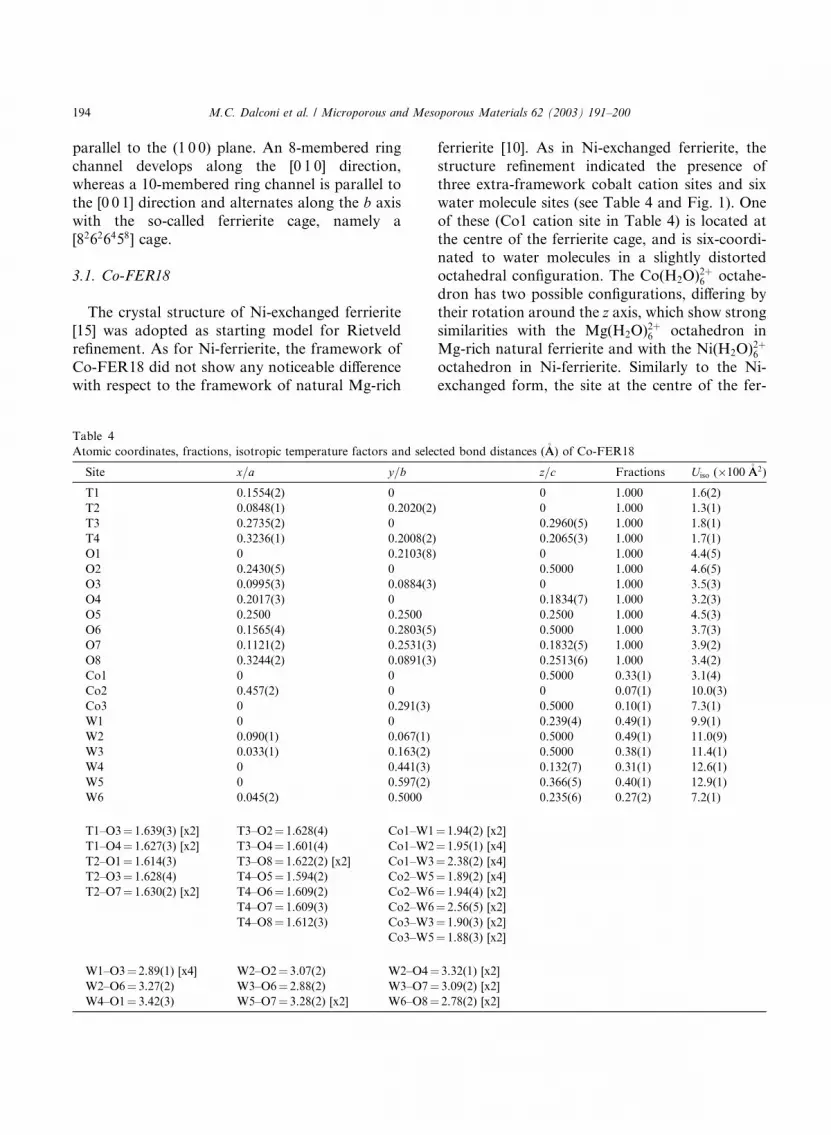
Table 4
Atomic coordinates, fractions, isotropic temperature factors and selec
Site x=a y=b
T1 0.1554(2) 0
T2 0.0848(1) 0.2020(2)
T3 0.2735(2) 0
T4 0.3236(1) 0.2008(2)
O1 0 0.2103(8)
O2 0.2430(5) 0
O3 0.0995(3) 0.0884(3)
O4 0.2017(3) 0
O5 0.2500 0.2500
O6 0.1565(4) 0.2803(5)
O7 0.1121(2) 0.2531(3)
O8 0.3244(2) 0.0891(3)
Co1 0 0
Co2 0.457(2) 0
Co3 0 0.291(3)
W1 0 0
W2 0.090(1) 0.067(1)
W3 0.033(1) 0.163(2)
W4 0 0.441(3)
W5 0 0.597(2)
W6 0.045(2) 0.5000
T1–O3¼ 1.639(3) [x2] T3–O2¼ 1.628(4) Co1–W1
T1–O4¼ 1.627(3) [x2] T3–O4¼ 1.601(4) Co1–W2
T2–O1¼ 1.614(3) T3–O8¼ 1.622(2) [x2] Co1–W3
T2–O3¼ 1.628(4) T4–O5¼ 1.594(2) Co2–W5
T2–O7¼ 1.630(2) [x2] T4–O6¼ 1.609(2) Co2–W6
T4–O7¼ 1.609(3) Co2–W6
T4–O8¼ 1.612(3) Co3–W3
Co3–W5
W1–O3¼ 2.89(1) [x4] W2–O2¼ 3.07(2) W2–O4¼W2–O6¼ 3.27(2) W3–O6¼ 2.88(2) W3–O7¼W4–O1¼ 3.42(3) W5–O7¼ 3.28(2) [x2] W6–O8¼
ferrierite [10]. As in Ni-exchanged ferrierite, the
structure refinement indicated the presence of
three extra-framework cobalt cation sites and six
water molecule sites (see Table 4 and Fig. 1). One
of these (Co1 cation site in Table 4) is located at
the centre of the ferrierite cage, and is six-coordi-nated to water molecules in a slightly distorted
octahedral configuration. The Co(H2O)2þ6 octahe-
dron has two possible configurations, differing by
their rotation around the z axis, which show strongsimilarities with the Mg(H2O)
2þ6 octahedron in
Mg-rich natural ferrierite and with the Ni(H2O)2þ6
octahedron in Ni-ferrierite. Similarly to the Ni-
exchanged form, the site at the centre of the fer-
ted bond distances (�AA) of Co-FER18
z=c Fractions Uiso ( 100 �AA2)0 1.000 1.6(2)
0 1.000 1.3(1)
0.2960(5) 1.000 1.8(1)
0.2065(3) 1.000 1.7(1)
0 1.000 4.4(5)
0.5000 1.000 4.6(5)
0 1.000 3.5(3)
0.1834(7) 1.000 3.2(3)
0.2500 1.000 4.5(3)
0.5000 1.000 3.7(3)
0.1832(5) 1.000 3.9(2)
0.2513(6) 1.000 3.4(2)
0.5000 0.33(1) 3.1(4)
0 0.07(1) 10.0(3)
0.5000 0.10(1) 7.3(1)
0.239(4) 0.49(1) 9.9(1)
0.5000 0.49(1) 11.0(9)
0.5000 0.38(1) 11.4(1)
0.132(7) 0.31(1) 12.6(1)
0.366(5) 0.40(1) 12.9(1)
0.235(6) 0.27(2) 7.2(1)
¼ 1.94(2) [x2]¼ 1.95(1) [x4]¼ 2.38(2) [x4]¼ 1.89(2) [x4]¼ 1.94(4) [x2]¼ 2.56(5) [x2]¼ 1.90(3) [x2]¼ 1.88(3) [x2]
3.32(1) [x2]
3.09(2) [x2]
2.78(2) [x2]
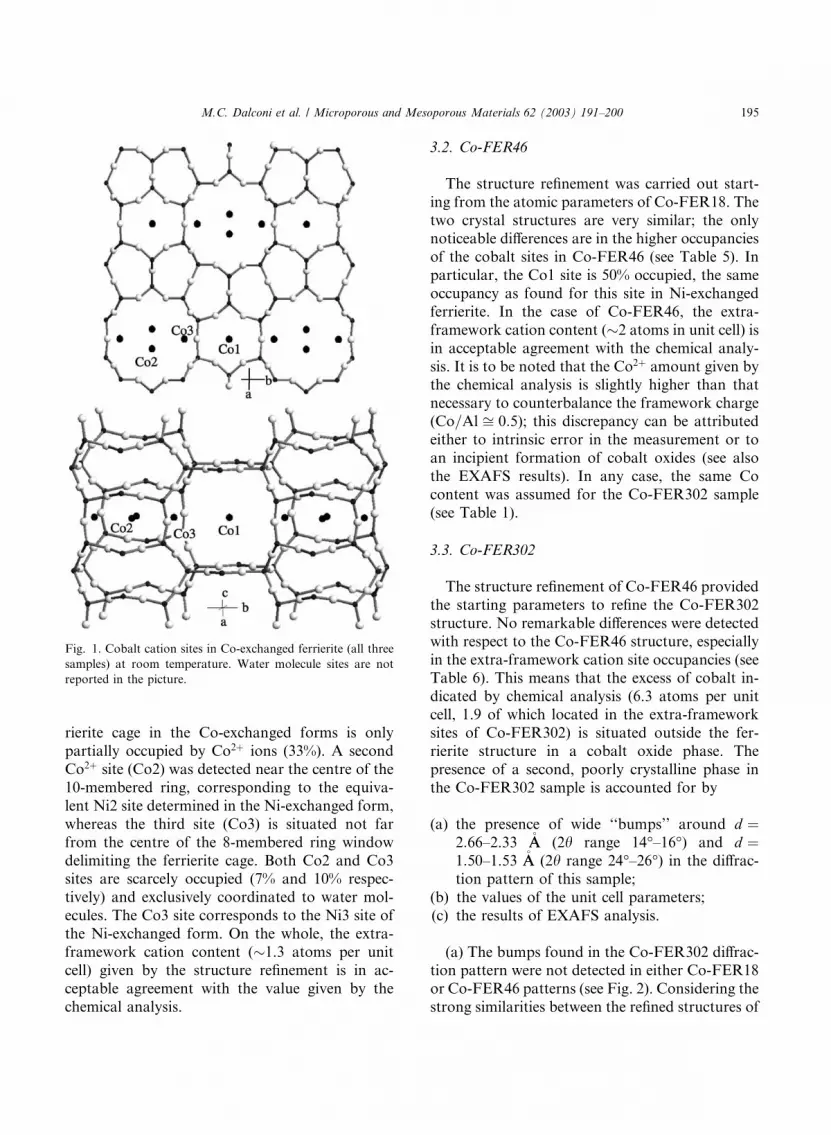
Fig. 1. Cobalt cation sites in Co-exchanged ferrierite (all three
samples) at room temperature. Water molecule sites are not
reported in the picture.
M.C. Dalconi et al. / Microporous and Mesoporous Materials 62 (2003) 191–200 195
rierite cage in the Co-exchanged forms is only
partially occupied by Co2þ ions (33%). A second
Co2þ site (Co2) was detected near the centre of the
10-membered ring, corresponding to the equiva-
lent Ni2 site determined in the Ni-exchanged form,
whereas the third site (Co3) is situated not far
from the centre of the 8-membered ring window
delimiting the ferrierite cage. Both Co2 and Co3sites are scarcely occupied (7% and 10% respec-
tively) and exclusively coordinated to water mol-
ecules. The Co3 site corresponds to the Ni3 site of
the Ni-exchanged form. On the whole, the extra-
framework cation content (�1.3 atoms per unitcell) given by the structure refinement is in ac-
ceptable agreement with the value given by the
chemical analysis.
3.2. Co-FER46
The structure refinement was carried out start-
ing from the atomic parameters of Co-FER18. The
two crystal structures are very similar; the onlynoticeable differences are in the higher occupancies
of the cobalt sites in Co-FER46 (see Table 5). In
particular, the Co1 site is 50% occupied, the same
occupancy as found for this site in Ni-exchanged
ferrierite. In the case of Co-FER46, the extra-
framework cation content (�2 atoms in unit cell) isin acceptable agreement with the chemical analy-
sis. It is to be noted that the Co2þ amount given bythe chemical analysis is slightly higher than that
necessary to counterbalance the framework charge
(Co=Al ffi 0:5); this discrepancy can be attributedeither to intrinsic error in the measurement or to
an incipient formation of cobalt oxides (see also
the EXAFS results). In any case, the same Co
content was assumed for the Co-FER302 sample
(see Table 1).
3.3. Co-FER302
The structure refinement of Co-FER46 provided
the starting parameters to refine the Co-FER302
structure. No remarkable differences were detected
with respect to the Co-FER46 structure, especially
in the extra-framework cation site occupancies (seeTable 6). This means that the excess of cobalt in-
dicated by chemical analysis (6.3 atoms per unit
cell, 1.9 of which located in the extra-framework
sites of Co-FER302) is situated outside the fer-
rierite structure in a cobalt oxide phase. The
presence of a second, poorly crystalline phase in
the Co-FER302 sample is accounted for by
(a) the presence of wide ‘‘bumps’’ around d ¼2:66–2.33 �AA (2h range 14�–16�) and d ¼1:50–1.53 �AA (2h range 24�–26�) in the diffrac-tion pattern of this sample;
(b) the values of the unit cell parameters;
(c) the results of EXAFS analysis.
(a) The bumps found in the Co-FER302 diffrac-tion pattern were not detected in either Co-FER18
or Co-FER46 patterns (see Fig. 2). Considering the
strong similarities between the refined structures of
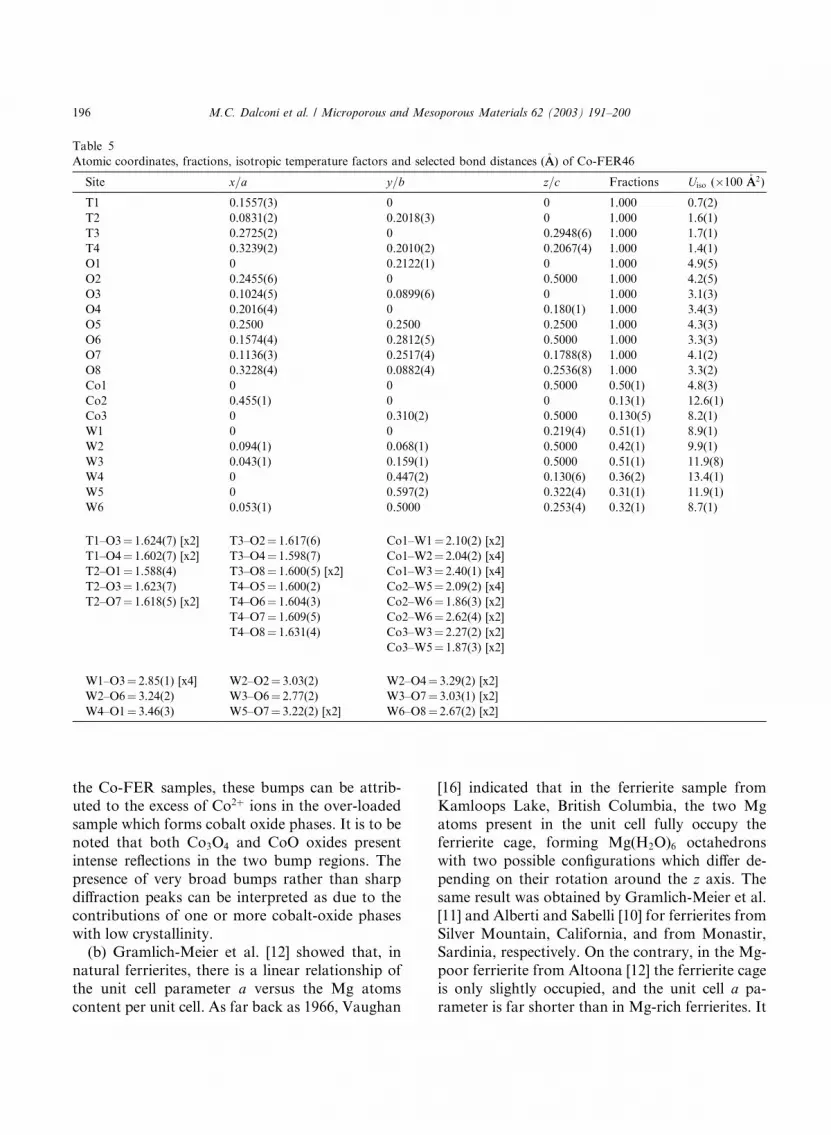
Table 5
Atomic coordinates, fractions, isotropic temperature factors and selected bond distances (�AA) of Co-FER46
Site x=a y=b z=c Fractions Uiso ( 100 �AA2)
T1 0.1557(3) 0 0 1.000 0.7(2)
T2 0.0831(2) 0.2018(3) 0 1.000 1.6(1)
T3 0.2725(2) 0 0.2948(6) 1.000 1.7(1)
T4 0.3239(2) 0.2010(2) 0.2067(4) 1.000 1.4(1)
O1 0 0.2122(1) 0 1.000 4.9(5)
O2 0.2455(6) 0 0.5000 1.000 4.2(5)
O3 0.1024(5) 0.0899(6) 0 1.000 3.1(3)
O4 0.2016(4) 0 0.180(1) 1.000 3.4(3)
O5 0.2500 0.2500 0.2500 1.000 4.3(3)
O6 0.1574(4) 0.2812(5) 0.5000 1.000 3.3(3)
O7 0.1136(3) 0.2517(4) 0.1788(8) 1.000 4.1(2)
O8 0.3228(4) 0.0882(4) 0.2536(8) 1.000 3.3(2)
Co1 0 0 0.5000 0.50(1) 4.8(3)
Co2 0.455(1) 0 0 0.13(1) 12.6(1)
Co3 0 0.310(2) 0.5000 0.130(5) 8.2(1)
W1 0 0 0.219(4) 0.51(1) 8.9(1)
W2 0.094(1) 0.068(1) 0.5000 0.42(1) 9.9(1)
W3 0.043(1) 0.159(1) 0.5000 0.51(1) 11.9(8)
W4 0 0.447(2) 0.130(6) 0.36(2) 13.4(1)
W5 0 0.597(2) 0.322(4) 0.31(1) 11.9(1)
W6 0.053(1) 0.5000 0.253(4) 0.32(1) 8.7(1)
T1–O3¼ 1.624(7) [x2] T3–O2¼ 1.617(6) Co1–W1¼ 2.10(2) [x2]T1–O4¼ 1.602(7) [x2] T3–O4¼ 1.598(7) Co1–W2¼ 2.04(2) [x4]T2–O1¼ 1.588(4) T3–O8¼ 1.600(5) [x2] Co1–W3¼ 2.40(1) [x4]T2–O3¼ 1.623(7) T4–O5¼ 1.600(2) Co2–W5¼ 2.09(2) [x4]T2–O7¼ 1.618(5) [x2] T4–O6¼ 1.604(3) Co2–W6¼ 1.86(3) [x2]
T4–O7¼ 1.609(5) Co2–W6¼ 2.62(4) [x2]T4–O8¼ 1.631(4) Co3–W3¼ 2.27(2) [x2]
Co3–W5¼ 1.87(3) [x2]
W1–O3¼ 2.85(1) [x4] W2–O2¼ 3.03(2) W2–O4¼ 3.29(2) [x2]W2–O6¼ 3.24(2) W3–O6¼ 2.77(2) W3–O7¼ 3.03(1) [x2]W4–O1¼ 3.46(3) W5–O7¼ 3.22(2) [x2] W6–O8¼ 2.67(2) [x2]
196 M.C. Dalconi et al. / Microporous and Mesoporous Materials 62 (2003) 191–200
the Co-FER samples, these bumps can be attrib-uted to the excess of Co2þ ions in the over-loaded
sample which forms cobalt oxide phases. It is to be
noted that both Co3O4 and CoO oxides present
intense reflections in the two bump regions. The
presence of very broad bumps rather than sharp
diffraction peaks can be interpreted as due to the
contributions of one or more cobalt-oxide phases
with low crystallinity.(b) Gramlich-Meier et al. [12] showed that, in
natural ferrierites, there is a linear relationship of
the unit cell parameter a versus the Mg atomscontent per unit cell. As far back as 1966, Vaughan
[16] indicated that in the ferrierite sample fromKamloops Lake, British Columbia, the two Mg
atoms present in the unit cell fully occupy the
ferrierite cage, forming Mg(H2O)6 octahedrons
with two possible configurations which differ de-
pending on their rotation around the z axis. Thesame result was obtained by Gramlich-Meier et al.
[11] and Alberti and Sabelli [10] for ferrierites from
Silver Mountain, California, and from Monastir,Sardinia, respectively. On the contrary, in the Mg-
poor ferrierite from Altoona [12] the ferrierite cage
is only slightly occupied, and the unit cell a pa-rameter is far shorter than in Mg-rich ferrierites. It
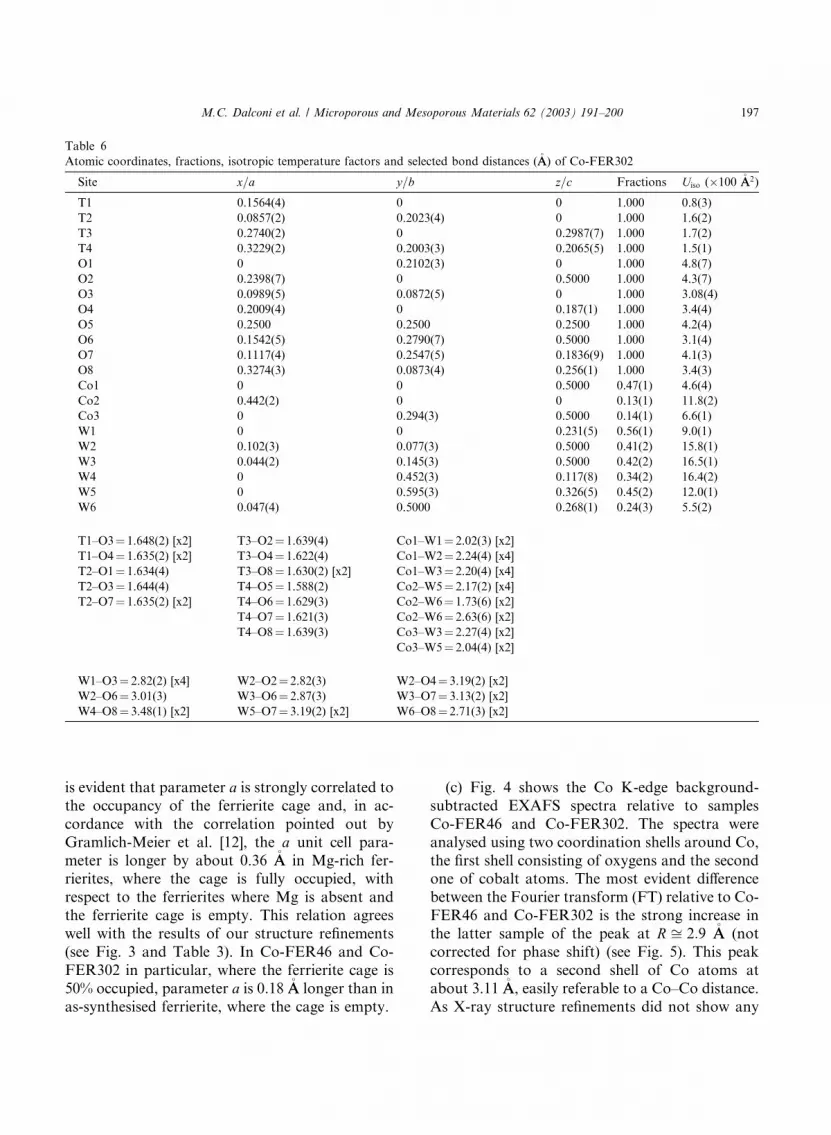
Table 6
Atomic coordinates, fractions, isotropic temperature factors and selected bond distances (�AA) of Co-FER302
Site x=a y=b z=c Fractions Uiso ( 100 �AA2)
T1 0.1564(4) 0 0 1.000 0.8(3)
T2 0.0857(2) 0.2023(4) 0 1.000 1.6(2)
T3 0.2740(2) 0 0.2987(7) 1.000 1.7(2)
T4 0.3229(2) 0.2003(3) 0.2065(5) 1.000 1.5(1)
O1 0 0.2102(3) 0 1.000 4.8(7)
O2 0.2398(7) 0 0.5000 1.000 4.3(7)
O3 0.0989(5) 0.0872(5) 0 1.000 3.08(4)
O4 0.2009(4) 0 0.187(1) 1.000 3.4(4)
O5 0.2500 0.2500 0.2500 1.000 4.2(4)
O6 0.1542(5) 0.2790(7) 0.5000 1.000 3.1(4)
O7 0.1117(4) 0.2547(5) 0.1836(9) 1.000 4.1(3)
O8 0.3274(3) 0.0873(4) 0.256(1) 1.000 3.4(3)
Co1 0 0 0.5000 0.47(1) 4.6(4)
Co2 0.442(2) 0 0 0.13(1) 11.8(2)
Co3 0 0.294(3) 0.5000 0.14(1) 6.6(1)
W1 0 0 0.231(5) 0.56(1) 9.0(1)
W2 0.102(3) 0.077(3) 0.5000 0.41(2) 15.8(1)
W3 0.044(2) 0.145(3) 0.5000 0.42(2) 16.5(1)
W4 0 0.452(3) 0.117(8) 0.34(2) 16.4(2)
W5 0 0.595(3) 0.326(5) 0.45(2) 12.0(1)
W6 0.047(4) 0.5000 0.268(1) 0.24(3) 5.5(2)
T1–O3¼ 1.648(2) [x2] T3–O2¼ 1.639(4) Co1–W1¼ 2.02(3) [x2]T1–O4¼ 1.635(2) [x2] T3–O4¼ 1.622(4) Co1–W2¼ 2.24(4) [x4]T2–O1¼ 1.634(4) T3–O8¼ 1.630(2) [x2] Co1–W3¼ 2.20(4) [x4]T2–O3¼ 1.644(4) T4–O5¼ 1.588(2) Co2–W5¼ 2.17(2) [x4]T2–O7¼ 1.635(2) [x2] T4–O6¼ 1.629(3) Co2–W6¼ 1.73(6) [x2]
T4–O7¼ 1.621(3) Co2–W6¼ 2.63(6) [x2]T4–O8¼ 1.639(3) Co3–W3¼ 2.27(4) [x2]
Co3–W5¼ 2.04(4) [x2]
W1–O3¼ 2.82(2) [x4] W2–O2¼ 2.82(3) W2–O4¼ 3.19(2) [x2]W2–O6¼ 3.01(3) W3–O6¼ 2.87(3) W3–O7¼ 3.13(2) [x2]W4–O8¼ 3.48(1) [x2] W5–O7¼ 3.19(2) [x2] W6–O8¼ 2.71(3) [x2]
M.C. Dalconi et al. / Microporous and Mesoporous Materials 62 (2003) 191–200 197
is evident that parameter a is strongly correlated tothe occupancy of the ferrierite cage and, in ac-
cordance with the correlation pointed out by
Gramlich-Meier et al. [12], the a unit cell para-meter is longer by about 0.36 �AA in Mg-rich fer-rierites, where the cage is fully occupied, with
respect to the ferrierites where Mg is absent and
the ferrierite cage is empty. This relation agrees
well with the results of our structure refinements
(see Fig. 3 and Table 3). In Co-FER46 and Co-
FER302 in particular, where the ferrierite cage is
50% occupied, parameter a is 0.18 �AA longer than inas-synthesised ferrierite, where the cage is empty.
(c) Fig. 4 shows the Co K-edge background-
subtracted EXAFS spectra relative to samples
Co-FER46 and Co-FER302. The spectra were
analysed using two coordination shells around Co,
the first shell consisting of oxygens and the secondone of cobalt atoms. The most evident difference
between the Fourier transform (FT) relative to Co-
FER46 and Co-FER302 is the strong increase in
the latter sample of the peak at R ffi 2:9 �AA (not
corrected for phase shift) (see Fig. 5). This peak
corresponds to a second shell of Co atoms at
about 3.11 �AA, easily referable to a Co–Co distance.As X-ray structure refinements did not show any

Fig. 3. Plot of unit cell parameter a (in �AA) versus number of Mgions per unit cell in ferrierite. For comparison the lattice con-
stants a of Co-ferrierite samples are reported. Symbols:
AS¼ as-synthesised ferrierite; A1, A2 and AL¼Altoona,Washington; SMM¼ Santa Monica Mountains; RM¼RodopeMountains, Bulgaria; K and KL¼Kamloops Lake, BC;SP¼ Sonora Pass, California; MO¼Monastir, Sardinia, Italy;PL¼Pinaus Lake, BC; ML¼Monte Lake, BC; I¼AlberoBassi, Vicenza, Italy (all data from Wise and Tschernich [17]
and references cited therein).
Fig. 4. Co K-edge EXAFS spectra of samples Co-FER46 and
Co-FER302.
Fig. 2. (a) Diffraction patterns of Co-exchanged ferrierite samples; (b) and (c) zoomed regions with ‘‘bump’’ in Co-FER302 pattern.
198 M.C. Dalconi et al. / Microporous and Mesoporous Materials 62 (2003) 191–200
remarkable differences between Co-FER46 andCo-FER302, and there are no Co–Co distances at
about 3.11 �AA inside the ferrierite structure, this
peak can be attributed only to Co–Co distances
outside the zeolite structure and referable to a
cobalt oxide phase. The weak, poorly defined peak
at 2.9 �AA in the FT of sample Co-FER46 can beeasily attributed to an incipient formation of co-balt oxide. Both the Co-FER46 and Co-FER302
samples show an intense peak at 1.5 �AA (not cor-rected for phase shift) which was modelled by a
shell of 6 oxygens at about 2.08 �AA. This shell maycorrespond to the 6 oxygens of the Co(H2O)
2þ6
octahedron inside the ferrierite cage, as well as to
the first shell of oxygens in a cobalt oxide phase.
Table 7 reports the values obtained from thequantitative data analysis, and Fig. 5 reports the
obtained fits.

Fig. 5. Fit ( ) to the Fourier transform of k3 vðkÞ Co signal(––) for samples Co-FER46 and Co-FER302.
Table 7
Results of the Co K-edge EXAFS analysis for Co-FER46 and
Co-FER302
Sample Co–O Co–Co
N R [�AA] r2 [�AA2] N R [�AA] r2 [�AA2]
Co-
FER46
5.8 2.08(1) 0.007 1.3 3.11(3) 0.008
Co-
FER302
5.2 2.09(3) 0.009 3.6 3.12(4) 0.007
M.C. Dalconi et al. / Microporous and Mesoporous Materials 62 (2003) 191–200 199
4. Conclusions
Comparison of the crystal structures of ferrierite
loaded with increasing amounts of cobalt ions in-
dicates that ferrierite structures can host cobalt
ions in three different extra-framework sites, even
at a quite low cation exchange. Their occupancy
increases up to the cation content corresponding
to the Co2þ amount necessary to counterbalance
the framework charge (Co=Al ffi 0:5). The mostpopulated site is at the centre of the ferrierite cage,in a quite regular Co(H2O)
2þ6 octahedral coordi-
nation. The refinement results show that the Co
content inside the ferrierite structure strongly in-
fluences unit cell parameter a, so that the amountof cation exchange can be roughly deduced by its
value. It has been demonstrated that an over-
exchange of Co ions gives rise to cobalt oxides
situated outside the zeolite structure.
Acknowledgements
The Ministero della Universit�aa e della RicercaScientifica e Tecnologica is thanked for its finan-
cial support to the research program ‘‘Zeolites,
materials of interest for industry and environment:synthesis, crystal structure, stability and applica-
tions’’ (COFIN 01).
References
[1] J.N. Armor, Micropor. Mesopor. Mater. 22 (1998) 451–
456.
[2] D. Kauck�yy, A. Vondrov�aa, J. D�eede�ccek, B. Wichterlov�aa, J.
Catal. 194 (2000) 318–329.
[3] Y. Li, J.N. Armor, Appl. Catal. B Env. 3 (1993) L1–L11.
[4] A.Y. Stakheev, C.W. Lee, S.J. Park, P.J. Chong, Catal.
Lett. 38 (1996) 71.
[5] Z. Sobal�ıık, J. D�eede�ccek, D. Kauck�yy, B. Wichterlov�aa, L.
Drozdov�aa, R. Prins, J. Catal. 194 (2000) 330–342.
[6] Y. Li, T.L. Slager, J.N. Armor, J. Catal. 150 (1994) 388–
399.
[7] Y. Li, J.N. Armor, Appl. Catal. B. 5 (1999) L257–L270.
[8] M.P. Attfield, S.J. Weigel, A.K. Cheetham, J. Catal. 172
(1997) 274–280.
[9] G. Cruciani, A. Alberti, A. Martucci, K.D. Knudsen, P.
Ciambelli, M. Rapacciuolo, in: M.M.J. Treacy, B.K.
Markus, M.E. Bisher, J.B. Higgins (Eds.), Proc. 12th Int.
Zeolite Conf. (1999) 2361.
[10] A. Alberti, C. Sabelli, Z. Kristallogr. 178 (1987) 249–256.
[11] R. Gramlich-Meier, W.M. Meier, B.K. Smith, Z. Kristal-
logr. 169 (1984) 201–210.
[12] R. Gramlich-Meier, V. Gramlich, W.M. Meier, Am.
Mineral. 70 (1985) 619–623.
200 M.C. Dalconi et al. / Microporous and Mesoporous Materials 62 (2003) 191–200
[13] A.C. Larson, R.B. Von Dreele, General Structure Analysis
System (GSAS) Manual, LANSCE, MS-H805 (1994) Los
Alamos National Laboratory, Los Alamos, NM 87545.
[14] S.I. Zabinsky, J.J. Rehr, A. Ankudinov, Phys. Rev. B 52
(1995) 2995.
[15] M.C. Dalconi, G. Criciani, A. Alberti, P. Ciambelli, M.T.
Rapacciuolo, Micropor. Mesopor. Mater. 39 (2000) 423–
430.
[16] P.A. Vaughan, Acta Crystallogr. 21 (1966) 983–990.
[17] W.S. Wise, R.W. Tschernich, Am. Miner. 61 (1976) 60–66.
Top Related
Copyright © 2022 FDOKUMEN

