


Bahasa
Halaman
Hukum

i n t e rn a t i o n a l j o u r n a l o f h y d r o g e n en e r g y 3 6 ( 2 0 1 1 ) 8 3 1 6e8 3 2 6
Avai lab le at www.sc iencedi rect .com
journa l homepage : www.e lsev ie r . com/ loca te /he
Simultaneous hydrogen and aromatics enhancement byobtaining optimum temperature profile and hydrogenremoval in naphtha reforming process; a novel theoreticalstudy
D. Iranshahi, A.M. Bahmanpour, K. Paymooni, M.R. Rahimpour*, A. Shariati
Department of Chemical Engineering, School of Chemical and Petroleum Engineering, Shiraz University, Shiraz 71345, Iran
a r t i c l e i n f o
Article history:
Received 25 January 2011
Received in revised form
23 March 2011
Accepted 4 April 2011
Available online 5 May 2011
Keywords:
Naphtha reforming
Optimization
Hydrogen permeation
Aromatics enhancement
Differential evolution method
* Corresponding author. Tel.: þ98 711 230307E-mail address: [email protected] (
0360-3199/$ e see front matter Copyright ªdoi:10.1016/j.ijhydene.2011.04.023
a b s t r a c t
In this novel theoretical study, the dimensionless length of the conventional naphtha
reforming reactor has been discretized into differential segments and three different cases
have been investigated in this regard. In the first case, inlet temperature of each segment
has been optimized via differential evolution (DE) method to obtain the optimized
temperature profile along the reactors by joining the achieved inlet temperatures for each
segment on the figure. Same approach has been applied in the second case in order to
achieve optimum hydrogen permeation rate. In the third case, the optimum profiles of
temperature and hydrogen removal have been obtained using DE optimization technique
using the same approach. The objective of each optimization case is to maximize the
hydrogen and aromatics production rate. As it is discussed further, unlike previous studies,
application of optimum temperature and hydrogen permeation profiles simultaneously
boosts hydrogen and aromatics production rate significantly. 10% and 24% enhancement in
hydrogen and aromatics production rates can be achieved by applying the novel theoretical
concepts in the conventional naphtha reforming process.
Copyright ª 2011, Hydrogen Energy Publications, LLC. Published by Elsevier Ltd. All rights
reserved.
1. Introduction enhance their quality. BTX production is another usage of
1.1. Naphtha reforming
Catalytic naphtha reforming is a process throughwhich one of
the main fractions of crude oil typically having low-octane
ratings called “Naphtha” is transformed into high-octane
liquid reformates [1]. Lighter ends (C1eC5) are produced in
this process, as well. High-octane reformates are usually
blended with low-octane gasoline produced in other units to
1; fax: þ98 711 6287294.M.R. Rahimpour).2011, Hydrogen Energy P
naphtha reforming units.
Considering the importance of boosting the octane number
of gasoline fuel and, consequently, the quality of produced
reformates in this process, several research efforts have been
made to investigate the catalytic naphtha reforming process.
The related studies can be classified into two separate cate-
gories. Some researchers have investigated and modeled the
kinetics of the process; Smith [2] has simplified the sophisti-
cated mechanism of this process by presenting a simple but
ublications, LLC. Published by Elsevier Ltd. All rights reserved.
i n t e r n a t i o n a l j o u r n a l o f h y d r o g e n en e r g y 3 6 ( 2 0 1 1 ) 8 3 1 6e8 3 2 6 8317
accurate kinetic model containing four dominant reactions
which present the governing reactions of themodel. Paraffins,
Naphthenes and Aromatics have been introduced as the
fundamental groups to be discussed in this model. Smith’s
model shows acceptable agreement with the experimental
data despite its simplicity. A more complex model has been
presented by Juarez and Macias [3] in which isomers of the
main groups in previous model have been considered in the
system. Less than 3% average deviation from experimental
data shows the accuracy of this model. A semi-empirical
kinetic model has been investigated by Stijepovic et al. [4] to
simulate the kinetics of catalytic naphtha reforming process.
Presence of Paraffins, Olefins, Naphthenes and Aromatics has
been considered in the system and their reactions have been
analyzed in the model. Similar studies in this field have been
done by other researchers [5e8]. The other category contains
the modifications which have been suggested by researchers
to improve the efficiency of the process. A semi-regenerative
naphtha reformer has been modeled and its operating
conditions have been optimized by Li et al. [9]. Economic and
environmental aspects have been considered in an objective
function defined by Stijepovic et al. [10] in a new simulation
and optimization for conventional naphtha reforming reac-
tors. Weifenget al. [11] have suggested a multi objective opti-
mization process to enhance aromatics production rate.
Khosravanipour and Rahimpour [12] have investigated the
dynamic behavior of a membrane reactor configuration for
naphtha reforming process by using Smith’s kinetic model.
Iranshahiet al. [13e15] have discussed the advantages of using
optimized spherical reactor configuration and also thermally
coupled recuperative reactor in order to improve the hydrogen
and aromatics production rate in naphtha reforming process.
Application of axial flow-spherical reactor and also combi-
nation of membrane tubular reactors and spherical reactors
are among the modifications which have been suggested and
discussed in previous studies [16,17]. Furthermore, various
modifications have been suggested to improve the efficiency
of the process [18e20].
Naphtha feed
Recycled
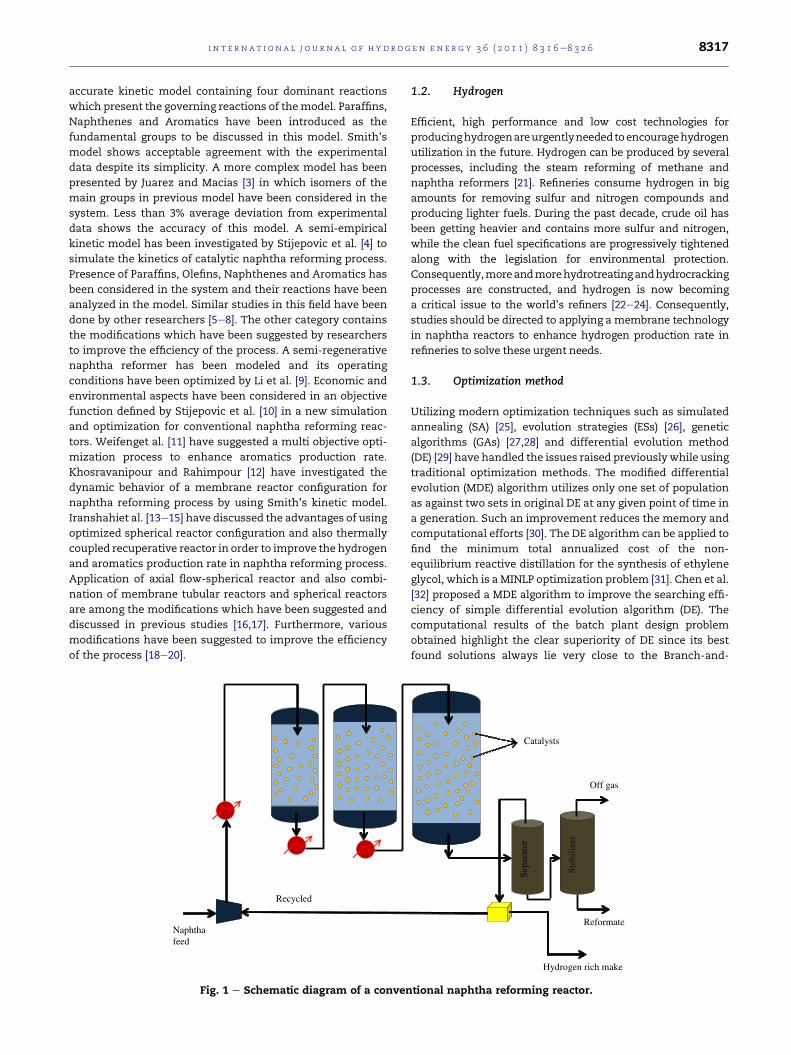
Fig. 1 e Schematic diagram of a conven
1.2. Hydrogen
Efficient, high performance and low cost technologies for
producinghydrogenareurgentlyneededtoencouragehydrogen
utilization in the future. Hydrogen can be produced by several
processes, including the steam reforming of methane and
naphtha reformers [21]. Refineries consume hydrogen in big
amounts for removing sulfur and nitrogen compounds and
producing lighter fuels. During the past decade, crude oil has
been getting heavier and contains more sulfur and nitrogen,
while the clean fuel specifications are progressively tightened
along with the legislation for environmental protection.
Consequently,moreandmorehydrotreatingandhydrocracking
processes are constructed, and hydrogen is now becoming
a critical issue to the world’s refiners [22e24]. Consequently,
studies should be directed to applying a membrane technology
in naphtha reactors to enhance hydrogen production rate in
refineries to solve these urgent needs.
1.3. Optimization method
Utilizing modern optimization techniques such as simulated
annealing (SA) [25], evolution strategies (ESs) [26], genetic
algorithms (GAs) [27,28] and differential evolution method
(DE) [29] have handled the issues raised previouslywhile using
traditional optimization methods. The modified differential
evolution (MDE) algorithm utilizes only one set of population
as against two sets in original DE at any given point of time in
a generation. Such an improvement reduces the memory and
computational efforts [30]. The DE algorithm can be applied to
find the minimum total annualized cost of the non-
equilibrium reactive distillation for the synthesis of ethylene
glycol, which is a MINLP optimization problem [31]. Chen et al.
[32] proposed a MDE algorithm to improve the searching effi-
ciency of simple differential evolution algorithm (DE). The
computational results of the batch plant design problem
obtained highlight the clear superiority of DE since its best
found solutions always lie very close to the Branch-and-
Sepa
rato
r
Stab
ilize
r
Hydrogen rich make
Off gas
Reformate
Catalysts
tional naphtha reforming reactor.
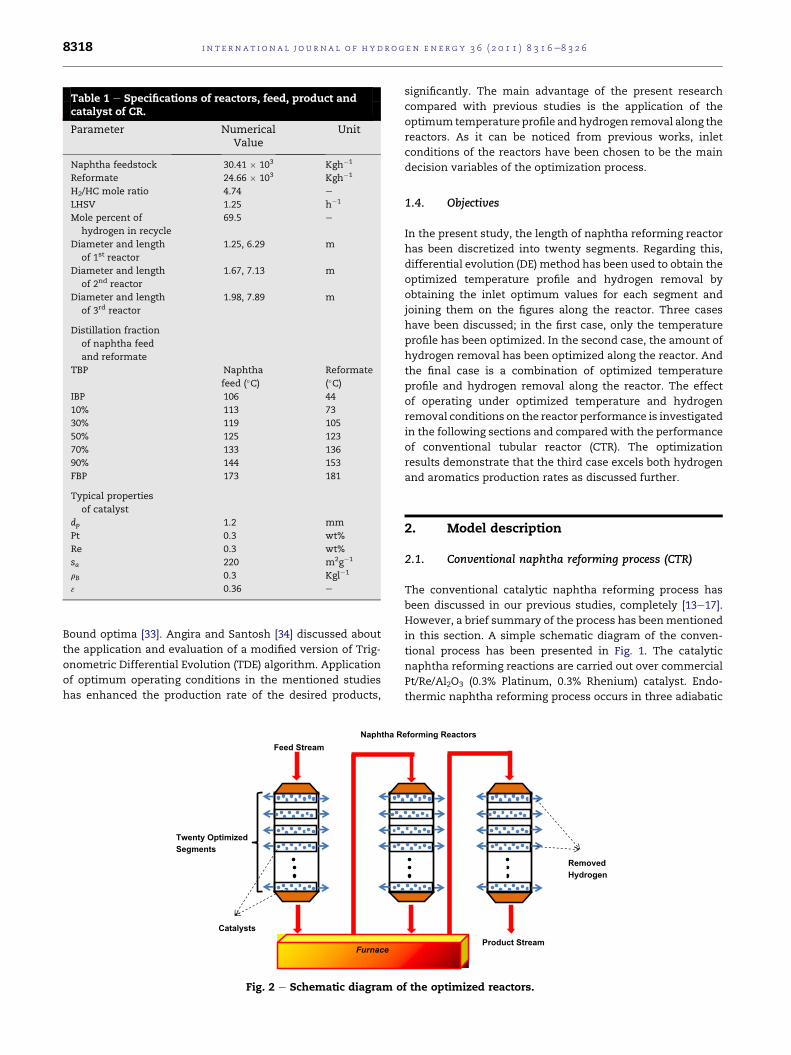
Table 1 e Specifications of reactors, feed, product andcatalyst of CR.
Parameter NumericalValue
Unit
Naphtha feedstock 30.41 � 103 Kgh�1
Reformate 24.66 � 103 Kgh�1
H2/HC mole ratio 4.74 e
LHSV 1.25 h�1
Mole percent of
hydrogen in recycle
69.5 e
Diameter and length
of 1st reactor
1.25, 6.29 m
Diameter and length
of 2nd reactor
1.67, 7.13 m
Diameter and length
of 3rd reactor
1.98, 7.89 m
Distillation fraction
of naphtha feed
and reformate
TBP Naphtha
feed (�C)Reformate
(�C)IBP 106 44
10% 113 73
30% 119 105
50% 125 123
70% 133 136
90% 144 153
FBP 173 181
Typical properties
of catalyst
dp 1.2 mm
Pt 0.3 wt%
Re 0.3 wt%
sa 220 m2g�1
rB 0.3 Kgl�1
3 0.36 e
i n t e rn a t i o n a l j o u r n a l o f h y d r o g e n en e r g y 3 6 ( 2 0 1 1 ) 8 3 1 6e8 3 2 68318
Bound optima [33]. Angira and Santosh [34] discussed about
the application and evaluation of a modified version of Trig-
onometric Differential Evolution (TDE) algorithm. Application
of optimum operating conditions in the mentioned studies
has enhanced the production rate of the desired products,
Furnace
Naphtha R
Feed Stream
Catalysts
Twenty Optimized
Segments
Fig. 2 e Schematic diagram o
significantly. The main advantage of the present research
compared with previous studies is the application of the
optimum temperature profile and hydrogen removal along the
reactors. As it can be noticed from previous works, inlet
conditions of the reactors have been chosen to be the main
decision variables of the optimization process.
1.4. Objectives
In the present study, the length of naphtha reforming reactor
has been discretized into twenty segments. Regarding this,
differential evolution (DE) method has been used to obtain the
optimized temperature profile and hydrogen removal by
obtaining the inlet optimum values for each segment and
joining them on the figures along the reactor. Three cases
have been discussed; in the first case, only the temperature
profile has been optimized. In the second case, the amount of
hydrogen removal has been optimized along the reactor. And
the final case is a combination of optimized temperature
profile and hydrogen removal along the reactor. The effect
of operating under optimized temperature and hydrogen
removal conditions on the reactor performance is investigated
in the following sections and compared with the performance
of conventional tubular reactor (CTR). The optimization
results demonstrate that the third case excels both hydrogen
and aromatics production rates as discussed further.
2. Model description
2.1. Conventional naphtha reforming process (CTR)
The conventional catalytic naphtha reforming process has
been discussed in our previous studies, completely [13e17].
However, a brief summary of the process has beenmentioned
in this section. A simple schematic diagram of the conven-
tional process has been presented in Fig. 1. The catalytic
naphtha reforming reactions are carried out over commercial
Pt/Re/Al2O3 (0.3% Platinum, 0.3% Rhenium) catalyst. Endo-
thermic naphtha reforming process occurs in three adiabatic
eforming Reactors
Removed
Hydrogen
Product Stream
f the optimized reactors.
i n t e r n a t i o n a l j o u r n a l o f h y d r o g e n en e r g y 3 6 ( 2 0 1 1 ) 8 3 1 6e8 3 2 6 8319
reactors. Three inter stage heaters have been applied to avoid
the reduction of the temperature and consequently, naph-
thene dehydrogenation reaction rate. The feed stream has
been combined with a recycle stream which contains
hydrogen in order to control the molar H2/HC ratio and coke
formation. Maintenance of H2/HC molar ratio in a specified
range may control the coke formation in the system. Table 1
presents the catalyst specifications and operating conditions
of the conventional process.
2.2. Novel optimized model
In the new configuration, the optimum temperature and
hydrogen removal profiles are determined along the reactors
and the effect of these optimized values on themain products
yield and the conversion of reactants are investigated. As
discussed before, the decision variables of the optimization
procedures applied in the previous studies were the inlet
conditions of the reactors. The superiority of the presented
model to the previous one is the optimization of the temper-
ature profile and amount of hydrogen removal along the
reactors which significantly affect the hydrogen and
aromatics production rate. Fig. 2 shows the scheme of the
procedure. Three cases are considered during the optimiza-
tion process of this specific problem. In this regard, the reactor
length is divided into twenty segments and material and
energy balances are evaluated considering optimized values
of the hydrogen removal and the temperature profile. In the
first case, the inlet temperature of each segment has been
optimized in a way to achieve the optimized temperature
profile by a combination of the obtained optimized inlet
temperature of the sections. Same procedure has been applied
in the second case for the amount of hydrogen removal along
the reactor and the third case is a combination of previous
cases. A scheme of the segment in Fig. 2 illustrates that the
mass and energy balances can be developed based on this
element by considering hydrogen removal.
3. Reaction kinetics
3.1. Naphtha reforming process
In order to simplify the calculation procedure, the suggested
model by Smith [2] has been used in this research. Although
themodel is simple, the results obtained from thismodel have
Table 2 e Comparison between model prediction and plant da
Reactor No. Inlet temperature (K) Inlet pressure (KPa)
1 777 3703
2 777 3537
3 775 3401
Reactor No. Outlet temperature (K)
Plant CR Deviation%
1 722 727 0.7%
2 753 751 0.3%
3 770 771 0.1%
acceptable agreement with industrial data which will be dis-
cussed in the model validation section. According to the
Smith’s model, four dominant reactions are investigated in
the naphtha reforming process as the main governing reac-
tions of this system, the reactions and the rate equations are
as follows:
1. Dehydrogenation of naphthenes to aromatics.
Naphthenes ðCnH2nÞ4Aromatics ðCnH2n�6Þ þ 3H2
DH1 ¼ 71 kJ=mole
r1 ¼�kf1
Ke1
��Ke1pn � parp
3h
�(1)
2. Dehydrocyclization of naphthenes to paraffins.
Naphthenes ðCnH2nÞ þH24Paraffins ðCnH2nþ2ÞDH2 ¼ �36:9 kJ=mole
r2 ¼�kf2
Ke2
��Ke2pnph � pp
�(2)
3. Hydrocracking of naphthenes to lower hydrocarbons.
Naphthenes ðCnH2nÞ þ n=3H24Lighter ends ðC1 � C5ÞDH3 ¼ �51:9 kJ=mole
r3 ¼�kf3
pt
�pn (3)
4. Hydrocracking of paraffins to lower hydrocarbons.
Paraffins ðCnH2nþ2Þ þ ðn� 3Þ=3H24Lighter ends ðC1 � C5ÞDH4 ¼ �56:6 kJ=mole
r4 ¼�kf4
pt
�pp (4)
In the mentioned rate equations, kf and Ke are forward rate
constants and equilibrium constants, respectively. Rase [35]
has investigated these constants and the following equa-
tions have been derived:
ta for fresh catalyst [27].
Catalyst distribution (wt%) Input feedstock (Mole%)
20 Paraffin 49.3
30 Naphthene 36
50 Aromatic 14.7
Aromatic in reformate (Mole%)
Plant CR Deviation%
e e e
e e e
57.7 56.2 2.7%
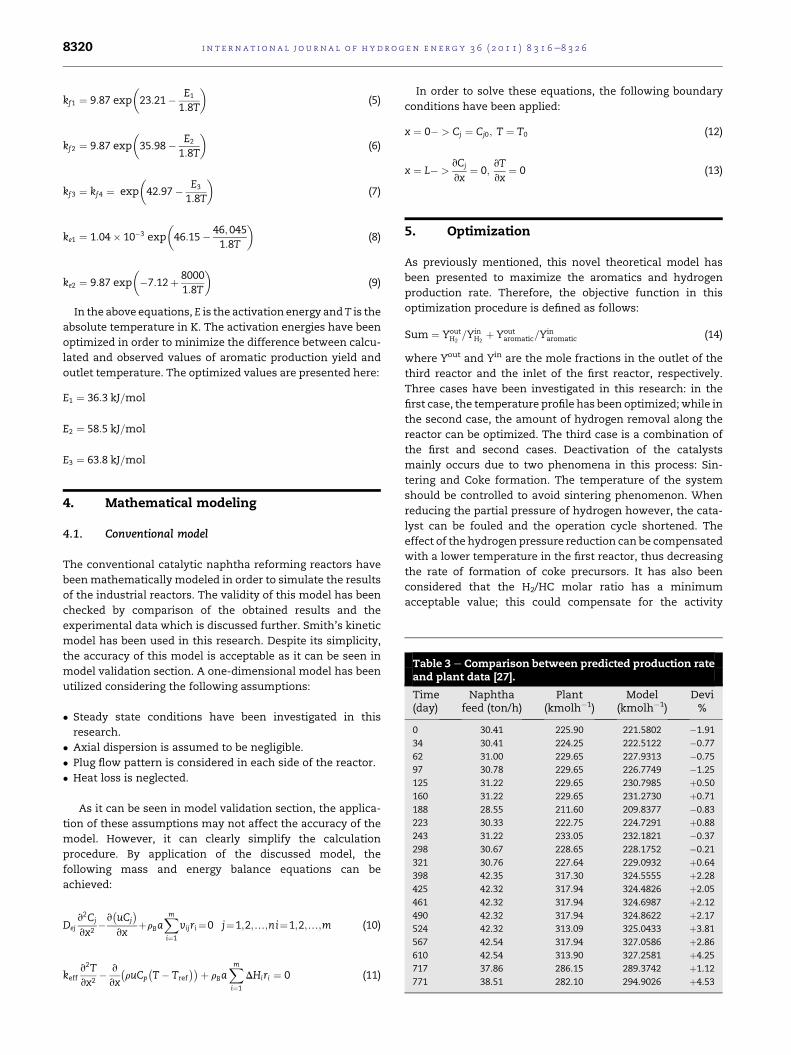
Table 3 e Comparison between predicted production rateand plant data [27].
Time(day)
Naphthafeed (ton/h)
Plant(kmolh�1)
Model(kmolh�1)
Devi%
0 30.41 225.90 221.5802 �1.91
34 30.41 224.25 222.5122 �0.77
62 31.00 229.65 227.9313 �0.75
97 30.78 229.65 226.7749 �1.25
125 31.22 229.65 230.7985 þ0.50
160 31.22 229.65 231.2730 þ0.71
188 28.55 211.60 209.8377 �0.83
223 30.33 222.75 224.7291 þ0.88
243 31.22 233.05 232.1821 �0.37
298 30.67 228.65 228.1752 �0.21
321 30.76 227.64 229.0932 þ0.64
398 42.35 317.30 324.5555 þ2.28
425 42.32 317.94 324.4826 þ2.05
461 42.32 317.94 324.6987 þ2.12
490 42.32 317.94 324.8622 þ2.17
524 42.32 313.09 325.0433 þ3.81
567 42.54 317.94 327.0586 þ2.86
610 42.54 313.90 327.2581 þ4.25
717 37.86 286.15 289.3742 þ1.12
771 38.51 282.10 294.9026 þ4.53
i n t e rn a t i o n a l j o u r n a l o f h y d r o g e n en e r g y 3 6 ( 2 0 1 1 ) 8 3 1 6e8 3 2 68320
kf1 ¼ 9:87 exp
�23:21� E1
1:8T
�(5)
kf2 ¼ 9:87 exp
�35:98� E2
1:8T
�(6)
kf3 ¼ kf4 ¼ exp
�42:97� E3
1:8T
�(7)
ke1 ¼ 1:04� 10�3 exp
�46:15� 46;045
1:8T
�(8)
ke2 ¼ 9:87 exp
��7:12þ 8000
1:8T
�(9)
In the above equations, E is the activation energy and T is the
absolute temperature in K. The activation energies have been
optimized in order to minimize the difference between calcu-
lated and observed values of aromatic production yield and
outlet temperature. The optimized values are presented here:
E1 ¼ 36:3 kJ=mol
E2 ¼ 58:5 kJ=mol
E3 ¼ 63:8 kJ=mol
4. Mathematical modeling
4.1. Conventional model
The conventional catalytic naphtha reforming reactors have
beenmathematically modeled in order to simulate the results
of the industrial reactors. The validity of this model has been
checked by comparison of the obtained results and the
experimental data which is discussed further. Smith’s kinetic
model has been used in this research. Despite its simplicity,
the accuracy of this model is acceptable as it can be seen in
model validation section. A one-dimensional model has been
utilized considering the following assumptions:
� Steady state conditions have been investigated in this
research.
� Axial dispersion is assumed to be negligible.
� Plug flow pattern is considered in each side of the reactor.
� Heat loss is neglected.
As it can be seen in model validation section, the applica-
tion of these assumptions may not affect the accuracy of the
model. However, it can clearly simplify the calculation
procedure. By application of the discussed model, the
following mass and energy balance equations can be
achieved:
Dejv2Cj
vx2�v
�uCj
�vx
þrBaXmi¼1
vijri¼0 j¼1;2;.;ni¼1;2;.;m (10)
keffv2Tvx2
� v
vx
�ruCp
�T� Tref
��þ rBaXmi¼1
DHiri ¼ 0 (11)
In order to solve these equations, the following boundary
conditions have been applied:
x ¼ 0� > Cj ¼ Cj0; T ¼ T0 (12)
x ¼ L� >vCj
vx¼ 0;
vTvx
¼ 0 (13)
5. Optimization
As previously mentioned, this novel theoretical model has
been presented to maximize the aromatics and hydrogen
production rate. Therefore, the objective function in this
optimization procedure is defined as follows:
Sum ¼ YoutH2
=YinH2
þ Youtaromatic=Y
inaromatic (14)
where Yout and Yin are the mole fractions in the outlet of the
third reactor and the inlet of the first reactor, respectively.
Three cases have been investigated in this research: in the
first case, the temperature profile has been optimized; while in
the second case, the amount of hydrogen removal along the
reactor can be optimized. The third case is a combination of
the first and second cases. Deactivation of the catalysts
mainly occurs due to two phenomena in this process: Sin-
tering and Coke formation. The temperature of the system
should be controlled to avoid sintering phenomenon. When
reducing the partial pressure of hydrogen however, the cata-
lyst can be fouled and the operation cycle shortened. The
effect of the hydrogen pressure reduction can be compensated
with a lower temperature in the first reactor, thus decreasing
the rate of formation of coke precursors. It has also been
considered that the H2/HC molar ratio has a minimum
acceptable value; this could compensate for the activity
0 0.1 0.2 0.3 0.4 0.5 0.6 0.7 0.8 0.9 1
720
730
740
750
760
770
780
Mass of catalyst (Dimensionless)
Tem
pera
ture
(K
)
0 0.02 0.04 0.06 0.08 0.1 0.12 0.14 0.16 0.18 0.2
720
725
730
735
740
745
Mass of catalyst (Dimensionless)
Opt
imum
tem
pera
ture
pro
file
of
firs
t re
acto
r (K
)
Case 1
Case 3
a
c d
b
0.2 0.25 0.3 0.35 0.4 0.45 0.50
730
740
750
760
770
780
790
800
Mass of catalyst (Dimensionless)
Opt
imum
tem
pera
ture
pro
file
of
seco
nd r
eact
or (
K)
Case 1
Case 3
0.5 0.55 0.6 0.65 0.7 0.75 0.8 0.85 0.9 0.95
790
791
792
793
794
795
796
797
798
799
800
Mass of catalyst (Dimensionless)
Opt
imum
tem
pera
ture
pro
file
of
thir
d re
acto
r (K
)
Case 1
Case 3
Fig. 3 e Temperature profile of (a) the conventional reactor (b) first reactor (c) second reactor and (d) third case.
i n t e r n a t i o n a l j o u r n a l o f h y d r o g e n en e r g y 3 6 ( 2 0 1 1 ) 8 3 1 6e8 3 2 6 8321
decline. Coke formation can be controlled by adjustment of
molar H2/HC ratio. In the temperature profile in the naphtha
reforming process should not exceed 550 �C or 823 K as
mentioned in literature [36,37]. However, to obtain more
acceptable answers, the upper limit of the temperature profile
has been set at 800 K. It may jeopardize the catalyst activity if
the H2/HC molar ratio reaches a value less than 4.73 [12].
Therefore, the following constraints have been applied in the
optimization procedure:
�H2
HC
�i
� 4:73 (15)
Ti � 800 K (16)
Penalty function has been applied in the optimization
procedure to eliminate the unacceptable answers automati-
cally. By using a penalty parameter, the defined constraints
are inserted in the procedure. Therefore, the objective func-
tion defined in this optimization problem is as follows:
Results ¼ �Sumþ 105X6
i¼1
G2i (17)
where
G1 ¼ max�0;�4:73� ðH2=HCÞ1
�(18)
G2 ¼ max�0;�4:73� ðH2=HCÞ2
�(19)
G3 ¼ max�0;�4:73� ðH2=HCÞ3
�(20)
G4 ¼ maxf0; ðT1 � 800Þg (21)
G5 ¼ maxf0; ðT2 � 800Þg (22)
G6 ¼ maxf0; ðT3 � 800Þg (23)
By application of Differential Evolution (DE) method, the
objective function has been minimized and, therefore, the
terms which represent the hydrogen and aromatics produc-
tion rate has been maximized.
6. Results and discussion
6.1. Model validation
The conventional model has been validated considering
observed plant data for conventional packed bed reactor at
0 0.02 0.04 0.06 0.08 0.1 0.12 0.14 0.16 0.18 0.2
0
1
2
3
4
5
6
7
8
mass of catalyst (Dimensionless)
Op
tim
um
h
yd
ro
gen
rem
oval (km
ole/m
2.h
r)
Case 2
Case 3
0.2 0.25 0.3 0.35 0.4 0.45
0
2
4
6
8
10
12
mass of catalyst (Dimensionless)
Op
tim
um
h
yd
ro
gen
rem
oval (km
ole/m
2 .h
r)
Case 2
Case 3
0.5 0.55 0.6 0.65 0.7 0.75 0.8 0.85 0.9 0.95 1
1.5
2
2.5
3
3.5
4
4.5
5
5.5
mass of catalyst (Dimensionless)
Op
tim
um
h
yd
ro
gen
rem
oval (km
ole/m
2.h
r)
Case 2
Case 3
a b
c
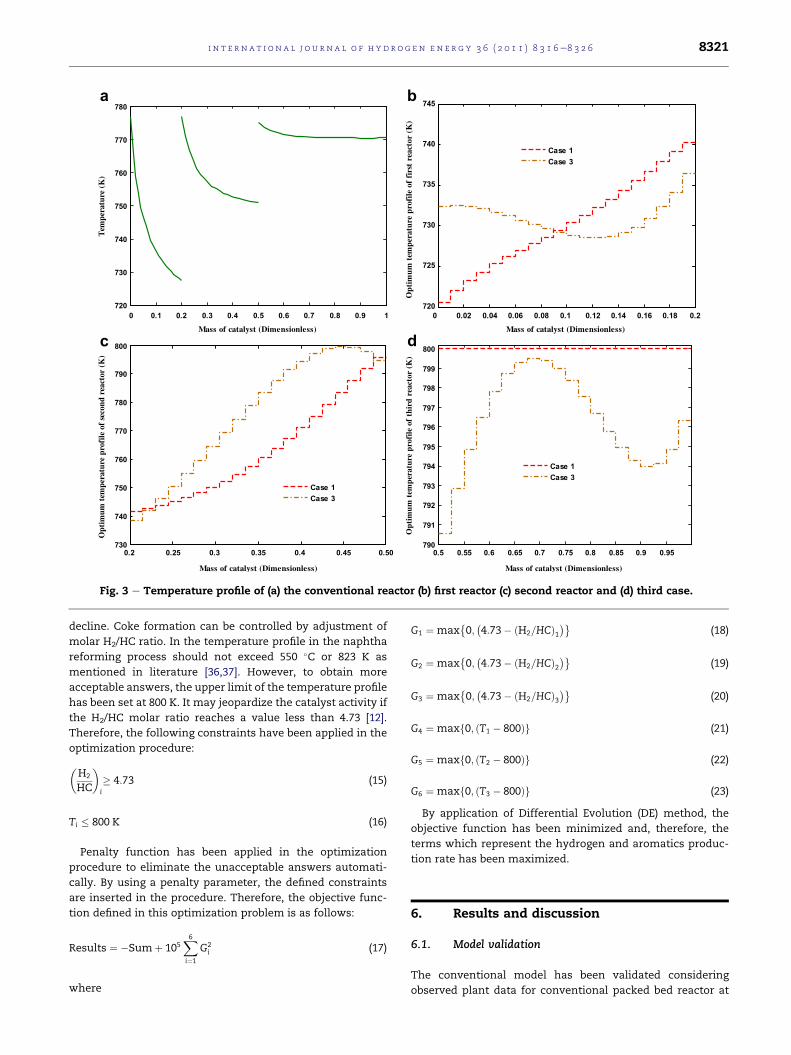
Fig. 4 e Hydrogen removal profiles for (a) first reactor (b) second reactor and (c) third case.
i n t e rn a t i o n a l j o u r n a l o f h y d r o g e n en e r g y 3 6 ( 2 0 1 1 ) 8 3 1 6e8 3 2 68322
steady state conditions. Table 2 presents the plant data and
predicted mole fractions of the components in the output of
the process. Model results show acceptable agreement with
the plant data. By utilizing the PONA Test in Stan Hop Seta
apparatus, each component (Paraffins, Naphthenes and
Aromatics) has been analyzed. The aromatic is tested espe-
cially by ASTM 2159 equivalent to UOP 273 method.
Steady state conditions have been considered in the
present research. However, by application of a catalyst deac-
tivation model [38], this conventional model has been also
validated by comparison of the theoretical and experimental
data for 800 operating days. This comparison has been pre-
sented in Table 3.
6.2. Discussion
As previously discussed, three cases have been studied in this
research; for each case, the reactors have been divided into 20
different segments. For each segment, the inlet temperature
has been optimized in the first case and the combination of
the optimized inlet temperatures provides us with an opti-
mized temperature profile along the reactors. The same
approach has been used in the second case. However, the
amount of hydrogen removal has been investigated in this
case. The third case is a combination of these two cases.
Fig. 3(a)e(d) presents the temperature profiles of the
system. In Fig. 3(a), the temperature profile of CTR has been
presented for comparison. Since naphtha reforming reactions
are predominantly endothermic, the reaction side tempera-
ture decreases abruptly along the reactors. In the first reactor,
the inlet concentration of naphthenes and n-paraffins is high,
therefore the reactions take place well and the temperature
drops abruptly. However, the reaction rate decreases at the
end of the first reactor owing to a decrease in the reaction side
temperature. Consequently, the outlet stream from the first
reactor is preheated via furnace before entering the second
reactor (see Fig. 1). In the second reactor, the same abrupt
temperature drop as the first reactor is not observed because
the most concentration of the naphtha feed is consumed in
the first reactor which lessens the reaction rates in the second
reactor. Ultimately, the lowest temperature drop is observed
in the third reactor owing to the least concentration of the
naphtha feed and the proceeding of the reactions along the
reactor. Optimized temperature profiles of cases 1 and 3 have
been shown in Fig. 3(b)e(d) for three reactors. As it can be seen
in the first case, the temperature profile of the first reactor is
lower compared with the conventional reactor. The temper-
ature profile increases in the second reactor and it reaches its
maximum limit in the third reactor. The objective of this
optimization procedure is to maximize the hydrogen and
0 0.1 0.2 0.3 0.4 0.5 0.6 0.7 0.8 0.9 1
0
20
40
60
80
100
120
140
Mass of catalyst (Dimensionless)
Aro
mat
ic p
rodu
ccti
on (
kmol
e/hr
)
CTR
Case 1
Case 2
Case 3
0 0.1 0.2 0.3 0.4 0.5 0.6 0.7 0.8 0.9 1
0
50
100
150
200
250
300
Mass of catalyst (Dimensionless)
Hyd
roge
n pr
oduc
tion
(km
ole/
hr)
CTR
Case 1
Case 2
Case 3
a b
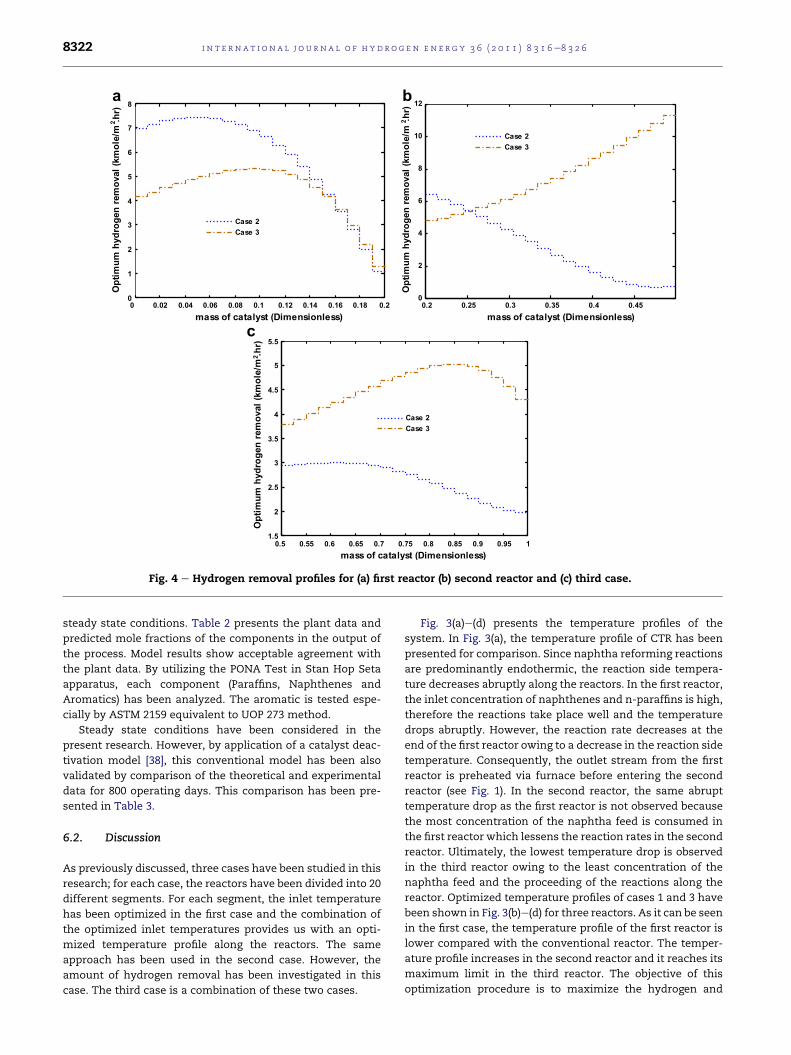
Fig. 5 e (a) Aromatics and (b) hydrogen production for each case.
i n t e r n a t i o n a l j o u r n a l o f h y d r o g e n en e r g y 3 6 ( 2 0 1 1 ) 8 3 1 6e8 3 2 6 8323
aromatics production yield. As it can be seen in the “Reaction
Kinetics” section, aromatics and hydrogen are mainly
produced via the first endothermic reaction. Higher temper-
ature profile may increase the production yield of these
materials. However, as it can be noticed from the optimization
procedure that, by using lower temperature profile in first
reactor, the production load may be shifted to the second and
third reactors. By using this strategy, fuel depletion in the
second and third reactors, whichmay have higher production
potential due to their operating conditions, can be avoided. In
this way, the amount of produced hydrogen and aromatics in
the first reactor may not be satisfactory, but it may boost the
final production yield.
To justify the optimized temperature profile obtained in
the third case, one should consider the hydrogen removal
along the reactors which have been shown in Fig. 4(a)e(c) for
the second and third cases. Owing to the in situ hydrogen
removal from the reaction side in the third case, a certain
amount of heat is removed which leads to a temperature
reduction. Therefore, the optimized inlet temperature of the
first reactor should be higher compared with the first case.
First, the hydrogen removal increases through the first reactor
slightlywhich leads to temperature reduction as it can be seen
in Fig. 3(b). As the hydrogen removal profile reaches its
0 0.1 0.2 0.3 0.4 0.5 0.6 0.7 0.8 0.9 1
-10
0
10
20
30
40
50
60
70
80
90
Mass of catalyst (Dimensionless)
Per
cent
age
of p
araf
fin
conv
ersi
on
CTR
Case 1
Case 2
Case 3
a b
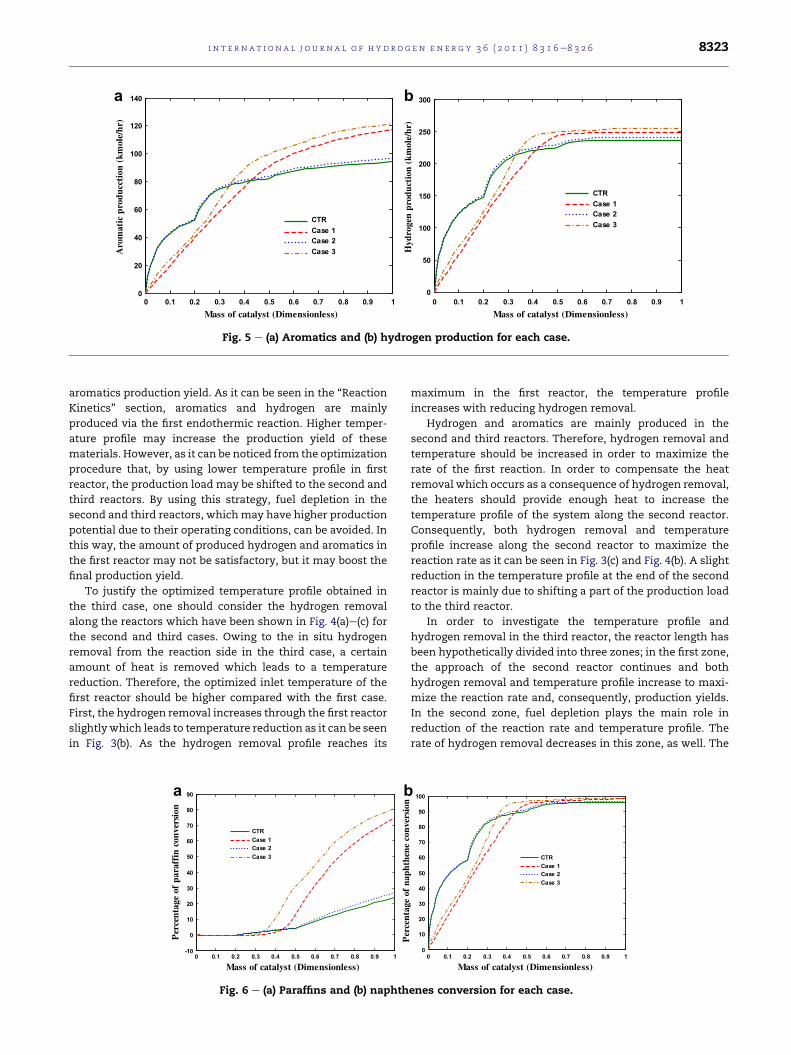
Fig. 6 e (a) Paraffins and (b) naphth
maximum in the first reactor, the temperature profile
increases with reducing hydrogen removal.
Hydrogen and aromatics are mainly produced in the
second and third reactors. Therefore, hydrogen removal and
temperature should be increased in order to maximize the
rate of the first reaction. In order to compensate the heat
removal which occurs as a consequence of hydrogen removal,
the heaters should provide enough heat to increase the
temperature profile of the system along the second reactor.
Consequently, both hydrogen removal and temperature
profile increase along the second reactor to maximize the
reaction rate as it can be seen in Fig. 3(c) and Fig. 4(b). A slight
reduction in the temperature profile at the end of the second
reactor is mainly due to shifting a part of the production load
to the third reactor.
In order to investigate the temperature profile and
hydrogen removal in the third reactor, the reactor length has
been hypothetically divided into three zones; in the first zone,
the approach of the second reactor continues and both
hydrogen removal and temperature profile increase to maxi-
mize the reaction rate and, consequently, production yields.
In the second zone, fuel depletion plays the main role in
reduction of the reaction rate and temperature profile. The
rate of hydrogen removal decreases in this zone, as well. The
0 0.1 0.2 0.3 0.4 0.5 0.6 0.7 0.8 0.9 1
0
10
20
30
40
50
60
70
80
90
100
Mass of catalyst (Dimensionless)
Per
cent
age
of n
apht
hene
con
vers
ion
CTR
Case 1
Case 2
Case 3
enes conversion for each case.
0 0.1 0.2 0.3 0.4 0.5 0.6 0.7 0.8 0.9 1
0
0.02
0.04
0.06
0.08
0.1
0.12
Mass of catalyst (Dimensionless)
CTR
Case 1
Case 2
Case 3N
apht
hene
s de
hydr
ogen
atio
n ra
te (
kmol
e /k
g ca
t. h
r)
0 0.1 0.2 0.3 0.4 0.5 0.6 0.7 0.8 0.9 1
4.5
5
5.5
6
6.5
7
7.5
8
Mass of catalyst (Dimensionless)
H2/H
C m
oalr
rat
io (
kmol
e/hr
) CTR
Case 1
Case 2
Case 3
a b
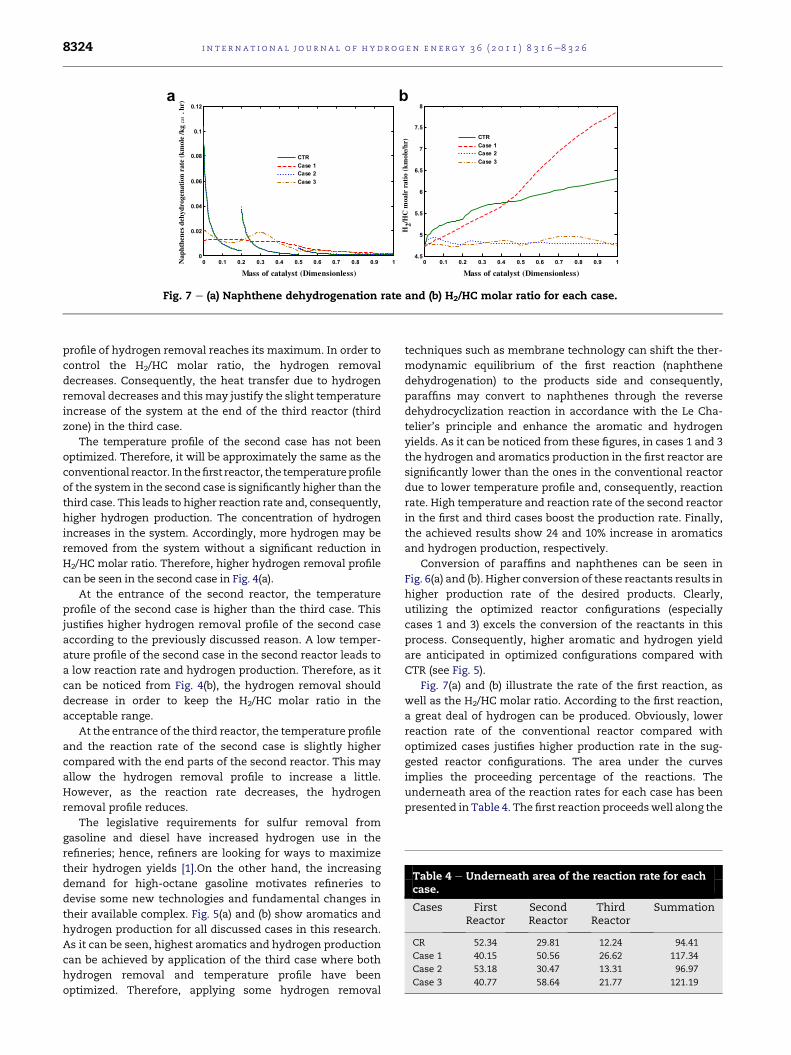
Fig. 7 e (a) Naphthene dehydrogenation rate and (b) H2/HC molar ratio for each case.
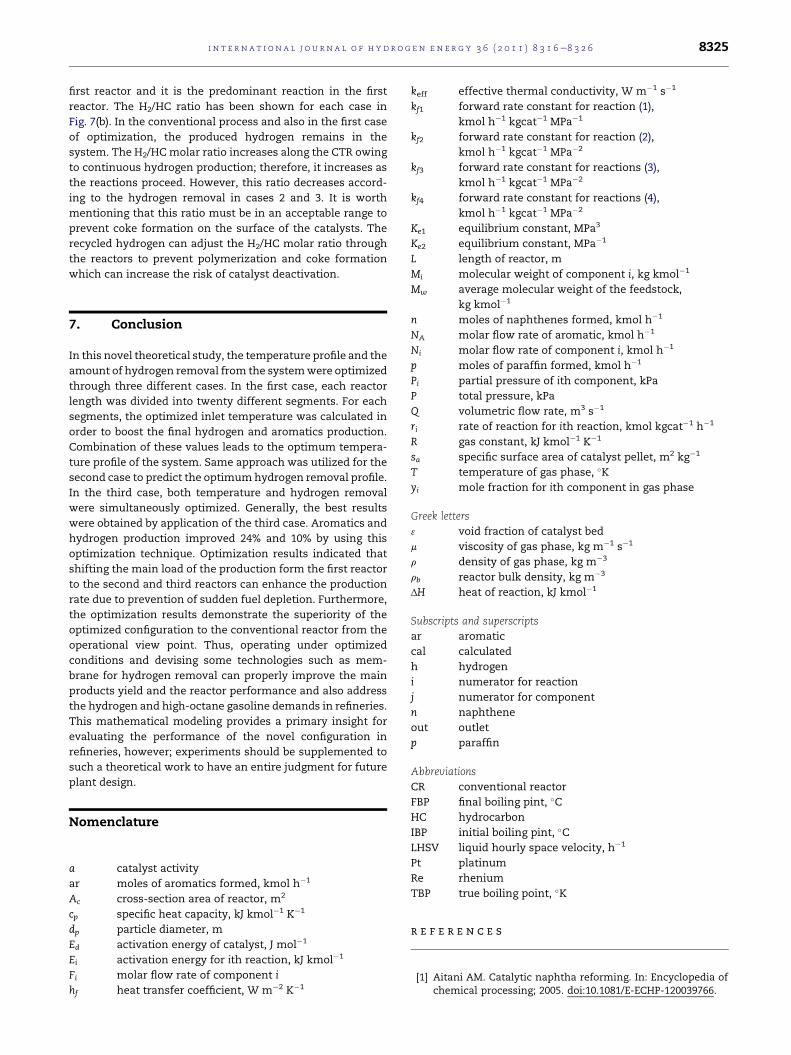
Table 4 e Underneath area of the reaction rate for eachcase.
Cases FirstReactor
SecondReactor
ThirdReactor
Summation
CR 52.34 29.81 12.24 94.41
Case 1 40.15 50.56 26.62 117.34
Case 2 53.18 30.47 13.31 96.97
Case 3 40.77 58.64 21.77 121.19
i n t e rn a t i o n a l j o u r n a l o f h y d r o g e n en e r g y 3 6 ( 2 0 1 1 ) 8 3 1 6e8 3 2 68324
profile of hydrogen removal reaches its maximum. In order to
control the H2/HC molar ratio, the hydrogen removal
decreases. Consequently, the heat transfer due to hydrogen
removal decreases and thismay justify the slight temperature
increase of the system at the end of the third reactor (third
zone) in the third case.
The temperature profile of the second case has not been
optimized. Therefore, it will be approximately the same as the
conventional reactor. In thefirst reactor, the temperatureprofile
of the system in the second case is significantly higher than the
third case. This leads to higher reaction rate and, consequently,
higher hydrogen production. The concentration of hydrogen
increases in the system. Accordingly, more hydrogen may be
removed from the system without a significant reduction in
H2/HC molar ratio. Therefore, higher hydrogen removal profile
can be seen in the second case in Fig. 4(a).
At the entrance of the second reactor, the temperature
profile of the second case is higher than the third case. This
justifies higher hydrogen removal profile of the second case
according to the previously discussed reason. A low temper-
ature profile of the second case in the second reactor leads to
a low reaction rate and hydrogen production. Therefore, as it
can be noticed from Fig. 4(b), the hydrogen removal should
decrease in order to keep the H2/HC molar ratio in the
acceptable range.
At the entrance of the third reactor, the temperature profile
and the reaction rate of the second case is slightly higher
compared with the end parts of the second reactor. This may
allow the hydrogen removal profile to increase a little.
However, as the reaction rate decreases, the hydrogen
removal profile reduces.
The legislative requirements for sulfur removal from
gasoline and diesel have increased hydrogen use in the
refineries; hence, refiners are looking for ways to maximize
their hydrogen yields [1].On the other hand, the increasing
demand for high-octane gasoline motivates refineries to
devise some new technologies and fundamental changes in
their available complex. Fig. 5(a) and (b) show aromatics and
hydrogen production for all discussed cases in this research.
As it can be seen, highest aromatics and hydrogen production
can be achieved by application of the third case where both
hydrogen removal and temperature profile have been
optimized. Therefore, applying some hydrogen removal
techniques such as membrane technology can shift the ther-
modynamic equilibrium of the first reaction (naphthene
dehydrogenation) to the products side and consequently,
paraffins may convert to naphthenes through the reverse
dehydrocyclization reaction in accordance with the Le Cha-
telier’s principle and enhance the aromatic and hydrogen
yields. As it can be noticed from these figures, in cases 1 and 3
the hydrogen and aromatics production in the first reactor are
significantly lower than the ones in the conventional reactor
due to lower temperature profile and, consequently, reaction
rate. High temperature and reaction rate of the second reactor
in the first and third cases boost the production rate. Finally,
the achieved results show 24 and 10% increase in aromatics
and hydrogen production, respectively.
Conversion of paraffins and naphthenes can be seen in
Fig. 6(a) and (b). Higher conversion of these reactants results in
higher production rate of the desired products. Clearly,
utilizing the optimized reactor configurations (especially
cases 1 and 3) excels the conversion of the reactants in this
process. Consequently, higher aromatic and hydrogen yield
are anticipated in optimized configurations compared with
CTR (see Fig. 5).
Fig. 7(a) and (b) illustrate the rate of the first reaction, as
well as the H2/HC molar ratio. According to the first reaction,
a great deal of hydrogen can be produced. Obviously, lower
reaction rate of the conventional reactor compared with
optimized cases justifies higher production rate in the sug-
gested reactor configurations. The area under the curves
implies the proceeding percentage of the reactions. The
underneath area of the reaction rates for each case has been
presented in Table 4. The first reaction proceedswell along the
i n t e r n a t i o n a l j o u r n a l o f h y d r o g e n en e r g y 3 6 ( 2 0 1 1 ) 8 3 1 6e8 3 2 6 8325
first reactor and it is the predominant reaction in the first
reactor. The H2/HC ratio has been shown for each case in
Fig. 7(b). In the conventional process and also in the first case
of optimization, the produced hydrogen remains in the
system. The H2/HCmolar ratio increases along the CTR owing
to continuous hydrogen production; therefore, it increases as
the reactions proceed. However, this ratio decreases accord-
ing to the hydrogen removal in cases 2 and 3. It is worth
mentioning that this ratio must be in an acceptable range to
prevent coke formation on the surface of the catalysts. The
recycled hydrogen can adjust the H2/HC molar ratio through
the reactors to prevent polymerization and coke formation
which can increase the risk of catalyst deactivation.
7. Conclusion
In this novel theoretical study, the temperature profile and the
amount of hydrogen removal from the systemwere optimized
through three different cases. In the first case, each reactor
length was divided into twenty different segments. For each
segments, the optimized inlet temperature was calculated in
order to boost the final hydrogen and aromatics production.
Combination of these values leads to the optimum tempera-
ture profile of the system. Same approach was utilized for the
second case to predict the optimumhydrogen removal profile.
In the third case, both temperature and hydrogen removal
were simultaneously optimized. Generally, the best results
were obtained by application of the third case. Aromatics and
hydrogen production improved 24% and 10% by using this
optimization technique. Optimization results indicated that
shifting the main load of the production form the first reactor
to the second and third reactors can enhance the production
rate due to prevention of sudden fuel depletion. Furthermore,
the optimization results demonstrate the superiority of the
optimized configuration to the conventional reactor from the
operational view point. Thus, operating under optimized
conditions and devising some technologies such as mem-
brane for hydrogen removal can properly improve the main
products yield and the reactor performance and also address
the hydrogen and high-octane gasoline demands in refineries.
This mathematical modeling provides a primary insight for
evaluating the performance of the novel configuration in
refineries, however; experiments should be supplemented to
such a theoretical work to have an entire judgment for future
plant design.
Nomenclature
a catalyst activity
ar moles of aromatics formed, kmol h�1
Ac cross-section area of reactor, m2
cp specific heat capacity, kJ kmol�1 K�1
dp particle diameter, m
Ed activation energy of catalyst, J mol�1
Ei activation energy for ith reaction, kJ kmol�1
Fi molar flow rate of component i
hf heat transfer coefficient, W m�2 K�1
keff effective thermal conductivity, W m�1 s�1
kf1 forward rate constant for reaction (1),
kmol h�1 kgcat�1 MPa�1
kf2 forward rate constant for reaction (2),
kmol h�1 kgcat�1 MPa�2
kf3 forward rate constant for reactions (3),
kmol h�1 kgcat�1 MPa�2
kf4 forward rate constant for reactions (4),
kmol h�1 kgcat�1 MPa�2
Ke1 equilibrium constant, MPa3
Ke2 equilibrium constant, MPa�1
L length of reactor, m
Mi molecular weight of component i, kg kmol�1
Mw average molecular weight of the feedstock,
kg kmol�1
n moles of naphthenes formed, kmol h�1
NA molar flow rate of aromatic, kmol h�1
Ni molar flow rate of component i, kmol h�1
p moles of paraffin formed, kmol h�1
Pi partial pressure of ith component, kPa
P total pressure, kPa
Q volumetric flow rate, m3 s�1
ri rate of reaction for ith reaction, kmol kgcat�1 h�1
R gas constant, kJ kmol�1 K�1
sa specific surface area of catalyst pellet, m2 kg�1
T temperature of gas phase, �Kyi mole fraction for ith component in gas phase
Greek letters
3 void fraction of catalyst bed
m viscosity of gas phase, kg m�1 s�1
r density of gas phase, kg m�3
rb reactor bulk density, kg m�3
ΔH heat of reaction, kJ kmol�1
Subscripts and superscripts
ar aromatic
cal calculated
h hydrogen
i numerator for reaction
j numerator for component
n naphthene
out outlet
p paraffin
Abbreviations
CR conventional reactor
FBP final boiling pint, �CHC hydrocarbon
IBP initial boiling pint, �CLHSV liquid hourly space velocity, h�1
Pt platinum
Re rhenium
TBP true boiling point, �K
r e f e r e n c e s
[1] Aitani AM. Catalytic naphtha reforming. In: Encyclopedia ofchemical processing; 2005. doi:10.1081/E-ECHP-120039766.
i n t e rn a t i o n a l j o u r n a l o f h y d r o g e n en e r g y 3 6 ( 2 0 1 1 ) 8 3 1 6e8 3 2 68326
[2] Smith RB. Kinetic analysis of naphtha reforming withplatinum catalyst. Chem Eng Prog 1959;55(6):76e80.
[3] Juarez JA, Macias EV. Kinetic modeling of naphtha catalyticreforming reactions. Energy Fuels 2000;14:1032e7.
[4] Stijepovic MZ, Ostojic AV, Milenkovic I, Linke P. Developmentof a kinetic model for catalytic reforming of naphtha andparameter estimation using industrial plant data. EnergyFuels 2009;23:979e83.
[5] Ramage MP, Graziani KP, Krambeck FJ. 6 Development ofMobil’s kinetic reforming model. Chem Eng Sci 1980;35:41e8.
[6] Ramage MP, Graziani KR, Schipper PH, Krambeck FJ, Choi BC.A review of Mobil’s industrial process modeling philosophy.Adv Chem Eng 1987;13:193e266.
[7] Krane HG, Groh AB, Schuhnan BL, Sinfeh JH. Reactions incatalytic reforming of naphtha. In: Paper presented in fifthworld petroleum congress; 1960.
[8] Kmak WS. A kinetic simulation model of the power formingprocess. In: AIChE national meeting; 1972.
[9] Li J, Tan Y, Liao L. Modeling and optimization of a semi-regenerative catalytic naphtha reformer. In: Conference oncontrol application; 2005.
[10] Stijepovic MZ, Linke P, Kijevcanin M. Optimization approachfor continuous catalytic regenerative reformer process.Energy Fuels 2010;24:1908e16.
[11] Weifeng H, Hongye S, Shengjing M, Jian C. Multi objectiveoptimization of the industrial naphtha catalytic reformingprocess. Chin J Chem Eng 2007;15(1):75e80.
[12] KhosravanipourMostafazadeh A, Rahimpour MR. Amembrane catalytic bed concept for naphtha reforming inthe presence of catalyst deactivation. Chem Eng Process2009;48:683e94.
[13] Iranshahi D, Rahimpour MR, Asgari A. A novel dynamicradial-flow, spherical-bed reactor concept for naphthareforming in the presence of catalyst deactivation. Int JHydrogen Energy 2010;35:6261e75.
[14] Rahimpour MR, Iranshahi D, Bahmanpour AM. Dynamicoptimization of a multi-stage spherical, radial flow reactorfor the naphtha reforming process in the presence of catalystdeactivation using differential evolution (DE) method. Int JHydrogen Energy 2010;35(14):7498e511.
[15] Iranshahi D, Bahmanpour AM, Pourazadi E, Rahimpour MR.Mathematical modeling of a multi-stage naphtha reformingprocess using novel thermally coupled recuperative reactorsto enhance aromatic production. Int J Hydrogen Energy 2010;35(20):10984e93.
[16] Iranshahi D, Pourazadi E, Paymooni K, Bahmanpour AM,Rahimpour MR, Shariati A. Modeling of an axial flow,spherical packed-bed reactor for naphtha reforming processin the presence of the catalyst deactivation. Int J HydrogenEnergy 2010;35(23):12784e99.
[17] Rahimpour MR, Iranshahi D, Pourazadi E, Bahmanpour AM.A comparative study on a novel combination of sphericaland membrane tubular reactors of the catalytic naphthareforming process. Int J Hydrogen Energy 2011;36(1):505e17.
[18] Rahimpour MR, Vakili R, Pourazadi E, Iranshahi D,Paymooni K. A novel integrated, thermally coupled fluidizedbed configuration for catalytic naphtha reforming to
enhance aromatic and hydrogen productions in refineries.Int J Hydrogen Energy 2011;36(4):2979e91.
[19] Iranshahi D, Pourazadi E, Bahmanpour AM, Rahimpour MR.A comparison of two different flow types on performance ofa thermally coupled recuperative reactor containing naphthareforming process and hydrogenation of nitrobenzene. Int JHydrogen Energy 2011;36(5):3483e95.
[20] Iranshahi D, Pourazadi E, Paymooni K, Rahimpour MR.Enhancement of aromatic production in naphtha reformingprocess by simultaneous operation of isothermal andadiabatic reactors. Int J Hydrogen Energy 2011;36(3):2076e85.
[21] Onozaki M, Watanabe K, Hashimoto T, Saegusa H,Katayama Y. Fuel 2006;85:143e9.
[22] Alves JJ, Towler GP. Analysis of refinery hydrogendistribution systems. Ind Eng Chem Res 2002;41(23):5759e69.
[23] Hallale N, Moore I, Vauk D. Hydrogen: liability or asset. ChemEng Prog 2002;98(9):66e75.
[24] Liu F, Zhang N. Strategy of purifier selection and integrationin hydrogen networks. ChemEng Res Des 2004;82:1315e30.
[25] Kirkpatrik S, Gelatt CD, Vechhi MP. Optimization bysimulated annealing. Science 1983;220(4568):671e80.
[26] Schwefel HP. Numerical optimization of computer models.New York: John Wiley & Sons; 1981.
[27] Goldberg DE. Genetic algorithms in search, optimization, andmachine learning. Reading, MA: Addison-Wesley; 1989.
[28] Davis L. Handbook of genetic algorithms. New York: VanNostrand Reinhold; 1991.
[29] Price K, Storn R. Differential evolution e a simple evolutionstrategy for fast optimization. Dr. Dobb’s J 1997;22:18e24.
[30] Babu BV, Angira R. Modified differential evolution (MDE) foroptimization of non-linear chemical processes. ComputChem Eng 2006;30(6e7):989e1002.
[31] Babu BV, Khan M. Optimization of reactive distillationprocesses using differential evolution strategies. Asia-PacificJ ChemEng 2007;2(4):322e35.
[32] Fang Q, Chen D, Yu H, Wu X. Differential evolution algorithmbased on eugenic strategy and its application to chemicalengineering. Huagong Xuebao/J Chem Industa Eng 2004;55(4):598e602.
[33] Ponsich A, Coello CAC. Differential evolution performancesfor the solution of mixed-integer constrained processengineering problems. Appl Soft Comput J 2011;11(1):399e409.
[34] Angira R, Santosh A. A modified trigonometric differentialevolution algorithm for optimization of dynamic systems2008. IEEE Congress on Evolutionary Computation, CEC; 2008.Article number 4630986. pp. 1463e8.
[35] Rase HF. Chemical reactor design for process plants. JohnWiley & Sons Inc; 1977.
[36] JessA,HeinO, KernC.Deactivation anddecoking of a naphthareforming catalyst. Stud Surf Sci Catal 1999;126:81e8.
[37] Behin J, Kavianpour HR. A comparative study for thesimulation of industrial naphtha reforming reactors withcorresponding pressure drop on catalyst. Pet Coal 2009;51(3):208e15.
[38] Rahimpour MR. Operability of an industrial catalytic naphthareformer in the presence of catalyst deactivation. Chem EngTechnol 2006;5:29.
Top Related
Copyright © 2022 FDOKUMEN

