


Bahasa
Halaman
Hukum

Shear wave anisotropy in the upper mantle beneath the Aegean
related to internal deformation
D. Hatzfeld,1 E. Karagianni,2 I. Kassaras,3 A. Kiratzi,2 E. Louvari,2 H. Lyon-Caen,4
K. Makropoulos,3 P. Papadimitriou,3 G. Bock,5 and K. Priestley6
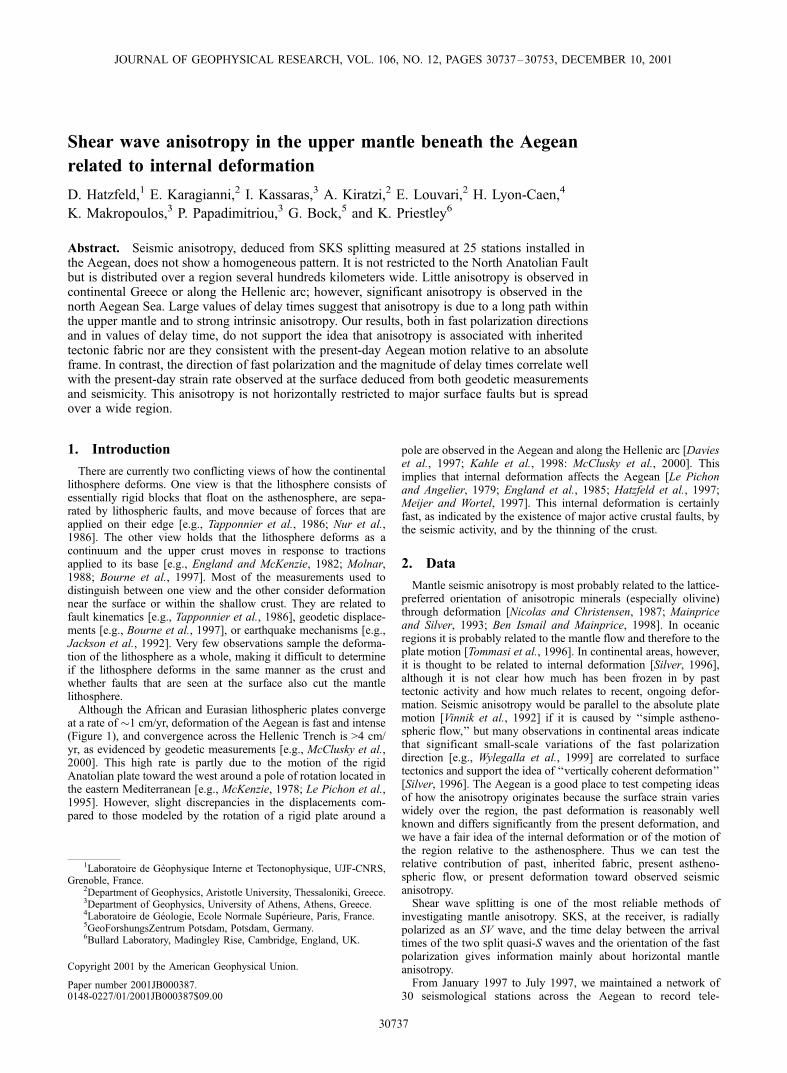
Abstract. Seismic anisotropy, deduced from SKS splitting measured at 25 stations installed inthe Aegean, does not show a homogeneous pattern. It is not restricted to the North Anatolian Faultbut is distributed over a region several hundreds kilometers wide. Little anisotropy is observed incontinental Greece or along the Hellenic arc; however, significant anisotropy is observed in thenorth Aegean Sea. Large values of delay times suggest that anisotropy is due to a long path withinthe upper mantle and to strong intrinsic anisotropy. Our results, both in fast polarization directionsand in values of delay time, do not support the idea that anisotropy is associated with inheritedtectonic fabric nor are they consistent with the present-day Aegean motion relative to an absoluteframe. In contrast, the direction of fast polarization and the magnitude of delay times correlate wellwith the present-day strain rate observed at the surface deduced from both geodetic measurementsand seismicity. This anisotropy is not horizontally restricted to major surface faults but is spreadover a wide region.
1. Introduction
There are currently two conflicting views of how the continentallithosphere deforms. One view is that the lithosphere consists ofessentially rigid blocks that float on the asthenosphere, are sepa-rated by lithospheric faults, and move because of forces that areapplied on their edge [e.g., Tapponnier et al., 1986; Nur et al.,1986]. The other view holds that the lithosphere deforms as acontinuum and the upper crust moves in response to tractionsapplied to its base [e.g., England and McKenzie, 1982; Molnar,1988; Bourne et al., 1997]. Most of the measurements used todistinguish between one view and the other consider deformationnear the surface or within the shallow crust. They are related tofault kinematics [e.g., Tapponnier et al., 1986], geodetic displace-ments [e.g., Bourne et al., 1997], or earthquake mechanisms [e.g.,Jackson et al., 1992]. Very few observations sample the deforma-tion of the lithosphere as a whole, making it difficult to determineif the lithosphere deforms in the same manner as the crust andwhether faults that are seen at the surface also cut the mantlelithosphere.Although the African and Eurasian lithospheric plates converge
at a rate of �1 cm/yr, deformation of the Aegean is fast and intense(Figure 1), and convergence across the Hellenic Trench is >4 cm/yr, as evidenced by geodetic measurements [e.g., McClusky et al.,2000]. This high rate is partly due to the motion of the rigidAnatolian plate toward the west around a pole of rotation located inthe eastern Mediterranean [e.g., McKenzie, 1978; Le Pichon et al.,1995]. However, slight discrepancies in the displacements com-pared to those modeled by the rotation of a rigid plate around a
pole are observed in the Aegean and along the Hellenic arc [Davieset al., 1997; Kahle et al., 1998: McClusky et al., 2000]. Thisimplies that internal deformation affects the Aegean [Le Pichonand Angelier, 1979; England et al., 1985; Hatzfeld et al., 1997;Meijer and Wortel, 1997]. This internal deformation is certainlyfast, as indicated by the existence of major active crustal faults, bythe seismic activity, and by the thinning of the crust.
2. Data
Mantle seismic anisotropy is most probably related to the lattice-preferred orientation of anisotropic minerals (especially olivine)through deformation [Nicolas and Christensen, 1987; Mainpriceand Silver, 1993; Ben Ismail and Mainprice, 1998]. In oceanicregions it is probably related to the mantle flow and therefore to theplate motion [Tommasi et al., 1996]. In continental areas, however,it is thought to be related to internal deformation [Silver, 1996],although it is not clear how much has been frozen in by pasttectonic activity and how much relates to recent, ongoing defor-mation. Seismic anisotropy would be parallel to the absolute platemotion [Vinnik et al., 1992] if it is caused by ‘‘simple astheno-spheric flow,’’ but many observations in continental areas indicatethat significant small-scale variations of the fast polarizationdirection [e.g., Wylegalla et al., 1999] are correlated to surfacetectonics and support the idea of ‘‘vertically coherent deformation’’[Silver, 1996]. The Aegean is a good place to test competing ideasof how the anisotropy originates because the surface strain varieswidely over the region, the past deformation is reasonably wellknown and differs significantly from the present deformation, andwe have a fair idea of the internal deformation or of the motion ofthe region relative to the asthenosphere. Thus we can test therelative contribution of past, inherited fabric, present astheno-spheric flow, or present deformation toward observed seismicanisotropy.Shear wave splitting is one of the most reliable methods of
investigating mantle anisotropy. SKS, at the receiver, is radiallypolarized as an SV wave, and the time delay between the arrivaltimes of the two split quasi-S waves and the orientation of the fastpolarization gives information mainly about horizontal mantleanisotropy.From January 1997 to July 1997, we maintained a network of
30 seismological stations across the Aegean to record tele-
JOURNAL OF GEOPHYSICAL RESEARCH, VOL. 106, NO. 12, PAGES 30737–30753, DECEMBER 10, 2001
1Laboratoire de Geophysique Interne et Tectonophysique, UJF-CNRS,Grenoble, France.
2Department of Geophysics, Aristotle University, Thessaloniki, Greece.3Department of Geophysics, University of Athens, Athens, Greece.4Laboratoire de Geologie, Ecole Normale Superieure, Paris, France.5GeoForshungsZentrum Potsdam, Potsdam, Germany.6Bullard Laboratory, Madingley Rise, Cambridge, England, UK.
Copyright 2001 by the American Geophysical Union.
Paper number 2001JB000387.0148-0227/01/2001JB000387$09.00
30737
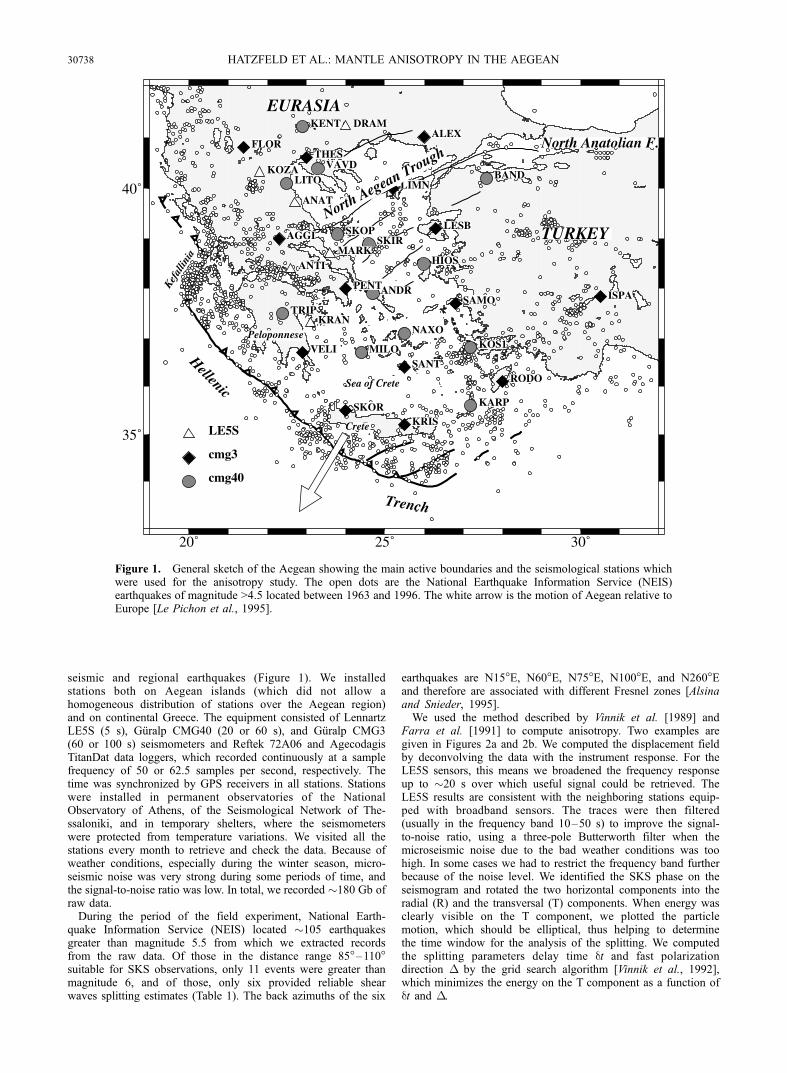
seismic and regional earthquakes (Figure 1). We installedstations both on Aegean islands (which did not allow ahomogeneous distribution of stations over the Aegean region)and on continental Greece. The equipment consisted of LennartzLE5S (5 s), Guralp CMG40 (20 or 60 s), and Guralp CMG3(60 or 100 s) seismometers and Reftek 72A06 and AgecodagisTitanDat data loggers, which recorded continuously at a samplefrequency of 50 or 62.5 samples per second, respectively. Thetime was synchronized by GPS receivers in all stations. Stationswere installed in permanent observatories of the NationalObservatory of Athens, of the Seismological Network of The-ssaloniki, and in temporary shelters, where the seismometerswere protected from temperature variations. We visited all thestations every month to retrieve and check the data. Because ofweather conditions, especially during the winter season, micro-seismic noise was very strong during some periods of time, andthe signal-to-noise ratio was low. In total, we recorded �180 Gb ofraw data.During the period of the field experiment, National Earth-
quake Information Service (NEIS) located �105 earthquakesgreater than magnitude 5.5 from which we extracted recordsfrom the raw data. Of those in the distance range 85�–110�suitable for SKS observations, only 11 events were greater thanmagnitude 6, and of those, only six provided reliable shearwaves splitting estimates (Table 1). The back azimuths of the six
earthquakes are N15�E, N60�E, N75�E, N100�E, and N260�Eand therefore are associated with different Fresnel zones [Alsinaand Snieder, 1995].We used the method described by Vinnik et al. [1989] and
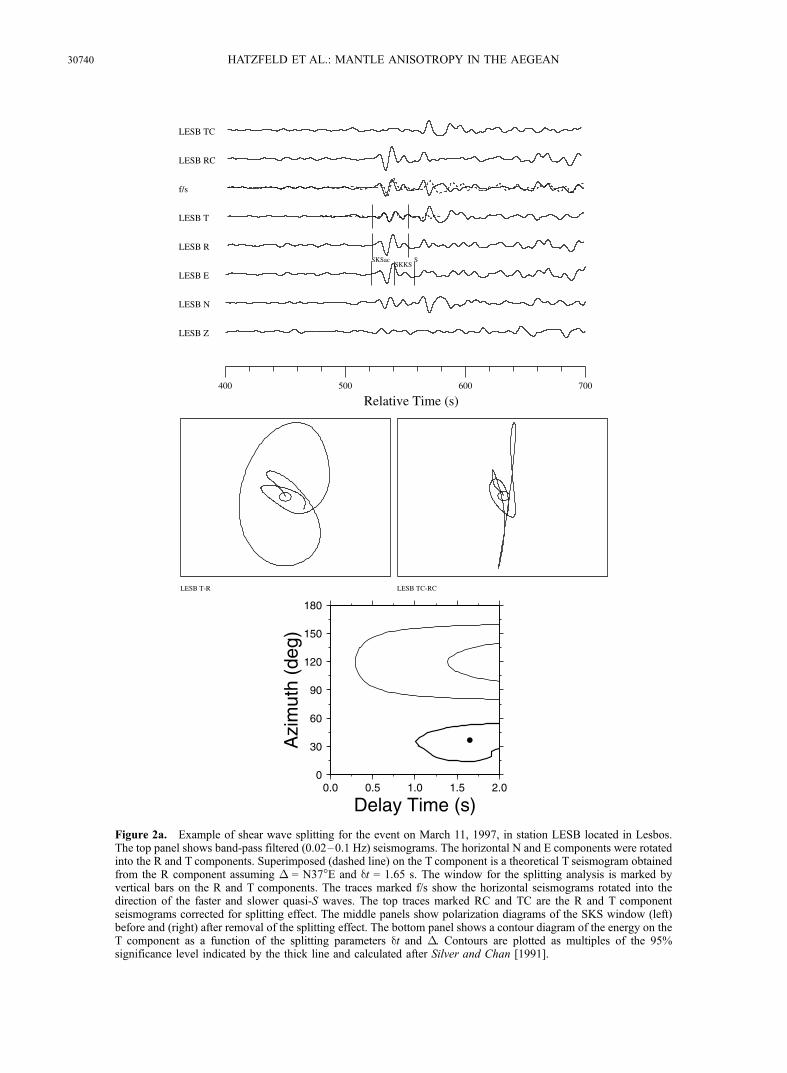
Farra et al. [1991] to compute anisotropy. Two examples aregiven in Figures 2a and 2b. We computed the displacement fieldby deconvolving the data with the instrument response. For theLE5S sensors, this means we broadened the frequency responseup to �20 s over which useful signal could be retrieved. TheLE5S results are consistent with the neighboring stations equip-ped with broadband sensors. The traces were then filtered(usually in the frequency band 10–50 s) to improve the signal-to-noise ratio, using a three-pole Butterworth filter when themicroseismic noise due to the bad weather conditions was toohigh. In some cases we had to restrict the frequency band furtherbecause of the noise level. We identified the SKS phase on theseismogram and rotated the two horizontal components into theradial (R) and the transversal (T) components. When energy wasclearly visible on the T component, we plotted the particlemotion, which should be elliptical, thus helping to determinethe time window for the analysis of the splitting. We computedthe splitting parameters delay time dt and fast polarizationdirection � by the grid search algorithm [Vinnik et al., 1992],which minimizes the energy on the T component as a function ofdt and �.
20˚ 25˚ 30˚
35˚
40˚
LE5S
cmg3
cmg40
AGGI
ALEX
ANAT
ANDR
ANTI
NAXO
RODO
BAND
DRAM
FLOR
SKOR
HIOS
KARP
KENT
KOS1
KRAN
KOZA
KRIS
LITO LIMN
MARK
MILO
LESB
PENT
SKIRSKOP
SAMO
THES
SANT
TRIP
VAVD
VELI
ISPA
North Anatolian F.
NorthAegean Trough
Hellenic
Trench
Kefal
linia
EURASIA
TURKEY
Crete
Peloponnese
Sea of CreteSea of CreteSea of CreteSea of CreteSea of Crete
Figure 1. General sketch of the Aegean showing the main active boundaries and the seismological stations whichwere used for the anisotropy study. The open dots are the National Earthquake Information Service (NEIS)earthquakes of magnitude >4.5 located between 1963 and 1996. The white arrow is the motion of Aegean relative toEurope [Le Pichon et al., 1995].
30738 HATZFELD ET AL.: MANTLE ANISOTROPY IN THE AEGEAN
The reliability of the result is estimated in three ways: (1)from the visual fit of the theoretical T component seismogramcalculated with the estimated splitting parameters from theobserved R component, (2) from the energy reduction on Tafter correction for splitting, which should be >50%, and (3)from the signal-to-noise ratio of the SKS phase on R, whichshould be >3. We assigned a quality factor to each measure-ment of either good or fair that depended on the uncertaintyboth in � and dt: good when errors in � were <20� and thosein dt were <0.3 s and fair when errors in � were <45� andthose in dt were <0.5 s. A low reduction value usually indicatessmall or null splitting and is considered reliable only if thesignal-to-noise ratio is >5 on the R component. Then, for each
station, we computed a weighted average (depending on therespective uncertainties in dt and in �) of the individual nonnullvalues.
3. Results
The results consist of two parameters: the time delay dt andthe polarization direction � of the faster of the two quasi-Swaves (Table 2 and Figure 3). In total, we estimated 150splitting parameters from data of six earthquakes. We comple-mented these results with SKS splitting measurements (Table 3)for records obtained from temporary GEOFON stations in the
Table 1. Earthquake Parameters
Number Date Time, UTLatitude,
�NLongitude,
�E MagnitudeDepth,km
BackAzimuth
�,deg
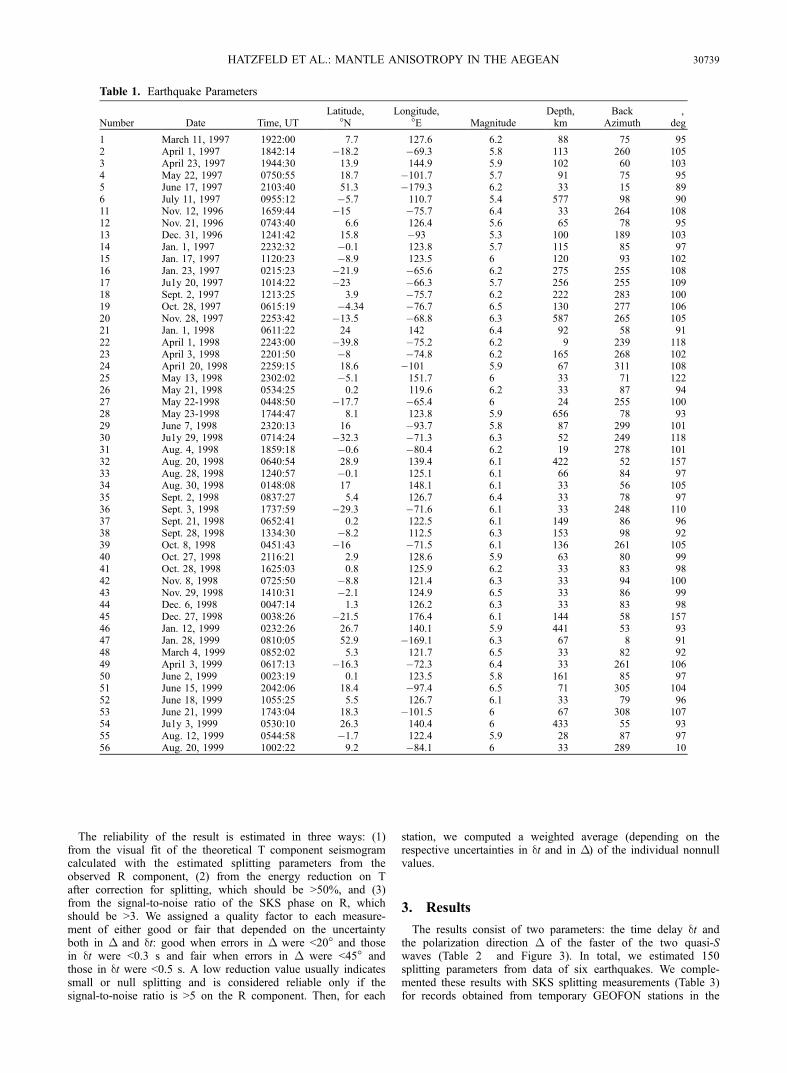
1 March 11, 1997 1922:00 7.7 127.6 6.2 88 75 952 April 1, 1997 1842:14 �18.2 �69.3 5.8 113 260 1053 April 23, 1997 1944:30 13.9 144.9 5.9 102 60 1034 May 22, 1997 0750:55 18.7 �101.7 5.7 91 75 955 June 17, 1997 2103:40 51.3 �179.3 6.2 33 15 896 July 11, 1997 0955:12 �5.7 110.7 5.4 577 98 9011 Nov. 12, 1996 1659:44 �15 �75.7 6.4 33 264 10812 Nov. 21, 1996 0743:40 6.6 126.4 5.6 65 78 9513 Dec. 31, 1996 1241:42 15.8 �93 5.3 100 189 10314 Jan. 1, 1997 2232:32 �0.1 123.8 5.7 115 85 9715 Jan. 17, 1997 1120:23 �8.9 123.5 6 120 93 10216 Jan. 23, 1997 0215:23 �21.9 �65.6 6.2 275 255 10817 Ju1y 20, 1997 1014:22 �23 �66.3 5.7 256 255 10918 Sept. 2, 1997 1213:25 3.9 �75.7 6.2 222 283 10019 Oct. 28, 1997 0615:19 �4.34 �76.7 6.5 130 277 10620 Nov. 28, 1997 2253:42 �13.5 �68.8 6.3 587 265 10521 Jan. 1, 1998 0611:22 24 142 6.4 92 58 9122 April 1, 1998 2243:00 �39.8 �75.2 6.2 9 239 11823 April 3, 1998 2201:50 �8 �74.8 6.2 165 268 10224 Apri1 20, 1998 2259:15 18.6 �101 5.9 67 311 10825 May 13, 1998 2302:02 �5.1 151.7 6 33 71 12226 May 21, 1998 0534:25 0.2 119.6 6.2 33 87 9427 May 22-1998 0448:50 �17.7 �65.4 6 24 255 10028 May 23-1998 1744:47 8.1 123.8 5.9 656 78 9329 June 7, 1998 2320:13 16 �93.7 5.8 87 299 10130 Ju1y 29, 1998 0714:24 �32.3 �71.3 6.3 52 249 11831 Aug. 4, 1998 1859:18 �0.6 �80.4 6.2 19 278 10132 Aug. 20, 1998 0640:54 28.9 139.4 6.1 422 52 15733 Aug. 28, 1998 1240:57 �0.1 125.1 6.1 66 84 9734 Aug. 30, 1998 0148:08 17 148.1 6.1 33 56 10535 Sept. 2, 1998 0837:27 5.4 126.7 6.4 33 78 9736 Sept. 3, 1998 1737:59 �29.3 �71.6 6.1 33 248 11037 Sept. 21, 1998 0652:41 0.2 122.5 6.1 149 86 9638 Sept. 28, 1998 1334:30 �8.2 112.5 6.3 153 98 9239 Oct. 8, 1998 0451:43 �16 �71.5 6.1 136 261 10540 Oct. 27, 1998 2116:21 2.9 128.6 5.9 63 80 9941 Oct. 28, 1998 1625:03 0.8 125.9 6.2 33 83 9842 Nov. 8, 1998 0725:50 �8.8 121.4 6.3 33 94 10043 Nov. 29, 1998 1410:31 �2.1 124.9 6.5 33 86 9944 Dec. 6, 1998 0047:14 1.3 126.2 6.3 33 83 9845 Dec. 27, 1998 0038:26 �21.5 176.4 6.1 144 58 15746 Jan. 12, 1999 0232:26 26.7 140.1 5.9 441 53 9347 Jan. 28, 1999 0810:05 52.9 �169.1 6.3 67 8 9148 March 4, 1999 0852:02 5.3 121.7 6.5 33 82 9249 Apri1 3, 1999 0617:13 �16.3 �72.3 6.4 33 261 10650 June 2, 1999 0023:19 0.1 123.5 5.8 161 85 9751 June 15, 1999 2042:06 18.4 �97.4 6.5 71 305 10452 June 18, 1999 1055:25 5.5 126.7 6.1 33 79 9653 June 21, 1999 1743:04 18.3 �101.5 6 67 308 10754 Ju1y 3, 1999 0530:10 26.3 140.4 6 433 55 9355 Aug. 12, 1999 0544:58 �1.7 122.4 5.9 28 87 9756 Aug. 20, 1999 1002:22 9.2 �84.1 6 33 289 10
HATZFELD ET AL.: MANTLE ANISOTROPY IN THE AEGEAN 30739
400 500 600 700
LESB Z
LESB N
LESB E
LESB R
LESB T
f/s
LESB RC
LESB TC
Relative Time (s)
SSKSacSKKS
LESB T-R LESB TC-RC
0
30
60
90
120
150
180
Azi
mut
h (d
eg)
0.0 0.5 1.0 1.5 2.0
Delay Time (s)Figure 2a. Example of shear wave splitting for the event on March 11, 1997, in station LESB located in Lesbos.The top panel shows band-pass filtered (0.02–0.1 Hz) seismograms. The horizontal N and E components were rotatedinto the R and T components. Superimposed (dashed line) on the T component is a theoretical T seismogram obtainedfrom the R component assuming � = N37�E and dt = 1.65 s. The window for the splitting analysis is marked byvertical bars on the R and T components. The traces marked f/s show the horizontal seismograms rotated into thedirection of the faster and slower quasi-S waves. The top traces marked RC and TC are the R and T componentseismograms corrected for splitting effect. The middle panels show polarization diagrams of the SKS window (left)before and (right) after removal of the splitting effect. The bottom panel shows a contour diagram of the energy on theT component as a function of the splitting parameters dt and �. Contours are plotted as multiples of the 95%significance level indicated by the thick line and calculated after Silver and Chan [1991].
30740 HATZFELD ET AL.: MANTLE ANISOTROPY IN THE AEGEAN
50 100 150 200 250 300 350
SAMO Z
SAMO N
SAMO E
SAMO R
SAMO T
SAMO Z
SAMO N
SAMO E
SAMO R
SAMO T
Relative Time (s)
SdiffSKSac
SKKSac
SAMO T-R SAMO TC-RC
SAMO T-R SAMO TC-RC
0
30
60
90
120
150
180
Azi
mut
h (d
eg)
0.0 0.5 1.0 1.5 2.0
Delay Time (s)
0
30
60
90
120
150
180
Azi
mut
h (d
eg)
0.0 0.5 1.0 1.5 2.0
Delay Time (s)
Broadband Broadband
BP 10-50 sec BP 10-50 sec
Broadband BP 10-50 sec
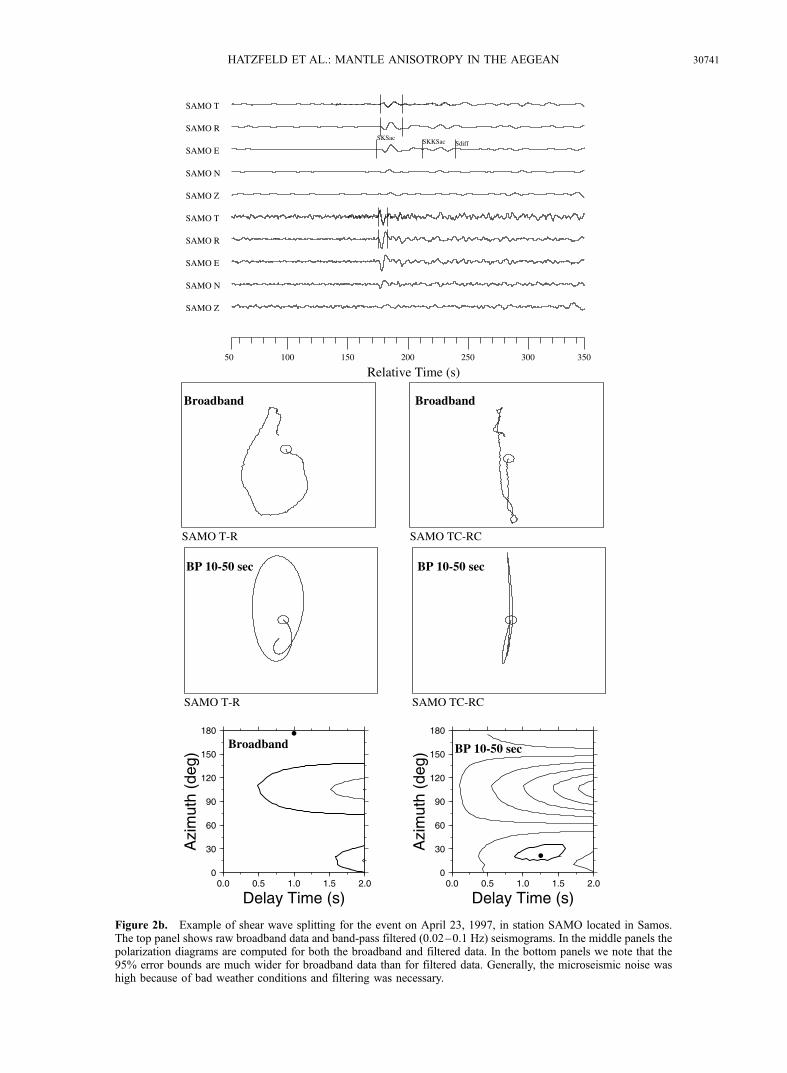
Figure 2b. Example of shear wave splitting for the event on April 23, 1997, in station SAMO located in Samos.The top panel shows raw broadband data and band-pass filtered (0.02–0.1 Hz) seismograms. In the middle panels thepolarization diagrams are computed for both the broadband and filtered data. In the bottom panels we note that the95% error bounds are much wider for broadband data than for filtered data. Generally, the microseismic noise washigh because of bad weather conditions and filtering was necessary.
HATZFELD ET AL.: MANTLE ANISOTROPY IN THE AEGEAN 30741

Table 2. Anisotropy Parameters Obtained During the Aegean Experiment
Station �a s�b dc sdd mpf e Filtersf Remark Event
AGGI 39 17 0.4 0.3 41 10–50 good 1AGGIg 176g 45g 0.1g 0.5g 99g 10–50g good nullg 2g
AGGI 27 16 0.6 0.2 40 raw good 3AGGI 16 20 0.3 0.2 43 >3 good 4AGGIg 90g 45g 0.5g 0.5g 97g >2g fair nullg 5g
AGGIg 83g 45g 0.05g 0.5g 99g 10–50g good nullg 6g
AGGIh 28h 10h 0.44h 0.13h
ALEX 1 45 1.05 0.5 55 raw fair 1ALEX 4 45 1.55 0.5 72 >3 fair 2ALEX 0 45 1.8 0.5 43 >3 fair 3ALEX 24 45 1.3 0.5 70 >3 fair 4ALEX 42 16 0.4 0.2 34 3–20 good 6ALEXh 30h 13h 0.8h 0.15h
ANAT 134 20 0.65 0.5 59 3–20 fair 1ANATg 142g 45g 0.9g 0.5g 92g rawg good nullg 3g
ANAT 156 45 0.85 0.5 70 >2 fair 4ANATg 108g 45g 1.3g 0.5g 91g >2g fair nullg 5g
ANATg 145g 45g 0.25g 0.5g 80g >2g fair nullg 6g
ANATh 137h 18h 0.75h 0.35h
ANDRg 90g 45g 0.95g 0.5g 77g >3g fair nullg 5g
ANDRg 11g 45g 0.35g 0.5g 99g >2g good nullg 6g
BANDh 21h 45h 1.1h 0.5h 46h >5h goodh 3h
HIOS 37 45 0.8 0.5 65 10–50 fair 1HIOS 58 45 1.35 0.5 76 10–50 fair 2HIOS 26 45 1.85 0.5 37 10–50 fair 3HIOSg 29g 45g 1.15g 0.5g 87g >3g good nullg 4g
HIOSg 20g 45g 0.95g 0.5g 99g 10–50g fair nullg 5g
HIOSg 102g 45g 1.1g 0.5g 94g 3–20g good nullg 6g
HIOSh 40h 26h 1.33h 0.29h
DRAMh 40h 17h 0.6h 0.3h 45h 10–20h goodh 1h
FLORg 99g 45g 0.15g 0.5g 82g 10–50g good nullg 1g
FLORg 157g 45g 0.85g 0.5g 86g >3g good nullg 2g
FLOR 22 20 0.4 0.5 50 10–50 fair 3FLOR 145 45 0.55 0.5 40 >2 fair 4FLOR 177 20 1.35 0.5 58 >2 fair 5FLOR 130 12 0.45 0.1 41 3–20 good 6FLORh 154h 9h 0.48h 0.09h
KARP 2 45 0.7 0.5 57 10–50 fair 1KARPg 163g 45g 0.5g 0.5g 99g 10–50g fair nullg 2g
KARP 177 45 0.8 0.5 64 raw fair 3KARP 24 16 1.15 0.4 52 >3 fair 4KARPg 36g 45g 0.5g 0.5g 85g 10–50g good nullg 5g
KARP 38 45 0.25 0.5 45 >2 fair 6KARPh 21h 14h 0.77h 0.23h
KENTg 180g 45g 1g 0.5g 65g 10–50g fair nullg 1g
KENTg 157g 45g 0.3g 0.5g 75g <10g fair nullg 4g
KOS1 43 15 0.65 0.2 32 10–50 good 1KOS1g 174g 45g 2.7g 0.5g 97g 10–50g fair nullg 2g
KOS1 154 45 0.75 0.5 48 >3 fair 4KOS1h 54h 14h 0.66h 0.18h
KOZAg 79g 45g 1.1g 0.5g 88g 3–20g fair nullg 1g
KOZA 156 10 0.75 0.25 38 >3 good 4KOZA 160 45 0.4 0.5 74 2–10 fair 6KOZAh 156h 10h 0.68h 0.22h
LESB 37 15 1.65 0.3 41 10–50 good 1LESBg 125g 45g 0.6g 0.5g 95g >3g good nullg 4g
LESB 45 7.5 1.55 0.3 43 10–50 good 5LESB 12 45 1.25 0.5 79 >3 fair 6LESBh 42h 6h 1.5h 0.18h
LIMN 11 45 2 0.7 53 10–50 fair 1LIMN 49 20 1.1 0.4 58 10–50 fair 2LIMN 25 45 2.2 0.7 44 10–50 fair 3LIMN 18 45 0.9 0.5 74 >3 fair 4LIMN 35 16 1.2 0.5 59 10–50 good 5LIMNg 257g 45g 0.35g 0.5g 77g 3–20g fair nullg 6g
LIMNh 36h 11h 1.3h 0.23h
LITOg 150g 45v 1.45g 0.5g 76g 10–50g fair nullg 1g
LITOg 152g 45g 2.8g 0.7v 91g 10–50g fair nullg 2g
LITOg 137g 45g 1.3v 0.5g 88g 10–20g fair nullg 3g
LITOg 136g 45g 0.45g 0.5g 90g >3g good nullg 4g
MILO 11 20 0.55 0.45 45 10–20 good 1MILOg 72g 45g 0.4g 0.5g 99g 10–20g good nullg 2g
MILO 170 17 0.55 0.4 53 5–50 fair 3
30742 HATZFELD ET AL.: MANTLE ANISOTROPY IN THE AEGEAN
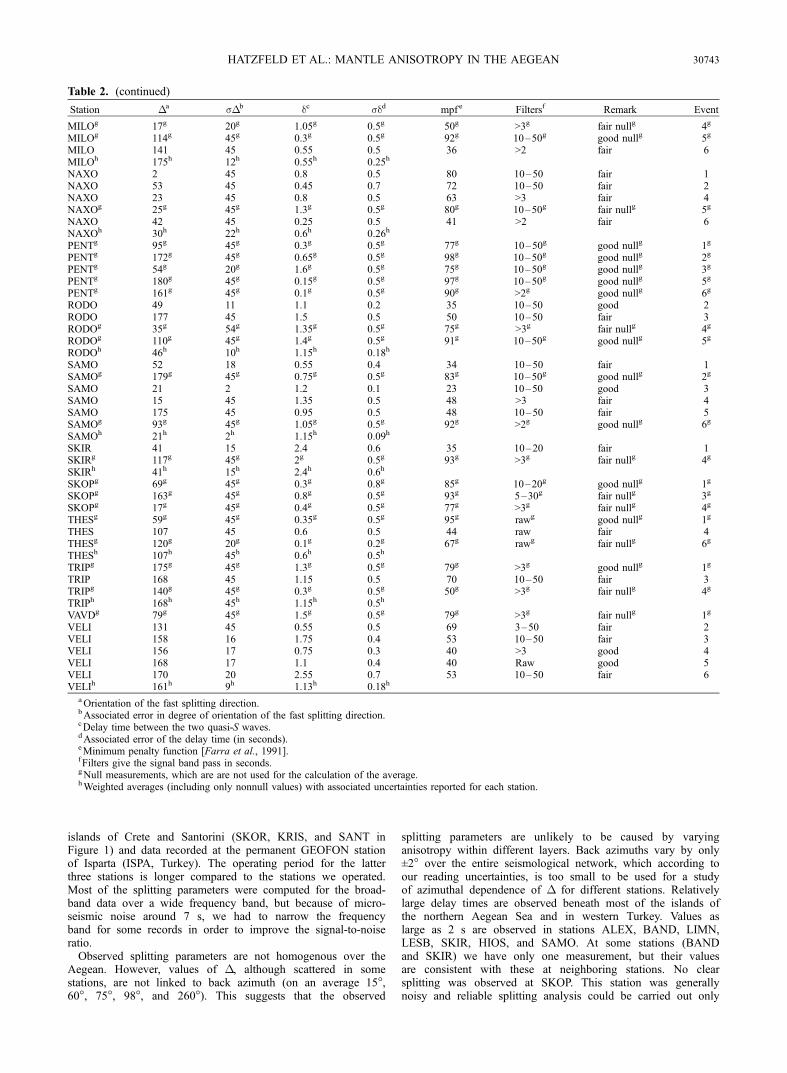
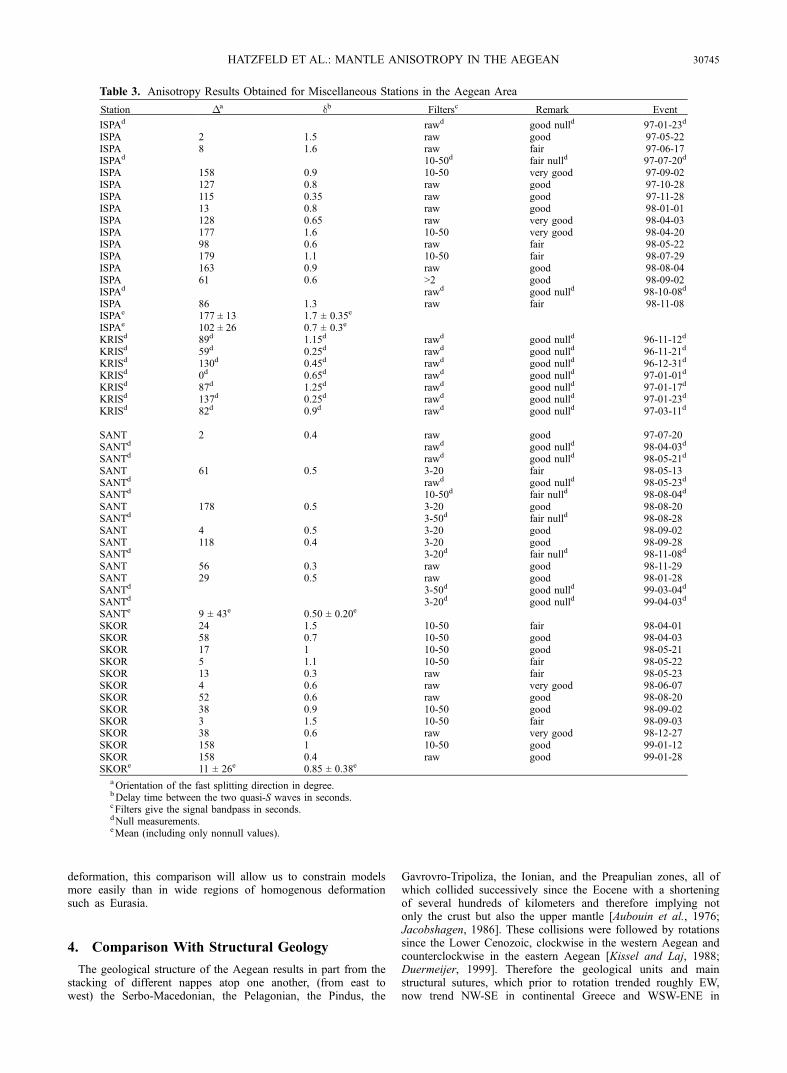
islands of Crete and Santorini (SKOR, KRIS, and SANT inFigure 1) and data recorded at the permanent GEOFON stationof Isparta (ISPA, Turkey). The operating period for the latterthree stations is longer compared to the stations we operated.Most of the splitting parameters were computed for the broad-band data over a wide frequency band, but because of micro-seismic noise around 7 s, we had to narrow the frequencyband for some records in order to improve the signal-to-noiseratio.Observed splitting parameters are not homogenous over the
Aegean. However, values of �, although scattered in somestations, are not linked to back azimuth (on an average 15�,60�, 75�, 98�, and 260�). This suggests that the observed
splitting parameters are unlikely to be caused by varyinganisotropy within different layers. Back azimuths vary by only±2� over the entire seismological network, which according toour reading uncertainties, is too small to be used for a studyof azimuthal dependence of � for different stations. Relativelylarge delay times are observed beneath most of the islands ofthe northern Aegean Sea and in western Turkey. Values aslarge as 2 s are observed in stations ALEX, BAND, LIMN,LESB, SKIR, HIOS, and SAMO. At some stations (BANDand SKIR) we have only one measurement, but their valuesare consistent with these at neighboring stations. No clearsplitting was observed at SKOP. This station was generallynoisy and reliable splitting analysis could be carried out only
Table 2. (continued)
Station �a s�b dc sdd mpf e Filtersf Remark Event
MILOg 17g 20g 1.05g 0.5g 50g >3g fair nullg 4g
MILOg 114g 45g 0.3g 0.5g 92g 10–50g good nullg 5g
MILO 141 45 0.55 0.5 36 >2 fair 6MILOh 175h 12h 0.55h 0.25h
NAXO 2 45 0.8 0.5 80 10–50 fair 1NAXO 53 45 0.45 0.7 72 10–50 fair 2NAXO 23 45 0.8 0.5 63 >3 fair 4NAXOg 25g 45g 1.3g 0.5g 80g 10–50g fair nullg 5g
NAXO 42 45 0.25 0.5 41 >2 fair 6NAXOh 30h 22h 0.6h 0.26h
PENTg 95g 45g 0.3g 0.5g 77g 10–50g good nullg 1g
PENTg 172g 45g 0.65g 0.5g 98g 10–50g good nullg 2g
PENTg 54g 20g 1.6g 0.5g 75g 10–50g good nullg 3g
PENTg 180g 45g 0.15g 0.5g 97g 10–50g good nullg 5g
PENTg 161g 45g 0.1g 0.5g 90g >2g good nullg 6g
RODO 49 11 1.1 0.2 35 10–50 good 2RODO 177 45 1.5 0.5 50 10–50 fair 3RODOg 35g 54g 1.35g 0.5g 75g >3g fair nullg 4g
RODOg 110g 45g 1.4g 0.5g 91g 10–50g good nullg 5g
RODOh 46h 10h 1.15h 0.18h
SAMO 52 18 0.55 0.4 34 10–50 fair 1SAMOg 179g 45g 0.75g 0.5g 83g 10–50g good nullg 2g
SAMO 21 2 1.2 0.1 23 10–50 good 3SAMO 15 45 1.35 0.5 48 >3 fair 4SAMO 175 45 0.95 0.5 48 10–50 fair 5SAMOg 93g 45g 1.05g 0.5g 92g >2g good nullg 6g
SAMOh 21h 2h 1.15h 0.09h
SKIR 41 15 2.4 0.6 35 10–20 fair 1SKIRg 117g 45g 2g 0.5g 93g >3g fair nullg 4g
SKIRh 41h 15h 2.4h 0.6h
SKOPg 69g 45g 0.3g 0.8g 85g 10–20g good nullg 1g
SKOPg 163g 45g 0.8g 0.5g 93g 5–30g fair nullg 3g
SKOPg 17g 45g 0.4g 0.5g 77g >3g fair nullg 4g
THESg 59g 45g 0.35g 0.5g 95g rawg good nullg 1g
THES 107 45 0.6 0.5 44 raw fair 4THESg 120g 20g 0.1g 0.2g 67g rawg fair nullg 6g
THESh 107h 45h 0.6h 0.5h
TRIPg 175g 45g 1.3g 0.5g 79g >3g good nullg 1g
TRIP 168 45 1.15 0.5 70 10–50 fair 3TRIPg 140g 45g 0.3g 0.5g 50g >3g fair nullg 4g
TRIPh 168h 45h 1.15h 0.5h
VAVDg 79g 45g 1.5g 0.5g 79g >3g fair nullg 1g
VELI 131 45 0.55 0.5 69 3–50 fair 2VELI 158 16 1.75 0.4 53 10–50 fair 3VELI 156 17 0.75 0.3 40 >3 good 4VELI 168 17 1.1 0.4 40 Raw good 5VELI 170 20 2.55 0.7 53 10–50 fair 6VELIh 161h 9h 1.13h 0.18h
aOrientation of the fast splitting direction.bAssociated error in degree of orientation of the fast splitting direction.cDelay time between the two quasi-S waves.dAssociated error of the delay time (in seconds).eMinimum penalty function [Farra et al., 1991].fFilters give the signal band pass in seconds.gNull measurements, which are are not used for the calculation of the average.hWeighted averages (including only nonnull values) with associated uncertainties reported for each station.
HATZFELD ET AL.: MANTLE ANISOTROPY IN THE AEGEAN 30743
for the event of May 22, 1997, which was well recorded andclearly shows no anisotropy.In contrast, the stations located in continental Greece (e.g.,
AGGI, ANAT, DRAM, FLOR, KOZA, and THES) show smalldelay times (<0.8 s) or, in some cases, null values (KENT, LITO,PENT, and VAVD). This is also the case beneath the Sea of Crete(e.g., ANDR, NAXO, MILO, SANT, and KOS1) and Crete (SKORand KRIS). Delay times >1 s are observed only at TRIP and VELI.For station VELI in southern Peloponnese we observe a meandelay of 1.1 s, which is greater than those at neighboringstations but well constrained and consistent in orientationwith the observations at TRIP.The fast polarization direction � is not homogenous over the
Aegean (Figure 3). In the northern Aegean Sea, and especially inthe northeast, � varies between N10� and N50�E (e.g., AGGI,HIOS, KOS1, LESB, LIMN, SAMO, and SKIR). In continentalGreece, � varies between N150� and N180�E and is significantlydifferent from the stations in the Aegean Sea. Beneath the stationsof KARP and RODO, in the eastern Hellenic arc, � is betweenN20� and N50�E.
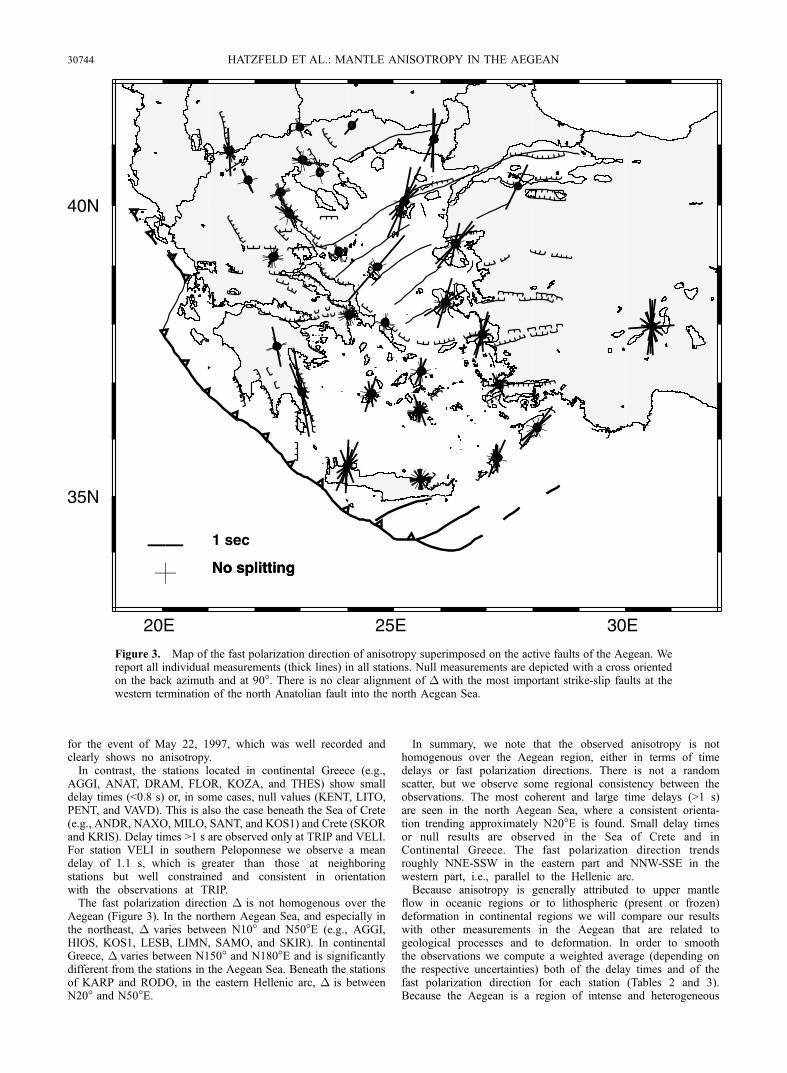
In summary, we note that the observed anisotropy is nothomogenous over the Aegean region, either in terms of timedelays or fast polarization directions. There is not a randomscatter, but we observe some regional consistency between theobservations. The most coherent and large time delays (>1 s)are seen in the north Aegean Sea, where a consistent orienta-tion trending approximately N20�E is found. Small delay timesor null results are observed in the Sea of Crete and inContinental Greece. The fast polarization direction trendsroughly NNE-SSW in the eastern part and NNW-SSE in thewestern part, i.e., parallel to the Hellenic arc.Because anisotropy is generally attributed to upper mantle
flow in oceanic regions or to lithospheric (present or frozen)deformation in continental regions we will compare our resultswith other measurements in the Aegean that are related togeological processes and to deformation. In order to smooththe observations we compute a weighted average (depending onthe respective uncertainties) both of the delay times and of thefast polarization direction for each station (Tables 2 and 3).Because the Aegean is a region of intense and heterogeneous
20E 25E 30E
35N
40N
1 sec
No splittingNo splitting
Figure 3. Map of the fast polarization direction of anisotropy superimposed on the active faults of the Aegean. Wereport all individual measurements (thick lines) in all stations. Null measurements are depicted with a cross orientedon the back azimuth and at 90�. There is no clear alignment of � with the most important strike-slip faults at thewestern termination of the north Anatolian fault into the north Aegean Sea.
30744 HATZFELD ET AL.: MANTLE ANISOTROPY IN THE AEGEAN
deformation, this comparison will allow us to constrain modelsmore easily than in wide regions of homogenous deformationsuch as Eurasia.
4. Comparison With Structural Geology
The geological structure of the Aegean results in part from thestacking of different nappes atop one another, (from east towest) the Serbo-Macedonian, the Pelagonian, the Pindus, the
Gavrovro-Tripoliza, the Ionian, and the Preapulian zones, all ofwhich collided successively since the Eocene with a shorteningof several hundreds of kilometers and therefore implying notonly the crust but also the upper mantle [Aubouin et al., 1976;Jacobshagen, 1986]. These collisions were followed by rotationssince the Lower Cenozoic, clockwise in the western Aegean andcounterclockwise in the eastern Aegean [Kissel and Laj, 1988;Duermeijer, 1999]. Therefore the geological units and mainstructural sutures, which prior to rotation trended roughly EW,now trend NW-SE in continental Greece and WSW-ENE in
Table 3. Anisotropy Results Obtained for Miscellaneous Stations in the Aegean Area
Station �a db Filtersc Remark Event
ISPAd rawd good nulld 97-01-23d
ISPA 2 1.5 raw good 97-05-22ISPA 8 1.6 raw fair 97-06-17ISPAd 10-50d fair nulld 97-07-20d
ISPA 158 0.9 10-50 very good 97-09-02ISPA 127 0.8 raw good 97-10-28ISPA 115 0.35 raw good 97-11-28ISPA 13 0.8 raw good 98-01-01ISPA 128 0.65 raw very good 98-04-03ISPA 177 1.6 10-50 very good 98-04-20ISPA 98 0.6 raw fair 98-05-22ISPA 179 1.1 10-50 fair 98-07-29ISPA 163 0.9 raw good 98-08-04ISPA 61 0.6 >2 good 98-09-02ISPAd rawd good nulld 98-10-08d
ISPA 86 1.3 raw fair 98-11-08ISPAe 177 ± 13 1.7 ± 0.35e
ISPAe 102 ± 26 0.7 ± 0.3e
KRISd 89d 1.15d rawd good nulld 96-11-12d
KRISd 59d 0.25d rawd good nulld 96-11-21d
KRISd 130d 0.45d rawd good nulld 96-12-31d
KRISd 0d 0.65d rawd good nulld 97-01-01d
KRISd 87d 1.25d rawd good nulld 97-01-17d
KRISd 137d 0.25d rawd good nulld 97-01-23d
KRISd 82d 0.9d rawd good nulld 97-03-11d
SANT 2 0.4 raw good 97-07-20SANTd rawd good nulld 98-04-03d
SANTd rawd good nulld 98-05-21d
SANT 61 0.5 3-20 fair 98-05-13SANTd rawd good nulld 98-05-23d
SANTd 10-50d fair nulld 98-08-04d
SANT 178 0.5 3-20 good 98-08-20SANTd 3-50d fair nulld 98-08-28SANT 4 0.5 3-20 good 98-09-02SANT 118 0.4 3-20 good 98-09-28SANTd 3-20d fair nulld 98-11-08d
SANT 56 0.3 raw good 98-11-29SANT 29 0.5 raw good 98-01-28SANTd 3-50d good nulld 99-03-04d
SANTd 3-20d good nulld 99-04-03d
SANTe 9 ± 43e 0.50 ± 0.20e
SKOR 24 1.5 10-50 fair 98-04-01SKOR 58 0.7 10-50 good 98-04-03SKOR 17 1 10-50 good 98-05-21SKOR 5 1.1 10-50 fair 98-05-22SKOR 13 0.3 raw fair 98-05-23SKOR 4 0.6 raw very good 98-06-07SKOR 52 0.6 raw good 98-08-20SKOR 38 0.9 10-50 good 98-09-02SKOR 3 1.5 10-50 fair 98-09-03SKOR 38 0.6 raw very good 98-12-27SKOR 158 1 10-50 good 99-01-12SKOR 158 0.4 raw good 99-01-28SKORe 11 ± 26e 0.85 ± 0.38e
aOrientation of the fast splitting direction in degree.bDelay time between the two quasi-S waves in seconds.cFilters give the signal bandpass in seconds.dNull measurements.eMean (including only nonnull values).
HATZFELD ET AL.: MANTLE ANISOTROPY IN THE AEGEAN 30745
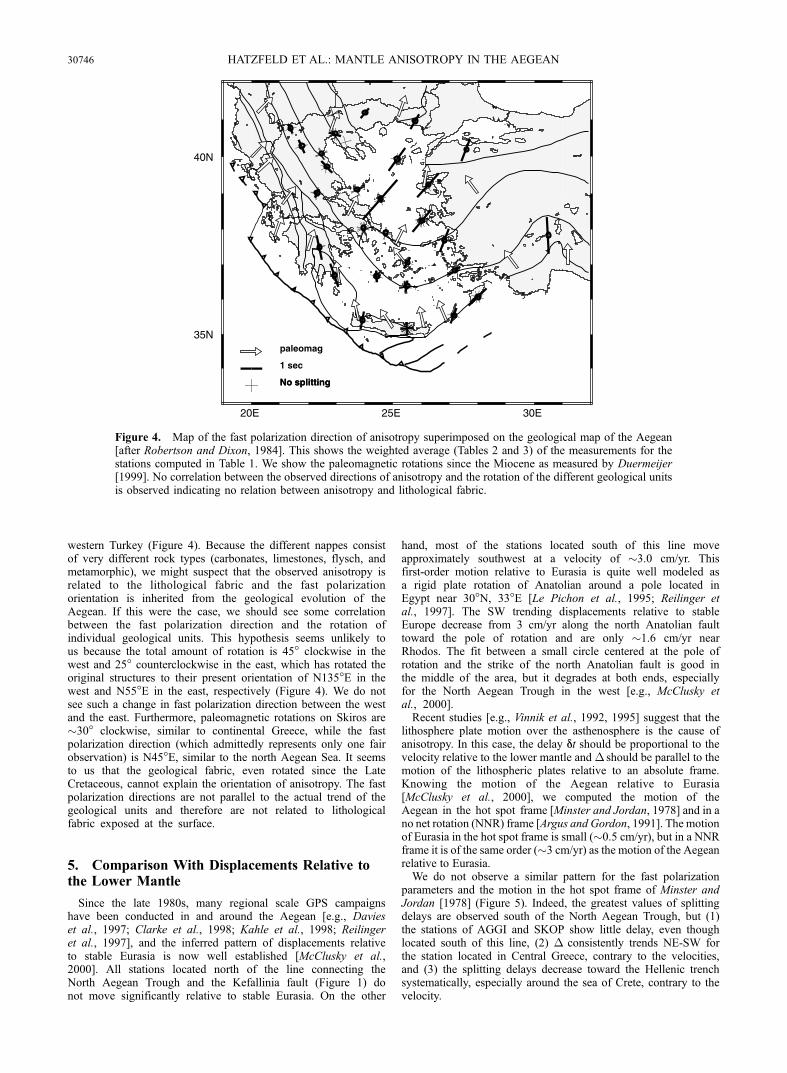
western Turkey (Figure 4). Because the different nappes consistof very different rock types (carbonates, limestones, flysch, andmetamorphic), we might suspect that the observed anisotropy isrelated to the lithological fabric and the fast polarizationorientation is inherited from the geological evolution of theAegean. If this were the case, we should see some correlationbetween the fast polarization direction and the rotation ofindividual geological units. This hypothesis seems unlikely tous because the total amount of rotation is 45� clockwise in thewest and 25� counterclockwise in the east, which has rotated theoriginal structures to their present orientation of N135�E in thewest and N55�E in the east, respectively (Figure 4). We do notsee such a change in fast polarization direction between the westand the east. Furthermore, paleomagnetic rotations on Skiros are�30� clockwise, similar to continental Greece, while the fastpolarization direction (which admittedly represents only one fairobservation) is N45�E, similar to the north Aegean Sea. It seemsto us that the geological fabric, even rotated since the LateCretaceous, cannot explain the orientation of anisotropy. The fastpolarization directions are not parallel to the actual trend of thegeological units and therefore are not related to lithologicalfabric exposed at the surface.
5. Comparison With Displacements Relative tothe Lower Mantle
Since the late 1980s, many regional scale GPS campaignshave been conducted in and around the Aegean [e.g., Davieset al., 1997; Clarke et al., 1998; Kahle et al., 1998; Reilingeret al., 1997], and the inferred pattern of displacements relativeto stable Eurasia is now well established [McClusky et al.,2000]. All stations located north of the line connecting theNorth Aegean Trough and the Kefallinia fault (Figure 1) donot move significantly relative to stable Eurasia. On the other
hand, most of the stations located south of this line moveapproximately southwest at a velocity of �3.0 cm/yr. Thisfirst-order motion relative to Eurasia is quite well modeled asa rigid plate rotation of Anatolian around a pole located inEgypt near 30�N, 33�E [Le Pichon et al., 1995; Reilinger etal., 1997]. The SW trending displacements relative to stableEurope decrease from 3 cm/yr along the north Anatolian faulttoward the pole of rotation and are only �1.6 cm/yr nearRhodos. The fit between a small circle centered at the pole ofrotation and the strike of the north Anatolian fault is good inthe middle of the area, but it degrades at both ends, especiallyfor the North Aegean Trough in the west [e.g., McClusky etal., 2000].Recent studies [e.g., Vinnik et al., 1992, 1995] suggest that the
lithosphere plate motion over the asthenosphere is the cause ofanisotropy. In this case, the delay Dt should be proportional to thevelocity relative to the lower mantle and � should be parallel to themotion of the lithospheric plates relative to an absolute frame.Knowing the motion of the Aegean relative to Eurasia[McClusky et al., 2000], we computed the motion of theAegean in the hot spot frame [Minster and Jordan, 1978] and in ano net rotation (NNR) frame [Argus and Gordon, 1991]. The motionof Eurasia in the hot spot frame is small (�0.5 cm/yr), but in a NNRframe it is of the same order (�3 cm/yr) as the motion of the Aegeanrelative to Eurasia.We do not observe a similar pattern for the fast polarization
parameters and the motion in the hot spot frame of Minster andJordan [1978] (Figure 5). Indeed, the greatest values of splittingdelays are observed south of the North Aegean Trough, but (1)the stations of AGGI and SKOP show little delay, even thoughlocated south of this line, (2) � consistently trends NE-SW forthe station located in Central Greece, contrary to the velocities,and (3) the splitting delays decrease toward the Hellenic trenchsystematically, especially around the sea of Crete, contrary to thevelocity.
20E 25E 30E
35N
40N
1 sec
paleomag
No splittingNo splitting
Figure 4. Map of the fast polarization direction of anisotropy superimposed on the geological map of the Aegean[after Robertson and Dixon, 1984]. This shows the weighted average (Tables 2 and 3) of the measurements for thestations computed in Table 1. We show the paleomagnetic rotations since the Miocene as measured by Duermeijer[1999]. No correlation between the observed directions of anisotropy and the rotation of the different geological unitsis observed indicating no relation between anisotropy and lithological fabric.
30746 HATZFELD ET AL.: MANTLE ANISOTROPY IN THE AEGEAN
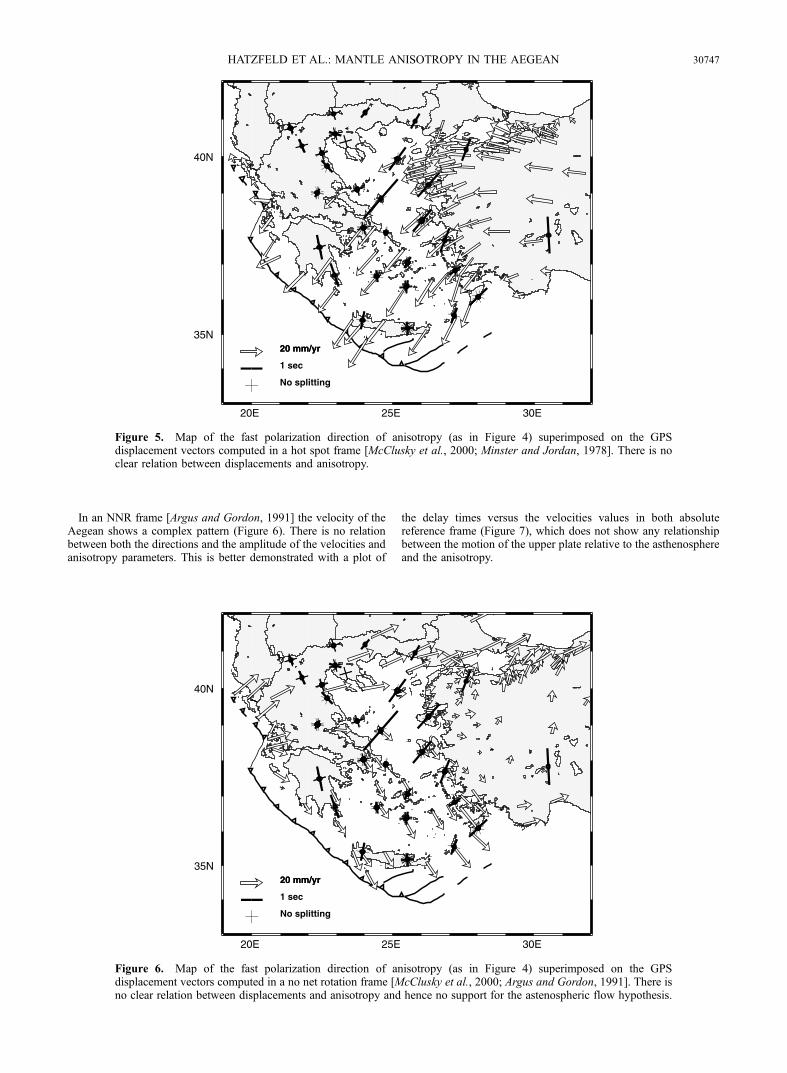
In an NNR frame [Argus and Gordon, 1991] the velocity of theAegean shows a complex pattern (Figure 6). There is no relationbetween both the directions and the amplitude of the velocities andanisotropy parameters. This is better demonstrated with a plot of
the delay times versus the velocities values in both absolutereference frame (Figure 7), which does not show any relationshipbetween the motion of the upper plate relative to the asthenosphereand the anisotropy.
20E 25E 30E
35N
40N
No splitting
1 sec
20 mm/yr20 mm/yr
Figure 5. Map of the fast polarization direction of anisotropy (as in Figure 4) superimposed on the GPSdisplacement vectors computed in a hot spot frame [McClusky et al., 2000; Minster and Jordan, 1978]. There is noclear relation between displacements and anisotropy.
20E 25E 30E
35N
40N
No splitting
1 sec
20 mm/yr20 mm/yr
Figure 6. Map of the fast polarization direction of anisotropy (as in Figure 4) superimposed on the GPSdisplacement vectors computed in a no net rotation frame [McClusky et al., 2000; Argus and Gordon, 1991]. There isno clear relation between displacements and anisotropy and hence no support for the astenospheric flow hypothesis.
HATZFELD ET AL.: MANTLE ANISOTROPY IN THE AEGEAN 30747
6. Comparison With Deformation Measurements
If we concentrate on the strain that affects the Aegean, excludingthe Hellenic arc, extension trends homogeneously N-S within theAegean, and some shortening is associated with the dextral strike-
slip motion of the North Aegean Trough [Jackson et al., 1994;Papazachos et al., 1998].A more detailed examination of the displacement vectors [Le
Pichon et al., 1995; McClusky et al., 2000] relative to the modeledmotion of the rigid Anatolian plate shows (1) the observeddisplacements slightly diverge from the modeled displacementsalong the Hellenic Trench and (2) an increase of the displacementstoward the Hellenic Trench (see also Figure 5). The misfit betweenobserved and modeled displacements as well as the increase invelocity trenchward supports the idea that the Aegean region isdeforming and is not a rigid block [e.g., McKenzie, 1978; LePichon and Angelier, 1979; Mercier et al., 1989]. This internaldeformation of the Aegean has been quantified by measuringvelocities of geodetic benchmarks relative to each other, withinthe Aegean, and by the seismic energy released since the beginningof the century [Jackson et al., 1994].
6.1. Seismicity
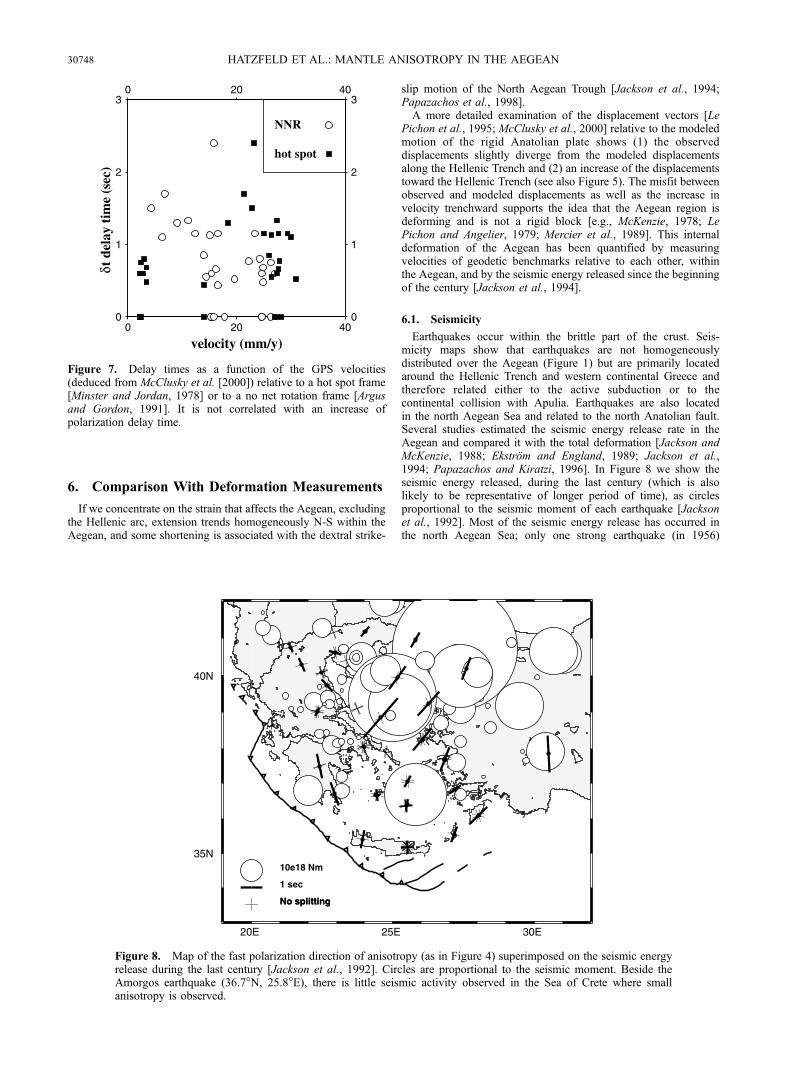
Earthquakes occur within the brittle part of the crust. Seis-micity maps show that earthquakes are not homogeneouslydistributed over the Aegean (Figure 1) but are primarily locatedaround the Hellenic Trench and western continental Greece andtherefore related either to the active subduction or to thecontinental collision with Apulia. Earthquakes are also locatedin the north Aegean Sea and related to the north Anatolian fault.Several studies estimated the seismic energy release rate in theAegean and compared it with the total deformation [Jackson andMcKenzie, 1988; Ekstrom and England, 1989; Jackson et al.,1994; Papazachos and Kiratzi, 1996]. In Figure 8 we show theseismic energy released, during the last century (which is alsolikely to be representative of longer period of time), as circlesproportional to the seismic moment of each earthquake [Jacksonet al., 1992]. Most of the seismic energy release has occurred inthe north Aegean Sea; only one strong earthquake (in 1956)
0
1
2
3
0
1
2
3
0 20 40
0 20 40
δt d
elay
tim
e (s
ec)
velocity (mm/y)
hot spot
NNR
Figure 7. Delay times as a function of the GPS velocities(deduced from McClusky et al. [2000]) relative to a hot spot frame[Minster and Jordan, 1978] or to a no net rotation frame [Argusand Gordon, 1991]. It is not correlated with an increase ofpolarization delay time.
20E 25E 30E
35N
40N
10e18 Nm
1 sec
No splittingNo splitting
Figure 8. Map of the fast polarization direction of anisotropy (as in Figure 4) superimposed on the seismic energyrelease during the last century [Jackson et al., 1992]. Circles are proportional to the seismic moment. Beside theAmorgos earthquake (36.7�N, 25.8�E), there is little seismic activity observed in the Sea of Crete where smallanisotropy is observed.
30748 HATZFELD ET AL.: MANTLE ANISOTROPY IN THE AEGEAN
occurred in the Sea of Crete. Along the Hellenic Trench therelation between the total deformation and the seismic energyrelease could be biased because it seems to deform aseismically.However, this aseismic deformation relates only to the Hellenicsubduction. As far as the Aegean Sea and continental Greece areconcerned, the seismic energy release is well correlated with thetotal amount of deformation as it is deduced from satellitegeodesy [Jackson et al., 1994].Thus it is clear that the seismic energy release is not homogenous
over the Aegean. It is largest in the north Aegean Sea, whereseveral earthquakes greater than magnitude 7 have occurred sincethe beginning of the century [Ambraseys and Jackson, 1990] butvery much lower in the Sea of Crete, where only one magnitude 7event has occurred near Amorgos. This difference in seismicity isalso observed in the historical seismicity record [Papazachos andPapazachou, 1997].Slip vectors from focal mechanisms give some information
about the relative displacement between rigid blocks, and the Pand T axes give some information about the strain regime. Bothstrong earthquakes [Ekstrom and England, 1989; Jackson et al.,1994; Papazachos et al., 1998] and microearthquakes [Hatzfeld etal., 1997] show that the seismic energy released within theAegean is consistent with N-S trending T axes in the northAegean Sea. In contrast, extension is trending along the trenchnear the Hellenic arc.
6.2. Geodesy
The relative displacements of benchmarks measured by GPSalso give an estimate of the internal deformation of theAegean. The results of McClusky et al. [2000] are a synthesisof several campaigns conducted in the Aegean and westernTurkey. From their results we first computed the deformation oftriangles defined by three consecutive benchmarks. This givesunstable results because the triangles were not of uniform
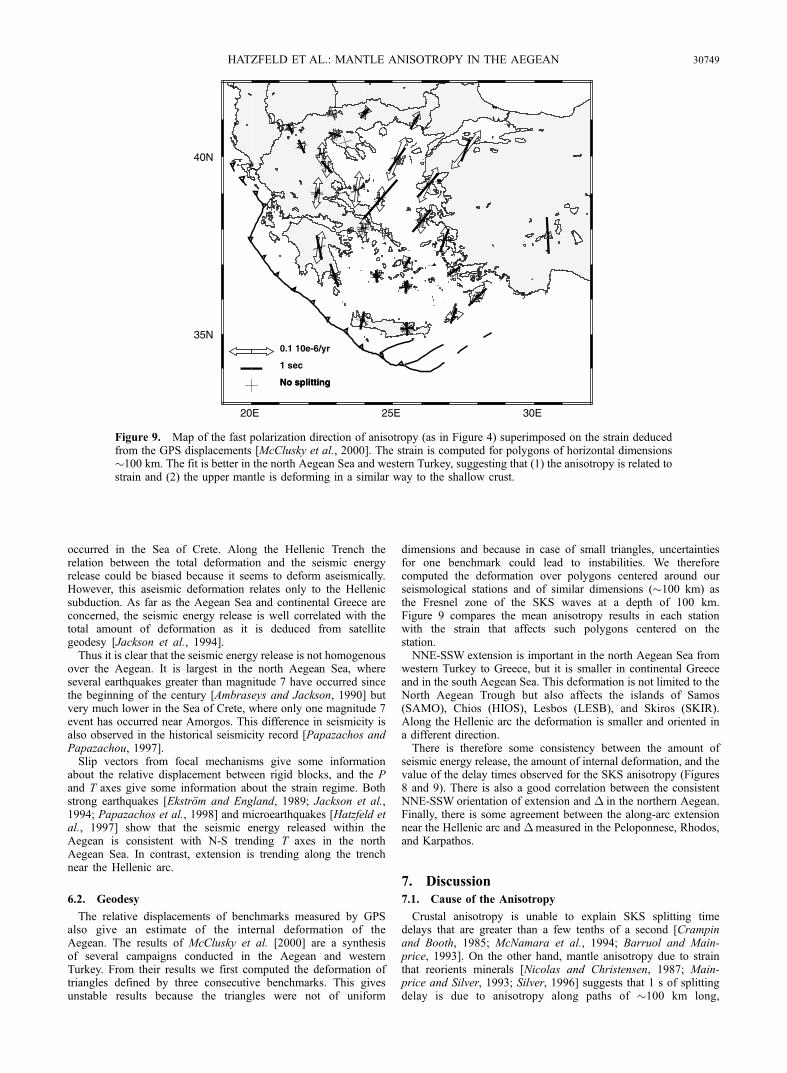
dimensions and because in case of small triangles, uncertaintiesfor one benchmark could lead to instabilities. We thereforecomputed the deformation over polygons centered around ourseismological stations and of similar dimensions (�100 km) asthe Fresnel zone of the SKS waves at a depth of 100 km.Figure 9 compares the mean anisotropy results in each stationwith the strain that affects such polygons centered on thestation.NNE-SSW extension is important in the north Aegean Sea from
western Turkey to Greece, but it is smaller in continental Greeceand in the south Aegean Sea. This deformation is not limited to theNorth Aegean Trough but also affects the islands of Samos(SAMO), Chios (HIOS), Lesbos (LESB), and Skiros (SKIR).Along the Hellenic arc the deformation is smaller and oriented ina different direction.There is therefore some consistency between the amount of
seismic energy release, the amount of internal deformation, and thevalue of the delay times observed for the SKS anisotropy (Figures8 and 9). There is also a good correlation between the consistentNNE-SSW orientation of extension and � in the northern Aegean.Finally, there is some agreement between the along-arc extensionnear the Hellenic arc and � measured in the Peloponnese, Rhodos,and Karpathos.
7. Discussion
7.1. Cause of the Anisotropy
Crustal anisotropy is unable to explain SKS splitting timedelays that are greater than a few tenths of a second [Crampinand Booth, 1985; McNamara et al., 1994; Barruol and Main-price, 1993]. On the other hand, mantle anisotropy due to strainthat reorients minerals [Nicolas and Christensen, 1987; Main-price and Silver, 1993; Silver, 1996] suggests that 1 s of splittingdelay is due to anisotropy along paths of �100 km long,
20E 25E 30E
35N
40N
0.1 10e-6/yr
1 sec
No splittingNo splitting
Figure 9. Map of the fast polarization direction of anisotropy (as in Figure 4) superimposed on the strain deducedfrom the GPS displacements [McClusky et al., 2000]. The strain is computed for polygons of horizontal dimensions�100 km. The fit is better in the north Aegean Sea and western Turkey, suggesting that (1) the anisotropy is related tostrain and (2) the upper mantle is deforming in a similar way to the shallow crust.
HATZFELD ET AL.: MANTLE ANISOTROPY IN THE AEGEAN 30749
implying anisotropy through the whole lithosphere and possiblythe asthenosphere. Our observations show SKS splitting delaysof up to 2 s and therefore suggest that both the whole lithosphereand part of the asthenosphere are involved in the process thatsplits the observed SKS waves; this is especially true for thenorthern Aegean Sea. In the case of the southern Aegean and,especially, along the Hellenic arc the horizontal anisotropy couldbe blurred by the subduction of the African lithospheric platebeneath the Hellenic arc because the asthenospheric flow iscertainly complex.There is no correlation of � with the NW-SE trend of the
geological unit or with the paleomagnetic rotations that occurredafter the middle Miocene or during the Quaternary [Kissel andLaj, 1988; Duermeijer, 1999], nor is there a correlation with theamount of total deformation that affected the Aegean since themiddle Miocene because anisotropy is not seen in the Sea ofCrete (stations NAXO, SANT, and MILO), which experienced astretching factor of �2 [Angelier et al., 1982]. Thus ourobservations show that the fast polarization direction is probablynot related to the geological fabric or inherited tectonicalprocesses.The orientation of anisotropy does not align with the orientation
of displacement of the Aegean relative to any of the hot spot orNNR frames, and the splitting delay times do not correlate with thedisplacement velocities (Figure 7). Thus it seems unlikely thatanisotropy is due to the rigid plate tectonic motion relative to anabsolute reference frame. If we consider the motion relative to a hotspot frame, � should align with the motion of the Peloponnese. Ina NNR frame we should observe a large delay time in central andnorthern Greece. Therefore our fast polarization directions do notsupport the simple asthenospheric flow model [e.g., Vinnik et al.,
1995], which assumes that anisotropy is controlled by the absoluteplate motion.Our fast polarization direction does not align with the ori-
entation of the major crustal (or lithospheric) discontinuities (i.e.,the different branches of the North Aegean Trough). Anyinterpretation in terms of vertically coherent deformation [seeSilver, 1996] as it has been proposed for the north Kunlun fault[e.g., McNamara et al., 1994] is not supported by our observa-tions. In the north Kunlun fault the fast polarization directionrotates quickly to become parallel to the fault, and values ofdelay times also vary rapidly with the distance to the fault. Inthe Aegean, � does not align with the North Aegean Trough inALEX, LESB, and BAND, and the amplitude of the delay israther constant from ALEX to SKIR and SAMO. It seemstherefore unlikely that anisotropy is restricted to the majorcrustal (or lithospheric) discontinuities.On the other hand, the pattern of fast polarization direction
closely resembles the pattern of extensional strain inferred bothfrom the geodetic measurements [e.g., Davies et al., 1997;Kahle et al., 1998] and the T axes of focal mechanisms[Hatzfeld et al., 1997]. It trends uniformly NNE-SSW overmost of the northern Aegean, and it is aligned with theHellenic Trench in the Peloponnese, Rhodos, and Karpathos.It is not limited to the North Aegean Trough but affects abroad region from ALEX to SAMO. The delay time correlatesreasonably well with the amount of seismic energy release(Figure 8), and the orientation correlates with the mean direc-tion of extension (Figure 9). It seems probable that the SKSsplitting is therefore related to the current strain rate (or recentfinite strain) rather than the total amount of finite deformationover a long time. The agreement is good in the northern
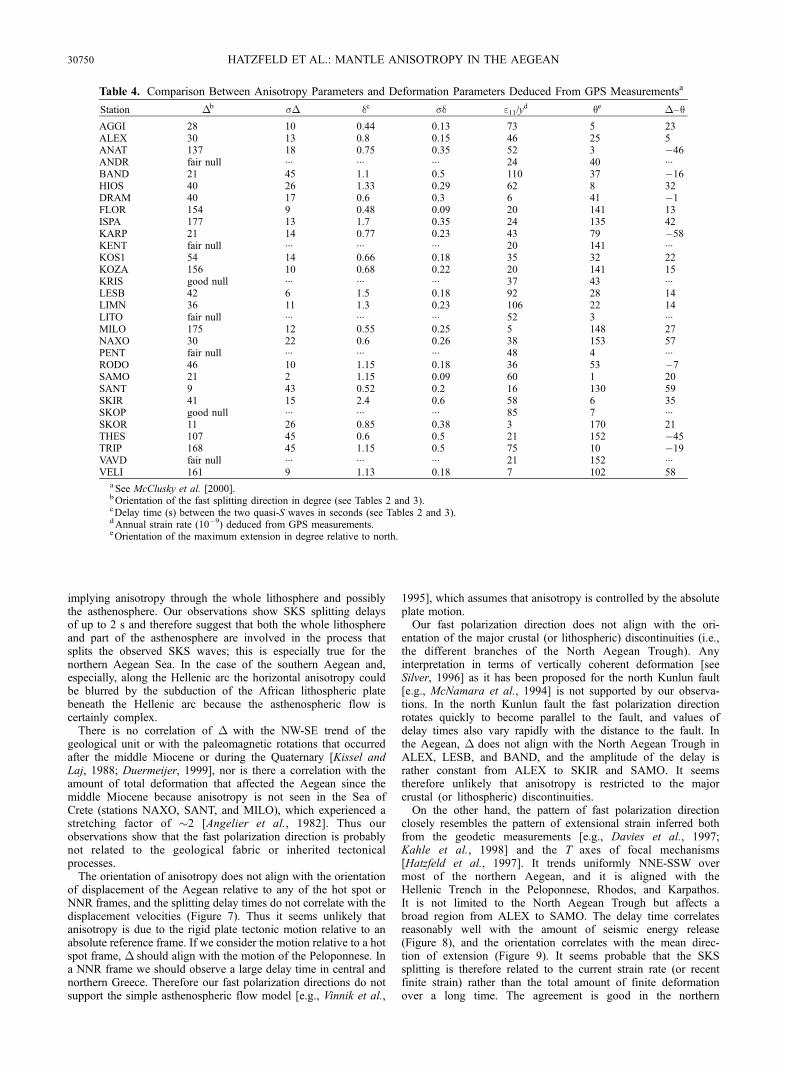
Table 4. Comparison Between Anisotropy Parameters and Deformation Parameters Deduced From GPS Measurementsa
Station �b s� dc sd e11/yd qe �– q
AGGI 28 10 0.44 0.13 73 5 23ALEX 30 13 0.8 0.15 46 25 5ANAT 137 18 0.75 0.35 52 3 �46ANDR fair null ... ... ... 24 40 ...
BAND 21 45 1.1 0.5 110 37 �16HIOS 40 26 1.33 0.29 62 8 32DRAM 40 17 0.6 0.3 6 41 �1FLOR 154 9 0.48 0.09 20 141 13ISPA 177 13 1.7 0.35 24 135 42KARP 21 14 0.77 0.23 43 79 �58KENT fair null ... ... ... 20 141 ...
KOS1 54 14 0.66 0.18 35 32 22KOZA 156 10 0.68 0.22 20 141 15KRIS good null ... ... ... 37 43 ...
LESB 42 6 1.5 0.18 92 28 14LIMN 36 11 1.3 0.23 106 22 14LITO fair null ... ... ... 52 3 ...
MILO 175 12 0.55 0.25 5 148 27NAXO 30 22 0.6 0.26 38 153 57PENT fair null ... ... ... 48 4 ...
RODO 46 10 1.15 0.18 36 53 �7SAMO 21 2 1.15 0.09 60 1 20SANT 9 43 0.52 0.2 16 130 59SKIR 41 15 2.4 0.6 58 6 35SKOP good null ... ... ... 85 7 ...
SKOR 11 26 0.85 0.38 3 170 21THES 107 45 0.6 0.5 21 152 �45TRIP 168 45 1.15 0.5 75 10 �19VAVD fair null ... ... ... 21 152 ...
VELI 161 9 1.13 0.18 7 102 58aSee McClusky et al. [2000].bOrientation of the fast splitting direction in degree (see Tables 2 and 3).cDelay time (s) between the two quasi-S waves in seconds (see Tables 2 and 3).dAnnual strain rate (10�9) deduced from GPS measurements.eOrientation of the maximum extension in degree relative to north.
30750 HATZFELD ET AL.: MANTLE ANISOTROPY IN THE AEGEAN
Aegean Sea. Along the Hellenic arc, mainly for the Peloponn-ese, Rhodos, and Karpathos, the fast polarization directionagrees with the direction of extensional strain as it is deducedfrom earthquake mechanisms but does not agree with the delaytimes. It is important to note that the Hellenic subduction israther peculiar and dips at a very shallow angle beneath thePeloponnese. On the other hand, the fast polarization directionabove some subduction zones has been observed parallel to thetrench [e.g., Russo and Silver, 1994]. Beneath the Peloponnese,both effects could constructively interfere, while they destruc-tively interfere beneath Crete.
7.2. Implication for the Geodynamics
Anisotropy in the Aegean is not restricted to the major faults butis distributed within a wide region around the major discontinuitieswhich are represented by the different branches of the NorthAegean Trough. This result is similar to the observations in NewZealand [e.g., Molnar et al., 1999] or in Tibet [e.g., Davis et al.,1997; Holt, 2000].If we assume that surface faults are crustal discontinuities but
that the mantle lithosphere deforms continuously beneath the crust,we can estimate the amount of strain that affects the lithosphere. Arough estimate of the total motion of Anatolia relative to Eurasiaalong the north Anatolian fault is �80–100 km since the Pliocene[i.e., Barka and Hancok, 1984]. Assuming a simple-shear defor-mation by displacement d = 100 km affecting a region of widthw = 100 km (the width of the different branches of the NorthAegean Trough), we compute an angle q = 30� between thedirection of the maximum extension and the direction of shear,and we compute a finite strain of e11 = 60%. First, 30� isapproximately the angle between � and the direction of motionalong the North Aegean Trough. Second, a finite strain of 60%produces an anisotropy dvs/vs = 7% [Ribe, 1992], which isconsistent with a time delay of 2 s for a wave propagation over100 km. Moreover, the present-day observed geodetic strain rateis �0.06–0.1 10�6/yr in the region of high anisotropy located inthe north Aegean Sea around the stations (Table 4). Accumu-lated over a period of 5 Myr, this contributes to a total finitestrain of 30–50%, which, again, is consistent with the aniso-tropy values computed above.From the GPS velocities reported by McClusky et al. [2000]
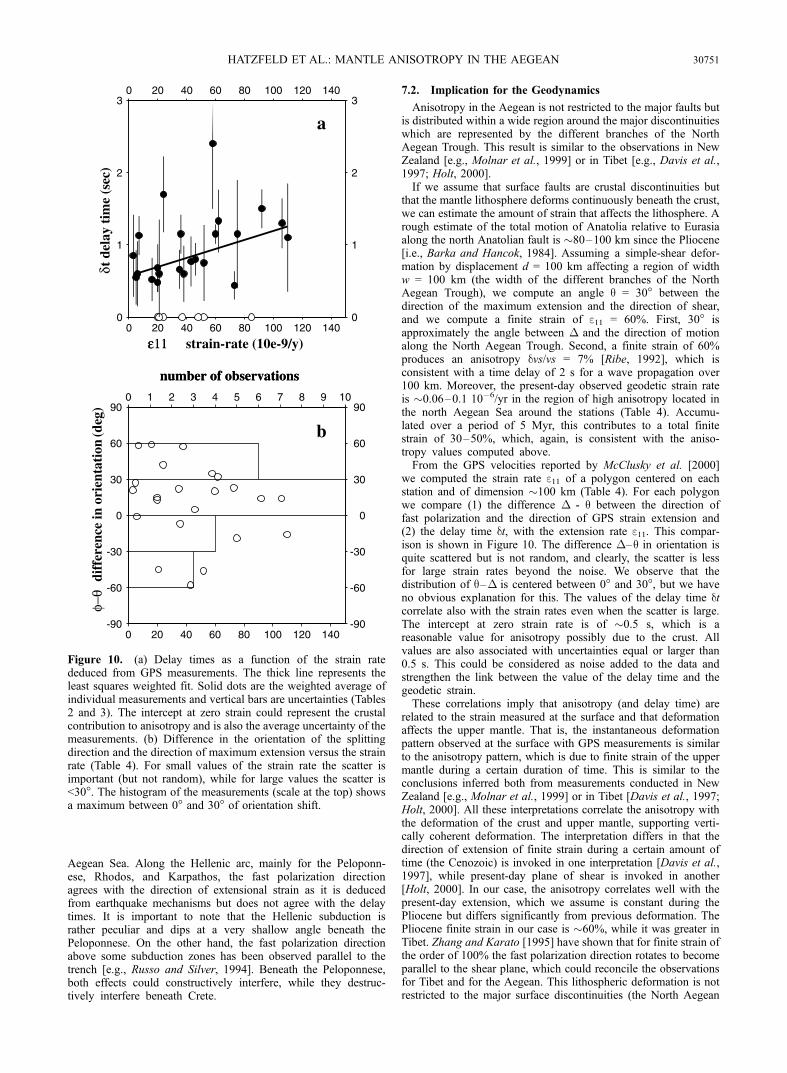
we computed the strain rate e11 of a polygon centered on eachstation and of dimension �100 km (Table 4). For each polygonwe compare (1) the difference � - q between the direction offast polarization and the direction of GPS strain extension and(2) the delay time dt, with the extension rate e11. This compar-ison is shown in Figure 10. The difference �–q in orientation isquite scattered but is not random, and clearly, the scatter is lessfor large strain rates beyond the noise. We observe that thedistribution of q–� is centered between 0� and 30�, but we haveno obvious explanation for this. The values of the delay time dtcorrelate also with the strain rates even when the scatter is large.The intercept at zero strain rate is of �0.5 s, which is areasonable value for anisotropy possibly due to the crust. Allvalues are also associated with uncertainties equal or larger than0.5 s. This could be considered as noise added to the data andstrengthen the link between the value of the delay time and thegeodetic strain.These correlations imply that anisotropy (and delay time) are
related to the strain measured at the surface and that deformationaffects the upper mantle. That is, the instantaneous deformationpattern observed at the surface with GPS measurements is similarto the anisotropy pattern, which is due to finite strain of the uppermantle during a certain duration of time. This is similar to theconclusions inferred both from measurements conducted in NewZealand [e.g., Molnar et al., 1999] or in Tibet [Davis et al., 1997;Holt, 2000]. All these interpretations correlate the anisotropy withthe deformation of the crust and upper mantle, supporting verti-cally coherent deformation. The interpretation differs in that thedirection of extension of finite strain during a certain amount oftime (the Cenozoic) is invoked in one interpretation [Davis et al.,1997], while present-day plane of shear is invoked in another[Holt, 2000]. In our case, the anisotropy correlates well with thepresent-day extension, which we assume is constant during thePliocene but differs significantly from previous deformation. ThePliocene finite strain in our case is �60%, while it was greater inTibet. Zhang and Karato [1995] have shown that for finite strain ofthe order of 100% the fast polarization direction rotates to becomeparallel to the shear plane, which could reconcile the observationsfor Tibet and for the Aegean. This lithospheric deformation is notrestricted to the major surface discontinuities (the North Aegean
0
1
2
3
0
1
2
3
0 20 40 60 80 100 120 140
0 20 40 60 80 100 120 140δt
del
ay t
ime
(sec
)
strain-rate (10e-9/y)ε11ε11
a
-90
-60
-30
0
30
60
90
-90
-60
-30
0
30
60
90
0 20 40 60 80 100 120 140
φ−θ
diff
eren
ce in
ori
enta
tion
(deg
)
number of observationsnumber of observations
b
0 1 2 3 4 5 6 7 8 9 10
Figure 10. (a) Delay times as a function of the strain ratededuced from GPS measurements. The thick line represents theleast squares weighted fit. Solid dots are the weighted average ofindividual measurements and vertical bars are uncertainties (Tables2 and 3). The intercept at zero strain could represent the crustalcontribution to anisotropy and is also the average uncertainty of themeasurements. (b) Difference in the orientation of the splittingdirection and the direction of maximum extension versus the strainrate (Table 4). For small values of the strain rate the scatter isimportant (but not random), while for large values the scatter is<30�. The histogram of the measurements (scale at the top) showsa maximum between 0� and 30� of orientation shift.
HATZFELD ET AL.: MANTLE ANISOTROPY IN THE AEGEAN 30751
Trough) but is spread over a wide region. This suggests that theupper mantle deforms in a continuum fashion and that differentbranches of the North Aegean Trough are only the brittle surfaceexpression of the mantle deformation.
8. Conclusion
The Aegean experiences significant present-day internal defor-mation. Unlike most of the places where anisotropy has beenmeasured, the Aegean strain rate is large and implies a largetwo-dimensional strain pattern. Measurements of mantle aniso-tropy in the Aegean do not correlate with preexisting structuralfabric (frozen into the lithosphere). Nor do they correlate withgeodetic displacements relative to absolute plate motion andtherefore do not fit models which involve the upper mantle inthe plate motion. They do not align well with the majortranscurrent faults of the North Aegean Trough and are thereforeinconsistent with models that predict that anisotropy is related tothe horizontal motion of the lithosphere over a mantle astheno-sphere.On the other hand, the fast polarization parameters are rather
well correlated, both in terms of orientation and magnitude, withthe recent strain rates as evidenced by the GPS measurementsand the seismicity (energy release and focal mechanisms). It isspread over a wide region around the major faults. Values ofdelay time are too large to be restricted to the path in the crustand therefore suggest that the crust and upper mantle deformsimilarly.
Acknowledgments. This study was supported by contract ENV4-CT96-0277 from the program Environment and Climate of the EuropeanCommission and the program IDYL of INSU-CNRS. We thank all theobservers who helped us to maintain the stations during the six months ofthe experiment. P. Clarke and J.-C. Ruegg kindly provided the programs tocompute the strain from GPS measurements and the change in referenceframe. J. Jackson, P. England, and P. Molnar provided helpful comments onearlier versions of the manuscript G. Helffrich (Associate Editor), W. Holt,and an anonymous reviewer gave constructive criticisms, which greatlyimprove the manuscript.
ReferencesAlsina, D., and R. Snieder, Small-scale sublithospheric continental mantledeformation: Constraints from SKS splitting observations, Geophys. J.Int., 123, 431–448, 1995.
Ambraseys, N., and J. Jackson, Seismicity and associated strain of centralGreece between 1890 and 1988, Geophys. J. Int., 101, 663–708, 1990.Angelier, J., N. Lyberis, X. Le Pichon, E. Barrier, and P. Huchon, Theneotectonic development of the Hellenic Arc and the Sea of Crete: Asynthesis, Tectonophysics, 86, 159–196, 1982.Argus, D. F., and P. G. Gordon, No-net-rotation model of current platevelocities incorporating plate motion model Nuvel-1, Geophys. Res. Lett.,18, 2039–2042, 1991.
Aubouin, J., M. Bonneau, J. Davidson, P. Leboulanger, S. Matesco, andA. Zambetakis, Esquisse structurale de l’arc Egeen externe: Des Dinar-ides aux Taurides, Bull. Soc. Geol. Fr., 7, 385–401, 1976.
Barka, A. A., and P. L. Hancok, Neotectonic deformation patterns in theconvex-northwards arc of the north Anatolian fault zone, in The Geolo-gical Evolution of the Eastern Mediterranean, edited by J. E. Dixon andA. H. F. Robertson, Geol. Soc. Spec. Publ., 17, 763–774, 1984.
Barruol, G., and D. Mainprice, A quantitative evaluation of the contribu-tion of crustal rocks to shear wave splitting of teleseismic SKS waves,Phys. Earth Planet. Inter., 78, 281–300, 1993.
Ben Ismail, W., and D. Mainprice, An olivine fabric database: An overviewof upper mantle fabrics and seismic anisotropy, Tectonophysics, 296,145–157, 1998.
Bourne, S. J., P. C. England, and B. Parsons, The motion of crustal blocksdriven by flow of the lithosphere: Implications for slip rates of faults inthe South Islands of New Zealand and southern California, Nature, 391,655–659, 1997.Clarke, P. J., et al., Crustal strain in central Greece from repeated GPSmeasurements in the interval 1989–1997, Geophys. J. Int., 135, 195–214, 1998.Crampin, S., and D. C. Booth, Shear-wave polarizations near the north
Anatolian fault, II, Interpretation in terms of crack-induced anisotropy,Geophys. J. R. Astron. Soc., 83, 75–92, 1985.
Davies, R., P. England, B. Parsons, H. Billiris, D. Paradissis, and G. Veis,Geodetic strain of Greece in the interval 1892-1992, J. Geophys. Res.,102, 24,571–24,588, 1997.
Davis, P., P. England, and G. Houseman, Comparison of shear wave split-ting and finite strain from the India-Asia collision zone, J. Geophys. Res.,102, 27,511–27,522, 1997.Duermeijer, C. E., Neogene to Recent tectonic evolution of the centralMediterranean, an integrated paleomagnetic approach, Ph.D. thesis,Utrecht, Netherlands, 1999.
Ekstrom, G., and P. England, Seismic strain rates in regions of distributedcontinental deformation, J. Geophys. Res., 94, 10,231–10,257, 1989.
England, P., and D. McKenzie, A thin viscous sheet model for continentaldeformation, Geophys. J. R. Astron. Soc., 70, 295–321, 1982.England, P., G. Houseman, and L. Sonder, Length scales for continentaldeformation in convergent, divergent, and strike slip environments: Ana-lytical and approximate solutions for a thin viscous sheet model, J. Geo-phys. Res., 90, 3551–3557, 1985.
Farra, V., L. P. Vinnik, B. Romanowicz, G. L. Kozarev, and R. Kind, Inver-sion of teleseismic S particle motion for azimuthal anisotropy in the uppermantle: A feasibility study, Geophys. J. Int., 106, 421–431, 1991.
Hatzfeld, D., J. Martinod, G. Bastet, and P. Gautier, An analog experimentfor the Aegean to describe the contribution of gravitational potentialenergy, J. Geophys. Res., 102, 649–659, 1997.
Holt, W. E., Correlated crust and mantle strain fields in Tibet, Geology, 28,67–70, 2000.
Jackson, J. A., and D. McKenzie, The relationship between plate motionsand seismic moment tensors, and the rates of active deformation in theMediterranean and the Middle East, Geophys. J., 93, 45–73, 1988.Jackson, J., J. Haines, and W. Holt, The horizontal velocity field in thedeforming Aegean Sea region determined from the moment tensors ofearthquakes, J. Geophys. Res., 97, 17,657–17,684, 1992.
Jackson, J., J. Haines, and W. Holt, A comparison of satellite laser rangingand seismicity data in the Aegean region, Geophys. Res. Lett., 21, 2849–2852, 1994.
Jacobshagen, V., Geologie von Griechenland, 363 pp., Gebruder Borntra-ger, Stuttgart, Germany, 1986.
Kahle, H.-G., C. Straub, R. Reilinger, S. McClusky, R. King, K. Hurst, G.Veis, K. Kastens, and P. Cross, The strain field in the eastern Mediterra-nean region, estimated by repeated GPS measurements, Tectonophysics,294, 237–252, 1998.
Kissel, C., and C. Laj, The tertiary geodynamical evolution of the Aegeanarc: A paleomagnetic reconstruction, Tectonophysics, 146, 183–201,1988.
Le Pichon, X., and J. Angelier, The Hellenic arc and trench system: A keyto the neotectonic evolution of the eastern Mediterranean region, Tecto-nophysics, 60, 1–42, 1979.
Le Pichon, X., N. Chamot-Rooke, S. Lallemant, R. Noomen, and G. Veis,Geodetic determination of the kinematics of central Greece with respectto Europe: Implications for eastern Mediterranean tectonics, J. Geophys.Res., 100, 12,675–12,690, 1995.
Mainprice, D., and P. G. Silver, Interpretation of SKS waves using samplesfrom the subcontinental lithosphere, Phys. Earth Planet. Inter., 78, 257–280, 1993.
McClusky, S., et al., GPS constraints on plate motions and deformations inthe eastern Mediterranean: Implications for plate dynamics, J. Geophys.Res., 105, 5695–5719, 2000.McKenzie, D. P., Active tectonics of the Alpine-Himalayan belt: TheAegean Sea and surrounding regions, Geophys. J. R. Astron. Soc., 55,217–254, 1978.McNamara, D. E., T. J. Owens, P. G. Silver, and F. T. Wu, Shear waveanisotropy beneath the Tibetan Plateau, J. Geophys. Res., 99, 13,655–13,665, 1994.Meijer, P. T., and M. J. R. Wortel, Present-day dynamics of the Aegeanregion: A model analysis of the horizontal pattern of stress and deforma-tion, Tectonics, 16, 879–895, 1997.
Mercier, J. L., D. Sorel, P. Vergely, and K. Simeakis, Extensional tectonicregimes in the Aegean basins during the Cenozoic, Basin Res., 2, 49–71,1989.Minster, J. B., and T. H. Jordan, Present-day plate motion, J. Geophys.Res., 83, 5331–5354, 1978.Molnar, P., Continental tectonics in the aftermath of plate tectonics,Nature, 335, 131–137, 1988.Molnar, P., et al., Continuous deformation versus faulting through thecontinental lithosphere of New Zealand, Science, 286, 516–519, 1999.Nicolas, A., and N. I. Christensen, Formation and anisotropy in uppermantle peridotites—A review, in Composition, Structure, and Dynamicsof the Lithosphere—Asthenosphere System, Geodyn. Ser., vol. 16, editedby K. Fuchs and C. Froidevaux, pp. 111–123, AGU, Washington, D. C.,1987.
30752 HATZFELD ET AL.: MANTLE ANISOTROPY IN THE AEGEAN
Nur, A., H. Ron, and O. Scotti, Fault mechanics and the kinematics ofblock rotation, Geology, 14, 746–749, 1986.Papazachos, B., and K. Papazachou, Earthquakes in Greece, 356 pp.,Ekdoseis Ziti, Thessaloniki, Greece, 1997.
Papazachos, B. C., E. E. Papadimitriou, A. A. Kiratzi, C. B. Papazachos,and E. K Louvari, Fault plane solutions in the Aegean Sea and thesurrounding area and their tectonic implication, Boll. Geof. Teorica Appl.,39, 199–218, 1998.
Papazachos, C. B., and A. A. Kiratzi, A detailed study of the active crustaldeformation in the Aegean and surrounding area, Tectonophysics, 253,129–153, 1996.
Reilinger, R., S. C. McClusky, M. B. Oral, R. W. King, and M. N. Toksoz,Global Positioning System measurements of present-day crustal move-ments in the Arabia-Africa-Eurasia plate collision zone, J. Geophys. Res.,102, 9983–9999, 1997.
Ribe, N. M., On the relation between seismic anisotropy and finite strain,J. Geophys. Res., 97, 8737–8747, 1992.
Robertson, A. H. F., and J. E. Dixon, Introduction: Aspects of the geologicalevolution of the eastern Mediterranean, in The Geological Evolution of theEastern Mediterranean, edited by J. E. Dixon and A. H. F. Robertson,Geol. Soc. Spec. Publ., 17, 1–74, 1984.Russo, R. M., and P. G. Silver, Trench-parallel flow beneath the Nazcaplate from seismic anisotropy, Science, 263, 1105–1111, 1994.Silver, P. G., Seismic anisotropy beneath the continents: Probing thedepths of the geology, Annu. Rev. Earth Planet. Sci., 24, 385–432,1996.Silver, P. G., and W. W. Chan, Shear wave splitting and subcontinentalmantle deformation, J. Geophys. Res., 96, 16,429–16,454, 1991.Tapponnier, P., Evolution tectonique du systeme alpin en Mediterranee:Poinconnement et ecrasement rigide plastique, Bull. Soc. Geol. Fr., 3,437–460, 1977.
Tapponnier, P., G. Peltzer, and R. Armijo, On the mechanics of the colli-sion between India and Asia, in Collision Tectonics, edited by M. P.Coward and A. C. Ries, Geol. Soc. Spec. Publ., 19, 115–157, 1986.Tommasi, A., A. Vauchez, and R. Russo, Seismic anisotropy in ocean
basins: Resistive drag of the sub-lithospheric mantle?, Geophys. Res.Lett., 23, 2991–2994, 1996.
Vinnik, L. P., V. Farra, and B. Romanowicz, Azimuthal anisotropy in theEarth from observations of SKS at Geoscope and Nars broadband sta-tions, Bull. Seismol. Soc. Am., 79, 1542–1558, 1989.
Vinnik, L. P., L. I. Makeyeva, A. Milev, and A. Y. Usenko, Global patternsof azimuthal anisotropy and deformations in the continental mantle, Geo-phys. J. Int., 111, 433–447, 1992.
Vinnik, L. P., R. W. Green, and B. Gruzinskaya, Recent deformation of thedeep continental root beneath southern Africa, Nature, 375, 50–52, 1995.
Wylegalla, K., G. Bock, J. Gossler, and W. Hanka, Anisotropy across theSorgenfrei-Tornquist zone from shear wave splitting, Tectonophysics,314, 335–350, 1999.
Zhang, S., and S.-I. Karato, Lattice preferred orientation of olivine aggre-gates deformed in simple shear, Nature, 375, 774–777, 1995.
�����������G. Bock, GeoForshungsZentrum Potsdam, Telegrafenberg, 14473
Potsdam, Germany.D. Hatzfeld, Laboratoire de Geophysique Interne et Tectonophysique,
UJF-CNRS, BP 53, 38041 Grenoble Cedex, France. ([email protected])E. Karagianni, A. Kiratzi, and E. Louvari, Department of Geophysics,
Aristotle University, BP 352-01, 54006 Thessaloniki, Greece.I. Kassaras, K. Makropoulos, and P. Papadimitriou, Department of
Geophysics, University of Athens, Illissia, 15784 Athens, Greece.H. Lyon-Caen, Laboratoire de Geologie, Ecole Normale Superieure,
75231 Paris Cedex 05, France.K. Priestley, Bullard Laboratory, Madingley Rise, Madingley Road,
Cambridge CB30EZ, England, UK.
(Received March 23, 2000; revised July 1, 2001;accepted July 5, 2001.)
HATZFELD ET AL.: MANTLE ANISOTROPY IN THE AEGEAN 30753
Top Related
Copyright © 2022 FDOKUMEN

