

![Optical spectroscopic analyses of OH incorporation into SiO[sub 2] films deposited from O[sub 2]/tetraethoxysilane plasmas](https://static.fdokumen.com/doc/165x107/6345705d38eecfb33a068f14/optical-spectroscopic-analyses-of-oh-incorporation-into-siosub-2-films-deposited.jpg)


Bahasa
Halaman
Hukum

DOI: 10.1002/cctc.201402573
Selective Hydrogenation of Cinnamaldehyde to CinnamalAlcohol over Platinum/Graphene Catalysts
Xiwang Ji,[a] Xiaoyu Niu,[a] Bo Li,*[c] Qing Han,[a] Fulong Yuan,[a] Francisco Zaera,*[b]
Yujun Zhu,*[a] and Honggang Fu[a]
Introduction
The selective hydrogenation of a,b-unsaturated carbonyl com-
pounds is of theoretical and practical significance.[1–3] For in-
stance, the hydrogenation of cinnamaldehyde (CAL) can pro-
duce cinnamal alcohol (COL), hydrocinnamaldehyde (HALD),
and/or hydrocinnamal alcohol (HALC; Scheme 1), but the selec-
tive production of COL is difficult because the hydrogenation
of the C=C bond is thermodynamically favored over that of
the C=O moiety.[1,4] Moreover, acetals and other unidentified
high-molecular-weight compounds can also be produced in
large quantities in these reactions.[4, 5] Although much research
has already been focused on this issue, the selective hydroge-
nation of a,b-unsaturated aldehydes remains a challenge.
The selective hydrogenation of a,b-unsaturated aldehydes
toward the unsaturated alcohol can be achieved with homoge-
neous catalysts such as metal hydrides, aluminium isopropox-
ide, and others.[6, 7] However, it is desirable to develop an equal-
ly selective heterogeneous catalyst as these are easier to
handle and separate from the products. To this end, a large
number of studies on supported catalysts based on Pt, Rh, Au,
Ru, and Pd active phases have been reported.[8–12] Cordier et al.
reported that the selectivity for COL production from CAL hy-
drogenation follows the sequence Os> Ir>Pt>Ru>Rh>
Pd,[13,14] a trend that was correlated with the width of the d-
band of the metal (Pd<Pt< Ir, Os). Many other studies have
targeted supported Pt catalysts because of their high activity
and moderate selectivity.
In addition to the different metals that can be used to con-
trol selectivity in CAL hydrogenation processes, the supports
may play an important role to define the selectivity. Indeed,
differences in activity and selectivity may be obtained by vary-
ing the nature of the interaction between the support and
nanoparticles (NPs). For instance, the selectivity toward COL
production may be enhanced by using reducible oxides such
as CeO2,[15] MnO2,
[16] SnO2,[17] TiO2,
[18] and ZnO[19] because of the
electron transfer that takes place between these supports and
Catalysts made of Pt nanoparticles dispersed on graphene
(X wt%Pt/G, X=2.0, 3.5, and 5.0) were prepared and character-
ized by XRD, Raman spectroscopy, BET surface area measure-
ments, TEM, and X-ray photoelectron spectroscopy (XPS), and
a 3.5 wt% Pt supported on Vulcan Carbon catalyst (3.5 wt%Pt/
VC) was included as a reference. Although the mean Pt nano-
particle size is approximately 4.4 nm for all X wt%Pt/G and
3.5 wt%Pt/VC catalysts, cinnamal alcohol was produced with
high selectivity only with the graphene-supported catalysts :
92% conversion and 88% selectivity toward cinnamal alcohol
were obtained with 3.5 wt%Pt/G. This catalyst also showed
good stability in recycling tests. The good selectivity observed
with the graphene-based catalysts is attributed to the higher
fraction of reduced surface Pt0 atoms seen on the surface of
the Pt nanoparticles (determined by XPS). This interpretation is
consistent with DFT calculations. Additional p–p interactions
between cinnamaldehyde and graphene may also play a role
in the selective hydrogenation of cinnamaldehyde.
Scheme 1. Hydrogenation of CAL.
[a] X. Ji, Dr. X. Niu, Q. Han, Prof. F. Yuan, Prof. Y. Zhu, H. Fu
Key Laboratory of Functional Inorganic Material Chemistry
(Heilongjiang University), Ministry of Education
School of Chemistry and Materials
Heilongjiang University
72 Xuefu Road, Harbin 150080 (China)
E-mail : [email protected]
[b] Prof. F. Zaera
Department of Chemistry
University of California, Riverside
900 University Avenue, Riverside, California 92521 (United States)
E-mail : [email protected]
[c] Dr. B. Li
Shenyang National Laboratory for Materials Science
Institute of Metal Research, Chinese Academy of Sciences
72 Wenhua Road, Shenyang 110016 (China)
E-mail : [email protected]
Supporting information for this article is available on the WWW underhttp://dx.doi.org/10.1002/cctc.201402573.
� 2014 Wiley-VCH Verlag GmbH&Co. KGaA, Weinheim ChemCatChem 2014, 6, 3246 – 3253 3246
CHEMCATCHEM
FULL PAPERS
the metallic phase. Moreover, weak Lewis sites on the support,
especially in the vicinity of the Pt NPs, may aid in the adsorp-
tion of CAL and HALD through an interaction of their polar car-
bonyl function (C=O).[20,21] This adsorption mode could assist in
the preferential formation of alcohols.
In recent years, thanks to their unique structures and prop-
erties, advanced carbon materials such as carbon nanofibers
(CNF), carbon nanotubes (CNT), and graphene have attracted
a great deal of attention as possible materials for metal-free
heterogeneous catalysts,[22,23] electrochemical energy storage
devices,[24] and fuel cells.[25,26] In particular, graphene, a two-di-
mensional planar carbon material first obtained from graphite
in 2004, is regarded as a promising electrocatalytic materi-
al.[27,28] Graphene can interact strongly with both transition
metals and aromatic compounds: theoretical calculations and
experimental results have indicated that some electron transfer
may occur between the supported Pt NPs and the graphene
support,[29,30] and thanks to the large p system of graphene,
guest molecules with p orbitals can be adsorbed readily on its
surface by p–p interactions.[31,32] In one case, Li et al.[33] ex-
plained the excellent catalytic performance seen for the cata-
lytic reduction of 4-nitrophenol (4-NP) with a Au/graphene hy-
drogel solid by the high adsorption ability of graphene to-
wards 4-NP and a synergistic effect between the graphene and
the Au NPs.
In the hydrogenation of CAL, it could be envisioned that the
aromatic ring may interact through its p electrons with the
basal plane of graphene to facilitate a flat adsorption geome-
try,[34] which provides a unique geometrical arrangement for
the potential selective hydrogenation of the carbonyl group by
adjacent Pt NPs. Indeed, previous publications of CAL hydroge-
nation on reduced graphene oxide catalysts have reported
a good selective performance.[35] However, the effect
of the Pt species and the interaction between Pt and
reduced graphene oxide on the catalytic activity
were not discussed in detail.[35] To test this hypothe-
sis, a number of Pt/graphene catalysts were prepared
and used for the selective hydrogenation of CAL. The
catalytic performance of the graphene support was
contrasted with that of other more conventional
carbon-containing solids, and the effect of Pt loading
was evaluated in terms of catalytic activity and selec-
tivity and interpreted with the help of theoretical
calculations.
Results
Catalyst characterization
Catalysts made of Pt NPs dispersed on graphene (X wt%Pt/G,
X=2.0, 3.5, and 5.0) were prepared, and a 3.5 wt% Pt support-
ed on Vulcan Carbon catalyst (3.5 wt%Pt/VC) was synthesized
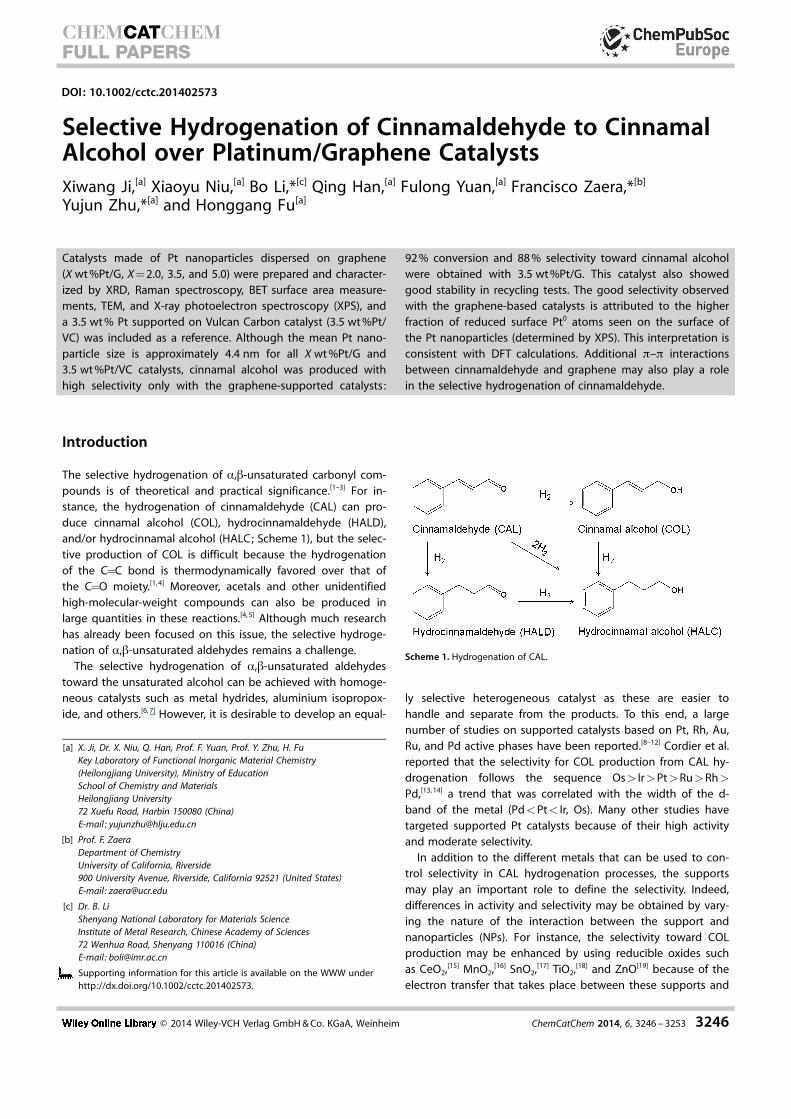
as a reference. The XRD patterns obtained for 3.5 wt%Pt/G
and 3.5 wt%Pt/VC are shown in Figure 1. The diffraction peaks
seen at 2q=26.4 (002) and 54.68 (004) in the pattern of the
graphene-based sample are characteristic of the parallel gra-
phene layers, whereas the diffraction peaks at 2q=42.5 (100)
and 77.48 (110) correspond to the 2D in-plane symmetry
along the graphene sheets.[36] Although some broad features
caused by carbon are seen in the XRD pattern of 3.5 wt%Pt/
VC, it is clear that the as-prepared graphene support has
a better crystallinity than the VC support. Additional diffraction
peaks were seen in the patterns of both catalysts at around
2q=39.7, 46.4, and 67.58, which correspond to the (111),
(200), and (220) crystalline planes of the face-centered cubic
(fcc) Pt particles, respectively.[26] The average diameters of the
Pt NPs (calculated by using the full width at half maximum of
the Pt(111) reflection and Scherrer’s equation[37]) are approxi-
mately 3.8 and 4.3 nm for 3.5 wt%Pt/VC and 3.5 wt%Pt/G, re-
spectively (Table 1).
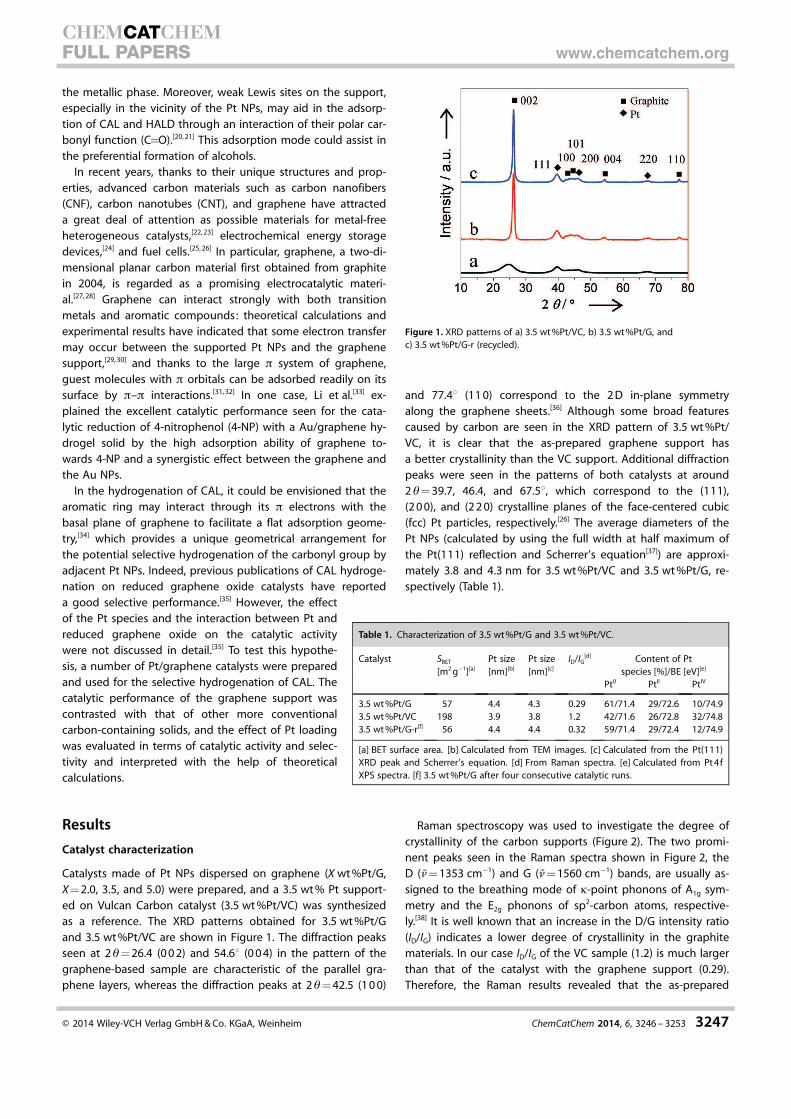
Raman spectroscopy was used to investigate the degree of
crystallinity of the carbon supports (Figure 2). The two promi-
nent peaks seen in the Raman spectra shown in Figure 2, the
D (n=1353 cmÿ1) and G (n=1560 cmÿ1) bands, are usually as-
signed to the breathing mode of k-point phonons of A1g sym-
metry and the E2g phonons of sp2-carbon atoms, respective-
ly.[38] It is well known that an increase in the D/G intensity ratio
(ID/IG) indicates a lower degree of crystallinity in the graphite
materials. In our case ID/IG of the VC sample (1.2) is much larger
than that of the catalyst with the graphene support (0.29).
Therefore, the Raman results revealed that the as-prepared
Table 1. Characterization of 3.5 wt%Pt/G and 3.5 wt%Pt/VC.
Catalyst SBET[m2gÿ1][a]
Pt size[nm][b]
Pt size[nm][c]
ID/IG[d] Content of Pt
species [%]/BE [eV][e]
Pt0 PtII PtIV
3.5 wt%Pt/G 57 4.4 4.3 0.29 61/71.4 29/72.6 10/74.93.5 wt%Pt/VC 198 3.9 3.8 1.2 42/71.6 26/72.8 32/74.83.5 wt%Pt/G-r[f] 56 4.4 4.4 0.32 59/71.4 29/72.4 12/74.9
[a] BET surface area. [b] Calculated from TEM images. [c] Calculated from the Pt(111)XRD peak and Scherrer’s equation. [d] From Raman spectra. [e] Calculated from Pt4fXPS spectra. [f] 3.5 wt%Pt/G after four consecutive catalytic runs.
Figure 1. XRD patterns of a) 3.5 wt%Pt/VC, b) 3.5 wt%Pt/G, andc) 3.5 wt%Pt/G-r (recycled).
� 2014 Wiley-VCH Verlag GmbH&Co. KGaA, Weinheim ChemCatChem 2014, 6, 3246 – 3253 3247
CHEMCATCHEM
FULL PAPERS www.chemcatchem.org
graphene catalyst has a higher degree of crystallinity than that
with the VC support, in agreement with the XRD analysis.
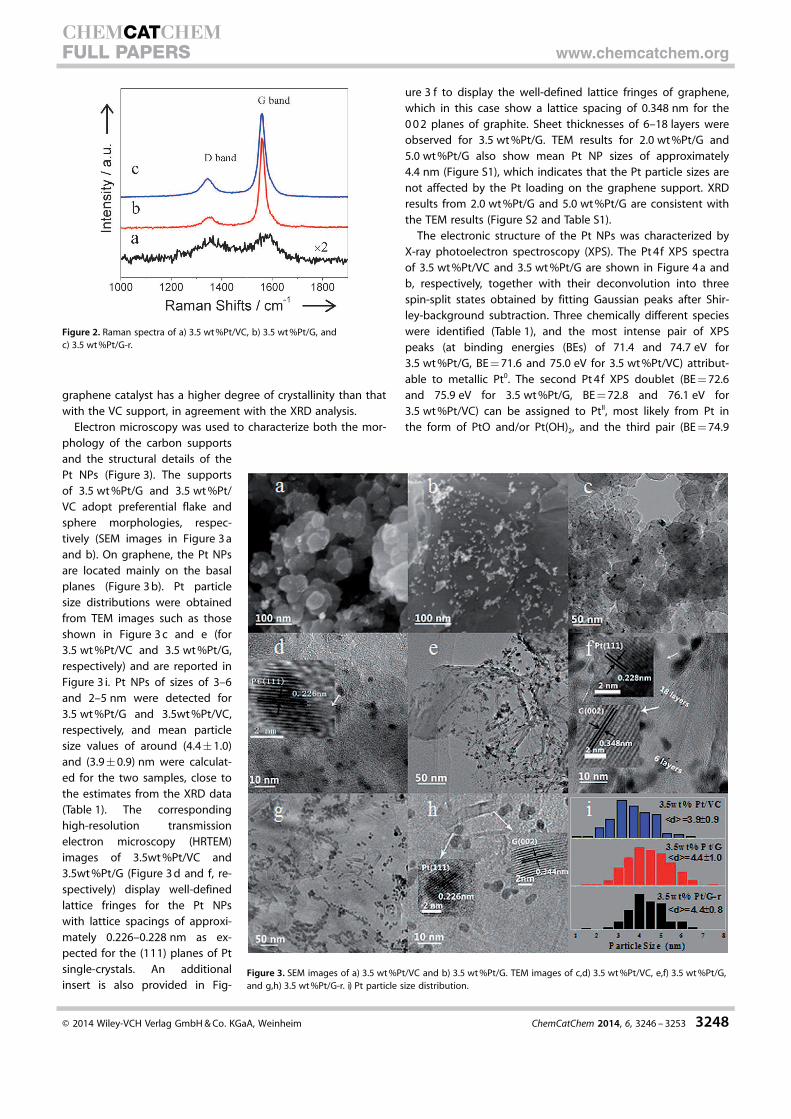
Electron microscopy was used to characterize both the mor-
phology of the carbon supports
and the structural details of the
Pt NPs (Figure 3). The supports
of 3.5 wt%Pt/G and 3.5 wt%Pt/
VC adopt preferential flake and
sphere morphologies, respec-
tively (SEM images in Figure 3a
and b). On graphene, the Pt NPs
are located mainly on the basal
planes (Figure 3b). Pt particle
size distributions were obtained
from TEM images such as those
shown in Figure 3c and e (for
3.5 wt%Pt/VC and 3.5 wt%Pt/G,
respectively) and are reported in
Figure 3 i. Pt NPs of sizes of 3–6
and 2–5 nm were detected for
3.5 wt%Pt/G and 3.5wt%Pt/VC,
respectively, and mean particle
size values of around (4.4�1.0)
and (3.9�0.9) nm were calculat-
ed for the two samples, close to
the estimates from the XRD data
(Table 1). The corresponding
high-resolution transmission
electron microscopy (HRTEM)
images of 3.5wt%Pt/VC and
3.5wt%Pt/G (Figure 3d and f, re-
spectively) display well-defined
lattice fringes for the Pt NPs
with lattice spacings of approxi-
mately 0.226–0.228 nm as ex-
pected for the (111) planes of Pt
single-crystals. An additional
insert is also provided in Fig-
ure 3 f to display the well-defined lattice fringes of graphene,
which in this case show a lattice spacing of 0.348 nm for the
002 planes of graphite. Sheet thicknesses of 6–18 layers were
observed for 3.5 wt%Pt/G. TEM results for 2.0 wt%Pt/G and
5.0 wt%Pt/G also show mean Pt NP sizes of approximately
4.4 nm (Figure S1), which indicates that the Pt particle sizes are
not affected by the Pt loading on the graphene support. XRD
results from 2.0 wt%Pt/G and 5.0 wt%Pt/G are consistent with
the TEM results (Figure S2 and Table S1).
The electronic structure of the Pt NPs was characterized by
X-ray photoelectron spectroscopy (XPS). The Pt4f XPS spectra
of 3.5 wt%Pt/VC and 3.5 wt%Pt/G are shown in Figure 4a and
b, respectively, together with their deconvolution into three
spin-split states obtained by fitting Gaussian peaks after Shir-
ley-background subtraction. Three chemically different species
were identified (Table 1), and the most intense pair of XPS
peaks (at binding energies (BEs) of 71.4 and 74.7 eV for
3.5 wt%Pt/G, BE=71.6 and 75.0 eV for 3.5 wt%Pt/VC) attribut-
able to metallic Pt0. The second Pt4f XPS doublet (BE=72.6
and 75.9 eV for 3.5 wt%Pt/G, BE=72.8 and 76.1 eV for
3.5 wt%Pt/VC) can be assigned to PtII, most likely from Pt in
the form of PtO and/or Pt(OH)2, and the third pair (BE=74.9
Figure 2. Raman spectra of a) 3.5 wt%Pt/VC, b) 3.5 wt%Pt/G, andc) 3.5 wt%Pt/G-r.
Figure 3. SEM images of a) 3.5 wt%Pt/VC and b) 3.5 wt%Pt/G. TEM images of c,d) 3.5 wt%Pt/VC, e,f) 3.5 wt%Pt/G,and g,h) 3.5 wt%Pt/G-r. i) Pt particle size distribution.
� 2014 Wiley-VCH Verlag GmbH&Co. KGaA, Weinheim ChemCatChem 2014, 6, 3246 – 3253 3248
CHEMCATCHEM
FULL PAPERS www.chemcatchem.org
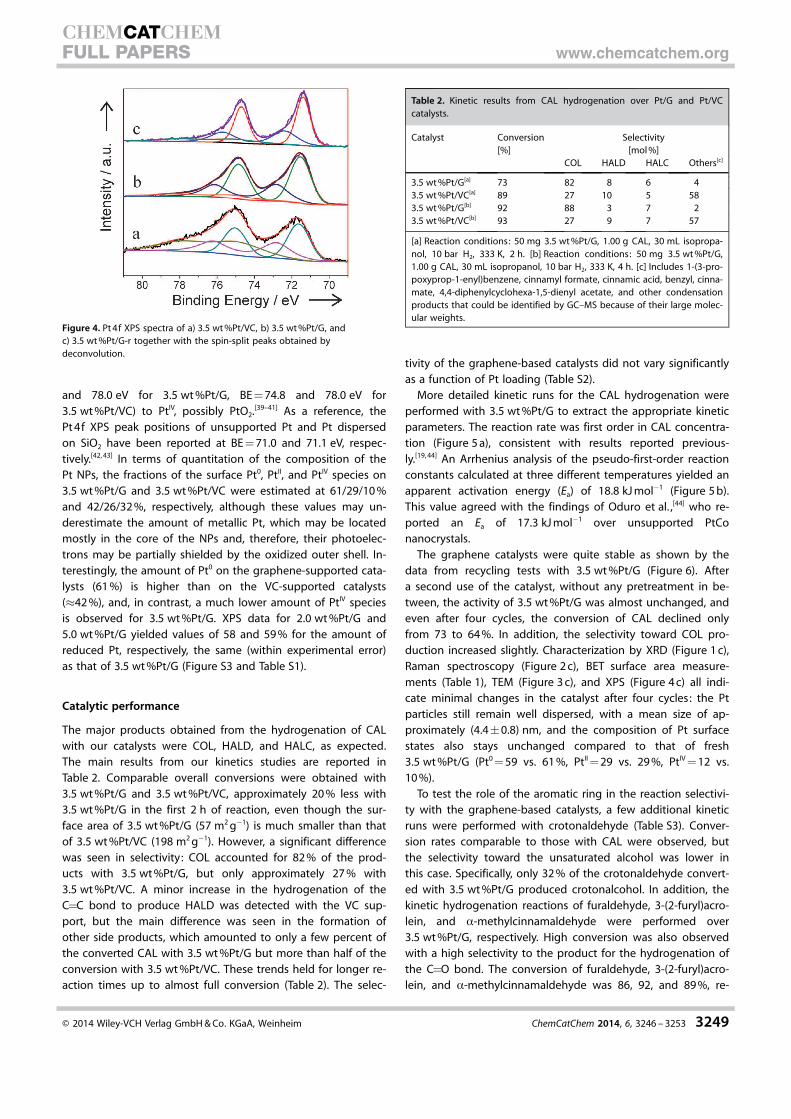
and 78.0 eV for 3.5 wt%Pt/G, BE=74.8 and 78.0 eV for
3.5 wt%Pt/VC) to PtIV, possibly PtO2.[39–41] As a reference, the
Pt4f XPS peak positions of unsupported Pt and Pt dispersed
on SiO2 have been reported at BE=71.0 and 71.1 eV, respec-
tively.[42,43] In terms of quantitation of the composition of the
Pt NPs, the fractions of the surface Pt0, PtII, and PtIV species on
3.5 wt%Pt/G and 3.5 wt%Pt/VC were estimated at 61/29/10%
and 42/26/32%, respectively, although these values may un-
derestimate the amount of metallic Pt, which may be located
mostly in the core of the NPs and, therefore, their photoelec-
trons may be partially shielded by the oxidized outer shell. In-
terestingly, the amount of Pt0 on the graphene-supported cata-
lysts (61%) is higher than on the VC-supported catalysts
(�42%), and, in contrast, a much lower amount of PtIV species
is observed for 3.5 wt%Pt/G. XPS data for 2.0 wt%Pt/G and
5.0 wt%Pt/G yielded values of 58 and 59% for the amount of
reduced Pt, respectively, the same (within experimental error)
as that of 3.5 wt%Pt/G (Figure S3 and Table S1).
Catalytic performance
The major products obtained from the hydrogenation of CAL
with our catalysts were COL, HALD, and HALC, as expected.
The main results from our kinetics studies are reported in
Table 2. Comparable overall conversions were obtained with
3.5 wt%Pt/G and 3.5 wt%Pt/VC, approximately 20% less with
3.5 wt%Pt/G in the first 2 h of reaction, even though the sur-
face area of 3.5 wt%Pt/G (57 m2gÿ1) is much smaller than that
of 3.5 wt%Pt/VC (198 m2gÿ1). However, a significant difference
was seen in selectivity: COL accounted for 82% of the prod-
ucts with 3.5 wt%Pt/G, but only approximately 27% with
3.5 wt%Pt/VC. A minor increase in the hydrogenation of the
C=C bond to produce HALD was detected with the VC sup-
port, but the main difference was seen in the formation of
other side products, which amounted to only a few percent of
the converted CAL with 3.5 wt%Pt/G but more than half of the
conversion with 3.5 wt%Pt/VC. These trends held for longer re-
action times up to almost full conversion (Table 2). The selec-
tivity of the graphene-based catalysts did not vary significantly
as a function of Pt loading (Table S2).
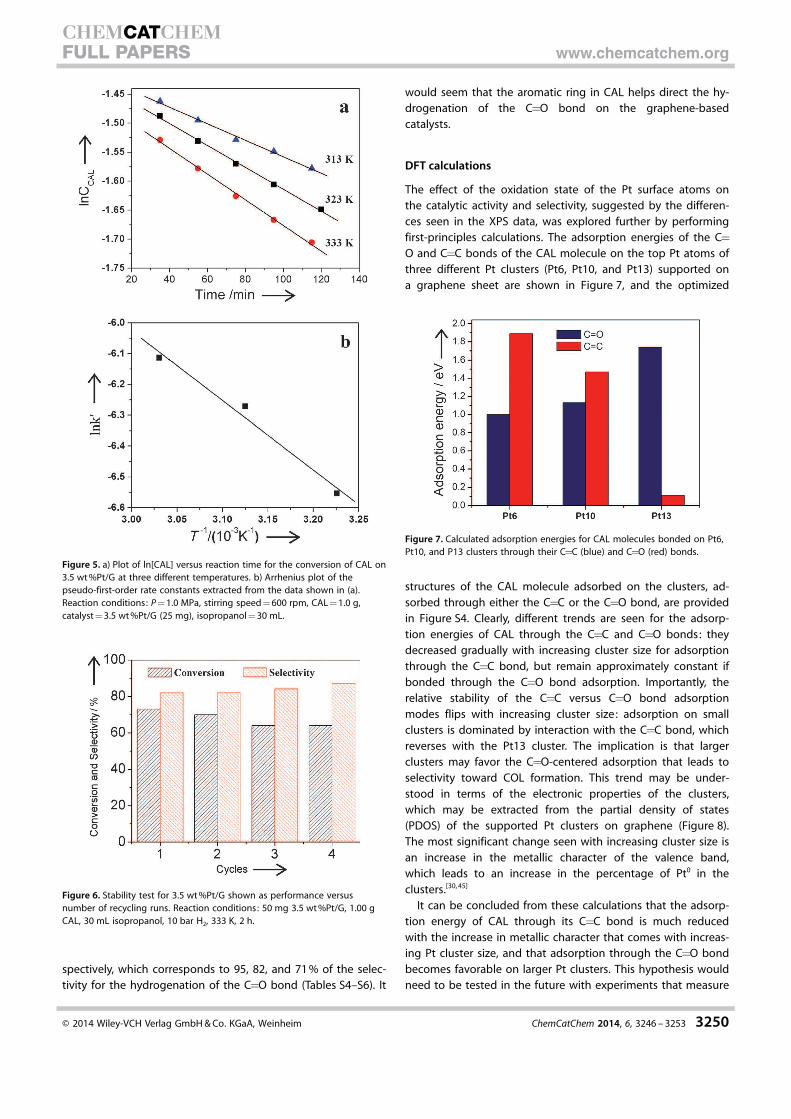
More detailed kinetic runs for the CAL hydrogenation were
performed with 3.5 wt%Pt/G to extract the appropriate kinetic
parameters. The reaction rate was first order in CAL concentra-
tion (Figure 5a), consistent with results reported previous-
ly.[19,44] An Arrhenius analysis of the pseudo-first-order reaction
constants calculated at three different temperatures yielded an
apparent activation energy (Ea) of 18.8 kJmolÿ1 (Figure 5b).
This value agreed with the findings of Oduro et al. ,[44] who re-
ported an Ea of 17.3 kJmolÿ1 over unsupported PtCo
nanocrystals.
The graphene catalysts were quite stable as shown by the
data from recycling tests with 3.5 wt%Pt/G (Figure 6). After
a second use of the catalyst, without any pretreatment in be-
tween, the activity of 3.5 wt%Pt/G was almost unchanged, and
even after four cycles, the conversion of CAL declined only
from 73 to 64%. In addition, the selectivity toward COL pro-
duction increased slightly. Characterization by XRD (Figure 1c),
Raman spectroscopy (Figure 2c), BET surface area measure-
ments (Table 1), TEM (Figure 3c), and XPS (Figure 4c) all indi-
cate minimal changes in the catalyst after four cycles: the Pt
particles still remain well dispersed, with a mean size of ap-
proximately (4.4�0.8) nm, and the composition of Pt surface
states also stays unchanged compared to that of fresh
3.5 wt%Pt/G (Pt0=59 vs. 61%, PtII=29 vs. 29%, PtIV=12 vs.
10%).
To test the role of the aromatic ring in the reaction selectivi-
ty with the graphene-based catalysts, a few additional kinetic
runs were performed with crotonaldehyde (Table S3). Conver-
sion rates comparable to those with CAL were observed, but
the selectivity toward the unsaturated alcohol was lower in
this case. Specifically, only 32% of the crotonaldehyde convert-
ed with 3.5 wt%Pt/G produced crotonalcohol. In addition, the
kinetic hydrogenation reactions of furaldehyde, 3-(2-furyl)acro-
lein, and a-methylcinnamaldehyde were performed over
3.5 wt%Pt/G, respectively. High conversion was also observed
with a high selectivity to the product for the hydrogenation of
the C=O bond. The conversion of furaldehyde, 3-(2-furyl)acro-
lein, and a-methylcinnamaldehyde was 86, 92, and 89%, re-
Table 2. Kinetic results from CAL hydrogenation over Pt/G and Pt/VCcatalysts.
Catalyst Conversion[%]
Selectivity[mol%]
COL HALD HALC Others[c]
3.5 wt%Pt/G[a] 73 82 8 6 43.5 wt%Pt/VC[a] 89 27 10 5 583.5 wt%Pt/G[b] 92 88 3 7 23.5 wt%Pt/VC[b] 93 27 9 7 57
[a] Reaction conditions: 50 mg 3.5 wt%Pt/G, 1.00 g CAL, 30 mL isopropa-nol, 10 bar H2, 333 K, 2 h. [b] Reaction conditions: 50 mg 3.5 wt%Pt/G,1.00 g CAL, 30 mL isopropanol, 10 bar H2, 333 K, 4 h. [c] Includes 1-(3-pro-poxyprop-1-enyl)benzene, cinnamyl formate, cinnamic acid, benzyl, cinna-mate, 4,4-diphenylcyclohexa-1,5-dienyl acetate, and other condensationproducts that could be identified by GC–MS because of their large molec-ular weights.
Figure 4. Pt4f XPS spectra of a) 3.5 wt%Pt/VC, b) 3.5 wt%Pt/G, andc) 3.5 wt%Pt/G-r together with the spin-split peaks obtained bydeconvolution.
� 2014 Wiley-VCH Verlag GmbH&Co. KGaA, Weinheim ChemCatChem 2014, 6, 3246 – 3253 3249
CHEMCATCHEM
FULL PAPERS www.chemcatchem.org
spectively, which corresponds to 95, 82, and 71% of the selec-
tivity for the hydrogenation of the C=O bond (Tables S4–S6). It
would seem that the aromatic ring in CAL helps direct the hy-
drogenation of the C=O bond on the graphene-based
catalysts.
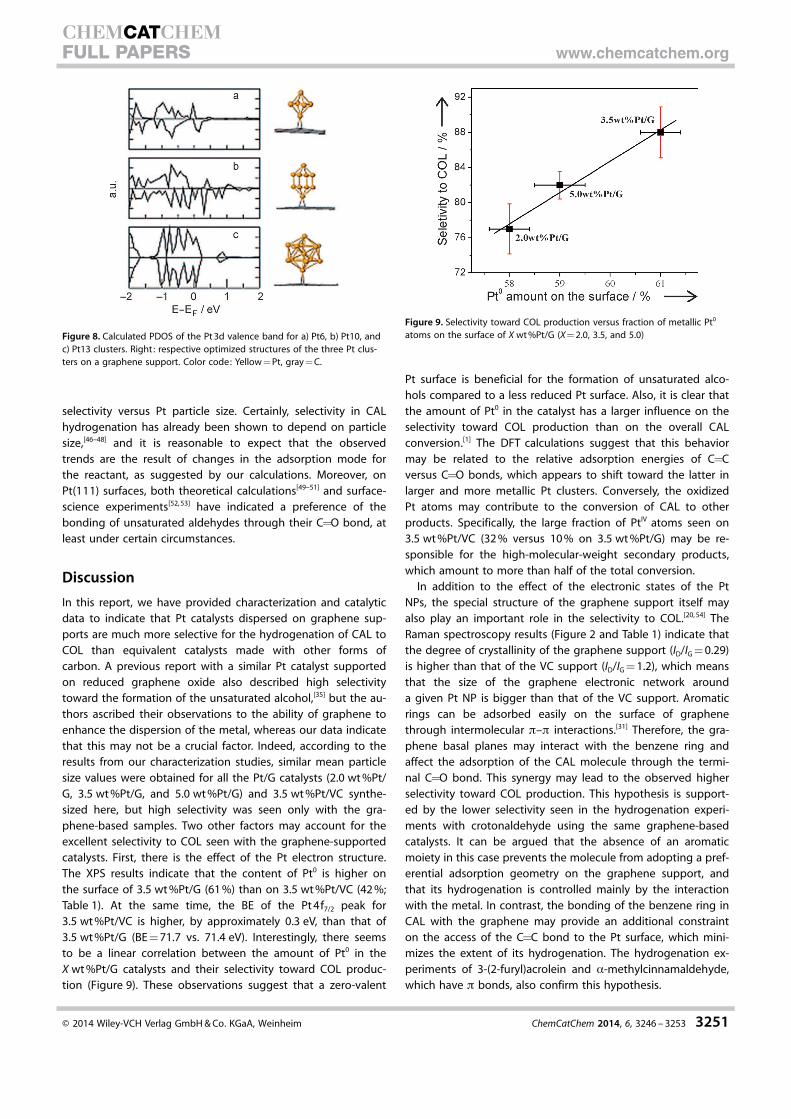
DFT calculations
The effect of the oxidation state of the Pt surface atoms on
the catalytic activity and selectivity, suggested by the differen-
ces seen in the XPS data, was explored further by performing
first-principles calculations. The adsorption energies of the C=
O and C=C bonds of the CAL molecule on the top Pt atoms of
three different Pt clusters (Pt6, Pt10, and Pt13) supported on
a graphene sheet are shown in Figure 7, and the optimized
structures of the CAL molecule adsorbed on the clusters, ad-
sorbed through either the C=C or the C=O bond, are provided
in Figure S4. Clearly, different trends are seen for the adsorp-
tion energies of CAL through the C=C and C=O bonds: they
decreased gradually with increasing cluster size for adsorption
through the C=C bond, but remain approximately constant if
bonded through the C=O bond adsorption. Importantly, the
relative stability of the C=C versus C=O bond adsorption
modes flips with increasing cluster size: adsorption on small
clusters is dominated by interaction with the C=C bond, which
reverses with the Pt13 cluster. The implication is that larger
clusters may favor the C=O-centered adsorption that leads to
selectivity toward COL formation. This trend may be under-
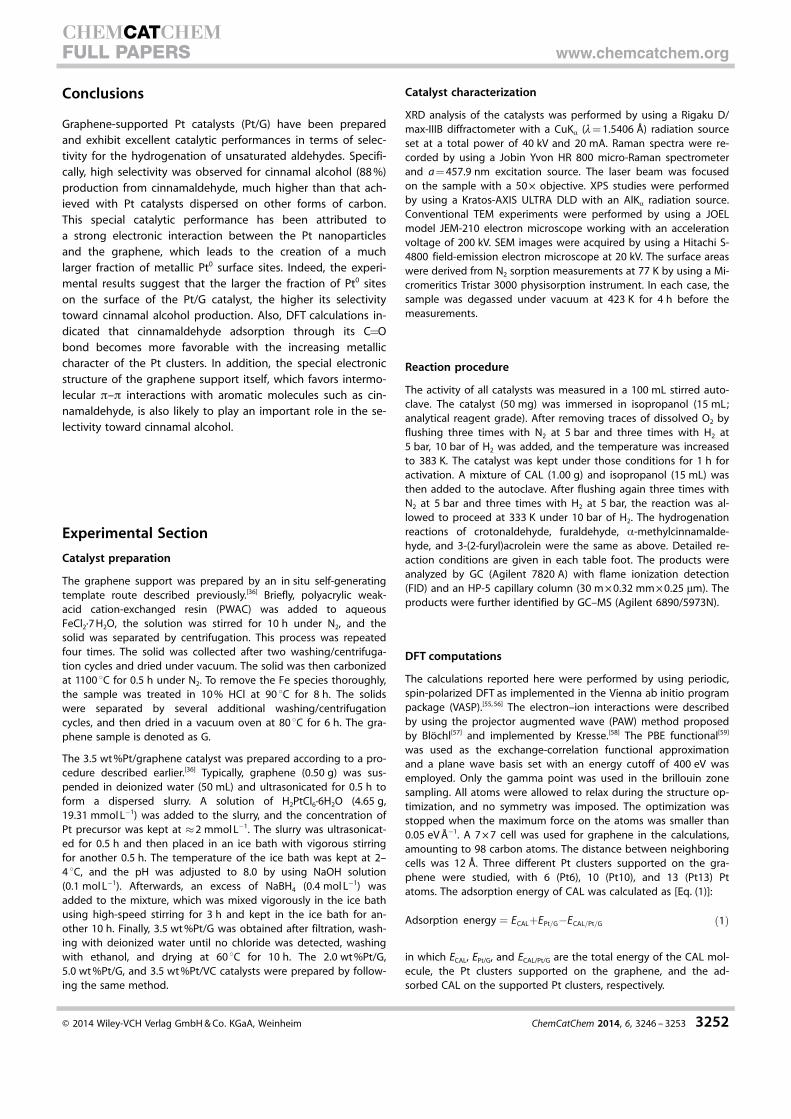
stood in terms of the electronic properties of the clusters,
which may be extracted from the partial density of states
(PDOS) of the supported Pt clusters on graphene (Figure 8).
The most significant change seen with increasing cluster size is
an increase in the metallic character of the valence band,
which leads to an increase in the percentage of Pt0 in the
clusters.[30,45]
It can be concluded from these calculations that the adsorp-
tion energy of CAL through its C=C bond is much reduced
with the increase in metallic character that comes with increas-
ing Pt cluster size, and that adsorption through the C=O bond
becomes favorable on larger Pt clusters. This hypothesis would
need to be tested in the future with experiments that measure
Figure 5. a) Plot of ln[CAL] versus reaction time for the conversion of CAL on3.5 wt%Pt/G at three different temperatures. b) Arrhenius plot of thepseudo-first-order rate constants extracted from the data shown in (a).Reaction conditions: P=1.0 MPa, stirring speed=600 rpm, CAL=1.0 g,catalyst=3.5 wt%Pt/G (25 mg), isopropanol=30 mL.
Figure 6. Stability test for 3.5 wt%Pt/G shown as performance versusnumber of recycling runs. Reaction conditions: 50 mg 3.5 wt%Pt/G, 1.00 gCAL, 30 mL isopropanol, 10 bar H2, 333 K, 2 h.
Figure 7. Calculated adsorption energies for CAL molecules bonded on Pt6,Pt10, and P13 clusters through their C=C (blue) and C=O (red) bonds.
� 2014 Wiley-VCH Verlag GmbH&Co. KGaA, Weinheim ChemCatChem 2014, 6, 3246 – 3253 3250
CHEMCATCHEM
FULL PAPERS www.chemcatchem.org
selectivity versus Pt particle size. Certainly, selectivity in CAL
hydrogenation has already been shown to depend on particle
size,[46–48] and it is reasonable to expect that the observed
trends are the result of changes in the adsorption mode for
the reactant, as suggested by our calculations. Moreover, on
Pt(111) surfaces, both theoretical calculations[49–51] and surface-
science experiments[52,53] have indicated a preference of the
bonding of unsaturated aldehydes through their C=O bond, at
least under certain circumstances.
Discussion
In this report, we have provided characterization and catalytic
data to indicate that Pt catalysts dispersed on graphene sup-
ports are much more selective for the hydrogenation of CAL to
COL than equivalent catalysts made with other forms of
carbon. A previous report with a similar Pt catalyst supported
on reduced graphene oxide also described high selectivity
toward the formation of the unsaturated alcohol,[35] but the au-
thors ascribed their observations to the ability of graphene to
enhance the dispersion of the metal, whereas our data indicate
that this may not be a crucial factor. Indeed, according to the
results from our characterization studies, similar mean particle
size values were obtained for all the Pt/G catalysts (2.0 wt%Pt/
G, 3.5 wt%Pt/G, and 5.0 wt%Pt/G) and 3.5 wt%Pt/VC synthe-
sized here, but high selectivity was seen only with the gra-
phene-based samples. Two other factors may account for the
excellent selectivity to COL seen with the graphene-supported
catalysts. First, there is the effect of the Pt electron structure.
The XPS results indicate that the content of Pt0 is higher on
the surface of 3.5 wt%Pt/G (61%) than on 3.5 wt%Pt/VC (42%;
Table 1). At the same time, the BE of the Pt4f7/2 peak for
3.5 wt%Pt/VC is higher, by approximately 0.3 eV, than that of
3.5 wt%Pt/G (BE=71.7 vs. 71.4 eV). Interestingly, there seems
to be a linear correlation between the amount of Pt0 in the
X wt%Pt/G catalysts and their selectivity toward COL produc-
tion (Figure 9). These observations suggest that a zero-valent
Pt surface is beneficial for the formation of unsaturated alco-
hols compared to a less reduced Pt surface. Also, it is clear that
the amount of Pt0 in the catalyst has a larger influence on the
selectivity toward COL production than on the overall CAL
conversion.[1] The DFT calculations suggest that this behavior
may be related to the relative adsorption energies of C=C
versus C=O bonds, which appears to shift toward the latter in
larger and more metallic Pt clusters. Conversely, the oxidized
Pt atoms may contribute to the conversion of CAL to other
products. Specifically, the large fraction of PtIV atoms seen on
3.5 wt%Pt/VC (32% versus 10% on 3.5 wt%Pt/G) may be re-
sponsible for the high-molecular-weight secondary products,
which amount to more than half of the total conversion.
In addition to the effect of the electronic states of the Pt
NPs, the special structure of the graphene support itself may
also play an important role in the selectivity to COL.[20,54] The
Raman spectroscopy results (Figure 2 and Table 1) indicate that
the degree of crystallinity of the graphene support (ID/IG=0.29)
is higher than that of the VC support (ID/IG=1.2), which means
that the size of the graphene electronic network around
a given Pt NP is bigger than that of the VC support. Aromatic
rings can be adsorbed easily on the surface of graphene
through intermolecular p–p interactions.[31] Therefore, the gra-
phene basal planes may interact with the benzene ring and
affect the adsorption of the CAL molecule through the termi-
nal C=O bond. This synergy may lead to the observed higher
selectivity toward COL production. This hypothesis is support-
ed by the lower selectivity seen in the hydrogenation experi-
ments with crotonaldehyde using the same graphene-based
catalysts. It can be argued that the absence of an aromatic
moiety in this case prevents the molecule from adopting a pref-
erential adsorption geometry on the graphene support, and
that its hydrogenation is controlled mainly by the interaction
with the metal. In contrast, the bonding of the benzene ring in
CAL with the graphene may provide an additional constraint
on the access of the C=C bond to the Pt surface, which mini-
mizes the extent of its hydrogenation. The hydrogenation ex-
periments of 3-(2-furyl)acrolein and a-methylcinnamaldehyde,
which have p bonds, also confirm this hypothesis.
Figure 8. Calculated PDOS of the Pt3d valence band for a) Pt6, b) Pt10, andc) Pt13 clusters. Right: respective optimized structures of the three Pt clus-ters on a graphene support. Color code: Yellow=Pt, gray=C.
Figure 9. Selectivity toward COL production versus fraction of metallic Pt0
atoms on the surface of X wt%Pt/G (X=2.0, 3.5, and 5.0)
� 2014 Wiley-VCH Verlag GmbH&Co. KGaA, Weinheim ChemCatChem 2014, 6, 3246 – 3253 3251
CHEMCATCHEM
FULL PAPERS www.chemcatchem.org
Conclusions
Graphene-supported Pt catalysts (Pt/G) have been prepared
and exhibit excellent catalytic performances in terms of selec-
tivity for the hydrogenation of unsaturated aldehydes. Specifi-
cally, high selectivity was observed for cinnamal alcohol (88%)
production from cinnamaldehyde, much higher than that ach-
ieved with Pt catalysts dispersed on other forms of carbon.
This special catalytic performance has been attributed to
a strong electronic interaction between the Pt nanoparticles
and the graphene, which leads to the creation of a much
larger fraction of metallic Pt0 surface sites. Indeed, the experi-
mental results suggest that the larger the fraction of Pt0 sites
on the surface of the Pt/G catalyst, the higher its selectivity
toward cinnamal alcohol production. Also, DFT calculations in-
dicated that cinnamaldehyde adsorption through its C=O
bond becomes more favorable with the increasing metallic
character of the Pt clusters. In addition, the special electronic
structure of the graphene support itself, which favors intermo-
lecular p–p interactions with aromatic molecules such as cin-
namaldehyde, is also likely to play an important role in the se-
lectivity toward cinnamal alcohol.
Experimental Section
Catalyst preparation
The graphene support was prepared by an in situ self-generatingtemplate route described previously.[36] Briefly, polyacrylic weak-acid cation-exchanged resin (PWAC) was added to aqueousFeCl2·7H2O, the solution was stirred for 10 h under N2, and thesolid was separated by centrifugation. This process was repeatedfour times. The solid was collected after two washing/centrifuga-tion cycles and dried under vacuum. The solid was then carbonizedat 1100 8C for 0.5 h under N2. To remove the Fe species thoroughly,the sample was treated in 10% HCl at 90 8C for 8 h. The solidswere separated by several additional washing/centrifugationcycles, and then dried in a vacuum oven at 80 8C for 6 h. The gra-phene sample is denoted as G.
The 3.5 wt%Pt/graphene catalyst was prepared according to a pro-cedure described earlier.[36] Typically, graphene (0.50 g) was sus-pended in deionized water (50 mL) and ultrasonicated for 0.5 h toform a dispersed slurry. A solution of H2PtCl6·6H2O (4.65 g,19.31 mmolLÿ1) was added to the slurry, and the concentration ofPt precursor was kept at �2 mmolLÿ1. The slurry was ultrasonicat-ed for 0.5 h and then placed in an ice bath with vigorous stirringfor another 0.5 h. The temperature of the ice bath was kept at 2–4 8C, and the pH was adjusted to 8.0 by using NaOH solution(0.1 molLÿ1). Afterwards, an excess of NaBH4 (0.4 molLÿ1) wasadded to the mixture, which was mixed vigorously in the ice bathusing high-speed stirring for 3 h and kept in the ice bath for an-other 10 h. Finally, 3.5 wt%Pt/G was obtained after filtration, wash-ing with deionized water until no chloride was detected, washingwith ethanol, and drying at 60 8C for 10 h. The 2.0 wt%Pt/G,5.0 wt%Pt/G, and 3.5 wt%Pt/VC catalysts were prepared by follow-ing the same method.
Catalyst characterization
XRD analysis of the catalysts was performed by using a Rigaku D/max-IIIB diffractometer with a CuKa (l=1.5406 �) radiation sourceset at a total power of 40 kV and 20 mA. Raman spectra were re-corded by using a Jobin Yvon HR 800 micro-Raman spectrometerand a=457.9 nm excitation source. The laser beam was focusedon the sample with a 50� objective. XPS studies were performedby using a Kratos-AXIS ULTRA DLD with an AlKa radiation source.Conventional TEM experiments were performed by using a JOELmodel JEM-210 electron microscope working with an accelerationvoltage of 200 kV. SEM images were acquired by using a Hitachi S-4800 field-emission electron microscope at 20 kV. The surface areaswere derived from N2 sorption measurements at 77 K by using a Mi-cromeritics Tristar 3000 physisorption instrument. In each case, thesample was degassed under vacuum at 423 K for 4 h before themeasurements.
Reaction procedure
The activity of all catalysts was measured in a 100 mL stirred auto-clave. The catalyst (50 mg) was immersed in isopropanol (15 mL;analytical reagent grade). After removing traces of dissolved O2 byflushing three times with N2 at 5 bar and three times with H2 at5 bar, 10 bar of H2 was added, and the temperature was increasedto 383 K. The catalyst was kept under those conditions for 1 h foractivation. A mixture of CAL (1.00 g) and isopropanol (15 mL) wasthen added to the autoclave. After flushing again three times withN2 at 5 bar and three times with H2 at 5 bar, the reaction was al-lowed to proceed at 333 K under 10 bar of H2. The hydrogenationreactions of crotonaldehyde, furaldehyde, a-methylcinnamalde-hyde, and 3-(2-furyl)acrolein were the same as above. Detailed re-action conditions are given in each table foot. The products wereanalyzed by GC (Agilent 7820 A) with flame ionization detection(FID) and an HP-5 capillary column (30 m�0.32 mm�0.25 mm). Theproducts were further identified by GC–MS (Agilent 6890/5973N).
DFT computations
The calculations reported here were performed by using periodic,spin-polarized DFT as implemented in the Vienna ab initio programpackage (VASP).[55, 56] The electron–ion interactions were describedby using the projector augmented wave (PAW) method proposedby Blçchl[57] and implemented by Kresse.[58] The PBE functional[59]
was used as the exchange-correlation functional approximationand a plane wave basis set with an energy cutoff of 400 eV wasemployed. Only the gamma point was used in the brillouin zonesampling. All atoms were allowed to relax during the structure op-timization, and no symmetry was imposed. The optimization wasstopped when the maximum force on the atoms was smaller than0.05 eV�ÿ1. A 7�7 cell was used for graphene in the calculations,amounting to 98 carbon atoms. The distance between neighboringcells was 12 �. Three different Pt clusters supported on the gra-phene were studied, with 6 (Pt6), 10 (Pt10), and 13 (Pt13) Ptatoms. The adsorption energy of CAL was calculated as [Eq. (1)]:
Adsorption energy ¼ ECALþEPt=GÿECAL=Pt=G ð1Þ
in which ECAL, EPt/G, and ECAL/Pt/G are the total energy of the CAL mol-ecule, the Pt clusters supported on the graphene, and the ad-sorbed CAL on the supported Pt clusters, respectively.
� 2014 Wiley-VCH Verlag GmbH&Co. KGaA, Weinheim ChemCatChem 2014, 6, 3246 – 3253 3252
CHEMCATCHEM
FULL PAPERS www.chemcatchem.org
Acknowledgements
This work is supported by the Program for New Century Excellent
Talents in Heilongjiang Provincial University (1155-NCET-014), the
Natural Science Foundation of Heilongjiang Province (B200805),
the Foundation of Educational Commission of Heilongjiang Prov-
ince of China (11531286), the Postdoctoral Science-research De-
velopmental Foundation of Heilongjiang Province of China (LBH-
Q12022), the Innovative Research Team in Heilongjiang University
(Hdtd2010-10), the Program for Innovative Research Team in Uni-
versity (IRT-1237), the Technology Foundation for Selected Over-
seas Chinese Scholar, and the Ministry of HRSS of China and the
U. S. National Science Foundation. B.L. is supported by a SYNL-
T.S. K Research Fellowship. B.L. is grateful for a financial grant
from the Institute of Metal Research (Y3NBA211A1). The comput-
ing resource is partly supported by the ShenYang Branch, Super-
computing Center of CAS.
Keywords: graphene · heterogeneous catalysis ·
hydrogenation · platinum · supported catalysts
[1] P. Gallezot, D. Richard, Catal. Rev. Sci. Eng. 1998, 40, 81–126.[2] P. Claus, Top. Catal. 1998, 5, 51–62.[3] U. K. Singh, M. A. Vannice, Appl. Catal. A 2001, 213, 1–24.[4] X. X. Han, R. X. Zhou, B. H. Yue, X. M. Zheng, Catal. Lett. 2006, 109, 157–
161.[5] Y. Li, C. H. Ge, J. Zhao, R. X. Zhou, Catal. Lett. 2008, 126, 280–285.[6] P. Mäki-Arvela, J. Hµjek, T. Salmi, D. Y. Murzin, Appl. Catal. A 2005, 292,
1–49.[7] J. March, Advanced Organic Chemistry, 2nd ed. , McGraw-Hill Kogakusha,
Tokyo, 1977.[8] Y. J. Zhu, F. Zaera, Catal. Sci. Technol. 2014, 4, 955–962.[9] G. R. Bertolini, C. I. Cabello, M. MuÇoz, M. Casella, D. Gazzoli, I. Pettiti, G.
Ferraris, J. Mol. Catal. A 2013, 366, 109–115.[10] T. Mitsudome, K. Kaneda, Green Chem. 2013, 15, 2636–2654.[11] H. Vu, F. GonÅalves, R. Philippe, E. Lamouroux, M. Corrias, Y. Kihn, D.
Plee, P. Kalck, P. Serp, J. Catal. 2006, 240, 18–22.[12] Z. Guo, C. Xiao, R. V. Maligal-Ganesh, L. Zhou, T. W. Goh, X. Li, D. Tesfa-
gaber, A. Thiel, W. Huang, ACS Catal. 2014, 4, 1340–1348.[13] G. Cordier, Y. Colleuille, P. Fouilloux in Catalyse par les MØtaux (Eds. : B.
Imelik, G. A. Martin, A. J. Renouprez), Editions du CNRS, Paris, 1984,p. 349.
[14] G. Cordier (S. A. Rhone-Poulenc, France) F2,329, 628, 1975 ; [Chem.
Abstr. 1977, 87, 38862s].[15] S. Bhogeswararao, D. Srinivas, J. Catal. 2012, 285, 31–40.[16] H. G. Manyar, B. Yang, H. Daly, H. Moor, S. McMonagle, Y. Tao, G. D.
Yadav, A. Goguet, P. Hu, C. Hardacre, ChemCatChem 2013, 5, 506–512.[17] K. Liberkovµ, R. Touroude, J. Mol. Catal. A 2002, 180, 221–230.[18] A. Huidobro, A. Sepffllveda-Escribano, F. Rodríguez-Reinoso, J. Catal.
2002, 212, 94–103.[19] E. V. Ramos-Fernµndez, A. F. P. Ferreira, K. A. F. Sepffllveda-Escribano, F.
Rodríguez-Reinoso, J. Catal. 2008, 258, 52–60.[20] S. Handjani, E. Marceau, J. Blanchard, J. M. Krafft, M. Che, P. Mäki-Arve-
lad, N. Kumard, J. Wärnåd, D. Y. Murzind, J. Catal. 2011, 282, 228–236.[21] Z. Guo, Y. T. Chen, L. S. Li, X. M. Wang, G. L. Hallerb, Y. H. Yang, J. Catal.
2010, 276, 314–326.[22] D. S. Su, J. Zhang, B. Frank, A. Thomas, X. Wang, J. Paraknowwitsch, R.
Schlçgl, ChemSusChem 2010, 3, 169–180.
[23] J. Zhang, X. Liu, R. Blume, A. Zhang, R. Schlçgl, D. S. Su, Science 2008,322, 73–77.
[24] D. S. Su, R. Schlçgl, ChemSusChem 2010, 3, 136–168.[25] R. Wang, J. Yang, K. Shi, B. Wang, L. Wang, G. Tian, B. Bateer, C. Tian, P.
Shen, H. Fu, RSC Adv. 2013, 3, 4771–4777.[26] J. Yang, C. Tian, L. Wang, H. Fu, Mater. Chem. 2011, 21, 3384–3390.[27] K. S. Novoselov, A. K. Geim, S. V. Morozov, D. Jiang, Y. Zhang, S. V. Dubo-
nos, I. V. Grigorieva, A. A. Firsov, Science 2004, 306, 666–669.[28] M. D. Stoller, S. J. Park, Y. W. Zhu, J. H. An, R. S. Ruoff, Nano Lett. 2008, 8,
3498–3502.[29] D. Q. Yang, G. X. Zhang, E. Sacher, M. JosØ-Yacamµn, N. Elizondo, J. Phys.
Chem. B 2006, 110, 8348–8356.[30] G. Ramos-Sanchez, P. B. Balbuena, Phys. Chem. Chem. Phys. 2013, 15,
11950–11959.[31] J. H. Yang, G. Sun, Y. J. Gao, H. B. Zhao, P. Tang, J. Tan, A. H. Lu, D. Ma,
Energy Environ. Sci. 2013, 6, 793–798.[32] Z. Zhang, H. Huang, X. Yang, L. Zang, J. Phys. Chem. Lett. 2011, 2, 2897–
2905.[33] J. Li, C. Liu, Y. J. Liu, Mater. Chem. 2012, 22, 8426–8430.[34] Z. Sun, Z. Rong, Y. Wang, Y. Xia, W. Du, Y. Wang, RSC Adv. 2014, 4,
1874–1878.[35] J. J. Shi, R. F. Nie, P. Chen, Z. Y. Hou, Catal. Commun. 2013, 41, 101–105.[36] L. Wang, C. G. Tian, H. Wang, Y. G. Ma, B. L. Wang, H. G. Fu, J. Phys.
Chem. C 2010, 114, 8727–8733.[37] Z. T. Liu, C. X. Wang, Z. W. Liu, J. Lu, Appl. Catal. A 2008, 344, 114–123.[38] F. Tuinstra, J. L. Koenig, J. Chem. Phys. 1970, 53, 1126–1130.[39] X. M. Feng, R. M. Li, C. H. Hu, W. H. Hou, J. Electroanal. Chem. 2011, 657,
28–33.[40] S. Sharma, A. Ganguly, P. Papakonstantinou, X. M. P. Miao, M. X. Li, J. L.
Hutchison, M. Delichatsios, S. J. Ukleja, J. Phys. Chem. C 2010, 114,19459–19466.
[41] X. W. Yu, S. Y. Ye, J. Power Sources 2007, 172, 145–154.[42] Z. Zhu, F. Tao, F. Zheng, R. Chang, Y. M. Li, L. Heinke, Z. Liu, M. Salmeron,
G. A. Somorjai, Nano Lett. 2012, 12, 1491–1497.[43] F. Y. Zhao, Y. Ikushima, M. Shirai, T. Ebina, M. Arai, J. Mol. Catal. A 2002,
180, 259–265.[44] W. O. Oduro, N. Cailuo, K. M. K. Yu, H. W. Yang, S. C. Tsang, Phys. Chem.
Chem. Phys. 2011, 13, 2590–2602.[45] B. S. Mun, M. Watanabe, M. Rossi, V. Stamenkovic, N. M. Markovic, P. N. J.
Ross, J. Chem. Phys. 2005, 123, 204717.[46] A. J. Plomp, H. Vuori, A. Krause, I. Outi, K. P. de Jong, J. H. Bitter, Appl.
Catal. A 2008, 351, 9–15.[47] A. K. Prashar, S. Mayadevi, D. R. Nandini, Catal. Commun. 2012, 28, 42–
46.[48] Y. Yuan, S. Yao, M. Wang, S. Lou, N. Yan, Curr. Org. Chem. 2013, 17, 400–
413.[49] F. Delbecq, P. Sautet, J. Catal. 2002, 211, 398–406.[50] D. Loffreda, F. Delbecq, F. Vigne, P. Sautet, Angew. Chem. Int. Ed. 2005,
44, 5279–5282; Angew. Chem. 2005, 117, 5413–5416.[51] D. Loffreda, F. Delbecq, F. Vigne, P. Sautet, J. Am. Chem. Soc. 2006, 128,
1316–1323.[52] J. C. de Jesffls, F. Zaera, J. Mol. Catal. A 1999, 138, 237–240.[53] J. C. de Jesffls, F. Zaera, Surf. Sci. 1999, 430, 99–115.[54] G. Szçllçsi, B. Tçrçk, L. Baranyi, M. Bartók, J. Catal. 1998, 179, 619–623.[55] G. Kresse, J. Furthmüller, Comput. Mater. Sci. 1996, 6, 15–50.[56] G. Kresse, J. Furthmüller, Phys. Rev. B 1996, 54, 11169–11186.[57] P. E. Blçchl, Phys. Rev. B 1994, 50, 17953–17979.[58] G. Kresse, D. Joubert, Phys. Rev. B 1999, 59, 1758–1775.[59] J. P. Perdew, K. Burke, M. Ernzerhof, Phys. Rev. Lett. 1996, 77, 3865–
3868.
Received: July 23, 2014Revised: August 6, 2014Published online on October 1, 2014
� 2014 Wiley-VCH Verlag GmbH&Co. KGaA, Weinheim ChemCatChem 2014, 6, 3246 – 3253 3253
CHEMCATCHEM
FULL PAPERS www.chemcatchem.org
Top Related

Copyright © 2022 FDOKUMEN

