


Bahasa
Halaman
Hukum

www.elsevier.com/locate/asr
Advances in Space Research 35 (2005) 370–375
SCIAMACHY solar irradiance observation in the spectralrange from 240 to 2380nm
J. Skupin a,*, S. Noel a, M.W. Wuttke a, M. Gottwald b, H. Bovensmann a, M. Weber a,J.P. Burrows a
a Institute of Environmental Physics (IUP), University of Bremen, Otto-Hahn-Allee 1, 28359 Bremen, Germanyb DLR/IMF, Oberpfaffenhofen, 82234 Wessling, Germany
Received 1 November 2004; received in revised form 9 March 2005; accepted 9 March 2005
Abstract
The SCanning Imaging Absorption Spectrometer for Atmospheric CHartographY (SCIAMACHY) is part of the payload of
ESA�s Environmental Satellite ENVISAT which was launched into a sun-synchronous polar orbit on 2002-03-01. It is the first space-
borne instrument covering a wavelength range from 240 to 2380 nm thus including ultraviolet, visible and near infrared spectral
regions.
The main purpose of SCIAMACHY is to determine the amount and distribution of a large number of atmospheric trace con-
stituents by measuring the radiance backscattered from the Earth. In addition, several solar observations are performed with daily
or orbital frequency.
The presented results will cover the following topics: (a) comparison of the solar irradiance measured by SCIAMACHY with
data from the instruments SOLSPEC/SOLSTICE/SUSIM and a solar spectrum derived by Kurucz; (b) comparison of the
SCIAMACHY solar Mg II index with GOME and NOAA data; (c) correlation of the relative change of solar irradiance measured
by SCIAMACHY with the sun spot index.
The mean solar irradiance for each of the 8 SCIAMACHY channels agrees with the Kurucz data within ±2–3%. The presented
analysis proves that SCIAMACHY is a valuable tool to monitor solar irradiance variations.
� 2005 COSPAR. Published by Elsevier Ltd. All rights reserved.
Keywords: SCIAMACHY; Solar irradiance; Mg II index; Sun spot index
1. Introduction
ESA�s new Earth observation satellite ENVISAT was
launched successfully into a sun-synchronous polar or-
bit on 2002-03-01. Among nine other instruments, the
passive remote sensing instrument SCIAMACHY
(SCanning Imaging Absorption spectroMeter for Atmo-spheric CHartographY) is part of the payload (Bovens-
mann et al., 1999, 2004). SCIAMACHY is an 8 channel
0273-1177/$30 � 2005 COSPAR. Published by Elsevier Ltd. All rights reser
doi:10.1016/j.asr.2005.03.036
* Corresponding author. Tel.: +49 421 218 3573; fax: +49 421 218
4555.
E-mail address: [email protected]
(J. Skupin).
spectrometer with 1024 spectral pixels per channel and
the first spaceborne instrument covering a wavelength
range from 240 to 2380 nm thus including ultraviolet,
visible and near infrared spectral regions (see Table 1).
Channels 1–6 (240–1750 nm) are contiguous, while
channels 7 and 8 measure disjoint wavelength intervals
around 2000 and 2300 nm.The main purpose of SCIAMACHY is to determine
the amount and distribution of a large number of atmo-
spheric trace constituents by measuring the radiance
backscattered from the Earth in limb and nadir geome-
try. In addition, several solar observations are per-
formed with daily or even orbital (about 100 min)
frequency using different combinations of mirrors and
ved.
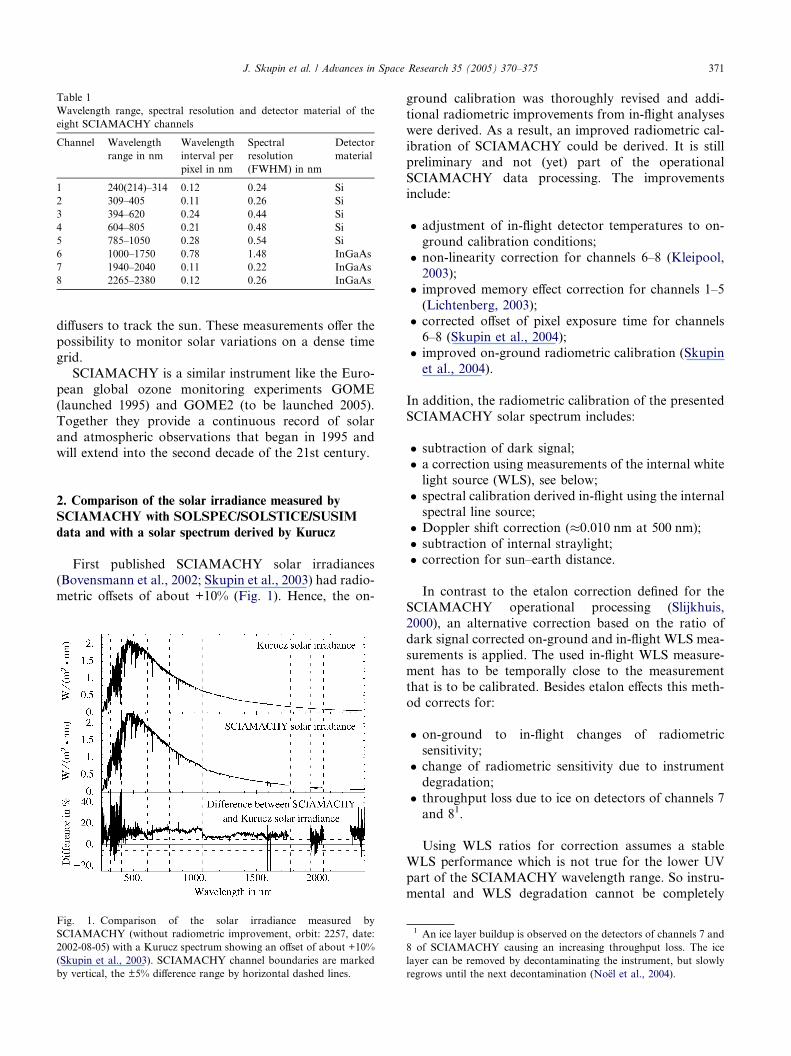
Table 1
Wavelength range, spectral resolution and detector material of the
eight SCIAMACHY channels
Channel Wavelength
range in nm
Wavelength
interval per
pixel in nm
Spectral
resolution
(FWHM) in nm
Detector
material
1 240(214)–314 0.12 0.24 Si
2 309–405 0.11 0.26 Si
3 394–620 0.24 0.44 Si
4 604–805 0.21 0.48 Si
5 785–1050 0.28 0.54 Si
6 1000–1750 0.78 1.48 InGaAs
7 1940–2040 0.11 0.22 InGaAs
8 2265–2380 0.12 0.26 InGaAs
J. Skupin et al. / Advances in Space Research 35 (2005) 370–375 371
diffusers to track the sun. These measurements offer the
possibility to monitor solar variations on a dense time
grid.
SCIAMACHY is a similar instrument like the Euro-
pean global ozone monitoring experiments GOME
(launched 1995) and GOME2 (to be launched 2005).
Together they provide a continuous record of solar
and atmospheric observations that began in 1995 andwill extend into the second decade of the 21st century.
2. Comparison of the solar irradiance measured by
SCIAMACHY with SOLSPEC/SOLSTICE/SUSIM
data and with a solar spectrum derived by Kurucz
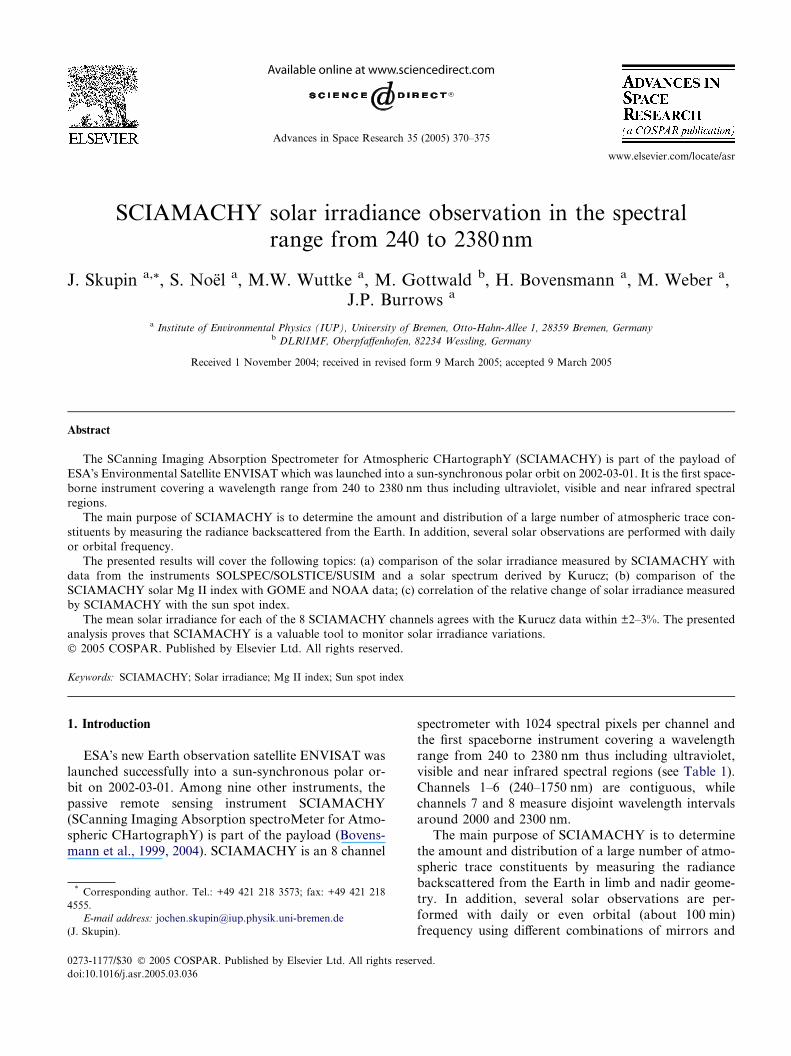
First published SCIAMACHY solar irradiances(Bovensmann et al., 2002; Skupin et al., 2003) had radio-
metric offsets of about +10% (Fig. 1). Hence, the on-
Fig. 1. Comparison of the solar irradiance measured by
SCIAMACHY (without radiometric improvement, orbit: 2257, date:
2002-08-05) with a Kurucz spectrum showing an offset of about +10%
(Skupin et al., 2003). SCIAMACHY channel boundaries are marked
by vertical, the ±5% difference range by horizontal dashed lines.
ground calibration was thoroughly revised and addi-
tional radiometric improvements from in-flight analyses
were derived. As a result, an improved radiometric cal-
ibration of SCIAMACHY could be derived. It is still
preliminary and not (yet) part of the operational
SCIAMACHY data processing. The improvementsinclude:
� adjustment of in-flight detector temperatures to on-
ground calibration conditions;
� non-linearity correction for channels 6–8 (Kleipool,
2003);
� improved memory effect correction for channels 1–5
(Lichtenberg, 2003);� corrected offset of pixel exposure time for channels
6–8 (Skupin et al., 2004);
� improved on-ground radiometric calibration (Skupin
et al., 2004).
In addition, the radiometric calibration of the presented
SCIAMACHY solar spectrum includes:
� subtraction of dark signal;
� a correction using measurements of the internal white
light source (WLS), see below;
� spectral calibration derived in-flight using the internal
spectral line source;
� Doppler shift correction (�0.010 nm at 500 nm);
� subtraction of internal straylight;
� correction for sun–earth distance.
In contrast to the etalon correction defined for the
SCIAMACHY operational processing (Slijkhuis,
2000), an alternative correction based on the ratio of
dark signal corrected on-ground and in-flight WLS mea-
surements is applied. The used in-flight WLS measure-
ment has to be temporally close to the measurement
that is to be calibrated. Besides etalon effects this meth-od corrects for:
� on-ground to in-flight changes of radiometric
sensitivity;
� change of radiometric sensitivity due to instrument
degradation;
� throughput loss due to ice on detectors of channels 7
and 81.
Using WLS ratios for correction assumes a stable
WLS performance which is not true for the lower UV
part of the SCIAMACHY wavelength range. So instru-
mental and WLS degradation cannot be completely
1 An ice layer buildup is observed on the detectors of channels 7 and
8 of SCIAMACHY causing an increasing throughput loss. The ice
layer can be removed by decontaminating the instrument, but slowly
regrows until the next decontamination (Noel et al., 2004).
372 J. Skupin et al. / Advances in Space Research 35 (2005) 370–375
separated in the UV. This leads to a possible broadband
error of a few percent in channel 1.
The SCIAMACHY solar irradiance is validated with
data from SOLSPEC (Thuillier et al., 2003), SOLSTICE
(Rottman and Woods, 1994), SUSIM (Floyd et al.,
2003) and with a solar spectrum derived by Kurucz(Kurucz, 1995). The Kurucz spectrum is based on the
file newkur.dat taken from the atmospheric modeling
program MODTRAN 3.7. To take care of the different
spectral resolutions of the instruments, high resolution
data are adapted to the lower resolution of the data it
is compared with. i.e. the Kurucz spectrum (spectral res-
olution 0.005–0.57 nm in the SCIAMACHY wavelength
range) is convoluted with the SCIAMACHY slit func-tion (as given in the SCIAMACHY keydata derived
from on-ground calibration measurements) to match
the SCIAMACHY spectral resolution. The SCIAM-
ACHY solar irradiance is binned to match the spectral
resolution of the SOLSPEC spectrometer (spectral reso-
lution 0.07–1.1 nm) and of the UARS instruments SOL-
STICE and SUSIM. For the latter ones, data are
500. 1000. 1500. 2000.Wavelength in nm
Wavelength in nm
0.
0.5
1.
1.5
2.0.
0.5
1.
1.5
2.0.
0.5
1.
1.5
2. Kurucz solar irradiance
SOLSPEC solar irradiance
SCIAMACHY solar irradiance
500. 1000. 1500. 2000.−20.
0.
20.
40.
–20.
0.
20.
40. Difference between SCIAMACHYand Kurucz solar irradiance
Difference between SCIAMACHYand SOLSPEC solar irradiance
Dif
fere
nce
in %
Dif
fere
nce
in %
W ⁄
(m2
• nm
)W
⁄ (m
2 • n
m)
W ⁄
(m2
• nm
)
Fig. 2. Comparison of the radiometrically improved solar irradiance
measured by SCIAMACHY (orbit: 10529, date: 2004-03-05) with
Kurucz and SOLSPEC spectra. Upper: Irradiances. Lower: Differ-
ences in %. SCIAMACHY channel boundaries are marked by vertical,
the ±5% difference range by horizontal dashed lines.
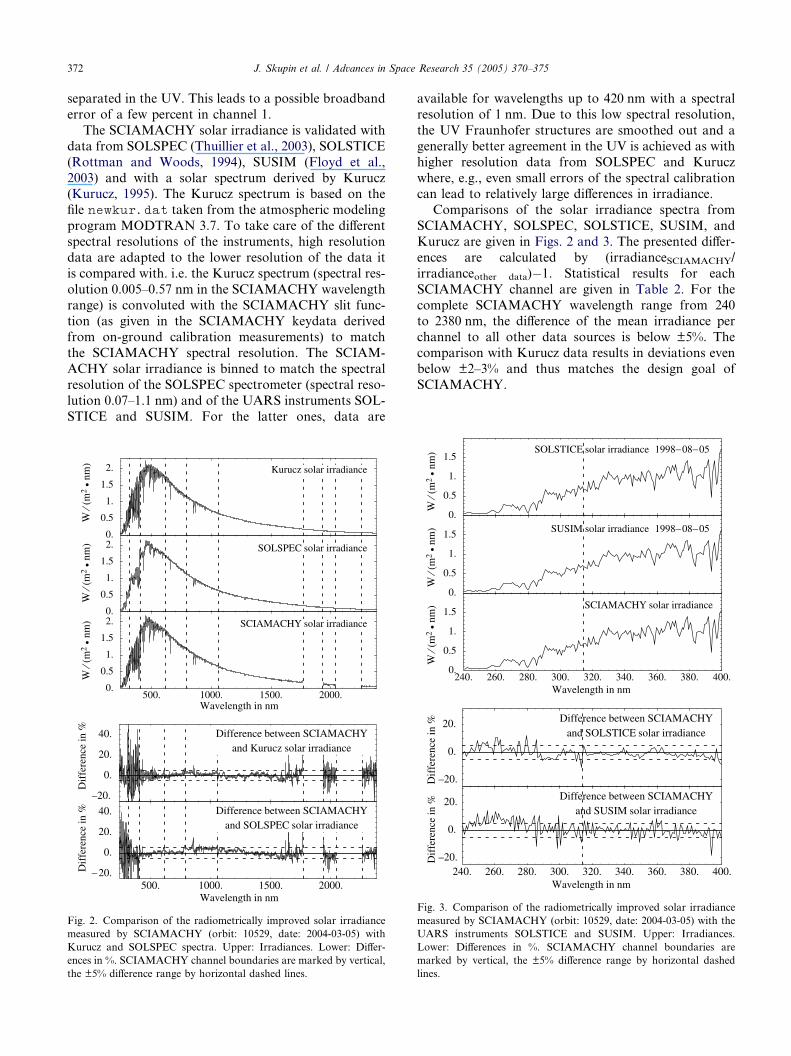
available for wavelengths up to 420 nm with a spectral
resolution of 1 nm. Due to this low spectral resolution,
the UV Fraunhofer structures are smoothed out and a
generally better agreement in the UV is achieved as with
higher resolution data from SOLSPEC and Kurucz
where, e.g., even small errors of the spectral calibrationcan lead to relatively large differences in irradiance.
Comparisons of the solar irradiance spectra from
SCIAMACHY, SOLSPEC, SOLSTICE, SUSIM, and
Kurucz are given in Figs. 2 and 3. The presented differ-
ences are calculated by (irradianceSCIAMACHY/
irradianceother data)�1. Statistical results for each
SCIAMACHY channel are given in Table 2. For the
complete SCIAMACHY wavelength range from 240to 2380 nm, the difference of the mean irradiance per
channel to all other data sources is below ±5%. The
comparison with Kurucz data results in deviations even
below ±2–3% and thus matches the design goal of
SCIAMACHY.
240. 260. 280. 300. 320. 340. 360. 380. 400.0.
0.5
1.
1.5
0.
0.5
1.
1.5
0.
0.5
1.
1.5SOLSTICE solar irradiance 1998−08−05
SUSIM solar irradiance 1998−08−05
SCIAMACHY solar irradiance
240. 260. 280. 300. 320. 340. 360. 380. 400.Wavelength in nm
Wavelength in nm
–20.
0.
20.
Dif
fere
nce
in %
Dif
fere
nce
in %
–20.
0.
20. Difference between SCIAMACHYand SOLSTICE solar irradiance
Difference between SCIAMACHYand SUSIM solar irradiance
W ⁄
(m2
• nm
)W
⁄ (m
2 • n
m)
W ⁄
(m2
• nm
)
Fig. 3. Comparison of the radiometrically improved solar irradiance
measured by SCIAMACHY (orbit: 10529, date: 2004-03-05) with the
UARS instruments SOLSTICE and SUSIM. Upper: Irradiances.
Lower: Differences in %. SCIAMACHY channel boundaries are
marked by vertical, the ±5% difference range by horizontal dashed
lines.
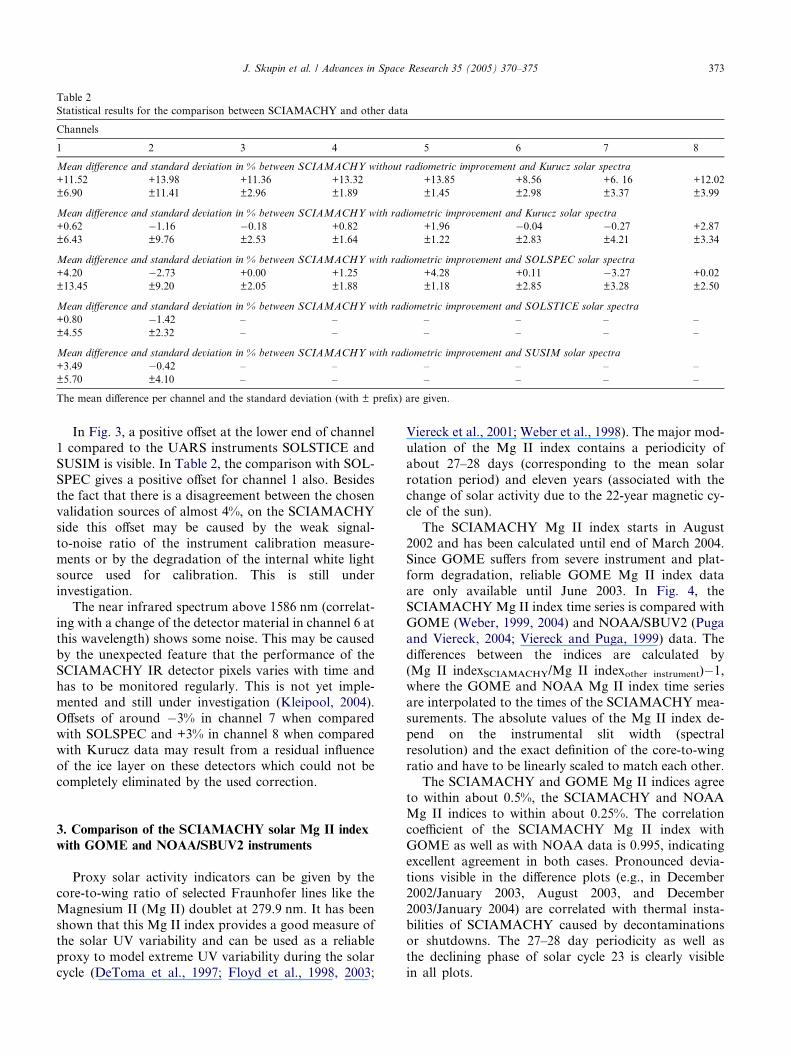
Table 2
Statistical results for the comparison between SCIAMACHY and other data
Channels
1 2 3 4 5 6 7 8
Mean difference and standard deviation in % between SCIAMACHY without radiometric improvement and Kurucz solar spectra
+11.52 +13.98 +11.36 +13.32 +13.85 +8.56 +6. 16 +12.02
±6.90 ±11.41 ±2.96 ±1.89 ±1.45 ±2.98 ±3.37 ±3.99
Mean difference and standard deviation in % between SCIAMACHY with radiometric improvement and Kurucz solar spectra
+0.62 �1.16 �0.18 +0.82 +1.96 �0.04 �0.27 +2.87
±6.43 ±9.76 ±2.53 ±1.64 ±1.22 ±2.83 ±4.21 ±3.34
Mean difference and standard deviation in % between SCIAMACHY with radiometric improvement and SOLSPEC solar spectra
+4.20 �2.73 +0.00 +1.25 +4.28 +0.11 �3.27 +0.02
±13.45 ±9.20 ±2.05 ±1.88 ±1.18 ±2.85 ±3.28 ±2.50
Mean difference and standard deviation in % between SCIAMACHY with radiometric improvement and SOLSTICE solar spectra
+0.80 �1.42 – – – – – –
±4.55 ±2.32 – – – – – –
Mean difference and standard deviation in % between SCIAMACHY with radiometric improvement and SUSIM solar spectra
+3.49 �0.42 – – – – – –
±5.70 ±4.10 – – – – – –
The mean difference per channel and the standard deviation (with ± prefix) are given.
J. Skupin et al. / Advances in Space Research 35 (2005) 370–375 373
In Fig. 3, a positive offset at the lower end of channel
1 compared to the UARS instruments SOLSTICE and
SUSIM is visible. In Table 2, the comparison with SOL-
SPEC gives a positive offset for channel 1 also. Besides
the fact that there is a disagreement between the chosen
validation sources of almost 4%, on the SCIAMACHY
side this offset may be caused by the weak signal-
to-noise ratio of the instrument calibration measure-ments or by the degradation of the internal white light
source used for calibration. This is still under
investigation.
The near infrared spectrum above 1586 nm (correlat-
ing with a change of the detector material in channel 6 at
this wavelength) shows some noise. This may be caused
by the unexpected feature that the performance of the
SCIAMACHY IR detector pixels varies with time andhas to be monitored regularly. This is not yet imple-
mented and still under investigation (Kleipool, 2004).
Offsets of around �3% in channel 7 when compared
with SOLSPEC and +3% in channel 8 when compared
with Kurucz data may result from a residual influence
of the ice layer on these detectors which could not be
completely eliminated by the used correction.
3. Comparison of the SCIAMACHY solar Mg II index
with GOME and NOAA/SBUV2 instruments
Proxy solar activity indicators can be given by the
core-to-wing ratio of selected Fraunhofer lines like the
Magnesium II (Mg II) doublet at 279.9 nm. It has been
shown that this Mg II index provides a good measure ofthe solar UV variability and can be used as a reliable
proxy to model extreme UV variability during the solar
cycle (DeToma et al., 1997; Floyd et al., 1998, 2003;
Viereck et al., 2001; Weber et al., 1998). The major mod-
ulation of the Mg II index contains a periodicity of
about 27–28 days (corresponding to the mean solar
rotation period) and eleven years (associated with the
change of solar activity due to the 22-year magnetic cy-
cle of the sun).
The SCIAMACHY Mg II index starts in August
2002 and has been calculated until end of March 2004.Since GOME suffers from severe instrument and plat-
form degradation, reliable GOME Mg II index data
are only available until June 2003. In Fig. 4, the
SCIAMACHY Mg II index time series is compared with
GOME (Weber, 1999, 2004) and NOAA/SBUV2 (Puga
and Viereck, 2004; Viereck and Puga, 1999) data. The
differences between the indices are calculated by
(Mg II indexSCIAMACHY/Mg II indexother instrument)�1,where the GOME and NOAA Mg II index time series
are interpolated to the times of the SCIAMACHY mea-
surements. The absolute values of the Mg II index de-
pend on the instrumental slit width (spectral
resolution) and the exact definition of the core-to-wing
ratio and have to be linearly scaled to match each other.
The SCIAMACHY and GOME Mg II indices agree
to within about 0.5%, the SCIAMACHY and NOAAMg II indices to within about 0.25%. The correlation
coefficient of the SCIAMACHY Mg II index with
GOME as well as with NOAA data is 0.995, indicating
excellent agreement in both cases. Pronounced devia-
tions visible in the difference plots (e.g., in December
2002/January 2003, August 2003, and December
2003/January 2004) are correlated with thermal insta-
bilities of SCIAMACHY caused by decontaminationsor shutdowns. The 27–28 day periodicity as well as
the declining phase of solar cycle 23 is clearly visible
in all plots.
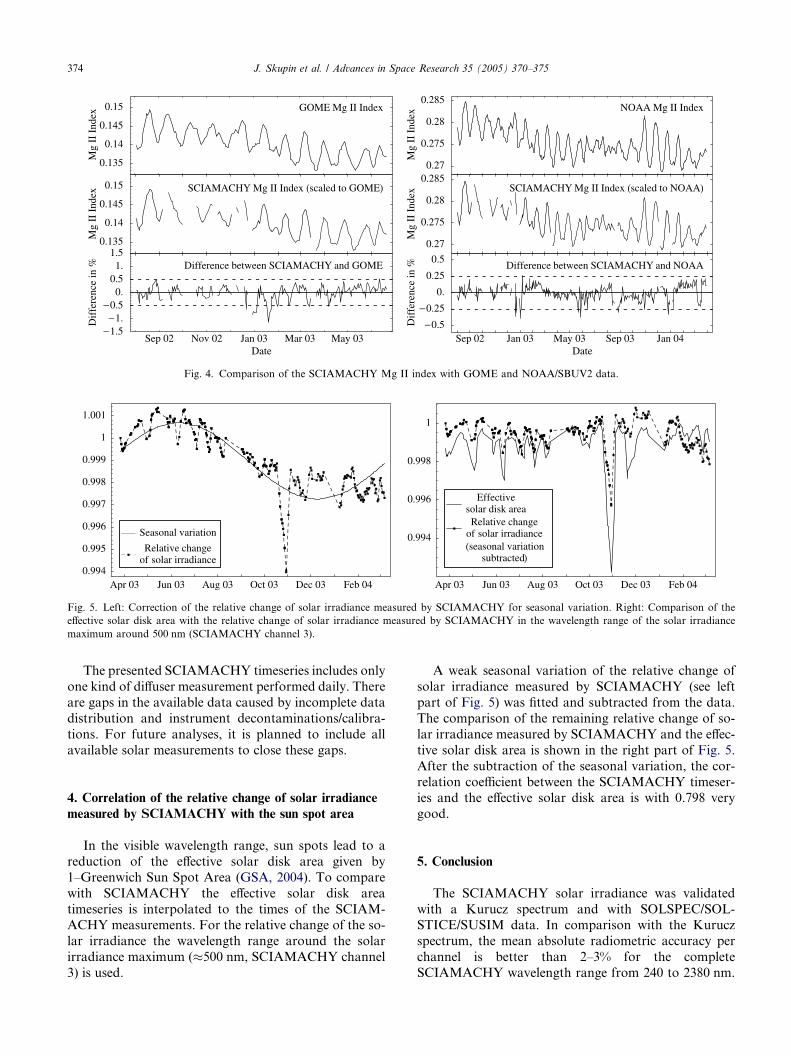
Apr 03 Jun 03 Aug 03 Oct 03 Dec 03 Feb 040.994
0.995
0.996
0.997
0.998
0.999
1
1.001
Relative changeof solar irradiance
Seasonal variation
Apr 03 Jun 03 Aug 03 Oct 03 Dec 03 Feb 04
0.994
0.996
0.998
1
(seasonal variationsubtracted)
Relative changeof solar irradiance
Effectivesolar disk area
Fig. 5. Left: Correction of the relative change of solar irradiance measured by SCIAMACHY for seasonal variation. Right: Comparison of the
effective solar disk area with the relative change of solar irradiance measured by SCIAMACHY in the wavelength range of the solar irradiance
maximum around 500 nm (SCIAMACHY channel 3).
Sep 02 Nov 02 Jan 03 Mar 03 May 03Date
−1.5−1.
−0.50.
0.51.
1.50.135
0.14
0.145
0.15
0.135
0.14
0.145
0.15 GOME Mg II Index
SCIAMACHY Mg II Index (scaled to GOME)
Difference between SCIAMACHY and GOME
Sep 02 Jan 03 May 03 Sep 03 Jan 04Date
−0.5
−0.25
0.
0.25
0.5
Dif
fere
nce
in %
0.27
0.275
0.28
0.285
Mg
II I
ndex
Mg
II I
ndex
Dif
fere
nce
in %
Mg
II I
ndex
Mg
II I
ndex
0.27
0.275
0.28
0.285NOAA Mg II Index
SCIAMACHY Mg II Index (scaled to NOAA)
Difference between SCIAMACHY and NOAA
Fig. 4. Comparison of the SCIAMACHY Mg II index with GOME and NOAA/SBUV2 data.
374 J. Skupin et al. / Advances in Space Research 35 (2005) 370–375
The presented SCIAMACHY timeseries includes only
one kind of diffuser measurement performed daily. There
are gaps in the available data caused by incomplete data
distribution and instrument decontaminations/calibra-
tions. For future analyses, it is planned to include all
available solar measurements to close these gaps.
4. Correlation of the relative change of solar irradiance
measured by SCIAMACHY with the sun spot area
In the visible wavelength range, sun spots lead to a
reduction of the effective solar disk area given by
1–Greenwich Sun Spot Area (GSA, 2004). To compare
with SCIAMACHY the effective solar disk area
timeseries is interpolated to the times of the SCIAM-ACHY measurements. For the relative change of the so-
lar irradiance the wavelength range around the solar
irradiance maximum (�500 nm, SCIAMACHY channel
3) is used.
A weak seasonal variation of the relative change of
solar irradiance measured by SCIAMACHY (see left
part of Fig. 5) was fitted and subtracted from the data.
The comparison of the remaining relative change of so-
lar irradiance measured by SCIAMACHY and the effec-
tive solar disk area is shown in the right part of Fig. 5.
After the subtraction of the seasonal variation, the cor-
relation coefficient between the SCIAMACHY timeser-ies and the effective solar disk area is with 0.798 very
good.
5. Conclusion
The SCIAMACHY solar irradiance was validated
with a Kurucz spectrum and with SOLSPEC/SOL-STICE/SUSIM data. In comparison with the Kurucz
spectrum, the mean absolute radiometric accuracy per
channel is better than 2–3% for the complete
SCIAMACHY wavelength range from 240 to 2380 nm.
J. Skupin et al. / Advances in Space Research 35 (2005) 370–375 375
It was demonstrated that SCIAMACHY solar obser-
vations can be utilized to derive a time series of a proxy
solar activity indicator, the so called Mg II index. An
excellent correlation of 0.995 with Mg II indices from
GOME and NOAA has been achieved. This shows that
spectral structures in solar irradiance like the Mg II dou-blet lines are measured by SCIAMACHY accurately
and with long term stability.
The good correlation of 0.798 between the relative
change of solar irradiance measured by SCIAMACHY
and the effective solar disk area demonstrates that in
the visible wavelength range SCIAMACHY is capable
to measure relative changes of the solar irradiance in
the order of 10�3.Although SCIAMACHY was primarily designed for
atmospheric remote sensing it could be shown that it is
also a valuable tool for monitoring solar irradiance vari-
ations. It offers the unique opportunity to observe the
sun every 100 min in the wavelength range from 240 to
2380 nm.
Acknowledgements
This research was funded in its entirety by DLR
Projektdirektion Raumfahrt, Bonn (FKZ: 50 EE
0025). The authors thank ESA for providing SCIAM-
ACHY data as well as the Upper Atmosphere Re-
search Satellite (UARS) Project, (Code 916), and the
Distributed Active Archive Center (DAAC, Code902) at the Goddard Space Flight Center, Greenbelt,
MD 20771 for the production and distribution of SOL-
STICE and SUSIM data. The UARS and DAAC
activities are sponsored by NASA�s Earth Science
Enterprise.
References
Bovensmann, H., Ahlers, B., Buchwitz, M., Frerick, J., Gottwald, M.,
Hoogeveen, R., Kaiser, J., Kleipool, Q., Krieg, E., Lichtenberg, G.,
Mager, R., Meyer, J., Noel, S., Schlesier, A., Sioris, C., Skupin, J.,
von Savigny, C., Wuttke, M.W., Burrows, J.P. SCIAMACHY in-
flight instrument performance. in: Sawaya-Lacoste, H. (Ed.),
Proceedings of the Envisat Calibration Review (SP-520). ESA
Publications Division, pp. 1–21, 2002, distributed on CD, filename
of article: sciamachy/scia_02.pdf.
Bovensmann, H., Buchwitz, M., Frerick, J., Hoogeveen, R., Kleipool,
Q., Lichtenberg, G., Noel, S., Richter, A., Rozanov, A., Rozanov,
V., Skupin, J., von Savigny, C., Wuttke, M.W., Burrows, J.P.
SCIAMACHY on ENVISAT: In-flight optical performance and
first results, in: Schafer, K.P., Comeron, A., Carleer, M.R., Picard,
R.H. (Eds.), Remote Sensing of Clouds and the Atmosphere VIII.
Proceedings of SPIE, vol. 5235, pp. 160–173, 2004.
Bovensmann, H., Burrows, J.P., Buchwitz, M., Frerick, J., Noel, S.,
Rozanov, V., Chance, K.V., Goede, A.H.P. SCIAMACHY –
mission objectives and measurement modes. J. Atmos. Sci. 56 (2),
127–150, 1999.
DeToma, G., White, O.R., Knapp, B.G., Rottman, G.J., Woods, T.N.
Solar Mg II core-to-wing index: comparison of SBUV2 and
SOLSTICE time series. J. Geophys. Res. 102, 2597–2610, 1997.
Floyd, L.E., Cook, J.W., Herring, L., Crane, P.C. SUSIM�S 11-year
observational record of the solar UV irradiance. Adv. Space Res.
31, 2111–2120, 2003.
Floyd, L.E., Reiser, P.A., Crane, P.C., Herring, L.C., Prinz, D.K.,
Brueckner, G.E. Solar cycle 22 UV spectral irradiance variability:
current measurements by SUSIM UARS. Sol. Phys. 177, 79–87,
1998.
GSA. Greenwich sun spot area, 2004. Available from: <http://
science.nasa.gov/ssl/pad/solar/greenwch.htm>.
Kleipool, Q. SCIAMACHY: recalculation of OPTEC5 non-linearity.
SRON, docnr. SRON-SCIA-PhE-RP-013, 2003. Available from:
<http://www.sron.nl/~SCIA_CAL/docs/rp013.ps.gz>.
Kleipool, Q. SCIAMACHY: evolution of dead and bad pixel mask.
SRON, docnr. SRON-SCIA-PhE-RP-21, 2004. Available from:
<http://www.sron.nl/~SCIA_CAL/docs/timedbm.pdf>.
Kurucz, R.L. The solar spectrum: atlases and line identifications. In:
Sauval, A.J., Blomme, R., Grevesse, N. (Eds.), Laboratory and
astronomical high resolution spectra. Astronomical Society of the
Pacific Conference Series, vol. 81, pp. 17–31, 1995.
Lichtenberg, G. SCIAMACHY channel 1-5 memory effect I: key data
implementation and in-flight measurements. SRON, docnr.
SRON-SCIA-PhE-RP-11, 2003. Available from: <http://
www.sron.nl/~SCIA_CAL/docs/memory_effect_sronrpI.pdf>.
Noel, S., Bovensmann, H., Skupin, J., Wuttke, M.W., Burrows, J.P.,
Gottwald, M., Krieg, E. SCIAMACHY long-term monitoring
results. in: Proceedings of the ENVISAT & ERS Symposium (SP-
572). ESA Publications Division, 2004.
Puga, L.C., Viereck, R.A. NOAA/SBUV2 Mg II index, 2004.
Available from: <http://www.sec.noaa.gov/ftpdir/sbuv/
NOAAMgII.dat>.
Rottman, G.J., Woods, T.N. The UARS SOLSTICE. SPIE 2266, 317–
327, 1994.
Skupin, J., Gerilowski, K., Noel, S., Wuttke, M.W., Bovensmann, H.,
Burrows, J.P. Improvement of the SCIAMACHY radiometric
calibration and its validation on solar irradiances in the spectral
range from 240 to 2380 nm. in: Proceedings of the ENVISAT and
ERS Symposium (SP-572). ESA Publications Division, 2004.
Skupin, J., Noel, S., Wuttke, M.W., Bovensmann, H., Burrows, J.P.,
Hoogeveen, R., Kleipool, Q., Lichtenberg, G. In-flight calibration
of the SCIAMACHY solar irradiance spectrum. Adv. Space Res.
32 (11), 2129–2134, 2003.
Slijkhuis, S. ENVISAT-1 SCIAMACHY level 0 to 1c processing
algorithm theoretical basis document (ENV-ATB-DLR-SCIA-
0041). DLR, second ed., 2000.
Thuillier,G.,Herse,M.,Labs,D., Foujols,T., Peetermans,W.,Gillotay,
D., Simon, P.C., Mandel, H. The solar spectral irradiance from 200
to 2400 nm as measured by the SOLSPEC spectrometer from the
ATLAS and EURECA missions. Sol. Phys. 214 (1), 1–22, 2003.
Viereck, R.A., Puga, L.C. The NOAA Mg II core-to-wing solar index:
construction of a 20-year time series of chromospheric variability
from multiple satellites. J. Geophys. Res. 104, 9995–10005, 1999.
Viereck, R.A., Puga, L.C., McMullin, D., Judge, D., Weber, M.,
Tobiska, W. The Mg II index: a proxy for solar EUV. Geophys.
Res. Lett. 28, 1343–1346, 2001.
Weber, M. Solar activity during solar cycle 23 monitored by GOME.
In: Proceedings of the European symposium on atmospheric
measurements from space (ESAMS 1999), ESA Special Publica-
tion: ESA-WPP-161, pp. 611–616, 1999.
Weber, M. GOME Mg II index, 2004. Available from: <http://
www.iup.physik.uni-bremen.de/gome/gomemgii.html>.
Weber, M., Burrows, J., Cebula, R. GOME solar UV/VIS irradiance
measurements between 1995 and 1997 – first results on proxy solar
activity studies. Sol. Phys. 177, 63–77, 1998.
Copyright © 2022 FDOKUMEN

