


Bahasa
Halaman
Hukum

Salary Schedules PASBO Annual Conference - March 11-14, 2014
Prepared by PSBA Research 1
Serving the Commonwealth and its communities from offices in:Harrisburg - Philadelphia -Pittsburgh - Wilkes-Barre
David W. Davare, Ph.D.Pennsylvania Economy League
Harrisburg Office
1
Salary Schedule Analysis and Preparation
2

Salary Schedules PASBO Annual Conference - March 11-14, 2014
Prepared by PSBA Research 2
Topics
Compensation
Negotiations
Getting started
Schedule Analysis
Salary schedule issues
3
Elements of CompensationSalaries Health insurance
Retirement
Social Security/Medicare
Other benefits
Extra‐curricular compensation
Continuing education – payment for credits
Language (seniority, days, hours, etc.)
4

Salary Schedules PASBO Annual Conference - March 11-14, 2014
Prepared by PSBA Research 3
Compensation – Salaries
Education = column
Years of service = steps
Step movement
Increment or incremental cost
Column movement
5
6
Steps Bach Master Doctorate
1 33,385 34,719 35,8402 33,934 35,729 36,4003 34,503 35,860 36,9804 35,096 36,465 37,5855 35,715 37,096 38,2166 36,365 37,759 38,8797 37,053 38,460 39,5818 38,994 40,440 41,5609 40,934 42,419 43,53910 42,875 44,398 45,51911 45,956 47,540 48,66012 49,796 51,546 52,57613 56,073 57,858 58,97814 60,481 62,353 63,47315 63,196 65,235 66,355
Salary Schedule Basics
Salary Schedules PASBO Annual Conference - March 11-14, 2014
Prepared by PSBA Research 4
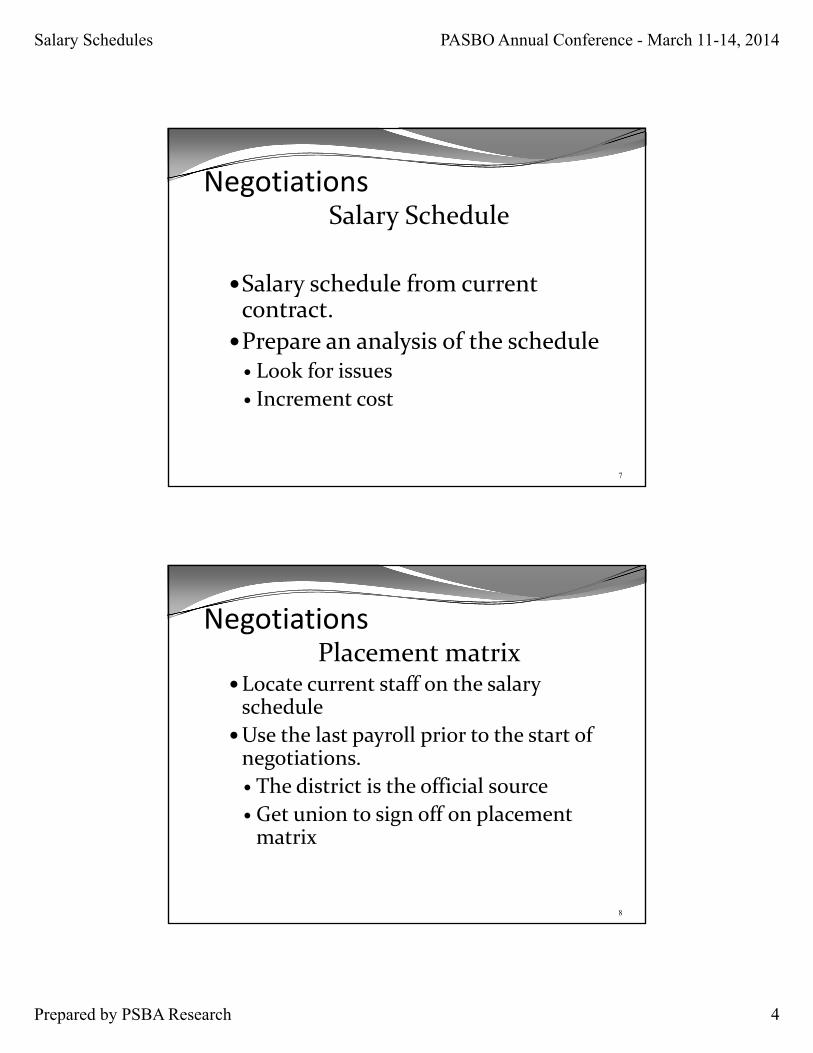
NegotiationsSalary Schedule
Salary schedule from current contract.
Prepare an analysis of the schedule Look for issues
Increment cost
7
NegotiationsPlacement matrix
Locate current staff on the salary schedule
Use the last payroll prior to the start of negotiations.
The district is the official source
Get union to sign off on placement matrix
8
Salary Schedules PASBO Annual Conference - March 11-14, 2014
Prepared by PSBA Research 5
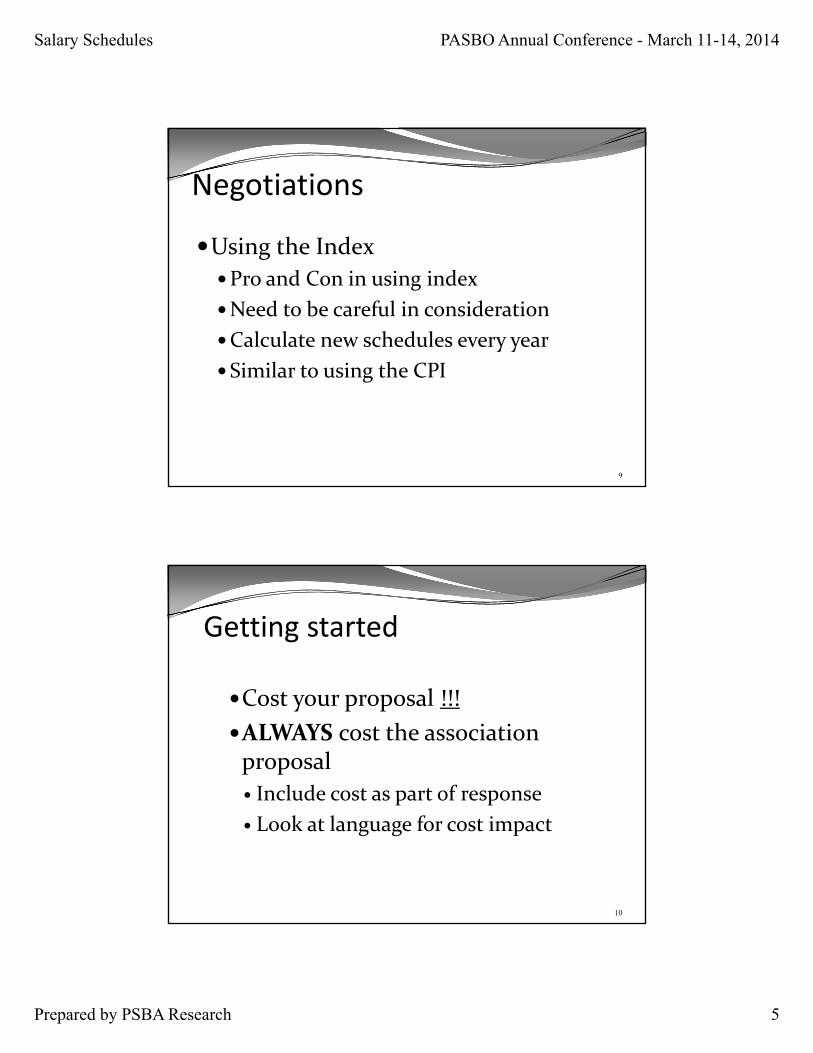
Negotiations
Using the Index
Pro and Con in using index
Need to be careful in consideration
Calculate new schedules every year
Similar to using the CPI
9
Getting started
Cost your proposal !!!
ALWAYS cost the association proposal
Include cost as part of response
Look at language for cost impact
10
Salary Schedules PASBO Annual Conference - March 11-14, 2014
Prepared by PSBA Research 6
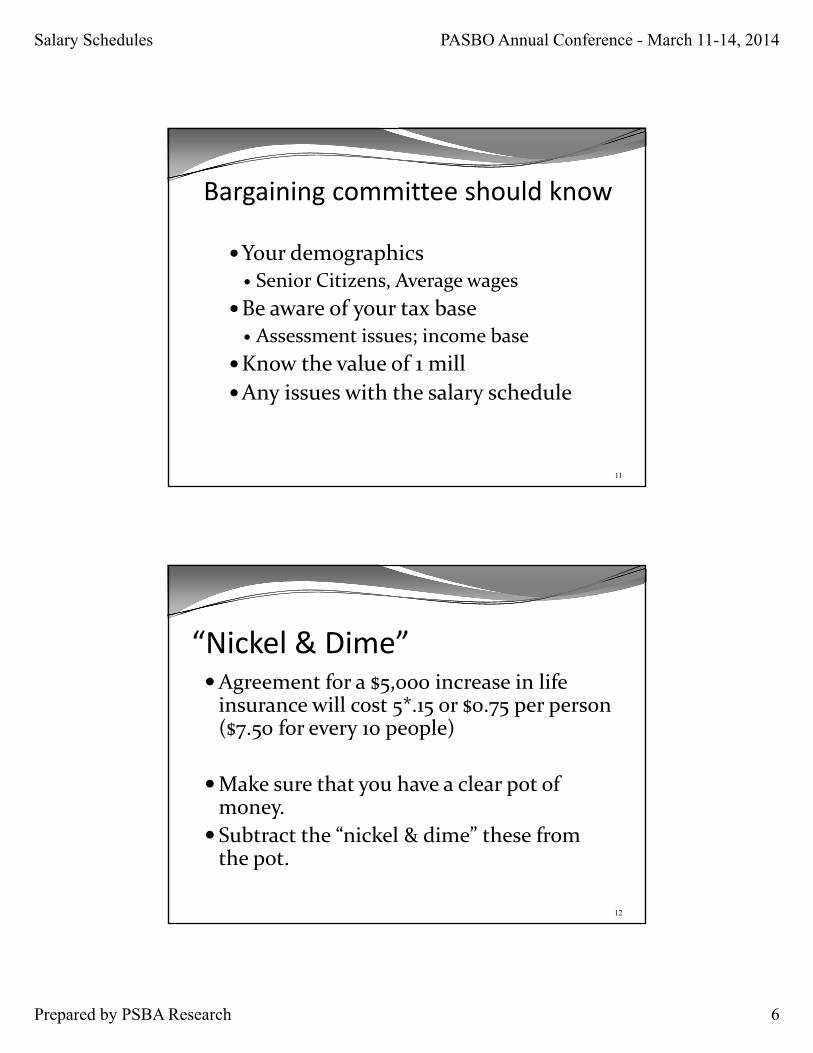
Bargaining committee should know
Your demographics Senior Citizens, Average wages
Be aware of your tax base Assessment issues; income base
Know the value of 1 mill
Any issues with the salary schedule
11
“Nickel & Dime” Agreement for a $5,000 increase in life insurance will cost 5*.15 or $0.75 per person ($7.50 for every 10 people)
Make sure that you have a clear pot of money.
Subtract the “nickel & dime” these from the pot.
12

Salary Schedules PASBO Annual Conference - March 11-14, 2014
Prepared by PSBA Research 7
“Nickel & Dime”
Be aware of the “nickel – dime” items
Each instructional employee shall be granted two (2) personal days each school year in addition…
Any unused personal days… will be rolled over into sick leave. [Including] …perfect attendance days.
[U]nused sick days paid at $75 per day….”
13
“Nickel & Dime”
14
Be aware of the “nickel – dime” items
During the absence of any teacher, a substitute shall be hired for such teacher except in case of emergency where a substitute cannot be obtained.
If a “regular” teacher is assigned by the principal or her/his designee to substitute for another teacher during the regular teacher’s planning time, the “regular” teacher shall be paid at the rate of $xx.xx
Salary Schedules PASBO Annual Conference - March 11-14, 2014
Prepared by PSBA Research 8
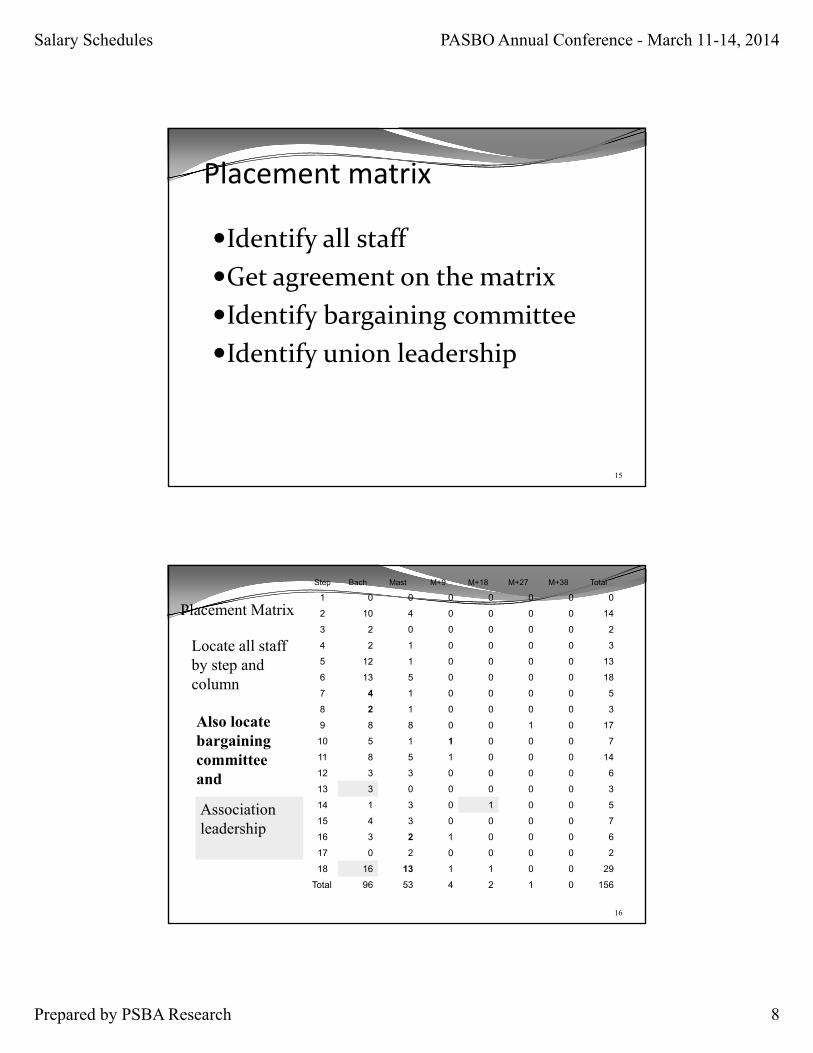
Placement matrix
Identify all staff
Get agreement on the matrix
Identify bargaining committee
Identify union leadership
15
16
Step Bach Mast M+9 M+18 M+27 M+38 Total
1 0 0 0 0 0 0 0
2 10 4 0 0 0 0 14
3 2 0 0 0 0 0 2
4 2 1 0 0 0 0 3
5 12 1 0 0 0 0 13
6 13 5 0 0 0 0 18
7 4 1 0 0 0 0 5
8 2 1 0 0 0 0 3
9 8 8 0 0 1 0 17
10 5 1 1 0 0 0 7
11 8 5 1 0 0 0 14
12 3 3 0 0 0 0 6
13 3 0 0 0 0 0 3
14 1 3 0 1 0 0 5
15 4 3 0 0 0 0 7
16 3 2 1 0 0 0 6
17 0 2 0 0 0 0 2
18 16 13 1 1 0 0 29
Total 96 53 4 2 1 0 156
Placement Matrix
Locate all staff by step and column
Also locate bargaining committee and
Association leadership
Salary Schedules PASBO Annual Conference - March 11-14, 2014
Prepared by PSBA Research 9
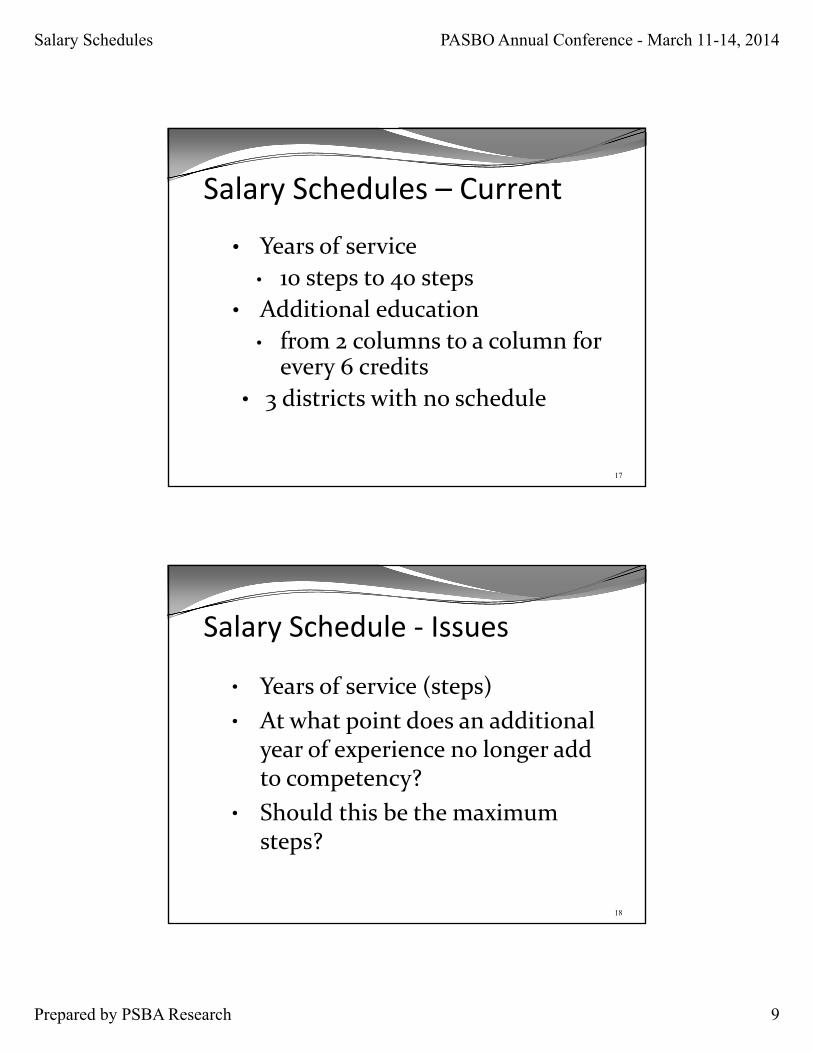
Salary Schedules – Current
• Years of service
• 10 steps to 40 steps
• Additional education
• from 2 columns to a column for every 6 credits
• 3 districts with no schedule
17
Salary Schedule ‐ Issues
• Years of service (steps)
• At what point does an additional year of experience no longer add to competency?
• Should this be the maximum steps?
18

Salary Schedules PASBO Annual Conference - March 11-14, 2014
Prepared by PSBA Research 10
Salary Schedule ‐ Issues
• Additional education (columns)
• At what point does an additional credit no longer add to competency?
• Should this be the column?
• Issue in North Carolina and Saucon Valley SD
19
20
Salary Schedule
Step Bach Mast M+9 M+18 M+27 M+38
1 37,600 38,300 38,600 38,900 39,200 39,500
2 38,200 38,900 39,200 39,500 39,800 40,100
3 38,700 39,400 39,700 40,000 40,300 40,600
4 39,200 39,900 40,200 40,500 40,800 41,100
5 39,600 40,300 40,600 40,900 41,200 41,500
6 40,100 40,800 41,100 41,400 41,700 42,000
7 40,600 41,300 41,600 41,900 42,200 42,500
8 41,600 42,300 42,600 42,900 43,200 43,500
9 43,000 43,700 44,000 44,300 44,600 44,900
10 44,700 45,400 45,700 46,000 46,300 46,600
11 46,300 47,000 47,300 47,600 47,900 48,200
12 47,600 48,300 48,600 48,900 49,200 49,500
13 49,400 50,100 50,400 50,700 51,000 51,300
14 51,000 51,700 52,000 52,300 52,600 52,900
15 52,500 53,200 53,500 53,800 54,100 54,400
16 53,350 54,050 54,350 54,650 54,950 55,250
17 67,325 55,000 55,300 55,600 55,900 56,200
18 68,958 69,258 69,558 69,858 70,158
COLUMNS
STEP
Salary Schedules PASBO Annual Conference - March 11-14, 2014
Prepared by PSBA Research 11
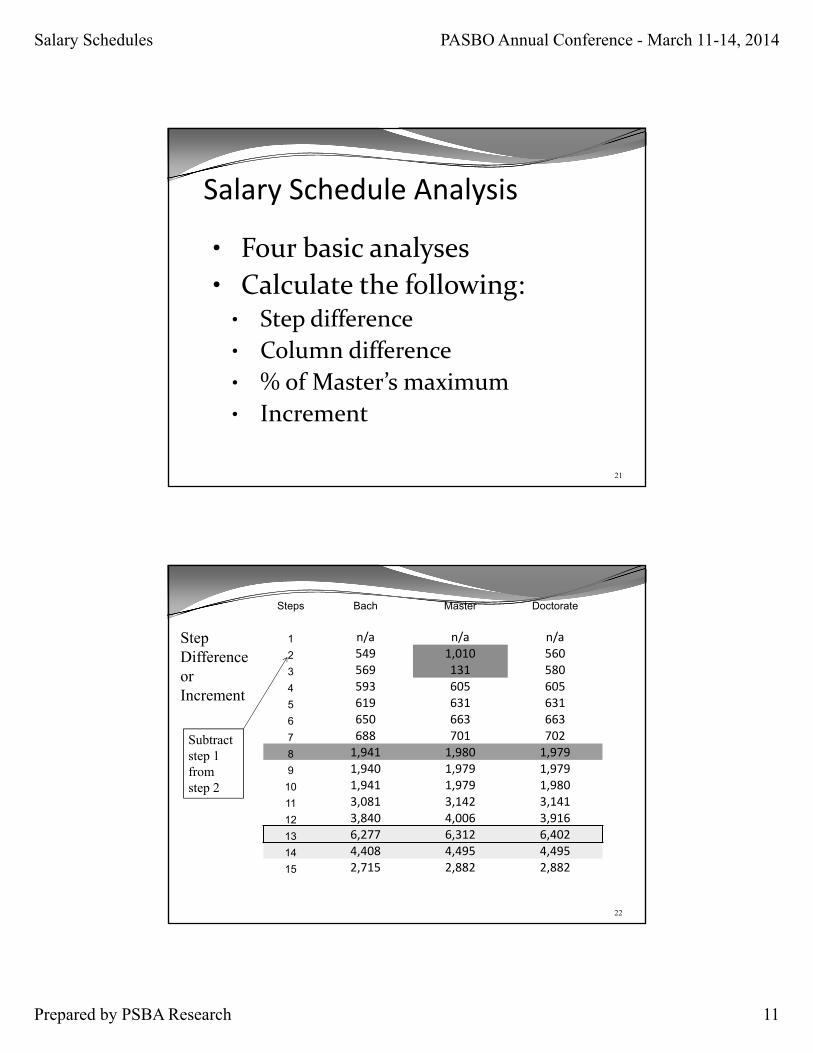
Salary Schedule Analysis
• Four basic analyses
• Calculate the following:• Step difference
• Column difference
• % of Master’s maximum
• Increment
21
22
Steps Bach Master Doctorate
1 n/a n/a n/a
2 549 1,010 560
3 569 131 580
4 593 605 605
5 619 631 631
6 650 663 663
7 688 701 702
8 1,941 1,980 1,979
9 1,940 1,979 1,979
10 1,941 1,979 1,980
11 3,081 3,142 3,141
12 3,840 4,006 3,916
13 6,277 6,312 6,402
14 4,408 4,495 4,495
15 2,715 2,882 2,882
Step Differenceor Increment
Subtract step 1 from step 2
Salary Schedules PASBO Annual Conference - March 11-14, 2014
Prepared by PSBA Research 12
23
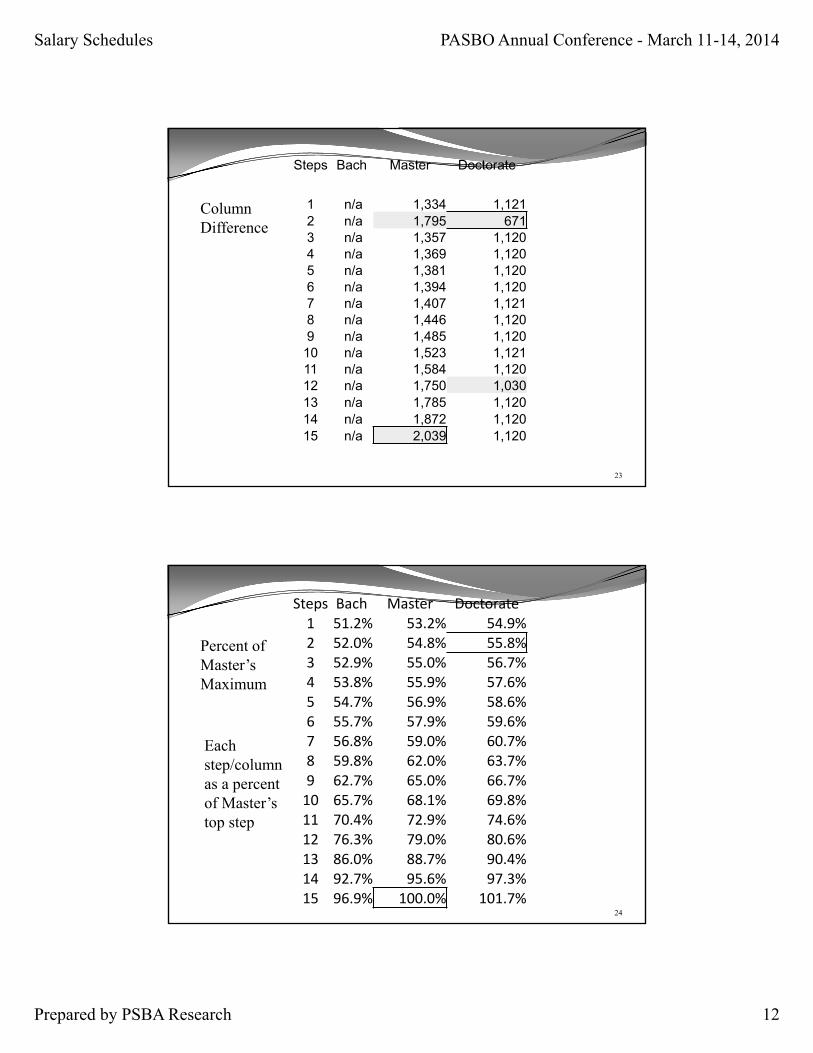
Steps Bach Master Doctorate
1 n/a 1,334 1,1212 n/a 1,795 6713 n/a 1,357 1,1204 n/a 1,369 1,1205 n/a 1,381 1,1206 n/a 1,394 1,1207 n/a 1,407 1,1218 n/a 1,446 1,1209 n/a 1,485 1,120
10 n/a 1,523 1,12111 n/a 1,584 1,12012 n/a 1,750 1,03013 n/a 1,785 1,12014 n/a 1,872 1,12015 n/a 2,039 1,120
Column Difference
24
Steps Bach Master Doctorate1 51.2% 53.2% 54.9%2 52.0% 54.8% 55.8%3 52.9% 55.0% 56.7%4 53.8% 55.9% 57.6%5 54.7% 56.9% 58.6%6 55.7% 57.9% 59.6%7 56.8% 59.0% 60.7%8 59.8% 62.0% 63.7%9 62.7% 65.0% 66.7%10 65.7% 68.1% 69.8%11 70.4% 72.9% 74.6%12 76.3% 79.0% 80.6%13 86.0% 88.7% 90.4%14 92.7% 95.6% 97.3%15 96.9% 100.0% 101.7%
Percent of Master’sMaximum
Each step/column as a percent of Master’s top step

Salary Schedules PASBO Annual Conference - March 11-14, 2014
Prepared by PSBA Research 13
25
Steps Bach Master Doctorate1 n/a n/a n/a2 0.8% 1.5% 0.9%3 0.9% 0.2% 0.9%4 0.9% 0.9% 0.9%5 0.9% 1.0% 1.0%6 1.0% 1.0% 1.0%7 1.1% 1.1% 1.1%8 3.0% 3.0% 3.0%9 3.0% 3.0% 3.0%10 3.0% 3.0% 3.0%11 4.7% 4.8% 4.8%12 5.9% 6.1% 6.0%13 9.6% 9.7% 9.8%14 6.8% 6.9% 6.9%15 4.2% 4.4% 4.4%
Step Difference as % of Master’stop step
Cost matrix
Uses 9th grade algebra
A * B = C
A is the salary matrix
B is the placement matrix
C is the cost matrix
26

Salary Schedules PASBO Annual Conference - March 11-14, 2014
Prepared by PSBA Research 14
Cost of Increment
Calculate the cost of the current placement matrix (A*B1=C1)
Move everyone one step on the placement matrix
Use the current salary schedule
Multiple the current salary schedule by the new placement matrix (A*B2=C2)
Resulting cost (C2) is then subtracted from the original cost (C1) and the difference is the increment
27
35,000
40,000
45,000
50,000
55,000
60,000
65,000
70,000
75,000
1 2 3 4 5 6 7 8 9 10 11 12 13 14 15 16 17 18 19 20 21 22 23 24 25 26 27 28 29 30 31 32 33 34 35 36 37 38 39 40
Schedule 2010‐11
B M M+27 D
Graphic representation of current salary schedule for 4 columns

Salary Schedules PASBO Annual Conference - March 11-14, 2014
Prepared by PSBA Research 15
Schedule needs “fixed”
Who prepared the broke schedules?
Why should the district pay to fix what the association broke?
Do the repair separate from the increase to make sure the repair occurs.
Make the increase in the year of the repair account for the repair.
29
30
30,000
35,000
40,000
45,000
50,000
55,000
60,000
65,000
70,000
1 2 3 4 5 6 7 8 9 10 11 12 13 14 15 16
STEPS
Bach Master
Doctorate Linear (Master)

Salary Schedules PASBO Annual Conference - March 11-14, 2014
Prepared by PSBA Research 16
Association Positions
Steps and Columns
• Get to the top – 10 years
• Education – or columns
Supplant promotion
Promotion IS move to administration
31
Association Positions
• Attrition = Increment
• Therefore the discussion of an increase should be on scale
• Starting salary target $40/50K
32

Salary Schedules PASBO Annual Conference - March 11-14, 2014
Prepared by PSBA Research 17
Association Schedules
33
Association prepared schedule
Year Amount$
Increase%
IncreaseAgreement
Base 2010‐11 8,001,971
1 2011‐12 8,280,885 278,914 3.49% 2.704%
2 2012‐13 8,573,182 292,297 3.53% 2.807%
3 2013‐14 8,849,183 276,001 3.22% 2.955%
4 2014‐15 9,142,441 293,258 3.31% 3.005%
5 2015‐16 9,438,659 296,218 3.24% 3.063%
Association Schedules
34
Year$
Increase%
IncreaseAgreement % diff $ diff
2011‐12 278,914 3.49% 2.704%0.79% 62,895
2012‐13 292,297 3.53% 2.807%0.72% 59,871
2013‐14 276,001 3.22% 2.955%0.27% 22,719
2014‐15 293,258 3.31% 3.005%0.31% 26,990
2015‐16 296,218 3.24% 3.063%0.18% 16,182

Salary Schedules PASBO Annual Conference - March 11-14, 2014
Prepared by PSBA Research 18
Cost of not checking2010‐11 2011‐12 2012‐13 2013‐14 2014‐15 Total
2010‐11 62,895 62,895 62,895 62,895 62,895 314,477
2011‐12 59,871 59,871 59,871 59,871 239,483
2012‐13 22,719 22,719 22,719 68,157
2013‐14 26,990 26,990 53,980
2014‐15 16,182 16,182
Total 8.6% over the life of the contract 692,279
Plus PSERS + Social Security
35
Support Staff SalaryArgument for increases:
Living Wage
Based on family structure
Originally developed for welfare to work policy debate
36

Salary Schedules PASBO Annual Conference - March 11-14, 2014
Prepared by PSBA Research 19
Affordable Healthcare Act (aka Obamacare)Employer sponsored healthcare
Cadillac plan
Single = 10,200
Family = 27,500
Excise tax = 40% on amount that exceed limits
37
Q & A
38
Salary Schedules PASBO Annual Conference - March 11-14, 2014
Prepared by PSBA Research 20
E‐mail: [email protected]
Cell phone: 717.975.7000

IU8 Presentation Pennsylvania Economy League
1
Terms associated with salary schedule negotiations Across the board increase: All individuals receive the same increase. (If this term is
used you need to clearly understand if the increase includes or excludes the increment.)
Attrition: The reduction in cost that results when a teacher at the top of the schedule
retires and is replaced by a teacher on the lower level of the salary schedule. Bump Step: Same as a jump step. The difference between two steps is substantially
larger than the difference between other steps. The amount can vary from $3,000 to $15,000 for a single step.
Career rate: Defined by PSEA as the salary at the top of the Masters degree column. Column movement: The movement of individuals between columns based on increased
education as measured by college credits. Compaction: The number of total steps on the salary schedule is reduced. Cost matrix: The result of multiplying the salary matrix by the placement matrix. Equivalency or equivalent credits: The training an individual receives that is treated at
though it was equal to college credits for advancement across the columns. Fixing the salary schedule: Eliminate a bump/jump step or other variation between steps.
The expectation is that the Board will absorb the cost of “fixing” and provide increases beyond the amount to “fix” the schedule.
Increment: The cost of advancing all employees on the placement matrix by one step. Jump Step: Same as bump step. The difference between two steps is substantially larger
than the difference between other steps. The amount can vary from $3,000 to $15,000 for a single step.
On scale increase: Applying the salary increase to the salary schedule excluding any
increment cost. Placement matrix: The listing of employees by step and column. Salary index: A distribution of salaries on the schedule based on a percent of the career
rate or Master’s maximum. Step movement: The means by which an employee will progress through the salary
schedule. Wage Freeze: No step or column movement for one year along with no change in the salary schedule
Top Related
Copyright © 2022 FDOKUMEN

