2020 Practitioners Salary and Compensation Survey
49
2020 Practitioners Salary and Compensation Survey Engineers Geoscientists Manitoba May 2021
-
Upload
khangminh22 -
Category
Documents
-
view
1 -
download
0
Transcript of 2020 Practitioners Salary and Compensation Survey

2020 Practitioners Salary and Compensation Survey
Engineers Geoscientists ManitobaMay 2021
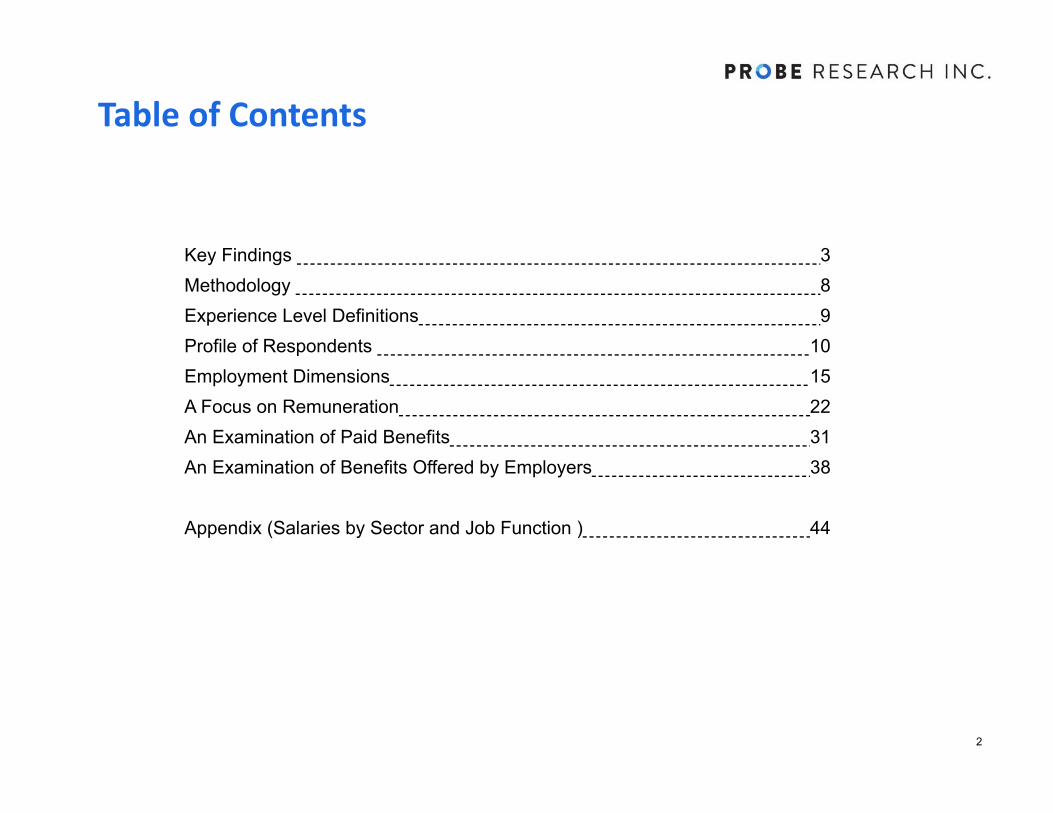
Table of Contents
2
Key Findings 3Methodology 8Experience Level Definitions 9Profile of Respondents 10Employment Dimensions 15A Focus on Remuneration 22An Examination of Paid Benefits 31An Examination of Benefits Offered by Employers 38
Appendix (Salaries by Sector and Job Function ) 44
Key FindingsFor More Information:
Probe Research Inc.603 – 191 Lombard Ave.Winnipeg, MB R3B 0X1(204) 926-6565
www.probe-research.com
3
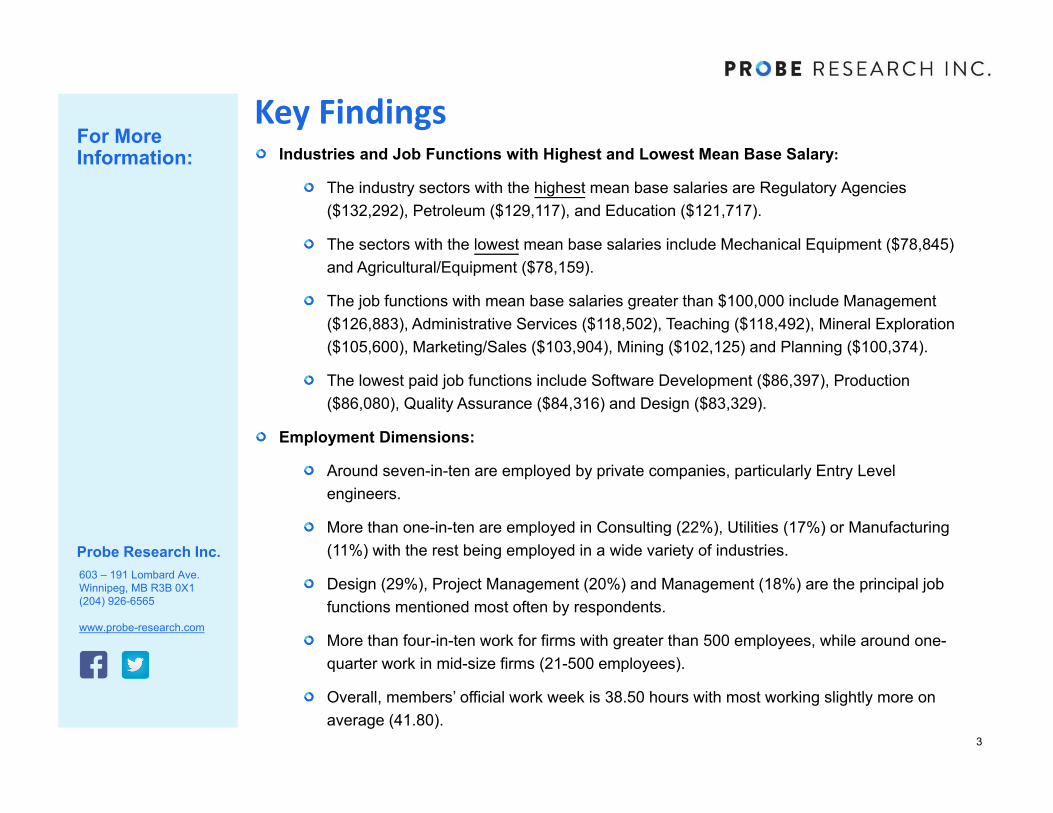
Industries and Job Functions with Highest and Lowest Mean Base Salary:
The industry sectors with the highest mean base salaries are Regulatory Agencies ($132,292), Petroleum ($129,117), and Education ($121,717).
The sectors with the lowest mean base salaries include Mechanical Equipment ($78,845) and Agricultural/Equipment ($78,159).
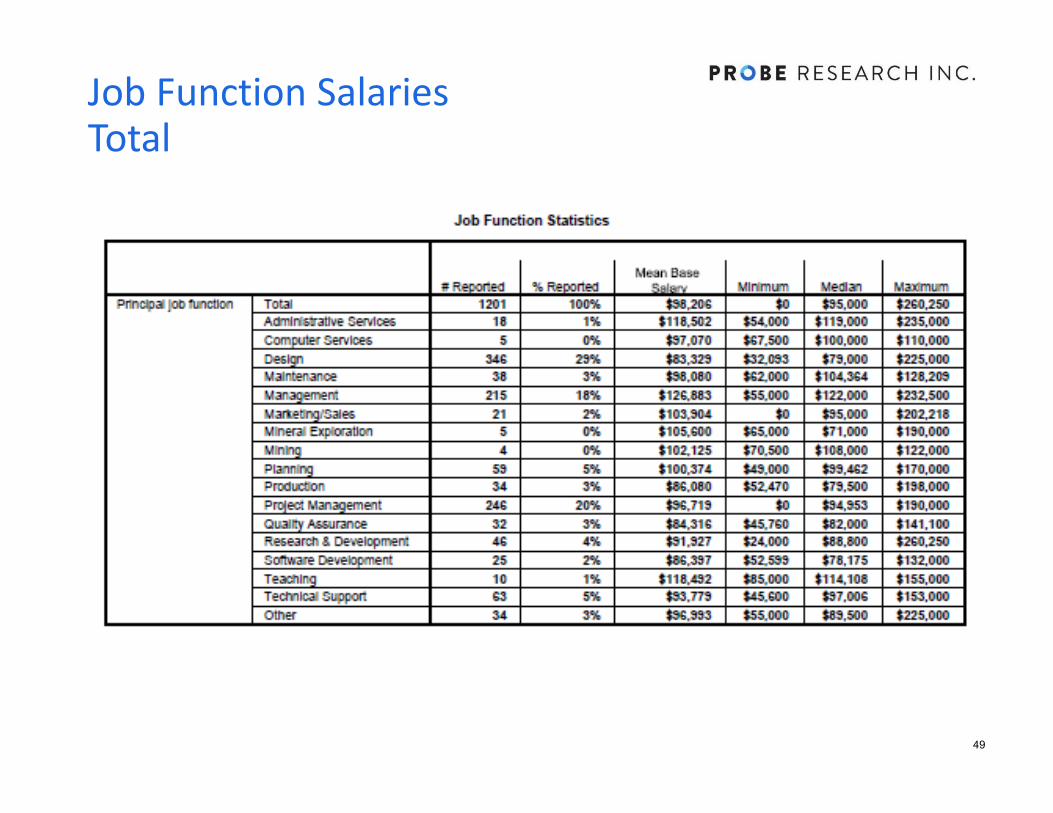
The job functions with mean base salaries greater than $100,000 include Management ($126,883), Administrative Services ($118,502), Teaching ($118,492), Mineral Exploration ($105,600), Marketing/Sales ($103,904), Mining ($102,125) and Planning ($100,374).
The lowest paid job functions include Software Development ($86,397), Production ($86,080), Quality Assurance ($84,316) and Design ($83,329).
Employment Dimensions:
Around seven-in-ten are employed by private companies, particularly Entry Level engineers.
More than one-in-ten are employed in Consulting (22%), Utilities (17%) or Manufacturing (11%) with the rest being employed in a wide variety of industries.
Design (29%), Project Management (20%) and Management (18%) are the principal job functions mentioned most often by respondents.
More than four-in-ten work for firms with greater than 500 employees, while around one-quarter work in mid-size firms (21-500 employees).
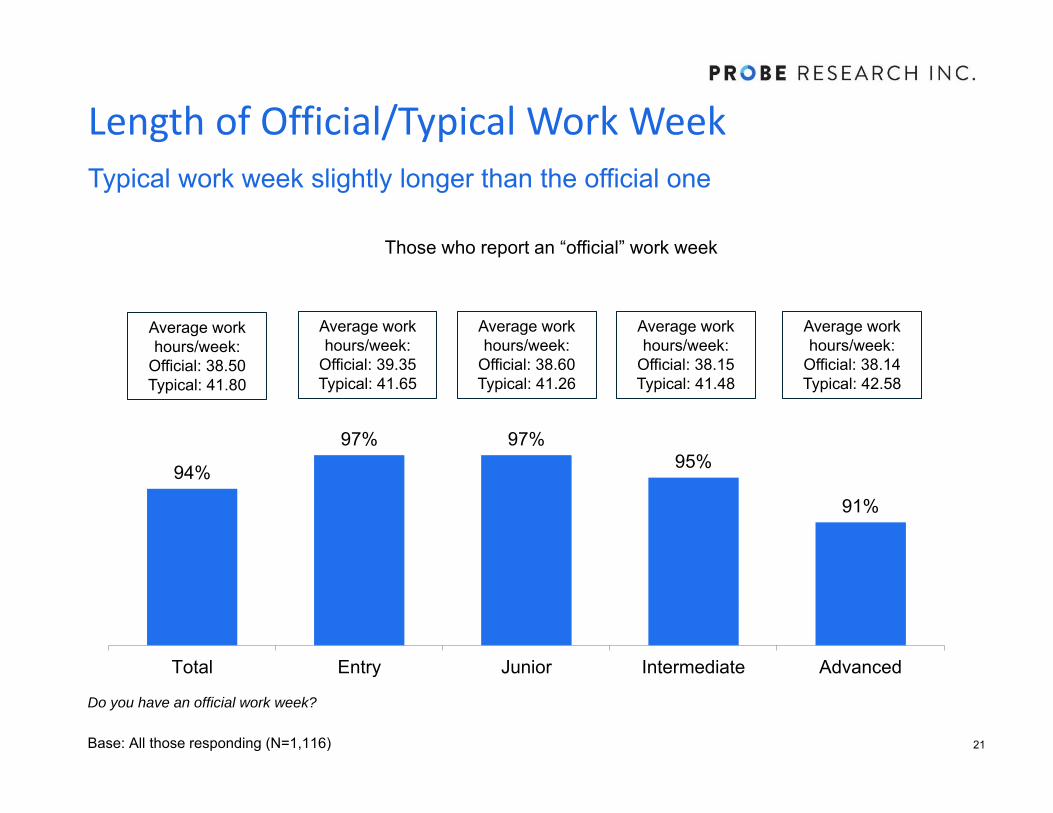
Overall, members’ official work week is 38.50 hours with most working slightly more on average (41.80).
Key FindingsFor More Information:
Probe Research Inc.603 – 191 Lombard Ave.Winnipeg, MB R3B 0X1(204) 926-6565
www.probe-research.com
4
Remuneration:
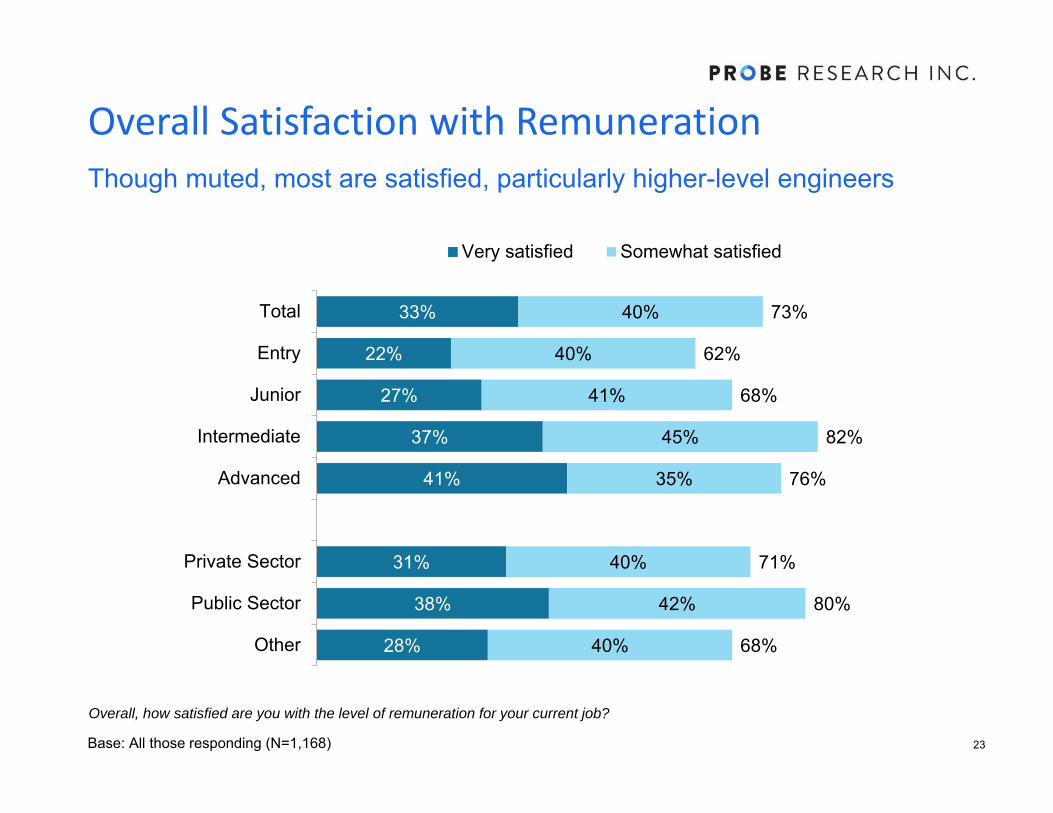
Overall, seven-in-ten are satisfied with their level of remuneration although high levels of satisfaction do not reach 50%. Intermediate (82%) and Advanced Level engineers (78%) are most satisfied as are those working in the public sector (80%).
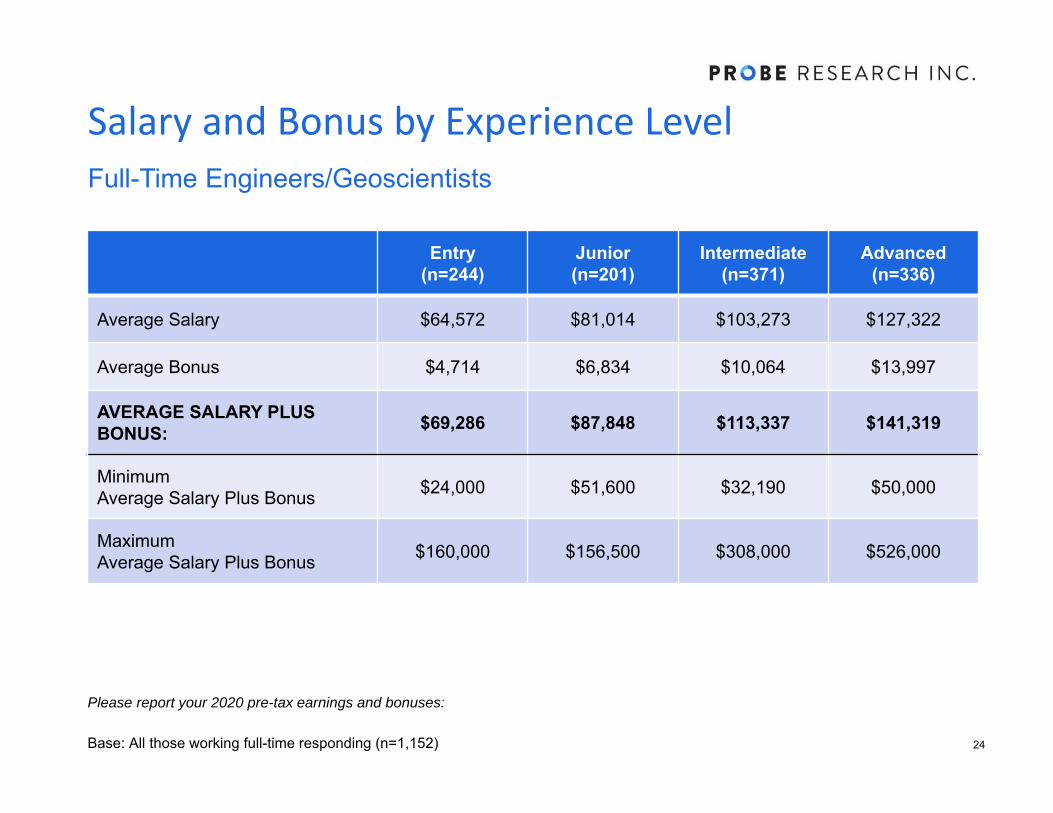
Average salaries plus bonuses for full-time engineers/geoscientists range from $69,286 (Entry Level) to $87,848 for Junior Level, $113,337 for Intermediate Level up to $141,319 for Advanced Level.
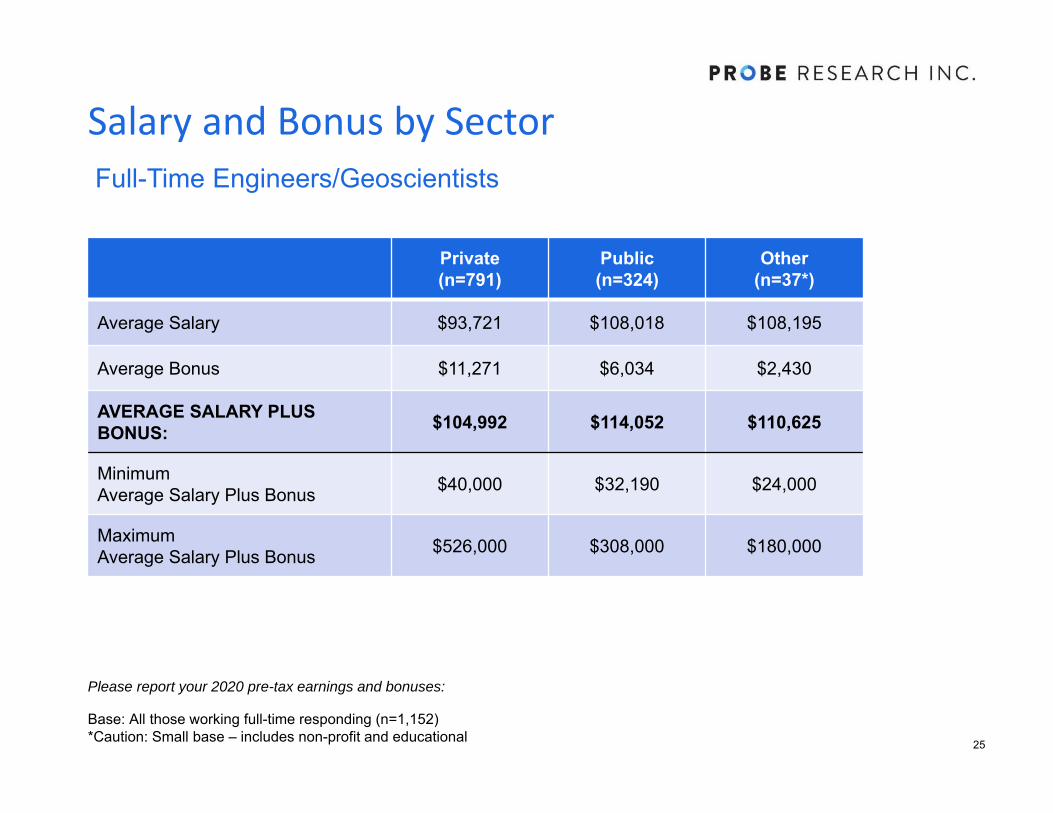
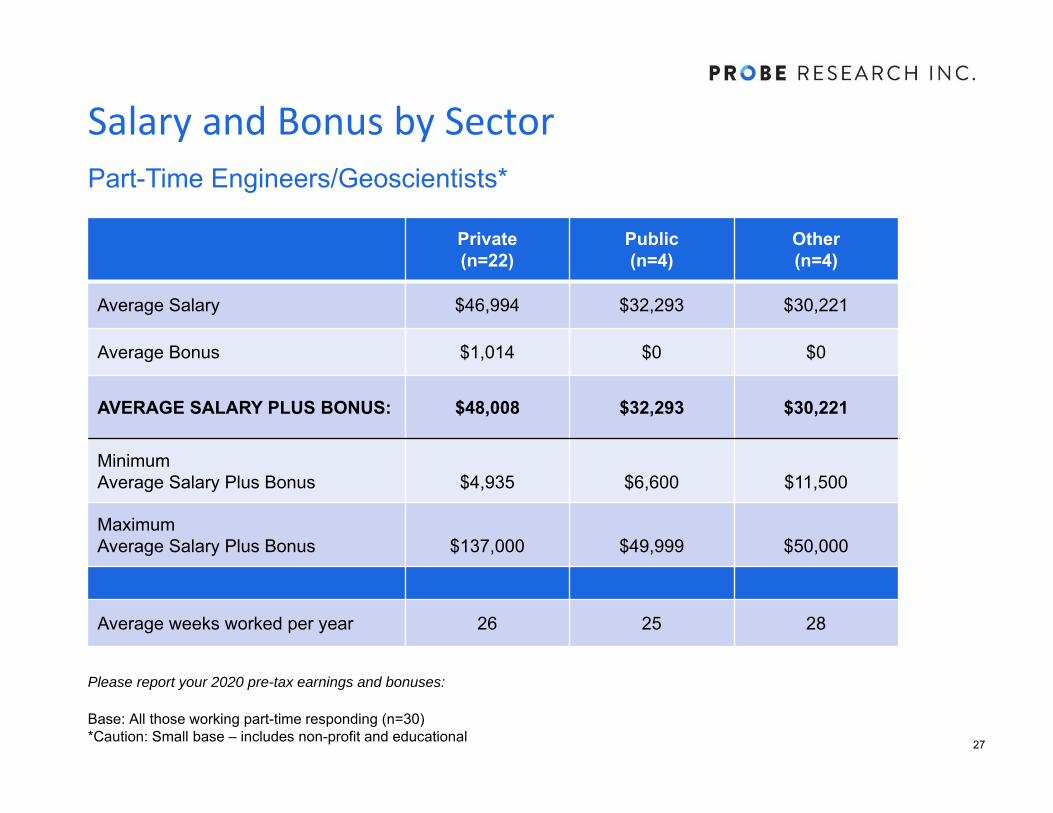
By sector, those working in the private sector earn an average of $104,992 including salary and bonuses, while their public sector counterparts earn $114,052 on average and those working in non-profit/education sectors earn $110,625.
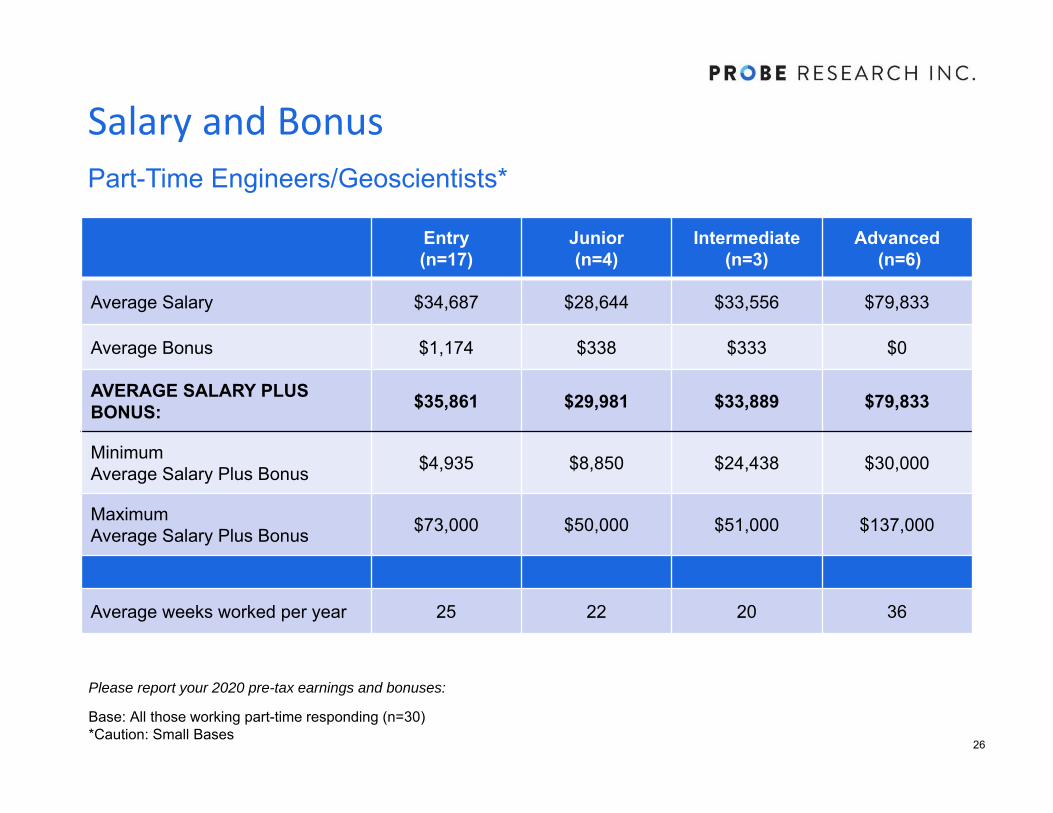
Overall, the average salary and bonus paid to part-time engineers/geoscientists is $43,541. Note this data is based on a very small sample of 30 respondents.
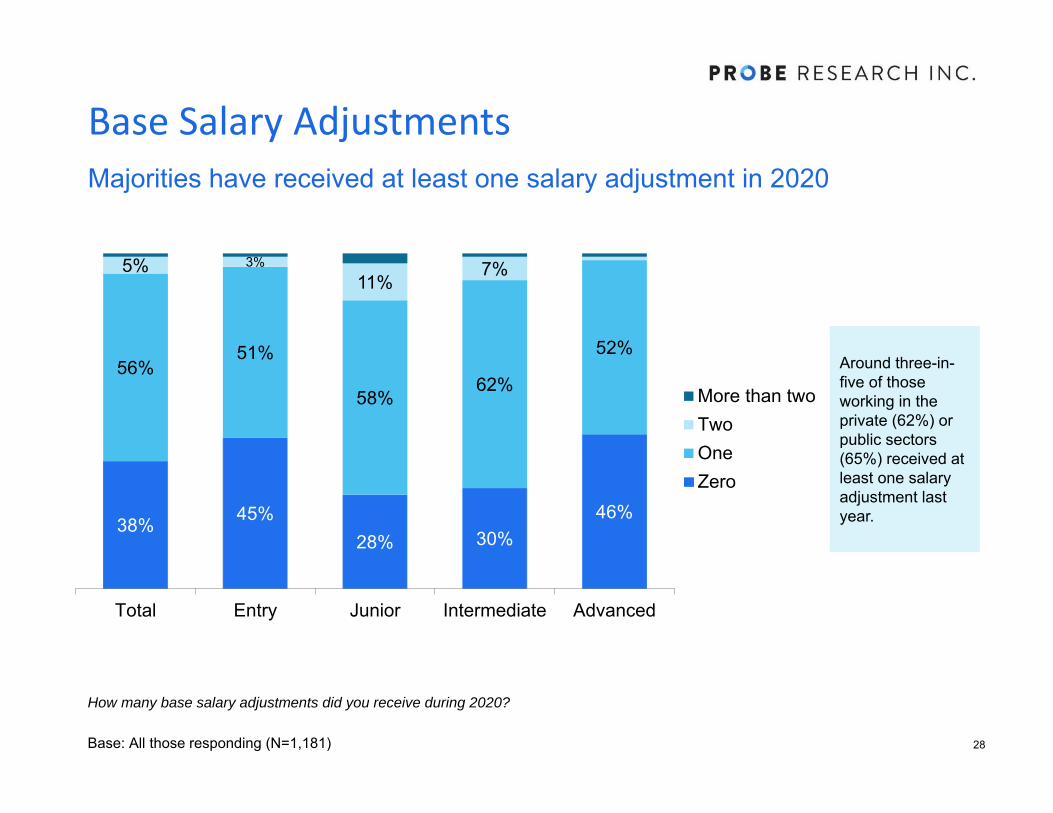
Majorities have received at least one salary adjustment in 2020 that includes a net salary percentage increase of 4.2% overall (rising to 6.1% among Entry Level). Very few received a decrease in their salary in 2020 although the average was a 6.6% decrease.
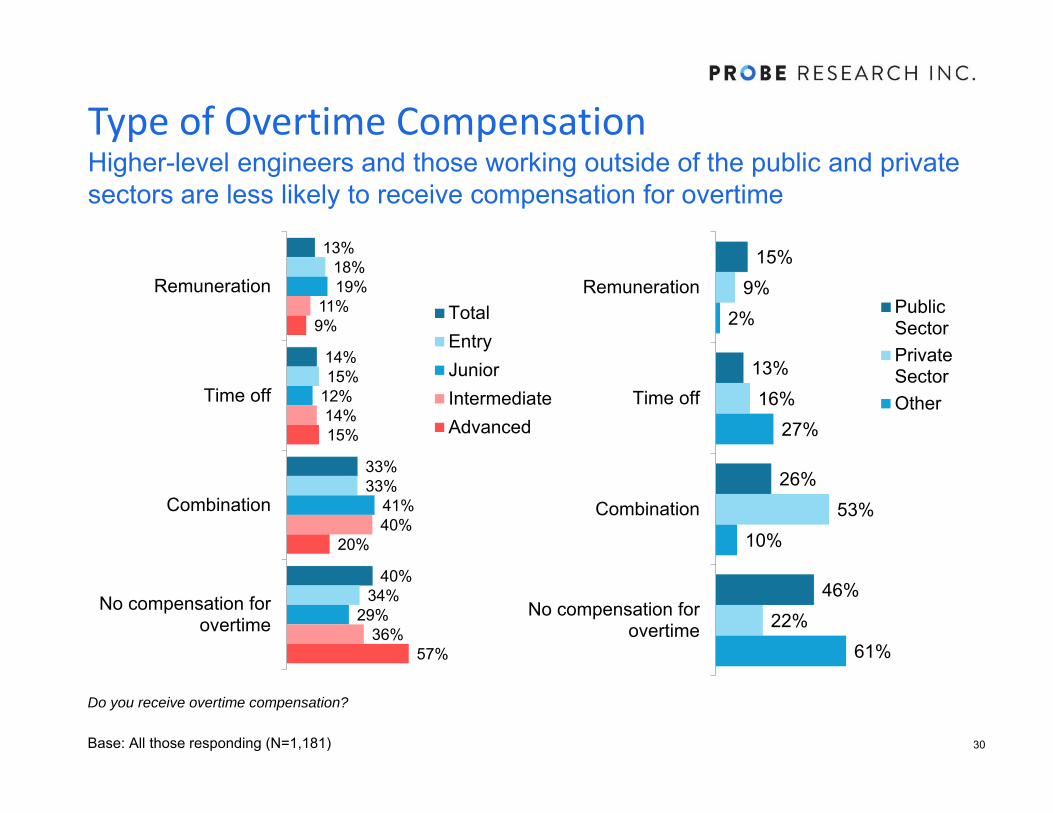
Four-in-ten do not receive any compensation for working overtime, particularly Advanced Level engineers (57% do not receive compensation for overtime). One-third overall receive a combination of money and time-off for working overtime.
Key FindingsFor More Information:
Probe Research Inc.603 – 191 Lombard Ave.Winnipeg, MB R3B 0X1(204) 926-6565
www.probe-research.com
5
Probe Research Inc.
(204) [email protected]
Paid Benefits:
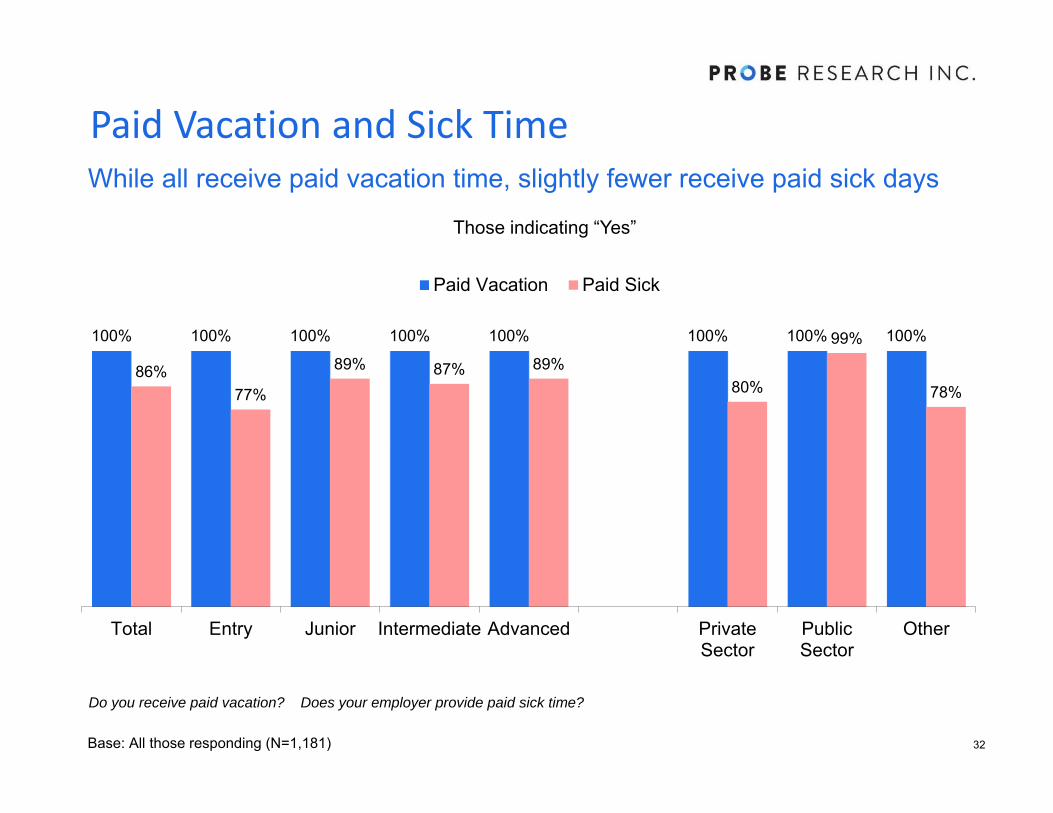
All receive paid vacation time although slightly fewer receive paid sick days. Entry Level (77%) and those who work in the non-profit or education sectors (78%) were least likely to receive paid sick days.
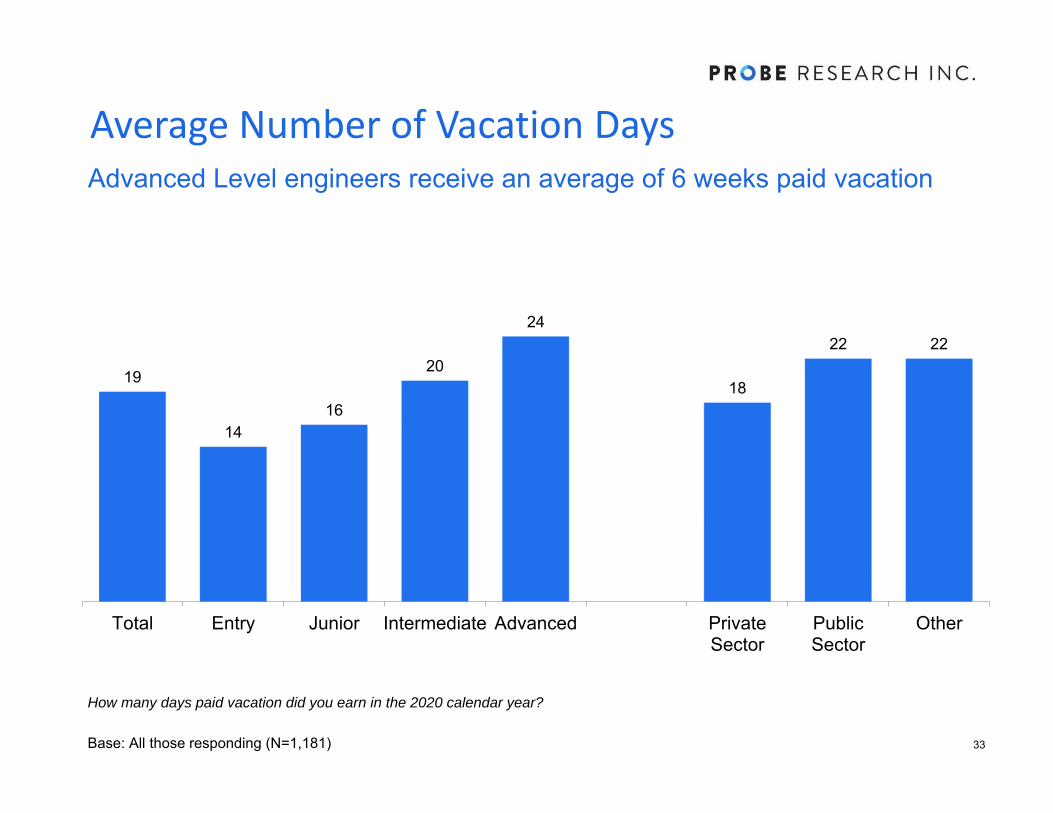
Overall, engineers/geoscientists average 19 days of vacation a year (rising to 24 for Advanced Level).
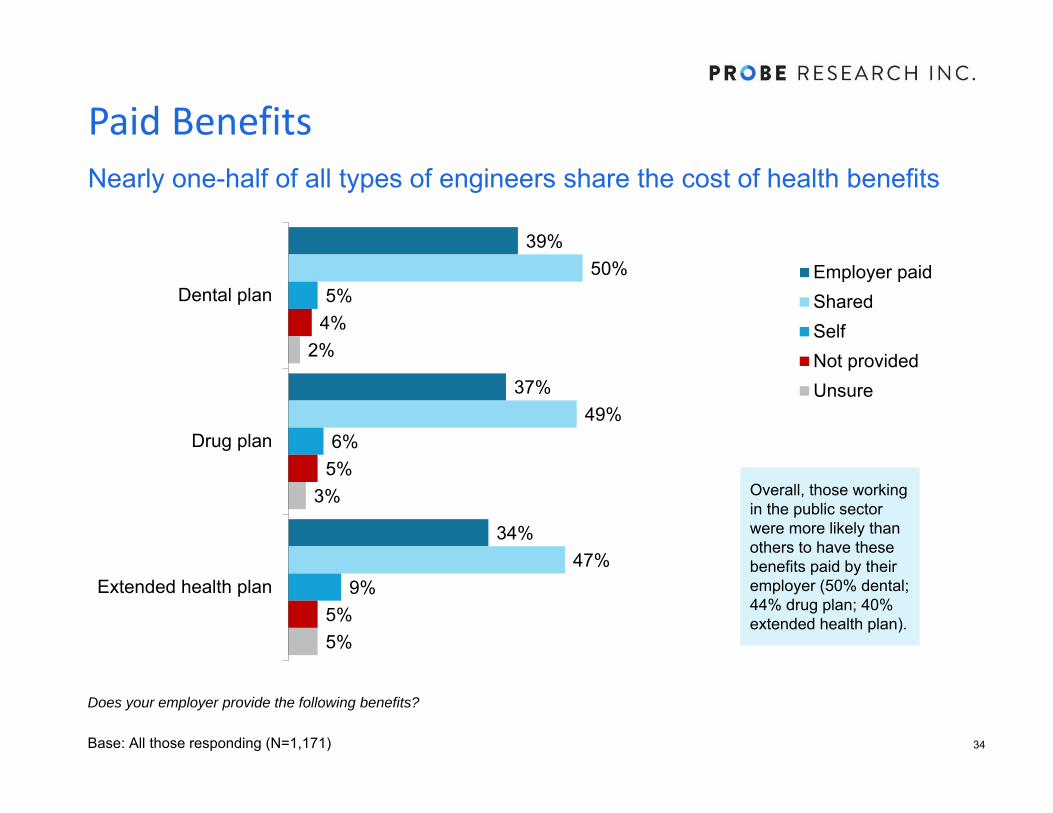
Around one-half of respondents share the costs of their dental, drug and extended health plans, although those working in the public sector were more likely to have these paid by their employer.
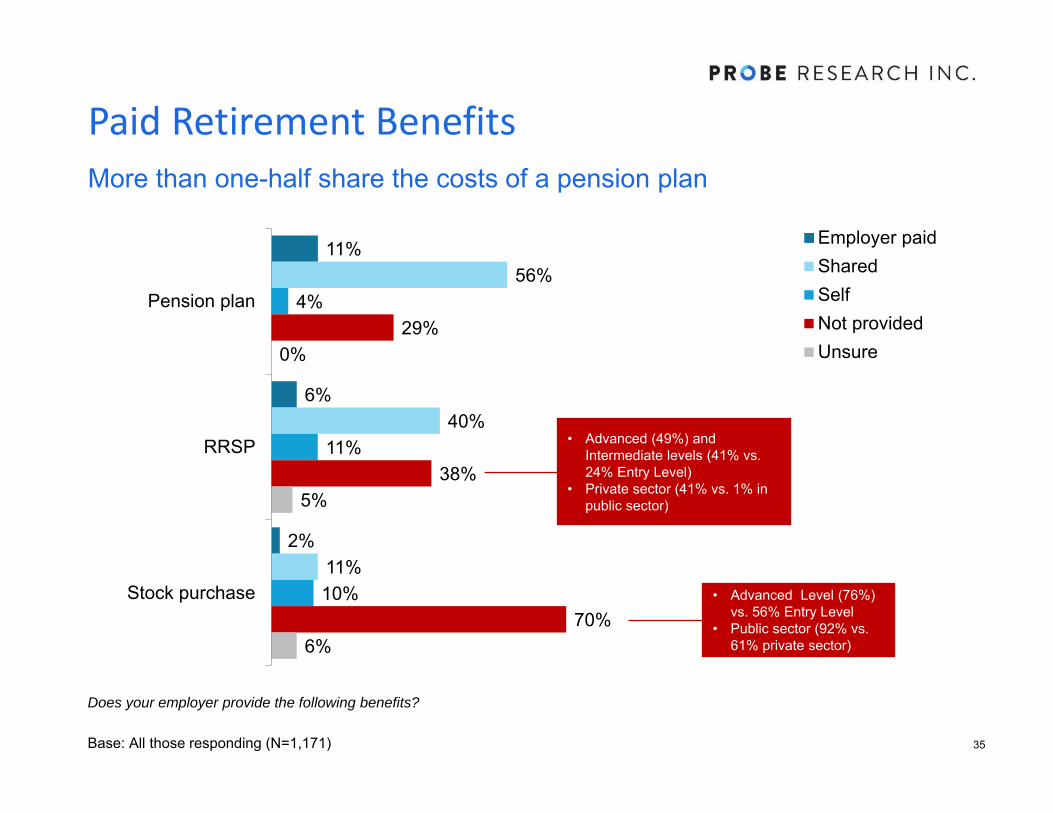
More than one-half share the costs of a pension plan and four-in-ten share the costs of RRSPs, while a majority of 70% do not have any stock purchase options through their employer.
Life insurance and long-term disability were most likely to be a shared expense between employer/employee.
One-quarter of respondents had parental leave (top up of employment insurance) paid by their employer while three-in-ten did not have this benefit or were unsure.
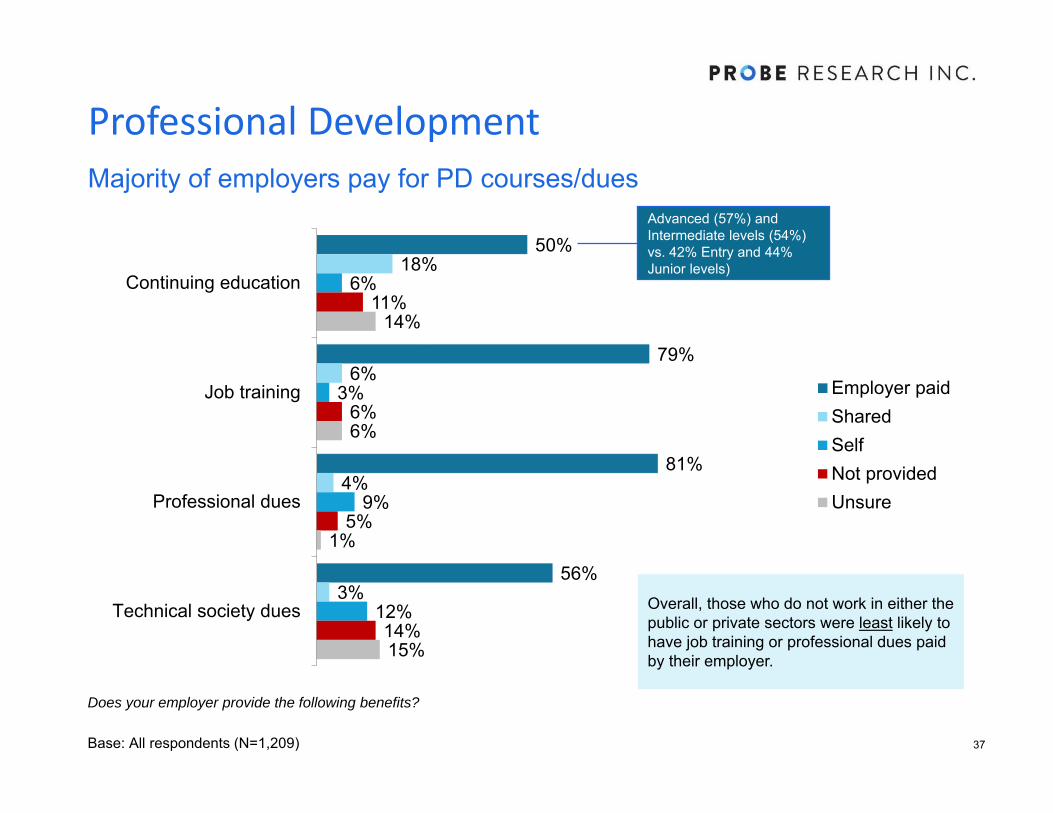
A majority of employers pay for professional development courses including continuing education (50%) and job training (79%).
In terms of professional dues, 81% had their professional dues paid by their employer and 56% had technical society dues paid by their employers.
Key FindingsFor More Information:
Probe Research Inc.603 – 191 Lombard Ave.Winnipeg, MB R3B 0X1(204) 926-6565
www.probe-research.com
6
Benefits Offered by Employers:
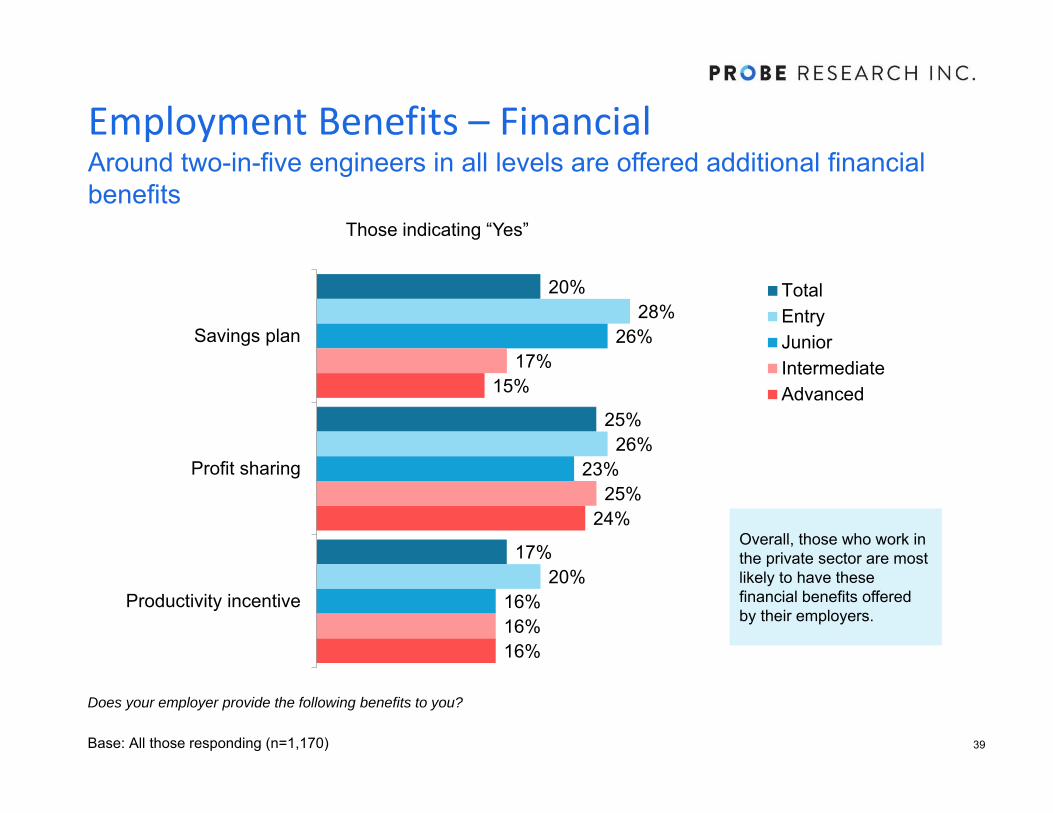
Around two-in-five members are offered additional financial benefits including a profit sharing (25%), a savings plan (20%) and a productivity incentive (17%).
Flexible work hours (81%) and leaves of absence (59%) are offered by a majority of employers although job sharing much less so (13%).
Vehicles (9%) and vehicle allowances (21%) are provided by far fewer employers.
For engineers/geoscientists who are parents, parental leave is offered by around one-half of employers while daycare is offered by only 1% of employers.
Liability insurance is a benefit that most Advanced Level engineers have (49%), while far fewer Entry Level have this benefit (20%).
Key FindingsFor More Information:
Probe Research Inc.603 – 191 Lombard Ave.Winnipeg, MB R3B 0X1(204) 926-6565
www.probe-research.com
7
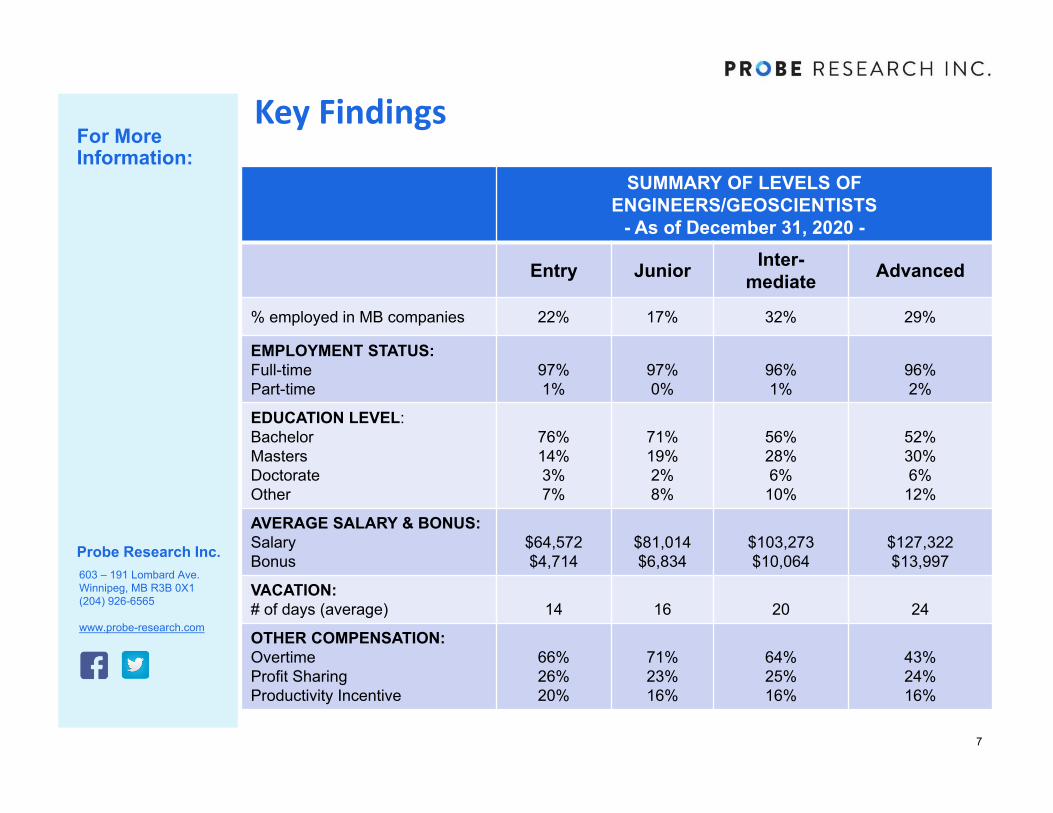
SUMMARY OF LEVELS OF ENGINEERS/GEOSCIENTISTS
- As of December 31, 2020 -
Entry Junior Inter-mediate Advanced
% employed in MB companies 22% 17% 32% 29%
EMPLOYMENT STATUS:Full-timePart-time
97%1%
97%0%
96%1%
96%2%
EDUCATION LEVEL:BachelorMastersDoctorateOther
76%14%3%7%
71%19%2%8%
56%28%6%10%
52%30%6%
12%
AVERAGE SALARY & BONUS: SalaryBonus
$64,572$4,714
$81,014$6,834
$103,273$10,064
$127,322$13,997
VACATION:# of days (average) 14 16 20 24
OTHER COMPENSATION:OvertimeProfit SharingProductivity Incentive
66%26%20%
71%23%16%
64%25%16%
43%24%16%
8
Methodology
Research Objectives
Engineers Geoscientists Manitoba conducted an online survey among its engineer and geoscience members. The purpose of the research was to collect information on the salary and compensation packages provided by employers. Probe Research Inc. was retained to analyze the data and report on the findings.
Methodology
An online survey was administered and made available by Engineers Geoscientists Manitoba to its members via their database portal. The survey was available for completion from March 1st to March 31st, 2021. Self-employed engineers/geoscientists are not included in these results.
A total of 1,209 members completed the survey for a response rate of 22%.
Sample
The sample consisted of a potential of 5,503 eligible members (both active interns or members as of February 25, 2021) with a home and work address in Manitoba.
As an online survey is a sample of convenience, no margin-of-error can be ascribed. However, a random and representative non-convenience sample of 1,209 eligible engineers/geoscientists would have a margin of error of ± 2.48 percentage points, 19 times out of 20 (finite population correction).
9
Experience Level Definitions
Below are the definitions used to describe the four levels of engineers/geoscientists as of December 31, 2020 who participated in this research:
Entry Level: This includes engineering/geoscience interns (EIT/GIT) who have not yet received a professional designation and/or who have 1-4 years experience after graduation.
Junior Level: This includes engineers/geoscientists with a professional designation (P.Eng./P.Geo.) and who have 5-9 years of experience after graduation.
Intermediate Level: This includes engineers/geoscientists with a professional designation (P.Eng./P.Geo.) and have 10-19 years experience after graduation.
Advanced Level: This includes engineers/geoscientists with a professional designation (P.Eng./P.Geo.) and 20+ years experience after graduation.

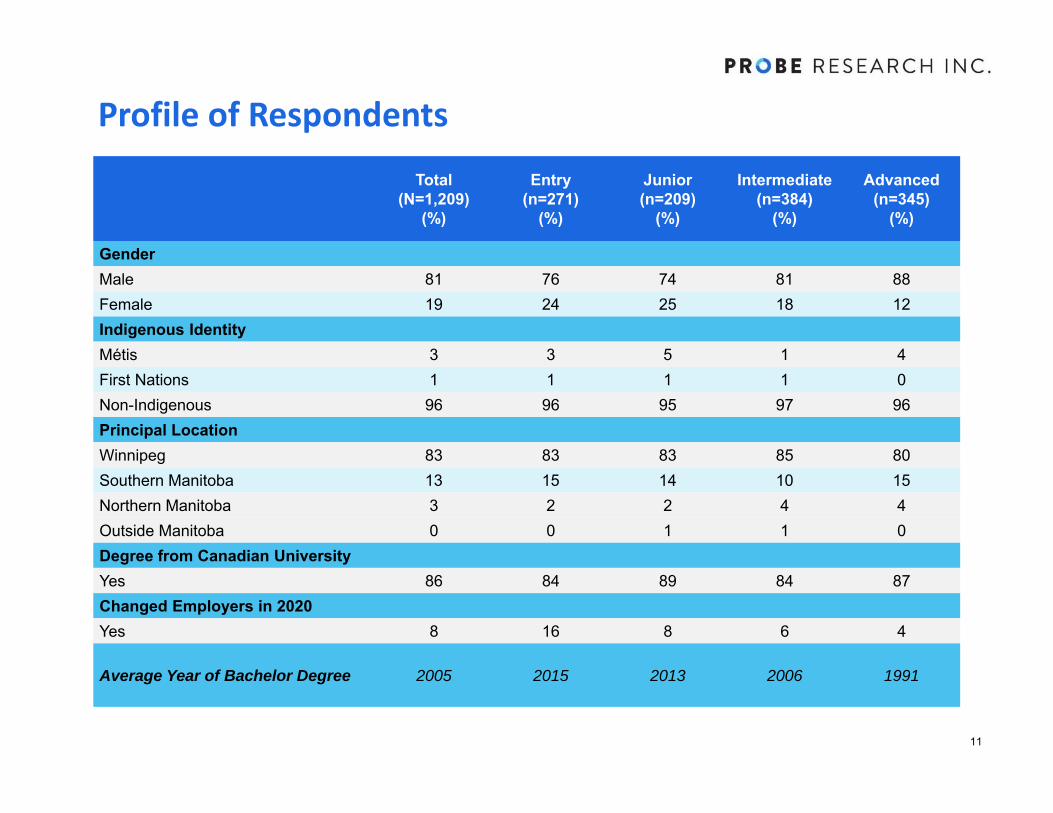
Profile of Respondents
Profile of Respondents
11
Total (N=1,209)
(%)
Entry(n=271)
(%)
Junior(n=209)
(%)
Intermediate(n=384)
(%)
Advanced(n=345)
(%)
Gender Male 81 76 74 81 88Female 19 24 25 18 12Indigenous Identity Métis 3 3 5 1 4First Nations 1 1 1 1 0Non-Indigenous 96 96 95 97 96 Principal LocationWinnipeg 83 83 83 85 80Southern Manitoba 13 15 14 10 15Northern Manitoba 3 2 2 4 4Outside Manitoba 0 0 1 1 0Degree from Canadian UniversityYes 86 84 89 84 87Changed Employers in 2020Yes 8 16 8 6 4
Average Year of Bachelor Degree 2005 2015 2013 2006 1991
12
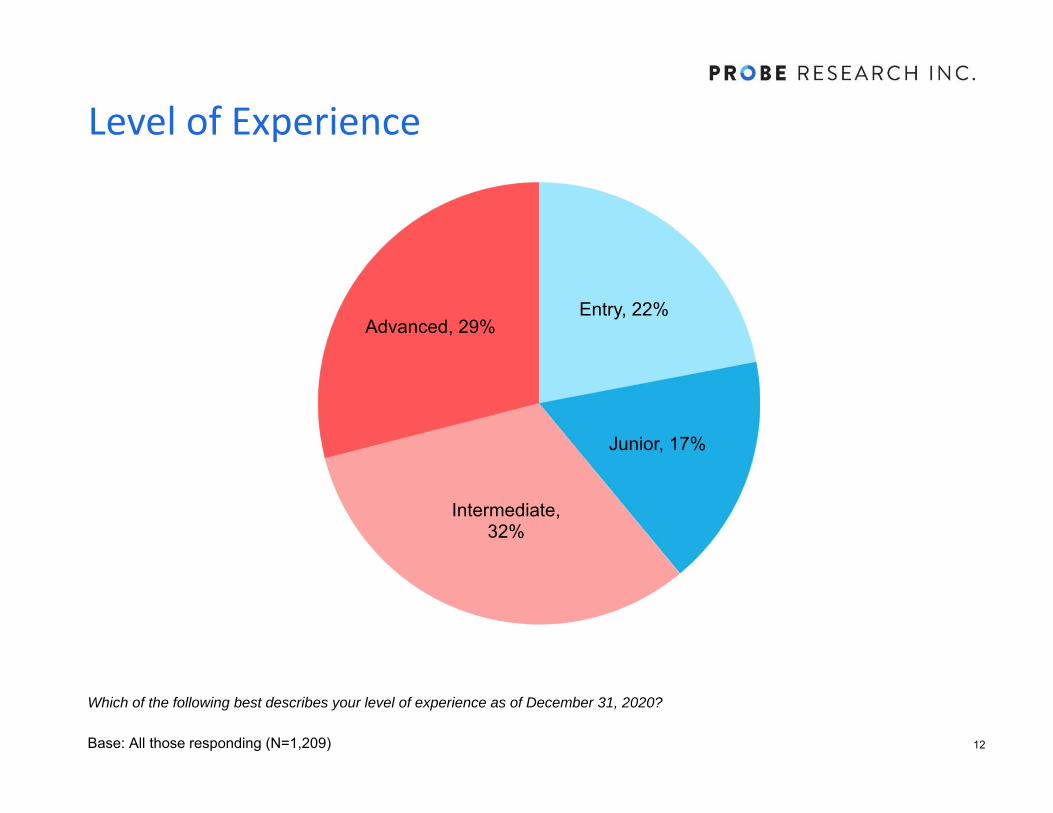
Level of Experience
Which of the following best describes your level of experience as of December 31, 2020?
Base: All those responding (N=1,209)
Entry, 22%
Junior, 17%
Intermediate, 32%
Advanced, 29%
13
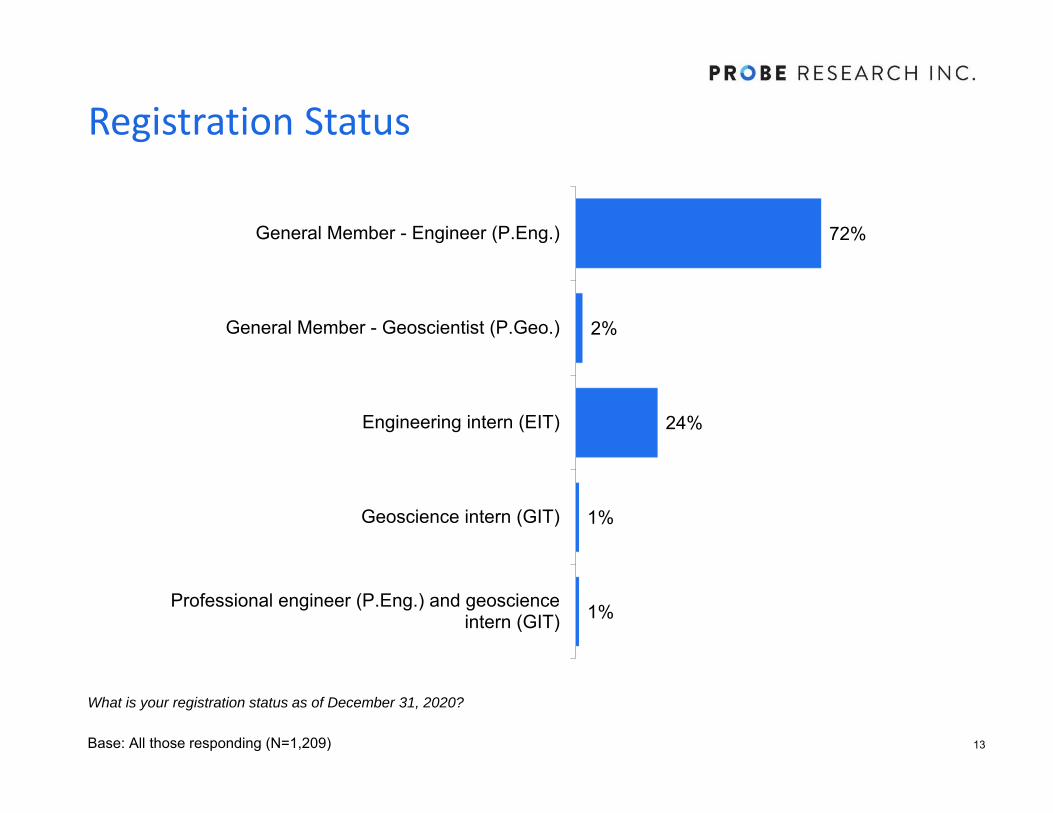
Registration Status
What is your registration status as of December 31, 2020?
Base: All those responding (N=1,209)
72%
2%
24%
1%
1%
General Member - Engineer (P.Eng.)
General Member - Geoscientist (P.Geo.)
Engineering intern (EIT)
Geoscience intern (GIT)
Professional engineer (P.Eng.) and geoscienceintern (GIT)
14
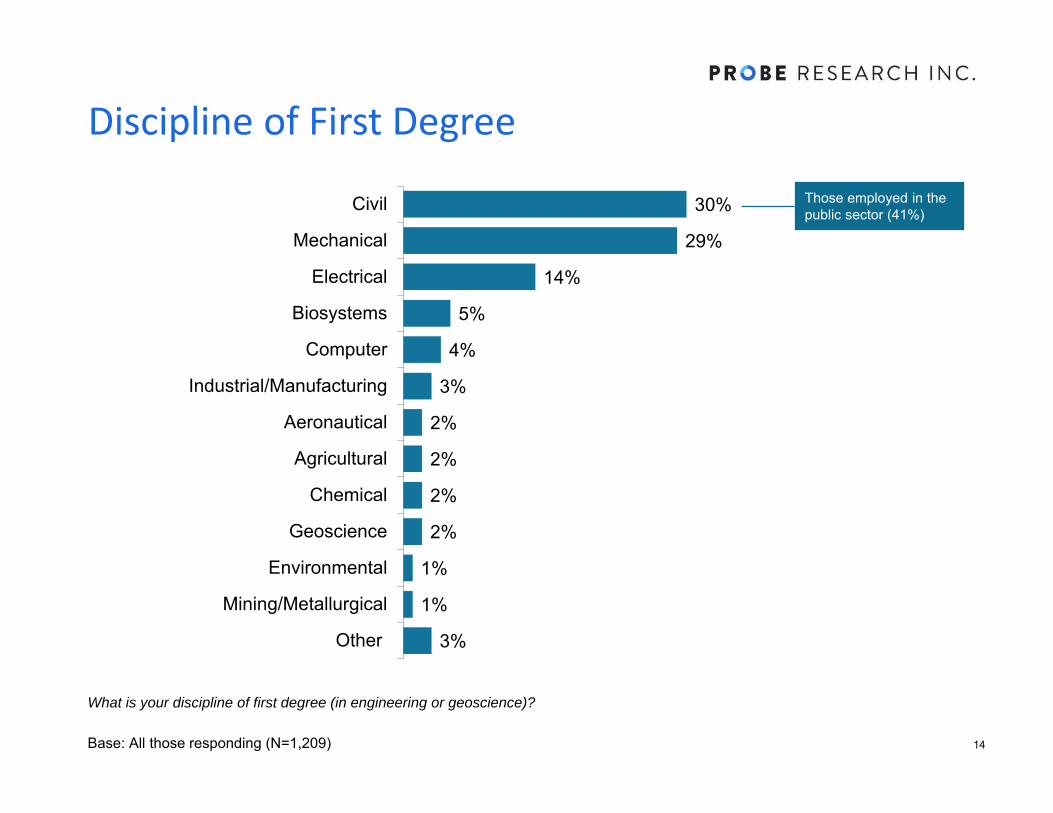
Discipline of First Degree
What is your discipline of first degree (in engineering or geoscience)?
Base: All those responding (N=1,209)
30%
29%
14%
5%
4%
3%
2%
2%
2%
2%
1%
1%
3%
Civil
Mechanical
Electrical
Biosystems
Computer
Industrial/Manufacturing
Aeronautical
Agricultural
Chemical
Geoscience
Environmental
Mining/Metallurgical
Other
Those employed in the public sector (41%)
Employment Dimensions
16
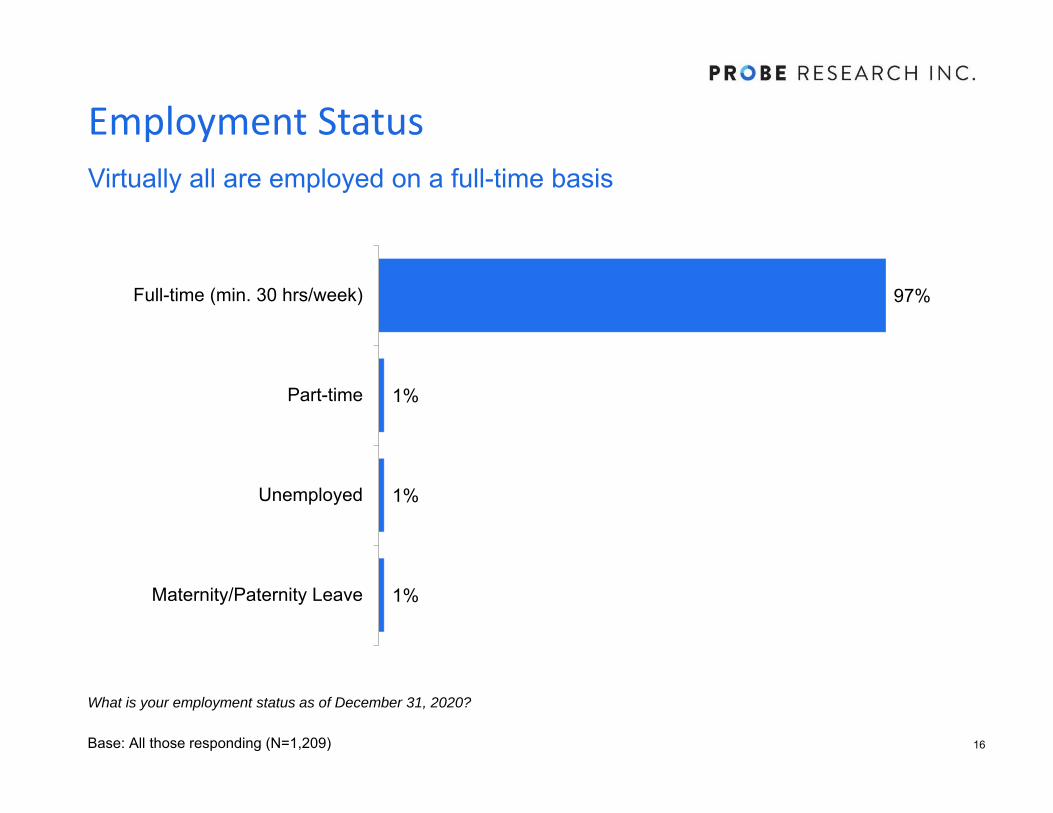
Employment StatusVirtually all are employed on a full-time basis
What is your employment status as of December 31, 2020?
Base: All those responding (N=1,209)
97%
1%
1%
1%
Full-time (min. 30 hrs/week)
Part-time
Unemployed
Maternity/Paternity Leave
17
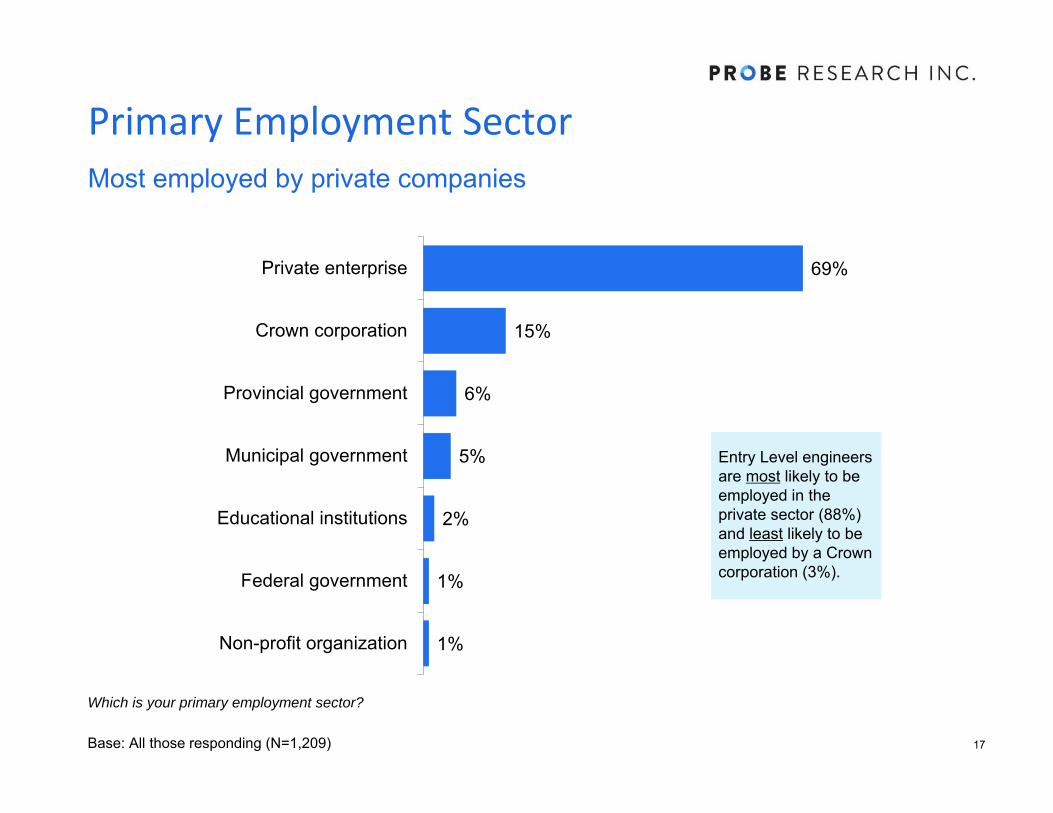
Primary Employment SectorMost employed by private companies
Which is your primary employment sector?
Base: All those responding (N=1,209)
69%
15%
6%
5%
2%
1%
1%
Private enterprise
Crown corporation
Provincial government
Municipal government
Educational institutions
Federal government
Non-profit organization
Entry Level engineers are most likely to be employed in the private sector (88%) and least likely to be employed by a Crown corporation (3%).
18
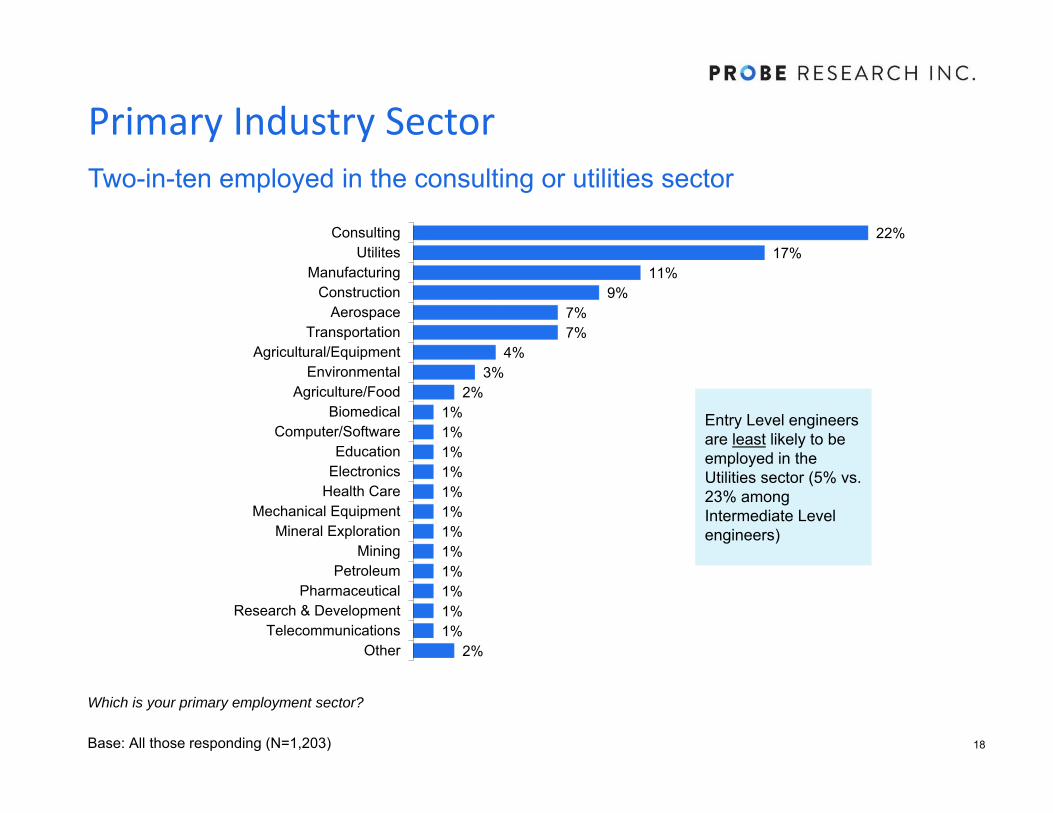
Primary Industry SectorTwo-in-ten employed in the consulting or utilities sector
Which is your primary employment sector?
Base: All those responding (N=1,203)
22%17%
11%9%
7%7%
4%3%
2%1%1%1%1%1%1%1%1%1%1%1%1%
2%
ConsultingUtilites
ManufacturingConstruction
AerospaceTransportation
Agricultural/EquipmentEnvironmental
Agriculture/FoodBiomedical
Computer/SoftwareEducation
ElectronicsHealth Care
Mechanical EquipmentMineral Exploration
MiningPetroleum
PharmaceuticalResearch & Development
TelecommunicationsOther
Entry Level engineers are least likely to be employed in the Utilities sector (5% vs.23% among Intermediate Levelengineers)
19
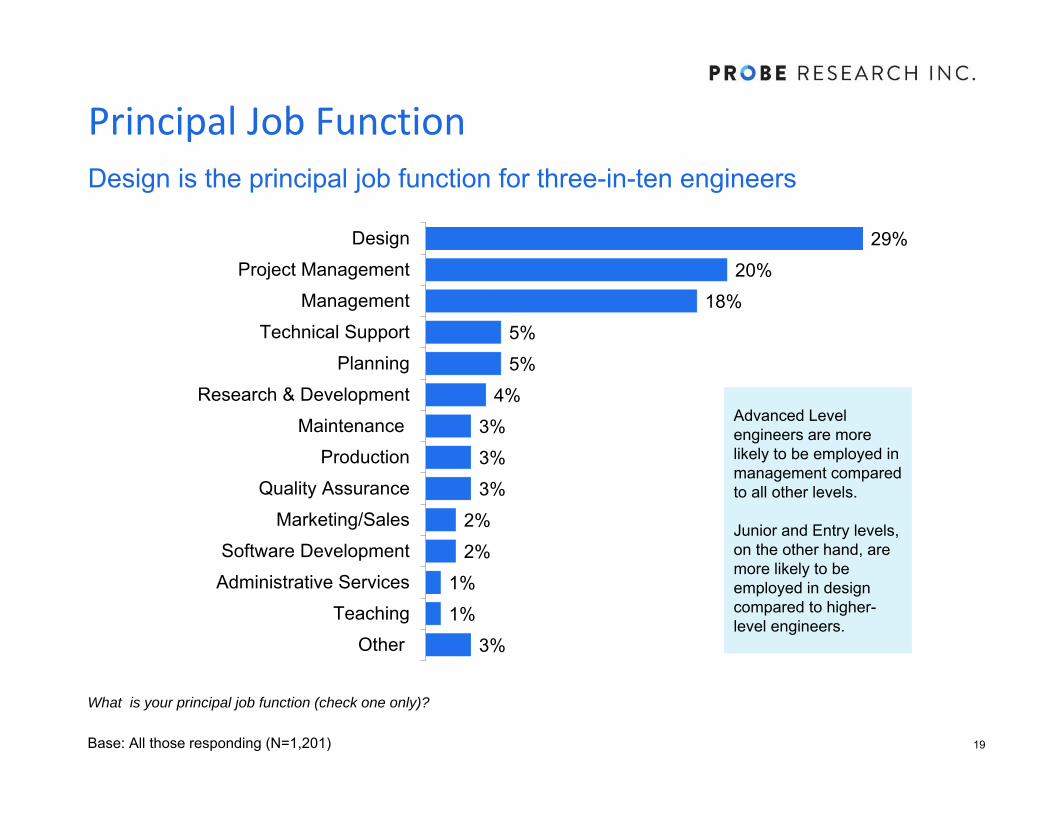
Principal Job FunctionDesign is the principal job function for three-in-ten engineers
What is your principal job function (check one only)?
Base: All those responding (N=1,201)
29%20%
18%5%5%
4%3%3%3%
2%2%
1%1%
3%
DesignProject Management
ManagementTechnical Support
PlanningResearch & Development
MaintenanceProduction
Quality AssuranceMarketing/Sales
Software DevelopmentAdministrative Services
TeachingOther
Advanced Level engineers are more likely to be employed in management compared to all other levels.
Junior and Entry levels, on the other hand, are more likely to be employed in design compared to higher-level engineers.
20
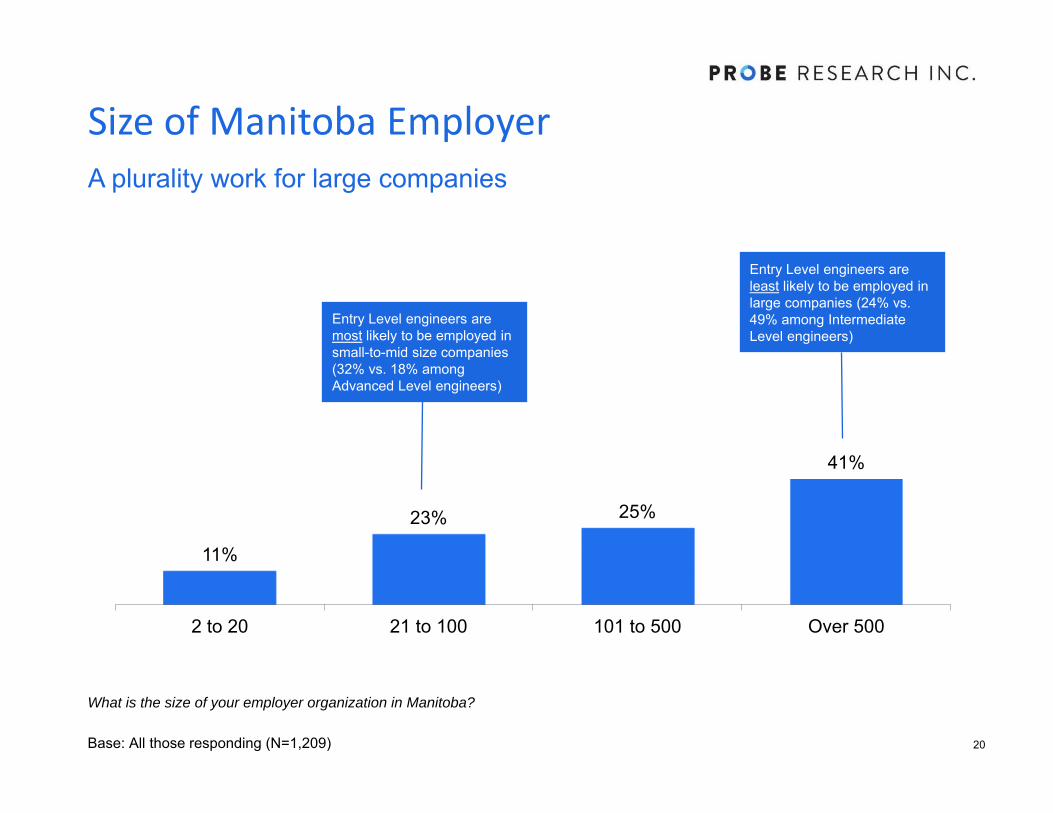
Size of Manitoba EmployerA plurality work for large companies
What is the size of your employer organization in Manitoba?
Base: All those responding (N=1,209)
11%
23% 25%
41%
2 to 20 21 to 100 101 to 500 Over 500
Entry Level engineers are least likely to be employed in large companies (24% vs.49% among Intermediate Level engineers)
Entry Level engineers are most likely to be employed in small-to-mid size companies (32% vs. 18% among Advanced Level engineers)
21
Length of Official/Typical Work WeekTypical work week slightly longer than the official one
Do you have an official work week?
Base: All those responding (N=1,116)
94%
97% 97%95%
91%
Total Entry Junior Intermediate Advanced
Those who report an “official” work week
Average work hours/week:
Official: 38.14Typical: 42.58
Average work hours/week:
Official: 39.35Typical: 41.65
Average work hours/week:
Official: 38.60Typical: 41.26
Average work hours/week:
Official: 38.15Typical: 41.48
Average work hours/week:
Official: 38.50Typical: 41.80

A Focus on Remuneration
23
Overall Satisfaction with RemunerationThough muted, most are satisfied, particularly higher-level engineers
Base: All those responding (N=1,168)
33%
22%
27%
37%
41%
31%
38%
28%
40%
40%
41%
45%
35%
40%
42%
40%
73%
62%
68%
82%
76%
71%
80%
68%
Total
Entry
Junior
Intermediate
Advanced
Private Sector
Public Sector
Other
Very satisfied Somewhat satisfied
Overall, how satisfied are you with the level of remuneration for your current job?
24
Salary and Bonus by Experience Level Full-Time Engineers/Geoscientists
Please report your 2020 pre-tax earnings and bonuses:
Base: All those working full-time responding (n=1,152)
Entry(n=244)
Junior(n=201)
Intermediate(n=371)
Advanced (n=336)
Average Salary $64,572 $81,014 $103,273 $127,322
Average Bonus $4,714 $6,834 $10,064 $13,997
AVERAGE SALARY PLUS BONUS: $69,286 $87,848 $113,337 $141,319
Minimum Average Salary Plus Bonus $24,000 $51,600 $32,190 $50,000
Maximum Average Salary Plus Bonus $160,000 $156,500 $308,000 $526,000
25
Salary and Bonus by Sector Full-Time Engineers/Geoscientists
Please report your 2020 pre-tax earnings and bonuses:
Base: All those working full-time responding (n=1,152)*Caution: Small base – includes non-profit and educational
Private(n=791)
Public(n=324)
Other(n=37*)
Average Salary $93,721 $108,018 $108,195
Average Bonus $11,271 $6,034 $2,430
AVERAGE SALARY PLUS BONUS: $104,992 $114,052 $110,625
Minimum Average Salary Plus Bonus $40,000 $32,190 $24,000
Maximum Average Salary Plus Bonus $526,000 $308,000 $180,000
26
Salary and Bonus Part-Time Engineers/Geoscientists*
Please report your 2020 pre-tax earnings and bonuses:
Base: All those working part-time responding (n=30)*Caution: Small Bases
Entry(n=17)
Junior(n=4)
Intermediate(n=3)
Advanced(n=6)
Average Salary $34,687 $28,644 $33,556 $79,833
Average Bonus $1,174 $338 $333 $0
AVERAGE SALARY PLUS BONUS: $35,861 $29,981 $33,889 $79,833
Minimum Average Salary Plus Bonus $4,935 $8,850 $24,438 $30,000
Maximum Average Salary Plus Bonus $73,000 $50,000 $51,000 $137,000
Average weeks worked per year 25 22 20 36
27
Salary and Bonus by Sector Part-Time Engineers/Geoscientists*
Please report your 2020 pre-tax earnings and bonuses:
Base: All those working part-time responding (n=30)*Caution: Small base – includes non-profit and educational
Private(n=22)
Public(n=4)
Other(n=4)
Average Salary $46,994 $32,293 $30,221
Average Bonus $1,014 $0 $0
AVERAGE SALARY PLUS BONUS: $48,008 $32,293 $30,221
Minimum Average Salary Plus Bonus $4,935 $6,600 $11,500
Maximum Average Salary Plus Bonus $137,000 $49,999 $50,000
Average weeks worked per year 26 25 28
28
Base Salary AdjustmentsMajorities have received at least one salary adjustment in 2020
How many base salary adjustments did you receive during 2020?
Base: All those responding (N=1,181)
38% 45%28% 30%
46%
56%51%
58%62%
52%
5% 3%11%
7%
Total Entry Junior Intermediate Advanced
More than twoTwoOneZero
Around three-in-five of those working in the private (62%) or public sectors (65%) received at least one salary adjustment last year.
29
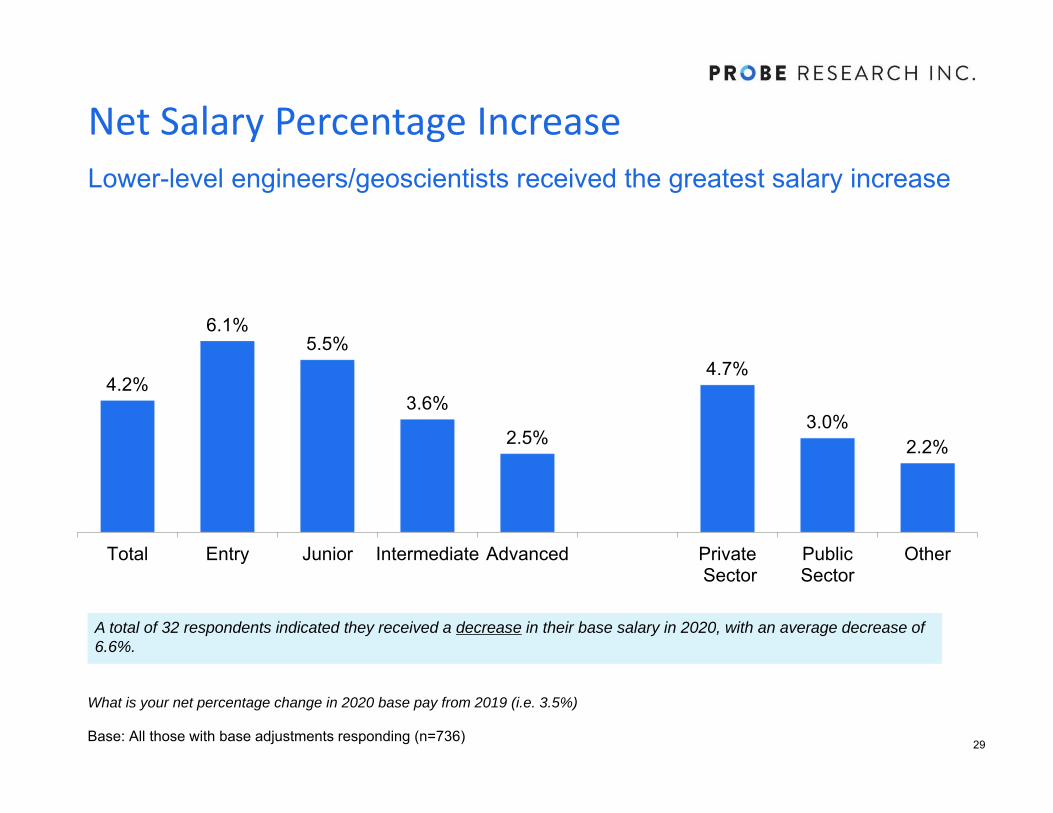
Net Salary Percentage IncreaseLower-level engineers/geoscientists received the greatest salary increase
What is your net percentage change in 2020 base pay from 2019 (i.e. 3.5%)
Base: All those with base adjustments responding (n=736)
4.2%
6.1%5.5%
3.6%
2.5%
4.7%
3.0%2.2%
Total Entry Junior Intermediate Advanced Private Sector
PublicSector
Other
A total of 32 respondents indicated they received a decrease in their base salary in 2020, with an average decrease of 6.6%.
30
Type of Overtime CompensationHigher-level engineers and those working outside of the public and private sectors are less likely to receive compensation for overtime
Do you receive overtime compensation?
Base: All those responding (N=1,181)
13%
14%
33%
40%
18%
15%
33%
34%
19%
12%
41%
29%
11%
14%
40%
36%
9%
15%
20%
57%
Remuneration
Time off
Combination
No compensation forovertime
TotalEntryJuniorIntermediateAdvanced
15%
13%
26%
46%
9%
16%
53%
22%
2%
27%
10%
61%
Remuneration
Time off
Combination
No compensation forovertime
PublicSectorPrivateSectorOther
An Examination of Paid Benefits
32
Paid Vacation and Sick TimeWhile all receive paid vacation time, slightly fewer receive paid sick days
Do you receive paid vacation? Does your employer provide paid sick time?
Base: All those responding (N=1,181)
100% 100% 100% 100% 100% 100% 100% 100%
86%77%
89% 87% 89%80%
99%
78%
Total Entry Junior Intermediate Advanced PrivateSector
PublicSector
Other
Paid Vacation Paid Sick
Those indicating “Yes”
33
Average Number of Vacation DaysAdvanced Level engineers receive an average of 6 weeks paid vacation
How many days paid vacation did you earn in the 2020 calendar year?
Base: All those responding (N=1,181)
19
1416
20
24
18
22 22
Total Entry Junior Intermediate Advanced PrivateSector
PublicSector
Other
34
Paid BenefitsNearly one-half of all types of engineers share the cost of health benefits
Does your employer provide the following benefits?
Base: All those responding (N=1,171)
39%
37%
34%
50%
49%
47%
5%
6%
9%
4%
5%
5%
2%
3%
5%
Dental plan
Drug plan
Extended health plan
Employer paidSharedSelfNot providedUnsure
Overall, those working in the public sector were more likely than others to have these benefits paid by their employer (50% dental; 44% drug plan; 40% extended health plan).
35
Paid Retirement BenefitsMore than one-half share the costs of a pension plan
Does your employer provide the following benefits?
Base: All those responding (N=1,171)
11%
6%
2%
56%
40%
11%
4%
11%
10%
29%
38%
70%
0%
5%
6%
Pension plan
RRSP
Stock purchase
Employer paidSharedSelfNot providedUnsure
• Advanced (49%) andIntermediate levels (41% vs.24% Entry Level)
• Private sector (41% vs. 1% inpublic sector)
• Advanced Level (76%)vs. 56% Entry Level
• Public sector (92% vs.61% private sector)

36
Paid Leave and Disability BenefitsA plurality share the cost of life insurance premiums with their employer
Does your employer provide the following benefits?
Base: All those responding (N=1,171)
27%
35%
29%
26%
45%
34%
38%
7%
13%
7%
12%
3%
8%
8%
6%
30%
6%
15%
15%
35%
Life insurance
Short term disability
Long term disability
Parental leave (top upEmployment Insurance)
Employer paidSharedSelfNot providedUnsure
Intermediate (40%) and Advanced levels (41% vs.28% Entry Level)
Public sector (43% vs. 19% private sector)
37
Professional DevelopmentMajority of employers pay for PD courses/dues
Does your employer provide the following benefits?
Base: All respondents (N=1,209)
50%
79%
81%
56%
18%
6%
4%
3%
6%
3%
9%
12%
11%
6%
5%
14%
14%
6%
1%
15%
Continuing education
Job training
Professional dues
Technical society dues
Employer paidSharedSelfNot providedUnsure
Advanced (57%) and Intermediate levels (54%) vs. 42% Entry and 44% Junior levels)
Overall, those who do not work in either the public or private sectors were least likely to have job training or professional dues paid by their employer.

An Examination of Benefits Provided by Employers
39
Employment Benefits – Financial Around two-in-five engineers in all levels are offered additional financial benefits
Does your employer provide the following benefits to you?
Base: All those responding (n=1,170)
20%
25%
17%
28%
26%
20%
26%
23%
16%
17%
25%
16%
15%
24%
16%
Savings plan
Profit sharing
Productivity incentive
TotalEntryJuniorIntermediateAdvanced
Overall, those who work in the private sector are most likely to have these financial benefits offered by their employers.
Those indicating “Yes”
40
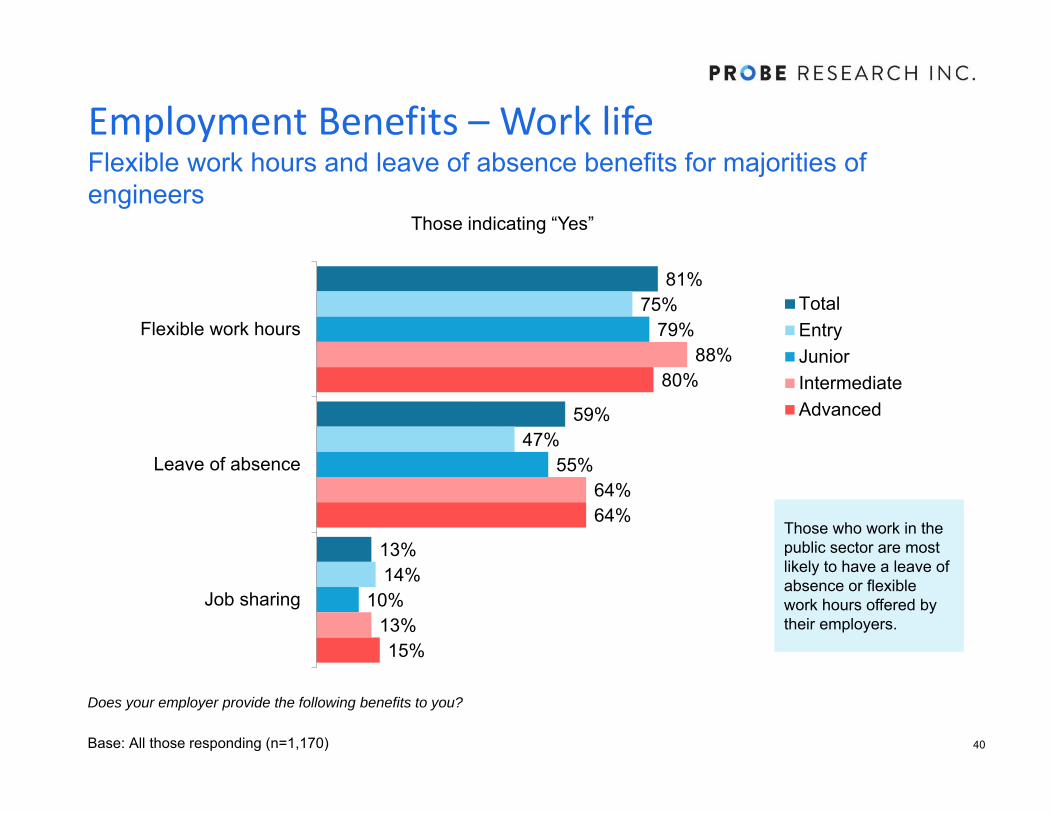
Employment Benefits – Work lifeFlexible work hours and leave of absence benefits for majorities of engineers
Does your employer provide the following benefits to you?
Base: All those responding (n=1,170)
81%
59%
13%
75%
47%
14%
79%
55%
10%
88%
64%
13%
80%
64%
15%
Flexible work hours
Leave of absence
Job sharing
TotalEntryJuniorIntermediateAdvanced
Those who work in the public sector are most likely to have a leave of absence or flexible work hours offered by their employers.
Those indicating “Yes”
41
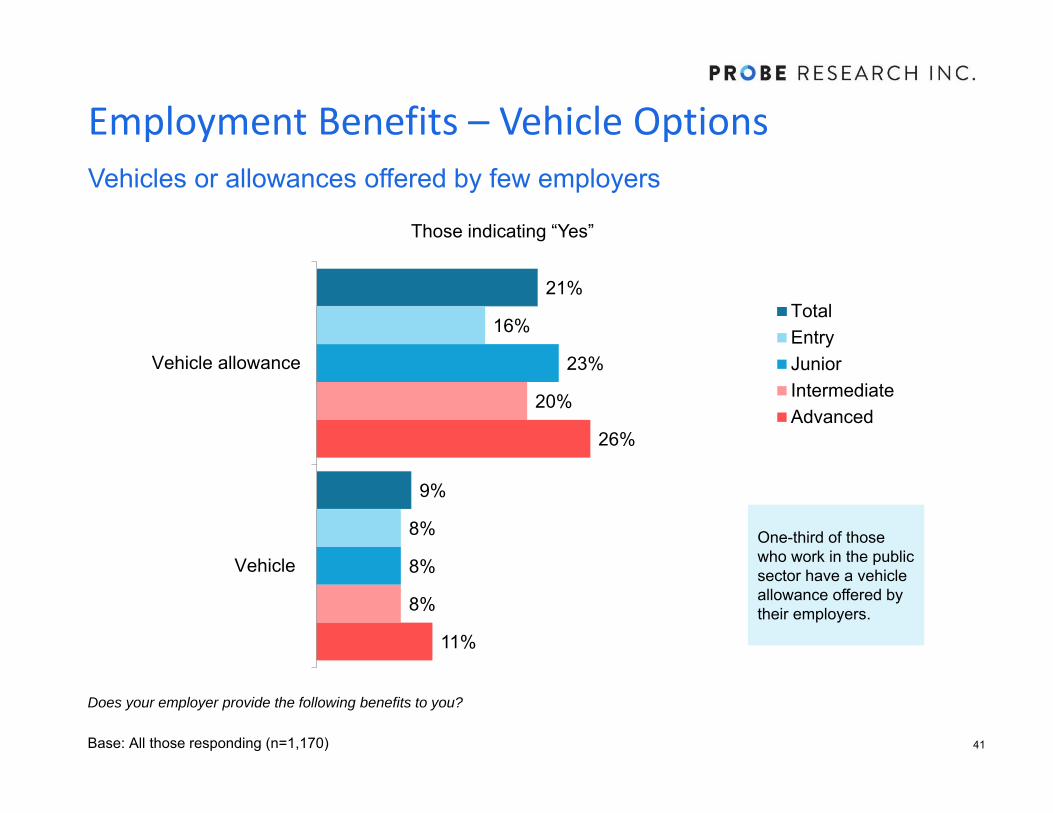
Employment Benefits – Vehicle OptionsVehicles or allowances offered by few employers
Does your employer provide the following benefits to you?
Base: All those responding (n=1,170)
21%
9%
16%
8%
23%
8%
20%
8%
26%
11%
Vehicle allowance
Vehicle
TotalEntryJuniorIntermediateAdvanced
One-third of those who work in the public sector have a vehicle allowance offered by their employers.
Those indicating “Yes”
42
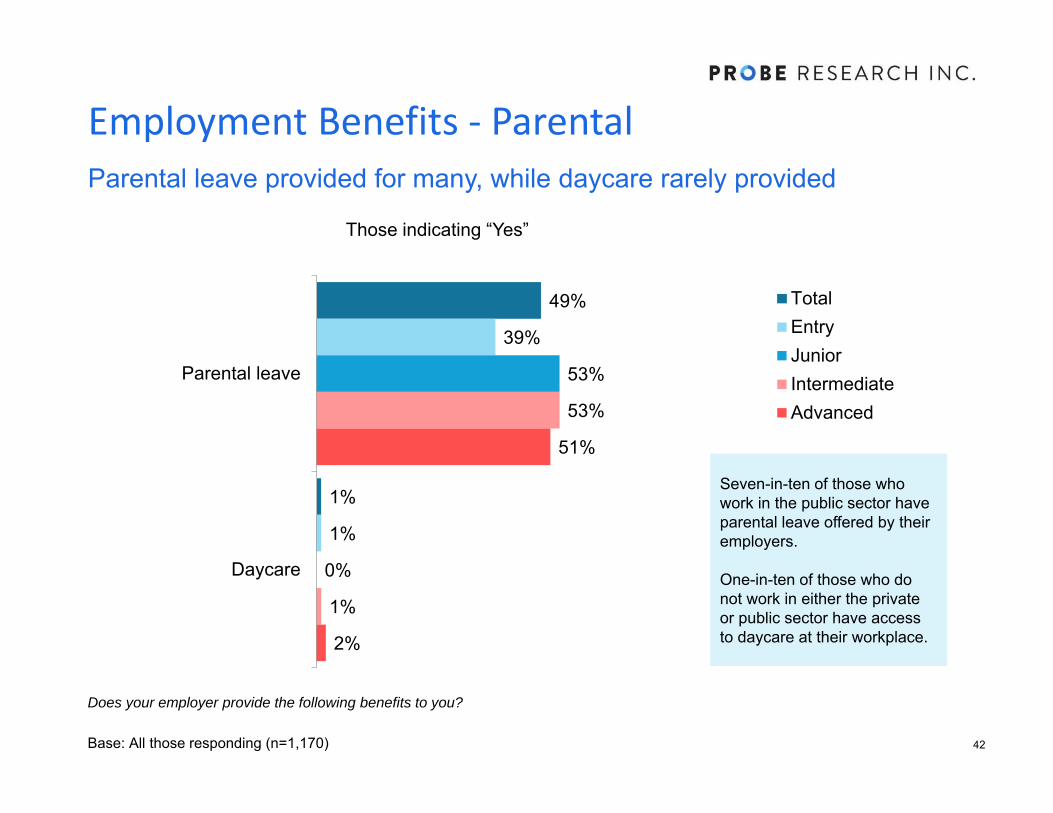
Employment Benefits ‐ ParentalParental leave provided for many, while daycare rarely provided
Does your employer provide the following benefits to you?
Base: All those responding (n=1,170)
49%
1%
39%
1%
53%
0%
53%
1%
51%
2%
Parental leave
Daycare
TotalEntryJuniorIntermediateAdvanced
Seven-in-ten of those who work in the public sector have parental leave offered by their employers.
One-in-ten of those who do not work in either the private or public sector have access to daycare at their workplace.
Those indicating “Yes”
43
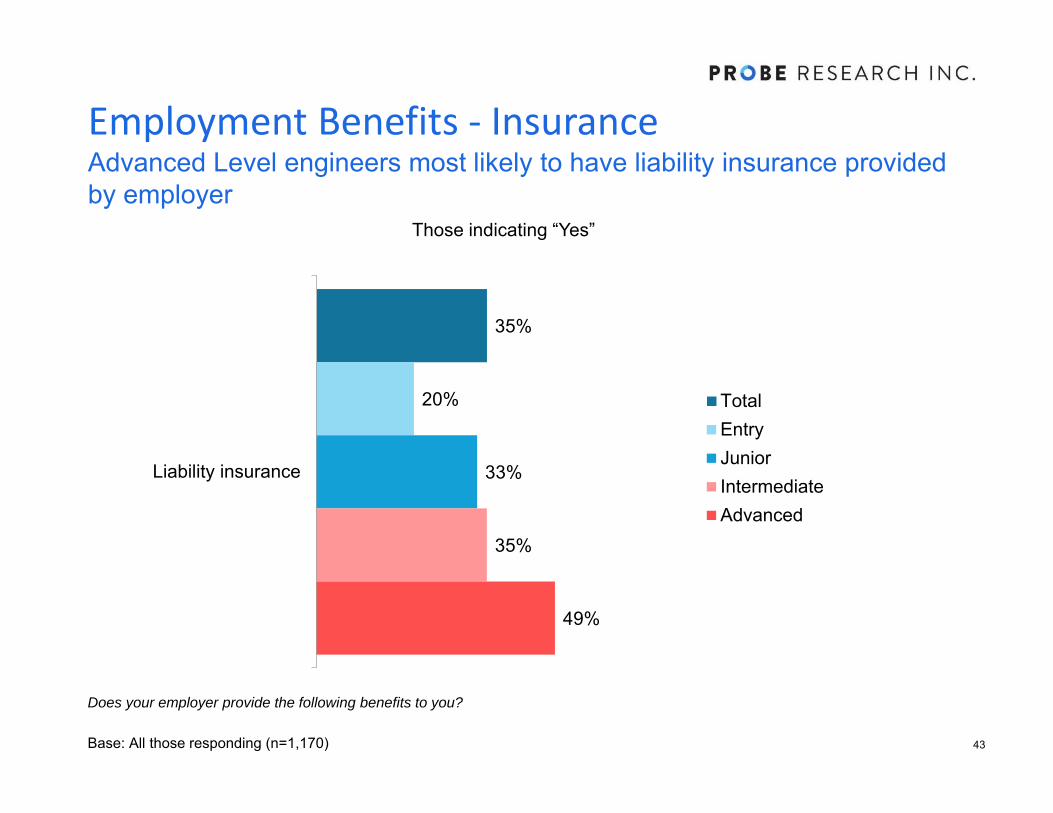
Employment Benefits ‐ InsuranceAdvanced Level engineers most likely to have liability insurance provided by employer
Does your employer provide the following benefits to you?
Base: All those responding (n=1,170)
35%
20%
33%
35%
49%
Liability insurance
TotalEntryJuniorIntermediateAdvanced
Those indicating “Yes”

APPENDIXSalaries by Sector and Job Function
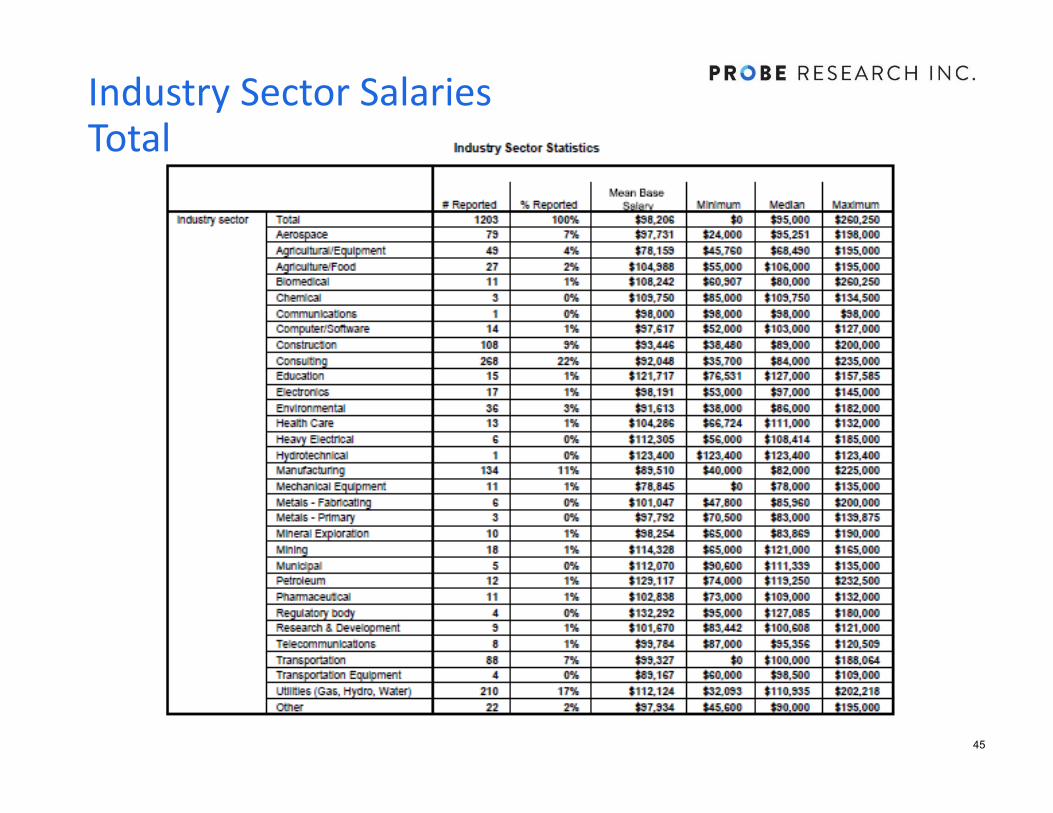
45
Industry Sector SalariesTotal
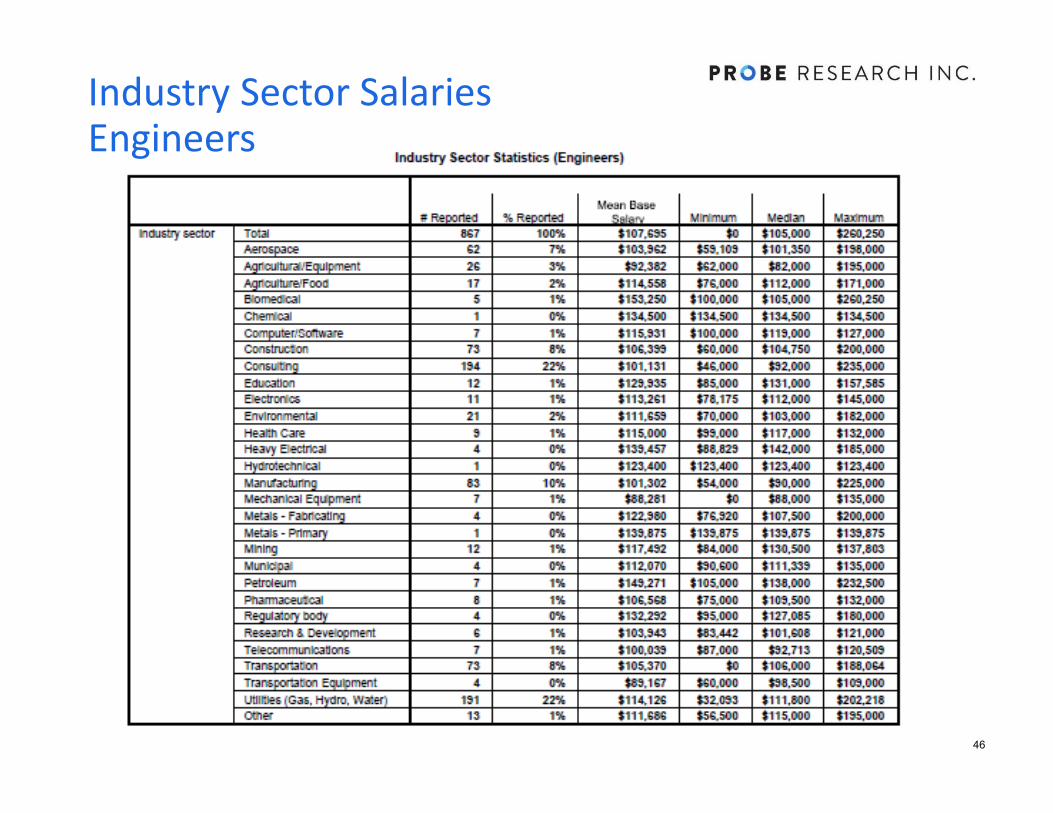
46
Industry Sector SalariesEngineers
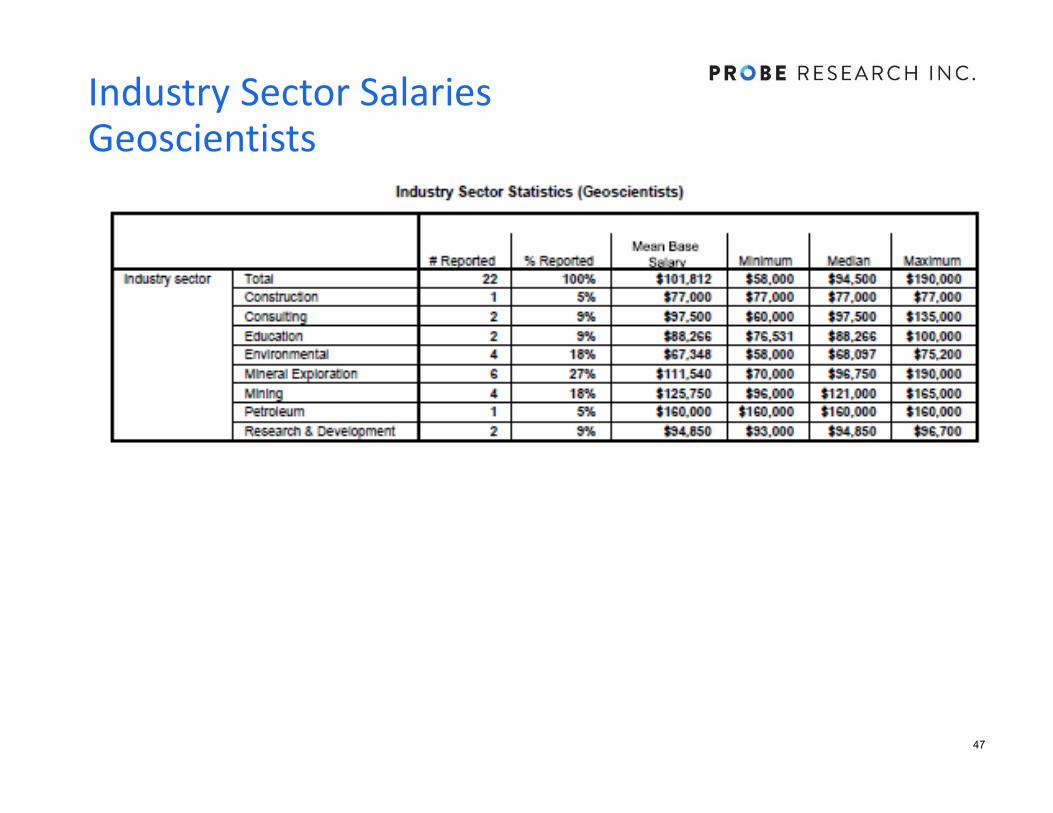
47
Industry Sector SalariesGeoscientists
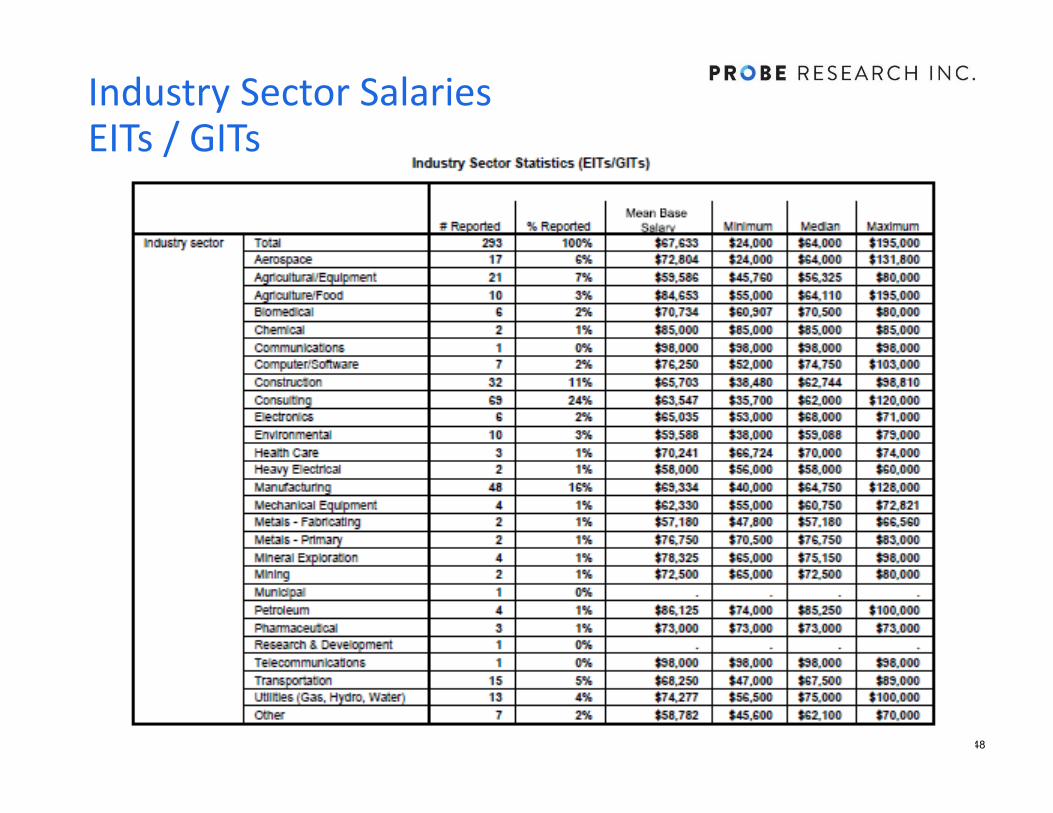
48
Industry Sector SalariesEITs / GITs
49
Job Function SalariesTotal