


Bahasa
Halaman
Hukum

1
Title Slide.
2
Road Map
3
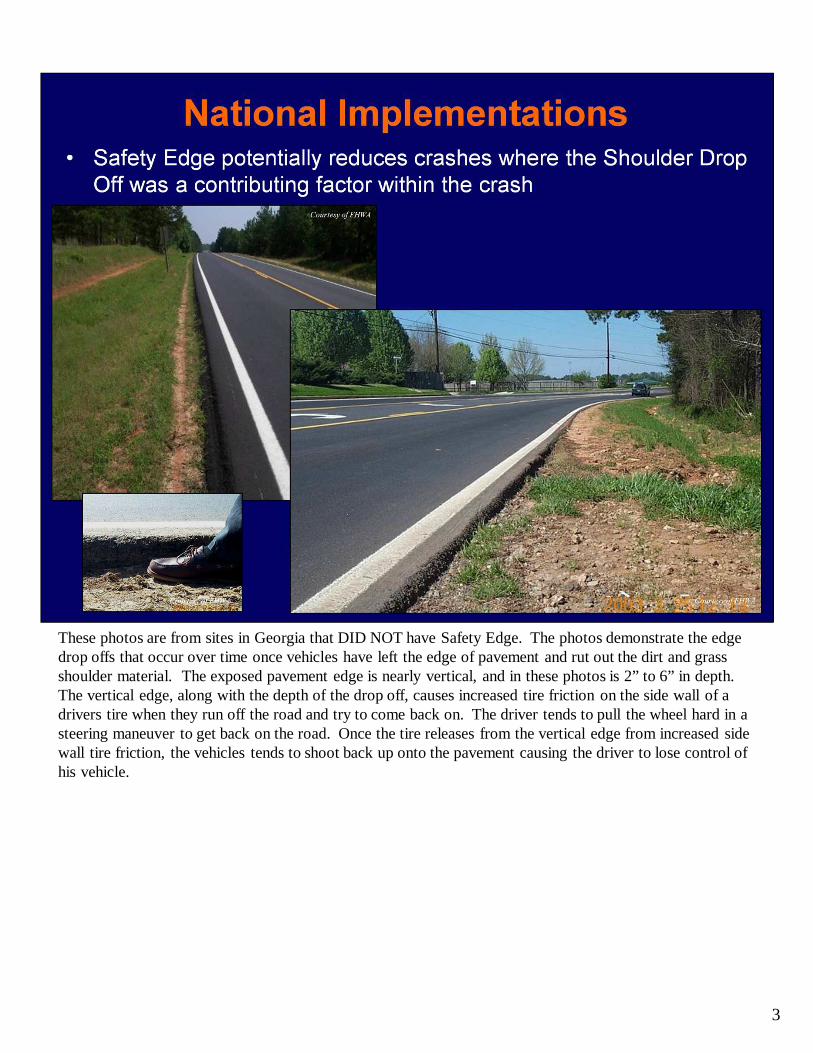
These photos are from sites in Georgia that DID NOT have Safety Edge. The photos demonstrate the edge drop offs that occur over time once vehicles have left the edge of pavement and rut out the dirt and grass shoulder material. The exposed pavement edge is nearly vertical, and in these photos is 2” to 6” in depth. The vertical edge, along with the depth of the drop off, causes increased tire friction on the side wall of a drivers tire when they run off the road and try to come back on. The driver tends to pull the wheel hard in a steering maneuver to get back on the road. Once the tire releases from the vertical edge from increased side wall tire friction, the vehicles tends to shoot back up onto the pavement causing the driver to lose control of his vehicle.
4
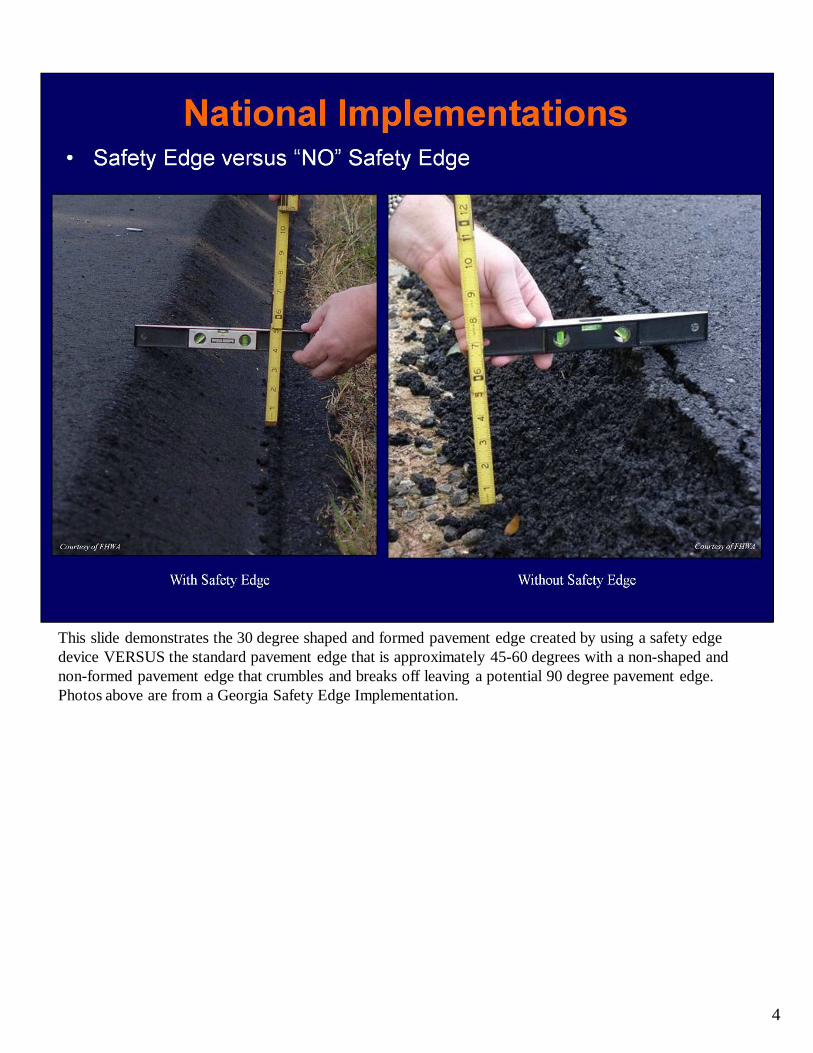
This slide demonstrates the 30 degree shaped and formed pavement edge created by using a safety edge device VERSUS the standard pavement edge that is approximately 45-60 degrees with a non-shaped and non-formed pavement edge that crumbles and breaks off leaving a potential 90 degree pavement edge. Photos above are from a Georgia Safety Edge Implementation.
5
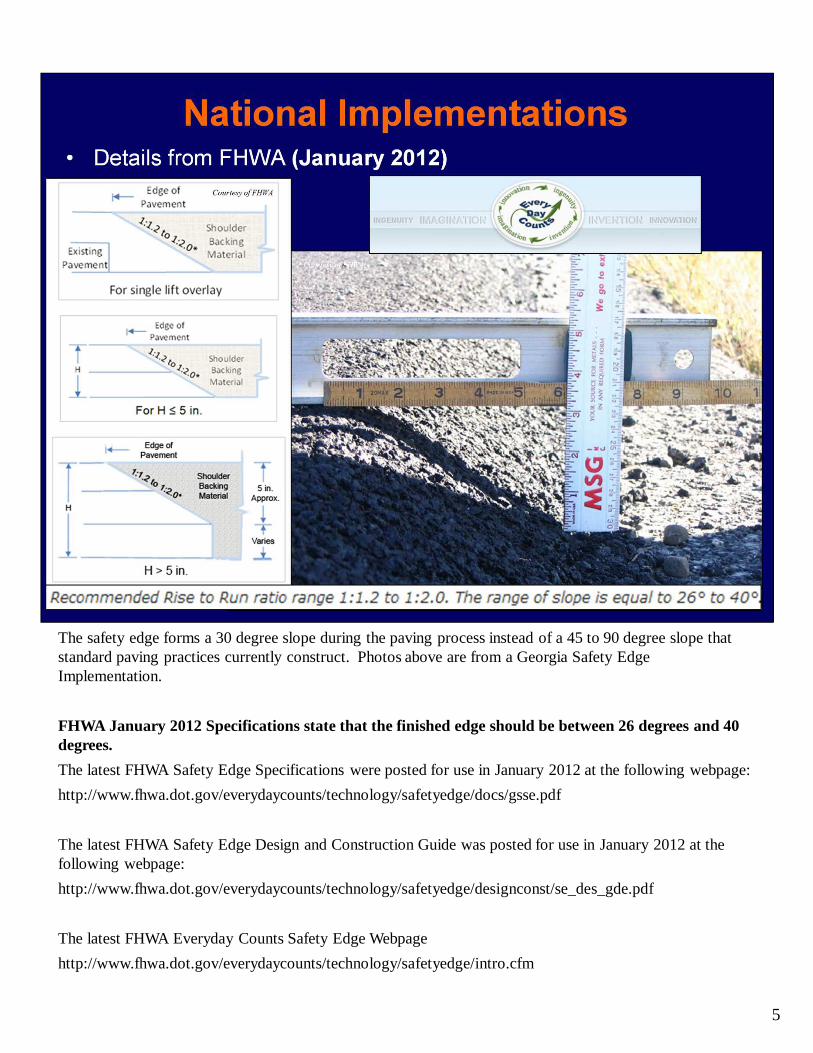
The safety edge forms a 30 degree slope during the paving process instead of a 45 to 90 degree slope that standard paving practices currently construct. Photos above are from a Georgia Safety Edge Implementation.
FHWA January 2012 Specifications state that the finished edge should be between 26 degrees and 40 degrees.
The latest FHWA Safety Edge Specifications were posted for use in January 2012 at the following webpage:
http://www.fhwa.dot.gov/everydaycounts/technology/safetyedge/docs/gsse.pdf
The latest FHWA Safety Edge Design and Construction Guide was posted for use in January 2012 at the following webpage:
http://www.fhwa.dot.gov/everydaycounts/technology/safetyedge/designconst/se_des_gde.pdf
The latest FHWA Everyday Counts Safety Edge Webpage
http://www.fhwa.dot.gov/everydaycounts/technology/safetyedge/intro.cfm
6
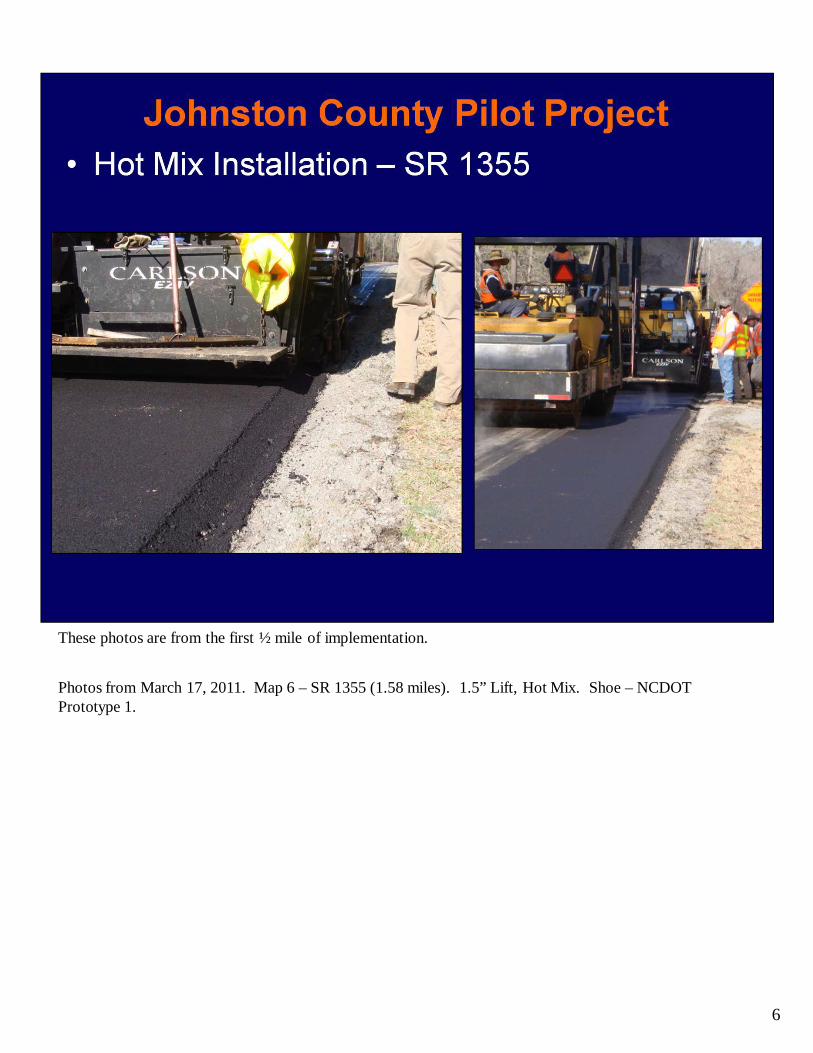
These photos are from the first ½ mile of implementation.
Photos from March 17, 2011. Map 6 – SR 1355 (1.58 miles). 1.5” Lift, Hot Mix. Shoe – NCDOT Prototype 1.
7
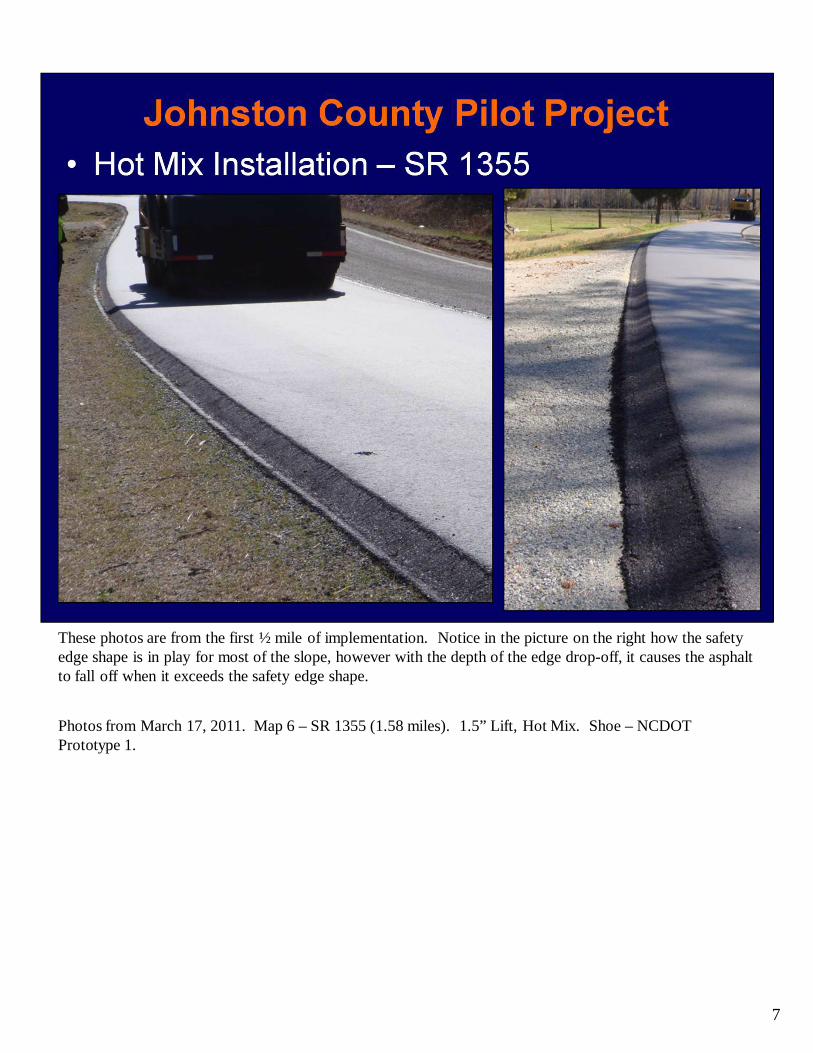
These photos are from the first ½ mile of implementation. Notice in the picture on the right how the safety edge shape is in play for most of the slope, however with the depth of the edge drop-off, it causes the asphalt to fall off when it exceeds the safety edge shape.
Photos from March 17, 2011. Map 6 – SR 1355 (1.58 miles). 1.5” Lift, Hot Mix. Shoe – NCDOT Prototype 1.
8
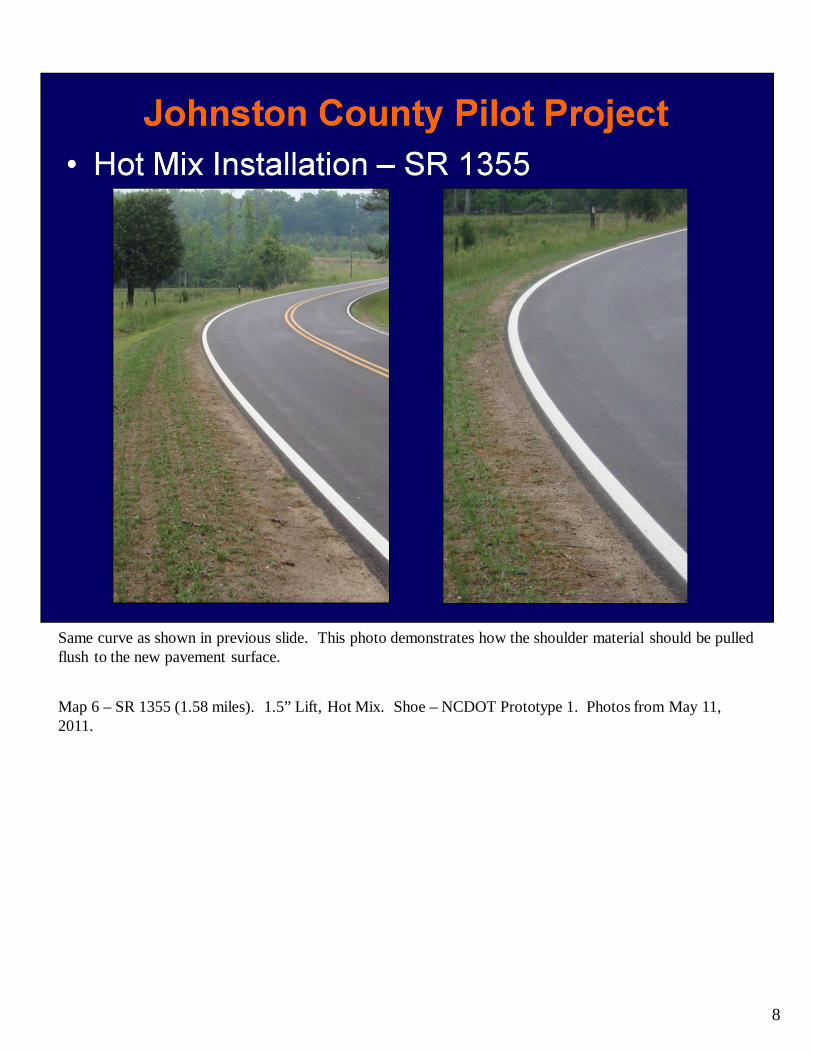
Same curve as shown in previous slide. This photo demonstrates how the shoulder material should be pulled flush to the new pavement surface.
Map 6 – SR 1355 (1.58 miles). 1.5” Lift, Hot Mix. Shoe – NCDOT Prototype 1. Photos from May 11, 2011.
9
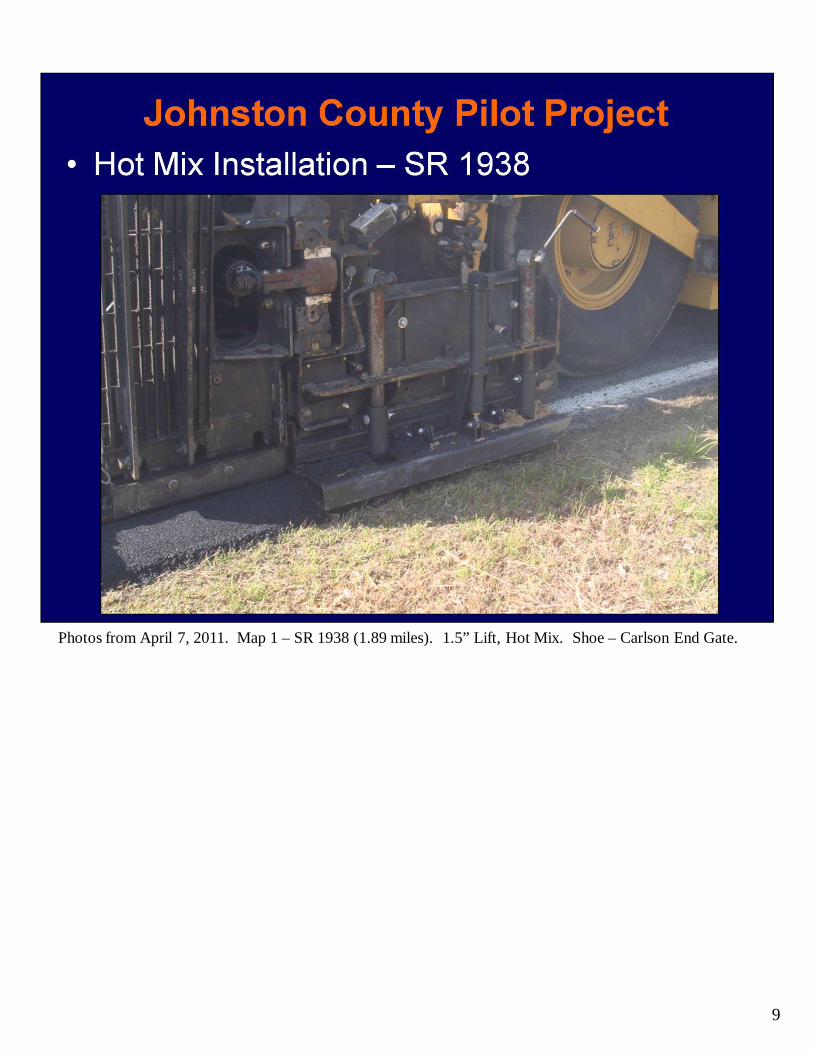
Photos from April 7, 2011. Map 1 – SR 1938 (1.89 miles). 1.5” Lift, Hot Mix. Shoe – Carlson End Gate.
10
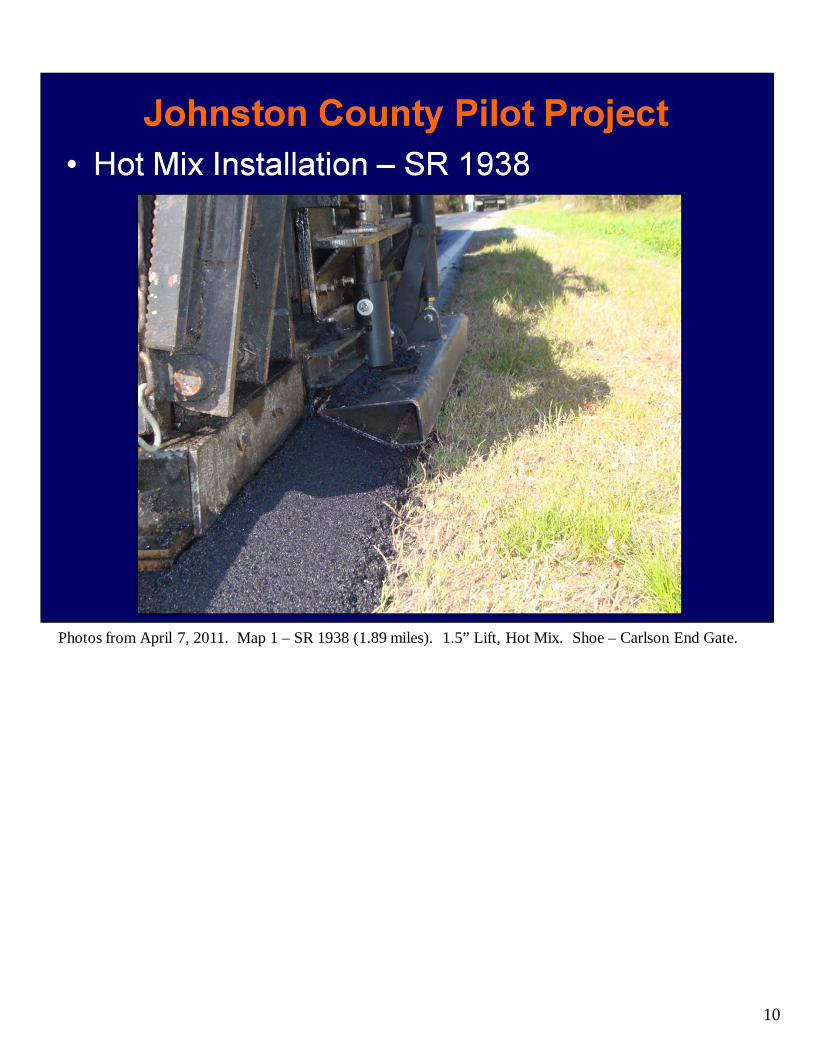
Photos from April 7, 2011. Map 1 – SR 1938 (1.89 miles). 1.5” Lift, Hot Mix. Shoe – Carlson End Gate.
11
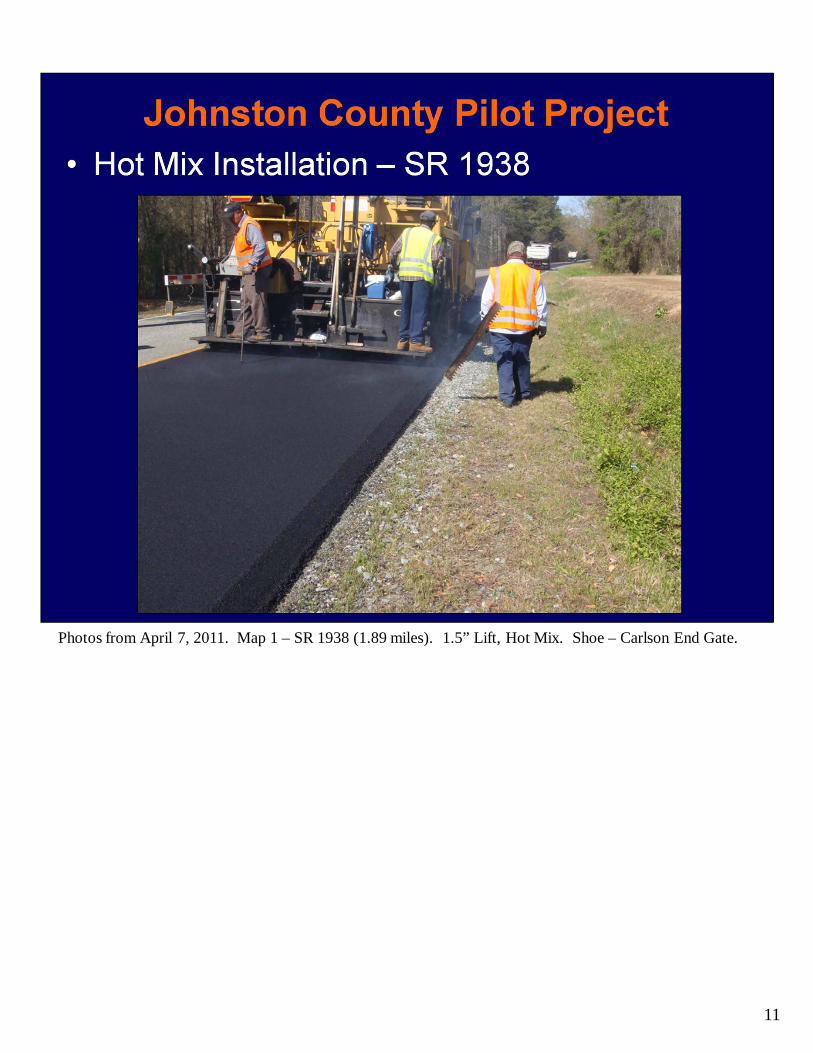
Photos from April 7, 2011. Map 1 – SR 1938 (1.89 miles). 1.5” Lift, Hot Mix. Shoe – Carlson End Gate.
12
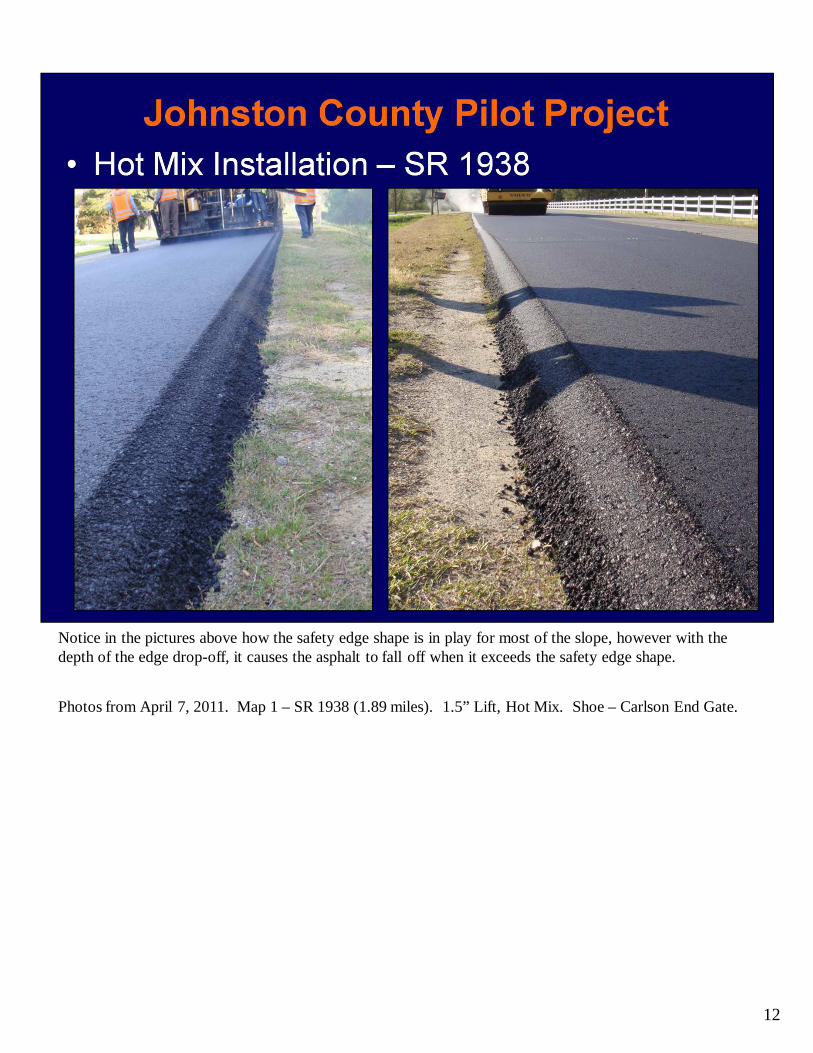
Notice in the pictures above how the safety edge shape is in play for most of the slope, however with the depth of the edge drop-off, it causes the asphalt to fall off when it exceeds the safety edge shape.
Photos from April 7, 2011. Map 1 – SR 1938 (1.89 miles). 1.5” Lift, Hot Mix. Shoe – Carlson End Gate.
13
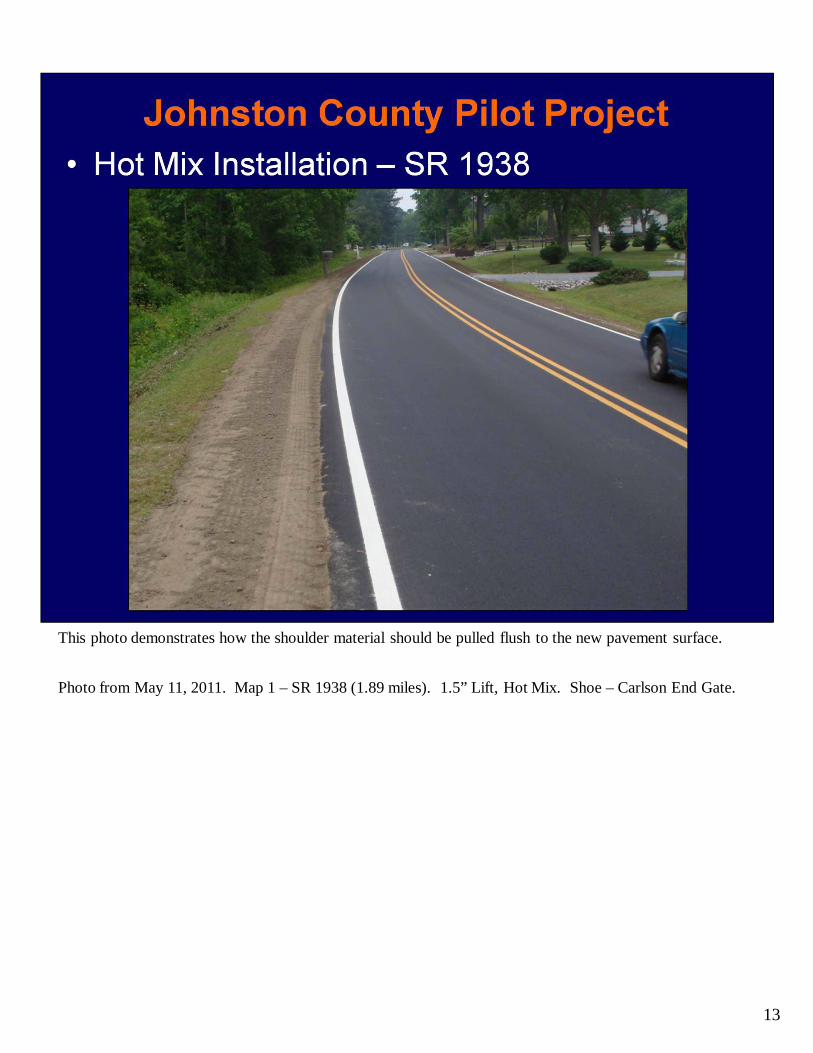
This photo demonstrates how the shoulder material should be pulled flush to the new pavement surface.
Photo from May 11, 2011. Map 1 – SR 1938 (1.89 miles). 1.5” Lift, Hot Mix. Shoe – Carlson End Gate.
14
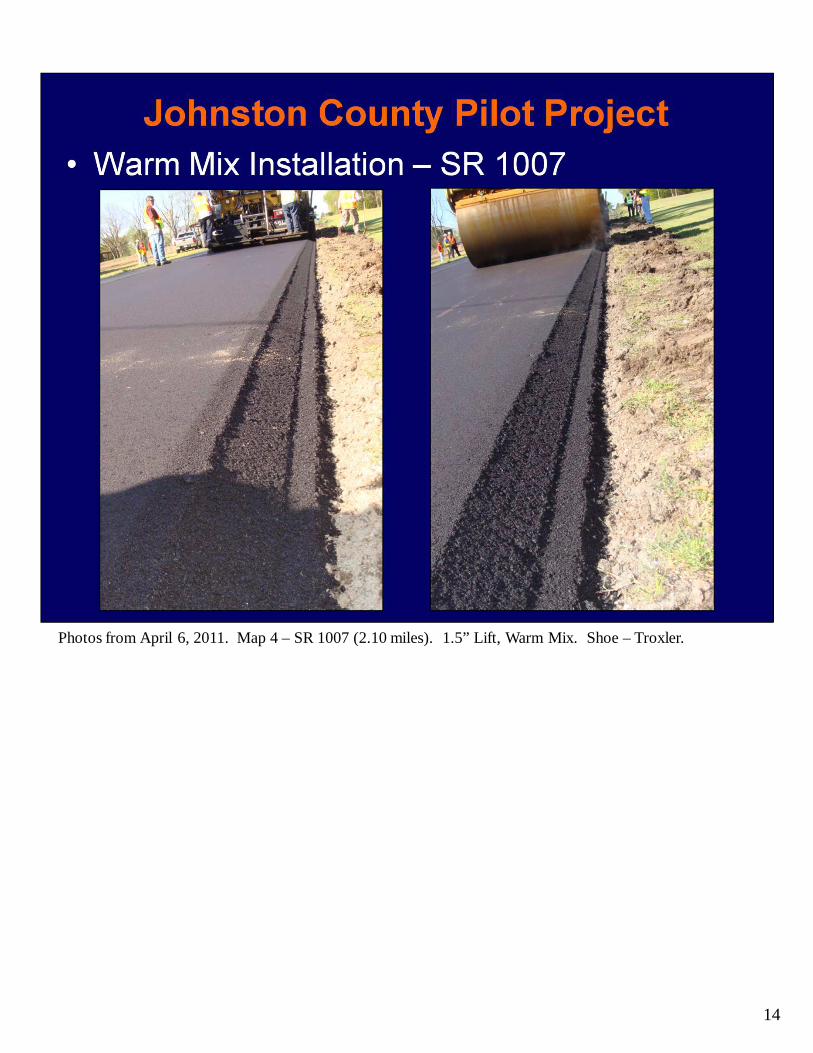
Photos from April 6, 2011. Map 4 – SR 1007 (2.10 miles). 1.5” Lift, Warm Mix. Shoe – Troxler.
15
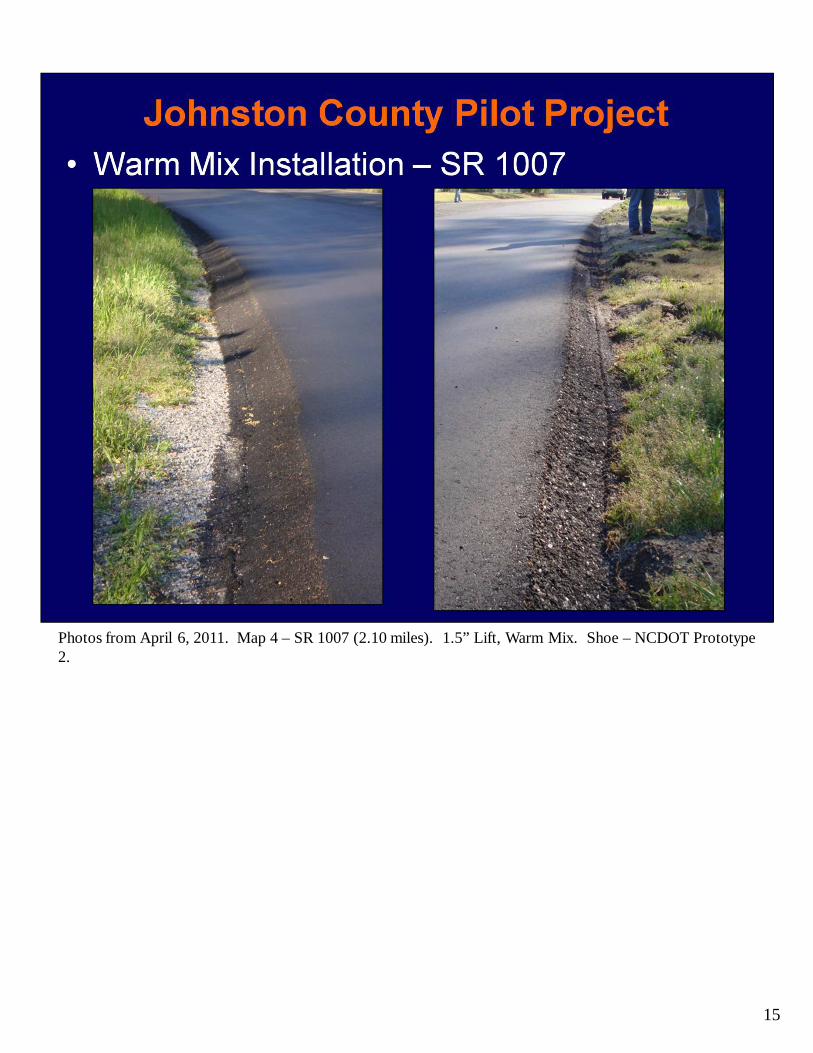
Photos from April 6, 2011. Map 4 – SR 1007 (2.10 miles). 1.5” Lift, Warm Mix. Shoe – NCDOT Prototype 2.
16
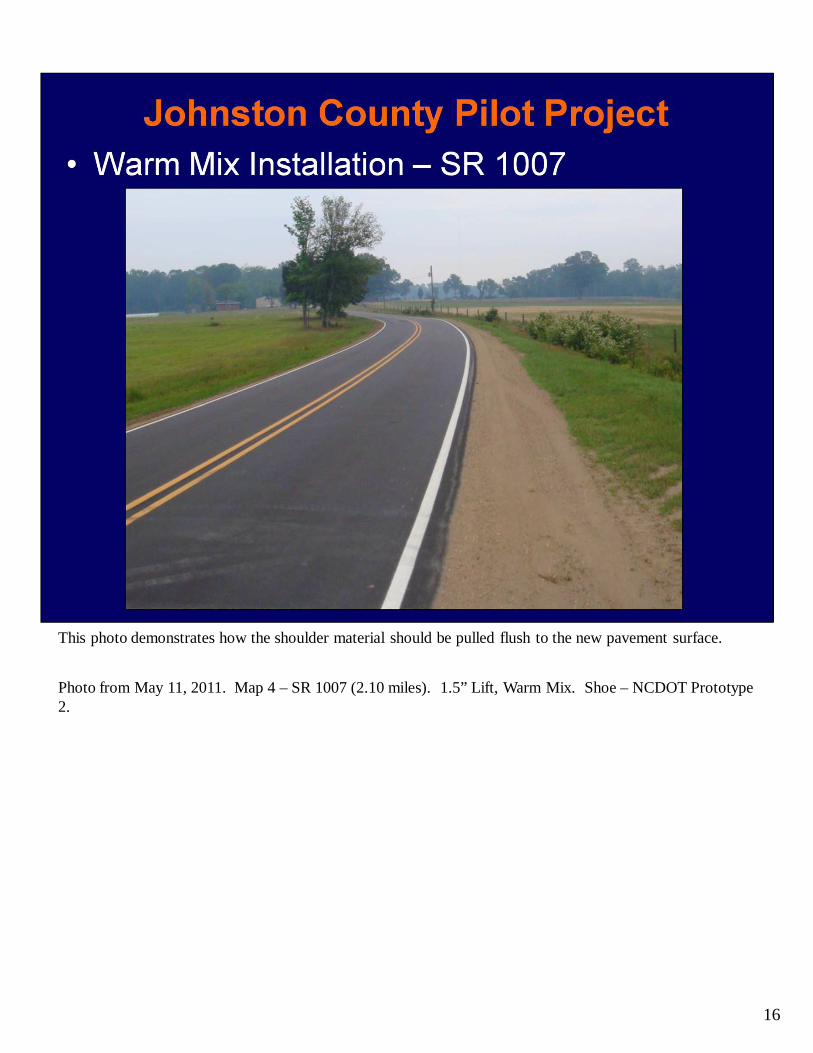
This photo demonstrates how the shoulder material should be pulled flush to the new pavement surface.
Photo from May 11, 2011. Map 4 – SR 1007 (2.10 miles). 1.5” Lift, Warm Mix. Shoe – NCDOT Prototype 2.
17
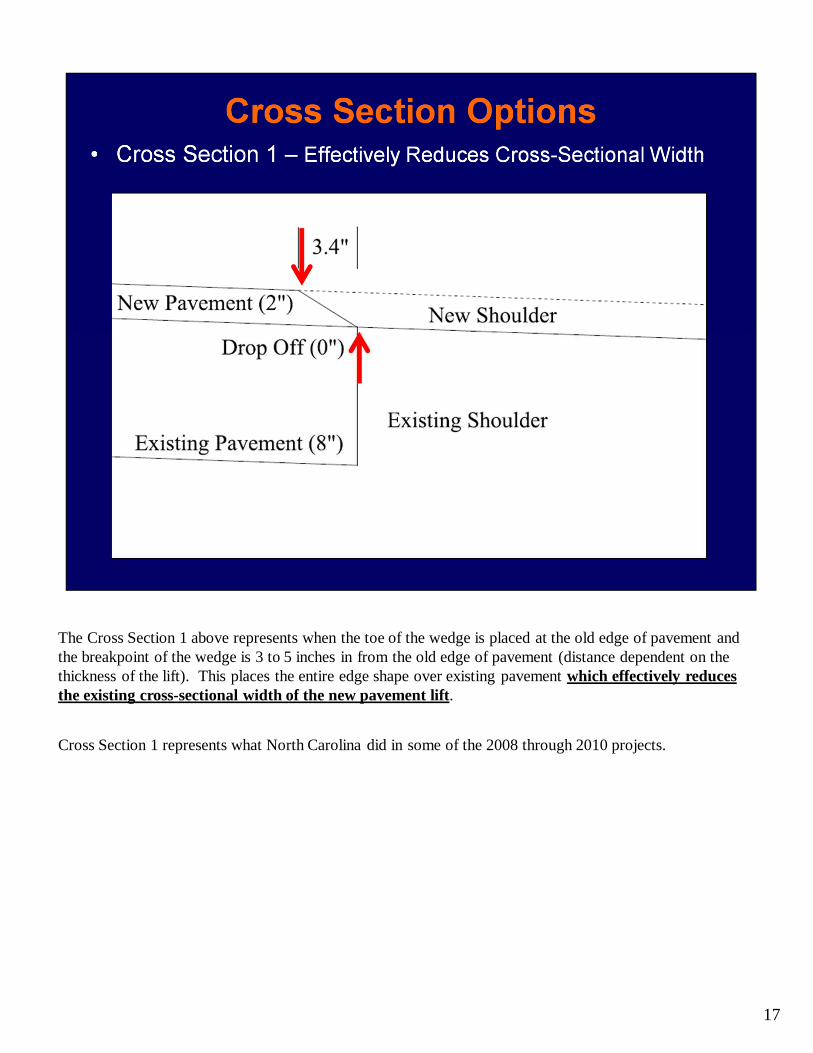
The Cross Section 1 above represents when the toe of the wedge is placed at the old edge of pavement and the breakpoint of the wedge is 3 to 5 inches in from the old edge of pavement (distance dependent on the thickness of the lift). This places the entire edge shape over existing pavement which effectively reduces the existing cross-sectional width of the new pavement lift.
Cross Section 1 represents what North Carolina did in some of the 2008 through 2010 projects.

18
The Cross Section 2 above represents when the breakpoint of the wedge is placed at the old edge of pavement and the toe of the wedge is 3 to 5 inches out from the old edge of pavement (distance dependent on the thickness of the lift). This places the entire edge shape over soil which effectively keeps the existing cross-sectional width the same on the new pavement lift as the old pavement lift.
Cross Section 2 represents 90 percent of what North Carolina did in the 2011 Projects.

19
The Cross Section 2 above represents when the breakpoint of the wedge is placed at the old edge of pavement and the toe of the wedge is 3 to 5 inches out from the old edge of pavement (distance dependent on the thickness of the lift). This places the entire edge shape over soil which effectively keeps the existing cross-sectional width the same on the new pavement lift as the old pavement lift.
This slide represents what would occur if there was an existing 2 inch edge drop-off. The edge would extend out an additional 3.4 inches on a 2 inch lift (distance is increase from 3.4 inch increase when there is no edge drop off). Keep in mind that the edge devices make a safety edge shape that is 6 to 9 inches wide (dependent on device). For this example of a 6.8 inch safety edge shape (from a 2 inch edge drop-off), the 6 inch safety edge device would only make the shape for the first 6 inches after the edge breakpoint, then the asphalt would fall off as usual. This will be demonstrated in multiple photos throughout this section.
20
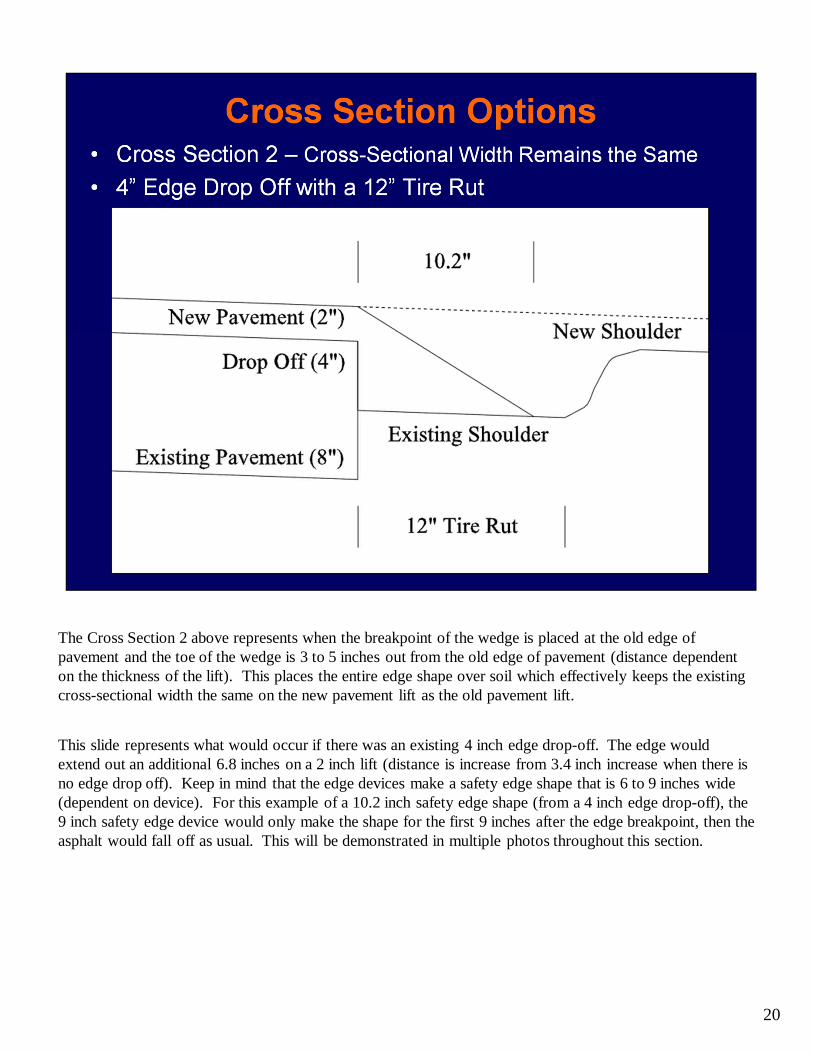
The Cross Section 2 above represents when the breakpoint of the wedge is placed at the old edge of pavement and the toe of the wedge is 3 to 5 inches out from the old edge of pavement (distance dependent on the thickness of the lift). This places the entire edge shape over soil which effectively keeps the existing cross-sectional width the same on the new pavement lift as the old pavement lift.
This slide represents what would occur if there was an existing 4 inch edge drop-off. The edge would extend out an additional 6.8 inches on a 2 inch lift (distance is increase from 3.4 inch increase when there is no edge drop off). Keep in mind that the edge devices make a safety edge shape that is 6 to 9 inches wide (dependent on device). For this example of a 10.2 inch safety edge shape (from a 4 inch edge drop-off), the 9 inch safety edge device would only make the shape for the first 9 inches after the edge breakpoint, then the asphalt would fall off as usual. This will be demonstrated in multiple photos throughout this section.
21
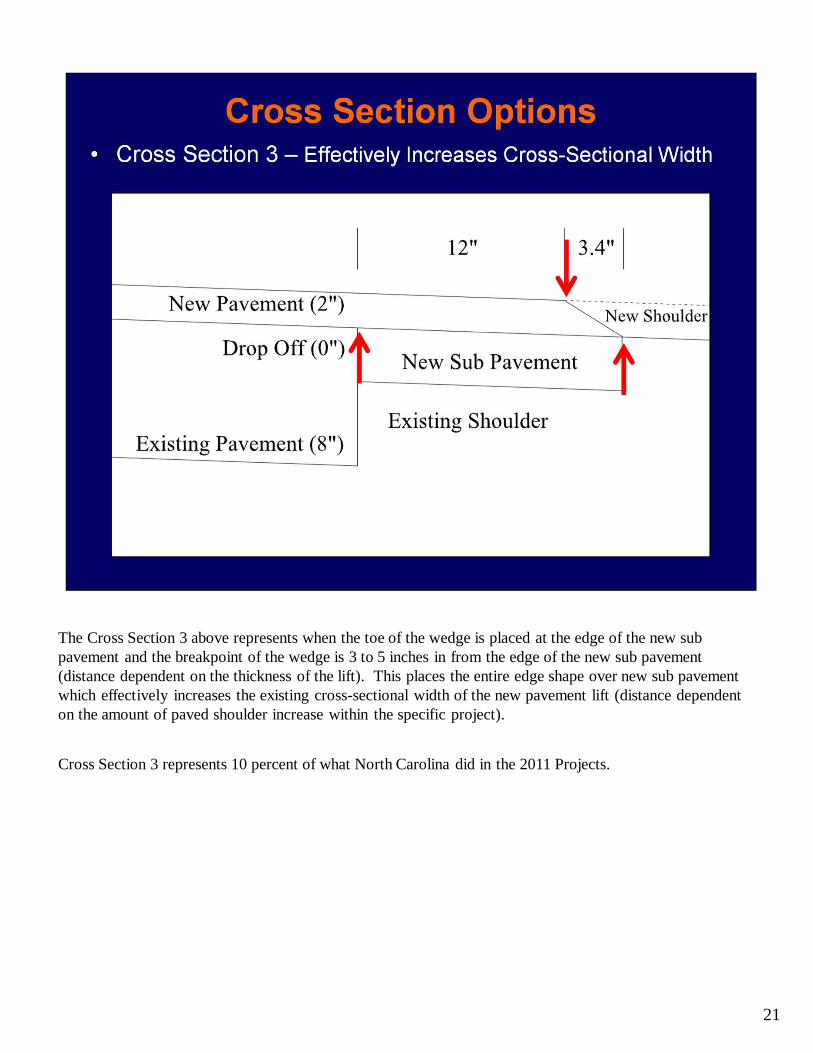
The Cross Section 3 above represents when the toe of the wedge is placed at the edge of the new sub pavement and the breakpoint of the wedge is 3 to 5 inches in from the edge of the new sub pavement (distance dependent on the thickness of the lift). This places the entire edge shape over new sub pavement which effectively increases the existing cross-sectional width of the new pavement lift (distance dependent on the amount of paved shoulder increase within the specific project).
Cross Section 3 represents 10 percent of what North Carolina did in the 2011 Projects.

22
23

24
Photos from March 24, 2011. Map 2 – SR 1921 (0.64 miles). 1.5” Lift, Warm Mix. Shoe – NCDOT Prototype 1.
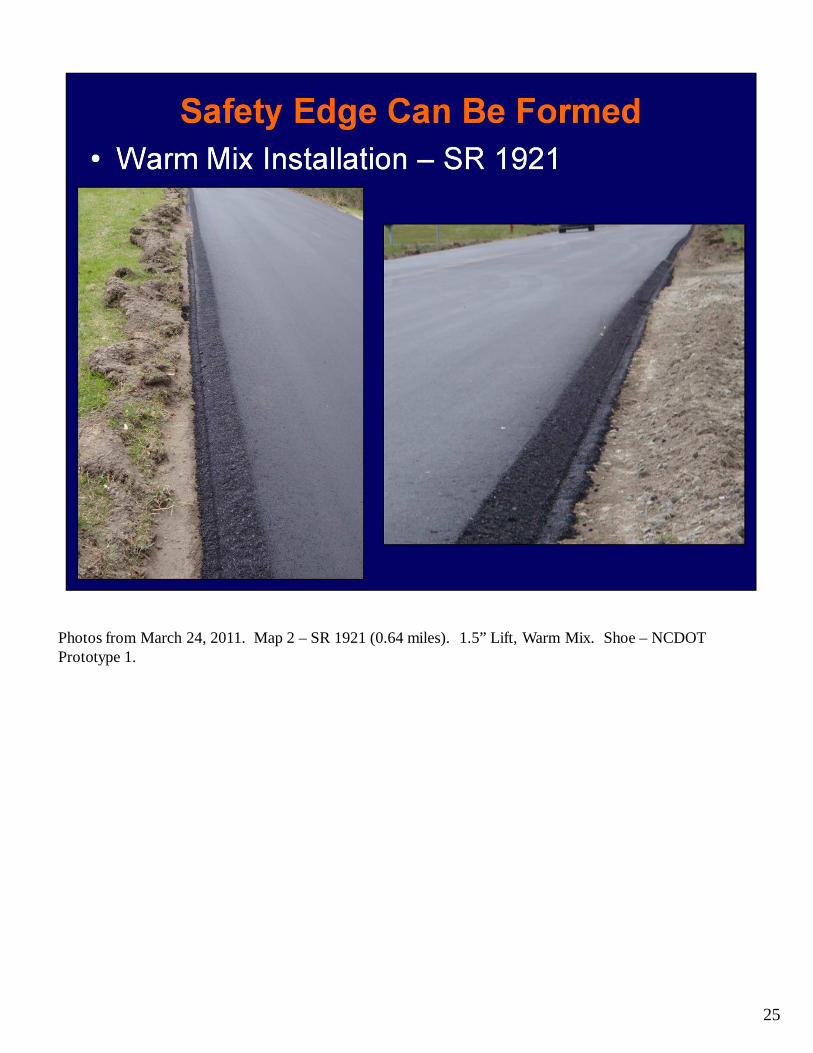
25
Photos from March 24, 2011. Map 2 – SR 1921 (0.64 miles). 1.5” Lift, Warm Mix. Shoe – NCDOT Prototype 1.
26
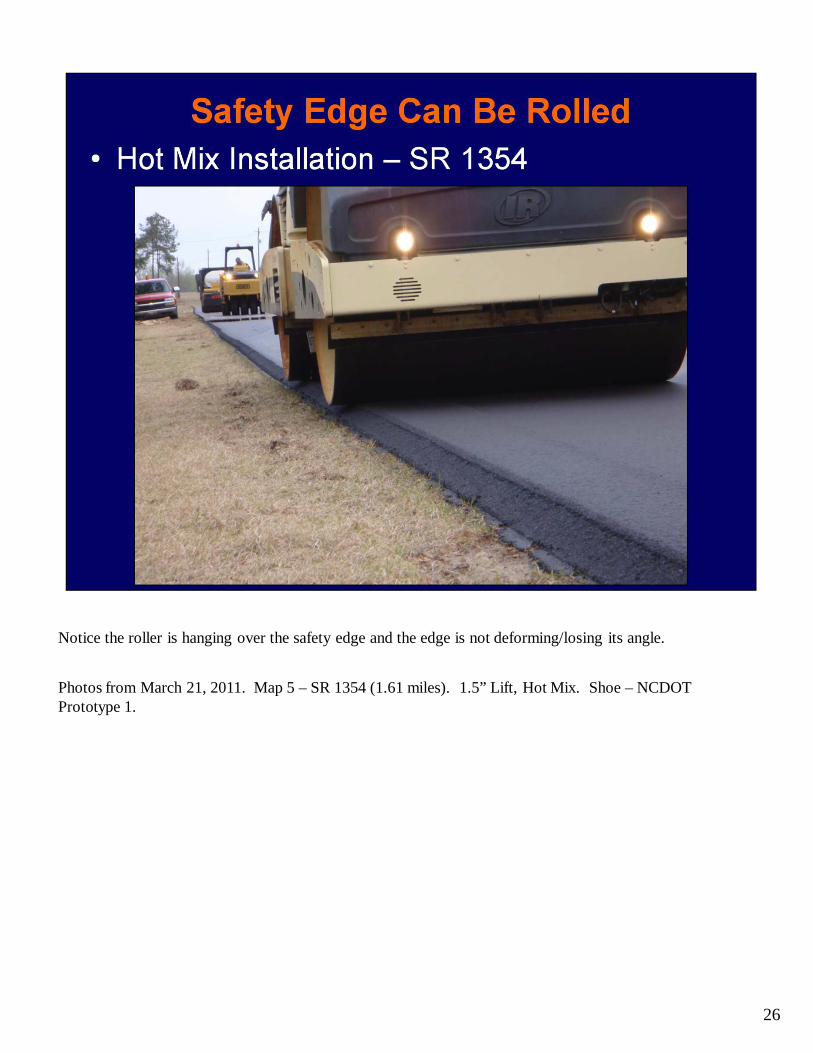
Notice the roller is hanging over the safety edge and the edge is not deforming/losing its angle.
Photos from March 21, 2011. Map 5 – SR 1354 (1.61 miles). 1.5” Lift, Hot Mix. Shoe – NCDOT Prototype 1.
27
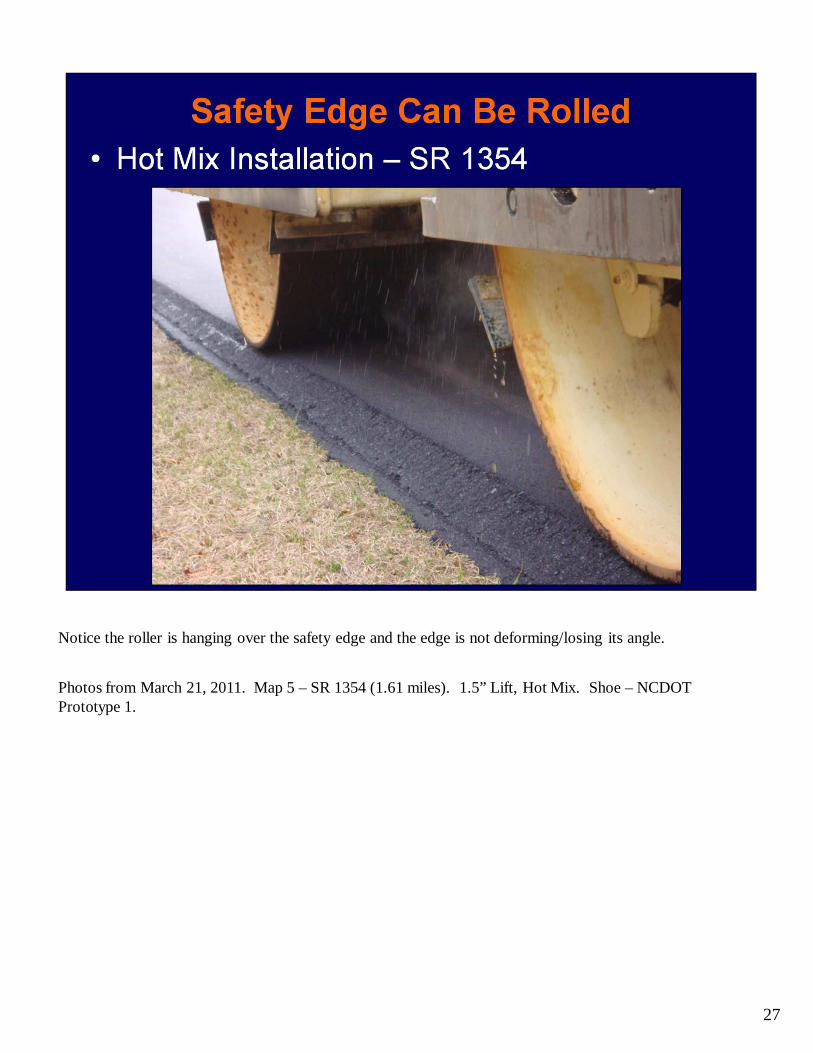
Notice the roller is hanging over the safety edge and the edge is not deforming/losing its angle.
Photos from March 21, 2011. Map 5 – SR 1354 (1.61 miles). 1.5” Lift, Hot Mix. Shoe – NCDOT Prototype 1.
28
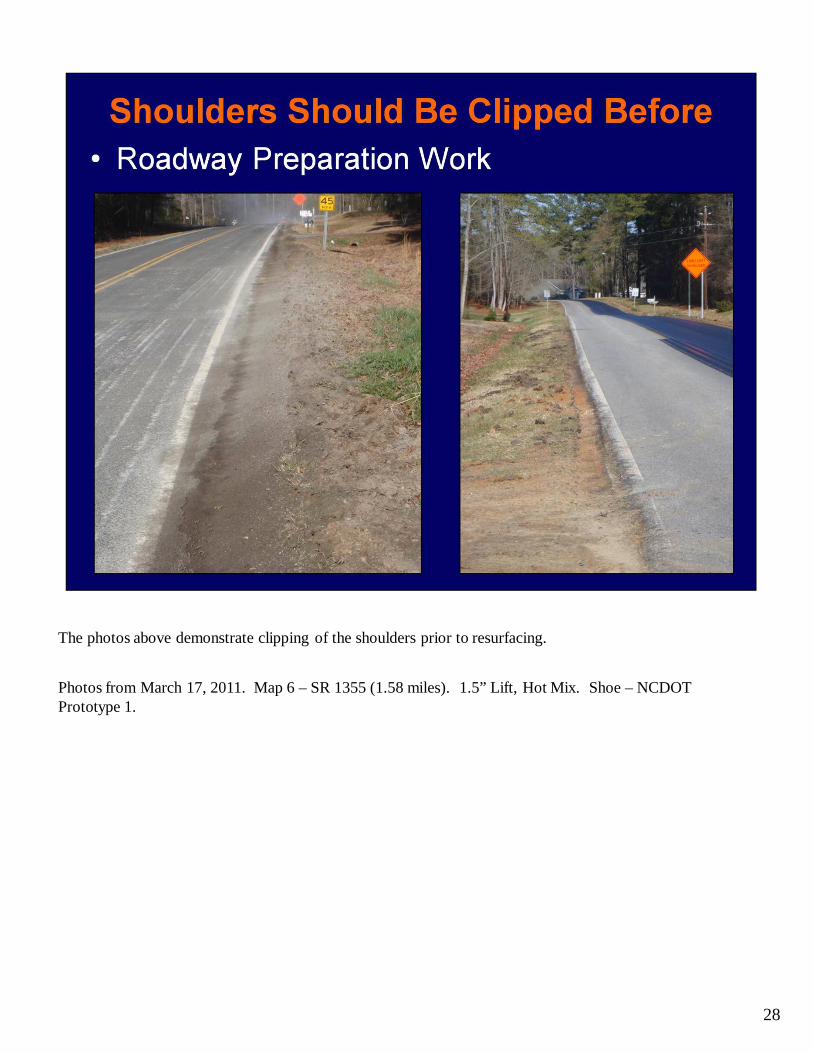
The photos above demonstrate clipping of the shoulders prior to resurfacing.
Photos from March 17, 2011. Map 6 – SR 1355 (1.58 miles). 1.5” Lift, Hot Mix. Shoe – NCDOT Prototype 1.
29
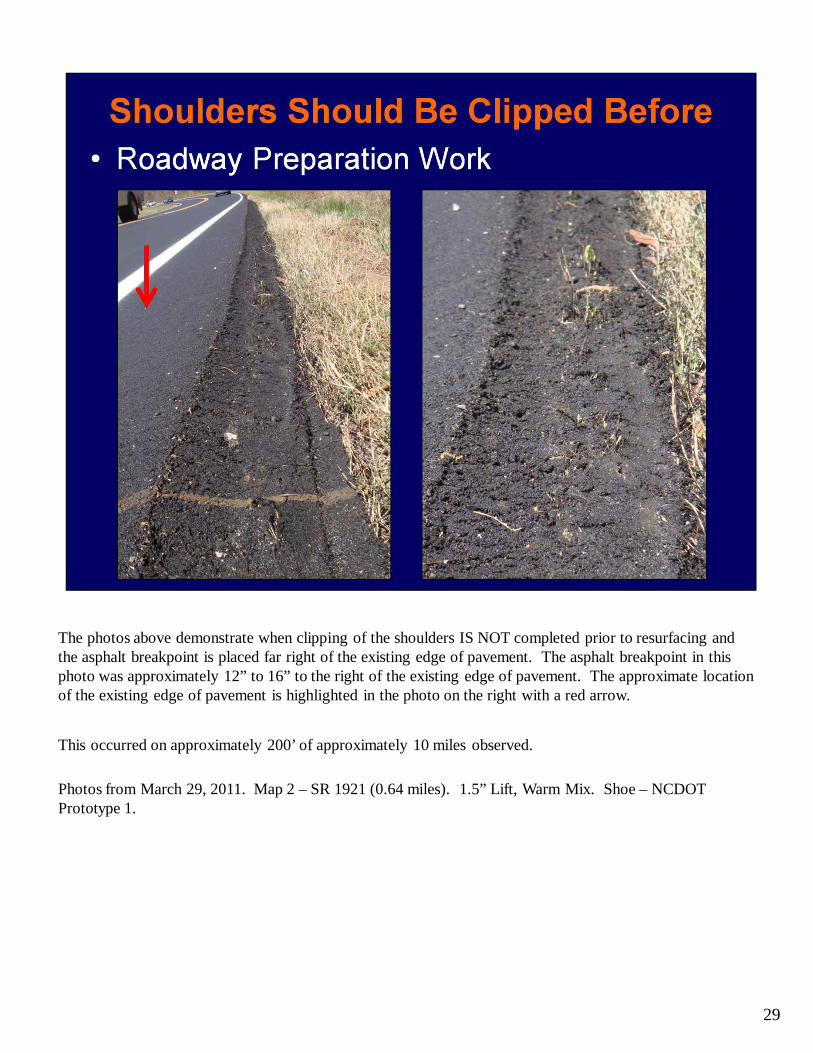
The photos above demonstrate when clipping of the shoulders IS NOT completed prior to resurfacing and the asphalt breakpoint is placed far right of the existing edge of pavement. The asphalt breakpoint in this photo was approximately 12” to 16” to the right of the existing edge of pavement. The approximate location of the existing edge of pavement is highlighted in the photo on the right with a red arrow.
This occurred on approximately 200’ of approximately 10 miles observed.
Photos from March 29, 2011. Map 2 – SR 1921 (0.64 miles). 1.5” Lift, Warm Mix. Shoe – NCDOT Prototype 1.
30
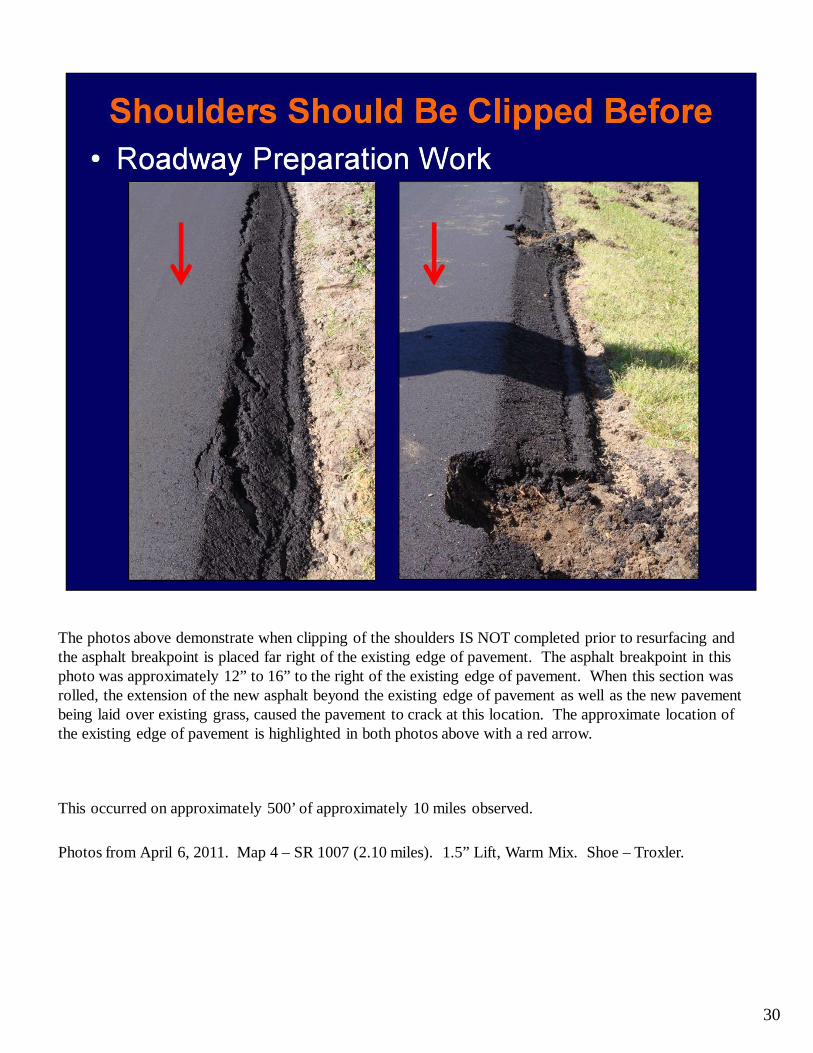
The photos above demonstrate when clipping of the shoulders IS NOT completed prior to resurfacing and the asphalt breakpoint is placed far right of the existing edge of pavement. The asphalt breakpoint in this photo was approximately 12” to 16” to the right of the existing edge of pavement. When this section was rolled, the extension of the new asphalt beyond the existing edge of pavement as well as the new pavement being laid over existing grass, caused the pavement to crack at this location. The approximate location of the existing edge of pavement is highlighted in both photos above with a red arrow.
This occurred on approximately 500’ of approximately 10 miles observed.
Photos from April 6, 2011. Map 4 – SR 1007 (2.10 miles). 1.5” Lift, Warm Mix. Shoe – Troxler.
31
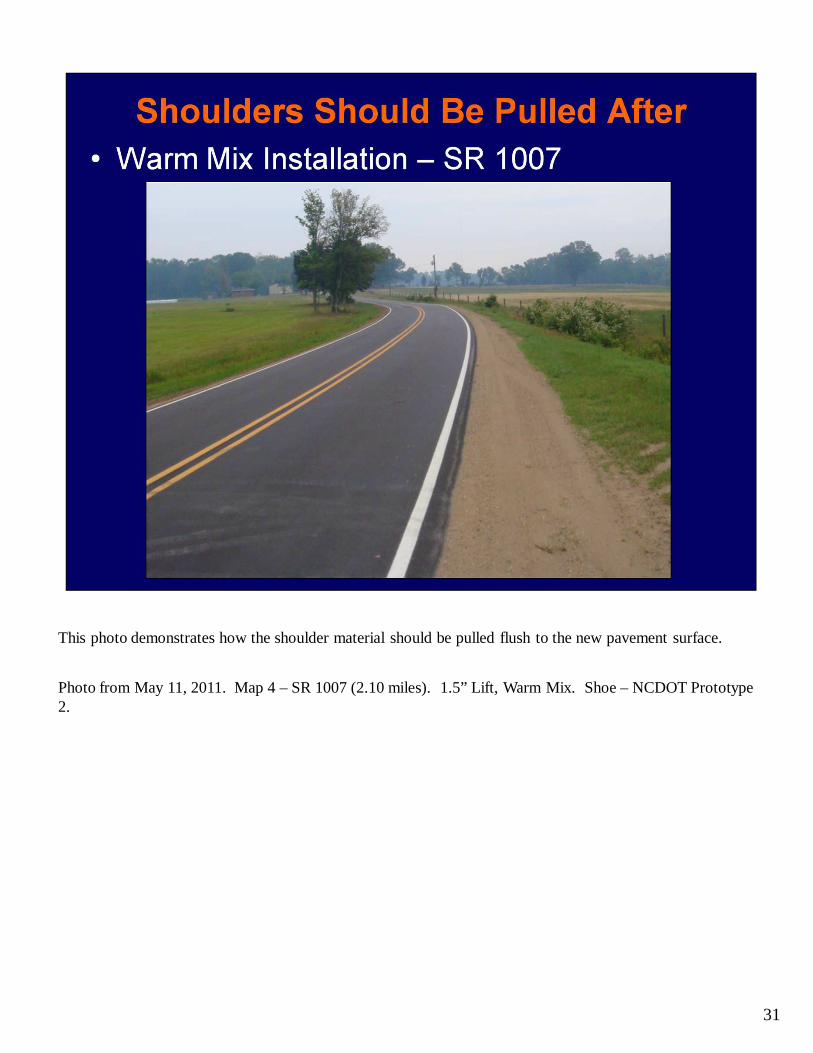
This photo demonstrates how the shoulder material should be pulled flush to the new pavement surface.
Photo from May 11, 2011. Map 4 – SR 1007 (2.10 miles). 1.5” Lift, Warm Mix. Shoe – NCDOT Prototype 2.
32
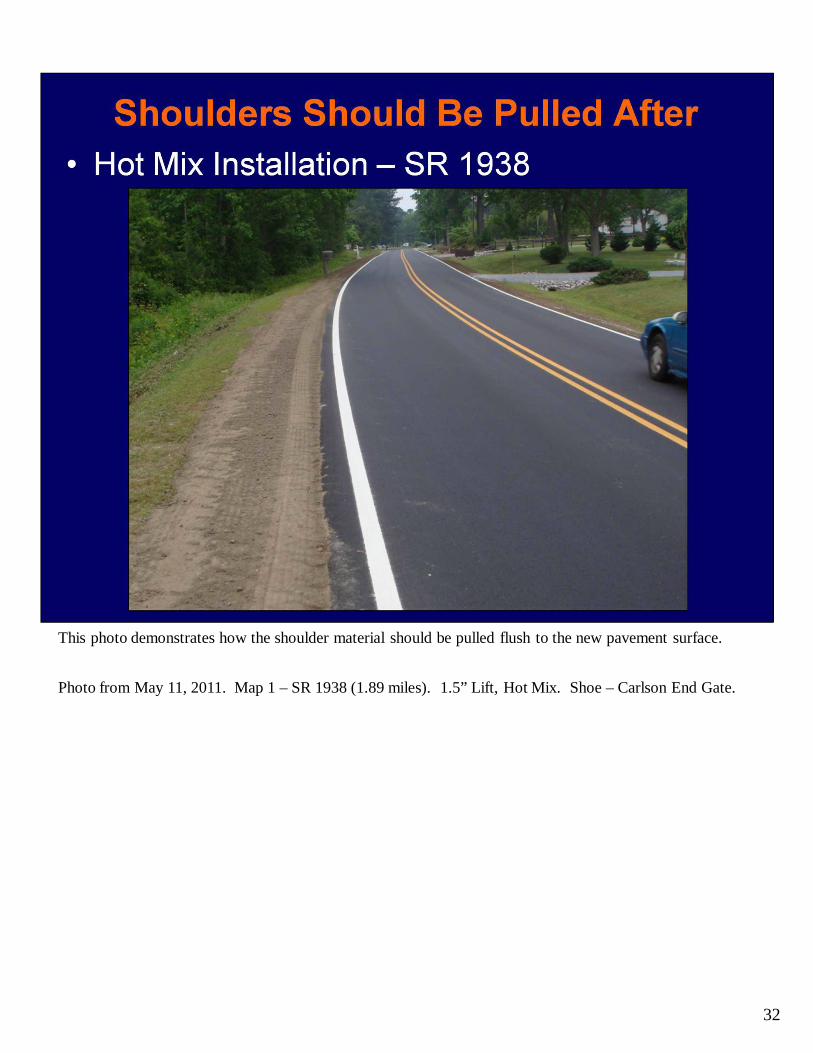
This photo demonstrates how the shoulder material should be pulled flush to the new pavement surface.
Photo from May 11, 2011. Map 1 – SR 1938 (1.89 miles). 1.5” Lift, Hot Mix. Shoe – Carlson End Gate.
33
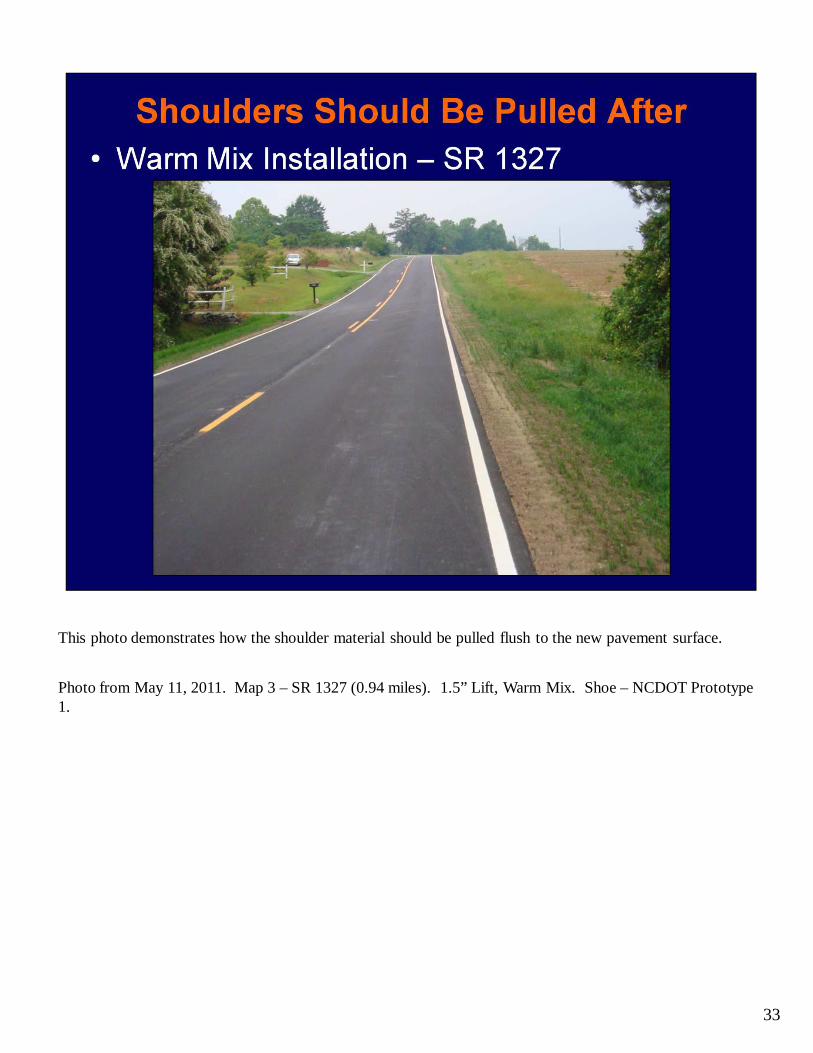
This photo demonstrates how the shoulder material should be pulled flush to the new pavement surface.
Photo from May 11, 2011. Map 3 – SR 1327 (0.94 miles). 1.5” Lift, Warm Mix. Shoe – NCDOT Prototype 1.
34
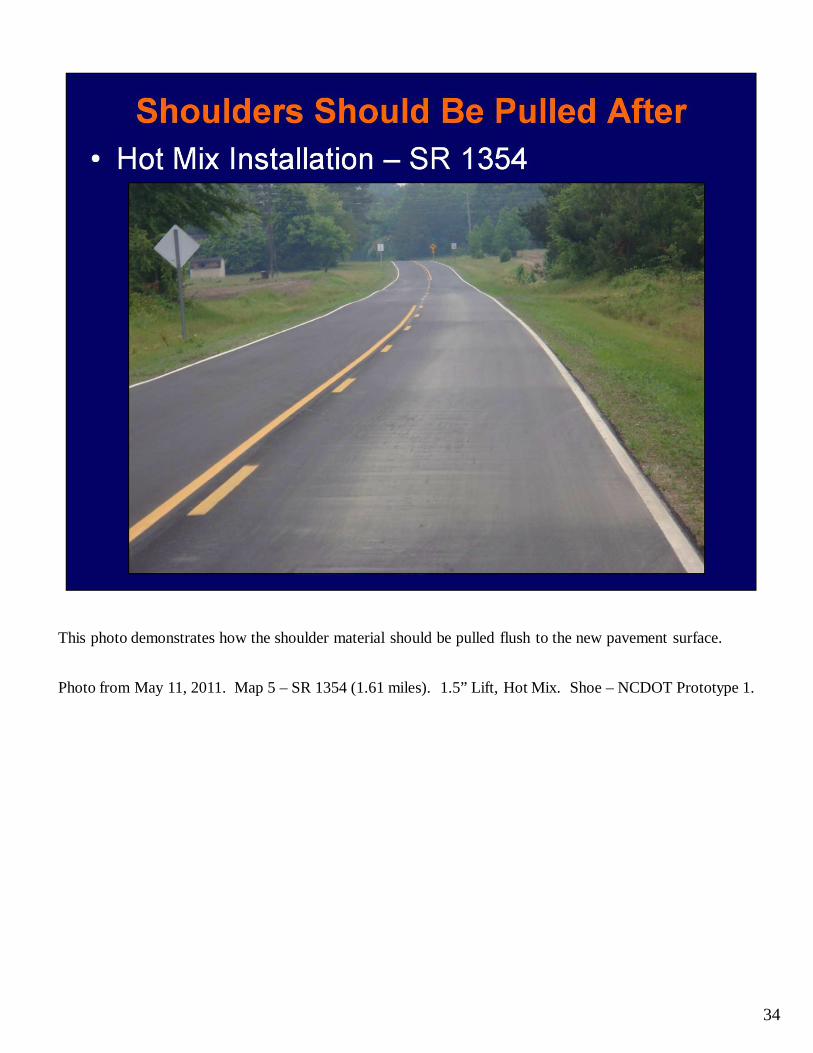
This photo demonstrates how the shoulder material should be pulled flush to the new pavement surface.
Photo from May 11, 2011. Map 5 – SR 1354 (1.61 miles). 1.5” Lift, Hot Mix. Shoe – NCDOT Prototype 1.
35
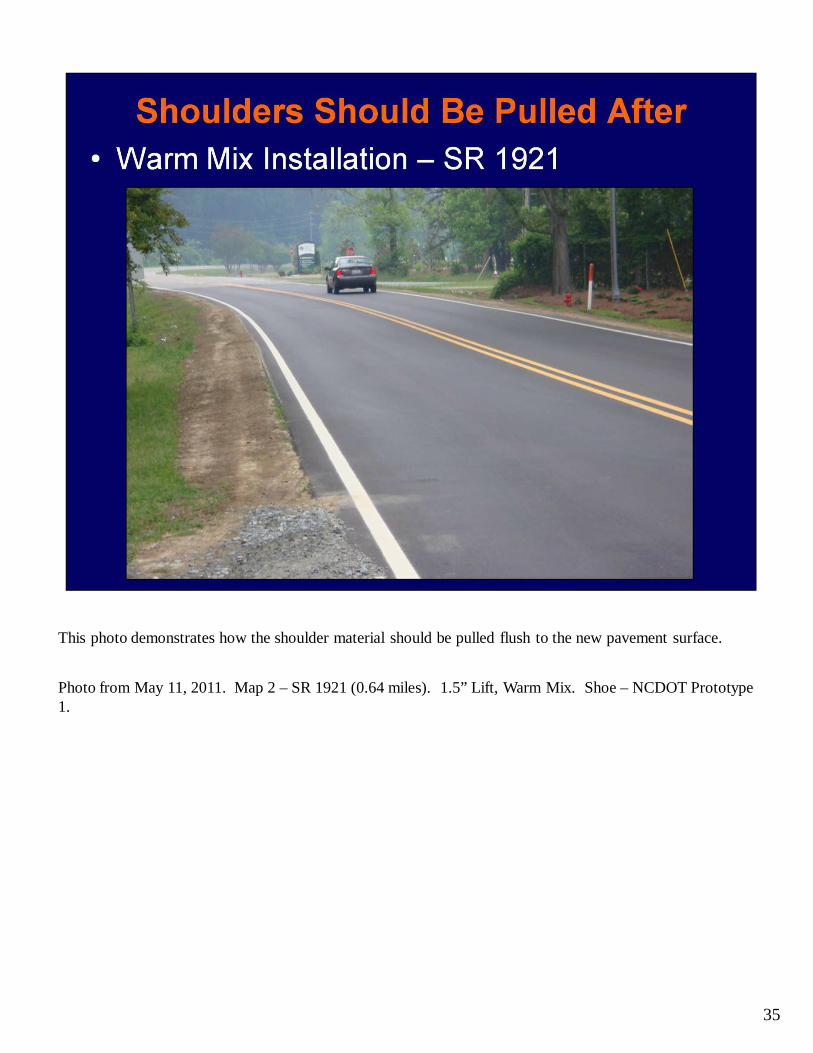
This photo demonstrates how the shoulder material should be pulled flush to the new pavement surface.
Photo from May 11, 2011. Map 2 – SR 1921 (0.64 miles). 1.5” Lift, Warm Mix. Shoe – NCDOT Prototype 1.
36
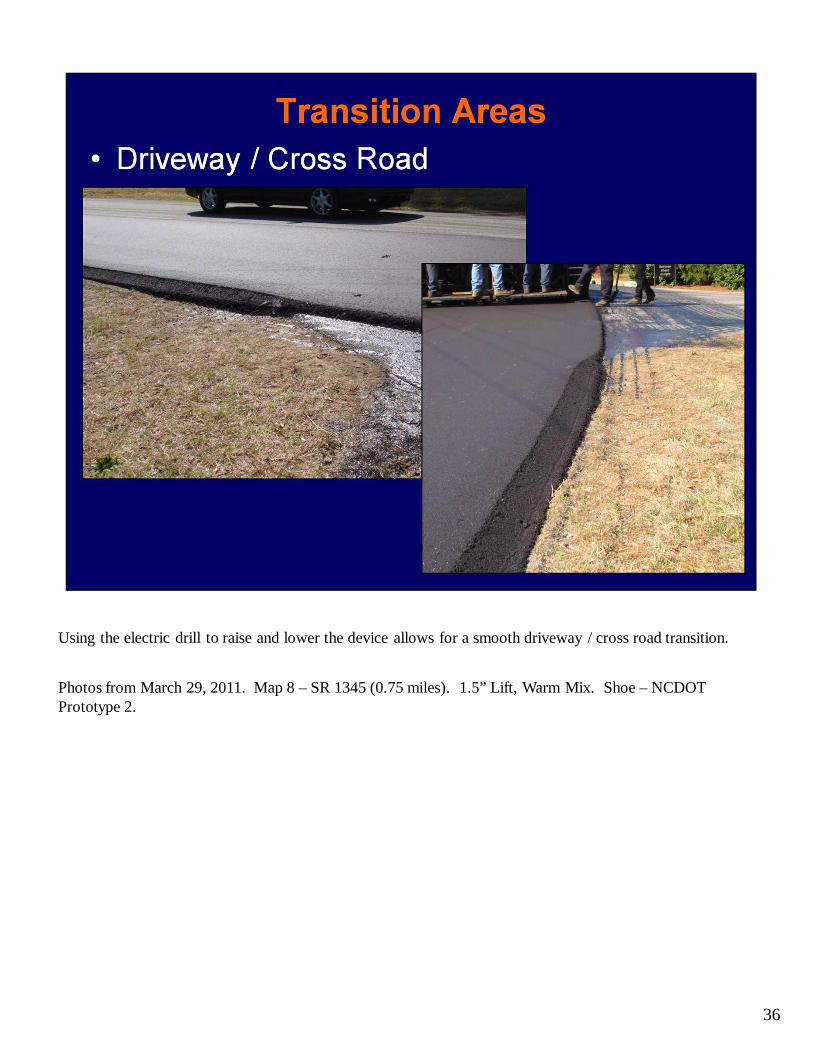
Using the electric drill to raise and lower the device allows for a smooth driveway / cross road transition.
Photos from March 29, 2011. Map 8 – SR 1345 (0.75 miles). 1.5” Lift, Warm Mix. Shoe – NCDOT Prototype 2.
37
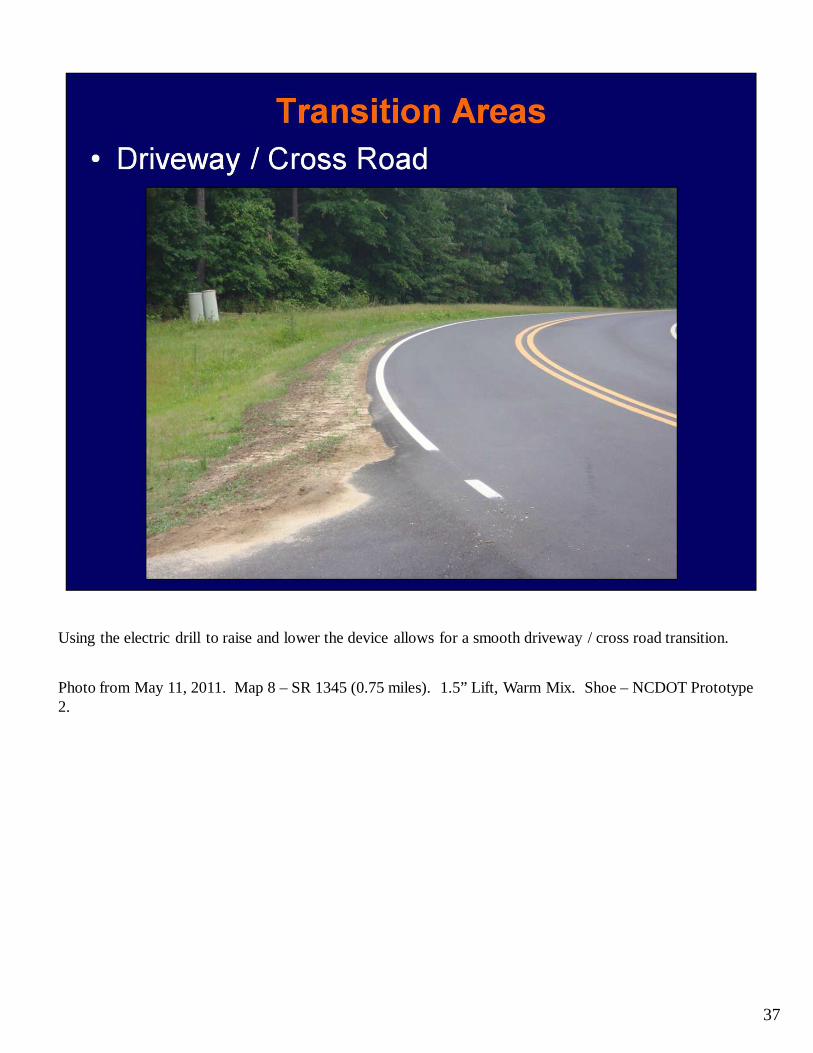
Using the electric drill to raise and lower the device allows for a smooth driveway / cross road transition.
Photo from May 11, 2011. Map 8 – SR 1345 (0.75 miles). 1.5” Lift, Warm Mix. Shoe – NCDOT Prototype 2.
38
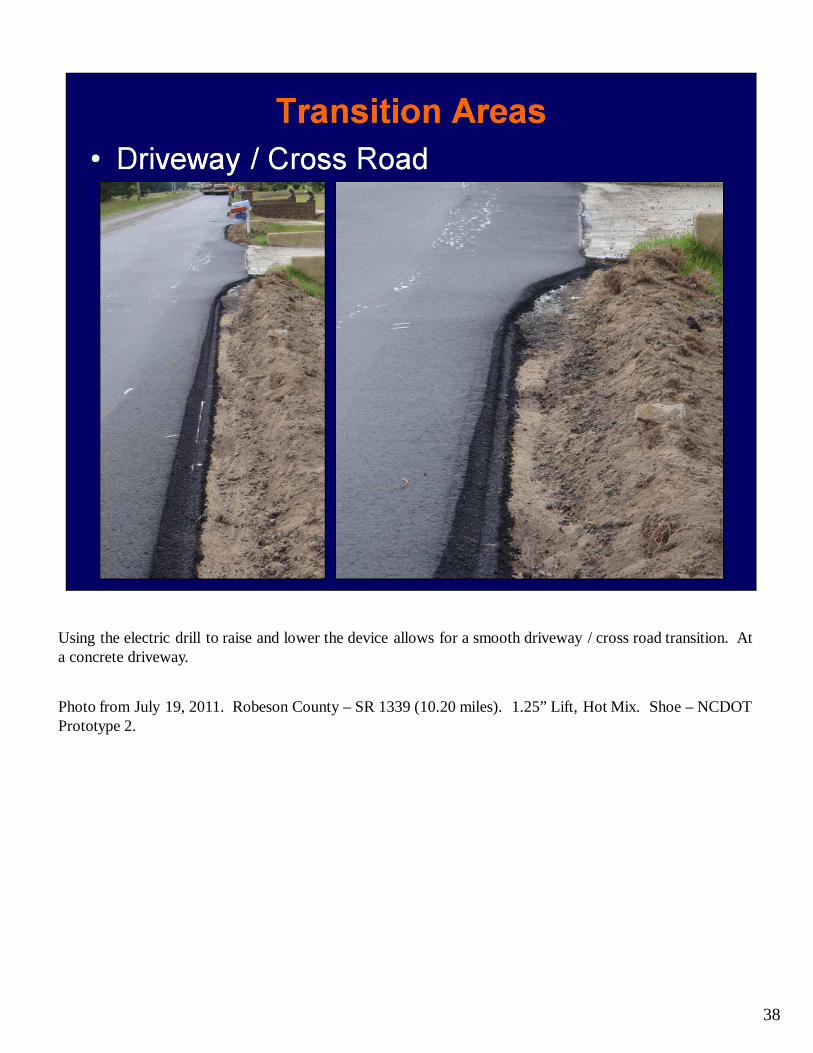
Using the electric drill to raise and lower the device allows for a smooth driveway / cross road transition. At a concrete driveway.
Photo from July 19, 2011. Robeson County – SR 1339 (10.20 miles). 1.25” Lift, Hot Mix. Shoe – NCDOT Prototype 2.
39
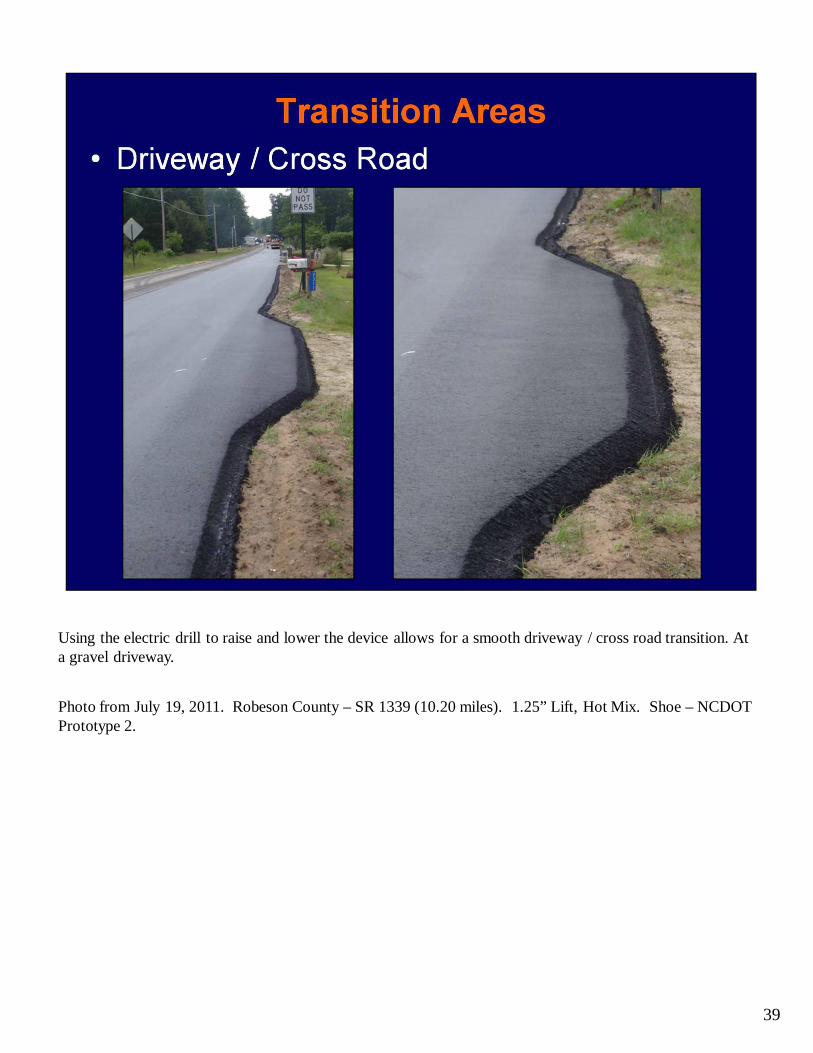
Using the electric drill to raise and lower the device allows for a smooth driveway / cross road transition. At a gravel driveway.
Photo from July 19, 2011. Robeson County – SR 1339 (10.20 miles). 1.25” Lift, Hot Mix. Shoe – NCDOT Prototype 2.

40
FHWA visited a few of the Pilot Project sites and needed to take sample densities with and without the safety edge device in play. The photos above demonstrate the edge of pavement with and without safety edge. The safety edge was raised for approximately 1000 feet for the density test sections. We have not yet received the results of this testing. The next two slides represent the same.
Photos from April 6, 2011. Map 4 – SR 1007 (2.10 miles). 1.5” Lift, Warm Mix. Shoe – NCDOT Prototype 2.
41
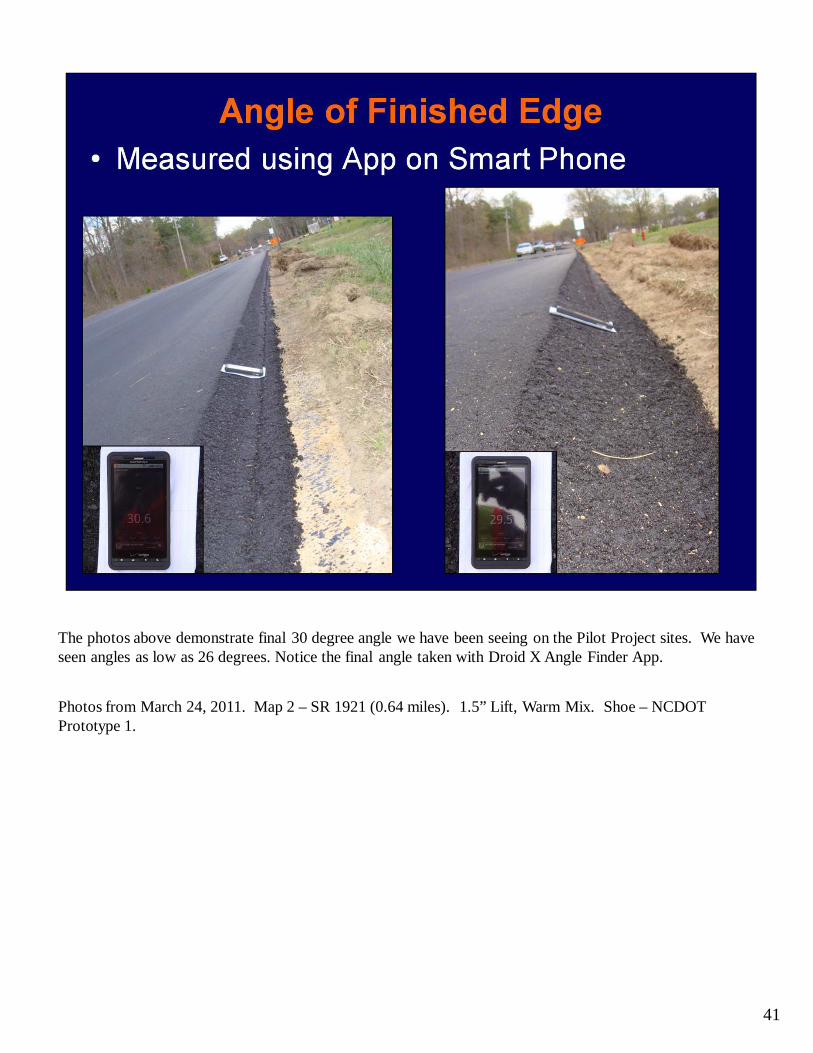
The photos above demonstrate final 30 degree angle we have been seeing on the Pilot Project sites. We have seen angles as low as 26 degrees. Notice the final angle taken with Droid X Angle Finder App.
Photos from March 24, 2011. Map 2 – SR 1921 (0.64 miles). 1.5” Lift, Warm Mix. Shoe – NCDOT Prototype 1.
42
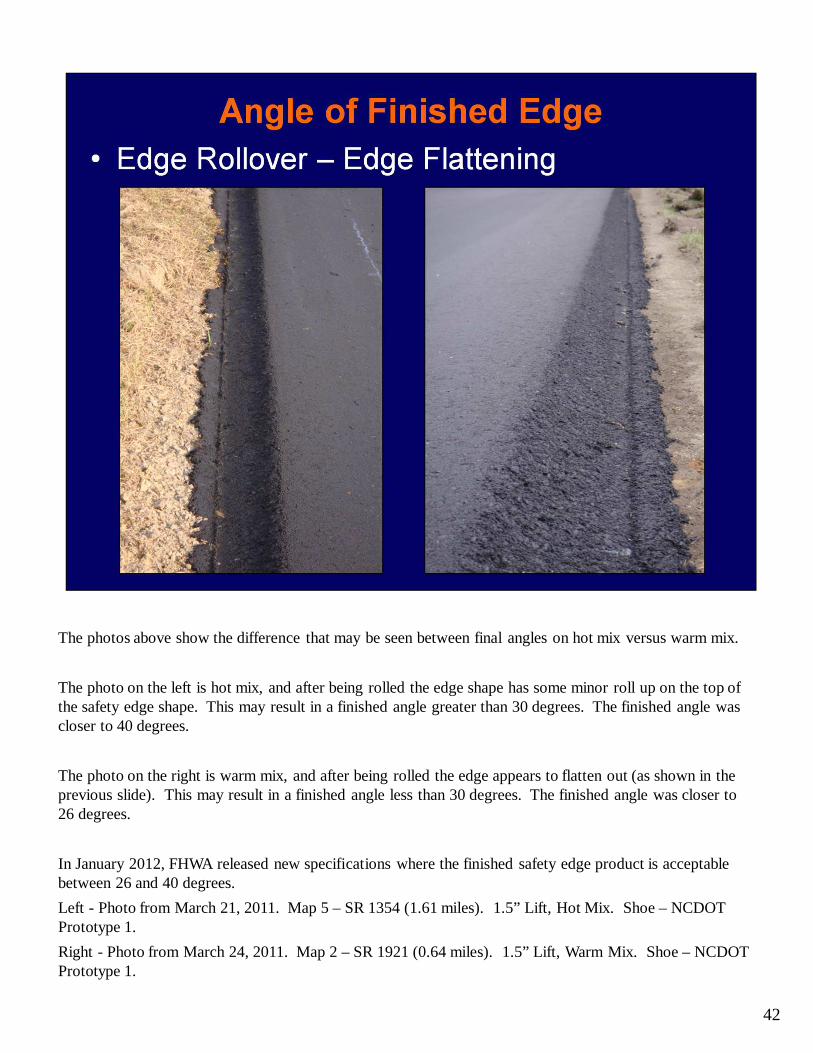
The photos above show the difference that may be seen between final angles on hot mix versus warm mix.
The photo on the left is hot mix, and after being rolled the edge shape has some minor roll up on the top of the safety edge shape. This may result in a finished angle greater than 30 degrees. The finished angle was closer to 40 degrees.
The photo on the right is warm mix, and after being rolled the edge appears to flatten out (as shown in the previous slide). This may result in a finished angle less than 30 degrees. The finished angle was closer to 26 degrees.
In January 2012, FHWA released new specifications where the finished safety edge product is acceptable between 26 and 40 degrees.
Left - Photo from March 21, 2011. Map 5 – SR 1354 (1.61 miles). 1.5” Lift, Hot Mix. Shoe – NCDOT Prototype 1.
Right - Photo from March 24, 2011. Map 2 – SR 1921 (0.64 miles). 1.5” Lift, Warm Mix. Shoe – NCDOT Prototype 1.
43
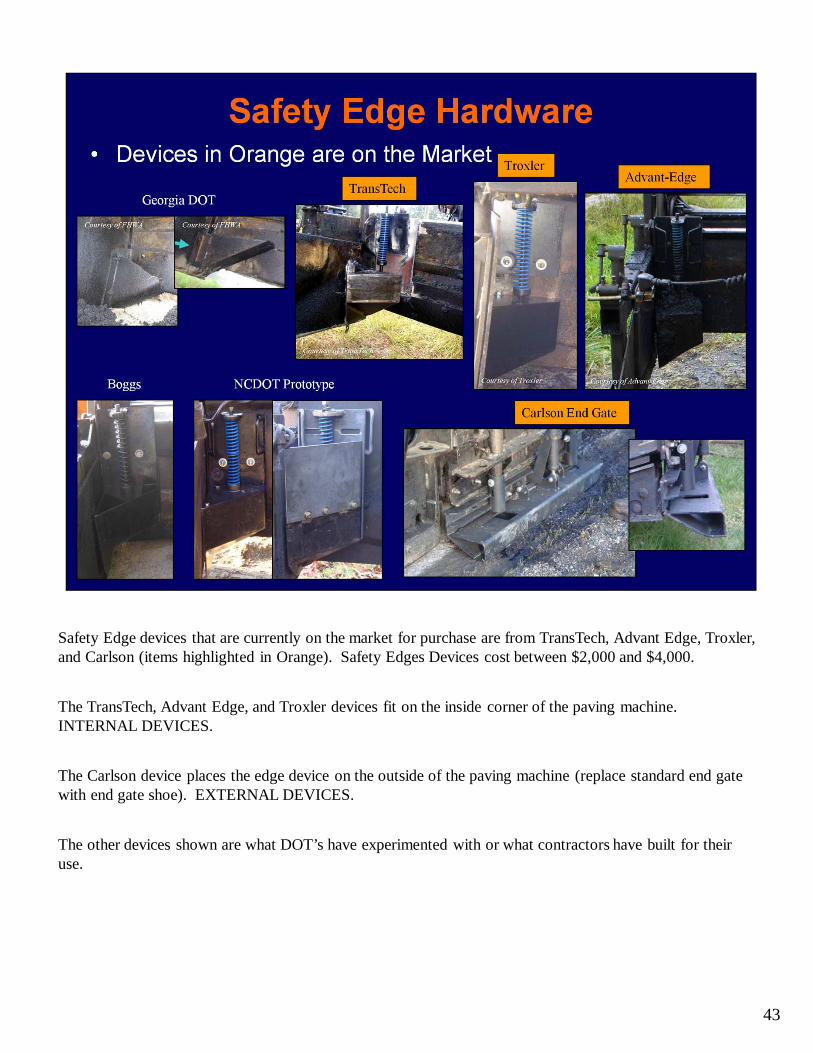
Safety Edge devices that are currently on the market for purchase are from TransTech, Advant Edge, Troxler, and Carlson (items highlighted in Orange). Safety Edges Devices cost between $2,000 and $4,000.
The TransTech, Advant Edge, and Troxler devices fit on the inside corner of the paving machine. INTERNAL DEVICES.
The Carlson device places the edge device on the outside of the paving machine (replace standard end gate with end gate shoe). EXTERNAL DEVICES.
The other devices shown are what DOT’s have experimented with or what contractors have built for their use.
44
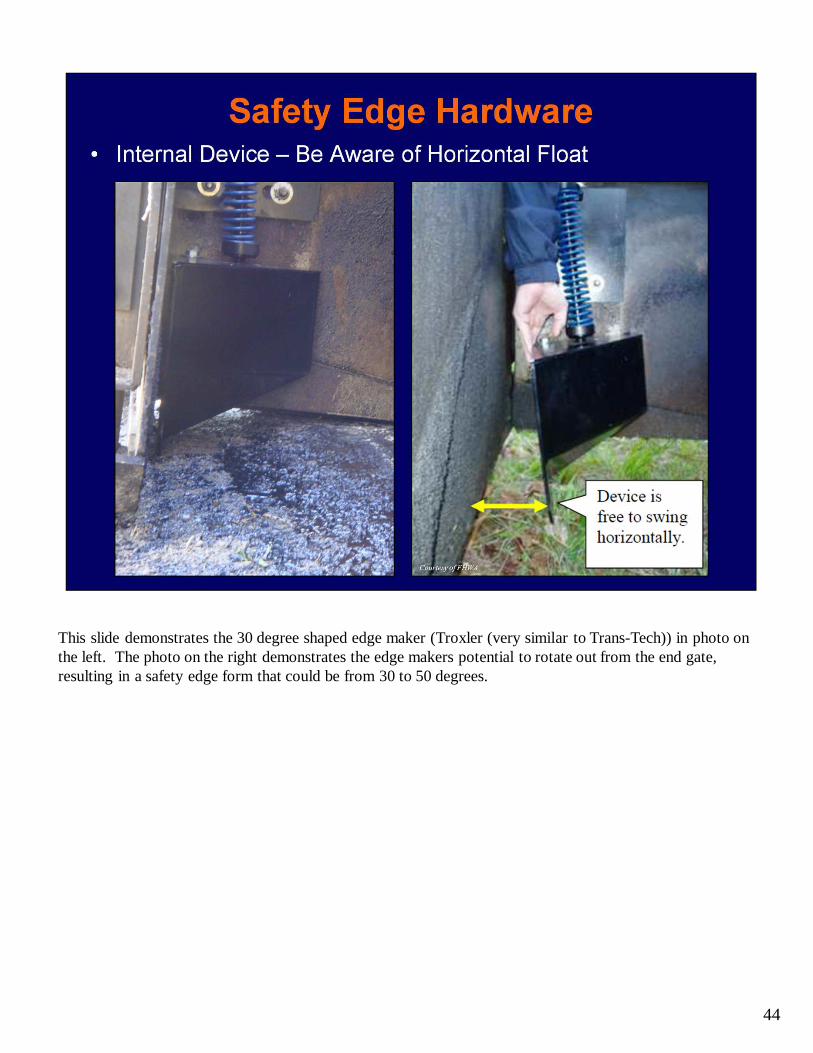
This slide demonstrates the 30 degree shaped edge maker (Troxler (very similar to Trans-Tech)) in photo on the left. The photo on the right demonstrates the edge makers potential to rotate out from the end gate, resulting in a safety edge form that could be from 30 to 50 degrees.
45
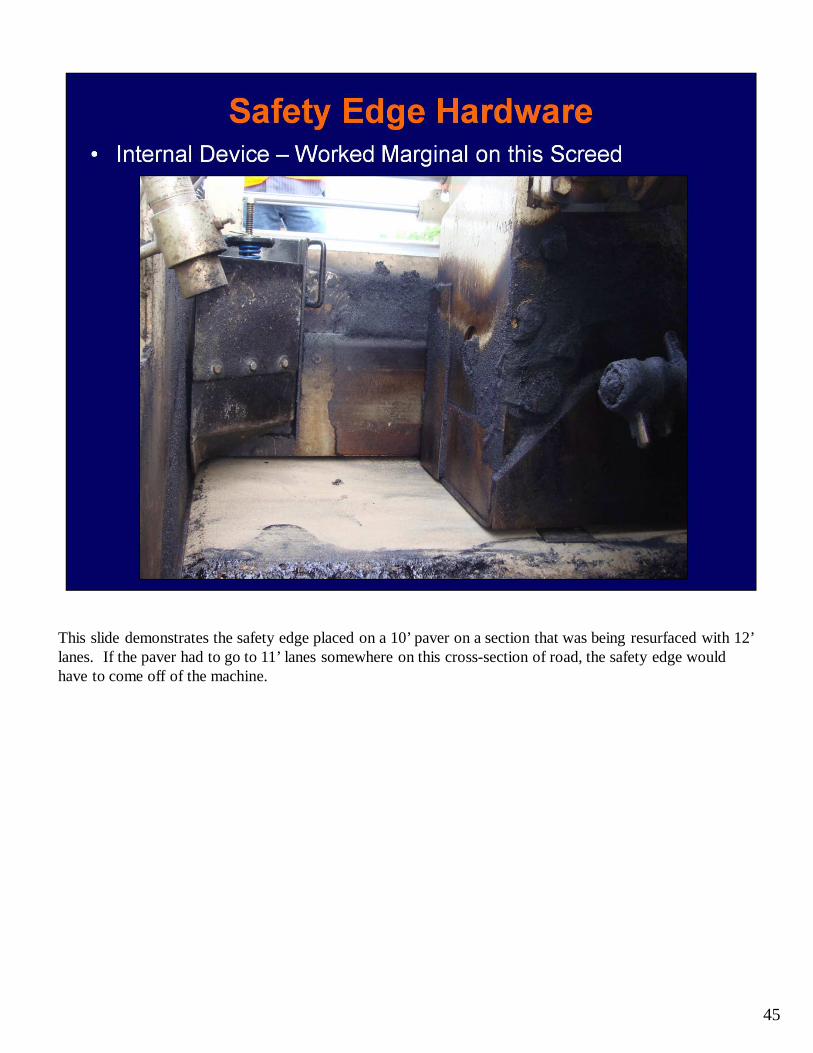
This slide demonstrates the safety edge placed on a 10’ paver on a section that was being resurfaced with 12’ lanes. If the paver had to go to 11’ lanes somewhere on this cross-section of road, the safety edge would have to come off of the machine.
46
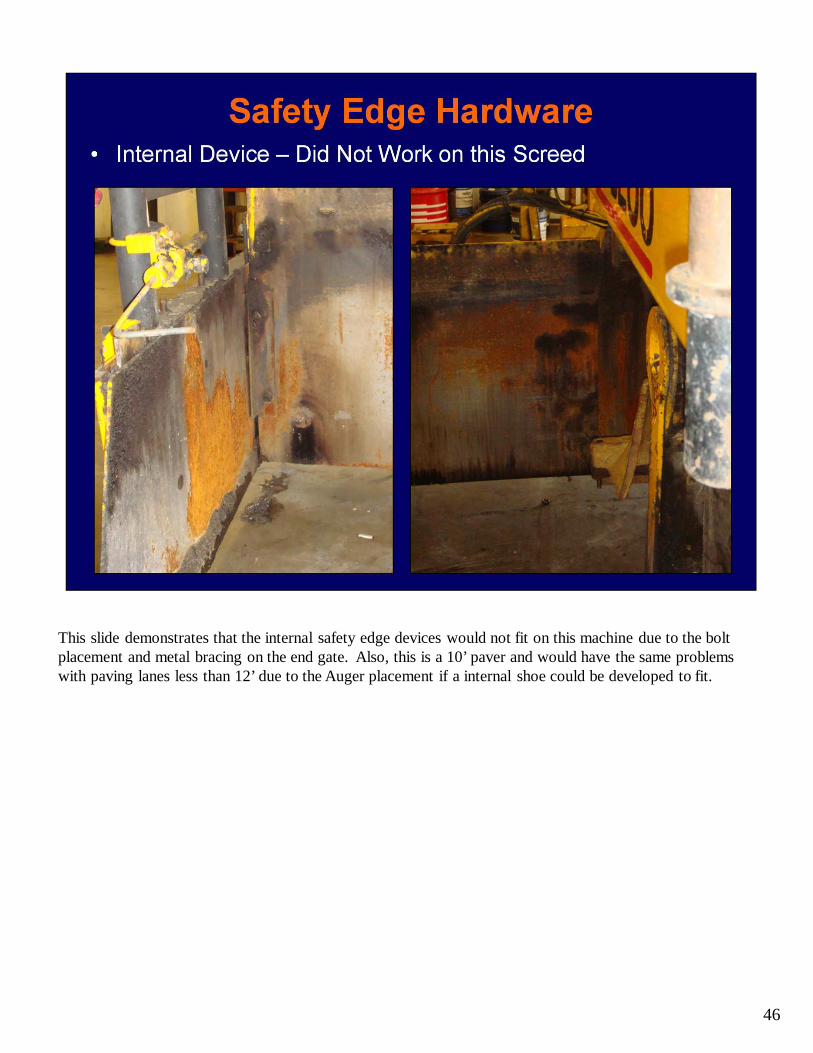
This slide demonstrates that the internal safety edge devices would not fit on this machine due to the bolt placement and metal bracing on the end gate. Also, this is a 10’ paver and would have the same problems with paving lanes less than 12’ due to the Auger placement if a internal shoe could be developed to fit.
47
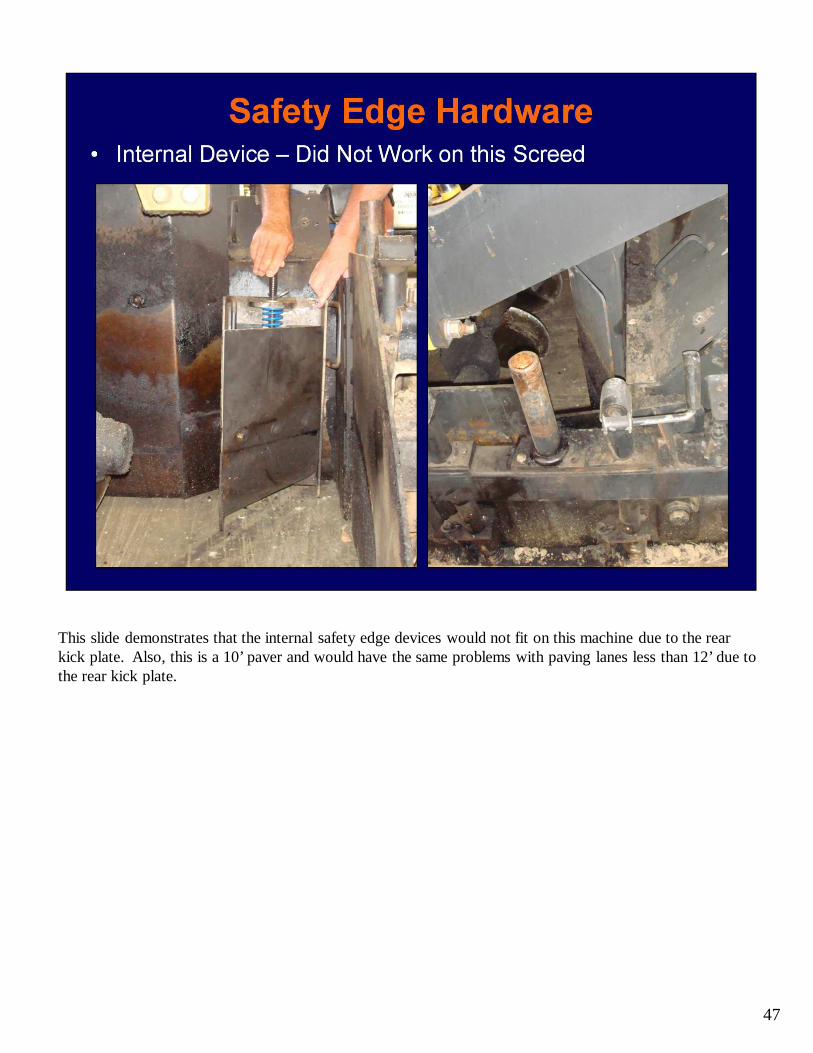
This slide demonstrates that the internal safety edge devices would not fit on this machine due to the rear kick plate. Also, this is a 10’ paver and would have the same problems with paving lanes less than 12’ due to the rear kick plate.
48
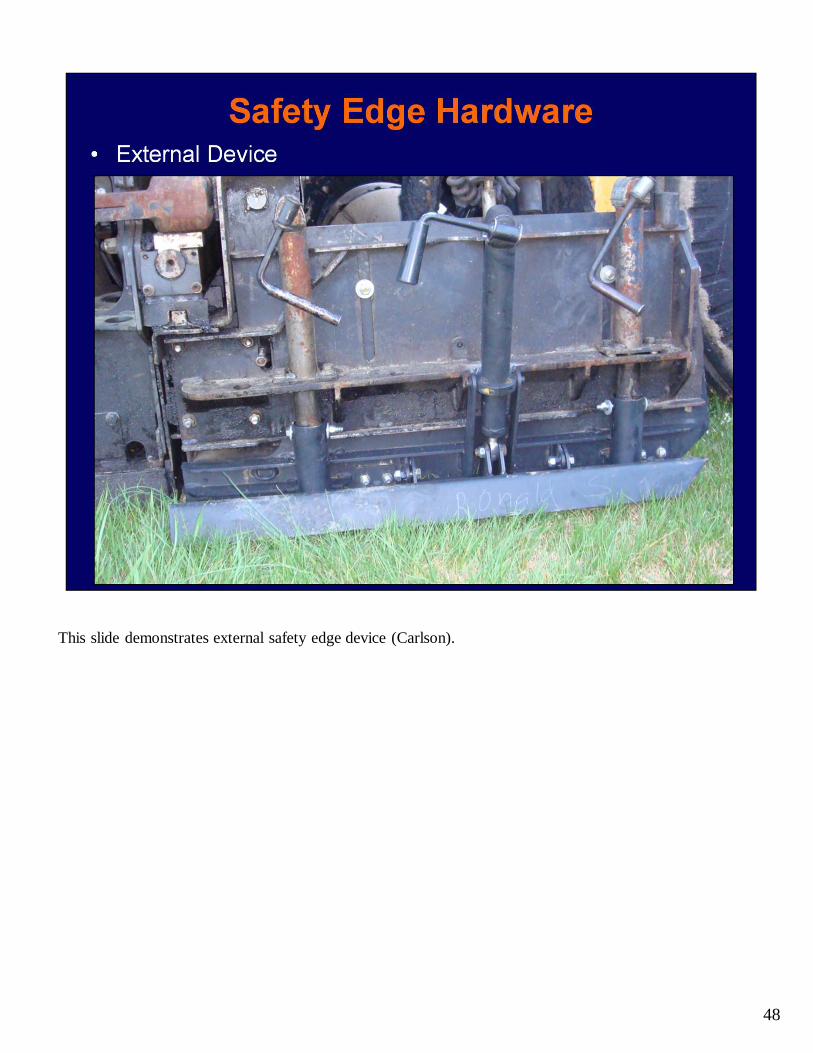
This slide demonstrates external safety edge device (Carlson).
49
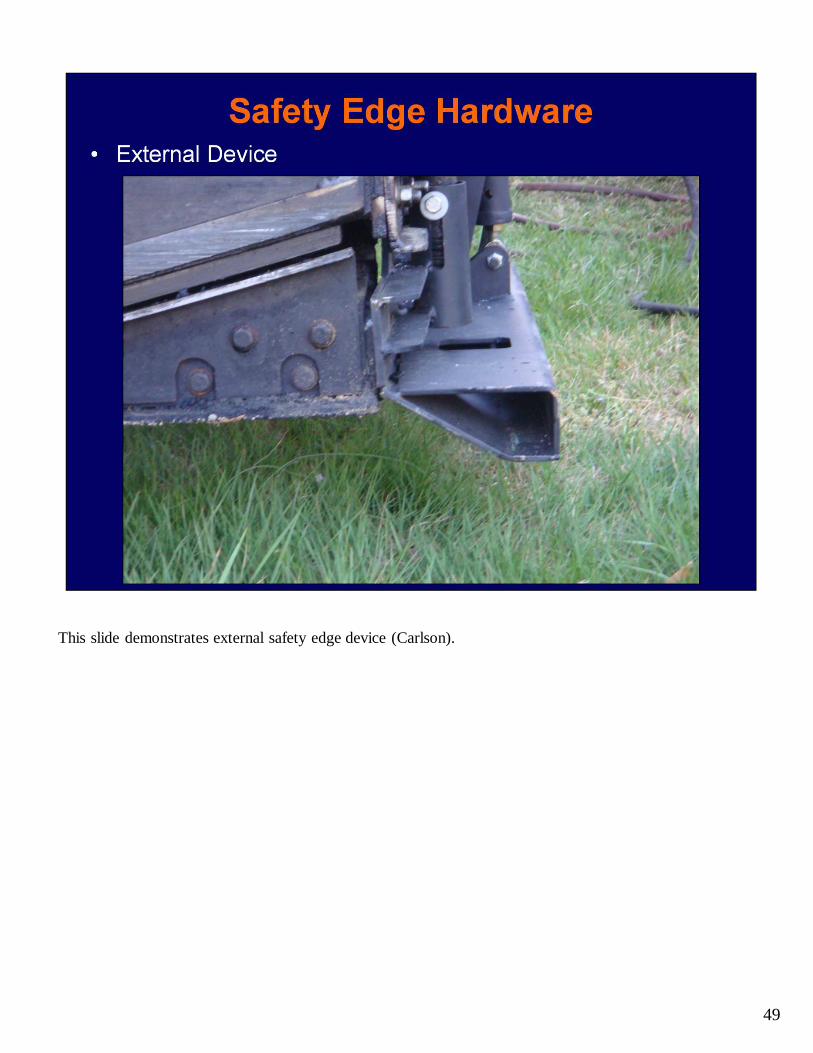
This slide demonstrates external safety edge device (Carlson).

50
This slide demonstrates Fixed Edge and Internal Safety Edge Devices (TransTech, Troxler, and Advant Edge). The Advant Edge has the ability to be switched out to either the right or left side of the paver.
51
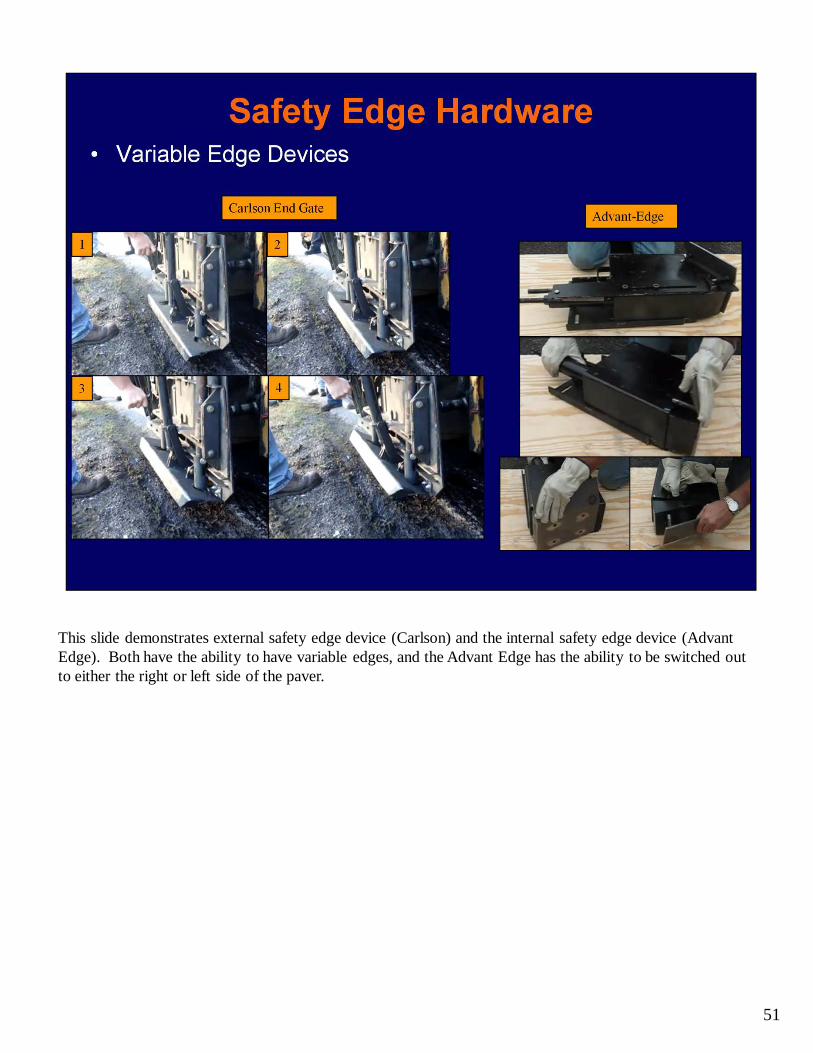
This slide demonstrates external safety edge device (Carlson) and the internal safety edge device (Advant Edge). Both have the ability to have variable edges, and the Advant Edge has the ability to be switched out to either the right or left side of the paver.
52
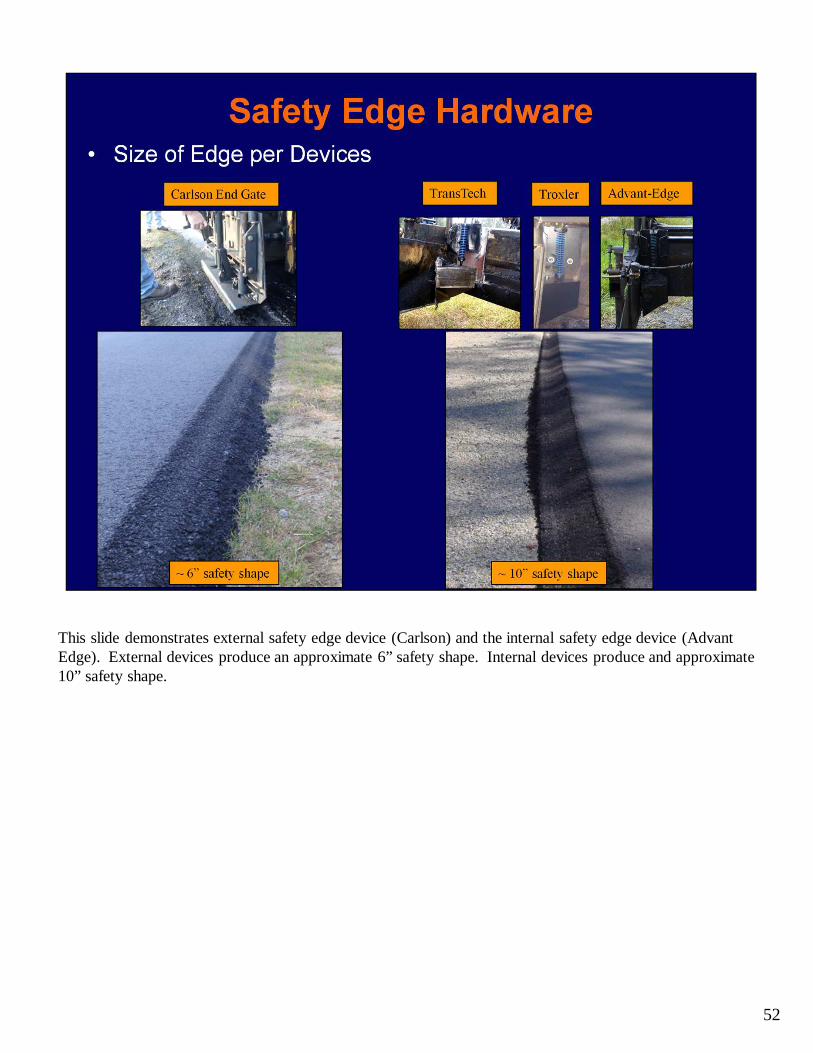
This slide demonstrates external safety edge device (Carlson) and the internal safety edge device (Advant Edge). External devices produce an approximate 6” safety shape. Internal devices produce and approximate 10” safety shape.
53
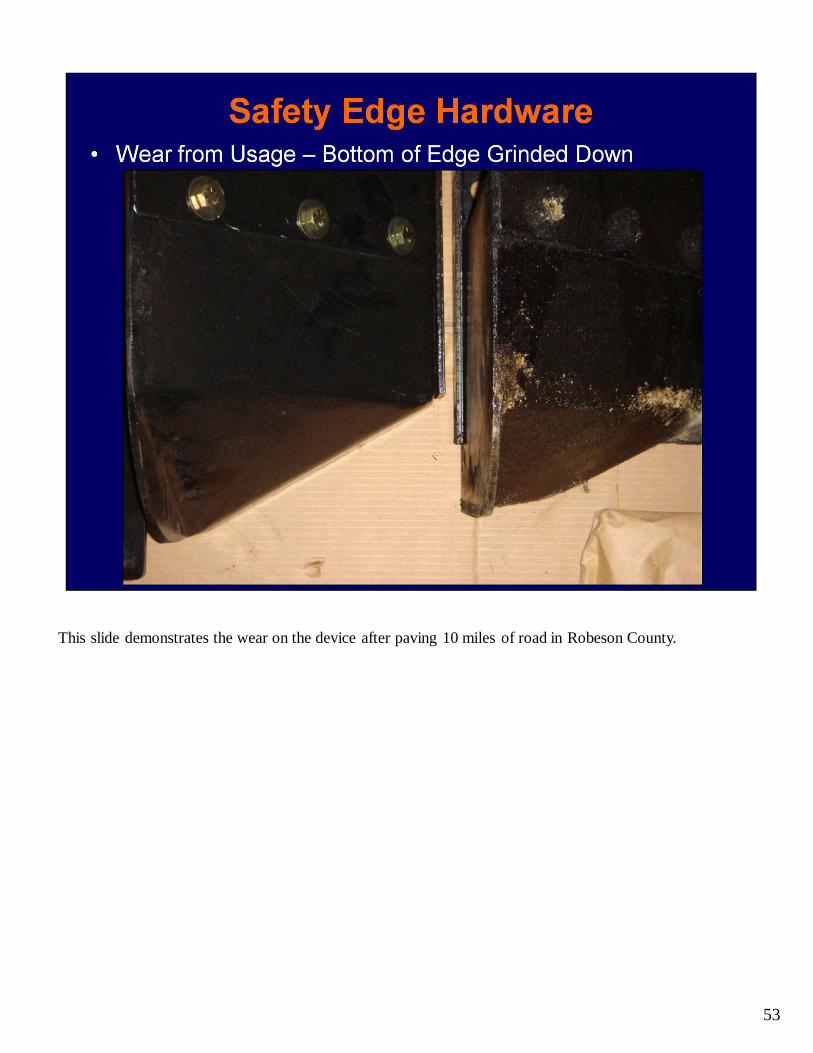
This slide demonstrates the wear on the device after paving 10 miles of road in Robeson County.
54
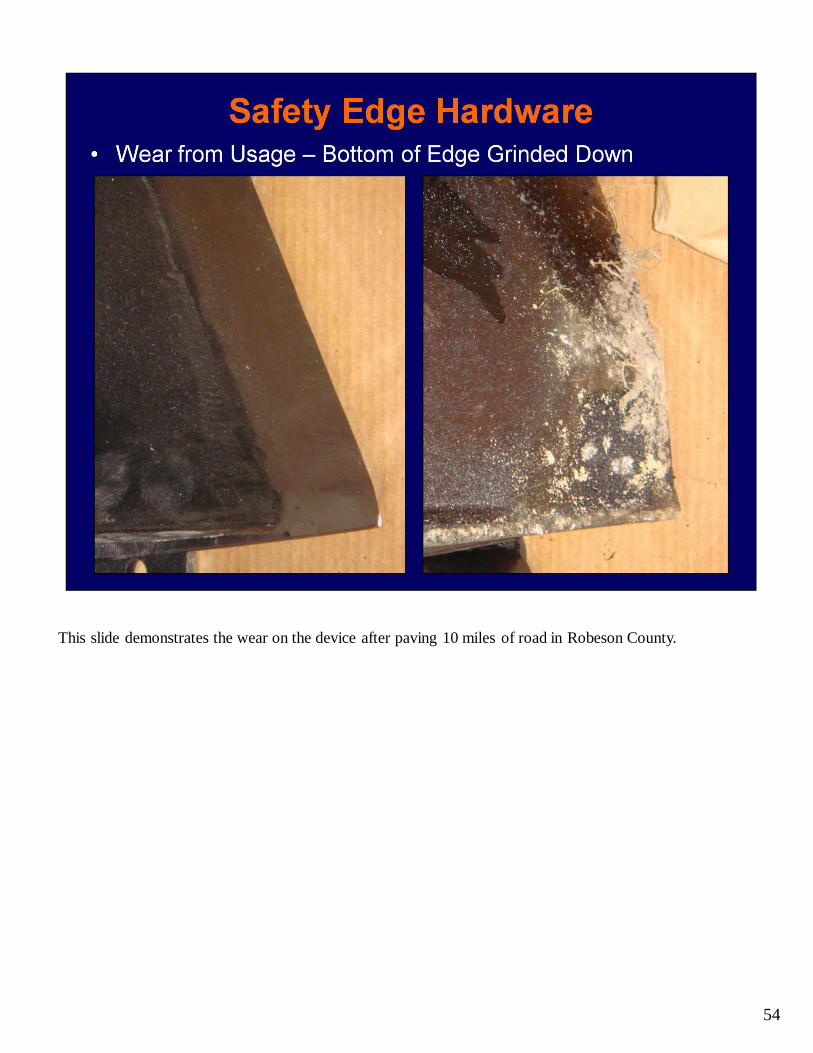
This slide demonstrates the wear on the device after paving 10 miles of road in Robeson County.

55
This slide demonstrates the damage to the screw device if the shoe is not raised and lowered properly and the device happens to snag objects along the roadside (such as concrete driveways).
56
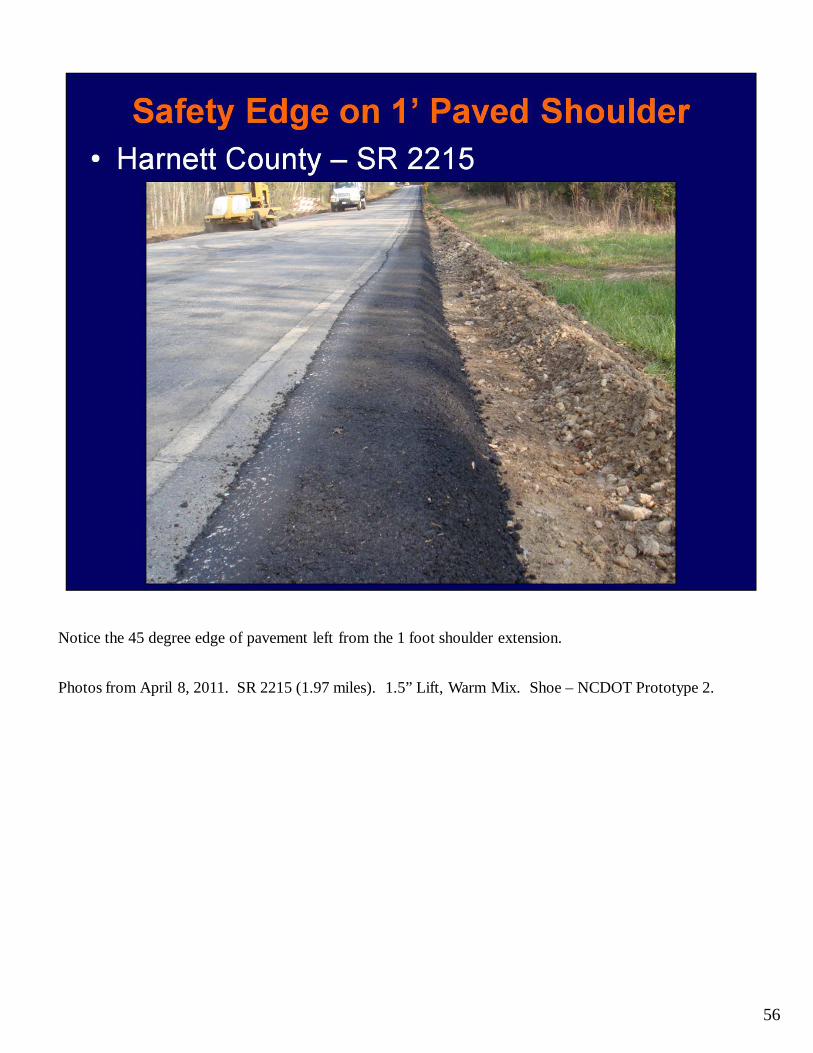
Notice the 45 degree edge of pavement left from the 1 foot shoulder extension.
Photos from April 8, 2011. SR 2215 (1.97 miles). 1.5” Lift, Warm Mix. Shoe – NCDOT Prototype 2.
57
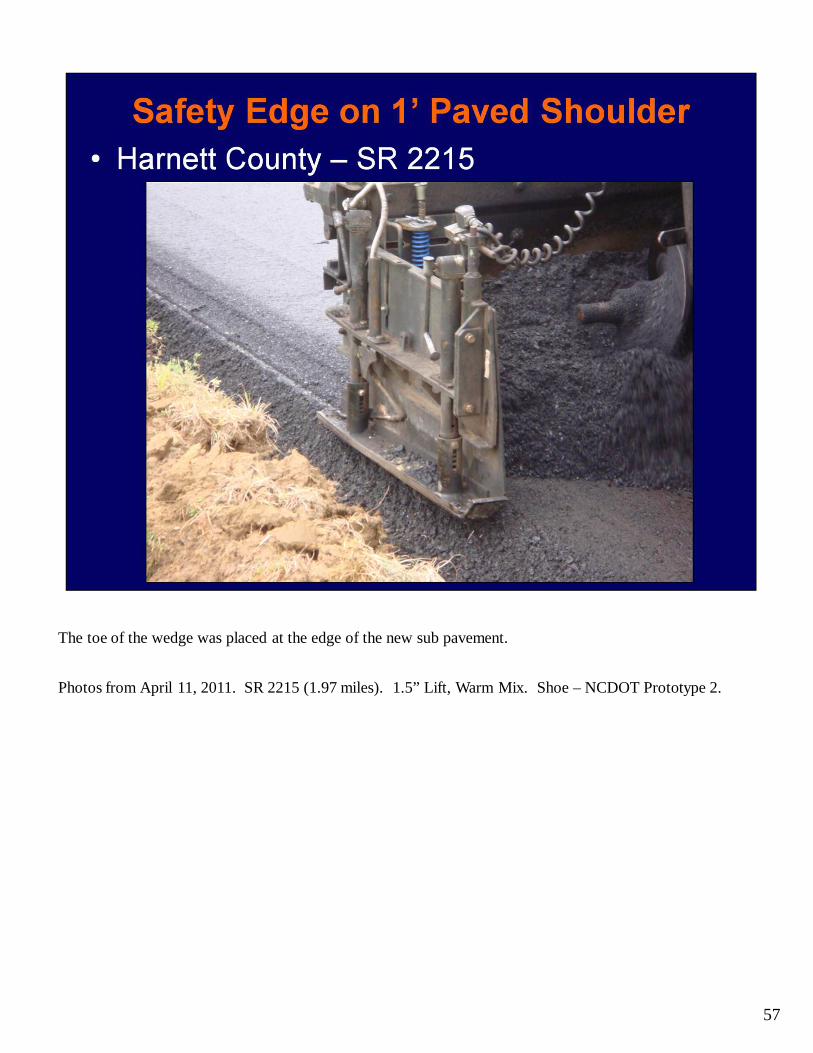
The toe of the wedge was placed at the edge of the new sub pavement.
Photos from April 11, 2011. SR 2215 (1.97 miles). 1.5” Lift, Warm Mix. Shoe – NCDOT Prototype 2.
58
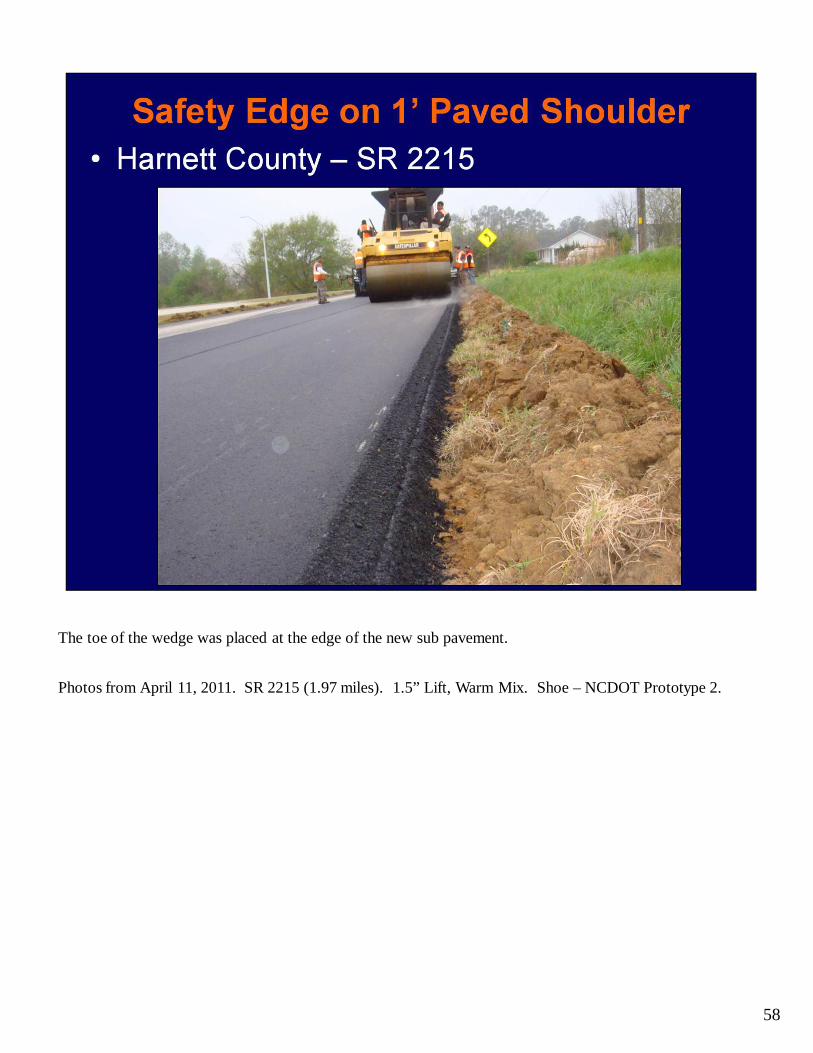
The toe of the wedge was placed at the edge of the new sub pavement.
Photos from April 11, 2011. SR 2215 (1.97 miles). 1.5” Lift, Warm Mix. Shoe – NCDOT Prototype 2.
59
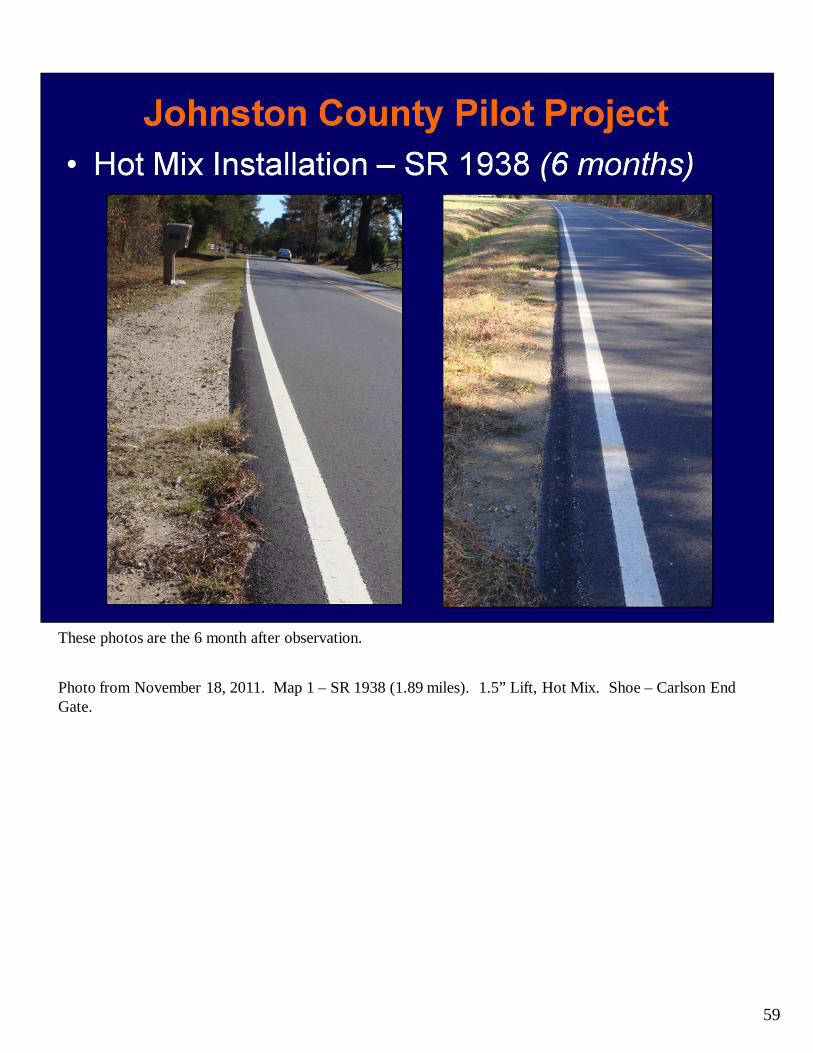
These photos are the 6 month after observation.
Photo from November 18, 2011. Map 1 – SR 1938 (1.89 miles). 1.5” Lift, Hot Mix. Shoe – Carlson End Gate.
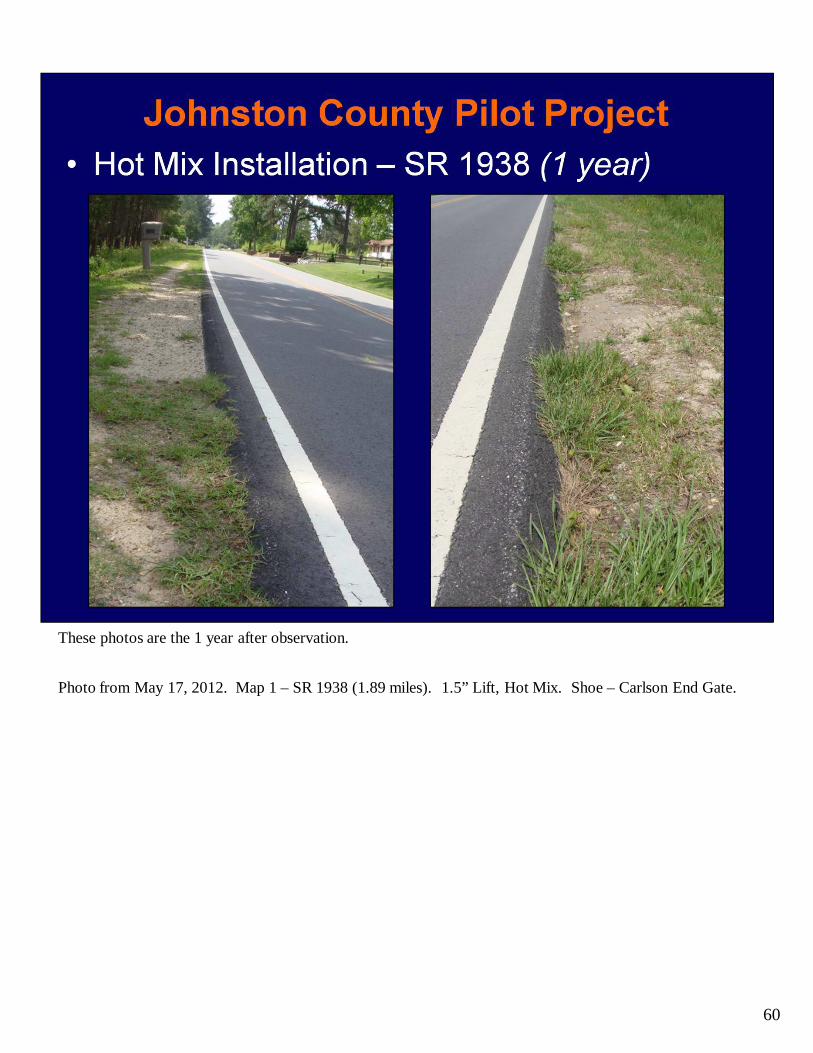
60
These photos are the 1 year after observation.
Photo from May 17, 2012. Map 1 – SR 1938 (1.89 miles). 1.5” Lift, Hot Mix. Shoe – Carlson End Gate.
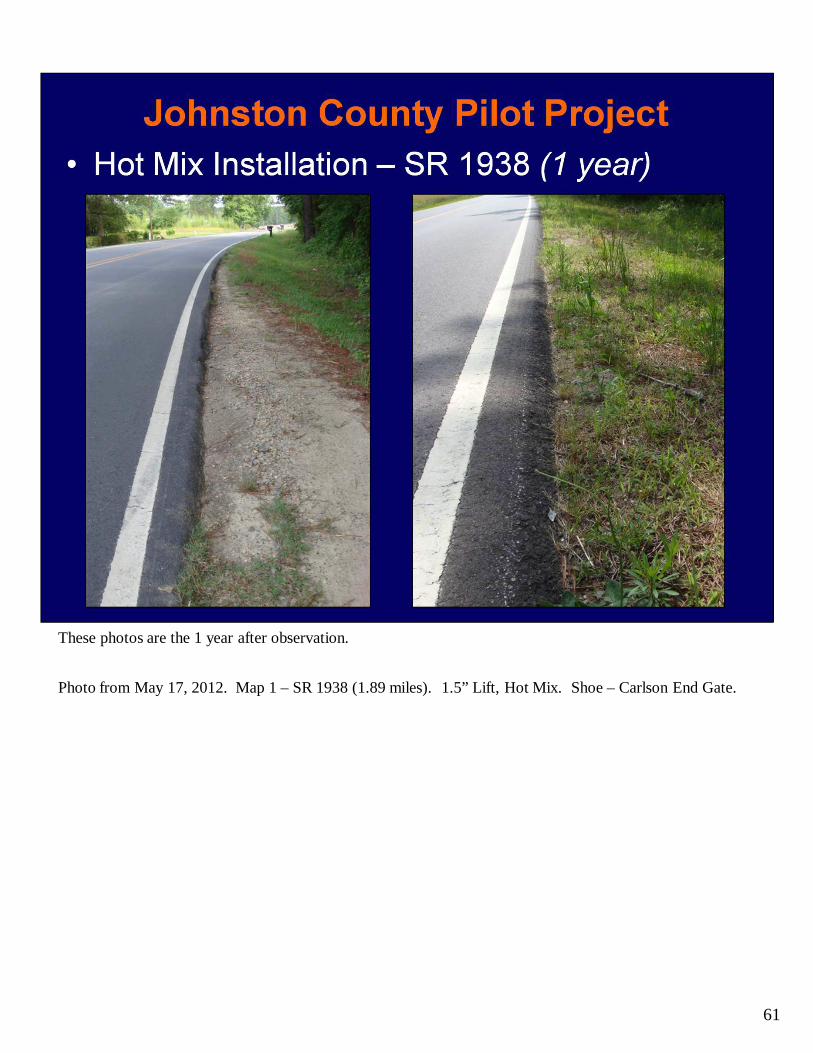
61
These photos are the 1 year after observation.
Photo from May 17, 2012. Map 1 – SR 1938 (1.89 miles). 1.5” Lift, Hot Mix. Shoe – Carlson End Gate.
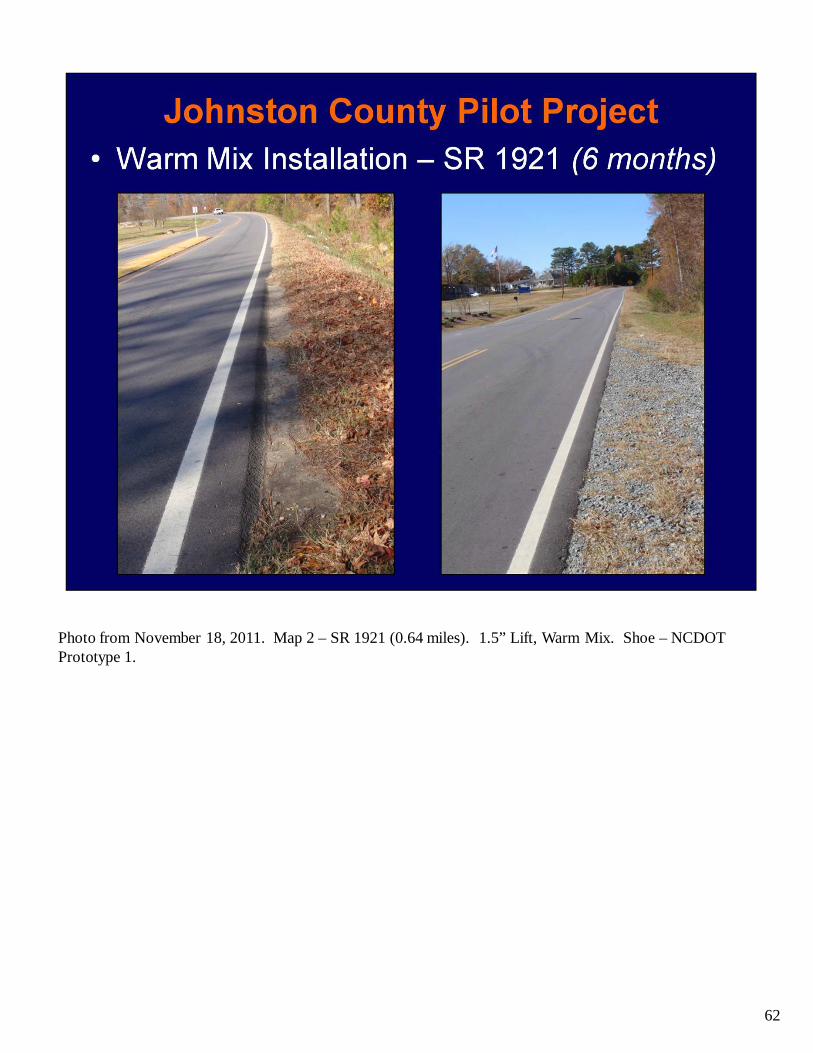
62
Photo from November 18, 2011. Map 2 – SR 1921 (0.64 miles). 1.5” Lift, Warm Mix. Shoe – NCDOT Prototype 1.
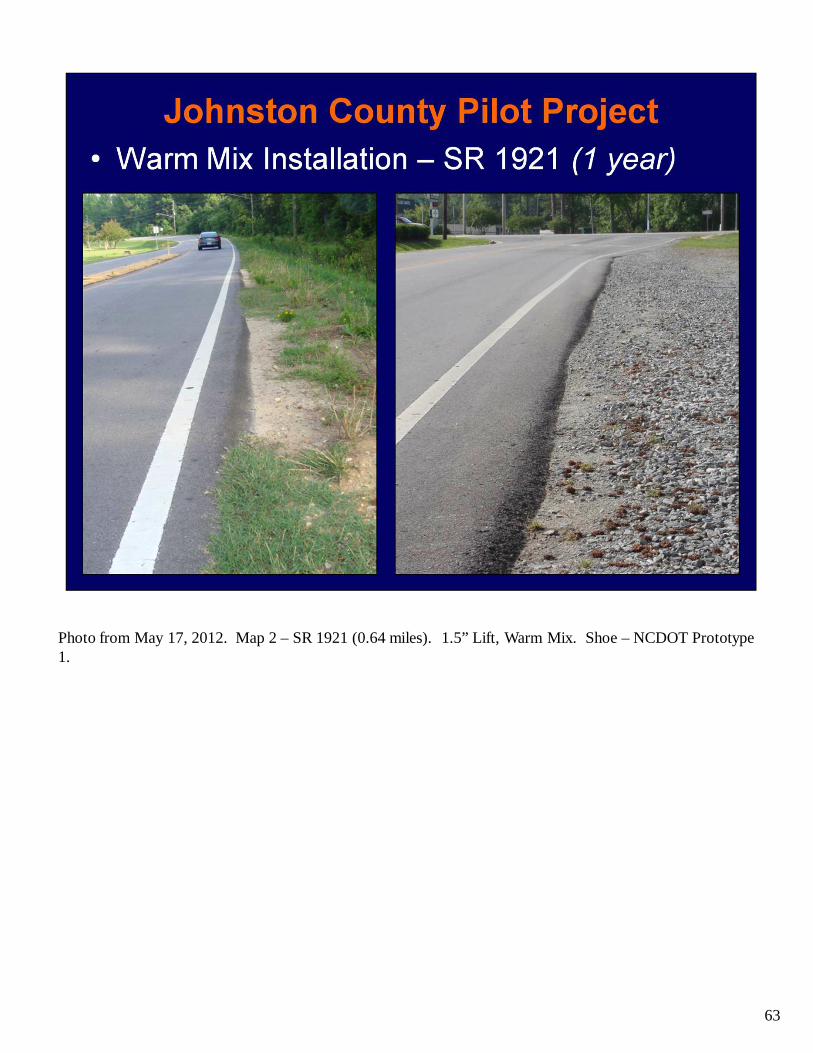
63
Photo from May 17, 2012. Map 2 – SR 1921 (0.64 miles). 1.5” Lift, Warm Mix. Shoe – NCDOT Prototype 1.
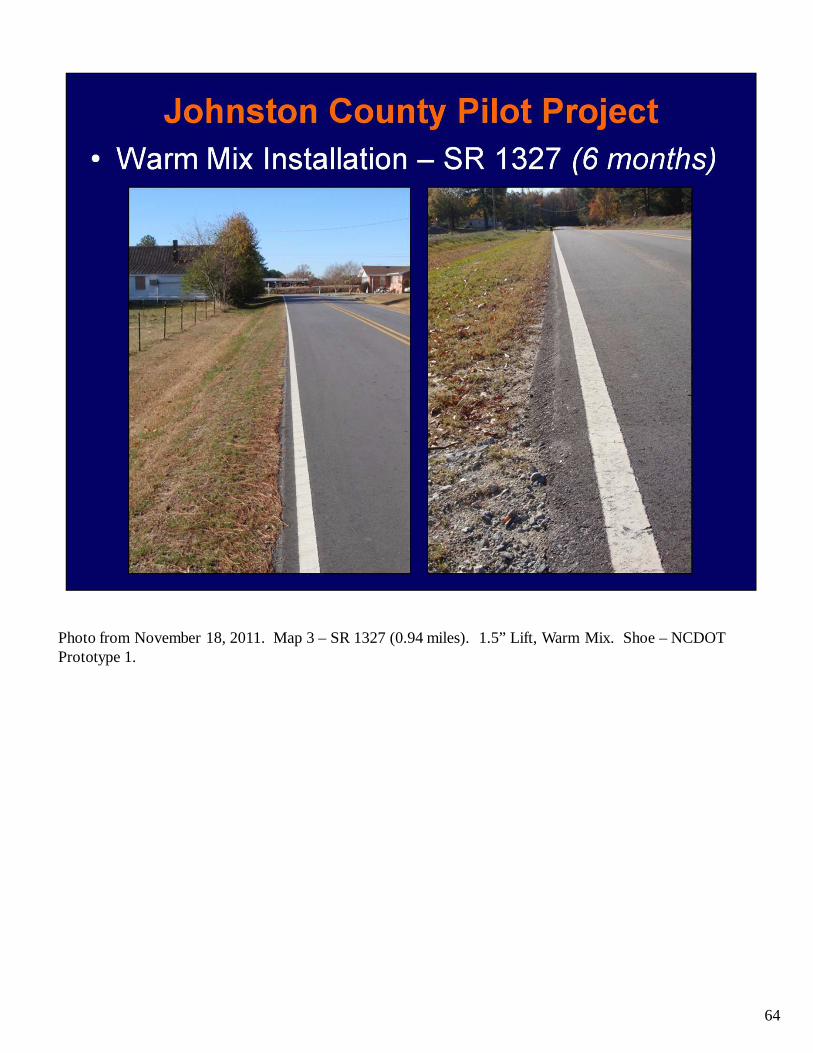
64
Photo from November 18, 2011. Map 3 – SR 1327 (0.94 miles). 1.5” Lift, Warm Mix. Shoe – NCDOT Prototype 1.
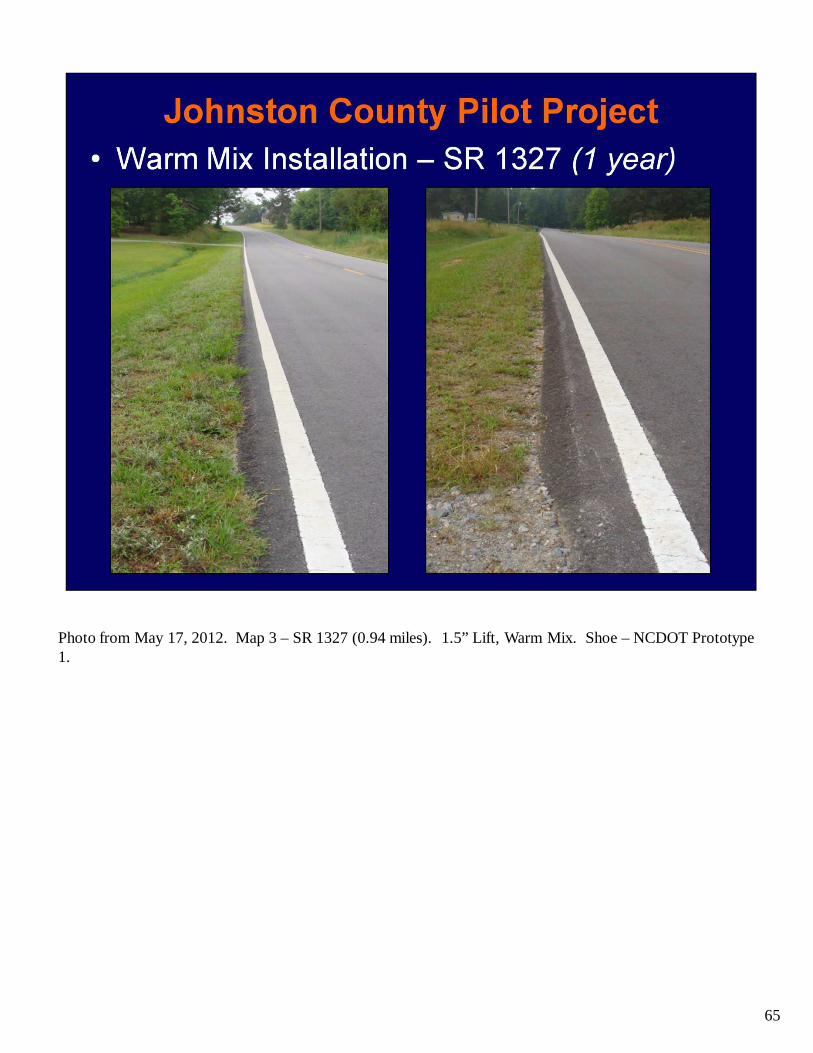
65
Photo from May 17, 2012. Map 3 – SR 1327 (0.94 miles). 1.5” Lift, Warm Mix. Shoe – NCDOT Prototype 1.
66
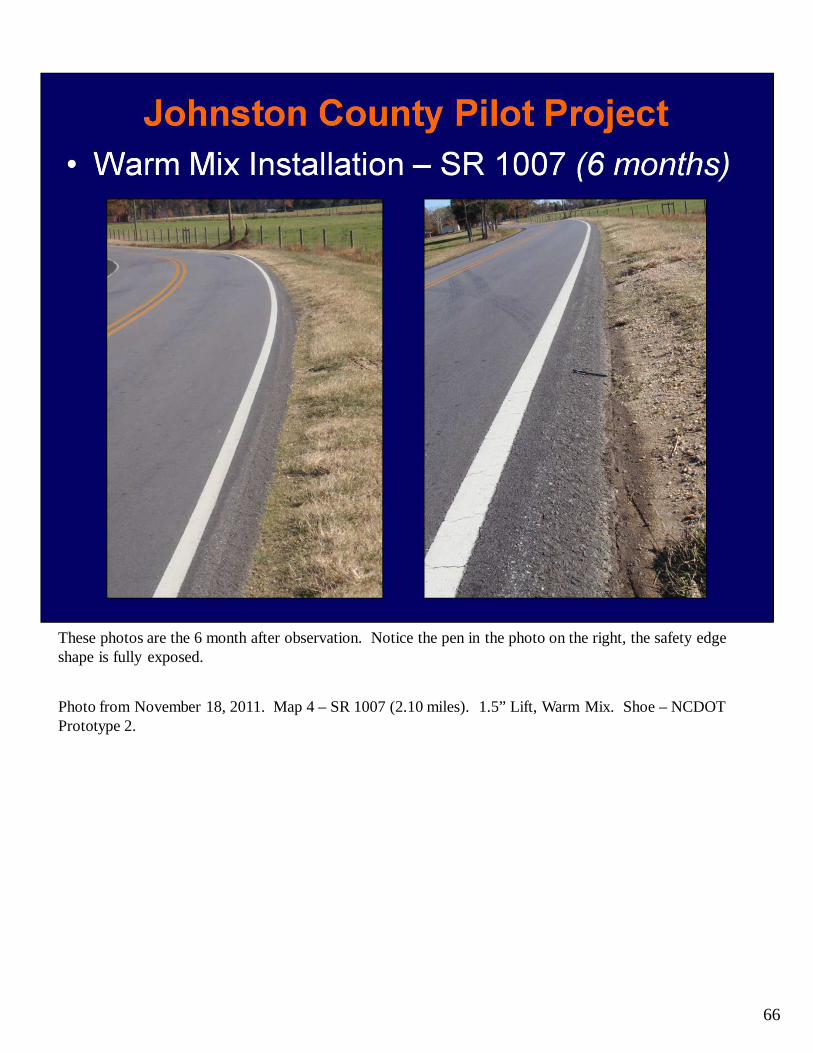
These photos are the 6 month after observation. Notice the pen in the photo on the right, the safety edge shape is fully exposed.
Photo from November 18, 2011. Map 4 – SR 1007 (2.10 miles). 1.5” Lift, Warm Mix. Shoe – NCDOT Prototype 2.

67
Photo from November 18, 2011. Map 4 – SR 1007 (2.10 miles). 1.5” Lift, Warm Mix. Shoe – NCDOT Prototype 2.
68
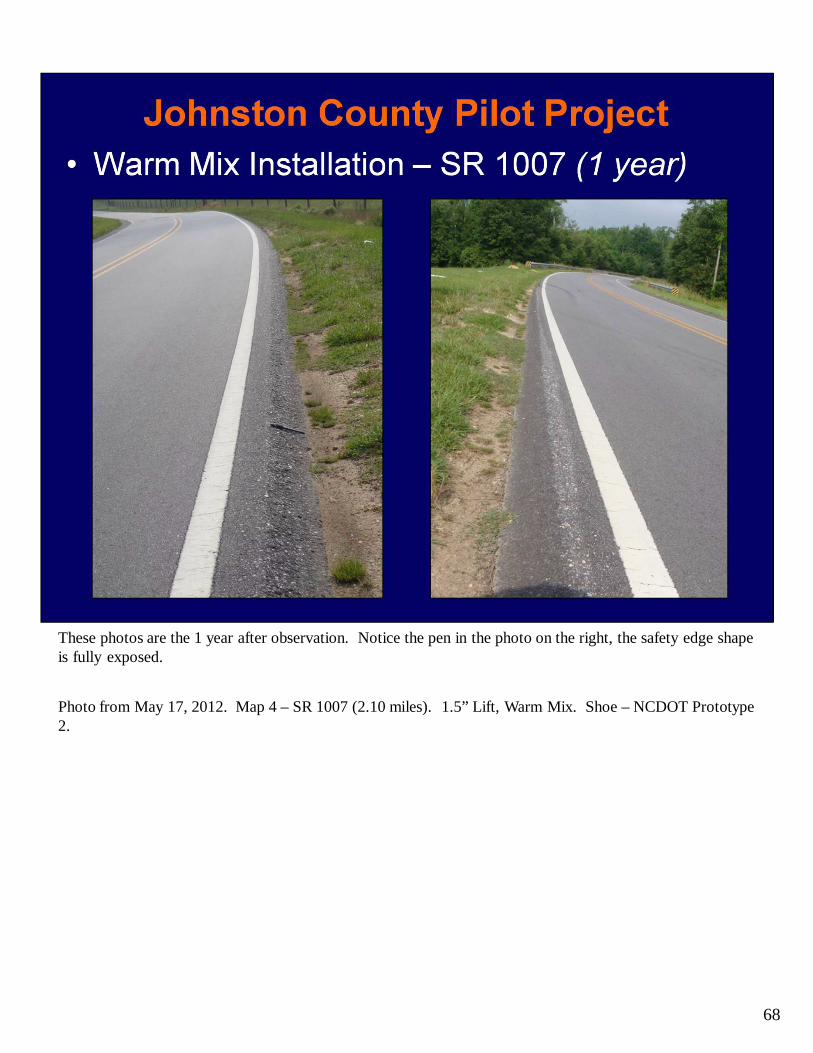
These photos are the 1 year after observation. Notice the pen in the photo on the right, the safety edge shape is fully exposed.
Photo from May 17, 2012. Map 4 – SR 1007 (2.10 miles). 1.5” Lift, Warm Mix. Shoe – NCDOT Prototype 2.
69
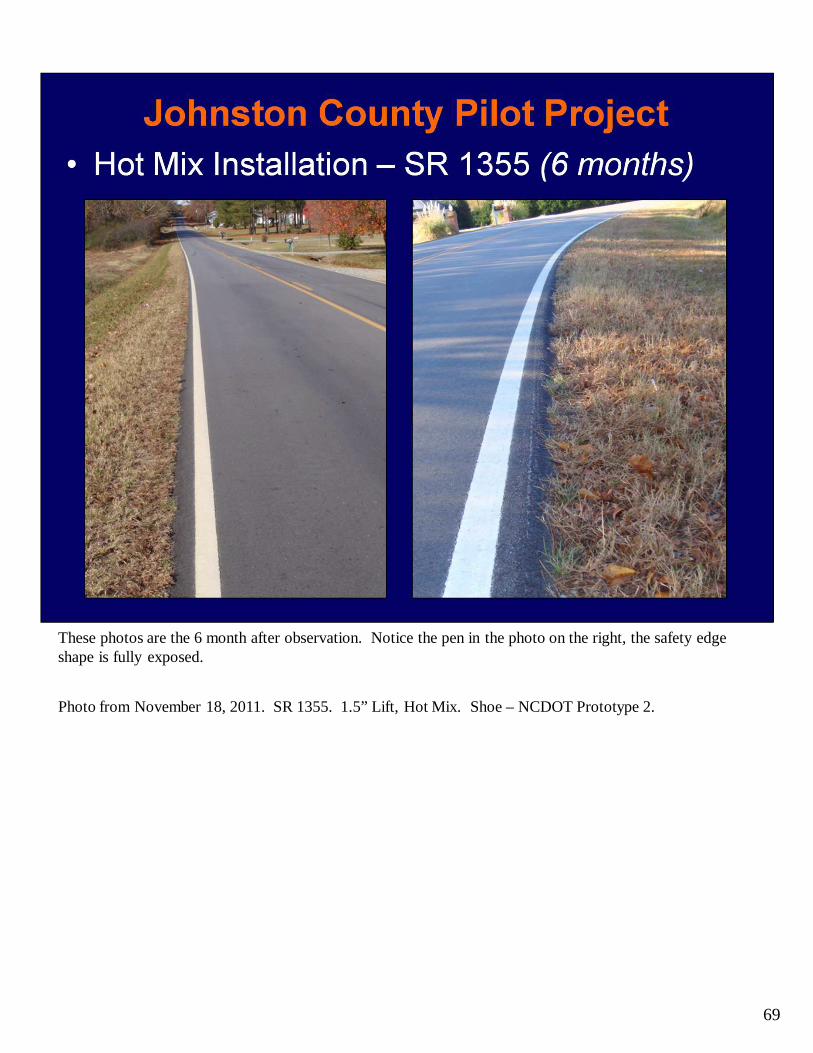
These photos are the 6 month after observation. Notice the pen in the photo on the right, the safety edge shape is fully exposed.
Photo from November 18, 2011. SR 1355. 1.5” Lift, Hot Mix. Shoe – NCDOT Prototype 2.
70
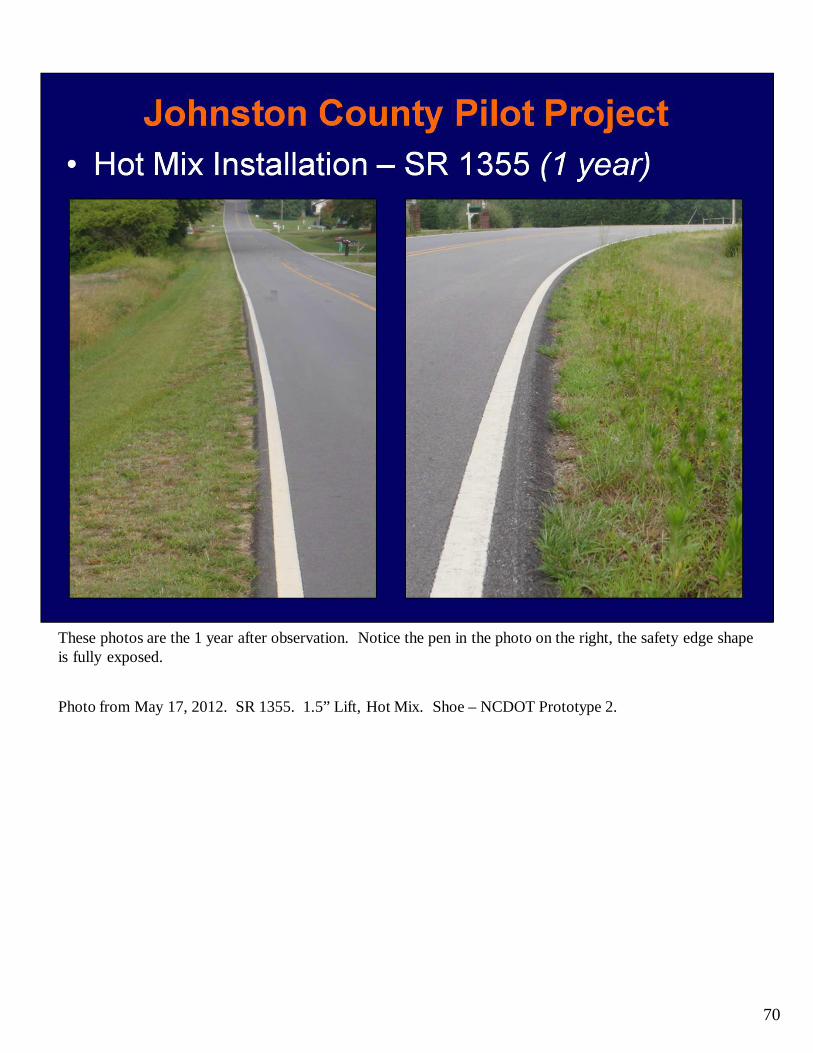
These photos are the 1 year after observation. Notice the pen in the photo on the right, the safety edge shape is fully exposed.
Photo from May 17, 2012. SR 1355. 1.5” Lift, Hot Mix. Shoe –NCDOT Prototype 2.
71
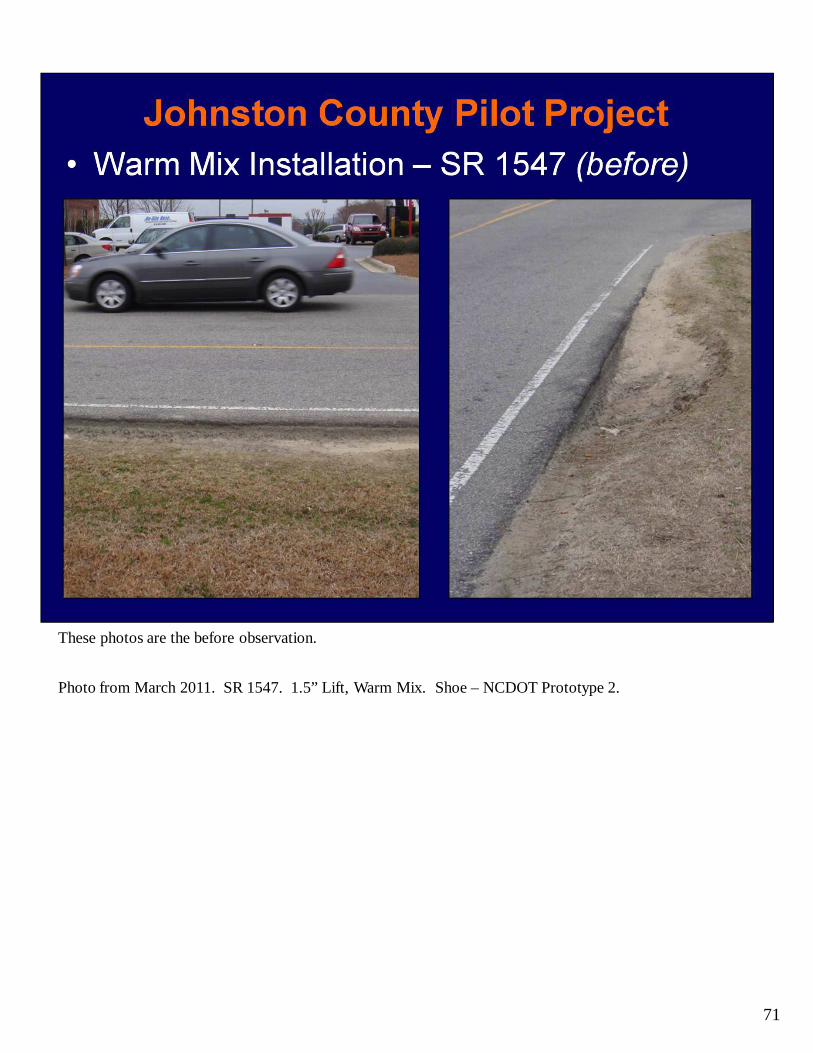
These photos are the before observation.
Photo from March 2011. SR 1547. 1.5” Lift, Warm Mix. Shoe – NCDOT Prototype 2.

72
These photos are the 6 month after observation.
Photo from November 18, 2011. SR 1547. 1.5” Lift, Warm Mix. Shoe – NCDOT Prototype 2.
73
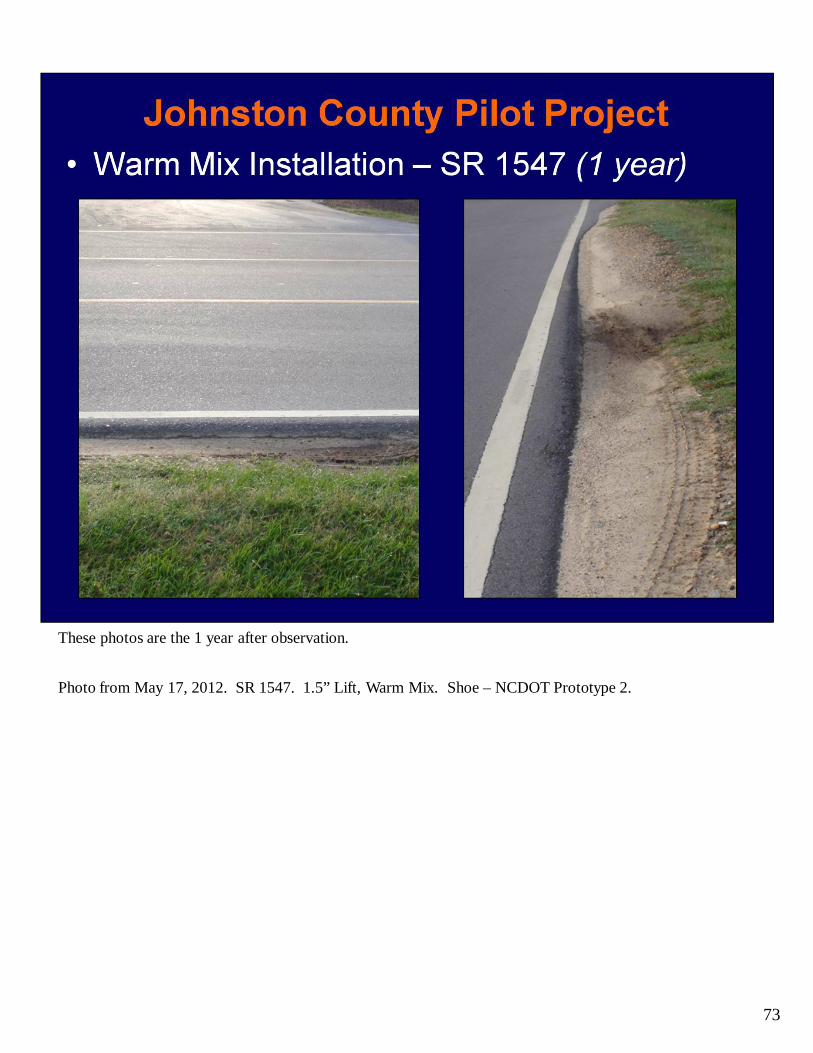
These photos are the 1 year after observation.
Photo from May 17, 2012. SR 1547. 1.5” Lift, Warm Mix. Shoe – NCDOT Prototype 2.
74
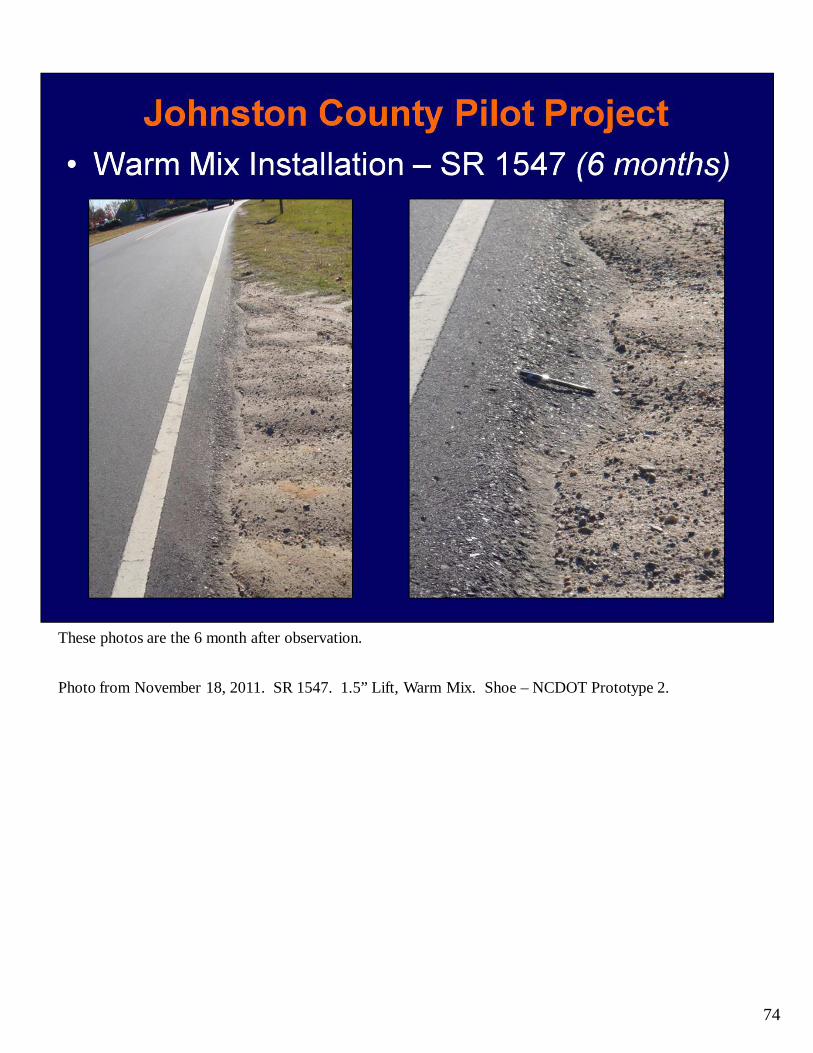
These photos are the 6 month after observation.
Photo from November 18, 2011. SR 1547. 1.5” Lift, Warm Mix. Shoe – NCDOT Prototype 2.
75
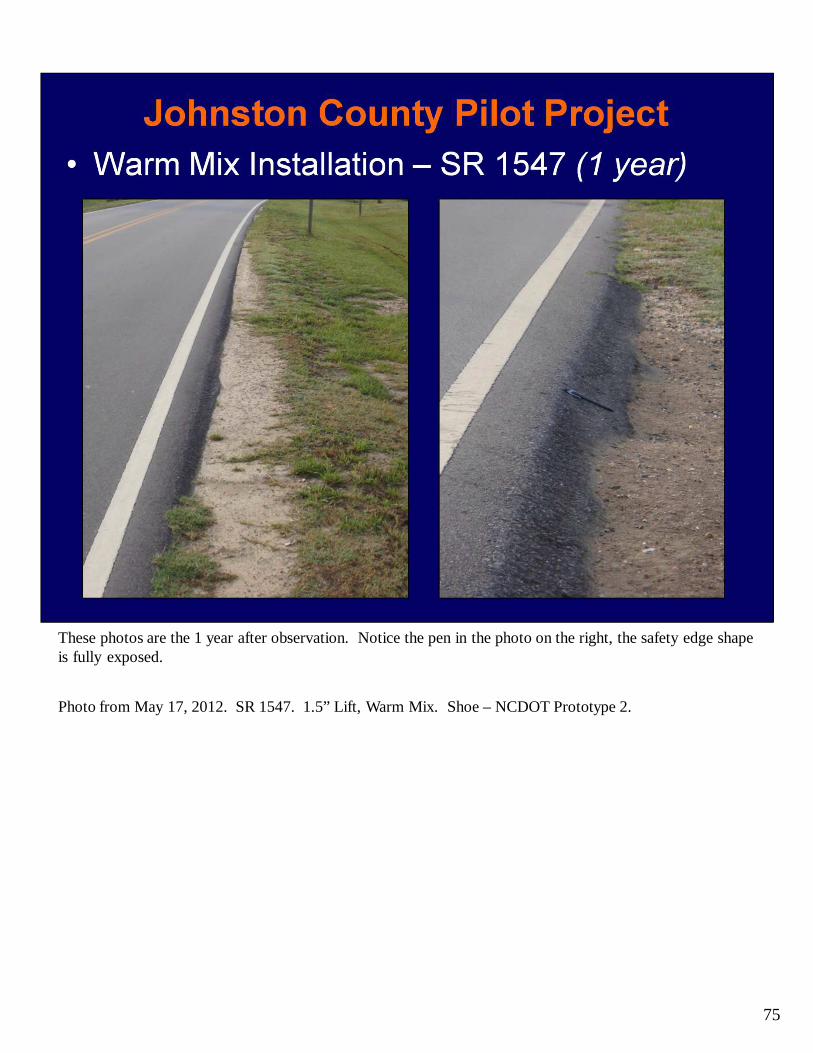
These photos are the 1 year after observation. Notice the pen in the photo on the right, the safety edge shape is fully exposed.
Photo from May 17, 2012. SR 1547. 1.5” Lift, Warm Mix. Shoe – NCDOT Prototype 2.
76
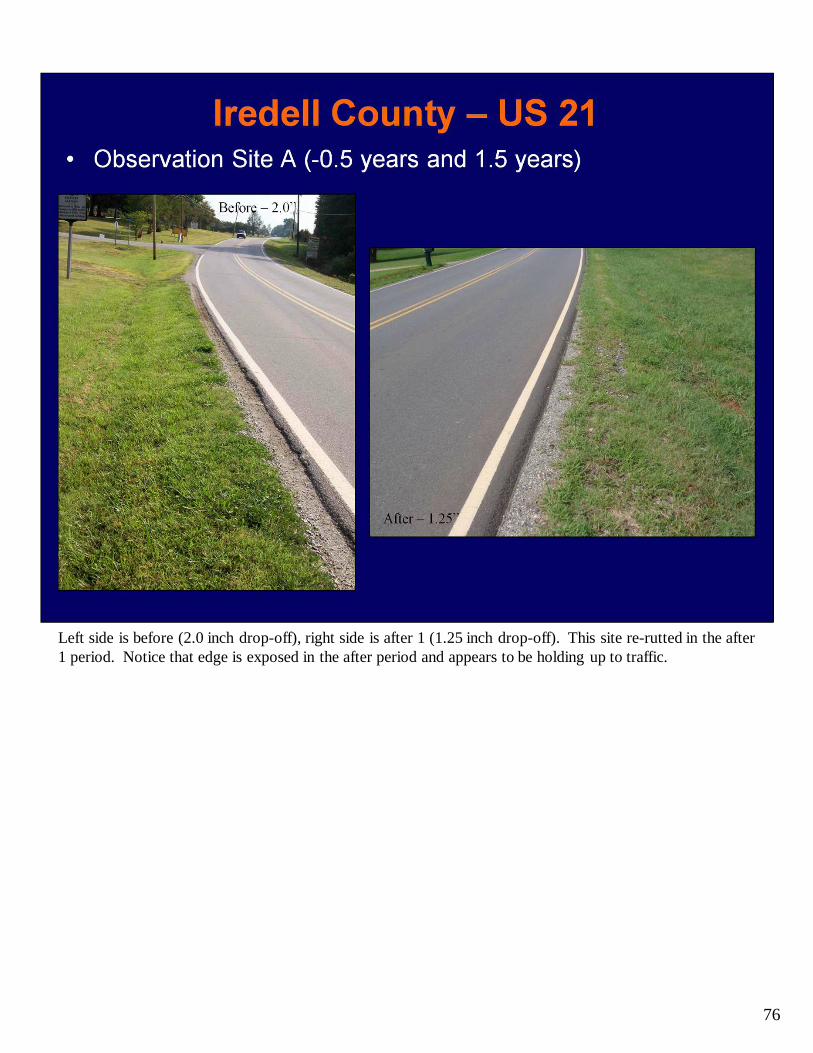
Left side is before (2.0 inch drop-off), right side is after 1 (1.25 inch drop-off). This site re-rutted in the after 1 period. Notice that edge is exposed in the after period and appears to be holding up to traffic.
77
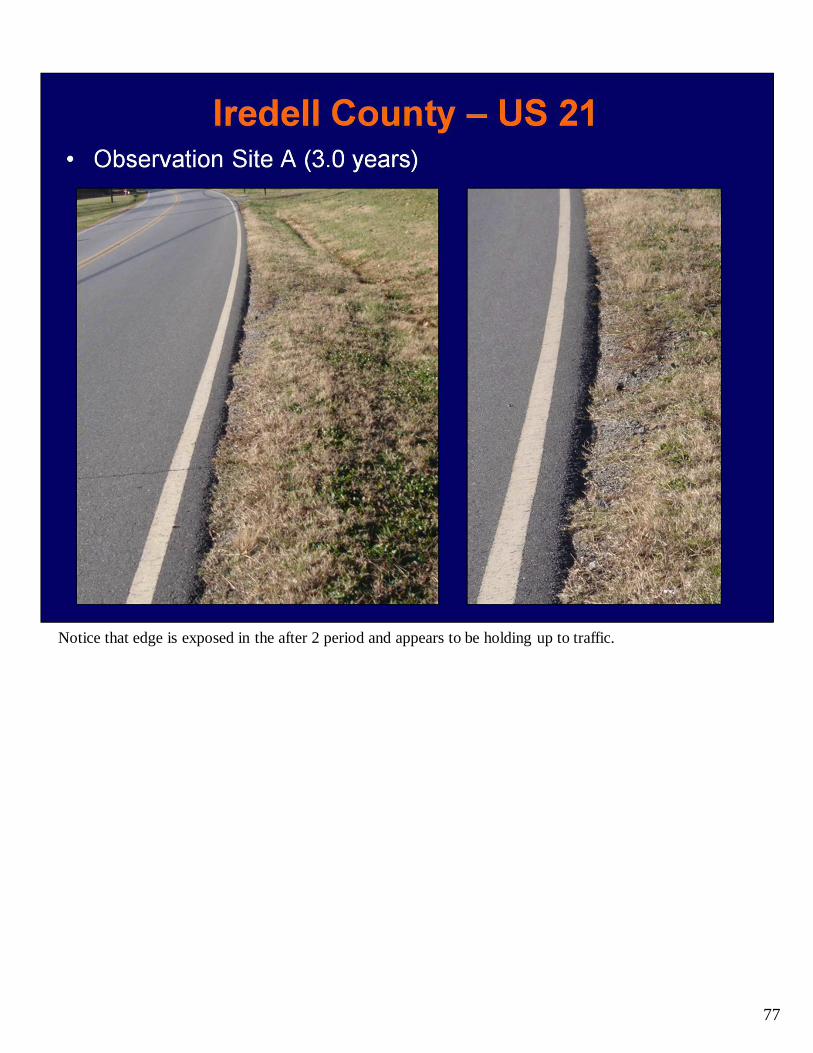
Notice that edge is exposed in the after 2 period and appears to be holding up to traffic.
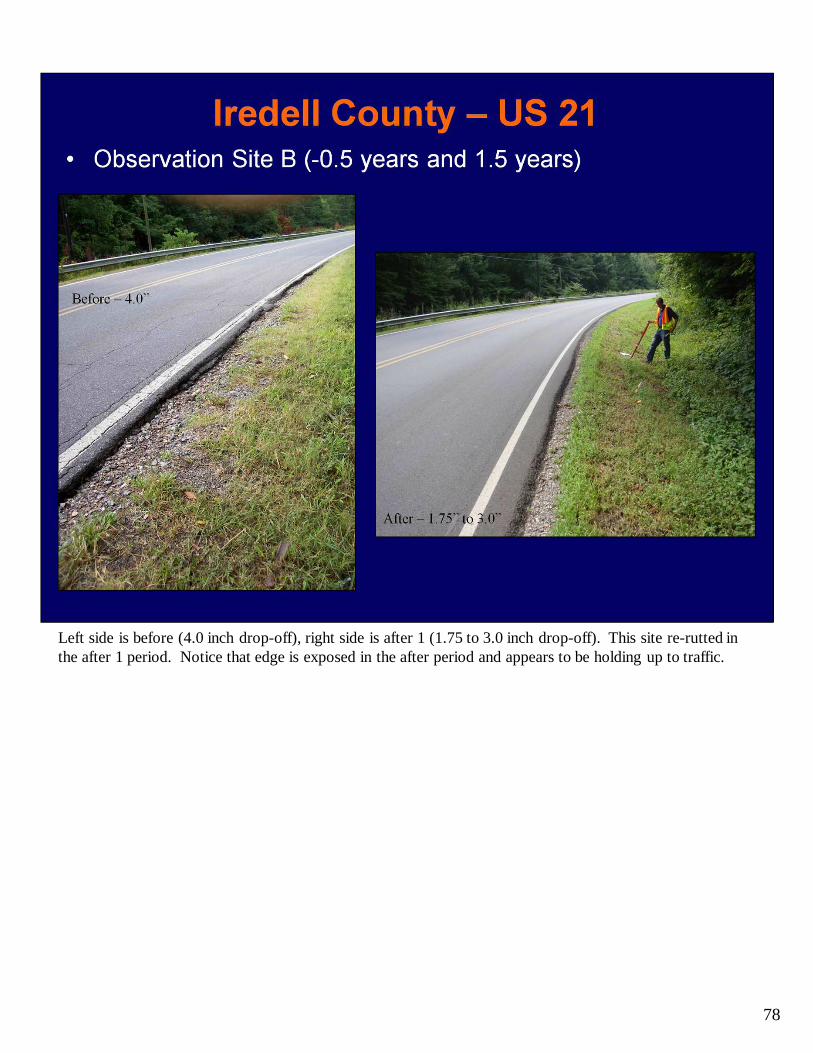
78
Left side is before (4.0 inch drop-off), right side is after 1 (1.75 to 3.0 inch drop-off). This site re-rutted in the after 1 period. Notice that edge is exposed in the after period and appears to be holding up to traffic.

79
Notice that edge is exposed in the after 2 period and appears to be holding up to traffic.
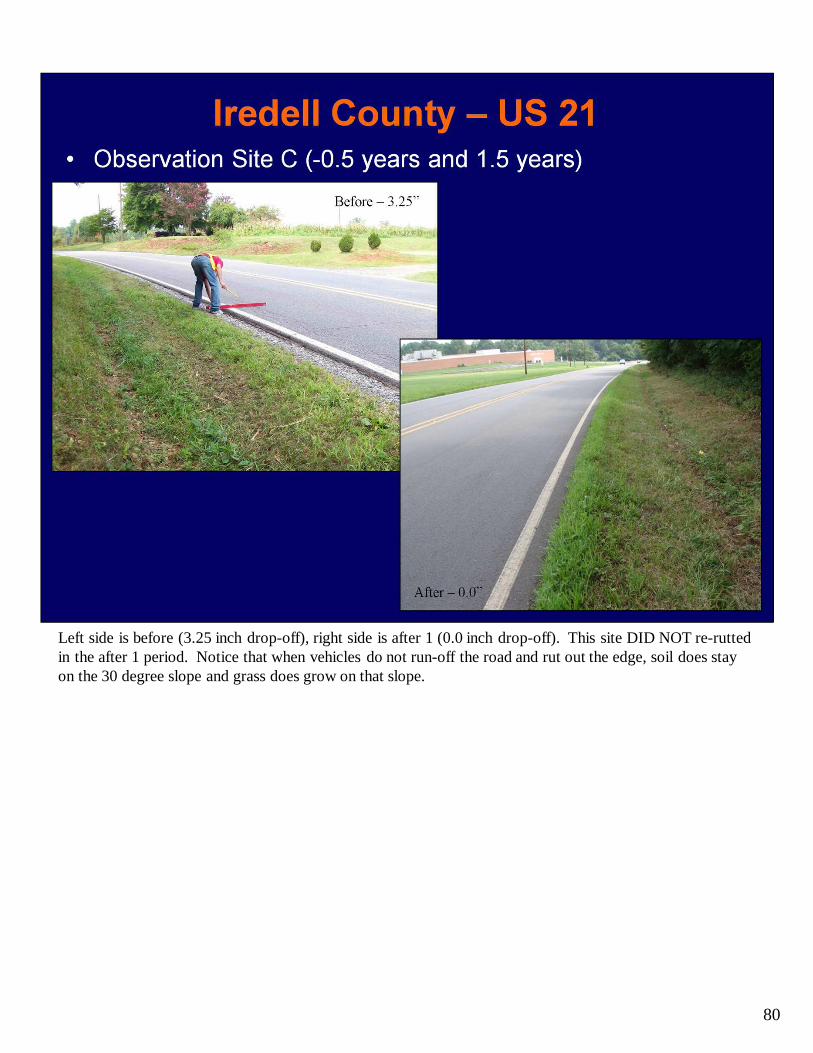
80
Left side is before (3.25 inch drop-off), right side is after 1 (0.0 inch drop-off). This site DID NOT re-rutted in the after 1 period. Notice that when vehicles do not run-off the road and rut out the edge, soil does stay on the 30 degree slope and grass does grow on that slope.
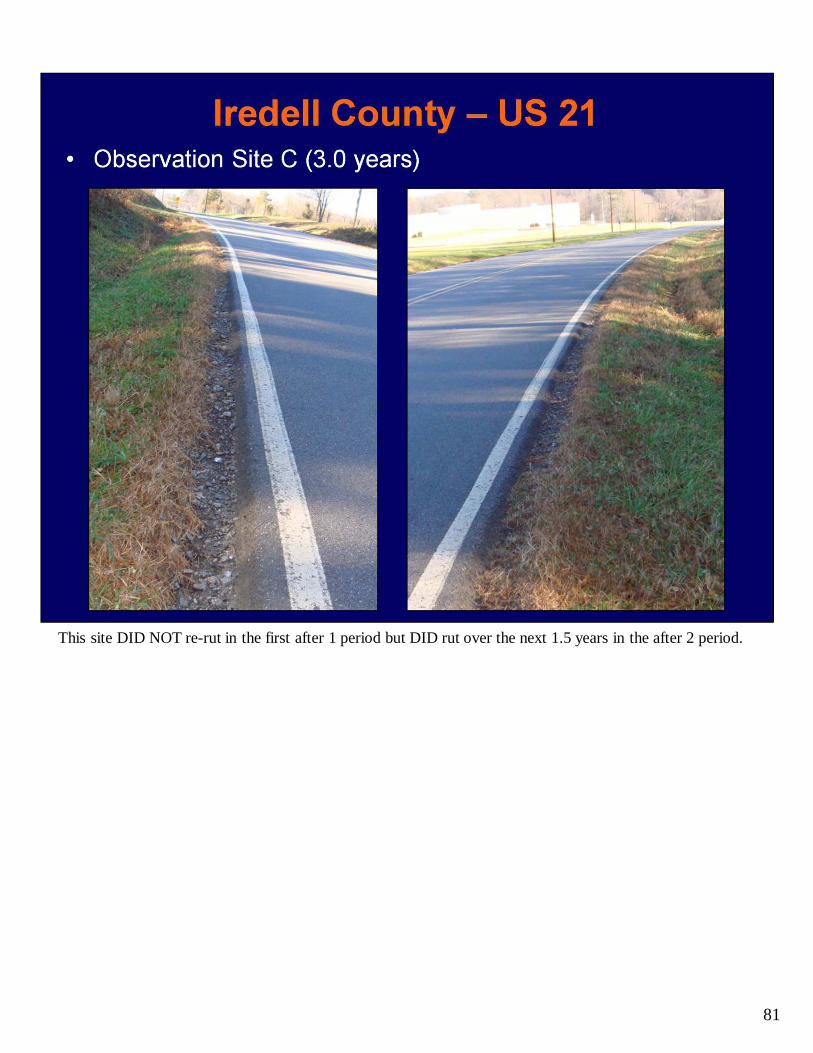
81
This site DID NOT re-rut in the first after 1 period but DID rut over the next 1.5 years in the after 2 period.
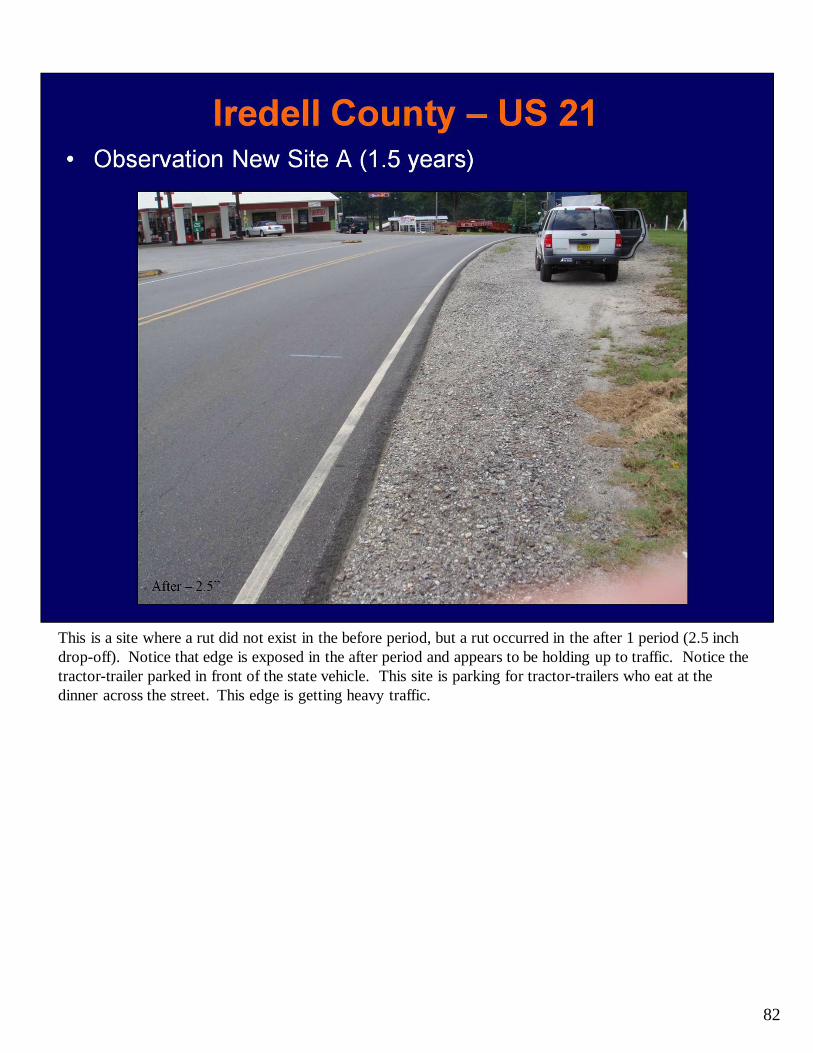
82
This is a site where a rut did not exist in the before period, but a rut occurred in the after 1 period (2.5 inch drop-off). Notice that edge is exposed in the after period and appears to be holding up to traffic. Notice the tractor-trailer parked in front of the state vehicle. This site is parking for tractor-trailers who eat at the dinner across the street. This edge is getting heavy traffic.

83
Notice that edge is exposed in the after 2 period and appears to be holding up to traffic.
84
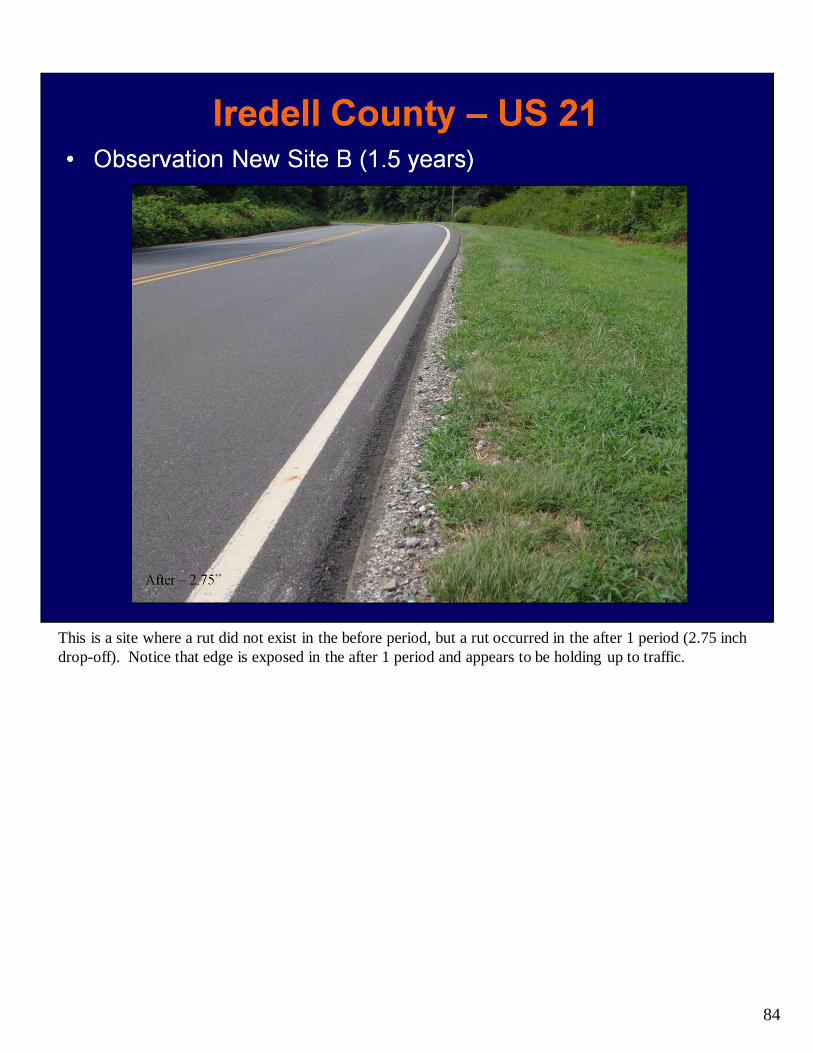
This is a site where a rut did not exist in the before period, but a rut occurred in the after 1 period (2.75 inch drop-off). Notice that edge is exposed in the after 1 period and appears to be holding up to traffic.
85
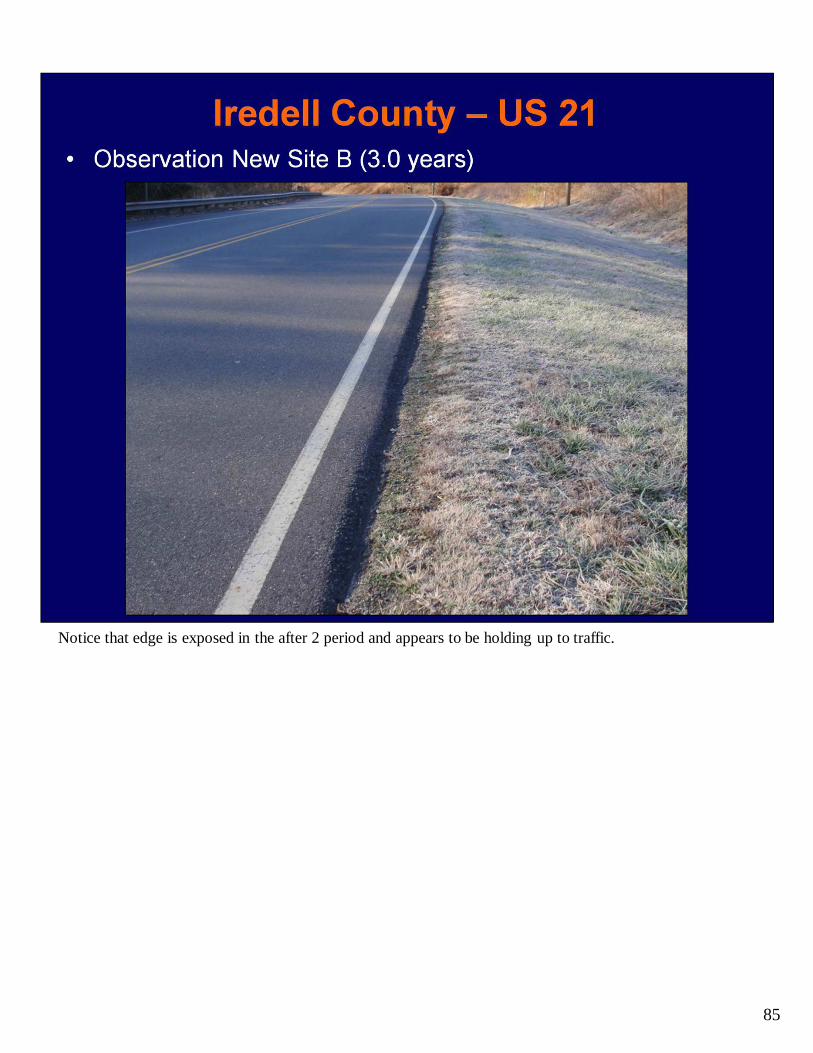
Notice that edge is exposed in the after 2 period and appears to be holding up to traffic.
86
Road Map
87
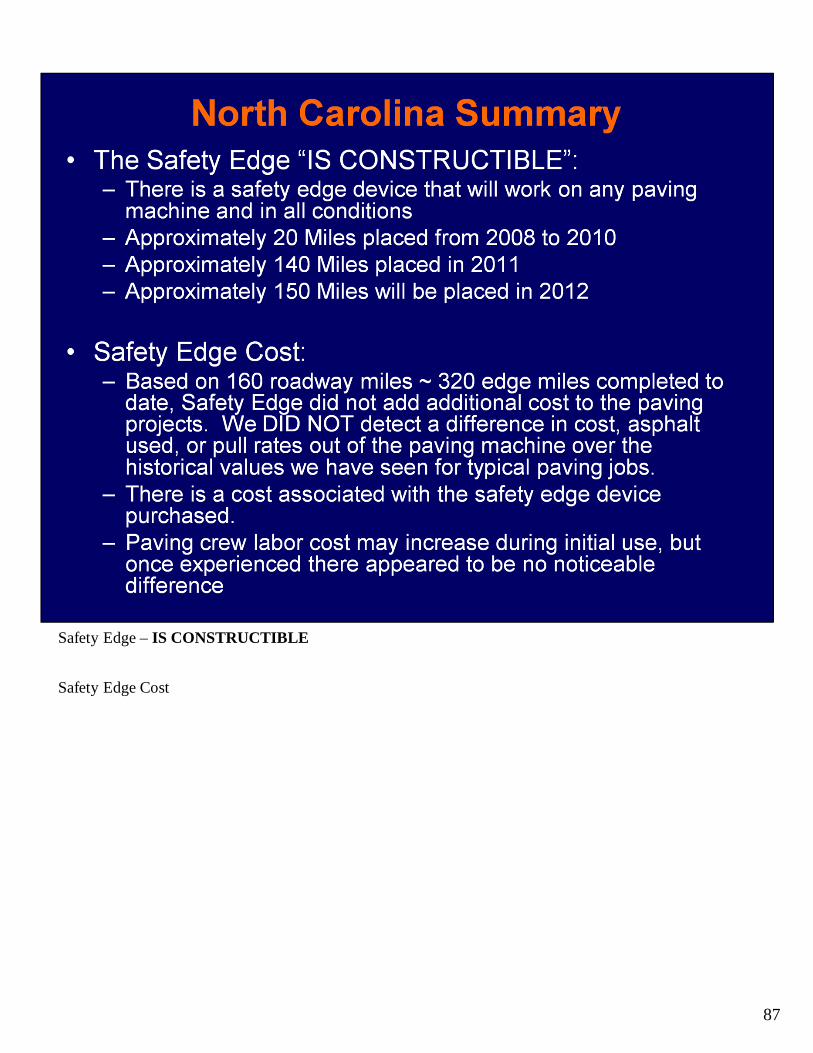
Safety Edge –IS CONSTRUCTIBLE
Safety Edge Cost
88
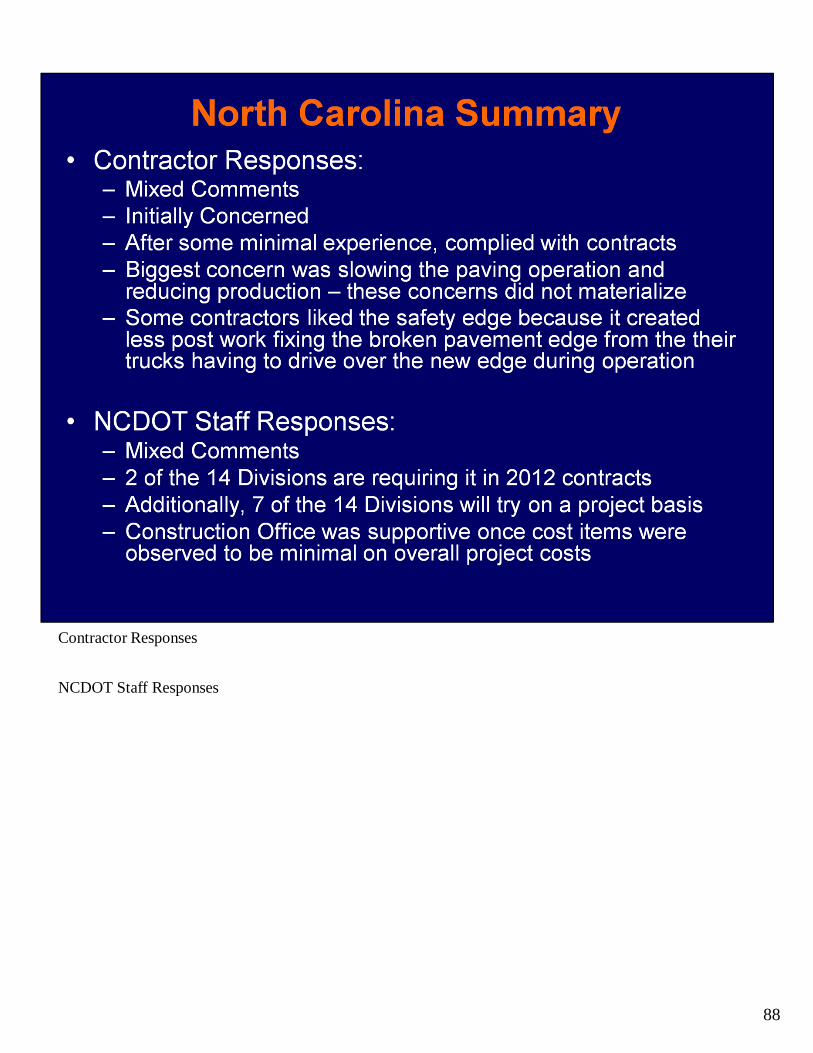
Contractor Responses
NCDOT Staff Responses
89
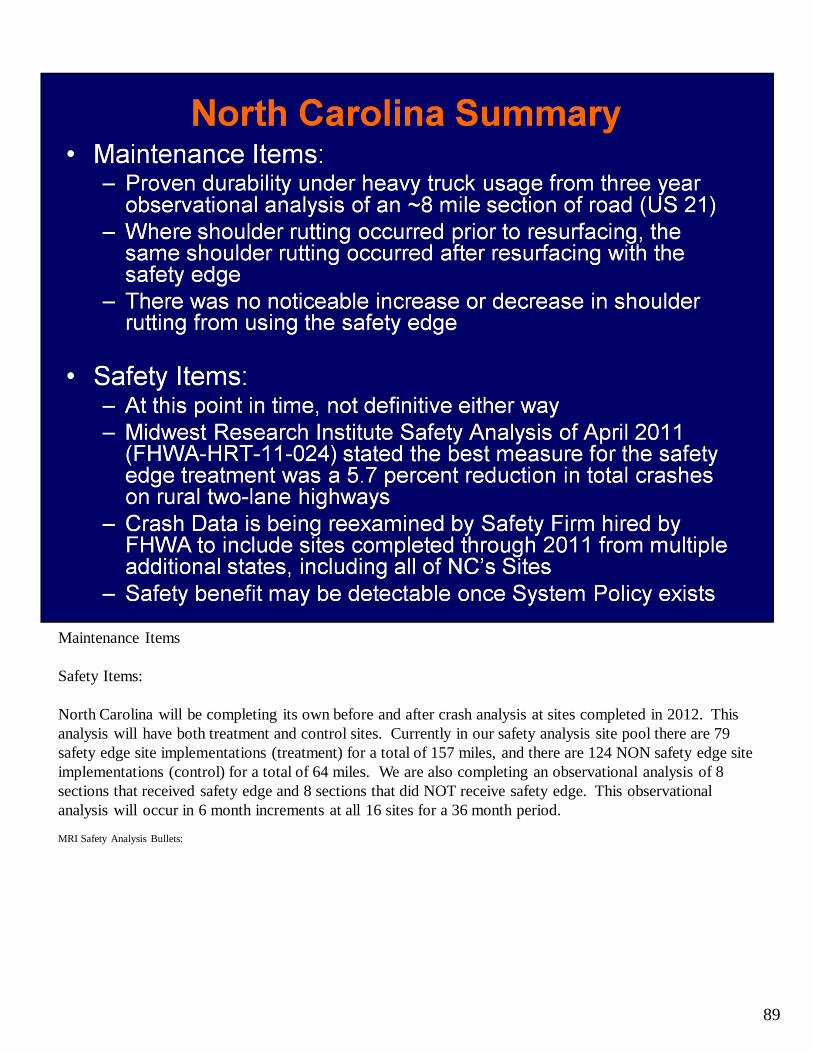
Maintenance Items
Safety Items:
North Carolina will be completing its own before and after crash analysis at sites completed in 2012. This analysis will have both treatment and control sites. Currently in our safety analysis site pool there are 79 safety edge site implementations (treatment) for a total of 157 miles, and there are 124 NON safety edge site implementations (control) for a total of 64 miles. We are also completing an observational analysis of 8 sections that received safety edge and 8 sections that did NOT receive safety edge. This observational analysis will occur in 6 month increments at all 16 sites for a 36 month period.
MRI Safety Analysis Bullets:
3 year analysis - Sites in Georgia, Indiana, and New York; Two-lane, paved shoulder – 42 sites, ~89 miles; Two-lane, unpaved shoulder – 38 sites, ~103 miles; Multi-lane, paved shoulder – 10 sites, ~19 milesTwo-lane sites indicate a best estimate of a 5 percent reduction in total crashes, not significant but positive directionResurfacing increases crashes for 12 to 30 months afterMany of the sites indicated that shoulders were not pulled upProportion of drop-off heights > 2” were no differentCost of edge per volume of asphalt used is $955 per mile on both sides of the roadwayTwo-lane, paved shoulder – B/C ratios were 7 to 86; Two-lane, unpaved shoulder – B/C ratios were 5 to 124
90
North Carolina – Overall Perspective
Copyright © 2022 FDOKUMEN

