


Bahasa
Halaman
Hukum

Commissioned by the Swedish Environmental Protection Agency
SMED Report No 75 2006
Revised Method for Estimating Emissions of
NMVOC from Solvent and Other Product Use in
Sweden
Tina Skårman, Helena Danielsson, Emma Henningsson,
IVL Swedish Environmental Research Institute
Margareta Östman, Swedish Chemicals Inspectorate, organisation
2006-01-26
Published at: www.smed.se
Publisher: Swedish Meteorological and Hydrological Institute
Address: SE-601 76 Norrköping, Sweden
Start year: 2006
ISSN: 1653-8102
SMED is short for Swedish Environmental Emissions Data, which is a collaboration between IVL
Swedish Environmental Research Institute, SCB Statistics Sweden, SLU Swedish University of
Agricultural Sciences, and SMHI Swedish Meteorological and Hydrological Institute. The work co-
operation within SMED commenced during 2001 with the long-term aim of acquiring and developing
expertise within emission statistics. Through a long-term contract for the Swedish Environmental
Protection Agency extending until 2014, SMED is heavily involved in all work related to Sweden's
international reporting obligations on emissions to air and water, waste and hazardous substances. A
central objective of the SMED collaboration is to develop and operate national emission databases and
offer related services to clients such as national, regional and local governmental authorities, air and
water quality management districts, as well as industry. For more information visit SMED's website
www.smed.se.
3
Summary
This report describes how a new method for estimating emissions of NMVOC and CO2
from CRF sector 3, Solvent and Other Products Use, has been developed. This
consumption-based method with a product related approach consists of two steps:
1. Data on amounts of solvents and solvent based products produced in, imported to or
used in Sweden, and exported from Sweden, was derived from the Swedish Product
Register at the Swedish Chemicals Inspectorate. The information was used for
generating quantity time series for emissions of NMVOC and C from activities
included in CRF sector 3.
2. Emission factors were established, considering emission reduction as well as
application techniques, and emission time series for NMVOC were calculated.
Knowledge of the carbon content of the individual NMVOCs was used for
calculation of CO2 emission time series.
This new Swedish method for estimating emissions of NMVOC and CO2 from Solvent
and Other Product Use is more transparent, complete and better adapted to its purposes
compared to previous methods. The design of the model makes it easy to adjust
emission factors and include new years in the time series, which facilitates consistent
annual updates of time series in the future.
Swedish Summary
I denna rapport beskrivs hur en ny metod for att uppskatta NMVOC och CO2
emissioner från CRF sektor 3 Lösningsmedel och annan produktanvändning har tagits
fram. Metoden baseras på produktanvändning och kan indelas i två steg:
1. Uppgifter om mängder lösningsmedel och produkter innehållande lösningsmedel
som produceras i, importeras till eller används i Sverige eller exporteras från
Sverige har hämtats från Kemikalieinspektionens Produktregister. Med dessa
uppgifter som grund skapades tidsserier över hanterad mängd NMVOC och C för
aktiviteter inom CRF sektor 3.
2. Emissionsfaktorer fastställdes, med hänsyn tagen till emissionsreducerande åtgärder
och produkternas användning och utnyttjades för att beräkna och skapa NMVOC-
tidsserier. Kunskap om kolinnehållet i ingående NMVOC användes för att beräkna
och skapa CO2 tidsserierna.
Den nya svenska metoden för emissionsuppskattningar av NMVOC och CO2 från
sektorn Lösningsmedel och annan produktanvändning är mer transparent, fullständig
och ändamålsenlig än tidigare använda metoder. Metoden gör det lätt att justera
emissionsfaktorer och infoga nya år till tidsserien vilket underlättar att konsistent
uppdatera tidsserierna framdeles.
4
Contents
SUMMARY ................................................................................................................................................. 3
SWEDISH SUMMARY ............................................................................................................................. 3
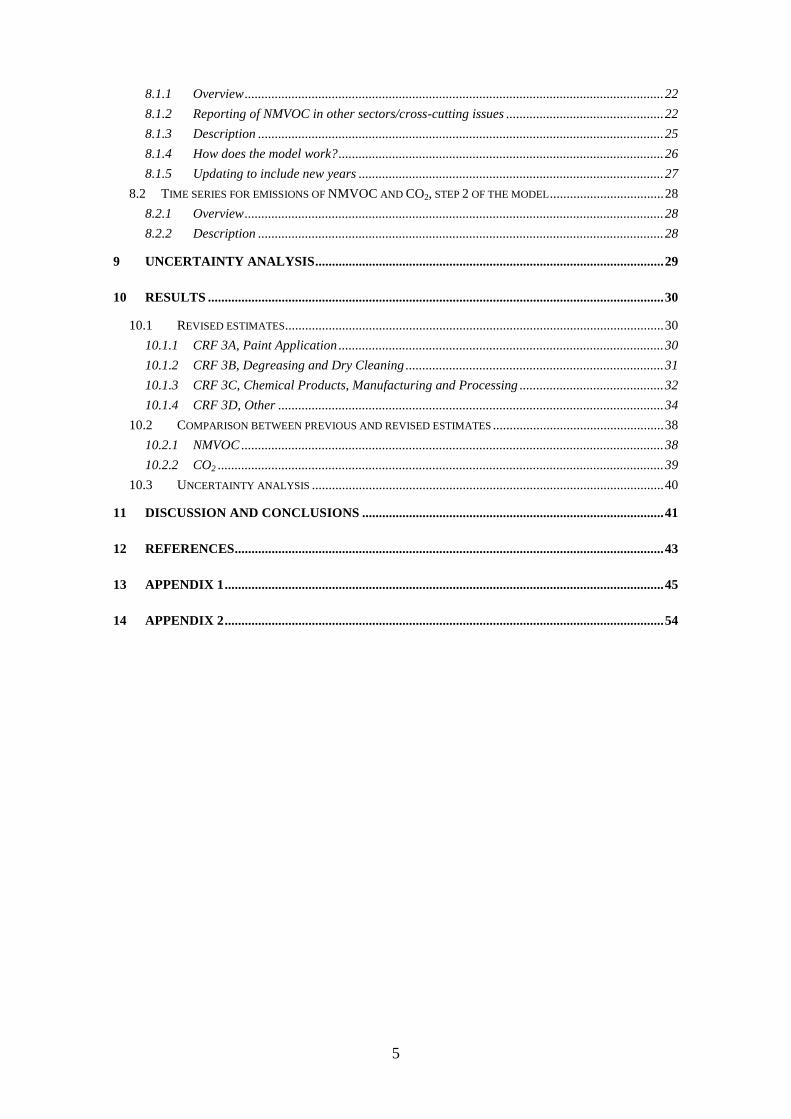
CONTENTS ................................................................................................................................................ 4
1 INTRODUCTION ............................................................................................................................ 6
1.1 BACKGROUND................................................................................................................................. 6
1.2 AIM OF PROJECT .............................................................................................................................. 7
2 INTERNATIONAL EMISSION REPORTING REQUIREMENTS AND GUIDELINES ....... 7
2.1 GENERAL REPORTING REQUIREMENTS AND GUIDELINES ................................................................. 7
2.2 SOLVENT AND OTHER PRODUCT USE, REPORTING SECTOR 3 .......................................................... 8
2.2.1 Revised 1996 IPCC Guidelines for National Greenhouse Gas Inventories .......................... 8
2.2.2 EMEP/CORINAIR Emission Inventory Guidebook ............................................................ 10
3 DEFINITION OF VOC .................................................................................................................. 11
3.1 EU-REGULATION .......................................................................................................................... 11
4 METHODS IN OTHER COUNTRIES ......................................................................................... 12
4.1 NORWEGIAN METHOD: .................................................................................................................. 12
4.2 DANISH METHOD........................................................................................................................... 13
4.3 GERMAN METHOD ......................................................................................................................... 14
5 THE SWEDISH PRODUCTS REGISTER .................................................................................. 14
5.1 CONTENT OF THE PRODUCTS REGISTER ........................................................................................ 15
5.2 INFORMATION OF PURCHASING INDUSTRIAL SECTOR .................................................................... 16
5.3 INFORMATION ON TYPE OF PRODUCT ............................................................................................ 16
5.4 INFORMATION ON CHEMICAL COMPOSITION .................................................................................. 16
6 EXTRACTS FROM THE PRODUCTS REGISTER .................................................................. 17
6.1 OVER THE YEARS .......................................................................................................................... 17
6.2 TYPE OF PRODUCT DATA ............................................................................................................... 18
6.3 COMPOSITION DATA ...................................................................................................................... 18
7 METHOD ........................................................................................................................................ 19
7.1 OVERVIEW .................................................................................................................................... 19
7.2 SUBSTANCES ................................................................................................................................. 20
7.3 ACTIVITY DATA ............................................................................................................................ 20
7.4 EMISSION FACTORS ....................................................................................................................... 21
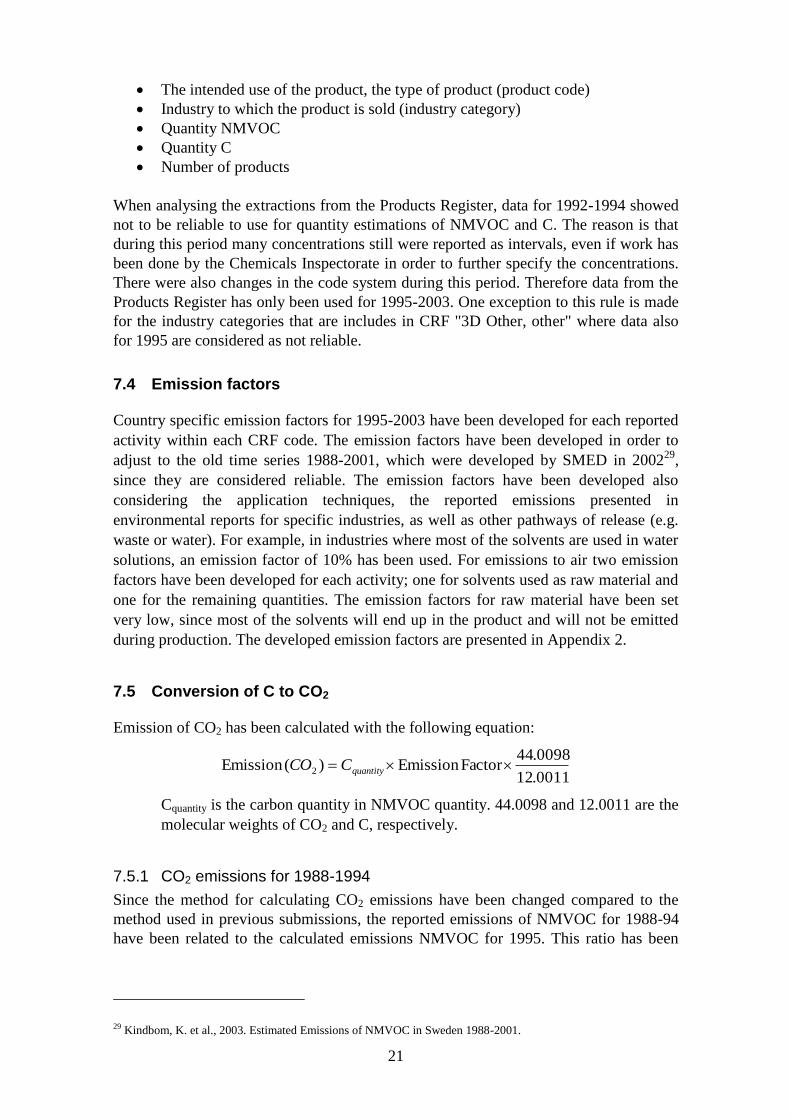
7.5 CONVERSION OF C TO CO2 ............................................................................................................ 21
7.5.1 CO2 emissions for 1988-1994 ............................................................................................. 21
8 THE EXCEL MODEL ................................................................................................................... 22
8.1 TIME SERIES FOR QUANTITIES OF NMVOC AND C, STEP 1 OF THE MODEL .................................... 22
5
8.1.1 Overview ............................................................................................................................. 22
8.1.2 Reporting of NMVOC in other sectors/cross-cutting issues ............................................... 22
8.1.3 Description ......................................................................................................................... 25
8.1.4 How does the model work? ................................................................................................. 26
8.1.5 Updating to include new years ........................................................................................... 27
8.2 TIME SERIES FOR EMISSIONS OF NMVOC AND CO2, STEP 2 OF THE MODEL .................................. 28
8.2.1 Overview ............................................................................................................................. 28
8.2.2 Description ......................................................................................................................... 28
9 UNCERTAINTY ANALYSIS ........................................................................................................ 29
10 RESULTS ........................................................................................................................................ 30
10.1 REVISED ESTIMATES................................................................................................................. 30
10.1.1 CRF 3A, Paint Application ................................................................................................. 30
10.1.2 CRF 3B, Degreasing and Dry Cleaning ............................................................................. 31
10.1.3 CRF 3C, Chemical Products, Manufacturing and Processing ........................................... 32
10.1.4 CRF 3D, Other ................................................................................................................... 34
10.2 COMPARISON BETWEEN PREVIOUS AND REVISED ESTIMATES ................................................... 38
10.2.1 NMVOC .............................................................................................................................. 38
10.2.2 CO2 ..................................................................................................................................... 39
10.3 UNCERTAINTY ANALYSIS ......................................................................................................... 40
11 DISCUSSION AND CONCLUSIONS .......................................................................................... 41
12 REFERENCES ................................................................................................................................ 43
13 APPENDIX 1 ................................................................................................................................... 45
14 APPENDIX 2 ................................................................................................................................... 54
6
1 Introduction
1.1 Background
On a yearly basis Sweden is obliged to report national air emissions of several
pollutants to UNFCCC (United Nations Framework Convention on Climate Change),
the European Union’s Mechanism for Monitoring Community Greenhouse Gas
Emissions and for Implementing the Kyoto Protocol, CLRTAP (Convention of Long-
range Transboundary Air Pollutants, and the EU NEC Directive (National Emissions
Ceilings).
Reporting follows the revised 1996 IPCC (Intergovernmental Panel on Climate Change)
Guidelines for National Greenhouse Gas Inventories1 (IPCC Guidelines), IPCC Good
Practice Guidance and Uncertainty Management in National Greenhouse Gas
Inventories2 (IPCC Good Practice Guidance), UNFCCC reporting guidelines on annual
inventories3 (FCCC/CP/2002/8) and CORINAIR / EMEP guidelines
4.
The base year for reporting NMVOC, according to the 1991 Geneva Protocol on the
Control of Emissions of Volatile Organic Compounds5, is 1988 for Sweden. Hence, the
first year in the time series presented in this report is 1988.
During 2002, a SMED study was carried out6, aiming at compiling time series of
emissions of NMVOC in Sweden for all sectors included in the international reporting.
In this study the estimated emissions of NMVOC from the sector Solvent and Other
Product Use was based on information from various sources. For example data reported
in companies environmental reports, data from the Products Register at the Swedish
Chemicals Inspectorate, as well as information from experts or trade organisations is
included. The major part of the estimated emissions is however based on earlier national
reports, investigations and estimations of national NMVOC emissions. The time series
for the sector Solvent and Other Product Use presented in the SMED report of 2002 are
still to be considered as reliable. One of the main conclusions in the study of 2002 was
that emissions from the sector Solvent and Other Product Use needed further attention,
primarily concerning developing methods and finding sources of background data, in
order to facilitate and make it possible to perform consistent annual updates of national
emission data in the future.
1IPCC (1997). Revised 1996 IPCC Guidelines for National Greenhouse Gas Inventories.
2 IPCC (2000). IPCC Good Practice Guidance and Uncertainty Management in National Greenhouse Gas Inventories.
3 FCCC/CP/2002/8 (28 March 2003). Review of the implementation of commitments and of other provisions of the
convention. National communications: greenhouse gas inventories from parties included in annex 1 to the convention
UNFCCC guidelines on reporting and review. 4 EEA (2004). EMEP/CORINAIR Emission Inventory Guidebook - 3rd edition September 2004 UPDATE. EEA
Technical report No 30. http://reports.eea.eu.int/EMEPCORINAIR4/en
5 UNECE (1991). Convention on Long-range Transboundary Air Pollution, Protocol on the Control of Emissions of
Volatile Organic Compounds. http://www.unece.org/env/lrtap/vola_h1.htm
6 Kindbom, K. et al., 2003. Estimated Emissions of NMVOC in Sweden 1988-2001.
7
1.2 Aim of project
The aim of the present project was to develop a method and a model for annual
calculations of emissions of NMVOC from reporting sector 3, Solvent and Other
Product Use, which fulfils the requirements according to IPCC and UNECE guidelines
as well as to CORINAIR / EMEP guidelines. The model should be based on data from
the Products Register at the Swedish Chemicals Inspectorate.
2 International emission reporting requirements and guidelines
2.1 General reporting requirements and guidelines
On a yearly basis Sweden is obliged to report national air emissions of several
pollutants to several international bodies:
UNFCCC (United Nations Framework Convention on Climate Change). Reporting
according to IPCC (Intergovernmental Panel on Climate Change) guidelines7.
Reporting follows revised 1996 IPCC (Intergovernmental Panel on Climate Change)
Guidelines for National Greenhouse gas Inventories (IPCC Guidelines), IPCC Good
Practice Guidance and Uncertainty Management in National Greenhouse gas
inventories (IPCC Good Practice Guidance)8, and UNFCCC Reporting Guidelines
on annual inventories (FCCC/CP/2002/8)9.
European Union’s Mechanism for Monitoring Community greenhouse gas
emissions and for implementing the Kyoto Protocol. Reporting follows IPCC
guidelines (see above).
CLRTAP (United Nation’s Convention on Long-Range Transboundary Air
Pollution) which follows CORINAIR / EMEP guidelines10
.
Directive 2001/81/EC on national emission ceilings for certain atmospheric
pollutants which follows CORINAIR / EMEP guidelines10
.
7 IPCC (1997). Revised 1996 IPCC Guidelines for National Greenhouse Gas Inventories.
8 IPCC (2000). IPCC Good Practice Guidance and Uncertainty Management in National Greenhouse Gas Inventories.
9 FCCC/CP/2002/8 (28 March 2003). Review of the implementation of commitments and of other provisions of the
convention. National communications: greenhouse gas inventories from parties included in annex 1 to the convention
UNFCCC guidelines on reporting and review.
10 EEA (2004). EMEP/CORINAIR Emission Inventory Guidebook - 3rd edition September 2004 UPDATE. EEA
Technical report No 30. http://reports.eea.eu.int/EMEPCORINAIR4/en
8
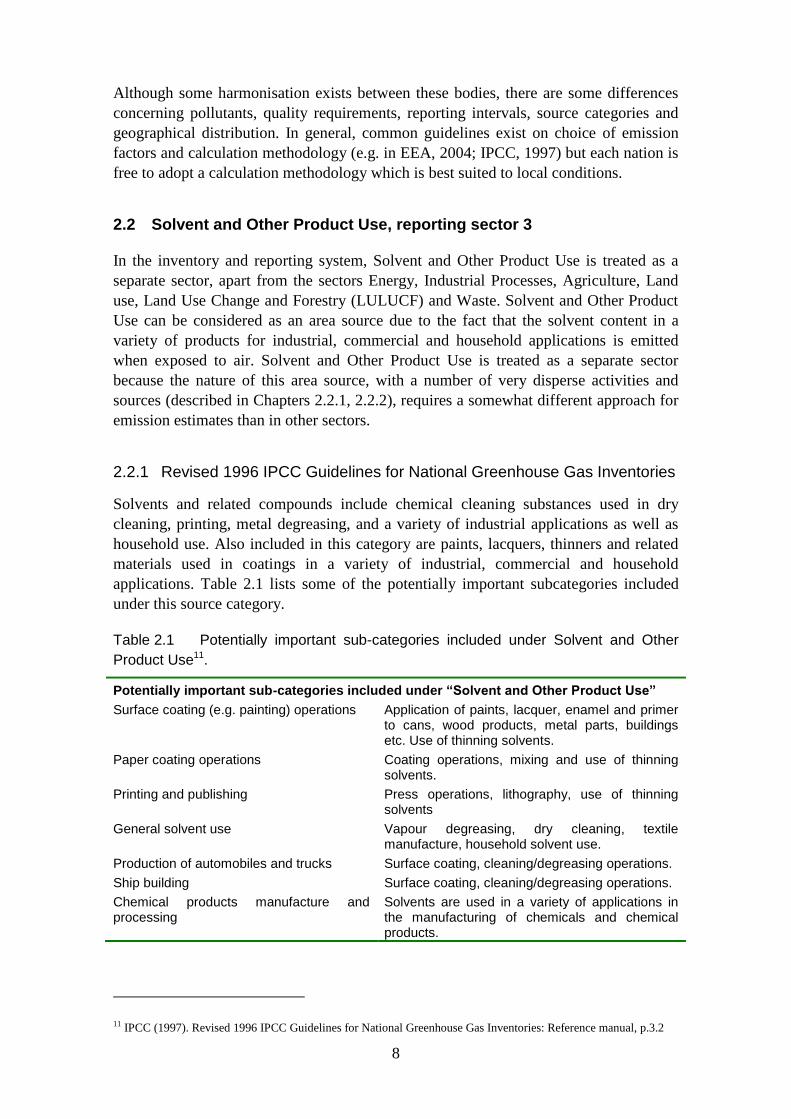
Although some harmonisation exists between these bodies, there are some differences
concerning pollutants, quality requirements, reporting intervals, source categories and
geographical distribution. In general, common guidelines exist on choice of emission
factors and calculation methodology (e.g. in EEA, 2004; IPCC, 1997) but each nation is
free to adopt a calculation methodology which is best suited to local conditions.
2.2 Solvent and Other Product Use, reporting sector 3
In the inventory and reporting system, Solvent and Other Product Use is treated as a
separate sector, apart from the sectors Energy, Industrial Processes, Agriculture, Land
use, Land Use Change and Forestry (LULUCF) and Waste. Solvent and Other Product
Use can be considered as an area source due to the fact that the solvent content in a
variety of products for industrial, commercial and household applications is emitted
when exposed to air. Solvent and Other Product Use is treated as a separate sector
because the nature of this area source, with a number of very disperse activities and
sources (described in Chapters 2.2.1, 2.2.2), requires a somewhat different approach for
emission estimates than in other sectors.
2.2.1 Revised 1996 IPCC Guidelines for National Greenhouse Gas Inventories
Solvents and related compounds include chemical cleaning substances used in dry
cleaning, printing, metal degreasing, and a variety of industrial applications as well as
household use. Also included in this category are paints, lacquers, thinners and related
materials used in coatings in a variety of industrial, commercial and household
applications. Table 2.1 lists some of the potentially important subcategories included
under this source category.
Table 2.1 Potentially important sub-categories included under Solvent and Other
Product Use11.
Potentially important sub-categories included under “Solvent and Other Product Use”
Surface coating (e.g. painting) operations Application of paints, lacquer, enamel and primer to cans, wood products, metal parts, buildings etc. Use of thinning solvents.
Paper coating operations Coating operations, mixing and use of thinning solvents.
Printing and publishing Press operations, lithography, use of thinning solvents
General solvent use Vapour degreasing, dry cleaning, textile manufacture, household solvent use.
Production of automobiles and trucks Surface coating, cleaning/degreasing operations.
Ship building Surface coating, cleaning/degreasing operations.
Chemical products manufacture and processing
Solvents are used in a variety of applications in the manufacturing of chemicals and chemical products.
11 IPCC (1997). Revised 1996 IPCC Guidelines for National Greenhouse Gas Inventories: Reference manual, p.3.2
9
In the IPCC Guidelines12
there are two basic approaches to emission estimations from
Solvent and Other Product Use, depending on the availability of data on the activities
producing emissions and the emission factors. The approaches are:
1) Production-based - In some cases, solvent or coating use is associated with
centralised industrial production activities, such as automobile and ship production,
textile manufacture, paper coating, chemical products manufacture, etc. In these cases it
is generally possible to develop NMVOC emission factors based on unit of product
output. These are based on the amount of paint, solvents, or other chemically volatile
compounds consumed per unit of the final products. Once reasonable factors are
developed it is straightforward to estimate annual emissions based on production data,
which is generally available on an annual basis for most countries. Industrial production
data is also compiled and published by international organisations (e.g., United Nations,
1992), and these data can be used as supplement to locally available data.
2) Consumption-based - In many applications of paints, solvents and similar products,
the end uses are too small-scale, diverse, and dispersed to be tracked directly. Therefore
emissions estimates are generally based on total consumption (i.e. sales) of the solvents,
paints, etc., used in these applications. The assumption is that once these products are
sold to end users, they are applied and emissions occur relatively rapidly. For most
surface coating and general solvent use, this approach is used. Emission factors are
developed based on the likely ultimate release of NMVOC to the atmosphere per unit of
product consumed. These emission factors can then be applied to sales data for specific
solvent or paint products.
2.2.1.1 Indirect emissions of CO2 from atmospheric oxidation of NMVOC
According to UNFCCC Reporting Guidelines on annual inventories13
, indirect
emissions of CO2 from atmospheric oxidation of emitted NMVOC shall also be
accounted for.
Indirect emissions of CO2 from emissions of NMVOC in sector 3, Solvent and Other
Product Use, should be accounted for by assuming that the carbon share in emitted
NMVOC is 85%14
according to the following equation:
12
44)(Emission )(Emission 2 NMVOCCCO content
Ccontent is the carbon content of the solvents and is set by default to 0.85. The user can
modify the default value of Ccontent. The numbers 44 and 12 represents the molecular
weights of CO2 and C respectively.
12 IPCC (1997). Revised 1996 IPCC Guidelines for National Greenhouse Gas Inventories: Reference manual, p.3.2
13 FCCC/CP/2002/8 (28 March 2003). Review of the implementation of commitments and of other provisions of the
convention. National communications: greenhouse gas inventories from parties included in annex 1 to the convention
UNFCCC guidelines on reporting and review. pp 46-47
14 Pulles, T., Skákala, J., Svetlik, J. 1999. ReportER, User manual. Technical report No 32 European Environment
Agency.
10
As pointed out in the second-order 2006 Draft IPCC Guidelines for National
Greenhouse Gas Inventories15
, the carbon content in the NMVOC emissions from
solvent use can be based on a speciation profile of these emissions, and the weighted
average carbon content of the individual chemical species. If information on the
speciation profile is not available, a default average carbon content of 60% by mass may
be used. The default value has thereby been changed from 85% to 60% in the second-
order 2006 Draft guidelines.
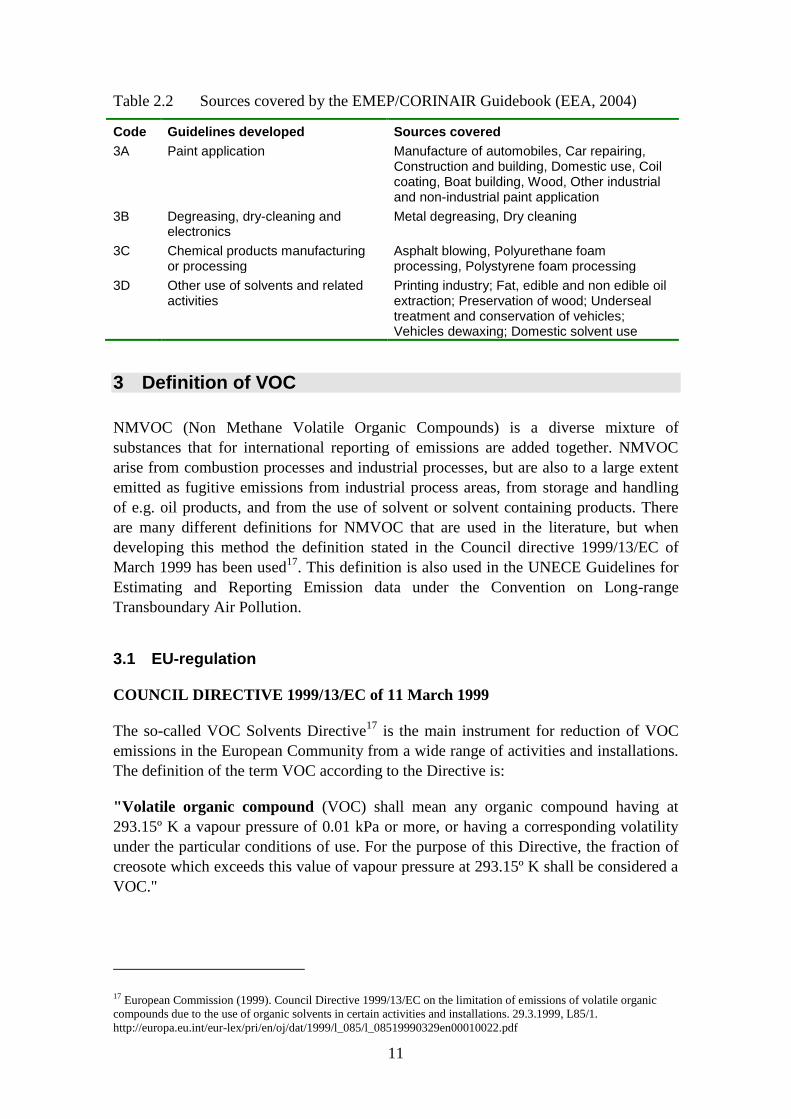
2.2.2 EMEP/CORINAIR Emission Inventory Guidebook
EMEP/CORINAIR Emission Inventory Guidebook (EEA, 2004) contains a general
chapter with background information and guidelines for one simple and one more
detailed methodology for estimating the overall solvent use in a country (Chapter B600
and B600a)16
.
The simple methodology for calculating NMVOC emissions from solvent use is based
on per capita data for several source categories given in the guidelines. All relevant
source categories that together contribute to more than 90% of the total NMVOC
emission needs to be inventoried.
The detailed methodology is based on a mass balance per solvent. In the method all
relevant solvents used or products consumed need to be inventoried, at least those
together representing more than 90% of the total NMVOC emission. It is also, for the
detailed methodology, pointed out that it is important not to double-count NMVOC
compounds in making a solvent mass balance, and also that a decision has to be made
whether to base the calculations on groups of NMVOC components, e.g. alkanes,
chlorinated hydrocarbons etc, or on individual compounds.
A more specific methodology for each source category, with developed guidelines, is
given in the chapters B610-64116
in the guidelines. To get data for each source category
it is necessary to collect all relevant consumption data. This approach is used in most of
the chapters with specific guidance according to Table 2.2.
15 IPPC (2006). Second order Draft of 2006 Guidelines (unpublished).
16 EEA (2004). EMEP/CORINAIR Emission Inventory Guidebook - 3rd edition September 2004 UPDATE. EEA
Technical report No 30. http://reports.eea.eu.int/EMEPCORINAIR4/en/group_06.pdf
11
Table 2.2 Sources covered by the EMEP/CORINAIR Guidebook (EEA, 2004)
Code Guidelines developed Sources covered
3A Paint application Manufacture of automobiles, Car repairing, Construction and building, Domestic use, Coil coating, Boat building, Wood, Other industrial and non-industrial paint application
3B Degreasing, dry-cleaning and electronics
Metal degreasing, Dry cleaning
3C Chemical products manufacturing or processing
Asphalt blowing, Polyurethane foam processing, Polystyrene foam processing
3D Other use of solvents and related activities
Printing industry; Fat, edible and non edible oil extraction; Preservation of wood; Underseal treatment and conservation of vehicles; Vehicles dewaxing; Domestic solvent use
3 Definition of VOC
NMVOC (Non Methane Volatile Organic Compounds) is a diverse mixture of
substances that for international reporting of emissions are added together. NMVOC
arise from combustion processes and industrial processes, but are also to a large extent
emitted as fugitive emissions from industrial process areas, from storage and handling
of e.g. oil products, and from the use of solvent or solvent containing products. There
are many different definitions for NMVOC that are used in the literature, but when
developing this method the definition stated in the Council directive 1999/13/EC of
March 1999 has been used17
. This definition is also used in the UNECE Guidelines for
Estimating and Reporting Emission data under the Convention on Long-range
Transboundary Air Pollution.
3.1 EU-regulation
COUNCIL DIRECTIVE 1999/13/EC of 11 March 1999
The so-called VOC Solvents Directive17
is the main instrument for reduction of VOC
emissions in the European Community from a wide range of activities and installations.
The definition of the term VOC according to the Directive is:
"Volatile organic compound (VOC) shall mean any organic compound having at
293.15º K a vapour pressure of 0.01 kPa or more, or having a corresponding volatility
under the particular conditions of use. For the purpose of this Directive, the fraction of
creosote which exceeds this value of vapour pressure at 293.15º K shall be considered a
VOC."
17 European Commission (1999). Council Directive 1999/13/EC on the limitation of emissions of volatile organic
compounds due to the use of organic solvents in certain activities and installations. 29.3.1999, L85/1.
http://europa.eu.int/eur-lex/pri/en/oj/dat/1999/l_085/l_08519990329en00010022.pdf
12
"Organic compound shall mean any compound containing at least the element carbon
and one or more of hydrogen, halogens, oxygen, sulphur, phosphorus, silicon or
nitrogen, with the exception of carbon oxides and inorganic carbonates and
bicarbonates."
4 Methods in other countries
Norway, Denmark and Germany have all developed consumption-based methods and
models for handling emissions from Solvent and Other Product Use. The Norwegian
and Danish methods have both a solvent balance approach, while the German method is
product related.
4.1 Norwegian method:
The Norwegian method18
was developed in 1994 and uses a solvent balance approach
when estimating emissions of NMVOC from Solvent and Other Product Use. The
solvent balance is defined as:
Emission = (production + import - export - destruction - feedstock) * solvent content *
fraction emitted + emissions from certain industrial processes
Certain industrial processes = emissions from production processes where solvents are
used as feedstock or in industries where the emissions originating from solvent are well
known.
The solvent balance is based on the commodities in the foreign trade and production
statistics that are either pure solvents or products containing solvents. The needed data
is summarised in Table 4.1.
18 Rypdal, K. (1995). Løsemiddelbalanse for Norge. Utslipp, förbruk og metode, Statens
Forurensningstillsyn, SFT Rapport 95:02. ISBN 82-7655-271-4.
13
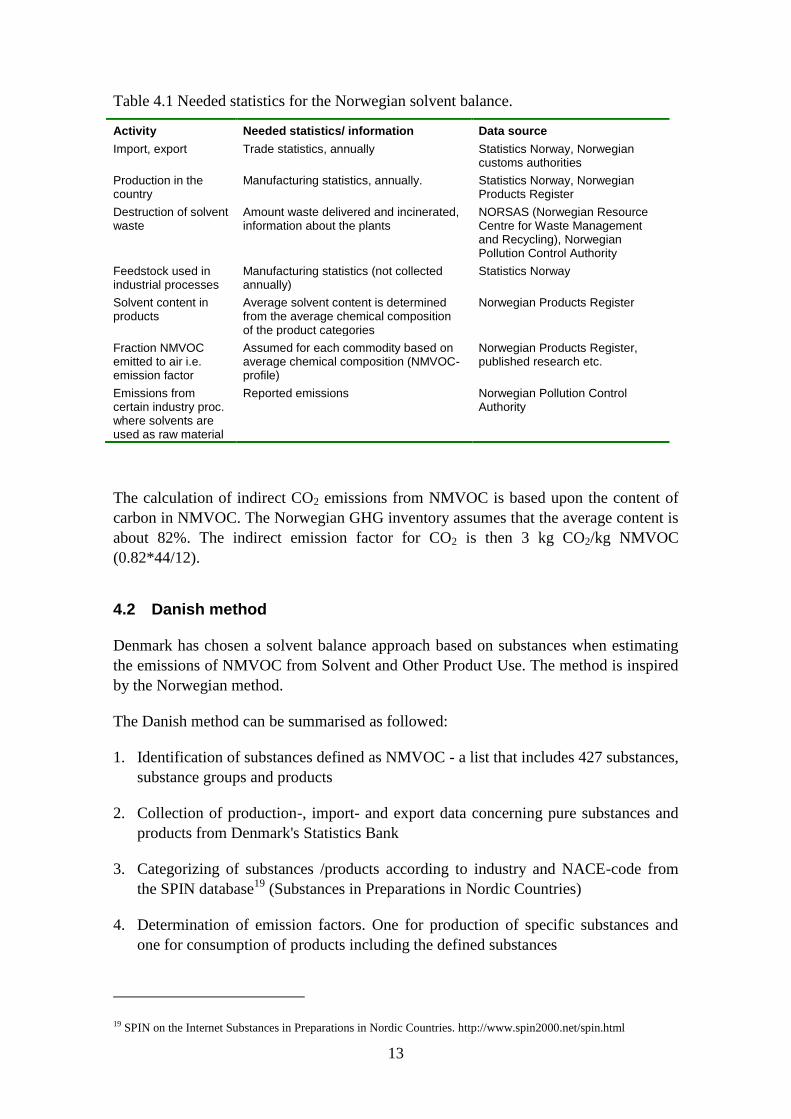
Table 4.1 Needed statistics for the Norwegian solvent balance.
Activity Needed statistics/ information Data source
Import, export Trade statistics, annually Statistics Norway, Norwegian customs authorities
Production in the country
Manufacturing statistics, annually. Statistics Norway, Norwegian Products Register
Destruction of solvent waste
Amount waste delivered and incinerated, information about the plants
NORSAS (Norwegian Resource Centre for Waste Management and Recycling), Norwegian Pollution Control Authority
Feedstock used in industrial processes
Manufacturing statistics (not collected annually)
Statistics Norway
Solvent content in products
Average solvent content is determined from the average chemical composition of the product categories
Norwegian Products Register
Fraction NMVOC emitted to air i.e. emission factor
Assumed for each commodity based on average chemical composition (NMVOC-profile)
Norwegian Products Register, published research etc.
Emissions from certain industry proc. where solvents are used as raw material
Reported emissions Norwegian Pollution Control Authority
The calculation of indirect CO2 emissions from NMVOC is based upon the content of
carbon in NMVOC. The Norwegian GHG inventory assumes that the average content is
about 82%. The indirect emission factor for CO2 is then 3 kg CO2/kg NMVOC
(0.82*44/12).
4.2 Danish method
Denmark has chosen a solvent balance approach based on substances when estimating
the emissions of NMVOC from Solvent and Other Product Use. The method is inspired
by the Norwegian method.
The Danish method can be summarised as followed:
1. Identification of substances defined as NMVOC - a list that includes 427 substances,
substance groups and products
2. Collection of production-, import- and export data concerning pure substances and
products from Denmark's Statistics Bank
3. Categorizing of substances /products according to industry and NACE-code from
the SPIN database19
(Substances in Preparations in Nordic Countries)
4. Determination of emission factors. One for production of specific substances and
one for consumption of products including the defined substances
19 SPIN on the Internet Substances in Preparations in Nordic Countries. http://www.spin2000.net/spin.html
14
4.3 German method
In Germany they use a consumption-based method with a product related approach20
when calculating emissions of NMVOC from Solvent and Other Product Use. In the
method they use the NMVOC definition stated in the Council directive 1999/13/EC of
March 199921
(se section 3.1). The German method includes the following steps:
1. The use of solvents and solvent based products are derived from production
statistics and foreign trade statistics (production + import - export).
2. The use of the solvents and solvent based products in each specific industrial and
commercial sector and in households are estimated.
3. The emission factors are developed in consideration of application techniques,
emission control measure and other pathways of NMVOC release (e.g. waste, water,
recycling).
5 The Swedish Products Register
In the Swedish Products Register, chemical products imported to or manufactured in
Sweden are registered. It was launched in 1978 and in the beginning it contained only
names of companies and products. It has been extended over the years and the latest
more extensive change in the registration rules was done in 1992. In the beginning the
Products Register was associated with the then existing Produktkontrollbyrån, and since
1986 the register is handled by the Swedish Chemicals Inspectorate.
In chapter 14 §10 in the Environmental Code22
the existence of a register for the
chemical products that professionally are brought to or manufactured in Sweden is
fixed. In the Ordinance of chemical products and biotechnical organisms (1998:941)23
,
§ 10-12, the Swedish Chemicals Inspectorate is appointed the authority to keep the
register. All products, imported or manufactured, in volumes exceeding 100 kg during a
year and included in the annex to the ordinance23
, are obliged to be registered. The
products in the annex are specified by their statistical customs number according to the
CN (Combined Nomenclature). It encompasses many hundred types of products, most
of them also intuitively included in the term “Chemical products” by the public. Where
there is disagreement whether a product belongs to a type of products that has to be
registered or not, guidance can be received from the Customs Authority.
20 Theloke, J., Friedrich, R. (2003). Development of an improved product based approach for the calculation of
NMVOC emissions from solvent use in Germany and uncertainty analysis. Paper presented at the 12th International
Emission Inventory Conference "Emission Inventories - Applying New Technologies," San Diego, April 29 - May 1,
2003. www.epa.gov/ttn/chief/conference/ei12/area/theloke.pdf
21 European Commission (1999). Council Directive 1999/13/EC on the limitation of emissions of volatile organic
compounds due to the use of organic solvents in certain activities and installations. 29.3.1999, L85/1.
http://europa.eu.int/eur-lex/pri/en/oj/dat/1999/l_085/l_08519990329en00010022.pdf
22 In Swedish: Miljöbalk, (SFS 1998:808),. 14 kap 10 §. http://www.notisum.se/rnp/sls/lag/19980808.HTM
23 In Swedish: Förordning (SFS 1998:941) om kemiska produkter och biotekniska organismer, 10-12§
http://www.notisum.se/rnp/sls/lag/19980941.htm
15
5.1 Content of the Products Register
Information that shall be included in the Products Register is stated in the Swedish
Chemicals Inspectorate Regulation (KIFS 1998:8)24
, chapter 7. The products shall at the
latest be reported before the end of February the year after import or manufacture was
started. Also products brought on the Swedish market to be sold under a new brand
name have to be registered. The intention is that all product names of chemical products
on the Swedish market are included in the Products Register.
The following information shall be reported:
Registering company
Name of the product
The statistical customs number of the product
Whether the product is imported, manufactured or/and has changed market name
The registration number of an approved pesticide
If the product is intended to be sold to consumers
The quantity imported or manufactured last year
Industrial sectors to which the product is sold
The intended use of the product, the type of product
The labelling regarding health and environmental danger, if applicable
Risk phrases if the product can be carcinogenic, allergenic or toxic to reproduction
The chemical composition with exact names and concentrations
Each year a form, including the information above, is sent to the company to be
completed with last year’s quantities and any other changes in name or market
information. As the reporting is mandatory an annual update of the quantities is thus
achieved.
24 In Swedish: Kemikalieinspektionens föreskrifter (KIFS 1998:8) om kemiska produkter och biotekniska
organismer; 7 kap. Anmälan till produktregistret, ISSN 0283-1937.
http://www.kemi.se/upload/Lagar%20m.m/KIFS/K98_8.pdf
16
5.2 Information of purchasing industrial sector
The reporting company shall state to which industrial sectors the product is sold. If a
company imports a product to be used within its own production, the industrial category
shall be reported. The industrial categories are stated by use of SNI code, the Swedish
Standard Industrial Classification based on the international NACE nomenclature for
economic activities. In the Products Register not all industrial sectors in SNI are used.
Some industrial sectors are to be stated on a very high level e.g. the Construction sector.
The grouping of industrial categories has changed during the years: Some categories
have been split and others have disappeared, and for some years both the overall
industrial category and one or several of its included under-categories have been
possible to report.
Maximum three industrial categories can be reported as purchasing the product. If the
product has a statistical customs number beginning with 28 or 29 the percentage sold to
each of the three shall be stated. Also exported percentage shall be reported. The
percentage can be stated for other products than the mandatory as well, but if this is not
done the quantities are distributed arithmetically when summations are done.
5.3 Information on type of product
Liable to register are both substances and formulations. This means that the
classification and codification of types of products is depending on both possible
functions of raw material substance and of preparations. The company has to use those
codes when registering the product. Between 1992 and 2001 about 220 different codes
where used in the register to describe type of product. In 2002 a more extensive set of
codes was introduced with about 700 different types of product codes, most of them
among paint and adhesive products. It is the same set of codes that is used by the
Norwegian and Danish product registers.
It is neither asked for nor possible to report a distribution of use between the product
types. When extracting quantities per product type from the register the quantities are
arithmetically distributed.
5.4 Information on chemical composition
A substance has always to be stated with the unambiguous chemical name, mostly the
name is specified by its CAS-number. For registering, all substances have to be
identified by their CAS-number which is used in the register to store and process data.
For the very few that don’t have a CAS-number, special treatment is required.
17
The substance concentration has to be given with exact percentage except for paints,
where the percentage can be reported within ten percents intervals. All substances that
make a product hazardous have to be stated, as well as all other if they amount to more
than five percentages. Substances that are carcinogenic, sensitising, mutagenic or toxic
to reproduction have always to be stated, as also any preservative.
Ca 13 000 substances are registered as ingredients of the almost 70 000 imported or
manufactured chemical products in 2003. Of those about 3 000 are polymers.
6 Extracts from the Products Register
6.1 Over the years
The categorisation of industrial sectors and types of products has been changed during
the years. As some industrial categories have been added or have disappeared during the
years, the extract of quantity data for a certain industrial sector over time necessitates
knowledge of the category/code history of that sector. Above all the sectors of
“Manufacture of transport equipment” (DM, D34, D35), “Trade” (G) and “Community,
social and personal service” (O), have been made more disaggregated.
The same problem applies for types of product. Here, the thorough change of codes in
2002 is forming the main obstacle, but also the changes in small steps during earlier
years.
According to the Regulation25
maximum three industrial categories have to be stated.
Most products are sold to only one sector. Products that are sold to many industrial
categories are mostly pure substances. They are sold as raw material to more than three
industrial categories, and the entire quantity cannot be reported in percent as the
regulation and reporting form is designed now. The consequence is that for a part of the
quantity in the product register there is no industrial category at all stated. Therefore, in
queries that include summarising industrial category quantities, a part of the total sum
may be missing.
25 In Swedish: Kemikalieinspektionens föreskrifter (KIFS 1998:8) om kemiska produkter och biotekniska
organismer; 7 kap. Anmälan till produktregistret, ISSN 0283-1937.
http://www.kemi.se/upload/Lagar%20m.m/KIFS/K98_8.pdf
18
6.2 Type of product data
Caution shall be taken in interpreting quantity and number of products of a certain type
as a very exact observation. The specification from the registering companies of the
product type(s) can be different even if products are similar or the same. This depends
on that product type is not an absolutely defined concept, as the product can be used for
several things and different suppliers emphasise different properties for different
markets. So, when evaluating data, one has to bear in mind that products might include
product types with close definitions, and sometimes it can be necessary to summarise all
related product types to a more superior level.
6.3 Composition data
Solvents and other volatile substances used in chemical products are mostly well-
defined substances. Some are refined natural mixtures, like the petroleum solvents. All
have known CAS-numbers and very few volatile organic compounds are added as new
ingredients in chemicals each year, as recent innovation is not focussing on volatile
functional chemicals at all. The concept of volatility is not searchable in the Products
Register as it contains no physical/chemical property data, and when particular
substances are searched for, the CAS-numbers have to be used.
19
7 Method
7.1 Overview
The general method for calculating emissions from a certain source is to multiply
relevant activity data with an emission factor, according to the equation:
EFE AD
Where E= emission, AD= activity data and EF=emission factor
The developed method for calculating emissions of NMVOC from Solvent and Other
Product Use is consumption-based with a product related approach. The definition for
NMVOC stated in the Council directive of March 199926
(se section 3.1) is used. The
method can be summarised as follows:
1. The sold amount of solvents and solvent based products are derived from the
Products Register at the Swedish Chemicals Inspectorate. (production + import -
export)
2. The use of the solvents and solvent based products in each specific industrial and
commercial sector and in households are estimated.
3. The emission factors are developed taken into consideration the application
techniques, emission reduction and other pathways of release (e.g. waste or water).
The emissions for 1995-2003 have been calculated with activity data, quantity of
NMVOC and C in sold and imported amount of solvents, obtained from the Products
Register at the Swedish Chemicals Inspectorate and country specific emissions factors.
The Products Register can not deliver reliable data, in this matter, for 1988-1994 for
most industry categories. For these years data from former reported time series,
compiled in a special study concerning NMVOC emissions, carried out by SMED in
200227
, have been used since these time series are considered reliable. For most sub-
codes, data from 1988 are known and emissions have been interpolated between 1988
and 1995. For some industries the whole time series for 1988-1994 has been used
instead of interpolating between 1988 and 1995.
26 European Commission (1999). Council Directive 1999/13/EC on the limitation of emissions of volatile organic
compounds due to the use of organic solvents in certain activities and installations. 29.3.1999, L85/1.
http://europa.eu.int/eur-lex/pri/en/oj/dat/1999/l_085/l_08519990329en00010022.pdf
27 Kindbom, K. et al., 2003. Estimated Emissions of NMVOC in Sweden 1988-2001.
20
7.2 Substances
A list of substances that are defined as NMVOC, and can be found in the Products
Register in a quantity over 100 tonnes, has been compiled. The following definition of
NMVOC has been used:
"Volatile organic compound (VOC) shall mean any organic compound having at
293.15 K a vapour pressure of 0.01 kPa or more, or having a corresponding volatility
under the particular conditions of use. For the purpose of this Directive, the fraction of
creosote which exceeds this value of vapour pressure at 293.15° K shall be considered a
VOC26
."
All substances that could be found, in any of the approximately 65 000 active products,
in the Products Register for 2003 were extracted with CAS-number, name and quantity.
The substances were sorted by quantity range and the substances that could be found in
quantities over 100 tonnes were listed. The limit of 100 tonnes were chosen on the basis
that substances that can be found in the Products Register in quantities less than 100
tonnes are equivalent to 0.03% of the total solvent sales of 400 000 tonnes. The
substance list for 2003 has been complemented with substances found in quantities
exceeding 100 tonnes in the extractions for 1992-2002. This check will be done every
year and if a new substance exceeds 100 tonnes the substance will be put on the
substance list.
A manual selection has been made in order to select each substance with vapour
pressure of 0.01 kPa or more at 293.15° K according to the chosen definition of VOC
(see definition above).
The final substance list contains 344 substances defined as NMVOC. The list includes
CAS-number, name, molecular formula and carbon share for each substance. The
substance list is presented in Appendix 1. The carbon share for each substance has been
calculated based on the molecular formula. In some cases a mixture of substances are
included in the substance list, and for the mixtures the carbon content has been
estimated by the Chemicals Inspectorate as 85% of NMVOC, based on information in
the Products Register. In those cases when the carbon content can not be derived from
the Products Register, the default value, given in UNFCCC second-order draft
guidelines 200628
, of 60% has been used (se section 2.2.1.1).
7.3 Activity data
The substance list has been used to extract quantities of NMVOC and C in substances
found in the Products Register. Data extractions have been made for each year from
1992 to 2003. The extractions show for each year:
28 IPPC (2006). Second order Draft of 2006 Guidelines (unpublished).
21
The intended use of the product, the type of product (product code)
Industry to which the product is sold (industry category)
Quantity NMVOC
Quantity C
Number of products
When analysing the extractions from the Products Register, data for 1992-1994 showed
not to be reliable to use for quantity estimations of NMVOC and C. The reason is that
during this period many concentrations still were reported as intervals, even if work has
been done by the Chemicals Inspectorate in order to further specify the concentrations.
There were also changes in the code system during this period. Therefore data from the
Products Register has only been used for 1995-2003. One exception to this rule is made
for the industry categories that are includes in CRF "3D Other, other" where data also
for 1995 are considered as not reliable.
7.4 Emission factors
Country specific emission factors for 1995-2003 have been developed for each reported
activity within each CRF code. The emission factors have been developed in order to
adjust to the old time series 1988-2001, which were developed by SMED in 200229
,
since they are considered reliable. The emission factors have been developed also
considering the application techniques, the reported emissions presented in
environmental reports for specific industries, as well as other pathways of release (e.g.
waste or water). For example, in industries where most of the solvents are used in water
solutions, an emission factor of 10% has been used. For emissions to air two emission
factors have been developed for each activity; one for solvents used as raw material and
one for the remaining quantities. The emission factors for raw material have been set
very low, since most of the solvents will end up in the product and will not be emitted
during production. The developed emission factors are presented in Appendix 2.
7.5 Conversion of C to CO2
Emission of CO2 has been calculated with the following equation:
0011.12
0098.44FactorEmission )(Emission 2 quantityCCO
Cquantity is the carbon quantity in NMVOC quantity. 44.0098 and 12.0011 are the
molecular weights of CO2 and C, respectively.
7.5.1 CO2 emissions for 1988-1994
Since the method for calculating CO2 emissions have been changed compared to the
method used in previous submissions, the reported emissions of NMVOC for 1988-94
have been related to the calculated emissions NMVOC for 1995. This ratio has been
29 Kindbom, K. et al., 2003. Estimated Emissions of NMVOC in Sweden 1988-2001.
22
used to calculate the emissions of CO2 for each CFR code (3A-D) according to the
following equation:
1995) ,())1995,(),((n),(Emission 22 COEmissionNMVOCEmissionnNMVOCEmissionCO
where n is emission year.
8 The Excel model
The model consists of two steps:
1. Generating time series for quantities of NMVOC and C for activities within
CRF sector 3.
2. Calculating time series for emissions of NMVOC and CO2 for activities within
CRF sector 3.
8.1 Time series for quantities of NMVOC and C, step 1 of the model
8.1.1 Overview
The extractions from the Products Register for 1992-2003 have been used in order to
compile a connection diagram with all combinations of "product codes" and "industry
categories". For all combinations, decisions whether to include or exclude from
reporting are based on expert judgements in order to avoid double-counting. If the
combination should be included, it’s specific CRF code has been decided. Furthermore,
it has to be determined if the product is used as raw material or not. The quantities of
NMVOC used as raw material in processes have been identified and treated separately
from the other quantities for each CRF code, because most of the solvents used as raw
material will not be emitted. An Excel macro has been written in order to compile time
series with quantities of NMVOC and C for each sub-code within CRF sector 3.
8.1.2 Reporting of NMVOC in other sectors/cross-cutting issues
In order to avoid double-counting of reported emissions within other sectors an expert
judgement has been made on both industry category and product function. The
industries that are excluded in the extractions from the Products Register are considered
to be reported in CRF 1, 2 or 6. The judgements made for industry categories are
presented in Table 8.1 and Table 8.2. All industrial activities reported in CRF-codes
other than CRF 3, are excluded in the extractions from the Products Register. This
judgement is made regardless of presence of NMVOC emissions for the activity.
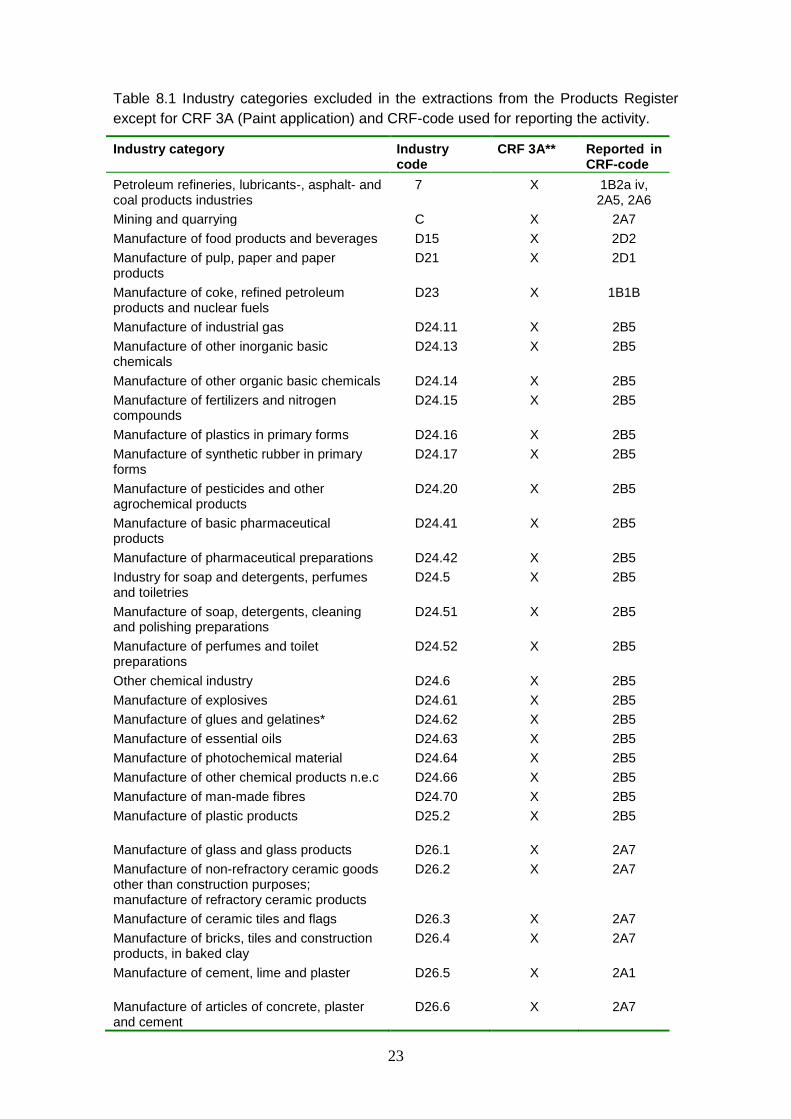
23
Table 8.1 Industry categories excluded in the extractions from the Products Register
except for CRF 3A (Paint application) and CRF-code used for reporting the activity.
Industry category Industry code
CRF 3A** Reported in CRF-code
Petroleum refineries, lubricants-, asphalt- and coal products industries
7 X 1B2a iv, 2A5, 2A6
Mining and quarrying C X 2A7
Manufacture of food products and beverages D15 X 2D2
Manufacture of pulp, paper and paper products
D21 X 2D1
Manufacture of coke, refined petroleum products and nuclear fuels
D23 X 1B1B
Manufacture of industrial gas D24.11 X 2B5
Manufacture of other inorganic basic chemicals
D24.13 X 2B5
Manufacture of other organic basic chemicals D24.14 X 2B5
Manufacture of fertilizers and nitrogen compounds
D24.15 X 2B5
Manufacture of plastics in primary forms D24.16 X 2B5
Manufacture of synthetic rubber in primary forms
D24.17 X 2B5
Manufacture of pesticides and other agrochemical products
D24.20 X 2B5
Manufacture of basic pharmaceutical products
D24.41 X 2B5
Manufacture of pharmaceutical preparations D24.42 X 2B5
Industry for soap and detergents, perfumes and toiletries
D24.5 X 2B5
Manufacture of soap, detergents, cleaning and polishing preparations
D24.51 X 2B5
Manufacture of perfumes and toilet preparations
D24.52 X 2B5
Other chemical industry D24.6 X 2B5
Manufacture of explosives D24.61 X 2B5
Manufacture of glues and gelatines* D24.62 X 2B5
Manufacture of essential oils D24.63 X 2B5
Manufacture of photochemical material D24.64 X 2B5
Manufacture of other chemical products n.e.c D24.66 X 2B5
Manufacture of man-made fibres D24.70 X 2B5
Manufacture of plastic products D25.2 X 2B5
Manufacture of glass and glass products D26.1 X 2A7
Manufacture of non-refractory ceramic goods other than construction purposes; manufacture of refractory ceramic products
D26.2 X 2A7
Manufacture of ceramic tiles and flags D26.3 X 2A7
Manufacture of bricks, tiles and construction products, in baked clay
D26.4 X 2A7
Manufacture of cement, lime and plaster D26.5 X 2A1
Manufacture of articles of concrete, plaster and cement
D26.6 X 2A7
24
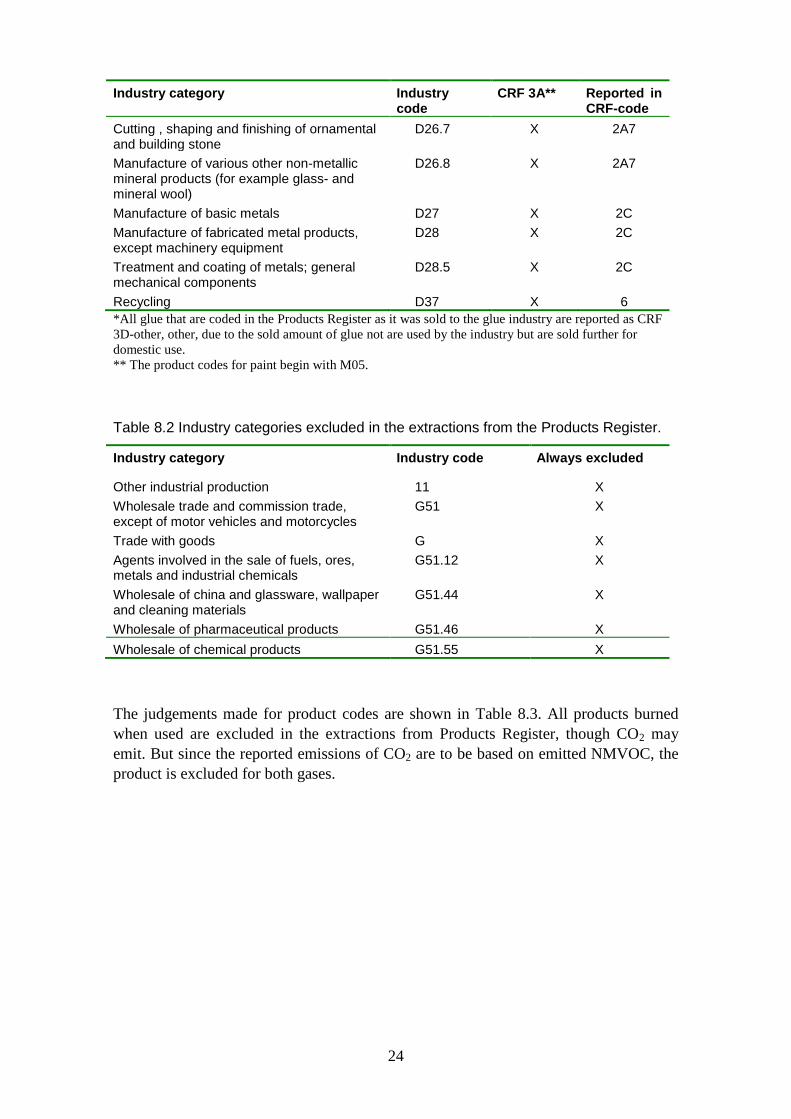
Industry category Industry code
CRF 3A** Reported in CRF-code
Cutting , shaping and finishing of ornamental and building stone
D26.7 X 2A7
Manufacture of various other non-metallic mineral products (for example glass- and mineral wool)
D26.8 X 2A7
Manufacture of basic metals D27 X 2C
Manufacture of fabricated metal products, except machinery equipment
D28 X 2C
Treatment and coating of metals; general mechanical components
D28.5 X 2C
Recycling D37 X 6
*All glue that are coded in the Products Register as it was sold to the glue industry are reported as CRF
3D-other, other, due to the sold amount of glue not are used by the industry but are sold further for
domestic use.
** The product codes for paint begin with M05.
Table 8.2 Industry categories excluded in the extractions from the Products Register.
Industry category Industry code Always excluded
Other industrial production 11 X
Wholesale trade and commission trade, except of motor vehicles and motorcycles
G51 X
Trade with goods G X
Agents involved in the sale of fuels, ores, metals and industrial chemicals
G51.12 X
Wholesale of china and glassware, wallpaper and cleaning materials
G51.44 X
Wholesale of pharmaceutical products G51.46 X
Wholesale of chemical products G51.55 X
The judgements made for product codes are shown in Table 8.3. All products burned
when used are excluded in the extractions from Products Register, though CO2 may
emit. But since the reported emissions of CO2 are to be based on emitted NMVOC, the
product is excluded for both gases.
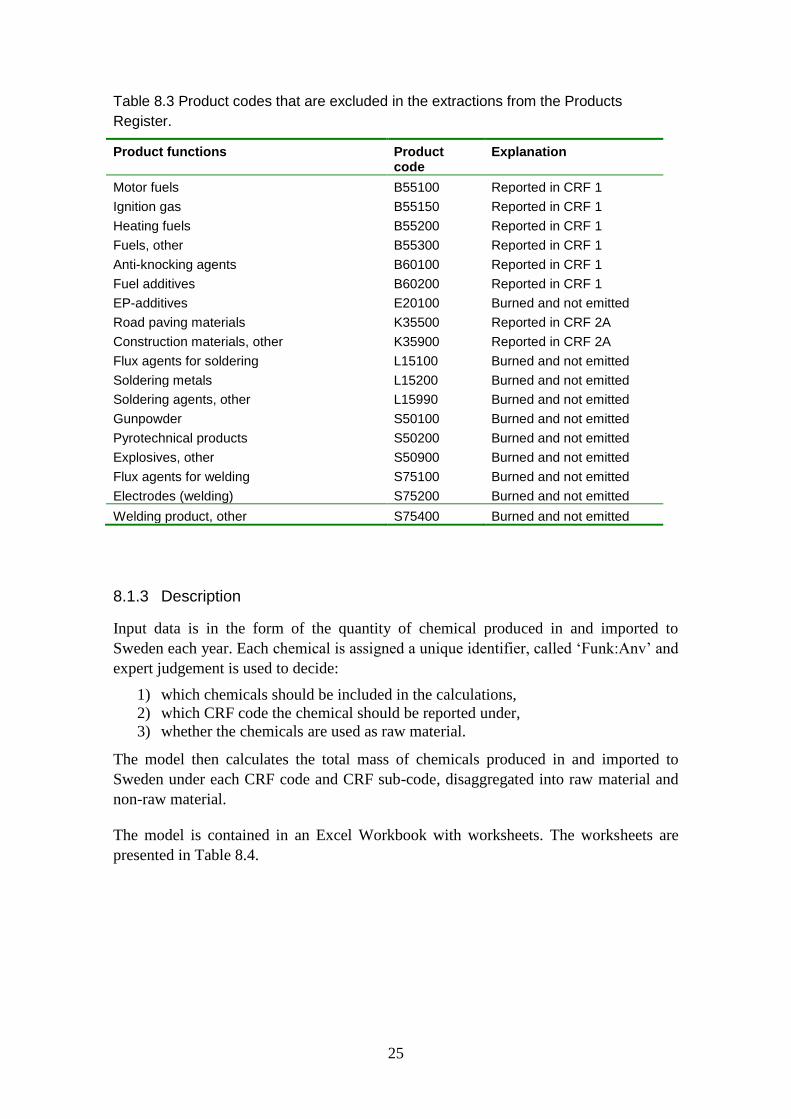
25
Table 8.3 Product codes that are excluded in the extractions from the Products
Register.
Product functions Product code
Explanation
Motor fuels B55100 Reported in CRF 1
Ignition gas B55150 Reported in CRF 1
Heating fuels B55200 Reported in CRF 1
Fuels, other B55300 Reported in CRF 1
Anti-knocking agents B60100 Reported in CRF 1
Fuel additives B60200 Reported in CRF 1
EP-additives E20100 Burned and not emitted
Road paving materials K35500 Reported in CRF 2A
Construction materials, other K35900 Reported in CRF 2A
Flux agents for soldering L15100 Burned and not emitted
Soldering metals L15200 Burned and not emitted
Soldering agents, other L15990 Burned and not emitted
Gunpowder S50100 Burned and not emitted
Pyrotechnical products S50200 Burned and not emitted
Explosives, other S50900 Burned and not emitted
Flux agents for welding S75100 Burned and not emitted
Electrodes (welding) S75200 Burned and not emitted
Welding product, other S75400 Burned and not emitted
8.1.3 Description
Input data is in the form of the quantity of chemical produced in and imported to
Sweden each year. Each chemical is assigned a unique identifier, called ‘Funk:Anv’ and
expert judgement is used to decide:
1) which chemicals should be included in the calculations,
2) which CRF code the chemical should be reported under,
3) whether the chemicals are used as raw material.
The model then calculates the total mass of chemicals produced in and imported to
Sweden under each CRF code and CRF sub-code, disaggregated into raw material and
non-raw material.
The model is contained in an Excel Workbook with worksheets. The worksheets are
presented in Table 8.4.
26
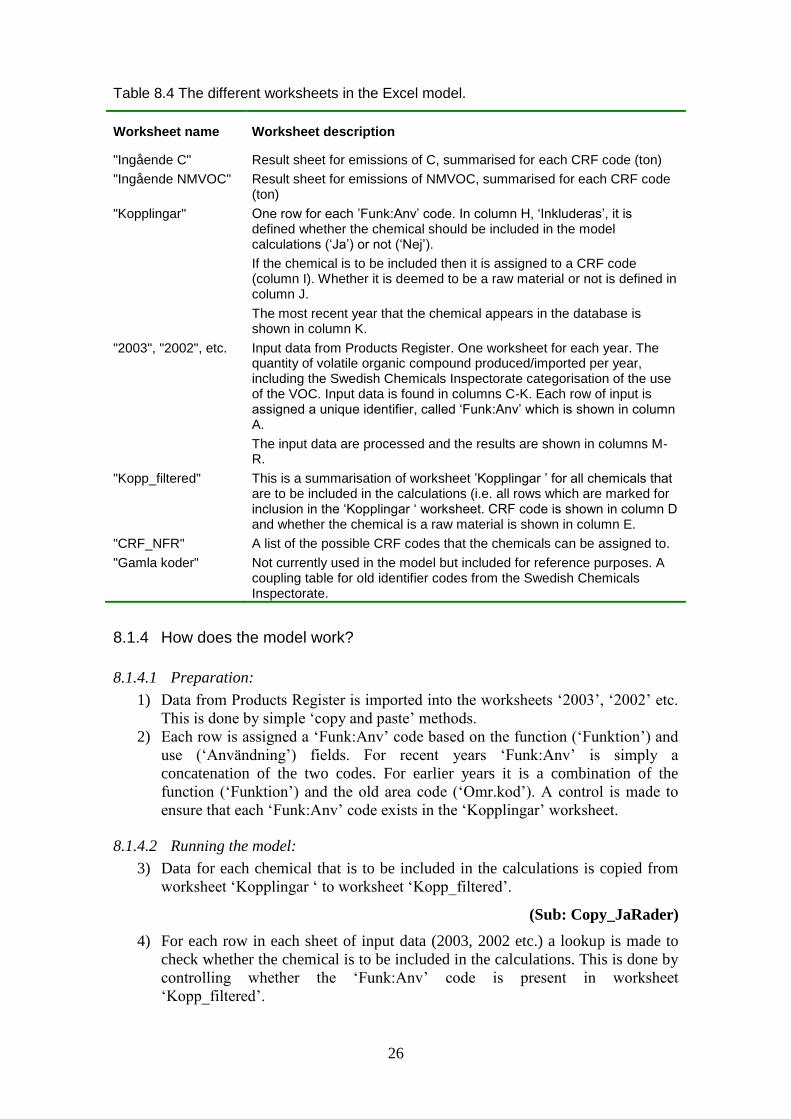
Table 8.4 The different worksheets in the Excel model.
Worksheet name Worksheet description
"Ingående C" Result sheet for emissions of C, summarised for each CRF code (ton)
"Ingående NMVOC" Result sheet for emissions of NMVOC, summarised for each CRF code (ton)
"Kopplingar" One row for each ’Funk:Anv’ code. In column H, ‘Inkluderas’, it is defined whether the chemical should be included in the model calculations (‘Ja’) or not (‘Nej’).
If the chemical is to be included then it is assigned to a CRF code (column I). Whether it is deemed to be a raw material or not is defined in column J.
The most recent year that the chemical appears in the database is shown in column K.
"2003", "2002", etc. Input data from Products Register. One worksheet for each year. The quantity of volatile organic compound produced/imported per year, including the Swedish Chemicals Inspectorate categorisation of the use of the VOC. Input data is found in columns C-K. Each row of input is assigned a unique identifier, called ‘Funk:Anv’ which is shown in column A.
The input data are processed and the results are shown in columns M-R.
"Kopp_filtered" This is a summarisation of worksheet ’Kopplingar ’ for all chemicals that are to be included in the calculations (i.e. all rows which are marked for inclusion in the ‘Kopplingar ‘ worksheet. CRF code is shown in column D and whether the chemical is a raw material is shown in column E.
"CRF_NFR" A list of the possible CRF codes that the chemicals can be assigned to.
"Gamla koder" Not currently used in the model but included for reference purposes. A coupling table for old identifier codes from the Swedish Chemicals Inspectorate.
8.1.4 How does the model work?
8.1.4.1 Preparation:
1) Data from Products Register is imported into the worksheets ‘2003’, ‘2002’ etc.
This is done by simple ‘copy and paste’ methods.
2) Each row is assigned a ‘Funk:Anv’ code based on the function (‘Funktion’) and
use (‘Användning’) fields. For recent years ‘Funk:Anv’ is simply a
concatenation of the two codes. For earlier years it is a combination of the
function (‘Funktion’) and the old area code (‘Omr.kod’). A control is made to
ensure that each ‘Funk:Anv’ code exists in the ‘Kopplingar’ worksheet.
8.1.4.2 Running the model:
3) Data for each chemical that is to be included in the calculations is copied from
worksheet ‘Kopplingar ‘ to worksheet ‘Kopp_filtered’.
(Sub: Copy_JaRader)
4) For each row in each sheet of input data (2003, 2002 etc.) a lookup is made to
check whether the chemical is to be included in the calculations. This is done by
controlling whether the ‘Funk:Anv’ code is present in worksheet
‘Kopp_filtered’.
27
If the chemical is to be included, then the quantity C and quantity NMVOC is
copied into the relevant column M-P, depending on whether the chemical is a
raw material or not. The CRF code and sub-code are copied to columns Q and R
respectively.
If the chemical is not to be included, then the zeros is written in the relevant
column M-P, depending on whether the chemical is a raw material or not. The
CRF code and sub-code are filled with a hyphen (‘-‘).
(Sub: Collect_from_Kemisheets)
5) For each CRF code and sub-code found in rows 1 and 2 in the worksheet
“Ingående C”, and for each year for which there is a ‘year worksheet’ (i.e.
“2003”,”2002” etc), a lookup is done in columns M, N, O and P and a total
emissions (C icke råvara, C råvara, NMVOC icke råvara, NMVOC råvara), for
each year and CRF code is calculated. The results are written in ‘Ingående C’
and ‘Ingående NMVOC’.
(Sub: Sum_Emissions)
8.1.5 Updating to include new years
To include new years in the time series the KemiSheetArray in Main and
Collect_from_Kemisheets need to be updated in Visual Basics. All other required
updates have been flagged up as comments in the scripts.
28
8.2 Time series for emissions of NMVOC and CO2, step 2 of the model
8.2.1 Overview
The time series for quantities that step 1 of the model generates are copied to the
calculation step of the model. The following calculations are made within step 2 of the
model:
1) Running average over three years
2) Emissions for 1995-2003 are estimated based on the calculated quantities with
the running average and emission factors. Conversion of quantities of C to CO2.
8.2.2 Description
8.2.2.1 Running average
The sold amount of volatile organic compound is not always identical to the amount of
substance used in a single year and therefore the time series for quantities of NMVOC
and C has been recalculated using a running average over three years. This means that
reported emissions for two years need to be updated in every new submission. The use
of running average results in a smoother time series for quantities of both NMVOC and
C.
8.2.2.2 Emissions for 1995-2003
The developed country specific emission factors, see section 7.4, are used when
calculating emissions of NMVOC and CO2 for 1995-2003. When adding data for a new
year the emission factors for each sub-code needs to be updated, both for raw material
and remaining quantities. When calculating emissions of CO2 the equation presented in
section 7.5 is used.
29
9 Uncertainty analysis
During 2005, a SMED study was carried out, aiming to improve the transparency and
quality in the present uncertainty estimates in the Swedish National Greenhouse Gas
Inventory by making the underlying documentation and structures for uncertainty
estimates more consistent and traceable. The uncertainty estimates have been performed
for direct greenhouse gases. Each source was evaluated regarding uncertainties (%) on
activity data (AD), emission factors (EF) or direct emissions (EM).
The uncertainties have been set on sector level for CRF 3, Solvent and Other Product
Use. For activity data the uncertainties have been discussed and assigned in co-
operation with the Swedish Chemicals Inspectorate. Uncertainty estimates for the
country specific emission factors used were estimated by expert judgement.
The uncertainty analysis is performed according the IPCC Guidelines Tier 1 method as
described in Good Practice Guidance section 6.3.2, see especially table 6.130
. For each
source, the uncertainty for activity data (UAD) and emission factors (UEF) is estimated
and given in percents. The combined uncertainty (CU) for activity data and emission
factors – the uncertainty for the reported emissions from each source – is calculated as:
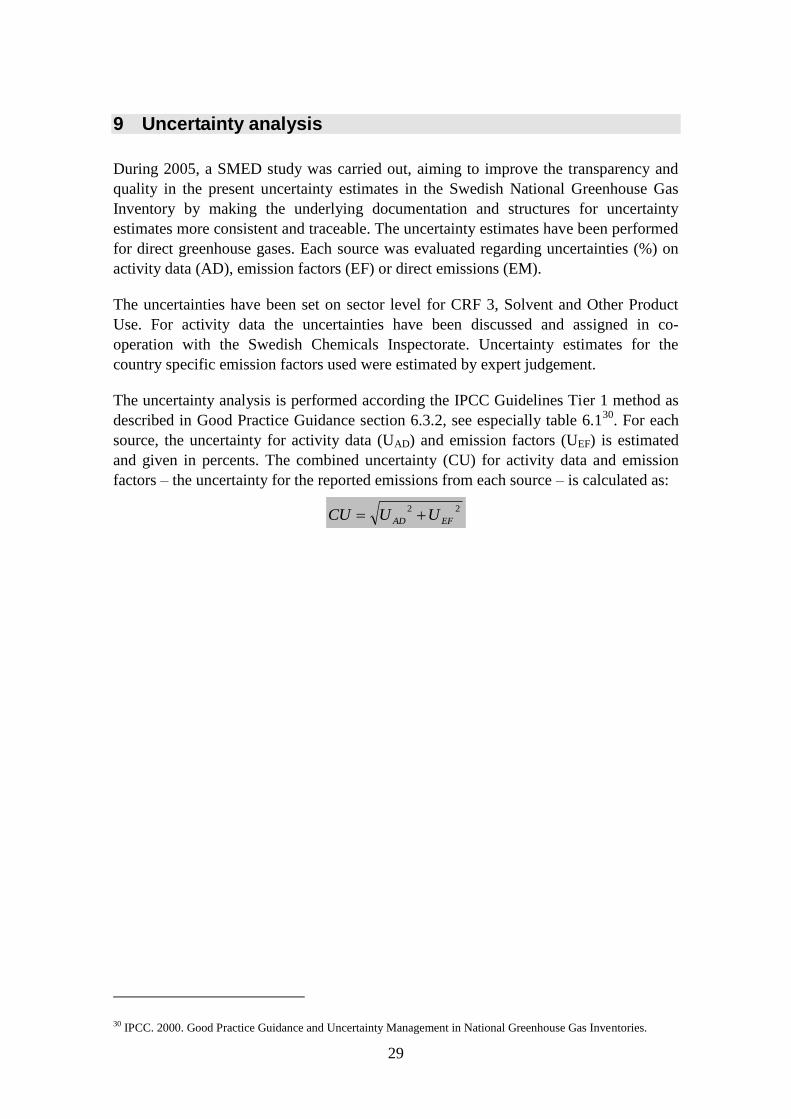
22
EFAD UUCU
30 IPCC. 2000. Good Practice Guidance and Uncertainty Management in National Greenhouse Gas Inventories.

30
10 Results
10.1 Revised estimates
The percentage proportion of the reported emissions of NMVOC in sub-codes within
CRF 3, Solvent and Other Product Use, is presented in Figure 10.1. The sub-codes are
3A- Paint Application, 3B- Degreasing and Dry Cleaning, 3C- Chemical Products,
Manufacturing and Processing and 3D- Other. As it can be seen in the figure, CRF 3D-
Other is the most dominating code within the sector.
0%
20%
40%
60%
80%
100%
1988
1989
1990
1991
1992
1993
1994
1995
1996
1997
1998
1999
2000
2001
2002
2003
3D
3C
3B
3A
Figure 10.1 The sub-code proportion (%) of reported emissions of NMVOC in CRF 3.
In the following figures the emitted amounts of NMVOC and CO2 for each sub-code are
presented. In order to describe the eventual change of carbon content in NMVOC the
quota CO2/NMVOC is also shown.
10.1.1 CRF 3A, Paint Application
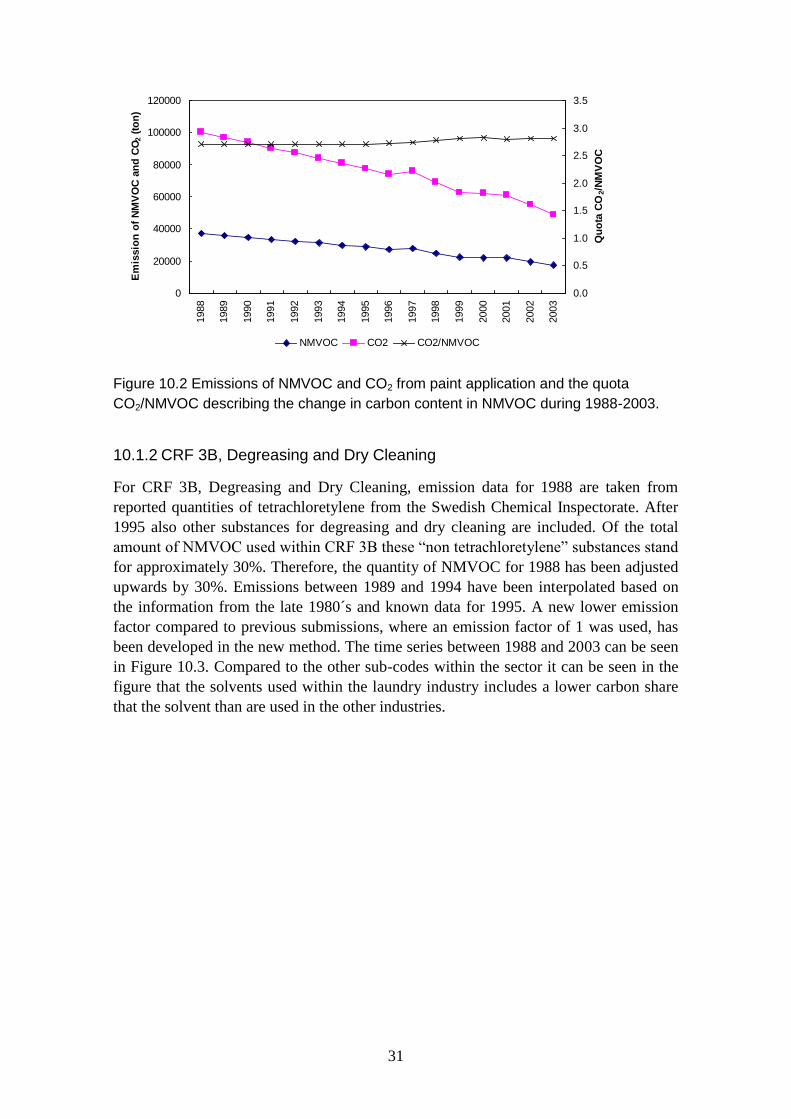
Emissions from Paint Application for 1988 are taken from the time series that were
compiled in a special study concerning NMVOC emissions, which was carried out by
SMED in 200231
. The emissions for 1989-1994 have been interpolated based on the
information from 1988 and known data for 1995. The time series for CRF 3A, Paint
Application, between 1988 and 2003 can be seen in Figure 10.2 below.
31 Kindbom, K. et al., 2003. Estimated Emissions of NMVOC in Sweden 1988-2001.
31
0
20000
40000
60000
80000
100000
120000
1988
1989
1990
1991
1992
1993
1994
1995
1996
1997
1998
1999
2000
2001
2002
2003
Em
issio
n o
f N
MV
OC
an
d C
O2 (
ton
)
0.0
0.5
1.0
1.5
2.0
2.5
3.0
3.5
Qu
ota
CO
2/N
MV
OC
NMVOC CO2 CO2/NMVOC
Figure 10.2 Emissions of NMVOC and CO2 from paint application and the quota
CO2/NMVOC describing the change in carbon content in NMVOC during 1988-2003.
10.1.2 CRF 3B, Degreasing and Dry Cleaning
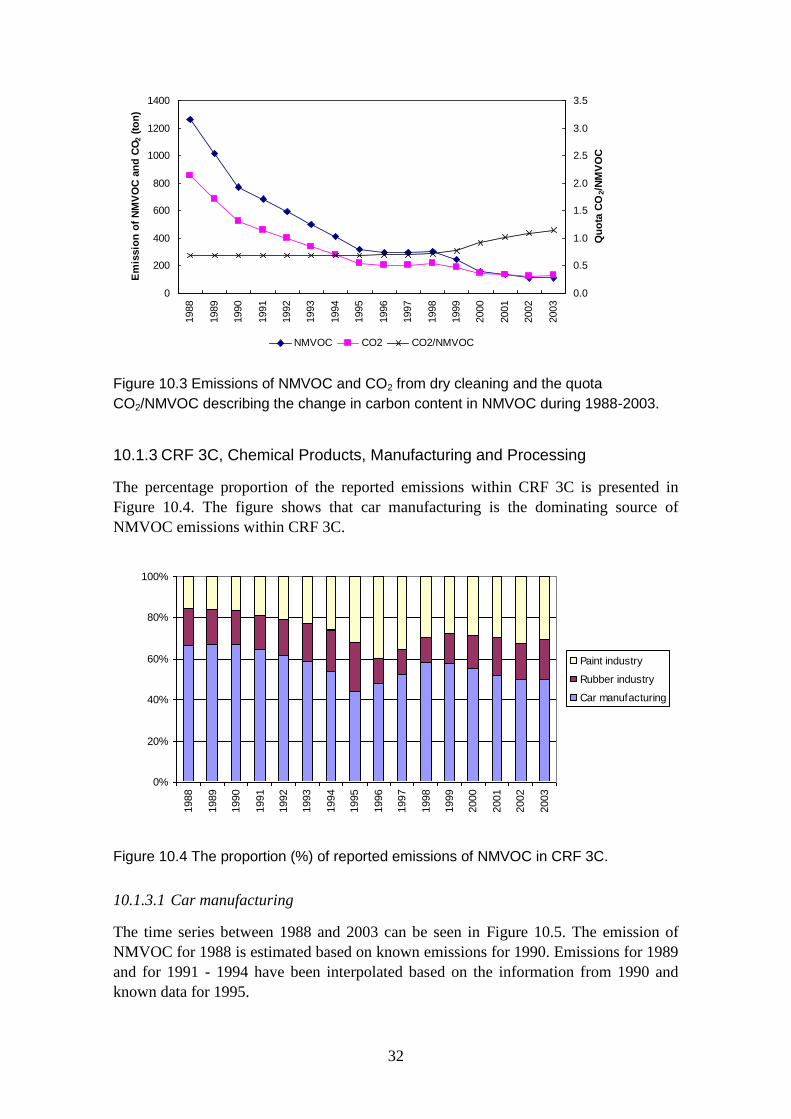
For CRF 3B, Degreasing and Dry Cleaning, emission data for 1988 are taken from
reported quantities of tetrachloretylene from the Swedish Chemical Inspectorate. After
1995 also other substances for degreasing and dry cleaning are included. Of the total
amount of NMVOC used within CRF 3B these “non tetrachloretylene” substances stand
for approximately 30%. Therefore, the quantity of NMVOC for 1988 has been adjusted
upwards by 30%. Emissions between 1989 and 1994 have been interpolated based on
the information from the late 1980´s and known data for 1995. A new lower emission
factor compared to previous submissions, where an emission factor of 1 was used, has
been developed in the new method. The time series between 1988 and 2003 can be seen
in Figure 10.3. Compared to the other sub-codes within the sector it can be seen in the
figure that the solvents used within the laundry industry includes a lower carbon share
that the solvent than are used in the other industries.
32
0
200
400
600
800
1000
1200
1400
1988
1989
1990
1991
1992
1993
1994
1995
1996
1997
1998
1999
2000
2001
2002
2003
Em
issio
n o
f N
MV
OC
an
d C
O2 (
ton
)
0.0
0.5
1.0
1.5
2.0
2.5
3.0
3.5
Qu
ota
CO
2/N
MV
OC
NMVOC CO2 CO2/NMVOC
Figure 10.3 Emissions of NMVOC and CO2 from dry cleaning and the quota
CO2/NMVOC describing the change in carbon content in NMVOC during 1988-2003.
10.1.3 CRF 3C, Chemical Products, Manufacturing and Processing
The percentage proportion of the reported emissions within CRF 3C is presented in
Figure 10.4. The figure shows that car manufacturing is the dominating source of
NMVOC emissions within CRF 3C.
0%
20%
40%
60%
80%
100%
1988
1989
1990
1991
1992
1993
1994
1995
1996
1997
1998
1999
2000
2001
2002
2003
Paint industry
Rubber industry
Car manufacturing
Figure 10.4 The proportion (%) of reported emissions of NMVOC in CRF 3C.
10.1.3.1 Car manufacturing
The time series between 1988 and 2003 can be seen in Figure 10.5. The emission of
NMVOC for 1988 is estimated based on known emissions for 1990. Emissions for 1989
and for 1991 - 1994 have been interpolated based on the information from 1990 and
known data for 1995.
33
0
1000
2000
3000
4000
5000
6000
7000
8000
1988
1989
1990
1991
1992
1993
1994
1995
1996
1997
1998
1999
2000
2001
2002
2003
Em
issio
n o
f N
MV
OC
an
d C
O2 (
ton
)
0.0
0.5
1.0
1.5
2.0
2.5
3.0
3.5
Qu
ota
CO
2/N
MV
OC
NMVOC CO2 CO2/NMVOC
Figure 10.5 Emissions of NMVOC and CO2 from car manufacturing and the quota
CO2/NMVOC describing the change in carbon content in NMVOC during 1988-2003.
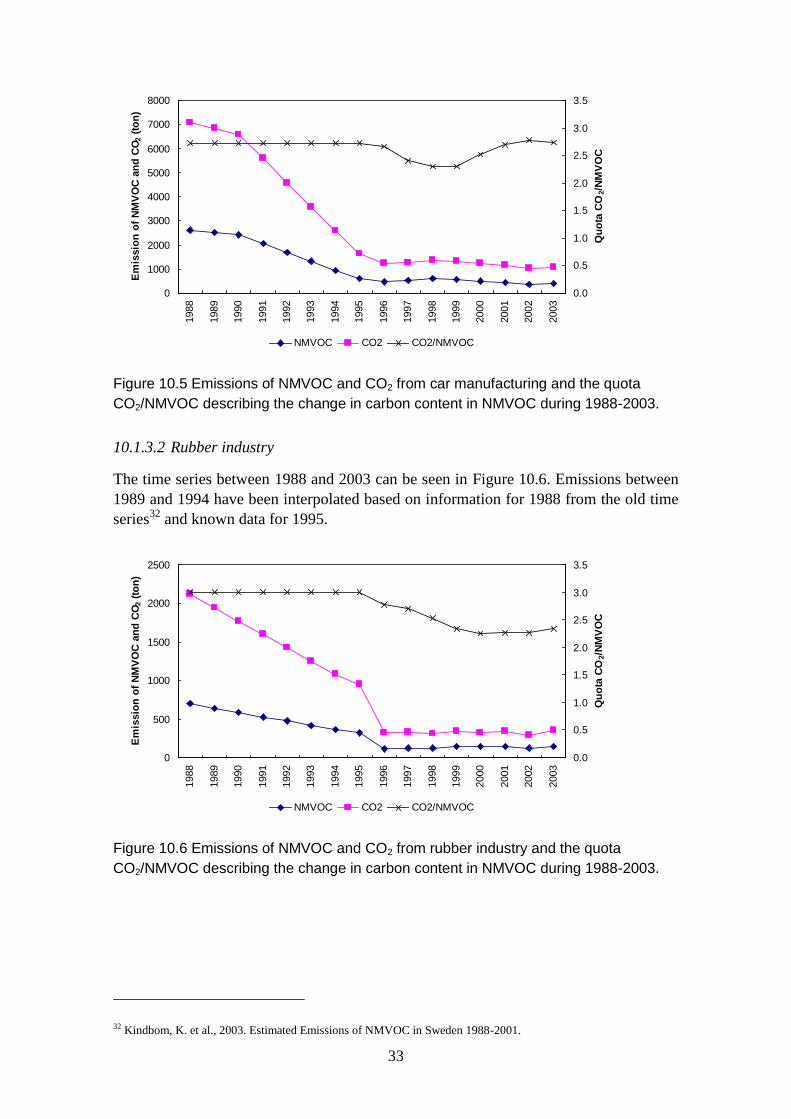
10.1.3.2 Rubber industry
The time series between 1988 and 2003 can be seen in Figure 10.6. Emissions between
1989 and 1994 have been interpolated based on information for 1988 from the old time
series32
and known data for 1995.
0
500
1000
1500
2000
2500
1988
1989
1990
1991
1992
1993
1994
1995
1996
1997
1998
1999
2000
2001
2002
2003
Em
issio
n o
f N
MV
OC
an
d C
O2 (
ton
)
0.0
0.5
1.0
1.5
2.0
2.5
3.0
3.5
Qu
ota
CO
2/N
MV
OC
NMVOC CO2 CO2/NMVOC
Figure 10.6 Emissions of NMVOC and CO2 from rubber industry and the quota
CO2/NMVOC describing the change in carbon content in NMVOC during 1988-2003.
32 Kindbom, K. et al., 2003. Estimated Emissions of NMVOC in Sweden 1988-2001.
34
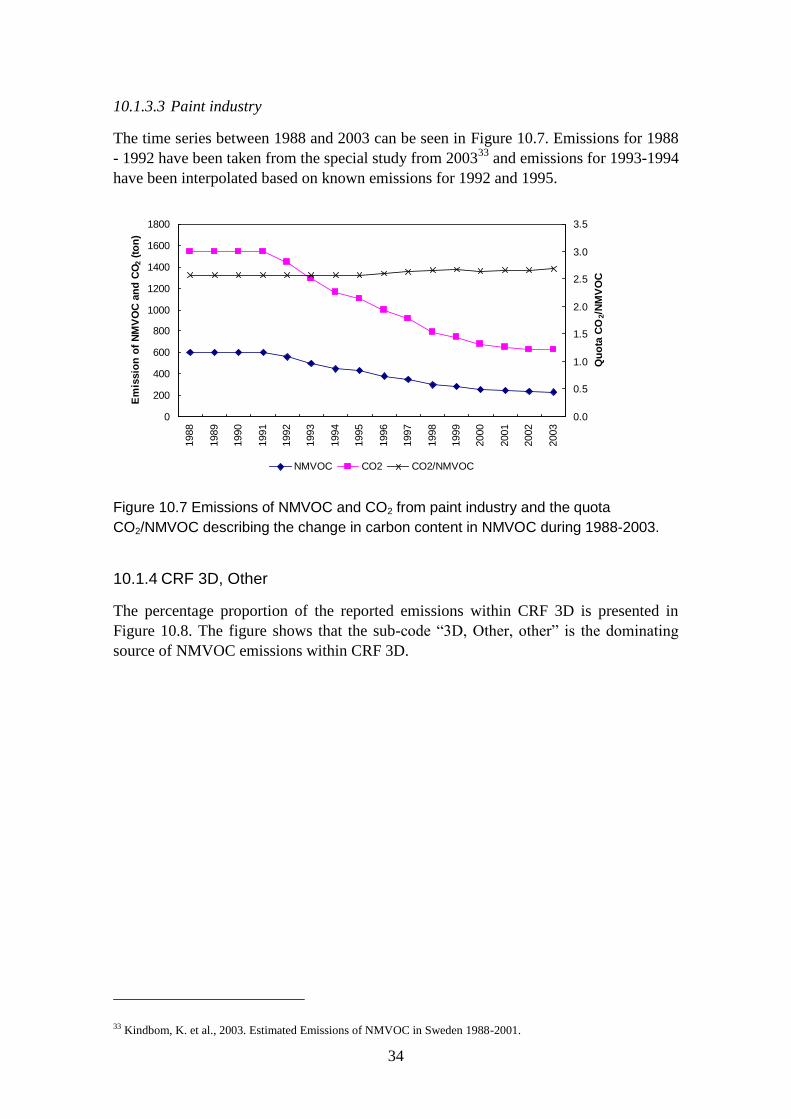
10.1.3.3 Paint industry
The time series between 1988 and 2003 can be seen in Figure 10.7. Emissions for 1988
- 1992 have been taken from the special study from 200333
and emissions for 1993-1994
have been interpolated based on known emissions for 1992 and 1995.
0
200
400
600
800
1000
1200
1400
1600
1800
1988
1989
1990
1991
1992
1993
1994
1995
1996
1997
1998
1999
2000
2001
2002
2003
Em
issio
n o
f N
MV
OC
an
d C
O2 (
ton
)
0.0
0.5
1.0
1.5
2.0
2.5
3.0
3.5
Qu
ota
CO
2/N
MV
OC
NMVOC CO2 CO2/NMVOC
Figure 10.7 Emissions of NMVOC and CO2 from paint industry and the quota
CO2/NMVOC describing the change in carbon content in NMVOC during 1988-2003.
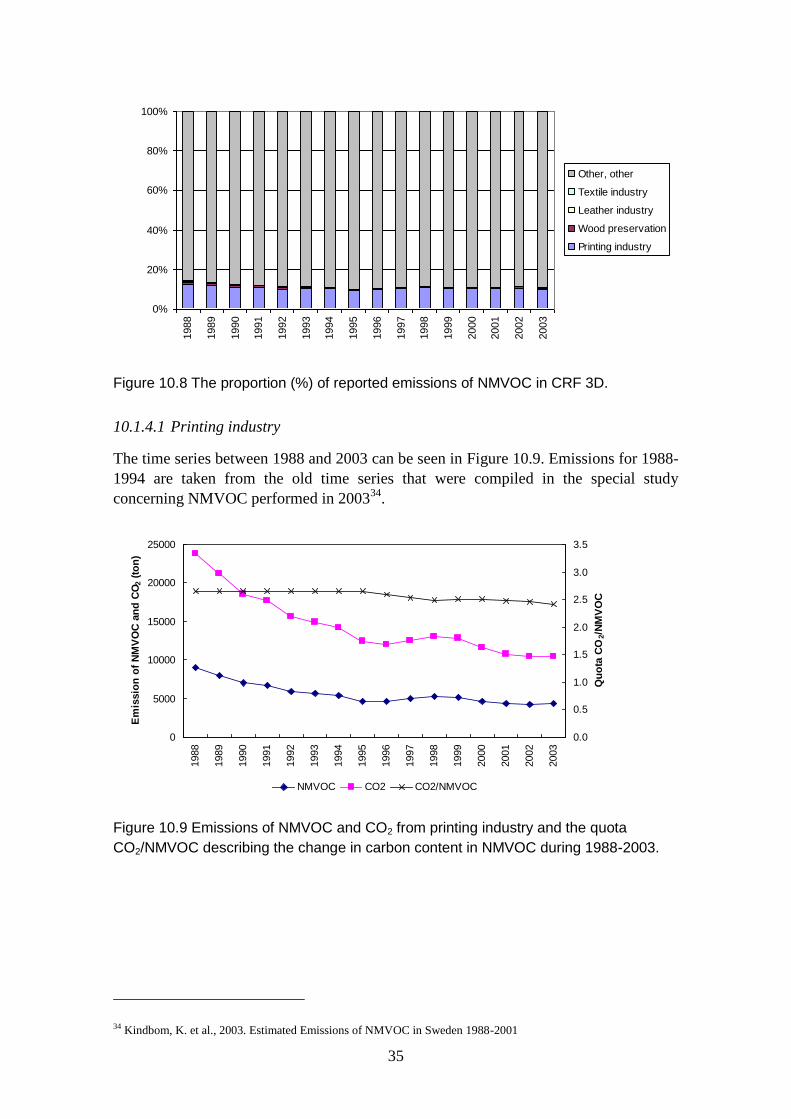
10.1.4 CRF 3D, Other
The percentage proportion of the reported emissions within CRF 3D is presented in
Figure 10.8. The figure shows that the sub-code “3D, Other, other” is the dominating
source of NMVOC emissions within CRF 3D.
33 Kindbom, K. et al., 2003. Estimated Emissions of NMVOC in Sweden 1988-2001.
35
0%
20%
40%
60%
80%
100%
1988
1989
1990
1991
1992
1993
1994
1995
1996
1997
1998
1999
2000
2001
2002
2003
Other, other
Textile industry
Leather industry
Wood preservation
Printing industry
Figure 10.8 The proportion (%) of reported emissions of NMVOC in CRF 3D.
10.1.4.1 Printing industry
The time series between 1988 and 2003 can be seen in Figure 10.9. Emissions for 1988-
1994 are taken from the old time series that were compiled in the special study
concerning NMVOC performed in 200334
.
0
5000
10000
15000
20000
25000
1988
1989
1990
1991
1992
1993
1994
1995
1996
1997
1998
1999
2000
2001
2002
2003
Em
issio
n o
f N
MV
OC
an
d C
O2 (
ton
)
0.0
0.5
1.0
1.5
2.0
2.5
3.0
3.5
Qu
ota
CO
2/N
MV
OC
NMVOC CO2 CO2/NMVOC
Figure 10.9 Emissions of NMVOC and CO2 from printing industry and the quota
CO2/NMVOC describing the change in carbon content in NMVOC during 1988-2003.
34 Kindbom, K. et al., 2003. Estimated Emissions of NMVOC in Sweden 1988-2001
36
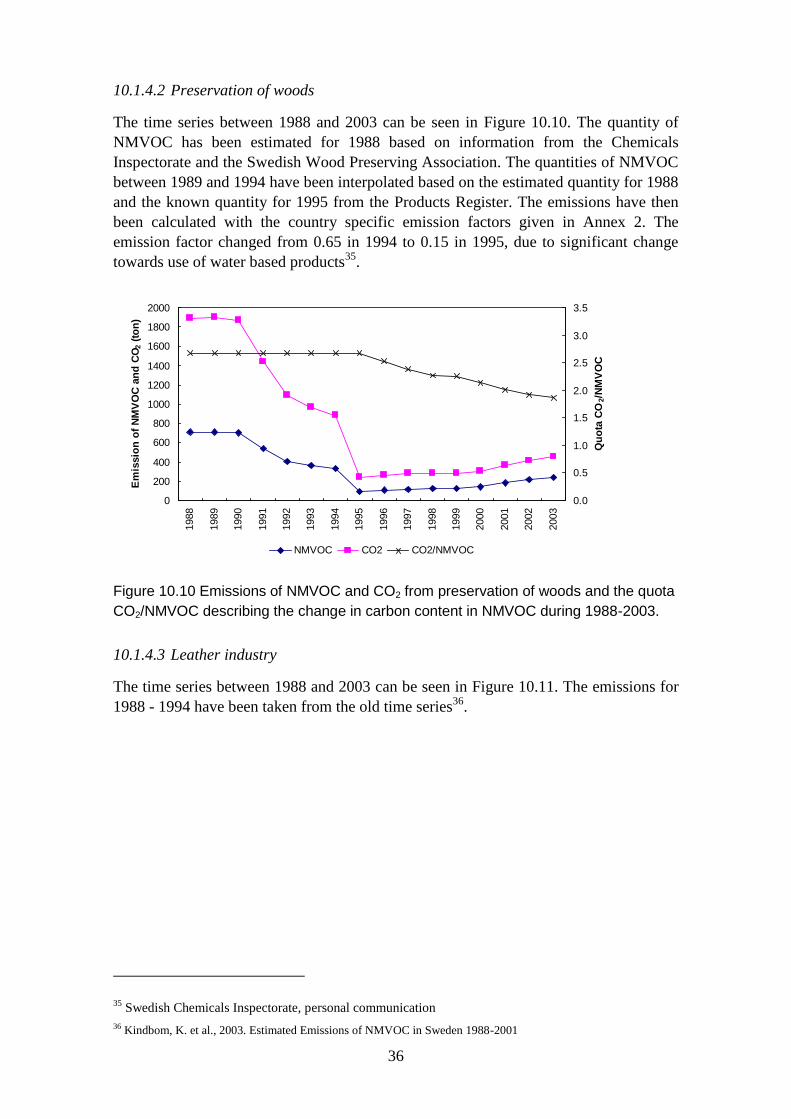
10.1.4.2 Preservation of woods
The time series between 1988 and 2003 can be seen in Figure 10.10. The quantity of
NMVOC has been estimated for 1988 based on information from the Chemicals
Inspectorate and the Swedish Wood Preserving Association. The quantities of NMVOC
between 1989 and 1994 have been interpolated based on the estimated quantity for 1988
and the known quantity for 1995 from the Products Register. The emissions have then
been calculated with the country specific emission factors given in Annex 2. The
emission factor changed from 0.65 in 1994 to 0.15 in 1995, due to significant change
towards use of water based products35
.
0
200
400
600
800
1000
1200
1400
1600
1800
2000
1988
1989
1990
1991
1992
1993
1994
1995
1996
1997
1998
1999
2000
2001
2002
2003
Em
issio
n o
f N
MV
OC
an
d C
O2 (
ton
)
0.0
0.5
1.0
1.5
2.0
2.5
3.0
3.5
Qu
ota
CO
2/N
MV
OC
NMVOC CO2 CO2/NMVOC
Figure 10.10 Emissions of NMVOC and CO2 from preservation of woods and the quota
CO2/NMVOC describing the change in carbon content in NMVOC during 1988-2003.
10.1.4.3 Leather industry
The time series between 1988 and 2003 can be seen in Figure 10.11. The emissions for
1988 - 1994 have been taken from the old time series36
.
35 Swedish Chemicals Inspectorate, personal communication
36 Kindbom, K. et al., 2003. Estimated Emissions of NMVOC in Sweden 1988-2001
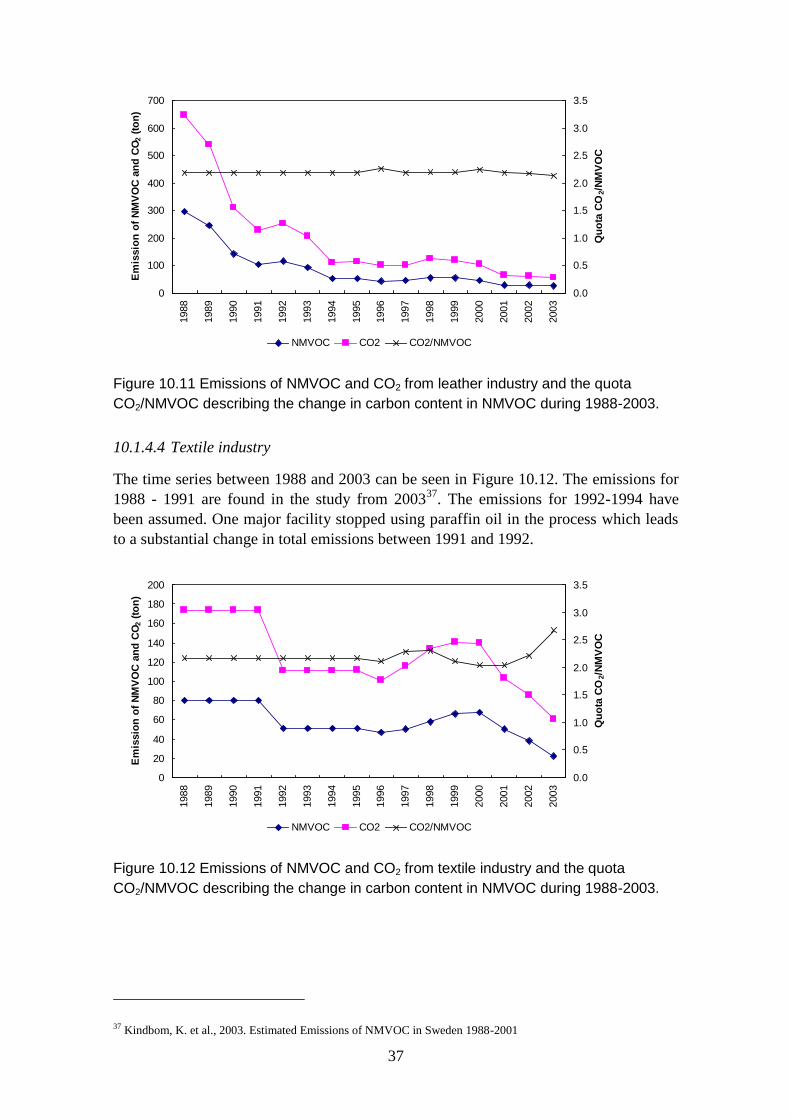
37
0
100
200
300
400
500
600
700
1988
1989
1990
1991
1992
1993
1994
1995
1996
1997
1998
1999
2000
2001
2002
2003
Em
issio
n o
f N
MV
OC
an
d C
O2 (
ton
)
0.0
0.5
1.0
1.5
2.0
2.5
3.0
3.5
Qu
ota
CO
2/N
MV
OC
NMVOC CO2 CO2/NMVOC
Figure 10.11 Emissions of NMVOC and CO2 from leather industry and the quota
CO2/NMVOC describing the change in carbon content in NMVOC during 1988-2003.
10.1.4.4 Textile industry
The time series between 1988 and 2003 can be seen in Figure 10.12. The emissions for
1988 - 1991 are found in the study from 200337
. The emissions for 1992-1994 have
been assumed. One major facility stopped using paraffin oil in the process which leads
to a substantial change in total emissions between 1991 and 1992.
0
20
40
60
80
100
120
140
160
180
200
1988
1989
1990
1991
1992
1993
1994
1995
1996
1997
1998
1999
2000
2001
2002
2003
Em
issio
n o
f N
MV
OC
an
d C
O2 (
ton
)
0.0
0.5
1.0
1.5
2.0
2.5
3.0
3.5Q
uo
ta C
O2/N
MV
OC
NMVOC CO2 CO2/NMVOC
Figure 10.12 Emissions of NMVOC and CO2 from textile industry and the quota
CO2/NMVOC describing the change in carbon content in NMVOC during 1988-2003.
37 Kindbom, K. et al., 2003. Estimated Emissions of NMVOC in Sweden 1988-2001
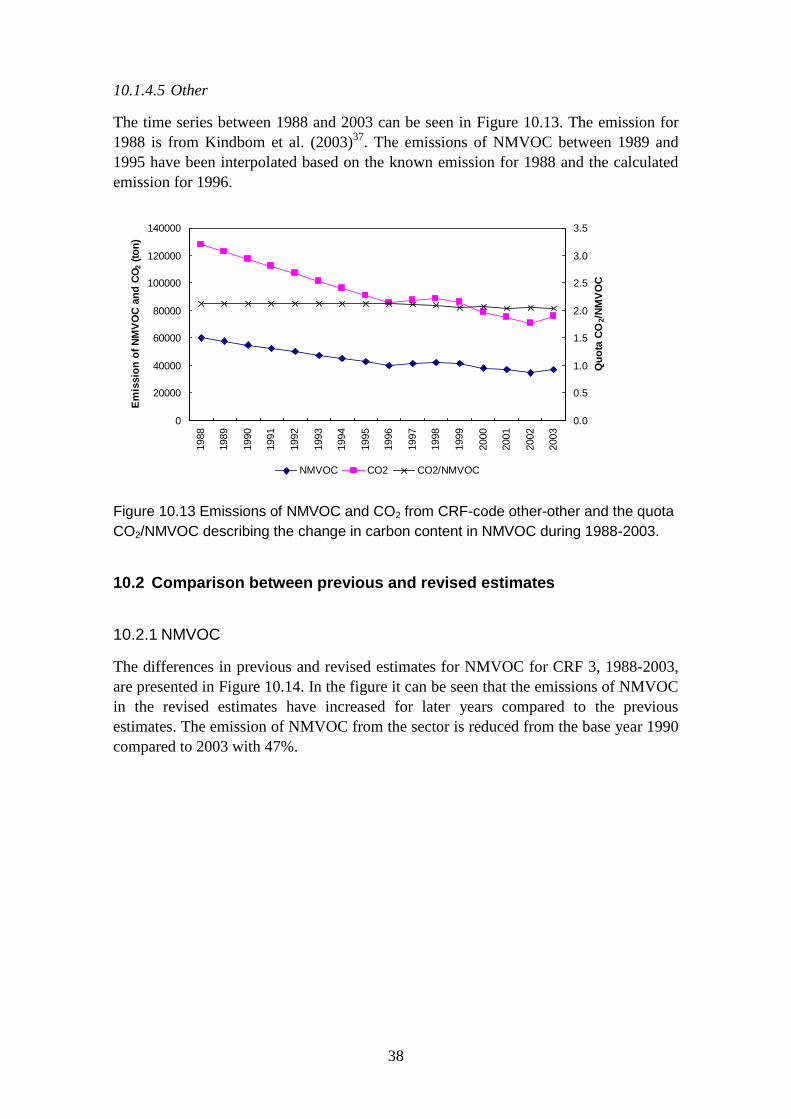
38
10.1.4.5 Other
The time series between 1988 and 2003 can be seen in Figure 10.13. The emission for
1988 is from Kindbom et al. (2003)37
. The emissions of NMVOC between 1989 and
1995 have been interpolated based on the known emission for 1988 and the calculated
emission for 1996.
0
20000
40000
60000
80000
100000
120000
140000
1988
1989
1990
1991
1992
1993
1994
1995
1996
1997
1998
1999
2000
2001
2002
2003
Em
issio
n o
f N
MV
OC
an
d C
O2 (
ton
)
0.0
0.5
1.0
1.5
2.0
2.5
3.0
3.5
Qu
ota
CO
2/N
MV
OC
NMVOC CO2 CO2/NMVOC
Figure 10.13 Emissions of NMVOC and CO2 from CRF-code other-other and the quota
CO2/NMVOC describing the change in carbon content in NMVOC during 1988-2003.
10.2 Comparison between previous and revised estimates
10.2.1 NMVOC
The differences in previous and revised estimates for NMVOC for CRF 3, 1988-2003,
are presented in Figure 10.14. In the figure it can be seen that the emissions of NMVOC
in the revised estimates have increased for later years compared to the previous
estimates. The emission of NMVOC from the sector is reduced from the base year 1990
compared to 2003 with 47%.
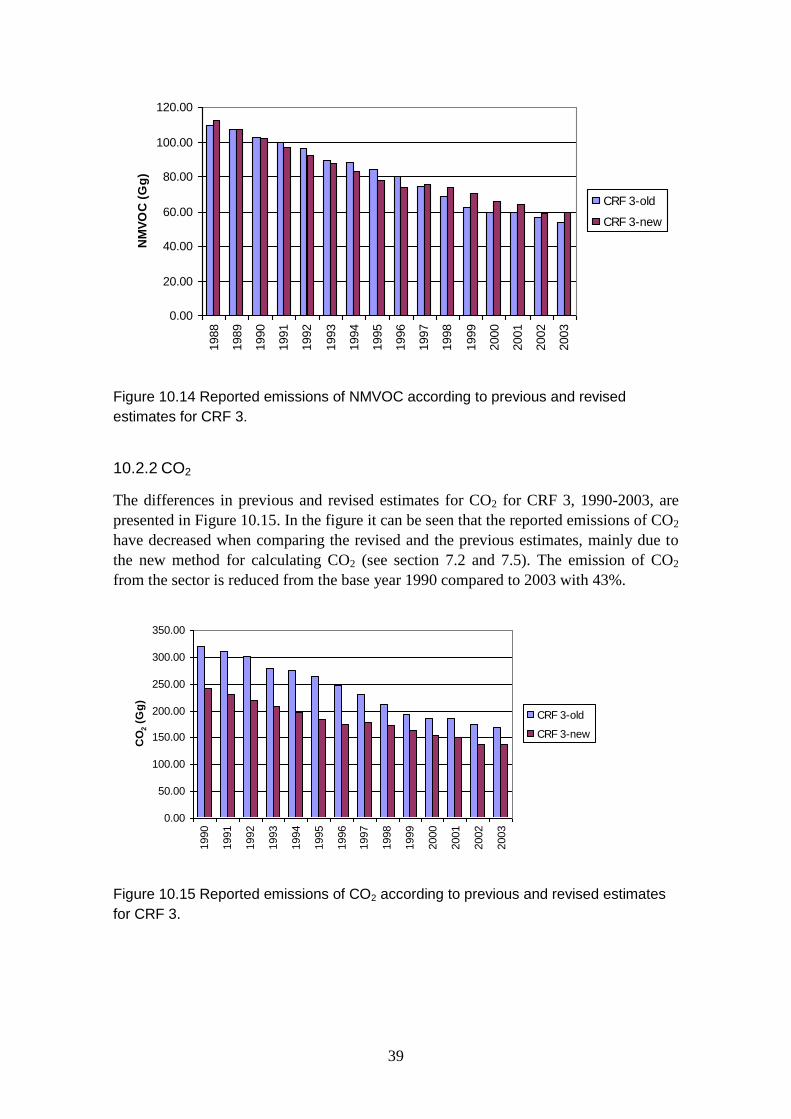
39
0.00
20.00
40.00
60.00
80.00
100.00
120.00
1988
1989
1990
1991
1992
1993
1994
1995
1996
1997
1998
1999
2000
2001
2002
2003
NM
VO
C (
Gg
)
CRF 3-old
CRF 3-new
Figure 10.14 Reported emissions of NMVOC according to previous and revised
estimates for CRF 3.
10.2.2 CO2
The differences in previous and revised estimates for CO2 for CRF 3, 1990-2003, are
presented in Figure 10.15. In the figure it can be seen that the reported emissions of CO2
have decreased when comparing the revised and the previous estimates, mainly due to
the new method for calculating CO2 (see section 7.2 and 7.5). The emission of CO2
from the sector is reduced from the base year 1990 compared to 2003 with 43%.
0.00
50.00
100.00
150.00
200.00
250.00
300.00
350.00
1990
1991
1992
1993
1994
1995
1996
1997
1998
1999
2000
2001
2002
2003
CO
2 (
Gg
)
CRF 3-old
CRF 3-new
Figure 10.15 Reported emissions of CO2 according to previous and revised estimates
for CRF 3.
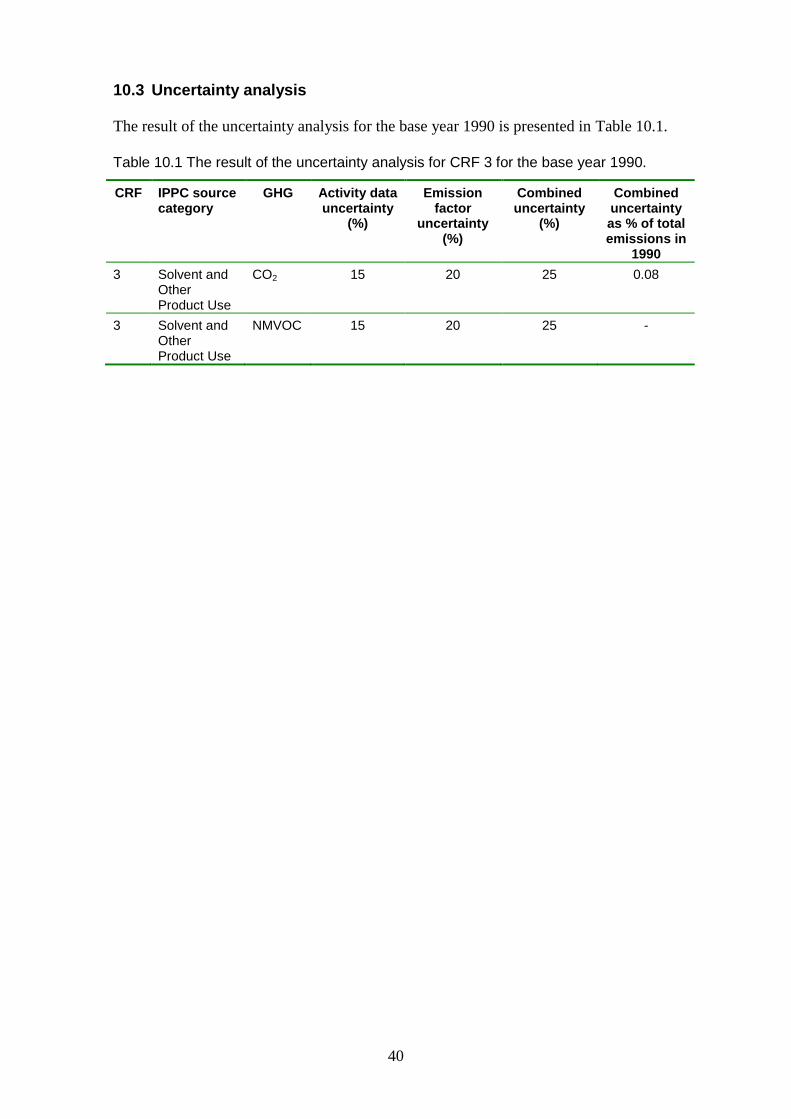
40
10.3 Uncertainty analysis
The result of the uncertainty analysis for the base year 1990 is presented in Table 10.1.
Table 10.1 The result of the uncertainty analysis for CRF 3 for the base year 1990.
CRF IPPC source category
GHG Activity data uncertainty
(%)
Emission factor
uncertainty (%)
Combined uncertainty
(%)
Combined uncertainty as % of total emissions in
1990
3 Solvent and Other Product Use
CO2 15 20 25 0.08
3 Solvent and Other Product Use
NMVOC 15 20 25 -
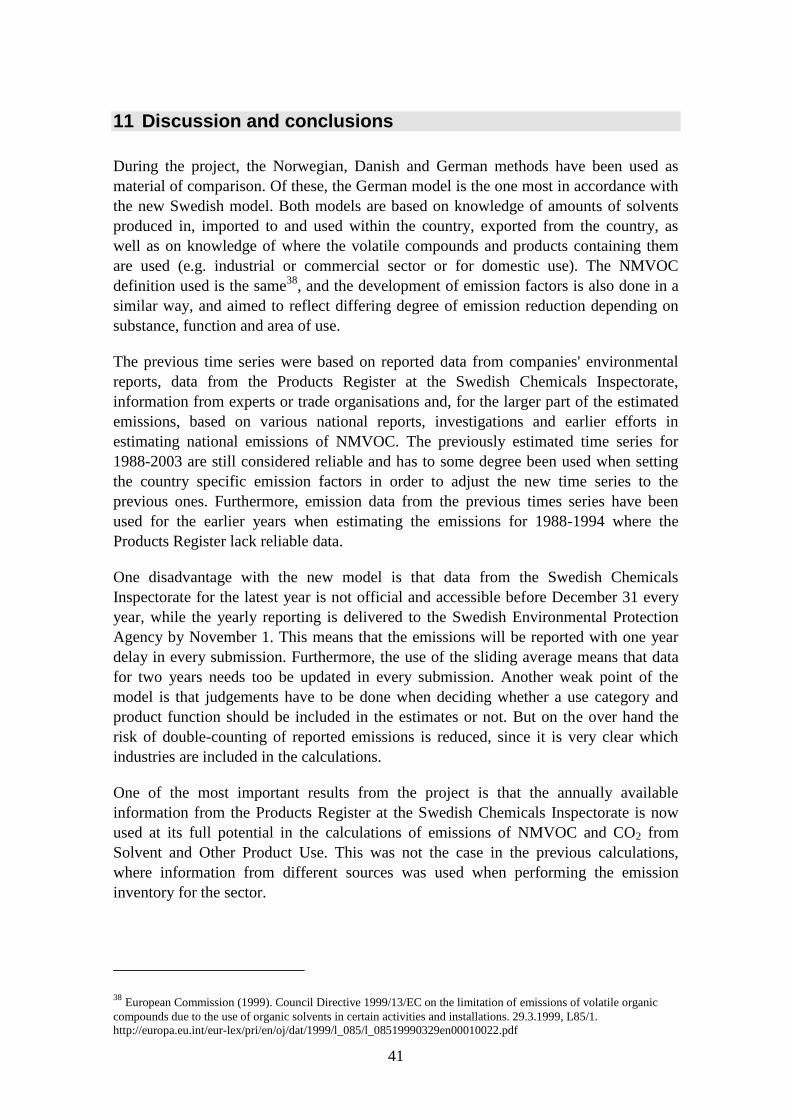
41
11 Discussion and conclusions
During the project, the Norwegian, Danish and German methods have been used as
material of comparison. Of these, the German model is the one most in accordance with
the new Swedish model. Both models are based on knowledge of amounts of solvents
produced in, imported to and used within the country, exported from the country, as
well as on knowledge of where the volatile compounds and products containing them
are used (e.g. industrial or commercial sector or for domestic use). The NMVOC
definition used is the same38
, and the development of emission factors is also done in a
similar way, and aimed to reflect differing degree of emission reduction depending on
substance, function and area of use.
The previous time series were based on reported data from companies' environmental
reports, data from the Products Register at the Swedish Chemicals Inspectorate,
information from experts or trade organisations and, for the larger part of the estimated
emissions, based on various national reports, investigations and earlier efforts in
estimating national emissions of NMVOC. The previously estimated time series for
1988-2003 are still considered reliable and has to some degree been used when setting
the country specific emission factors in order to adjust the new time series to the
previous ones. Furthermore, emission data from the previous times series have been
used for the earlier years when estimating the emissions for 1988-1994 where the
Products Register lack reliable data.
One disadvantage with the new model is that data from the Swedish Chemicals
Inspectorate for the latest year is not official and accessible before December 31 every
year, while the yearly reporting is delivered to the Swedish Environmental Protection
Agency by November 1. This means that the emissions will be reported with one year
delay in every submission. Furthermore, the use of the sliding average means that data
for two years needs too be updated in every submission. Another weak point of the
model is that judgements have to be done when deciding whether a use category and
product function should be included in the estimates or not. But on the over hand the
risk of double-counting of reported emissions is reduced, since it is very clear which
industries are included in the calculations.
One of the most important results from the project is that the annually available
information from the Products Register at the Swedish Chemicals Inspectorate is now
used at its full potential in the calculations of emissions of NMVOC and CO2 from
Solvent and Other Product Use. This was not the case in the previous calculations,
where information from different sources was used when performing the emission
inventory for the sector.
38 European Commission (1999). Council Directive 1999/13/EC on the limitation of emissions of volatile organic
compounds due to the use of organic solvents in certain activities and installations. 29.3.1999, L85/1.
http://europa.eu.int/eur-lex/pri/en/oj/dat/1999/l_085/l_08519990329en00010022.pdf
42
The estimates of CO2 are considered to be more accurate compared to the previous
estimates due to the direct carbon content in sold amount of NMVOC are used as input
information in the calculations. In the previous estimates a default value of 85% carbon
content in the NMVOC were used.
To conclude, the new Swedish method for estimating emissions of NMVOC and CO2
from Solvent and Other Product Use is more transparent, complete and better adapted to
its purposes compared to previous methods. The design of the model makes it easy to
adjust emission factors and include new years in the time series, which facilitates
consistent annual updates of time series in the future.
43
12 References
EEA (2004). EMEP/CORINAIR Emission Inventory Guidebook - 3rd edition September 2004
UPDATE. EEA Technical report No 30.
http://reports.eea.eu.int/EMEPCORINAIR4/en
EEA (2004). EMEP/CORINAIR Emission Inventory Guidebook - 3rd edition September 2004
UPDATE. EEA Technical report No 30.
http://reports.eea.eu.int/EMEPCORINAIR4/en/group_06.pdf
European Commission (1999). Council Directive 1999/13/EC on the limitation of emissions of
volatile organic compounds due to the use of organic solvents in certain activities and
installations. 29.3.1999, L85/1.
http://europa.eu.int/eur-lex/pri/en/oj/dat/1999/l_085/l_08519990329en00010022.pdf
European Commission (2004). Directive 2004/42/CE of the European Parliament and Council
on the limitation of emissions of volatile organic compounds due to the use of organic solvents
in certain paints and varnishes and vehicle refinishing products and amending Directive
1999/13/EC. 30.4.2004, L 143/87.
FCCC/CP/2002/8 (28 March 2003). Review of the implementation of commitments and of other
provisions of the convention. National communications: greenhouse gas inventories from
parties included in annex 1 to the convention UNFCCC guidelines on reporting and review.
Förordning (SFS 1998:941) om kemiska produkter och biotekniska organismer, 10-12§.
http://www.notisum.se/rnp/sls/lag/19980941.htm
IPCC (1997). Revised 1996 IPCC Guidelines for National Greenhouse Gas Inventories.
IPCC (2000). IPCC Good Practice Guidance and Uncertainty Management in National
Greenhouse Gas Inventories.
IPPC (2006). Second order Draft of 2006 Guidelines (unpublished).
Kemikalieinspektionens föreskrifter (KIFS 1998:8) om kemiska produkter och
biotekniska organismer; 7 kap. Anmälan till produktregistret, ISSN 0283-1937.
http://www.kemi.se/upload/Lagar%20m.m/KIFS/K98_8.pdf
Kindbom, K., Boström, C-Å., Skårman, T., Gustafsson, T. and Talonpoika, M. 2003. Estimated
Emissions of NMVOC in Sweden 1988-2001.
Miljöbalk, (SFS 1998:808),. 14 kap 10 §.
http://www.notisum.se/rnp/sls/lag/19980808.HTM
Pulles, T., Skákala, J., Svetlik, J. 1999. ReportER, User manual. Technical report No 32
European Environment Agency.
44
Rypdal, K. (1995). Løsemiddelbalanse for Norge. Utslipp, förbruk og metode, Statens
Forurensningstillsyn, SFT Rapport 95:02. ISBN 82-7655-271-4.
SPIN on the Internet Substances in Preparations in Nordic Countries.
http://www.spin2000.net/spin.html
Theloke, J., Friedrich, R. (2003). Development of an improved product based approach for the
calculation of NMVOC emissions from solvent use in Germany and uncertainty analysis. Paper
presented at the 12th International Emission Inventory Conference "Emission Inventories -
Applying New Technologies," San Diego, April 29 - May 1, 2003.
www.epa.gov/ttn/chief/conference/ei12/area/theloke.pdf
UNECE (1991). Convention on Long-range Transboundary Air Pollution, Protocol on the
Control of Emissions of Volatile Organic Compounds.
http://www.unece.org/env/lrtap/vola_h1.htm
UNECE (2003). Guidelines for Estimating and Reporting Emission Data under the Convention
on Long-range Transboundary Air Pollution. Air Pollution Studies No. 15, UNECE, Geneva.
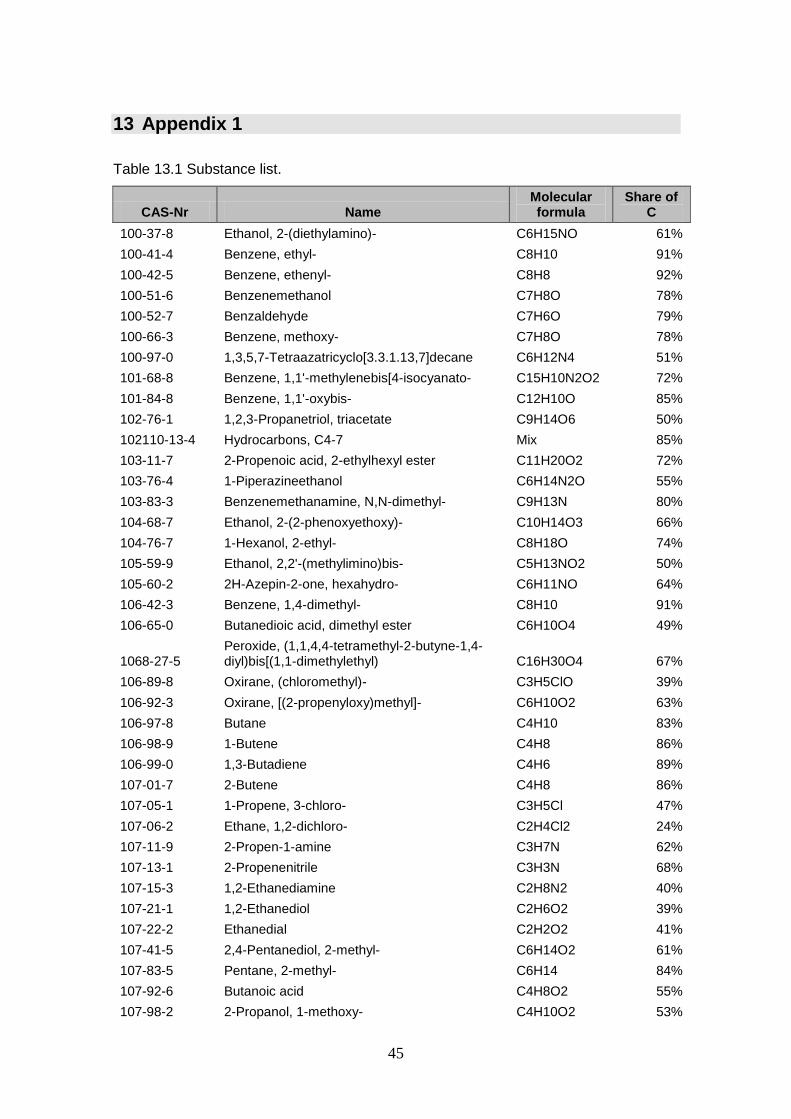
45
13 Appendix 1
Table 13.1 Substance list.
CAS-Nr Name Molecular formula
Share of C
100-37-8 Ethanol, 2-(diethylamino)- C6H15NO 61%
100-41-4 Benzene, ethyl- C8H10 91%
100-42-5 Benzene, ethenyl- C8H8 92%
100-51-6 Benzenemethanol C7H8O 78%
100-52-7 Benzaldehyde C7H6O 79%
100-66-3 Benzene, methoxy- C7H8O 78%
100-97-0 1,3,5,7-Tetraazatricyclo[3.3.1.13,7]decane C6H12N4 51%
101-68-8 Benzene, 1,1'-methylenebis[4-isocyanato- C15H10N2O2 72%
101-84-8 Benzene, 1,1'-oxybis- C12H10O 85%
102-76-1 1,2,3-Propanetriol, triacetate C9H14O6 50%
102110-13-4 Hydrocarbons, C4-7 Mix 85%
103-11-7 2-Propenoic acid, 2-ethylhexyl ester C11H20O2 72%
103-76-4 1-Piperazineethanol C6H14N2O 55%
103-83-3 Benzenemethanamine, N,N-dimethyl- C9H13N 80%
104-68-7 Ethanol, 2-(2-phenoxyethoxy)- C10H14O3 66%
104-76-7 1-Hexanol, 2-ethyl- C8H18O 74%
105-59-9 Ethanol, 2,2'-(methylimino)bis- C5H13NO2 50%
105-60-2 2H-Azepin-2-one, hexahydro- C6H11NO 64%
106-42-3 Benzene, 1,4-dimethyl- C8H10 91%
106-65-0 Butanedioic acid, dimethyl ester C6H10O4 49%
1068-27-5 Peroxide, (1,1,4,4-tetramethyl-2-butyne-1,4-diyl)bis[(1,1-dimethylethyl) C16H30O4 67%
106-89-8 Oxirane, (chloromethyl)- C3H5ClO 39%
106-92-3 Oxirane, [(2-propenyloxy)methyl]- C6H10O2 63%
106-97-8 Butane C4H10 83%
106-98-9 1-Butene C4H8 86%
106-99-0 1,3-Butadiene C4H6 89%
107-01-7 2-Butene C4H8 86%
107-05-1 1-Propene, 3-chloro- C3H5Cl 47%
107-06-2 Ethane, 1,2-dichloro- C2H4Cl2 24%
107-11-9 2-Propen-1-amine C3H7N 62%
107-13-1 2-Propenenitrile C3H3N 68%
107-15-3 1,2-Ethanediamine C2H8N2 40%
107-21-1 1,2-Ethanediol C2H6O2 39%
107-22-2 Ethanedial C2H2O2 41%
107-41-5 2,4-Pentanediol, 2-methyl- C6H14O2 61%
107-83-5 Pentane, 2-methyl- C6H14 84%
107-92-6 Butanoic acid C4H8O2 55%
107-98-2 2-Propanol, 1-methoxy- C4H10O2 53%
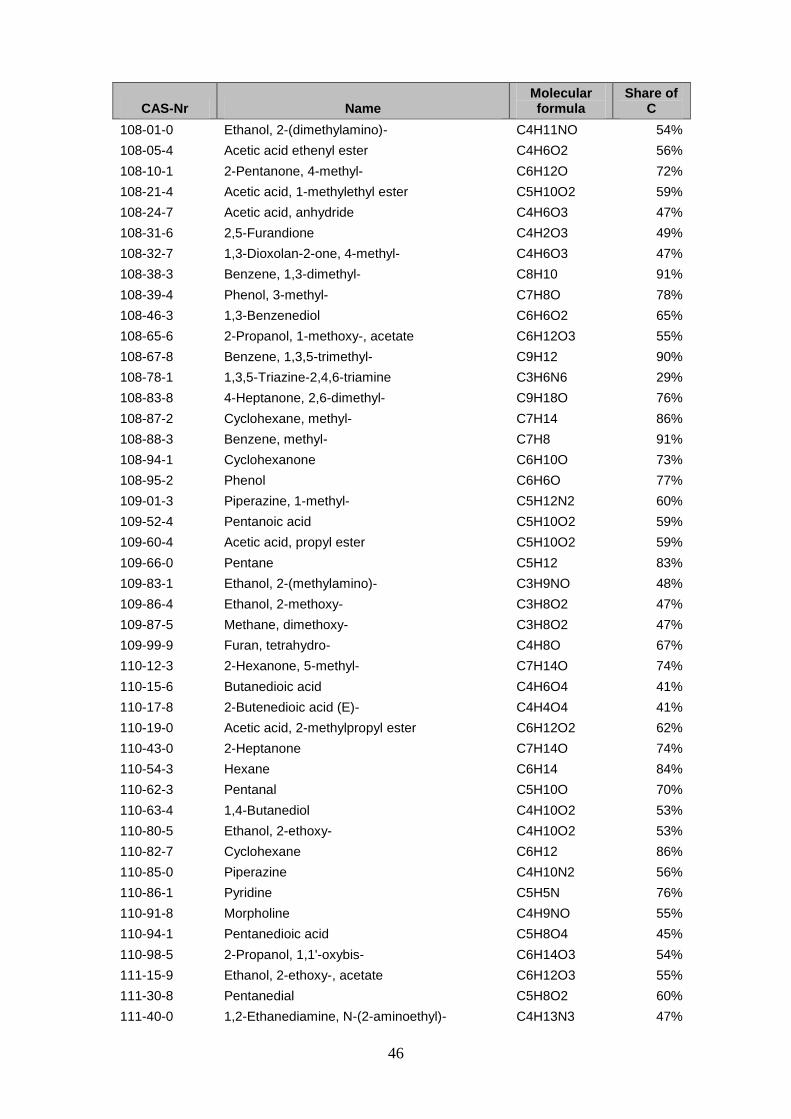
46
CAS-Nr Name Molecular formula
Share of C
108-01-0 Ethanol, 2-(dimethylamino)- C4H11NO 54%
108-05-4 Acetic acid ethenyl ester C4H6O2 56%
108-10-1 2-Pentanone, 4-methyl- C6H12O 72%
108-21-4 Acetic acid, 1-methylethyl ester C5H10O2 59%
108-24-7 Acetic acid, anhydride C4H6O3 47%
108-31-6 2,5-Furandione C4H2O3 49%
108-32-7 1,3-Dioxolan-2-one, 4-methyl- C4H6O3 47%
108-38-3 Benzene, 1,3-dimethyl- C8H10 91%
108-39-4 Phenol, 3-methyl- C7H8O 78%
108-46-3 1,3-Benzenediol C6H6O2 65%
108-65-6 2-Propanol, 1-methoxy-, acetate C6H12O3 55%
108-67-8 Benzene, 1,3,5-trimethyl- C9H12 90%
108-78-1 1,3,5-Triazine-2,4,6-triamine C3H6N6 29%
108-83-8 4-Heptanone, 2,6-dimethyl- C9H18O 76%
108-87-2 Cyclohexane, methyl- C7H14 86%
108-88-3 Benzene, methyl- C7H8 91%
108-94-1 Cyclohexanone C6H10O 73%
108-95-2 Phenol C6H6O 77%
109-01-3 Piperazine, 1-methyl- C5H12N2 60%
109-52-4 Pentanoic acid C5H10O2 59%
109-60-4 Acetic acid, propyl ester C5H10O2 59%
109-66-0 Pentane C5H12 83%
109-83-1 Ethanol, 2-(methylamino)- C3H9NO 48%
109-86-4 Ethanol, 2-methoxy- C3H8O2 47%
109-87-5 Methane, dimethoxy- C3H8O2 47%
109-99-9 Furan, tetrahydro- C4H8O 67%
110-12-3 2-Hexanone, 5-methyl- C7H14O 74%
110-15-6 Butanedioic acid C4H6O4 41%
110-17-8 2-Butenedioic acid (E)- C4H4O4 41%
110-19-0 Acetic acid, 2-methylpropyl ester C6H12O2 62%
110-43-0 2-Heptanone C7H14O 74%
110-54-3 Hexane C6H14 84%
110-62-3 Pentanal C5H10O 70%
110-63-4 1,4-Butanediol C4H10O2 53%
110-80-5 Ethanol, 2-ethoxy- C4H10O2 53%
110-82-7 Cyclohexane C6H12 86%
110-85-0 Piperazine C4H10N2 56%
110-86-1 Pyridine C5H5N 76%
110-91-8 Morpholine C4H9NO 55%
110-94-1 Pentanedioic acid C5H8O4 45%
110-98-5 2-Propanol, 1,1'-oxybis- C6H14O3 54%
111-15-9 Ethanol, 2-ethoxy-, acetate C6H12O3 55%
111-30-8 Pentanedial C5H8O2 60%
111-40-0 1,2-Ethanediamine, N-(2-aminoethyl)- C4H13N3 47%
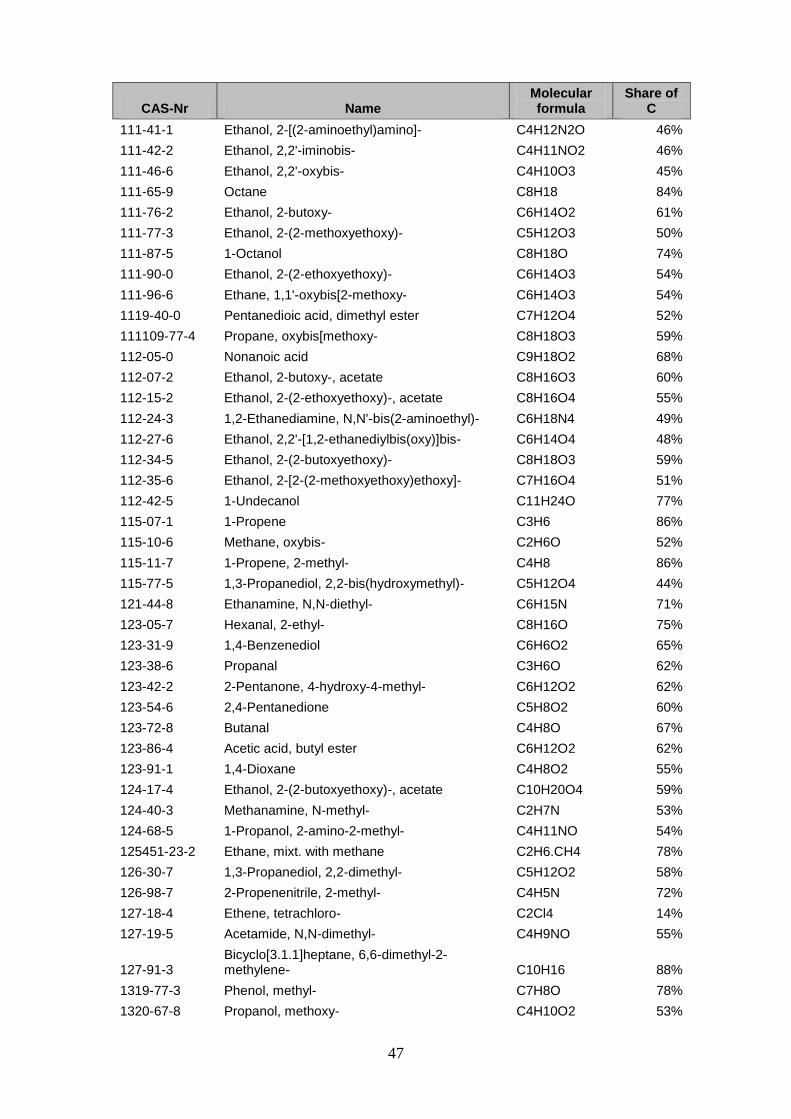
47
CAS-Nr Name Molecular formula
Share of C
111-41-1 Ethanol, 2-[(2-aminoethyl)amino]- C4H12N2O 46%
111-42-2 Ethanol, 2,2'-iminobis- C4H11NO2 46%
111-46-6 Ethanol, 2,2'-oxybis- C4H10O3 45%
111-65-9 Octane C8H18 84%
111-76-2 Ethanol, 2-butoxy- C6H14O2 61%
111-77-3 Ethanol, 2-(2-methoxyethoxy)- C5H12O3 50%
111-87-5 1-Octanol C8H18O 74%
111-90-0 Ethanol, 2-(2-ethoxyethoxy)- C6H14O3 54%
111-96-6 Ethane, 1,1'-oxybis[2-methoxy- C6H14O3 54%
1119-40-0 Pentanedioic acid, dimethyl ester C7H12O4 52%
111109-77-4 Propane, oxybis[methoxy- C8H18O3 59%
112-05-0 Nonanoic acid C9H18O2 68%
112-07-2 Ethanol, 2-butoxy-, acetate C8H16O3 60%
112-15-2 Ethanol, 2-(2-ethoxyethoxy)-, acetate C8H16O4 55%
112-24-3 1,2-Ethanediamine, N,N'-bis(2-aminoethyl)- C6H18N4 49%
112-27-6 Ethanol, 2,2'-[1,2-ethanediylbis(oxy)]bis- C6H14O4 48%
112-34-5 Ethanol, 2-(2-butoxyethoxy)- C8H18O3 59%
112-35-6 Ethanol, 2-[2-(2-methoxyethoxy)ethoxy]- C7H16O4 51%
112-42-5 1-Undecanol C11H24O 77%
115-07-1 1-Propene C3H6 86%
115-10-6 Methane, oxybis- C2H6O 52%
115-11-7 1-Propene, 2-methyl- C4H8 86%
115-77-5 1,3-Propanediol, 2,2-bis(hydroxymethyl)- C5H12O4 44%
121-44-8 Ethanamine, N,N-diethyl- C6H15N 71%
123-05-7 Hexanal, 2-ethyl- C8H16O 75%
123-31-9 1,4-Benzenediol C6H6O2 65%
123-38-6 Propanal C3H6O 62%
123-42-2 2-Pentanone, 4-hydroxy-4-methyl- C6H12O2 62%
123-54-6 2,4-Pentanedione C5H8O2 60%
123-72-8 Butanal C4H8O 67%
123-86-4 Acetic acid, butyl ester C6H12O2 62%
123-91-1 1,4-Dioxane C4H8O2 55%
124-17-4 Ethanol, 2-(2-butoxyethoxy)-, acetate C10H20O4 59%
124-40-3 Methanamine, N-methyl- C2H7N 53%
124-68-5 1-Propanol, 2-amino-2-methyl- C4H11NO 54%
125451-23-2 Ethane, mixt. with methane C2H6.CH4 78%
126-30-7 1,3-Propanediol, 2,2-dimethyl- C5H12O2 58%
126-98-7 2-Propenenitrile, 2-methyl- C4H5N 72%
127-18-4 Ethene, tetrachloro- C2Cl4 14%
127-19-5 Acetamide, N,N-dimethyl- C4H9NO 55%
127-91-3 Bicyclo[3.1.1]heptane, 6,6-dimethyl-2-methylene- C10H16 88%
1319-77-3 Phenol, methyl- C7H8O 78%
1320-67-8 Propanol, methoxy- C4H10O2 53%
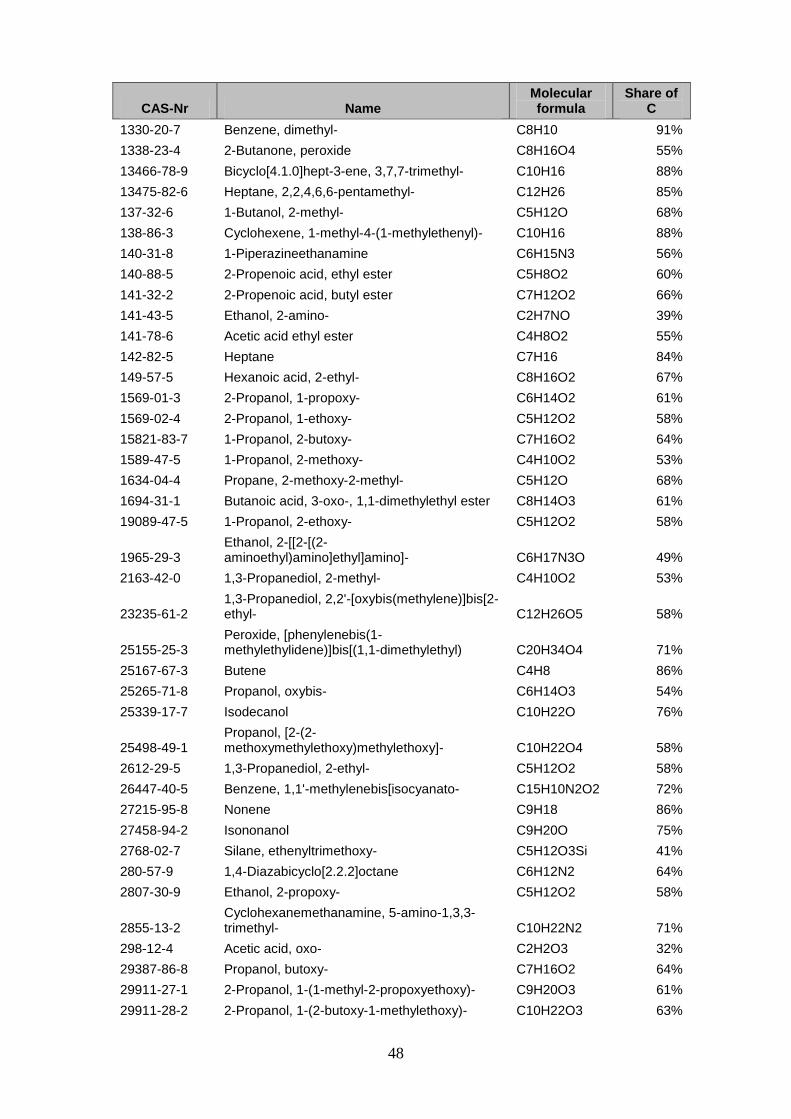
48
CAS-Nr Name Molecular formula
Share of C
1330-20-7 Benzene, dimethyl- C8H10 91%
1338-23-4 2-Butanone, peroxide C8H16O4 55%
13466-78-9 Bicyclo[4.1.0]hept-3-ene, 3,7,7-trimethyl- C10H16 88%
13475-82-6 Heptane, 2,2,4,6,6-pentamethyl- C12H26 85%
137-32-6 1-Butanol, 2-methyl- C5H12O 68%
138-86-3 Cyclohexene, 1-methyl-4-(1-methylethenyl)- C10H16 88%
140-31-8 1-Piperazineethanamine C6H15N3 56%
140-88-5 2-Propenoic acid, ethyl ester C5H8O2 60%
141-32-2 2-Propenoic acid, butyl ester C7H12O2 66%
141-43-5 Ethanol, 2-amino- C2H7NO 39%
141-78-6 Acetic acid ethyl ester C4H8O2 55%
142-82-5 Heptane C7H16 84%
149-57-5 Hexanoic acid, 2-ethyl- C8H16O2 67%
1569-01-3 2-Propanol, 1-propoxy- C6H14O2 61%
1569-02-4 2-Propanol, 1-ethoxy- C5H12O2 58%
15821-83-7 1-Propanol, 2-butoxy- C7H16O2 64%
1589-47-5 1-Propanol, 2-methoxy- C4H10O2 53%
1634-04-4 Propane, 2-methoxy-2-methyl- C5H12O 68%
1694-31-1 Butanoic acid, 3-oxo-, 1,1-dimethylethyl ester C8H14O3 61%
19089-47-5 1-Propanol, 2-ethoxy- C5H12O2 58%
1965-29-3 Ethanol, 2-[[2-[(2-aminoethyl)amino]ethyl]amino]- C6H17N3O 49%
2163-42-0 1,3-Propanediol, 2-methyl- C4H10O2 53%
23235-61-2 1,3-Propanediol, 2,2'-[oxybis(methylene)]bis[2-ethyl- C12H26O5 58%
25155-25-3 Peroxide, [phenylenebis(1-methylethylidene)]bis[(1,1-dimethylethyl) C20H34O4 71%
25167-67-3 Butene C4H8 86%
25265-71-8 Propanol, oxybis- C6H14O3 54%
25339-17-7 Isodecanol C10H22O 76%
25498-49-1 Propanol, [2-(2-methoxymethylethoxy)methylethoxy]- C10H22O4 58%
2612-29-5 1,3-Propanediol, 2-ethyl- C5H12O2 58%
26447-40-5 Benzene, 1,1'-methylenebis[isocyanato- C15H10N2O2 72%
27215-95-8 Nonene C9H18 86%
27458-94-2 Isononanol C9H20O 75%
2768-02-7 Silane, ethenyltrimethoxy- C5H12O3Si 41%
280-57-9 1,4-Diazabicyclo[2.2.2]octane C6H12N2 64%
2807-30-9 Ethanol, 2-propoxy- C5H12O2 58%
2855-13-2 Cyclohexanemethanamine, 5-amino-1,3,3-trimethyl- C10H22N2 71%
298-12-4 Acetic acid, oxo- C2H2O3 32%
29387-86-8 Propanol, butoxy- C7H16O2 64%
29911-27-1 2-Propanol, 1-(1-methyl-2-propoxyethoxy)- C9H20O3 61%
29911-28-2 2-Propanol, 1-(2-butoxy-1-methylethoxy)- C10H22O3 63%
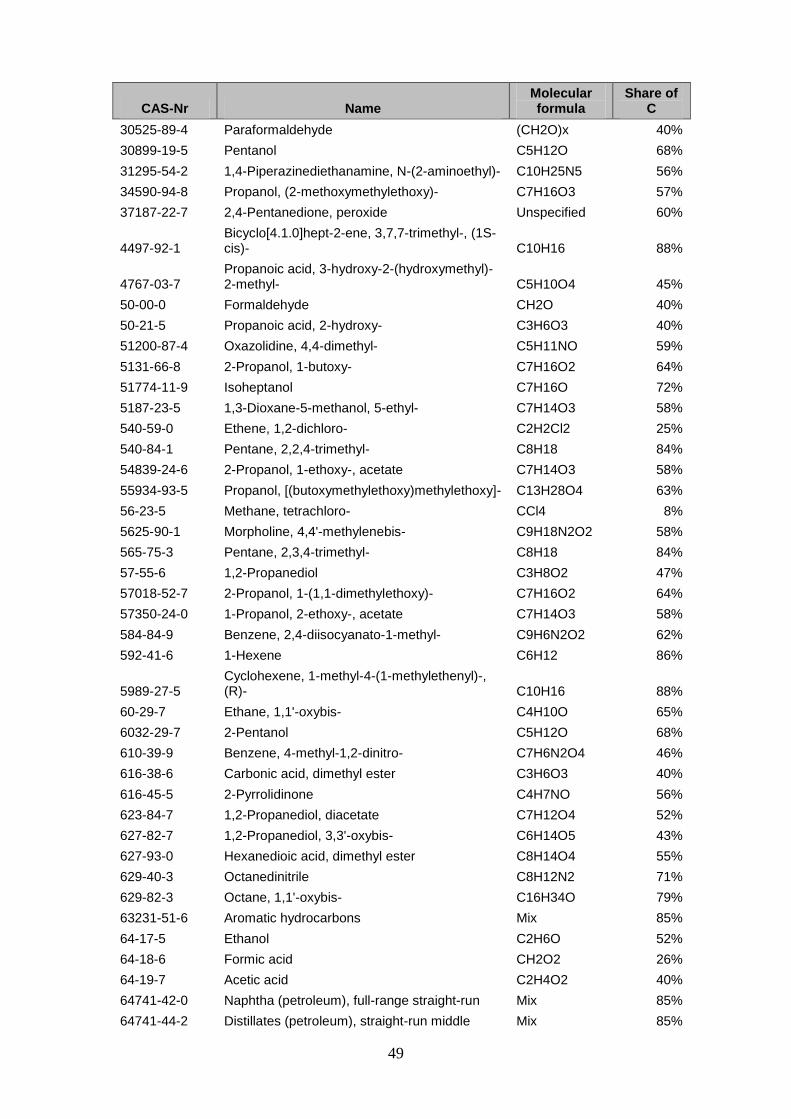
49
CAS-Nr Name Molecular formula
Share of C
30525-89-4 Paraformaldehyde (CH2O)x 40%
30899-19-5 Pentanol C5H12O 68%
31295-54-2 1,4-Piperazinediethanamine, N-(2-aminoethyl)- C10H25N5 56%
34590-94-8 Propanol, (2-methoxymethylethoxy)- C7H16O3 57%
37187-22-7 2,4-Pentanedione, peroxide Unspecified 60%
4497-92-1 Bicyclo[4.1.0]hept-2-ene, 3,7,7-trimethyl-, (1S-cis)- C10H16 88%
4767-03-7 Propanoic acid, 3-hydroxy-2-(hydroxymethyl)-2-methyl- C5H10O4 45%
50-00-0 Formaldehyde CH2O 40%
50-21-5 Propanoic acid, 2-hydroxy- C3H6O3 40%
51200-87-4 Oxazolidine, 4,4-dimethyl- C5H11NO 59%
5131-66-8 2-Propanol, 1-butoxy- C7H16O2 64%
51774-11-9 Isoheptanol C7H16O 72%
5187-23-5 1,3-Dioxane-5-methanol, 5-ethyl- C7H14O3 58%
540-59-0 Ethene, 1,2-dichloro- C2H2Cl2 25%
540-84-1 Pentane, 2,2,4-trimethyl- C8H18 84%
54839-24-6 2-Propanol, 1-ethoxy-, acetate C7H14O3 58%
55934-93-5 Propanol, [(butoxymethylethoxy)methylethoxy]- C13H28O4 63%
56-23-5 Methane, tetrachloro- CCl4 8%
5625-90-1 Morpholine, 4,4'-methylenebis- C9H18N2O2 58%
565-75-3 Pentane, 2,3,4-trimethyl- C8H18 84%
57-55-6 1,2-Propanediol C3H8O2 47%
57018-52-7 2-Propanol, 1-(1,1-dimethylethoxy)- C7H16O2 64%
57350-24-0 1-Propanol, 2-ethoxy-, acetate C7H14O3 58%
584-84-9 Benzene, 2,4-diisocyanato-1-methyl- C9H6N2O2 62%
592-41-6 1-Hexene C6H12 86%
5989-27-5 Cyclohexene, 1-methyl-4-(1-methylethenyl)-, (R)- C10H16 88%
60-29-7 Ethane, 1,1'-oxybis- C4H10O 65%
6032-29-7 2-Pentanol C5H12O 68%
610-39-9 Benzene, 4-methyl-1,2-dinitro- C7H6N2O4 46%
616-38-6 Carbonic acid, dimethyl ester C3H6O3 40%
616-45-5 2-Pyrrolidinone C4H7NO 56%
623-84-7 1,2-Propanediol, diacetate C7H12O4 52%
627-82-7 1,2-Propanediol, 3,3'-oxybis- C6H14O5 43%
627-93-0 Hexanedioic acid, dimethyl ester C8H14O4 55%
629-40-3 Octanedinitrile C8H12N2 71%
629-82-3 Octane, 1,1'-oxybis- C16H34O 79%
63231-51-6 Aromatic hydrocarbons Mix 85%
64-17-5 Ethanol C2H6O 52%
64-18-6 Formic acid CH2O2 26%
64-19-7 Acetic acid C2H4O2 40%
64741-42-0 Naphtha (petroleum), full-range straight-run Mix 85%
64741-44-2 Distillates (petroleum), straight-run middle Mix 85%
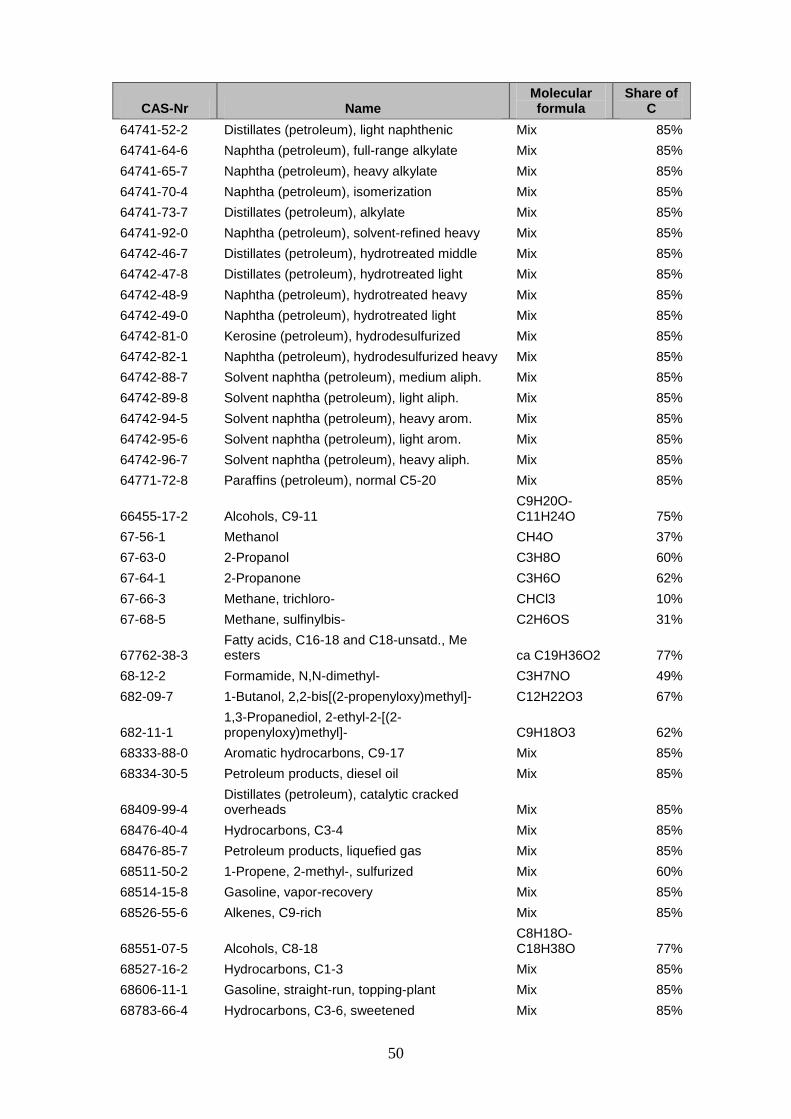
50
CAS-Nr Name Molecular formula
Share of C
64741-52-2 Distillates (petroleum), light naphthenic Mix 85%
64741-64-6 Naphtha (petroleum), full-range alkylate Mix 85%
64741-65-7 Naphtha (petroleum), heavy alkylate Mix 85%
64741-70-4 Naphtha (petroleum), isomerization Mix 85%
64741-73-7 Distillates (petroleum), alkylate Mix 85%
64741-92-0 Naphtha (petroleum), solvent-refined heavy Mix 85%
64742-46-7 Distillates (petroleum), hydrotreated middle Mix 85%
64742-47-8 Distillates (petroleum), hydrotreated light Mix 85%
64742-48-9 Naphtha (petroleum), hydrotreated heavy Mix 85%
64742-49-0 Naphtha (petroleum), hydrotreated light Mix 85%
64742-81-0 Kerosine (petroleum), hydrodesulfurized Mix 85%
64742-82-1 Naphtha (petroleum), hydrodesulfurized heavy Mix 85%
64742-88-7 Solvent naphtha (petroleum), medium aliph. Mix 85%
64742-89-8 Solvent naphtha (petroleum), light aliph. Mix 85%
64742-94-5 Solvent naphtha (petroleum), heavy arom. Mix 85%
64742-95-6 Solvent naphtha (petroleum), light arom. Mix 85%
64742-96-7 Solvent naphtha (petroleum), heavy aliph. Mix 85%
64771-72-8 Paraffins (petroleum), normal C5-20 Mix 85%
66455-17-2 Alcohols, C9-11 C9H20O-C11H24O 75%
67-56-1 Methanol CH4O 37%
67-63-0 2-Propanol C3H8O 60%
67-64-1 2-Propanone C3H6O 62%
67-66-3 Methane, trichloro- CHCl3 10%
67-68-5 Methane, sulfinylbis- C2H6OS 31%
67762-38-3 Fatty acids, C16-18 and C18-unsatd., Me esters ca C19H36O2 77%
68-12-2 Formamide, N,N-dimethyl- C3H7NO 49%
682-09-7 1-Butanol, 2,2-bis[(2-propenyloxy)methyl]- C12H22O3 67%
682-11-1 1,3-Propanediol, 2-ethyl-2-[(2-propenyloxy)methyl]- C9H18O3 62%
68333-88-0 Aromatic hydrocarbons, C9-17 Mix 85%
68334-30-5 Petroleum products, diesel oil Mix 85%
68409-99-4 Distillates (petroleum), catalytic cracked overheads Mix 85%
68476-40-4 Hydrocarbons, C3-4 Mix 85%
68476-85-7 Petroleum products, liquefied gas Mix 85%
68511-50-2 1-Propene, 2-methyl-, sulfurized Mix 60%
68514-15-8 Gasoline, vapor-recovery Mix 85%
68526-55-6 Alkenes, C9-rich Mix 85%
68551-07-5 Alcohols, C8-18 C8H18O-C18H38O 77%
68527-16-2 Hydrocarbons, C1-3 Mix 85%
68606-11-1 Gasoline, straight-run, topping-plant Mix 85%
68783-66-4 Hydrocarbons, C3-6, sweetened Mix 85%
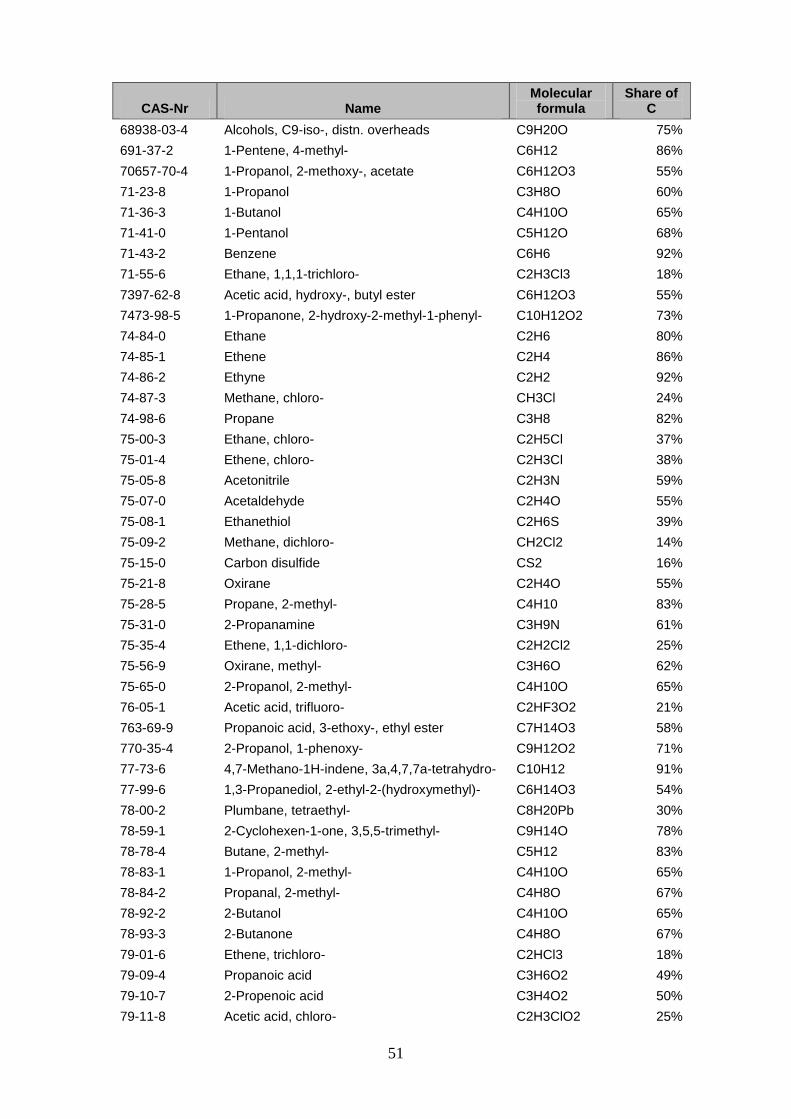
51
CAS-Nr Name Molecular formula
Share of C
68938-03-4 Alcohols, C9-iso-, distn. overheads C9H20O 75%
691-37-2 1-Pentene, 4-methyl- C6H12 86%
70657-70-4 1-Propanol, 2-methoxy-, acetate C6H12O3 55%
71-23-8 1-Propanol C3H8O 60%
71-36-3 1-Butanol C4H10O 65%
71-41-0 1-Pentanol C5H12O 68%
71-43-2 Benzene C6H6 92%
71-55-6 Ethane, 1,1,1-trichloro- C2H3Cl3 18%
7397-62-8 Acetic acid, hydroxy-, butyl ester C6H12O3 55%
7473-98-5 1-Propanone, 2-hydroxy-2-methyl-1-phenyl- C10H12O2 73%
74-84-0 Ethane C2H6 80%
74-85-1 Ethene C2H4 86%
74-86-2 Ethyne C2H2 92%
74-87-3 Methane, chloro- CH3Cl 24%
74-98-6 Propane C3H8 82%
75-00-3 Ethane, chloro- C2H5Cl 37%
75-01-4 Ethene, chloro- C2H3Cl 38%
75-05-8 Acetonitrile C2H3N 59%
75-07-0 Acetaldehyde C2H4O 55%
75-08-1 Ethanethiol C2H6S 39%
75-09-2 Methane, dichloro- CH2Cl2 14%
75-15-0 Carbon disulfide CS2 16%
75-21-8 Oxirane C2H4O 55%
75-28-5 Propane, 2-methyl- C4H10 83%
75-31-0 2-Propanamine C3H9N 61%
75-35-4 Ethene, 1,1-dichloro- C2H2Cl2 25%
75-56-9 Oxirane, methyl- C3H6O 62%
75-65-0 2-Propanol, 2-methyl- C4H10O 65%
76-05-1 Acetic acid, trifluoro- C2HF3O2 21%
763-69-9 Propanoic acid, 3-ethoxy-, ethyl ester C7H14O3 58%
770-35-4 2-Propanol, 1-phenoxy- C9H12O2 71%
77-73-6 4,7-Methano-1H-indene, 3a,4,7,7a-tetrahydro- C10H12 91%
77-99-6 1,3-Propanediol, 2-ethyl-2-(hydroxymethyl)- C6H14O3 54%
78-00-2 Plumbane, tetraethyl- C8H20Pb 30%
78-59-1 2-Cyclohexen-1-one, 3,5,5-trimethyl- C9H14O 78%
78-78-4 Butane, 2-methyl- C5H12 83%
78-83-1 1-Propanol, 2-methyl- C4H10O 65%
78-84-2 Propanal, 2-methyl- C4H8O 67%
78-92-2 2-Butanol C4H10O 65%
78-93-3 2-Butanone C4H8O 67%
79-01-6 Ethene, trichloro- C2HCl3 18%
79-09-4 Propanoic acid C3H6O2 49%
79-10-7 2-Propenoic acid C3H4O2 50%
79-11-8 Acetic acid, chloro- C2H3ClO2 25%
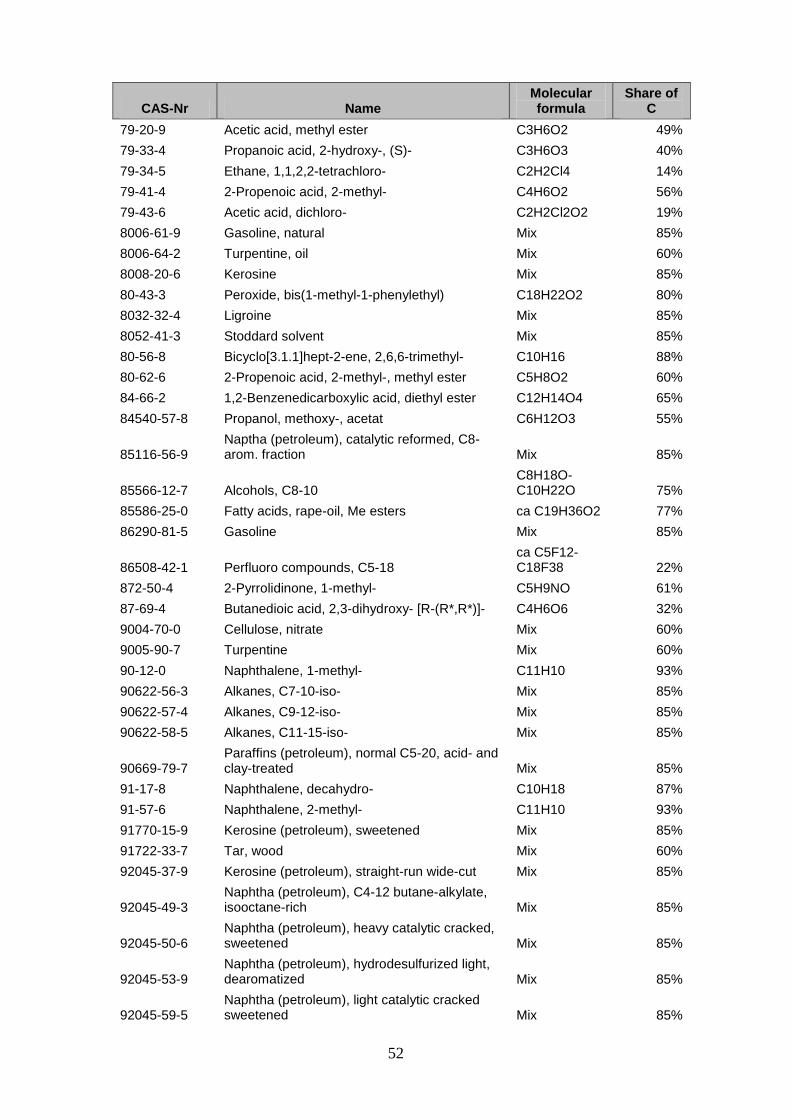
52
CAS-Nr Name Molecular formula
Share of C
79-20-9 Acetic acid, methyl ester C3H6O2 49%
79-33-4 Propanoic acid, 2-hydroxy-, (S)- C3H6O3 40%
79-34-5 Ethane, 1,1,2,2-tetrachloro- C2H2Cl4 14%
79-41-4 2-Propenoic acid, 2-methyl- C4H6O2 56%
79-43-6 Acetic acid, dichloro- C2H2Cl2O2 19%
8006-61-9 Gasoline, natural Mix 85%
8006-64-2 Turpentine, oil Mix 60%
8008-20-6 Kerosine Mix 85%
80-43-3 Peroxide, bis(1-methyl-1-phenylethyl) C18H22O2 80%
8032-32-4 Ligroine Mix 85%
8052-41-3 Stoddard solvent Mix 85%
80-56-8 Bicyclo[3.1.1]hept-2-ene, 2,6,6-trimethyl- C10H16 88%
80-62-6 2-Propenoic acid, 2-methyl-, methyl ester C5H8O2 60%
84-66-2 1,2-Benzenedicarboxylic acid, diethyl ester C12H14O4 65%
84540-57-8 Propanol, methoxy-, acetat C6H12O3 55%
85116-56-9 Naptha (petroleum), catalytic reformed, C8-arom. fraction Mix 85%
85566-12-7 Alcohols, C8-10 C8H18O-C10H22O 75%
85586-25-0 Fatty acids, rape-oil, Me esters ca C19H36O2 77%
86290-81-5 Gasoline Mix 85%
86508-42-1 Perfluoro compounds, C5-18 ca C5F12-C18F38 22%
872-50-4 2-Pyrrolidinone, 1-methyl- C5H9NO 61%
87-69-4 Butanedioic acid, 2,3-dihydroxy- [R-(R*,R*)]- C4H6O6 32%
9004-70-0 Cellulose, nitrate Mix 60%
9005-90-7 Turpentine Mix 60%
90-12-0 Naphthalene, 1-methyl- C11H10 93%
90622-56-3 Alkanes, C7-10-iso- Mix 85%
90622-57-4 Alkanes, C9-12-iso- Mix 85%
90622-58-5 Alkanes, C11-15-iso- Mix 85%
90669-79-7 Paraffins (petroleum), normal C5-20, acid- and clay-treated Mix 85%
91-17-8 Naphthalene, decahydro- C10H18 87%
91-57-6 Naphthalene, 2-methyl- C11H10 93%
91770-15-9 Kerosine (petroleum), sweetened Mix 85%
91722-33-7 Tar, wood Mix 60%
92045-37-9 Kerosine (petroleum), straight-run wide-cut Mix 85%
92045-49-3 Naphtha (petroleum), C4-12 butane-alkylate, isooctane-rich Mix 85%
92045-50-6 Naphtha (petroleum), heavy catalytic cracked, sweetened Mix 85%
92045-53-9 Naphtha (petroleum), hydrodesulfurized light, dearomatized Mix 85%
92045-59-5 Naphtha (petroleum), light catalytic cracked sweetened Mix 85%
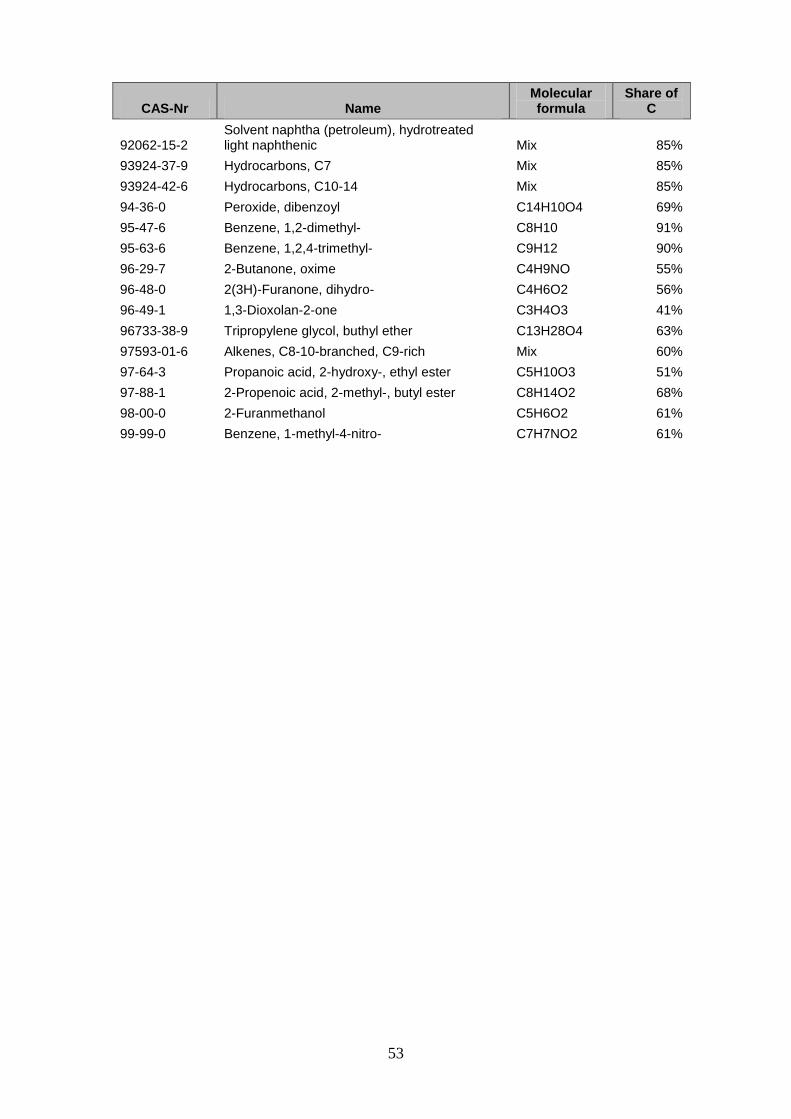
53
CAS-Nr Name Molecular formula
Share of C
92062-15-2 Solvent naphtha (petroleum), hydrotreated light naphthenic Mix 85%
93924-37-9 Hydrocarbons, C7 Mix 85%
93924-42-6 Hydrocarbons, C10-14 Mix 85%
94-36-0 Peroxide, dibenzoyl C14H10O4 69%
95-47-6 Benzene, 1,2-dimethyl- C8H10 91%
95-63-6 Benzene, 1,2,4-trimethyl- C9H12 90%
96-29-7 2-Butanone, oxime C4H9NO 55%
96-48-0 2(3H)-Furanone, dihydro- C4H6O2 56%
96-49-1 1,3-Dioxolan-2-one C3H4O3 41%
96733-38-9 Tripropylene glycol, buthyl ether C13H28O4 63%
97593-01-6 Alkenes, C8-10-branched, C9-rich Mix 60%
97-64-3 Propanoic acid, 2-hydroxy-, ethyl ester C5H10O3 51%
97-88-1 2-Propenoic acid, 2-methyl-, butyl ester C8H14O2 68%
98-00-0 2-Furanmethanol C5H6O2 61%
99-99-0 Benzene, 1-methyl-4-nitro- C7H7NO2 61%

54
14 Appendix 2
Table 14.1 Country specific emission factors for CRF 3A-C.
Year
3A Paint Application-industry
3A Paint Application- consumers
3B Degreasing and Dry Cleaning 3C-Car manufacturing 3C - Rubber industry 3C - Paint industry
Remaining Raw material Remaining
Raw material Remaining
Raw material Remaining
Raw material Remaining
Raw material Remaining
Raw material
1988 0.57 0.001
1989 0.57 0.001
1990 0.57 0.001
1991 0.57 0.001
1992 0.57 0.001
1993 0.57 0.001
1994 0.57 0.001
1995 0.95 0.001 0.95 0.001 0.57 0.001 0.5 0.001 0.3 0.001 0.0035 0.001
1996 0.95 0.001 0.95 0.001 0.57 0.001 0.46 0.001 0.29 0.001 0.0034 0.001
1997 0.95 0.001 0.95 0.001 0.57 0.001 0.42 0.001 0.29 0.001 0.0033 0.001
1998 0.8 0.001 0.95 0.001 0.57 0.001 0.38 0.001 0.28 0.001 0.0031 0.001
1999 0.6 0.001 0.95 0.001 0.57 0.001 0.33 0.001 0.28 0.001 0.0030 0.001
2000 0.6 0.001 0.95 0.001 0.57 0.001 0.29 0.001 0.27 0.001 0.0029 0.001
2001 0.55 0.001 0.95 0.001 0.57 0.001 0.25 0.001 0.26 0.001 0.0028 0.001
2002 0.4 0.001 0.95 0.001 0.57 0.001 0.2 0.001 0.26 0.001 0.0026 0.001
2003 0.3 0.001 0.95 0.001 0.57 0.001 0.2 0.001 0.25 0.001 0.0025 0.001
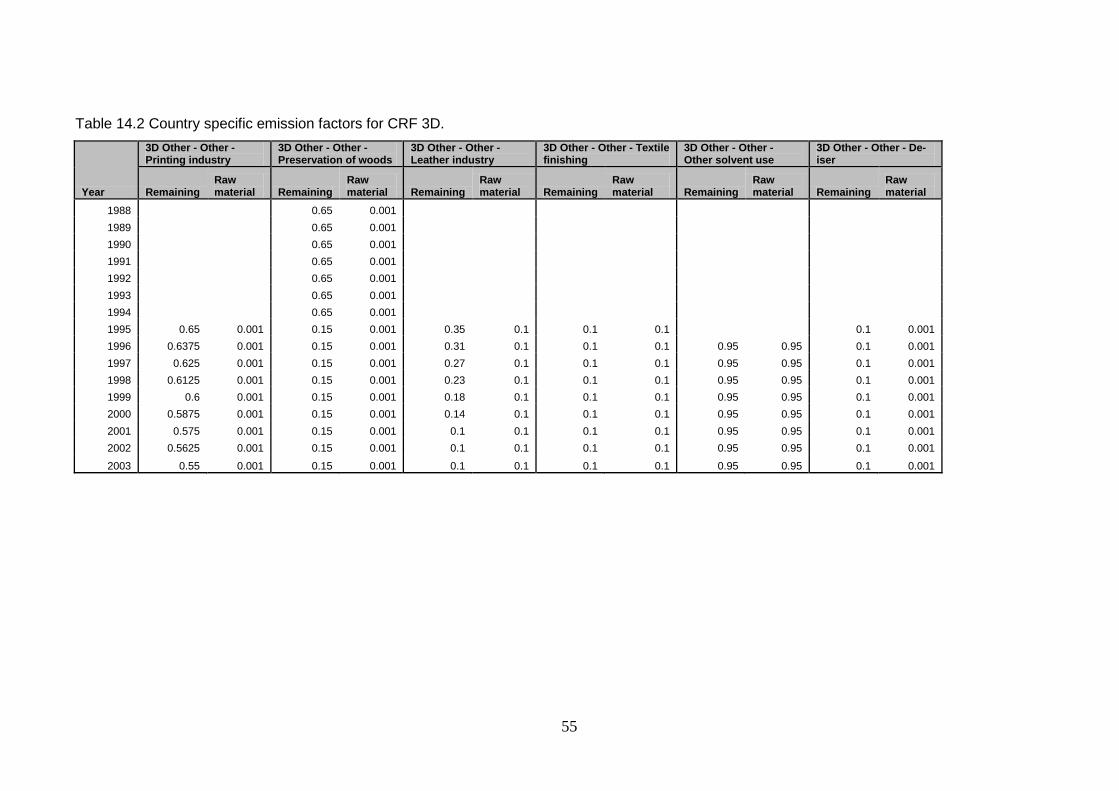
55
Table 14.2 Country specific emission factors for CRF 3D.
Year
3D Other - Other - Printing industry
3D Other - Other - Preservation of woods
3D Other - Other - Leather industry
3D Other - Other - Textile finishing
3D Other - Other - Other solvent use
3D Other - Other - De-iser
Remaining Raw material Remaining
Raw material Remaining
Raw material Remaining
Raw material Remaining
Raw material Remaining
Raw material
1988 0.65 0.001
1989 0.65 0.001
1990 0.65 0.001
1991 0.65 0.001
1992 0.65 0.001
1993 0.65 0.001
1994 0.65 0.001
1995 0.65 0.001 0.15 0.001 0.35 0.1 0.1 0.1 0.1 0.001
1996 0.6375 0.001 0.15 0.001 0.31 0.1 0.1 0.1 0.95 0.95 0.1 0.001
1997 0.625 0.001 0.15 0.001 0.27 0.1 0.1 0.1 0.95 0.95 0.1 0.001
1998 0.6125 0.001 0.15 0.001 0.23 0.1 0.1 0.1 0.95 0.95 0.1 0.001
1999 0.6 0.001 0.15 0.001 0.18 0.1 0.1 0.1 0.95 0.95 0.1 0.001
2000 0.5875 0.001 0.15 0.001 0.14 0.1 0.1 0.1 0.95 0.95 0.1 0.001
2001 0.575 0.001 0.15 0.001 0.1 0.1 0.1 0.1 0.95 0.95 0.1 0.001
2002 0.5625 0.001 0.15 0.001 0.1 0.1 0.1 0.1 0.95 0.95 0.1 0.001
2003 0.55 0.001 0.15 0.001 0.1 0.1 0.1 0.1 0.95 0.95 0.1 0.001

Top Related
Copyright © 2022 FDOKUMEN

