


Bahasa
Halaman
Hukum

(This is a sample cover image for this issue. The actual cover is not yet available at this time.)
This article appeared in a journal published by Elsevier. The attachedcopy is furnished to the author for internal non-commercial researchand education use, including for instruction at the authors institution
and sharing with colleagues.
Other uses, including reproduction and distribution, or selling orlicensing copies, or posting to personal, institutional or third party
websites are prohibited.
In most cases authors are permitted to post their version of thearticle (e.g. in Word or Tex form) to their personal website orinstitutional repository. Authors requiring further information
regarding Elsevier’s archiving and manuscript policies areencouraged to visit:
http://www.elsevier.com/copyright
Author's personal copy
Reviewing the need for gaming in education to accommodate the net generation
G. Bekebrede, H.J.G. Warmelink*, I.S. MayerDelft University of Technology, Faculty of Technology, Policy and Management, PO Box 5015, 2600 GA, Delft, The Netherlands
a r t i c l e i n f o
Article history:Received 15 December 2010Received in revised form15 February 2011Accepted 18 February 2011
Keywords:Cooperative/collaborative learningInteractive learning environmentsSimulationsTeaching/learning strategies
a b s t r a c t
There is a growing interest in the use of simulations and games in Dutch higher education. Thisdevelopment is based on the perception that students belong to the ‘gamer generation’ or ‘net gener-ation’: a generation that has grown up with computer games and other technology affecting theirpreferred learning styles, social interaction patterns and technology use generally. It is often argued thatin education this generation prefers active, collaborative and technology-rich learning, i.e. learningmethods that involve extensive computer use and collaboration among students. Gaming is thenproposed as a new teaching method which addresses these requirements. This article presents theresults of a survey which studied whether this discourse is also applicable to higher education studentsfrom the Netherlands and whether games, considered as active, collaborative and technology-richlearning experiences, are of greater importance in the formal education of today’s students. Of 1432respondents from eight Dutch institutes of higher education surveyed between 2005 and 2009, about25% fit our criteria of being a clear representative of the net generation. Furthermore, our analysis showsthat there is little difference, and no statistically significant difference, in active, collaborative andtechnology-rich learning preferences between the representatives and non-representatives of the netgeneration. Furthermore, no large or statistically significant differences were found between represen-tatives and non-representatives of the net generation with respect to the value they accorded to gamingin education. Overall our dataset did not fit the expectations raised by the net generation theory, with thepercentage of students who fit the criteria being much lower than expected. However, regardless ofwhether they represented the net generation or not, in general our respondents preferred collaborativeand technology-rich learning and deemed games a valuable teaching method.
� 2011 Elsevier Ltd. All rights reserved.
1. Introduction
Dutch higher education has undergone considerable change over the past years. Throughout numerous institutes of Dutch highereducation, we have observed increased interest in and use of simulations and games (including their combined use). The increased interestis evident first and foremost from the initiation and outcomes of numerous governmentally funded and educationally focused gameresearch and development projects (GATE, 2011; Mayer, Bekebrede, Stegers-Jager, 2007; Programmabureau Maatschappelijke Sectoren &ICT, 2011; Warmelink & Mayer, 2009). This interest is not only visible in Dutch higher education but can also be observed in otherWestern countries such as the USA, the UK and Canada. One way to explain the increase in the use of computer simulations and games inhigher education is the popularity of computer gaming as entertainment in the Netherlands and the world in general. The fact that gamingrequires and elicits learning, fuels a perception that educational institutes can and need to adopt gaming technology and the accompanyingprinciples of use to ensure the appeal and thus the learning effect of the educational programmes offered.
Educators and educational policymakers havemany influential publications towhich they can refer in support of such perceptions. Thesepublications adopt discourses that stress the uniqueness of those who extensively adopt technology and play computer games in their dailylives. They are the ‘gamer generation’ (Beck & Wade, 2004, 2006), ‘digital natives’ (Prensky, 2001a) or the ‘net generation’ (Tapscott, 1998).According to Prensky, these ‘digital natives’ have undergone ‘mind alterations’ and ‘cognitive change’ (2001a, p. 39) while growing up withcomputer games and other technology. Beck and Wade argue similarly that the ‘gamer generation’ has ‘systematically different ways ofworking’ resulting from ‘one central factor: growing up with video games’ (Beck & Wade, 2004, 2006, p. 2). Tapscott uses perhaps the most
* Corresponding author. Tel.: þ31 15 2781349; fax: þ31 15 2786233.E-mail addresses: [email protected] (G. Bekebrede), [email protected] (H.J.G. Warmelink), [email protected] (I.S. Mayer).
Contents lists available at ScienceDirect
Computers & Education
journal homepage: www.elsevier .com/locate/compedu
0360-1315/$ – see front matter � 2011 Elsevier Ltd. All rights reserved.doi:10.1016/j.compedu.2011.02.010
Computers & Education 57 (2011) 1521–1529
Author's personal copy
popular term to date - the ‘net generation’ - stating that people of this generation ‘are learning, playing, communicating, working andcreating communities very different than their parents’ (Tapscott, 1998, p. 2, quoted in Prensky, 2001a, p. 39). Due to the intense use ofcomputer games and other new media, these authors argue that this generation has a different way of interacting and learning in general.
According to the discourse, this alternative way of learning requires alternative ways of teaching. Gaming is expected to be one newmethod that is appropriate to the net generation, as it is based on active, collaborative and technology-rich learning, i.e. learning methodsthat involve extensive computer use and collaboration among students. The main questionwe ask in this article is whether this discourse isapplicable to higher education students in the Netherlands. Do these students exhibit the characteristics of the net generation? Secondly, weask whether games, considered as active, collaborative and technology-rich learning experiences, are of greater importance to thesestudents in their formal education. Finally, we ask whether the greater importance of gaming in higher education deemed by these studentsis due to changed learning preferences.
In this article we firstly review recent research into the topic of the net generation and identify new topics for further research. We arguethat our empirical study of higher education students in the Netherlands is able to offer relevant insights into the existence of a ‘netgeneration’ and its subsequent effects on higher education methods. We thus turn to investigate the existence of a net generation in ourdataset. This is followed by an analysis of the data to determinewhether the net generation prefers active, collaborative and technology-richlearning experiences, including the use of games, in their higher education. The article ends with a discussion of the consequences of ourresearch for the use of games in higher education.
2. The gamer discourse
At the turn of the millennium, a number of authors of high-profile books instigated what we term ‘the gamer discourse’. Prensky, aneducational theorist and practitioner, popularised the discourse in his seminal book Digital Game-based Learning (2001a), referring to andbuilding upon Tapscott’s equally influential workGrowing Up Digital (1998), inwhich the term ‘net generation’was coined.We consider bothPrensky and Tapscott to be the protagonists of the gamer discourse. The discourse describes specific characteristics of thosewho have grownup as avid users of technology – computer games in particular – and distinguishes them from thosewho have not. In other words, the formergroup is considered to be distinct from the latter and to form a distinct generation, not only in terms of birth date but also in terms ofbehaviour, and specifically with respect to preferred learning styles, social interaction patterns and technology use, which also encompassesformal education. Thus, advocates of the discourse conclude that tech-savvy and game-playing students wish to adopt and also expect anactive, collaborative and technology-rich learning experience in their formal education (Prensky, 2001a, p. 52).
Prensky further popularised gamer discourse through several journal publications (e.g. Prensky, 2001b, 2001c), another book (Prensky,2006) and various keynote lectures. The discourse was adopted by other authors in the Western world, for example by Oblinger from theEDUCAUSE institute, who subsequently initiatedmany extensive studies on the topic in the USA (Oblinger, 2004; Oblinger & Oblinger, 2005),and the educational specialists Veen and Vrakking (2006). Moreover, the discourse was adopted by Beck and Wade in the context ofa discussion of changes that the ‘gamer generation’ would bring to business organisations (2004, 2006).
Gamer discourse has since become a popular research topic, with the funding of many extensive research projects over the years whichhave been able to further gather large amounts of rich empirical data in order to study and evaluate this discourse. The following researchprojects into the media and technology use of students are notable:
� Over 28,000 higher education students from 96 institutes were surveyed in the USA between 2004 and 2006 (Salaway, Katz, & Caruso,2006).
� Over 5000 primary and secondary education students from 43 institutes were surveyed in Canada in 2005 (Media Awareness Network,2005).
� Over 2300 secondary education students throughout the UK were surveyed in 2006 (Sandford, Ulicsak, Facer, & Rudd, 2006).� Over 2500 higher education students from 3 institutes were surveyed in Australia in 2006 (Kennedy et al., 2009).� In 2008 a commercial research organisation collated data from different research projects to gain a general insight into the media andtechnology use of an unknown number of ‘teens’ across 50 countries (The Nielsen Company, 2009).
These studies were often representative of at least a substantial section of the population in a specific country and were focused onstudents whowere assumed to be part of the net generation. However, the researchers found that the dichotomous thinking underlying thegamer discoursewas not supported by their datasets and they therefore developed amuchmore nuanced view of students, their technologyuse and their preferred use of technology in formal education. Not all youngsters were avid technology users or gamers, nor did they allprefer gaming within their education.
Two recent review articles have examined the evidence provided by the studies mentioned above as well as other studies that criticise oreven reject the discourse (Bennett, Maton, & Kervin, 2008; Schulmeister, 2009). Following a review of over 50 empirical studies into mediause, Schulmeister criticised the notion of a generational shift implied by the term ‘net generation’. According to him, the extensive use ofmany different types of media and technology does not warrant the signifying of a generational shift. Focusing on the context and motivesbehind media and technology use, Schulmeister, as well as Bennett, Maton and Kervin, suggest that there has been no fundamental changein learning style preferences in higher education. Put simply, they argue that media and technology have replaced other means or places ofsocialisation, such as the playground, that adolescents are attracted to as part of growing up.
Thus, the deterministic undercurrent of the gamer discourse has to some extent been disproved by empirical research and replaced bynew theories that are informed by that evidence.Whatwe are left with is a discourse that emphasises the context andmotives behindmediaand technology use, and discounts the general social-psychological effects of media and technology use since empirical evidence suggeststhat the same, familiar and ‘completely normal process of socialization’ (Schulmeister, 2009) is taking place when students and youngstersuse them. This helps explainwhy in certain learning contexts games as forms of active, collaborative and technology-rich learningmight notbemore attractive than other forms. Moreover, it also helps explainwhy in certain learning contexts, non-gamersmight be just as interested
G. Bekebrede et al. / Computers & Education 57 (2011) 1521–15291522
Author's personal copy
in using games as forms of active, collaborative and technology-rich learning as gamers. It simply depends on the lifetime experiences,context and motives of the learner.
Interestingly, Prensky recently introduced some amendments to his original theory of digital natives and immigrants (2009), sug-gesting that the distinction between the two was losing ground. As technology in general and computer games in particular becomemore ubiquitous and saturate our daily lives, there is a growth in the number of tech-savvy people regardless of date of birth. Moreover,since the people previously attributed to the digital natives category have a birth date of roughly 1982 onwards, they are now up to oreven over 28 years old and have thus left the formal education system to perhaps become teachers themselves. Prensky maintains thatthe more ubiquitous use of media and technology today favours a learning style that entails active involvement, collaboration and thehigh use of technology which also extends to formal education. Furthermore, having done extensive empirical research and developedextensive knowledge into the topic, both Prensky (2010) and Tapscott (2008) more recently reaffirmed the gamer discourse in newbooks.
Thus, the debate about the validity of the gamer discourse is not over and the discourse itself continues to be attractive. Moreover, giventhe wide net that the discourse casts over society, the amount of empirical research is as yet insufficient to confirm, criticise or denounceit. The empirical evidence and recent theoretical amendments by those opposed and attracted to the gamer discourse suggest thata subsection of students who have used technology avidly, socially and throughout their entire lives prefer a formal education system basedon active, collaborative and technology-rich learning. Taking Prensky’s recent theoretical amendment into account, one would assume thissubsection to have grown in size over the years.
The question remains whether current and future generations of students are and will be different from their predecessors in terms oftheir technology use and preferred learning styles, and what the consequences are for using games within formal education. Our empiricalresearch provides insight into these issues within the context of Dutch higher education, fulfilling two current scientific needs. Firstly, large-scale quantitative social scientific research on this topic has – to our knowledge – not been conducted in the Netherlands. It is reasonable toassume that such researchwould lead to results that are just as interesting as those in otherWestern countries.With our datawewill be ableto extensively test whether the recent criticisms of the gamer discourse as expressed by Schulmeister and Bennett, Maton and Kervin applyto Dutch students. Secondly, our surveys of Dutch students of higher education have been carried out since 2005, making our studylongitudinal in design. Sincewe have obtained empirical data over a five-year period (2005–2009), we are able to test Prensky’s more recenttheory about the growth of the subsection of students looking for active, collaborative and technology-rich learning experiences in formalhigher education, regardless of their birth year or upbringing.
Our study poses and answers the following three questions:
1. Do higher education students in the Netherlands exhibit the characteristics of the net generation in the period 2005–2009, i.e. are theyavid computer users and computer-game players?
2. Is there a difference between net generation representatives and non-representatives concerning a preference for active, collaborativeand technology-rich learning?
3. Is there a difference between net generation representatives and non-representatives concerning a preference for gaming as a teachingmethod?
3. Method
3.1. General research design
Our research revolved around the application of 23 games within several Dutch institutes of higher education.1 These games differ intopic (from port planning to social work), duration (one day or several weeks), computer use (computer supported or completely virtualenvironment) and learning objectives. At the start of each game we asked the students who were about to take part to fill in our ques-tionnaire. In this first survey we determined the gender, age, amount of game-play (both for entertainment and educational purposes),attitude towards gaming in education, preferred learning styles and learning expectations for the upcoming game. After each game hadfinished, we asked the same students to fill out another questionnaire. In this second survey we determined their opinions about the designof the game, the play process and the learning outcomes. The surveys’ designs were based on Kriz and Hense’s groundwork for gameevaluation (2006), adapted for computer and online games (Mayer et al., 2007).
To answer the questions posed in Section 2 above, we focused our analyses on the data about the players of these games, providedby the pre-game survey. We examined whether these students liked trying new uses and applications of computers and whether theyplayed computer games privately. These data allowed us to determine to what extent we had representatives of the net generation inour sample. Furthermore, we analysed the data to determine the learning style preferences of these students (both those repre-sentative and not representative of the net generation) and to what extent they deemed gaming of value or added value in theireducation.
3.2. Sample
Since starting this research in 2005, we have obtained data from 1607 respondents. These respondents took part in one of 23 gamesacross 12 educational institutes. All of these games were specifically designed by teachers and simulation/gaming experts for use in highereducation. Each institute used their games in different courses at different levels, BSc and MSc, and in different years of their curricula. Thisgives our sample an enormous variety.
1 The development and use of these games in education were part of different research projects over the period 2005–2009 in which we were involved, as mentioned inthe acknowledgements.
G. Bekebrede et al. / Computers & Education 57 (2011) 1521–1529 1523
Author's personal copy
Most respondents (68%) were students studying at Delft University of Technology (DUT), the university with which we are affiliated. Theother participants studied at other institutes of higher education (universities, universities of applied sciences and colleges), of which 8werelocated in the Netherlands. For this article we selected Dutch students from 2005 to 2009 as our unit of analysis to specifically address theDutch situation. Consequently, this led to the exclusion of some respondents from our dataset. The final sample consisted of 1432respondents, all students of higher education in The Netherlands. In addition to DUT, the Dutch institutes are (in order of the number ofrespondents they provided): HU University of Applied Sciences Utrecht, Erasmus University Rotterdam, Rotterdam University of AppliedSciences, the Open University of the Netherlands, The Hague University of Applied Sciences, Inholland University of Applied Sciences, LeidenUniversity and Leiden University of Applied Sciences.
3.3. Participants
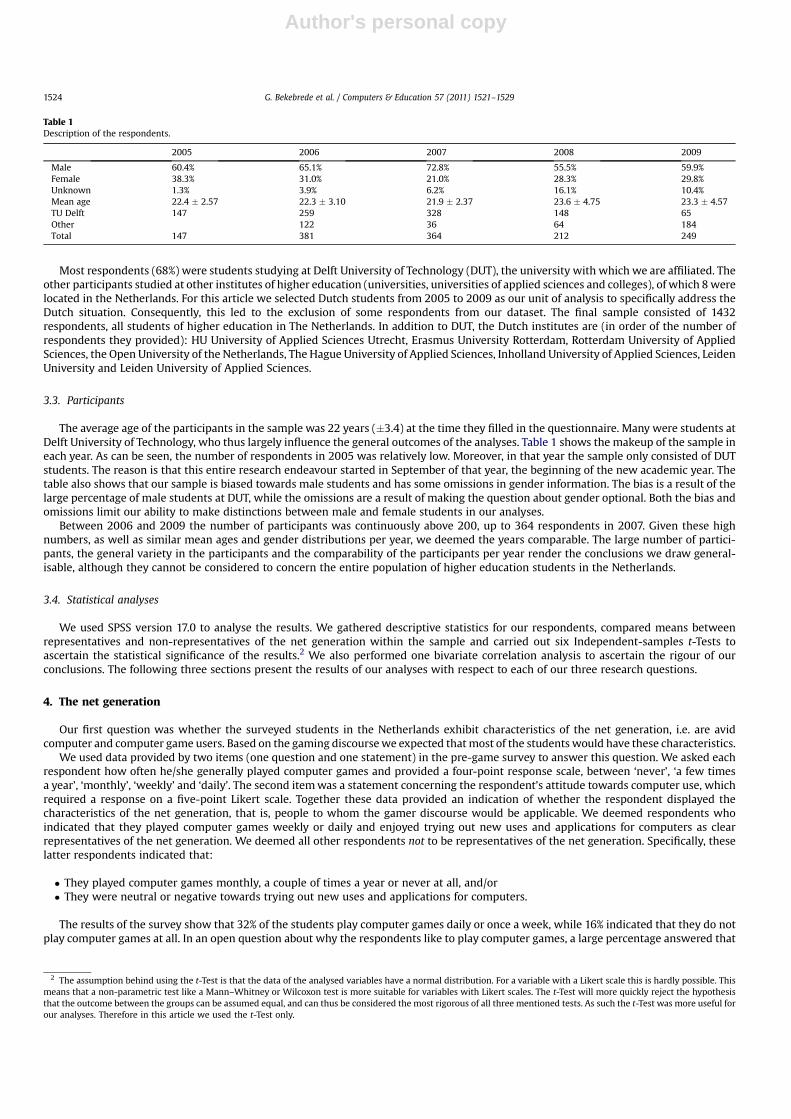
The average age of the participants in the sample was 22 years (�3.4) at the time they filled in the questionnaire. Many were students atDelft University of Technology, who thus largely influence the general outcomes of the analyses. Table 1 shows the makeup of the sample ineach year. As can be seen, the number of respondents in 2005 was relatively low. Moreover, in that year the sample only consisted of DUTstudents. The reason is that this entire research endeavour started in September of that year, the beginning of the new academic year. Thetable also shows that our sample is biased towards male students and has some omissions in gender information. The bias is a result of thelarge percentage of male students at DUT, while the omissions are a result of making the question about gender optional. Both the bias andomissions limit our ability to make distinctions between male and female students in our analyses.
Between 2006 and 2009 the number of participants was continuously above 200, up to 364 respondents in 2007. Given these highnumbers, as well as similar mean ages and gender distributions per year, we deemed the years comparable. The large number of partici-pants, the general variety in the participants and the comparability of the participants per year render the conclusions we draw general-isable, although they cannot be considered to concern the entire population of higher education students in the Netherlands.
3.4. Statistical analyses
We used SPSS version 17.0 to analyse the results. We gathered descriptive statistics for our respondents, compared means betweenrepresentatives and non-representatives of the net generation within the sample and carried out six Independent-samples t-Tests toascertain the statistical significance of the results.2 We also performed one bivariate correlation analysis to ascertain the rigour of ourconclusions. The following three sections present the results of our analyses with respect to each of our three research questions.
4. The net generation
Our first question was whether the surveyed students in the Netherlands exhibit characteristics of the net generation, i.e. are avidcomputer and computer game users. Based on the gaming discoursewe expected thatmost of the students would have these characteristics.
We used data provided by two items (one question and one statement) in the pre-game survey to answer this question. We asked eachrespondent how often he/she generally played computer games and provided a four-point response scale, between ‘never’, ‘a few timesa year’, ‘monthly’, ‘weekly’ and ‘daily’. The second itemwas a statement concerning the respondent’s attitude towards computer use, whichrequired a response on a five-point Likert scale. Together these data provided an indication of whether the respondent displayed thecharacteristics of the net generation, that is, people to whom the gamer discourse would be applicable. We deemed respondents whoindicated that they played computer games weekly or daily and enjoyed trying out new uses and applications for computers as clearrepresentatives of the net generation. We deemed all other respondents not to be representatives of the net generation. Specifically, theselatter respondents indicated that:
� They played computer games monthly, a couple of times a year or never at all, and/or� They were neutral or negative towards trying out new uses and applications for computers.
The results of the survey show that 32% of the students play computer games daily or once a week, while 16% indicated that they do notplay computer games at all. In an open question about why the respondents like to play computer games, a large percentage answered that
Table 1Description of the respondents.
2005 2006 2007 2008 2009
Male 60.4% 65.1% 72.8% 55.5% 59.9%Female 38.3% 31.0% 21.0% 28.3% 29.8%Unknown 1.3% 3.9% 6.2% 16.1% 10.4%Mean age 22.4 � 2.57 22.3 � 3.10 21.9 � 2.37 23.6 � 4.75 23.3 � 4.57TU Delft 147 259 328 148 65Other 122 36 64 184Total 147 381 364 212 249
2 The assumption behind using the t-Test is that the data of the analysed variables have a normal distribution. For a variable with a Likert scale this is hardly possible. Thismeans that a non-parametric test like a Mann–Whitney or Wilcoxon test is more suitable for variables with Likert scales. The t-Test will more quickly reject the hypothesisthat the outcome between the groups can be assumed equal, and can thus be considered the most rigorous of all three mentioned tests. As such the t-Test was more useful forour analyses. Therefore in this article we used the t-Test only.
G. Bekebrede et al. / Computers & Education 57 (2011) 1521–15291524
Author's personal copy
they did not like playing computer games or only played simple games such as solitaire or minesweeper to ward off boredom. About 17%disagreed with the statement that they enjoy trying out new uses and applications for computers, while 63% agreed with it. This means thatthe general assumption of the net generation theory that all students play computer games is not confirmed. However, most students doenjoy trying new uses and applications for computers. The question then remains whether the respondents who do play games also enjoytrying new computer uses and applications.
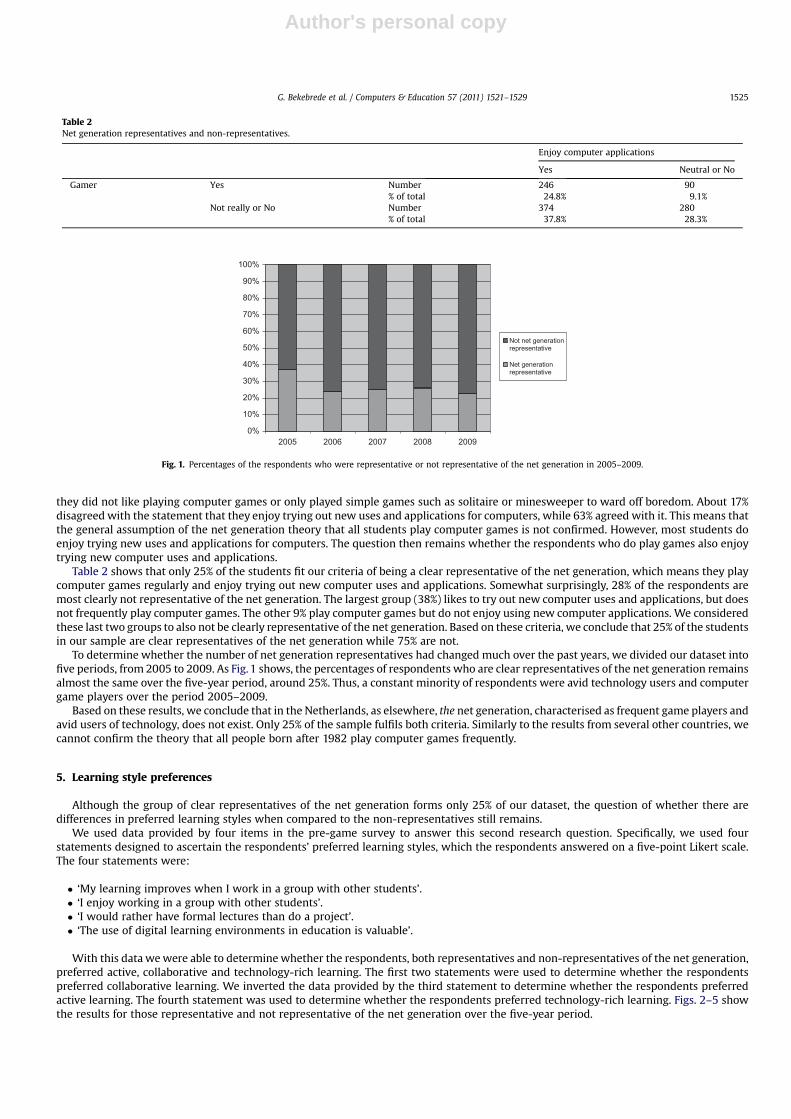
Table 2 shows that only 25% of the students fit our criteria of being a clear representative of the net generation, which means they playcomputer games regularly and enjoy trying out new computer uses and applications. Somewhat surprisingly, 28% of the respondents aremost clearly not representative of the net generation. The largest group (38%) likes to try out new computer uses and applications, but doesnot frequently play computer games. The other 9% play computer games but do not enjoy using new computer applications. We consideredthese last two groups to also not be clearly representative of the net generation. Based on these criteria, we conclude that 25% of the studentsin our sample are clear representatives of the net generation while 75% are not.
To determine whether the number of net generation representatives had changed much over the past years, we divided our dataset intofive periods, from 2005 to 2009. As Fig. 1 shows, the percentages of respondents who are clear representatives of the net generation remainsalmost the same over the five-year period, around 25%. Thus, a constant minority of respondents were avid technology users and computergame players over the period 2005–2009.
Based on these results, we conclude that in the Netherlands, as elsewhere, the net generation, characterised as frequent game players andavid users of technology, does not exist. Only 25% of the sample fulfils both criteria. Similarly to the results from several other countries, wecannot confirm the theory that all people born after 1982 play computer games frequently.
5. Learning style preferences
Although the group of clear representatives of the net generation forms only 25% of our dataset, the question of whether there aredifferences in preferred learning styles when compared to the non-representatives still remains.
We used data provided by four items in the pre-game survey to answer this second research question. Specifically, we used fourstatements designed to ascertain the respondents’ preferred learning styles, which the respondents answered on a five-point Likert scale.The four statements were:
� ‘My learning improves when I work in a group with other students’.� ‘I enjoy working in a group with other students’.� ‘I would rather have formal lectures than do a project’.� ‘The use of digital learning environments in education is valuable’.
With this data wewere able to determine whether the respondents, both representatives and non-representatives of the net generation,preferred active, collaborative and technology-rich learning. The first two statements were used to determine whether the respondentspreferred collaborative learning. We inverted the data provided by the third statement to determine whether the respondents preferredactive learning. The fourth statement was used to determine whether the respondents preferred technology-rich learning. Figs. 2–5 showthe results for those representative and not representative of the net generation over the five-year period.
Table 2Net generation representatives and non-representatives.
Enjoy computer applications
Yes Neutral or No
Gamer Yes Number 246 90% of total 24.8% 9.1%
Not really or No Number 374 280% of total 37.8% 28.3%
0%
10%
20%
30%
40%
50%
60%
70%
80%
90%
100%
2005 2006 2007 2008 2009
Not net generationrepresentative
Net generationrepresentative
Fig. 1. Percentages of the respondents who were representative or not representative of the net generation in 2005–2009.
G. Bekebrede et al. / Computers & Education 57 (2011) 1521–1529 1525
Author's personal copy
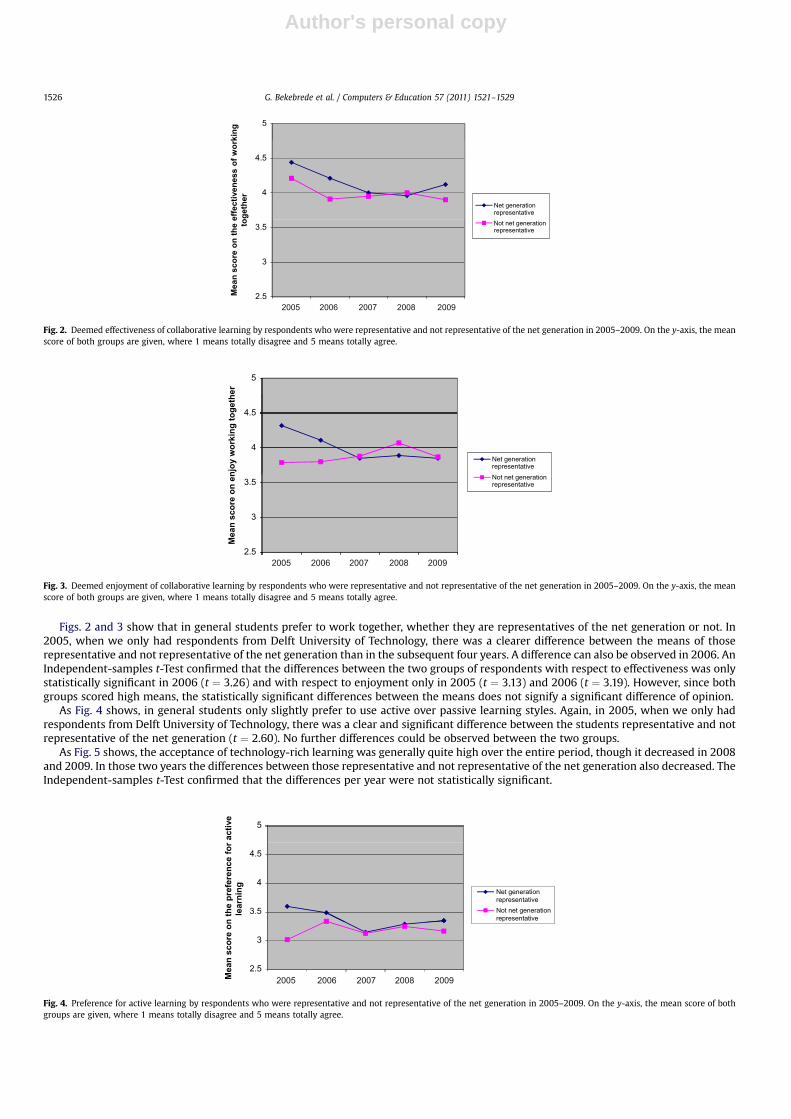
Figs. 2 and 3 show that in general students prefer to work together, whether they are representatives of the net generation or not. In2005, when we only had respondents from Delft University of Technology, there was a clearer difference between the means of thoserepresentative and not representative of the net generation than in the subsequent four years. A difference can also be observed in 2006. AnIndependent-samples t-Test confirmed that the differences between the two groups of respondents with respect to effectiveness was onlystatistically significant in 2006 (t ¼ 3.26) and with respect to enjoyment only in 2005 (t ¼ 3.13) and 2006 (t ¼ 3.19). However, since bothgroups scored high means, the statistically significant differences between the means does not signify a significant difference of opinion.
As Fig. 4 shows, in general students only slightly prefer to use active over passive learning styles. Again, in 2005, when we only hadrespondents from Delft University of Technology, there was a clear and significant difference between the students representative and notrepresentative of the net generation (t ¼ 2.60). No further differences could be observed between the two groups.
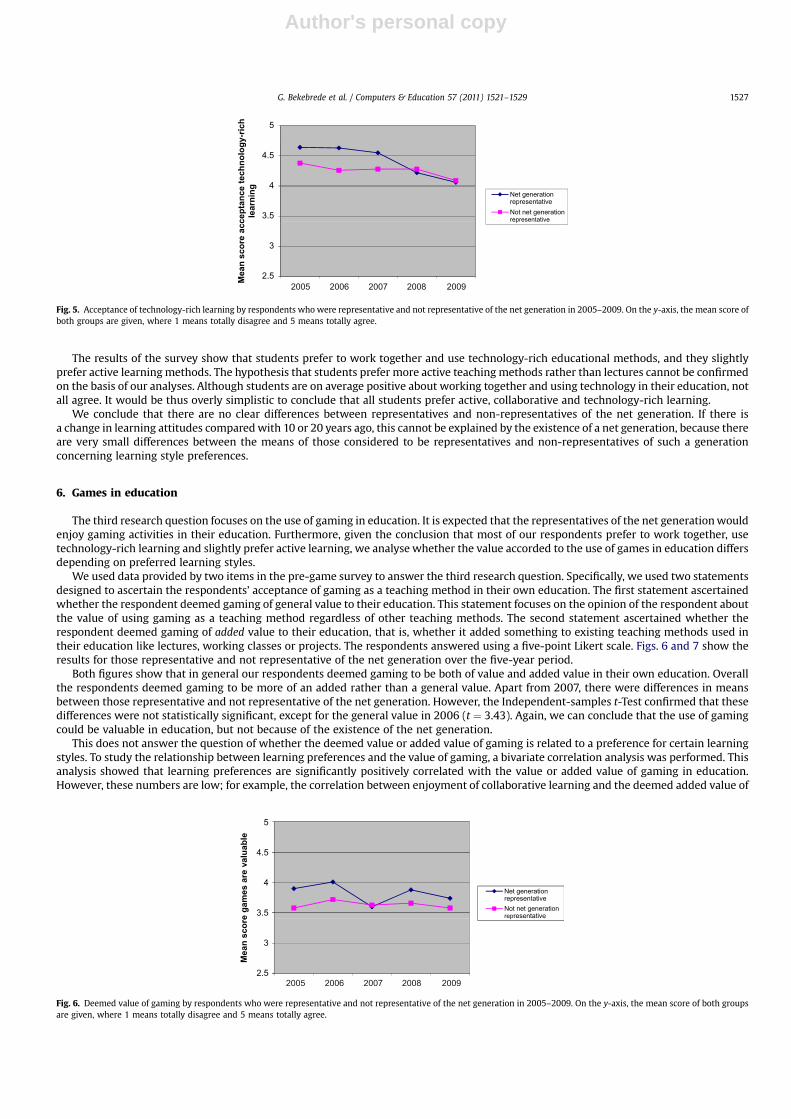
As Fig. 5 shows, the acceptance of technology-rich learning was generally quite high over the entire period, though it decreased in 2008and 2009. In those two years the differences between those representative and not representative of the net generation also decreased. TheIndependent-samples t-Test confirmed that the differences per year were not statistically significant.
5
4
4.5
Net generation representative
3
3.5
Me
an
s
co
re
o
n e
njo
y w
ork
in
g to
ge
th
er
Not net generation representative
2.52005 2006 2007 2008 2009
Fig. 3. Deemed enjoyment of collaborative learning by respondents who were representative and not representative of the net generation in 2005–2009. On the y-axis, the meanscore of both groups are given, where 1 means totally disagree and 5 means totally agree.
5
3.5
4
4.5
Net generation representativeNot net generation representative
2.5
3
Me
an
s
co
re
o
n th
e p
re
fe
re
nc
e fo
r a
ctive
le
arn
in
g
2005 2006 2007 2008 2009
Fig. 4. Preference for active learning by respondents who were representative and not representative of the net generation in 2005–2009. On the y-axis, the mean score of bothgroups are given, where 1 means totally disagree and 5 means totally agree.
5
4
4.5
Net generationrepresentative
2.5
3
3.5M
ea
n s
co
re
o
n th
e e
ffe
ctive
ne
ss
o
f w
ork
in
g
to
geth
er
Not net generationrepresentative
2005 2006 2007 2008 2009
Fig. 2. Deemed effectiveness of collaborative learning by respondents who were representative and not representative of the net generation in 2005–2009. On the y-axis, the meanscore of both groups are given, where 1 means totally disagree and 5 means totally agree.
G. Bekebrede et al. / Computers & Education 57 (2011) 1521–15291526
Author's personal copy
The results of the survey show that students prefer to work together and use technology-rich educational methods, and they slightlyprefer active learningmethods. The hypothesis that students prefer more active teaching methods rather than lectures cannot be confirmedon the basis of our analyses. Although students are on average positive about working together and using technology in their education, notall agree. It would be thus overly simplistic to conclude that all students prefer active, collaborative and technology-rich learning.
We conclude that there are no clear differences between representatives and non-representatives of the net generation. If there isa change in learning attitudes comparedwith 10 or 20 years ago, this cannot be explained by the existence of a net generation, because thereare very small differences between the means of those considered to be representatives and non-representatives of such a generationconcerning learning style preferences.
6. Games in education
The third research question focuses on the use of gaming in education. It is expected that the representatives of the net generationwouldenjoy gaming activities in their education. Furthermore, given the conclusion that most of our respondents prefer to work together, usetechnology-rich learning and slightly prefer active learning, we analyse whether the value accorded to the use of games in education differsdepending on preferred learning styles.
We used data provided by two items in the pre-game survey to answer the third research question. Specifically, we used two statementsdesigned to ascertain the respondents’ acceptance of gaming as a teaching method in their own education. The first statement ascertainedwhether the respondent deemed gaming of general value to their education. This statement focuses on the opinion of the respondent aboutthe value of using gaming as a teaching method regardless of other teaching methods. The second statement ascertained whether therespondent deemed gaming of added value to their education, that is, whether it added something to existing teaching methods used intheir education like lectures, working classes or projects. The respondents answered using a five-point Likert scale. Figs. 6 and 7 show theresults for those representative and not representative of the net generation over the five-year period.
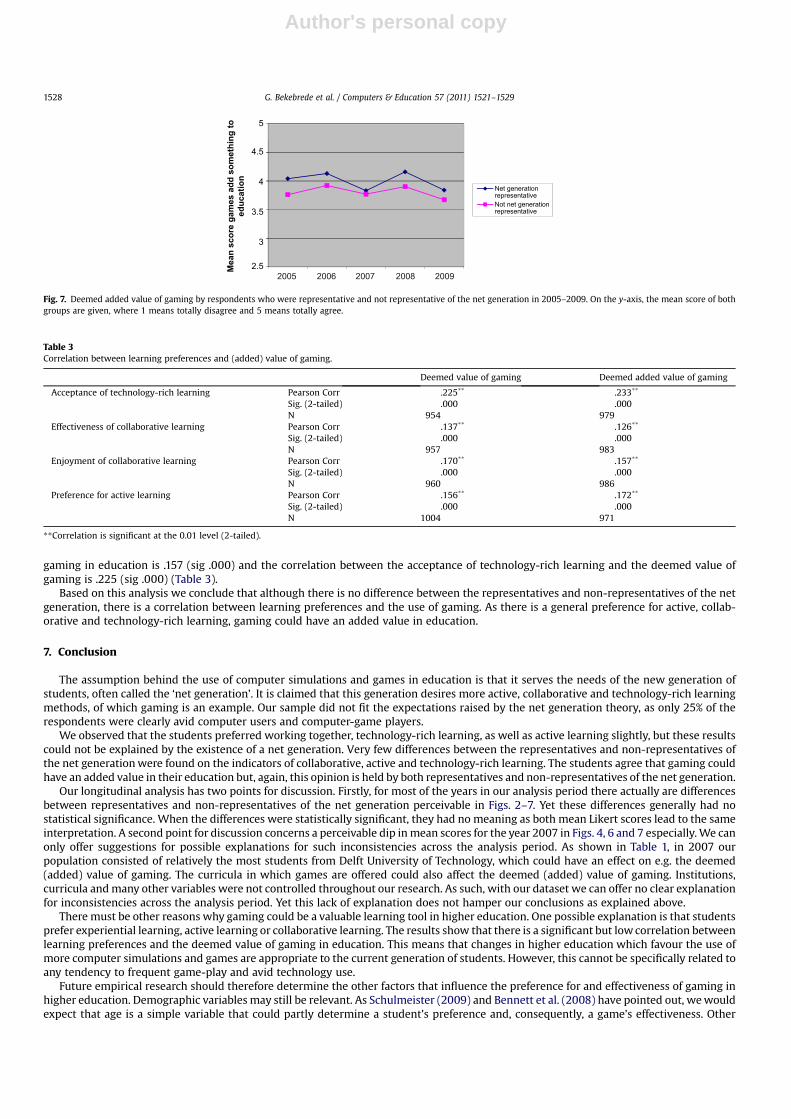
Both figures show that in general our respondents deemed gaming to be both of value and added value in their own education. Overallthe respondents deemed gaming to be more of an added rather than a general value. Apart from 2007, there were differences in meansbetween those representative and not representative of the net generation. However, the Independent-samples t-Test confirmed that thesedifferences were not statistically significant, except for the general value in 2006 (t ¼ 3.43). Again, we can conclude that the use of gamingcould be valuable in education, but not because of the existence of the net generation.
This does not answer the question of whether the deemed value or added value of gaming is related to a preference for certain learningstyles. To study the relationship between learning preferences and the value of gaming, a bivariate correlation analysis was performed. Thisanalysis showed that learning preferences are significantly positively correlated with the value or added value of gaming in education.However, these numbers are low; for example, the correlation between enjoyment of collaborative learning and the deemed added value of
Fig. 6. Deemed value of gaming by respondents who were representative and not representative of the net generation in 2005–2009. On the y-axis, the mean score of both groupsare given, where 1 means totally disagree and 5 means totally agree.
5
3.5
4
4.5
Net generation representativeNot net generationrepresentative
2.5
3M
ean
s
co
re
a
cce
ptan
ce te
ch
no
lo
gy-ric
h
le
arn
in
g
2005 2006 2007 2008 2009
Fig. 5. Acceptance of technology-rich learning by respondents who were representative and not representative of the net generation in 2005–2009. On the y-axis, the mean score ofboth groups are given, where 1 means totally disagree and 5 means totally agree.
G. Bekebrede et al. / Computers & Education 57 (2011) 1521–1529 1527
Author's personal copy
gaming in education is .157 (sig .000) and the correlation between the acceptance of technology-rich learning and the deemed value ofgaming is .225 (sig .000) (Table 3).
Based on this analysis we conclude that although there is no difference between the representatives and non-representatives of the netgeneration, there is a correlation between learning preferences and the use of gaming. As there is a general preference for active, collab-orative and technology-rich learning, gaming could have an added value in education.
7. Conclusion
The assumption behind the use of computer simulations and games in education is that it serves the needs of the new generation ofstudents, often called the ‘net generation’. It is claimed that this generation desires more active, collaborative and technology-rich learningmethods, of which gaming is an example. Our sample did not fit the expectations raised by the net generation theory, as only 25% of therespondents were clearly avid computer users and computer-game players.
We observed that the students preferred working together, technology-rich learning, as well as active learning slightly, but these resultscould not be explained by the existence of a net generation. Very few differences between the representatives and non-representatives ofthe net generationwere found on the indicators of collaborative, active and technology-rich learning. The students agree that gaming couldhave an added value in their education but, again, this opinion is held by both representatives and non-representatives of the net generation.
Our longitudinal analysis has two points for discussion. Firstly, for most of the years in our analysis period there actually are differencesbetween representatives and non-representatives of the net generation perceivable in Figs. 2–7. Yet these differences generally had nostatistical significance. When the differences were statistically significant, they had no meaning as both mean Likert scores lead to the sameinterpretation. A second point for discussion concerns a perceivable dip inmean scores for the year 2007 in Figs. 4, 6 and 7 especially.We canonly offer suggestions for possible explanations for such inconsistencies across the analysis period. As shown in Table 1, in 2007 ourpopulation consisted of relatively the most students from Delft University of Technology, which could have an effect on e.g. the deemed(added) value of gaming. The curricula in which games are offered could also affect the deemed (added) value of gaming. Institutions,curricula andmany other variables were not controlled throughout our research. As such, with our dataset we can offer no clear explanationfor inconsistencies across the analysis period. Yet this lack of explanation does not hamper our conclusions as explained above.
There must be other reasons why gaming could be a valuable learning tool in higher education. One possible explanation is that studentsprefer experiential learning, active learning or collaborative learning. The results show that there is a significant but lowcorrelation betweenlearning preferences and the deemed value of gaming in education. This means that changes in higher education which favour the use ofmore computer simulations and games are appropriate to the current generation of students. However, this cannot be specifically related toany tendency to frequent game-play and avid technology use.
Future empirical research should therefore determine the other factors that influence the preference for and effectiveness of gaming inhigher education. Demographic variables may still be relevant. As Schulmeister (2009) and Bennett et al. (2008) have pointed out, wewouldexpect that age is a simple variable that could partly determine a student’s preference and, consequently, a game’s effectiveness. Other
Table 3Correlation between learning preferences and (added) value of gaming.
Deemed value of gaming Deemed added value of gaming
Acceptance of technology-rich learning Pearson Corr .225** .233**
Sig. (2-tailed) .000 .000N 954 979
Effectiveness of collaborative learning Pearson Corr .137** .126**
Sig. (2-tailed) .000 .000N 957 983
Enjoyment of collaborative learning Pearson Corr .170** .157**
Sig. (2-tailed) .000 .000N 960 986
Preference for active learning Pearson Corr .156** .172**
Sig. (2-tailed) .000 .000N 1004 971
**Correlation is significant at the 0.01 level (2-tailed).
Mean
sco
re g
am
es ad
d so
meth
in
g to
ed
uc
atio
n
Net generation representativeNot net generation representative
5
3.5
4
4.5
2.5
3
2005 2006 2007 2008 2009
Fig. 7. Deemed added value of gaming by respondents who were representative and not representative of the net generation in 2005–2009. On the y-axis, the mean score of bothgroups are given, where 1 means totally disagree and 5 means totally agree.
G. Bekebrede et al. / Computers & Education 57 (2011) 1521–15291528
Author's personal copy
game-related variables could also lead to differences in preferences and in the effectiveness of gaming, such as the perceived quality ofa game’s design and its ability to facilitate learning.
Acknowledgements
An earlier version of this article was presented at the 41st ISAGA Conference in Spokane, Washington, USA. We would like to thank all ofthe reviewers and participants at the conference for their constructive feedback. Wewould also like to thank the two anonymous reviewersfor their constructive feedback concerning the current version of the article. Our researchwas partly funded by SURFfoundation through theKODOS project (2004–2006), as well as the Programmabureau Maatschappelijke Sectoren & ICT through the Learning in a Virtual Worldproject (2007–2009). These funding sources had no involvement in the study design, the decision to publish, or the writing of this article.
References
Beck, J. C., & Wade, M. (2004). Got game: How the gamer generation is reshaping business forever. Boston: Harvard Business School Press.Beck, J. C., & Wade, M. (2006). The kids are alright: How the gamer generation is changing the workplace. Boston: Harvard Business School Press.Bennett, S., Maton, K., & Kervin, L. (2008). The ‘digital natives’ debate: a critical review of the evidence. British Journal of Educational Technology, 39(5), 775–786.GATE. (2011). Project information. GATE j Game Research for Training and Entertainment. Retrieved February 7, 2011, from. http://gate.gameresearch.nl/index.php%
3FpageID¼85.Kennedy, G. E., Dalgarno, B., Bennett, S., Gray, K., Waycott, J., Judd, T. S., et al. (2009). Educating the net generation. A handbook of findings for practice and policy. Sydney:
Australian Learning and Teaching Council.Kriz, W. C., & Hense, J. U. (2006). Theory-oriented evaluation for the design of and research in gaming and simulation. Simulation & Gaming, 37(2), 268–283.Mayer, I., Stegers-Jager, K., & Bekebrede, G. (2007). Spelend leren in virtuele werelden. Bouwstenen voor online gaming in het hoger onderwijs. Groningen: Wolters-Noordhoff.Media Awareness Network. (2005). Young canadians in a wired world. Phase II. Student survey. Erin: ERIN Research Inc.Oblinger, D. G. (2004). The next generation of educational engagement. Journal of Interactive Media in Education, 8, 1–18.Oblinger, D. G., & Oblinger, J. L. (2005). Educating the net generation. Boulder: EDUCAUSE.Prensky, M. (2001a). Digital game-based learning. New York: McGraw-Hill.Prensky, M. (2001b). Digital natives, digital immigrants. On the Horizon, 9(5), 1–6.Prensky, M. (2001c). Do they really think differently? On the Horizon, 9(6), 1–9.Prensky, M. (2006). Don’t bother me mom – I’m learning! St. Paul: Paragon House.Prensky, M. (2009). H. sapiens digital: from digital immigrants and digital natives to digital wisdom. Innovate, 5(3), 1–9.Prensky, M. (2010). Teaching digital natives. Partnering for real learning. Thousand Oaks: Corwin Press.Programmabureau Maatschappelijke Sectoren & ICT. (2011). Projecten onderwijs. Programmabureau M&ICT. Retrieved February 7, 2011, from. http://www.m-ict.nl/index.php?
option¼com_content&task¼category§ionid¼27&id¼55&Itemid¼212.Salaway, G., Katz, R. N., & Caruso, J. B. (2006). The ECAR study of undergraduate students and information technology, Vol. 7. Boulder: EDUCAUSE.Sandford, R., Ulicsak, M., Facer, K., & Rudd, T. (2006). Teaching with games. Using commercial off-the-shelf computer games in formal education. Bristol: Futurelab.Schulmeister, R. (2009). Is there a net gener in the house? Dispelling a mystification. E-Learning and Education, 5.Tapscott, D. (1998). Growing up digital. The rise of the net generation. New York: McGraw-Hill.Tapscott, D. (2008). Grown up digital. How the net generation is changing your world. New York: McGraw-Hill.The Nielsen Company. (2009). How teens use media. A Nielsen report on the myths and realities of teen media trends. New York: The Nielsen Company.Veen, W., & Vrakking, B. (2006). Homo zappiens. Growing up in a digital age. London: Network Continuum Education.Warmelink, H., & Mayer, I. (Eds.). (2009). Learning in a virtual world. Reflections on the cyberdam research and development project. Nijmegen: Wolf Legal Publishers.
G. Bekebrede et al. / Computers & Education 57 (2011) 1521–1529 1529
Copyright © 2022 FDOKUMEN

