


Bahasa
Halaman
Hukum


CONVENED BY PLATINUM SPONSOR
Conference Abstracts
Proceedings - Abstract and Paper

Veg Futures 08 Australia’s national vegetation conference
Retaining trees in a grazing landscape: impacts on ground cover in
sheep-grazing agro-ecosystems in southern Queensland
Andy Le Brocque 1, 2, Kellie Goodhew2,4, Geoff Cockfield1, 3
1. Australian Centre for Sustainable Catchments, University of Southern Queensland. 2. Faculty of Sciences, University of Southern Queensland. Email: [email protected]. 3. Faculty of Business, University of Southern Queensland. Email: [email protected] 4. present address, Queensland Department of Natural Resources & Water. Email:
Date: 23 October 2008
Abstract
In low-input, low-productivity grazing systems, the modification of natural woodlands through
overstorey tree and woody regrowth removal are management options used by graziers to increase
native grass production for livestock grazing. This paper describes studies that determine if
vegetation management by graziers affect floristic composition and plant cover in the Traprock wool-
producing region of southern Queensland. Forty-seven sites in the region were sampled according to
vegetation type (ironbark/gum woodland and box woodland), density of mature trees (low: 6 trees/ha,
medium: 6-20 trees/ha, and high: >20 trees/ha), and the presence or absence of woody regrowth in
the understorey to determine vegetation patterns. A subset of 18 sites was selected to establish
grazing exclusion experiments in both vegetation types under varying mature tree densities. Here we
describe the general patterns in vegetation under differing mature tree densities and provide some
preliminary results of the 4-year grazing exclusion experiment. While grass production is low under
high overstorey tree densities, no differences between medium tree densities and open paddock
areas is apparent, suggesting retaining trees in a low-input, low-productivity grazing system can
provide biodiversity benefits without adversely impacting upon production.

Veg Futures 08: Australia’s national vegetation conference
Introduction
An increasing body of research is recognising the value of biodiversity within production landscapes
(e.g. McIntyre and Lavorel, 1994; Kirkpatrick et al., 2005). However, ecological studies examining
whether different grazing management strategies enhance biodiversity conservation while
maintaining long-term productivity are limited (Dorrough et al., 2004). In contrast, the negative effects
of grazing have been well documented. Grazing alters the composition of understorey species
(Prober and Thiele, 1995; Clarke, 2003), prevents seedling recruitment (McIntyre and Lavorel, 1994),
contributes to soil erosion and compaction (Yates and Hobbs, 1997) and enhances the invasion of
exotic species (Prober and Thiele, 1995; Clarke, 2003).
Trees have traditionally been viewed as having negative impacts on grass production in grazing
landscapes, by competing for water, soil nutrients, light or a combination of these factors (Scholes
and Archer, 1997). A number of studies (e.g. McIvor and Gardener, 1995; McIvor, 2001) have shown
tree density is inversely related to pasture yield in many woodland communities. However, retaining
trees on grazing lands can provide shelter and shade for stock (Walpole, 1999), reduce salinity and
land deterioration (McIvor and McIntyre, 2002), enhance soil nutrients (Gibbs et al., 1999) and
potentially improve the quality of grasses for livestock (Jackson and Ash, 2001). In spite of these
benefits, the clearing of remnant vegetation and re-clearing of woody regrowth in grazing landscapes
has resulted in the loss and severe modification of large areas of woodlands in eastern Australia
(McIvor and McIntyre, 2002). In addition, pastoral land management in many grazing systems often
involves removing or reducing the tree layer in remaining wooded areas to increase native grass
production for livestock grazing (McIvor and McIntyre, 2002).
Exclosure studies have been widely utilised to assess the effects of livestock grazing in relation to
groundcover composition and abundance, but have produced mixed results (Pettit & Frond, 2007;
Spooner et al., 2002). Lunt et al. (2007), for example, implemented grazing exclusion in a Eucalyptus
camalulensis forest in the Gulpa Island State Forest in South East Australia. The results, over a 12
year period, indicated grazing exclusion had very little impact on understorey composition and
structure (Lunt et al., 2007). Lunt & Morgan (1999), in contrast, saw an increase in species richness
over a 10 year period in a Themeda triandra grassland reserve in south-east Australia. These
studies demonstrate vegetative responses to grazing exclusion may be largely influenced by
environmental factors as well as grazing history and exclusion duration.
Potentially, there are both biodiversity and production benefits if trees are retained in grazing
landscapes. However, there is little empirical information to suggest what overstorey tree density
may be appropriate so that both production and conservation goals may be achieved in these
agricultural systems. In our study, overstorey (mature) tree density and the presence/absence of

Veg Futures 08: Australia’s national vegetation conference
woody regrowth in the understorey were used as broad surrogates of vegetation management
practices for livestock grazing in the Traprock wool-producing region of southern Queensland,
Australia. The objective of this study was to determine the effects of vegetation management for
grazing (altered tree density and woody regrowth) on floristic composition and cover of two woodland
communities which previously dominated the landscape. Specifically, we examined the following
questions: is there a difference in floristic composition and understorey cover across overstorey tree
density classes? What is the response of the understorey to grazing exclusion?
Methods
Study area
The study was undertaken in the Traprock wool-growing region in southern Queensland, an area
recognised for the production of fine gauge wool fibres by predominantly un-improved native pasture
grazing. The original vegetation of the region had been subjected to clearing by ring-barking some 80
years ago and many sites were periodically re-cleared (until about 30 years ago) to control woody
regrowth (Le Brocque et al., 2008). The remaining vegetation is predominately grassy eucalypt
woodland comprised of narrow-leaved ironbark (Eucalyptus crebra), tumbledown gum (E. dealbata),
white box (E. albens) (Queensland Herbarium RE type 13.11.3, Sattler and Williams, 1999) on the
upper slopes and ridges and, on the lower slopes, yellow box (E. melliodora), greybox (Eucalyptus
microcarpa) or gum topped box (Eucalyptus moluccana) (RE type 13.11.8, Sattler and Williams,
1999), interspersed with grazing paddocks. The region supports approximately 300 000 hectares of
grazing land, stocked at a nominal rate of about 1-2 DSE (dry sheep equivalents) per hectare.
Composition and understorey cover across overstorey tree densities
Survey sites were stratified across vegetation type (ironbark/gum woodland vs. box woodland),
density of overstorey trees (low (<6 trees/ha), medium (6-20 trees/ha) and high (>20 trees/ha)), and
presence/absence of woody regrowth in the understorey. Sites within each of these treatment
combinations were sampled from patches at least 5 ha in size. A total of 47 sites were sampled,
including 4 reference sites (Figure 1; Table 1). Reference sites were chosen to represent woodlands
with minimal grazing impact; however, they have been subjected to modification from light grazing,
altered fire regimes and some selective logging, in the past.

Veg Futures 08: Australia’s national vegetation conference
Figure 1. Map of Traprock wool-growing region (shaded) showing location of study sites. Open site
symbols represent both survey and exclosure sites.
At each survey site, a 500 m² quadrat was randomly established and the composition and frequency
of plant species was determined (after Morrison et al., 1995). Site stand structure was determined
using the modified Specht (1981) structural classification scheme (after Le Brocque and Buckney,
1997). Based on the vegetation of the study area, six strata were pre-defined: trees 10-30 m, trees
<10 m, shrubs >2 m, shrubs <2 m, forbs/herbs/other (non-woody species), and graminoids (including
grasses, sedges and others). The percentage foliage cover of each stratum was estimated within the
500 m² quadrat. Data were pooled across some strata to derive total tree cover and total shrub cover.

Veg Futures 08: Australia’s national vegetation conference
Table 1. Description of survey sites, abbreviated description (label), and number (n) of replicates for
each treatment combination and site numbers. * Subset of study sites included in grazing exclusion
study.
Site description Label n Site numbers
Low density; no regrowth; ironbark/gum woodland LNU 5 1*, 2*, 3*, 4, 5
Low density; regrowth; ironbark/gum woodland LRU 5 6, 7, 8, 9, 10
Low density; no regrowth; box woodland LNL 5 11*, 12, 13*, 14, 15*
Low density; regrowth; box woodland LRL 4 16, 17, 18, 19
Medium density; no regrowth, ironbark/gum woodland MNU 4 20, 21*, 22*, 23*
Medium density; regrowth, ironbark/gum woodland MRU 4 24, 25, 26, 27
Medium density; no regrowth, box woodland MNL 3 28*, 29*, 30*
High density; no regrowth; ironbark/gum woodland HNU 4 31*, 32, 33*, 34*
High density; regrowth; ironbark/gum woodland HRU 2 35, 36
High density; pole stage regrowth; ironbark/gum woodland HORU 4 37, 38, 39, 40
High density; no regrowth; box woodland HNL 3 41*, 42*, 43*
Reference; ironbark/gum woodland REFU 2 44, 45
Reference; box woodland REFL 2 46, 47
Understorey response to grazing exclusion
Across both vegetation types, a subset of 18 sites that were free of woody regrowth in the
understorey was selected for grazing exclusion (Figure 1). At each site, three 6 x 6 metre plots were
established in areas representing the corresponding vegetation type and overstorey tree density.
Exclosures consisted of a control or open site marked by four corner pegs allowing animal grazing; a
partial exclosure plot comprising of a 1.5m fence to exclude sheep grazing; and a complete exclosure
with a 2.5m fence to prevent grazing from sheep and other large herbivores (Figure 2).
Exclosures were sampled in April 2005 (two months after establishment), February 2006 (12 months
after exclosure establishment), February 2007 (2 years after exclosure establishment), and in
February 2008 (3 years after exclosure establishment). Within each 6 x 6 metre exclosure plot, a
central 2 x 2 metre quadrat was sampled for ground cover and vascular plant species composition.
Veg Futures 08: Australia’s national vegetation conference
Ground cover was determined by subjectively estimating the percent cover of all species within each
2 x 2 metre quadrat. The above-ground vegetation was clipped in a separate 0.25 m² quadrat within
each 6 x 6 m exclosure plot using hand sheers. Plant biomass (gm/0.25m²) was determined as dry
weight by after oven drying (50-60 ºC) for 3 to 4 days.
Figure 2. Complete exclosure set up in a low overstorey tree density (open paddock) site. Photo: A.
Le Brocque, 2006.
Statistical Methods
Non-metric multidimensional scaling (nMDS) was performed on Bray-Curtis similarities calculated
from the frequency data (survey) and plant cover data (exclosure study) using the Primer v.5.2.9 for
Windows program (Primer-E Ltd, 2001). Analysis of similarity (ANOSIM) was performed on the
frequency data to determine if there were differences in similarlity between a priori groups (Clarke

Veg Futures 08: Australia’s national vegetation conference
and Gorley, 2001). One-way analysis of variance was used to determine if there were differences in
grass cover or forb/herb cover between treatments. All cover data were arc-sine transformed prior to
analysis, while Levene’s statistic and residual plots were used to test for homogeneity of variances. In
addition, Spearman-rank correlations were performed to determine whether cover variables (e.g. tree
and grass cover) were related.
A two-way crossed analysis of similarity (ANOSIM) was performed on plant cover data to determine if
there were differences between treatments in terms of exclosure and overstorey tree densities. A
Two-way ANOVA for each vegetation type was also undertaken, analysing the 2008 (3 years
following exclusion) biomass data with respect to exclosure treatment and mature tree density and
the interaction between these factors. The homogeneity of variances assumption (Levene’s test;
p>0.05) was met for both vegetation types.
Results
Composition and understorey cover across overstorey tree densities
A total of 202 plant taxa from 53 families was recorded in the study (Le Brocque et al., 2008). A plot
of centroids from the nMDS ordination of frequency data (Figure 3) indicates a general gradient of
increasing mature tree density from left to right across the diagram. Low tree density no regrowth
sample centroids (LNU and LNL) were well separated from low density regrowth and medium density
woodlands (LRL, LRU, MRU, MNL, MNU) and high tree density box woodlands (HNL, RefL), towards
the centre of the ordination and high density ironbark/gum woodlands (HNU, HRU, HoRU, RefU) on
the right (Figure 3). Analysis of similarity showed no significant differences in floristic composition
between low density no regrowth ironbark/gum woodlands (LNU) and low density no regrowth box
woodlands (LNL) (R = 0.176; Table 2). With a few exceptions, such as low tree density no regrowth
samples (LNL, LNU), ANOSIM results reveal significant differences in floristic composition between
box woodlands and ironbark/gum woodlands within any mature tree density or regrowth/no regrowth
treatments (Table 2).

Veg Futures 08: Australia’s national vegetation conference
Figure 3. Centroids plot of non-metric multidimensional scaling ordination of floristic composition data
(frequency) across all sites: LNU (), LNL (), LRU (), LRL (), MNU ( ), MNL ( ), MRU ( ),
HNU (), HNL (), HRU (), HoRU (), RefL (), RefU ().
Table 2. Summary of results from analysis of similarity (ANOSIM) of floristic composition (plant
frequency) across overstorey tree densities.
Summary of Pairwise comparisons (R values): (R values are significant at † 0.05<p<0.01; †† p<0.01)
LNU LRU LNL LRL MNU MRU MNL HNU HRU HORU HNL REFU
LRU 0.46††
LNL 0.18 0.86††
LRL 0.29 0.31 0.87††
MNU 0.23 0.51†† 0.54†† 0.28
MRU 0.31 0.11 0.74†† 0.02 -0.05
MNL 0.49† 0.29† 0.85† 0.20 0.28 0.32
HNU 0.77†† 0.50†† 0.93†† 0.62† 0.54† 0.28 0.35
HRU 0.64† 0.46 1.00† 0.43 0.36 -0.21 0.50 -0.04
HORU 0.65† 0.34 0.91†† 0.63† 0.67† 0.46 0.48 0.10 0.46
HNL 0.40† 0.59† 0.87† 0.61† 0.22 0.41 0.15 0.37 0.92 0.72
REFU 0.89† 0.78† 1.00† 0.96 0.96 0.93 1.00 -0.25 0.50 0.68 1.00
REFL 0.64† 0.44 0.89† 0.32 0.07 <0.01 <0.01 0.18 0.50 0.61 0.67 1.00
nMDS axis 1
nM
DS
axis
2
Stress = 0.20

Veg Futures 08: Australia’s national vegetation conference
Mean grass cover ranged between 3% (RefU) and 71% (LNL) across treatments (Figure 4a). Low
density no regrowth box woodland (LNL) had a significantly higher grass cover than most other
woodlands (p<0.05), except for low density no regrowth ironbark/gum woodland (LNU) and medium
density no regrowth woodlands (MNU and MNL) (Figure 4a). Forb cover was generally low across all
treatments ranging from 2% (REFL) to 15% (LNU) and was generally higher in no regrowth
woodlands (Figure 4b). Grass cover declined significantly with increasing total tree cover (rs = -0.510;
p<0.001; Figure 5a). Similarly, forb and herb cover declined with increasing total tree cover (rs = -
0.489; p<0.001; Figure 5b).
Figure 4. Mean foliage projective cover (%) of (a) grasses (df = 12, 34; F = 8.90) and (b) herbs/forbs
(df = 12, 34; F = 3.47) across treatments. Treatments with same letter are not significantly different
(Tukey’s test, p>0.05). Error bars are standard errors.

Veg Futures 08: Australia’s national vegetation conference
Figure 5. Scatterplot showing relationship between (a) grass and tree cover, and (b) forb/herb cover
and total tree cover.

Veg Futures 08: Australia’s national vegetation conference
Understorey response to grazing exclusion
A total of 151 plant taxa (135 native, 16 exotic) were recorded across the exclosure and overstorey
tree density treatments in the two vegetation types. The two-way crossed ANOSIM of plant cover
data for both vegetation types following three years of exclusion (Table 3) shows that differences
between mature tree densities were significant for both ironbark/gum woodlands (p=0.007) and box
woodlands (p=0.037). Exclosure treatments were not significant (p>0.05) across either vegetation
type (Table 3). In ironbark/gum woodlands, high mature tree density sites were significantly different
in floristic composition to low and medium tree density sites. In box woodlands, high mature tree
density sites were significantly different in floristic composition to low tree density sites. Medium
density box woodland sites were not significantly different in floristic composition to either high or low
tree density sites.
Table 3. Summary of results from analysis of similarity (ANOSIM) of plant cover data across
treatments following three years of exclusion. Global R value and significance level shown;
treatments sharing the same superscript are not significantly different (p>0.05).
Effects R value Significance Pairwise tests
Ironbark/gum woodland
Overstorey Tree Density 0.262 0.007* Lowa Mediuma Highb
Exclosure -0.192 0.953 Completea Partiala Opena
Box woodland
Overstorey Tree Density 0.193 0.037* Lowa Mediumab Highb
Exclosure -0.147 0.894 Completea Partiala Opena
Mean biomass data for exclosure treatments for both vegetation types across all years is shown in
Figure 6. High heterogeneity across all treatments precluded any meaningful statistical analysis of
biomass data with respect to time. Generally low density treatments show a stronger response in
terms of increasing biomass than either medium or high tree density treatments across both
vegetation types (Figure 6). An increase in mean above-ground biomass from 2005 to 2008 was
generally indicated for low tree density treatments for both vegetation types. High density
ironbark/gum woodland sites also exhibited a marked increase in biomass in 2008. In the low density
Veg Futures 08: Australia’s national vegetation conference
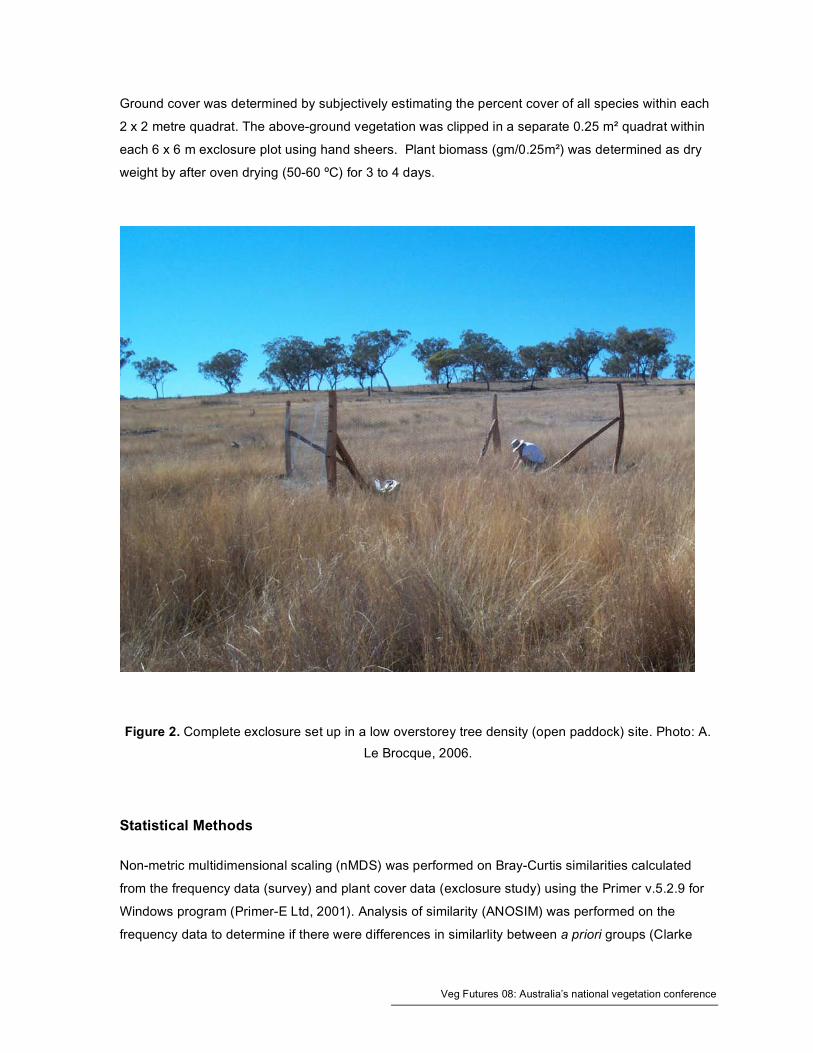
treatments, the most notable increase in mean above-ground biomass was in the complete
exclosures (Figures 6a & 6d). A highly variable response is noted for medium and high density box
woodland samples. No pattern is evident for medium density ironbark/gum woodland samples.
Figure 6. Mean above-ground plant biomass (gm/0.25m2) across treatments for (a) low (b) medium
and (c) high density ironbark/gum woodland, and (d) low (e) medium and (f) high density box
woodland for successive years. Error bars are standard errors.
Overstorey tree density showed significant differences in terms of above-ground biomass for both
vegetation types (p < 0.05; Table 4). Low overstorey tree density sites were significantly higher in
above-ground biomass in 2008 than medium and high overstorey density sites. Exclosure type and
the interaction term were not significant (p > 0.05; Table 4).

Veg Futures 08: Australia’s national vegetation conference
Table 4. Two-way ANOVA of above-ground biomass in 2008 for each vegetation type. Tukey’s post
hoc tests show mean biomass per 0.25m2 (� standard error): means sharing same superscript are
not significantly different (p>0.05).
Woodland Factor F-score (df)
P-value Post Hoc Tests
Overstorey Tree Density 13.30 (2) 0.000 Low
63.9a (16.2)
Med.
22.6b (3.6)
High
14.0b (6.7)
Exclosure 2.15 (2) 0.146 not significant
Ironbark/gum Woodland
Density * Exclosure Interaction 0.87 (4) 0.499 not significant
Overstorey Tree Density 7.72 (2) 0.004 Low
88.3a (17.0)
Med.
31.4b (7.1)
High
15.3b (4.0)
Exclosure 2.60 (2) 0.102 not significant
Box Woodland
Density * Exclosure Interaction 1.16 (4) 0.361 not significant
Discussion
Composition and understorey cover across overstorey tree densities
The results indicate that no differences in species composition (frequency) or ground cover are
evident between low density no regrowth woodlands (LNU and LNL); however, these woodlands
were generally different to other woodlands in terms of species composition. These open paddock
areas are structurally very simple systems, with an absence of shrub and tree strata. The resultant
ground cover of grasses and herbs/forbs essentially form a ‘paddock’ community that show little
similarity to pre-European vegetation types. At medium and high overstorey tree densities,
differences in species composition between the vegetation types became more evident. In particular,
medium overstorey tree density woodlands show similarity to higher overstorey tree density
woodlands and the reference (relatively undisturbed) woodlands within the two vegetation types. This
suggests that medium overstorey tree densities (6-20 trees/ha) provide for an increased diversity of
plant species closer in composition to less disturbed elements of the grazing landscape.
However, ground (grass and herb/forb) cover showed no differences between open paddock areas
and medium overstorey tree densities, particularly where there was an absence of woody regrowth in
the understorey, despite significant negative relationships observed between ground cover and tree

Veg Futures 08: Australia’s national vegetation conference
cover. Indeed, the relationship exhibited for grass cover and tree cover indicates that at lower tree
cover (less than approx. 20%), grass cover shows little decline. These results suggest that medium
overstorey tree densities do not necessarily adversely affect ground forage (at least in terms of cover)
for this system.
Chilcott et al. (1997) suggested that an overstorey of mature trees at a medium density may facilitate
the re-establishment of native plant species. Retaining mature trees on grazing lands can also
provide a range of other ecosystem benefits including: shelter and shade for stock (Walpole, 1999);
prevention of land deterioration (McIvor and McIntyre, 2002); enhancement of soil nutrients (Gibbs et
al., 1999); and potential improvement in the quality of grasses for livestock (Jackson and Ash, 2001).
Understorey response to grazing exclusion
While very much a preliminary analysis of data gathered from the grazing exclusion study, some
general trends are notable. Overstorey tree density was a significant factor accounting for differences
in both species composition and above-ground biomass for 2008 data (three years following
exclusion). However, the results are somewhat contradictory. Overall ground cover species
composition (in terms of similarity) was not different between low and medium overstorey tree
densities in both vegetation types, consistent with the broader survey. The box woodland also shows
a significant difference between low overstorey tree density sites and high overstorey tree density
sites, with medium overstorey tree density sites not different to either. On the other hand, low
overstorey tree density sites exhibited greater increases in mean biomass over the experimental
period in comparison to medium and high density samples. In particular, medium overstorey tree
density sites showed a highly variable pattern over the four sampling sessions and may reflect the
effects of other factors, such as possible climate influences. Lunt et al. (2007) similarly found rainfall
to have a greater influence on plant responses than grazing exclusion in E. camaldulensis forests in
southeast Australia.
Competition for resources, particularly soil water and light, can greatly influence plant survival and
reproduction with dense tree stands likely to decrease resource levels available to small herbaceous
vegetation and grasses (Jackson & Ash, 2001; McIvor, 2001; Scanlan, 2002; Lunt et al., 2007). Low
overstorey tree density sites would, as a result of reduced resource competition, exhibit a greater in
crease in above-ground biomass than those with higher overstorey densities.
More significantly, exclosure type (complete, partial or open) showed no consistent differences in
composition or above-ground biomass after three years of grazing exclusion. This result is somewhat
surprising as, particularly in open paddock areas, it was expected that biomass would be much
Veg Futures 08: Australia’s national vegetation conference
higher in the complete grazing exclosure than the open grazed plots within sites. While some trend
reflecting this expectation appears to exist in relation to the 2008 biomass data, high variability within
samples overshadows any significant differences. Species composition may also take longer to
exhibit differences between exclosure treatments, due to a lag in assemblage changes within plots.
The effects of grazing within differing vegetation communities can be species specific (Hobbs &
Huenneke, 1992), with the exclusion of livestock grazing resulting in increased biomass production of
grazing-sensitive plant species (Lunt et al., 2007). Spooner & Briggs (2008) examined fenced and
unfenced sites in grazing woodlands in southern New South Wales over a 5 year period and found
significant differences in plant species. Fenced sites exhibited considerable decreases in perennial
grasses, both native and exotic, between 2000 and 2005 and notable increases in exotic annual
grasses (Spooner & Briggs, 2008). Hence, mean biomass may not show significant differences
between grazing exclusion and open plots, but may show marked differences in species composition
and abundance.
Longer implementation of exclosure treatments may be required before differences may be realised.
Compared with other exclosure studies, the duration of this investigation in the Traprock region is
relatively short. Pettit & Froend (2001) studied grazing exclosure in E. marginata woodlands in
southwest Western Australia for 7 years. Spooner & Briggs (2008) analysed data over a 5 year
period. Lunt & Morgan (1999) carried out treatments in a grassland reserve in southeast Australia for
10 years. Lunt et al. (2007) examined E. camaldulensis forests in southeast Australia for 12 years
and produced only minor impacts on understorey composition and structure.
Management and conservation significance
Vegetation management practices within the Traprock region have influenced the floristic
composition and richness of woodland communities. Maintaining a medium density of mature trees in
these woodlands can potentially satisfy both production (in terms of grass cover) and biodiversity
(floristic composition) goals in this modified grazing landscape. In both vegetation types examined
here, a medium density of trees would be adequate to ensure a similar floristic composition to that of
high mature tree density areas is maintained. This is significant for land management practices in the
Traprock region in that while there is no significant increase in grass production in the very open
areas compared to medium mature tree density areas, there is a significant decline in biodiversity
value, at least in terms of floristic composition, and potentially other ecosystem services provided by
more structurally complex vegetation.

Veg Futures 08: Australia’s national vegetation conference
Three years of grazing exclusion has failed to show differences in above-ground biomass between
the three exclosure types (complete, partial, open). This, in part, may be due to high inter-annual
variability, or may indicate a longer study is required. However, both compositional and biomass
differences were evident between overstorey tree densities, confirming results from the broader
survey. A further analysis of species composition and functional types within plots may provide more
conclusive evidence for assessing differences between exclosure types. Longer-term monitoring of
exclosure plots would seem necessary in determining the biodiversity ‘potential’ of the woodland and
paddock elements of this production landscape.

Veg Futures 08: Australia’s national vegetation conference
References
Chilcott, C., Reid, N.C.H. & King, K. 1997. 'Impact of trees on the diversity of pasture species and soil biota in grazed landscapes on the Northern Tablelands, NSW', in P. Hale & D. Lamb (eds.), Conservation Outside Nature Reserves, pp. 378-386. Centre for Conservation Biology, Brisbane.
Clarke, K.R., Gorley, R.N., 2001. Primer v5: User Manual/Tutorial, Primer-E Ltd, Plymouth.
Clarke, P.J., 2003. Composition of grazed and cleared temperate grassy woodlands in eastern Australia: patterns in space and inferences in time. Journal of Vegetation Science 14, 5-14.
Dorrough, J., Yen, A., Turner, V., Clark, S.G., Crosthwaite, J., Hirth, J.R., 2004. Livestock grazing management and biodiversity conservation in Australian temperate grassy landscapes. Australian Journal of Agricultural Research 55, 279-295.
Gibbs, L., Reid, N., Whalley, R.D.B., 1999. Relationships between tree cover and grass dominance in a grazed temperate stringybark (Eucalyptus laevopinea) open-forest. Australian Journal of Botany 47, 49-60.
Hobbs, R., Huenneke, L., 1992. Disturbance, Diversity and Invasion: Implications for Conservation, Conservation Biology 6: 324 - 337.
Jackson, J., Ash, A.J., 2001. The role of trees in enhancing soil nutrient availability for native perennial grasses in open eucalypt woodlands of north-east Queensland. Australian Journal of Agricultural Research 52, 377-386.
Kirkpatrick, J.B., Gilfedder, L., Bridle, K., Zacharek, A., 2005. The positive and negative conservation impacts of sheep grazing and other disturbances on the vascular plant species and vegetation of lowland sub humid Tasmania. Ecological Management & Restoration 6, 51-60.
Le Brocque, A.F., Buckney, R.T., 1997. Multivariate relationships between floristic composition and stand structure in vegetation of Ku-ring-gai Chase National Park, New South Wales. Australian Journal of Botany 45, 1033-1044.
Le Brocque, A.F., Goodhew,K.A., Zammit C.A., 2008. Overstorey tree density and understorey regrowth effects on plant composition, stand structure and floristic richness in grazed temperate woodlands in eastern Australia. Agriculture, Ecosystems and Environment, in press.
Lunt, I., Morgan, J., 1999. Vegetation Changes after 10 years of Grazing Exclusion and Intermittent Burning in a Themeda triandra (Poaceae) Grassland Reserve in South east Australia. Australian Journal of Botany 47: 537 – 552.
Lunt, I., Jansen, A., Binns, D., Kenny, S., 2007. Long-term Effects of Exclusion of Grazing Stock on Degraded Herbaceous Plant Communities in a riparian Eucalyptus camaldulensis Forest in South East Australia, Austral Ecology 32: 937 – 949.
McIntyre, S., Lavorel, S., 1994. How environmental and disturbance factors influence species composition in temperate Australian grasslands. Journal of Vegetation Science 5, 373-384.
McIvor, J.G., 2001. Pasture management in semi-arid tropical woodlands: regeneration of degraded pastures protected from grazing. Australian Journal of Experimental Agriculture 41, 487-96.

Veg Futures 08: Australia’s national vegetation conference
McIvor, J.G., Gardener, C.J., 1995. Pasture management in semi-arid woodlands: effects on herbage yields and botanical composition. Australian Journal of Experimental Agriculture 35, 705-715.
McIvor, J.G., McIntyre, S., 2002. Understanding grassy woodland ecosystems, in: McIntyre, S., McIvor, J.G., Heard, K.M., (Eds.), Managing and Conserving Grassy Woodlands, CSIRO Publishing, Collingwood, pp. 1-23.
Morrison, D.A., Le Brocque, A.F., Clarke, P.J., 1995. An assessment of some improved techniques for estimating abundance (frequency) of sedentary organisms. Vegetatio 120, 131-145.
Pettit, N.E., Froend, R.H., 1995. Long-term changes in the vegetation after the cessation of livestock grazing in Eucalyptus marginata (jarrah) woodland remnants, Austral Ecology 26: 22-31.
Primer-E Ltd, 2001. Primer v.5.2.9 for Windows, Primer-E Ltd, Plymouth.
Prober, S.M., Thiele, K.R., 1995. Conservation of the grassy white box woodlands: relative contributions of size and disturbance to floristic composition and diversity of remnants. Australian Journal of Botany 43, 349-366.
Sattler, P., Williams, R., 1999. The Conservation Status of Queensland's Bioregional Ecosystem, Queensland Environmental Protection Agency, Brisbane.
Scanlan, J., 2002. Some Aspects of Tree-Grass Dynamics in Queensland’s Grazing Lands, Rangeland Journal 24: 56 – 82.
Scholes, R.J., Archer, S.R., 1997. Tree-grass interactions in savannas. Annual Review of Ecology and Systematics 28, 517-544.
Spooner, P., Lunt, I., Robinson, W., 2002. ‘Is fencing enough? The short-term effects of stock exclusion in remnant grassy woodlands in southern NSW’, Ecological Management & Restoration. 3: 117-126.
Spooner, P., Briggs, S., 2008. Woodlands on Farms in Southern New South Wales: A Longer-term Assessment of Vegetation Changes after Fencing, Ecological Management & Restoration 9: 33 – 41.
Walpole, S.C., 1999. Assessment of the economic and ecological impacts of remnant vegetation on pasture productivity. Pacific Conservation Biology 5, 28-35.
Yates, C.J., Hobbs, R.J., 1997. Temperate eucalypt woodlands: A review of their status, processes threatening their persistence and techniques for restoration. Australian Journal of Botany 45, 949-973.
Acknowledgements We thank Kate Reardon-Smith, Simon Attwood, Jarrod Kath, Charlie Zammit, John Dearnaley
(University of Southern Queensland), Martine Maron (University of Queensland); Darren Marshall,
Greg Ford & Lynn Pullen (Queensland Murray-Darling Committee), Traprock Wool Association and
all participating landholders (particularly Clive Smith, Andrew Ferrier, Denzil Mills & Andrew Finlay)
and Land Water & Wool, particularly Jann Williams.
Top Related
Copyright © 2022 FDOKUMEN

