

Bahasa
Halaman
Hukum


FISH HABITAT MAPPING
Results of a short study of interactions of cetaceansand longline fisheries in Atlantic waters: environmentalcorrelates of catches and depredation events
Gema Hernandez-Milian Æ Sabine Goetz Æ Catuxa Varela-Dopico ÆJose Rodriguez-Gutierrez Æ Jorge Romon-Olea Æ Jose R. Fuertes-Gamundi ÆEdelmiro Ulloa-Alonso Æ Nick J. C. Tregenza Æ Andy Smerdon ÆMonserrat G. Otero Æ Vicente Tato Æ Jianjun Wang Æ M. Begona Santos ÆAlfredo Lopez Æ Rebeca Lago Æ Julio M. Portela Æ Graham J. Pierce
� Springer Science+Business Media B.V. 2008
Abstract In the Atlantic, economic losses have
been reported from shark, swordfish and tuna longline
fisheries due to depredation by cetaceans. We exam-
ined interactions of odontocete cetaceans with
commercial longliners operating in waters off Brazil
and the Azores archipelago during 2006–2007, anal-
ysing relationships between catches, depredation on
hooked fish, cetacean sightings, acoustic records of
cetacean presence and environmental variables. Data
were provided by skippers of six vessels and by on-
board observers for two vessels. The percentage of
longline sets depredated by cetaceans was low
(ranging from 1% to 9% of total sets per ship) but
the proportion of fish damaged was high (up to 100%)
when depredation occurred. Catches were related to
the phase of the moon, cloud cover, sea surface
temperature and water depth whereas cetacean sight-
ings were primarily related to catches. In particular
there was a positive association between Delphinus
delphis sightings and catches of swordfish, and
between Stenella frontalis sightings and mako
catches. Acoustic detection was low when depreda-
tion by false killer whales occurred although highGuest editor: V. D. Valavanis
Essential Fish Habitat Mapping in the Mediterranean
G. Hernandez-Milian (&) � J. Wang � G. J. Pierce
University of Aberdeen, Tillidrone Avenue, Aberdeen
AB24 2TZ, UK
e-mail: [email protected]
S. Goetz � M. B. Santos � J. M. Portela � G. J. Pierce
Instituto Espanol de Oceanografıa, Centro Oceanografico
de Vigo, Cabo Estai, Canido, 36200 Vigo, Spain
C. Varela-Dopico
Estacion de Biologıa Marina da Grana, University of
Santiago de Compostela, Casa do Horreo e Casa da
Estrela, Rua da Ribeira 1-4, A Grana, 15590 Ferrol, Spain
C. Varela-Dopico � J. Rodriguez-Gutierrez �J. Romon-Olea � J. R. Fuertes-Gamundi �E. Ulloa-Alonso
Cooperativa de Armadores de Pesca del Puerto de Vigo,
Sociedad Coop. Ltda., Puerto Pesquero, Edif.
Cooperativa de Armadores, Apdo. 1078, 36202 Vigo,
Spain
N. J. C. Tregenza
Chelonia Limited, Beach Cottage, 5 Beach Terrace, Long
Rock, Cornwall TR20 8JE, UK
A. Smerdon
Aquatec Group Ltd., High Street, Hartley Wintney,
Hampshire RG27 8NY, UK
M. G. Otero � V. Tato
MG Otero Consultores SL, Porto Pesqueiro, Nvo Tinglado
Xeral Empaque Of. 8, PO Box 1132, 36202 Vigo, Spain
A. Lopez � R. Lago
CEMMA, Apdo. 15, 36380 Gondomar, Pontevedra, Spain
123
Hydrobiologia (2008) 612:251–268
DOI 10.1007/s10750-008-9501-2

rates of clicks were detected when delphinids were
sighted and false killer whales were by-caught. This
may indicate that false killer whales are not echolo-
cating when feeding on fish hooked on a longline.
Keywords Cetaceans � False killer whale �Longline fishery � Depredation � Hydrophones �Behaviour � Habitat modelling
Introduction
Pelagic longline fisheries in the Atlantic usually
operate in offshore waters, mainly targeting tuna,
swordfish, billfishes (Istiophoridae) and sharks
(Brothers et al., 1999a). In contrast to the Pacific,
catches of these species have not increased over the
last decade (ICCAT, 2007). The most important
Atlantic fishing grounds for longliners are located in
the South Central tropical area and NW-W Azores
waters (Lewison et al., 2004). The Spanish tuna and
swordfish longline fishery is one of the most impor-
tant in the Atlantic (ICCAT, 2007), a significant
source of income for the Spanish fishing sector
(Garza Gil et al., 2003). The lines used are approx-
imately 50 miles long and typically carry 1200–1250
hooks.
Toothed whales (Odontoceti) are attracted to
longlines because they provide an easily accessible
source of food and the fish caught on them are often
large. Cetaceans cause significant economic losses
due to damage and removal of bait and hooked fish in
a range of longline fisheries around the world
(Northridge, 1984; Dahlheim, 1988; Ashford et al.,
1996; Capdeville, 1997; Dalla Rosa & Secchi, 2002,
2007; Donoghue et al., 2002; Gilman et al., 2006;
Zollett & Read, 2006; Ramos-Cartelle & Mejuto,
2007). Odontocetes are believed to develop familiar-
ity with the sounds produced by longliners (such as
the sound of the engine, the gear haulers and the
electric equipment) and are frequently observed to
follow vessels for days in order to take advantage of
the catches (Gilman et al., 2006; Ramos-Cartelle &
Mejuto 2007). Depredation rates tend to be higher for
longer soak times (Gilman et al., 2007a, b).
In tropical and subtropical Atlantic waters, the
killer whale (Orcinus orca, Linnaeus 1758) and the
false killer whale (Pseudorca crassidens, Owen
1846) are known to interact with the pelagic
longline fishery for tuna and swordfish (Dalla Rosa
& Secchi, 2002, 2007; Dalla Rosa et al., 2006;
Ramos-Cartelle & Mejuto, 2007). Killer whales and
false killer whales are distributed in all oceans, the
former best known from cooler waters and the latter
preferring tropical, subtropical and warm temperate
waters. Killer whales are found from the surf zone
to 800 km from the coast, with large concentrations
over the continental shelf, whereas false killer
whales inhabit deep offshore waters. Both species
mainly feed on fish, cephalopods and other marine
mammals (Jefferson et al., 1993; Stacey et al., 1994;
Carwadine, 1995). Environmental and oceano-
graphic features, such as water temperature,
bathymetry, oceanic fronts, lunar cycle, and spatio-
temporal factors are believed to play an important
role in the distribution of the cetaceans and their
prey (e.g. Damalas et al., 2007; Romo et al., 2007;
De Stephanis et al., 2008).
Marine mammal presence in offshore waters is
usually determined by means of sightings recorded
from vessels. However, use of passive acoustic
methods, e.g. deployment of T-PODs (www.
chelonia.com), can increase the detection rate, espe-
cially when visibility is low or the animals spend
little time on the surface, and the range of detection
may be wider than if only visual observation is used
(Carstensen et al. 2006; Leeney & Tregenza 2006;
Philpott et al., 2007).
The present short study aimed to describe the
interactions of cetaceans, in particular killer and false
killer whales, with longline fisheries for swordfish
and tuna in two regions of the Atlantic (Brazil and
Azores), determining the relationships between
catches, cetacean presence, the incidence of depre-
dation and environmental variables. Specifically: (1)
Are the fish caught in particular places and is the size
of catch related to environmental conditions? (2) Is
cetacean presence and/or the occurrence of depreda-
tion related to particular environmental conditions?
(3) Is depredation associated with the presence of
particular cetaceans species and is it related to the
amount of fish caught? Finally, since turtle by-
catches were frequent we also investigated possible
relationships between turtle by-catch, fish catch and
environmental conditions.
252 Hydrobiologia (2008) 612:251–268
123

Materials and methods
Sampling effort and study area
Data were gathered from eight Spanish commercial
pelagic surface longline vessels, operating in Atlantic
waters (1) off Brazil and extending into mid-Atlantic
waters and (2) to the west of the Azores archipelago,
between June 2006 and June 2007 (Fig. 1, Table 1).
The two vessels with observers were fishing off
Brazil (V7) and west of the Azores (V8),
respectively.
The oceanography of the study area off Brazil is
dominated by the South Equatorial Current, which
has an offshoot along Brazil’s North Coast (the North
Brazil Current) and to the South (the Brazil Current).
Offshore, in the waters of the Brazil Current,
important fishery resources include Thunnus albac-
ares in the southern region and T. alalunga in the
northern region (Zavala-Camin & Antero da Silva,
1991), which are caught around seamounts and
banks. The Brazil Current is a weak western bound-
ary current carrying warm subtropical water with a
temperature range of 18–28�C, which runs south
along the coast of Brazil from about 9� S to about
38� S and is generally confined to the upper 600 m of
the water column (Memery et al., 2000; Zavilov
et al., 1999).
The second study area is to the west of the Azores
archipelago, a group of nine volcanic islands situated
on the Mid-Atlantic ridge, in an area dominated
oceanographically by the Gulf Stream. The richness
of fishing resources in the Azores originates from the
complex relations between intermediate depth hydro-
thermal fields and seamount ecosystems. Tuna and
swordfish are the most important target groups in the
vicinity of the islands, although sharks—mainly blue
shark (Prionace glauca) and shortfin mako (Isurus
oxyrinchus)—can outnumber swordfish 10:1 in long-
line catches (Morato et al., 2001).
Sampling methods
Skippers of six vessels (V1–V6) recorded data on
catches of fish, cetacean sightings and depredation on
catches. In addition, two vessels (V7 operating off
North East Brazil between January and March 2007
and V8 operating South West of the Azores between
April and June 2007) each carried a scientific
observer on board, who registered data on fishing
activity, cetacean sightings, acoustic detection of
cetaceans, depredation on catches, and environmental
data (Table 1).
Data on fishing activity included the time and
location of each set, the number of hooks on the line,
total catch (number and biomass of fish, by species)
and any by-catch of marine mammals or sea turtles.
The fish caught were identified as follows: swordfish
(Xiphias gladius), shortfin mako (Isurus oxyrinchus),
blue shark (Prionace glauca), tuna (Thunnus spp.,
mainly T. alalunga, T. albacore, and T. Obesus),
marlin (Istiophoridae), dolphinfish (Coryphaena
hippurus), barracuda (Sphyraena spp.) or garfish
(Belonidae).
The number and species of fishes damaged by
predators was logged and, based on the nature of the
damage, the depredation was identified as due to
cetaceans, sharks or other species, such as sea turtles.
Fish damaged by cetaceans can be distinguished from
shark-damaged fish since sharks typically bite the fish
in half leaving clean borders or multiple smaller bites,
whereas cetaceans such as killer whales and false
killer whales tear the body of the fish, leaving bites
with ragged borders and often just the head or the lips
and upper jaw of the fish on the hook (Secchi &
Vaske, 1998; Donoghue et al., 2002; Gilman et al.,
2006; Varela-Dopico, pers. obs.). Fishermen reportFig. 1 Fishing areas of vessels V1–V8 in the Atlantic Ocean.
Squares indicate where fishing operations took place
Hydrobiologia (2008) 612:251–268 253
123

that cetaceans may occasionally also remove the fish
entirely from the lines. Sea turtles leave several small
bites on the fish, mainly eating the commercial parts
(Varela-Dopico, pers. obs.).
Environmental data recorded on board by observ-
ers comprised sea state on the Douglas scale (Sea),
cloud cover on a scale from 0 to 8 (Cd), moon phase
(M1: new moon, M2: waxing moon, M3: full moon,
M4: waning moon), sea surface temperature (SST)
and water depth (Depth). In addition, bathymetry and
coast line data for all trips were obtained from the
GEBCO Atlas 2003, and a map was generated using
ESRI Arc/View 3.3 (Fig. 1).
Sightings of cetaceans were recorded throughout
fishing operations by the two observers, whereas
sightings on the remaining six vessels were opportu-
nistic. Geographic position, number of animals and
species were recorded when they were sighted. The
following categories were used: sperm whale (Phys-
eter macrocephalus), killer whale (Orcinus orca),
false killer whale (Pseudorca crassidens), common
dolphin (Delphinus delphis), Atlantic spotted dolphin
(Stenella frontalis), unidentified Odontoceti and
Mysticeti.
Between one and three T-PODs (Table 2) were
deployed along the line during most sets by vessels
V7 and V8, in approximately 5 m water depth, one at
each end and one in the middle. In order to prevent
possible losses, they were attached to a buoy. The T-
PODs used (version 5, www.chelonia.co.uk) detect
clicks and click trains of specific cetacean species.
They consist of a hydrophone, an analogue processor,
a system to log echolocation clicks, and software that
is able to filter cetacean clicks within a specific
bandwidth. The T-PODs were programmed to detect
false killer whales using parameters values calculated
Table 1 Fishing effort and depredation rates of eight Spanish
commercial longline vessels operating in Atlantic waters (June
2006–July 2007): Vessel number (V1–V8), total no. of
monitored sets per vessel, total no. of hooks deployed per
vessel during monitored trips, average no. of hooks per set,
average amount of catch per set (kg), percentage and number
of sets with cetacean depredation, Spearman correlation
coefficients (r) and associated probability (P) for the relation-
ship between average weight of catches/set and total catch lost
per vessel due to cetacean depredation (V1–V6: Both fish
damaged and bait/fish removed from the hooks were consid-
ered; V7–V8: Only damaged fish was considered), and
percentage and number of sets with sea turtle/marine mammal
by-catch
Vessel Sets Hooks Hooks/set Average catch/set Sets with
cetacean
depredation
Correlation
between catch
and
depredation
% of Catch lost Sets with by-catch
Sea
turtles
Marine mammals
% No. r P % No. No.
V1 76 102,600 1,350 1198.9 5.3 4 -0.07 0.547 1.6 10.5 8 0
V2 45 43,200 960 1574.7 8.9 4 -0.47 0.001 8.6 4.4 2 0
V3 126 163,800 1,300 886.1 5.6 7 -0.24 0.022 3.7 0 0 0
V4 137 185,358 1,353 1177.7 4.4 6 0.08 0.482 3.0 5.1 7 0
V5 94 116,100 1,235 1268.4 1.1 1 -0.01 0.934 0.2 10.6 10 0
V6 71 98,500 1,387 1715.6 4.3 3 -0.22 0.071 0.6 12.7 9 0
V7 30 37,673 1,256 2064.0 3.3 1 0.22 0.238 0.6 33.3 10 0
V8 56 62,198 1,111 1335.8 3.6 2 0.09 0.518 0.9 12.5 7 1
Total 635 809,429 1,275 28 53 1
Table 2 Number and percentage of sets monitored using different numbers of hydrophones (T-PODs), for vessels V7 (Brazil) and
V8 (Azores)
Vessel 3 T-PODs 2 T-PODs 1 T-POD No T-PODs Total sets
Sets % Sets % Sets % Sets %
V7 8 26.7 16 53.3 3 10.0 3 10.0 30
V8 55 98.2 0 0 0 0 1 1.8 56
Total 63 16 3 4 86
254 Hydrobiologia (2008) 612:251–268
123

for free-ranging false killer whales by Madsen et al.,
(2004) (filter A = 41 kHz, filter B = 16 kHz, band-
width = 4–6, sensitivity = various, minimum click
duration = 40 ls). They registered the number of
clicks and classified the clicks according to the
probability of coming from a false killer whale as
high, low, doubtful or very doubtful (Table 3).
P. crassidens produces echolocation sounds of 30–
70 kHz (Madsen et al., 2004). However, this over-
laps with the frequency range for other delphinid
species, e.g. Delphinus delphis echolocation pulse
frequency is between 20 and 100 kHz (Wood &
Evans, 1980) and Stenella spp. emit clicks between
30 and 85 kHz (Lammers et al., 2003) or show
bimodal click spectra with peaks at 40–60 kHz and
120–140 kHz (Schotten et al., 2003). Therefore the
degree of species-specificity of the detections
depends on the species present in the study area and
in the present case was low due to the presence of
both Delphinus and Stenella.
Data from the T-PODs were downloaded and
stored on a laptop after hauling each line. Due to
technical problems not all T-PODs worked all the
time during the survey in Brazilian waters. In the
Azores, T-PODs were used during all but one set. For
each T-POD and each set, we extracted the number of
clicks that were considered likely to come from
delphinids (‘‘positives’’, the sum of ‘‘CetHi’’ and
‘‘CetLo’’ categories, also known as ‘‘CetAll’’, see
www.chelonia.co.uk) and the number of other clicks
(‘‘negatives’’). Two additional indicators of cetacean
activity were calculated (after Tougaard et al., 2004;
Skov et al., 2002; Leeney & Tregenza, 2006): aver-
age click rate (the number of positive clicks divided
by the total recording time) and click intensity (the
mean number of positive clicks during minutes with
clicks). Both indicators were calculated by T-POD
and set.
Data analysis
Variables used for data analysis comprised descrip-
tors of catch composition, occurrence and amount of
depredation on catches, cetacean sightings, acoustic
detections of cetaceans, and environmental data (see
Table 4). Possible relationships between variables
were initially explored using Spearman rank correla-
tions, treating data from each set as a sample and
analysing data from each vessel separately.
To provide a more detailed insight into relation-
ships between response and explanatory variables,
redundancy analysis (RDA) and generalised additive
models were used with data from vessels 7 and 8
(recorded by observers). Data for Brazil and the
Azores were analysed separately. For both surveys,
(a) catches (numbers) of swordfish, tuna, shortfin
mako and blue shark and (b) acoustic data on cetacean
presence (click rate and click intensity) could be used
as response variables for the RDA. For the Azores
survey, there was sufficient data to also treat (c)
cetacean sightings (numbers seen for Delphinus
delphis, Stenella frontalis, Orcinus orca, Pseudorca
crassidens, Physeter macrocephalus, Mysticetes and
unidentified Odontocetes) and (d) incidence of dep-
redation (numbers of damaged fish for swordfish,
shortfin mako and escolar) as response variables.
Thus, six RDA analyses were carried out in total
(Table 5). In each case, all remaining variables were
treated as explanatory variables. When using acoustic
or depredation variables as response variables, ceta-
cean sightings were converted to presence–absence
data for use as explanatory variables, since we
Table 3 Number of clicks detected by the hydrophones for vessels V7 (Brazil) and V8 (Azores)
Vessel CetHi CetLo Doubtful Very doubtful Positives Negatives Total
Clicks % Clicks % Clicks % Clicks % Clicks % Clicks %
V7 17,186 21.3 21,253 27.0 21,782 27.0 20,400 25.3 68,268 84.7 12,352 15.3 80,621
V8 50,439 11.9 71,193 16.8 188,374 44.5 113,358 26.8 121,370 28.7 301,994 71.3 423,364
Total 67,625 92,446 210,156 133,758 189,638 314,346 503,985
CetHi, clicks with high probability of coming from a cetacean; CetLo, clicks with lower probability of coming from a cetacean;
Doubtful, clicks which are often from cetaceans, but are sometimes unreliable; Very doubtful, click sequences which are more likely
to arise from other sources; Positives, sum of CetHi + CetLo; Negatives, sum of doubtful and very doubtful; Total, Total number of
clicks detected by the T-PODs regardless of source
Hydrobiologia (2008) 612:251–268 255
123
considered the visually confirmed presence or absence
of cetaceans to be more important than the precise
number present. RDA output indicates the proportion
of variation in the response variables explained by the
explanatory variables. The statistical significance of
the effects of explanatory variables was obtained
using a Monte Carlo permutation test with n = 4,999
permutations. The relationships between the response
and explanatory variables were also displayed as
point-vector biplots (see Zuur et al., 2007).
When RDA detected significant relationships
between response and explanatory variables, these
were further investigated using Generalised Additive
Models (GAMs) and Generalised Linear Models
(GLMs) for individual response variables within each
of the four groups (catch, acoustic detections, sight-
ings, and depredation), thereby allowing non-linearity
in the relationships to be taken into account.
Response variables could generally be assumed to
follow binomial (presence–absence data) or Poisson
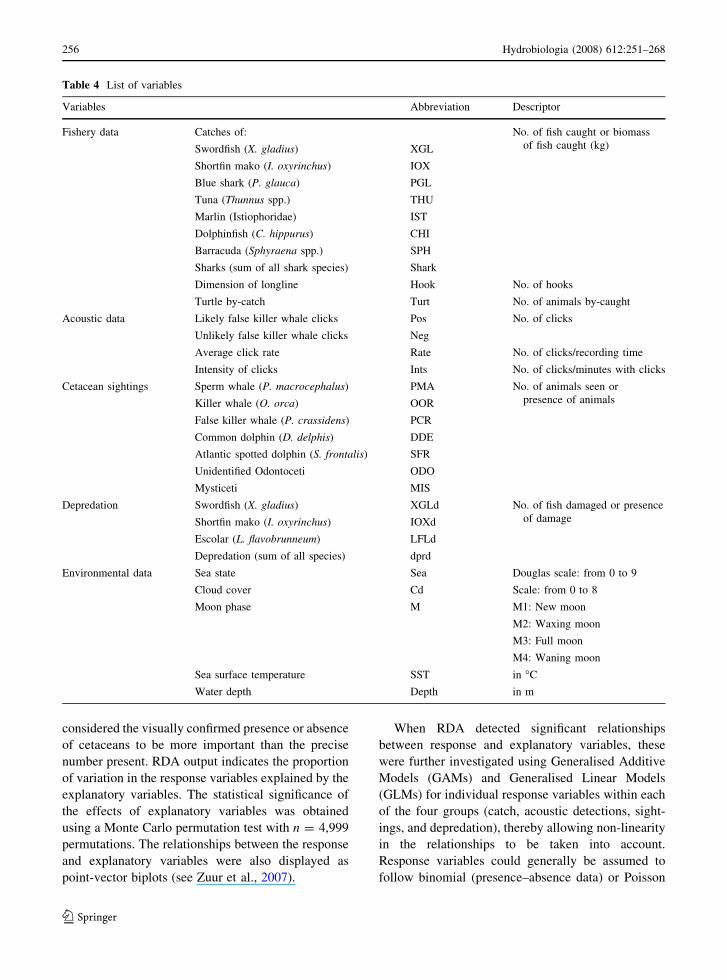
Table 4 List of variables
Variables Abbreviation Descriptor
Fishery data Catches of: No. of fish caught or biomass
of fish caught (kg)Swordfish (X. gladius) XGL
Shortfin mako (I. oxyrinchus) IOX
Blue shark (P. glauca) PGL
Tuna (Thunnus spp.) THU
Marlin (Istiophoridae) IST
Dolphinfish (C. hippurus) CHI
Barracuda (Sphyraena spp.) SPH
Sharks (sum of all shark species) Shark
Dimension of longline Hook No. of hooks
Turtle by-catch Turt No. of animals by-caught
Acoustic data Likely false killer whale clicks Pos No. of clicks
Unlikely false killer whale clicks Neg
Average click rate Rate No. of clicks/recording time
Intensity of clicks Ints No. of clicks/minutes with clicks
Cetacean sightings Sperm whale (P. macrocephalus) PMA No. of animals seen or
presence of animalsKiller whale (O. orca) OOR
False killer whale (P. crassidens) PCR
Common dolphin (D. delphis) DDE
Atlantic spotted dolphin (S. frontalis) SFR
Unidentified Odontoceti ODO
Mysticeti MIS
Depredation Swordfish (X. gladius) XGLd No. of fish damaged or presence
of damageShortfin mako (I. oxyrinchus) IOXd
Escolar (L. flavobrunneum) LFLd
Depredation (sum of all species) dprd
Environmental data Sea state Sea Douglas scale: from 0 to 9
Cloud cover Cd Scale: from 0 to 8
Moon phase M M1: New moon
M2: Waxing moon
M3: Full moon
M4: Waning moon
Sea surface temperature SST in �C
Water depth Depth in m
256 Hydrobiologia (2008) 612:251–268
123

(count data) distributions, with an addition parameter
for dispersion included in the model if overdispersion
was detected, and using appropriate link functions.
The exceptions were click intensity, which was log-
transformed to achieve an approximately Gaussian
distribution, and average click rate, which had an
approximately Gaussian distribution. For the Brazil
data set both average click rate and click intensity
were consistently low so the number of positive
clicks was used as the response variable in GAMs.
Cetacean sightings and depredation data were con-
verted to presence–absence for use in GAMs and
GLMs. Cloud cover (on a scale of 0–8) was treated as
a continuous variable. For all continuous explanatory
variables, degrees of freedom were constrained to be
less than 5 to avoid overfitting.
The fitted GAMs had the general form:
yi ¼ aþ f1 xi1ð Þ þ . . .þ fm ximð Þ þ bnxin þ . . .þ bpxip
þ ei ei�N 0; r2� �
where yi is the response variable, fj() are the
smoothing functions, bq are coefficients for paramet-
ric terms (e.g. dummy variables generated from
categorical variables) and e a random error parameter
(Zuur et al., 2007). Models were fitted using a
combination of forwards and backwards selection
until all remaining terms were significant or none
remained. Where none of the explanatory variables
remaining was a continuous variable or could be
treated as such, model fitting continued using gener-
alised linear modelling (GLM). Plots of residuals
were examined to confirm goodness of fit. RDA,
GAMs and GLMs were performed using Brodgar
2.5.2 (www.brodgar.com). More information about
these techniques can be found in Zuur et al. (2007).
Since turtle by-catch occurred quite frequently we
also examined possible causal factors (environmental
conditions and catch). Kruskal-Wallis tests were used
to compare fish catches and environmental conditions
during sets with and without turtle by-catch.
Results
Overall fishing effort, catches, by-catch and losses
due to depredation
The fishing effort of the eight longline vessels
monitored was located in the South Equatorial
Current (V1–V7) and the Gulf Stream (V8) (Fig. 1).
Between July 2006 and June 2007 the vessels
Table 5 Numerical output of the Redundancy analysis (RDA)
for vessels V7 (Brazil) and V8 (Azores) indicating individual
eigenvalues of the first and second axis (k1, k2), sum of all
canonical eigenvalues (Sum), and results of F tests (F and
associated probability, P) for the significance of effects of
individual explanatory variables (only explanatory variables
with significant effects are shown)
Vessel Response variables k1 k2 Sum Explanatory variables F P
V7 Fish catches 17.91 12.21 0.46 Turt 2.92 0.010
M4 2.40 0.032
Acoustic data 33.62 0.68 0.34 M2 4.94 0.027
V8 Fish catches 24.59 13.69 0.47 M3 5.99 0.000
Depth 3.14 0.017
SST 3.00 0.019
M4 0.04 0.037
Acoustic data 46.68 0.54 0.47 DDE 8.27 0.004
SFR 5.37 0.016
Sightings 14.38 8.44 0.40 XGL 2.94 0.012
M3 2.08 0.032
Rate 2.10 0.034
dprd 4.45 0.039
IOX 2.70 0.045
Depredation 30.42 6.95 0.44 PCR 21.72 0.001
When one set of variables (see Table 4) was used as response variables, all variables from the other four sets were potentially
available as ‘‘explanatory’’ variables
Hydrobiologia (2008) 612:251–268 257
123
performed 635 sets, deploying an average number of
1,275 hooks per set and catching a total of
1185.5 tons of marketable fish. Depredation by
cetaceans occurred during between 1% and 9% of
sets per vessel, with overall estimated losses (per
vessel) between 0.2% and 8.6% of the total catch
(V1–V6: Both fish damaged and bait/fish removed
from the hooks were considered; V7–V8: Only
damaged fish was considered) (Table 1).
By-catch of turtles was reported for all vessels,
except for V3, occurring on an average in 11.2% of
all sets. The number of turtles by-caught ranged
between 1 and 5 animals per set. Leatherback turtle
Dermochelys coriacea (39% of turtle individuals by-
caught) and green turtle Chelonia mydas (31%) were
the most frequently caught species, followed by
loggerhead turtle Caretta caretta (19%) and Olive
Ridley turtle Lepidochelys olivacea (11%). Most
turtles were caught alive and released. Marine
mammal by-catch was registered only once: during
one set off the Azores, two false killer whales were
caught on the longline (Table 1).
Catches and depredation on non-observer vessels
For the non-observer trips (V1–V6), skippers
recorded that all catch damaged was due to cetacean
depredation, based on the type of bite marks seen.
The average percentage of sets depredated was low
(4.6%) but when depredation occurred, between 2%
and 100% of the catch was lost, with over 25% of the
catch lost on two-thirds of these occasions. For two of
the six vessels, the occurrence of depredation was
significantly negatively correlated with catch (V2:
r = -0.47, P = 0.001; V3: r = -0.24, P = 0.022)
(Table 1), suggesting that depredation may signifi-
cantly reduce catches.
Catches, by-catches and depredation on vessels
with observers
The total catch of the two vessels with observers on
board (V7 and V8) was 136.7 tonnes (3,645 individ-
uals) of fish, of which 87% (by number) were
marketable. The main species caught off Brazil (V7)
by number were tuna (54.5%), swordfish (29.4%) and
marlin (7.5%). Off the Azores (V8), the principal
species caught by number were sharks (73.6%, blue
sharks and shortfin mako sharks) and swordfish
(24.6%). Depredation of catches occurred during 19
out of 86 sets: nine times off Brazil and ten times off
the Azores. However, based on visual inspection of
the damaged fish, this was attributed to cetaceans,
presumed to be false killer whales, on only three
occasions, once off Brazil (3.3% of sets) and twice
off the Azores (3.6% of sets) (Table 1). This
compares to twelve instances of depredation by
sharks and four that were attributed to turtles. The
overall proportion of catches (by number) damaged
by cetaceans across all sets was only 0.2% and 0.9%
of total catch, respectively. The fish damaged by
cetaceans were swordfish (85.7% by number) and
shortfin mako (14.3% by number).
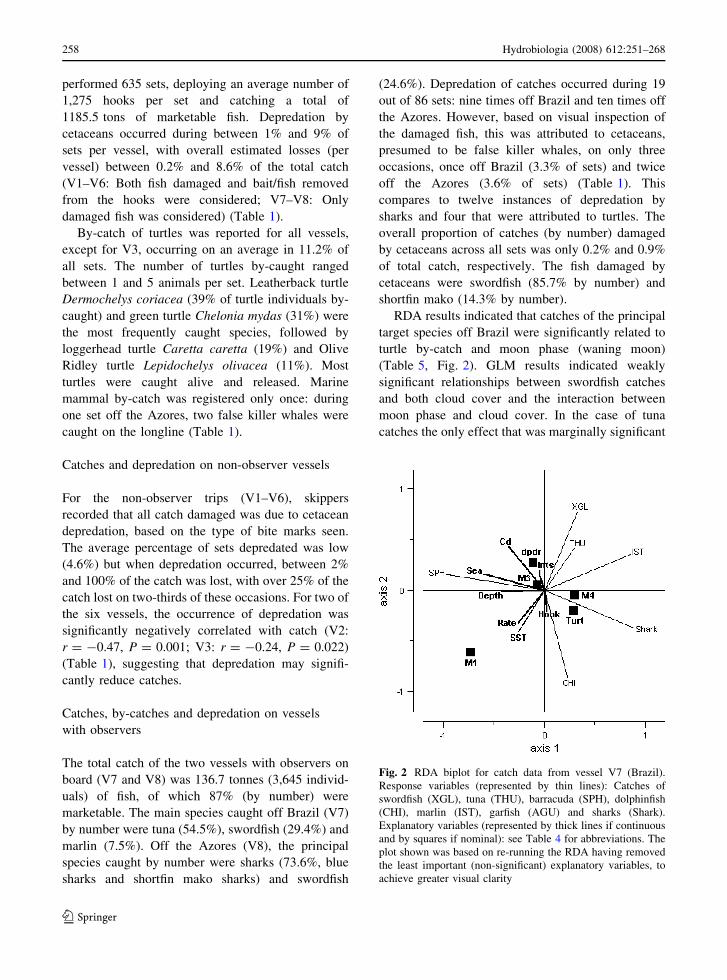
RDA results indicated that catches of the principal
target species off Brazil were significantly related to
turtle by-catch and moon phase (waning moon)
(Table 5, Fig. 2). GLM results indicated weakly
significant relationships between swordfish catches
and both cloud cover and the interaction between
moon phase and cloud cover. In the case of tuna
catches the only effect that was marginally significant
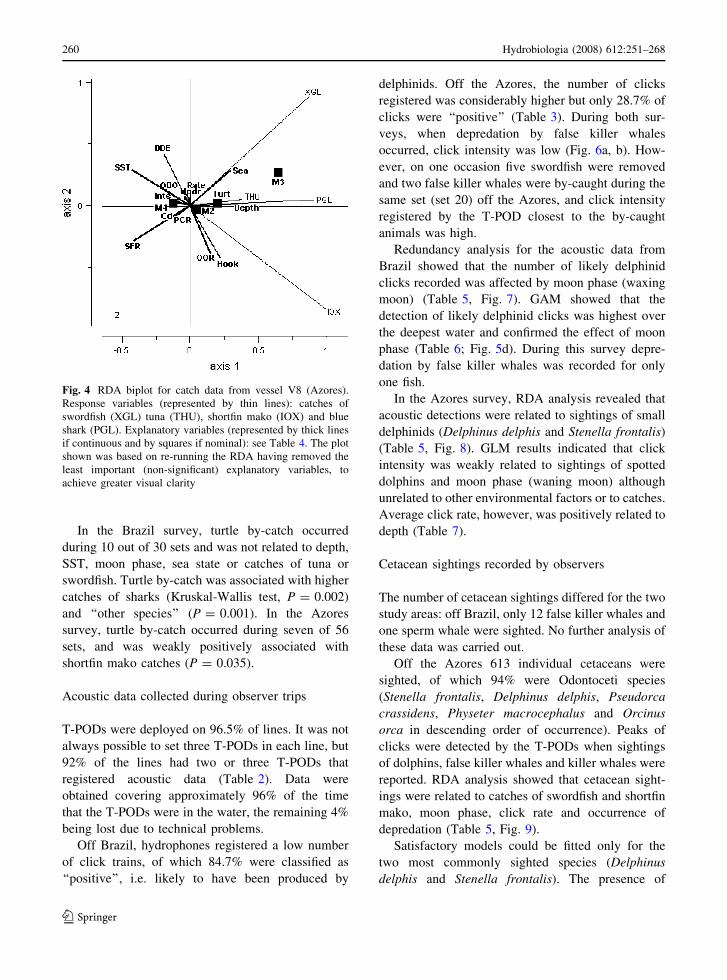
Fig. 2 RDA biplot for catch data from vessel V7 (Brazil).
Response variables (represented by thin lines): Catches of
swordfish (XGL), tuna (THU), barracuda (SPH), dolphinfish
(CHI), marlin (IST), garfish (AGU) and sharks (Shark).
Explanatory variables (represented by thick lines if continuous
and by squares if nominal): see Table 4 for abbreviations. The
plot shown was based on re-running the RDA having removed
the least important (non-significant) explanatory variables, to
achieve greater visual clarity
258 Hydrobiologia (2008) 612:251–268
123

was the interaction term, with both main effects
(cloud cover, moon phase) non-significant (Table 6).
The co-plot (Fig. 3) illustrates the interaction
between the effects of cloud cover and moon phase
in relation to swordfish catches. Due to the small
sample size, further investigation of these relation-
ships is not possible.
Off the Azores, RDA showed catches of the three
main fish species were related to moon phase, water
depth and SST (Table 5, Fig. 4). GAMs showed that
swordfish catches were related to water depth, moon
phase, cloud cover and sightings of Stenella frontalis
(Table 7). Catches peaked at a cloud cover value of 2
(Fig. 5a), showed a minimum value at around
3,000 m depth (increasing in shallower and deeper
waters) (Fig. 5b) and decreased in the presence of
Stenella. Given that spotted dolphins are unlikely to
remove large fish from the lines, the interpretation of
the latter relationship is unclear.
Mako catches off the Azores showed significant
relationships with moon phase, SST, click rate and
sightings of Delphinus delphis and Stenella frontalis
(Table 7). Catches were lower at higher temperatures
and lower at the highest values for click rate
(Fig. 5c). Catches were strongly negatively associ-
ated with presence of common dolphins and
positively associated with presence of spotted dol-
phins. Finally blue shark catches were related to
moon phase, with higher catches around full moon
(Table 7).
Table 6 GAM and GLM results using data from vessel V7 (Brazil, N = 30 sets)
Response
variables
Explanatory
variables
Type t F P Sign edf %dev AIC
XGL 29.2 211.6
Moon N All [0.05
Cd L 2.22 0.0364 +
Cd-M3 N -2.08 0.0492 -
THU 45.2 302.6
Moon N All [0.05
Cd N 1.71 [0.05
M2-Cd N -2.12 0.0448 -
Pos 51.9 838.2
M1 N -2.93 0.0084 -
M2 N 2.45 0.0237 +
Depth S 3.49 0.0263 3.64
The response variables were catches (number) of swordfish and tuna per set, and the number of likely delphinid echolocation clicks.
In all cases, a quasi-Poisson distribution was assumed for the response variable. Results displayed are as follows: explanatory
variables (and interactions) included in the final model, whether they were included as smoothers (S), linear terms (L) or nominal
variables (N), their significance (based on F or t tests, with P-value), the direction (sign) of the effect (+ or -) and degrees of
freedom for smoothers. Also given are the overall percentage of deviance explained (%dev) and AIC value for the model. Full moon
(M4) was used as the reference value when evaluating effect of moon phase (since there was only one record with new moon).
Explanatory variables used: Table 4
Fig. 3 Co-plot for swordfish catches by vessel V7 (Brazil),
illustrating the interactions between effects of moon phase and
cloud cover
Hydrobiologia (2008) 612:251–268 259
123
In the Brazil survey, turtle by-catch occurred
during 10 out of 30 sets and was not related to depth,
SST, moon phase, sea state or catches of tuna or
swordfish. Turtle by-catch was associated with higher
catches of sharks (Kruskal-Wallis test, P = 0.002)
and ‘‘other species’’ (P = 0.001). In the Azores
survey, turtle by-catch occurred during seven of 56
sets, and was weakly positively associated with
shortfin mako catches (P = 0.035).
Acoustic data collected during observer trips
T-PODs were deployed on 96.5% of lines. It was not
always possible to set three T-PODs in each line, but
92% of the lines had two or three T-PODs that
registered acoustic data (Table 2). Data were
obtained covering approximately 96% of the time
that the T-PODs were in the water, the remaining 4%
being lost due to technical problems.
Off Brazil, hydrophones registered a low number
of click trains, of which 84.7% were classified as
‘‘positive’’, i.e. likely to have been produced by
delphinids. Off the Azores, the number of clicks
registered was considerably higher but only 28.7% of
clicks were ‘‘positive’’ (Table 3). During both sur-
veys, when depredation by false killer whales
occurred, click intensity was low (Fig. 6a, b). How-
ever, on one occasion five swordfish were removed
and two false killer whales were by-caught during the
same set (set 20) off the Azores, and click intensity
registered by the T-POD closest to the by-caught
animals was high.
Redundancy analysis for the acoustic data from
Brazil showed that the number of likely delphinid
clicks recorded was affected by moon phase (waxing
moon) (Table 5, Fig. 7). GAM showed that the
detection of likely delphinid clicks was highest over
the deepest water and confirmed the effect of moon
phase (Table 6; Fig. 5d). During this survey depre-
dation by false killer whales was recorded for only
one fish.
In the Azores survey, RDA analysis revealed that
acoustic detections were related to sightings of small
delphinids (Delphinus delphis and Stenella frontalis)
(Table 5, Fig. 8). GLM results indicated that click
intensity was weakly related to sightings of spotted
dolphins and moon phase (waning moon) although
unrelated to other environmental factors or to catches.
Average click rate, however, was positively related to
depth (Table 7).
Cetacean sightings recorded by observers
The number of cetacean sightings differed for the two
study areas: off Brazil, only 12 false killer whales and
one sperm whale were sighted. No further analysis of
these data was carried out.
Off the Azores 613 individual cetaceans were
sighted, of which 94% were Odontoceti species
(Stenella frontalis, Delphinus delphis, Pseudorca
crassidens, Physeter macrocephalus and Orcinus
orca in descending order of occurrence). Peaks of
clicks were detected by the T-PODs when sightings
of dolphins, false killer whales and killer whales were
reported. RDA analysis showed that cetacean sight-
ings were related to catches of swordfish and shortfin
mako, moon phase, click rate and occurrence of
depredation (Table 5, Fig. 9).
Satisfactory models could be fitted only for the
two most commonly sighted species (Delphinus
delphis and Stenella frontalis). The presence of
Fig. 4 RDA biplot for catch data from vessel V8 (Azores).
Response variables (represented by thin lines): catches of
swordfish (XGL) tuna (THU), shortfin mako (IOX) and blue
shark (PGL). Explanatory variables (represented by thick lines
if continuous and by squares if nominal): see Table 4. The plot
shown was based on re-running the RDA having removed the
least important (non-significant) explanatory variables, to
achieve greater visual clarity
260 Hydrobiologia (2008) 612:251–268
123
D. delphis was related to higher catches of swordfish
and lower catches of shortfin mako catches. The
presence of Stenella frontalis was associated with
higher mako catches and lower swordfish catches.
Both species were more frequently sighted when
detection of ‘‘positive’’ clicks was high. In addition,
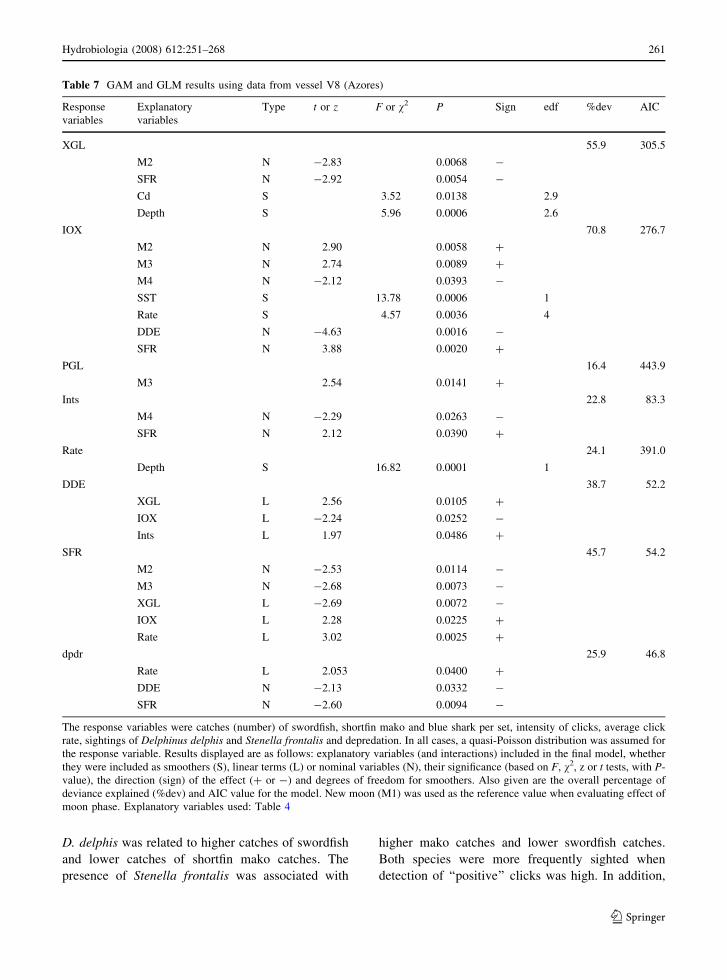
Table 7 GAM and GLM results using data from vessel V8 (Azores)
Response
variables
Explanatory
variables
Type t or z F or v2 P Sign edf %dev AIC
XGL 55.9 305.5
M2 N -2.83 0.0068 -
SFR N -2.92 0.0054 -
Cd S 3.52 0.0138 2.9
Depth S 5.96 0.0006 2.6
IOX 70.8 276.7
M2 N 2.90 0.0058 +
M3 N 2.74 0.0089 +
M4 N -2.12 0.0393 -
SST S 13.78 0.0006 1
Rate S 4.57 0.0036 4
DDE N -4.63 0.0016 -
SFR N 3.88 0.0020 +
PGL 16.4 443.9
M3 2.54 0.0141 +
Ints 22.8 83.3
M4 N -2.29 0.0263 -
SFR N 2.12 0.0390 +
Rate 24.1 391.0
Depth S 16.82 0.0001 1
DDE 38.7 52.2
XGL L 2.56 0.0105 +
IOX L -2.24 0.0252 -
Ints L 1.97 0.0486 +
SFR 45.7 54.2
M2 N -2.53 0.0114 -
M3 N -2.68 0.0073 -
XGL L -2.69 0.0072 -
IOX L 2.28 0.0225 +
Rate L 3.02 0.0025 +
dpdr 25.9 46.8
Rate L 2.053 0.0400 +
DDE N -2.13 0.0332 -
SFR N -2.60 0.0094 -
The response variables were catches (number) of swordfish, shortfin mako and blue shark per set, intensity of clicks, average click
rate, sightings of Delphinus delphis and Stenella frontalis and depredation. In all cases, a quasi-Poisson distribution was assumed for
the response variable. Results displayed are as follows: explanatory variables (and interactions) included in the final model, whether
they were included as smoothers (S), linear terms (L) or nominal variables (N), their significance (based on F, v2, z or t tests, with P-
value), the direction (sign) of the effect (+ or -) and degrees of freedom for smoothers. Also given are the overall percentage of
deviance explained (%dev) and AIC value for the model. New moon (M1) was used as the reference value when evaluating effect of
moon phase. Explanatory variables used: Table 4
Hydrobiologia (2008) 612:251–268 261
123

sightings of Stenella frontalis were lower during full
and waxing moon (Table 7).
Depredation
Nine fish were depredated during the Brazil survey of
which only one may have been depredated by false
killer whales. Further statistical analysis was there-
fore not possible.
During the Azores survey, depredation affected
three species (swordfish, shortfin mako and escolar),
but false killer whales probably mainly removed
swordfish. RDA suggested that depredation was
related with sightings of false killer whales (Table 5,
Fig. 10). The GLM, however, revealed that the
occurrence of depredation increased when click rate
was high and sightings of small delphinids (D. del-
phis and S. frontalis) were low (Table 7).
Discussion
Our results suggest that catches of the main target
species of the fishing vessels observed were affected
by environmental variables such as light conditions
(cloud cover and moon phase), water temperature and
water depth. Tuna, swordfish and sharks are all
oceanic migratory species, which are mostly found in
temperate surface waters where thermal fronts and
upwelling processes occur (Collette & Nauen, 1983;
Bigelow et al., 1999; Brill et al., 1999; Dagorn et al.,
2000; De Stephanis et al., 2008). They show diel
vertical movement patterns, feeding at the surface
layer during the night (Nakamura, 1985; Bigelow
et al., 1999; Domokos et al., 2007) and descending to
deeper waters during the day. Therefore, longlines
targeting these species are usually set in surface
waters around sunset, soaking during the night, and
hauled around sunrise.
Based on this small data set, moon phase appears
to have an important effect on swordfish and shark
catches. This was also found in other areas, e.g. the
Pacific (Pallares & Garcia-Mamolar, 1985; Bigelow
et al., 1999) and the Mediterranean (Damalas et al.,
2007). Cloud cover also affects seabird by-catch on
longlines. A higher intensity of moon and daylight
(depending on moon phase and cloud cover) may
improve the visibility of bait on the lines and
Fig. 5 GAM results:
Azores (V8)—smoothing
curves for partial effect of
(a) cloud cover and (b)
water depth on swordfish
catches, and (c) click rate
on mako catches. Brazil
(V7)—smoothing curve for
partial effect of (d) water
depth on the number of
likely delphinid clicks
recorded. Dotted lines
indicate 95% confidence
bands
262 Hydrobiologia (2008) 612:251–268
123

Fig. 6 Click intensity and
occurrence of depredation
for (a) vessel V7 (Brazil)
and (b) vessel V8 (Azores),
by set
Fig. 7 RDA biplot for acoustic data from vessel V7 (Brazil).
Response variables (represented by thin lines): likely delphinid
clicks (Pos) and unlikely delphinid clicks (Neg). Explanatory
variables (represented by thick lines if continuous and by
squares if nominal): see Table 4. The plot shown was based on
re-running the RDA having removed the least important (non-
significant) explanatory variables, to achieve greater visual
clarity
Fig. 8 RDA biplot for acoustic data from vessel V8 (Azores).
Response variables (represented by thin lines): likely delphinid
clicks (Pos) and unlikely delphinid clicks (Neg). Explanatory
variables (represented by thick lines if continuous and by
squares if nominal): see Table 4. The plot shown was based on
re-running the RDA having removed the least important (non-
significant) explanatory variables, to achieve greater visual
clarity
Hydrobiologia (2008) 612:251–268 263
123

therefore attract more fish (and sea birds) to the
fishing gear (Cherel et al., 1996; Brothers et al.,
1999a, b).
Bigelow et al. (1999) found that swordfish CPUE
in the northern Pacific Ocean was lowest over a range
of 2,000–3,000 m bottom depth, and then increased
in deeper water. Our results suggest that a similar
relationship applies in Atlantic waters.
The by-catch rate of cetaceans during our study
was very low and similar to rates reported by Dalla
Rosa & Secchi (2002). Two false killer whales were
by-caught during one set off the Azores. This is
consistent with the observation by Perrin et al. (1994)
that, although cetacean by-catch is a major issue in
fishing gear such as gillnets and trawls, with longlines
it occurs only occasionally.
The frequency of false killer whale sightings was
very low, perhaps because they were primarily
feeding underwater on fishes hooked on the line
(between 15 and 100 m water depth) and were
therefore not visible for observers. Other delphinids,
however, were frequently sighted. Delphinus delphis
sightings off the Azores were more frequent when
catches of swordfish were high and mako catches
were low, while for sightings of Stenella frontalis it
was the other way around. This might indicate that
both delphinid species share the same habitat, but
feed on different prey. However, other studies
suggest that the trophic ecology of Delphinus delphis
and Stenella frontalis is quite similar (Aguiar dos
Santos & Haimovici, 2001).
Although they are unlikely to prey directly on
large swordfish and mako sharks, respectively, they
may feed on the same fish and squid species that are
taken by these species. The association between
swordfish and dolphins may be similar to the strong
tuna-dolphin (D. delphis and Stenella species) asso-
ciation found in other areas (e.g. Hall & Donovan,
2002; Reeves & Reijnders, 2002). This association
was originally exploited by fishermen in the Eastern
Tropical Pacific where yellowfin tuna swam under-
neath dolphins and were thus located.
T-PODs are useful to give insight into cetacean
activity under water. However, analysis of acoustic
data in relation to sightings data suggested that most
Fig. 9 RDA biplot for cetacean sightings data from vessel V8
(Azores). Response variables (represented by thin lines):
Sightings of Mysticetes (MIS), Delphinus delphis (DDE),
Stenella frontalis (SFR), Pseudorca crassidens (PCR) and
Orcinus orca (OOR), Physeter macrocephalus (PMA) and not
identified odontocetes (ODO). Explanatory variables (repre-
sented by thick lines if continuous and by squares if nominal):
see Table 4. The plot shown was based on re-running the RDA
having removed the least important (non-significant) explan-
atory variables, to achieve greater visual clarity
Fig. 10 RDA biplot for depredation data from vessel V8
(Azores). Response variables (represented by thin lines):
Depredation on swordfish (XGLd), shortfin mako (IOXd) and
Escolar (LFLd). Explanatory variables (represented by thick
lines if continuous and by squares if nominal): see Table 4. The
plot shown was based on re-running the RDA having removed
the least important (non-significant) explanatory variables, to
achieve greater visual clarity
264 Hydrobiologia (2008) 612:251–268
123

of the recorded clicks came from small delphinids,
which produce echolocation sounds in the same
frequency range as those emitted by false killer
whales. False killer whales, like other odontocete
species, use biosonar to echolocate their prey. Fishes
hooked on a surface longline are easy to prey on and
the use of echolocation may not be necessary for
feeding on them.
In our study, both observer and skipper data
indicate that the frequency of depredation on pelagic
longlines operating in Atlantic waters was low. Less
than 1% of the overall catch per trip was lost during
both trips when scientific observers were on board.
However, if depredation occurred, the amount of
catch lost per set reported by skippers exceeded 25%
on most occasions and could reach up to 100%.
Similar results were reported by Dalla Rosa & Secchi
(2007), Kock et al. (2006), Poisson et al. (2007) and
Ramos-Cartelle & Mejuto (2007). When depredation
occurred, the economic loss could be as high as 40%
of the value of the catches, including vessel operation
costs and fishing time lost (ARVI, unpublished data).
A possible reason for the low incidence of depreda-
tion is that skippers avoid fishing areas where
cetacean presence is known to be high in order to
reduce interactions (Dahlheim, 1988). However,
fishermen think that these animals learn to follow
the longline vessels (e.g. Poisson & Taquet, 2000;
Donoghue et al., 2002). It should be noted that
depredation rates may be underestimated because
only damaged fish were counted when calculating
depredation rates, while fish removed entirely from
the hooks could not be quantified.
Our results suggest that false killer whale was the
main marine mammal predator removing catch from
the longlines, although few instances were recorded
and depredation by sharks was four times as frequent
as that attributed to marine mammals. Although the
species most frequently sighted in our study were
D. delphis and S. frontalis, dolphins were hardly ever
observed when depredation occurred which indicates
that they were most likely not feeding on the hooked
fish. Therefore, the co-occurrence of depredation and
cetacean clicks may have been coincidental. For two
of the non-observer vessels, the amount of fish caught
was significantly lower when depredation by false
killer whales occurred. In addition, RDA suggested a
relationship between the occurrence of depredation
and sightings of Pseudorca for the observer vessels
and the only by-catch of false killer whales coincided
with the removal of five swordfish from the line
during one set. Dalla Rosa & Secchi (2007) reported
that depredation on longline fisheries targeting
swordfish in Brazilian waters was primarily caused
by killer whales, but occasionally by other cetaceans
such as false killer whales. However, their research
was carried out closer to the coast where killer whales
are more abundant (Jefferson et al., 1993).
False killer whales mainly feed on fish and
cephalopods (Koen-Alonso & Pedraza, 1999; Her-
nandez-Garcia, 2002; Ramos-Cartelle & Mejuto,
2007). Previous studies (Secchi & Vaske, 1998;
Gilman et al., 2006; Zollett & Read, 2006) demon-
strated that fish hooked on longlines was becoming a
new resource, changing the feeding customs of the
cetaceans. According to Ramos-Cartelle & Mejuto
(2007), the cetaceans learnt to use the bait and
catches retained on the fishing gear as an ‘easy’ prey
to capture and thereby reduce the energy costs of
feeding. They seem to be selective when taking fish
from the lines (Kock et al., 2006). In our study, the
main fish species consumed by cetaceans was
swordfish. This was also found by Poisson & Taquet
(2000) and Dalla Rosa & Secchi (2007). However,
off Brazil tuna was the main fish captured and sharks
were the main target species (followed by swordfish)
off the Azores. Thus the consumption of swordfish
might indicate a preference of the cetaceans for this
species, as suggested by Dalla Rosa & Secchi (2007)
and Poisson and Taquet (2000).
While observers reported depredation by sharks
and other animals, skippers on the other six vessels
reported depredation in general, with the assumption
that false killer whales were responsible being based
on sightings of this species alongside the boats.
Donoghue et al., (2002) indicated that fish damaged
by sharks may be inaccurately reported. Skippers
may not distinguish between different types of bite
marks.
Turtle by-catch was frequent, especially when a
higher number of sharks were caught, and involved at
least four different turtle species. Carranza et al.
(2006) found that mako sharks preyed upon various
species of sea turtles in the Equatorial Eastern
Atlantic. This might also apply in our study area.
Several instances of damage to hooked fish were
attributed to turtles. Although in this study most
turtles were apparently released alive, turtle by-catch
Hydrobiologia (2008) 612:251–268 265
123
remains a major issue in longline fisheries, one which
can possibly be reduced by use of alternative hook
designs and bait or by fishing deeper (e.g. Gilman
et al. 2007a, b).
Conclusions
In our study, catch rates were influenced by environ-
mental parameters such as light conditions, SST and
water depth, whereas cetacean presence was mainly
related to the catch rates of particular fish species,
possibly indicating trophic relationships between
species. Acoustic recordings probably reflected the
presence of delphinids in general rather than false
killer whales in particular and it is possible that false
killer whales preying on longlines do not need to use
biosonar to locate their prey. The depredation rate
and the overall amount of catch consumed during our
survey were low, but when depredation occurred, the
proportion of catch lost mostly exceeded 25%.
Although the statistical analysis revealed some
potentially interesting relationships between catches,
cetacean presence, depredation and environmental
variables, it is important to note that this was a small-
scale study: we analysed data from 86 observed sets
and more data are needed to further explore and
quantify these relationships.
Acknowledgements We would like to thank the Spanish
Secretarıa General de Pesca Marıtima for funding the present
study ‘Developing an Acoustic Prototype to Reduce
Depredation by Marine Mammals on Swordfish Fisheries
(Pingers)’. GHM, SG and GJP received additional support
from the EU-funded projects Envi-EFH (SSA 022466),
ECOSUMMER (MEST-CT-2005-020501) and ANIMATE
(MEXC-CT-2006-042337), respectively. Furthermore, we
would like to address our special thanks to all captains and
fishermen for their cooperation and to the members of
CEMMA (Coordinadora para los estudios de mamıferos
marinos) who helped with the design of the cetacean surveys
and the review of the results. We also like to thank Colin
MacLeod and Alain Zuur for assisting with the statistical
analysis and Gema Martinez for assisting with production of
maps.
References
Aguiar dos Santos, R. & M. Haimovici, 2001. Cephalopods in
the diet of marine mammals stranded or incidentally
caught along southeastern and southern Brazil (21–34�S).
Fisheries Research 52: 99–112.
Ashford, J. P., P. S. Rubilar & A. R. Martin, 1996. Interactions
between cetaceans and longline fishery operations around
South Georgia. Marine Mammal Science 12: 452–457.
Bigelow, K. A., C. H. Boggs & X. He, 1999. Environmental
effects on swordfish and blue shark catch rates in the US
North Pacific longline fishery. Fisheries Oceanography 8:
178–198.
Brill, R. W., B. A. Block, C. H. Boggs, K. A. Bigelow, E. V.
Freund & D. J. Marcinek, 1999. Horizontal movements
and depth distribution of large, adult yellowfin tuna
(Thunnus albacares) near the Hawaiian Islands, recorded
using ultrasonic telemetry: implications for the physio-
logical ecology of pelagic fishes. Marine Biology 133:
395–408.
Brothers, N. P., J. Cooper & S. Løkkeborg, 1999a. The inci-
dental catch of seabirds by longline fisheries: worldwide
review and technical guidelines for mitigation. FAO
Fisheries Circular 937. FAO, Rome.
Brothers, N. P., R. Gales & T. Reid, 1999b. The influence of
environmental variables and mitigation measures on sea-
bird catch rates in the Japanese tuna longline fishery
within the Australian Fishing Zone, 1991–1995. Biologi-
cal Conservation 88: 85–101.
Capdeville, D., 1997. Interaction of marine mammals with the
longline fishery around the Kerguelen Islands (Division
58.5.1) during the 1995/96 cruise. CCAMLR Science 4:
171–174.
Carranza, A., A. Domingo & A. Estrades, 2006. Pelagic
longlines: a threat to sea turtles in the Equatorial Eastern
Atlantic. Biological Conservation 131: 52–57.
Carstensen, J., O. D. Henriksen & J. Teilmann, 2006. Impacts
of offshore wind farm construction on harbour porpoises:
acoustic monitoring of echolocation activity using por-
poise detectors (TPODs). Marine Ecology Progress Series
321: 295–308.
Carwadine, M., 1995. Whales, Dolphins and Porpoises. Dor-
ling Kindersley, London.
Cherel, Y., H. Weimerskirch & G. Duhamel, 1996. Interactions
between longline vessels and seabirds in Kerguelen waters
and a method to reduce seabird mortality. Biological
Conservation 75: 63–70.
Collette, B. B. & C. E. Nauen, 1983. FAO species catalogue.
Scombrids of the world. An annotated catalogue of tunas,
mackerels, bonitos and related species known to date.
FAO Fisheries Synopsis 125-2. FAO, Rome.
Dagorn, L., P. Bach & E. Josse, 2000. Movement patterns of
large bigeye tuna (Thunnus obesus) in the open ocean,
determined using ultrasonic telemetry. Marine Biology
136: 361–371.
Dahlheim, M. E., 1988. Killer Whale (Orcinus orca) Depre-
dation on Longline Catches of Sablefish (Anoplopomafimbria) in Alaskan Waters. Alaska Fisheries Science
Centre, Seattle, Washington. NWAFC Report 88-14.
Dalla Rosa, L. & E. R. Secchi, 2002. Comparative analysis of
the interactions between killer whales/sharks and the tuna/
swordfish fishery in southern and southeastern Brazil. In
Donoghue, M., R. R. Reeves & G. S. Stone (eds), Report
of the Workshop on Interactions Between Cetaceans and
Longline Fisheries. Apia, Samoa, 2002.
Dalla Rosa, L. & E. R. Secchi, 2007. Killer whale (Orcinus orca)
interactions with the tuna and swordfish longline fishery off
266 Hydrobiologia (2008) 612:251–268
123

southern and south-eastern Brazil: a comparison with shark
interactions. Journal of the Marine Biological Association
of the United Kingdom 87: 135–140.
Dalla Rosa, L., E. R. Secchi & D. Monteiro, 2006. Killer whale
depredation on longline catches in Brazilian waters. Pro-
ceedings of the Workshop on Fisheries Depredation by
Killer and Sperm Whales: Behavioural Insights, Behav-
ioural Solutions, British Columbia, Canada, 2006.
Damalas, D., P. Megalofonou & M. Apostolopoulou, 2007.
Environmental, spatial, temporal and operational effects
on swordfish (Xiphias gladius) catch rates of eastern
Mediterranean Sea longline fisheries. Fisheries Research
84: 233–246.
De Stephanis, R., T. Cornulier, P. Verborgh, J. Salazar-Sierra,
N. Perez Gimeno & C. Guinet, 2008. Summer spatial
distribution of cetaceans in the Strait of Gibraltar in
relation to the oceanographic context. Marine Ecology
Progress Series 353: 275–288.
Domokos, R., M. P. Seki, J. J. Polovina & D. R. Hawn, 2007.
Oceanographic investigation of the American Samoa
Albacore (Thunnus alalunga) habitat and longline fishing
grounds. Fisheries Oceanography 16: 555–572.
Donoghue, M., R. R. Reeves & G. S. Stone, 2002. Report of
the Workshop on Interactions Between Cetaceans and
Longline Fisheries. New England Aquarium Press, Boston
MA, USA.
Garza Gil, M. D., M. M. Varela-Lafuente & C. Iglesias
Malvido, 2003. Spain’s North Atlantic swordfish fishery.
Marine Policy 27: 31–37.
Gilman, E., N. Brothers, G. McPherson & P. Dalzell, 2006. A
review of cetacean interactions with longline gear. Journal
of Cetacean Research and Management 8: 215–223.
Gilman, E., S. Clarke, N. Brothers, J. Alfaro-Shigueto, J.
Mandelman, J. Mangel, S. Petersen, S. Piovano, N.
Thomson, P. Dalzell, M. Donoso, M. Goren & T. Werner,
2007a. Shark Depredation and Unwanted By-catch in
Pelagic Longline Fisheries: Industry Practices and Atti-
tudes, and Shark Avoidance Strategies. Western Pacific
Regional Fishery Management Council, Honolulu, USA.
Gilman, E., D. Kobayashi, T. Swenarton, N. Brothers, P.
Dalzell & I. Kinan-Kelly, 2007b. Reducing sea turtle
interactions in the Hawaii-based longline swordfish fish-
ery. Biological Conservation 139: 19–28.
Hall, M. A. & G. P. Donovan, 2002. Environmentalists, fish-
ermen, cetaceans and fish: is there a balance and can
science help to find it? In Evans, P. G. H. & J. A. Raga
(eds), Marine Mammals: Biology and Conservation.
Kluwer Academic Press, New York: 491–521.
Hernandez-Garcia, V., 2002. Contents of the digestive tract of
a false killer whale (Pseudorca crassidens) stranded in
Gran Canaria (Canary Islands, central east Atlantic).
Bulletin of Marine Science 71: 367–369.
International Commission for the Conservation of Atlantic
Tunas (ICCAT), 2007. Report for the Biennial Period,
2006–2007, Part 1–2. http://www.iccat.int.
Jefferson, T., S. Leatherwood & M. Webber, 1993. FAO
Species Identification. Marine Mammals of the World.
FAO, Rome.
Koen-Alonso, M. & S. N. Pedraza, 1999. Stomach contents of
false killer whales (Pseudorca crassidens) stranded on the
coasts of the Strait of Magellan, Tierra del Fuego. Marine
Mammal Science 15: 712–724.
Kock, K. H., M. Purves & G. Duhamel, 2006. Interactions
between cetaceans and fisheries in the Southern Ocean.
Polar Biology 29: 379–388.
Lammers, M. O., W. W. L. Au, R. Aubauer & P. E. Nachtigall,
2003. A comparative analysis of the pulsed emissions of
free-ranging Hawaiian spinner dolphins (Stenella longi-rostris). In Thomas, J. E., C. F. Moss & M. Vater (eds),
Echolocation in Bats and Dolphins. University of Chicago
Press, Chicago.
Leeney, R. H. & N. J. C. Tregenza, 2006. Proceedings of the
Workshop on Static Acoustic Monitoring of Cetaceans,
Gdynia, Poland, 2006. ECS Newsletter 46, Special Issue.
Lewison, R. L., S. A. Freeman & L. B. Crowder, 2004.
Quantifying the effects of fisheries on threatened species:
the impact of pelagic longlines on loggerhead and leath-
erback sea turtles. Ecology Letters 7: 221–231.
Madsen, P. T., I. Kerr & R. Payne, 2004. Echolocation clicks
of two free-ranging, oceanic delphinids with different
food preferences: false killer whales Pseudorca crassi-dens and Risso’s dolphins Grampus griseus. Journal of
Experimental Biology 207: 1811–1823.
Memery, L., M. Arhan, X. A. Alvarez-Salgado, M. J. Messias,
H. Mercier, C. G. Castro & A. F. Rios, 2000. The water
masses along the western boundary of the south and
equatorial Atlantic. Progress in Oceanography 47: 69–98.
Morato, T., S. Guenette & T. Pitcher, 2001. Fisheries of the
Azores, 1982–1999. In Zeller, D., R. Watson, T. Pitcher &
D. Pauly (eds), Fisheries Impacts on North Atlantic Eco-
systems: Catch, Effort and National/Regional Data Sets,
Vol. 9. Fisheries Centre Research Reports, University of
British Columbia, British Columbia: 214–220.
Nakamura, I., 1985. FAO species catalogue. Billfishes of the
World. An annotated and illustrated catalogue of marlins,
sailfishes, spearfishes and swordfishes known to date.
FAO Fisheries Synopsis 125-5. FAO, Rome.
Northridge, S. P., 1984. World review of interactions between
marine mammals and fisheries. FAO Fisheries Technical
Paper 251. FAO, Rome.
Pallares, P. & J. M. Garcia-Mamolar, 1985. Efectos de las fases
de la luna sobre los rendimientos de la flota atunera-
tropical espanola. Collective Volume of Scientific Papers.
International Commission for the Conservation of Atlantic
Tunas (ICCAT) 23: 228–236.
Perrin, W. F., G. P. Donovan & J. Barlow, 1994. Report of the
International Whaling Commission. Gillnets and Ceta-
ceans. International Whaling Commission, Special Issue
15, Cambridge, UK.
Philpott, E., A. Englund, S. Ingram & E. Rogan, 2007. Using
T-PODs to investigate the echolocation of coastal bottle-
nose dolphins. Journal of the Marine Biological
Association of the UK 87: 11–17.
Poisson, F. & M. Taquet, 2000. French Swordfish longline
fishery in South-West Indian Ocean: preliminary results
from the PPR Program. IOTC Proceedings, WPB00-06.
Poisson, F., C. Marjolet, K. Mete & M. Vanpouille, 2007.
Interactions of cetaceans and sharks with the Reunion
Island swordfish longline fishery in the Indian Ocean
between 1997 and 2000. Report of the IOTC Workshop
Hydrobiologia (2008) 612:251–268 267
123

on the Depredation in the Tuna Longline Fisheries in the
Indian Ocean, Victoria, Seychelles.
Ramos-Cartelle, A. & J. Mejuto, 2007. Interaction of the false
killer whale (Pseudorca crassidens) and depredation on
the swordfish catches of the Spanish surface longline fleet
in the Atlantic, Indian and Pacific Oceans. Report of the
Standing Committee on Research and Statistics SCRS of
the International Commission for the Conservation of
Atlantic Tunas (ICCAT) 25 (ICCAT/SCRS/07/25).
Reeves, R. R. & P. J. H. Reijnders, 2002. Conservation and
management. In Hoelzel, A. R. (ed.), Marine Mammal
Biology: An Evolutionary Approach. Blackwell Science,
Oxford.
Romo, A., C. Casanova, J. Sanz, A. Calle & J. L. Casanova,
2007. Relation between meteorological conditions and the
catching of red tuna (Thunnus thynnus) from the mea-
surements of the TOVS and AVHRR sensors of the
NOAA satellites. International Journal of Remote Sensing
28: 2671–2681.
Schotten, M., W. W. L. Au, M. O. Lammers & R. Aubauer,
2003. Echolocation recordings and localization of wild
spinner dolphins (Stenella longirostris) and pantropical
spotted dolphins (S. attenuata) using a four-hydrophone
array. In Thomas, J. E., C. F. Moss & M. Vater (eds),
Echolocation in Bats and Dolphins. University of Chicago
Press, Chicago.
Secchi, E. R. & T. Vaske Jr., 1998. Killer whale (Orcinus orca)
sightings and depredation on tuna and swordfish longline
catches in Southern Brazil. Aquatic Mammals 24: 117–122.
Skov, H., J. Teilmann, O. D. Henriksen & J. Carstensen, 2002.
Investigations of harbour porpoises at the planned site for
wind turbines at Horns Reef. Status report: 1/1/2001–31/12/
2001. Commissioned by Tech-wise A/S. Ornis Consult A/S.
http://www.hornsrev.dk/Miljoeforhold/miljoerapporter/
Investigations_of_harbour_popoises.pdf.
Stacey, P. J., S. Leatherwood & R. W. Baird, 1994. Pseudorcacrassidens. Mammalian Species 456: 1–6.
Tougaard, J., J. Carstensen, O. D. Henriksen, J. Teilmann & J.
R. Hansen, 2004. Harbour porpoises on Horns Reef—
effects of the Horns Reef Wind Farm. Annual Status
Report 2003. Commissioned by Elsam Engineering A/S,
National Environmental Research Institute (NERI).
Wood, F. G. & W. E. Evans, 1980. Adaptiveness and ecology
of echolocation in toothed whales. In Busnel, R. & J. Fish
(eds), Animal Sonar Systems. Plenum, New York.
Zavala-Camin, L. A. & J. N. Antero da Silva, 1991. Historico
da pesquisa e pesca de atuns com espinhel no Brasil.
Atlantica, Rio Grande 13: 107–114.
Zavilov, P. O., I. Wainer & J. M. Absy, 1999. Sea surface
temperature variability off southern Brazil and Uruguay as
revealed from historical data since 1854. Journal of
Geophysical Research 105: 21–32.
Zollett, E. A. & A. J. Read, 2006. Depredation of catch by
bottlenose dolphins (Tursiops truncatus) in the Florida
king mackerel (Scomberomorus cavalla) troll fishery.
Fishery Bulletin 104: 343–349.
Zuur, A. F., E. N. Ieno & G. M. Smith, 2007. Analysing
Ecological Data. Springer, New York.
268 Hydrobiologia (2008) 612:251–268
123
Top Related
Copyright © 2022 FDOKUMEN

