


Bahasa
Halaman
Hukum

Jointly published by Akadémiai Kiadó, Budapest Scientometrics,and Kluwer Academic Publishers, Dordrecht Vol. 60, No. 3 (2004) 365–383
Received January 30, 2004Address for correspondence:VALENTINA A. MARKUSOVAAll Russian Institute for Scientific and Technical Information of the Russian Academy of Sciences20 Ulitsa Usievicha, Moscow 125190, RussiaE-mail: [email protected]
0138–9130/2004/US $ 20.00Copyright © 2004 Akadémiai Kiadó, BudapestAll rights reserved
Research in non-metropolitan universitiesas a new stage of science development in Russia
VALENTINA A. MARKUSOVA,a VLADIMIR A. MININ,b ALEXANDR N. LIBKIND,bC. N. MARGRIET JANSZ,c MICHEL ZITT,d ELISE BASSECOULARD-ZITT d
a All Russian Institute for Scientific and Technical Information of the Russian Academy of Sciences,Moscow (Russia)
b Russian Foundation for Basic Research, Moscow (Russia)c Technology Foundation STW, Utrecht (The Netherlands)
d IBIS-LERECO, INRA, Nantes (France)
The tremendous social and political changes that culminated in the Soviet Union’s dissolutionhad a great impact on the Russian science community. Due to the Russian transformation to amarket economy a new model of R&D emerged on the basis of the higher education system (R&Din universities). This paper is part of a project, the main goals of which were to analyse the impactof competitive funding on R&D in provincial universities, the distribution of funding by theRussian Foundation for Basic Research, and the level of cross-sectoral and internationalcollaboration. This paper gives a descriptive overview of R&D conducted at the 380 provincialuniversities, looking at 9,800 applications, 1,950 research projects, 19,981 individuals, and morethan 29,600 publications for the period 1996–2001. Our data demonstrated a positive tendency indemographic statistics in the provinces. A map of intra-national collaboration taking place in1995–2002 in provincial universities situated in different economic regions was designed. Our datashow a strong collaboration within the regions, which is an important factor of sustainability.Publication output grew by a factor two or two-and half in six years. The share in output onmathematics was the highest at about 45%, physics and chemistry had equal shares of about 20%each. Researchers from the Ural and Povolzh’e regions were more active in knowledgedissemination than their colleagues from the other nine economic-geographic regions. Bibliometricanalysis of more than 1,450 international collaborative publications for 1999–2001 demonstrated astrong shift in collaboration partners from Former East Block and former USSR countries toWestern Europe, USA and Japan. Among the regions, Povolzh’e, Ural, Volgo-Vyatsky andCentral Chernozem’e demonstrated a stronger tendency to collaborate. This collaboration dependsheavily on financial support from foreign countries.
Introduction
Russian science has an excellent track record for world-class scientific research,which was conducted in the research institutes under the umbrella of the Academy ofScience of the USSR (now the Russian Academy of Sciences). Universities and higher

V. A. MARKUSOVA et al.: Non-metropolitan universities of Russia
366 Scientometrics 60 (2004)
education institutes were involved in teaching students and played an insignificant rolein basic research (exceptions were Moscow State University and St-Petersburg StateUniversity).
The tremendous social-political changes that culminated in the Soviet Union’sdissolution had a great impact on the Russian science community. Due to the Russiantransformation to a market economy a new model of R&D emerged within the highereducation system (R&D in universities). There are three kinds of agencies involved inthe higher education system in Russia: universities, higher education institutes andacademies (not to be confused with the Russian Academy of Sciences). To facilitate thereading, we call all of them “universities”. Recently published results of comprehensiveresearch devoted to R&D in post-Soviet Russia (RADOCEVIC, 2003) emphasised that therestructuring process of R&D is slow. The role of provincial universities (PU) in R&Dand the changes taking place were completely neglected. However, it is impossible toevaluate new trends in R&D in Russia without tracing changes in higher educationinstitutions. The development of research in higher education institutions and theinvolvement of the young generation are very important factors for the future prosperityin the provinces as well as in Russia as a whole. As the higher education system isgoing through speedy changes, it attracts financial resources for its transformation fromthe population. In 1993 the Russian government started to co-fund regionally orientedprograms, which currently amount to 0.3% of the federal R&D budget*. In 2002, anadditional sum of more than $1.7 million (about 50 million rubles) was assigned tosupport basic research in the regions. In addition, the Russian Foundation for BasicResearch (RFBR) and the governments of 41 regions funded these programs (there are89 geographic regions in Russia, not to be confused with the 12 economic regions).These joint programs focused on research subjects, which could be important for thelocal economy. As a consequence of the new government funding policy, particularlythe multi-channel system of competitive funding, the provincial universities becameserious players and partners of academic institutions and industry inside of Russia asmuch as outside.
Moreover, in the provinces the new local elite became aware of the necessity ofscience for stability and prosperity in the region. Life in the provinces is much harderand local universities face more financial problems than their colleagues in megapolis.Today, government support covers only office expenses (including utilities) and a partof salary costs. Salaries of scientists are low and grant money is essential for the supportof scientists’ families. Another observation concerns the growing interest in regionalcollaboration. In 1995, less than one-quarter of all academic papers involved cross-sectorial collaboration in the USA (Science & Technology Indicators, 1998).A preliminary analysis of selected data from the RFBR database has shown a similar
* The RFBR budget is usually between 5-7% of the total federal R&D budget.
V. A. MARKUSOVA et al.: Non-metropolitan universities of Russia
Scientometrics 60 (2004) 367
tendency for Russia. Small universities rely more on external collaboration. In 1998,about thirty per cent of the Russian articles in SCI journals involved internationalcollaboration.
Recent studies (OKUBO et al., 2000) underlined a special pattern of collaboration inthe regions situated at a national border. From our own experience we knew about somespecial links among Russian Far East universities and Japanese and Chineseuniversities. However, the phenomenon needs deeper and more sophisticated analysis ofthe social and cognitive mechanisms that shape the scientific practice of today.Information collected by our team from different sources demonstrated the vigorousactivity of various Russian and foreign agencies to strengthen collaboration withuniversities and higher education institutes situated in the provinces. To reach this goal,many foreign funding organisations as well as private companies (including the BritishCouncil, UNESCO, Samsung Electronics etc.) opened branches of their agencies inseveral provinces (e.g. Siberia, Russian Far East, etc.). These activities had a strongimpact on R&D in those provinces.
This paper is part of a project, the main goal of which is to investigate collaborationas a main factor of the new role of regional universities on the Russian science stageand on the impact of these changes on the research being done in the Russian provinces.
Methods
The primary source of data was an extensive Russian database on applications andgranted projects “GRANT”, which was developed by the RFBR. This database was firstused as an instrument of bibliometric evaluation by our team in 1996 (INTAS grant 96-0036). In 1995–2002, the RFBR selected to support over 22,000 research projects out ofmore than 69,400 applications. In total, the database contains information on 138,000individuals. Every year, some 8,000 projects are being financed by the RFBR involvingover 40,000 scientists from approximately 1,500 R&D institutions. Research projectsinvolving at least one person affiliated with a university located outside of the Moscowand St-Petersburg regions were identified. Subsequently, special files on theseprovincial universities (PU) were compiled and a database was designed. Up to 2003,the PU database includes information about 19,981 researchers, 9,800 applications,1,950 research projects, about 380 PU and more than 29,600 publications. It now allowsidentification of the best scientific groups and universities, links of collaborationbetween research groups in universities and research organisations and industry as wellas among various geographic regions, and to assess the performance of researchers andtheir contribution to world science. The Science Citation Index database via DIALOGfor 1999 and 2000 was used as a reference instrument and as an evaluation tool forcollaboration and research results. A sociological survey was undertaken to shedadditional light on the life of the scientific community in the provinces, to evaluate the
V. A. MARKUSOVA et al.: Non-metropolitan universities of Russia
368 Scientometrics 60 (2004)
level of cross-country and international collaboration and to examine the level of accessto electronic resources as an important factor of stability in the regions.
The research projects studied were carried out by 486 universities (a total of 590universities are mentioned in the statistical Directory “Science in Russia, 2000”), ofwhich 380 are situated in the Russian provinces. The database includes informationabout each funded project, name and address of the organisation where the research wasdone, the type of organisation (research institute, educational organisation or privatefacility) and bibliographic information on each publication (including an abstract)published by the grantees as a result of the project. Since the majority of Russianresearch scholars engaged in basic research have been supported by the RFBR thisinformation enabled us to estimate the progress made in basic research in regionaluniversities.
The following indicators were used for evaluation:• Total number of applications and grants for each university;• Distribution of applications and grants by field of science;• Number of researchers who applied for a grant in each region;• International collaborative output (CO) by each university, region and country;• Country’s share of total CO in a specific field of science.Special attention was given to the verification of names and addresses of universities
and higher education institutes, which appeared in the database. We want to underlinethat during last seven years about 70% of the universities changed their name. Extensivechecking was done to clean the database.
Results and discussion
Applications and grants distribution by field of science and regions
The research projects have been sorted by field of science, university and region.We used the same classification of fields of science as INTAS: M – mathematics,mechanics and computer science; P – physics and astronomy; C – chemistry; L – lifesciences including biomedicine; ES – earth and environment science.
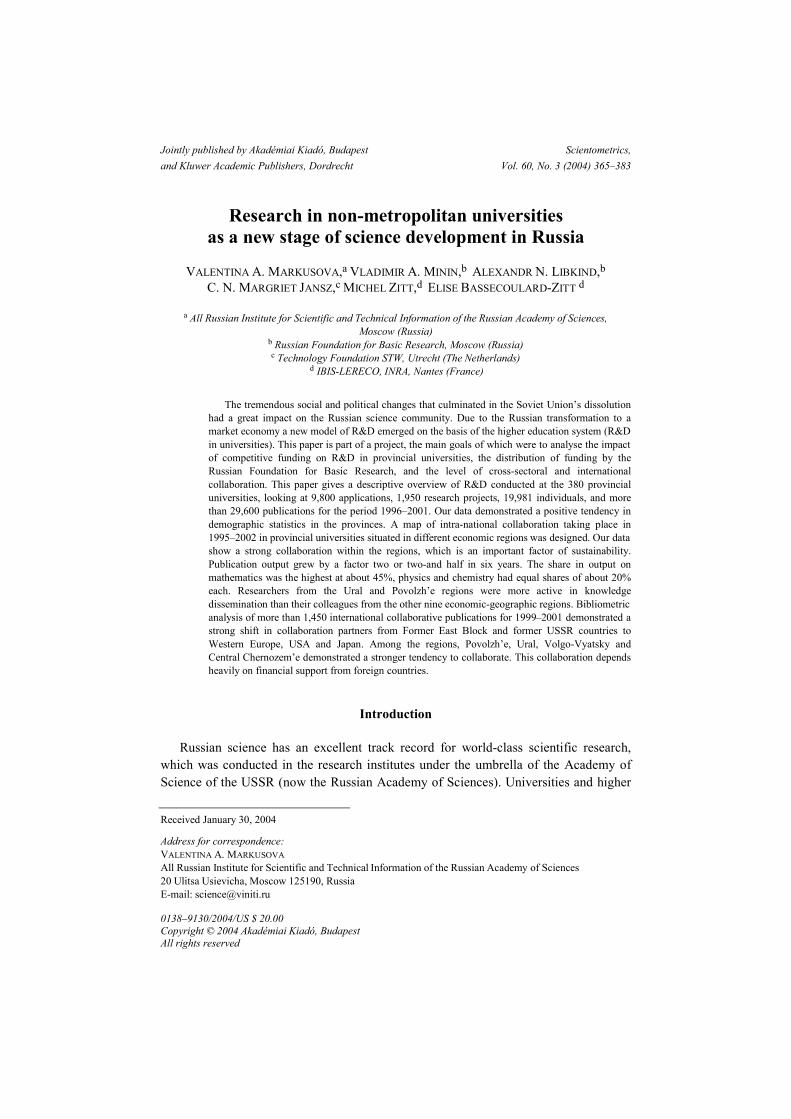
To get more precise knowledge about research development in the provinces webased our analysis on both applications and grants. We assume that an application for agrant is a sign of research activity in a university. Statistical data about the distributionof applications and grants over the universities for 1995–2002 are presented in Figure 1.In this period, the number of people from a PU, who applied for a grant, was 39,194.However, among these researchers several individuals received more than one grantduring these years. The number of unique individuals was 19,851. On average, eachresearcher was awarded 1.97 grants. For all universities the average success rate (the

V. A. MARKUSOVA et al.: Non-metropolitan universities of Russia
Scientometrics 60 (2004) 369
ratio between the number of grants and the number of applications) was 0.22. Thisfigure is lower than for the whole pool of RFBR grant-holders. A low success rate couldbe related to a sharp growth in the teachers’ burden since 1992. As an example, duringthe period of 1993–1999 the number of students increased by 47 per cent (from 2.54millions to 3.73 millions). However, the number of teachers increased by only seven percent (from 239,900 to 255,900). We believe that with such a student-professor ratio,research activity becomes a rival of teaching. The growth in student numbers inprovincial universities can be attributed partly to economic circumstances. Due to thehigh cost of living in megapolis, young people cannot afford to live and study inMoscow or St-Petersburg. On the other hand professional teachers do not move fromMoscow or St-Petersburg to the provinces. This is why the number of skilled teachers islimited. This must be seen in the light of the Russian cultural tradition: it was alwaysprestigious, especially for people in the provinces, to give their children highereducation.
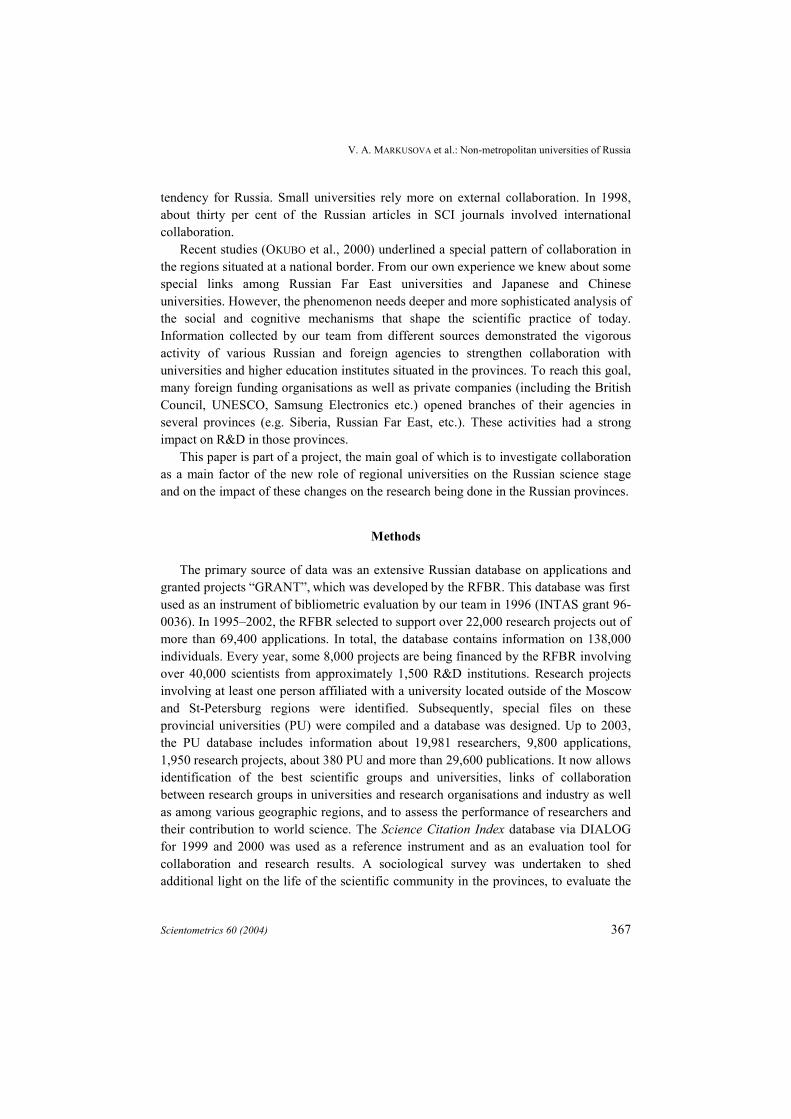
We observed growth in the number of researchers, who applied for a grant(Figure 2), compared with a decline in the whole RFBR pool. Growth was strong in thenumber of application and grants on M (mathematics and computer sciences). It is clear(Figure 1) that the growth rate was significantly higher for grants than for applications;this increasing success rate is an indication of the high quality of the proposed work. Inother fields of science both the number of applications and the number of grantsdeclined. Further study of the reasons for the observed trends showed that basicresearch in the provinces is quite different from that in megapolis, wherephysics/astronomy is the strongest discipline (INTAS grant 96-0036). This could be aspecific feature of research in pure mathematics. We also want to emphasise that PUnever could afford to buy expensive equipment for research on physics. Russia hasdeveloped a great tradition in mathematics dating back to Euler and Bernoulli in theearly 18th century. The famous mathematician N.I. Lobachevsky was Professor inKazan University at the end of the nineteenth century. Since that time many universitiesin the Povolzh’e region developed good schools on mathematics. A high share of grantson M can be attributed to the fact that in pure mathematics researchers rely primarily ontheir brain and do not need expensive equipment such as physicists do. In 1995–2002the principal investigators (PI) affiliated with universities submitted 9,287 applicationsand carried out 1,950 research projects* in 229 PU. However, the number ofuniversities, whose researchers participated in RFBR projects as a member of a researchteam, was 380.
* In some charts the number of grants given to PU was 2200. This number is due to the involvement ofseveral regions in one project.
V. A. MARKUSOVA et al.: Non-metropolitan universities of Russia
370 Scientometrics 60 (2004)
Figure 1. Distribution of applications by field of science, 1995–2002M = mathematics, mechanics and computer science
Ph = physics and astronomyC = chemistry
LS = life sciences including biomedicineES = earth and environment science
Figure 2. Growth of provincial university researchers’ activity, 1997–2002
V. A. MARKUSOVA et al.: Non-metropolitan universities of Russia
Scientometrics 60 (2004) 371
A list of the top thirty universities ranked by the number of grants was compiled.These thirty universities received about 80 percent of the grants given to regionaluniversities in this period.
Cross-sectoral and intra-national collaboration
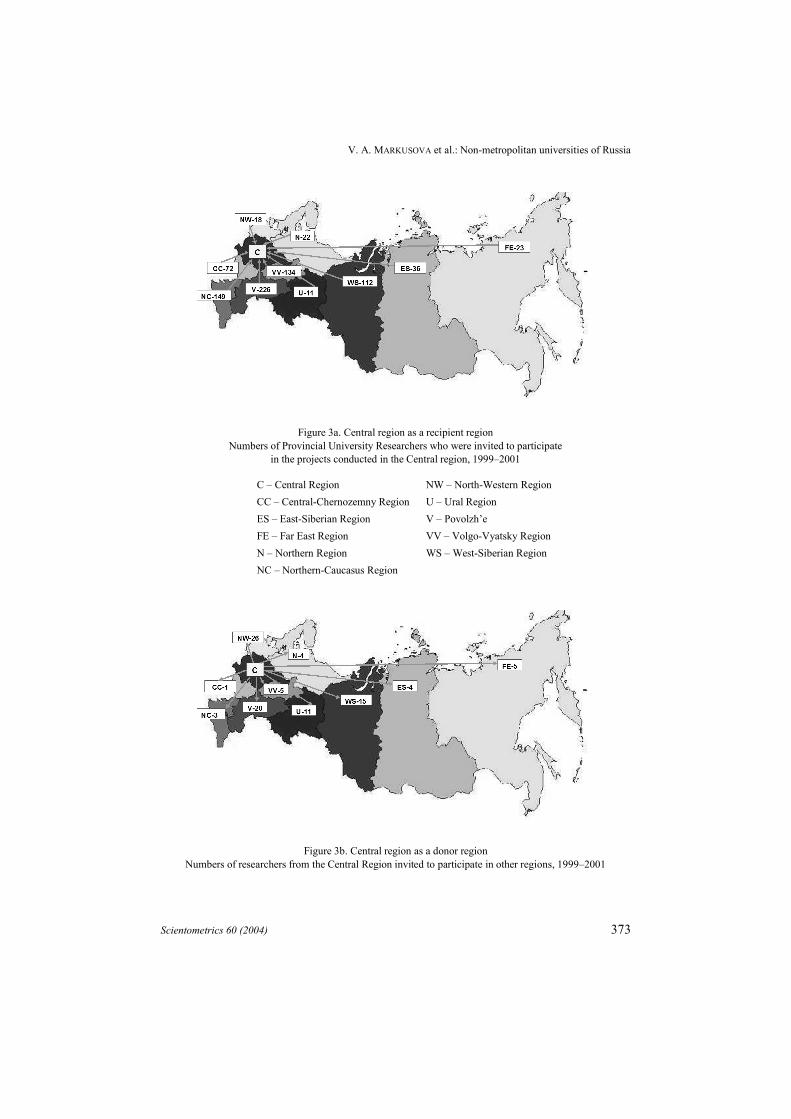
Cross-sectoral collaboration is viewed as a vehicle moving research results towardpractical application. In 1995–2002, researchers collaborated with 6,769 specialistsfrom 705 agencies. A list of the first seventy-five agencies was compiled. The totalnumber of participants in collaboration with seventy-five agencies was 7,879, but only3,831 unique people were involved implying that each specialist was involved onaverage in 1.92 grant applications. Our data demonstrated that PU had strongercollaboration with research institutes than with industrial and private enterprises. Anupgraded map of intra-national collaboration taking place in 1995–2002 by differenteconomic regions was designed. The strength of collaboration was evaluated by lookingat the number of researchers involved in collaborative efforts. The data are presented inTable 1. We did not observe strong ties among the eleven economic regions.* Takinginto consideration the cost of airfare and the size of the regions, it is not surprising thatwe did not see a strong collaboration among regions. Our data show strongercollaboration inside of the regions, which is an important factor of sustainability. Theregions have less job opportunities than a megapolitan area and the involvement incollaborative research helps to build human and professional connections, that have apositive impact on sustainability. The deeper picture of collaboration appears if weevaluate each region as a donor and recipient of researchers. To visualise collaborationamong the regions we used the Geographic System “COMPAS-3” developed by Dr.Gitis from the Institute of Information Transmission of the RAS (Figures 3a and 3b).The maps demonstrate each region’s participation in R&D and the differences betweenthem. As an example, the Central region was mainly a recipient region, which attractedresources from other regions. The Povolzh’e Region was primarily a donor region.
Demographic statistics
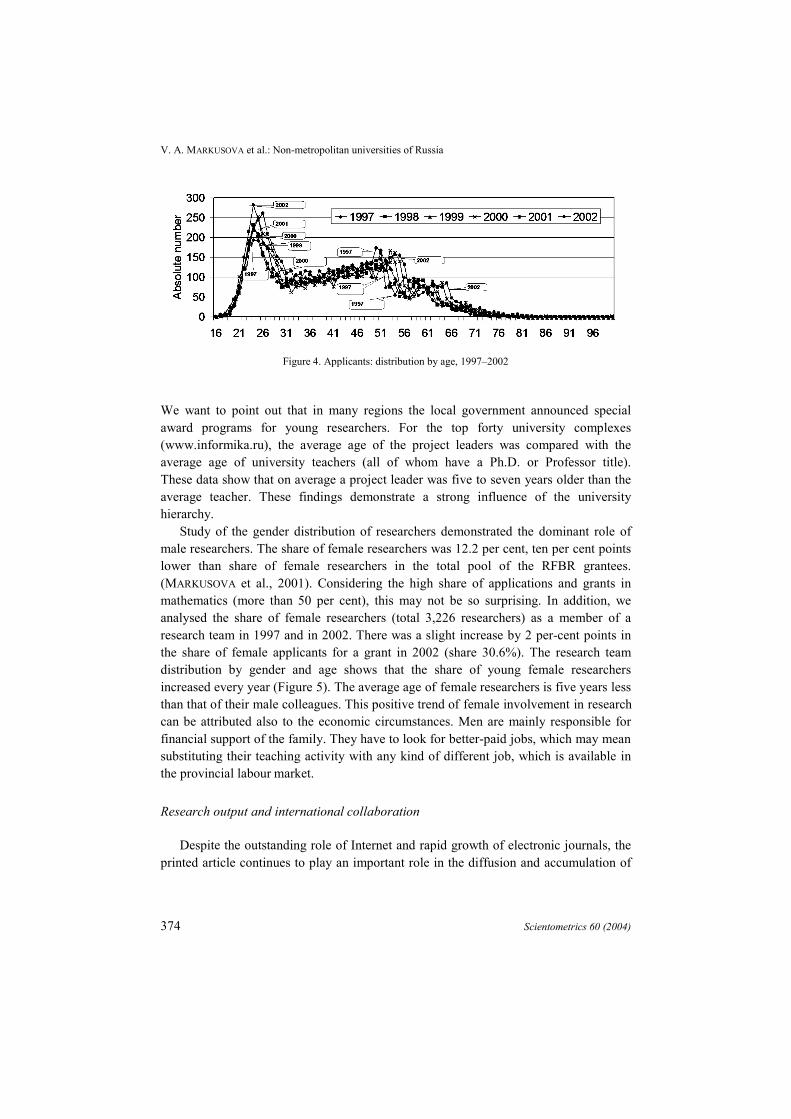
One vigorously discussed problem is that Russian science is ageing. Demographicdata on 19,851 researchers were collected and analysed. The age distribution of theapplicants in 1997–2002 is shown in Figure 4. We found that the share of the youngerage group has increased steadily from 37% in 1997 to 41% in 2002. This is a positivesign, showing that in the provinces more young people became attracted to science.
* There are 12 economic regions in Russia but one of them, the Kaliningrad region, had only a few grants.
V. A. MARKUSOVA et al.: Non-metropolitan universities of Russia
372 Scientometrics 60 (2004)
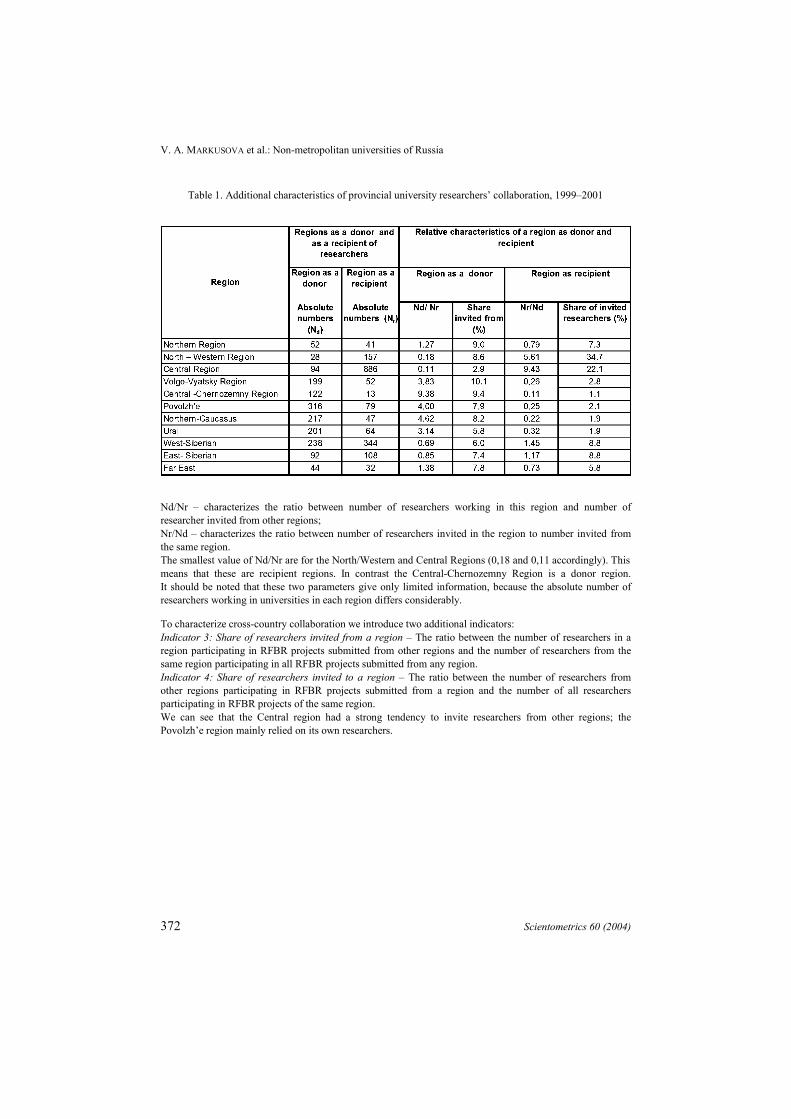
Table 1. Additional characteristics of provincial university researchers’ collaboration, 1999–2001
Nd/Nr – characterizes the ratio between number of researchers working in this region and number ofresearcher invited from other regions;Nr/Nd – characterizes the ratio between number of researchers invited in the region to number invited fromthe same region.The smallest value of Nd/Nr are for the North/Western and Central Regions (0,18 and 0,11 accordingly). Thismeans that these are recipient regions. In contrast the Central-Chernozemny Region is a donor region.It should be noted that these two parameters give only limited information, because the absolute number ofresearchers working in universities in each region differs considerably.
To characterize cross-country collaboration we introduce two additional indicators:Indicator 3: Share of researchers invited from a region – The ratio between the number of researchers in aregion participating in RFBR projects submitted from other regions and the number of researchers from thesame region participating in all RFBR projects submitted from any region.Indicator 4: Share of researchers invited to a region – The ratio between the number of researchers fromother regions participating in RFBR projects submitted from a region and the number of all researchersparticipating in RFBR projects of the same region.We can see that the Central region had a strong tendency to invite researchers from other regions; thePovolzh’e region mainly relied on its own researchers.
V. A. MARKUSOVA et al.: Non-metropolitan universities of Russia
Scientometrics 60 (2004) 373
Figure 3a. Central region as a recipient regionNumbers of Provincial University Researchers who were invited to participate
in the projects conducted in the Central region, 1999–2001
C – Central Region NW – North-Western RegionCC – Central-Chernozemny Region U – Ural RegionES – East-Siberian Region V – Povolzh’eFE – Far East Region VV – Volgo-Vyatsky RegionN – Northern Region WS – West-Siberian RegionNC – Northern-Caucasus Region
Figure 3b. Central region as a donor regionNumbers of researchers from the Central Region invited to participate in other regions, 1999–2001
V. A. MARKUSOVA et al.: Non-metropolitan universities of Russia
374 Scientometrics 60 (2004)
Figure 4. Applicants: distribution by age, 1997–2002
We want to point out that in many regions the local government announced specialaward programs for young researchers. For the top forty university complexes(www.informika.ru), the average age of the project leaders was compared with theaverage age of university teachers (all of whom have a Ph.D. or Professor title).These data show that on average a project leader was five to seven years older than theaverage teacher. These findings demonstrate a strong influence of the universityhierarchy.
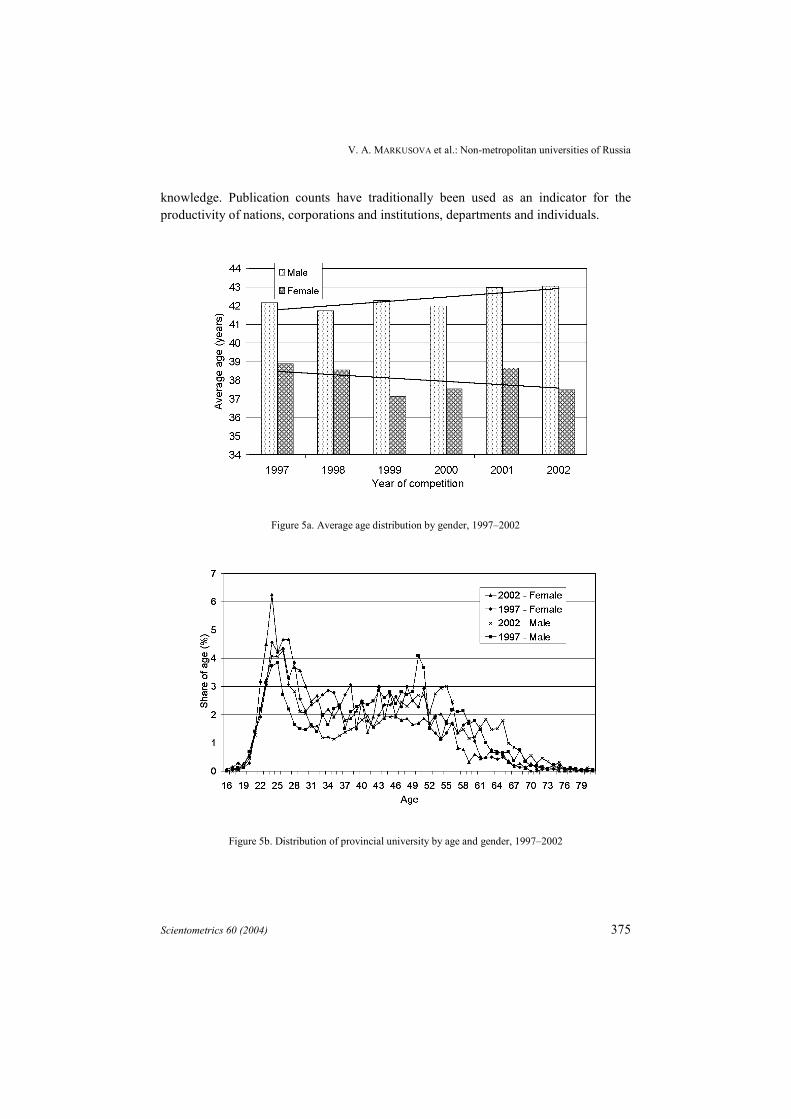
Study of the gender distribution of researchers demonstrated the dominant role ofmale researchers. The share of female researchers was 12.2 per cent, ten per cent pointslower than share of female researchers in the total pool of the RFBR grantees.(MARKUSOVA et al., 2001). Considering the high share of applications and grants inmathematics (more than 50 per cent), this may not be so surprising. In addition, weanalysed the share of female researchers (total 3,226 researchers) as a member of aresearch team in 1997 and in 2002. There was a slight increase by 2 per-cent points inthe share of female applicants for a grant in 2002 (share 30.6%). The research teamdistribution by gender and age shows that the share of young female researchersincreased every year (Figure 5). The average age of female researchers is five years lessthan that of their male colleagues. This positive trend of female involvement in researchcan be attributed also to the economic circumstances. Men are mainly responsible forfinancial support of the family. They have to look for better-paid jobs, which may meansubstituting their teaching activity with any kind of different job, which is available inthe provincial labour market.
Research output and international collaboration
Despite the outstanding role of Internet and rapid growth of electronic journals, theprinted article continues to play an important role in the diffusion and accumulation of
V. A. MARKUSOVA et al.: Non-metropolitan universities of Russia
Scientometrics 60 (2004) 375
knowledge. Publication counts have traditionally been used as an indicator for theproductivity of nations, corporations and institutions, departments and individuals.
Figure 5a. Average age distribution by gender, 1997–2002
Figure 5b. Distribution of provincial university by age and gender, 1997–2002

V. A. MARKUSOVA et al.: Non-metropolitan universities of Russia
376 Scientometrics 60 (2004)
Statistics on publication output were collected from the preliminary and final reportssubmitted by principal investigators to the RFBR in the six-year window 1996–2001.The study was focused on publication analysis and knowledge dissemination by PUresearchers across various regions. Considerable effort had to be devoted to cleaning thedatabase and verifying the journal names (especially titles of foreign journals) cited inprincipal investigators’ (PI) reports. The total output amounted to more than 29,600publications. The share of journal articles among these publications was 33.9%. Thisnumber is about 10 per-cent points lower than for the whole RFBR pool. In part this iscertainly due to the fact that it is much harder for a researcher from a PU to publishresults in peer-reviewed journals. It is worth to underline that more than 2,000 articles(20.5%) were published in 676 foreign journals. We can state that there is a trendtowards integration of PU researchers into world science. On the other hand, only halfof the journal articles in the total RFBR output were published in journals covered bythe SCI. This implies that about 80% of total PU output is not available to the worldscientific community. We observed a steady growth of research productivity byapproximately a factor two to two-and half in six years. The share of research output byregion is in good concordance with the share of grants given to a specific region.Researchers from the Ural, Povolzh’e and East Siberian regions were more active inknowledge dissemination than their counterparts from other regions. The pattern ofoutput distribution by field of science demonstrated similarity with the grantdistribution by field of science: a dominating role of publications on M (on averagemore than 45 per cent); P and C had approximately equal shares – about 20%.
According to a study performed by the RAND Corporation in 2000, thescientifically advanced countries (namely, the USA, United Kingdom, Germany,France, The Netherlands, the Scandinavian countries, and Russia) show a strongtendency to co-operate with each other. In our project international collaboration (IC)was studied on the basis of the PI grantee output in 1999–2001. Frequency ofcollaboration was evaluated on the basis of the number of collaborative papers. A totalof 1420 unique collaborative publications (CP) were evaluated, which involvedcollaboration with researchers from 59 countries. On average each country participatedin 1.3 CP. The share of these papers was about 9.1% of the PU total output (15,486publications). It is five per-cent points lower than the share of CP in the whole pool ofRFBR grantees’ output. When interpreting these findings one should keep in mind thatthe opportunity to collaborate with foreign countries opened only ten years ago forRussian universities. It is known that the pattern of international collaboration dependson cultural, sociological and political traditions. The distribution of CP by country andeconomic region was evaluated. To evaluate PU external collaboration it wasreasonable to group nations into well-recognised geographical/political regions.
V. A. MARKUSOVA et al.: Non-metropolitan universities of Russia
Scientometrics 60 (2004) 377
The three regions with appreciable intra-regional collaboration are:• 14 former Soviet republics;• Eastern Block countries, i.e. Bulgaria, East Germany, Poland, Czech Republic,
Slovakia, Yugoslavia, Bosnia, Croatia, Slovenia, Romania, and Montenegro;• Asia, i.e., China, Mongolia, North Korea, and Vietnam.We observed a strong shift in collaboration partners from former East Block
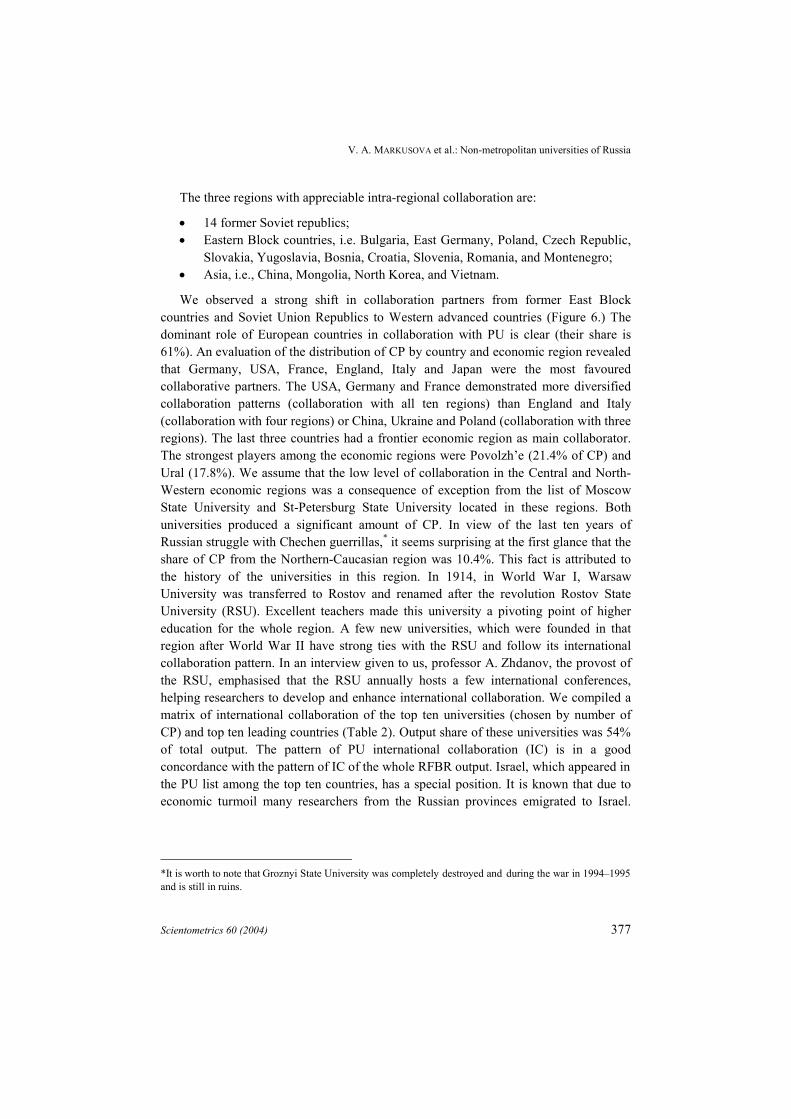
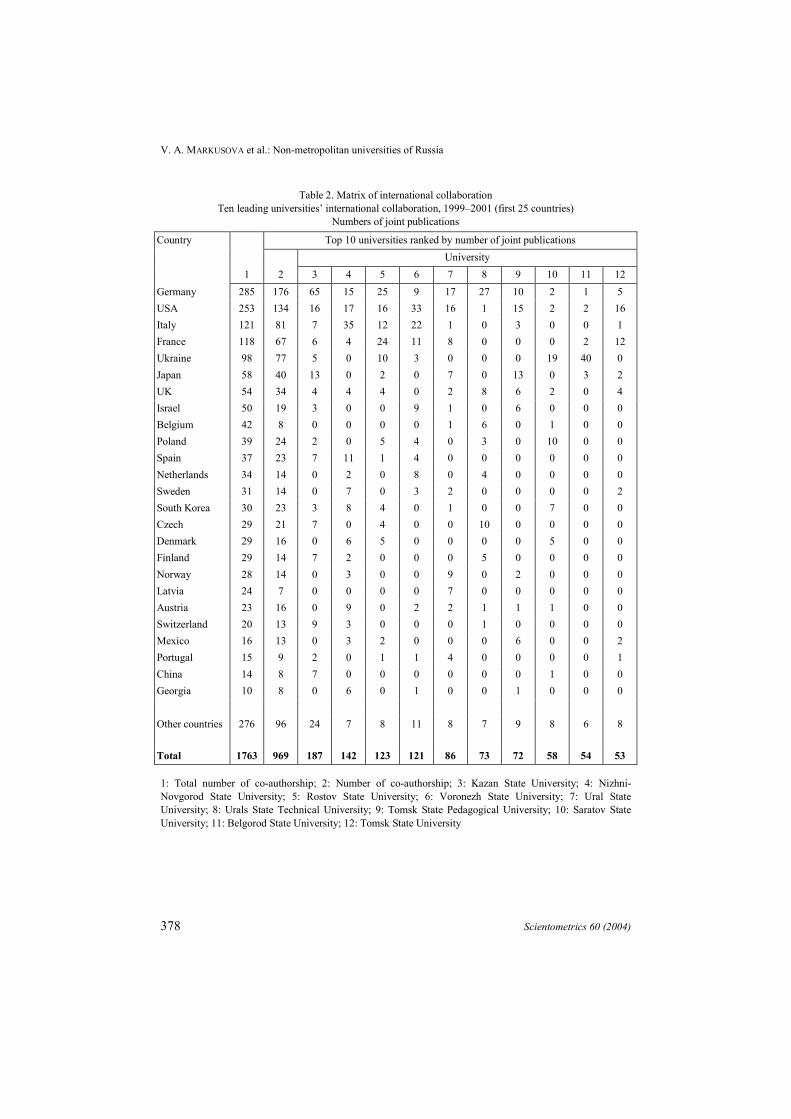
countries and Soviet Union Republics to Western advanced countries (Figure 6.) Thedominant role of European countries in collaboration with PU is clear (their share is61%). An evaluation of the distribution of CP by country and economic region revealedthat Germany, USA, France, England, Italy and Japan were the most favouredcollaborative partners. The USA, Germany and France demonstrated more diversifiedcollaboration patterns (collaboration with all ten regions) than England and Italy(collaboration with four regions) or China, Ukraine and Poland (collaboration with threeregions). The last three countries had a frontier economic region as main collaborator.The strongest players among the economic regions were Povolzh’e (21.4% of CP) andUral (17.8%). We assume that the low level of collaboration in the Central and North-Western economic regions was a consequence of exception from the list of MoscowState University and St-Petersburg State University located in these regions. Bothuniversities produced a significant amount of CP. In view of the last ten years ofRussian struggle with Chechen guerrillas,* it seems surprising at the first glance that theshare of CP from the Northern-Caucasian region was 10.4%. This fact is attributed tothe history of the universities in this region. In 1914, in World War I, WarsawUniversity was transferred to Rostov and renamed after the revolution Rostov StateUniversity (RSU). Excellent teachers made this university a pivoting point of highereducation for the whole region. A few new universities, which were founded in thatregion after World War II have strong ties with the RSU and follow its internationalcollaboration pattern. In an interview given to us, professor A. Zhdanov, the provost ofthe RSU, emphasised that the RSU annually hosts a few international conferences,helping researchers to develop and enhance international collaboration. We compiled amatrix of international collaboration of the top ten universities (chosen by number ofCP) and top ten leading countries (Table 2). Output share of these universities was 54%of total output. The pattern of PU international collaboration (IC) is in a goodconcordance with the pattern of IC of the whole RFBR output. Israel, which appeared inthe PU list among the top ten countries, has a special position. It is known that due toeconomic turmoil many researchers from the Russian provinces emigrated to Israel.
*It is worth to note that Groznyi State University was completely destroyed and during the war in 1994–1995and is still in ruins.
V. A. MARKUSOVA et al.: Non-metropolitan universities of Russia
378 Scientometrics 60 (2004)
Table 2. Matrix of international collaborationTen leading universities’ international collaboration, 1999–2001 (first 25 countries)
Numbers of joint publicationsTop 10 universities ranked by number of joint publications
UniversityCountry
1 2 3 4 5 6 7 8 9 10 11 12Germany 285 176 65 15 25 9 17 27 10 2 1 5USA 253 134 16 17 16 33 16 1 15 2 2 16Italy 121 81 7 35 12 22 1 0 3 0 0 1France 118 67 6 4 24 11 8 0 0 0 2 12Ukraine 98 77 5 0 10 3 0 0 0 19 40 0Japan 58 40 13 0 2 0 7 0 13 0 3 2UK 54 34 4 4 4 0 2 8 6 2 0 4Israel 50 19 3 0 0 9 1 0 6 0 0 0Belgium 42 8 0 0 0 0 1 6 0 1 0 0Poland 39 24 2 0 5 4 0 3 0 10 0 0Spain 37 23 7 11 1 4 0 0 0 0 0 0Netherlands 34 14 0 2 0 8 0 4 0 0 0 0Sweden 31 14 0 7 0 3 2 0 0 0 0 2South Korea 30 23 3 8 4 0 1 0 0 7 0 0Czech 29 21 7 0 4 0 0 10 0 0 0 0Denmark 29 16 0 6 5 0 0 0 0 5 0 0Finland 29 14 7 2 0 0 0 5 0 0 0 0Norway 28 14 0 3 0 0 9 0 2 0 0 0Latvia 24 7 0 0 0 0 7 0 0 0 0 0Austria 23 16 0 9 0 2 2 1 1 1 0 0Switzerland 20 13 9 3 0 0 0 1 0 0 0 0Mexico 16 13 0 3 2 0 0 0 6 0 0 2Portugal 15 9 2 0 1 1 4 0 0 0 0 1China 14 8 7 0 0 0 0 0 0 1 0 0Georgia 10 8 0 6 0 1 0 0 1 0 0 0
Other countries 276 96 24 7 8 11 8 7 9 8 6 8
Total 1763 969 187 142 123 121 86 73 72 58 54 53
1: Total number of co-authorship; 2: Number of co-authorship; 3: Kazan State University; 4: Nizhni-Novgorod State University; 5: Rostov State University; 6: Voronezh State University; 7: Ural StateUniversity; 8: Urals State Technical University; 9: Tomsk State Pedagogical University; 10: Saratov StateUniversity; 11: Belgorod State University; 12: Tomsk State University
V. A. MARKUSOVA et al.: Non-metropolitan universities of Russia
Scientometrics 60 (2004) 379
Figure 6. Distribution of provincial university international collaboration by partner area
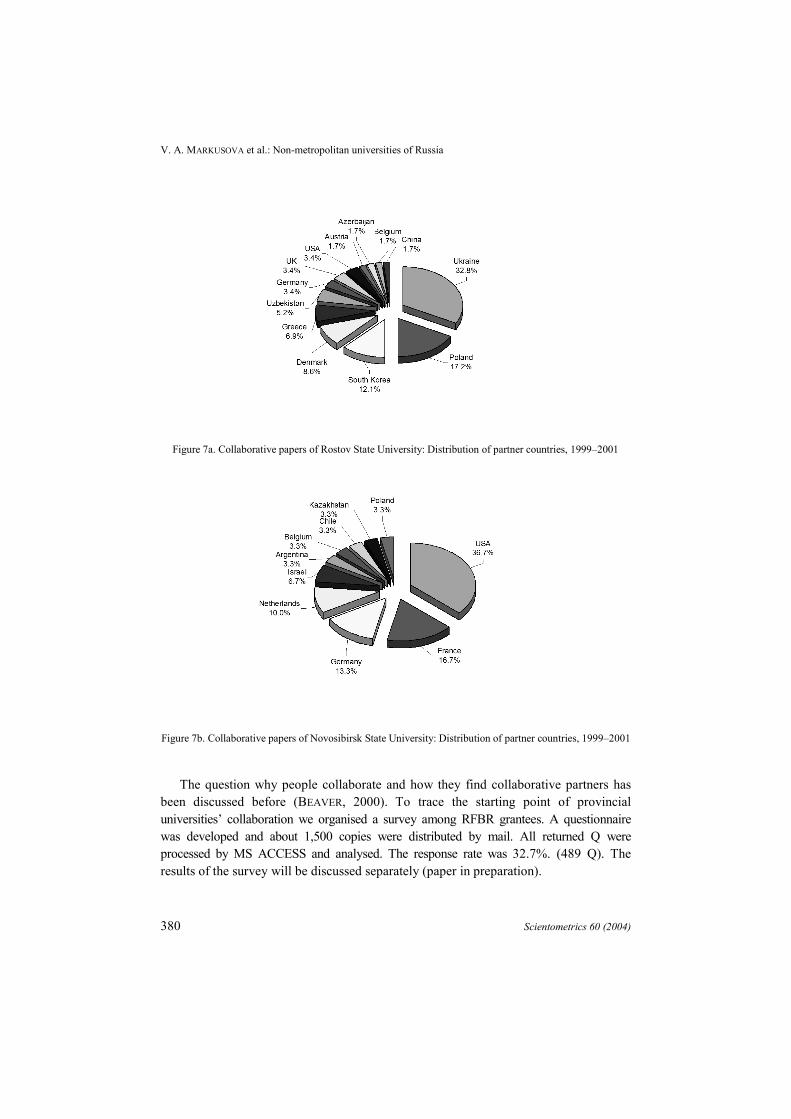
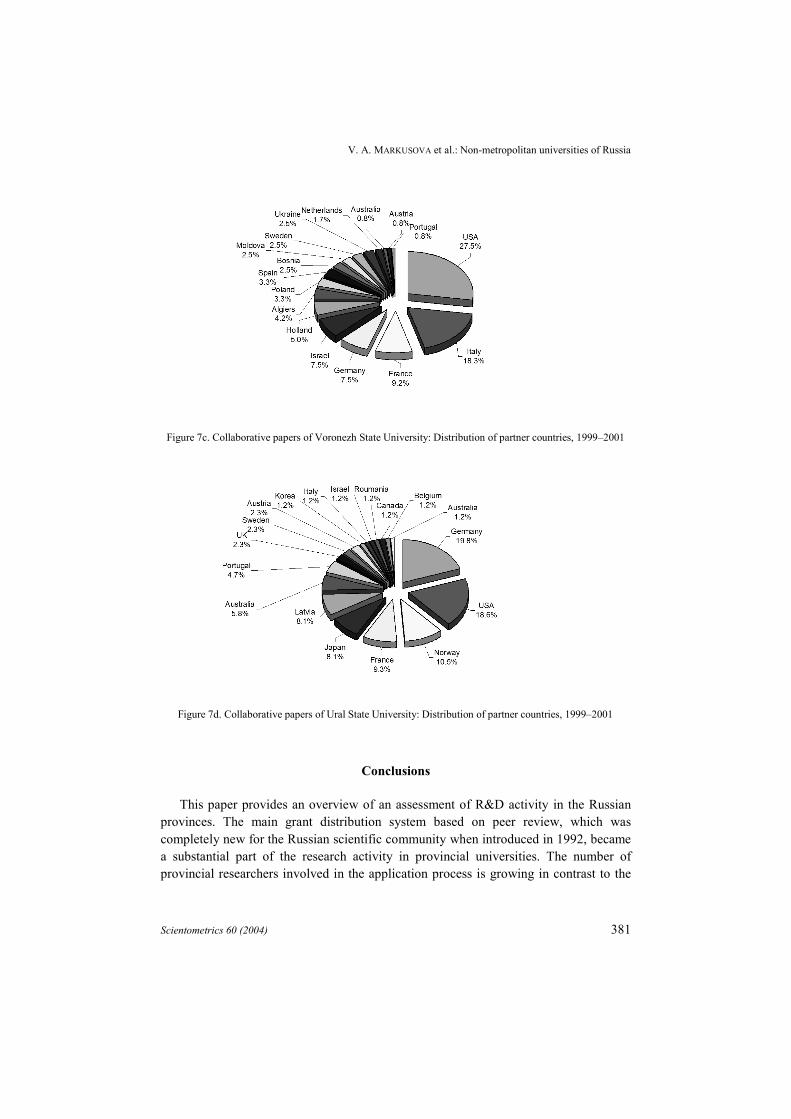
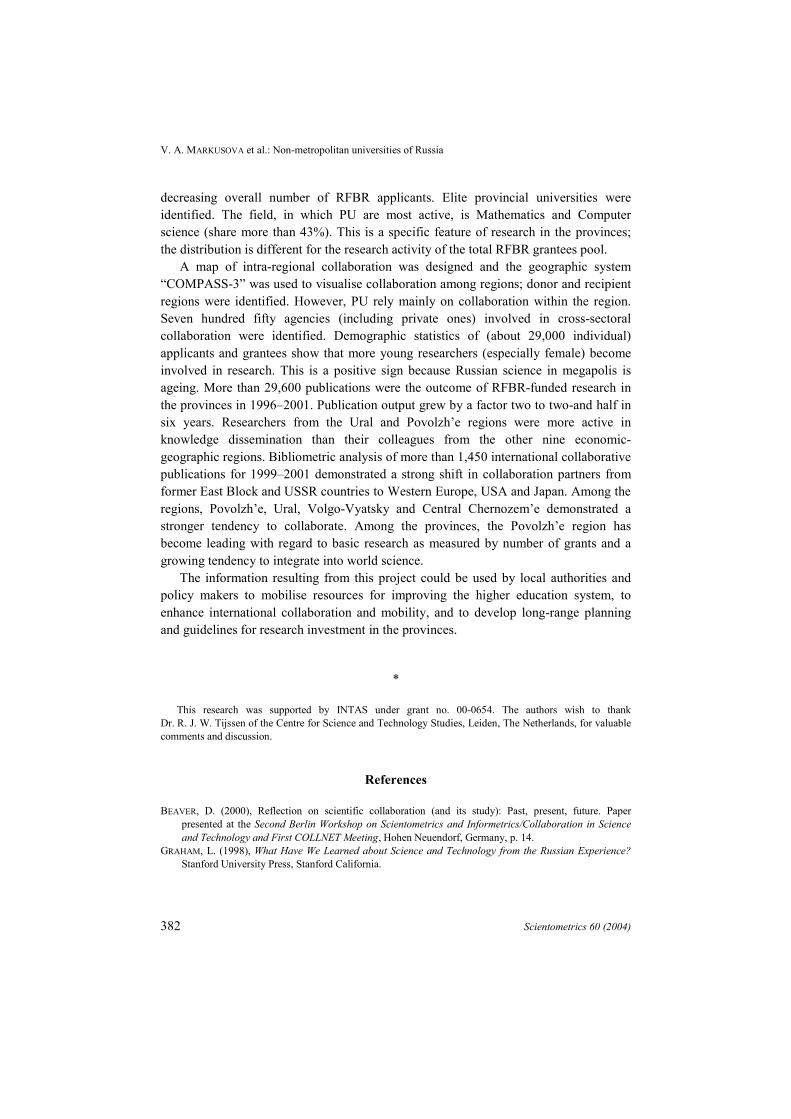
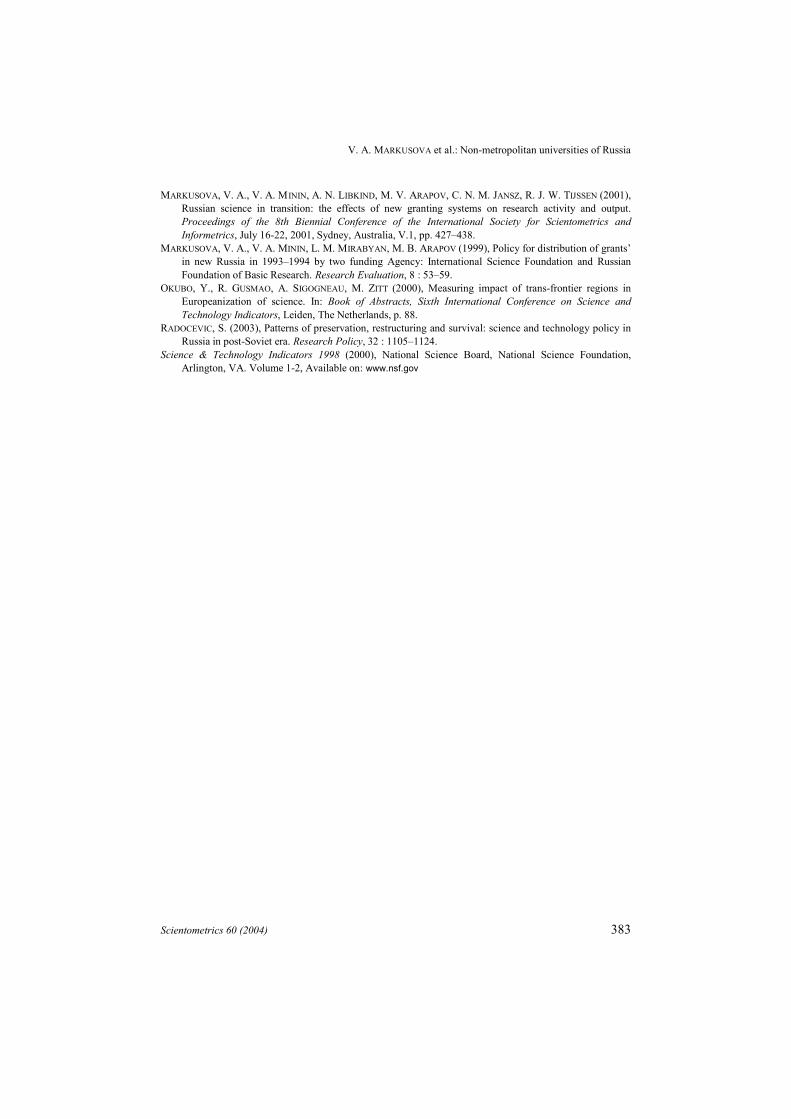
Potentially, their emigration is turning “brain drain” into “brain gain” because theystimulated collaboration between Israel and their alma mater. Collaboration patterns ofa few top universities – Kazan’ State University (KSU), Nizhegorodsky StateUniversity (NSU), Rostov State University (RSU), and Ural State University – revealeach university’s preference in collaborative partners (Figure 7). Due to the history ofhigher education and industrial development of the regions during the Soviet era, eachregion was focused on international collaboration in the field of science, which wasmost advanced there. The Volgo-Vyatskyi, Central Chernozem’e and West-Siberianregions were focused on IC in physics (its share was between 50% – 60%). The Uralpattern of collaboration was equally shared by collaboration on M, P and C (each shareabout 30%). Researchers from the Far East pursued IC on ES. The distribution of CP byfield of science indicates the strongest collaboration on physics and mathematics – theshare of each field was 39.3% (P) and 33.6% (M). This means that physicists were moreactive in knowledge dissemination than any of their counterparts. It is well-known thatin the former USSR, physics, particularly nuclear physics and astrophysics (due to theirmilitary applications), was a lavishly funded and supported discipline benefiting fromthe powerful school of first-class Russian scholars and still appreciated by the worldscientific community. The list of top fifty journals, in which PU grantees published theirresults, mainly consists of journals on physics and astronomy. All these journals arecovered by the SCI. We want to emphasise that due to economic circumstances Russianinternational collaboration depended heavily on financial support from foreign counties.US and German funding agencies (e.g. the US Civilian Research and DevelopmentFoundation and the Max Plank Society) have special programs for collaborativeprojects with Russian provincial universities. These programs gave an impetus tobilateral collaboration.
V. A. MARKUSOVA et al.: Non-metropolitan universities of Russia
380 Scientometrics 60 (2004)
Figure 7a. Collaborative papers of Rostov State University: Distribution of partner countries, 1999–2001
Figure 7b. Collaborative papers of Novosibirsk State University: Distribution of partner countries, 1999–2001
The question why people collaborate and how they find collaborative partners hasbeen discussed before (BEAVER, 2000). To trace the starting point of provincialuniversities’ collaboration we organised a survey among RFBR grantees. A questionnairewas developed and about 1,500 copies were distributed by mail. All returned Q wereprocessed by MS ACCESS and analysed. The response rate was 32.7%. (489 Q). Theresults of the survey will be discussed separately (paper in preparation).
V. A. MARKUSOVA et al.: Non-metropolitan universities of Russia
Scientometrics 60 (2004) 381
Figure 7c. Collaborative papers of Voronezh State University: Distribution of partner countries, 1999–2001
Figure 7d. Collaborative papers of Ural State University: Distribution of partner countries, 1999–2001
Conclusions
This paper provides an overview of an assessment of R&D activity in the Russianprovinces. The main grant distribution system based on peer review, which wascompletely new for the Russian scientific community when introduced in 1992, becamea substantial part of the research activity in provincial universities. The number ofprovincial researchers involved in the application process is growing in contrast to the
V. A. MARKUSOVA et al.: Non-metropolitan universities of Russia
382 Scientometrics 60 (2004)
decreasing overall number of RFBR applicants. Elite provincial universities wereidentified. The field, in which PU are most active, is Mathematics and Computerscience (share more than 43%). This is a specific feature of research in the provinces;the distribution is different for the research activity of the total RFBR grantees pool.
A map of intra-regional collaboration was designed and the geographic system“COMPASS-3” was used to visualise collaboration among regions; donor and recipientregions were identified. However, PU rely mainly on collaboration within the region.Seven hundred fifty agencies (including private ones) involved in cross-sectoralcollaboration were identified. Demographic statistics of (about 29,000 individual)applicants and grantees show that more young researchers (especially female) becomeinvolved in research. This is a positive sign because Russian science in megapolis isageing. More than 29,600 publications were the outcome of RFBR-funded research inthe provinces in 1996–2001. Publication output grew by a factor two to two-and half insix years. Researchers from the Ural and Povolzh’e regions were more active inknowledge dissemination than their colleagues from the other nine economic-geographic regions. Bibliometric analysis of more than 1,450 international collaborativepublications for 1999–2001 demonstrated a strong shift in collaboration partners fromformer East Block and USSR countries to Western Europe, USA and Japan. Among theregions, Povolzh’e, Ural, Volgo-Vyatsky and Central Chernozem’e demonstrated astronger tendency to collaborate. Among the provinces, the Povolzh’e region hasbecome leading with regard to basic research as measured by number of grants and agrowing tendency to integrate into world science.
The information resulting from this project could be used by local authorities andpolicy makers to mobilise resources for improving the higher education system, toenhance international collaboration and mobility, and to develop long-range planningand guidelines for research investment in the provinces.
*
This research was supported by INTAS under grant no. 00-0654. The authors wish to thankDr. R. J. W. Tijssen of the Centre for Science and Technology Studies, Leiden, The Netherlands, for valuablecomments and discussion.
References
BEAVER, D. (2000), Reflection on scientific collaboration (and its study): Past, present, future. Paperpresented at the Second Berlin Workshop on Scientometrics and Informetrics/Collaboration in Scienceand Technology and First COLLNET Meeting, Hohen Neuendorf, Germany, p. 14.
GRAHAM, L. (1998), What Have We Learned about Science and Technology from the Russian Experience?Stanford University Press, Stanford California.
V. A. MARKUSOVA et al.: Non-metropolitan universities of Russia
Scientometrics 60 (2004) 383
MARKUSOVA, V. A., V. A. MININ, A. N. LIBKIND, M. V. ARAPOV, C. N. M. JANSZ, R. J. W. TIJSSEN (2001),Russian science in transition: the effects of new granting systems on research activity and output.Proceedings of the 8th Biennial Conference of the International Society for Scientometrics andInformetrics, July 16-22, 2001, Sydney, Australia, V.1, pp. 427–438.
MARKUSOVA, V. A., V. A. MININ, L. M. MIRABYAN, M. B. ARAPOV (1999), Policy for distribution of grants’in new Russia in 1993–1994 by two funding Agency: International Science Foundation and RussianFoundation of Basic Research. Research Evaluation, 8 : 53–59.
OKUBO, Y., R. GUSMAO, A. SIGOGNEAU, M. ZITT (2000), Measuring impact of trans-frontier regions inEuropeanization of science. In: Book of Abstracts, Sixth International Conference on Science andTechnology Indicators, Leiden, The Netherlands, p. 88.
RADOCEVIC, S. (2003), Patterns of preservation, restructuring and survival: science and technology policy inRussia in post-Soviet era. Research Policy, 32 : 1105–1124.
Science & Technology Indicators 1998 (2000), National Science Board, National Science Foundation,Arlington, VA. Volume 1-2, Available on: www.nsf.gov
Copyright © 2022 FDOKUMEN

