


Bahasa
Halaman
Hukum

and around glacier forelands (eg, Griffey and Matthews, 1978;Matthews and Dresser, 1983; Matthews, 1984, 1985; Porter andOrombelli, 1985; Röthlisberger, 1986; Nicolussi and Patzelt,2000; Dahl et al., 2002), but much is fragmentary through burialor destruction of the evidence relating to early glacial episodes(eg, Gibbons et al., 1984; Nesje et al., 1991). Minerogenic
IntroductionHolocene fluctuations of alpine glaciers have conventionally beenreconstructed from moraine sequences and organic evidence on
Reconstruction of Holocene glacierhistory from distal sources: glaciofluvialstream-bank mires and a glaciolacustrinesediment core near Sota Sæter,Breheimen, southern NorwayRichard A. Shakesby,1* Jamie G. Smith,1 John A. Matthews,1 StefanWinkler,2 P. Quentin Dresser,1 Jostein Bakke,3,4 Svein-Olaf Dahl,3,4
Øyvind Lie4 and Atle Nesje4,5
( 1Department of Geography, School of the Environment and Society, University of Wales Swansea,Singleton Park, Swansea SA2 8PP, UK; 2Department of Geography, University of Würzburg, Am Hubland,D-97074, Würzburg, Germany; 3Department of Geography, University of Bergen, Fosswinkelsgate 6,N-5007, Bergen, Norway; 4Bjerknes Centre for Climatic Research, Allégaten 55, N-5007, Bergen, Norway;5Department of Earth Sciences, University of Bergen, Allégaten 41, N-5007, Bergen, Norway)
Received 1 March 2007; revised manuscript accepted 20 April 2007
Abstract: This study attempts to reconstruct the Holocene glacier history of Breheimen, southern Norway fromfour stream-bank mire sites and a downstream lake sediment core near Sota Sæter, based on lithostratigraphy, sed-iment properties (loss-on-ignition (LOI), magnetic susceptibility (MS), grain size characteristics) and 69 radio-carbon dates. Late-Preboreal deglaciation is indicated by lake-floor accumulation of organic matter (gyttja) largelyreplacing minerogenic sediment before 9000 cal. BP. A distinct minerogenic layer is thought to represent glacierexpansion during the 8.2 ka Finse Event. Following this event until c. 2200 cal. BP, glaciers were mostly smallerthan today, indicated by slow accumulation of mainly gyttja with predominantly thin minerogenic layers. A troughin LOI and corresponding small peaks in different silt fractions indicate possible glacial expansion from c. 3500to 3000 cal. BP. The shorter c. 7500 year stream-bank mire record suggests brief, distinct episodes of Neoglacialglacier activity at c. 5600 and 3650 cal. BP. After c. 2200 cal. BP, up to three possible glacier expansion eventsare indicated in the lake core compared with up to eight represented in the mire sequences, suggesting greater sen-sitivity of the latter to small-scale glacier expansion. Marked ‘suppressed’ Neoglacial expansion until after c. 2200cal. BP contrasts with the more typically reported start at 6000–5300 cal. BP elsewhere in southern Norway.Methodological implications are discussed including: factors responsible for erroneous radiocarbon dates in mireand lake core stratigraphies; high spatial variability in mire stratigraphy; determining the amplitude of glacier con-traction episodes; isolating the glacial signal from background ‘noise’; and further improvement of dating.
Key words: Neoglacial, neoglaciation, Holocene climate, Finse Event, 8.2 ka cal. BP event, ‘Little Ice Age’,stream-bank mires, glaciofluvial approach, glaciolacustrine approach, radiocarbon dating,Norway, Breheimen.
The Holocene 17,6 (2007) pp. 729–745
© 2007 SAGE Publications 10.1177/0959683607080514
*Author for correspondence (e-mail: [email protected])
at Universitetsbiblioteket i Bergen on February 11, 2015hol.sagepub.comDownloaded from
sediment in glacier-fed lakes and glaciofluvial stream-bank mires,however, can potentially provide unbroken high-resolution recordsof glacier fluctuations. The value of lakes in this respect was firstrecognized in the mid-1970s (Karlén, 1976) and the approach sub-sequently applied in, for example, North America (eg, Leonard,1985, 1986, 1997; Souch, 1994; Leonard and Reasoner, 1999;Levy et al., 2004), the European Alps (eg, Leemann and Niessen,1994; Ohlendorf, 1999) and Scandinavia (eg, Karlén, 1981, 1988;Nesje et al., 1991, 1994, 1995, 2000, 2001, 2006; Dahl and Nesje,1994; Matthews and Karlén, 1992; Matthews et al., 2000; Dahlet al., 2003; Lie et al., 2004; Bakke et al., 2005a). In stream-bankmires, glacier contraction and expansion are interpreted respec-tively from peat accumulation and discrete minerogenic layers rep-resenting overbank deposition of suspended sediment. Thisapproach has been pioneered and developed in southern Norway(Nesje and Dahl, 1991a, b; Nesje et al., 1991, 2001, 2004; Dahl andNesje, 1994, 1996; Dahl et al., 2003; Matthews et al., 2005).
Previous research into the Holocene glacial history of Breheimen,southern Norway from glacier foreland evidence showed only ‘LittleIce Age’ advances, except for older fragmentary buried organic evi-dence at low altitude and possible pre-‘Little Ice Age’ moraineridges at a few small high-altitude glaciers (Winkler et al., 2003;Shakesby et al., 2004). The present study focuses on the lithostratig-raphy and dating of stream-bank mire exposures and of a down-stream lake sediment core near Sota Sæter, Breheimen. It aims to: (1)reconstruct Holocene glacier variations in Breheimen from distalsources; (2) make regional and subregional comparisons; and (3) dis-cuss methodological implications arising from the study.
Background to Breheimen and thestudy locations
Breheimen lies between Lustrafjorden to the south, theJostedalsbreen ice cap to the west, Jotunheimen to the southeastand Ottadalen to the northeast (Figure 1). The bedrock is mainlygranitic and migmatic gneiss (Sigmond et al., 1984; Lutro andTveten, 1996). As discussed in Winkler et al. (2003), the climatestation on Sognefjell (1413 m a.s.l.) in Jotunheimen provides theclosest correspondence of climate to central Breheimen. It has amean annual precipitation of 860 mm and a mean annual tem-perature of −3.1°C (Aune, 1993; Førland, 1993). The estimatedtemperature at the much lower altitude of the sites near SotaSæter (7° 42′E, 61° 48′N) is c. 1.0°C.
Modern and ‘Little Ice Age’ steady-state equilibrium linealtitudes (ELAs) were calculated using the accumulation arearatio (AAR) method and an AAR of 0.6 (Andrews, 1975;Porter, 1975) for two glaciers: Storegrovbreen (13.4 km2),which is part of Sekkebreen ice cap, and the smallerTverreggibreen (2.8 km2) (Figure 1). The modern extents andaltitudinal ranges of these glaciers are those according toØstrem et al. (1988) and the ‘Little Ice Age’ extents are asmapped by Winkler et al. (2003). ELA was depressed at the‘Little Ice Age’ maximum for both glaciers by an estimated 70m, which lies within the range calculated for other glaciers insouthern Norway (Torsnes et al., 1993; Matthews et al., 2000,2005; Nesje et al., 2000).
730 The Holocene 17,6 (2007)
Figure 1 Map of the Liavatnet catchment, showing locations of stream-bank mire sites, the coring site in Liavatnet, and glacier extent now andat the maximum of the ‘Little Ice Age’ for selected glaciers. Inset map (top left) shows the locations of places in southern Scandinavia referred toin the text: Hardangerjøkulen (H) and Folgefonna (F), in addition to Breheimen (B). The regional inset map (bottom left) shows the position ofBreheimen relative to the Jostedalsbreen ice cap and glaciers of Jotunheimen
at Universitetsbiblioteket i Bergen on February 11, 2015hol.sagepub.comDownloaded from
PRO
OF
ON
LY
Richard A. Shakesby et al.: Reconstruction of Holocene glacier history from distal sources 731
Fig
ure 2
Loc
atio
ns o
f st
ream
-ban
k m
ire
site
s an
d li
thos
trat
igra
phy.
(a)
Loc
atio
n of
tre
nch
1A d
owns
trea
m o
f a
bedr
ock
ridg
e. T
renc
h 1B
was
exc
avat
ed t
o th
e ri
ght
of t
his
tren
ch. (
b) L
ocat
ion
of s
ite
2. N
ote
Mys
ubyt
ta s
trea
m a
t rig
ht-c
entr
e of
the
phot
ogra
ph. (
c) L
ocat
ion
of s
ite
3 (n
ote
figu
re s
tand
ing
clos
e to
the
site
and
its
prox
imit
y to
the
Mys
ubyt
ta s
trea
m):
Mys
ubyt
tdal
en c
an b
e se
en in
the
back
grou
nd. (
d) T
renc
h1A
, lit
host
rati
grap
hy (
note
min
erog
enic
laye
rs d
rape
d ov
er f
alle
n br
anch
es n
ear
base
). (
e) T
renc
h 1B
, lit
host
rati
grap
hy. (
f) S
ite
2, li
thos
trat
igra
phy
(not
e 26
cm
thic
k m
iner
ogen
ic la
yer
abov
e tr
owel
thou
ght t
o re
p-re
sent
‘L
ittl
e Ic
e A
ge’
glac
ier
expa
nsio
n, a
nd t
he d
epth
of
pene
trat
ion
by l
ive
root
s). (
g) S
ite
3, l
itho
stra
tigr
aphy
(no
te p
enet
rati
on o
f th
e ro
ots
to t
he b
ase
of t
his
c. 5
0 cm
dee
p ex
cava
tion
)
at Universitetsbiblioteket i Bergen on February 11, 2015hol.sagepub.comDownloaded from
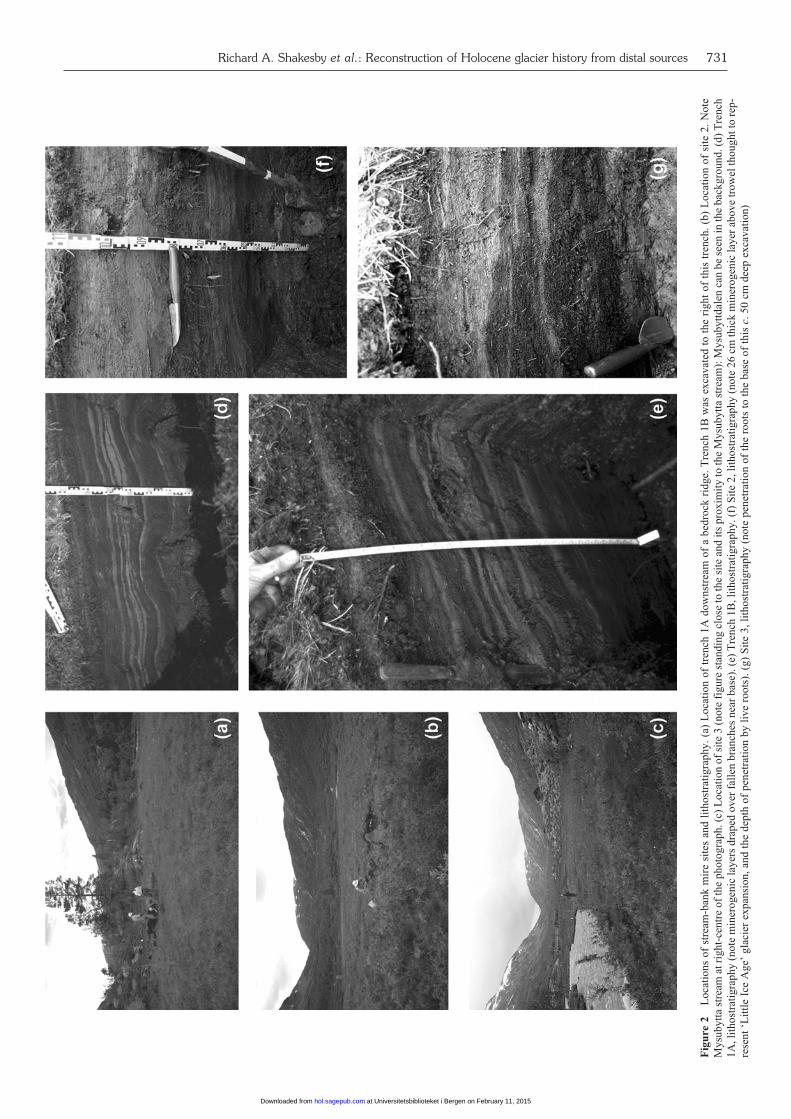
Stream-bank mires and upstream glacialsediment sourcesThe four stream-bank mire sites extend over c. 1.5 km in the sub-alpine vegetation zone (Moen, 1998) at the lower, eastern end ofMysubyttdalen, which is a slightly sinuous 11.5 km long glacialtrough covered mainly in vegetated till and colluvium (Figure 1).The floor of the trough rises from c. 830 m near the study sites toc. 1280 m at its upstream end so that the lower reaches lie belowthe local tree lines of mountain birch (Betula pubescens ssp. tor-tuosa) (at c. 1000–1050 m) and of Scots pine (Pinus sylvestris) at900 m. The mires lie alongside the Mysubytta stream, which isinterrupted by a series of lakes. Fluvial deposits are sparse in theupper, but more extensive in the lower part of the valley.
Site 1 is c. 30 m from the stream bank downvalley of a bedrockridge in a comparatively wet mire (Figure 2a). The vegetationcomprises predominantly Eriophorum spp. and occasional dwarfwillow (Salix glauca) individuals and dead pine stumps. On sur-rounding raised dry ground, there are mature Pinus sylvestris indi-viduals with a Calluna vulgaris understorey. Site 2 is c. 25 m fromthe stream on a drier mire upstream of a bedrock outcrop (Figure2b). The vegetation is dominated by herbs with sparse dwarfshrubs. Site 3 lies only 2 m from the stream in a small, narrow, wetmire (Figure 2c). Site 4 is the farthest upvalley on raised, rela-tively dry ground inside an abandoned meander loop.
Tverreggibreen and Storegrovbreen would have supplied mostof the enhanced suspended sediment load carried by theMysubytta stream during glacier expansion episodes, with lesseramounts from the smaller ice bodies upstream of Mysubyttvatnet(Kupbreen, Kupenbreen, thin ice south of Tverrbyttnbreen, and asmall niche glacier southwest of the latter) (Figure 1).
Liavatnet and catchmentThe lake core was obtained from near the distal end of Liavatnet,which lies at 733 m a.s.l. and has a surface area of 3.3 km2. Thelake is bounded by the steep-sided and forested glaciated valley ofBråtadalen, which is incised some 600 m into an undulating c.1500–1600 m high plateau. Modern glaciers occupy c. 30 km2
(13.6%) out of a total lake catchment area of c. 220 km2 (Figure 1).The glaciers of Harbardsbreen, Fortundalsbreen and Greinbreenprovide additional lake sediment input via the Syrtbytta and Stillastreams to that transported by the Mysubytta stream (Figure 1).Sediment also reaches Liavatnet from a number of small streams,and debris flow and avalanche tracks on adjacent slopes.
Methods and rationale
Stream-bank miresAt the four sites (Figure 1), manual excavation of five short trenches(1A, 1B, 2, 3 and 4) was undertaken. Trench 1B was within 1 m oftrench 1A. Stratigraphic descriptions and sampling for radiocarbondating were made from the open trench faces. Variations in peatcolour and degree of humification were noted. Grain-size analysisof minerogenic sediments < 2 mm in one representative trench (1B)was carried out using a Beckman Coulter LS230 Optical BenchParticle Size Analyser. The data are grouped into the following sizefractions by weight: clay (< 0.002 mm); fine (0.002–0.006 mm),medium (0.006–0.020 mm) and coarse (0.020–0.060 mm) silt; andfine (0.060–0.200mm), medium (0.200–0.600 mm) and coarse(0.600–2.00 mm) sand (Head, 1980).
Bluish-grey, silt-rich units in glaciofluvial stream-bank miresare regarded as indicating upstream glacier presence and/orexpansion (eg, Nesje and Dahl, 1991a, b; Dahl and Nesje, 1994;Matthews et al., 2005) and are thought to represent overbank dep-osition of the suspended meltwater sediment load carried typically
in the spring freshet and summer months in response to enhancedglacier ablation and sediment flushing following precipitationevents (Gurnell and Clark, 1987). Whereas this suspended load isnormally relatively low in non-glacial streams (Hallet et al.,1996), it is typically increased in glacial streams through abrasionat wet-based glacier beds (Boulton, 1978; Dahl et al., 2003).Coarse sediment tends to be trapped in upstream lakes. Glacierdisappearance or reduced size generally allows peat accumulationto proceed undisturbed.
Liavatnet lake coreTwo c. 3 m long cores showing similar lithostratigraphiesobtained 10 m apart were collected using a piston-type corer(Nesje, 1992) in 2001. Only the results from one of the cores arereported here. The cores were taken from a position about 1 kmfrom the distal end of the lake where it is deepest (29.1 m), flattestand therefore considered least likely to have been disturbed bysubaqueous slides (Karlén, 1981; Souch, 1994; Dahl et al., 2003;but see Snowball and Sandgren, 1996). Core extraction, descrip-tion and sampling were undertaken in the laboratory followingstorage at 4°C. The colour, general textural characteristics andlithostratigraphy were described systematically and samples takenat 1 cm intervals.
Percentage weight loss-on-ignition (LOI) was calculated forpre-weighed, oven-dried (105°C) 1–3 g samples heated to 550°Cfor 2.5 h (Smith, 2002, 2003). Organic production is often high inlakes like Liavatnet near the tree line such that LOI tends to be asensitive inverse indicator of varying minerogenic input associ-ated with glacier fluctuations (Karlén, 1976; Dahl et al., 2003),except when the clastic input is high. The residue following igni-tion, however, may include inorganic mineral matter, biogenic sil-ica (diatoms) and carbonate (Battarbee et al., 2001; Nesje et al.,2004), although the latter is unlikely to have affected Liavatnet asit lies on non-calcareous bedrock.
In addition to glacially derived sediment sources, Liavatnetwould also have received sediment inputs from valley sides dur-ing colluvial or alluvial activity. Textural characteristics can helpin separating glacial from other sediment sources (Matthews et al.,2005). Grain-size distributions for material < 300 µm were deter-mined for each 1 cm sample of the core using a Micrometrics 5100SediGraph. The data are grouped into the following fractions byweight: clay (< 0.002 mm), fine (0.002–0.008 mm), medium(0.008–0.020 mm) and coarse (0.020–0.063 mm) silt, and sand(0.063–0.300 mm). The presence of sediment > 300 µm was notedwhen describing the core.
Magnetic susceptibility (MS) indicates primarily magnetic min-eral concentration within a sediment and typically varies inverselywith LOI. In glaciofluvial lakes, high MS values can indicate glacialerosion and transport of clastic sediments in the catchment(Snowball and Thompson, 1990; Karlén and Matthews, 1992;Snowball et al., 1999; Matthews et al., 2000; Nesje et al., 2000;Seierstad et al., 2002), although they can also reflect sediment inputfrom adjacent valley sides by overland flow during rainstorms,floods and mass movements (snow avalanches and debris flows)from adjacent valley sides (Sandgren and Risberg, 1990; Nesje et al.,1991, 1995, 2000, 2001; Karlén and Matthews, 1992; Dahl et al.,2003; Sletten et al., 2003). MS was measured for each dried 1 cmsample using a Bartington MS2B desktop probe and MS2C Sensor.
Radiocarbon datingSixty-eight bulk radiocarbon dates were obtained from theSwansea Radiocarbon Laboratory and one AMS date from BetaAnalytic Inc., Florida, USA. All the Swansea dates were obtainedfrom 0.5–2 cm thick bulk samples using standard techniques. TheAMS date was obtained from an unidentified wood fragmentpretreated with alkali and acid washes. All radiocarbon ages have
732 The Holocene 17,6 (2007)
at Universitetsbiblioteket i Bergen on February 11, 2015hol.sagepub.comDownloaded from
Richard A. Shakesby et al.: Reconstruction of Holocene glacier history from distal sources 733
Fig
ure 3
Lit
host
rati
grap
hy a
nd u
ncal
ibra
ted
radi
ocar
bon
date
s fo
r th
e st
ream
-ban
k m
ire
site
s in
Mys
ubyt
tdal
en. S
ite
loca
tion
s ar
e gi
ven
in F
igur
e 1.
Cal
ibra
ted
radi
ocar
bon
date
s ar
e gi
ven
in T
able
1
at Universitetsbiblioteket i Bergen on February 11, 2015hol.sagepub.comDownloaded from
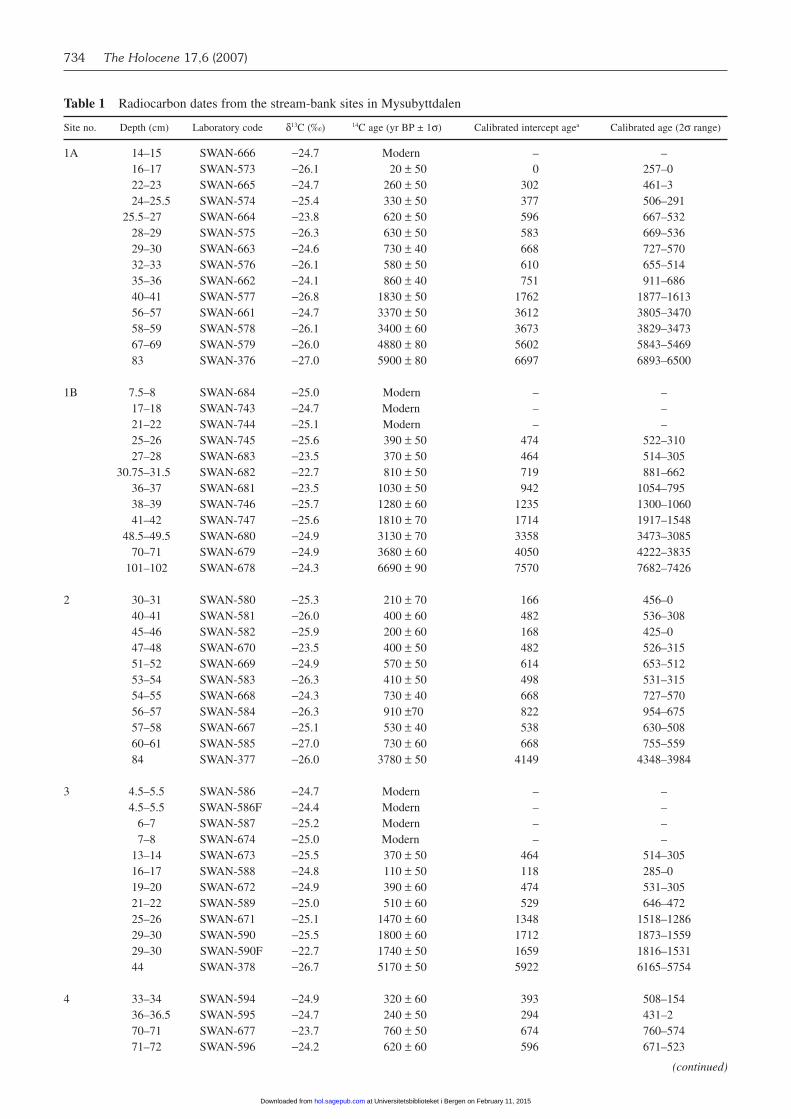
Table 1 Radiocarbon dates from the stream-bank sites in Mysubyttdalen
Site no. Depth (cm) Laboratory code δ13C (‰) 14C age (yr BP ± 1σ) Calibrated intercept agea Calibrated age (2σ range)
1A 14–15 SWAN-666 −24.7 Modern – –16–17 SWAN-573 −26.1 20 ± 50 0 257–0 22–23 SWAN-665 −24.7 260 ± 50 302 461–3 24–25.5 SWAN-574 −25.4 330 ± 50 377 506–291
25.5–27 SWAN-664 −23.8 620 ± 50 596 667–532 28–29 SWAN-575 −26.3 630 ± 50 583 669–536 29–30 SWAN-663 −24.6 730 ± 40 668 727–570 32–33 SWAN-576 −26.1 580 ± 50 610 655–514 35–36 SWAN-662 −24.1 860 ± 40 751 911–686 40–41 SWAN-577 −26.8 1830 ± 50 1762 1877–1613 56–57 SWAN-661 −24.7 3370 ± 50 3612 3805–3470 58–59 SWAN-578 −26.1 3400 ± 60 3673 3829–3473 67–69 SWAN-579 −26.0 4880 ± 80 5602 5843–5469 83 SWAN-376 −27.0 5900 ± 80 6697 6893–6500
1B 7.5–8 SWAN-684 −25.0 Modern – –17–18 SWAN-743 −24.7 Modern – –21–22 SWAN-744 −25.1 Modern – –25–26 SWAN-745 −25.6 390 ± 50 474 522–310 27–28 SWAN-683 −23.5 370 ± 50 464 514–305
30.75–31.5 SWAN-682 −22.7 810 ± 50 719 881–662 36–37 SWAN-681 −23.5 1030 ± 50 942 1054–795 38–39 SWAN-746 −25.7 1280 ± 60 1235 1300–1060 41–42 SWAN-747 −25.6 1810 ± 70 1714 1917–1548
48.5–49.5 SWAN-680 −24.9 3130 ± 70 3358 3473–3085 70–71 SWAN-679 −24.9 3680 ± 60 4050 4222–3835
101–102 SWAN-678 −24.3 6690 ± 90 7570 7682–7426
2 30–31 SWAN-580 −25.3 210 ± 70 166 456–0 40–41 SWAN-581 −26.0 400 ± 60 482 536–308 45–46 SWAN-582 −25.9 200 ± 60 168 425–0 47–48 SWAN-670 −23.5 400 ± 50 482 526–31551–52 SWAN-669 −24.9 570 ± 50 614 653–512 53–54 SWAN-583 −26.3 410 ± 50 498 531–315 54–55 SWAN-668 −24.3 730 ± 40 668 727–570 56–57 SWAN-584 −26.3 910 ±70 822 954–675 57–58 SWAN-667 −25.1 530 ± 40 538 630–508 60–61 SWAN-585 −27.0 730 ± 60 668 755–559 84 SWAN-377 −26.0 3780 ± 50 4149 4348–3984
3 4.5–5.5 SWAN-586 −24.7 Modern – –4.5–5.5 SWAN-586F −24.4 Modern – –
6–7 SWAN-587 −25.2 Modern – –7–8 SWAN-674 −25.0 Modern – –
13–14 SWAN-673 −25.5 370 ± 50 464 514–305 16–17 SWAN-588 −24.8 110 ± 50 118 285–0 19–20 SWAN-672 −24.9 390 ± 60 474 531–305 21–22 SWAN-589 −25.0 510 ± 60 529 646–472 25–26 SWAN-671 −25.1 1470 ± 60 1348 1518–1286 29–30 SWAN-590 −25.5 1800 ± 60 1712 1873–1559 29–30 SWAN-590F −22.7 1740 ± 50 1659 1816–1531 44 SWAN-378 −26.7 5170 ± 50 5922 6165–5754
4 33–34 SWAN-594 −24.9 320 ± 60 393 508–154 36–36.5 SWAN-595 −24.7 240 ± 50 294 431–2 70–71 SWAN-677 −23.7 760 ± 50 674 760–57471–72 SWAN-596 −24.2 620 ± 60 596 671–523
(continued)
734 The Holocene 17,6 (2007)
at Universitetsbiblioteket i Bergen on February 11, 2015hol.sagepub.comDownloaded from
been corrected for δ13C and calibrated to calendar years BP usingthe INTCAL98 program of Stuiver et al. (1998). Fifty-eight datesrelate to the stream-bank mires and 11 to the lake core.Identifiable live roots were removed in the field from the stream-bank mire samples and further roots extracted during laboratorypretreatment.
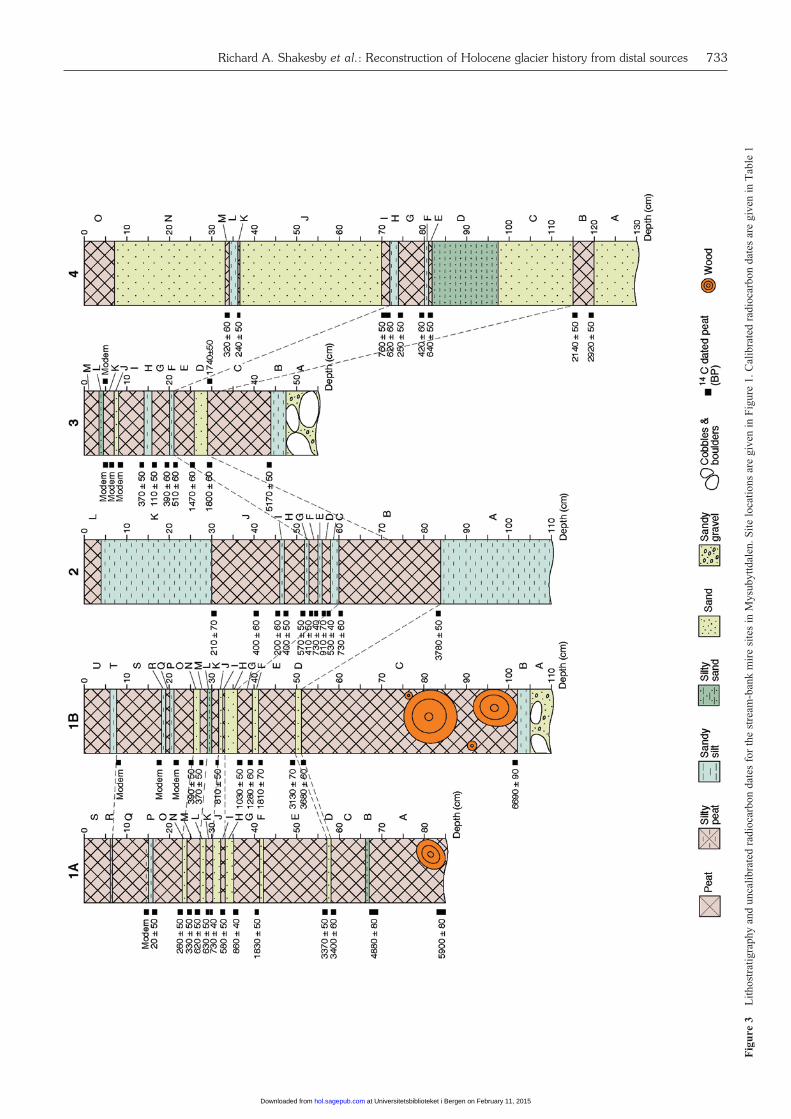
Stream-bank mire sites: stratigraphyand datingMire locations, stratigraphies and summarized uncalibrated radiocar-bon dates are presented in Figures 2 and 3. Table 1 gives details of theradiocarbon dates including their calibrated ages. Uncalibrated datesare mainly quoted in this section but calibrated dates in the discussion.
Site 1Grain-size characteristics of the minerogenic units from trench 1B(Table 2) show that they vary from silty sands to sandy silts. Theoldest date and minimum age for peat development at theMysubytta sites of 6690 ± 90 BP (SWAN-678) was obtained fromthe lowermost 1 cm of peat in trench 1B (Figure 3). Layers of peatand minerogenic sediment are draped over and therefore postdatedead roots and fallen boughs of pine, birch and possibly alder(Figures 2d and 2e). Basal peat was not reached in trench 1A.Well-humified peat units A, C, E and G in trench 1A and C, E andG in trench 1B are separated by distinct, thin (1–1.5 cm) sandylayers (units B, D and F in 1A, and D and F in 1B). Unit B intrench 1A has a maximum constrained age of 4880 ± 80 BP(SWAN-579). The similar bracketing dates for unit D in bothtrenches (3370 ± 50 BP, SWAN-661 and 3400 ± 60 BP, SWAN-578 in trench 1A; 3680 ± 60 BP, SWAN-679 and 3130 ± 70 BP,SWAN-680 in trench 1B) indicate age equivalence despite tex-tural differences. Minerogenic units F and H in both trenches arefiner in 1B (sandy silt) than in 1A (fine sand). Bracketing ages forthe lower minerogenic unit (F) in 1B (1280 ± 60 BP, SWAN-746;1810 ± 70 BP, SWAN-747) suggest the possibility of later forma-tion than for unit F in trench 1A dated to 1830 ± 50 BP (SWAN-
577) from overlying peat. Similarly, the minerogenic units H inboth trenches are apparently of similar age although the date fromunderlying peat in 1A (860 ± 40 BP, SWAN-662) is significantlyyounger than that in 1B (1030 ± 50 BP, SWAN-681).
In the upper sections of trenches 1A and 1B, units J, L and Ncomprise three distinct 1 to 2 cm thick sandy layers interruptingwell humified peat. Associated radiocarbon dates in 1A are strati-graphically in order except for the lowermost one (580 ± 50 BP,SWAN-576). Discounting this date, the others range from 730 ±40 BP (SWAN-663) for the base of unit K to 260 ± 50 BP(SWAN-665) for basal peat in unit O, which overlies the upper-most of the three minerogenic layers (unit N). Similar dates areassociated with stratigraphically similarly positioned layers intrench 1B, which reinforces the view that the date of 580 ± 50 BP(SWAN-576) is erroneous.
Peaty units O and Q in trench 1A, and O, Q and S in trench 1Bcomprise increasingly well-humified peat down-profile. Thesepeaty units are interrupted by 1 cm thick, fine sandy silt (P in bothtrenches) or silty sand (R in 1B) layers. Bracketing dates give onlyone non-‘modern’ date of 20 ± 50 BP (SWAN-573). The upper-most units in these trenches (S in 1A and U in 1B) comprise 6 cmof poorly humified peat overlying a 0.5–1.0 cm, fine sandy-siltlayer, with an associated ‘modern’ date (SWAN-684).
Sites 2, 3 and 4The sequences at these sites represent shorter periods of accumu-lation, and lithostratigraphic reversal of radiocarbon dates is moreprevalent than at site 1. Broadly, the sequence at site 2 (Figure 2f)shows a c. 55 cm thick peat layer intercalated with four 1–2 cmthick sandy silt bands (units C, E, G and I) sandwiched betweenoverlying 26 cm thick (unit K) and underlying > 25 cm thick (unitA) layers of sandy silt. A basal date in unit B indicates a mid-Holocene age of 3780 ± 50 BP (SWAN-377). Eight dates brack-eting the four thin sandy silt bands range in age from 910 ± 70 BP(SWAN-584) to 200 ± 60 BP (SWAN-582) but some are out ofstratigraphical order.
At site 3 (Figure 2g), basal diamicton (unit A) and sandy silt(unit B) underlie mostly well humified peat intercalated with
Richard A. Shakesby et al.: Reconstruction of Holocene glacier history from distal sources 735
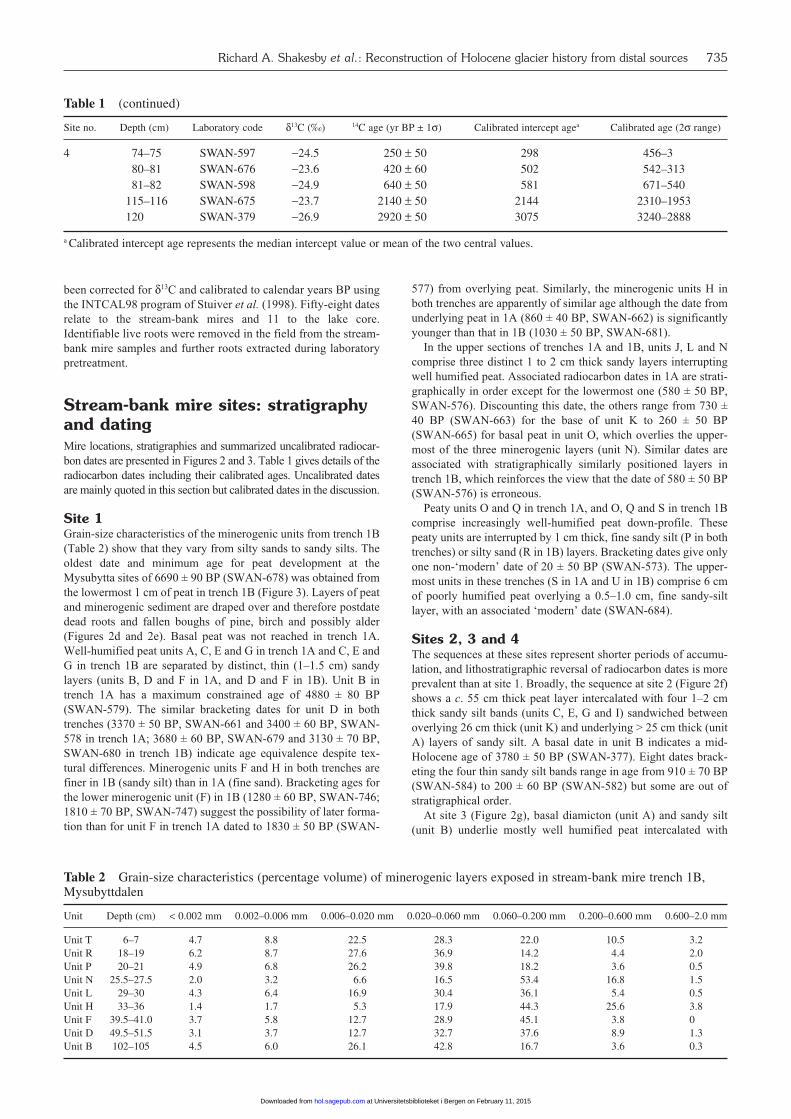
Table 1 (continued)
Site no. Depth (cm) Laboratory code δ13C (‰) 14C age (yr BP ± 1σ) Calibrated intercept agea Calibrated age (2σ range)
4 74–75 SWAN-597 −24.5 250 ± 50 298 456–3 80–81 SWAN-676 −23.6 420 ± 60 502 542–313 81–82 SWAN-598 −24.9 640 ± 50 581 671–540
115–116 SWAN-675 −23.7 2140 ± 50 2144 2310–1953 120 SWAN-379 −26.9 2920 ± 50 3075 3240–2888
a Calibrated intercept age represents the median intercept value or mean of the two central values.
Table 2 Grain-size characteristics (percentage volume) of minerogenic layers exposed in stream-bank mire trench 1B,Mysubyttdalen
Unit Depth (cm) < 0.002 mm 0.002–0.006 mm 0.006–0.020 mm 0.020–0.060 mm 0.060–0.200 mm 0.200–0.600 mm 0.600–2.0 mm
Unit T 6–7 4.7 8.8 22.5 28.3 22.0 10.5 3.2Unit R 18–19 6.2 8.7 27.6 36.9 14.2 4.4 2.0Unit P 20–21 4.9 6.8 26.2 39.8 18.2 3.6 0.5Unit N 25.5–27.5 2.0 3.2 6.6 16.5 53.4 16.8 1.5Unit L 29–30 4.3 6.4 16.9 30.4 36.1 5.4 0.5Unit H 33–36 1.4 1.7 5.3 17.9 44.3 25.6 3.8Unit F 39.5–41.0 3.7 5.8 12.7 28.9 45.1 3.8 0Unit D 49.5–51.5 3.1 3.7 12.7 32.7 37.6 8.9 1.3Unit B 102–105 4.5 6.0 26.1 42.8 16.7 3.6 0.3
at Universitetsbiblioteket i Bergen on February 11, 2015hol.sagepub.comDownloaded from
736 The Holocene 17,6 (2007)
Fig
ure 4
Lit
host
rati
grap
hy a
nd u
ncal
ibra
ted
radi
ocar
bon
date
s fo
r th
e L
iava
tnet
cor
e. L
ocat
ion
of t
he c
orin
g si
te i
s gi
ven
in F
igur
e 1.
Cal
ibra
ted
radi
ocar
bon
date
s ar
e gi
ven
in T
able
4
at Universitetsbiblioteket i Bergen on February 11, 2015hol.sagepub.comDownloaded from
Richard A. Shakesby et al.: Reconstruction of Holocene glacier history from distal sources 737
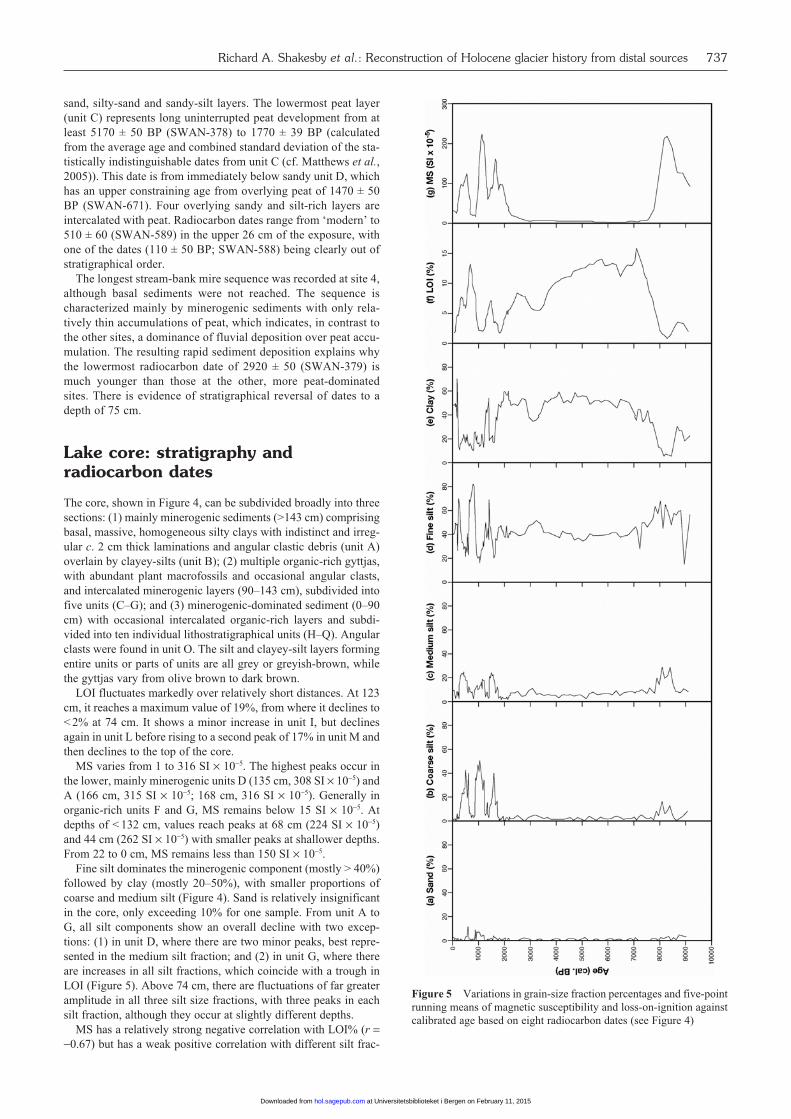
Figure 5 Variations in grain-size fraction percentages and five-pointrunning means of magnetic susceptibility and loss-on-ignition againstcalibrated age based on eight radiocarbon dates (see Figure 4)
sand, silty-sand and sandy-silt layers. The lowermost peat layer(unit C) represents long uninterrupted peat development from atleast 5170 ± 50 BP (SWAN-378) to 1770 ± 39 BP (calculatedfrom the average age and combined standard deviation of the sta-tistically indistinguishable dates from unit C (cf. Matthews et al.,2005)). This date is from immediately below sandy unit D, whichhas an upper constraining age from overlying peat of 1470 ± 50BP (SWAN-671). Four overlying sandy and silt-rich layers areintercalated with peat. Radiocarbon dates range from ‘modern’ to510 ± 60 (SWAN-589) in the upper 26 cm of the exposure, withone of the dates (110 ± 50 BP; SWAN-588) being clearly out ofstratigraphical order.
The longest stream-bank mire sequence was recorded at site 4,although basal sediments were not reached. The sequence ischaracterized mainly by minerogenic sediments with only rela-tively thin accumulations of peat, which indicates, in contrast tothe other sites, a dominance of fluvial deposition over peat accu-mulation. The resulting rapid sediment deposition explains whythe lowermost radiocarbon date of 2920 ± 50 (SWAN-379) ismuch younger than those at the other, more peat-dominatedsites. There is evidence of stratigraphical reversal of dates to adepth of 75 cm.
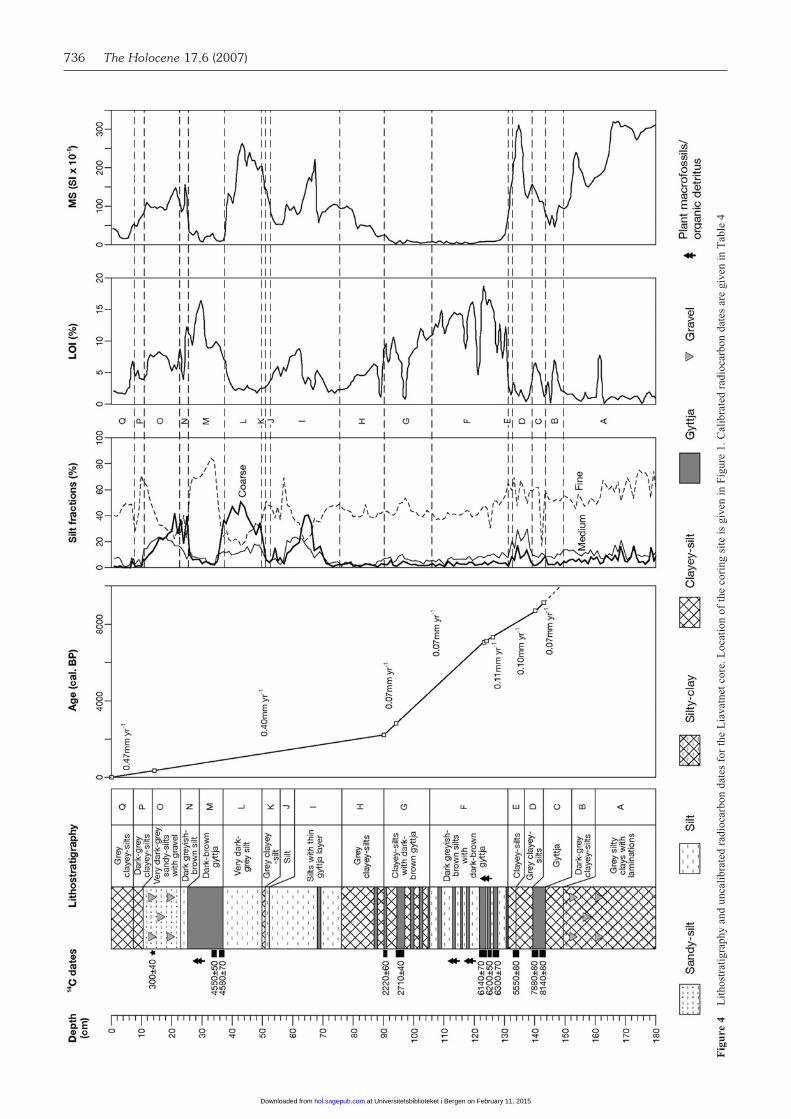
Lake core: stratigraphy andradiocarbon dates
The core, shown in Figure 4, can be subdivided broadly into threesections: (1) mainly minerogenic sediments (>143 cm) comprisingbasal, massive, homogeneous silty clays with indistinct and irreg-ular c. 2 cm thick laminations and angular clastic debris (unit A)overlain by clayey-silts (unit B); (2) multiple organic-rich gyttjas,with abundant plant macrofossils and occasional angular clasts,and intercalated minerogenic layers (90–143 cm), subdivided intofive units (C–G); and (3) minerogenic-dominated sediment (0–90cm) with occasional intercalated organic-rich layers and subdi-vided into ten individual lithostratigraphical units (H–Q). Angularclasts were found in unit O. The silt and clayey-silt layers formingentire units or parts of units are all grey or greyish-brown, whilethe gyttjas vary from olive brown to dark brown.
LOI fluctuates markedly over relatively short distances. At 123cm, it reaches a maximum value of 19%, from where it declines to< 2% at 74 cm. It shows a minor increase in unit I, but declinesagain in unit L before rising to a second peak of 17% in unit M andthen declines to the top of the core.
MS varies from 1 to 316 SI × 10−5. The highest peaks occur inthe lower, mainly minerogenic units D (135 cm, 308 SI × 10−5) andA (166 cm, 315 SI × 10−5; 168 cm, 316 SI × 10−5). Generally inorganic-rich units F and G, MS remains below 15 SI × 10−5. Atdepths of < 132 cm, values reach peaks at 68 cm (224 SI × 10−5)and 44 cm (262 SI × 10−5) with smaller peaks at shallower depths.From 22 to 0 cm, MS remains less than 150 SI × 10−5.
Fine silt dominates the minerogenic component (mostly > 40%)followed by clay (mostly 20–50%), with smaller proportions ofcoarse and medium silt (Figure 4). Sand is relatively insignificantin the core, only exceeding 10% for one sample. From unit A toG, all silt components show an overall decline with two excep-tions: (1) in unit D, where there are two minor peaks, best repre-sented in the medium silt fraction; and (2) in unit G, where thereare increases in all silt fractions, which coincide with a trough inLOI (Figure 5). Above 74 cm, there are fluctuations of far greateramplitude in all three silt size fractions, with three peaks in eachsilt fraction, although they occur at slightly different depths.
MS has a relatively strong negative correlation with LOI% (r =−0.67) but has a weak positive correlation with different silt frac-
at Universitetsbiblioteket i Bergen on February 11, 2015hol.sagepub.comDownloaded from
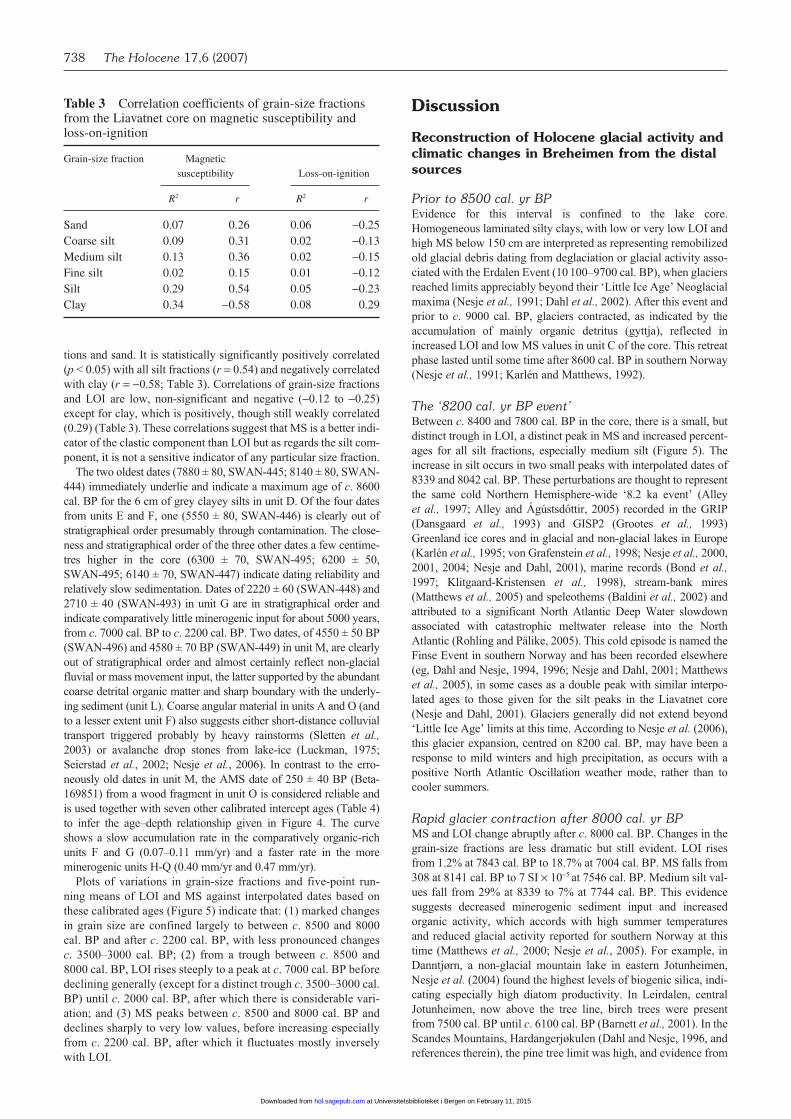
tions and sand. It is statistically significantly positively correlated(p < 0.05) with all silt fractions (r = 0.54) and negatively correlatedwith clay (r = −0.58; Table 3). Correlations of grain-size fractionsand LOI are low, non-significant and negative (−0.12 to −0.25)except for clay, which is positively, though still weakly correlated(0.29) (Table 3).These correlations suggest that MS is a better indi-cator of the clastic component than LOI but as regards the silt com-ponent, it is not a sensitive indicator of any particular size fraction.
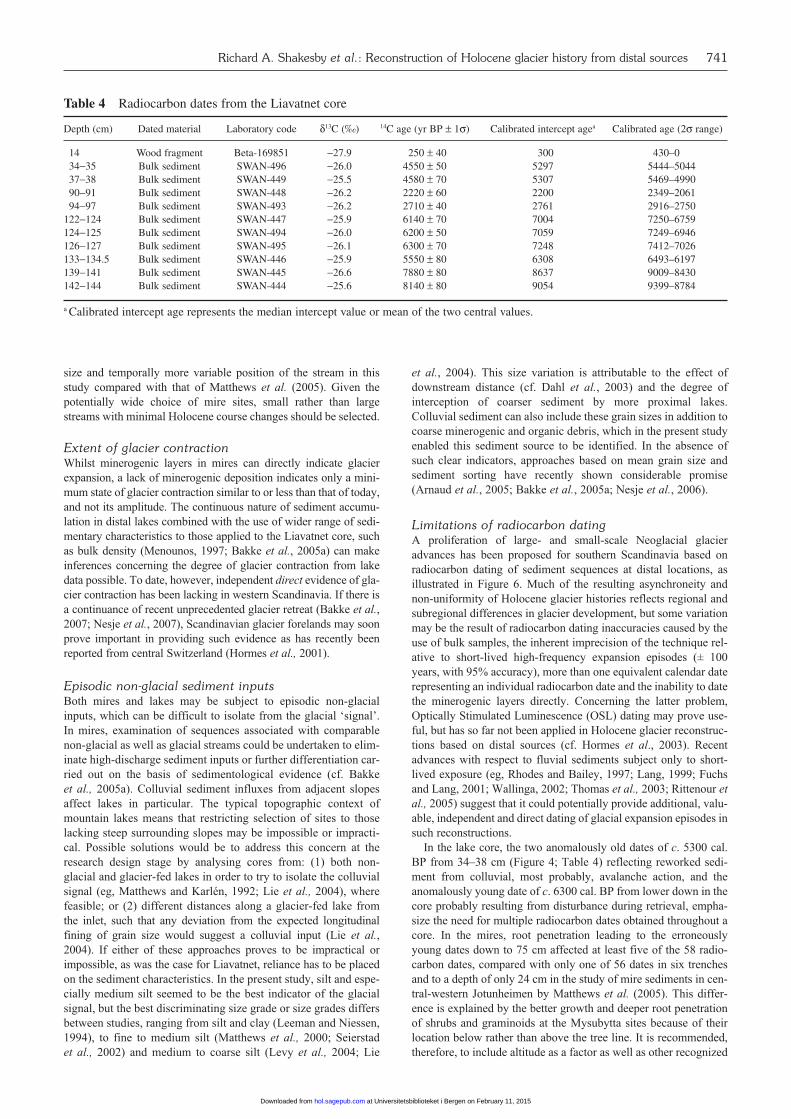
The two oldest dates (7880 ± 80, SWAN-445; 8140 ± 80, SWAN-444) immediately underlie and indicate a maximum age of c. 8600cal. BP for the 6 cm of grey clayey silts in unit D. Of the four datesfrom units E and F, one (5550 ± 80, SWAN-446) is clearly out ofstratigraphical order presumably through contamination. The close-ness and stratigraphical order of the three other dates a few centime-tres higher in the core (6300 ± 70, SWAN-495; 6200 ± 50,SWAN-495; 6140 ± 70, SWAN-447) indicate dating reliability andrelatively slow sedimentation. Dates of 2220 ± 60 (SWAN-448) and2710 ± 40 (SWAN-493) in unit G are in stratigraphical order andindicate comparatively little minerogenic input for about 5000 years,from c. 7000 cal. BP to c. 2200 cal. BP. Two dates, of 4550 ± 50 BP(SWAN-496) and 4580 ± 70 BP (SWAN-449) in unit M, are clearlyout of stratigraphical order and almost certainly reflect non-glacialfluvial or mass movement input, the latter supported by the abundantcoarse detrital organic matter and sharp boundary with the underly-ing sediment (unit L). Coarse angular material in units A and O (andto a lesser extent unit F) also suggests either short-distance colluvialtransport triggered probably by heavy rainstorms (Sletten et al.,2003) or avalanche drop stones from lake-ice (Luckman, 1975;Seierstad et al., 2002; Nesje et al., 2006). In contrast to the erro-neously old dates in unit M, the AMS date of 250 ± 40 BP (Beta-169851) from a wood fragment in unit O is considered reliable andis used together with seven other calibrated intercept ages (Table 4)to infer the age–depth relationship given in Figure 4. The curveshows a slow accumulation rate in the comparatively organic-richunits F and G (0.07–0.11 mm/yr) and a faster rate in the moreminerogenic units H-Q (0.40 mm/yr and 0.47 mm/yr).
Plots of variations in grain-size fractions and five-point run-ning means of LOI and MS against interpolated dates based onthese calibrated ages (Figure 5) indicate that: (1) marked changesin grain size are confined largely to between c. 8500 and 8000cal. BP and after c. 2200 cal. BP, with less pronounced changesc. 3500–3000 cal. BP; (2) from a trough between c. 8500 and8000 cal. BP, LOI rises steeply to a peak at c. 7000 cal. BP beforedeclining generally (except for a distinct trough c. 3500–3000 cal.BP) until c. 2000 cal. BP, after which there is considerable vari-ation; and (3) MS peaks between c. 8500 and 8000 cal. BP anddeclines sharply to very low values, before increasing especiallyfrom c. 2200 cal. BP, after which it fluctuates mostly inverselywith LOI.
Discussion
Reconstruction of Holocene glacial activity andclimatic changes in Breheimen from the distalsources
Prior to 8500 cal. yr BPEvidence for this interval is confined to the lake core.Homogeneous laminated silty clays, with low or very low LOI andhigh MS below 150 cm are interpreted as representing remobilizedold glacial debris dating from deglaciation or glacial activity asso-ciated with the Erdalen Event (10 100–9700 cal. BP), when glaciersreached limits appreciably beyond their ‘Little Ice Age’ Neoglacialmaxima (Nesje et al., 1991; Dahl et al., 2002). After this event andprior to c. 9000 cal. BP, glaciers contracted, as indicated by theaccumulation of mainly organic detritus (gyttja), reflected inincreased LOI and low MS values in unit C of the core. This retreatphase lasted until some time after 8600 cal. BP in southern Norway(Nesje et al., 1991; Karlén and Matthews, 1992).
The ‘8200 cal. yr BP event’Between c. 8400 and 7800 cal. BP in the core, there is a small, butdistinct trough in LOI, a distinct peak in MS and increased percent-ages for all silt fractions, especially medium silt (Figure 5). Theincrease in silt occurs in two small peaks with interpolated dates of8339 and 8042 cal. BP. These perturbations are thought to representthe same cold Northern Hemisphere-wide ‘8.2 ka event’ (Alleyet al., 1997; Alley and Ágústsdóttir, 2005) recorded in the GRIP(Dansgaard et al., 1993) and GISP2 (Grootes et al., 1993)Greenland ice cores and in glacial and non-glacial lakes in Europe(Karlén et al., 1995; von Grafenstein et al., 1998; Nesje et al., 2000,2001, 2004; Nesje and Dahl, 2001), marine records (Bond et al.,1997; Klitgaard-Kristensen et al., 1998), stream-bank mires(Matthews et al., 2005) and speleothems (Baldini et al., 2002) andattributed to a significant North Atlantic Deep Water slowdownassociated with catastrophic meltwater release into the NorthAtlantic (Rohling and Pälike, 2005). This cold episode is named theFinse Event in southern Norway and has been recorded elsewhere(eg, Dahl and Nesje, 1994, 1996; Nesje and Dahl, 2001; Matthewset al., 2005), in some cases as a double peak with similar interpo-lated ages to those given for the silt peaks in the Liavatnet core(Nesje and Dahl, 2001). Glaciers generally did not extend beyond‘Little Ice Age’ limits at this time. According to Nesje et al. (2006),this glacier expansion, centred on 8200 cal. BP, may have been aresponse to mild winters and high precipitation, as occurs with apositive North Atlantic Oscillation weather mode, rather than tocooler summers.
Rapid glacier contraction after 8000 cal. yr BPMS and LOI change abruptly after c. 8000 cal. BP. Changes in thegrain-size fractions are less dramatic but still evident. LOI risesfrom 1.2% at 7843 cal. BP to 18.7% at 7004 cal. BP. MS falls from308 at 8141 cal. BP to 7 SI × 10−5 at 7546 cal. BP. Medium silt val-ues fall from 29% at 8339 to 7% at 7744 cal. BP. This evidencesuggests decreased minerogenic sediment input and increasedorganic activity, which accords with high summer temperaturesand reduced glacial activity reported for southern Norway at thistime (Matthews et al., 2000; Nesje et al., 2005). For example, inDanntjørn, a non-glacial mountain lake in eastern Jotunheimen,Nesje et al. (2004) found the highest levels of biogenic silica, indi-cating especially high diatom productivity. In Leirdalen, centralJotunheimen, now above the tree line, birch trees were presentfrom 7500 cal. BP until c. 6100 cal. BP (Barnett et al., 2001). In theScandes Mountains, Hardangerjøkulen (Dahl and Nesje, 1996, andreferences therein), the pine tree limit was high, and evidence from
738 The Holocene 17,6 (2007)
Table 3 Correlation coefficients of grain-size fractionsfrom the Liavatnet core on magnetic susceptibility andloss-on-ignition
Grain-size fraction Magnetic susceptibility Loss-on-ignition
R2 r R2 r
Sand 0.07 0.26 0.06 −0.25Coarse silt 0.09 0.31 0.02 −0.13Medium silt 0.13 0.36 0.02 −0.15Fine silt 0.02 0.15 0.01 −0.12Silt 0.29 0.54 0.05 −0.23Clay 0.34 −0.58 0.08 0.29
at Universitetsbiblioteket i Bergen on February 11, 2015hol.sagepub.comDownloaded from
the Norwegian Sea indicates warm conditions (Calvo et al., 2002).The fallen large boughs and tree stumps at Mysubytta site 1 prob-ably date from early during this post-Finse Event warm interlude asthe peat layers, which have a base date of c. 7600 cal. BP, aredraped over and therefore postdate, the fossil wood (Figure 2d).
Onset of neoglaciation and minor Neoglacial glacierexpansion episodes after 7000 cal. yr BPThis interlude is represented in both the lake and stream-bank mirestratigraphies. Glacier expansion (neoglaciation) is suggested as earlyas c. 7000 cal. BP by falling LOI, but other indicators in the lake coreindicate much later expansion after c. 5000 cal. BP. At mire site 1,peat accumulation from before c. 7000 cal. BP until c. 1600–1700 cal.BP is interrupted only by two thin minerogenic layers dated to c. 3650cal. BP and c. 5600 cal. BP, which are interpreted as episodes ofshort-lived glacier expansion. Basal peat dates of c. 4150 cal. BP atsite 2 and c. 5900 cal. BP at site 3 overlying sandy silt possibly post-date similar minor Neoglacial expansion episodes, but they could alsorepresent relatively young peat overlying basal deposits.
In the lake core, LOI shows an overall decline from 18.7% at7004 to 4.6% at 2000 cal. BP and the accumulation rate is low(0.07–0.11 mm/yr). MS shows little variation during this warminterlude, possibly explained by increased diatom productiondepositing non-magnetic biogenic silica, which would explainwhy LOI fluctuates but MS remains consistently low (≤ c. 10 SI ×10−5) (cf. Nesje et al., 2004). There is little evidence from the lakecore for persistent Neoglacial expansion episodes during thisinterlude except for c. 3500 to 3000 cal. BP, which corresponds tothe distinct trough in the LOI five-point running mean and thesmall peak in the fine, and to a lesser extent the medium silt,which dates to about 3200 cal. BP (Figure 5). This may representthe same glacial expansion episode that is dated to 3650 cal. BP atmire site 1. The absence of the c. 5600 cal. BP event identified at
mire site 1 may be a result of the comparative insensitivity ofsediment accumulation in Liavatnet at least to some short-livedglacial events such as this as a result of the large volume of thelake and its more distal position relative to the mire sites.
Major Neoglacial expansion from 2200 cal. yr BPThis interlude is distinguished by relatively high-frequency,high-amplitude glacier expansions and contractions atLiavatnet. In the Liavatnet core, the sediment accumulation rateis much higher than at lower depths and there are three pro-nounced episodes of minerogenic sediment input. Their timingvaries according to LOI, MS and particle size evidence (Figure4). In Figure 5, the LOI running means form distinct troughs at1825, 1125 and, to a lesser extent, at 500 cal. BP. MS runningmeans show peaks displaced by up to 225 years at 1600, 1100and 525 cal. BP. The timing of the peaks for the different siltfractions in the lake core varies over ranges of up to c. 250years: they are 1375–1575, 775–1025 and 214–475 years. Thepresence of angular gravel in unit O and abundant coarseorganic debris in unit M (Figure 4), however, reflects the influxof locally derived material from the adjacent slopes. Careshould be taken, therefore, in placing too much reliance onthese interpolated dates, as they are based on widely spacedradiocarbon dates (Figure 4).
In contrast, two of the four stream-bank mire sites contain up toeight minerogenic layers probably indicating glacier expansionepisodes. Bracketing dates around minerogenic layers in trench 1Band at site 3 (units F and D, respectively) suggest a similar date of c.1500 cal. BP for a glacier expansion episode. The 26 cm thick unit Kat site 2 may well represent the ‘Little Ice Age’ glacier expansion (AD
1750 maximum), which was the most extensive Neoglacial expansionepisode in southern Norway for most glaciers (Matthews andShakesby, 1984; Matthews, 1991, 2005; Matthews and Briffa, 2005).
Richard A. Shakesby et al.: Reconstruction of Holocene glacier history from distal sources 739
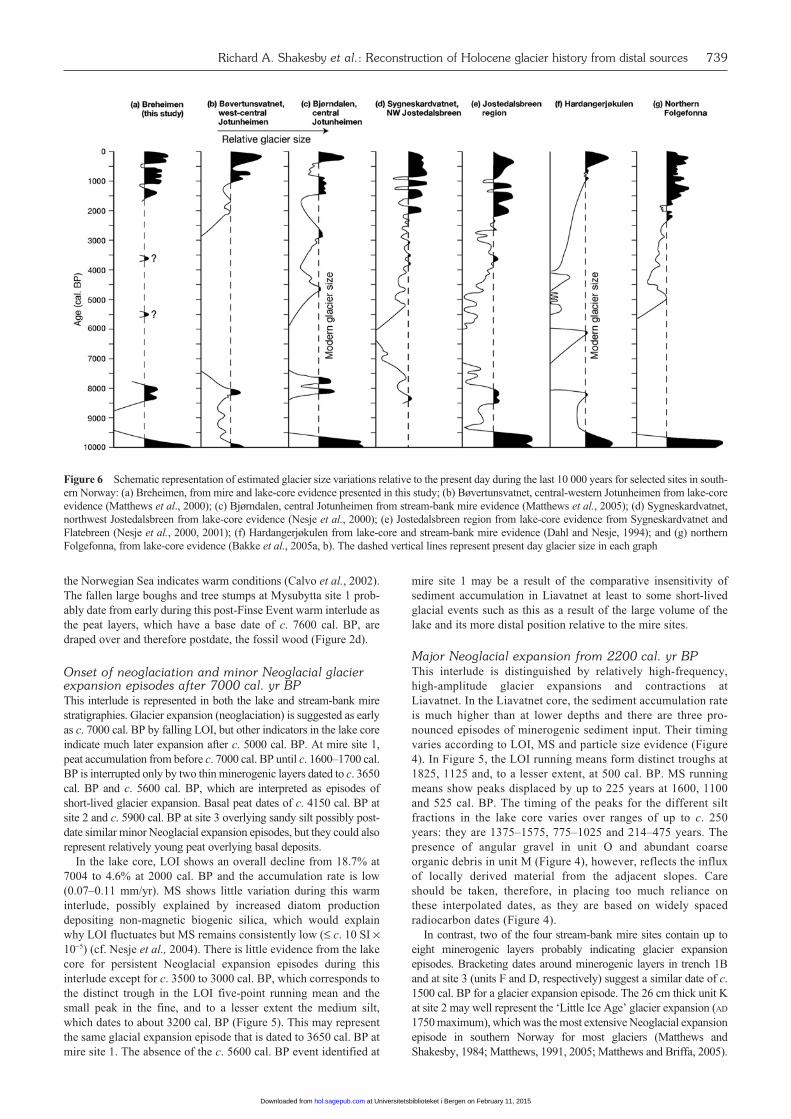
Figure 6 Schematic representation of estimated glacier size variations relative to the present day during the last 10 000 years for selected sites in south-ern Norway: (a) Breheimen, from mire and lake-core evidence presented in this study; (b) Bøvertunsvatnet, central-western Jotunheimen from lake-coreevidence (Matthews et al., 2000); (c) Bjørndalen, central Jotunheimen from stream-bank mire evidence (Matthews et al., 2005); (d) Sygneskardvatnet,northwest Jostedalsbreen from lake-core evidence (Nesje et al., 2000); (e) Jostedalsbreen region from lake-core evidence from Sygneskardvatnet andFlatebreen (Nesje et al., 2000, 2001); (f) Hardangerjøkulen from lake-core and stream-bank mire evidence (Dahl and Nesje, 1994); and (g) northernFolgefonna, from lake-core evidence (Bakke et al., 2005a, b). The dashed vertical lines represent present day glacier size in each graph
at Universitetsbiblioteket i Bergen on February 11, 2015hol.sagepub.comDownloaded from
The Liavatnet core shows complementary changes in LOI andMS representing glacier contraction from c.1000 cal. BP and last-ing until c.700 cal. BP, and coincides with the ‘Mediaeval WarmEpoch’ (MWE) (AD 800–1300 or 1150–650 cal. BP; Cronin et al.,2003). At the mire sites, there is inconsistent evidence for a pro-longed MWE.
Breheimen Holocene glacier history: regionalcomparisonsPrevious research of Breheimen Holocene glacier history from glacierforeland evidence (Winkler et al., 2003; Shakesby et al., 2004) indi-cated that: (1) most glaciers reached their Neoglacial maximum in the‘Little Ice Age’; (2) there were eight synchronous phases of ‘Little IceAge’ moraine formation; (3) the timing of the ‘Little Ice Age’ glaciermaximum varied from the fifteenth to the early nineteenth century; (4)possible pre-‘Little Ice Age’ glacier expansion was indicated fromburied organic evidence at low-altitude and relative-age dating ofmoraines at high-altitude glacier forelands. The mire and lake core evi-dence presented in this paper supports the notion of multiple ‘Little IceAge’ glacier expansion episodes in Breheimen but, more importantly,it extends our knowledge of expansion episodes back to Preborealtimes, notably those at c. 8200, c. 5600, c. 3650–3000 (combining mireand lake-core evidence) and c. 1500 cal. BP.
Comparison of the Breheimen evidence with that from elsewherein southern Norway (Figure 6) suggests a regional asynchroneity ofevents as well as similarities. All sites with evidence extending to c.10 000 cal. BP show abrupt glacier contraction for c. 1000–1500years following post-Erdalen Event deglaciation c. 9700 cal. BP.The Finse Event (c. 8200 cal. BP) is evident at most, though not allsites, and with dates in the range 8400–7700 cal. BP. It is sometimesrepresented by one and sometimes by two peaks, as with the siltcontent in the Liavatnet core (though there are only single peaks forLOI or MS). Most research outside of Norway has indicated a sin-gle event, but Ellison et al. (2006) have recently identified two dis-tinct cooling events (8490 and 8290 years ago) in the subpolarNorth Atlantic from deep-sea core sediment and Sundqvist et al.(2007) report multiple cold events from stalagmites in northwesternSweden. In contrast, only one peak represents this event in north-western Jostedalsbreen (Nesje et al., 2000). If the double silt peakdoes represent two cooling events, it may be that relatively smallglaciers in Liavatnet catchment were particularly sensitive to thisabrupt cooling event and that lake sediment accumulation was alsoresponsive to corresponding variations in suspended sedimentinputs. If so, however, this contrasts with the lack of evidence in thelake sediment for the c. 5600 cal. BP event recorded at mire site 1.
For much of c. 7500–2500 cal. BP, most sites suggest glacierswere smaller than today and probably disappeared, including theJostedalsbreen ice cap, at least for the period 7000–6000 cal. BP.The Breheimen mid-Holocene glacier history is similar to somethough not all other southern Norwegian sites. Distal lake evi-dence from central-western Jotunheimen suggested absence of themain glaciers supplying its sediment between c. 7.6 and 3 ka orpossibly later (Matthews et al., 2000; Figure 6b). In proximalstream-bank mire sites in central Jotunheimen, Matthews et al.(2005), on the other hand, report two prolonged phases of glaciergrowth and retreat over this interval peaking in 4.4 ka and 2.8 ka(Figure 6c). Distal lake evidence from northwest Jostedalsbreensuggested disappearance of this part of the ice cap from 7340 to6150 cal. BP, followed by high-frequency glacier fluctuationsaccording to Nesje et al. (2000) (Figure 6d). Other sites in south-ern Norway also suggest increasing glacial activity, though withdifferent numbers of short-lived glacial episodes (eg, Dahl andNesje, 1994; Bakke et al., 2005a) (Figures 6e–g). Peat with anage range of 8600 to 4400 cal. BP exposed close to the modernsnout of Tunsbergsdalsbreen, an eastern Jostedalsbreen outlet gla-cier (Mottershead et al., 1974; Mottershead and Collins, 1976)
indicates a glacier that was at least as small as today between thesedates. It has been argued that gradual glacier growth during themid Holocene, contrasting with early-Holocene abrupt changes,may correlate with falling sea-surface temperatures in response todecreasing summer insolation caused by orbital changes (Calvo et al., 2002; Kim et al., 2004; Bakke et al., 2005a, 2007).
Multiple glacier fluctuations of large amplitude after c. 2500 andparticularly after c. 1500 cal. BP are evident from nearly all sites insouthern Norway, for example, from Jostedalsbreen (Nesje et al.,2001), Hardangerjøkulen (Dahl and Nesje, 1994), Jotunheimen(Matthews et al., 2000, 2005) and northern Folgefonna (Bakke et al.,2005a). According to the latter authors, the fluctuations may havebeen caused by changing precipitation patterns in western Norwayassociated with unstable North Atlantic Oscillation (NAO) weatherpatterns and/or varying influence of the Russian High. Other than the‘Little Ice Age’, which is well dated from a variety of sources, theevidence differs regarding the precise timing of millennial- and cen-tennial-scale glacier expansion episodes over this period (Figure 6).Evidence for a single synchronous glacier contraction episode repre-senting the MWE is lacking from lake evidence elsewhere in south-ern Norway (eg, Dahl and Nesje, 1994; Matthews et al., 2000; Bakkeet al., 2005a) as in the Mysubytta mire sites, perhaps because thetemperature rise was accompanied by increased winter precipitationso that minor decadal-scale glacier expansion not recorded in distallakes still occurred (Bakke et al., 2005a).
Considering the timing of the onset of Neoglacial activity, theBreheimen record, like that from central Jotunheimen (Matthewset al., 2000; Figure 6b), suggests ‘suppressed’ neoglaciation, inwhich marked unequivocal glacial activity is only evident duringthe late Holocene after c. 2500 cal. BP. This contrasts with conven-tional views for southern Norway of Neoglacial expansion begin-ning c. 6000–5300 cal. BP, or broadly equal-amplitude expansionepisodes throughout the Holocene, as seems appropriate for north-ern Sweden and the European Alps (Matthews, 2006). Theseregional and subregional differences in glacier behaviour inScandinavia may well represent complex, similar-scale precipita-tion responses to a changing position of the dominant tracks ofNorth Atlantic westerlies (Bakke et al., 2007). Differences in glacierbehaviour could also be caused by one or more of the following fac-tors. First, catchment topography can affect the way glacier incep-tion and wastage respond to climatically induced changes in ELAsuch that, for example, higher elevation glaciers would be the firstto respond to falling ELA. Second, glacier morphology might affectthe signal. Rapid glacierization of a plateau caused by falling ELAmight result in a pronounced minerogenic input at distal sites,whereas for cirque and valley glaciers the input might be initiallysmall or non-existent. Third, the glacial signal could be affected bycatchment hydrology, notably the shape of the drainage networkand extent of glaciated area. Fourth, the sensitivity of glacierizedcatchments to background ‘noise’ from non-glacial sediment inputscan vary according to the prominence of these relative to glacialinputs. Finally, the location of Breheimen, intermediate between themore maritime glaciers of Jostedalsbreen, controlled largely by win-ter snow accumulation, and the more continental glaciers ofJotunheimen, controlled largely by the summer ablation season (cf.Nesje et al., 2000), may account for the different behaviour of itsglaciers as they responded to changes in the maritime–continentalgradient across southern Norway.
Methodological implications
Within-site and downstream stratigraphic variability inmiresMatthews et al. (2005) highlighted spatial variability as an impor-tant consideration when interpreting mire sequences, but that at theMysubytta sites is particularly high. This is attributed to the greater
740 The Holocene 17,6 (2007)
at Universitetsbiblioteket i Bergen on February 11, 2015hol.sagepub.comDownloaded from
size and temporally more variable position of the stream in thisstudy compared with that of Matthews et al. (2005). Given thepotentially wide choice of mire sites, small rather than largestreams with minimal Holocene course changes should be selected.
Extent of glacier contractionWhilst minerogenic layers in mires can directly indicate glacierexpansion, a lack of minerogenic deposition indicates only a mini-mum state of glacier contraction similar to or less than that of today,and not its amplitude. The continuous nature of sediment accumu-lation in distal lakes combined with the use of wider range of sedi-mentary characteristics to those applied to the Liavatnet core, suchas bulk density (Menounos, 1997; Bakke et al., 2005a) can makeinferences concerning the degree of glacier contraction from lakedata possible. To date, however, independent direct evidence of gla-cier contraction has been lacking in western Scandinavia. If there isa continuance of recent unprecedented glacier retreat (Bakke et al.,2007; Nesje et al., 2007), Scandinavian glacier forelands may soonprove important in providing such evidence as has recently beenreported from central Switzerland (Hormes et al., 2001).
Episodic non-glacial sediment inputsBoth mires and lakes may be subject to episodic non-glacialinputs, which can be difficult to isolate from the glacial ‘signal’.In mires, examination of sequences associated with comparablenon-glacial as well as glacial streams could be undertaken to elim-inate high-discharge sediment inputs or further differentiation car-ried out on the basis of sedimentological evidence (cf. Bakkeet al., 2005a). Colluvial sediment influxes from adjacent slopesaffect lakes in particular. The typical topographic context ofmountain lakes means that restricting selection of sites to thoselacking steep surrounding slopes may be impossible or impracti-cal. Possible solutions would be to address this concern at theresearch design stage by analysing cores from: (1) both non-glacial and glacier-fed lakes in order to try to isolate the colluvialsignal (eg, Matthews and Karlén, 1992; Lie et al., 2004), wherefeasible; or (2) different distances along a glacier-fed lake fromthe inlet, such that any deviation from the expected longitudinalfining of grain size would suggest a colluvial input (Lie et al.,2004). If either of these approaches proves to be impractical orimpossible, as was the case for Liavatnet, reliance has to be placedon the sediment characteristics. In the present study, silt and espe-cially medium silt seemed to be the best indicator of the glacialsignal, but the best discriminating size grade or size grades differsbetween studies, ranging from silt and clay (Leeman and Niessen,1994), to fine to medium silt (Matthews et al., 2000; Seierstadet al., 2002) and medium to coarse silt (Levy et al., 2004; Lie
et al., 2004). This size variation is attributable to the effect ofdownstream distance (cf. Dahl et al., 2003) and the degree ofinterception of coarser sediment by more proximal lakes.Colluvial sediment can also include these grain sizes in addition tocoarse minerogenic and organic debris, which in the present studyenabled this sediment source to be identified. In the absence ofsuch clear indicators, approaches based on mean grain size andsediment sorting have recently shown considerable promise(Arnaud et al., 2005; Bakke et al., 2005a; Nesje et al., 2006).
Limitations of radiocarbon datingA proliferation of large- and small-scale Neoglacial glacieradvances has been proposed for southern Scandinavia based onradiocarbon dating of sediment sequences at distal locations, asillustrated in Figure 6. Much of the resulting asynchroneity andnon-uniformity of Holocene glacier histories reflects regional andsubregional differences in glacier development, but some variationmay be the result of radiocarbon dating inaccuracies caused by theuse of bulk samples, the inherent imprecision of the technique rel-ative to short-lived high-frequency expansion episodes (± 100years, with 95% accuracy), more than one equivalent calendar daterepresenting an individual radiocarbon date and the inability to datethe minerogenic layers directly. Concerning the latter problem,Optically Stimulated Luminescence (OSL) dating may prove use-ful, but has so far not been applied in Holocene glacier reconstruc-tions based on distal sources (cf. Hormes et al., 2003). Recentadvances with respect to fluvial sediments subject only to short-lived exposure (eg, Rhodes and Bailey, 1997; Lang, 1999; Fuchsand Lang, 2001; Wallinga, 2002; Thomas et al., 2003; Rittenour etal., 2005) suggest that it could potentially provide additional, valu-able, independent and direct dating of glacial expansion episodes insuch reconstructions.
In the lake core, the two anomalously old dates of c. 5300 cal.BP from 34–38 cm (Figure 4; Table 4) reflecting reworked sedi-ment from colluvial, most probably, avalanche action, and theanomalously young date of c. 6300 cal. BP from lower down in thecore probably resulting from disturbance during retrieval, empha-size the need for multiple radiocarbon dates obtained throughout acore. In the mires, root penetration leading to the erroneouslyyoung dates down to 75 cm affected at least five of the 58 radio-carbon dates, compared with only one of 56 dates in six trenchesand to a depth of only 24 cm in the study of mire sediments in cen-tral-western Jotunheimen by Matthews et al. (2005). This differ-ence is explained by the better growth and deeper root penetrationof shrubs and graminoids at the Mysubytta sites because of theirlocation below rather than above the tree line. It is recommended,therefore, to include altitude as a factor as well as other recognized
Richard A. Shakesby et al.: Reconstruction of Holocene glacier history from distal sources 741
Table 4 Radiocarbon dates from the Liavatnet core
Depth (cm) Dated material Laboratory code δ13C (‰) 14C age (yr BP ± 1σ) Calibrated intercept agea Calibrated age (2σ range)
14 Wood fragment Beta-169851 −27.9 250 ± 40 300 430–0 34−35 Bulk sediment SWAN-496 −26.0 4550 ± 50 5297 5444–5044 37−38 Bulk sediment SWAN-449 −25.5 4580 ± 70 5307 5469–4990 90−91 Bulk sediment SWAN-448 −26.2 2220 ± 60 2200 2349–2061 94−97 Bulk sediment SWAN-493 −26.2 2710 ± 40 2761 2916–2750
122−124 Bulk sediment SWAN-447 −25.9 6140 ± 70 7004 7250–6759 124−125 Bulk sediment SWAN-494 −26.0 6200 ± 50 7059 7249–6946 126−127 Bulk sediment SWAN-495 −26.1 6300 ± 70 7248 7412–7026 133−134.5 Bulk sediment SWAN-446 −25.9 5550 ± 80 6308 6493–6197 139−141 Bulk sediment SWAN-445 −26.6 7880 ± 80 8637 9009–8430 142−144 Bulk sediment SWAN-444 −25.6 8140 ± 80 9054 9399–8784
a Calibrated intercept age represents the median intercept value or mean of the two central values.
at Universitetsbiblioteket i Bergen on February 11, 2015hol.sagepub.comDownloaded from
important considerations (eg, glacier proximity, distance fromchannel bank) when selecting mire sites for Holocene glacierreconstructions.
Conclusions(1) The glaciofluvial and glaciolacustrine sedimentary evi-
dence together with 69 radiocarbon dates provide important newdata on Holocene glacier activity in the comparatively remote andlittle-studied Breheimen region, southern Norway, which lies on asteep climatic gradient between the more maritime Jostedalsbreenand more continental Jotunheimen regions. The results comple-ment earlier reconstructions based on glacier forelands in theregion, which demonstrated the predominance of the ‘Little IceAge’ advance and, importantly, they indicate the number and tim-ing of possible small-scale glacier expansions and contractionssince early Holocene times.
(2) Our new evidence suggests that following deglaciationand relatively warm conditions in the catchment after the ErdalenEvent (c. 9700 cal. BP), glaciers expanded during the Finse Event(c. 8200 cal. BP), which may have occurred in two pulses separatedby a few hundred years according to changes in silt content in thelake core. Shortly after this expansion episode, glaciers underwentconsiderable contraction and there is evidence from mature treegrowth that some stream-bank mires dried out. From c. 7900 untilc. 2200 cal. BP, glaciers are thought to have been generally small.Possible short-lived glacier activity occurred c. 5600 and c.3650–3000 cal. BP. After c. 2200 cal. BP, the amplitude of the gla-cier expansion and contraction signal increased substantially, thelake-core evidence suggesting up to three and the mire evidence upto eight expansion episodes. The known dominance of the ‘LittleIce Age’ as the most extensive glacier advance since the ErdalenEvent is not apparent from the relative sizes of peaks or troughs ofsedimentary characteristics in the lake-core evidence.
(3) Comparison of Breheimen with other southernNorwegian glaciofluvial and glaciolacustrine evidence shows cer-tain broad similarities, including glacier contraction following theErdalen Event, the glacier advance of the Finse Event during theearly-Holocene ‘Climatic Optimum’, and a subsequent longperiod of reduced glacier size or disappearance for several thou-sand years after the Finse Event. The extensive glacier expansionepisodes after c. 2200 cal. BP are also characteristic of other mireand lacustrine sequences in southern Norway. The consensus thatneoglaciation in southern Norway began c. 6000 cal. BP or shortlyafterwards for many glaciers, however, appears to be inapplicableto Breheimen. Instead, a model of ‘suppressed’ Neoglacial sensi-tivity seems appropriate, resulting in a substantial delay in theonset of marked Neoglacial expansion until after c. 2200 cal. BP.
(4) The mire sequences differ from the more distal lakesequence as regards the type of glacial signal to which they arebest ‘tuned’: the former seem to be more sensitive to decadal andcentennial, small-scale changes compared with the longer-term,millennial to multimillennial large-scale changes in glacier sizefor the latter. Used in conjunction, the two types of evidence canprovide a more balanced view of glacier fluctuations by helping todifferentiate between a glacial signal and background noise, whichcan be difficult when relying on evidence from only one type ofdistal sedimentary source.
(5) Methodological concerns arising from this study include:dealing with large within-site and downstream differences in mirestratigraphy; determining the degree of glacier contraction betweenexpansion episodes; isolating glacial from non-glacial signals; andthe limitations of radiocarbon dates affected by non-glacial sedi-ment inputs and core disturbance in lake sediments and by rootpenetration in mire stratigraphies.
(6) We suggest the following means of solving or alleviatingthese problems: (i) selecting high-altitude mire sites adjacent,where possible, to non-glacial as well as to glacier-fed streams thatare small, and have relatively stable channel courses; (ii) restrictingselection of lakes to those lacking steep surrounding slopes toavoid non-glacial sediment influxes or, adopting coring pro-grammes aimed at isolating these influxes; and (iii) trialling addi-tional OSL dating of minerogenic layers.
Acknowledgements
The stream-bank mire trenches were excavated and sampled on theJotunheimen Research Expeditions, 1998 and 2000. Thanks are dueto the following: Nicola Jones and Anna Ratcliffe for drawing theillustrations; Alexandra Bärwaldt for assistance in the field; and theDeutsche Forschungsgemeinschaft (DFG) for enabling SW to carryout the research on this project. This paper represents University ofWales Swansea Jotunheimen Research Expeditions, Contribution No.161 and Bjerknes Centre for Climatic Research, Publication No. 168.
References
Alley, R.B. and Ágústsdóttir, A.M. 2005: The 8k event: cause andconsequences of a major Holocene abrupt climate change. QuaternaryScience Reviews 24, 1123–49.Alley, R.B., Mayewski, P.A., Sowers, T., Stuiver, M., Taylor, K.C.
and Clark, P.U. 1997: Holocene climate instability: a prominent,widespread event 8200 yr ago. Geology 25, 483–86.Andrews, J.T. 1975: Glacial systems: an approach to glaciers andtheir environments. Duxbury Press.Arnaud, F., Revel, M., Chapron, E., Desmet, M. and Tribovillard,
N. 2005: 7200 years of Rhone river flooding activity in Lake LeBourget, France: a high-resolution sediment record of NW Alpshydrology. The Holocene 15, 420–28.Aune, B. 1993: Temperatur Normaler, Normalperioder 1961–91. DenNorske Meteorologiske Institutt, 63 pp.Bakke, J., Lie, Ø., Nesje, A., Dahl, S.O. and Paasche, Ø. 2005a:Utilizing physical sediment variability in glacier-fed lakes for contin-uous glacier reconstructions during the Holocene, northernFolgefonna, western Norway. The Holocene 15, 161–76.Bakke, J., Nesje, A. and Dahl, S.O. 2005b: Lateglacial and earlyHolocene palaeoclimatic reconstruction based on glacier fluctuationsand equilibrium-line altitudes at northern Folgefonna, Hardanger,western Norway. Journal of Quaternary Science 20, 179–98.Bakke, J., Lie, Ø., Dahl, S.O., Nesje, A. and Bjune, A.E. 2007:Strength and spatial patterns of the Holocene wintertime westerlies inthe NE Atlantic region. Global and Planetary Changedoi.10.1016/j.gloplacha.2006.07.030.Baldini, J.U.L., McDermott, F. and Fairchild, I.J. 2002: Structureof the 8200-year cold event revealed by a speleothem trace elementrecord. Science 296, 2203–206.Barnett, C., Dumayne-Peaty, L. and Matthews, J.A. 2001:Holocene climatic change and tree-line response in Leirdalen, centralJotunheimen, south central Norway. Review of Palaeobotany andPalynology 117, 119–37.Battarbee, R.W., Cameron, N.G., Golding, P., Brooks, S.J.,
Switsur, R., Harkness, D., Appleby, P., Oldfield, F., Thompson,
R., Monteith, D.T. and McGovern, A. 2001: Evidence for Holoceneclimate variability from the sediments of a Scottish remote mountainlake. Journal of Quaternary Science 16, 339–46.Bond, G., Showers, W., Cheseby, M., Lotti, R., Almasi, P.,
deMenocal, P., Priore, P., Cullen, H., Hajadas, I. and Bonani, G.
1997: A pervasive millennial-scale cycle in North Atlantic Holoceneand glacial climates. Science 278, 1257–66.Boulton, G.S. 1978: Boulder shapes and grain-size distributions ofdebris as indicators of transport paths through a glacier and till gene-sis. Sedimentology 25, 773–99.
742 The Holocene 17,6 (2007)
at Universitetsbiblioteket i Bergen on February 11, 2015hol.sagepub.comDownloaded from
Calvo, E., Grimalt, J. and Jansen, E. 2002: High resolution Uk/37 seasurface temperature reconstruction in the Norwegian Sea during theHolocene. Quaternary Science Reviews 21, 1385–94.Cronin, T.M., Dwyer, G.S., Kamiya, T., Schwede, S. and Willard,
D.A. 2003: Medieval Warm Period, Little Ice Age and 20th centurytemperature variability from Chesapeake Bay. Global and PlanetaryChange 36, 17–29.Dahl, S.O. and Nesje, A. 1994: Holocene glacier fluctuations atHardangerjøkulen, central-southern Norway: a high-resolution com-posite chronology from lacustrine and terrestrial deposits. TheHolocene 4, 269–77.––— 1996: A new approach to calculating winter precipitation bycombining glacier equilibrium-line altitudes and pine-tree limits: acase study from Hardangerjøkulen, central southern Norway. TheHolocene 6, 381–98.Dahl, S.O., Bakke, J., Lie, Ø. and Nesje, A. 2003: Reconstruction offormer glacier equilibrium-line altitudes based on proglacial sites: anevaluation of approaches and selection of sites. Quaternary ScienceReviews 22, 275–87.Dahl, S.O., Nesje, A., Lie, Ø., Fjordheim, K. and Matthews, J.A.
2002: Timing, equilibrium-line altitudes and climatic implications oftwo early-Holocene glacier readvances during the Erdalen Event atJostedalsbreen, western Norway. The Holocene 12, 17–25.Dansgaard, W., Johnsen, S.J., Clausen, H.B., Dahl-Jensen, D.,
Gundestrup, N.S., Hammer, C.U., Hvidberg, C.S., Steffensen,
J.P., Sveinbjörnsdottir, A.E., Jouzel, J. and Bond, G. 1993:Evidence for general instability of past climate from a 250-kyr ice-core record. Nature 364, 218–20.Ellison, C.R.W., Chapman, M.R. and Hall, I.R. 2006: Surface anddeep ocean interactions during the cold climate event 8200 years ago.Science 312, 1929–32.Førland, E.J. 1993: Nedbørnormaler Normalperiode 1961–90. DenNorske Meteorologiske Institutt, Rapport nr 39/93, Klima.Fuchs, M. and Lang, A. 2001: OSL dating of coarse-grain fluvialquartz using single-aliquot protocols on sediments from NEPeloponnese, Greece. Quaternary Science Reviews 20, 783–87.Gibbons, A.B., Megeath, J.D. and Pierce, K.L. 1984: Probability ofmoraine survival in a succession of glacial advances. Geology 12,327–30.Griffey, N.J. and Matthews, J.A. 1978: Major Neoglacial glacierexpansion episodes in southern Norway: evidence from moraine ridgestratigraphy with 14C dates on buried palaeosols and moss layers.Geografiska Annaler 60A, 73–90.Grootes, P.M., Stuiver, M., White, J.W.C., Johnsen, J. and Jouzel,
J. 1993: Comparison of oxygen isotope records from the GISP2 andGRIP Greenland ice cores. Nature 366, 552–54.Gurnell, A.M. and Clark, M.J., editors 1987: Glacio-fluvial sedi-ment transfer: an alpine perspective. Wiley.Hallet, B., Hunter, L. and Bogen, J. 1996: Rates of erosion and sed-iment evacuation by glaciers: a review of field data and their implica-tions. Global and Planetary Change 12, 213–35.Head, K.H. 1980: Manual of soil laboratory testing, vol. 1: soil clas-sification and compaction tests. Pentech Press.Hormes, A., Müller, B.U. and Schlüchter, Ch. 2001: The Alps withlittle ice: evidence for eight Holocene phases of reduced glacier extentin the Central Swiss Alps. The Holocene 11, 255–65.Hormes, A., Preusser, F., Denton, G., Hajdas, I., Weiss, D.,
Stocker, T.F. and Schlüchter, C. 2003: Radiocarbon and lumines-cence dating of overbank deposits in outwash sediments of the LastGlacial Maximum in North Westland, New Zealand. New ZealandJournal of Geology and Geophysics 46, 95–106.Karlén, W. 1976: Lacustrine sediments and tree-limit variations asindicators of Holocene climatic fluctuations in Lappland, northernSweden. Geografiska Annaler 58A, 1–34.––— 1981: Lacustrine sediment studies. Geografiska Annaler 63A,273–81.––— 1988: Scandinavian glacier and climatic fluctuations during theHolocene. Quaternary Science Reviews 7, 199–209.Karlén, W. and Matthews, J.A. 1992: Reconstructing Holocene gla-cier variations from glacial lake sediments: studies fromNordvestlandet and Jostedalsbreen-Jotunheimen, southern Norway.Geografiska Annaler 74A 327–48.
Karlén, W., Bodin, A, Kuylenstierna, J. and Nåslund, J.-O. 1995:Climate of northern Sweden during the Holocene. Journal of CoastalResearch (Special Issue) 17, 49–54.Kim, J.-H., Rimbu, N., Lorenz, S.J., Lohmann, G., Nam, S.-I.,
Schouten, S., Rühlemann, C. and Schneider, R.R. 2004: NorthPacific and North Atlantic sea-surface temperature variability duringthe Holocene. Quaternary Science Reviews 23, 2141–54.Klitgaard-Kristensen, D., Sjerup, H.-P., Haflidson, H., Johnsen,
S. and Spurk, M. 1998: A regional 8200 calendar years BP coolingevent in northwest Europe, induced by final stages of theLaurentide ice-sheet deglaciation? Journal of Quaternary Science13, 165–69.Lang, A. 1999: The chronology of Holocene alluvial sediments fromthe Wetterau, Germany, provided by optical and 14C dating. TheHolocene 9, 207–14.Leemann, A. and Niessen, F. 1994: Holocene glacial activity and cli-matic variations in the Swiss Alps: reconstructing a continuous recordfrom proglacial lake sediments. The Holocene 4, 259–68.Leonard, E.M. 1985: Glaciological and climatic controls on lake sed-imentation, Canadian Rocky Mountains. Zeitschrift fürGletscherkunde und Glazialgeologie 21, 35–42.––— 1986: Use of lacustrine sedimentary sequences as indicators ofHolocene glacial history, Banff National Park, Alberta, Canada.Quaternary Research 26, 218–31.––— 1997: The relationship between glacial activity and sedimentproduction: evidence from a 4450-year varve record of neoglacial sed-imentation in Hector Lake, Alberta, Canada. Journal ofPaleolimnology 17, 319–30.Leonard, E.M. and Reasoner, M.A. 1999: A continuous Holoceneglacial record inferred from proglacial lake sediments in BanffNational Park, Alberta, Canada. Quaternary Research 51, 1–13.Levy, L.B., Kaufman, D.S. and Werner, A. 2004: Holocene glacierfluctuations, Waskey Lake, northeastern Ahklun Mountains, south-western Alaska. The Holocene 14, 185–93.Lie, Ø., Dahl, S.O., Nesje, A., Matthews, J.A. and Sandvold, S.
2004: Holocene fluctuations of a polythermal glacier in high-altitudeeastern Jotunheimen, central-southern Norway: a multi-site, multi-parameter approach based on lacustrine deposits. Quaternary ScienceReviews 23, 1925–45.Luckman, B.H. 1975: Drop stones from snow-avalanche depositionon lake ice. Journal of Glaciology 14, 186–88.Lutro, O. and Tveten, E. 1996: Geologisk kart over Norge,berggrunnskart Årdal M 1:250, 000. Trondheim. Norges GeologiskeUndersøkelse.Matthews, J.A. 1984: Limitations of 14C dates from buried soils inreconstructing glacier variations and Holocene climate. In: Mörner,N.-A. and Karlén, W., editors, Climatic changes on a yearly to mil-lennial basis: geological, historical and instrumental records. Reidel,281–90.––— 1985: Radiocarbon dating of surface and buried soils: principles,problems and prospects. In Richards, K.S., Arnett, R.R. and Ellis, S.,editors, Geomorphology and soils. Allen & Unwin, 269–88.––— 1991: The late Neoglacial (‘Little Ice Age’) glacial maximum insouthern Norway: new 14C-dating evidence and climatic implications.The Holocene 1, 219–33.––— 2005: ‘Little Ice Age’ glacier variations in Jotunheimen, south-ern Norway: a study in regionally controlled lichenometric dating ofrecessional moraines with implications for climate and lichen growthrates. The Holocene 15, 1–19.––— 2006: Neoglaciation in Europe. In Elias, S.A., editor,Encyclopedia of Quaternary science. Elsevier, 1122–33.Matthews, J.A. and Briffa, K.R. 2005: The ‘Little Ice Age’: re-eval-uation of an evolving concept. Geografiska Annaler 87A, 17–36.Matthews, J.A. and Dresser, P.Q. 1983: Intensive 14C dating of aburied palaeosol horizon. Geologiska Föreningens in StockholmFörhandlingar 105, 59–63.Matthews, J.A. and Karlén, W. 1992: Asynchronous neoglaciationand Holocene climatic change reconstructed from Norwegian glacio-lacustrine sedimentary sequences. Geology 20, 991–94.Matthews, J.A. and Shakesby, R.A. 1984: The status of the ‘Little IceAge’ in southern Norway: relative-age dating of Neoglacial moraineswith Schmidt hammer and lichenometry. Boreas 13, 333–46.
Richard A. Shakesby et al.: Reconstruction of Holocene glacier history from distal sources 743
at Universitetsbiblioteket i Bergen on February 11, 2015hol.sagepub.comDownloaded from
Matthews, J.A., Dahl, S.O., Nesje, A., Berrisford, M.S. andAndersson, C. 2000: Holocene glacier variations in centralJotunheimen, southern Norway based on distal glaciolacustrine sedi-ment cores. Quaternary Science Reviews 19, 1625–47.Matthews, J.A., Berrisford, M.S., Nesje, A., Dahl, S.O., Bjune, A.E.,
Bakke, J., Birks, J.B., Lie, Ø. Dumayne-Peaty, L. and Barnett, C.
2005: Holocene glacier history of Bjørnbreen and climatic reconstruc-tion in central Jotunheimen, Norway, based on proximal glaciofluvialstream-bank mires. Quaternary Science Reviews 24, 67–90.Menounos, B. 1997: The water content of lake sediments and its rela-tionship to other physical parameters: an alpine case study. TheHolocene 7, 207–12.Moen, A. 1998: Nasjonalatlas for Norge: vegetasjon. StatensKartverk.Mottershead, D.N. and Collins, R.L. 1976: A study of Flandrian gla-cier fluctuations in Tunsbergdalen, southern Norway. NorskGeologisk Tidsskrift 56, 413–36.Mottershead, D.N., Collins, R.L. and White, I.D. 1974: Two radio-carbon dates from Tunsbergdal. Norsk Geologisk Tidsskrift 54, 131–34.Nesje, A. 1992: A piston corer for lacustrine and marine sediments.Arctic and Alpine Research 24, 257–59.Nesje, A. and Dahl, S.O. 1991a: Late Holocene glacier fluctuations inBevringsdalen, Jostedalsbreen region, western Norway (c. 3200–1400BP). The Holocene 1, 1–7.––— 1991b: Holocene glacier variations at Blåisen, Hardangerjø-kulen, central southern Norway. Quaternary Research 35, 25–40.––— 2001: The Greenland 8200 cal. yr BP event detected in loss-on-ignition profiles in Norwegian lacustrine sediment sequences. Journalof Quaternary Science 16, 155–66.Nesje, A., Kvamme, M., Rye, N. and Løvlie, R. 1991: Holocene gla-cial and climate history of the Jostedalsbreen region, western Norway:evidence from lake sediments and terrestrial deposits. QuaternaryScience Reviews 10, 87–114.Nesje, A., Dahl, S.O., Løvlie, R. and Sulebak, J.R. 1994: Holoceneglacier activity at the southwestern part of Hardangerjøkulen, centralsouthern Norway: evidence from lacustrine sediments. The Holocene4, 377–82.Nesje, A., Dahl, S.O. and Løvlie, R. 1995: Late Holocene glaciersand avalanche activity in the Ålfotbreen area, western Norway evi-dence from a lacustrine sedimentary record. Norsk GeologiskTidsskrift 75, 120–26.Nesje, A., Dahl, S.O., Andersson, C. and Matthews, J.A. 2000: Thelacustrine sedimentary succession in Sygneskardvatnet, westernNorway: a continuous, high-resolution record of the Jostedalsbreen icecap during the Holocene. Quaternary Science Reviews 19, 1047–65.Nesje, A., Matthews, J.A., Dahl, S.O., Berrisford, M.S. and Andersson,
C. 2001: Holocene glacier fluctuations of Flatebreen and winter-precipita-tion changes in the Jostedalsbreen region, western Norway, based onglaciolacustrine sediment records. The Holocene 11, 267–80.Nesje, A., Dahl, S.O. and Lie, Ø. 2004: Holocene millennial-scalesummer temperature variability inferred from sediment parameters ina non-glacial mountain lake: Danntjørn, Jotunheimen, central south-ern Norway. Quaternary Science Reviews 23, 2183–205.Nesje, A., Eystein, J., Birks, H.J.B., Bjune, A.E., Bakke, J.,
Andersson, C., Dahl, S.O., Klitgaard Kristensen, D., Lauritzen, S.-
E., Lie, Ø., Risebrobakken, B. and Svendsen, J.-I. 2005: Holocene cli-mate variability in the northern North Atlantic region: a review ofterrestrial and marine evidence. In Drange, H., Furevik, T., Gerdas, R.and Berger, W., editors, The Nordic Seas: an integrated perspective.Geophysical Monograph Series 158, American Geophysical Union,289–321.Nesje, A., Bjune, A.E., Bakke, J., Dahl, S.O., Lie, Ø. and Birks,
H.J.B. 2006: Holocene palaeoclimate reconstructions atVanndalsvatnet, western Norway, with particular reference to the8200 cal. yr BP event. The Holocene 16, 717–29.Nesje, A., Bakke, J., Dahl, S.O., Lie, Ø. and Matthews, J.A. 2007:Norwegian mountain glaciers in the past, present and future. Globaland Planetary Change doi 10.1016/j.gloplacha.2006.08.004.Nicolussi, K. and Patzelt, G. 2000: Discovery of early Holocenewood and peat on the forefield of the Pasterze Glacier, Eastern Alps,Austria. The Holocene 10, 191–99.
Ohlendorf, C. 1999: High alpine lake sediments as chronicles forregional glacier and climate history in the upper Engadine, south-eastern Switzerland. Shaker Verlag.Østrem, G., Selvig, K.D. and Tandberg, K. 1988: Atlas over Breer iSør-Norge. Norges Vassdrags- og Energiverk Vassdragsdirektoratet,180 pp.Porter, S.C. 1975: Equilibrium line altitudes of late Quaternary glaciersin the Southern Alps, New Zealand. Quaternary Research 5, 27–47.Porter, S.C. and Orombelli, G. 1985: Glacier contraction during themiddle Holocene in the western Italian Alps: evidence and implica-tions. Geology 13, 296–98.Rhodes, E.J. and Bailey, R.A. 1997: The effect of thermal transfer onthe zeroing of the luminescence of quartz from recent glaciofluvialsediments. Quaternary Science Reviews 16, 291–98.Rittenour, T.M., Goble, R.J. and Blum, M.D. 2005: Development ofan OSL chronology for Late Pleistocene channel belts in the lowerMississippi valley, USA. Quaternary Science Reviews 24, 2539–54.Rohling, E.J. and Pälike, H. 2005: Centennial-scale climate coolingwith a sudden cold event around 8,200 years ago. Nature 434, 975–79.Röthlisberger, F. 1986: 10000 Jahre Gletschergeschichte der Erde.Verlag Sauerländer, 416 pp.Sandgren, P. and Risberg, J. 1990: Magnetic mineralogy of the lakesin Lake Ådran, eastern Sweden, and an interpretation of earlyHolocene water level changes. Boreas 19, 57–68.Seierstad, J., Nesje, A., Dahl, S.O. and Simonsen, J.R. 2002: Holoceneglacier fluctuations of Grovabreen and Holocene snow-avalanche activ-ity reconstructed from lake sediments in Grøningstølsvatnet, westernNorway. The Holocene 12, 211–22.Shakesby, R.A., Matthews, J.A. and Winkler, S. 2004: Glacier vari-ations in Breheimen, southern Norway: relative-age dating ofHolocene moraine complexes at six high-altitude glaciers. TheHolocene 14, 899–910.Sigmond, E.M.O., Gustavson, M. and Roberts, D. 1984:Berggrunnskart over Norge. Målestokk 1:1 million. NorgesGeologiske Undersøkelse (map).Sletten, K., Blikra, L.H., Ballantyne, C.K., Nesje, A. and Dahl,
S.O. 2003: Holocene debris flows recognized in a lacustrine sedimen-tary succession: sedimentology, chronostratigraphy and cause of trig-gering. The Holocene 13, 907–20.Smith, J.G. 2002: Reconstructing glacier variations from glaciolacus-trine sediments: a new approach using modern analogues in southernNorway. Unpublished Ph.D. thesis, University of Wales.––— 2003: Aspects of the loss-on-ignition (LOI) technique in the con-text of clay-rich, glaciolacustrine sediments. Geografiska Annaler85A, 91–97.Snowball, I.F. and Sandgren, P. 1996: Lake sediment studies ofHolocene glacial activity in the Kårsa valley, northern Sweden: con-trasts in interpretation. The Holocene 6, 367–72.Snowball, I. and Thompson, R. 1990: A mineral magnetic study ofHolocene sedimentation in Lough Catherine, Northern Ireland. Boreas19, 127–46.Snowball, I., Sandgren, P. and Petterson, G. 1999: The mineralmagnetic properties of an annually laminated Holocene lake sedimen-tary sequence in northern Sweden. The Holocene 9, 353–62.Souch, C. 1994: A methodology to interpret downvalley lake sedi-ments as records of neoglacial activity – Coast Mountains, BritishColumbia, Canada. Geografiska Annaler 76A, 169–85.Stuiver, M., Reimer, P.J., Bard, E., Beck, J.W., Burr, G.S.,
Hughen, K.A., Kromer, B., McCormac, F.G., van der Plicht, J.
and Spurk, M. 1998: INTCAL 98: radiocarbon age calibration24000–0 cal BP. Radiocarbon 40, 1041–83.Sundqvist, H.S., Holmgren, K. and Lauritzen, S.-E. 2007: Stableisotope variations in stalagmites from northwestern Sweden documentclimate and environmental change during the early Holocene. TheHolocene 17, 259–67.Thomas, P.J., Murray, A.S. and Sandgren, P. 2003: Age limit andage underestimation using different OSL signals from lacustrinequartz and polymineral fine grains. Quaternary Science Reviews 22,1139–43.Torsnes, I., Rye, N. and Nesje, A. 1993: Modern and Little Ice Ageequilibrium-line altitudes on outlet glaciers from Jostedalsbreen,
744 The Holocene 17,6 (2007)
at Universitetsbiblioteket i Bergen on February 11, 2015hol.sagepub.comDownloaded from

western Norway: an evaluation of different approaches to their cal-culation. Arctic and Alpine Research 25, 106–16.Von Grafenstein, U., Erlenkeuser, H., Müller, J., Jouzel, J. andJohnsen, S. 1998: The cold event 8200 years ago documented in oxy-gen isotope records of precipitation in Europe and Greenland. ClimateDynamics 14, 73–81.
Wallinga, J. 2002: Optically-stimulated luminescence dating offluvial deposits: a review. Boreas 31, 303–22.Winkler, S., Matthews, J.A., Shakesby, R.A. and Dresser, P.Q.
2003: Glacier variations in Breheimen, southern Norway: dating LittleIce Age moraine sequences at seven low-altitude glaciers. Journal ofQuaternary Science 18, 395–413.
Richard A. Shakesby et al.: Reconstruction of Holocene glacier history from distal sources 745
at Universitetsbiblioteket i Bergen on February 11, 2015hol.sagepub.comDownloaded from
Top Related
Copyright © 2022 FDOKUMEN

