


Bahasa
Halaman
Hukum

International Journal of Pharmaceutics 475 (2014) 428–437
Pharmaceutical nanotechnology
Raman spectroscopy for in-line and off-line quantification of poorlysoluble drugs in strip films
Jun Zhang a, Ye Ying c, Barbara Pielecha-Safira b, Ecevit Bilgili a, Rohit Ramachandran d,Rodolfo Romañach e, Rajesh N. Davé a,**, Zafar Iqbal c,*aDepartment of Chemical, Biological, and Pharmaceutical Engineering, New Jersey Institute of Technology, Newark, NJ 07102, USAbWallington Public School, Pine Street, Wallington, NJ 07057, USAcDepartment of Chemistry and Environmental Science, New Jersey Institute of Technology, Newark, NJ 07102, USAdDepartment of Chemical and Biochemical Engineering, Rutgers University, Piscataway, NJ 08854, USAeDepartment of Chemistry, University of Puerto Rico, Mayagüez Campus, Puerto Rico, USA
A R T I C L E I N F O
Article history:Received 27 December 2013Received in revised form 20 August 2014Accepted 26 August 2014Available online 27 August 2014
Keywords:Raman spectroscopyCalibration modelStrip filmsIn-line drug concentration monitoringPrincipal component analysis
A B S T R A C T
Raman spectroscopy was used as a process analytical technology (PAT) tool for in-line measurement ofactive pharmaceutical ingredient (API) content during continuous manufacturing of strip filmscontaining nanoparticles of poorly water-soluble APIs. Fenofibrate and naproxen were used as modelAPIs, whose concentrations ranged from 3% to 26% (w/w) in the model calibration. For both in-line andoff-line measurements, calibration models employed partial least square (PLS) analysis, yieldingcorrelation coefficients (R2) greater than 0.9946 and root mean squared error of calibration (RMSEC) ofabout 0.44%, indicating the validity and accuracy of the calibration. The robustness of Ramanspectroscopy as a PAT tool was established by considering three processing parameters after substrateinterference correction: sensing location, substrate speed and film thickness. Calibration models for eachAPI were validated using a separate batch of strip films by predicting the API concentrations to within�1.3%. Principal component analysis (PCA) was used to explain the interactions between processingvariables and calibration models, which suggest that besides API concentration, film thickness could alsobe monitored using Raman spectroscopy. The results demonstrate the potential of Raman spectroscopyas an effective PAT tool for novel strip film manufacturing process, facilitating detection of drug form andconcentration in real-time.
ã 2014 Elsevier B.V. All rights reserved.
Contents lists available at ScienceDirect
International Journal of Pharmaceutics
journa l home page : www.e l sev ier .com/ loca te / i jpharm
1. Introduction
This paper examines Raman spectroscopy as an in-line processanalytical technology (PAT) tool for monitoring the production ofpoorly water-soluble drug particle loaded thin films, manufac-tured through continuous casting over a moving substrate.Biocompatible polymeric strip film technology has emerged asa promising platform for drug delivery due to its high potential forpatient compliance, continuous processing and cost-effectivemanufacturing (Cilurzo et al., 2008; Dixit and Puthli, 2009). It hasalso been recently shown to be an excellent dosage form forenhancing the dissolution of poorly water-soluble drugs byincorporating them as crystalline nanoparticles or microparticlesin contrast to conventional solvent-casting (Dixit and Puthli,
* Corresponding author. Tel.: +1 973 596 8571; fax: +1 973 596 3586.** Corresponding author. Tel.: +1 973 596 5860; fax: +1 973 642 7088.
E-mail addresses: [email protected] (R.N. Davé), [email protected] (Z. Iqbal).
http://dx.doi.org/10.1016/j.ijpharm.2014.08.0510378-5173/ã 2014 Elsevier B.V. All rights reserved.
2009; Sievens-Figueroa et al., 2012a; Susarla et al., 2013).Although there are many papers addressing various aspects ofpharmaceutical strip film design, formulation and applications(see e.g., Dixit and Puthli, 2009), as well as processing anddissolution testing (Sievens-Figueroa et al., 2012a,b; Susarla et al.,2013) the topic of in-line monitoring for process control andquality assurance has not been explored. Due to their virtuallytwo-dimensional format and their production in a continuousprocess, strip films offer easy incorporation of PAT tools, forging apathway toward quality-by-design. In this regard, previous workhas explored use of off-line near-IR chemical imaging todetermine drug distribution within films (Sievens-Figueroaet al., 2012a; Susarla et al., 2013). On the other hand, use ofin-line Raman spectroscopy, which has not been explored forstrip films, may offer additional benefits due to its ability to detectdrug crystallinity and form. Therefore, the use of Ramanspectroscopy is studied here for detecting the drug content,which can allow for in-line assessment of potency of the filmscontaining nanoparticles of poorly water-soluble drugs.
J. Zhang et al. / International Journal of Pharmaceutics 475 (2014) 428–437 429
Particle size reduction is a popular method for improving thebioavailability of BCS (Biopharmaceutical Classification System)Class II drugs, which have poor water solubility (Brown et al., 2004;Liversidge and Cundy, 1995; Singh et al., 2012; Yu et al., 2002).Among various techniques of particle size reduction reported inthe past few decades (Aulton and Wells, 2002), wet stirred mediamilling has become of great interest due to the efficiency by whichdrug nanoparticles and microparticles are produced (Afolabi et al.,2014; Merisko-Liversidge et al., 2003). Significant recent researchon the production and characterization of drug nanosuspensionswith various stabilizers such as polymers and surfactants will beleveraged in the present study (Beck et al., 2013; Bhakay et al.,2013, 2014; Bilgili and Afolabi, 2012; Dalvi et al., 2013; Heinz et al.,2009; Monteiro et al., 2013). Drug nanosuspensions, formed viamedia milling, have been used in diverse dosage forms where theirsmall size and increased surface area may lead to an increaseddissolution rate and bioavailability (Patravale and Kulkarni, 2004).Generally, a solid dosage form is preferred due to patientpreference, ease of administration, and long-term physical stabilityissues associated with the nanosuspensions (Van Eerdenbrughet al., 2008). However, preparation of solid dosage forms entailsdrying of nanosuspensions, which may lead to nanoparticleagglomeration, poor redispersion, and slow recovery of primarynanoparticles during redispersion and dissolution testing (Bhakayet al., 2013; Hu et al., 2011). In order to address these issues, in thiswork, drug nanoparticles are incorporated into a biocompatible,edible polymer strip film, taking advantage of such recentlydemonstrated phenomena as avoiding irreversible agglomeration,thereby retaining the large surface area of the nanoparticles(Sievens-Figueroa et al., 2012a; Susarla et al., 2013).
Pharmaceutical products must meet strict specifications whichoften require time-consuming, expensive and inefficient off-linetesting on randomly collected samples to evaluate the end productquality. In order to improve product quality through processdesign, multiple PAT tools have been developed to provide in-lineand real-time process information that allows for monitoring ofprocessing variables and prediction of product quality (FDA andCVM, 2004). Raman spectroscopy is one such PAT tool which canobserve molecular vibrations and rotations, as well as latticemodes in solid molecular systems (Pelletier, 1999). It has beendemonstrated as a useful non-destructive method to monitorpharmaceutical manufacturing because it can provide detailed in-line processing information about the active pharmaceuticalingredient (API) (Michelet et al., 2013). It is also a promising tool
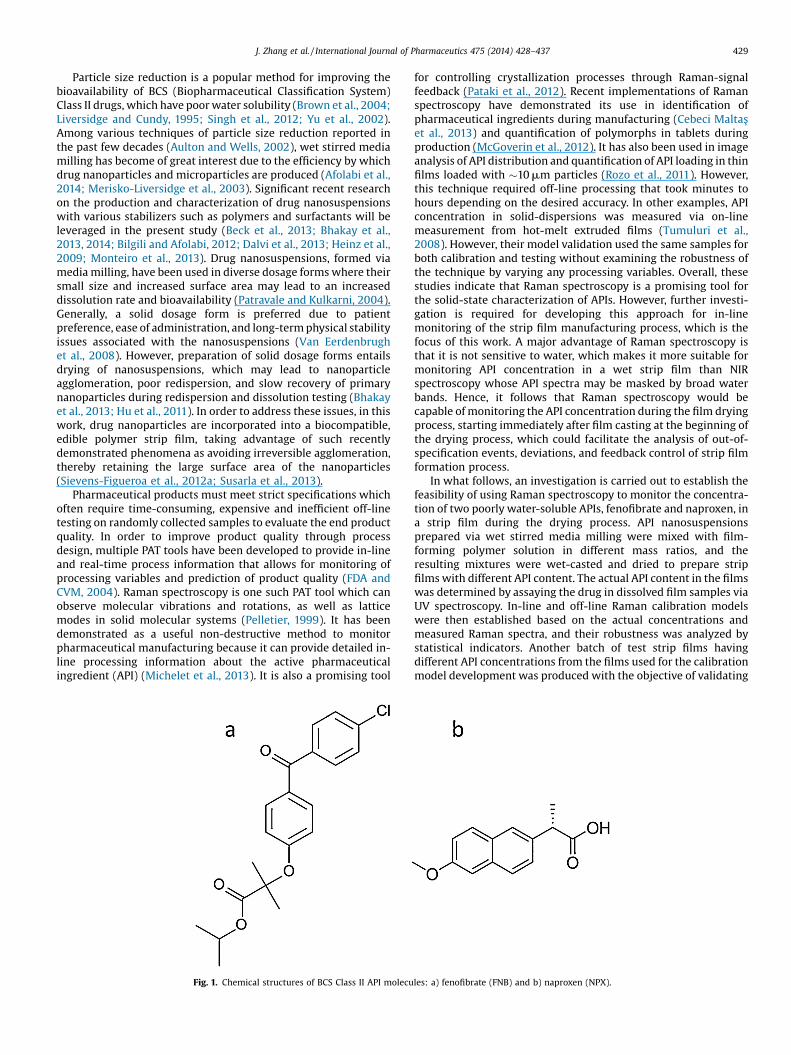
Fig. 1. Chemical structures of BCS Class II API molecu
for controlling crystallization processes through Raman-signalfeedback (Pataki et al., 2012). Recent implementations of Ramanspectroscopy have demonstrated its use in identification ofpharmaceutical ingredients during manufacturing (Cebeci Maltaşet al., 2013) and quantification of polymorphs in tablets duringproduction (McGoverin et al., 2012). It has also been used in imageanalysis of API distribution and quantification of API loading in thinfilms loaded with �10 mm particles (Rozo et al., 2011). However,this technique required off-line processing that took minutes tohours depending on the desired accuracy. In other examples, APIconcentration in solid-dispersions was measured via on-linemeasurement from hot-melt extruded films (Tumuluri et al.,2008). However, their model validation used the same samples forboth calibration and testing without examining the robustness ofthe technique by varying any processing variables. Overall, thesestudies indicate that Raman spectroscopy is a promising tool forthe solid-state characterization of APIs. However, further investi-gation is required for developing this approach for in-linemonitoring of the strip film manufacturing process, which is thefocus of this work. A major advantage of Raman spectroscopy isthat it is not sensitive to water, which makes it more suitable formonitoring API concentration in a wet strip film than NIRspectroscopy whose API spectra may be masked by broad waterbands. Hence, it follows that Raman spectroscopy would becapable of monitoring the API concentration during the film dryingprocess, starting immediately after film casting at the beginning ofthe drying process, which could facilitate the analysis of out-of-specification events, deviations, and feedback control of strip filmformation process.
In what follows, an investigation is carried out to establish thefeasibility of using Raman spectroscopy to monitor the concentra-tion of two poorly water-soluble APIs, fenofibrate and naproxen, ina strip film during the drying process. API nanosuspensionsprepared via wet stirred media milling were mixed with film-forming polymer solution in different mass ratios, and theresulting mixtures were wet-casted and dried to prepare stripfilms with different API content. The actual API content in the filmswas determined by assaying the drug in dissolved film samples viaUV spectroscopy. In-line and off-line Raman calibration modelswere then established based on the actual concentrations andmeasured Raman spectra, and their robustness was analyzed bystatistical indicators. Another batch of test strip films havingdifferent API concentrations from the films used for the calibrationmodel development was produced with the objective of validating
les: a) fenofibrate (FNB) and b) naproxen (NPX).

Table 1API concentrations of strip films containing FNB and NPX prepared from sampleswith different nanosuspension–polymer solution ratios (measured by directassaying via UV spectroscopy).
Sample Nanosuspension(g)
Polymersolution (g)
FNB referenceconcentration(w/w %)
NPX referenceconcentration(w/w %)
Group A 20 20 26.0 23.0Group B 20 30 19.6 15.8Group C 10 20 15.8 12.5Group D 10 35 9.9 7.1Group E 5 40 4.7 2.8
430 J. Zhang et al. / International Journal of Pharmaceutics 475 (2014) 428–437
the established in-line calibration model. Subsequently, calibrationmodels were also developed for different process parameters suchas substrate speed, probe location and casting thickness. principalcomponent analysis (PCA) was applied to explain the variation inRaman spectra as influenced by API concentration, processparameters and within-sample variation in the Raman spectrum.The study of different process parameters, along with the PCAinterpretation of the data, allows us to demonstrate the robustnessof in-line Raman spectroscopy for monitoring API concentrationand possibly film thickness.
2. Materials and methods
2.1. Preparation of nanosuspension and polymer solution
Two BCS Class II APIs, fenofibrate (FNB; Jai Radhe Sales) andnaproxen (NPX; Medisia), were used in this study. Their molecularstructures are shown in Fig. 1. Sodium dodecyl sulfate (SDS;Sigma–Aldrich) and hydroxypropyl methyl cellulose (HPMC;Methocel E15LV from Dow Chemical) were used as stabilizersduring wet media milling. HPMC (E15LV) and polyvinylpyrrolidone(PVP; K90 from Sigma–Aldrich) were used as film formers, andglycerin (Sigma–Aldrich) was used as the plasticizer.
Preparation of stable API nanosuspensions with a combinationof cellulose-based polymers and anionic surfactants in a wetstirred media milling process has been discussed elsewhere(Bhakay et al., 2011, 2013; Bilgili and Afolabi, 2012; Monteiroet al., 2013; Sievens-Figueroa et al., 2012a). In the present study,two API nanosuspensions consisting of 8.85% (w/w) FNB and NPX,respectively, 2.21% (w/w) HPMC and 0.44% (w/w) SDS, were
Fig. 2. Schematic of the laboratory scale process use
prepared. A polymer solution consisting of 75% (w/w) water,10% (w/w) HPMC, 10% (w/w) PVP and 5% (w/w) glycerin wasprepared by mixing the components at 80–90 �C, and the mixturewas cooled down to room temperature (around 20 �C) prior to stripfilm preparation.
For each API, five mixtures of the respective nanosuspensionsand polymer solution mentioned above were prepared asprecursor film suspensions with the objective of developing aRaman spectroscopic calibration model for the films. Theformulations for these five mixtures (Groups A–E) are presentedin Table 1. The nanosuspension and polymer solution were mixedfor 3 h by a dual-propeller mixer (McMaster) with a motor (VWRInternational), and the mixture was allowed to equilibrate at restuntil bubbles completely disappeared. Although the same nano-suspension and polymer solution formulations were used for eachAPI, the mass ratio of API nanosuspension-to-polymer solution wasvaried to prepare samples (mixtures) and resulting films withdifferent API content.
2.2. Strip film formation process
The schematic of the strip film formation process is shown inFig. 2. The entire process was conducted using precision tapecasting equipment (Model TC-71LC, HED International Inc.), wherethe substrate roller (IX in Fig. 2) was attached to a motor (BaldorElectric), which allowed the strip film to be moved forward alongwith a 15 cm wide Mylar substrate. The doctor blade (Model 3700from Elcometer Instruments) was used to hold the preparedmixture and extruded wet film on the surface of the Mylarsubstrate with a specific thickness controlled by the aperture.The drying began right after the wet film entered the dryingchamber (I in Fig. 2). The 2-m long drying chamber consists ofthree zones as shown in Fig. 2: Zone 1 (II), Zone 2 (III) and Zone 3(IV). The temperature of each zone can be manipulated indepen-dently to heat the bottom surface of the wet film, while counter-flowing air drawn in and out of the chamber by a blower (ModelDayton 1TDP3) and passed through an air heater (ModelBHN717N10S-24 from Watlow) heats the top surface of the filmand removes moisture. Three windows (VI in Fig. 2) are available tomonitor the drying process using specific sensors, for example, afiber optic Raman probe.
For the baseline process, wet film thickness, substrate speed,and drying temperatures were fixed and the API concentrations
d for the preparation of drug-loaded strip films.

J. Zhang et al. / International Journal of Pharmaceutics 475 (2014) 428–437 431
used are shown in Table 1. Five samples (i.e., Group A, B, C, D and Ereferred in Table 1) were cast at a wet thickness of 500 mm with asubstrate speed of 0.17 cm/s and the temperature set at 50 �C in allthree zones (i.e., Zones I, II and III). Since the in-line Ramanspectroscopy is ultimately intended for real-time monitoring of theAPI content in wet films during drying, the spectra were collectedwhile the film was still drying. The typical amount of time requiredto partially dry the film was 19.6 min, which is the residence timein the drier. In the present work, the selection of dryingtemperature of 50 �C and thinner wet film thickness permitted arelatively short residence time while assuring that possible heat-induced degradation of the physical and chemical properties of thestrip film would be avoided. As a reference, a strip film with1000 mm wet thickness loaded with drug nanoparticles required aslong as 80 min to dry at 40 �C to the desired moisture end-point(Susarla et al., 2013). All strip films together with the substrateswere collected after coming out of the drying chamber, and weredried further at room temperature (approximately 20 �C) until theycould be peeled off the substrate. These strip films were labeledand sealed in polyethylene bags for further analysis.
In order to validate the calibration models of FNB and NPX,another batch of strip films was produced. Using the aforemen-tioned baseline process conditions, but with different mass ratiosof nanosuspension-to-polymer solution from those reported inTable 1, allowed us to prepare films with API concentrationsdifferent from the baseline films. These strip films served as testsamples for Raman spectroscopy in contrast to the previous set offilms that were used for calibration. For each API, four sampleswere prepared with different concentrations than those used forthe development of the calibration model.
In the second part of the study, NPX in-line calibration modelswere established for three process scenarios different than thebaseline process (see Table 2), while using the API formulationspresented in Table 1. Substrate speed, probe location and casting orwet film thickness were considered because they are key processparameters that may impact how the drying process is monitored.For the three scenarios, the parameters were adapted fromthe baseline values based on the one-factor-at-a-time (OFAT)approach. The selection of these three process parameters can berationalized as follows: all parameters affect the water content thatimpacts the composition of the films, which might be reflected inthe Raman spectra. Raising the substrate speed will lead to higherwater content in the film at a given location in the drier because thedrying time is shorter (e.g., increasing the substrate speed from0.17 to 0.37 cm/s reduced the drying time from 19.6 min to 9 min).Likewise, at any given position in the drier, a thick wet film willhave more water content than a thin wet film under the sameoperating conditions. Obviously, more water is present in the wetfilm earlier in the drying process (e.g., the film is not as dry in Zone2 as in Zone 3). While the water evaporation rate is mainly affectedby the flow rate of hot air and the temperature of the three zones,these process parameters were not investigated and are outsidethe scope of the current study. As mentioned before, the
Table 2Operation settings of 3 scenarios for naproxen.
Substratespeed (cm/s)
Castingthickness (mm)a
Location of opticprobe
Scenario1
0.17 500 Zone 2
Scenario2
0.37 500 Zone 3
Scenario3
0.17 1000 Zone 3
a Casting thickness indicates aperture of the doctor blade.
temperature was set at 50 �C, while the hot air flow rate was setat the same value as in a previous study (Susarla et al., 2013).
To investigate the impact of different process parameters oncalibration model development, principal component analysis(PCA), was used to reduce the dimensionality of the data from thethree process scenarios (Abdi and Williams, 2010). The percentageof difference between Raman spectra explained by changes in thethree process parameters in the respective scenarios could allowfor refinement of the baseline calibration model once the processparameters are varied.
2.3. Drug content measurement via direct assaying
The actual API concentrations in the films were determined basedon drug assaying via off-line UV spectroscopy. These concentrations,hereafter referred to as reference concentrations, were subsequentlyused for the calibration model development and validation(Section 2.4). For FNB and NPX containing films, the drug assaymeasurement via UV spectroscopy was already developed and usedas a standard procedure (Sievens-Figueroa et al., 2012a). In order todetermine the drug assay, round strip film samples were punchedout from awholefilmbya hole punch (McMaster, US; I.D. 3/8 in.). Thefilm thickness and weight were measured by a micrometer(McMaster, US) and an analytical balance (ML, Mettler Toledo,US), respectively. After these measurements, each sample (n = 3) wasdissolved in 250 mL SDS solution (5.4 mg/mL) using a magnetstirring plate (RT5, IKA, US) for 6 h. Finally, an aliquot from thissolution was taken to measure the absorption at a specificwavelength, i.e., 290 nm for FNB and 272 nm for NPX, by a UVspectrometer (EvolutionTM300, Thermo Scientific). The absorbancewas then converted into the API concentration via establishedcalibration curves of absorbance vs. concentration.
2.4. In-line and off-line Raman spectroscopy and development ofcalibration model
For both in-line and off-line measurements, Raman spectros-copy was performed with an EZ Raman system from EnwaveOptronics Inc. equipped with a fiber optic probe consisting of a785 nm laser, emitting with a total power of 250 mW, capable ofmeasuring Raman lines with frequencies ranging from 102 to3300 cm�1 with 2 cm�1 resolution, and operating at a workingdistance of 7 mm from the top surface of the film. The equipment'ssoftware, EZ Raman Reader from Enwave Optronics Inc. was usedfor data acquisition.
For in-line measurements, the fiber optic probe was located inZone 3 (see Fig. 1). Spectral scanning involved three consecutivescans at 10 s exposure each of the moving strip film. Similar settingwas also applied for the validation experiments. For off-linemeasurements, the strip film was cut into small rectangles andexamined with the EZ Raman system coupled to an opticalmicroscope (Leica BME) using a 10� objective with 10 mm spotsize. The laser beam was focused on the samples prior to eachmeasurement, and 10 s exposures each of the strip film at 5 randomlyselected locations were used for the acquisition of Raman data.All spectral data were analyzed using the Unscrambler1 X version10.3-software from CAMO. For Raman spectral analysis, the standardnormal variate (SNV) method was used as the pre-treatment whichhas been widely accepted for eliminating the differences caused byvariations of the baseline and spurious data generated by laserintensity fluctuations (Barnes et al., 1989). The partial least square(PLS) model was employed for regression analysis of the Ramanspectra. In order to assess the calibration model, three statisticalparameters, namely, the correlation coefficient (R2), root meansquared error of cross validation (RMSECV) and root mean squarederror of calibration (RMSEC), were used. The RMSECV indicatesthe standard error generated by leave-one-out cross validation

Fig. 3. Raman spectra of the five FNB strip films with different drug loading, Mylar substrate and pure FNB powder. The left panel shows the Raman spectra in thewavenumber range of 102–3300 cm�1 that are offset along the intensity axis to enhance clarity. The right panel shows the Raman spectra in the wavenumber range of1024–1550 cm�1 (see the boxed region in the left panel, but without offset along the intensity axis), which were actually used for the development of the calibration model. Inthe wavenumber range of 1024–1550 cm�1, notable Raman lines at 1092 cm�1 and 1148 cm�1 appeared from the FNB strip films and pure FNB powder due to presence of FNB,whereas no obvious Raman line appeared due to Mylar.
432 J. Zhang et al. / International Journal of Pharmaceutics 475 (2014) 428–437
(Rencher and Christensen, 2012), and RMSEC is a standard errorcalculated from the calibration data (Orzel et al., 2012; Stauden-mayer et al., 2012).
3. Results and discussion
3.1. Quantification of reference concentrations
The API concentrations, also referred to as reference concen-trations, in the strip films were measured using the procedurediscussed in Section 2.3 by direct assaying via UV spectroscopy andare presented in Table 1. They were only used for the developmentof the calibration models. Table 1 indicates that the use of lowermass ratios of API nanosuspension-to-polymer solution in themixture indeed yielded strip films with lower API concentrations,which was intended during the preparation step. The concentra-tion difference between FNB and NPX for the same mass ratio ofdrug nanosuspension-to-polymer solution is most likely caused bythe unknown amount of water lost during preparation of thenanosuspension and polymer solution as well as potential druginhomogeneity in the mixtures. For the current investigation, themaximum API loading was kept at 26% (w/w) to assure good filmquality because it was found that higher API concentration resulted
Fig. 4. Raman spectra of the five NPX strip films, Mylar substrate and pure NPX powder. Tthat are offset along the intensity axis to enhance clarity. The right panel shows the Ramanpanel, but without offset along the intensity axis), which were actually used for the develoRaman lines at 410 cm�1, 524 cm�1 and 742 cm�1 appeared from the NPX strip films an
in poor film quality due to an insufficient amount of polymer forfilm formation. Future studies will consider higher drug loadingsfor the refinement of the calibration model.
3.2. Interpretation of Raman spectra
Since the laser beam can easily penetrate the wet film duringspectra collection, the Raman spectra would also include thecontribution from the substrate, which is Mylar in this case. Figs. 3and 4 illustrate the in-line spectra of the FNB and NPX films,respectively, along with those of Mylar and the as-received APIs.The different colors indicate the spectra of the strip films withdifferent API concentrations. For Mylar, which is composed ofpolyethylene terephthalate (PET), two strong lines at 1602 and1730 cm�1 assigned to the n(CQO) stretching mode of PET areobserved. However, since carbonyl groups are present in bothFNB and NPX (see Fig. 2), lines associated with the n(CQO)stretching mode also exist in the Raman spectra of FNB and NPX. Toeliminate the interference due to Mylar, Raman spectra in the1024–1550 cm�1 and 350–780 cm�1 regions for FNB and NPX,respectively, were studied. For FNB, two lines at 1092 and1148 cm�1 assigned to the n(C��O) mode (Saerens et al., 2011)were analyzed, whereas for NPX, three lines, which can be assigned
he left panel shows the Raman spectra in the wavenumber range of 102–3300 cm�1
spectra in the wavenumber range of 350–780 cm�1 (see the boxed region in the leftpment of the calibration model. In the wavenumber range of 350–780 cm�1, notabled pure NPX powder, whereas no obvious Raman line appeared due to Mylar.
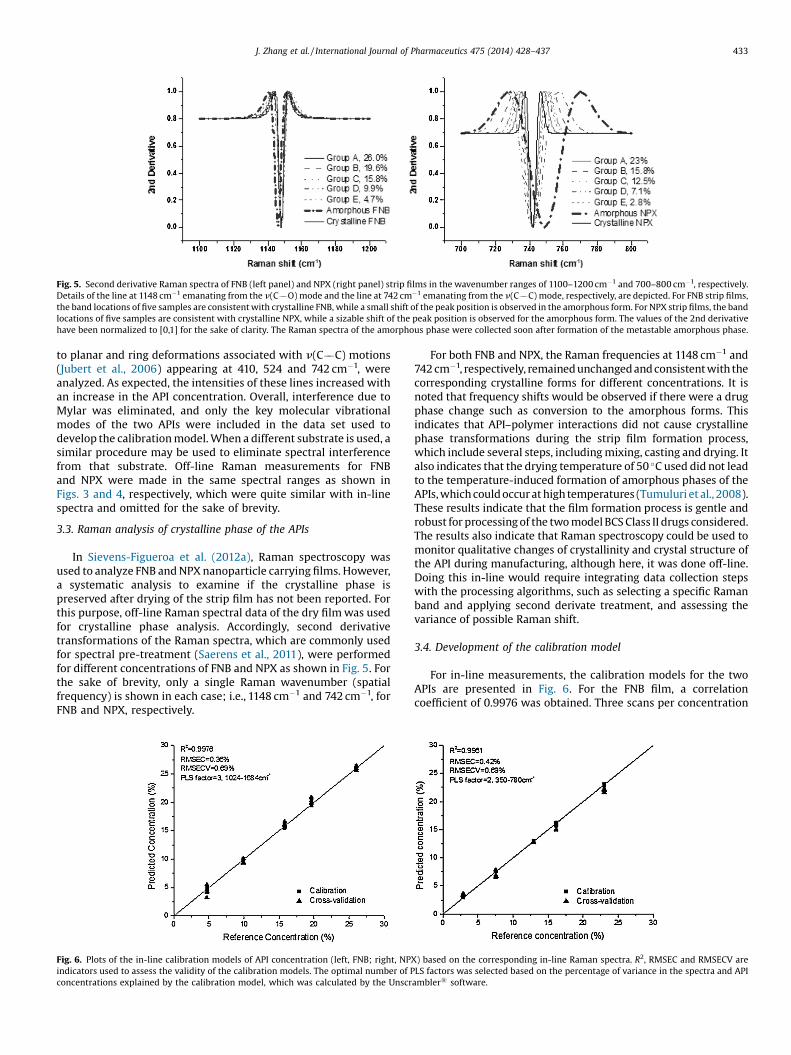
Fig. 5. Second derivative Raman spectra of FNB (left panel) and NPX (right panel) strip films in the wavenumber ranges of 1100–1200 cm�1 and 700–800 cm�1, respectively.Details of the line at 1148 cm�1 emanating from the n(C��O) mode and the line at 742 cm�1 emanating from the n(C��C) mode, respectively, are depicted. For FNB strip films,the band locations of five samples are consistent with crystalline FNB, while a small shift of the peak position is observed in the amorphous form. For NPX strip films, the bandlocations of five samples are consistent with crystalline NPX, while a sizable shift of the peak position is observed for the amorphous form. The values of the 2nd derivativehave been normalized to [0,1] for the sake of clarity. The Raman spectra of the amorphous phase were collected soon after formation of the metastable amorphous phase.
J. Zhang et al. / International Journal of Pharmaceutics 475 (2014) 428–437 433
to planar and ring deformations associated with n(C��C) motions(Jubert et al., 2006) appearing at 410, 524 and 742 cm�1, wereanalyzed. As expected, the intensities of these lines increased withan increase in the API concentration. Overall, interference due toMylar was eliminated, and only the key molecular vibrationalmodes of the two APIs were included in the data set used todevelop the calibration model. When a different substrate is used, asimilar procedure may be used to eliminate spectral interferencefrom that substrate. Off-line Raman measurements for FNBand NPX were made in the same spectral ranges as shown inFigs. 3 and 4, respectively, which were quite similar with in-linespectra and omitted for the sake of brevity.
3.3. Raman analysis of crystalline phase of the APIs
In Sievens-Figueroa et al. (2012a), Raman spectroscopy wasused to analyze FNB and NPX nanoparticle carrying films. However,a systematic analysis to examine if the crystalline phase ispreserved after drying of the strip film has not been reported. Forthis purpose, off-line Raman spectral data of the dry film was usedfor crystalline phase analysis. Accordingly, second derivativetransformations of the Raman spectra, which are commonly usedfor spectral pre-treatment (Saerens et al., 2011), were performedfor different concentrations of FNB and NPX as shown in Fig. 5. Forthe sake of brevity, only a single Raman wavenumber (spatialfrequency) is shown in each case; i.e., 1148 cm�1 and 742 cm�1, forFNB and NPX, respectively.
Fig. 6. Plots of the in-line calibration models of API concentration (left, FNB; right, NPXindicators used to assess the validity of the calibration models. The optimal number of Pconcentrations explained by the calibration model, which was calculated by the Unscr
For both FNB and NPX, the Raman frequencies at 1148 cm�1 and742 cm�1, respectively, remained unchanged and consistent with thecorresponding crystalline forms for different concentrations. It isnoted that frequency shifts would be observed if there were a drugphase change such as conversion to the amorphous forms. Thisindicates that API–polymer interactions did not cause crystallinephase transformations during the strip film formation process,which include several steps, including mixing, casting and drying. Italso indicates that the drying temperature of 50 �C used did not leadto the temperature-induced formation of amorphous phases of theAPIs, which could occur at high temperatures (Tumuluri et al., 2008).These results indicate that the film formation process is gentle androbust for processing of the two model BCS Class II drugs considered.The results also indicate that Raman spectroscopy could be used tomonitor qualitative changes of crystallinity and crystal structure ofthe API during manufacturing, although here, it was done off-line.Doing this in-line would require integrating data collection stepswith the processing algorithms, such as selecting a specific Ramanband and applying second derivate treatment, and assessing thevariance of possible Raman shift.
3.4. Development of the calibration model
For in-line measurements, the calibration models for the twoAPIs are presented in Fig. 6. For the FNB film, a correlationcoefficient of 0.9976 was obtained. Three scans per concentration
) based on the corresponding in-line Raman spectra. R2, RMSEC and RMSECV areLS factors was selected based on the percentage of variance in the spectra and APIambler1 software.

Fig. 7. Plots of the off-line calibration models of API concentration (left, FNB; right, NPX) based on the corresponding off-line Raman spectra. R2, RMSEC and RMSECV areindicators used to assess the validity of the calibration models. The optimal number of PLS factors was selected based on the percentage of variance in the spectra and APIconcentrations explained by the calibration model, which was calculated by the Unscrambler1 software.
Table 3Validation of FNB and NPX in-line Raman calibration models using a different batchof strip films.
API Referenceconcentrationa
(w/w %)
Predicted concentrationb
(w/w %), n = 3Standard deviation(%), n = 3
FNB (PLSfactor:3)
14.1 15.0 0.7119.2 19.3 1.157.5 8.5 0.5317.4 18.7 0.62
NPX (PLSfactor:2)
14.6 15.6 0.7619.1 19.7 1.677.3 7.7 0.8617.5 18.7 0.92
a Determined from drug assaying of the films, which were not used in the Ramancalibration, via UV spectroscopy.
b Predicted using established in-line Raman calibration model.
434 J. Zhang et al. / International Journal of Pharmaceutics 475 (2014) 428–437
were used for the development of the calibration model, and themodel was assessed with a RMSEC of 0.36% and a RMSECV of 0.69%.For the NPX film, three scans per concentration were used, and acorrelation coefficient of 0.9961, RMSEC of 0.42% and RMSECV of0.69% were obtained.
Fig. 7 presents the calibration models that are based on off-linemeasurements for the two APIs. Five scanning results were usedfor the calibration model, so each group of points includes fivemeasurements for each reference concentration of the APIs. For theFNB film, the RMSEC, RMSECV and correlation coefficient were0.44%, 0.73% and 0.9946, respectively. For the NPX films, a stronglinear relationship was observed by the correlation coefficient,RMSEC and RMSECV values of 0.9969, 0.36% and 1.1%, respectively.
It is important to note that the Raman spectra of in-line andoff-line measurements were collected in different contexts: in-linespectra were collected from a moving strip film with partialresidual water content and contained various background noiseincluding some from Mylar substrate despite the minimizationowing to the selection of a specific segment of the Raman spectra,whereas off-line spectra were collected from a static dry strip film.Hence, the quality of the off-line calibration model is expected tobe better than that for the in-line. Nevertheless, based on theresults shown in Figs. 6 and 7, the correlation coefficients andRMSECs generated from in-line and off-line measurements weresimilar, indicating good linearity of response throughout thecalibration range. This suggests that the scattering cross-sectionvariations caused by different residual water contents withinin-line and off-line samples will not significantly impact thecalibration models. It also suggests that specific segments of theRaman spectra, i.e., from 1024 cm�1 to 1550 cm�1 and from350 cm�1 and 780 cm�1 for FNB and NPX, respectively, can be usedto calibrate the API concentration accurately.
The optimal number of PLS factors, i.e., the number of latentvariables, presented in Figs. 6 and 7, was selected based on thepercentage of variance in the spectra and API concentrationsexplained by the calibration model, which was calculated by theUnscrambler1 software. The in-line PLS factors (3 for FNB and 2 forNPX) are similar to those utilized in the Raman calibration modelsused for monitoring API concentration during hot melt extrusion(HME) process (Saerens et al., 2011; Tumuluri et al., 2008). Adifference between off-line and in-line calibration models wasobserved for the RMSECV values of NPX calibration models, i.e.,1.1% and 0.69%. This finding is counterintuitive as the off-linecalibration model is expected to be better than the in-linecalibration model due to the more stable environment of spectracollection in the former. The difference may be explained based onthe scale of scrutiny used for the determination of the API
concentration by Raman spectroscopy. The off-line spectrarepresented the NPX concentration of five random 10 mm spots,whereas the in-line spectra represented the averaged NPXconcentration within the area of 10 mm by 17 mm, which isobviously much larger than the 10 mm spots used for off-lineanalysis. A larger scale of scrutiny may have led to lower RMSECVof the in-line calibration model despite the non-stationary natureof the film. RMSECV of the off-line calibration models suggests thatthe relative standard deviation of FNB is better than that of NPX,whereas the in-line models suggest identical RMSECV for bothdrugs. This difference between the in-line and off-line models mayalso originate from the different scales of scrutiny and moving vs.stationary nature of the films during the spectra collection.
3.5. Validation of calibration models
The validation results are given in Table 3, where the referenceconcentration is that of the dry film quantified by direct assayingvia UV spectroscopy (Section 2.3), the predicted concentration isthe one calculated by projection of the in-line Raman spectracollected during the strip film formation onto the correspondingin-line calibration models. The optimal number of PLS factors were3 and 2 for FNB and NPX, respectively. The prediction involvedthree samples and corresponding standard deviation values areprovided in Table 3.
The validation results suggest that the calibration modelsdeveloped under the baseline process conditions can accuratelymonitor the API concentration in-line during the strip filmformation process. Since accurate predictions were observed, it

J. Zhang et al. / International Journal of Pharmaceutics 475 (2014) 428–437 435
is reasonable that any sample with concentration ranging from 7.2to 19.2% (w/w) can be accurately predicted by the calibrationmodels, and it is expected that to a first approximation, thecalibration models would also be valid for the whole referenceconcentration range, i.e., 2.6 to 26% (w/w).
3.6. Impact of process parameters on Raman spectroscopic monitoringof API concentration
In order to examine how changes in the processing conditionscan impact the calibration models, the in-line calibration modelsfor NPX in three process scenarios, which are different from thebaseline process, were considered (refer to Table 2). Thesecalibration models are used not only to confirm the capability ofRaman spectroscopy for quantifying the API concentration underdifferent process conditions, but also to help better understand thestrip film formation process, especially that of drying. At first, thesame NPX calibration model that was obtained from the baselineprocess was utilized to predict the API concentration from each ofthe Raman spectra collected from the three process scenarios(Fig. 6). Significant errors in the prediction of API concentrationswere observed because the water contents in these differentprocess scenarios are different. Different wet film thicknesses andworking distances from the laser source may impact thepenetration and scattering of the light beam at the same setting,ultimately causing a variation of the Raman spectral intensities.
To alleviate this problem, a new calibration model for each ofthe three process scenarios was developed in the same way as forthe baseline process by collecting the Raman spectra and using themeasured reference concentrations of the API in the films via drugassay using UV spectroscopy. For these new models, the correlationcoefficients (R2) were all greater than 0.9937 for both in-line andoff-line data, and the RMSECs were all less than 0.54%,demonstrating predictive capability. Thus overall, these resultsindicate the validity of the proposed methodology and that a newin-line calibration model should be established and re-validatedonce the operating conditions have been changed, which is alsorequired as per PAT guidance (FDA and CVM, 2004).
3.7. PCA analysis of the impact of process parameters on Ramanspectra
In order to interpret the Raman spectra, three components wereconsidered: API concentration, process parameters and within-sample variation in the Raman spectrum. The first two are highlyrelevant to the use of Raman for the film process monitoring,whereas the last one gives a measure of relative error in spectraldata. In order to sort out the weight of each of the threecomponents with regard to the interpretation of the variations ofRaman spectra, PCA analysis was implemented via transitivecomparison. Within-sample variations of the Raman spectrum andprocess parameters were analyzed first to determine their weightin explaining the Raman spectrum under identical API concentra-tion. Then, the variations of the Raman spectra were evaluatedwhen both the API concentration, and one of three processparameters were varied. Based on these results, the impact of thethree processing parameters and API concentration on thecalibration models can be quantified. The PCA results are givenin Fig. 8 where the ellipse shown in all figures is indicative of themultivariate 95% confidence interval for the spectral variance, andthe percentages of the first two principal components (factors), i.e.,PC-1 and PC-2, were computed by Unscrambler1 X, and theirdefinitions in each PCA result are explained below. The notationemployed for the panels within Fig. 8, is as follows; 1, 2, and3 represent variation in the process parameters, specifically, probelocation, substrate speed, and wet film thickness, respectively;
whereas, within each scenario 1, 2, and 3, “a” represents fixed APIconcentration, while “b” represents varying API concentration.
First, the influence of three process parameters is examined forfixed API concentration (Group A). PCA results for different locationsof the fiber optic probe are shown in Fig. 8, panel 1a. Here, 61% of theRaman spectral variance could be explained by the first majorcomponent, i.e., PC-1. We can infer that in this case, PC-1 mainlyrepresents different probe locations, while PC-2 mainly representswithin-sample spectral variation, accounting for 22%. This indicatesthat the spectral variation is greater between Zone 2 and Zone 3(different probe locations) than for the samples obtained within oneof the zones. This means that the differences between locations arehighly evident. The PCA score plot (Fig. 8 panel 1a) also shows thatscores from Zone 3 are very close together which is indicative ofsimilarity in spectra, indicating that intrinsic error is low comparedto the variation in the process parameter, probe location. Similarresults were obtained from the scenarios for the remaining twoprocess parameters; substrate speeds and wet film thicknesses andare shown in Fig. 8, panels 2a and 3a, respectively. For example, panel3a shows that scores from the 500 mm and 1000 mm lie on differentsides of PC-1, indicating spectral differences that are from thicknessvariation. The PCA score plot also shows that Raman spectra areaffected by film thickness, indicating the feasibility of predicting filmthickness, which will be discussed further through the results frompanel 3b. Overall, the results from panels 1a, 2a, and 3a, suggest thatthe process parameters would have greater influence in interpretingthe Raman spectra than within-sample spectral variation, as long asthe API concentration is fixed. On the other hand, when the processconditions arethesame,onewouldexpectthattheAPIconcentrationwould influence a greater proportion of the Raman spectra thanwithin-sample spectrum variation (Saerens et al., 2011). Therefore,next, the API concentrations are also changed.
PCA was used to evaluate spectral changes when bothconcentration and processing parameters are varied, and theresults are shown in the b panels of Fig. 8. For the spectra obtainedfrom Zones 2 and 3 (Fig. 8, panel 1b), PC-1 accounts for 79% of thevariance in the Raman spectra, whereas PC-2 accounts for only 6%.Here, it may be inferred that PC-1 mainly represents the differentAPI concentrations, and PC-2 mainly represents different locations.For the same API concentration, different locations would havevarying water content but similar concentrations of API particlesper cross-sectional segment of a film. Since Raman spectroscopywould be only weakly sensitive to the n(O��H) stretching vibrationof water (McGoverin et al., 2012; Shi et al., 2012), it is expected thatthe spectra would arise mainly from the API particles, but stillwould be impacted by residual water content, e.g., 6% of Ramanspectral variations. Similar results were obtained from the scenarioof different substrate speeds (Fig. 8, panel 2b). The PC-1,representing API concentration, accounts for 77% of the variancein the Raman spectra, while PC-2, representing different substratespeeds accounts for only 8%. Interestingly, the trends seen in theresults for different thicknesses do not follow that observed in theprevious two cases. That is because the number of API particles percross-sectional segment is different from that reflected in thespectra (Fig. 8, panel 3b), where PC-1, which here representsmainly the thickness, determines 51% of Raman spectral variations,and PC-2, representing the API concentration, determines 32%. Thisis an interesting and important outcome that suggests that Ramanspectroscopy could also be used to monitor the film thickness sincethe thickness of API loaded film contributed more significantly tothe Raman spectral variation than the API concentration did. Theseresults have also been validated using the K-mean cluster for groupanalysis. For example, the spectra from samples of differentthicknesses (Fig. 8, panel 3b) can be isolated into two groups, eachrepresenting one thickness, whereas the spectra from differentlocations and substrate speeds cannot be similarly isolated. These

Fig. 8. PCA of the in-line calibration spectra of NPX strip films obtained from three process scenarios involving different probe locations (1a, 1b), different substrate speeds(2a, 2b), and different wet film thicknesses (3a, 3b). Panels “a” are for fixed API concentration (Group A), while “b” for varying API concentration (Groups A–E in Table 1). Eachdata point corresponds to a different Raman spectrum. The ellipse is indicative of the multivariate 95% confidence interval for the spectral variance. The percentage of spectralvariance explained by the first two principal components, i.e., PC-1 and PC-2, were computed by Unscrambler1 X. Capital and lowercase letters for a group label denote thesame formulation and API concentration, but are designated for the two different values of each process parameter.
436 J. Zhang et al. / International Journal of Pharmaceutics 475 (2014) 428–437
results also address the explanation in Section 3.6 that calibrationmodel should be revalidated once the operating conditions havebeen changed, which is in line with FDA recommendations.
4. Conclusions
This study demonstrates that Raman spectroscopy is anattractive PAT tool for monitoring the strip film manufacturingprocess with respect to in-line quantification of API concentration.All the RMSECs obtained were less than 0.6%, demonstrating goodaccuracy of the calibration models. The off-line results supportedthe in-line measurements, which indicated that the partialsegments of the Raman spectra used to avoid interference fromthe substrate spectrum and residual water content provideaccurate quantification of the API concentrations in the stripfilms. The results also suggest that in-line Raman spectroscopy is
an efficient PAT approach for monitoring API concentration since itallows the user to avoid repetitious sample preparation and tomake measurements in real-time. The evaluations conducted on aseparate batch of strip films enabled us to validate the calibrationmodel and to demonstrate that the API concentration can beaccurately predicted. These findings suggest that Raman spectros-copy would be a suitable PAT tool to implement feedback controlstrategy in continuous manufacturing of strip films throughmonitoring of API concentration. In addition, Raman spectroscopyis also able to detect possible changes in the solid-state of the API.
The calibration models established by varying three differentoperating conditions confirmed the applicability of the methodol-ogy and the capability of Raman spectroscopy for API concentra-tion monitoring during the drying process. In addition, thisexercise demonstrated that the in-line calibration model must berevalidated once the operating conditions have been changed; a

J. Zhang et al. / International Journal of Pharmaceutics 475 (2014) 428–437 437
protocol that is in line with the FDA guidelines. The PCA analysis ofthree process scenarios demonstrated that Raman spectroscopy isnot only a flexible tool for monitoring the API concentration in-lineunder different operating conditions, but also may be used to gainprocess understanding. From the process control perspective, thePCA results indicated that the film thickness could also bemonitored by Raman spectroscopy, although the substrate speedwould require an extra sensor for control implementation. It wasevident that the Raman spectrometer can be installed at anylocation of the strip film formation process for the purpose ofquantifying the API concentration in-line. Thus overall, this workdemonstrates the potential of Raman spectroscopy as an effectivePAT tool for strip film manufacturing process through facilitatingdetection of drug concentration and form in real-time.
Acknowledgments
The authors acknowledge financial support of this workthrough an NSF-Engineering Research Center award(EEC-0540855), as well as support for BPS through an NSF-RETaward (EEC-0908889). The authors are grateful to Scott Krull for hismeticulous editing of the manuscript.
References
Abdi, H., Williams, L.J., 2010. Principal component analysis. Wiley Interdiscip. Rev.Comput. Stat. 2, 433–459.
Afolabi, A., Akinlabi, O., Bilgili, E., 2014. Impact of process parameters on thebreakage kinetics of poorly water-soluble drugs during wet stirred mediamilling: a microhydrodynamic view. Eur. J. Pharm. Sci. 51, 75–86.
Aulton, M.E., Wells, T., 2002. Pharmaceutics: The Science of Dosage Form Design.Churchill Livingstone, London.
Barnes, R., Dhanoa, M., Lister, S.J., 1989. Standard normal variate transformation andde-trending of near-infrared diffuse reflectance spectra. Appl. Spectrosc. 43,772–777.
Beck, C., Sievens-Figueroa, L., Gärtner, K., Jerez-Rozo, J.I., Romañach, R.J., Bilgili, E.,Davé, R.N., 2013. Effects of stabilizers on particle redispersion and dissolutionfrom polymer strip films containing liquid antisolvent precipitated griseofulvinparticles. Powder Technol. 236, 37–51.
Bhakay, A., Merwade, M., Bilgili, E., Dave, R.N., 2011. Novel aspects of wet milling forthe production of microsuspensions and nanosuspensions of poorly water-soluble drugs. Drug Dev. Ind. Pharm. 37, 963–976.
Bhakay, A., Davé, R., Bilgili, E., 2013. Recovery of BCS Class II drugs during aqueousredispersion of core–shell type nanocomposite particles produced via fluidizedbed coating. Powder Technol. 236, 221–234.
Bhakay, A., Azad, M., Bilgili, E., Dave, R., 2014. Redispersible fast dissolvingnanocomposite microparticles of poorly water-soluble drugs. Int. J. Pharm. 461,367–379.
Bilgili, E., Afolabi, A., 2012. A combined microhydrodynamics–polymer adsorptionanalysis for elucidation of the roles of stabilizers in wet stirred media milling.Int. J. Pharm. 439, 193–206.
Brown, C.K., Chokshi, H.P., Nickerson, B., Reed, R.A., Rohrs, B.R., Shah, P.A., 2004.Dissolution testing of poorly soluble compounds. Pharm. Technol. 28, 56–65.
Cebeci Maltaş, D., Kwok, K., Wang, P., Taylor, L.S., Ben-Amotz, D., 2013. Rapidclassification of pharmaceutical ingredients with Raman spectroscopy usingcompressive detection strategy with PLS-DA multivariate filters. J. Pharm.Biomed. Anal. 80, 63–68.
Cilurzo, F., Cupone, I.E., Minghetti, P., Selmin, F., Montanari, L., 2008. Fast dissolvingfilms made of maltodextrins. Eur. J. Pharm. Biopharm. 70, 895–900.
Dalvi, S.V., Azad, M.A., Dave, R., 2013. Precipitation and stabilization of ultrafineparticles of fenofibrate in aqueous suspensions by RESOLV. Powder Technol.236, 75–84.
Dixit, R., Puthli, S., 2009. Oral strip technology: overview and future potential. J.Control. Release 139, 94–107.
FDA, U., CVM, O., 2004. U.S. Department of Health and Human Services, Food andDrug Administration. Guidance for industry: PAT—a framework for innovativepharmaceutical development, manufacturing and quality assurance. Rockville,
MD, http://www.fda.gov/downloads/Drugs/GuidanceComplianceRegulatoryIn-formation/Guidances/ucm070305.pdf (accessed 28.08.14)
Heinz, A., Gordon, K.C., McGoverin, C.M., Rades, T., Strachan, C.J., 2009.Understanding the solid-state forms of fenofibrate–a spectroscopic andcomputational study. Eur. J. Pharm. Biopharm. 71, 100–108.
Hu, J., Ng, W.K., Dong, Y., Shen, S., Tan, R.B., 2011. Continuous and scalable process forwater-redispersible nanoformulation of poorly aqueous soluble APIs byantisolvent precipitation and spray-drying. Int. J. Pharm. 404, 198–204.
Jubert, A., Legarto, M.L., Massa, N.E., Tévez, L.L., Okulik, N.B., 2006. Vibrational andtheoretical studies of non-steroidal anti-inflammatory drugs ibuprofen [2-(4-isobutylphenyl)propionic acid]; naproxen [6-methoxy-a-methyl-2-naphtha-lene acetic acid] and tolmetin acids [1-methyl-5-(4-methylbenzoyl)-1H-pyrrole-2-acetic acid]. J. Mol. Struct. 783, 34–51.
Liversidge, G.G., Cundy, K.C., 1995. Particle size reduction for improvement of oralbioavailability of hydrophobic drugs: I. Absolute oral bioavailability ofnanocrystalline danazol in beagle dogs. Int. J. Pharm. 125, 91–97.
McGoverin, C.M., Hargreaves, M.D., Matousek, P., Gordon, K.C., 2012. Pharmaceuticalpolymorphs quantified with transmission Raman spectroscopy. J. RamanSpectrosc. 43, 280–285.
Merisko-Liversidge, E., Liversidge, G.G., Cooper, E.R., 2003. Nanosizing: a formulationapproach for poorly-water-soluble compounds. Eur. J. Pharm. Sci. 18, 113–120.
Michelet, A., Boiret, M., Lemhachheche, F., Malec, L., Tfayli, A., Ziemons, E., 2013. Useof Raman spectrometry in the pharmaceutical field. S.T.P. Pharm. Prat. 23.
Monteiro, A., Afolabi, A., Bilgili, E., 2013. Continuous production of drug nanoparticlesuspensions via wet stirred media milling: a fresh look at the Rehbinder effect.Drug Dev. Ind. Pharm. 39, 266–283.
Orzel, J., Daszykowski, M., Walczak, B., 2012. Controlling sugar quality on the basisof fluorescence fingerprints using robust calibration. Chemom. Intell. Lab. Syst.110, 89–96.
Pataki, H., Csontos, I., Nagy, Z.K., Vajna, B., Molnar, M., Katona, L., Marosi, G., 2012.Implementation of Raman signal feedback to perform controlled crystallizationof carvedilol. Org. Process Res. Dev. 17, 493–499.
Patravale, V., Kulkarni, R., 2004. Nanosuspensions: a promising drug deliverystrategy. J. Pharm. Pharmacol. 56, 827–840.
Pelletier, M.J., 1999. Analytical Applications of Raman Spectroscopy. Wiley-Blackwell, Hoboken, NJ, USA.
Rencher, A.C., Christensen, W.F., 2012. Methods of Multivariate Analysis. John Wiley& Sons, New York, NY, USA.
Rozo, J.I., Zarow, A., Zhou, B., Pinal, R., Iqbal, Z., Romanach, R.J., 2011. Complementarynear-infrared and Raman chemical imaging of pharmaceutical thin films. J.Pharm. Sci. 100, 4888–4895.
Saerens, L., Dierickx, L., Lenain, B., Vervaet, C., Remon, J.P., De Beer, T., 2011. Ramanspectroscopy for the in-line polymer–drug quantification and solid statecharacterization during a pharmaceutical hot-melt extrusion process. Eur. J.Pharm. Biopharm. 77, 158–163.
Shi, L., Gruenbaum, S.M., Skinner, J.L., 2012. Interpretation of IR and Raman lineshapes for H2O and D2O ice Ih. J. Phys. Chem. B 116, 13821–13830.
Sievens-Figueroa, L., Bhakay, A., Jerez-Rozo, J.I., Pandya, N., Romanach, R.J.,Michniak-Kohn, B., Iqbal, Z., Bilgili, E., Dave, R.N., 2012a. Preparation andcharacterization of hydroxypropyl methyl cellulose films containing stable BCSClass II drug nanoparticles for pharmaceutical applications. Int. J. Pharm. 423,496–508.
Sievens-Figueroa, L., Pandya, N., Bhakay, A., Keyvan, G., Michniak-Kohn, B., Bilgili, E.,Davé, R.N., 2012b. Using USP I and USP IV for discriminating dissolution rates ofnano-and microparticle-loaded pharmaceutical strip-films. AAPS PharmSci-Tech 13, 1473–1482.
Singh, R., Ierapetritou, M., Ramachandran, R., 2012. An engineering study on theenhanced control and operation of continuous manufacturing of pharmaceuti-cal tablets via roller compaction. Int. J. Pharm. 438, 307–326.
Staudenmayer, J., Zhu, W., Catellier, D.J., 2012. Statistical considerations in theanalysis of accelerometry-based activity monitor data. Med. Sci. Sports Exerc.44, S61–67.
Susarla, R., Sievens-Figueroa, L., Bhakay, A., Shen, Y., Jerez-Rozo, J.I., Engen, W.,Khusid, B., Bilgili, E., Romañach, R.J., Morris, K.R., Michniak-Kohn, B., Davé, R.N.,2013. Fast drying of biocompatible polymer films loaded with poorly water-soluble drug nano-particles via low temperature forced convection. Int. J.Pharm. 455, 93–103.
Tumuluri, V.S., Kemper, M.S., Lewis, I.R., Prodduturi, S., Majumdar, S., Avery, B.A.,Repka, M.A., 2008. Off-line and on-line measurements of drug-loaded hot-meltextruded films using Raman spectroscopy. Int. J. Pharm. 357, 77–84.
Van Eerdenbrugh, B., Van den Mooter, G., Augustijns, P., 2008. Top–down productionof drug nanocrystals: nanosuspension stabilization, miniaturization andtransformation into solid products. Int. J. Pharm. 364, 64–75.
Yu, L.X., Amidon, G.L., Polli, J.E., Zhao, H., Mehta, M.U., Conner, D.P., Shah, V.P., Lesko,L.J., Chen, M.-L., Lee, V.H., 2002. Biopharmaceutics classification system: thescientific basis for biowaiver extensions. Pharm. Res. 19, 921–925.
Top Related
Copyright © 2022 FDOKUMEN

