


Bahasa
Halaman
Hukum

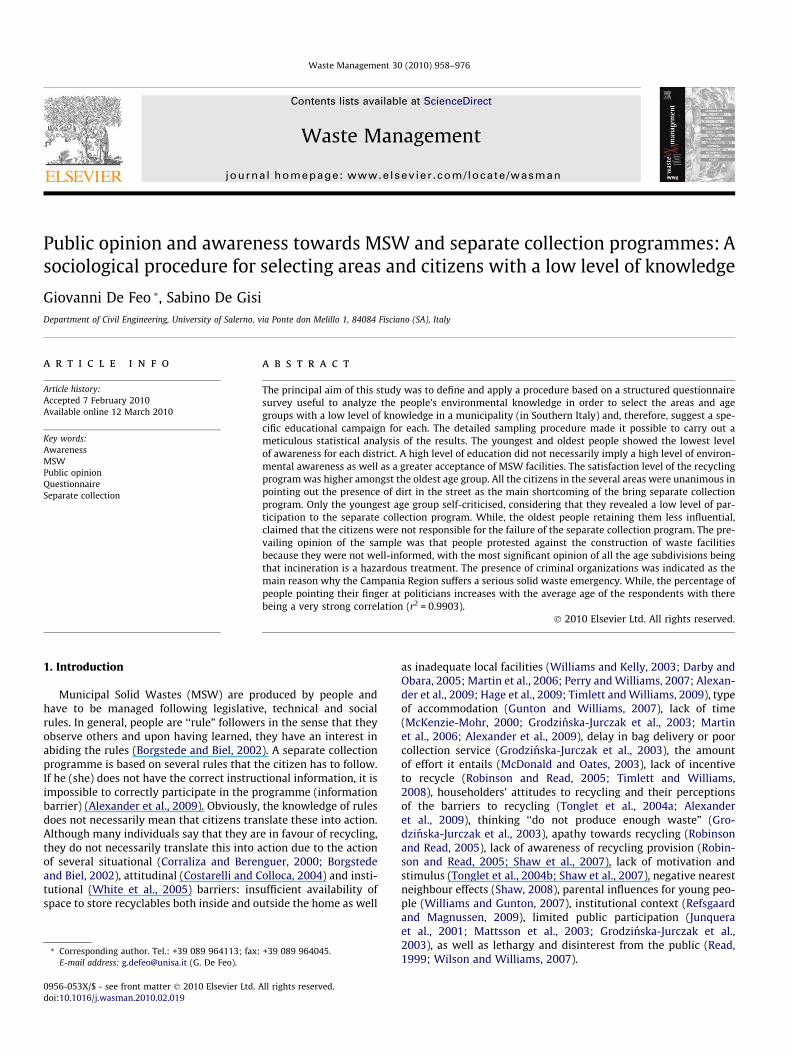
Waste Management 30 (2010) 958–976
Contents lists available at ScienceDirect
Waste Management
journal homepage: www.elsevier .com/ locate/wasman
Public opinion and awareness towards MSW and separate collection programmes: Asociological procedure for selecting areas and citizens with a low level of knowledge
Giovanni De Feo *, Sabino De GisiDepartment of Civil Engineering, University of Salerno, via Ponte don Melillo 1, 84084 Fisciano (SA), Italy
a r t i c l e i n f o a b s t r a c t
Article history:Accepted 7 February 2010Available online 12 March 2010
Key words:AwarenessMSWPublic opinionQuestionnaireSeparate collection
0956-053X/$ - see front matter � 2010 Elsevier Ltd.doi:10.1016/j.wasman.2010.02.019
* Corresponding author. Tel.: +39 089 964113; fax:E-mail address: [email protected] (G. De Feo).
The principal aim of this study was to define and apply a procedure based on a structured questionnairesurvey useful to analyze the people’s environmental knowledge in order to select the areas and agegroups with a low level of knowledge in a municipality (in Southern Italy) and, therefore, suggest a spe-cific educational campaign for each. The detailed sampling procedure made it possible to carry out ameticulous statistical analysis of the results. The youngest and oldest people showed the lowest levelof awareness for each district. A high level of education did not necessarily imply a high level of environ-mental awareness as well as a greater acceptance of MSW facilities. The satisfaction level of the recyclingprogram was higher amongst the oldest age group. All the citizens in the several areas were unanimous inpointing out the presence of dirt in the street as the main shortcoming of the bring separate collectionprogram. Only the youngest age group self-criticised, considering that they revealed a low level of par-ticipation to the separate collection program. While, the oldest people retaining them less influential,claimed that the citizens were not responsible for the failure of the separate collection program. The pre-vailing opinion of the sample was that people protested against the construction of waste facilitiesbecause they were not well-informed, with the most significant opinion of all the age subdivisions beingthat incineration is a hazardous treatment. The presence of criminal organizations was indicated as themain reason why the Campania Region suffers a serious solid waste emergency. While, the percentage ofpeople pointing their finger at politicians increases with the average age of the respondents with therebeing a very strong correlation (r2 = 0.9903).
� 2010 Elsevier Ltd. All rights reserved.
1. Introduction
Municipal Solid Wastes (MSW) are produced by people andhave to be managed following legislative, technical and socialrules. In general, people are ‘‘rule” followers in the sense that theyobserve others and upon having learned, they have an interest inabiding the rules (Borgstede and Biel, 2002). A separate collectionprogramme is based on several rules that the citizen has to follow.If he (she) does not have the correct instructional information, it isimpossible to correctly participate in the programme (informationbarrier) (Alexander et al., 2009). Obviously, the knowledge of rulesdoes not necessarily mean that citizens translate these into action.Although many individuals say that they are in favour of recycling,they do not necessarily translate this into action due to the actionof several situational (Corraliza and Berenguer, 2000; Borgstedeand Biel, 2002), attitudinal (Costarelli and Colloca, 2004) and insti-tutional (White et al., 2005) barriers: insufficient availability ofspace to store recyclables both inside and outside the home as well
All rights reserved.
+39 089 964045.
as inadequate local facilities (Williams and Kelly, 2003; Darby andObara, 2005; Martin et al., 2006; Perry and Williams, 2007; Alexan-der et al., 2009; Hage et al., 2009; Timlett and Williams, 2009), typeof accommodation (Gunton and Williams, 2007), lack of time(McKenzie-Mohr, 2000; Grodzinska-Jurczak et al., 2003; Martinet al., 2006; Alexander et al., 2009), delay in bag delivery or poorcollection service (Grodzinska-Jurczak et al., 2003), the amountof effort it entails (McDonald and Oates, 2003), lack of incentiveto recycle (Robinson and Read, 2005; Timlett and Williams,2008), householders’ attitudes to recycling and their perceptionsof the barriers to recycling (Tonglet et al., 2004a; Alexanderet al., 2009), thinking ‘‘do not produce enough waste” (Gro-dzinska-Jurczak et al., 2003), apathy towards recycling (Robinsonand Read, 2005), lack of awareness of recycling provision (Robin-son and Read, 2005; Shaw et al., 2007), lack of motivation andstimulus (Tonglet et al., 2004b; Shaw et al., 2007), negative nearestneighbour effects (Shaw, 2008), parental influences for young peo-ple (Williams and Gunton, 2007), institutional context (Refsgaardand Magnussen, 2009), limited public participation (Junqueraet al., 2001; Mattsson et al., 2003; Grodzinska-Jurczak et al.,2003), as well as lethargy and disinterest from the public (Read,1999; Wilson and Williams, 2007).
G. De Feo, S. De Gisi / Waste Management 30 (2010) 958–976 959
The principal aim of this study was to define and apply a proce-dure based on a structured questionnaire survey useful to analyzethe people’s environmental knowledge in order to select the areasand age groups with a low level of knowledge in a municipality (inSouthern Italy) and, therefore, suggest a specific educational cam-paign for each. The specific objectives of the research were thefollowing:
1. identify and explain any differences of awareness between thedifferent areas and social characteristics of the respondents(age, sex, marital status, occupation, level of education, etc.);
2. critically evaluate public satisfaction with the separate collec-tion program between the different areas and social character-istics of the respondents;
3. examine and evaluate the main shortcomings of the separatecollection system according to the respondents;
4. identify and explain who is responsible for the failure of theseparate collection program according to the respondents;
5. explain why citizens show little effort in the separate collectionprogram;
6. explain why residents protest against the construction of wastefacilities;
7. evaluate what people think about waste incineration;8. evaluate what the main reason is for the region where people
live (Campania Region, in Southern Italy) suffering from a seri-ous solid waste emergency; and, finally,
9. try to comment on the main reason for the tremendous produc-tion of waste according to the respondents.
1.1. Application of structured questionnaires as research instrumentsin the field of waste management
A particular characteristic of a structured questionnaire as a re-search instrument is that it presents the opportunity to record avariety of information as well as a large amount of data from a rel-atively large number of people in a short space of time in a stand-ardised form (Patton, 1990; Robson, 1993; Darby and Obara, 2005).Obviously, as with everything created by a human being, even astructured questionnaire has its advantages and disadvantages.For instance, Yin (2008) pointed out that the limitations of thiskind of instrument include the introduction of bias due to poorlyconstructed questions, as well as the possibility that the intervie-wee answering the questions in the manner that he (she) supposesthe interviewer will want (reflexivity). Moreover, there is a partic-ular tendency of the public to exaggerate their pro-environmentalbehaviour (Williams and Kelly, 2003). In fact, it has been docu-mented that respondents tend to exaggerate their waste manage-ment behaviours especially when these are perceived to beethically sound (Woollam et al., 2003; Williams and Kelly, 2003;Tucker, 2003; Darby and Obara, 2005; Martin et al., 2006; Alexan-der et al., 2009).
Answers can be recorded by means of open and/or closed ques-tions. While, the questions can be submitted either personally bymeans of an interview or as a postal survey. In general, a postalquestionnaire does not achieve a high return rate (McDonald andBall, 1998; Dixon and Williams, 2007), although Dixon and Wil-liams (2007) reported that a postal survey in the Borough of Wyre,in England, obtained a response rate of 72.5% (Williams and Kelly,2003). An effective approach to increasing the response rate is tosend out a postal reminder to non-respondents after a fixed time(Dixon and Williams, 2007). Finally, it is almost impossible to cor-rectly verify the level of ‘‘natural” awareness and knowledge ofrespondents with a postal questionnaire because they not onlyhave a lot of time to answer the questions but they can also consult
information sources (the Internet, books, newspapers, magazines,explanatory leaflets, etc.).
The first part of the questionnaire usually includes sectionswhich are aimed at discovering the social characteristics of theindividual being interviewed. The questionnaire has to be submit-ted to a sample which correctly represents the entire group of indi-viduals that we want information about (population) both in termsof dimension and structure (sampling procedure). The larger yoursample size, the more you can be sure that their answers truly re-flect the population. Since we base conclusions about the popula-tion on data from the sample, if the sample is not correctlystructured and/or is small in comparison with the representedpopulation, the subsequent study could be useless.
A structured questionnaire can be effectively used in order toinvestigate public participation in recycling schemes, focusing onawareness, attitude, knowledge and behaviour. The basic idea isthat it is impossible to apply a not known rule as well as a generallack of awareness and/or knowledge of MSW, thus making it diffi-cult to involve the public in recycling programmes. As a matter offact, a number of previous studies have highlighted that awarenessinfluences attitude and, in turn, attitude influences knowledge andbehaviour (to various degrees) (Corraliza and Berenguer, 2000;Borgstede and Biel, 2002; Costarelli and Colloca, 2004; Daviset al., 2006; Martin et al., 2006; Dixon and Williams, 2007; Guntonand Williams, 2007; Alexander et al., 2009). In particular, Guntonand Williams (2007) noted that pro-environmental behaviour canexist independently to pro-environmental attitude, depending onwhere barriers occur within the chain of causality, and based onthe level of both specific and general environmental awareness.Even though current research shows that environmental attitudeis a poor predictor of subsequent behaviour (Costarelli and Colloca,2004), it is clear that in order to alter behaviour, awareness mustbe increased, with an associated reduction in situational barriers(Gunton and Williams, 2007). Therefore, recycling, and other formsof waste management, need to be adequately communicated to thepublic, with traditions being changed for the better (Read, 1999;Gunton and Williams, 2007). Changing individual behaviour is cen-tral to achieving a sustainable future (McKenzie-Mohr, 2000) andeffective behavioural change programmes have to be implementedin order to match this goal.
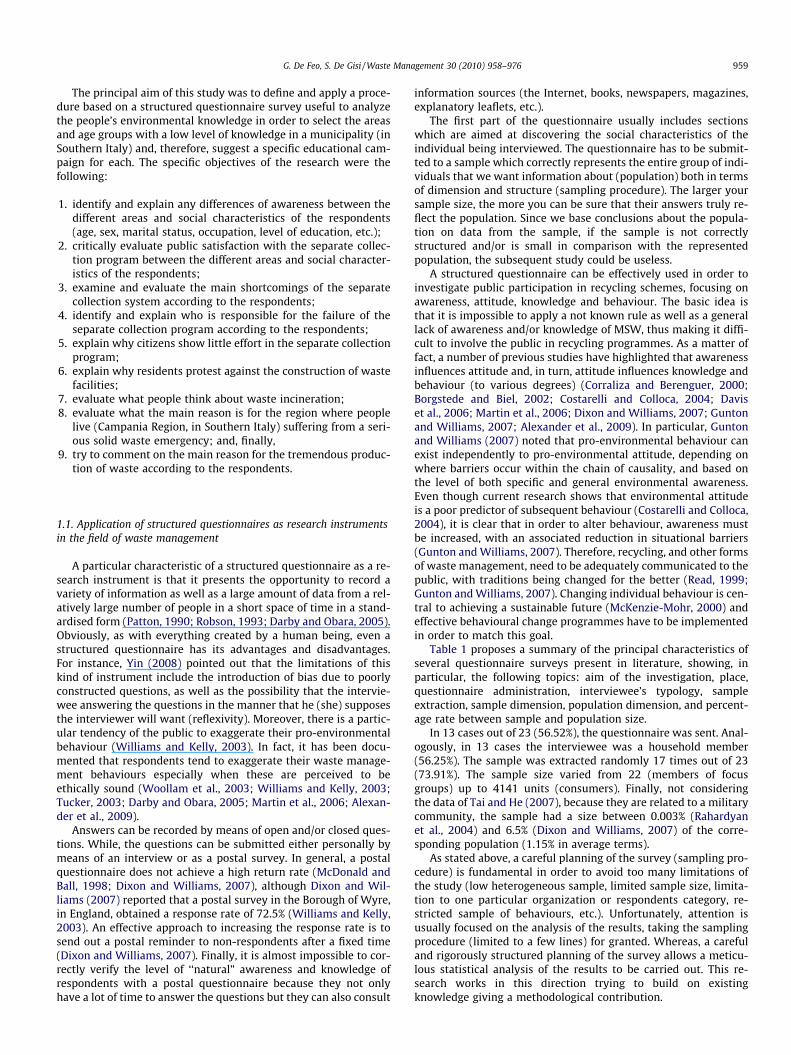
Table 1 proposes a summary of the principal characteristics ofseveral questionnaire surveys present in literature, showing, inparticular, the following topics: aim of the investigation, place,questionnaire administration, interviewee’s typology, sampleextraction, sample dimension, population dimension, and percent-age rate between sample and population size.
In 13 cases out of 23 (56.52%), the questionnaire was sent. Anal-ogously, in 13 cases the interviewee was a household member(56.25%). The sample was extracted randomly 17 times out of 23(73.91%). The sample size varied from 22 (members of focusgroups) up to 4141 units (consumers). Finally, not consideringthe data of Tai and He (2007), because they are related to a militarycommunity, the sample had a size between 0.003% (Rahardyanet al., 2004) and 6.5% (Dixon and Williams, 2007) of the corre-sponding population (1.15% in average terms).
As stated above, a careful planning of the survey (sampling pro-cedure) is fundamental in order to avoid too many limitations ofthe study (low heterogeneous sample, limited sample size, limita-tion to one particular organization or respondents category, re-stricted sample of behaviours, etc.). Unfortunately, attention isusually focused on the analysis of the results, taking the samplingprocedure (limited to a few lines) for granted. Whereas, a carefuland rigorously structured planning of the survey allows a meticu-lous statistical analysis of the results to be carried out. This re-search works in this direction trying to build on existingknowledge giving a methodological contribution.
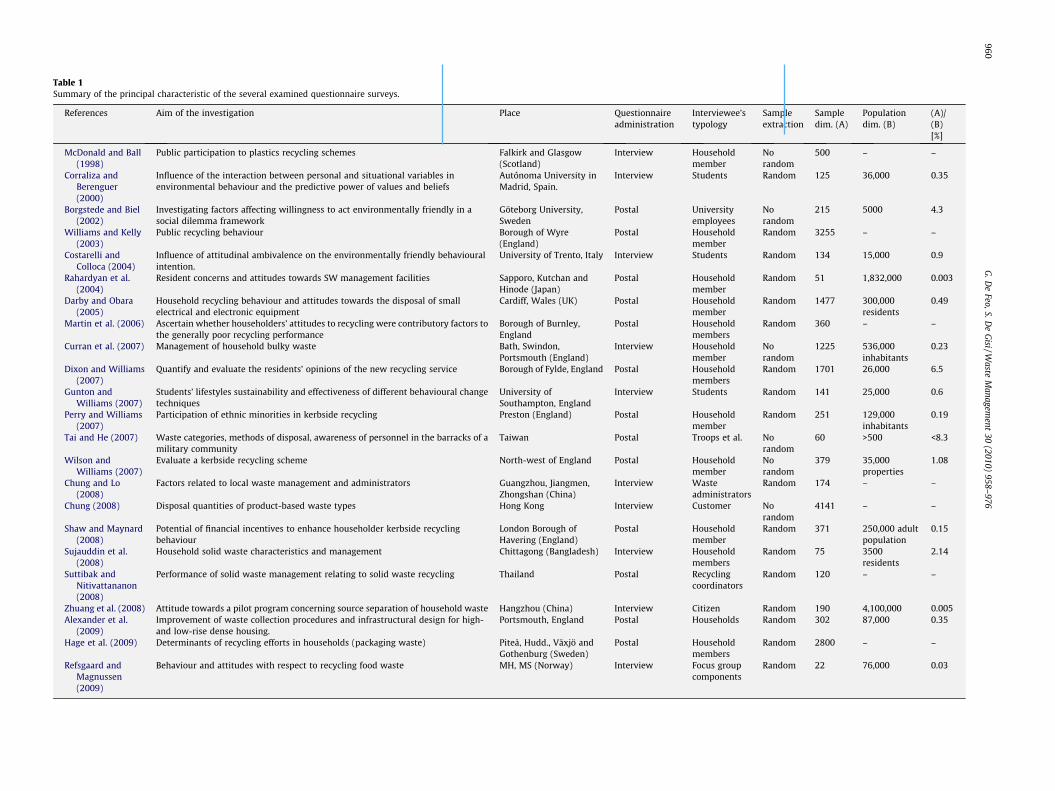
Table 1Summary of the principal characteristic of the several examined questionnaire surveys.
References Aim of the investigation Place Questionnaireadministration
Interviewee’stypology
Sampleextraction
Sampledim. (A)
Populationdim. (B)
(A)/(B)[%]
McDonald and Ball(1998)
Public participation to plastics recycling schemes Falkirk and Glasgow(Scotland)
Interview Householdmember
Norandom
500 – –
Corraliza andBerenguer(2000)
Influence of the interaction between personal and situational variables inenvironmental behaviour and the predictive power of values and beliefs
Autónoma University inMadrid, Spain.
Interview Students Random 125 36,000 0.35
Borgstede and Biel(2002)
Investigating factors affecting willingness to act environmentally friendly in asocial dilemma framework
Göteborg University,Sweden
Postal Universityemployees
Norandom
215 5000 4.3
Williams and Kelly(2003)
Public recycling behaviour Borough of Wyre(England)
Postal Householdmember
Random 3255 – –
Costarelli andColloca (2004)
Influence of attitudinal ambivalence on the environmentally friendly behaviouralintention.
University of Trento, Italy Interview Students Random 134 15,000 0.9
Rahardyan et al.(2004)
Resident concerns and attitudes towards SW management facilities Sapporo, Kutchan andHinode (Japan)
Postal Householdmember
Random 51 1,832,000 0.003
Darby and Obara(2005)
Household recycling behaviour and attitudes towards the disposal of smallelectrical and electronic equipment
Cardiff, Wales (UK) Postal Householdmember
Random 1477 300,000residents
0.49
Martin et al. (2006) Ascertain whether householders’ attitudes to recycling were contributory factors tothe generally poor recycling performance
Borough of Burnley,England
Postal Householdmembers
Random 360 – –
Curran et al. (2007) Management of household bulky waste Bath, Swindon,Portsmouth (England)
Interview Householdmember
Norandom
1225 536,000inhabitants
0.23
Dixon and Williams(2007)
Quantify and evaluate the residents’ opinions of the new recycling service Borough of Fylde, England Postal Householdmembers
Random 1701 26,000 6.5
Gunton andWilliams (2007)
Students’ lifestyles sustainability and effectiveness of different behavioural changetechniques
University ofSouthampton, England
Interview Students Random 141 25,000 0.6
Perry and Williams(2007)
Participation of ethnic minorities in kerbside recycling Preston (England) Postal Householdmember
Random 251 129,000inhabitants
0.19
Tai and He (2007) Waste categories, methods of disposal, awareness of personnel in the barracks of amilitary community
Taiwan Postal Troops et al. Norandom
60 >500 <8.3
Wilson andWilliams (2007)
Evaluate a kerbside recycling scheme North-west of England Postal Householdmember
Norandom
379 35,000properties
1.08
Chung and Lo(2008)
Factors related to local waste management and administrators Guangzhou, Jiangmen,Zhongshan (China)
Interview Wasteadministrators
Random 174 – –
Chung (2008) Disposal quantities of product-based waste types Hong Kong Interview Customer Norandom
4141 – –
Shaw and Maynard(2008)
Potential of financial incentives to enhance householder kerbside recyclingbehaviour
London Borough ofHavering (England)
Postal Householdmember
Random 371 250,000 adultpopulation
0.15
Sujauddin et al.(2008)
Household solid waste characteristics and management Chittagong (Bangladesh) Interview Householdmembers
Random 75 3500residents
2.14
Suttibak andNitivattananon(2008)
Performance of solid waste management relating to solid waste recycling Thailand Postal Recyclingcoordinators
Random 120 – –
Zhuang et al. (2008) Attitude towards a pilot program concerning source separation of household waste Hangzhou (China) Interview Citizen Random 190 4,100,000 0.005Alexander et al.
(2009)Improvement of waste collection procedures and infrastructural design for high-and low-rise dense housing.
Portsmouth, England Postal Households Random 302 87,000 0.35
Hage et al. (2009) Determinants of recycling efforts in households (packaging waste) Piteå, Hudd., Växjö andGothenburg (Sweden)
Postal Householdmembers
Random 2800 – –
Refsgaard andMagnussen(2009)
Behaviour and attitudes with respect to recycling food waste MH, MS (Norway) Interview Focus groupcomponents
Random 22 76,000 0.03
960G
.De
Feo,S.De
Gisi/W
asteM
anagement
30(2010)
958–976
G. De Feo, S. De Gisi / Waste Management 30 (2010) 958–976 961
2. Materials and methods
2.1. Procedure
The first step of the procedure is to divide the city under studyinto several areas according to the local popular and historic sub-divisions in districts (the place that residents call ‘‘home” sensulatu). In fact, each district has proper attitudes, values, traditions,etc. as a consequence of a complex process of territorial transfor-mation and subdivision. On the contrary, a generic subdivisionbased on a numerical repartition of the population in equal sam-ples could lose these common elements.
The second step of the procedure is to extract a structured sam-ple of people not less than 14 years old. As shown in Fig. 1, we sug-gest assuming a percentage sample size corresponding to aconfidence level of 99% and a confidence interval in the range 4–5%. The sample to extract has to perfectly reproduce the populationin terms of male and female percentages. Moreover, the followingage subdivision is suggested: (1) 14–18, (2) 19–29, (3) 30–49, (4)50–64 and (5) >65. Obviously, the sample has to perfectly repro-duce the population in terms of male and female percentages foreach age subdivision. In fact, how the sample of questionnairerespondents reflects the composition of the population of concernis very important.
The third step is to design a structured questionnaire on the ba-sis of literature reviews, personal experience and knowledge of thepeople and places involved. The questionnaire has to have threeparts: (1) personal attributes and personal behaviour of the samplecomponents; (2) questions aimed at verifying the people’s environ-mental knowledge (‘‘people’s awareness”); (3) questions to verifythe opinion of the sample population in relation to the adoptedseparate collection program and, in general, waste and relatedarguments.
The fourth step is to administer the questionnaire to the samplecomponents by means of street interviews.
The fifth step is to number the administered questionnaires anddigitize the collected data in a spreadsheet reproducing the struc-ture of the questionnaire, for the several areas and for the severalage subdivisions, as shown in the next paragraphs. The questionsaimed at verifying the people’s environmental knowledge can besummarized by considering only the percentage of correct an-swers. While, the questions to verify the opinion of the samplepopulation have to be analyzed in detail.
The sixth step is to analyze the people’s environmental knowl-edge in order to select the areas and age groups with a low level of
0
200
400
600
800
1000
1200
1.00E+00 1.00E+01 1.00E+02 1.00E+03 1.00E+04 1.00E+05 1.00E+06 1.00E+07 1.00E+08
Population size (logarithmic scale)
Sam
ple
size
4.00% 5.00% 4.25% 4.50% 4.75%
(a)
Fig. 1. (a) Sample size needed for a confidence level of 99% and for a confidence intervalneeded for a confidence level of 99%, for a confidence interval of 4.00–5.00% and for a pop
knowledge and suggest a specific education campaign in order toprogressively change for the better their pro-environmentalbehaviour. In particular, the following scheme is proposed: if theaverage percentage of correct answers to the knowledge questionsis less than 30%, the considered age group reveals a very poor levelof awareness (‘‘red” level). If the average percentage is between therange 30–50%, the considered age subdivision shows a poor level ofawareness (‘‘yellow” level). If the average percentage is betweenthe range 50–70%, the considered age group shows a sufficient le-vel of awareness (‘‘green” level). Finally, if the average percentageis greater than 70%, the considered age subdivision shows a goodlevel of awareness (‘‘blue” level). Obviously, this scheme can be ap-plied to each area as well as to the total sample.
If an area shows a ‘‘red” level, an extensive education cam-paign with instructional information should be performed oneach age group of the area, relating to all the themes of the sub-mitted questions. In fact, there is a strong positive correlation be-tween recognition of instructional information and higher levelsof recycling (Thomas, 2001; Timlett and Williams, 2008) due tothe fact that awareness (and in turn knowledge) can be positivelyaltered through the provision of relevant information (Guntonand Williams, 2007). The education campaign can include severaltools (Martin et al., 2006; Timlett and Williams, 2008): adverts inthe local press as well as the radio and TV, bill-board campaigns,district magazines and newsletters, instructional leaflets deliv-ered to households and/or at community points (such as librariesand doctors surgeries), roadshow initiatives, public consultationmeetings, door-to-door promotional campaigns, talks to schoolsand other community groups (e.g. senior citizen center) and web-sites, personal contact with individual householders, focusgroups.
If an area shows a ‘‘yellow” level, a targeted education cam-paign has to be implemented to the age subdivisions which showthe lowest levels of awareness, relating to the specific argumentsrelated to the questions where people showed a low level ofawareness (leaflets delivered to households, door-to-door promo-tional campaigns, talks to specific community groups, personalcontact with individual householders, focus groups). While, ifan area shows a ‘‘green” level, a light education campaign canbe performed based on the focus group instrument. Finally, ifan area shows a ‘‘blue” level, no education campaign is required.In practice, with the ‘‘red” and ‘‘yellow” levels, it is necessary tointroduce useful information from outside. Whereas, with the‘‘green” level, an internal sharing of information is merelyrequired.
0
1
2
3
4
5
6
7
8
9
10
10000 20000 30000 40000 50000 60000 70000 80000 90000 100000Population size (logarithmic scale)
Perc
enta
ge s
ampl
e si
ze [%
] 4.00% 4.25% 4.50% 4.75% 5.00%
(b)
of 4.00–5.00% (using a 50% percentage picking a choice). (b) Percentage sample sizeulation size of 10,000–100,000 elements (using a 50% percentage picking a choice).
962 G. De Feo, S. De Gisi / Waste Management 30 (2010) 958–976
2.2. Characteristics of the study area
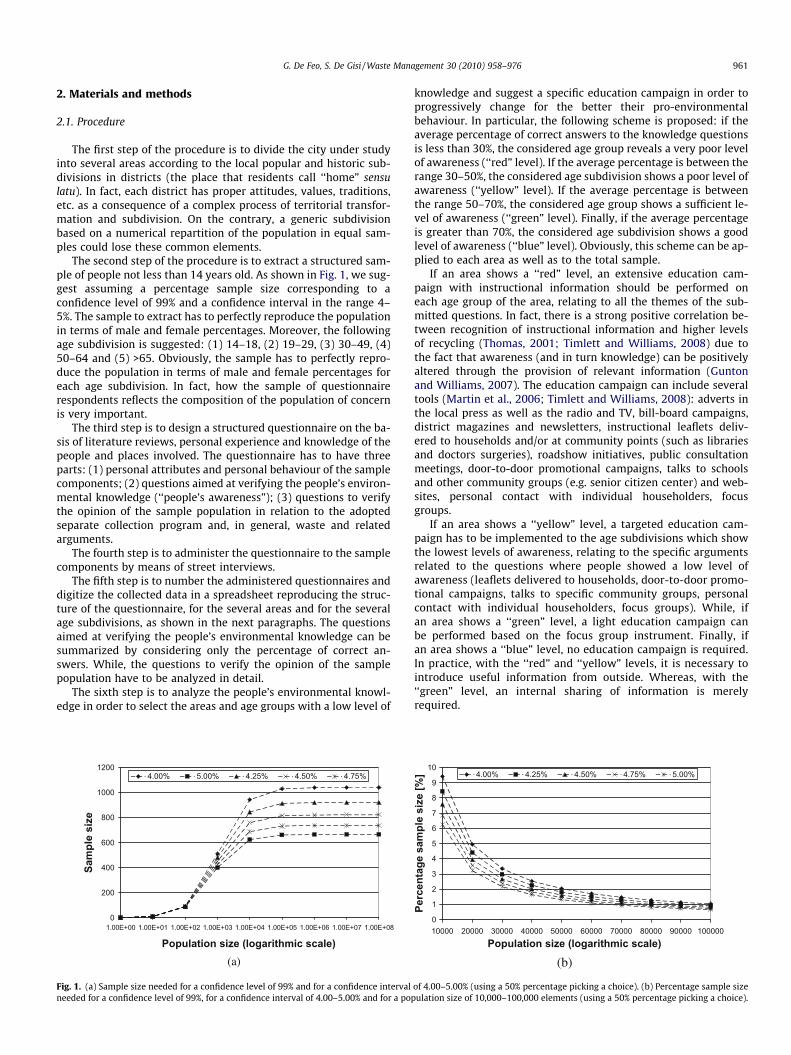
The questionnaire was administered in the city of Nocera Inferi-ore in the District of Salerno, Campania Region, in Southern Italy(Fig. 2). The following are the principal data on Nocera Inferiore:18 m minimum altitude, 1075 maximum altitude, 43 m average alti-tude, 47,048 inhabitants (12/31/2007, register office of Nocera Infe-riore), 20.85 km2, 2256.5 inhabitants/km2 population density. It isimportant to point out that the Campania Region is an area suffering
Fig. 2. Localization of the city of Nocera Inferiore where the questionnaire surv
Fig. 3. Scheme of the study areas. (1) ‘‘Quartiere Storico” (‘‘Historical” district); (2)(‘‘Capocasale” district; (4) ‘‘Quartiere Piedimonte” (‘‘Piedimonte” district); (5) ‘‘Quartiere(‘‘Casolla-Grotti” district).
from a serious solid waste emergency that has lasted over 15 years(De Feo and Malvano, 2009). It is the culmination of a process ofinsufficient implementation of European waste legislation for whichItaly has repeatedly been condemned by the European Court of Jus-tice. In particular, the images of heaps of rubbish in the streets of Na-ples and other nearby cities (including the city under study) wereimpressively documented by international press reports.
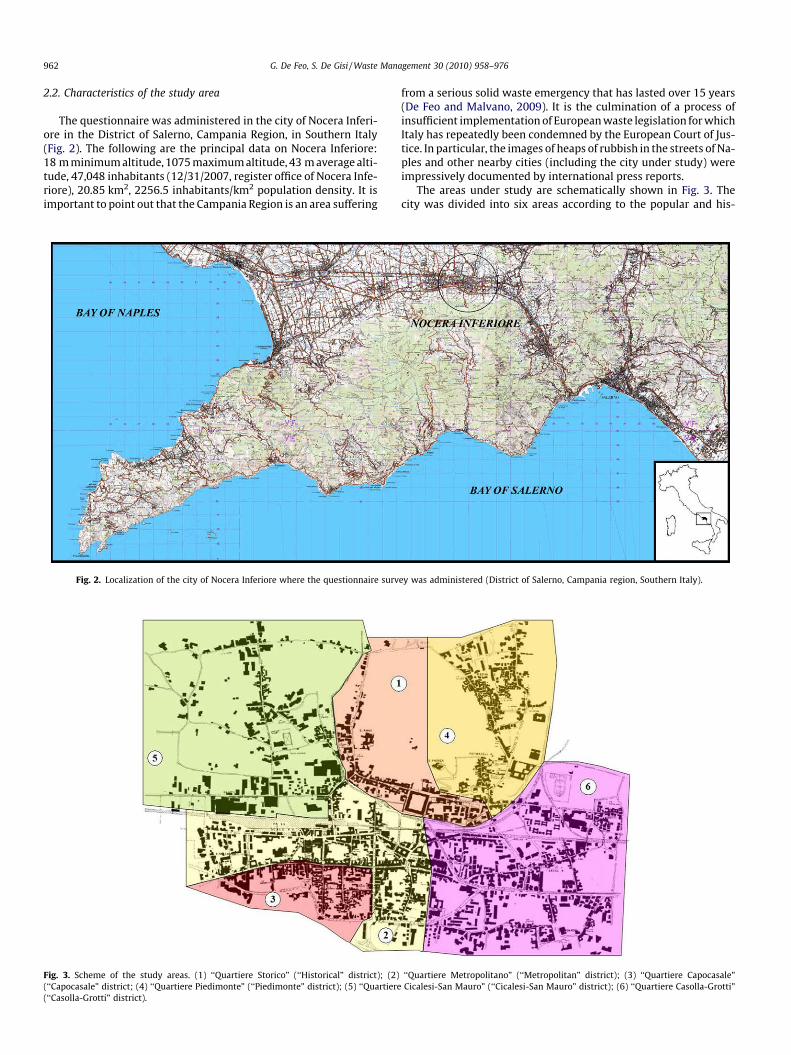
The areas under study are schematically shown in Fig. 3. Thecity was divided into six areas according to the popular and his-
ey was administered (District of Salerno, Campania region, Southern Italy).
‘‘Quartiere Metropolitano” (‘‘Metropolitan” district); (3) ‘‘Quartiere Capocasale”Cicalesi-San Mauro” (‘‘Cicalesi-San Mauro” district); (6) ‘‘Quartiere Casolla-Grotti”
G. De Feo, S. De Gisi / Waste Management 30 (2010) 958–976 963
torical subdivisions in districts, as suggested in the procedure.The following are the names and the principal characteristics ofthe considered areas in the city of Nocera Inferiore: (1) ‘‘QuartiereStorico” (‘‘Historical” district) (6116 inhabitants, 13%; 2.72 km2;2249 inhabitants/km2); (2) ‘‘Quartiere Metropolitano” (‘‘Metropol-itan” district) (9880 inhabitants, 21%; 3.48 km2; 2839 inhabitants/km2); (3) ‘‘Quartiere Capocasale” (‘‘Capocasale” district) (7998inhabitants, 17%; 1.40 km2; 5713 inhabitants/km2); (4) ‘‘QuartierePiedimonte” (‘‘Piedimonte” district) (6116 inhabitants, 13%;3.4 km2; 1747 inhabitants/km2); (5) ‘‘Quartiere Cicalesi-San Mau-ro” (‘‘Cicalesi-San Mauro” district) (7998 inhabitants, 17%;6.7 km2; 1194 inhabitants/km2); (6) ‘‘Quartiere Casolla-Grotti”(‘‘Casolla-Grotti” district) (8939 inhabitants, 19%; 5.7 km2; 1568inhabitants/km2). It can be noted that the first group of three dis-tricts (1–3) is more densely populated (3157 inhabitants/km2).Moreover, they represent the oldest districts of the city as wellas being characterised by high-rise buildings. While, the secondgroup of three districts (4–6) is less densely populated (1450inhabitants/km2), less urbanised, with the presence of peoplewith peasant origins, as well as modern high- and low-risebuildings.
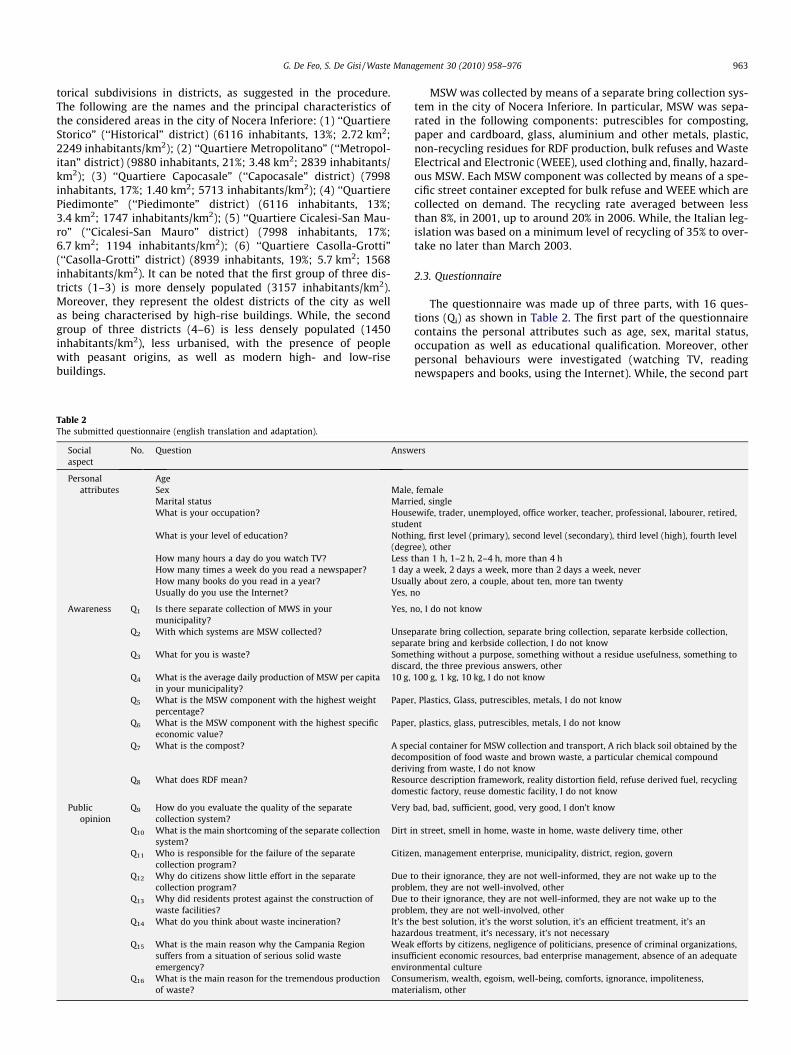
Table 2The submitted questionnaire (english translation and adaptation).
Socialaspect
No. Question Answ
Personalattributes
AgeSex MaleMarital status MarrWhat is your occupation? Hous
studeWhat is your level of education? Noth
(degrHow many hours a day do you watch TV? Less tHow many times a week do you read a newspaper? 1 dayHow many books do you read in a year? UsuaUsually do you use the Internet? Yes, n
Awareness Q1 Is there separate collection of MWS in yourmunicipality?
Yes, n
Q2 With which systems are MSW collected? Unsesepar
Q3 What for you is waste? Somedisca
Q4 What is the average daily production of MSW per capitain your municipality?
10 g,
Q5 What is the MSW component with the highest weightpercentage?
Paper
Q6 What is the MSW component with the highest specificeconomic value?
Paper
Q7 What is the compost? A spedecomderiv
Q8 What does RDF mean? Resoudome
Publicopinion
Q9 How do you evaluate the quality of the separatecollection system?
Very
Q10 What is the main shortcoming of the separate collectionsystem?
Dirt i
Q11 Who is responsible for the failure of the separatecollection program?
Citize
Q12 Why do citizens show little effort in the separatecollection program?
Due tprobl
Q13 Why did residents protest against the construction ofwaste facilities?
Due tprobl
Q14 What do you think about waste incineration? It’s thhazar
Q15 What is the main reason why the Campania Regionsuffers from a situation of serious solid wasteemergency?
Weakinsufenvir
Q16 What is the main reason for the tremendous productionof waste?
Consumate
MSW was collected by means of a separate bring collection sys-tem in the city of Nocera Inferiore. In particular, MSW was sepa-rated in the following components: putrescibles for composting,paper and cardboard, glass, aluminium and other metals, plastic,non-recycling residues for RDF production, bulk refuses and WasteElectrical and Electronic (WEEE), used clothing and, finally, hazard-ous MSW. Each MSW component was collected by means of a spe-cific street container excepted for bulk refuse and WEEE which arecollected on demand. The recycling rate averaged between lessthan 8%, in 2001, up to around 20% in 2006. While, the Italian leg-islation was based on a minimum level of recycling of 35% to over-take no later than March 2003.
2.3. Questionnaire
The questionnaire was made up of three parts, with 16 ques-tions (Qi) as shown in Table 2. The first part of the questionnairecontains the personal attributes such as age, sex, marital status,occupation as well as educational qualification. Moreover, otherpersonal behaviours were investigated (watching TV, readingnewspapers and books, using the Internet). While, the second part
ers
, femaleied, singleewife, trader, unemployed, office worker, teacher, professional, labourer, retired,nt
ing, first level (primary), second level (secondary), third level (high), fourth levelee), otherhan 1 h, 1–2 h, 2–4 h, more than 4 ha week, 2 days a week, more than 2 days a week, never
lly about zero, a couple, about ten, more tan twentyo
o, I do not know
parate bring collection, separate bring collection, separate kerbside collection,ate bring and kerbside collection, I do not knowthing without a purpose, something without a residue usefulness, something tord, the three previous answers, other100 g, 1 kg, 10 kg, I do not know
, Plastics, Glass, putrescibles, metals, I do not know
, plastics, glass, putrescibles, metals, I do not know
cial container for MSW collection and transport, A rich black soil obtained by theposition of food waste and brown waste, a particular chemical compound
ing from waste, I do not knowrce description framework, reality distortion field, refuse derived fuel, recyclingstic factory, reuse domestic facility, I do not know
bad, bad, sufficient, good, very good, I don’t know
n street, smell in home, waste in home, waste delivery time, other
n, management enterprise, municipality, district, region, govern
o their ignorance, they are not well-informed, they are not wake up to theem, they are not well-involved, othero their ignorance, they are not well-informed, they are not wake up to theem, they are not well-involved, othere best solution, it’s the worst solution, it’s an efficient treatment, it’s andous treatment, it’s necessary, it’s not necessaryefforts by citizens, negligence of politicians, presence of criminal organizations,
ficient economic resources, bad enterprise management, absence of an adequateonmental culturemerism, wealth, egoism, well-being, comforts, ignorance, impoliteness,
rialism, other
964 G. De Feo, S. De Gisi / Waste Management 30 (2010) 958–976
(questions Q1–Q8) was aimed at verifying the people’s environ-mental knowledge (‘‘people’s awareness”) as well as to obtainthe data useful for implementing the procedure. Finally, the thirdpart (Q9–Q16) were questions to verify the opinion of the samplepopulation about the adopted separate collection program and, ingeneral, waste and related arguments (‘‘public opinion”).
The questionnaires were administered by means of anonymousstreet interviews conducted by two undergraduate students of the
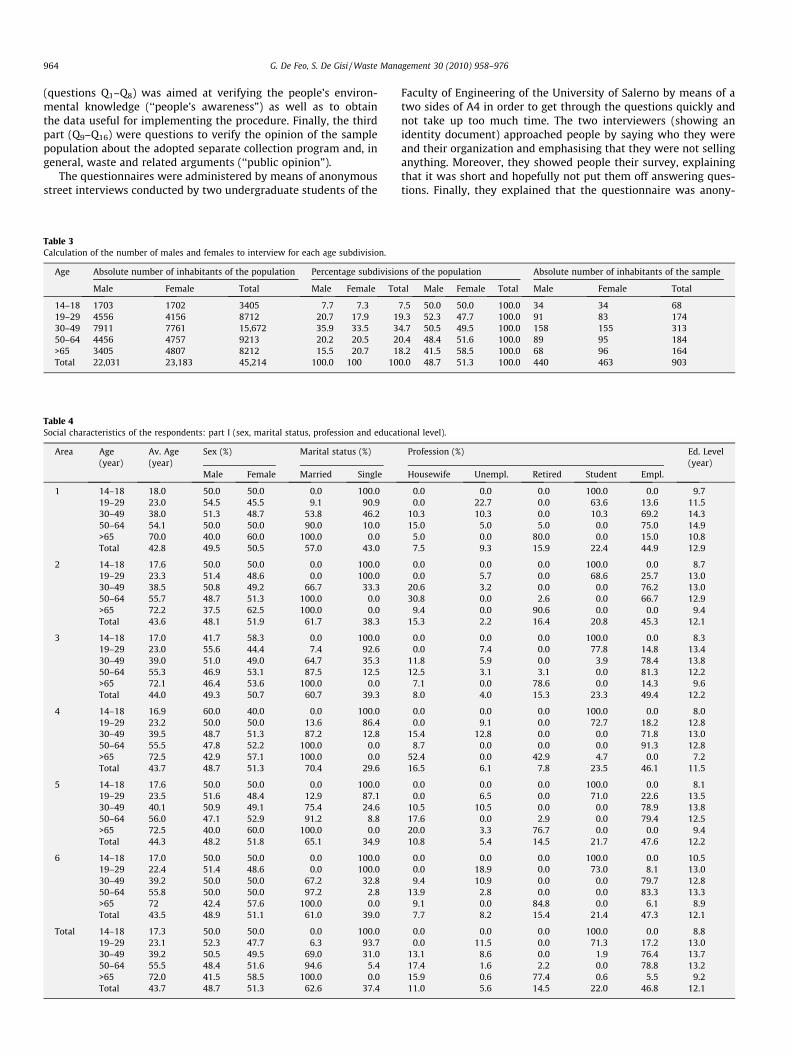
Table 3Calculation of the number of males and females to interview for each age subdivision.
Age Absolute number of inhabitants of the population Percentage subdivisio
Male Female Total Male Female To
14–18 1703 1702 3405 7.7 7.319–29 4556 4156 8712 20.7 17.9 130–49 7911 7761 15,672 35.9 33.5 350–64 4456 4757 9213 20.2 20.5 2>65 3405 4807 8212 15.5 20.7 1Total 22,031 23,183 45,214 100.0 100 10
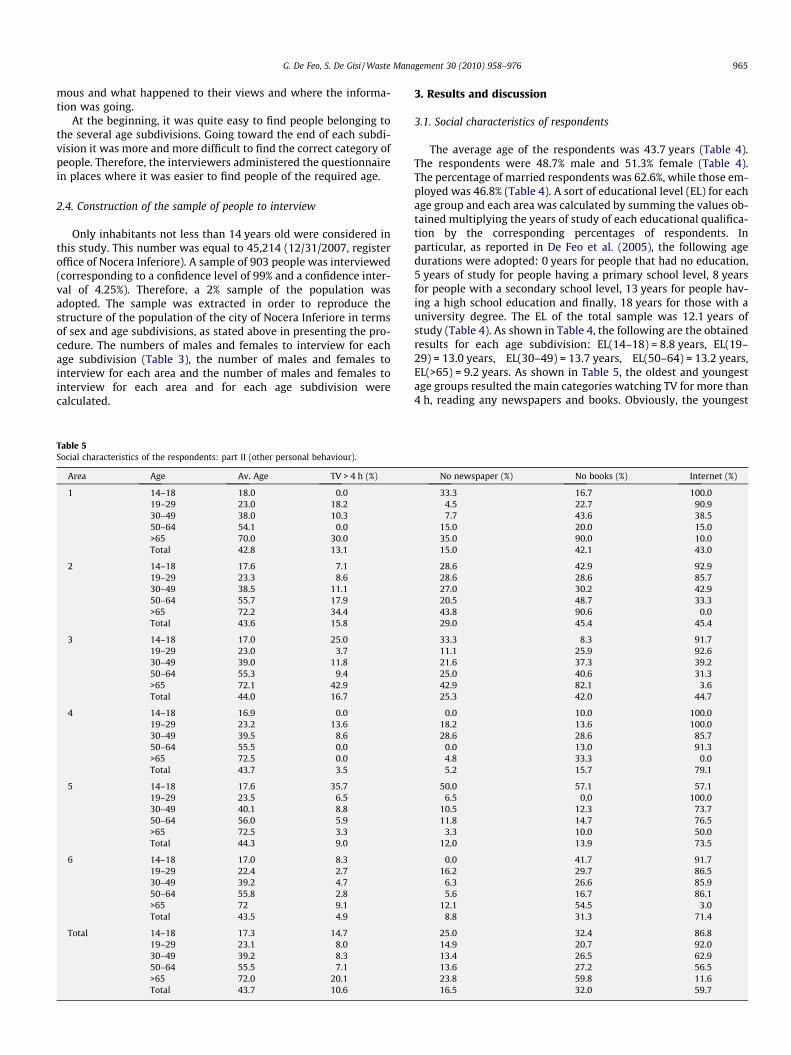
Table 4Social characteristics of the respondents: part I (sex, marital status, profession and educat
Area Age(year)
Av. Age(year)
Sex (%) Marital status (%)
Male Female Married Single
1 14–18 18.0 50.0 50.0 0.0 100.019–29 23.0 54.5 45.5 9.1 90.930–49 38.0 51.3 48.7 53.8 46.250–64 54.1 50.0 50.0 90.0 10.0>65 70.0 40.0 60.0 100.0 0.0Total 42.8 49.5 50.5 57.0 43.0
2 14–18 17.6 50.0 50.0 0.0 100.019–29 23.3 51.4 48.6 0.0 100.030–49 38.5 50.8 49.2 66.7 33.350–64 55.7 48.7 51.3 100.0 0.0>65 72.2 37.5 62.5 100.0 0.0Total 43.6 48.1 51.9 61.7 38.3
3 14–18 17.0 41.7 58.3 0.0 100.019–29 23.0 55.6 44.4 7.4 92.630–49 39.0 51.0 49.0 64.7 35.350–64 55.3 46.9 53.1 87.5 12.5>65 72.1 46.4 53.6 100.0 0.0Total 44.0 49.3 50.7 60.7 39.3
4 14–18 16.9 60.0 40.0 0.0 100.019–29 23.2 50.0 50.0 13.6 86.430–49 39.5 48.7 51.3 87.2 12.850–64 55.5 47.8 52.2 100.0 0.0>65 72.5 42.9 57.1 100.0 0.0Total 43.7 48.7 51.3 70.4 29.6
5 14–18 17.6 50.0 50.0 0.0 100.019–29 23.5 51.6 48.4 12.9 87.130–49 40.1 50.9 49.1 75.4 24.650–64 56.0 47.1 52.9 91.2 8.8>65 72.5 40.0 60.0 100.0 0.0Total 44.3 48.2 51.8 65.1 34.9
6 14–18 17.0 50.0 50.0 0.0 100.019–29 22.4 51.4 48.6 0.0 100.030–49 39.2 50.0 50.0 67.2 32.850–64 55.8 50.0 50.0 97.2 2.8>65 72 42.4 57.6 100.0 0.0Total 43.5 48.9 51.1 61.0 39.0
Total 14–18 17.3 50.0 50.0 0.0 100.019–29 23.1 52.3 47.7 6.3 93.730–49 39.2 50.5 49.5 69.0 31.050–64 55.5 48.4 51.6 94.6 5.4>65 72.0 41.5 58.5 100.0 0.0Total 43.7 48.7 51.3 62.6 37.4
Faculty of Engineering of the University of Salerno by means of atwo sides of A4 in order to get through the questions quickly andnot take up too much time. The two interviewers (showing anidentity document) approached people by saying who they wereand their organization and emphasising that they were not sellinganything. Moreover, they showed people their survey, explainingthat it was short and hopefully not put them off answering ques-tions. Finally, they explained that the questionnaire was anony-
ns of the population Absolute number of inhabitants of the sample
tal Male Female Total Male Female Total
7.5 50.0 50.0 100.0 34 34 689.3 52.3 47.7 100.0 91 83 1744.7 50.5 49.5 100.0 158 155 3130.4 48.4 51.6 100.0 89 95 1848.2 41.5 58.5 100.0 68 96 1640.0 48.7 51.3 100.0 440 463 903
ional level).
Profession (%) Ed. Level(year)
Housewife Unempl. Retired Student Empl.
0.0 0.0 0.0 100.0 0.0 9.70.0 22.7 0.0 63.6 13.6 11.5
10.3 10.3 0.0 10.3 69.2 14.315.0 5.0 5.0 0.0 75.0 14.9
5.0 0.0 80.0 0.0 15.0 10.87.5 9.3 15.9 22.4 44.9 12.9
0.0 0.0 0.0 100.0 0.0 8.70.0 5.7 0.0 68.6 25.7 13.0
20.6 3.2 0.0 0.0 76.2 13.030.8 0.0 2.6 0.0 66.7 12.9
9.4 0.0 90.6 0.0 0.0 9.415.3 2.2 16.4 20.8 45.3 12.1
0.0 0.0 0.0 100.0 0.0 8.30.0 7.4 0.0 77.8 14.8 13.4
11.8 5.9 0.0 3.9 78.4 13.812.5 3.1 3.1 0.0 81.3 12.2
7.1 0.0 78.6 0.0 14.3 9.68.0 4.0 15.3 23.3 49.4 12.2
0.0 0.0 0.0 100.0 0.0 8.00.0 9.1 0.0 72.7 18.2 12.8
15.4 12.8 0.0 0.0 71.8 13.08.7 0.0 0.0 0.0 91.3 12.8
52.4 0.0 42.9 4.7 0.0 7.216.5 6.1 7.8 23.5 46.1 11.5
0.0 0.0 0.0 100.0 0.0 8.10.0 6.5 0.0 71.0 22.6 13.5
10.5 10.5 0.0 0.0 78.9 13.817.6 0.0 2.9 0.0 79.4 12.520.0 3.3 76.7 0.0 0.0 9.410.8 5.4 14.5 21.7 47.6 12.2
0.0 0.0 0.0 100.0 0.0 10.50.0 18.9 0.0 73.0 8.1 13.09.4 10.9 0.0 0.0 79.7 12.8
13.9 2.8 0.0 0.0 83.3 13.39.1 0.0 84.8 0.0 6.1 8.97.7 8.2 15.4 21.4 47.3 12.1
0.0 0.0 0.0 100.0 0.0 8.80.0 11.5 0.0 71.3 17.2 13.0
13.1 8.6 0.0 1.9 76.4 13.717.4 1.6 2.2 0.0 78.8 13.215.9 0.6 77.4 0.6 5.5 9.211.0 5.6 14.5 22.0 46.8 12.1
G. De Feo, S. De Gisi / Waste Management 30 (2010) 958–976 965
mous and what happened to their views and where the informa-tion was going.
At the beginning, it was quite easy to find people belonging tothe several age subdivisions. Going toward the end of each subdi-vision it was more and more difficult to find the correct category ofpeople. Therefore, the interviewers administered the questionnairein places where it was easier to find people of the required age.
2.4. Construction of the sample of people to interview
Only inhabitants not less than 14 years old were considered inthis study. This number was equal to 45,214 (12/31/2007, registeroffice of Nocera Inferiore). A sample of 903 people was interviewed(corresponding to a confidence level of 99% and a confidence inter-val of 4.25%). Therefore, a 2% sample of the population wasadopted. The sample was extracted in order to reproduce thestructure of the population of the city of Nocera Inferiore in termsof sex and age subdivisions, as stated above in presenting the pro-cedure. The numbers of males and females to interview for eachage subdivision (Table 3), the number of males and females tointerview for each area and the number of males and females tointerview for each area and for each age subdivision werecalculated.
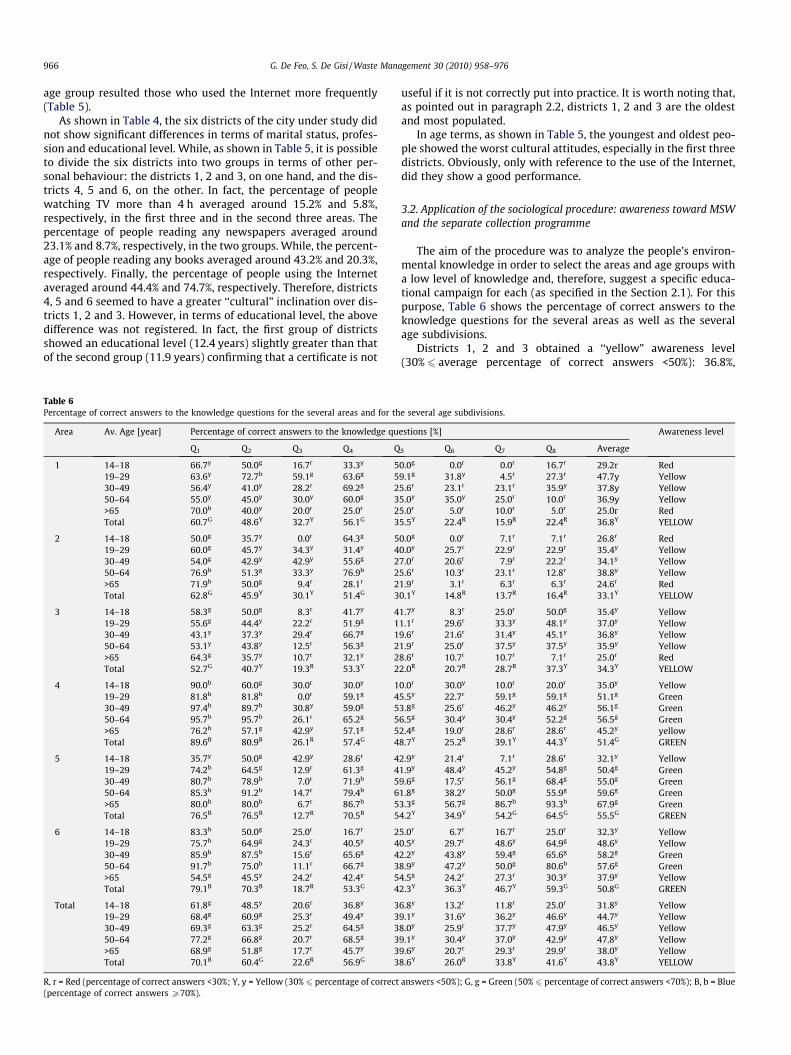
Table 5Social characteristics of the respondents: part II (other personal behaviour).
Area Age Av. Age TV > 4 h (%)
1 14–18 18.0 0.019–29 23.0 18.230–49 38.0 10.350–64 54.1 0.0>65 70.0 30.0Total 42.8 13.1
2 14–18 17.6 7.119–29 23.3 8.630–49 38.5 11.150–64 55.7 17.9>65 72.2 34.4Total 43.6 15.8
3 14–18 17.0 25.019–29 23.0 3.730–49 39.0 11.850–64 55.3 9.4>65 72.1 42.9Total 44.0 16.7
4 14–18 16.9 0.019–29 23.2 13.630–49 39.5 8.650–64 55.5 0.0>65 72.5 0.0Total 43.7 3.5
5 14–18 17.6 35.719–29 23.5 6.530–49 40.1 8.850–64 56.0 5.9>65 72.5 3.3Total 44.3 9.0
6 14–18 17.0 8.319–29 22.4 2.730–49 39.2 4.750–64 55.8 2.8>65 72 9.1Total 43.5 4.9
Total 14–18 17.3 14.719–29 23.1 8.030–49 39.2 8.350–64 55.5 7.1>65 72.0 20.1Total 43.7 10.6
3. Results and discussion
3.1. Social characteristics of respondents
The average age of the respondents was 43.7 years (Table 4).The respondents were 48.7% male and 51.3% female (Table 4).The percentage of married respondents was 62.6%, while those em-ployed was 46.8% (Table 4). A sort of educational level (EL) for eachage group and each area was calculated by summing the values ob-tained multiplying the years of study of each educational qualifica-tion by the corresponding percentages of respondents. Inparticular, as reported in De Feo et al. (2005), the following agedurations were adopted: 0 years for people that had no education,5 years of study for people having a primary school level, 8 yearsfor people with a secondary school level, 13 years for people hav-ing a high school education and finally, 18 years for those with auniversity degree. The EL of the total sample was 12.1 years ofstudy (Table 4). As shown in Table 4, the following are the obtainedresults for each age subdivision: EL(14–18) = 8.8 years, EL(19–29) = 13.0 years, EL(30–49) = 13.7 years, EL(50–64) = 13.2 years,EL(>65) = 9.2 years. As shown in Table 5, the oldest and youngestage groups resulted the main categories watching TV for more than4 h, reading any newspapers and books. Obviously, the youngest
No newspaper (%) No books (%) Internet (%)
33.3 16.7 100.04.5 22.7 90.97.7 43.6 38.5
15.0 20.0 15.035.0 90.0 10.015.0 42.1 43.0
28.6 42.9 92.928.6 28.6 85.727.0 30.2 42.920.5 48.7 33.343.8 90.6 0.029.0 45.4 45.4
33.3 8.3 91.711.1 25.9 92.621.6 37.3 39.225.0 40.6 31.342.9 82.1 3.625.3 42.0 44.7
0.0 10.0 100.018.2 13.6 100.028.6 28.6 85.7
0.0 13.0 91.34.8 33.3 0.05.2 15.7 79.1
50.0 57.1 57.16.5 0.0 100.0
10.5 12.3 73.711.8 14.7 76.5
3.3 10.0 50.012.0 13.9 73.5
0.0 41.7 91.716.2 29.7 86.5
6.3 26.6 85.95.6 16.7 86.1
12.1 54.5 3.08.8 31.3 71.4
25.0 32.4 86.814.9 20.7 92.013.4 26.5 62.913.6 27.2 56.523.8 59.8 11.616.5 32.0 59.7
966 G. De Feo, S. De Gisi / Waste Management 30 (2010) 958–976
age group resulted those who used the Internet more frequently(Table 5).
As shown in Table 4, the six districts of the city under study didnot show significant differences in terms of marital status, profes-sion and educational level. While, as shown in Table 5, it is possibleto divide the six districts into two groups in terms of other per-sonal behaviour: the districts 1, 2 and 3, on one hand, and the dis-tricts 4, 5 and 6, on the other. In fact, the percentage of peoplewatching TV more than 4 h averaged around 15.2% and 5.8%,respectively, in the first three and in the second three areas. Thepercentage of people reading any newspapers averaged around23.1% and 8.7%, respectively, in the two groups. While, the percent-age of people reading any books averaged around 43.2% and 20.3%,respectively. Finally, the percentage of people using the Internetaveraged around 44.4% and 74.7%, respectively. Therefore, districts4, 5 and 6 seemed to have a greater ‘‘cultural” inclination over dis-tricts 1, 2 and 3. However, in terms of educational level, the abovedifference was not registered. In fact, the first group of districtsshowed an educational level (12.4 years) slightly greater than thatof the second group (11.9 years) confirming that a certificate is not
Table 6Percentage of correct answers to the knowledge questions for the several areas and for th
Area Av. Age [year] Percentage of correct answers to the knowledge qu
Q1 Q2 Q3 Q4 Q
1 14–18 66.7y 50.0g 16.7r 33.3y 519–29 63.6y 72.7b 59.1g 63.6g 530–49 56.4y 41.0y 28.2r 69.2g 250–64 55.0y 45.0y 30.0y 60.0g 3>65 70.0b 40.0y 20.0r 25.0r 2Total 60.7G 48.6Y 32.7Y 56.1G 3
2 14–18 50.0g 35.7y 0.0r 64.3g 519–29 60.0g 45.7y 34.3y 31.4y 430–49 54.0g 42.9y 42.9y 55.6g 250–64 76.9b 51.3g 33.3y 76.9b 2>65 71.9b 50.0g 9.4r 28.1r 2Total 62.8G 45.9Y 30.1Y 51.4G 3
3 14–18 58.3g 50.0g 8.3r 41.7y 419–29 55.6g 44.4y 22.2r 51.9g 130–49 43.1y 37.3y 29.4r 66.7g 150–64 53.1y 43.8y 12.5r 56.3g 2>65 64.3g 35.7y 10.7r 32.1y 2Total 52.7G 40.7Y 19.3R 53.3Y 2
4 14–18 90.0b 60.0g 30.0r 30.0y 119–29 81.8b 81.8b 0.0r 59.1g 430–49 97.4b 89.7b 30.8y 59.0g 550–64 95.7b 95.7b 26.1r 65.2g 5>65 76.2b 57.1g 42.9y 57.1g 5Total 89.6B 80.9B 26.1R 57.4G 4
5 14–18 35.7y 50.0g 42.9y 28.6r 419–29 74.2b 64.5g 12.9r 61.3g 430–49 80.7b 78.9b 7.0r 71.9b 550–64 85.3b 91.2b 14.7r 79.4b 6>65 80.0b 80.0b 6.7r 86.7b 5Total 76.5B 76.5B 12.7R 70.5B 5
6 14–18 83.3b 50.0g 25.0r 16.7r 219–29 75.7b 64.9g 24.3r 40.5y 430–49 85.9b 87.5b 15.6r 65.6g 450–64 91.7b 75.0b 11.1r 66.7g 3>65 54.5g 45.5y 24.2r 42.4y 5Total 79.1B 70.3B 18.7R 53.3G 4
Total 14–18 61.8g 48.5y 20.6r 36.8y 319–29 68.4g 60.9g 25.3r 49.4y 330–49 69.3g 63.3g 25.2r 64.5g 350–64 77.2g 66.8g 20.7r 68.5g 3>65 68.9g 51.8g 17.7r 45.7y 3Total 70.1B 60.4G 22.6R 56.9G 3
R, r = Red (percentage of correct answers <30%; Y, y = Yellow (30% 6 percentage of correct(percentage of correct answers P70%).
useful if it is not correctly put into practice. It is worth noting that,as pointed out in paragraph 2.2, districts 1, 2 and 3 are the oldestand most populated.
In age terms, as shown in Table 5, the youngest and oldest peo-ple showed the worst cultural attitudes, especially in the first threedistricts. Obviously, only with reference to the use of the Internet,did they show a good performance.
3.2. Application of the sociological procedure: awareness toward MSWand the separate collection programme
The aim of the procedure was to analyze the people’s environ-mental knowledge in order to select the areas and age groups witha low level of knowledge and, therefore, suggest a specific educa-tional campaign for each (as specified in the Section 2.1). For thispurpose, Table 6 shows the percentage of correct answers to theknowledge questions for the several areas as well as the severalage subdivisions.
Districts 1, 2 and 3 obtained a ‘‘yellow” awareness level(30% 6 average percentage of correct answers <50%): 36.8%,
e several age subdivisions.
estions [%] Awareness level
5 Q6 Q7 Q8 Average
0.0g 0.0r 0.0r 16.7r 29.2r Red9.1g 31.8y 4.5r 27.3r 47.7y Yellow5.6r 23.1r 23.1r 35.9y 37.8y Yellow5.0y 35.0y 25.0r 10.0r 36.9y Yellow5.0r 5.0r 10.0r 5.0r 25.0r Red5.5Y 22.4R 15.9R 22.4R 36.8Y YELLOW
0.0g 0.0r 7.1r 7.1r 26.8r Red0.0y 25.7r 22.9r 22.9r 35.4y Yellow7.0r 20.6r 7.9r 22.2r 34.1y Yellow5.6r 10.3r 23.1r 12.8r 38.8y Yellow1.9r 3.1r 6.3r 6.3r 24.6r Red0.1Y 14.8R 13.7R 16.4R 33.1Y YELLOW
1.7y 8.3r 25.0r 50.0g 35.4y Yellow1.1r 29.6r 33.3y 48.1y 37.0y Yellow9.6r 21.6r 31.4y 45.1y 36.8y Yellow1.9r 25.0r 37.5y 37.5y 35.9y Yellow8.6r 10.7r 10.7r 7.1r 25.0r Red2.0R 20.7R 28.7R 37.3Y 34.3Y YELLOW
0.0r 30.0y 10.0r 20.0r 35.0y Yellow5.5y 22.7r 59.1g 59.1g 51.1g Green3.8g 25.6r 46.2y 46.2y 56.1g Green6.5g 30.4y 30.4y 52.2g 56.5g Green2.4g 19.0r 28.6r 28.6r 45.2y yellow8.7Y 25.2R 39.1Y 44.3Y 51.4G GREEN
2.9y 21.4r 7.1r 28.6r 32.1y Yellow1.9y 48.4y 45.2y 54.8g 50.4g Green9.6g 17.5r 56.1g 68.4g 55.0g Green1.8g 38.2y 50.0g 55.9g 59.6g Green3.3g 56.7g 86.7b 93.3b 67.9g Green4.2Y 34.9Y 54.2G 64.5G 55.5G GREEN
5.0r 6.7r 16.7r 25.0r 32.3y Yellow0.5y 29.7r 48.6y 64.9g 48.6y Yellow2.2y 43.8y 59.4g 65.6g 58.2g Green8.9y 47.2y 50.0g 80.6b 57.6g Green4.5g 24.2r 27.3r 30.3y 37.9y Yellow2.3Y 36.3Y 46.7Y 59.3G 50.8G GREEN
6.8y 13.2r 11.8r 25.0r 31.8y Yellow9.1y 31.6y 36.2y 46.6y 44.7y Yellow8.0y 25.9r 37.7y 47.9y 46.5y Yellow9.1y 30.4y 37.0y 42.9y 47.8y Yellow9.6y 20.7r 29.3r 29.9r 38.0y Yellow8.6Y 26.0R 33.8Y 41.6Y 43.8Y YELLOW
answers <50%); G, g = Green (50% 6 percentage of correct answers <70%); B, b = Blue
G. De Feo, S. De Gisi / Waste Management 30 (2010) 958–976 967
33.1% and 34.3%, respectively. While, districts 4, 5 and 6 showed a‘‘green” awareness level (50% 6 average percentage of correct an-swers <70%): 51.4%, 55.5% and 50.8%, respectively. This means thatin the first group of areas (1, 2 and 3) a targeted education cam-paign has to be implemented to the age groups which showedthe lowest levels of awareness and regarding the specific argu-ments related to the questions where people showed a poor levelof awareness. While, in the second group of areas (4, 5 and 6) alight education campaign can be performed based on the focusgroup instrument (Darby and Obara, 2005; Martin et al., 2006; Ref-sgaard and Magnussen, 2009). The registered response was in com-pliance with the fact that the two groups of districts showeddifferent personal behaviours regarding cultural attitude such asreading newspapers and books, watching TV and using the Inter-net. This result confirms that the lack of information plays a keyrole on the level of awareness (Martin et al., 2006; Alexanderet al., 2009). Moreover, the ‘‘green” districts were the suburbanareas, less densely populated and with modern buildings.
The youngest (14–18 years) and oldest (>65 years) peopleshowed the lowest level of awareness for each area, excepted forthe oldest people in district 5. This registered behaviour, partiallydisagrees with the findings of Hage et al. (2009) who stated that
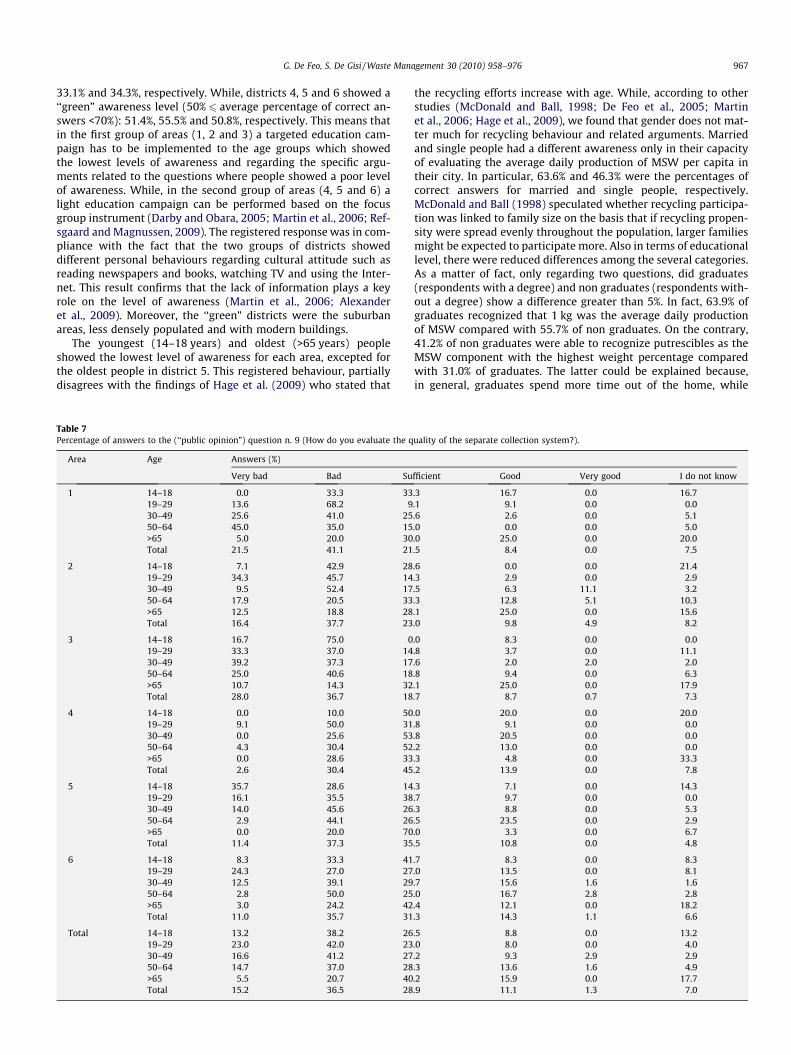
Table 7Percentage of answers to the (‘‘public opinion”) question n. 9 (How do you evaluate the q
Area Age Answers (%)
Very bad Bad Su
1 14–18 0.0 33.3 3319–29 13.6 68.2 930–49 25.6 41.0 2550–64 45.0 35.0 15>65 5.0 20.0 30Total 21.5 41.1 21
2 14–18 7.1 42.9 2819–29 34.3 45.7 1430–49 9.5 52.4 1750–64 17.9 20.5 33>65 12.5 18.8 28Total 16.4 37.7 23
3 14–18 16.7 75.0 019–29 33.3 37.0 1430–49 39.2 37.3 1750–64 25.0 40.6 18>65 10.7 14.3 32Total 28.0 36.7 18
4 14–18 0.0 10.0 5019–29 9.1 50.0 3130–49 0.0 25.6 5350–64 4.3 30.4 52>65 0.0 28.6 33Total 2.6 30.4 45
5 14–18 35.7 28.6 1419–29 16.1 35.5 3830–49 14.0 45.6 2650–64 2.9 44.1 26>65 0.0 20.0 70Total 11.4 37.3 35
6 14–18 8.3 33.3 4119–29 24.3 27.0 2730–49 12.5 39.1 2950–64 2.8 50.0 25>65 3.0 24.2 42Total 11.0 35.7 31
Total 14–18 13.2 38.2 2619–29 23.0 42.0 2330–49 16.6 41.2 2750–64 14.7 37.0 28>65 5.5 20.7 40Total 15.2 36.5 28
the recycling efforts increase with age. While, according to otherstudies (McDonald and Ball, 1998; De Feo et al., 2005; Martinet al., 2006; Hage et al., 2009), we found that gender does not mat-ter much for recycling behaviour and related arguments. Marriedand single people had a different awareness only in their capacityof evaluating the average daily production of MSW per capita intheir city. In particular, 63.6% and 46.3% were the percentages ofcorrect answers for married and single people, respectively.McDonald and Ball (1998) speculated whether recycling participa-tion was linked to family size on the basis that if recycling propen-sity were spread evenly throughout the population, larger familiesmight be expected to participate more. Also in terms of educationallevel, there were reduced differences among the several categories.As a matter of fact, only regarding two questions, did graduates(respondents with a degree) and non graduates (respondents with-out a degree) show a difference greater than 5%. In fact, 63.9% ofgraduates recognized that 1 kg was the average daily productionof MSW compared with 55.7% of non graduates. On the contrary,41.2% of non graduates were able to recognize putrescibles as theMSW component with the highest weight percentage comparedwith 31.0% of graduates. The latter could be explained because,in general, graduates spend more time out of the home, while
uality of the separate collection system?).
fficient Good Very good I do not know
.3 16.7 0.0 16.7
.1 9.1 0.0 0.0
.6 2.6 0.0 5.1
.0 0.0 0.0 5.0
.0 25.0 0.0 20.0
.5 8.4 0.0 7.5
.6 0.0 0.0 21.4
.3 2.9 0.0 2.9
.5 6.3 11.1 3.2
.3 12.8 5.1 10.3
.1 25.0 0.0 15.6
.0 9.8 4.9 8.2
.0 8.3 0.0 0.0
.8 3.7 0.0 11.1
.6 2.0 2.0 2.0
.8 9.4 0.0 6.3
.1 25.0 0.0 17.9
.7 8.7 0.7 7.3
.0 20.0 0.0 20.0
.8 9.1 0.0 0.0
.8 20.5 0.0 0.0
.2 13.0 0.0 0.0
.3 4.8 0.0 33.3
.2 13.9 0.0 7.8
.3 7.1 0.0 14.3
.7 9.7 0.0 0.0
.3 8.8 0.0 5.3
.5 23.5 0.0 2.9
.0 3.3 0.0 6.7
.5 10.8 0.0 4.8
.7 8.3 0.0 8.3
.0 13.5 0.0 8.1
.7 15.6 1.6 1.6
.0 16.7 2.8 2.8
.4 12.1 0.0 18.2
.3 14.3 1.1 6.6
.5 8.8 0.0 13.2
.0 8.0 0.0 4.0
.2 9.3 2.9 2.9
.3 13.6 1.6 4.9
.2 15.9 0.0 17.7
.9 11.1 1.3 7.0
968 G. De Feo, S. De Gisi / Waste Management 30 (2010) 958–976
non graduates (especially housewives) spend more time on house-work and therefore have more familiarity with kitchen waste.
As shown in Table 6, the highest percentages were obtained forquestions n. 1 (‘‘Is there separate collection of MWS in your munic-ipality?”, ‘‘blue” level), n. 2 (‘‘With which systems are MSW col-lected?”, ‘‘green” level) and n. 4 (‘‘What is the average dailyproduction of MSW per capita in your municipality?”, ‘‘green” le-vel). In particular, 70.1% of people knew that there was a separatecollection program. In the light of the tendency of the public toexaggerate their pro-environmental behaviours (Williams andKelly, 2003), the registered percentage was alarming. As a matterof fact, only 60.4% knew that there was a separate bring collectionsystem. Moreover, 56.9% of people knew that their average dailyproduction of MSW was around 1 kg. Therefore, the more specificthe question was, the lower the percentage of correct answers was.
Regarding questions n. 1 and 2, the best respondents were peo-ple in the category 50–64, in area n. 4, with 95.7% of correct an-swers. As a matter of fact, Table 2 points out that 0% of themwatch TV for more than 4 h, 0% of them do not read newspapers,only 13.0% of them do not read books and 91.3% of them use theInternet (which was clearly the highest percentage in the cate-gory). Therefore, we have the confirmation that good habits in
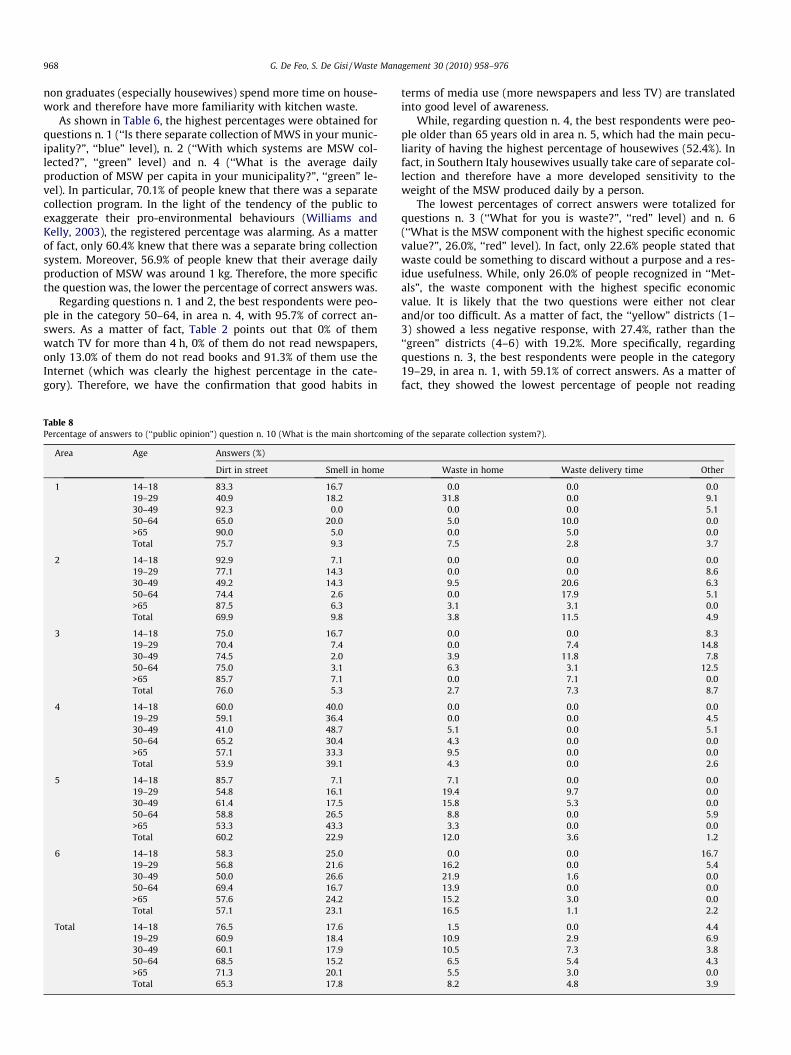
Table 8Percentage of answers to (‘‘public opinion”) question n. 10 (What is the main shortcomin
Area Age Answers (%)
Dirt in street Smell in home
1 14–18 83.3 16.719–29 40.9 18.230–49 92.3 0.050–64 65.0 20.0>65 90.0 5.0Total 75.7 9.3
2 14–18 92.9 7.119–29 77.1 14.330–49 49.2 14.350–64 74.4 2.6>65 87.5 6.3Total 69.9 9.8
3 14–18 75.0 16.719–29 70.4 7.430–49 74.5 2.050–64 75.0 3.1>65 85.7 7.1Total 76.0 5.3
4 14–18 60.0 40.019–29 59.1 36.430–49 41.0 48.750–64 65.2 30.4>65 57.1 33.3Total 53.9 39.1
5 14–18 85.7 7.119–29 54.8 16.130–49 61.4 17.550–64 58.8 26.5>65 53.3 43.3Total 60.2 22.9
6 14–18 58.3 25.019–29 56.8 21.630–49 50.0 26.650–64 69.4 16.7>65 57.6 24.2Total 57.1 23.1
Total 14–18 76.5 17.619–29 60.9 18.430–49 60.1 17.950–64 68.5 15.2>65 71.3 20.1Total 65.3 17.8
terms of media use (more newspapers and less TV) are translatedinto good level of awareness.
While, regarding question n. 4, the best respondents were peo-ple older than 65 years old in area n. 5, which had the main pecu-liarity of having the highest percentage of housewives (52.4%). Infact, in Southern Italy housewives usually take care of separate col-lection and therefore have a more developed sensitivity to theweight of the MSW produced daily by a person.
The lowest percentages of correct answers were totalized forquestions n. 3 (‘‘What for you is waste?”, ‘‘red” level) and n. 6(‘‘What is the MSW component with the highest specific economicvalue?”, 26.0%, ‘‘red” level). In fact, only 22.6% people stated thatwaste could be something to discard without a purpose and a res-idue usefulness. While, only 26.0% of people recognized in ‘‘Met-als”, the waste component with the highest specific economicvalue. It is likely that the two questions were either not clearand/or too difficult. As a matter of fact, the ‘‘yellow” districts (1–3) showed a less negative response, with 27.4%, rather than the‘‘green” districts (4–6) with 19.2%. More specifically, regardingquestions n. 3, the best respondents were people in the category19–29, in area n. 1, with 59.1% of correct answers. As a matter offact, they showed the lowest percentage of people not reading
g of the separate collection system?).
Waste in home Waste delivery time Other
0.0 0.0 0.031.8 0.0 9.1
0.0 0.0 5.15.0 10.0 0.00.0 5.0 0.07.5 2.8 3.7
0.0 0.0 0.00.0 0.0 8.69.5 20.6 6.30.0 17.9 5.13.1 3.1 0.03.8 11.5 4.9
0.0 0.0 8.30.0 7.4 14.83.9 11.8 7.86.3 3.1 12.50.0 7.1 0.02.7 7.3 8.7
0.0 0.0 0.00.0 0.0 4.55.1 0.0 5.14.3 0.0 0.09.5 0.0 0.04.3 0.0 2.6
7.1 0.0 0.019.4 9.7 0.015.8 5.3 0.0
8.8 0.0 5.93.3 0.0 0.0
12.0 3.6 1.2
0.0 0.0 16.716.2 0.0 5.421.9 1.6 0.013.9 0.0 0.015.2 3.0 0.016.5 1.1 2.2
1.5 0.0 4.410.9 2.9 6.910.5 7.3 3.8
6.5 5.4 4.35.5 3.0 0.08.2 4.8 3.9
G. De Feo, S. De Gisi / Waste Management 30 (2010) 958–976 969
newspapers in their category. While, regarding question n. 6, thebest respondents were again people older than 65 in the area n.5 (the best also for question n. 4).
Finally, questions n. 5 (‘‘What is the MSW component with thehighest weight percentage?”), n. 7 (‘‘What is compost?”) and n. 8(‘‘What does RDF mean?”) obtained a poor level of awareness(‘‘yellow” level). In fact, only 38.6% of people knew that ‘‘Putresci-bles” was the MSW component with the highest weight percent-age. While, only 33.8% knew what compost is. Finally, only 41.6%known what RDF means. More specifically, regarding questionsn. 5, the best respondents were people in the category 50–64, inarea n. 5 (the less urbanised), with 61.8% of correct answers. More-over, in general, the best respondents were the oldest people whoare essentially of peasant origin and therefore are more familiarwith the organic fraction of MSW. Regarding question n. 7, the bestrespondents were the oldest people, in area n. 5, with 86.7%. In thelight of the comment performed for the previous question, this re-sult is not surprising because area n. 5 is the less urbanised, withthe highest percentage of people with a peasant origin. Moreover,there is a significant difference between ‘‘yellow” and ‘‘green” dis-tricts with 19.4% and 46.7% of correct answers, respectively.Regarding question n. 8, about the meaning of RDF, the best
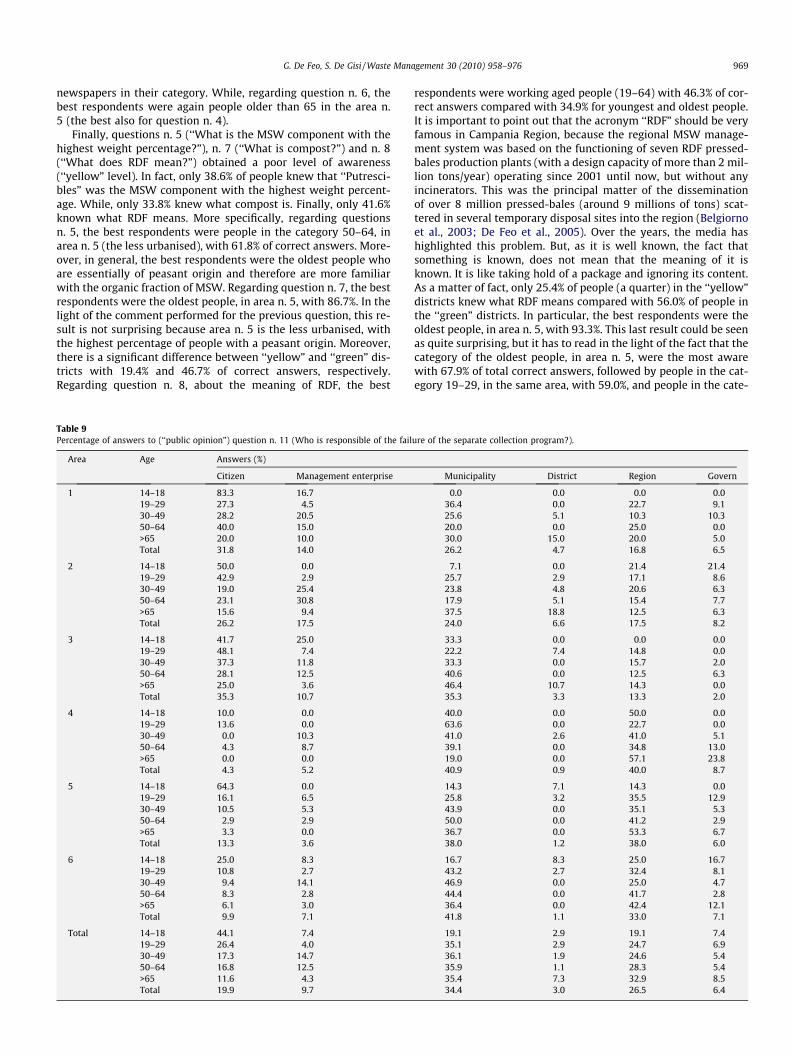
Table 9Percentage of answers to (‘‘public opinion”) question n. 11 (Who is responsible of the fail
Area Age Answers (%)
Citizen Management enterprise
1 14–18 83.3 16.719–29 27.3 4.530–49 28.2 20.550–64 40.0 15.0>65 20.0 10.0Total 31.8 14.0
2 14–18 50.0 0.019–29 42.9 2.930–49 19.0 25.450–64 23.1 30.8>65 15.6 9.4Total 26.2 17.5
3 14–18 41.7 25.019–29 48.1 7.430–49 37.3 11.850–64 28.1 12.5>65 25.0 3.6Total 35.3 10.7
4 14–18 10.0 0.019–29 13.6 0.030–49 0.0 10.350–64 4.3 8.7>65 0.0 0.0Total 4.3 5.2
5 14–18 64.3 0.019–29 16.1 6.530–49 10.5 5.350–64 2.9 2.9>65 3.3 0.0Total 13.3 3.6
6 14–18 25.0 8.319–29 10.8 2.730–49 9.4 14.150–64 8.3 2.8>65 6.1 3.0Total 9.9 7.1
Total 14–18 44.1 7.419–29 26.4 4.030–49 17.3 14.750–64 16.8 12.5>65 11.6 4.3Total 19.9 9.7
respondents were working aged people (19–64) with 46.3% of cor-rect answers compared with 34.9% for youngest and oldest people.It is important to point out that the acronym ‘‘RDF” should be veryfamous in Campania Region, because the regional MSW manage-ment system was based on the functioning of seven RDF pressed-bales production plants (with a design capacity of more than 2 mil-lion tons/year) operating since 2001 until now, but without anyincinerators. This was the principal matter of the disseminationof over 8 million pressed-bales (around 9 millions of tons) scat-tered in several temporary disposal sites into the region (Belgiornoet al., 2003; De Feo et al., 2005). Over the years, the media hashighlighted this problem. But, as it is well known, the fact thatsomething is known, does not mean that the meaning of it isknown. It is like taking hold of a package and ignoring its content.As a matter of fact, only 25.4% of people (a quarter) in the ‘‘yellow”districts knew what RDF means compared with 56.0% of people inthe ‘‘green” districts. In particular, the best respondents were theoldest people, in area n. 5, with 93.3%. This last result could be seenas quite surprising, but it has to read in the light of the fact that thecategory of the oldest people, in area n. 5, were the most awarewith 67.9% of total correct answers, followed by people in the cat-egory 19–29, in the same area, with 59.0%, and people in the cate-
ure of the separate collection program?).
Municipality District Region Govern
0.0 0.0 0.0 0.036.4 0.0 22.7 9.125.6 5.1 10.3 10.320.0 0.0 25.0 0.030.0 15.0 20.0 5.026.2 4.7 16.8 6.5
7.1 0.0 21.4 21.425.7 2.9 17.1 8.623.8 4.8 20.6 6.317.9 5.1 15.4 7.737.5 18.8 12.5 6.324.0 6.6 17.5 8.2
33.3 0.0 0.0 0.022.2 7.4 14.8 0.033.3 0.0 15.7 2.040.6 0.0 12.5 6.346.4 10.7 14.3 0.035.3 3.3 13.3 2.0
40.0 0.0 50.0 0.063.6 0.0 22.7 0.041.0 2.6 41.0 5.139.1 0.0 34.8 13.019.0 0.0 57.1 23.840.9 0.9 40.0 8.7
14.3 7.1 14.3 0.025.8 3.2 35.5 12.943.9 0.0 35.1 5.350.0 0.0 41.2 2.936.7 0.0 53.3 6.738.0 1.2 38.0 6.0
16.7 8.3 25.0 16.743.2 2.7 32.4 8.146.9 0.0 25.0 4.744.4 0.0 41.7 2.836.4 0.0 42.4 12.141.8 1.1 33.0 7.1
19.1 2.9 19.1 7.435.1 2.9 24.7 6.936.1 1.9 24.6 5.435.9 1.1 28.3 5.435.4 7.3 32.9 8.534.4 3.0 26.5 6.4
970 G. De Feo, S. De Gisi / Waste Management 30 (2010) 958–976
gory 30–49, in area n. 6, with 58.2%. Finally, we can reflect on thefact that a low level of environmental awareness was recognized asone of the main reasons to the realization of all kinds of MSW facil-ities (Rahardyan et al., 2004). For instance, De Feo et al. (2005), in asurvey on public opinion and resident’s concerns, perceptions andattitudes toward MSW facilities in an area not far from that of thisstudy, showed that some people in the Campania Region were con-vinced that waste was burned in a RDF production plant. In partic-ular, the worst answer was given by the youngest people: 47.1% ofthem thought that waste was incinerated in a RDF plant.
3.3. Public opinion
In this paragraph the results relating to the ‘‘public opinion”questions are presented and discussed. In particular, differencesamong the areas and age subdivisions are emphasized. Moreover,since there was a particular difference in terms of personal behav-iour and awareness as well as in terms of population density andkinds of dwellings between the districts 1, 2 and 3 (‘‘yellow” dis-tricts), on one hand, and districts 4, 5 and 6 (‘‘green” districts),on the other, one of the aims of the investigation was to verify ifthere were analogous differences in terms of public opinion.
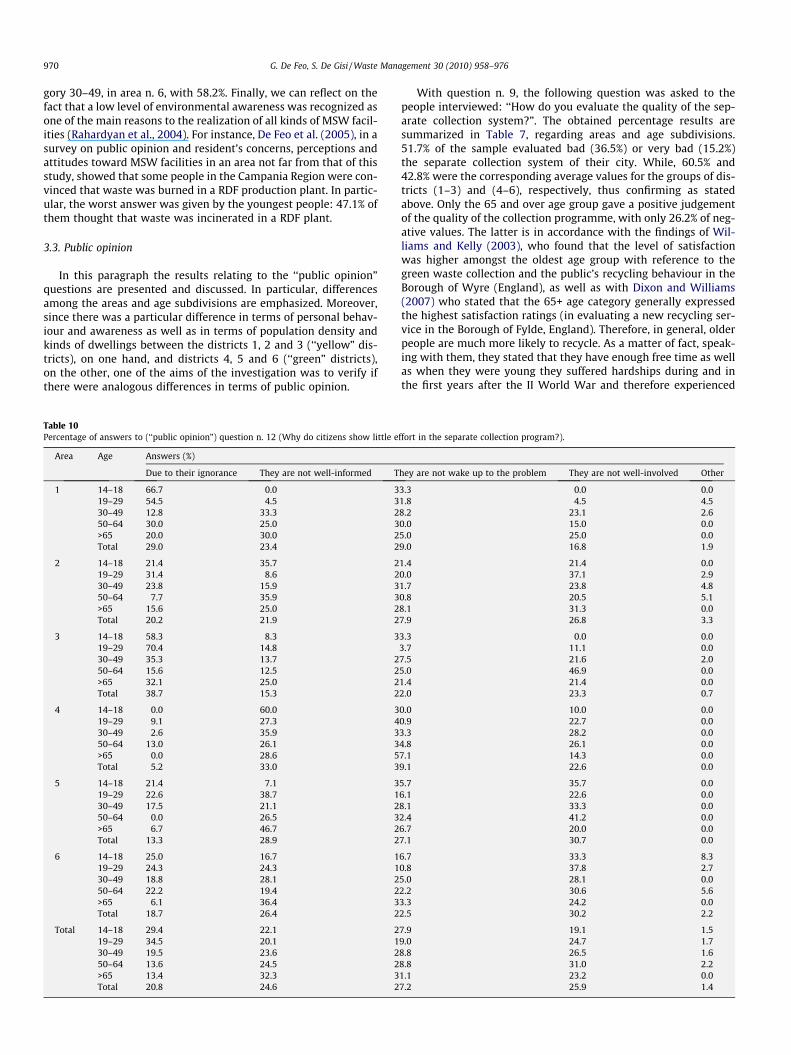
Table 10Percentage of answers to (‘‘public opinion”) question n. 12 (Why do citizens show little e
Area Age Answers (%)
Due to their ignorance They are not well-informed T
1 14–18 66.7 0.0 319–29 54.5 4.5 330–49 12.8 33.3 250–64 30.0 25.0 3>65 20.0 30.0 2Total 29.0 23.4 2
2 14–18 21.4 35.7 219–29 31.4 8.6 230–49 23.8 15.9 350–64 7.7 35.9 3>65 15.6 25.0 2Total 20.2 21.9 2
3 14–18 58.3 8.3 319–29 70.4 14.830–49 35.3 13.7 250–64 15.6 12.5 2>65 32.1 25.0 2Total 38.7 15.3 2
4 14–18 0.0 60.0 319–29 9.1 27.3 430–49 2.6 35.9 350–64 13.0 26.1 3>65 0.0 28.6 5Total 5.2 33.0 3
5 14–18 21.4 7.1 319–29 22.6 38.7 130–49 17.5 21.1 250–64 0.0 26.5 3>65 6.7 46.7 2Total 13.3 28.9 2
6 14–18 25.0 16.7 119–29 24.3 24.3 130–49 18.8 28.1 250–64 22.2 19.4 2>65 6.1 36.4 3Total 18.7 26.4 2
Total 14–18 29.4 22.1 219–29 34.5 20.1 130–49 19.5 23.6 250–64 13.6 24.5 2>65 13.4 32.3 3Total 20.8 24.6 2
With question n. 9, the following question was asked to thepeople interviewed: ‘‘How do you evaluate the quality of the sep-arate collection system?”. The obtained percentage results aresummarized in Table 7, regarding areas and age subdivisions.51.7% of the sample evaluated bad (36.5%) or very bad (15.2%)the separate collection system of their city. While, 60.5% and42.8% were the corresponding average values for the groups of dis-tricts (1–3) and (4–6), respectively, thus confirming as statedabove. Only the 65 and over age group gave a positive judgementof the quality of the collection programme, with only 26.2% of neg-ative values. The latter is in accordance with the findings of Wil-liams and Kelly (2003), who found that the level of satisfactionwas higher amongst the oldest age group with reference to thegreen waste collection and the public’s recycling behaviour in theBorough of Wyre (England), as well as with Dixon and Williams(2007) who stated that the 65+ age category generally expressedthe highest satisfaction ratings (in evaluating a new recycling ser-vice in the Borough of Fylde, England). Therefore, in general, olderpeople are much more likely to recycle. As a matter of fact, speak-ing with them, they stated that they have enough free time as wellas when they were young they suffered hardships during and inthe first years after the II World War and therefore experienced
ffort in the separate collection program?).
hey are not wake up to the problem They are not well-involved Other
3.3 0.0 0.01.8 4.5 4.58.2 23.1 2.60.0 15.0 0.05.0 25.0 0.09.0 16.8 1.9
1.4 21.4 0.00.0 37.1 2.91.7 23.8 4.80.8 20.5 5.18.1 31.3 0.07.9 26.8 3.3
3.3 0.0 0.03.7 11.1 0.07.5 21.6 2.05.0 46.9 0.01.4 21.4 0.02.0 23.3 0.7
0.0 10.0 0.00.9 22.7 0.03.3 28.2 0.04.8 26.1 0.07.1 14.3 0.09.1 22.6 0.0
5.7 35.7 0.06.1 22.6 0.08.1 33.3 0.02.4 41.2 0.06.7 20.0 0.07.1 30.7 0.0
6.7 33.3 8.30.8 37.8 2.75.0 28.1 0.02.2 30.6 5.63.3 24.2 0.02.5 30.2 2.2
7.9 19.1 1.59.0 24.7 1.78.8 26.5 1.68.8 31.0 2.21.1 23.2 0.07.2 25.9 1.4
G. De Feo, S. De Gisi / Waste Management 30 (2010) 958–976 971
the importance of giving the right value to everything. Moreover,in the past they had the opportunity to take part in the returnableempties program. In accordance to Alexander et al. (2009), femalesshowed a slightly higher satisfaction rating (43.4%) compared withthat of males (39.1%). While, married and single people gave quitedifferent negative responses (dissatisfaction): 43.9% and 64.8%,respectively. Similarly, De Feo et al. (2005) registered a certain dif-ference of opinion between married and single people in the sameregion and with regarding analogous issues. In that study, De Feoet al. (2005) also found a difference between the views of gradu-ates and non graduates. An analogous difference was found in thisresearch. In fact, 63.3% of graduates are unsatisfied compared with49.2% of non graduates.
As shown in Table 8, question n. 10 was aimed at verifying whatwas the main shortcoming of the separate collection system. Allthe citizens in the several areas were unanimous in pointing outthe presence of dirt in the street as the main shortcoming. About73.9% and 57.1% were the corresponding average values for thegroups of districts (1–3) and (4–6), respectively, confirming theinfluence of personal behaviour on public opinion. All the agegroups showed the same opinion, but with the highest percentage
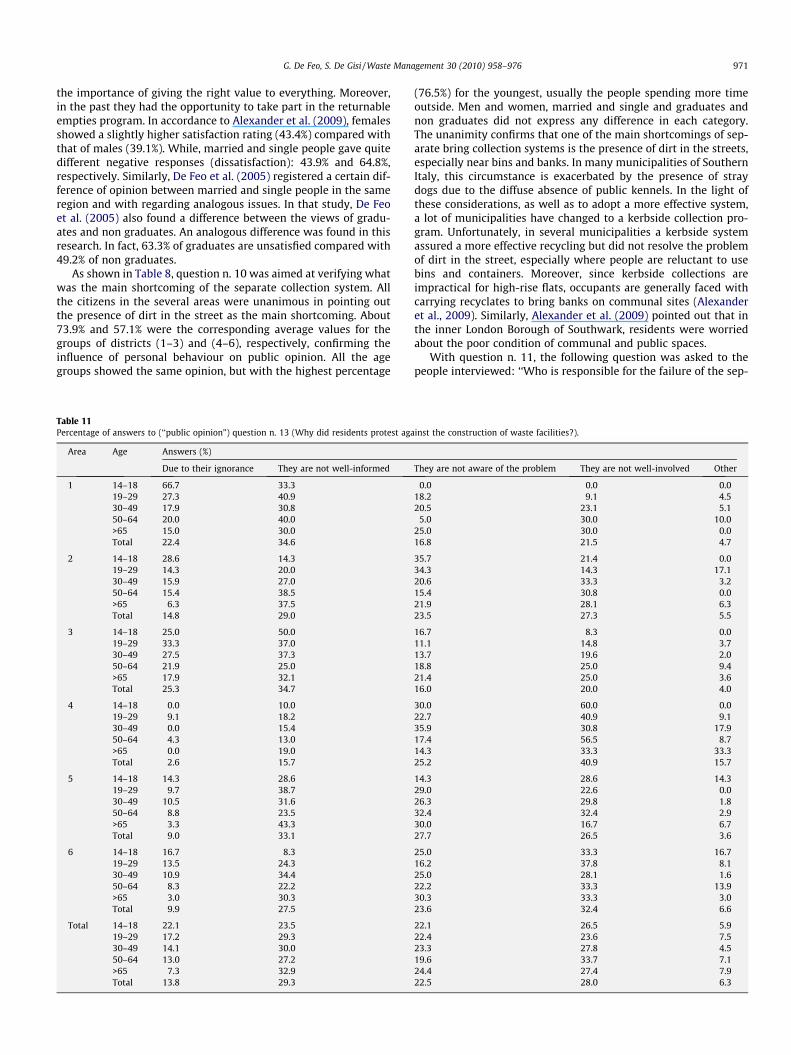
Table 11Percentage of answers to (‘‘public opinion”) question n. 13 (Why did residents protest aga
Area Age Answers (%)
Due to their ignorance They are not well-informed
1 14–18 66.7 33.319–29 27.3 40.930–49 17.9 30.850–64 20.0 40.0>65 15.0 30.0Total 22.4 34.6
2 14–18 28.6 14.319–29 14.3 20.030–49 15.9 27.050–64 15.4 38.5>65 6.3 37.5Total 14.8 29.0
3 14–18 25.0 50.019–29 33.3 37.030–49 27.5 37.350–64 21.9 25.0>65 17.9 32.1Total 25.3 34.7
4 14–18 0.0 10.019–29 9.1 18.230–49 0.0 15.450–64 4.3 13.0>65 0.0 19.0Total 2.6 15.7
5 14–18 14.3 28.619–29 9.7 38.730–49 10.5 31.650–64 8.8 23.5>65 3.3 43.3Total 9.0 33.1
6 14–18 16.7 8.319–29 13.5 24.330–49 10.9 34.450–64 8.3 22.2>65 3.0 30.3Total 9.9 27.5
Total 14–18 22.1 23.519–29 17.2 29.330–49 14.1 30.050–64 13.0 27.2>65 7.3 32.9Total 13.8 29.3
(76.5%) for the youngest, usually the people spending more timeoutside. Men and women, married and single and graduates andnon graduates did not express any difference in each category.The unanimity confirms that one of the main shortcomings of sep-arate bring collection systems is the presence of dirt in the streets,especially near bins and banks. In many municipalities of SouthernItaly, this circumstance is exacerbated by the presence of straydogs due to the diffuse absence of public kennels. In the light ofthese considerations, as well as to adopt a more effective system,a lot of municipalities have changed to a kerbside collection pro-gram. Unfortunately, in several municipalities a kerbside systemassured a more effective recycling but did not resolve the problemof dirt in the street, especially where people are reluctant to usebins and containers. Moreover, since kerbside collections areimpractical for high-rise flats, occupants are generally faced withcarrying recyclates to bring banks on communal sites (Alexanderet al., 2009). Similarly, Alexander et al. (2009) pointed out that inthe inner London Borough of Southwark, residents were worriedabout the poor condition of communal and public spaces.
With question n. 11, the following question was asked to thepeople interviewed: ‘‘Who is responsible for the failure of the sep-
inst the construction of waste facilities?).
They are not aware of the problem They are not well-involved Other
0.0 0.0 0.018.2 9.1 4.520.5 23.1 5.1
5.0 30.0 10.025.0 30.0 0.016.8 21.5 4.7
35.7 21.4 0.034.3 14.3 17.120.6 33.3 3.215.4 30.8 0.021.9 28.1 6.323.5 27.3 5.5
16.7 8.3 0.011.1 14.8 3.713.7 19.6 2.018.8 25.0 9.421.4 25.0 3.616.0 20.0 4.0
30.0 60.0 0.022.7 40.9 9.135.9 30.8 17.917.4 56.5 8.714.3 33.3 33.325.2 40.9 15.7
14.3 28.6 14.329.0 22.6 0.026.3 29.8 1.832.4 32.4 2.930.0 16.7 6.727.7 26.5 3.6
25.0 33.3 16.716.2 37.8 8.125.0 28.1 1.622.2 33.3 13.930.3 33.3 3.023.6 32.4 6.6
22.1 26.5 5.922.4 23.6 7.523.3 27.8 4.519.6 33.7 7.124.4 27.4 7.922.5 28.0 6.3
972 G. De Feo, S. De Gisi / Waste Management 30 (2010) 958–976
arate collection program?”. The obtained percentages are summa-rized in Table 9, regarding areas and age subdivisions. About 34.4%of the sample retained that the Municipality had the most respon-sibility. While, 31.1% and 40.2% were the corresponding averagevalues for the ‘‘yellow” and ‘‘green” districts, respectively. Onlythe youngest age group gave a ‘‘non political” answer retainingthat the citizen was principally responsible. In practice, the youn-gest age group made self-criticism considering that they revealed alow level of participation to the separate collection programme.The results obtained to this question, could be read in the lightof what Martin et al. (2006) stated in evaluating the perceptionof Council responsibility for waste disposal against recycling par-ticipation. In fact, they argued that people who believed them-selves to be less influential also believed themselves, ipso facto,less responsible. In this sense, the oldest people retaining them-selves to be less influential, have retained that citizens have lessresponsibility for the failure of the separate collection program.
As shown in Table 10, question n. 12 was aimed at verifyingwhy citizens show little effort in the separate collection program.This question has to be considered in the light of the situation ofserious solid waste emergency suffered by the Campania Region,
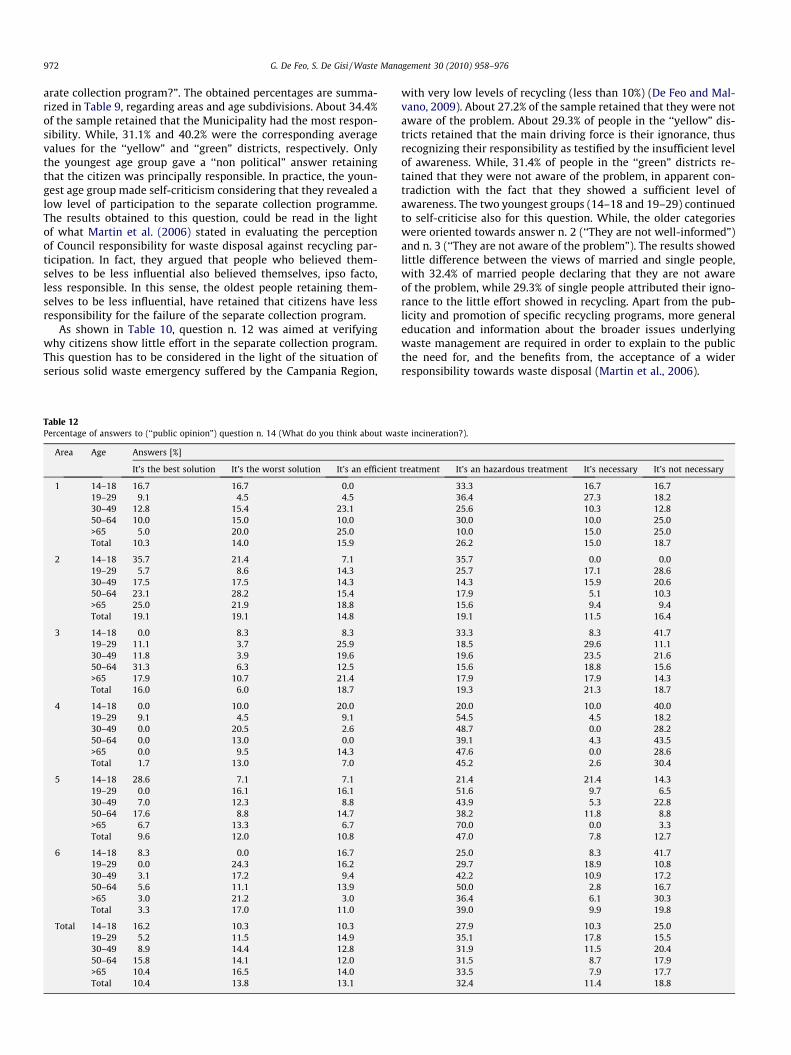
Table 12Percentage of answers to (‘‘public opinion”) question n. 14 (What do you think about was
Area Age Answers [%]
It’s the best solution It’s the worst solution It’s an efficient
1 14–18 16.7 16.7 0.019–29 9.1 4.5 4.530–49 12.8 15.4 23.150–64 10.0 15.0 10.0>65 5.0 20.0 25.0Total 10.3 14.0 15.9
2 14–18 35.7 21.4 7.119–29 5.7 8.6 14.330–49 17.5 17.5 14.350–64 23.1 28.2 15.4>65 25.0 21.9 18.8Total 19.1 19.1 14.8
3 14–18 0.0 8.3 8.319–29 11.1 3.7 25.930–49 11.8 3.9 19.650–64 31.3 6.3 12.5>65 17.9 10.7 21.4Total 16.0 6.0 18.7
4 14–18 0.0 10.0 20.019–29 9.1 4.5 9.130–49 0.0 20.5 2.650–64 0.0 13.0 0.0>65 0.0 9.5 14.3Total 1.7 13.0 7.0
5 14–18 28.6 7.1 7.119–29 0.0 16.1 16.130–49 7.0 12.3 8.850–64 17.6 8.8 14.7>65 6.7 13.3 6.7Total 9.6 12.0 10.8
6 14–18 8.3 0.0 16.719–29 0.0 24.3 16.230–49 3.1 17.2 9.450–64 5.6 11.1 13.9>65 3.0 21.2 3.0Total 3.3 17.0 11.0
Total 14–18 16.2 10.3 10.319–29 5.2 11.5 14.930–49 8.9 14.4 12.850–64 15.8 14.1 12.0>65 10.4 16.5 14.0Total 10.4 13.8 13.1
with very low levels of recycling (less than 10%) (De Feo and Mal-vano, 2009). About 27.2% of the sample retained that they were notaware of the problem. About 29.3% of people in the ‘‘yellow” dis-tricts retained that the main driving force is their ignorance, thusrecognizing their responsibility as testified by the insufficient levelof awareness. While, 31.4% of people in the ‘‘green” districts re-tained that they were not aware of the problem, in apparent con-tradiction with the fact that they showed a sufficient level ofawareness. The two youngest groups (14–18 and 19–29) continuedto self-criticise also for this question. While, the older categorieswere oriented towards answer n. 2 (‘‘They are not well-informed”)and n. 3 (‘‘They are not aware of the problem”). The results showedlittle difference between the views of married and single people,with 32.4% of married people declaring that they are not awareof the problem, while 29.3% of single people attributed their igno-rance to the little effort showed in recycling. Apart from the pub-licity and promotion of specific recycling programs, more generaleducation and information about the broader issues underlyingwaste management are required in order to explain to the publicthe need for, and the benefits from, the acceptance of a widerresponsibility towards waste disposal (Martin et al., 2006).
te incineration?).
treatment It’s an hazardous treatment It’s necessary It’s not necessary
33.3 16.7 16.736.4 27.3 18.225.6 10.3 12.830.0 10.0 25.010.0 15.0 25.026.2 15.0 18.7
35.7 0.0 0.025.7 17.1 28.614.3 15.9 20.617.9 5.1 10.315.6 9.4 9.419.1 11.5 16.4
33.3 8.3 41.718.5 29.6 11.119.6 23.5 21.615.6 18.8 15.617.9 17.9 14.319.3 21.3 18.7
20.0 10.0 40.054.5 4.5 18.248.7 0.0 28.239.1 4.3 43.547.6 0.0 28.645.2 2.6 30.4
21.4 21.4 14.351.6 9.7 6.543.9 5.3 22.838.2 11.8 8.870.0 0.0 3.347.0 7.8 12.7
25.0 8.3 41.729.7 18.9 10.842.2 10.9 17.250.0 2.8 16.736.4 6.1 30.339.0 9.9 19.8
27.9 10.3 25.035.1 17.8 15.531.9 11.5 20.431.5 8.7 17.933.5 7.9 17.732.4 11.4 18.8
G. De Feo, S. De Gisi / Waste Management 30 (2010) 958–976 973
With question n. 13, the following question was asked to thepeople interviewed: ‘‘Why did residents protest against the con-struction of waste facilities?”. This question was formulated be-cause, as stated above, the Campania Region does not have anykind of facility necessary to close the waste management cycle.In particular, there were no sufficient composting (and/or anaero-bic) plants and only one incinerator that has still to be tested (inthe city of Acerra). One of the main reasons for this emergency sit-uation is the fact that, over the past 15 years, people have stronglyopposed and reacted to the realization of MSW facilities (De Feoet al., 2005). The obtained percentages are summarized in Table11, regarding areas and age subdivisions. About 29.3% of the sam-ple retained that people protested because they were not well-in-formed as well as 32.8% of people in the ‘‘yellow” districts. In fact,the fear about risks increases when information about the MSWfacility is limited as well as the lack of information also reducesthe credibility of a facility owner and leads to protests to the facil-ity (Rahardyan et al., 2004). While, 33.3% of people in the ‘‘green”districts retained that they were not well-involved, thus manifest-ing that they do not want only to receive information, but they areaware of the problem and thus they want to be involved in the
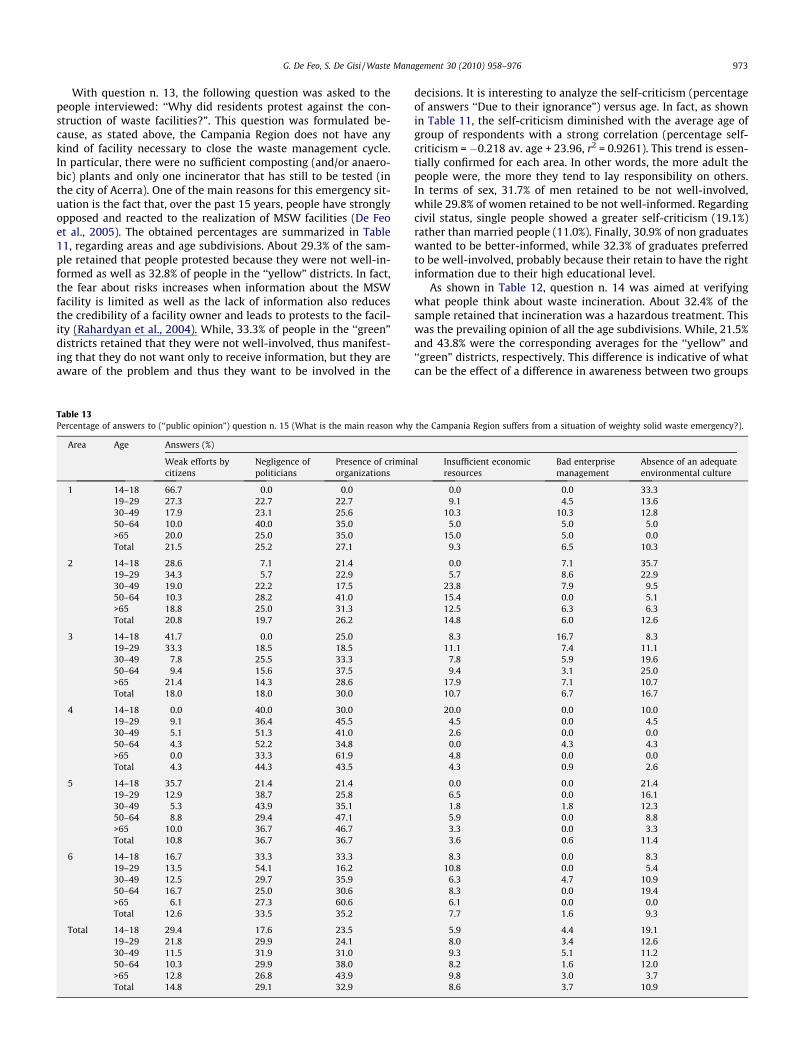
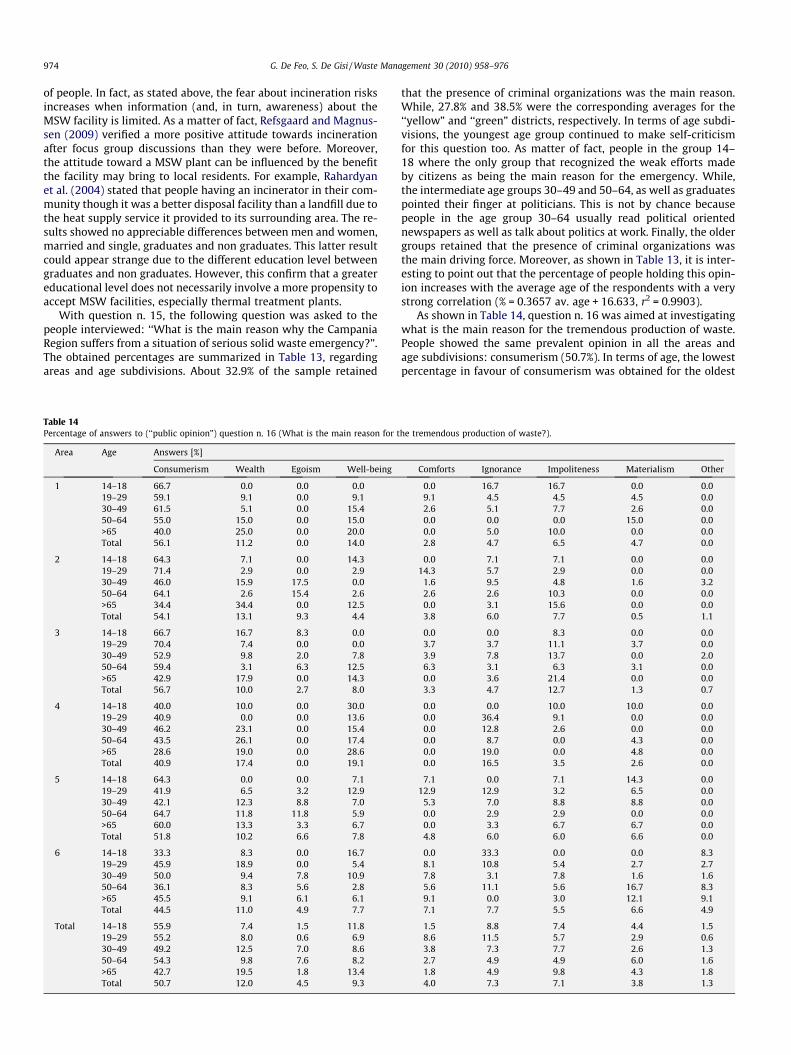
Table 13Percentage of answers to (‘‘public opinion”) question n. 15 (What is the main reason why
Area Age Answers (%)
Weak efforts bycitizens
Negligence ofpoliticians
Presence of criminaorganizations
1 14–18 66.7 0.0 0.019–29 27.3 22.7 22.730–49 17.9 23.1 25.650–64 10.0 40.0 35.0>65 20.0 25.0 35.0Total 21.5 25.2 27.1
2 14–18 28.6 7.1 21.419–29 34.3 5.7 22.930–49 19.0 22.2 17.550–64 10.3 28.2 41.0>65 18.8 25.0 31.3Total 20.8 19.7 26.2
3 14–18 41.7 0.0 25.019–29 33.3 18.5 18.530–49 7.8 25.5 33.350–64 9.4 15.6 37.5>65 21.4 14.3 28.6Total 18.0 18.0 30.0
4 14–18 0.0 40.0 30.019–29 9.1 36.4 45.530–49 5.1 51.3 41.050–64 4.3 52.2 34.8>65 0.0 33.3 61.9Total 4.3 44.3 43.5
5 14–18 35.7 21.4 21.419–29 12.9 38.7 25.830–49 5.3 43.9 35.150–64 8.8 29.4 47.1>65 10.0 36.7 46.7Total 10.8 36.7 36.7
6 14–18 16.7 33.3 33.319–29 13.5 54.1 16.230–49 12.5 29.7 35.950–64 16.7 25.0 30.6>65 6.1 27.3 60.6Total 12.6 33.5 35.2
Total 14–18 29.4 17.6 23.519–29 21.8 29.9 24.130–49 11.5 31.9 31.050–64 10.3 29.9 38.0>65 12.8 26.8 43.9Total 14.8 29.1 32.9
decisions. It is interesting to analyze the self-criticism (percentageof answers ‘‘Due to their ignorance”) versus age. In fact, as shownin Table 11, the self-criticism diminished with the average age ofgroup of respondents with a strong correlation (percentage self-criticism = �0.218 av. age + 23.96, r2 = 0.9261). This trend is essen-tially confirmed for each area. In other words, the more adult thepeople were, the more they tend to lay responsibility on others.In terms of sex, 31.7% of men retained to be not well-involved,while 29.8% of women retained to be not well-informed. Regardingcivil status, single people showed a greater self-criticism (19.1%)rather than married people (11.0%). Finally, 30.9% of non graduateswanted to be better-informed, while 32.3% of graduates preferredto be well-involved, probably because their retain to have the rightinformation due to their high educational level.
As shown in Table 12, question n. 14 was aimed at verifyingwhat people think about waste incineration. About 32.4% of thesample retained that incineration was a hazardous treatment. Thiswas the prevailing opinion of all the age subdivisions. While, 21.5%and 43.8% were the corresponding averages for the ‘‘yellow” and‘‘green” districts, respectively. This difference is indicative of whatcan be the effect of a difference in awareness between two groups
the Campania Region suffers from a situation of weighty solid waste emergency?).
l Insufficient economicresources
Bad enterprisemanagement
Absence of an adequateenvironmental culture
0.0 0.0 33.39.1 4.5 13.6
10.3 10.3 12.85.0 5.0 5.0
15.0 5.0 0.09.3 6.5 10.3
0.0 7.1 35.75.7 8.6 22.9
23.8 7.9 9.515.4 0.0 5.112.5 6.3 6.314.8 6.0 12.6
8.3 16.7 8.311.1 7.4 11.1
7.8 5.9 19.69.4 3.1 25.0
17.9 7.1 10.710.7 6.7 16.7
20.0 0.0 10.04.5 0.0 4.52.6 0.0 0.00.0 4.3 4.34.8 0.0 0.04.3 0.9 2.6
0.0 0.0 21.46.5 0.0 16.11.8 1.8 12.35.9 0.0 8.83.3 0.0 3.33.6 0.6 11.4
8.3 0.0 8.310.8 0.0 5.4
6.3 4.7 10.98.3 0.0 19.46.1 0.0 0.07.7 1.6 9.3
5.9 4.4 19.18.0 3.4 12.69.3 5.1 11.28.2 1.6 12.09.8 3.0 3.78.6 3.7 10.9
974 G. De Feo, S. De Gisi / Waste Management 30 (2010) 958–976
of people. In fact, as stated above, the fear about incineration risksincreases when information (and, in turn, awareness) about theMSW facility is limited. As a matter of fact, Refsgaard and Magnus-sen (2009) verified a more positive attitude towards incinerationafter focus group discussions than they were before. Moreover,the attitude toward a MSW plant can be influenced by the benefitthe facility may bring to local residents. For example, Rahardyanet al. (2004) stated that people having an incinerator in their com-munity though it was a better disposal facility than a landfill due tothe heat supply service it provided to its surrounding area. The re-sults showed no appreciable differences between men and women,married and single, graduates and non graduates. This latter resultcould appear strange due to the different education level betweengraduates and non graduates. However, this confirm that a greatereducational level does not necessarily involve a more propensity toaccept MSW facilities, especially thermal treatment plants.
With question n. 15, the following question was asked to thepeople interviewed: ‘‘What is the main reason why the CampaniaRegion suffers from a situation of serious solid waste emergency?”.The obtained percentages are summarized in Table 13, regardingareas and age subdivisions. About 32.9% of the sample retained
Table 14Percentage of answers to (‘‘public opinion”) question n. 16 (What is the main reason for t
Area Age Answers [%]
Consumerism Wealth Egoism Well-being
1 14–18 66.7 0.0 0.0 0.019–29 59.1 9.1 0.0 9.130–49 61.5 5.1 0.0 15.450–64 55.0 15.0 0.0 15.0>65 40.0 25.0 0.0 20.0Total 56.1 11.2 0.0 14.0
2 14–18 64.3 7.1 0.0 14.319–29 71.4 2.9 0.0 2.930–49 46.0 15.9 17.5 0.050–64 64.1 2.6 15.4 2.6>65 34.4 34.4 0.0 12.5Total 54.1 13.1 9.3 4.4
3 14–18 66.7 16.7 8.3 0.019–29 70.4 7.4 0.0 0.030–49 52.9 9.8 2.0 7.850–64 59.4 3.1 6.3 12.5>65 42.9 17.9 0.0 14.3Total 56.7 10.0 2.7 8.0
4 14–18 40.0 10.0 0.0 30.019–29 40.9 0.0 0.0 13.630–49 46.2 23.1 0.0 15.450–64 43.5 26.1 0.0 17.4>65 28.6 19.0 0.0 28.6Total 40.9 17.4 0.0 19.1
5 14–18 64.3 0.0 0.0 7.119–29 41.9 6.5 3.2 12.930–49 42.1 12.3 8.8 7.050–64 64.7 11.8 11.8 5.9>65 60.0 13.3 3.3 6.7Total 51.8 10.2 6.6 7.8
6 14–18 33.3 8.3 0.0 16.719–29 45.9 18.9 0.0 5.430–49 50.0 9.4 7.8 10.950–64 36.1 8.3 5.6 2.8>65 45.5 9.1 6.1 6.1Total 44.5 11.0 4.9 7.7
Total 14–18 55.9 7.4 1.5 11.819–29 55.2 8.0 0.6 6.930–49 49.2 12.5 7.0 8.650–64 54.3 9.8 7.6 8.2>65 42.7 19.5 1.8 13.4Total 50.7 12.0 4.5 9.3
that the presence of criminal organizations was the main reason.While, 27.8% and 38.5% were the corresponding averages for the‘‘yellow” and ‘‘green” districts, respectively. In terms of age subdi-visions, the youngest age group continued to make self-criticismfor this question too. As matter of fact, people in the group 14–18 where the only group that recognized the weak efforts madeby citizens as being the main reason for the emergency. While,the intermediate age groups 30–49 and 50–64, as well as graduatespointed their finger at politicians. This is not by chance becausepeople in the age group 30–64 usually read political orientednewspapers as well as talk about politics at work. Finally, the oldergroups retained that the presence of criminal organizations wasthe main driving force. Moreover, as shown in Table 13, it is inter-esting to point out that the percentage of people holding this opin-ion increases with the average age of the respondents with a verystrong correlation (% = 0.3657 av. age + 16.633, r2 = 0.9903).
As shown in Table 14, question n. 16 was aimed at investigatingwhat is the main reason for the tremendous production of waste.People showed the same prevalent opinion in all the areas andage subdivisions: consumerism (50.7%). In terms of age, the lowestpercentage in favour of consumerism was obtained for the oldest
he tremendous production of waste?).
Comforts Ignorance Impoliteness Materialism Other
0.0 16.7 16.7 0.0 0.09.1 4.5 4.5 4.5 0.02.6 5.1 7.7 2.6 0.00.0 0.0 0.0 15.0 0.00.0 5.0 10.0 0.0 0.02.8 4.7 6.5 4.7 0.0
0.0 7.1 7.1 0.0 0.014.3 5.7 2.9 0.0 0.0
1.6 9.5 4.8 1.6 3.22.6 2.6 10.3 0.0 0.00.0 3.1 15.6 0.0 0.03.8 6.0 7.7 0.5 1.1
0.0 0.0 8.3 0.0 0.03.7 3.7 11.1 3.7 0.03.9 7.8 13.7 0.0 2.06.3 3.1 6.3 3.1 0.00.0 3.6 21.4 0.0 0.03.3 4.7 12.7 1.3 0.7
0.0 0.0 10.0 10.0 0.00.0 36.4 9.1 0.0 0.00.0 12.8 2.6 0.0 0.00.0 8.7 0.0 4.3 0.00.0 19.0 0.0 4.8 0.00.0 16.5 3.5 2.6 0.0
7.1 0.0 7.1 14.3 0.012.9 12.9 3.2 6.5 0.0
5.3 7.0 8.8 8.8 0.00.0 2.9 2.9 0.0 0.00.0 3.3 6.7 6.7 0.04.8 6.0 6.0 6.6 0.0
0.0 33.3 0.0 0.0 8.38.1 10.8 5.4 2.7 2.77.8 3.1 7.8 1.6 1.65.6 11.1 5.6 16.7 8.39.1 0.0 3.0 12.1 9.17.1 7.7 5.5 6.6 4.9
1.5 8.8 7.4 4.4 1.58.6 11.5 5.7 2.9 0.63.8 7.3 7.7 2.6 1.32.7 4.9 4.9 6.0 1.61.8 4.9 9.8 4.3 1.84.0 7.3 7.1 3.8 1.3
G. De Feo, S. De Gisi / Waste Management 30 (2010) 958–976 975
people (42.7%). This is not surprisingly because in societies likethose in Campania Region, the older the people are, the less theytend to consume as well as buy less and save more. A similarbehaviour was showed by married people, with 47.1% indicatingconsumerism, in comparison with single people, with 57.9%. Alsoin this case, a married person tends to buy less and save morerather than a single person, especially if the married is part of ahousehold with children. Finally, also between the ‘‘yellow” and‘‘green” districts, there was a similar situation with around a 10%difference, with 55.6% for the group (1–3) and 45.7% for the group(4–6). This behaviour could be due to the fact that the ‘‘green” dis-tricts have a georgic tradition.
3.4. Limitations of the study
The most significant limitation of the current study is that at afirst observation the process used could appear pretty standard,but it proposes an attentive and detailed sampling procedure use-ful in order to avoid the usual reported limitations of studies of thiskind (low heterogeneous sample, limited sample size, limitation toone particular organization or respondents category, restrictedsample of behaviours, etc.). Moreover, the procedure makes ameticulous statistical analysis of the results possible. A further lim-itation of the present study concerns the questionnaire. In fact, itwould have been useful to ask for information on the number ofhousehold members or who in the household was responsible forhandling waste separation and disposal. Moreover, some of thequestions listed in Table 2 could appear biased to people that doesnot know the serious situation existing in Campania Region interms of waste management. For this reason, we emphasized thisaspect. Finally, at present, following the findings of this study,the Municipality of Nocera Inferiore decided to adopt a kerbsidecollection system as well as perform a communication campaigntaking into consideration the results of our findings.
4. Conclusions
In conclusion, coherently with the principal aim as well as withspecific objectives of the research set out in the introductory sec-tion, the following outcomes based on the obtained results canbe pointed out:
� the proposed procedure was effective for selecting areas and cit-izens with a low level of knowledge about MSW and separatecollection programme (principal aim);
� better level of awareness were obtained for those districts thatshowed better personal behaviours regarding cultural attitudesuch as reading newspapers and books, watching TV and usingthe Internet. Moreover, the ‘‘green” districts were the suburbanareas, less densely populated and with modern high- and low-rise buildings and with the presence of people with a peasantorigin (specific objective 1);
� the attentive sampling procedure made a meticulous statisticalanalysis of the results possible (specific objective 1);
� the youngest and the oldest people showed the lowest level ofawareness for each district (specific objective 1);
� married and single people had a different awareness only in thecapacity of evaluating the average daily production of MSW percapita in their municipality (specific objective 1);
� men and women showed a comparable level of awareness (spe-cific objective 1);
� in terms of educational level, there were reduced differences ofawareness among the several categories. Therefore a high edu-cational level does not necessarily involve a high level of envi-ronmental awareness (specific objective 1);
� only the 65 and over age group gave a positive judgement of thequality of the collection programme, confirming that the level ofsatisfaction was higher amongst the oldest age group (specificobjective 2);
� all citizens in the several areas were unanimous in pointing outthe presence of dirt in the street as the main shortcoming of thebring separate collection program. All the age groups showedthe same opinion, but with the highest percentage for the youn-gest, usually the people spending more time outside (specificobjective 3);
� the majority of the sample retained that the Municipality hadthe most responsibility for the failure of the separate collectionprogram. Only the youngest age group gave a ‘‘non political”answer retaining that the citizen was principally responsible.While, the oldest people retaining themselves to be less influen-tial, have retained that citizens has less responsibility for thefailure of the separate collection program (specific objective 4);
� only the youngest age group made self-criticism consideringthat they revealed a low level of participation to the separatecollection program (specific objective 5);
� the prevalent opinion of the sample was that people protestedagainst the construction of waste facilities because they werenot well-informed thus confirming that lack of informationleads to protests to the facility. While, self-criticism diminishedwith the average age of group of respondents with a strong cor-relation (specific objective 6);
� the prevailing opinion of all the age subdivisions was that incin-eration is a hazardous treatment. The results showed no appre-ciable differences between graduates and non graduates,confirming that a greater educational level does not necessarilyinvolve a more propensity to accept MSW facilities (specificobjective 7);
� the presence of criminal organizations was indicated as themain reason why the Campania Region suffers from a serioussolid waste emergency. While, the percentage of people pointingtheir finger at politicians increases with the average age of groupof respondents with a very strong correlation (specific objective8);
� consumerism was retained as the main reason for the tremen-dous production of waste in all the areas and age subdivisions(specific objective 9).
Acknowledgments
The authors wish to thank eng. Francesco Esposito and eng.Antonio Avagliano for their precious work in submitting the ques-tionnaires, Dr. Sacha A. Berardo for his English revision as well astwo anonymous referees for their effective suggestions.
References
Alexander, C., Smaje, C., Timlett, R., Williams, I.D., 2009. Improving socialtechnologies for recycling. Proceedings of the Institution of Civil EngineersWaste and Resource Management 162, 15–28.
Belgiorno, V., De Feo, G., Panza, D., Napoli, R.M.A., 2003. An ‘‘alternative” disposal forrefuse derived fuel. In: Proceedings of Sardinia 2005, Ninth International WasteManagement and Landfill Symposium, CISA. Cagliari, Sardinia, Italy.
Borgstede, C., Biel, A., 2002. Pro-environmental behaviour: situational barriers andconcern for the good at stake. Göteborg Psychological Reports 32 (1), 1–10.
Chung, S.S., 2008. Using plastic bag waste to assess the reliability of self-reportedwaste disposal data. Waste Management 28, 2574–2584.
Chung, S.S., Lo, C.W.H., 2008. Local waste management constraints and wasteadministrators in China. Waste Management 28, 272–281.
Corraliza, J., Berenguer, J., 2000. Environmental values, beliefs and actions. Asituational approach. Environment and Behaviour 32 (6), 832–848.
Costarelli, S., Colloca, P., 2004. The effects of attitudinal ambivalence on pro-environmental behavioural intentions. Journal of Environmental Psychology 24,279–288.
976 G. De Feo, S. De Gisi / Waste Management 30 (2010) 958–976
Curran, A., Williams, I.D., Heaven, S., 2007. Management of household bulky wastein England. Resources, Conservation and Recycling 51, 78–92.
Darby, L., Obara, L., 2005. Household recycling behaviour and attitudes towards thedisposal of small electrical and electronic equipment. Resources, Conservationand Recycling 44, 17–35.
Davis, G., Phillips, P.S., Read, A.D., Iida, Y., 2006. Demonstrating the need for thedevelopment of internal research capacity: understanding recyclingparticipation using the theory of planned behaviour in West Oxfordshire, UK.Resources, Conservation and Recycling 46, 115–127.
De Feo, G., Malvano, C., 2009. The use of LCA in selecting the best MSWmanagement system. Waste Management 29, 1901–1915.
De Feo, G., Panza, D., Belgiorno, V., 2005. Public opinion and residents concerns,perception and attitudes toward MSW treatment and disposal plants. In:Proceedings of Sardinia 2005, Tenth International Waste Management andLandfill Symposium, CISA, Cagliari, Sardinia, Italy.
Dixon, J., Williams, I.D., 2007. The recycling4fylde initiative. Communications inWaste and Resource Management 8 (1), 33–40.
Grodzinska-Jurczak, M., Tarabul, M., Read, A.R., 2003. Increasing participation inrational municipal waste management – a case study analysis in Jaslo City(Poland). Resources, Conservation and Recycling 38, 67–88.
Gunton, H., Williams, I.D., 2007. Waste minimisation using behaviour changetechniques: a case study for students. In: Lechner, P. (Ed.), Waste Matters:Integrating Views. Proceedings of the 2nd BOKU Waste Conference, April 16–19,Vienna. ISBN 978-3-7089-0060-5.
Hage, O., Söderholm, P., Berglund, C., 2009. Norms and economic motivation inhousehold recycling: empirical evidence from Sweden, Resources. Conservationand Recycling 53, 155–165.
Junquera, B., del Brío, J.A., Muñiz, M., 2001. Citizens’ attitude to reuse of municipalsolid waste: a practical application. Resources, Conservation and Recycling 33,51–60.
Martin, M., Williams, I.D., Clark, M., 2006. Social, cultural and structural influenceson household waste recycling: a case study. Resources, Conservation andRecycling 48, 357–395.
Mattsson, C.H., Berg, P.E.O., Clarkson, P.A., 2003. The development of systems forproperty close collection of recyclables: experiences from Sweden and England.Resources, Conservation and Recycling 38, 39–57.
McDonald, S., Ball, R., 1998. Public participation in plastics recycling schemes.Resources, Conservation and Recycling 22, 123–141.
McDonald, S., Oates, C., 2003. Reasons for non-participation in a kerbside recyclingscheme. Resources, Conservation and Recycling 39, 369–385.
McKenzie-Mohr, D., 2000. Promoting sustainable behaviour: an introduction tocommunity-based social marketing. Journal of Social Issues 56 (3), 543–554.
Patton, M.Q., 1990. Qualitative Evaluation and Research Methods. Sage, London.Perry, G.D.R., Williams, I.D., 2007. The participation of ethnic minorities in
kerbside recycling: a case study, resources. Conservation and Recycling 49,308–323.
Rahardyan, B., Matsuto, T., Kakuta, Y., Tanaka, N., 2004. Resident’s concerns andattitudes towards solid waste management facilities. Waste Management 24,437–451.
Read, A.D., 1999. ‘‘A weekly doorstep recycling collection, I had no idea we could!”Overcoming the local barriers to participation. Resources, Conservation andRecycling 26, 217–249.
Refsgaard, K., Magnussen, K., 2009. Household behaviour and attitudes with respectto recycling food waste e experiences from focus groups. Journal ofEnvironmental Management 90, 760–771.
Robinson, G.M., Read, A.D., 2005. Recycling behaviour in a London Borough: resultsfrom large-scale household surveys. Resources, Conservation and Recycling 45,70–83.
Robson, C., 1993. Real World Research: A Resource for Social Scientists andPractitioner–researchers. Blackwell, Oxford.
Shaw, P.J., 2008. Nearest neighbour effects in kerbside household waste recycling.Resources, Conservation and Recycling 52, 775–784.
Shaw, P.J., Maynard, S.J., 2008. The potential of financial incentives to enhancehouseholders’ kerbside recycling behavior. Waste Management 28, 1732–1741.
Shaw, P.J., Lyas, J.K., Maynard, S.J., van Vugt, M., 2007. On the relationship betweenset-out rates and participation ratios as a tool for enhancement of kerbsidehousehold waste recycling. Journal of Environmental Management 83, 34–43.
Sujauddin, M., Huda, S.M.S., Hoque, R.A.T.M., 2008. Household solid wastecharacteristics and management in Chittagong, Bangladesh. WasteManagement 28, 1688–1695.
Suttibak, S., Nitivattananon, V., 2008. Assessment of factors influencing theperformance of solid waste recycling programs. Resources, Conservation andRecycling 53, 45–56.
Tai, H.S., He, W.H., 2007. A novel model of organic waste composting in Taiwanmilitary community. Waste Management 27, 664–674.
Thomas, C., 2001. Public understanding and its effect on recycling performance inHampshire and Milton Keynes. Resources, Conservation and Recycling 32 (3–4),259–274.
Timlett, R.E., Williams, I.D., 2008. Public participation and recycling performance inEngland: a comparison of tools for behaviour change. Resources, Conservationand Recycling 52, 622–634.
Timlett, R.E., Williams, I.D., 2009. The impact of transient populations on recyclingbehaviour in a densely populated urban environment. Resources, Conservationand Recycling 53, 498–506.
Tonglet, M., Phillips, P.S., Read, A.D., 2004a. Using the theory of planned behaviourto investigate the determinants of recycling behaviour: a case study fromBrixworth, UK. Resources, Conservation and Recycling 41, 191–214.
Tonglet, M., Phillips, P.S., Bates, M.P., 2004b. Determining the drivers forhouseholder pro-environmental behaviour: waste minimization compared torecycling. Resources, Conservation and Recycling 42, 27–48.
Tucker, P., 2003. Understanding recycling surveys. Warmer Bulletin 88, 16–17.White, R., Fischer, A., Hansen, H.P., Varjopuro, R., Young, J., Adamescu, M., 2005.
Conflict Management, Participation, Social learning and Attitudes inBiodiversity Conservation. ALTERNet R4 (available on line atwww.alternet.info).
Williams, I.D., Gunton., H., 2007. Sustainable lifestyles for young people: a casestudy for university students. In: Proceedings of the 11th International WasteManagement and Landfill Symposium, Paper No. 146.
Williams, I.D., Kelly, J., 2003. Greenwaste collection and the public’s recyclingbehaviour in the Borough of Wyre, England. Resources, Conservation andRecycling 38, 139–159.
Wilson, C.D.H., Williams, I.D., 2007. Kerbside collection: a case study from thenorth-west of England Resources. Conservation and Recycling 52, 381–394.
Woollam, T.C., Emery, A., Griffiths, A.J., Williams, K.P., 2003. A comparison ofintended and claimed recycling behaviour to actual, in a new kerbside scheme.Chartered Institute Wastes Management (CIWM) Scientific Technical Review 4(3), 2–9.
Yin, R.K., 2008. Case Study Research: Design and Methods. Sage Publications (CA),London.
Zhuang, Y., Wu, S.W., Wang, Y.L., Wu, W.X., Chen, Y.X., 2008. Source separation ofhousehold waste: a case study in China. Waste Management 28, 2022–2030.
Top Related
Copyright © 2022 FDOKUMEN

