


Bahasa
Halaman
Hukum


FY 2020 - 2024 Capital Investment Plan
FY 2020BUDGET
ENSURING AN EQUITABLE, SUSTAINABLE AND RESILIENT CHARLOTTE
Proposed

62 62
This page intentionally left blank.

1
CITY MANAGER’S MESSAGE

62 62
This page intentionally left blank.

i | P a g e
May 6, 2019
Honorable Mayor and City Council
City of Charlotte, North Carolina
I respectfully submit to you the Proposed Fiscal Year (FY) 2020 Budget for the City of Charlotte. The
Proposed Budget is composed of the General Fund, Enterprise Funds, Capital Funds, Internal Service
Funds, and Special Revenue Funds for a total of $2.6 billion (net of transfers). A summary of the Proposed
Budget is outlined in the following table:
Proposed FY 2020 Budget (Net of Transfers)
General Fund $727,674,000
Transfer to Other Funds -$79,033,029
Sub-Total General Fund $648,640,971
Aviation $725,821,802
Charlotte Area Transit System (CATS) $191,402,077
Charlotte Water $443,207,762
Storm Water $78,288,264
Sub-Total Nongeneral Funds $1,438,719,905
General Community Investment Plan $131,780,106
General Capital Debt Service $102,608,926
Pay-As-You-Go Funds $1,790,009
Sub-Total Capital Investments $236,179,041
Debt Service - Nongeneral Funds $161,398,606
Special Revenue and Internal Service Funds $142,596,373
Total All Funds $2,627,534,896
The Proposed FY 2020 Budget continues the unification and efficiency efforts the city is undergoing. Last
year’s budget signaled the end of “Run Your Business.” We are becoming a more collaborative, responsive
organization focused on providing the highest quality services possible in a cost effective and accountable
manner. To continue to move the city forward, the Proposed FY 2020 Budget focuses on four new strategic
priorities: Economic Development, Neighborhood Development, Transportation and Planning, and Well-
Managed Government.

ii | P a g e
The Proposed FY 2020 General Fund Budget is $727.7 million, a 4.8 percent or $33.3 million increase over
last year. The total budget is $2.6 billion and supports initiatives that increase our capacity to achieve
great things in our communities.
Highlights of the Budget Include:
• No property tax increases
• Increases the minimum wage of full-time City of Charlotte employees to $16 per hour
• Provides a three percent merit pool for salaried employees
• Provides a 1.5 percent market adjustment and 1.5 percent merit pool for hourly employees
• Enhances the above increases to a $2,080 per year (or $1 per hour) minimum for all full-time
general employees earning less than $69,333 per year
• Enhances public safety employee compensation
o An additional five percent pay increase for all Police Sergeants
o An additional five percent pay increase for top-step Police Officers through the Senior
Police Officer program
o A 2.5 percent pay increase for all Fire Captains and for top-step Fire Engineers
o An additional one percent to the city 401k contribution for Firefighters (in January)
• No healthcare premium cost increase for any employee in any plan
• Promotes the creation and preservation of affordable housing by doubling the 2020 affordable
housing bond allocation from $25 million to $50 million, and provides an additional $12.7
million to support other affordable housing initiatives
• Helps qualifying seniors by providing an additional $750,000 for the Aging in Place program
• Progresses the goal of becoming a national leader in the Circular Economy
• Continues support for the tree canopy
• Provides for two additional garbage collection trucks and crews to keep our city clean
• Continues support of initiatives in Historic West End with $150,000 along with supporting the
Eastside and Westside Initiatives with $1.0 million
• Supports economic development initiatives for new business creation, innovation, and
entrepreneurship with $1.7 million
• Increases Minority Women Small Business Enterprise (MWSBE) opportunities by providing an
additional $450,000 for capacity building programs
• Establishes the Office of Equity, Mobility, and Immigrant Integration to advance upward
mobility, immigrant services, diversity, equity, and inclusion within our organization and
throughout the community
• Invests $500,000 in neighborhoods by expanding the microgrants program
• Continues to optimize services through the creation of the General Services Department,
aligning several related core functions
• Implements Capital Investment Plan enhancements including the creation of an Advanced
Planning and Design Program, updates debt model assumptions to establish a steady state, and
formalizes the project close-out process

iii | P a g e
Impact of Property Valuations The Proposed FY 2020 Budget was developed in the wake of the 2019 Mecklenburg County real property
revaluation. State law requires a real property revaluation at least once every eight years. Localities can
choose the frequency of the revaluation, and Mecklenburg County has chosen to conduct it every eight
years. During this process, all real property value is reassessed by the county assessor to reflect the current
market value. Properties under review include buildings, permanent fixtures, structures, and land. The
last time the county conducted a revaluation was in 2011.
The economy has experienced significant expansion since the last revaluation. Since July 2009, the
economy has grown continuously for more than 118 months, two months shy of becoming the longest
expansion in U.S. economic history. The 2019 real property revaluation reflects this economic growth,
with the City of Charlotte adding $42.8 billion in real property value for a total property tax base of $142.7
billion; total real property (commercial and residential) values grew by 60.1 percent in the City of
Charlotte. Commercial real property in the city grew by 81.8 percent and residential real property grew
by 47.5 percent, implying that commercial real property grew 1.7 times faster than residential real
property.
The faster growth in commercial property creates a shift in total property tax burden from residential to
commercial property owners. If commercial properties had grown at the same rate as residential
properties, homeowners in the City of Charlotte would have needed to pay an additional $18.0 million in
property taxes to achieve a revenue-neutral rate.
Revenue-Neutral Tax Rate Statement
During revaluation years, state law requires that I inform you of the “revenue-neutral” tax rate. The
revenue-neutral tax rate for the FY 2020 Budget is 34.81 cents per $100 assessed valuation. This
represents a 28.8 percent decrease from the previous year’s tax rate. The revenue-neutral tax rates for
FY 2020 are listed in the following table:
Revenue-Neutral Tax Rates per $100 Valuation
FY 2019 Current
FY 2020
Revenue-Neutral
City Property Tax Rate 48.87¢ 34.81¢
Municipal Service Districts
District 1 - Center City 2.08¢ 1.36¢
District 2 - Center City 2.93¢ 1.83¢
District 3 - Center City 4.18¢ 2.89¢
District 4 - South End 6.68¢ 3.90¢
District 5 - University City 2.79¢ 2.12¢

iv | P a g e
Budget Engagement and Development At the core of developing a budget is the engagement
process. Engagement of the community, business leaders,
community service organizations, and employees are vital
components of the budget development process. This year,
we did just that. We had six Meet and Eat sessions with the
community. We engaged employee groups in several
settings. We spoke with community organizations and
businesses throughout the year. Finally, we spoke with you at seven council budget meetings, and various
regular city council meetings.
In October 2018, the City of Charlotte hosted its first Economic Roundtable. We sought feedback from
the Charlotte Economics Club and leaders from various industries within the region on emerging and
ongoing market trends. They provided us their outlook at the national, regional, and local levels. They
also shared their industry-specific insights. This valuable feedback was used to develop the city’s fiscal
outlook and revenue forecast.
Community Surveys
To better engage and garner feedback from the community, we surveyed our residents, businesses, and
employees in the fall of 2018. These surveys were tailored to each audience to capture the interests of
each group. Each survey was designed to help us identify and better understand what the respondents
thought was positive about the City of Charlotte and what they would like us to do better. Highlights of
each of the survey results are provided below.
The residents survey results:
• 72 percent of survey respondents rated Charlotte a “great place to live”
• 77 percent or greater rated the following attributes as important
o Job opportunities
o Quality, affordable housing
o Congestion free commuting
The business survey results:
• Respondents recognized the city’s economic
development group as competent individuals.
• Respondents assessed the city’s economic
development efforts as reactive, disjointed, and
unfocused.
The employee survey results:
• 62 percent of employees said the City of Charlotte
is a great place to work.
• Employees identified consistent management communication and lack of clear career paths as
areas for improvement.

v | P a g e
The results of the community surveys are consistent with the strategic priorities established by City
Council at the Annual Strategy Meeting.
Now, with the Proposed FY 2020 Budget, we move to implementing what we have heard. We are going
from theoretical to the practical. As the culture of continuous improvement takes hold organization wide,
we began the process of developing the budget with a new process and a new team. These foundational
changes infused analysis into all aspects of budget development. Department budgets were realigned to
reflect where the greatest needs are and where the spending is occurring. Operating and capital
assumptions were also reviewed and adjusted, resulting in revised revenue projections and increased
debt affordability.
Developed a Reader Friendly Budget
Having an engaged community is important. We rely on
feedback to make us better. However, we cannot solicit
feedback if our community does not understand where our
money comes from or where our money goes. We have
changed the look of the Budget Document, to better
communicate the most important policy-setting document the
city publishes. As a communication device, this new format
provides readers more detail and descriptions on what is in the
budget and the changes from FY 2019 to FY 2020. While the budget can be intricate and sometimes
complex, we are working to make it easier for people to read and understand.
Economic Factors Influencing Budget Development
National Economic Trend
The U.S. economic outlook is healthy based on key economic indicators which show how well the economy
is doing. The Gross Domestic Product (GDP), which measures the nation’s total production output, shows
that the national economy grew by 3.2 percent in the first quarter of 2019 according to initial estimates
from the Bureau of Economic Analysis. The current economic expansion is on track to become the longest
on record, with growth projections continuing well into the future. This expansion now runs a consecutive
118 months, two months shy of the longest
economic expansion of 120 months, which
occurred during the dotcom era.
The labor market is strong. Consumer sentiment
and business confidence remain elevated.
Mortgage rates have recently fallen, which
encourages home-buying and investment
spending. Because of these realities, many
economists are forecasting growth in the short-

vi | P a g e
term and medium-term, with low probabilities of a recession in the coming months.
Since the Great Recession ended in 2009, the national economy has created more than 20 million jobs,
continuously adding jobs for 103 straight months year-over-year with the unemployment rate now at 3.6
percent (April 2019), the lowest we have seen in half a century. Consumer and small business confidence
is relatively high, evidenced by increased consumer spending and business investments in hiring and
capital investment. Household debt-to-disposable income ratio has fallen by more 30 percentage points
since 2008, which implies household budgets are generally healthy. Home prices have continued to soar,
increasing 3.8 percent in March 2019 compared to a year ago. Housing stock remains relatively low with
sustained increases in buyer demand and actual home sales, without a corresponding increase in new
listings.
With the strengthening of the labor market and the overall economy, the Federal Reserve in its March
2019 meeting changed its monetary policy stance from raising the federal funds rate to a more “patient”
position, implying they may not raise rates in 2019, if there are no major shifts in economic conditions.
An increase in the federal funds rate generally has a ripple effect of increasing borrowing costs for
consumers and businesses.
Regional Economy
The Charlotte regional economy continues to grow at an exceptional pace and drive economic growth for
the entire state. As measured by GDP, the Charlotte regional economy has grown at an average annual
rate of about 3.4 percent since 2011. This is higher than the national and state annual average of around
two percent over the same period. The region’s economy, which is the largest in the Carolinas, ranks 20th
in the U.S. and accounts for about 23 percent of the total output of the Carolinas. Between 2008 and
2018, the Charlotte region contributed 53 percent of the growth in employment in the State of North
Carolina.
Charlotte has seen and continues to see increased
tourism and new businesses relocating to the area every
year because of our strategic geographic location, sound
regulatory environment, growth prospects, and relatively
low business costs. As a result, Charlotte’s economy has
seen positive gains in employment, population, tax base,
revenues, and overall strength and size of its economy.
Between February 2018 and February 2019, the number
of people employed in the city and county increased
about 2.5 percent and unemployment is at a record low
of 3.9 percent.
In 2018, the region added nearly 12,000 net new jobs in
industries such as transportation and logistics, finance
and insurance, and advanced manufacturing. In February 2019, regional banks, SunTrust and BB&T
announced their plan to merge and will become the sixth largest bank in the U.S. with headquarters in

vii | P a g e
Charlotte. Global manufacturing firm, Porta North America, announced relocation of its headquarters
from Newington, Connecticut to Charlotte, creating 25 new jobs and making a $3.5 million capital
investment. AXA is adding more than 550 new jobs, doubling its existing workforce in Charlotte and plans
to invest $18.0 million to expand its current location. Many more expansions and relocations have taken
and are taking place in the city, and the region continues adding more new jobs and experiencing
additional capital investments.
Local Economic Impact
The 2019 property revaluation put total property tax assessments at $142.7 billion, about $59.4 billion
greater than the last revaluation in 2011, a growth rate of about seven percent annually. There has been
consistent growth in both residential and commercial construction with commercial property values
growing faster than residential. The city’s second largest revenue source – sales tax revenue – is projected
to grow by 4.5 percent next year with similar growth projected in FY 2021.
The city’s population continues to grow at a
rapid pace, increasing by 1.8 percent in 2017
compared to the nation’s growth of less than
one percent. In 2017, estimates showed a net of
about 24 people moving to the city every day. By
2040, the city’s population is projected to reach
1.24 million people. Growth in employment in
the city continues to outpace population growth.
As growth in employment accelerates faster
than population growth, the employment-to-
population ratio grows larger resulting in a
strong labor market. People are moving to
Charlotte due to the strong economy, lower cost of living, and affordable housing as compared to other
larger cities. Between FY 2014 and FY 2018, Charlotte’s population grew from 792,874 to 859,035, but the
General Fund’s personnel count only grew from 5,374 to 5,681, representing a decline in employees per
10,000 residents from 68 to 66. As Charlotte’s population continues to grow, service models will need to
be adjusted to meet the growing demand on city services.
We Invest in our Community
We are Global
Charlotte Douglas International Airport (CLT) continues to be an industry-leading
example in how strong economic investment and sound development of the capital
program has a robust impact on the economy. CLT is the 6th busiest airport in the
nation, offering 175 non-stop flights and options to 36 international destinations.
The North Carolina Department of Transportation Division of Aviation published a
report in early 2019 estimating the total impact of all airports to the state economy.

viii | P a g e
At $23 billion, CLT provides almost half of the total economic impact of airports in the state, or
approximately five percent of North Carolina’s GDP. CLT also generates $1.1 billion in state and local tax
revenues. We will continue to invest in our airport, as demonstrated by my proposed five-year, $2.0 billion
Aviation capital investment plan. In addition, CLT continues to have one of the lowest cost per enplaned
passenger which was $1.26 per passenger in FY 2018.
We Connect People Regionally
Charlotte Area Transit System (CATS) operates the largest transit system
between Washington, D.C. and Atlanta, and serves Mecklenburg County with
service in Charlotte, Davidson, Huntersville, Cornelius, Matthews, Pineville, and
Mint Hill. CATS provides public transportation through bus routes, light rail, and
special services (for our elderly and disabled). In FY 2018, ridership was over 20
million passengers.
Meeting service needs of the public requires consistent engagement and extensive outreach. In 2019
CATS led an effort called Envision My Ride to redesign the current bus system. Through this initiative,
CATS studied bus route structures and frequencies to identify improvement.
The Envision My Ride effort resulted in outreach at 170 events with 1,209 survey responses and over
5,000 contacts with customers. This outreach informed several route alignments. This periodic review of
routes and other operational improvements helped CATS to maintain rates and fares at the same level as
in FY 2019.
An integrated system of connectivity is important to a growing city like Charlotte. To advance the 2030
Transit Corridor System Plan, significant and stable funding sources are required. Future investment in
transit focuses on an increase in planning for future corridors such as the Silver Line and Transit Oriented
Development and the transition of the Gold Line Phase II from construction to operation.
We Flow Through Pipes and Streams
Storm Water Services also plays a critical role through community investments by
minimizing flooding and protecting water quality. The 5,000 miles of pipe and
open drainage that Storm Water Services staff maintains is critical to our role as
environmental stewards. With the development of this budget, we conducted a
collaborative review of the Storm Water program, project categorization, and
rate-setting model (while aiming to maintain our AAA credit rating). The review
identified several areas of improvement and resulted in a new prioritization methodology that focuses on
publicly-owned priority projects. In the upcoming year, we will study the Storm Water Program further
to refine project categorization, identify efficiency savings, create synergy with other utility programs like
Charlotte Water, and explore the potential of having a standalone Storm Water department.
The rate-setting and financial model review has also led to a recommendation of no storm water rate
increase in FY 2020. In the upcoming fiscal year, we will continue to reassess project delivery, the
prioritization method, and operational efficiency. We will invest almost $500 million over the next five

ix | P a g e
years on a forecasted 1,690 high priority projects. This represents an 83 percent increase over last year’s
forecast.
The investments we make in our water and sewer infrastructure continue to have
a direct economic and employment impact. Charlotte Water serves over 1.0
million customers and maintains over 4,300 miles of water pipes. For every $1.0
million invested in water infrastructure, it is estimated that upwards of fifteen
jobs are generated throughout the economy. Six direct jobs are generated to
support the design and construction of water infrastructure, and nine additional
jobs are sustained by the indirect and induced spending triggered by the original
investment. A continued impact is expected as we plan to construct $1.6 billion in projects over the next
five years. Sound investment in our water and sewer system results in a $2.21 increase in the monthly
water and sewer bill (or around $26.50 per year) for the typical household.
Well-Managed Government
Aligning Around Priorities
At the January 2019 Annual Strategy meeting you determined the previous five focus areas, (which had
been in place since the early 1990’s) had become operational in nature and the city needed a revised set
of strategic priorities. Using a higher policy-setting focus and a more holistic approach, City Council
determined these new priorities to be: Economic Development, Neighborhood Development,
Transportation and Planning, and Well-Managed Government.
To meet the goals of the new strategic priorities, my leadership focus has been realigned. We are now
utilizing four collaborative work teams to leverage subject-matter expertise and integrate decision-
making, both within the organization and with our city partners to achieve results. These teams mirror
the new strategic priority areas:
• Economy, Jobs, and Upward Mobility Team –
Priority: Economic Development
• Mobility, Accessibility, and Connectivity Team –
Priority: Transportation & Planning
• Safe, Healthy, and Inclusive Communities Team –
Priority: Neighborhood Development
• Well-Managed Government Team –
Priority: Well-Managed Government
The new collaborative workgroups advance innovative
strategies and solutions, while actively sharing information and leveraging resources across departments.
While the realignment is not a cure-all to removing the silos, it is part of the answer and it promotes the
integration already begun at the City Council level.

x | P a g e
Getting our House in Order
Last year, I told you we were going to begin the transition away from the “run your business,” siloed
operational philosophy. I also told you it would require us to change some aspects of our current business
model and change in our culture. While it is widely known culture change takes many years, we are well
on the path to becoming One City with a shared vision and shared goals.
It is time to promote behavioral changes that revitalize our
organization’s culture, while preserving and championing our strengths.
The budget I am proposing continues the structural changes and begins
to address the needs of leadership and management. It focuses on
realignment of service delivery in key areas, addressing our
neighborhood needs, and creating opportunities for employees.
In the coming year, I will continue to promote a leadership philosophy that can solve problems, manage
complex issues, model leadership skills, and display a level of integrity that is above reproach. Having a
leadership team that can establish a strong foundation is a crucial element to achieving the goals and
priorities we have set. Future success depends on accelerating the shift to proactive management.
Implement Change – Internal and External Assessments
During my first year, we assessed our internal service functions such as communications, finance, human
resources, information technology, and procurement. We brought in nationally recognized groups to
evaluate how we do business. The underlying theme of the assessment results was the need for us to
change our governance structure in these key areas, which we are implementing currently. The savings
captured from the initial realignment was $1.1 million and a reduction of 17 positions.
We have restructured how some of our internal operations function and continually identify opportunities
to unify policies across the city to ensure we operate as Team Charlotte. As a continuation of this focus,
the Proposed FY 2020 Budget includes additional staffing to strengthen some of the foundational
functions such as internal audit and procurement.
Maintaining and evaluating policy and financial controls is a mark of a well-managed government. We
need to ensure we have resources in place to maintain appropriate
financial controls. The proposed budget includes an additional
Senior Auditor position and $35,000 for contractual support to
expand the capacity of Internal Audit to conduct reviews of
technology and construction contracts. In addition, to centralize
procurement governance and contract compliance, the Proposed
FY 2020 Budget includes an additional four positions.
However, changes in our external environment, such as tremendous population growth, mean we must
also examine how we deliver services externally. Organizational alignment is critical for achieving
increasingly better performance results now and in the future. The demand for services increases each
year, and the organization must eliminate misalignments and be nimble to respond efficiently. Similar to
What we say is strategy –
What we do is culture

xi | P a g e
the reviews conducted of the internal functions, we have begun reviewing how we deliver services
externally. The next phase of organizational restructuring includes realignment of the operational
departments for greater synergy and efficiency.
Moving Forward – Setting Our Foundation
With the Proposed FY 2020 Budget, we begin the journey to realign departments to their core mission.
We used this budget development cycle to thoroughly examine department budgets. We began an
iterative process of analyzing, estimating, revising, refining, and eventually recommending a budget to
you. It is a nearly year-long process of working with our departments and partners to understand service
needs, cost estimates, and revenue projections. This year we put extra emphasis in a few key areas:
• Using our city economist to refine our revenue projections
• Digging deep into each department’s base budget to ensure appropriated budget matches with actual expenditures
• Utilizing audits to identify areas for service and process improvement and to identify service gaps
These efforts have helped to strengthen the budget process and allowed for maximizing the allocation of
our resources.
Taking Care of Our Most Valuable Assets
Becoming an employer of choice means offering a fantastic work
culture and a workplace environment that attracts and retains
superior employees. It also means that as an employer we recognize
employees have a choice in where they work, and we recognize the
importance of creating opportunities for all to reach their full
potential.
Employee engagement and feedback is very important to us.
Employee engagement is based on trust, integrity, two-way
commitment, and communication between leadership and its
employees. A healthy workplace culture fosters positive attitudes and
behaviors leading to improved outcomes and a sense of pride in the work we do and in Team Charlotte.
Strategies to build an organization that puts employees first must be intentional. Proactive and interactive
sessions between workers and leadership are being increased each year. In 2018, the CM-Connect group
was formed. This group of almost 100 city leaders meet with the executive team and myself to discuss
city initiatives, provide feedback, and have open dialogue once a quarter.
In 2018 we established the Employee Relations Team, the “Queen’s Team.” Members of this team are
elected by their peers to represent their voice; for every 100 employees, a department representative is
elected and only non-supervisory positions are eligible to participate. This team composition was
intentionally constructed to allow frontline workers access to senior leadership. The Queen’s Team
members meet with some senior leadership and myself at least once a quarter to exchange information,

xii | P a g e
get feedback, provide input on workplace initiatives, and ask questions. The Queen’s Team members were
integral in developing the employee survey conducted in the fall.
Implementing Feedback from the Employee Survey
Results from the employee survey released in the spring of 2019 show that while we have some areas of
improvement, overall 62 percent of employees believe the City of Charlotte is a great place to work. About
72 percent of employees feel they are engaged and feel they can make a difference.
Employees also said they would like to: have City Manager Rap Sessions (which began spring of 2019);
create an internal job exchange program between departments; require annual supervisor training; and
develop a career ladder tool box.
Based on feedback from the employee survey, the Queen’s Team, and the CM-Connect group, we are
launching new programs and initiatives in FY 2020:
• Supervisor Training – making sure all our supervisors have a shared understanding of what is
expected of them and what they should expect from the employees they manage
• Career Pathways – ensuring existing employees have opportunities to advance within the
organization and promoting cross-department promotion
• Job Shadowing – allowing our employees to get a better understanding of what their peers do,
and providing exposure to new types of jobs
• Manager in Training – cultivating emerging leaders by helping them understand what it means to
be a manager and supervise individuals before they are put in a managerial role
Creating our Pipeline
We know we must look to the future of our workforce and
create career pathways. We need to invest in more than
infrastructure. We also need to invest in human capital to
ensure our projects are planned, designed, constructed,
operated, and maintained. In FY 2020, we are expanding
our career pathway offerings, by creating the City of
Charlotte Training and Career Academy. This Academy expands on the program that began in Charlotte
Water (Pipeline Academy), in which basic technical and soft skills training to individuals with barriers to
employment will be provided. In FY 2020, an estimated 50 participants will have the opportunity to enter
the workforce through our Training and Career Academy. For this, an additional $125,000 in FY 2020 is
provided to support general fund employees, which will complement $480,000 in non-general funds from
Aviation, Charlotte Water, CATS, and Storm Water. The training will result in the participants working
with the city, working with private sector partners, or entering a formal apprenticeship program.
Benchmarking Compensation and Benefits
In FY 2019, I requested a comprehensive compensation review that looked at our salary structure, leave
policies, benefits, and workplace environment. The intention was to benchmark what we do for our
employees against peer cities and determine what areas we can improve. When deciding the most

xiii | P a g e
appropriate way to benchmark, we heard loud and clear from our employees, over the past few years,
that we need to do better than benchmarking against other North Carolina cities. Charlotte is unique in
the state. In FY 2019, we set up a more data-driven approach to benchmarking.
The City Economist started with the 50 biggest cities in the country and used an economic tool called
clustering to align cities based on more than 15 objective measures such as: cost of living, density, poverty
rate, median income, and recent GDP growth. From the data, 20 cities clustered around Charlotte,
including cities such as Seattle, Portland, Denver, Austin, Nashville, Memphis, Louisville, and Columbus.
Using the objective list of cities, the departments of Strategy and Budget and Human Resources worked
to gather information on the compensation and benefits of these cities. We then partnered directly with
actuaries and consultants to analyze the information to determine where Charlotte currently stands in
key areas such as salaries, retirement, healthcare, and leave. The information attained from the analysis
is what drove several key Proposed FY 2020 Budget initiatives.
Taking Care of Our First Responders
Working collaboratively with the Public Safety Pay and Benefits
Team was one of the driving forces that led to our expanded city
benchmarking process. When compared to the 20 peer cities,
one piece of data immediately stood out: Charlotte’s top pay
was between seven and 12 percent lower than the benchmark
national median in four out of the five Public Safety Pay Plan
positions. In response to the information, and recognizing our
financial limitations, we worked collaboratively with the Public Safety Pay and
Benefits Team on a multi-year strategy to begin addressing those concerns.
Police Compensation
In FY 2019, the city announced implementation of a Senior Police Officer
Program to begin in FY 2020. Once this takes effect in FY 2020, the top pay
for a Police Officer with a four-year degree will increase to more than
$80,000. The current plan is to increase Police Officer top pay with another
five percent step in December 2020, bringing the two-year increase to more
than 10 percent, and bringing the top pay of a Police Officer to more than
$85,000.
Police Sergeant is the only public safety pay plan position that did not
receive a pay structure adjustment in the last few years. The Proposed FY
2020 Budget addresses this by increasing all Police Sergeant steps by five
percent. When combined with the market adjustment, all Police Sergeants
will earn at least a 6.5 percent increase. When combined with the planned FY 2021 increase of another
five percent, all Police Sergeants will earn ten percent more than typical over two years, and Sergeant top
pay will approach $100,000.

xiv | P a g e
Benchmarking against other cities isn’t the only reason to address Police compensation. Another key issue
is the difficulty we have retaining the Police Officers we invest in. One key issue frequently cited for the
attrition rate is the amount of time it takes for a Police Officer to reach top pay. The Proposed FY 2020
Budget includes the consolidation of Police Officer steps seven with eight, and steps nine with ten. The
consolidation of these four steps to two will be combined with a consolidation of an additional two steps
in FY 2021. This will lead to a Police Pay Plan with five percent steps. It is my hope that when coupled
with the increased high pay, this will help us retain our current police officers and to attract new ones.
Fire Compensation
The benchmarking study showed that top pay for Fire Engineers
and Fire Captain is also behind. My recommended plan is to
address these two positions by increasing their top pay by 10
percent beyond the typical market adjustment over the next
three years. This would include 2.5 percent for all Fire Captains
and top-step Fire Engineers in FY 2020. Although the
benchmarking study showed that Firefighter II’s are less behind
than their counterparts, the three-year plan includes a five
percent increase over two years beginning in FY 2021.
The Proposed FY 2020 Budget also includes additional compensation for all Firefighters in the form of an
increase in the city’s 401k contribution effective January 2020. Despite federal 401k rules treating
Firefighters and Law Enforcement Officers similarly, the city currently contributes three and five percent
to them, respectively. The three-year plan aims to match the contribution the city makes to Police by
providing an additional one percentage point increase in FY 2020 and an additional one percentage point
in FY 2022 for the Firefighter 401k contribution.
General Employee Compensation
Funding a Salary Increase
The Proposed FY 2020 Budget includes a three percent merit pool
for salaried employees and a total of three percent for hourly
employees. For hourly employees, this is split between a 1.5
percent merit pool and a 1.5 percent market adjustment.
Traditionally the market adjustment for hourly employees would
occur in February. In FY 2020, I am happy to report that I am
recommending moving the market adjustment up to December. It
is my hope that by FY 2022, we will start awarding the market
adjustment to hourly employees in July, the start of our fiscal year.
Although the city’s salary increases for general employees in recent years have compared favorably to
other cities in our benchmarking project, I wanted to add something different in FY 2020. Although we
don’t have the necessary funds to provide large across the board increases to employees, the Proposed

xv | P a g e
Budget does include two key initiatives that will provide additional compensation to our employees who
may need it most.
Increasing Minimum Regular Pay to $16/hour
In FY 2018, the city increased the minimum pay for all regular positions to $15/hour. The initiative has
undeniably been a success. In FY 2020, I am proposing that we take it one step further and increase the
same wage to $16/hour by the end of the fiscal year. This means that we will increase the starting pay
for common and labor-intensive jobs such as Sanitation Technician, Street Crew Member, and Kennel
Attendant. Some of the lowest paid employees in the city will receive $2,080 from this change, rather
than the $936 they would have received from a typical three percent increase.
Upward Mobility of our Workforce
In FY 2020, I would like to take enhanced compensation beyond Public Safety
and the lowest paid general employees, and also add funds for all employees
earning under $69,333. A traditional three percent salary increase provides
$2,700 annually to an employee earning $90,000 but only $1,200 for an
employee earning $40,000. To reduce the inequity in a way that doesn’t
negatively impact other employees, the Proposed FY 2020 Budget includes a
salary increase minimum of $2,080 for all full-time, regular employees who
receive a positive performance review. The $2,080 will be in total, and will
replace their scheduled three percent increase. Sixty-eight percent of the
general employee workforce will be positively impacted by the change, and zero employees will be
negatively impacted. By the end of FY 2020, all general employees (with a positive performance review)
who earn less than $69,333 annually will receive a $2,080 increase, and all employees earning more than
$69,333 will be eligible for their original three percent, on average.
This positive adjustment, coupled with the $16/hour minimum, means that the city’s 200 lowest paid full-
time employees, who earn an average of $32,686, will receive more than a six percent increase if they
receive a positive performance review. The city’s next 600 lowest paid employees, who earn an average
of $38,915, will receive at least a five percent increase. Overall, there are more than 3,100 general
employees who will be positively impacted by the change. Employees who may receive at least five
percent by the end of FY 2020 include: 160 Water and Utility Technicians at Charlotte Water, 74
Telecommunicators, 120 Solid Waste workers, and 75 CATS Special Transportation Drivers.
Addressing the Pay Structure
The city’s Hourly Pay Plan covers city employees in labor,
trades, and administrative positions. This pay plan consists of
20 traditional ranges each with a minimum and maximum. In
FY 2020, I am proposing that we expand the current pay
range minimums from 90 percent to 80 percent and the
maximums from 115 percent to 125 percent. This bigger
range will allow for more flexibility to hire employees based

xvi | P a g e
on their experience level and more flexibility to reward our best employees at the top of the range. This
recommendation also aligns with our benchmarking project, which showed that Charlotte’s narrow range
was unique amongst our peer cities.
The city’s current Broadbanding Pay Plan covers all salaried city employees in professional, management,
and executive positions. Out of the 20 peer cities, Charlotte was the only city with this type of pay
structure. In FY 2020 I am proposing a traditional range system for our salaried employees as well. This
will allow for consistency across the organization and promote clearer career paths for our employees.
Retirement
In our benchmarking project, we compared our city’s
pension plans to the 20 peer cities. The results were
positive. The general employee comparison showed that
Charlotte’s pension is the second best out of 11
comparable plans. Unlike six of the cities, Charlotte has not shifted any of its employees away from a
pension plan. Charlotte is one of only two cities to give both a pension plan and a 401k contribution to all
full-time employees.
Overall, the results show that we provide a good retirement plan to our employees. One of the reasons
we can do so is the strong fiscal management of our retirement systems. Despite it costing the General
Fund $2.9 million, I am fully supportive of the state’s decision to increase the employer contribution rate
in our General Employee and Law Enforcement Officer retirement systems. I am also recommending an
additional $1.0 million contribution to the Charlotte Firefighter’s Retirement System in FY 2020.
Healthcare
Delivering a comprehensive benefits package that provides value
is one of the cornerstones of the Human Resources mission to
help employees thrive. In 2018, there was a redesign of the
health plan offerings to provide a portfolio of medical plan
options to meet the needs of the city’s workforce, with different premium price points, various options
for medical and prescription drug coverages, and the addition of voluntary benefits. Supporting this
redesign, were continued enhancements to the city near-site MyClinic which provides free physician-
directed healthcare to employees and their family. The synergy between the new benefit design and the
clinic success are responsible for a six percent reduction in per-employee claims costs for the city; all the
more impressive considering the industry medical trend was a seven percent increase in those two years.
In addition, the MyClinic saved employees over $1.4 million dollars in 2018.
Our 2018 benchmarking project showed that the city needs to improve on some of its 2018 plan offerings.
Our Basic PPO Plan (Plan D) showed up relatively close to the bottom in overall value in 2018. Fortunately,
we recognized this issue in planning for 2019. Our 2019 plan changes included reducing the deductibles
in this plan, including the reduction of the family deductible by $4,000 and the family out-of-pocket
maximum by $2,000.

xvii | P a g e
The benchmarking project also showed that our basic health savings account (HSA) Plan A’s value was
below our peer cities’ HSA plans. In the 2020 plan year, we will enhance this plan by reducing the
deductibles and the out-of-pocket max. Additionally, we will reduce premiums in HSA Plan B to maintain
the structure of the two HSA plans. These two enhancements allow employees better choices when
deciding between plan types.
I am also happy to recommend that for the second year in a row, there will be no healthcare premium
increases in 2020. Two years without increases will allow the employer share of the premium to increase,
as plans get more expensive overall.
Continued All-Access Transit Pass
In FY 2019, we began offering All-Access Transit Passes to employees at the
significantly reduced rate of $33 per year. Since then, over 800 employees have
elected to participate in the program. In FY 2020, this program is proposed to be
continued.
Accelerated Multi-Disciplinary Training for First Responders
Additionally, $2.0 million in FY 2020 and $1.0 million in FY 2021 is proposed to provide multi-disciplinary
training to police officers. A dedicated investment in training allows for the acceleration in the number
of first responders trained in key areas. It is estimated that the funds will provide thousands of hours of
dedicated training in FY 2020.
Neighborhood Development
Intersection of Neighborhoods/Housing/Public Safety/Environment
As Charlotte continues its fast-paced growth, it is important that we
plan, design, and provide services for our neighborhoods in an equitable
fashion. It is also important that we create and maintain neighborhoods
where all individuals and families can thrive and have a voice, especially
our most vulnerable. Great neighborhoods do not just exist by
happenstance. They are created through intentional investment and
initiatives. Everything we do should be done collaboratively with
resident input.
Support Existing Housing Programs
Every year the city provides support for housing programs which are administered through the
Department of Housing and Neighborhood Services. There are multiple sources of funds used to support
down payment assistance, homeownership counseling, credit counseling, emergency relocation, crisis
rental and energy assistance, home rehabilitation, and emergency repair.
Under the program umbrella called Safe Home, we provide home rehabilitation assistance and emergency
repair funding. These programs serve individuals whose income is at or below 80 percent of the Area
Median Income (AMI). Because of the high need in these two programs, I am recommending these two

xviii | P a g e
programs receive an additional $700,000; of this amount, $250,000 for a total of $500,000 is dedicated to
the Emergency Repair Program and $450,000 is dedicated to the home rehabilitation program. In
addition, I propose using $640,000 in unallocated FY 2019 Community Development Block Grant funds to
bring the total to nearly $1.0 million for the home rehabilitation program in FY 2020. These funds will
complement federal funds of over $3.0 million used for the program, which includes TLC for CLT in
targeted neighborhoods.
Keeping Neighborhoods Affordable
The City of Charlotte asks the residents to vote on General Obligation Bonds (GOB) every two years. Last
year, City Council and Charlotte voters took the bold step of more than tripling the traditional $15.0 million
affordable housing bond allocation to $50.0 million. This encouraged the private sector, faith community,
and non-profit partners to join us and also contribute funds.
To further the work and fundraising already underway,
the Proposed FY 2020 Budget plans to double the
affordable housing bond allocation from $25.0 million
to $50.0 million for the next bond referendum in
November 2020 (FY 2021). With this commitment, we
are capitalizing on the incredible momentum and
continuing to show our dedication to improving
housing accessibility and upward mobility.
To leverage our resources, last year we announced we
were partnering with the Foundation For The Carolinas, Bank of America, Wells Fargo, and the Local
Initiatives Support Corporation (LISC), a national organization with a grassroots focus. Since then, LISC
has established its local office and hired a local executive director, Ralphine Caldwell. The city’s three-
year commitment is continued in the FY 2020 budget for $200,000.
While FY 2020 is an off-cycle year for the city’s bond referendum, we are partnering with LISC to continue
the energy to preserve Naturally Occurring Affordable Housing (NOAH) by adding $6.4 million in city funds
and a $5.1 million contribution from LISC. These funds will support NOAHs and encourage individuals to
build wealth through homeownership in two ways.
First, I propose creating an Single-Family Acquisition/Rehabilitation Loan Program to acquire, preserve,
and offer for resale a minimum of 12 single-family housing units to buyers earning up to 110 percent of
AMI. Vacant single-family houses will be acquired, preserved, and sold to qualified low to moderate
income households through a partnership with LISC and other community partners. Each property will
remain affordable for 15 years and buyers will receive homebuyers counseling and down payment
assistance through our existing program.
Potential target neighborhoods are consistent with Harvard’s Opportunity Insights data and include:
Biddleville-Smallwood, Grier Heights, Hidden Valley, and Renaissance West. Additional neighborhoods
may include: Enderly Park, Firestone Park, and Thomasboro/Hoskins. These neighborhoods are

xix | P a g e
considered based on data such as the number of minimum housing code cases, poverty rates, age of the
housing stock, high crime rates, and low educational attainment.
Second, I propose creating a Multi-Family NOAH Program. Based on the profile of most recent NOAH
approved by City Council in the spring of 2019, I am recommending $4.2 million and LISC is dedicating
$3.8 million of Charlotte Housing Opportunity Investment Fund (CHOIF) to purchasing up to 400 units of
multifamily housing in FY 2020. While this may be an aggressive goal, I believe working in partnership
with affordable housing developers, LISC, and other community partners, we can achieve this goal.
Helping Seniors
Aging in Place
As a proactive measure to address the impact of increased property
taxes due to the 2019 property revaluation, the city created the
Aging in Place Program to help some of Charlotte’s most vulnerable
residents stay in their homes. The FY 2019 budget included
$750,000 to help support low-income, senior home homeowners to
mitigate potential property tax impacts. For FY 2020, I am
recommending an additional $750,000, for a total of $1.5 million
available for this program.
To make sure our seniors were aware of this program, along with several other city and county programs,
community outreach was necessary. Our Senior Housing Support Team developed a comprehensive
engagement effort, whereby city employees knocked on nearly 200 doors in targeted neighborhoods
identified by the customer service division of 311. Over 1,550 seniors expressed interest in the program.
Preserving Our Natural Environment
Implementing the Strategic Energy Action Plan (SEAP)
Charlotte is taking steps to contribute to a healthier community and world by adopting a Strategic Energy
Action Plan (SEAP). The American Cities Climate Challenge (ACCC) is working with us to accelerate the
goals of the SEAP.
After working with community stakeholders for more than a year, City Council
adopted the SEAP in December 2018. The Sustainable and Resilient Charlotte by
2050 resolution and subsequent SEAP set ambitious goals of sourcing 100 percent
of our organization’s building and fleet energy from zero carbon sources and
becoming a low carbon city by 2050. The SEAP focuses on 11 action areas around
buildings, transportation, and energy generation that also emphasize a foundation
of workforce development and equity.
The SEAP is a high-level framework, but we have begun and plan to continue important baseline work in
FY 2020, and we are already making progress in identified projects. Baseline work that will be completed
in FY 2020 includes: finalizing total cost of ownership models that can be used in decision-making; forming

xx | P a g e
internal and external working groups; data-gathering and analysis; exploring partnerships; and getting
projects shovel-ready.
We can make progress toward our SEAP goals in several areas. For buildings, the city has goals of obtaining
LEED certification and we will analyze facilities for solar potential. For fleet, as we refine total cost of
ownership models, we will study transitioning the motor pool to include more electric vehicles and right-
sizing the fleet.
Furthermore, Charlotte Water is adding an additional electric vehicle charging station, implementing an
automatic vehicle locator system, and piloting the use of bio-gas from its wastewater plants as a fuel
source for city fleet. In addition, the departments of Planning, Design and Development and
Transportation will coordinate to expand bike and pedestrian infrastructure, collaborate to include a
sustainability lens within the 2040 Comprehensive Plan, and incorporate e-bikes and e-scooters in first-
mile/last-mile use. With respect to workforce development and equity, we continue identifying
departments for environmental apprenticeship opportunities.
Shortly after adopting the SEAP, the City of Charlotte was named one of 25 U.S. cities selected by
Bloomberg Philanthropies to participate in the American Cities Climate Challenge. The ACCC’s goals are
similarly aligned with the SEAP. The ACCC designation allows us access to resources and technical support,
including two full-time Climate Advisors for two years (paid for by Bloomberg Philanthropies); these
Advisors are already working with the city, focusing on transportation and building projects.
Implementing Circular Charlotte
In 2019, we are advancing the circular economy by planning the opening of the revamped
Innovation Barn. From our work with Metabolic, we realized as a city that we produce 900,000
tons of waste each year – or about $111.0 million worth of materials. This public-private
partnership between the City of Charlotte and Envision Charlotte will divert trash from the
landfill, create jobs, drive innovation and economic development, and will lead the city’s
transformation into this new economy.
Envision Charlotte will use the 36,000-square-foot facility next to Solid Waste headquarters
located in the Belmont neighborhood as community space to provide programs specializing in
the circular economy, co-working space for entrepreneurs focused on upcycling, 6,000 square
foot event space, a beer garden, and a zero-waste restaurant. And this is not just about the
circular economy, it is also about jobs. UNC Charlotte will have a classroom and their architect
students are helping to design the Barn’s outdoor furniture, and Johnson C. Smith students are
designing the aquaponic garden.
The city will also explore how to advance circular economy concepts within our existing
facilities. For example, Charlotte Water is planning to pursue a public-private partnership to
harvest phosphorus from its treatment processes to be beneficially reused as fertilizer and
reduce energy and chemical use at the treatment plants.

xxi | P a g e
Charlotte’s Tree Canopy
The city’s trees are one of its most valuable assets,
providing an enhanced quality of life by providing
shade, character, and clean air. Through
TreesCharlotte, and plantings by city staff as part of
city capital projects , the city planted 19,021 trees in
FY 2018. The city also uses fee-in-lieu dollars
collected from developers during permitting to acquire land to preserve trees. The city partners with
TreesCharlotte to facilitate tree planting events to continue maintaining the city’s tree canopy.
Currently, TreesCharlotte promotes the planting of about 5,300 trees per year. The FY Proposed 2020
Budget makes the fourth $250,000 contribution to the TreesCharlotte endowment, as well as $100,000
to support neighborhood engagement, education about the tree canopy, and tree plantings. In
addition, $900,000 is included in the Proposed FY 2020 Budget for planting trees within city right-of-way
areas, along with $1.6 million provided annually for trimming and removing trees due to aging trees and
storm damage.
Keeping Our City Clean
Providing a healthy community includes keeping our neighborhoods clean. The Proposed FY 2020 Budget
includes an investment of $4.6 million to enable us to maintain our high level of service to the city’s
346,000 existing customers, as well as address the increasing demand created by a growing population
and corresponding increase in the number of collection points around Charlotte.
First, the Proposed FY 2020 Budget provides $150,000 for two new automated
garbage collection crews, as well as $600,000 to purchase two new trucks, to
address the growing demand faced by our Solid Waste Services (SWS)
department. Second, the Proposed Budget supports all additional operating
expenditures needed for SWS to maintain current service levels, including $1.4
million for personnel cost increases and other updates, including vehicle and
equipment maintenance. Additionally, $2.4 million is included to address
contractual increases for the tipping fee. A $1.00 a month increase is proposed
to support service and contractual cost increases and the needed expansion of
the Solid Waste fleet of vehicles.
While we make investments to continue the level of service expected by our residents, and prepare for
future growth, we also need to prepare for the future of waste collection and disposal, including
evaluating the sustainability of this service’s financial model.
Continuing to Connect with Our Residents
We promote efforts to build safe and inclusive communities by engaging with our residents whether it is
in a city building or in their neighborhood. True community engagement is not about holding sessions to
check a box, it is about getting the feedback to design programs and services that best fit the needs of our
community. We are partnering with the New York City Public Engagement Unit to improve how we can
do things differently and become more intentional when engaging with our community. Towards this goal,

xxii | P a g e
we intend to leverage our 311 services even more in the coming year. If you call 311 with a question or
issue about solid waste services, rather than just solving that issue, we intend to provide you with some
information about city programs you might be interested in.
We also continue to utilize our Civic Leadership Academy to more broadly
inform residents about the City of Charlotte government and civic leadership.
Participants in the Academy are provided the opportunity to grow in their
leadership style, learn to analyze issues using data, connect with decision
makers and other Charlotte leaders, and gain useful tools to make a
difference in their communities. There are two rounds of classes each year
(11 sessions per class) and in the most recent application cycle, the city
received over 250 applications for 35 slots (five from each council district),
demonstrating the popularity of this program.
We also continue to engage the community around public safety issues. In FY 2019, we began the Bridging
the Difference program with the aim of bringing our community together for community conversations
across Charlotte around policing, including immigration and opioid use. In addition, CMPD’s Citizen’s
Academy helps build relationships between CMPD and the community, and creates residents who are
better-informed about police work and community services. Through a series of lectures, simulated
activities, practical sessions, and tours residents are given the opportunity to learn firsthand about police
operations.
We also meet our residents in their neighborhoods. The city offers free placemaking tours, which include
workshops, to highlight neighborhood-led placemaking in neighborhoods such as Country Club Heights,
Plaza Midwood, NoDa, Southend, and Uptown. In addition, we host half-day neighborhood board
retreats, two times per year, to help any neighborhood and business organization within the city assess
the current state of their community, identify and prioritize strategic goals, create action plans, and
improve resident quality of life. Since 2012, over 130 neighborhoods and businesses have participated.
Safe Alliance
Building a safe and healthy community also includes working through organizations outside of city
government to ensure our neighbors receive the services they need. We continue to work with
community partners to provide specific services that support key areas of focus for the city, contribute to
community enrichment, and complement services offered by city departments.
One complementary service offered in the community is targeted support for victims of domestic violence
and sexual assault. One of Safe Alliance’s three core programs is Victim Assistance and Legal
Representation. The FY 2020 Proposed Budget includes an additional $63,061 (this includes $49,000 in
one-time funding provided in FY 2019) to help support an additional attorney position at Safe Alliance to
provide legal assistance in obtaining domestic violence protective orders and filing for custody and
divorce. The Proposed FY 2020 total city contribution to Safe Alliance is $397,038.

xxiii | P a g e
Economic Development
Implementing Our Strategy
With the creation of the Charlotte Regional Business Alliance, in FY 2019, we realigned the city’s economic
development focus to become a more active partner in growing and developing the business and
workforce ecosystems. To align with other
regional efforts, we created a four-pillar
strategy to guide our work and to serve as
our foundation:
• Create great places that attract
great talent
• Business innovation
• Talent development
• Grow targeted industry clusters
Upward Mobility Starts in Our Organization
Back in the fall of 2018 you charged us with assessing our internal processes and
ensuring our practices foster diversity, equity and inclusion (DE&I). A steering
team of key individuals was formed, department liaisons were established, data
was analyzed, peer cities were compared, best practices were examined,
literature was researched, and interviews were conducted. The analysis identified
over 120 DE&I activities and initiatives we are engaged in. This 90-day assessment
resulted in a report that you received last year. The report provides 13
recommendations.
While that report contains various solutions, we can use to improve our internal
operations as it relates to DE&I, a key recommendation was to identify a lead to coordinate the work. To
fulfill that recommendation, I am proposing to create the Office of Equity, Mobility, and Integration within
our Housing and Neighborhood Services Department to be led by Federico Rios.
Federico Rios, currently serves as the International and Immigrant Integration Manager. In his new role,
he will link DE&I efforts both internal and externally. He is charged with implementing the
recommendations of the report and to immediately look at our external facing policies and practices that
cause inequitable investment and development in our community.
For this, I am recommending one new position which will work with
the Office of International Relations in the Department of Housing
and Neighborhood Services. This office will also work with community
partners to create opportunities for our residents and promote
upward mobility by aligning with the recommendations of the Leading
on Opportunity Council and the Immigrant Integration Task Force
Report.

xxiv | P a g e
Putting Resources Directly into Our Community
We cannot create safe and engaged communities on our own – we need help from our grassroots
organizations who are solving problems every day. As a city, we recognize we aren’t always equipped to
handle every problem – with the microgrants program we are reaching those grassroots organizations
doing amazing work to make our city safer every day.
Since its launch in 2018, the city’s microgrants program has made over 60 grants to community and non-
profit organizations. For FY 2020, I am proposing $500,000 in funding, five times more than what was
approved for FY 2019. The additional funds will provide small grants to community-based organizations
that promote conflict resolution, crime-fighting and prevention, youth and parent opportunities, and
family stability, and work to overcome racial segregation.
Our community investment continues with a recommended funding
level of $400,000 for the Neighborhood Matching Grants Program.
These funds will be matched by neighborhood volunteer dollars, and
will enable eligible neighborhood organizations and associations to
implement projects that make their neighborhoods better places to live
work and play. These projects give neighbors an opportunity to get to
know one another as they improve their neighborhood by building
community gardens or neighborhood sign toppers, hosting
neighborhood festivals or special events, or improving curb appeal by
painting or installing shutters or house numbers.
Last year, we made a three-year commitment to the Historic West End Initiative. This is a partnership that
began with the Knight Foundation, Charlotte Center City Partners, and community leaders in the Historic
West End to spur economic development based on a community-driven framework focused on three
themes: Engage, Prosper, and Enjoy. Going forward, LISC will take the seat of Center City Partners and
provide $150,000. LISC has already begun working with the Historic West End Partners (HWEP) using a
comprehensive, development community approach to build capacity and strengthen neighborhood
identity through resident action leadership development. LISC is also helping HWEP attract more
resources to the community and become more of a significant player in redevelopment activity.
LISC will also provide small business loans and bridge financing for selected projects. To complement the
partner effort, I am recommending $150,000 for FY 2020.
Upward Mobility Continues in Our Neighborhoods
Eastside and Westside Collaborative Initiative
While our city continues to grow and prosper, there are areas of our city I’d like to concentrate additional
effort. The eastside and westside of our city include communities prime for opportunity. To catalyze the
change, I am recommending $1.0 million to support the Eastside Collaborative Initiative and the Westside
Collaborative Initiative. Each collaborative will receive $500,000 and a total of $500,000 additional
support from LISC.

xxv | P a g e
These funds will help these communities transform themselves into areas of opportunity. They will
leverage other city funding such as the micro grants, neighborhood matching grants, and the Historic West
End Initiative to increase opportunities. LISC will support these initiatives by establishing a Charlotte
Financial Opportunity Center using family income and wealth building staff to provide workforce skills and
financial education services. LISC will also provide micro loans for entrepreneurs, small business façade
loans, and help with community capacity building.
These programs will be developed using robust community engagement techniques. Potential target
areas for these initiatives may include the Eastway, Central, Albemarle corridor on the eastside, and on
the westside, the Beatties Ford Road corridor from West Trade/Rozzelles Ferry to I-85.
Fostering Innovation
The Proposed FY 2020 Budget advances our strategy by recommending $1.7 million for new initiatives
and creating five new positions which will help build and maintain a successful business climate that
promotes workforce development, increases the number of jobs with sustainable wages and benefits,
provides economic opportunity, and encourages innovation and entrepreneurship. Included in this
funding is the creation of CLT Labs, which will serve as a “P3 Disruptor.” It will be a year-round living
laboratory where entrepreneurs can test and produce innovative ideas and products to change how the
city operates. In addition, “Innovate Charlotte” will connect entrepreneurs with resources and mentorship
opportunities that can help them further develop their career.
Charlotte Business Inclusion
Engaging Minority-Owned, Women-Owned, and Small Businesses
(MWSBEs) in the city’s business and capacity-building initiatives
remain a priority of the city. The city’s Charlotte Business INClusion
program continues to successfully partner with Charlotte’s business
community. The city’s spending with MWSBEs continues to grow,
with a new record of $110.4 million in FY 2018. This is $28.6 million
more (or 35 percent) than in FY 2017. In FY 2019, the functions of Charlotte Business INClusion were
transferred to the city’s Procurement office. This move allowed for more collaboration in purchasing and
contracting services. This realignment has led to a more efficient and targeted approach to creating new
pathways for MWSBEs to do business with the city. Furthering this success, a new software, Charlotte
INClusion, was launched in FY 2019. This integrated platform will make it easier to coordinate MWSBE
contract compliance, enable prime contractors to search for potential MWSBE subcontractors, and
streamline small business enterprise online certification.
With the help of a City Accelerator grant from the Citi
Foundation, we created the AmpUp Charlotte program, a 13-
week intensive business development program for local
minority business owners. The inaugural AmpUp Charlotte
cohort was developed in partnership with the National
Basketball Association (NBA) to prepare minority-owned businesses for contracting opportunities during
NBA All-Star Week. We had 15 graduates in the first class. The second cohort began in April 2019 with 16

xxvi | P a g e
businesses, and is specifically tailored to help minority businesses participate in contracting opportunities
at the Airport.
The Proposed FY 2020 Budget builds on this progress by proposing an additional $450,000 for MWSBE
capacity building. Investments include $64,000 to continue the AmpUp program and an additional
$250,000 to create a pipeline from AmpUp to “Graduate School,” and $125,000 to provide MWSBE-
specific resources on CharlotteBusinessResources.com.
Targeting Industries
In support of the fourth pillar of the city’s economic development strategy, this budget also makes
investments that will enhance marketing, as well as help us better understand the economic ecosystem
we already have. This Proposed Budget invests over $800,000 in the following enhancements:
improvements to CharlotteBusinessResources.com, including a chatbot that will provide on-demand
support; communication and marketing materials; site visits and travel to trade shows to better market
Charlotte globally; and other branding improvements. The budget also contains $75,000 for mapping the
talent development “ecosystem” which will help inventory and fully leverage talent resources, economic
impact analysis software to understand our local economy and the value of the city’s investments in our
community, and peer group meetings with stakeholders to understand industry-specific trends affecting
businesses who are already a part of our local community and economy.
Breaking Down Barriers and Increasing Upward Mobility
Upward mobility is a key focus for the city and Project P.I.E.C.E.
(Partnership for Inclusive Employment and Career Excellence) is a
program that addresses economic mobility, labor market
shortages, and employment opportunities in the city. It provides
training and employment opportunities for individuals with
multiple barriers to employment, including homelessness, a
criminal record, health issues, and/or lack of transportation.
With help from our partners at Goodwill, Charlotte Works, Urban League, TWIN, and Central Piedmont
Community College, we have met or exceeded every goal we set out to achieve with Project P.I.E.C.E. We
enrolled 332 job seekers in training – nearly double the goal of 180 we set when we started over three
years ago. Of this number, we graduated 282 participants, or 88 percent, surpassing our goal of 80
percent. Furthermore, we met our goal of 70 percent of graduates who are employed.
Because of the proven success of this program, I am recommending an additional $300,000 in FY 2020 to
continue Project P.I.E.C.E. Phase 2. This will expand Project P.I.E.C.E. 2.0 in the areas of transportation
and logistics.
No Tax Increase in FY 2020
The Proposed FY 2020 Budget does not include a tax increase. It will include a proposed revenue- neutral
rate of 34.81 cents. Adopting this revenue-neutral rate will give Charlotte the lowest city tax rate among
the ten biggest cities in North Carolina and the lowest city tax rate in at least 50 years. At this revenue-

xxvii | P a g e
neutral rate, homes which experienced less than 40 percent will receive a lower city tax bill, and homes
which experienced more than 40 percent growth will receive a higher city tax bill. All vehicle owners
should receive a reduction in their city vehicle personal property tax bill as well.
Revaluation Impacts Some of our Most Challenged Neighborhoods
While the city does not collect any more revenue than a typical year,
69 percent of homeowners will still pay more in city taxes because
of the increased value of their home. As part of evaluating the
county’s new property value data and developing the budget, we
did an in-depth analysis to understand the revaluation’s impacts on
our residents. The analysis was shared with you during our Budget
workshops and committee meetings.
The analysis revealed the greatest impacts occurred in
neighborhoods where people are at a significant risk of
displacement. One statistic that demonstrates some of the
concerns resulting from the revaluation is that homes originally
worth less than $200,000 experienced an increase in value, on
average, of 67 percent, while homes originally worth more than
$400,000 increased, on average, 34 percent. While I am proposing a $750,000 investment in the Aging in
Place Program to help some of our most vulnerable residents, there is no question there will be others
who are also impacted.
Transportation and Planning
Planning for the Next Generation
Designing Charlotte’s First Comprehensive Plan in 45 years
The Charlotte Future 2040 Comprehensive Plan is a plan that will guide how our city grows, how we invest
in our city over the next 20 years, what projects the city approves, and will show where development can
occur, and what neighborhoods will look like at the end of the next stage of the city’s growth.
It is Charlotte’s first Comprehensive Plan since the 1975 Comprehensive
Plan was prepared. Once completed, it will be a living document that takes
community input and ideas and turns them into the actions that guide our
decision-making in both the near- and long-term.
This Plan relies on connections – with other plans, with budgets, and with
what’s going on in the day-to-day life of Charlotte. The Plan’s major driving
theme is equity. Equitable development means being fair about what’s
added in different parts of the city and why it’s added.

xxviii | P a g e
We are well on our way to wrapping up our first phase of the project, which focused on collecting
information and listening to the community to understand existing needs and future goals. We are
beginning to look at different growth scenarios to determine the best option to make our city’s vision
become a reality. The FY 2020 Proposed Budget includes $550,000 for the development of the
Comprehensive Plan and the Knight Foundation for equitable community engagement.
Completing the 2014-2020 Capital Investment Plan
In FY 2014, City Council adopted the Big Ideas CIP, which included projects planned across the 2014, 2016,
2018, and 2020 bonds. The Proposed FY 2020 – 2024 CIP contains the final “Big Ideas” General Obligation
bond referendum in November 2020 (FY 2021). The initial plan supported $816.4 million which grew to
$1.0 billion in General Obligation Bonds (GOB) and Certificates of Participation (COPs).
This amount is proposed to increase by $306.1 million to $1.1 billion in FY 2021 to include additional
money for existing and new projects funded with bond or cash sources.
Previous Steady State Debt Affordability
Last year, we determined a sustainable “Steady State” capital plan which included $165.0 million in GOB
and $25.0 million in COPs. This was based on estimated future needs with a focus on providing stability
in our capital planning. Establishing a steady state model allows us to avoid increasing taxes to support
this CIP. By changing the model assumptions and no longer pulling all the debt capacity forward, we were
able to reserve affordability for the future years without tax increases.
Redefining Capital Development and Putting the Pieces Together
This budget development cycle we looked at how the capital plan was developed. We established a multi-
disciplinary team approach, with my office and the
departments of Engineering and Property Management,
Finance, Strategy and Budget, and our financial advisors
collaborating to improve capital outcomes and efficiencies. We
looked at the overall project management process, how capital
projects were requested, and how project scopes were defined
and costs estimated. We also examined our existing projects,
our expenditure rates, and our debt model assumptions.
The conclusion of our analysis indicates we can increase the
previous steady state amount of $190.0 million ($165 million
GOB and $25 million COPs) to $223.0 million ($190.0 million for
GOB and $33.0 million for COPs). This means we can afford an additional $25.0 million in GOB and $8.0
million COPs for a total of $33.0 million every bond cycle (every two years).

xxix | P a g e
The culmination of this review also leads me to
recommend we establish a Revolving Advanced
Planning and Design Program. For this
program, I recommend we dedicate $20.0
million from the Debt Service Fund as a
revolving account. This money will be used to
plan and design projects, approved by you, to
develop more accurate cost estimates. If the
projects are deemed ready to go forward to the
construction phase, this project will then be
approved by you in a subsequent CIP for either
GOB or COPs funding. The total amount appropriated and voted on will be the full cost of the project.
The planning and design amount included for a specific, approved project will be reimbursed when
permanent financing is available. This advanced planning and design approach will create a “project
pipeline” and a pool of potential projects for future funding. To begin planning projects, the Proposed FY
2020 CIP includes seven, high-priority projects:
Transportation and Planning Priority Area:
• Cross Charlotte Trail Segments 10 and 11
• Ashley Road/Tuckaseegee Road/Freedom Drive Intersection
• Eastway Drive/Shamrock Drive Intersection
• Bryant Farms Road Extension
• Robinson Church Road
Neighborhood Development
• Construct and Renovate Fire Stations
• Complete Police Division Stations
• Upgrade Existing Animal Care and Control Facility
Over the next year, we will review and discuss high-priority projects that align with the new strategic
priorities. Projects for consideration may be identified in master plans or City Council-adopted action
plans, presented based on operational need, or proposed because of technical analysis like safety,
congestion, or connectivity impacts. This process will be collaborative and will result in a Proposed FY
2021 CIP that we have built together. While we build the coming CIP together, I am also recommending
an additional $25.0 million for a total of $50.0 million for Affordable Housing in FY 2021.
Planning
and Design
Planning and Design Timeline

xxx | P a g e
Implementing the Change
Through the review of our capital development process and financial models, it became evident that some
departments’ core functions may have broadened
over time and may need to return to their original
mission. For example, returning the city engineer
function to the core mission of focusing on capital
project management and delivery is essential to the
future success of the city.
To ensure a higher level of attention is provided to
the capital process, I am proposing the creation of the Department of General Services in FY 2020. This
department will have several core functions under its purview. Services such as procurement, cemeteries,
environmental solutions, real estate management, fleet, property maintenance, special events
coordination, and engineering are included. The city engineer function remains a part of this department.
Correspondingly, transferring procurement from the Department of Finance allows Finance to return its
core mission of ensuring financial functions and internal controls are working effectively.
Across the nation, public service organizations have established successful Departments of General
Services to focus on providing cost-effective solutions and services. These types of departments provide
a variety of services. The creation of this type of department in the City of Charlotte will provide a level
of administrative coordination between core functions of the organization that did not exist previously.
To lead this department, I recommend the transfer of a vacant Special Assistant to the City Manager to
create a new director position.
Preserving Our Capital Assets
For the first time in 12 years, we completed a Capital Needs Inventory (CNI).
The CNI, which was a cross-department, collaborative effort, identified
anticipated public infrastructure needs over the next 10 years (FY 2020
through FY 2029). Projects originated from many sources including master
plans, studies, and City Council-adopted action plans. The CNI will be used
as a long-term planning tool for future CIPs. The Proposed FY 2020 CIP
directly reflects the CNI output, evidenced by the doubling of building
maintenance funding over the next five years. COPs are proposed to address needs such as roofs,
mechanical systems, facility expansions, and capital renovations. Included with this are two major
upgrades to the Charlotte-Mecklenburg Government Center: the replacement of two generators for $2.2
million in FY 2020 and the installation of new heating, ventilation, and air
conditioning (HVAC) equipment for a total of $25.7 million over five years.
The Proposed FY 2020 CIP also advances the repaving of a city-owned
heavy equipment facility parking lot, and it plans for the implementation
of the Americans with Disabilities Act (ADA) transition plan starting in FY
2021.

xxxi | P a g e
Scrubbing Our Accounts
This past year, we created a formalized project close-out process. While refinement is still needed in
process, we began the review of active projects. As part of this process, departments were to provide a
plan for each project, which included a remaining draw schedule, estimated completion date, and
determination of whether the project still needed its full funding. Through this process, $11.7 million in
savings was captured and is now proposed for reappropriation to support other projects in the Proposed
FY 2020-2024 CIP.
In addition, after detailed analysis it was determined that $19.9 million in balances are available from the
Pay-As-You-Go Fund for re-appropriation. I propose using the majority of these funds for the Cross
Charlotte Trail.
Addressing High Priority Projects and Initiatives
Improving the city’s bicycle infrastructure has long been a priority. Since 2000 the city has connected over
200 miles of bicycle network across the city. The Uptown Cycle Track is an important component of the
city’s bicycle network. This project provides connections to greenways and bike routes to provide greater
north/south and east/west bicycle mobility. I am proposing an additional $4.5 million in FY 2020 to
complete the cycle track from the Little Sugar Creek Greenway to the Irwin Creek Greenway.
The analysis of each active project has also led to
identifying additional costs. The potential of needing
additional funds was discussed at our City Council
Budget workshops. To fulfill the commitment to the
community, these three projects need to be
addressed, therefore, I have included funding for
them in them in Proposed FY 2020-2024 CIP. These
projects are:
• Cross Charlotte Trail: $54.4 million to complete planned and designed segments
• Central Division Police Station: $1.8 million to complete
• Infill Fire Station: $3.4 million to complete a new 3-bay station (location still to be determined)
Funding Planned Segments of the Cross Charlotte Trail
The City of Charlotte is partnering with Mecklenburg County to create a multi-use trail that will stretch
from the City of Pineville through Center City, on to the UNC
Charlotte campus, and to the Cabarrus County line. Once
completed, the trail will be approximately 30 miles in length
and will allow residents to travel seamlessly from one end
of Charlotte to the other. Approximately 140,000 residents
and 130,000 jobs will be located within walking distance of
the proposed trail and the adjacent connecting greenways.
This project was initially approved by City Council in FY 2014
as part of the Big Ideas for $35.0 million and then an

xxxii | P a g e
additional $3.0 million added for the South Charlotte Connector in FY 2016 bringing the total cost of the
trail to $38.0 million.
In February, we came to Council with an identified need of an additional $54.4 million to complete the
planned and designed segments of the Cross Charlotte Trail. In total, there are 11 segments of the Cross
Charlotte Trail, one is complete, eight are in planning or design, and the remaining two have not been
planned or designed. The cost estimate for the eight segments in planning and design is $54.4 million.
This amount is in addition to the $38 million previously authorized. The following sources of funds are
recommended to address the additional $54.4 million need:
• $11.7 million in savings identified in other projects
• $13.5 million in Pay-Go
• $14.0 million in savings from debt refinancing
• $15.2 million cash-in-lieu-of debt
• Sections 10 and 11 recommended for planning in the Advanced Planning and Design Program
The Year Ahead
Every day, Team Charlotte provides exceptional
service to our residents—this past year, we had
some days where that was put to the test. We
worked together as one to demonstrate
commitment and caring for our community
through tropical storms Florence and Michael.
The collaboration across and within the team
during preparation, response, and recovery was
extraordinary. We again demonstrated hard
work, enthusiasm, and commitment when we
hosted the NBA All-Star game. I am proud that
this year’s proposed budget delivers on the
promise in last year’s transmittal letter to
undertake a comprehensive compensation review and recognize our team’s extraordinary level of service.


62 62
This page intentionally left blank.

2
TABLE OF CONTENTS

62 62
This page intentionally left blank.

Table of Contents
City Manager’s Message City Manager’s Proposed Budget Letter .............................................................................................................. i Executive Summary Executive Summary ..................................................................................................................................................... 1 Revenue Neutral Tax Rate ..................................................................................................................................... 11 Citywide Summary of Tax Levies ....................................................................................................................... 13 Summary of Full-time Equivalent Allocations .............................................................................................. 14
Summary of Revenues ............................................................................................................................................. 15 Summary of Expenditures ..................................................................................................................................... 20 Summary of Financial Partners ........................................................................................................................... 22
Overview FY 2020 Budget Process ......................................................................................................................................... 27 Organizational Leadership .................................................................................................................................... 30 Organizational Chart ................................................................................................................................................ 31 Chart of Accounts ....................................................................................................................................................... 33
Fund Descriptions – Major Governmental Funds ...................................................................................... 34 Fund Descriptions – Non-Major Governmental Funds ............................................................................ 36
Strategic Priorities
City Council Strategic Priorities Overview ..................................................................................................... 41 Department Budgets
General Fund City Attorney ................................................................................................................................................................ 55 City Clerk ....................................................................................................................................................................... 59 City Manager ................................................................................................................................................................ 62 Communications ........................................................................................................................................................ 65 Community Relations .............................................................................................................................................. 69 Economic Development .......................................................................................................................................... 72 Finance ........................................................................................................................................................................... 77 Fire ................................................................................................................................................................................... 82 General Services …. ................................................................................................................................................... 88 Housing and Neighborhood Services ................................................................................................................ 98 Human Resources ................................................................................................................................................... 104 Innovation and Technology ............................................................................................................................... 109 Internal Audit ........................................................................................................................................................... 116 Mayor and City Council ........................................................................................................................................ 119 Planning ...................................................................................................................................................................... 121 Police ............................................................................................................................................................................ 126 Solid Waste Services .............................................................................................................................................. 133 Strategy and Budget .............................................................................................................................................. 138 Transportation ......................................................................................................................................................... 141 Non-Departmental Accounts ............................................................................................................................. 149

Table of Contents Nongeneral Funds
Enterprise Funds Aviation ....................................................................................................................................................................... 159 Charlotte Area Transit System .......................................................................................................................... 171 Charlotte Water ....................................................................................................................................................... 180 Storm Water .............................................................................................................................................................. 190
Internal Service Funds Employee Life and Health Fund ....................................................................................................................... 201 Risk Management Fund ....................................................................................................................................... 202
Special Revenue Funds Municipal Debt Service Fund ............................................................................................................................. 207 Convention Center Tax Fund ............................................................................................................................. 208 Convention Center Debt Service Fund .......................................................................................................... 209 Cultural Facilities Debt Service Fund ............................................................................................................. 210 Emergency Telephone System Fund …………………………………………………………………………….. 211 General Grants Fund ............................................................................................................................................. 212 Hall of Fame Tax Fund .......................................................................................................................................... 213 Hall of Fame Debt Service Fund ....................................................................................................................... 214 Tourism Operating Fund ..................................................................................................................................... 215 Tourism Debt Service Fund................................................................................................................................ 216 Housing and Neighborhood Services Consolidated Grants Fund ..................................................... 217 Powell Bill Fund ...................................................................................................................................................... 219 Consolidated Municipal Service Districts .................................................................................................... 220 Municipal Service Districts ................................................................................................................................. 221 Synthetic Tax Increment Grants ...................................................................................................................... 223
Capital Investment Plan Background, Guiding Principles, Capital Program Improvements, and Highlights .................. 227 Uses of Funds Project Index ............................................................................................................................... 232 General Capital Investment Plan Summary ................................................................................................ 238 Nongeneral Capital Investment Plan Summary ........................................................................................ 239 General CIP Project Summary Schedule ....................................................................................................... 242 Nongeneral Funds Project Summary Schedule ......................................................................................... 251 Pay-As-You-Go ......................................................................................................................................................... 261 Advanced Planning and Design Program ..................................................................................................... 279 Transportation and Planning ............................................................................................................................ 287 Neighborhood Development ............................................................................................................................. 307 Economic Development ....................................................................................................................................... 335 Well-Managed Government ............................................................................................................................... 349
User Fees User Fees Summary ................................................................................................................................................... 363 Regulatory Fees ........................................................................................................................................................... 368 General Services ...................................................................................................................................................... 368 Charlotte Department of Transportation..................................................................................................... 369 Planning, Design, & Development ................................................................................................................... 370 Charlotte Fire Department ................................................................................................................................. 371 Charlotte-Mecklenburg Police Department ................................................................................................ 373 City Clerk’s Office .................................................................................................................................................... 373 Charlotte Water ....................................................................................................................................................... 375

Table of Contents User Fees (continued) Non-Regulatory Fees Aviation ....................................................................................................................................................................... 376 City Clerk’s Office .................................................................................................................................................... 377 General Services ...................................................................................................................................................... 378 Planning, Design & Development .................................................................................................................... 380 Charlotte-Mecklenburg Police Department ................................................................................................ 381 Solid Waste Services .............................................................................................................................................. 382 Charlotte Department of Transportation..................................................................................................... 382 Charlotte Water ....................................................................................................................................................... 382
Other Fees Storm Water .............................................................................................................................................................. 383 Charlotte Water ....................................................................................................................................................... 383
User Fee Appendix ...................................................................................................................................................... 384
Summary Statistics and Policies City Profile ................................................................................................................................................................. 387 Finance and Budget Principles ......................................................................................................................... 393 Financial Policies and Practices ....................................................................................................................... 394 Capital Investment Plan Program Policies .................................................................................................. 398 Capital Investment Plan Financial Policies ................................................................................................. 399
Key Terms and Acronyms Key Terms ...................................................................................................................................................................... 403 Common Acronyms .................................................................................................................................................... 409
Appendix: Compensation and Benefits Executive Summary Human Resources Philosophy Market Movement Summary FY 2020 Public Safety Plan Proposed FY 2020 Broadbanding Pay Plan Structure Proposed FY 2020 Non-Exempt/Hourly Pay Plan Structure

62 62
This page intentionally left blank.

2 2
EXECUTIVE SUMMARY

62 62
This page intentionally left blank.

Executive Summary Overview of Total Budget
The total budget for Fiscal Year (FY) 2020 is $2.63 billion. The total budget is comprised of the annual operating budget and the Capital Investment Plan (capital budget). The annual operating budget reflects day-to-day operations, while the Capital Investment Plan represents large capital outlays over a five-year time horizon. The graph below shows the proposed budget allocated by services.
Personnel (includes benefits),
$813.8, 31.0%
Operating, $557.3, 21.2%
Debt Service, $264.0, 10.0%
Capital, $992.4, 37.8%
FY 2020 Proposed Budget: Total Expenditures by Category$2.63 billion$ in millions
General Fund, $648.6 , 24.7%
Charlotte Water, $515.8 , 19.6%
CATS, $206.0 , 7.9%
Aviation, $765.7 , 29.1% Storm Water
Services, $85.8 , 3.3%
General Debt/Interest, $102.6 , 3.9%
Internal Service and Special Revenue, $171.2 ,
6.5%
General CIP, $131.8 , 5.0%
FY 2020 Proposed Budget: Net of Transfers$2.63 billion$ in millions
7

Executive Summary Revenue and Finance
Development of the FY 2020 Proposed Budget also included a review of revenue and financial approach. The goal is to maintain a good value to tax and rate payers and ensure consistency with Council policy, and uphold the city’s financial ratings.
The property tax rate for FY 2020 is 34.81¢ per $100 of assessed valuation, a decrease of 14.06¢. The FY 2020 assessed value is estimated at $142.71 billion, with an estimated collection rate of 99.0 percent. The tax rate allocation is provided in the table below:
Fund FY 2019 Tax Rate
FY 2020 Tax Rate
Change from FY 2019 to FY 2020
General Fund 38.16¢ 27.31¢ -10.85¢Debt Service 9.51¢ 6.77¢ -2.74¢Pay-As-You-Go Capital 1.20¢ .73¢ -0.47¢Total Tax Rate 48.87¢ 34.81¢ -14.06¢
Proposed Rates and Fees
Charlotte Water The FY 2020 Water and Sewer Fee is proposed to increase by 3.4 percent for the typical homeowner. This means a $2.21 per month increase for a typical homeowner. Charlotte Water’s proposed budget focuses on maintaining a high-quality drinking water and wastewater system, guaranteeing a high level of customer satisfaction, ensuring operational efficiency and compliance, improving safety and security, and promoting a thriving, and economically sustainable community.
Storm Water The proposed FY 2020 Storm Water Services fee will not increase. It will remain at the current average annual user rate of $70.21.
Solid Waste The FY 2020 Solid Waste Fee is proposed to increase by $1.00 per month, or $12 per year. The proposed increase will support increases in solid waste service costs. Contract increases include collection services performed by private haulers and for rollout containers. The rate increase also supports two additional crews and equipment to meet service demand and create efficiency. Mecklenburg County proposed an increase of $1.50 per ton for landfill disposal, $2.00 per ton for yard waste disposal and $1.00 per ton for bagged leaves.
The median home value in Charlotte in FY 2019 was about $140,900. The break-even growth in home values resulting from the revaluation that would leave a property owner’s real property tax bill unchanged is 40.4 percent. The following table reflects the FY 2020 city tax and fee impact for a home that was valued at the FY 2019 median value and grew by the break-even growth in home values:
City of Charlotte Taxes and Fees Prior Year
FY 2019 Proposed FY 2020
$ Change
% Change
Home Value $140,900 $197,810 $56,910 40.4% Property Taxes (includes 14.06¢ decrease) $688.58 688.58 $0.00 0.00% Solid Waste Fee (Residential) $46.06 $58.06 $12.00 26.1%
Water and Sewer Fee (Average user rate) $775.32 $801.84 $26.52 3.42% Storm Water Fee (Average user rate) $70.21 $70.21 $0 0.00% Total Monthly $131.68 $134.89 $3.21 2.44% Total Annual $1,580.17 $1,618.69 $38.52 2.44%
8

Executive Summary General Fund Budget
A central fund into which most of the city’s general tax revenues and discretionary resources are pooled, which is allocated to support many of the operations of city government.
The two largest revenue sources in the General Fund are Property Tax and Sales Tax, which comprise approximately 70 percent of total revenue. The total General Fund revenue growth is budgeted at $33.3 million, an increase of 4.8 percent above FY 2019.
Property Tax, $390.2, 53.6%
Sales Tax, $117.7, 16.2%
Licenses and Fees, $88.3, 12.1%
Utility Franchise Sales Tax, $55.8, 7.7%
Intergovernmental, $59.3, 8.1%
Other Taxes, $16.4, 2.3%
General Fund RevenuesWhere the Money Comes From
$727.7 million $ in millions
9

Executive Summary General Fund Expenditures
The proposed FY 2020 General Fund budget is $727.7 million, a 4.8 percent increase above FY 2019 to address the Mayor and Council’s priorities and provide for a well-managed government.
Economic Development, $5.9 ,
0.8%
General Services, $26.4 , 3.6%
Financial Partners/Other,
$76.5 , 10.5%Fire, $133.0 ,
18.3%
Housing and Neighborhood
Services, $20.6 , 2.8%
Innovation and Technology, $33.2 ,
4.6%
Internal Services, $34.7 , 4.8%
Planning, $10.8 , 1.5%
Police, $285.1 , 39.2%
Solid Waste, $63.7 , 8.8%
Street Lighting, $9.8 , 1.3%
Transportation, $28.0 , 3.8%
FY 2020 General Fund ExpendituresWhere the Money Goes
$727.7 million
$ in millions
10

Executive Summary
1 1
2019 Real Property Revaluation and Revenue Neutral Tax Rate
North Carolina law mandates that counties reappraise all real property at least every eight years. In 2019 the Mecklenburg County Assessor completed a revaluation for the county including the City of Charlotte. Revaluation of real property during favorable economic conditions usually results in property values increasing.
The 2019 revaluation resulted in an overall increase of 54.2 percent in the real property tax base of the City of Charlotte from FY 2019 to FY 2020. The residential component of real property grew by 42.1 percent while commercial properties grew by 75.1 percent.
In a reappraisal year, state law requires that a revenue neutral tax rate be calculated and presented for comparison purposes. “The revenue neutral rate is the rate that is estimated to produce revenue for the next fiscal year equal to the revenue that would have been produced for the next fiscal year by the current tax rate if no reappraisal had occurred.” [NCGS 159-11(e)]
The statute states that to calculate the revenue neutral rate, [step 1] the budget officer shall first determine a rate that would produce revenues equal to those produced for the current fiscal year and [step 2] then increase the rate by a growth factor equal to the average annual percentage increase in the tax base due to improvements since the last general reappraisal.
The steps to calculate revenue-neutral for the City of Charlotte per $100 of property value is shown below:
FY 2019 Projected Revenue
FY 2020 Assessed Property Valuation
Unadjusted Revenue Neutral Tax Rate
Step 1 $484,592,039 ÷ $142,710,564,432 = 33.96¢ / $100
Unadjusted Revenue Neutral Tax Rate
Average Annual Growth Rate
Final Revenue Neutral Tax Rate
Step 2 33.96¢ / $100 × 2.52% = 34.81¢ / $100
The table below shows the revenue neutral tax rate calculation for the City of Charlotte and its Municipal Service Districts.
City of Charlotte Revenue Neutral Tax Rate
FY 2019 Projected Revenue $484,592,039
FY 2020 Assessed Value $142,710,564,432
Tax Rate to produce revenue equal to FY 2019 33.96¢ / $100
Growth Factor 2.52%
FY 2020 Revenue Neutral Rate 34.81¢ / $100
11

Executive Summary
2 2
For Municipal Service Districts, the same calculation methodology was employed which resulted in revenue neutral tax rates as shown below for each district:
Municipal Service District Rates per $100 Valuation
Municipal Service District FY 2019
Current Tax Rate FY 2020
Revenue Neutral Tax Rate
District 1 - Center City 2.08¢ 1.36¢
District 2 - Center City 2.93¢ 1.83¢
District 3 - Center City 4.18¢ 2.89¢
District 4 - South End 6.68¢ 3.90¢
District 5 - University City 2.79¢ 2.12¢
12

Summary of Tax Levies
7 7
FY 2017 FY 2018 FY 2019 FY 2020 Adopted Adopted Adopted Proposed
Citywide Assessed Property Valuation $93,830,455,252 $96,617,272,663 $98,847,293,588 $142,710,564,432
Citywide Tax Rate Per $100 Valuation
Fund
General 0.3741 0.3741 0.3816 0.2731
Municipal 0.0926 0.0926 0.0951 0.0677
Pay-As-You-Go 0.0120 0.0120 0.0120 0.0073
Total City-wide Tax Rate 0.4787 0.4787 0.4887 0.3481
Collection Rate
All Funds 0.9810 0.9875 0.9900 0.9900
Citywide Tax Levy*
Fund
General $318,097,150 $354,527,152 $373,429,260 $385,804,493Municipal Debt Service $85,655,762 $87,915,917 $93,063,738 $95,712,072Pay-As-You-Go $10,603,238 $11,369,147 $11,743,058 $10,328,752Total Citywide Tax Levy $414,356,150 $453,812,216 $478,236,056 $491,845,316* Levy excludes estimated rebates
Municipal Service Districts Rates Per $100 in Valuation
District 1 - Center City 0.0168 0.0168 0.0208 0.0136District 2 - Center City 0.0233 0.0233 0.0293 0.0183District 3 - Center City 0.0358 0.0358 0.0418 0.0289District 4 - South End 0.0668 0.0668 0.0668 0.0390District 5 - University City 0.0279 0.0279 0.0279 0.0212
Municipal Service Districts Assessed Valuation
District 1 - Center City $7,730,251,721 $7,885,841,558 $8,183,546,653 $12,892,535,666District 2 - Center City $3,280,575,709 $3,284,759,497 $3,483,647,721 $5,764,520,666District 3 - Center City $3,320,707,059 $3,358,293,703 $3,436,932,487 $5,156,043,404District 4 - South End $1,291,857,493 $1,384,388,551 $1,460,907,143 $2,717,820,303District 5 - University City $2,740,786,581 $2,697,136,682 $2,723,105,506 $3,873,938,001
13

Summary of Position Allocations by Fund
1 1
Departments
FY 2019 FY 2020 FY 2020 BudgetTotalFTEs
ProposedTotalFTEs
FTE Count
Change
City Attorney 30.00 30.00 -
City Clerk 7.00 8.00 1.00
City Manager's Office 11.00 11.00 -
Communications 35.00 34.00 -1.00
Community Relations 10.00 12.00 2.00
Economic Development 19.00 21.00 2.00
Finance* 119.00 88.00 -31.00
Fire 1,207.00 1,237.00 30.00
General Services* 450.00 491.00 41.00
Housing and Neighborhood Services 235.75 236.75 1.00
Human Resources 46.00 47.00 1.00
Internal Audit 10.00 11.00 1.00
Innovation and Technology 145.00 148.00 3.00
Mayor and City Council 12.00 12.00 -
Planning 97.00 108.00 11.00
Police 2,504.50 2,498.50 -6.00
Solid Waste Services 314.00 316.00 2.00
Strategy and Budget 18.00 17.00 -1.00
Transportation 423.75 424.75 1.00
Total General Fund 5,694.00 5,751.00 57.00 Aviation 659.00 708.00 49.00
Charlotte Area Transit System 534.75 582.75 48.00
Storm Water 153.00 171.00 18.00
Charlotte Water 958.00 997.00 39.00
Total Enterprise Fund 2,304.75 2,458.75 154.00
Risk Management 23.00 23.00 -
Total Internal Services Fund 23.00 23.00 0.00
Total All Funds 8,021.75 8,232.75 211.00
*In FY 2020 the Procurement division, including Charlotte Business Inclusion, will be transferred from Finance to General Services
14

Summary of Revenues
1 1
Major General Fund Revenue Sources
A balanced budget requires anticipated revenues equal appropriated expenditures. Using best practice budgeting principles, anticipated revenue is the key driver of the budget development process. The city’s revenue forecasting philosophy is focused on realistic expectations, while considering historic data and trends. To reduce the risk of misjudging the data, the city consults with its financial advisor and banking partners in order to gather a more comprehensive outlook of the current economy.
The following outlines the major revenue sources that make up General Fund and the assumptions used to forecast them.
The total General Fund budget for FY 2020 is $727,674,000, a revenue increase of $33.3 million (or 4.8 percent) over the FY 2019 Budget. The General Fund tax rate is 27.31¢ per $100 valuation. For FY 2020, revenue estimates are compiled using information provided by the North Carolina League of Municipalities, statistical trends, and other local factors.
Property Taxes: The General Fund budget is balanced with a property tax rate of 27.31¢ per $100 valuation. This will yield $390.2 million in total current and prior year ad valorem tax revenue based on an average real and personal property tax collection rate of 99.00 percent. This represents a $12.3 million revenue increase over FY 2019. The tax base used represents a total property valuation of $142.7 billion (including motor vehicles). One cent on the tax rate produces $14.1 million in revenue, after the estimated collection rate is applied. This rate is the lowest of the ten largest cities in the state.
Sales Taxes: The General Fund is projected to collect $117.7 million in sales tax revenue in FY 2020, a $6.9 million (or 6.3 percent) increase over FY 2019. Local sales taxes levied by the city and county comprise 2.50 percent of the total 7.25 percent sales tax paid on retail sales in North Carolina. The local sales tax portion consists of a 1-cent tax that was first levied in 1967, a ½-cent tax levied in 1983, a ½-cent tax levied in 1986, and an additional ½-cent that was levied in 1998 to support the transit system. Effective October 1, 2008, the state acquired control over ¼-cent of the Article 44 local option sales tax. The city will be completely reimbursed for the loss of this revenue with hold harmless payments. The State of North Carolina collects the sales taxes and distributes it to localities.
Utility Franchise Sales Tax: As of July 1, 1999, each city’s share of the utility franchise fee was based on actual receipts from companies providing electricity. The state levied a 3.22 percent franchise tax on the total gross receipts of all businesses within the state that provide electricity. An amount equal to 3.09 percent of the total gross receipts of electricity service derived from the sale within any municipality was distributed to the municipality in which these gross sales are made. These funds were collected by the state and distributed to the city based on the actual receipts from the providers for services provided within the city limits. On July 1, 2014, the state imposed a sales tax on electricity and piped natural gas, which replaced the previous Utilities Franchise Fee. This revenue source is projected to be $55.8 million in FY 2020, which represents an increase of $2.8 million (or 5.3 percent) over FY 2019.
Solid Waste Services Fee: The city collects a single family residential solid waste annual fee of $58.06 and a multi-family annual fee of $58.06 to offset a portion of the cost of providing solid waste services. The annual single family and multi-family residential annual fees are increased by $12.00, from FY 2019, a $1.00 increase per month. This revenue source is projected to be $20.1 million in FY 2020, which represents an increase of $4.4 million from FY 2019.
15

Summary of Revenues
2 2
General Fund The following provides a line item detail and year-to-year comparison of all budgeted general fund revenues.
Percent ChangeFY 2017 FY 2018 FY 2019 FY 2020 FY 2019
Actual Actual Adopted Proposed FY 2020
PROPERTY TAX Property Tax - Current Year Base $351,064,307 $359,815,737 $371,015,406 $382,829,271 3.2 %
Property Tax - Synthetic TIG Properties - - $2,413,854 $2,975,221 23.3 %
Prior Year - - $4,800,000 $4,800,000 0.0 % Rebates - - -$2,400,000 -$2,400,000 0.0 % Penalties $501,182 $495,913 $590,000 $500,000 -15.3 % Interest $1,484,908 $1,488,908 $1,500,000 $1,500,000 0.0 % Rebates of Listing Penalties -$8,000 -$8,000 0.0 %
Total $353,050,397 $361,800,558 $377,911,260 $390,196,492 3.3 %
SALES TAX Sales - Article 39 (1.0%) & Article 42 (0.5%) $99,298,837 $108,056,362 $110,793,539 $117,730,642 6.3 %
Total $99,298,837 $108,056,362 $110,793,539 $117,730,642 6.3 %
UTILITIES FRANCHISE TAX Utility Franchise $52,627,396 $52,933,406 $53,000,000 $55,799,321 5.3 %
Total $52,627,396 $52,933,406 $53,000,000 $55,799,321 5.3 %
POLICE SERVICES Law Enforcement Services - County $16,509,793 $17,994,061 $14,560,000 $15,901,116 9.2 % Small Town Service Fees $269,471 $165,218 $180,000 $165,000 -8.3 % School Resource Officers - School Board $4,519,495 $5,025,661 $5,344,514 $5,808,530 8.7 %
Total $21,298,759 $23,184,940 $20,084,514 $21,874,646 8.9 %
TAX REIMBURSEMENTS Beer & Wine Tax $3,704,577 $3,596,072 $4,074,510 $3,815,073 -6.4 % State Waste Disposal Tax $416,447 $695,875 $568,050 $595,000 4.7 %
Total $4,121,024 $4,291,947 $4,642,560 $4,410,073 -5.0 %
SOLID WASTE FEE Refuse Disposal Fees $11,018,835 $13,259,164 $15,698,124 $20,085,000 27.9 %
Business Garbage Fees $236,275 $212,225 $234,600 $225,000 -4.1 %
Total $11,255,110 $13,471,389 $15,932,724 $20,310,000 27.5 %
BUSINESS PRIVILEGE LICENSES Business Privilege Licenses $26,175 $21,506 - - 0.0 %
Total $26,175 $21,506 - - 0.0 %
OTHER REVENUES Licenses and Permits
Motor Vehicle Licenses $3,041,256 $3,006,224 $3,193,000 $3,193,000 0.0 % Motor Vehicle Licenses - Rebates -$63,333 -$79,278 -$48,000 -$48,000 0.0 % Animal Licenses - Fertile $160,047 $158,607 $160,000 $160,000 0.0 % Animal Licenses - Spay/Neuter $471,842 $447,144 $450,000 $450,000 0.0 % Fire Plan Review Fees $1,731,621 $1,962,619 $1,912,685 $2,793,345 46.0 % Vehicle Licenses - City Billed $19,095 $18,740 $20,000 $20,000 0.0 % Fire Permits $1,498,000 $1,634,995 $2,010,705 $1,344,775 -33.1 % Security Dog Licenses - $30 $100 $100 0.0 % Vehicle for Hire Fees and Permits $285,884 $290,372 $281,660 $281,660 0.0 % Carrier Franchise Fees $82,760 $80,673 $100,000 $100,000 0.0 % Video Programming (Cable Franchise) Fees $7,763,183 $7,566,705 $7,847,617 $7,566,705 -3.6 % Development Plan Review Fees $5,934,458 $5,945,227 $6,033,446 $3,195,435 -47.0 % Sexually Oriented Businesses Licenses $88,275 $92,165 $109,716 $92,000 -16.1 % Temporary Infrastructure Permits $13,400 $6,775 - $109,350 100.0 % Parking and Parade Permits $99,521 $119,721 $108,516 $323,875 198.5 %
Total $21,126,009 $21,250,719 $22,179,445 $19,582,245 -11.7 %
16

Summary of Revenues
3 3
General Fund Percent Change
FY 2017 FY 2018 FY 2019 FY 2020 FY 2019 Actual Actual Budget Proposed FY 2020
Fines, Forfeits and Penalties Vehicle for Hire Penalties $39,889 $19,523 $30,000 $20,000 -33.3 %
Housing Code Violations $165,010 $184,937 $155,726 $185,000 18.8 %
Parking Citations $763,044 $862,978 $819,780 $870,000 6.1 %
Parking Citation Penalties $71,611 $81,073 $74,401 $82,000 10.2 %
Security Alarm Fines $643,398 $728,744 $650,000 $730,000 12.3 %
Fire Citation Fines $87,461 $16,410 $84,500 $50,000 -40.8 %
Zoning Enforcement Fines $91,503 $138,972 $134,209 $148,000 10.3 %
Court Assessment Crime Lab $112,704 $89,682 $115,000 $85,000 -26.1 %
Privilege License Penalties $3,036 $1,372 - - 0.0 %
Animal License Penalties $53,259 $51,607 $40,000 $50,000 25.0 %
Animal Citation Penalties $19,891 $17,622 $10,000 $17,500 75.0 %
Court Costs - Superior $103,325 $95,647 $115,000 $115,000 0.0 %
Court Awards - Vice & Narcotics $225 $25 $50 - -100.0 %
Animal License Late Fees $74,748 $66,100 $76,500 $65,000 -15.0 %
Total $2,229,104 $2,354,692 $2,305,166 $2,417,500 4.9 %
Interlocal Grants and Agreements Wireless Communications $3,715,477 $3,966,955 $3,680,339 $3,606,311 -2.0 %
Fleet Maintenance $1,379,572 $1,426,332 $1,485,387 $1,493,000 0.5 %
Webhosting - County $91,950 - $91,950 - -100.0 %
First Responder $484,500 $444,125 $484,500 $566,929 17.0 %
Procurement Services $125,940 $115,328 $115,328 $115,328 0.0 %
Customer Services - CharMeck 311 - $1,411,560 $1,287,932 $1,335,207 3.7 %
CMGC Occupancy $791,800 $786,729 $795,378 $841,034 5.7 %
Recycling Program Proceeds $193,868 $217,830 $140,000 $70,000 -50.0 %
Corporate Communications Services $11,761 - $12,000 - -100.0 %
CMGC Phone Costs - County $29,897 $45,367 - - 0.0 %
County Fire Reimbursement $16,104 $15,854 - $723,000 100.0 %
Total $6,840,869 $8,430,080 $8,092,814 $8,750,809 8.1 %
Federal and State Shared Revenues ABC Stores Revenue $4,004,760 $4,543,436 $5,446,474 $4,829,681 -11.3 %
Total $4,004,760 $4,543,436 $5,446,474 $4,829,681 -11.3 %
General Government Enhanced User Fees - - $807,383 $807,383 0.0 %
Utility Right-of-Way Ordinance Fees $1,144,983 $1,326,477 - - 0.0 %
County Plan Review $848,400 - - - 0.0 %
Zoning Petition Filing Fees* $1,809,370 $2,714,908 $3,291,457 $1,341,018 -59.3 %
Annexation Fees $800 $1,200 $400 $400 0.0 %
Subdivision Services* $496,094 $587,396 $588,525 $4,405,127 648.5 %
Zoning Admin Fees $46,700 $1,040,665 $994,349 $1,030,909 3.7 %
Historic District Fee $46,910 $54,720 $44,250 $52,310 18.2 %
Equipment Mgmt Svcs - Fleet $71,760 $80,486 $72,171 $72,000 -0.2 %
Procurement Professional Services $340,436 $410,860 $400,000 $400,000 0.0 %
Procurement CCPA $214,664 $353,105 $300,000 $300,000 0.0 %
Tree Planting $84,288 $39,238 - - 0.0 %
Park It! Program Fees $7,562 $6,760 $7,000 $6,700 -4.3 %
Parking Garage Fees $1,008,629 $1,099,399 $1,160,232 $1,131,000 -2.5 %
Parking Meter Revenue $1,125,028 $1,270,625 $1,190,417 $1,277,000 7.3 %
Rent Revenue - Misc $652,438 $836,522 $1,652,122 $1,131,942 -31.5 % Total $7,898,062 $9,822,361 $10,508,306 $11,955,789 13.8 %
17

Summary of Revenues
4 4
General Fund Percent Change
FY 2017 FY 2018 FY 2019 FY 2020 FY 2019 Actual Actual Adopted Proposed FY 2020
Public Safety State Reimb for Services Provided - Transportation/Fire
$1,448,052 $2,223,142 $1,474,448 $1,529,281 -13.8 %
Federal Reimb for Services Provided - Fire - - - $230,000 100.0 %
Police - Fingerprint Reports $25,258 $29,265 $20,000 $27,500 37.5 %
Underbrush and Debris Removal $460,803 $503,180 $492,354 $500,000 1.6 %
Demolition - Clearing $260,924 $311,216 $271,751 $303,000 11.5 %
Sale of Animals $36,015 $34,481 $35,000 $35,000 0.0 %
Utility Street Cuts $2,683,700 $2,442,777 $2,850,000 $2,600,000 -8.8 %
Spay/Neuter Fees $68,224 $80,593 $80,000 $80,000 0.0 %
Vehicle Towing and Storage $99,315 $107,555 $92,808 $108,000 16.4 %
Animal Reclaim Fees $97,815 $88,086 $95,000 $95,000 0.0 %
Total $5,180,106 $5,820,295 $5,411,361 $5,507,781 -3.6 %
Cemeteries Sale of Cemetery Lots $263,000 $232,230 $292,400 $383,700 31.2 %
Grave Digging $313,333 $295,345 $401,100 $519,100 29.4 %
Duplicate Deeds and Transfer Fees $500 - $1,000 - -100.0 %
Monument Foundation $70,806 $85,615 $109,410 $116,560 6.5 %
Perpetual Care $35,800 $32,950 $69,100 $98,880 43.1 %
Total $683,439 $646,140 $873,010 $1,118,240 28.1 %
Use of Money and Property Interest on Liens $177,641 $249,627 $224,759 $250,000 11.2 %
Damage to City-Owned Equipment $534,573 $573,680 $550,667 $561,680 2.0 %
Reimbursement for City Car Use $94,987 $100,641 $106,090 $106,090 0.0 %
Total $807,201 $923,948 $881,516 $917,770 -4.6 %
Sale of Salvage and Land Sale of Land $217,800 $35,556 $100,000 - -100.0 %
Sale of Salvage $128,550 $142,509 $130,000 $130,000 0.0 %
Sale of Used Autos $783,296 $877,250 $750,000 $865,000 15.3 %
Total $1,129,646 $1,055,315 $980,000 $995,000 -7.1 %
Other Interest on Investments $706,859 $1,767,159 $1,050,725 $3,000,000 185.5 %
Miscellaneous Grants and Contributions $51,838 $107,800 - - 0.0 %
Newspaper Rack Revenue $7,300 $6,050 $7,500 $6,000 -20.0 %
Reimb City Svcs - SWS Spec Svcs $58,514 $99,533 $118,000 $120,000 1.7 %
Telecom Review/Modifications $8,000 $17,500 $20,000 - -100.0 %
Google Fiber Hut-Lease Agrmnt $26,368 $27,159 - $30,000 100.0 %
Recovery of Losses - $800,000 - - 0.0 %
Other Revenue $569,846 $328,024 $612,000 $734,025 19.9 %
Total $1,428,725 $3,153,225 $1,808,225 $3,890,025 17.5 %
Total Other Revenues $50,621,062 $56,233,052 $57,735,592 $59,964,840 -1.3 %
TRANSFERS AND FUND BALANCE Transferred Revenues
Occupancy Taxes - CRVA $5,484,623 $5,905,400 $5,752,992 $6,243,723 8.5 %
Heavy Equipment Tax $713,009 $765,058 $750,000 $820,000 9.3 %
Tree Mitigation Fees $1,314,782 $1,574,031 - - 0.0 %
Municipal Debt Service $1,214,599 $119,989 $122,859 $122,859 0.0 %
Convention Center Tax - Towns' TourismSubsidy
$3,697,278 $3,949,275 $3,986,127 $4,223,729 6.0 %
Convention Center Tax - Stadium Traffic Control - $1,250,000 $250,000 $250,000 0.0 %
PAYGO - One-time Funding - $325,000 - - 0.0 %
Total $13,131,150 $15,655,912 $11,912,703 $11,660,311 23.1 %
18

Summary of Revenues
5 5
General Fund Percent Change FY 2017 FY 2018 FY 2019 FY 2020 FY 2019
Actual Actual Adopted Proposed FY 2020
Intragovernmental Revenues
Cost Allocation - Storm Water $1,067,847 $1,214,122 $1,239,224 $1,014,071 -18.2 %
Cost Allocation - Charlotte Water $8,759,560 $8,947,389 $9,275,863 $11,017,046 18.8 %
Cost Allocation - Aviation $3,085,320 $3,581,903 $4,092,739 $4,713,409 15.2 %
Fire Control Services - Aviation $5,465,254 $6,034,736 $6,215,852 $6,668,159 7.3 %
Account Services - Storm Water $1,788,546 $1,825,977 $2,017,200 $1,835,274 -9.0 %
Account Services - Charlotte Water $5,172,490 $5,447,266 $5,692,199 $5,342,636 -6.1 %
Cost Allocation - CATS $3,539,549 $3,610,340 $4,880,357 $4,987,508 2.2 %
Cost Allocation - Risk Management $621,801 $613,032 $632,731 $384,480 -39.2 %
Police Services - Airport & CATS $6,903,765 $7,469,657 $8,530,919 $9,713,092 13.9 %
Total 36,404,132 38,744,422 42,577,084 45,675,675 7.3 %
Transfers from Other Funds
Cemetery Trust $17,985 $29,131 $96,000 $52,000 -45.8 %
Transfer from Capital Reserves for Police Foundation Study
$379,504 - - - 0.0 %
Total $397,489 $29,131 $96,000 $52,000 -45.8 %
Total Transfers and Fund Balance $49,932,771 $54,429,465 $54,585,787 $60,387,986 10.6 %
Total General Fund Revenues $642,231,531 $674,422,625 $694,385,975 $727,674,000 4.8 %
19

Summary of Expenditures
1 1
By Fund and Activity Net of Transfers
FY 2020FY 2020 Percent FY 2020 Percent FY 2020 Percent
Fund / Activity Operating Change Capital Change Total Change
General $648,640,971 7.9% 1 $648,640,971 7.9% 1
Aviation $233,052,393 35.5% $492,769,409 8.5% $725,821,802 15.9%
Water and Sewer $167,798,932 5.8% $275,408,830 13.9% $443,207,762 10.7%
Charlotte Area Transit System $161,433,837 4.6% $29,968,240 -50.2% $191,402,077 -10.8%
Storm Water Utility $15,788,264 2.7% $62,500,000 20.2% $78,288,264 16.2%
Debt Service $264,007,532 5.0% $264,007,532 5.0%
Powell Bill $22,141,067 -2.1% $22,141,067 -2.1%
Convention Center $22,345,698 -10.2% $22,345,698 -10.2%
NASCAR Hall of Fame $7,378,993 36.6% $7,378,993 36.6%
Public Safety and Other Grants $12,577,563 -7.4% $12,577,563 -7.4%
Public Safety 911 Services $3,515,000 6.3% $3,515,000 6.3%Housing and Neighorborhood Services Grants $14,455,552 30.1% $14,455,552 30.1%
Municipal Service Districts $6,124,775 4.9% $6,124,775 4.9%
Risk Management $1,501,288 3.1% $1,501,288 3.1%
Employee Life and Health Fund $44,093,655 N/A 2 $44,093,655 N/A
Tourism Operating $8,462,782 27.4% $8,462,782 27.4%
Pay-As-You-Go $1,790,009 4750% 3 $1,790,009 4750% 3
General Capital Investment Plan $131,780,106 -63.8% $131,780,106 -63.8%
Total Budget $1,635,108,311 12.9% $992,426,585 -15.4% $2,627,534,896 0.3% Adjusting the city's funds to "net of transfers" eli minates the presenta tion of dupli cate expenditures an d does not r espresent the full app ropriation.
1 FY 2020 includes $19.1 million in municipal equipment payments that were excluded in FY 2019. After adjusting, the General Fund growth from FY 2019 to FY 2020 is 4.6 percent.
2 The Employee Health and Life Fund was not included in the approved budget in FY 2019.
3 In FY 2020, the Pay-As-You-Go Fund includes a $1 million payment to the Charlotte Firefighters Retirement System.
20

Summary of Expenditures
2 2
General Fund Gross Expenditures
Department FY 2018 Actual
FY 2019 Adopted
FY 2020 Proposed
Percent Change
City Attorney $2,098,116 $2,705,078 $2,722,882 0.7 %
City Clerk $720,714 $771,539 $879,275 14.0 %
City Manager's Office $2,627,144 $2,678,128 $2,787,528 4.1 %
Communications $3,898,050 $4,178,779 $4,119,119 -1.4 %
Community Relations Committee $1,059,282 $1,097,564 $1,514,524 38.0 %
Economic Development $4,854,984 $5,798,807 $5,937,295 2.4 %
Finance 1,2 $19,005,825 $16,846,897 $12,668,677 -24.8 %
Fire $124,116,425 $126,675,700 $133,020,122 5.0 %
General Services 1,2 $17,837,507 $20,160,120 $26,397,988 30.9 %
Housing and Neighborhood Services $17,993,647 $19,931,100 $20,552,057 3.1 %
Human Resources $5,278,700 $5,592,116 $5,526,272 -1.2 %
Innovation and Technology $28,742,039 $29,137,597 $33,154,912 13.8 %
Internal Audit $1,276,163 $1,285,249 $1,423,444 10.8 %
Mayor & City Council $754,135 $742,369 $747,268 0.7 %
Planning Design and Development $6,967,312 $10,217,713 $10,813,087 5.8 %
Police $259,506,939 $272,691,156 $285,066,260 4.5 %
Solid Waste Services $55,502,644 $59,675,276 $63,678,465 6.7 %
Strategy and Budget $2,033,695 $2,446,755 $2,323,787 -5.0 %
Transportation $24,930,122 $26,634,763 $27,973,238 5.0 %
Non-Departmental $87,617,334 $85,119,269 $86,367,800 1.5 % Total General Fund Expenditures $666,820,777 $694,385,975 $727,674,000 4.8 %
1 In FY 2019 the Fleet Management division was transferred to Engineering and Property Management from Finance.2 General Services is created in FY 2020. The new department is the result of consolidating the Procurement Management division of Finance, the Sustainability division of Economic Development, and Engineering and Property Management.
21

Summary of Financial Partners
15 15
Financial Partners are contracted by the City of Charlotte to provide specific services. The types of financial partnerships are diverse and include partnerships that: support key areas of focus for the city, contribute to community enrichment, and complement departmental service needs.
There are four primary funding categories of Financial Partners – General Fund Discretionary, Dedicated Revenue Sources, Federal Grant Funds, and Pay-As-You-Go (PAYGO): General Fund Discretionary – this includes direct discretionary allocations from the General Fund Dedicated Revenue Sources – these partners receive allocations from sources such as Food & Beverage Sales Tax
and Municipal Service District Tax Federal Grant Funds – funded by federal programs such as Community Development Block Grants (CDBG) and
Housing Opportunities for Persons With AIDS (HOPWA) PAYGO – funded locally by the Innovative Housing portion of the PAYGO fund for services such as housing,
community development, and crisis assistance
Changes to Existing Financial Partners Funding
General Fund Discretionary All agencies, with the exception of Safe Alliance and Charlotte Regional Business Alliance are proposed to
maintain FY 2019 funding levels. Safe Alliance has a proposed increase of $14,061. This increase is intended to help support an additional attorney
position that will provide legal services for domestic violence protective orders and filing for custody or divorcefor victims of domestic violence and sexual assault in Mecklenburg County.
Charlotte Regional Business Alliance has a proposed increase of $3,276. This proposed increase is consistentwith a mutually agreed upon population per-capita formula and equals Mecklenburg County funding levels.
Dedicated Revenue Sources The FY 2020 recommended budgets for Charlotte Center City Partners and University City Partners Municipal
Service Districts #1-5 include proposed revenue neutral tax rates to support economic, cultural, and socialdevelopment within designated districts.
The Charlotte Regional Visitors Authority budget increases by approximately three percent over the FY 2019base funding level, due to increased revenue projections for the Occupancy Tax and Food & Beverage Tax.
Federal Grant Funds Agencies that receive partial or full funding from federal grants are budgeted to receive the full eligible federal
allocation Crisis Assistance Ministry and Charlotte Mecklenburg Housing Partnership are proposed to maintain the FY 2019
funding level for the PAYGO portion of their funding.
PAYGO Funds Agencies that receive 100 percent PAYGO funding are proposed to maintain their FY 2019 funding levels. For agencies that receive a portion of PAYGO funds, this component is held flat at the FY 2019 level (the federal
portion is allocated at the full eligible allocation)
Out of School Time Partners FY 2020 represents the first year of a bi-annual funding process for Out of School Time Partners. The total annual Out of School Time Partner funding of $979,934 maximizes the eligible CDBG allocation of
$815,007. The remaining $164,927 is funded by the Innovative Housing PAYGO program.
The individual Financial Partner funding levels are found on the following page.
22
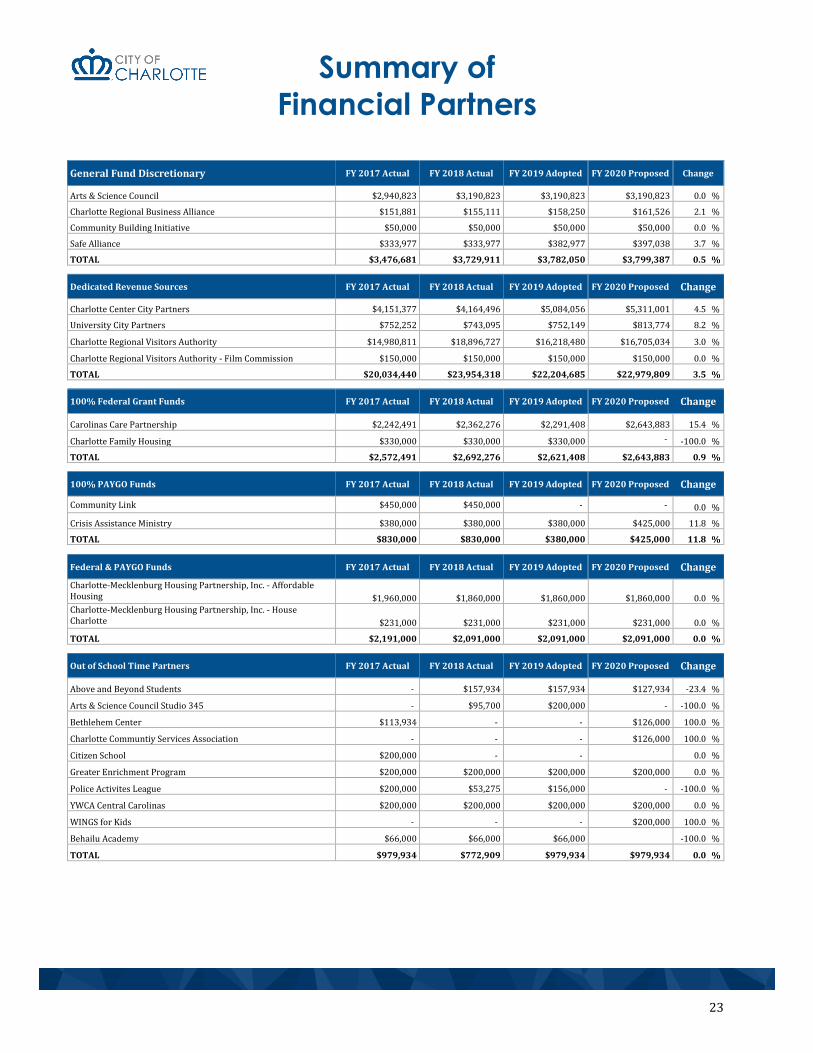
Summary of
Financial Partners
1
123
General Fund Discretionary FY 2017 Actual FY 2018 Actual FY 2019 Adopted FY 2020 Proposed Change
Arts & Science Council $2,940,823 $3,190,823 $3,190,823 $3,190,823 0.0 %
Charlotte Regional Business Alliance $151,881 $155,111 $158,250 $161,526 2.1 %
Community Building Initiative $50,000 $50,000 $50,000 $50,000 0.0 %
Safe Alliance $333,977 $333,977 $382,977 $397,038 3.7 %
TOTAL $3,476,681 $3,729,911 $3,782,050 $3,799,387 0.5 %
Dedicated Revenue Sources FY 2017 Actual FY 2018 Actual FY 2019 Adopted FY 2020 Proposed Change
Charlotte Center City Partners $4,151,377 $4,164,496 $5,084,056 $5,311,001 4.5 %
University City Partners $752,252 $743,095 $752,149 $813,774 8.2 %
Charlotte Regional Visitors Authority $14,980,811 $18,896,727 $16,218,480 $16,705,034 3.0 %
Charlotte Regional Visitors Authority - Film Commission $150,000 $150,000 $150,000 $150,000 0.0 %
TOTAL $20,034,440 $23,954,318 $22,204,685 $22,979,809 3.5 %
100% Federal Grant Funds FY 2017 Actual FY 2018 Actual FY 2019 Adopted FY 2020 Proposed Change
Carolinas Care Partnership $2,242,491 $2,362,276 $2,291,408 $2,643,883 15.4 %
Charlotte Family Housing $330,000 $330,000 $330,000 - -100.0 %
TOTAL $2,572,491 $2,692,276 $2,621,408 $2,643,883 0.9 %
100% PAYGO Funds FY 2017 Actual FY 2018 Actual FY 2019 Adopted FY 2020 Proposed Change
Community Link $450,000 $450,000 - - 0.0 %
Crisis Assistance Ministry $380,000 $380,000 $380,000 $425,000 11.8 %
TOTAL $830,000 $830,000 $380,000 $425,000 11.8 %
Federal & PAYGO Funds FY 2017 Actual FY 2018 Actual FY 2019 Adopted FY 2020 Proposed Change
Charlotte-Mecklenburg Housing Partnership, Inc. - Affordable Housing $1,960,000 $1,860,000 $1,860,000 $1,860,000 0.0 % Charlotte-Mecklenburg Housing Partnership, Inc. - House Charlotte $231,000 $231,000 $231,000 $231,000 0.0 %
TOTAL $2,191,000 $2,091,000 $2,091,000 $2,091,000 0.0 %
Out of School Time Partners FY 2017 Actual FY 2018 Actual FY 2019 Adopted FY 2020 Proposed Change
Above and Beyond Students - $157,934 $157,934 $127,934 -23.4 %
Arts & Science Council Studio 345 - $95,700 $200,000 - -100.0 %
Bethlehem Center $113,934 - - $126,000 100.0 %
Charlotte Communtiy Services Association - - - $126,000 100.0 %
Citizen School $200,000 - - 0.0 %
Greater Enrichment Program $200,000 $200,000 $200,000 $200,000 0.0 %
Police Activites League $200,000 $53,275 $156,000 - -100.0 %
YWCA Central Carolinas $200,000 $200,000 $200,000 $200,000 0.0 %
WINGS for Kids - - - $200,000 100.0 %
Behailu Academy $66,000 $66,000 $66,000 -100.0 %
TOTAL $979,934 $772,909 $979,934 $979,934 0.0 %

36 36
This page intentionally left blank.

2 2
OVERVIEW

36 36
This page intentionally left blank.

FY 2020 Budget Process
1 1
Overview of the Budget Process
The city’s annual budget is based on a July 1 – June 30 fiscal year and is guided by four adopted Strategic Priorities:
Economic Development (Economy, Jobs, and Upward Mobility), Transportation and Planning (Mobility, Accessibility, and Connectivity), Neighborhood Development (Safe, Healthy, and Inclusive Communities, including an environmental
focus), and Well-Managed Government (Efficient, Effective, Accountable, Responsive, Inclusive, and Customer
Focused).
Each Strategic Priority contains policy initiatives driven by the needs of the community and the organization. The budget process is used to assess and allocate resources to achieve optimal service delivery.
The operating and capital budgets are developed in two phases: 1. Budget policy development, which is comprised of the following:
City Council engagement regarding policy direction, Department services review, Staff engagement on performance management activities, and
2. Budget deliberations and adoption, which is comprised of the following: A presentation of the City Manager’s recommended budget to the Mayor and Council, Community engagement and feedback through the Public Hearing process, and The Mayor and City Council adoption of the budget by June 30.
Budget Policy Development – Phase One (October – April)
The budget process is guided by the Budget Principles adopted by City Council. The process begins in the fall with a Budget Kick-off event. The event provides the City Manager and the Strategy and Budget Director the opportunity to share information with departments pertaining to:
Key dates and submittals for department budgets, Federal and state legislature activities, Revenue projections, and The budget impact of achieving the vision set forth in the City Council’s Strategic Priorities.
In November or December, City Council formally approves its regular meeting and budget schedule for the upcoming calendar year. The schedule includes an Annual Strategy Session, Council Budget Committee Meetings, Budget Workshops, and Council Member Budget Briefings to discuss key components of the budget.
The Mayor and City Council’s Annual Strategy Session, held in January, allows the city’s executive team (City Manager, Deputy City Manager, and Assistant City Managers), the Strategy and Budget Director, and several department directors to provide an overview of the economic environment and potential operating and capital budget considerations for the upcoming year. During the strategy session, the Mayor and City Council also discuss key policy activities occurring at the federal, state, and local levels and the potential impacts to the community. These activities are reflected as policy initiatives in the strategic priorities and communicated as measures and targets. Additionally, city departments provide preliminary information on operating and capital needs for the upcoming year, recognizing further guidance may be provided from the Mayor and Council during the Budget and Effectiveness Committee Meetings and the Budget Workshops.
27

FY 2020 Budget Process
2 2
Budget Policy Development – Phase One (continued)
Between February and April, several meetings with the Council Budget and Effectiveness Committee as well as the Mayor and Council to continue discussions related to key components of the city’s operating and capital budgets. City Council is engaged through two different series of meetings, Council Budget and Effectiveness Committee Meetings and Council Budget Workshops.
The Council Budget and Effectiveness Committee is responsible for providing input on the budget process and previewing planned agenda topics for discussion during the Budget Workshops. Issues and initiatives are scheduled and presented to obtain recommendations and feedback to prepare for the Budget Workshop. The Budget Workshop is designed for Council to gain an understanding of key budget issues and give feedback to the City Manager for consideration.
The budget development policy phase concludes in April when the City Manager proposes a recommended budget, based on Council’s guidance and feedback from the Budget Workshops.
The budget is an instrument to set policy and summarize public services provided by the city. It is the annual plan for coordinating revenues and expenditures. The proposed budget covers the period of July 1, 2019 to June 30, 2020. The amounts for FY 2020 are approved through the appropriation ordinance adopted by the City Council. The approved budget document may include technical changes made after the City Manager’s presentation of the proposed budget.
The Budget Deliberations and Adoption – Phase Two (May – June)
The City Manager presents the proposed budget to Council at the beginning of May, followed by the opportunity for the community to provide additional feedback at the Public Hearing on the budget. The first opportunity for Council to comment on the Manager’s Recommended Budget is during the two Council Budget Briefings and then during Council Budget Adjustments Meeting held in mid-May. The process occurs as follows:
1. Council Budget Briefings are held to provide opportunities for Council to make inquiries regarding theManager’s Recommended Budget and receive feedback.
2. The Council makes budget adjustments about issues garnering five or more votes moving forward forfurther analysis and inclusion in the Straw Votes Meeting.
3. At a later date, Council reconvenes for the Council Budget Straw Vote Meeting, when a vote of six ormore on each proposed adjustment advances the budget adjustment for inclusion in the final budgetordinance proposed for adoption.
4. Budget Adoption at a Council Business Meeting must occur no later than June 30 of each year.
5. After the budget is adopted by Council, the Office of Strategy and Budget coordinates with citydepartments to close out the current year’s budget, appropriate funds for the new budget, and completebudget-related documents and publications. For the adopted budget to be amended, an action item andordinance must be brought before the City Council, with a majority vote approving it.
28

FY 2020 Budget Process
3 3
December 2018
City Council Business Meeting Approve FY 2020 Budget Calendar
Council Budget Committee Meeting City Auditor Workplan Debt Overview
October 2018
Budget Kick-off
Meet and Eat with the Community
March 2019
Mayor and Council Budget Workshop General Fund Update Revaluation Analysis Redefining the Capital Planning Process Nongeneral Funds Solid Waste Services Public Safety Pay Comparison
Council Budget Committee Meeting Pay Practices Comparison Solid Waste Aviation
PHA
SE I
– BU
DG
ET P
OLI
CY
DEV
ELO
PMEN
T
May 2019
Council Budget Committee Meeting Budget Presentation by City Manager Council Budget Briefings Council Budget Adjustments Meeting Council Budget Adjustments and
Straw Votes Meeting Public Hearing on Proposed Budget
June 2019
Budget Adoption for FY 2020
April 2019
Mayor and Council Budget Workshop General Employee Pay Practices Retirement Comparison Healthcare and Other Benefits
Comparison Financial Partners
February 2019
Council Budget Committee Meeting Financing the Capital Investment Plan Revaluation Analysis Preview CATS Budget Overview Storm Water Budget Overview
Mayor and Council Budget Workshop Enhanced Budget Development Process City Council Priorities FY 2020 General Fund Update Revaluation and Revenue Neutral Nongeneral Funds Capital Projects Status Update
PHA
SE II
– B
UD
GET
D
ELIB
ERA
TIO
NS
AN
D
AD
OPT
ION
January 2019
Mayor and Council Annual Strategy Meeting Traits of Effective Councils Governing
Through Priorities FY 2020 Budget Outlook Establishing City Priorities for 2020 and
Beyond
29

Charlotte City Council Members and City Manager
Vi Alexander Lyles, Julie Eiselt, Braxton Winston, James Mitchell Jr., Mayor Mayor Pro Tem At Large At Large
Dimple Ajmera, Larken Egleston, Dr. Justin Harlow, Lawana Mayfield, At Large District 1 District 2 District 3
Gregory A. Phipps, Matt Newton, Tariq Bokhari, Edmund H. Driggs, District 4 District 5 District 6 District
Marcus Jones, City Manager
30

Organizational Chart
9 9
• Aviation• Charlotte Area Transit System• Communications• Charlotte Water• City Attorney’s Office• City Clerk’s Office• City Manager’s Office• Community Relations• Economic Development• Fire• General Services
• Housing and Neighborhood Services• Human Resources• Innovation and Technology• Internal Audit• Finance• Mayor and City Council• Planning, Design, and Development• Police• Solid Waste Services• Strategy and Budget• Transportation
Appointed Boards and
Commissions (see next page)
City Attorney
City Manager
City Departments
Residents of Charlotte
City Clerk
City Council
31

Organizational Chart
10 10
Appointed Boards and Commissions
• Airport Advisory Committee• Bechtler Arts Foundation Board• Bicycle Advisory Committee• Business Advisory Committee• Charlotte Area Fund Board of Directors• Charlotte Community Capital Loan Fund• Charlotte Housing Authority Board• Charlotte International Cabinet• Charlotte Regional Visitors Authority• Charlotte Water Advisory Committee• Charlotte-Mecklenburg Public Access
Corporation• Citizens Review Board• Citizens' Transit Advisory Group• Civil Service Board• Community Relations Committee• Development Review Board• Domestic Violence Advisory Board• Housing Advisory Board of Charlotte-
Mecklenburg
• Charlotte Business INClusion Advisory Committee• Charlotte Tree Advisory Commission• Firemen's Relief Board of Trustees• Historic District Commission• Historic Landmarks Commission• Housing Appeals Board• Keep Charlotte Beautiful• Mint Museum Board of Trustees• NASCAR Hall of Fame Advisory
Committee• Neighborhood Matching Grants Fund• Passenger Vehicle For Hire• Planning Commission• Privatization/Competition Advisory Committee• Public Art Commission• Storm Water Advisory Committee• Transit Services Advisory Committee• Waste Management Advisory Board• Zoning Board of Adjustment
32

Chart of Accounts
11 11
City Attorney City Manager City Clerk Communications Community Relations Economic Development Fire Human
Resources General Services Housing and Neighborhood Services Innovation and Technology Internal Audit Mayor and City Council Finance Planning, Design,
and Development
Police Solid Waste
Services Strategy and Budget Transportation
Tourism Fund
Convention Center Tax Fund
Emergency Telephone System
Neighborhood Development Funds
Municipal Service Districts Fund
State Street Aid Fund
Cultural Facilities Fund
Hall of Fame Tax Fund
Risk Management Fund
Employee Life and Health Fund
Special Revenue Funds
Capital Project Funds
Water Sewer Fund
Public Transit Fund
Aviation Fund
Storm Water Fund
Internal Service Funds
Governmental Funds
Enterprise Funds
Appropriated Funds
Municipal Debt Service Fund
Perpetual Care Fund
General Grants Fund
Proprietary Funds
Public Transit Tax Fund
General Fund
33

Fund Descriptions
4 4
Major Governmental Funds
Funds are accounting groups that the city uses to keep track of specific sources of funding and spending for particular purposes. Some funds are required by state statutes. Other funds are established to control and manage resources designated for specific purposes.
The city uses three types of funds: 1. Governmental Funds – Most of the city’s basic services are included in governmental funds, which
focus on: (1) the flow in and out of cash and other financial assets that can readily be converted to cash,and(2) the balances left at year-end that are available for spending. These funds are reported using themodified accrual accounting basis and a current financial resources measurement focus.
The city adopts an annual budget for the General Fund, as required by state statutes. A budget comparison statement is presented in the Comprehensive Annual Financial Report (CAFR) for the General Fund using on a budget basis.
Major Governmental Funds include: General Fund - City’s primary operating money. It accounts for all financial resources of the general government, except those required to be accounted for in another fund.
Debt Service - Accounts for the resources accumulated and payments made for principal and interest on debt of governmental activities.
Capital Projects - Accounts for financial resources, primarily proceeds from bonds, and other financing agreements and taxes, used for the acquisition, construction, and improvement of capital equipment and facilities.
2. Nongeneral Funds – Services for which the city charges customers a fee are generally reported inproprietary funds. The city uses two types of propriety nongeneral funds: Enterprise funds and Internalservice funds.
Enterprise Funds include:Aviation - Accounts for the operation of the Charlotte Douglas International Airport.
Public Transit - Accounts for the operation of the Charlotte Area Transit System, provider of public mass transportation.
Storm Water - Accounts for the operation of Charlotte Storm Water Services, administrator of storm water programs and policies.
Water and Sewer - Accounts for the operation of the Charlotte Water Department, provider of water and wastewater services.
34

Fund Descriptions
5 5
Internal Services Funds are used to report activities that provide supplies and services for the city’s programs and activities. Internal service activities predominately benefit government functions rather than business-type activities. These funds account for:
Risk Management Fund – Account for the general insurance program of the city, as well as risk management services provided, on a cost-reimbursement basis, to other governmental units and agencies in Mecklenburg County.
Employee Health and Life Funds - contributed by the city and its employees for benefits.
3. Fiduciary Funds – The city is the trustee, or fiduciary, for the Firefighters’ Retirement System and theEmployee Benefit Trust. The city is responsible for ensuring that the assets reported in these funds areused for their intended purposes. The city cannot use these assets to finance its operations. These fundsaccount for:
Resources accumulated for the provision of benefit payments to the Charlotte Firefighters’Retirement System members and their beneficiaries, and
Resources accumulated for the provision of other postemployment benefit payments for retirees andtheir beneficiaries.
35

Fund Descriptions
6 6
Non-Major Governmental Funds
Special Revenue Funds
Special Revenue Funds are used to account for the proceeds from specific revenue sources (other than funding for major capital projects) that are restricted to expenditures for specified purposes.
Convention Center Tax Fund – Accounts for room occupancy and prepared food and beverage taxrevenues to be used for convention and tourism purposes, including debt service, maintenance andoperation of convention center facilities, and promotion of tourism.
Tourism Operating Fund – Accounts for room occupancy and other tax revenues to be used for tourismpurposes.
NASCAR Hall of Fame Tax Fund – Accounts for room occupancy tax and private contribution revenues tobe used for the NASCAR Hall of Fame.
Municipal Services District Fund – Accounts for property tax on property within designated MunicipalServices Districts to be used to enhance economic vitality and quality of life within the districts.
Grants Funds Fund – Accounts for federal and state grants to be used for public safety, including police,fire and emergency management, and other governmental-type activities.
Neighborhood Development Grants Fund – Accounts for federal grants to be used for neighborhoodactivities which develop viable urban communities providing adequate housing and economicopportunities, principally for persons of low and moderate income.
Employment and Training Fund – Accounts for federal grants to be used for activities providingcomprehensive employment and training services to enable individuals to secure and retainemployment at their maximum capacity.
State Street Aid Fund – Accounts for motor fuel taxes distributed by the state on the basis of local streetmileage and population to be used for maintenance, repair, and construction of streets and highways.
Emergency Communications Fund – Accounts for revenues remitted by the NC 911 Board from servicecharges imposed on voice communications service connections to be used for the operation andenhancement of the 911 system.
Permanent Fund
A Permanent Fund is used to report resources that are legally restricted to the extent that only earnings, not principal, may be used.
Perpetual Care Fund – Accounts for monies held by the city for cemetery maintenance.
36

Fund Descriptions
7 7
Debt Service Fund
The Debt Service Fund is used to account for the accumulation of resources and the payment of principal, interest, and related costs for all long-term debt other than debt issued for and serviced by business-type activities.
Capital Projects Fund
The Capital Projects Fund accounts for financial resources, primarily bond proceeds and property taxes, used for the acquisition, construction, or improvement of capital assets.
Enterprise Funds
Enterprise Funds are used to account for operations that charge a fee for service to customers similar to private business enterprises. The city has four enterprise operations.
Airport Funds – Accounts for the operation of the Charlotte-Douglas International Airport.
Public Transit Fund – Accounts for the operation of the Charlotte Area Transit System, provider ofcommunity-wide public transportation services.
Storm Water Fund – Accounts for the operation of Charlotte Storm Water Services, administrator ofstorm water programs and policies.
Water and Sewer Fund – Accounts for the operation of Charlotte Water, provider of water andwastewater services.
Internal Service Funds
Internal Service Funds are used to account for centralized services provided to city departments and other governmental units and agencies on a cost-reimbursement basis.
Employee Health and Life Fund – Accounts for funds contributed by the city and employees for healthand life benefits.
Risk Management Fund – Accounts for the general insurance program, claim, and loss control servicesfor the city as well as services provided on a cost-reimbursement basis to other governmental units andagencies in Mecklenburg County.
37

36 36
This page intentionally left blank.

2 2
STRATEGIC PRIORITIES

62 62
This page intentionally left blank.

2 2
STRATEGIC PRIORITIES
At the January 2019 City Council Annual Strategy Meeting, new strategic priorities were established. The priorities are part of Council renewing a focus on the higher-level policy framework needed to guide the City’s growth and progress forward.
The strategic priorities replaced the more operationally centered Focus Area Plans that have been in place since the early 1990’s. While the Focus Area Plans included important information, there was a need to refresh and heighten citywide strategy from an operational focus to a more holistic perspective in achieving the city’s vision.
The new strategic priorities defined by Council will guide decision making and align resource allocation:
o Economic Development (Economy, Jobs, and Upward Mobility)
Building and maintaining a successful business climate and workforce talent; including the numberof jobs with sustainable wages/benefits, economic opportunity for all residents and encouraginginnovation and entrepreneurship.
o Neighborhood Development (Safe, Healthy and Inclusive Communities)
Building and maintaining great neighborhoods with a focus on community safety, housing and theenvironment.
o Transportation and Planning (Accessibility, Mobility and Connectivity)
Anticipate and plan for the growth of the community. Address growth with strategic investments.building and maintaining a comprehensive transportation network and placemaking strategies thatencourage connection between neighborhoods and employment centers.
o Well-Managed Government (Efficient, Effective, Accountable, Responsive, Inclusive, andCustomer Focused)
Ensuring the city demonstrates leadership in financial stewardship, reviews best practices, andensures consistency in approach with an emphasis on effective and efficient services that areaccountable, customer focused, and inclusive.
The development of the Proposed FY 2020 Budget was guided by the new priorities with funding directed towards programs and services that support these priorities. The priorities serve as the foundation for funding decisions and setting objectives.
As part of the budget process, each department developed measures to track efforts in achieving the objectives and established targets. The objectives link the efforts to advancement of the citywide priorities and the measures gauge advancement within each of the priority areas. The strategic development process also included analyzing feedback from a survey conducted in the fall of 2018 to incorporate current community input.
41

3 3
To follow is an overview of the strategic planning process and a visual depiction of how the work of the departments is assessed in terms of objectives, measures, and targets in advancing the strategic priorities toward achieving Council’s vision.
Objectives: An objective is the driver which describes the desired outcome that if achieved will furtherprogress in advancing the strategic priorities.
Measures: Performance measures are metrics or indicators which assess progress towards meeting theobjective.
Targets: Targets are benchmarks established to evaluate the effectiveness of efforts in meeting the objectives.
The Priority Setting Model below displays how each component builds toward the vision and priorities of the city.
Department specific performance measures for each strategic priority are included in individual department pages. Selected performance measures from department plans are included in the following pages. These measures highlight the provide an important link in the internal roadmap of progress towards each strategic priority area.
Set by the City Manager
Set by City Council with Community Input
Community Feedback
Strategic Policy
Strategic Priorities
Objectives
Measures
Targets
Evaluation of Results
42

4 4
PRIORITY: Economic Development (Economy, Jobs, and Upward Mobility)
The strategic priority of Economic Development is measured by creating great places that promote regional economic growth, expanding the availability of good paying jobs through transformative projects, and attracting, growing, and retaining new and existing businesses with a focus on increasing opportunities for upward mobility.
The City of Charlotte supports diverse businesses and economic opportunities for all. Building and maintaining a successful business climate promotes workforce development, increases the number of jobs with sustainable wages and benefits, provides economic opportunity, and encourages innovation and entrepreneurship.
Highlights of measures for the Economic Development priority area are provided below:
Economic Development
Objective Measure FY 2018 Actual FY 2019 Target FY 2020 Target
Increase business relocations and expansions
Number of company announcements
New measure New measure ≥ 8
Number of jobs (includes retained and new)
New measure New measure 5,000
Amount of private investment
New measure New measure $300M
Increase talent development opportunities through Project PIECE 2.0
Number of new job seekers enrolled
New measure New measure ≥ 60
Percentage of enrolled graduating
New measure New measure 80%
Percentage of graduates employed
New measure New measure 70%
Leverage private investment
Total ratio public to private investment
New measure New measure ≥1:3
Partner with our customers to approve development plans in an efficient and collaborative manner that helps build a safe and thriving community
Percentage of land development reviews and inspections completed within projected timeframe and within an average of 2.5 review cycles
New measure 95% 95%
Promote Economic Inclusion
Percentage of direct spending with Minority Women Small Business Enterprises (MWSBEs)
18.5% >16% increase overprior fiscal year
16%
43

5 5
Economic Development
Objective Measure FY 2018 Actual FY 2019 Target FY 2020 Target
Provide employment pathways and development opportunities
Number of new hires to full-time city employment through various staffing partnerships
New measure New measure Establish baseline
Number of city employees to complete GED program
New measure New measure Establish baseline
Support entrepreneurs
Number of P3 Disruption Lab demonstration pilot projects
New measure New measure ≥ two P3 Disruption Lab Demonstration
pilot projects completed
Support minority small businesses
Number of minority small businesses participating in AMP UP CLT cohorts to prepare owners for contracting opportunities with the Airport and other anchor institutions
New measure New measure ≥ 30
Increase participants in apprenticeship programs
Number of participants in the apprenticeship program.
New measure Eight apprentice-ships
Increase by 25%
44

6 6
PRIORITY: Neighborhood Development (Safe, Healthy, and Inclusive Communities)
This priority area encompasses a holistic approach for neighborhoods. A comprehensive focus on neighborhood development includes the public safety services of police and fire, environmental considerations, affordable housing, enhancing community relations, and promoting diversity, equity, and inclusion for all. The major emphasis of this priority area is collaborating with the community to ensure there are safe and healthy neighborhoods across all of Charlotte.
Highlights of measures for the Neighborhood Development priority area are provided below:
Neighborhood Development
Objective Measure FY 2018 Actual FY 2019 Target FY 2020 Target
Foster neighborhood driven revitalization and improvement
Number of volunteers engaged to assist with addressing neighborhood cleanliness throughout the City
249 active Keep Charlotte Beautiful
Adopt-A-City Organizations
250 active Keep Charlotte Beautiful
Adopt-A-City Organizations
350 active Keep Charlotte Beautiful
Adopt-A-City Organizations
Investigate housing discrimination
Percentage of new fair housing cases closed within 100 days
48% 60% 60%
Maintain energy use practices so that city facilities compare favorably with available benchmark information in the South Atlantic region
Overall energy use intensity (EUI) -measured in thousands of British thermal units (BTUs) per square foot
EUI = 63.2 % Reduction =
16.3%
Maintain an overall EUI <67 or
reduction>15%
Maintain an overall EUI <67 or
reduction>15%
Maintain a clean city for all residents
Annual Keep Charlotte Beautiful assessment
1.75 ≤ 2.0 Litter Index Rating
≤ 2.0 Litter Index Rating
Preserve and create attractive and environmentally sustainable neighborhoods
Percent of nuisance cases resolved within 30 days
91% 90% 90%
45

7 7
Neighborhood Development
Objective Measure FY 2018 Actual FY 2019 Target FY 2020 Target
Preserve and increase affordable housing
Number of new affordable housing units funded
496 1,000 900
Number of units acquired and/or rehabilitated and restricted for low to moderate income residents
221 165 265
Number of down payment assistance loans provided
307 325 325
Prevent housing discrimination
Number of persons educated on fair housing practices and protections
1,279 1,000 1,000
Promote customer safety through the delivery of clean water
Percentage of applicable requirements met for the Safe Drinking Water Act and Clean Water Act
100% Compliance 100% Compliance 100% Compliance
Protect the environment
Reduce Sanitary Sewer Overflows per 100 miles
+/- 3.8 < 4.0 < 3.5
Reduce interpersonal and community conflicts
Percent of cases referred to Community Relations that are successfully resolved
85% 85% 85%
Reduce victimization Percent increase in number of illegal guns seized over previous fiscal year
4.4% ≥5.0% ≥5.0%
Timely response to calls for service
Percent of 911 calls answered within 10 seconds
94.6% 90.0% 90.0%
Percent of time first-due fire company responds within 6 minutes
90.0% 90.0% 90.0%
46

8 8
PRIORITY: Transportation and Planning (Accessibility, Mobility and Connectivity)
The Transportation and Planning strategic priority encompasses Charlotte’s current and future land development, urban design, and transportation needs to promote connectivity, accessibility, and mobility for residents and visitors citywide.
This priority area centers on developing the future of Charlotte through proactive land use planning and connecting neighborhoods with places to work and play while ensuring access to needed services.
Highlights of measures for the Transportation and Planning priority area are provided below:
Transportation and Planning
Objective Measure FY 2018 Actual FY 2019 Target FY 2020 Target
Advance transportation projects supporting growth, walkability, bicycle-friendliness, and Vision Zero Action Plan
Improve street lighting on high injury network corridors
New measure New measure 3 corridors
Miles of new sidewalks
11 ≥ 10 ≥ 10
Miles of new bikeways
8 ≥ 10 ≥ 10
Number of new pedestrian safety projects
New measure New measure ≥ 15
Number of new and upgraded signals
New measure New measure New ≥ 2 Upgraded ≥10
CharlotteFuture 2040 Comprehensive Plan and UDO Support
Engagement Plan and Phases 1 and 2 Strategies
Vision Framework Outline and Document
New measure New measure Refining Place Types, develop growth scenarios, select
preferred growth scenario, develop plan
policies and recommendations,
develop plan outline and framework, and
develop and draft the plan
Maintain existing infrastructure
Annual Pavement Condition Rating
82.05% ≥90% ≥82.05%
Overall customer satisfaction with Charlotte Area Transit System (CATS)
Overall net promoter score as expressed in net promoter surveys
53% 58% 58%
47

9 9
Transportation and Planning
Objective Measure FY 2018 Actual FY 2019 Target FY 2020 Target
Provide transportation choices
Ridership (Light Rail, Bus, Streetcar, VanPool, and STS)
20,730,659 23,218,184 23,500,000
On-time performance (Bus)
85.4% 85% 85%
48

10 10
FOUNDATIONAL FOCUS: Well-Managed Government (Efficient, Effective, Accountable, Responsive, Inclusive, and Customer Focused)
A foundational component within each of the three strategic priorities is a continued focus on well-managed government. This focus guides continuous efforts of accountability as we strive to promote efficient, effective, and quality services to the entire community.
The city's reputation as a financially Well-Managed Government is reflected in the continued AAA bond ratings, the annual receipt of the Government Finance Officer Associations award for budget and financial statements, and the annual audit with no significant findings. Operational efficiencies are highlighted by the many external recognitions received by the city, examples include Charlotte Water being awarded the North Carolina Section of the American Water Works Association (NC AWWA) and the North Carolina Member Association of the Water Environment Federation (NC WEA)’s 2018 NC AWWA-WEA Collection System of the Year Award, as well as General Services receiving fleet services recognitions from the National Association of Fleet Administrators (NAFA) “Top 100 Fleets” 2014-2018, and the Class 1 ISO rating of the Charlotte Mecklenburg Fire Department.
In addition to striving for efficiencies, the city strives to further refine internal service models to ensure the optimal balance of controls and streamlined services is achieved. An example of this effort includes additional resources being allocated to strengthen procurement across the city.
Additional continuous improvement efforts include the city’s focus on being the employer of choice. This effort is demonstrated within the new compensation plan for employees currently being designed to promote upward mobility through clear career paths and to increase pay equity across similar job classes and functions.
Highlights of measures for the Well-Managed Government priority area are provided below:
Well-Managed Government
Objective Measure FY 2018 Actual FY 2019 Target FY 2020 Target
Create an enhanced applicant experience through increased transparency and communication into the recruitment and selection process
Percentage of responding applicants satisfied with applicant experience
New measure New measure 80%
Deliver competitive audit services
Performance audits issued
16 12 15
49

11 11
Well-Managed Government
Objective Measure FY 2018 Actual FY 2019 Target FY 2020 Target
Improve effectiveness and efficiency through organizational IT alignment
Identify citywide technology processes critical for IT re-alignment
New measure New measure Implement at least four streamlined
processes by end of Q4, FY 2020
Minimize the cost of incurring debt to finance capital projects
Credit rating from external rating agencies
AAA rating Maintain AAA credit rating
Maintain AAA credit rating
Maintain ISO rating for fire services
Conduct review of ISO rating and maintain an ISO Class 1
ISO Class 1 ISO Class 1 ISO Class 1
Maintain low-cost recycling collection
Curbside collection cost per ton recyclable materials
$142/ton < North Carolina statewide average
< North Carolina statewide average
Curbside collection cost per ton refuse
$90/ton < North Carolina statewide average
< North Carolina statewide average
Operate efficient weekly curbside refuse collection
Average number curbside garbage cart collections per hour
134 ≥125 ≥125
Promote Employee Wellness
Percentage of eligible employees opting for medical insurance who are electing the wellness incentive premium
93% 65% 70%
Promote options for public engagement
Number of viewers to the GOV Channel
71,397 78,540 10% increase over FY 2019
Provide services that efficiently meet the needs of 311 call center customers
Percent of 311 calls answered within 30 seconds
74% 70% 70%
Call abandonment rate – Percent of all calls abandoned by the caller
4% ≤5% ≤5%
Implement on-line chat capability
New measure Research the best tools to employ for
chat capability
Fully implement on-line chat capability
50

3 3
DEPARTMENT BUDGETS

62 62
This page intentionally left blank.

1
GENERAL FUND
DEPARTMENT BUDGETS

62 62
This page intentionally left blank.

City Attorney
1 1
Mission Statement Ensure that appropriate legal services are provided in accordance with the highest professional and ethical standards.
Department Overview Provide legal advice and representation to the Mayor, City Council, City Manager, other city officials, and employees in their official capacities Represent the city, its officials, and employees in litigation filed by or against them in their official capacities Provide legal opinions to city officials and employees on city-related matters Draft or review all ordinances and resolutions adopted by the City Council Review or draft contracts, leases, deeds, franchises, and other legal documents to which the city is a party
Organizational Chart
Budget Overview Percent Change
FY 2017 FY 2018 FY 2019 FY 2020 FY 2019 Actual Actual Adopted Proposed FY 2020
Expenditures Personnel Services $3,669,709 $4,179,100 $4,497,646 $4,605,832 2.4 % Operating Expenses $402,411 $293,938 $374,265 $374,083 0.0 % Departmental Charges -$710,847 -$2,374,922 -$2,166,833 -$2,257,033 4.2 % Total Expenditures $3,361,273 $2,098,116 $2,705,078 $2,722,882 0.7 %
Office of the Attorney
LitigationLegal Advice
and Representation
55

City Attorney
2 2
FY 2020 Adjustments 1
Budget Action FTE Amount
Provide funds for a citywide compensation increase 1- $63,267Support compensation increase for employees in FY 2020 which includes: a three percent merit increase pool for salaried employees; a 1.5 percent market increase and 1.5 percent merit increase pool for hourly employees; and a 1.5 percent market increase and step increase (2.5 to five percent) for eligible public safety pay plan employees. Additional funds are included in the non-department budget to ensure that all general employees with a positive performance review receive at least a one dollar per hour increase by the end of FY 2020.
Provide additional funds for operating expenses - $12,000Provide additional funds for operating expenditures such as printing, publishing, supplies, furniture, and equipment based on recent utilization.
Reconcile reimbursement from other departments - -$90,200Technical adjustment to update funds reimbursed by other city departments for service provided. This is a routine action that occurs at the beginning of the budget cycle and does not impact the level of service provided.
Update personnel expenditures - $3,333
Technical adjustment to update department costs for personnel services. The update includes the full annual cost of salary increases approved in FY 2019, an update to employer healthcare costs, and the impact of staffing changes that have occurred in FY 2019. These are routine actions that occur at the beginning of the budget cycle.
Adjust employer contribution to the North Carolina Local Governmental Employees' Retirement System (NCLGERS) - $41,586
Technical adjustment for the required employer retirement contribution based on the NCLGERS Board of Trustees January action to increase employer rates from 7.75 percent to 8.95 percent for general employees and 8.50 percent to 9.70 percent for law enforcement officers.
Update allocations for Internal Service Providers (ISPs) - -$12,182Technical adjustment to update funds needed to support ISPs based on anticipated cost of services. ISPs provide services to other city departments, including: building maintenance, rent of land and buildings, telecommunication; insurance liabilities, insurance premiums, and risk administration.
Net Change 0.00 $17,804
56

City Attorney
3 3
Performance Measure Highlights
FY 2018 FY 2019 FY 2020 Objective Measure Actual Target Target
Strategic Priority Area: Well-Managed Government (Efficient, Effective, Accountable, Responsive, Inclusive, and Customer Focused)
Timely public record responses
Percent of public records requests responded to within two business days
New Measure New Measure 90%
Enhance Attorney staff efficiency in technology
Attorney registration and participation in technology training courses
New Measure New Measure 100%
Educate city employees on applicable legal issues
Prepare a blog entry of legal interests on city sharepoint site or website
New Measure New Measure Quarterly
Improve interaction of staff with department clients
Develop client scorecard for Attorney characteristics, i.e., (approachability, willingness to help, and managing expectations)
New Measure New Measure One scorecard for each Attorney
Strategic Priority Area: Economic Development (Economy, Jobs and Upward Mobility)
Provide opportunity for law students to gain work experience in government practice
Number and type of summer internships
New Measure New Measure Two internships for 2nd year students; one
internship for 1st year students
57

City Attorney
4 4
Full-Time Equivalent (FTE) Position Summary
Position Title FY 2019 FTE Change in FTE FY 2020 FTE
Administrative Officer III 1.00 - 1.00 Assistant City Attorney II 4.00 1.00 5.00 City Attorney 1.00 - 1.00 Deputy City Attorney 1.00 - 1.00 Legal Secretary 2.00 - 2.00 Paralegal 5.00 - 5.00 Senior Assistant City Attorney 13.00 -1.00 12.00 Senior Assistant City Attorney Lead 2.00 - 2.00 Senior Deputy City Attorney 1.00 - 1.00
Department Total FTE 30.00 0.00 30.00
58

City Clerk
5 5
Mission Statement Provide high quality information and services to City Council, staff, and the public so that effective and responsible decisions can be made to govern the City of Charlotte.
Department Overview
Maintain a permanent history of government actions
Assist Mayor and City Council with records requests and oaths of office Administer boards and commissions appointment process Administer the speakers list for City Council meetings Create, dispense, and archive verbatim minutes of all City Council meetings Manage public records, research, and provide public access to records Maintain the Code of Ordinances Administer the citywide records request program and records management program
Organizational Chart
Budget Overview Percent Change
FY 2017 FY 2018 FY 2019 FY 2020 FY 2019 Actual Actual Adopted Proposed FY 2020
Revenues Licenses, Fees, Fines $37,620 $45,418 $38,880 $45,000 15.7 % Charges to Current Services $800 $1,200 $400 $400 0.0 % Total Revenues $38,420 $46,618 $39,280 $45,400 15.6 %
Expenditures Personnel Services $471,847 $566,244 $634,070 $714,695 12.7 % Operating Expenses $142,585 $154,470 $137,469 $164,580 19.7 % Total Expenditures $614,432 $720,714 $771,539 $879,275 14.0 % Net Expenditures $576,012 $674,096 $732,259 $833,875 13.9 %
Office of the Clerk
Office Management Boards Minutes Records
59

City Clerk
6 6
FY 2020 Adjustments Budget Action FTE Amount
Provide funds for a citywide compensation increase - $8,202Support compensation increase for employees in FY 2020 which includes: a three percent merit increase pool for salaried employees; a 1.5 percent market increase and 1.5 percent merit increase pool for hourly employees; and a 1.5 percent market increase and step increase (2.5 to five percent) for eligible public safety pay plan employees. Additional funds are included in the non-department budget to ensure that all general employees with a positive performance review receive at least a one dollar per hour increase by the end of FY 2020.
Provide funds for operating support - $12,419Provide funds for operating support, including organizational development training, advertising, and mailing.
Accelerate historical records preservation - $15,000Provide funds for completion of project to restore and preserve permanent records. Clerk's Office must comply with North Carolina General Statutes and preserve historical records.
Add Administrative Officer I 1.00 $57,202
Provide staffing to support the citywide Records Program. This program is responsible for advising and coordinating public records requests as well as corresponding with citizens who have submitted public records requests.
Update personnel expenditures - $12,712Technical adjustment to update department costs for personnel services. The update includes the full annual cost of salary increases approved in FY 2019, an update to employer healthcare costs, and the impact of staffing changes that have occurred in FY 2019. These are routine actions that occur at the beginning of the budget cycle.
Adjust employer contribution to the North Carolina Local Governmental Employees' Retirement System (NCLGERS) - $5,479
Technical adjustment for the required employer retirement contribution based on the NCLGERS Board of Trustees January action to increase employer rates from 7.75 percent to 8.95 percent for general employees and 8.50 percent to 9.70 percent for law enforcement officers.
Update allocations for Internal Service Providers (ISPs) - -$3,278
Technical adjustment to update funds needed to support ISPs based on anticipated cost of services. ISPs provide services to other city departments, including: building maintenance; rent of land and buildings; telecommunication; insurance liabilities; insurance premiums; and risk administration.
Net Change 1.00 $107,736
60

City Clerk
7 7
Performance Measure Highlights
FY 2018 FY 2019 FY 2020
Objective Measure Actual Target Target
Strategic Priority Area: Well-Managed Government (Efficient, Effective, Accountable, Responsive, Inclusive, and Customer Focused)
Maintain permanent history of government actions
Percent of meetings completed, published to web and placed on agenda for Council approval within 30 days of original meeting
93% 98% 98%
Efficiently Administer Boards and Commissions
Percent of applications, nominations, and appointments processed
100% 100% 100%
Certify, maintain and process all official documents in timely manner
Percent of official documents certified and processed within 7 days of approval/ receipt
100% 100% 100%
Preserve permanent historical records per NC General Statutes
Number of books preserved and number of books microfilmed by Department of Cultural Resources
3 2 25 to complete project; inventory microfilm;
archive permanent records on microfilm
Enhance public access to government records
Initiatives completed to advance public records request program and citywide records management program
Recruitment of citywide records program manager
Publish public records on Open Data Portal
Timely completion of public record requests and web upload of official
documents
Full-Time Equivalent (FTE) Position Summary
Position Title FY 2019 FTE Change in FTE FY 2020 FTE
Administrative Officer I - 1.00 1.00 Administrative Officer III 1.00 - 1.00 Administrative Officer IV 1.00 - 1.00 City Clerk 1.00 - 1.00 Deputy City Clerk 1.00 - 1.00 Office Assistant V 3.00 - 3.00
Department Total FTE 7.00 1.00 8.00
61

City Manager
1 1
Office of theCity
Manager
AdministrativeSupport
ExecutiveLeadership
SpecialProjects
Mission StatementProvide high quality public service delivery and exceptional strategic leadership in the administration of Mayor and
City Council priorities that promote safety, trust, and accountability, while improving the quality of life for all residents.
Department OverviewProvide professional expertise and support to Mayor and City Council Provide organization-wide leadership and strategic direction for departments in the delivery of high quality
public services
Maintain an organizational vision that utilizes data driven strategies to invest in the city’s future and ensure a
well-managed government
Organizational Chart
Budget OverviewPercent Change
FY 2017 FY 2018 FY 2019 FY 2020 FY 2019 Actual Actual Adopted Proposed FY 2020
Expenditures
Personnel Services $2,610,229 $2,188,463 $2,393,943 $2,513,264 5.0 %
Operating Expenses $611,248 $438,681 $284,185 $274,264 -3.5 %Total Expenditures $3,221,477 $2,627,144 $2,678,128 $2,787,528 4.1 %
62

City Manager
8 8
FY 2020 Adjustments
Budget Action FTE Amount
Provide funds for a citywide compensation increase - $46,314Support compensation increase for employees in FY 2020 which includes: a three percent merit increase pool for salaried employees; a 1.5 percent market increase and 1.5 percent merit increase pool for hourly employees; and a 1.5 percent market increase and step increase (2.5 to five percent) for eligible public safety pay plan employees. Additional funds are included in the non-department budget to ensure that all general employees with a positive performance review receive at least a one dollar per hour increase by the end of FY 2020.
Update personnel expenditures - $51,405Technical adjustment to update department costs for personnel services. The update includes the full annual cost of salary increases approved in FY 2019, an update to employer healthcare costs, and the impact of staffing changes that have occurred in FY 2019. These are routine actions that occur at the beginning of the budget cycle.
Adjust employer contribution to the North Carolina Local Governmental Employees' Retirement System (NCLGERS) - $21,602
Technical adjustment for the required employer retirement contribution based on the NCLGERS Board of Trustees January action to increase employer rates from 7.75 percent to 8.95 percent for general employees and 8.50 percent to 9.70 percent for law enforcement officers.
Update allocations for Internal Service Providers (ISPs) - -$9,921Technical adjustment to update funds needed to support ISPs based on anticipated cost of services. ISPs provide services to other city departments, including: building maintenance, rent of land and buildings, telecommunication, insurance liabilities, insurance premiums, and risk administration.
Net Change - $109,400
63

City Manager
9 9
Full-Time Equivalent (FTE) Position Summary
Position Title FY 2019 FTE Change in FTE FY 2020 FTE
Assistant City Manager 3.00 - 3.00 Assistant to City Manager 1.00 - 1.00 Assistant to City Manager II 2.00 - 2.00 City Manager 1.00 - 1.00 Deputy City Manager 1.00 - 1.00 Executive Assistant to City Manager 1.00 - 1.00 Intergovernmental Relations Manager 1.00 - 1.00 Special Assistant to City Manager 1.00 - 1.00
Department Total FTE 11.00 - 11.00
64

Communications
10 10
Mission Statement To develop innovative and strategic communication and marketing solutions that advance the city’s overall vision and tell the stories that shape Charlotte.
Department Overview Develop and implement strategic communications for departments and the residents of Charlotte Respond to media inquiries, public record requests, develop press releases, conduct crisis communications, and manage social media presence Provide marketing strategy, brand development and management, and coordinate city website information
Organizational Chart
Budget Overview Percent Change
FY 2017 FY 2018 FY 2019 FY 2020 FY 2019 Actual Actual Adopted Proposed FY 2020
Expenditures Personnel Services $1,833,436 $3,166,338 $3,472,245 $3,490,910 0.5 % Operating Expenses $511,014 $731,712 $800,698 $722,373 -9.8 % Departmental Charges $0 $0 -$94,164 -$94,164 0.0 % Total Expenditures $2,344,450 $3,898,050 $4,178,779 $4,119,119 -1.4 %
Office of the Director
Citywide Media
Relations
Channel Strategy
ManagementProgram
ManagementCreative and Graphic Arts
Constituent Services
65

Communications
11 11
FY 2020 Adjustments
Budget Action FTE Amount
Provide funds for a citywide compensation increase - $41,745
Support compensation increase for employees in FY 2020 which includes: a three percent merit increase pool for salaried employees; a 1.5 percent market increase and 1.5 percent merit increase pool for hourly employees; and a 1.5 percent market increase and step increase (2.5 to five percent) for eligible public safety pay plan employees. Additional funds are included in the non-department budget to ensure that all general employees with a positive performance review receive at least a one dollar per hour increase by the end of FY 2020.
Consolidate Communications leadership positions -1.00 -$144,271 Consolidate duties of a vacant Public Services Coordinator with a vacant Communications Director position. No impact to service is anticipated.
Update personnel expenditures - $89,321Technical adjustment to update department costs for personnel services. The update includes the full annual cost of salary increases approved in FY 2019, an update to employer healthcare costs, and the impact of staffing changes that have occurred in FY 2019. These are routine actions that occur at the beginning of the budget cycle.
Adjust employer contribution to the North Carolina Local Governmental Employees' Retirement System (NCLGERS) - $31,870
Technical adjustment for the required employer retirement contribution based on the NCLGERS Board of Trustees January action to increase employer rates from 7.75 percent to 8.95 percent for general employees and 8.50 percent to 9.70 percent for law enforcement officers.
Update allocations for Internal Service Providers (ISPs) - -$78,325Technical adjustment to update funds needed to support ISPs based on anticipated cost of services. ISPs provide services to other city departments, including: building maintenance, rent of land and buildings, telecommunication, insurance liabilities, insurance premiums, and risk administration.
Net Change -1.00 -$59,660
66

Communications
12 12
Performance Measure Highlights
2018 FY 2019 FY 2020 Objective Measure Actual Target Target
Strategic Priority Area: Well-Managed Government (Efficient, Effective, Accountable, Responsive, Inclusive, and Customer Focused)
Increase effective citywide communication efforts
Percent increase of weekly media clips, inquiries, and records requests over prior fiscal years
57% 10% 10%
Provide and improve alternative sources for citizens to gain information related to the city
Number of total city webpage, newsroom, and social media visits
5,340,345 visits 6,675,430 visits 25% increase over FY 2019
Promote options for public engagement
Number of viewers to the GOV Channel
71,397 78,540 10% increase over FY 2019
Create consistent branding for the city
Number of creative solutions and graphic design projects
429 470 10% increase over FY 2019
67

Communications
13 13
Full-Time Equivalent (FTE) Positions Summary
Position Title FY 2019 FTE Change in FTE FY 2020 FTE
Administrative Officer II 1.00 - 1.00 Administrative Officer IV 1.00 - 1.00 Administrative Secretary I 1.00 1.00 Administrative Services Manager 2.00 -1.00 1.00 Chief Marketing Officer 1.00 - 1.00 Communications Director 1.00 - 1.00 Constituent Services Division Manager - 1.00 1.00 Content Webmaster 2.00 - 2.00 Content Webmaster Supervisor 1.00 - 1.00 Corporate Communication Specialist 2.00 4.00 6.00 Corporate Communication Specialist Senior 5.00 -1.00 4.00 Creative Services Supervisor 1.00 - 1.00 Graphic Artist Senior 1.00 - 1.00 Mayor & City Council Support Specialist 4.00 -1.00 3.00 Mayor & City Council Support Specialist Associate 1.00 - 1.00
Mayor & City Council Support Specialist Senior 1.00 - 1.00 Public Info Specialist Senior 1.00 - 1.00 Public Information Specialist 1.00 - 1.00 Public Service Coordinator 3.00 - 3.00 TV Station Manager 1.00 - 1.00 Video Producer/Director 1.00 - 1.00 Video Technician 3.00 -3.00 - Department Total FTE 35.00 -1.00 34.00
68

Community Relations
13 13
Mission Statement Promote community harmony, facilitate resolutions, and celebrate diversity.
Department Overview Provide conflict management and diversity training Provide training on the Americans with Disabilities Act (ADA) to help promote accessibility across the city Investigate violations of the fair housing ordinance
Organizational Chart
Budget Overview Percent Change
FY 2017 FY 2018 FY 2019 FY 2020 FY 2019 Actual Actual Adopted Proposed FY 2020
Expenditures Personnel Services $916,369 $962,276 $1,193,574 $1,607,971 34.7 % Operating Expenses $97,298 $97,006 $83,700 $86,263 3.1 % Departmental Charges $0 $0 -$179,710 -$179,710 0.0 % Total Expenditures $1,013,667 $1,059,282 $1,097,564 $1,514,524 38.0 %
Office of the Director
Community Affairs
Dispute Settlement Fair Housing Americans with
Disabilities
69

Community Relations
14 14
FY 2020 Adjustments
Budget Action FTE Amount
Provide funds for a citywide compensation increase - $17,934Support compensation increase for employees in FY 2020 which includes: a three percent merit increase pool for salaried employees; a 1.5 percent market increase and 1.5 percent merit increase pool for hourly employees; and a 1.5 percent market increase and step increase (2.5 to five percent) for eligible public safety pay plan employees. Additional funds are included in the non-department budget to ensure that all general employees with a positive performance review receive at least a one dollar per hour increase by the end of FY 2020.
Update personnel expenditures 2.00 $386,569 Technical adjustment to update department costs for personnel services. The update includes the full annual cost of salary increases approved in FY 2019, an update to employer healthcare costs, and the impact of staffing changes that have occurred in FY 2019. These are routine actions that occur at the beginning of the budget cycle. The update also includes funding for a Community Relations Administrator and Community Affairs Manager added in FY 2019.
Adjust employer contribution to the North Carolina Local Governmental Employees' Retirement System (NCLGERS) - $9,894
Technical adjustment for the required employer retirement contribution based on the NCLGERS Board of Trustees January action to increase employer rates from 7.75 percent to 8.95 percent for general employees and 8.50 percent to 9.70 percent for law enforcement officers.
Update allocations for Internal Service Providers (ISPs) - $2,563Technical adjustment to update funds needed to support ISPs based on anticipated cost of services. ISPs provide services to other city departments, including: building maintenance, rent of land and buildings, telecommunication, insurance liabilities, insurance premiums, and risk administration.
Net Change 2.00 $416,960
70

Community Relations
15 15
Performance Measure Highlights
FY 2018 FY 2019 FY 2020
Objective Measure Actual Target Target
Strategic Priority Area: Neighborhood Development (Safe, Healthy, and Inclusive Communities)
Improve human relations work process for International Community
Number of collaborations and partnerships with the international community
4 4 4
Improve service delivery to Community Relations members, volunteers, customers and partners
Average rating on Community Relations survey of members, volunteers, customers, and partners regarding service delivery on a 5.0 scale
4.2 4.0 4
Investigate housing discrimination
Number of housing discrimination cases investigated
21 25 30
Percent of fair housing discrimination cases closed within 100 days
48% 60% 60%
Prevent housing discrimination
Number of fair housing conciliation attempts
New measure 15 50
Reduce interpersonal and community conflicts
Percent of cases referred to Community Relations that are successfully resolved
85% 85% 85%
Full-Time Equivalent (FTE) Position Summary
Position Title FY 2019 FTE Change in FTE FY 2020 FTE
Administrative Officer I 1.00 - 1.00 Community Affairs Manager - 1.00 1.00 Community Programs Coordinator 1.00 - 1.00 Community Relations Administrator - 1.00 1.00 Community Relations Manager 1.00 - 1.00 Community Relations Specialist 5.00 - 5.00 Deputy Community Relations Director 1.00 - 1.00 Community Relations Director 1.00 - 1.00
Department Total FTE 10.00 2.00 12.00
71

Economic Development
1 1
Office of the Director
Great Places Business Innovation
Talent Development
Prospective Business
Mission Statement Economic Development’s mission is to help Charlotte’s businesses and residents thrive. Collectively, the team advances the community through building great places, creating a climate where all businesses innovate and prosper, and developing a diversified talent pipeline.
Department Overview
Provide services to build and sustain prosperity, retain jobs, increase the tax base Support public/private partnerships, business attraction and retention, small business and entrepreneurial growth, corridor revitalization, and workforce development
Organizational Chart
Budget Overview Percent Change
FY 2017 FY 2018 FY 2019 FY 2020 FY 2019 Actual Actual Adopted Proposed FY 2020
Expenditures Personnel Services $949,636 $1,878,710 $2,097,368 $2,366,187 12.8 % Operating Expenses $2,153,014 $3,078,323 $3,782,246 $3,651,915 -3.4 % Departmental Charges $0 -$102,049 -$80,807 -$80,807 0.0 % Total Expenditures $3,102,650 $4,854,984 $5,798,807 $5,937,295 2.4 %
72

Economic Development
17 17
FY 2020 Adjustments
Budget Action FTE Amount
Provide funds for a citywide compensation increase - $28,192Support compensation increase for employees in FY 2020 which includes: a three percent merit increase pool for salaried employees; a 1.5 percent market increase and 1.5 percent merit increase pool for hourly employees; and a 1.5 percent market increase and step increase (2.5 to five percent) for eligible public safety pay plan employees. Additional funds are included in the non-department budget to ensure that all general employees with a positive performance review receive at least a one dollar per hour increase by the end of FY 2020.
Expand Economic Development programs to align with four strategic priorities 5.00 $476,912 Expand the Economic Development Department to align with the four strategic priorities of: Great Places; Business Innovation; Talent Development; and Prospective and Existing Businesses. This action reclassifies existing positions and adds five additional full-time positions to achieve priority goals.
Reconcile funds for Centralina Economic Development Commission Membership - $24,000Provide funds for the City of Charlotte to remain a partner with the Centralina Council of Governments (CCOG). CCOG provides a variety of services for the region, including the administration of state and federal grants in the areas of aging, workforce development, economic development, and planning.
Provide additional funds for operating support - $25,000Provide funds for additional operating costs such as supplies, training, contractual services, and technology. This action aligns with the department's desire to expand service around its four priorities: Great Places; Business Innovation; Talent Development; and Prospective and Existing Businesses.
Transfer Sustainability Division into General Services -3.00 -$457,493 Transfer three positions and operating expenses from Economic Development to General Services. The City of Charlotte is restructuring how city departments collaborate and work together. This transition into General Services will allow for sustainability to be a major focus in city-related projects. A corresponding entry can be found in General Services.
Update Expense budget for grants - -$50,000Technical adjustment to realign expenses for grants from Economic Development to Housing and Neighborhood Services. A corresponding adjustment is found in Housing and Neighborhood Services.
73

Economic Development
18 18
FY 2020 Adjustments
Budget Action FTE Amount Update personnel expenditures - $87,946
Technical adjustment to update department costs for personnel services. The update includes the full annual cost of salary increases approved in FY 2019, an update to employer healthcare costs, and the impact of staffing changes that have occurred in FY 2019. These are routine actions that occur at the beginning of the budget cycle.
Adjust employer contribution to the North Carolina Local Governmental Employees' Retirement System (NCLGERS) - $20,627
Technical adjustment for the required employer retirement contribution based on the NCLGERS Board of Trustees January action to increase employer rates from 7.75 percent to 8.95 percent for general employees and 8.50 percent to 9.70 percent for law enforcement officers.
Update allocations for Internal Service Providers (ISPs) - -$16,696Technical adjustment to update funds needed to support ISPs based on anticipated cost of services. ISPs provide services to other city departments, including: building maintenance; rent of land and buildings; telecommunication; insurance liabilities; insurance premiums; and risk administration.
Net Change 2.00 $138,488
74

Economic Development
19 19
Performance Measure Highlights
FY 2018 FY 2019 FY 2020 Objective Measure Actual Target Target
Strategic Priority Area: Economic Development (Economy, Jobs, and Upward Mobility)
Increase business relocations and expansions
Dollar amount of private investment in the city
New Measure New Measure $300,000,000
The number of new jobs (include retained and new)
New Measure New Measure 5,000
The level of participation by entrepreneurs in classes and events
New Measure New Measure >500
The number of company announcements
New Measure New Measure ≥8%
Leverage private investment in major redevelopment projects through public improvements
Leverage ratio public to private investment
New Measure New Measure ≥1:3
Support minority small businesses
The number of minority small businesses participating in AMP UP CLT cohorts to prepare owners for contracting opportunities with the airport and other anchor institutions
New Measure New Measure ≥30
75

Economic
Development
1 1
Full-Time Equivalent (FTE) Position Summary
Position Title FY 2019 FTE Change in FTE FY 2020 FTE
Administrative Officer I 1.00 - 1.00Administrative Officer II 1.00 - 1.00Administrative Officer III 3.00 -1.00 2.00Assistant City Manager 1.00 - 1.00Assistant Economic Development Director - 3.00 3.00Deputy Economic Development Director 1.00 - 1.00Economic Development Operations Manager Senior 3.00 -2.00 1.00
Economic Development Program Manager 4.00 3.00 7.00Economic Development Specialist Senior 4.00 - 4.00Energy Sustainability Coordinator - - -Services Division Manager 1.00 -1.00 -
Department Total FTE 19.00 2.00 21.00
76

Finance
1 1
Office of the Chief
Financial Officer
AdministrationFinancialReporting
Business Systems
DevelopmentRevenue Treasury
Financial Services
Mission Statement Finance partners with customers to achieve their service goals in the community through sound management of finances.
Department Overview
Provide strategic financial planning and accounting services to the city, including federal and state-mandated
reporting and the Comprehensive Annual Financial Report Process citywide accounts payable and accounts receivables, including utility payments and housing loans
Manage the investment of city funds and issuance of debt instruments
Organizational Chart
Budget Overview Percent Change
FY 2017 FY 2018 FY 2019 FY 2020 FY 2019 Actual Actual Adopted Proposed FY 2020
Revenues
Intergovt-local $1,515,994 $1,552,631 $115,328 $0 -100.0 %
Intergovt-state $7,845,943 $7,647,378 $100,000 $0 -100.0 %
Admin charges $626,860 $844,451 $700,000 $0 -100.0 %
Other $26,435 $2,536 $0 $0 0.0 %
Private contribution $0 $100,000 $0 $0 0.0 %
Sales of assets $911,847 $1,019,759 $880,000 $0 -100.0 %
Total Revenues $10,927,079 $11,166,755 $1,795,328 $0 -100.0 %
Expenditures
Personnel Services $19,173,086 $20,152,590 $11,312,354 $8,564,642 -24.3 %
Operating Expenses $13,208,806 $12,380,345 $5,702,384 $4,131,829 -27.5 %
Capital Outlay $85,891 $73,438 $0 $0 0.0 %
Grants and Contributions $83,048 $0 $0 $0 0.0 %
Departmental Charges -$14,621,017 -$14,074,020 -$229,322 -$89,275 -61.1 %
Interfund Activity Support $59,690 $60,089 $61,481 $61,481 0.0Total Expenditures $17,989,504 $18,592,443 $16,846,897 $12,668,677 -24.8 %
Net Expenditures $7,062,425 $7,425,688 $15,051,569 $12,668,677 -15.8 %
Fleet Management was transferred to General Services in FY 2019. In FY 2020, Procurement moved to General Services and operational support for public access television moved to the Non-Departmental budget.
77

Finance
22 22
FY 2020 Adjustments
Budget Action FTE Amount Provide funds for citywide compensation increase - $141,614
Support compensation increase for employees in FY 2020 which includes: a three percent merit increase pool for salaried employees; a 1.5 percent market increase and 1.5 percent merit increase pool for hourly employees; and a 1.5 percent market increase and step increase (2.5 to five percent) for eligible public safety pay plan employees. Additional funds are included in the non-department budget to ensure that all general employees with a positive performance review receive at least a one dollar per hour increase by the end of FY 2020.
Support Charlotte Water operations 3.00 - Add Accounting Technician, Accountant II, and Accountant IV to provide enhanced financial services to Charlotte Water in accounts payable, financial reporting, and debt management. These positions are suppported with revenue of $213,420 from Charlotte Water. There is a corresponding entry shown in Charlotte Water.
Support maintenance for financial systems - $24,895Technical adjustment to support contractual increases for maintenance of city's financial management system, revenue collection system, and billing invoice system.
Transfer public access channel support to non-departmental budget - -$683,305Technical adjustment to transfer operational support budgets for Charlotte Mecklenburg Public Access Channel, and local public, educational, and government access channels to the non-departmental section of the General Fund Budget.
Correct allocation for department chargeout - $95,047Technical adjustment to correct a department chargeout that was erroneously included during a previous budget cycle
Transfer Procurement Division from Finance to Department of General Services -34.00 -$4,085,840 Executive adjustment to realign procurement functions to the newly formed Department of General Services to provide citywide acquisition functions and services. There is corresponding entry in General Services for this adjustment.
Update personnel expenditures - $352,205Technical adjustment to update department costs for personnel services. The update includes the full annual cost of salary increases approved in FY 2019, an update to employer healthcare costs, and the impact of staffing changes that have occurred in FY 2019. These are routine actions that occur at the beginning of the budget cycle.
78

Finance
23 23
FY 2020 Adjustments (continued)
Budget Action FTE Amount Adjust employer contribution to the North Carolina Local Governmental Employees' Retirement System (NCLGERS) - $100,242
Technical adjustment for the required employer retirement contribution based on the NCLGERS Board of Trustees January action to increase employer rates from 7.75 percent to 8.95 percent for general employees and 8.50 percent to 9.70 percent for law enforcement officers.
Update allocations for Internal Service Providers (ISPs) - -$123,078Technical adjustment to update funds needed to support ISPs based on anticipated cost of services. ISPs provide services to other city departments, including: building maintenance; rent of land and buildings; telecommunication; insurance liabilities; insurance premiums; and risk administration.
Net Change -31.00 -$4,178,220
Performance Measure Highlights
FY 2018 FY 2019 FY 2020 Objective Measure Actual Target Target
Strategic Priority Area: Well-Managed Government (Efficient, Effective, Accountable, Responsive, Inclusive, and Customer Focused)
Follow Generally Accepted Accounting Principles to create an accurate Comprehensive Annual Financial Report
External auditor's opinion Achieved an unmodified opinion
Achieve an unmodified opinion
Achieve an unmodified opinion
Minimize the cost of incurring debt to finance capital projects
Credit rating from external rating agencies
AAA rating Maintain AAA credit rating
Maintain AAA credit rating
Provide timely payment to city vendors
Average # of days to pay valid accounts payable invoices
29.49 < 30 < 30
79

Finance
24 24
Full-Time Equivalent (FTE) Position Summary
Position Title FY 2019 FTE Change in FTE FY 2020 FTE
Accountant I 1.00 - 1.00 Accountant II 4.00 2.00 6.00 Accountant III 2.00 - 2.00 Accountant IV 4.00 1.00 5.00 Accounting Specialist Senior 9.00 -2.00 7.00 Accounting Technician 10.00 1.00 11.00 Administrative Officer I 4.00 -3.00 1.00 Administrative Officer II 2.00 1.00 3.00 Administrative Officer III 3.00 -2.00 1.00 Administrative Officer IV 1.00 - 1.00 Administrative Officer V 1.00 - 1.00 Administrative Secretary I 1.00 - 1.00 Assistant Chief Accountant 1.00 - 1.00 Assistant Finance Director 1.00 - 1.00 Assistant Financial Services Manager 2.00 - 2.00 Business System Specialist Associate 1.00 - 1.00 Business Systems Specialist Intermediate 5.00 - 5.00 Business Systems Specialist Lead 1.00 - 1.00 Business System Specialist Senior 1.00 - 1.00 Business Systems Manager 1.00 - 1.00 Central Cashier 1.00 - 1.00 Chief Accountant 1.00 - 1.00 Chief Financial Officer 1.00 - 1.00 City Treasurer 1.00 - 1.00 Construction Contracts Admin Coordinator Lead 1.00 -1.00 0.00
Contracts Admin Coordinator 7.00 -7.00 0.00 Contracts Admin Specialist 3.00 -3.00 0.00 Contracts Admin Specialist Lead 1.00 -1.00 0.00 Customer/Revenue Service Assistant Senior 4.00 - 4.00 Customer/Revenue Service Assistant 4.00 - 4.00 Customer/Revenue Service Specialist 3.00 - 3.00 Debt Manager 1.00 - 1.00 Economic Development Program Manager 2.00 -2.00 0.00 Finance Director 1.00 - 1.00 Financial Accountant I 2.00 - 2.00 Financial Accountant II 3.00 - 3.00 Financial Accountant III 5.00 - 5.00
80

Finance
25 25
Full-Time Equivalent (FTE) Position Summary (continued)
Position Title FY 2019 FTE Change in FTE FY 2020 FTE Financial Services Manager 2.00 - 2.00 Investment Manager 1.00 - 1.00 Management Analyst 1.00 -1.00 0.00 Office Assistant V 1.00 - 1.00 Operations Supervisor 1.00 -1.00 0.00 Procurement Services Assistant Division Manager 1.00 -1.00 0.00
Procurement Services Division Manager 1.00 -1.00 0.00 Purchasing Agent 3.00 -3.00 0.00 Revenue Collections Agent 3.00 - 3.00 Senior Technical Writer 1.00 - 1.00 Small Business Program Manager 1.00 -1.00 0.00 Small Business Program Special 6.00 -6.00 0.00 Stores Supervisor 1.00 -1.00 0.00
Department Total FTE 119.00 -31.00 88.00
81

Fire
26 26
Mission Statement To preserve life and property through rapid emergency response, code enforcement, education, and planning.
Department Overview
Respond to calls for emergency services
Ensure emergency preparedness Provide public outreach and education to prevent fires and other emergencies Investigate the origin and cause of fires
Organizational Chart
Budget Overview Percent Change
FY 2017 FY 2018 FY 2019 FY 2020 FY 2019 Actual Actual Adopted Proposed FY 2020
Revenues Intergovernmental $916,282 $1,248,545 $755,037 $1,838,721 143.5 %
Licenses, fees, fines $1,585,461 $1,651,405 $2,095,205 $1,394,775 -33.4 % Charges for current services $1,731,621 $1,962,619 $1,912,685 $2,793,345 46.0 % Miscellaneous $24,948 $36,036 $33,264 $33,264 0 % Admin charges $5,465,254 $6,034,736 $6,215,852 $6,668,159 7.3 % Other $6,508 $0 $0 $0 0.0 % Miscellaneous and Other $31,456 $36,036 $33,264 $33,264 0.0 % Private contribution $51,838 - - - 0.0 % Total Revenues $9,813,367 $10,969,377 $11,045,307 $12,761,528 15.5 %
Expenditures Personnel Services $106,194,872 $109,370,369 $112,067,321 $118,131,130 5.4 % Operating Expenses $14,710,065 $14,598,331 $14,871,104 $15,173,785 2.0 % Capital Outlay $23,233 $411,522 - - 0 % Departmental Charges -$236,389 -$263,797 -$262,725 -$284,793 8.4 % Total Expenditures $120,691,781 $124,116,425 $126,675,700 $133,020,122 5.0 % Net Expenditures $110,878,414 $113,147,047 $115,630,393 $120,258,594 4.0 %
Office of the Chief
Operations Business Administration
Personnel Administration
82

Fire
27 27
FY 2020 Adjustments
Budget Action FTE Amount Provide funds for a citywide compensation increase - $2,477,857
Support compensation increase for employees in FY 2020 which includes: a three percent merit increase pool for salaried employees; a 1.5 percent market increase and 1.5 percent merit increase pool for hourly employees; and a 1.5 percent market increase and step increase (2.5 to five percent) for eligible public safety pay plan employees. Additional funds are included in the non-department budget to ensure that all general employees with a positive performance review receive at least a one dollar per hour increase by the end of FY 2020.
Provide funds for enhanced compensation - $1,111,645Provide funds to create an extra step for Firefighter Engineers and re-align the market rate for Fire Captain. This adjustment also adds one percent to the Firefighter's 401K, effective January 2020.
Hire firefighters for new Infill Fire Station 43 in spring of 2020 18.00 $263,807
Hire 18 new Firefighters for Infill Fire Station 43 at I-77 and Clanton Road. The funds will allow new firefighters to begin training in the fire academy in the spring of 2020, prior to the station's anticipated opening in FY 2021.
Provide equipment funding - $300,000Provide funds for new and replacement fire equipment for Firefighters. In FY 2020 these funds will be used to purchase new equipment related to Fire Infill Station 43.
Firefighters to suport services 9.00 $382,773 Provide funds for nine additional Firefighters to serve in existing stations. The addition of nine Firefighters reconciles the number of positions needed reduce the overall use of overtime.
Provide expenditure authority for revenue reimbursed deployment events - $230,000Provide funds for overtime costs related to external revenue-reimbursed events. These funds will only be released to the department if external revenue is realized.
Add command staff positions at Aviation 2.00 $263,033 Provide funds for one Division Chief, and one Captain in Aviation. These positions will fulfill supervisory and training roles for the existing two companies supporting the Aviation department.
83

Fire
28 28
FY 2020 Adjustments (continued)
Budget Action FTE Amount
Increase funds for fuel - $125,672Support fuel costs for Public Safety response vehicles based on prior year utilization. Fuel consumption is driven by calls for service.
Support third party vendor for promotional process - $125,000
Contract with a third party to manage the promotional process for Fire Captains and Battalion Chiefs. This helps ensure to hire the highest qualified candidates, through an independent objective process.
Support One Stop Shop by hiring a Plans Examiner 1.00 $68,329 Hire a Plans Examiner to support land development and assist Planning, Design, and Development's efforts to create a one-stop for all city permit responsibilities.
Reconcile funds for strategic deployment software - $50,057Provide funds to support software that provides the capability to predict and plan for future operational workloads. Funds included are for annual maintenance.
Update personnel expenditures - $1,364,609Technical adjustment to update department costs for personnel services. The update includes the full annual cost of salary increases approved in FY 2019, an update to employer healthcare costs, and the impact of staffing changes that have occurred in FY 2019. These are routine actions that occur at the beginning of the budget cycle.
Adjust employer contribution to the North Carolina Local Governmental Employees' Retirement System (NCLGERS)
- $101,889
Technical adjustment for the required employer retirement contribution based on the NCLGERS Board of Trustees January action to increase employer rates from 7.75 percent to 8.95 percent for general employees and 8.50 percent to 9.70 percent for law enforcement officers.
Update allocations for Internal Service Providers (ISPs) - -$520,249Technical adjustment to update funds needed to support ISPs based on anticipated cost of services. ISPs provide services to other city departments, including: building maintenance; rent of land and buildings; telecommunication; insurance liabilities; insurance premiums; and risk administration.
Net Change 30.00 $6,344,422
84

Fire
29 29
Performance Measure Highlights
FY 2018 FY 2019 FY 2020
Objective Measure Actual Target Target
Strategic Priority Area: Neighborhood Development (Safe, Healthy, and Inclusive Communities)
Timely response to calls for service: first-due total response time, all calls for service
Percent of calls responded to within six minutes
90% 90% 90%
Timely response to calls for service: fourth-due (effective firefighting force) total response time, structure fire call
Percent of calls responded to with an effective firefighting force (four companies) within 10 minutes 20 seconds
83% 90% 90%
Provide public education instruction to increase safety and health of families
Percent of CMS 3rd graders receive fire prevention education in 111 schools
100% 100% 100%
Timely response to calls to 911: Receipt of call to phone pick-up
Percent of 911 calls answered within 10 seconds
97% 90% 90%
Efficient dispatch of companies: phone pick-up to dispatch
Percent of 911 calls dispatched within 60 seconds
94% 90% 90%
Strategic Priority Area: Well-Managed Government (Efficient, Effective, Accountable, Responsive, Inclusive, and Customer Focused)
Provide training and development for emergency operations members
Conduct Emergency Operations Center (EOC) exercise
New Measure Conduct an annual EOC exercise that demonstrates full activation of the
EOC
Conduct an annual EOC exercise that
demonstrates full activation of the
EOC Maintain diversity Percent of women and
minorities involved in the firefighter applicant pool
47% ≥ 20% ≥ 20%
85

Fire
30 30
Full-Time Equivalent (FTE) Position Summary
Position Title FY 2019 FTE Change in FTE FY 2020 FTE
Administrative Officer I 2.00 2.00 4.00 Administrative Officer II 4.00 -1.00 3.00 Administrative Officer III 1.00 1.00 2.00 Administrative Officer IV 1.00 - 1.00 Administrative Officer V 3.00 - 3.00 Administrative Secretary I 1.00 - 1.00 Applications Administrator 1.00 - 1.00 Battalion Fire Chief 37.00 - 37.00Building Maintenance Assistant 1.00 - 1.00 Business Systems Specialist Intermediate 3.00 - 3.00 Business Systems Specialist Lead 0.00 1.00 1.00 Business Systems Specialist Senior 0.00 1.00 1.00 Business Systems Manager 1.00 - 1.00 Business Systems Program Manager 1.00 - 1.00 Chief Fire Inspector 1.00 - 1.00 Chief Fire Investigator 1.00 - 1.00 Deputy Fire Chief 3.00 - 3.00 Division Fire Chief 6.00 1.00 7.00 Emergency Management Planner 3.00 - 3.00 Facilities Services Coordinator 4.00 - 4.00 Fire Captain 248.00 4.00 252.00 Fire Captain - Special Assignment 5.00 - 5.00 Fire Chief 1.00 - 1.00 Fire Communication Services Supervisor 1.00 - 1.00 Fire EMS Instructor Coordinator 1.00 - 1.00 Fire Equipment Technician 3.00 - 3.00 Fire Fighter Engineer 198.00 3.00 201.00 Fire Fighter I 201.00 41.00 242.00 Fire Fighter II 373.00 -20.00 353.00 Fire Inspector 12.00 -1.00 11.00 Fire Inspector Certified 21.00 2.00 23.00 Fire Inspector Senior 6.00 - 6.00 Fire Investigator Certified 6.00 - 6.00 Fire Investigator Senior 3.00 - 3.00
86

Fire
31 31
Full-Time Equivalent (FTE) Position Summary (continued)
Position Title FY 2019 FTE Change in FTE FY 2020 FTE
Fire Marshal 1.00 - 1.00 Fire Telecommunicator I 24.00 - 24.00Fire Telecommunicator I Lead 7.00 - 7.00 Fire Telecommunicator II 6.00 - 6.00 Fire Telecommunicator III 2.00 - 2.00 GIS Analyst 2.00 -1.00 1.00 GIS Supervisor 1.00 -1.00 0.00 Management Analyst Senior 1.00 - 1.00 Office Assistant V 5.00 -2.00 3.00 Software Developer Intermediate 1.00 - 1.00 Software Developer Senior 1.00 - 1.00 Storekeeper 2.00 - 2.00 Stores Supervisor 1.00 - 1.00
Department Total FTE 1,207.00 30.00 1,237.00
87

General Services1
1 1
Mission Statement Guide agencies through innovative and efficient deployment of resources to meet their missions and fulfill the needs of the city in a rapidly evolving and complex environment. Design and deliver expanded, shared services across departments and for the City of Charlotte to improve performance and save taxpayer money.
Department Overview Design, construction, maintenance, and sustainability of capital infrastructure projects, public facilities, and grounds Provide review services for private land development Manage the acquisition of real estate, goods and services through competitive processes Administer the Charlotte Business INClusion (CBI) Policy by certifying Minority, Women, and Small Business Enterprises (MWSBEs) and partnering with departments to establish and monitor MWSBE inclusion goals Provide safe, reliable, best-value, enterprise-wide fleet and operational equipment management and maintenance services to the city and county
Organizational Chart
Budget Overview Percent Change
FY 2017 FY 2018 FY 2019 FY 2020 FY 2019 Actual Actual Adopted Proposed FY 2020
Revenues Licenses, Fees, and Fines $7,078,405 $7,330,866 $7,324,008 $3,886,835 4 -46.9 % Intergovernmental-Local $791,800 $786,729 $2,280,765 $2,334,034 2.3 % Charges for Current Services $767,727 $685,377 $873,010 $1,118,240 28.1 % Miscellaneous $742,702 $880,749 $1,638,858 $1,128,678 -31.1 % Administrative Charges $0 $0 $72,171 $72,000 -0.2 % Total Revenues $9,786,489 $8,056,146 $12,288,812 $6,312,431 -48.6 %
1Created in FY 2020 from the former department of Engineering and Property Management 2 Storm Water is also displayed in the Nongeneral Funds 3 Land Development, Building Services, Real Estate, and Landscape Management are within Engineering and Project
4 Revenues transferred to Planning, Design, & Development in FY 2020 for the One-Stop-Shop permitting initiative
Office of the Director
Engineering and Project Management Storm Water2 Fleet
ManagementProcurement
and CBI3Sustainability
Office3
88
Management; Procurement and CBI division are realigned from Finance; Sustainability Office is realigned from Economic Development

General Services1
2 2
Budget Overview (continued)
Expenditures Personnel Services $28,203,166 $29,738,288 $39,589,873 $44,866,524 13.3 % Operating Expenses $10,319,972 $11,807,415 $19,079,456 $20,834,628 9.2 % Capital Outlay $299,778 $1,193 $164,000 $174,000 6.1 % Departmental Charges -$21,976,518 -$23,709,389 -$38,673,209 -$39,477,164 2.1 % Total Expenditures $16,846,398 $17,837,507 $20,160,120 $26,397,988 30.9 % Net Expenditures $7,059,909 $9,781,361 $7,871,308 $20,085,557 155.2 %
89

General Services
3 3
FY 2020 Adjustments
Budget Action FTE Amount
Provide funds for citywide compensation increase - $568,421Support compensation increase for employees in FY 2020 which includes: a three percent merit increase pool for salaried employees; a 1.5 percent market increase and 1.5 percent merit increase pool for hourly employees; and a 1.5 percent market increase and step increase (2.5 to five percent) for eligible public safety pay plan employees. Additional funds are included in the non-department budget to ensure that all general employees with a positive performance review receive at least a one dollar per hour increase by the end of FY 2020.
Enhance the management structure of the newly formed department 1.00 $235,720 Provide funds for a General Services Director position to oversee nonpersonal services and enhance support operations and nonpersonnel services. Funding from this position is provided primarily from the elimination of a Special Assistant to the City Manager. There is a corresponding entry in the Office of Strategy and Budget.
Enhance citywide contractual compliance and technology procurement 4.00 $175,263 Provide funds for four positions to enhance the city's contractual compliance efforts. Support for three Compliance Officers and one Administrative Coordinator is provided. Enterprise Funds will also provide support for two positions for two years until the enhanced services become part of the city's Cost Allocation Plan. The enhancement includes $144,438 that is supported with revenue from enterprise funds.
Provide funds to enhance the department's safety program 1.00 $81,415 Provide funds for one Safety Coordinator position to enhance safety in areas with technical or hazardous operations such as the fleet maintenance, facility maintenance, landscape management, and land development. This position will support the department Safety Supervisor in implementing program needs, monitoring safety compliance, developing corrective action plans, and providing safety training.
Annualize contractual costs for parts supplier contract in Fleet operations - $298,504Annualize funds for parts supply and management contract that was approved in FY 2019 for Fleet operations. The contract provides overall efficiency and cost savings to the department.
Provide funds for contractual increase in janitorial services contract - $74,000Technical adjustment to provide funds for an contractual increase in the Government Center's janitorial services contract.
90

General Services
4 4
FY 2020 Adjustments (continued)
Budget Action FTE Amount
Support contractual increase in security contract - $11,125
Technical adjustment to provide funds for a contractual increase in the security services contract in the Government Center.
Support contractual increase in grounds and median maintenance contracts - $154,077Technical adjustment to provide funds for contractual increases in contracts related to cemetery grounds maintenance, median maintenance, and general grounds maintenance.
Provide funds for lease payments - $2,510Technical increase to provide funds for a contractual rent increase at the city's Asset Recovery and Disposal Facility.
Provide accounting method for asset reimbursement - -$65,000Technical adjustment to provide an accounting method for Nongeneral Fund departments to reimburse the General Fund for costs incurred to auction the departments' surplus vehicles and equipment. This action will have no impact on service.
Realign procurement personnel and related expenses to provide acquisition services 34.00 $4,045,046
Executive adjustment to realign procurement functions to the newly formed department of General Services to provide citywide acquisition functions and services. There is corresponding entry in Finance for this adjustment.
Realign personnel and related expenses to enhance sustainability initiatives 3.00 $457,493 Executive adjustment to realign the Office of Sustainability to the newly formed department of General Services to enhance sustainability initiatives and advance sustainability goals. There is corresponding entry in Economic Development for this adjustment.
Realign personnel and related expenses to improve data analytics and data management -2.00 -$286,024
Executive adjustment to realign the Office of Data and Analytics to Innovation and Technology to improve data analytics and citywide data management. There is a corresponding entry in Innovation and Technology for this adjustment.
Adjust departmental charges - -$553,724Technical adjustment for departmental charges in fleet maintenance. Other city departments reimburse Fleet Management for services and repairs performed on their vehicles. This adjustment reflects an anticipated increase in costs.
91

General Services
5 5
FY 2020 Adjustments (continued)
Budget Action FTE Amount
Update personnel expenditures - $694,850Technical adjustment to update department costs for personnel services. The update includes the full annual cost of salary increases approved in FY 2019, an update to employer healthcare costs, and the impact of staffing changes that have occurred in FY 2019. These are routine actions that occur at the beginning of the budget cycle.
Adjust employer contribution to the North Carolina Local Governmental Employees' Retirement System (NCLGERS) - $348,579
Technical adjustment for the required employer retirement contribution based on the NCLGERS Board of Trustees January action to increase employer rates from 7.75 percent to 8.95 percent for general employees and 8.50 percent to 9.70 percent for law enforcement officers.
Update allocations for Internal Service Providers (ISPs) - -$4,387Technical adjustment to update funds needed to support ISPs based on anticipated cost of services. ISPs provide services to other city departments, including: building maintenance; rent of land and buildings; telecommunication; insurance liabilities; insurance premiums; and risk administration.
Net Change 41.00 $6,237,868
92

General Services
6 6
Performance Measure Highlights
FY 2020 FY 2018 FY 2019 FY 2020 Objective Measure Actual Target Target
Strategic Priority Area: Economic Development (Economy, Jobs, and Upward Mobility)
Partnering with customers to approve development plans in an efficient and collaborative manner that helps build a safe and thriving community
Average number of reviews done
1.9 average reviews
Review plans on average 95% on time, within average of 2.5
reviews
≤ 2.5 Reviews
Strategic Priority Area: Neighborhood Development (Safe, Healthy, and Inclusive Communities)
Protect and expand a healthy tree canopy
Reduce the number of hazardous street trees
New Measure New Measure Meet wait time for tree removal: Extreme priority:
2 days, High priority: 2 months,
Medium/Low: 4 months
Achieve canopy neutral impacts when comparing trees removed to trees planted by the City
New Measure New Measure Maintain at least 100% canopy neutrality.
Strategic Priority Area: Transportation and Planning (Mobility, Accessibility, and Connectivity)
Facilitate public-private partnerships, which integrate education, recreation, employment, and housing resources
Percent of project schedule milestones met during the fiscal year
New Measure New Measure > 85%
Strategic Priority Area: Well-Managed Government (Efficient, Effective, Accountable, Responsive, Inclusive, and Customer Focused)
Maintain energy use practices so city facilities compare favorably with available benchmark information in the South Atlantic region
Overall energy use intensity (EUI) - measured in thousands of British thermal units (BTUs) per square foot
EUI = 63.2
Percent Reduction = 16.3%
Maintain an Overall EUI <67
or reduction>15%
Maintain an Overall EUI <67
or reduction>15%
93

General Services
7 7
Full-Time Equivalent (FTE) Position Summary
Position Title FY 2019 FTE Change in FTE FY 2020 FTE Administrative Officer I 12.00 2.00 14.00 Administrative Officer II 11.00 2.00 13.00 Administrative Officer III 7.00 2.00 9.00 Administrative Officer IV 3.00 2.00 5.00 Administrative Officer V 3.00 - 3.00 Administrative Secretary I 1.00 - 1.00 Arborist 2.00 - 2.00 Assistant City Engineer 1.00 - 1.00 Assistant Director 1.00 1.00 2.00 Associate Urban Forestry Specialist 1.00 - 1.00 Assistant Field Operations Supervisor 7.00 - 7.00 Building Maintenance Superintendent 1.00 - 1.00 Building Services Manager 1.00 - 1.00 Business System Specialist Associate 1.00 - 1.00 Business Systems Specialist Intermediate 2.00 - 2.00
Business Systems Specialist Lead 1.00 - 1.00 Business System Specialist Senior 6.00 - 6.00 Carpenter 1.00 - 1.00 Carpenter Senior 3.00 - 3.00 Chief Airport Construction Inspector 1.00 - 1.00 Chief Arborist 1.00 - 1.00 Chief Maintenance Mechanic 6.00 - 6.00 Construction Contracts Admin Coordinator Lead 1.00 1.00 2.00
Construction Inspector 24.00 -1.00 23.00 Construction Inspector Senior 6.00 - 6.00 Construction Manager 2.00 - 2.00 Construction Supervisor 7.00 - 7.00 Contract Technician 2.00 - 2.00 Contracts Admin Coordinator 5.00 8.00 13.00 Contracts Admin Specialist - 3.00 3.00 Contracts Admin Specialist Lead - 1.00 1.00 Courier 2.00 - 2.00 Courier-lead 1.00 - 1.00 Data Analytics Manager 1.00 -1.00 - Data Analytics Specialist Lead 1.00 -1.00 - Drafting Technician 5.00 - 5.00
94

General Services
8 8
Full-Time Equivalent (FTE) Position Summary (continued)
Position Title FY 2019 FTE Change in FTE FY 2020 FTE Economic Development Program Manager - 2.00 2.00
Energy Manager 1.00 - 1.00 Energy Management Specialist 2.00 - 2.00 Energy Sustainability Coordinator 1.00 1.00 2.00 Engineering & Property Management Director 1.00 - 1.00
Engineering Business Services Manager 1.00 - 1.00 Engineering Contracts Manager 1.00 - 1.00 Engineering Contracts Specialist 8.00 - 8.00 Engineering Division Manager 3.00 - 3.00 Engineering Program Manager 11.00 - 11.00 Engineering Project Coordinator 5.00 - 5.00 Engineering Project Manager 26.00 - 26.00 Environmental Compliance Specialist 1.00 - 1.00 Equipment Management Division Manager 1.00 - 1.00
Equipment Operator I 2.00 - 2.00 Equipment Operator II 7.00 - 7.00 Equipment Operator III 2.00 - 2.00 Equipment Parts Manager 1.00 - 1.00 Equipment Parts Team Leader 3.00 - 3.00 Equipment Parts Technician 7.00 - 7.00 Equipment Shop Manager 4.00 - 4.00 Equipment Shop Supervisor 9.00 - 9.00 Erosion Control Coordinator 6.00 - 6.00 Facilities Services Coordinator 1.00 - 1.00 Field Operations Supervisor 3.00 - 3.00 Fleet Specification Analyst 3.00 - 3.00 GIS Analyst 1.00 - 1.00 GIS Coordinator 1.00 - 1.00 GIS Technician 1.00 - 1.00 Government Plaza Property Manager 1.00 - 1.00 Government Plaza Security Coordinator 1.00 - 1.00 Heavy Equipment Service Evt 4.00 - 4.00 Heavy Equipment Service Evt Lead 1.00 - 1.00
95

General Services
9 9
Full-Time Equivalent (FTE) Position Summary (continued)
Position Title FY 2019 FTE Change in FTE FY 2020 FTE Heavy Equipment Service Technician Associate 1.00 - 1.00
Heavy Equipment Service Technician Lead 4.00 - 4.00
Heavy Equipment Service Technician Master 11.00 1.00 12.00
Heavy Equipment Service Technician Senior 26.00 - 26.00
Horticulturist 1.00 - 1.00 HVAC Technician Senior 9.00 - 9.00 Labor Crew Chief II 8.00 - 8.00 Laborer 2.00 - 2.00 Landscape Architect 1.00 - 1.00 Landscape Crew Member 2.00 - 2.00 Landscape Division Manager 1.00 - 1.00 Landscape Supervisor 2.00 - 2.00 Light Equipment Service Technician Associate 2.00 - 2.00
Light Equipment Service Technician Lead 3.00 - 3.00
Light Equipment Service Technician Master 13.00 - 13.00
Light Equipment Service Technician Senior 13.00 -1.00 12.00
Locksmith 1.00 - 1.00 Management Analyst 1.00 3.00 4.00 Office Assistant IV 2.00 - 2.00 Office Assistant V 1.00 - 1.00 Operations Manager Senior - 1.00 1.00 Operations Supervisor 4.00 1.00 5.00 Pesticide Applicator 2.00 - 2.00 Plan Review Engineer 3.00 - 3.00 Planning/Design Engineer 3.00 - 3.00 Procurement Services Assistant Division Manager - 1.00 1.00
Procurement Services Division Manager - 1.00 1.00 Public Info Specialist Senior 2.00 - 2.00 Public Service Coordinator 1.00 - 1.00 Purchasing Agent - 3.00 3.00 Real Estate Agent II 9.00 - 9.00
96

General Services
10 10
Full-Time Equivalent (FTE) Position Summary (continued)
Position Title FY 2019 FTE Change in FTE FY 2020 FTE Real Estate Agent II Lead 1.00 - 1.00 Real Estate Agent III 1.00 - 1.00 Real Estate Division Manager 1.00 - 1.00 Real Estate Program Manager 3.00 - 3.00 Safety Coordinator - 1.00 1.00 Safety Supervisor 1.00 - 1.00 Senior Engineer 6.00 - 6.00 Senior Engineering Project Manager 14.00 - 14.00 Service Order Specialist 8.00 - 8.00 Small Business Program Manager - 1.00 1.00 Small Business Program Specialist - 6.00 6.00 Software Developer Senior 1.00 - 1.00 Stores Supervisor - 1.00 1.00 Survey And Mapping Supervisor 1.00 - 1.00 Survey Party Chief 9.00 - 9.00 Survey Supervisor 2.00 - 2.00 Survey Technician 6.00 - 6.00 Systems Maintenance Mechanic Senior 8.00 1.00 9.00 Systems Maintenance Mechanic 1.00 -1.00 - Tree Trimmer 7.00 - 7.00 Urban Forestry Specialist 1.00 - 1.00 Water Quality Program Admin 1.00 - 1.00
Department Total FTE 450.00 41.00 491.00
97

Housing and Neighborhood Services
42 42
Mission Statement Create vibrant, diverse neighborhoods through the delivery of four major service areas: community engagement for stronger and safer neighborhoods; code enforcement to maintain standards for a higher quality of life; housing services for the development of workforce, assisted, and special needs housing; and CharMeck 311 for providing timely information and services to residents.
Department Overview Provide services to sustain prosperity, retain jobs, increase the tax base, implement energy saving projects, and maintain and improve the quality of life in Charlotte’s neighborhoods Provide loans and grants to finance affordable housing projects and housing support agencies Provide support for service area teams in neighborhoods and business corridors Conduct housing, property, and zoning inspections to communicate and enforce city codes Provide leadership for youth apprenticeship and intern programs throughout city government Provide customer service to residents through CharMeck 311
Organizational Chart
Budget Overview Percent Change
FY 2017 FY 2018 FY 2019 FY 2020 FY 2019 Actual Actual Adopted Proposed FY 2020
Revenues Intergovernmental-Local $0 $1,411,560 $1,287,932 $1,335,207 3.7 % Licenses, Fees, and Fines $256,513 $323,909 $289,935 $333,000 14.9 % Charges for Current Services $821,042 $921,951 $856,913 $911,000 6.3 % Total Revenues $1,077,555 $2,657,420 $2,434,780 $2,579,207 5.9 %
Expenditures Personnel Services $16,060,378 $16,168,889 $18,061,347 $18,924,447 4.8 % Operating Expenses $4,553,768 $3,990,874 $4,666,202 $4,424,059 -5.2 % Departmental Charges -$2,054,968 -$2,166,116 -$2,796,449 -$2,796,449 0.0 % Total Expenditures $18,559,178 $17,993,647 $19,931,100 $20,552,057 3.1 %
Office of the Director
Housing Services
Community Engagement
Code Enforcement
CharMeck 311
Budget and Finance, HR, and
ComplianceStrategic Support
98

Housing and Neighborhood Services
44 44
FY 2020 Adjustments
Budget Action FTE Amount
Provide funds for citywide compensation increase - $283,756
Support compensation increase for employees in FY 2020 which includes: a three percent merit increase pool for salaried employees; a 1.5 percent market increase and 1.5 percent merit increase pool for hourly employees; and a 1.5 percent market increase and step increase (2.5 to five percent) for eligible public safety pay plan employees. Additional funds are included in the non-department budget to ensure that all general employees with a positive performance review receive at least a one dollar per hour increase by the end of FY 2020.
Enhance citywide upward mobility; immigration; and diversity, equity, and inclusion initiatives 1.00 $156,935
Provide funds for one Assistant Director position to enhance citywide initiatives that will directly support upward mobility; immigration; and diversity, equity, and inclusion.
Adjust grant expenses - $50,000Technical adjustment to realign expenses for grants from Economic Development to Housing and Neighborhood Services. A corresponding adjustment is found in Economic Development.
Update personnel expenditures - $261,806Technical adjustment to update department costs for personnel services. The update includes the full annual cost of salary increases approved in FY 2019, an update to employer healthcare costs, and the impact of staffing changes that have occurred in FY 2019. These are routine actions that occur at the beginning of the budget cycle.
Adjust employer contribution to the North Carolina Local Governmental Employees' Retirement System (NCLGERS) - $160,603
Technical adjustment for the required employer retirement contribution based on the NCLGERS Board of Trustees January action to increase employer rates from 7.75 percent to 8.95 percent for general employees and 8.50 percent to 9.70 percent for law enforcement officers
Update allocations for Internal Service Providers (ISPs) - -$292,143Technical adjustment to update funds needed to support ISPs based on anticipated cost of services. ISPs provide services to other city departments, including: building maintenance; rent of land and buildings; telecommunication; insurance liabilities; insurance premiums; and risk administration.
Net Change 1.00 $620,957
99

Housing and Neighborhood Services
45 45
Performance Measure Highlights
FY 2018 FY 2019 FY 2020 Objective Measure Actual Target Target
Strategic Priority Area: Economic Development (Economy, Jobs, and Upward Mobility)
Increase economic mobility, social capital, and career opportunities for youth
Number of private sector businesses and non-profits recruited to provide youth internships, pre-apprenticeships, job shadowing, and other work experiences
399 200 220
Strategic Priority Area: Neighborhood Development (Safe, Healthy, and Inclusive Communities)
Preserve and create attractive and environmentally sustainable neighborhoods
Percent of nuisance cases resolved within 30 days
91% 90% 90%
Preserve and increase affordable housing
Number of new affordable housing units funded
496 1,000 900
Number of units acquired and/or rehabilitated and restricted for low to moderate income residents
221 165 265
Number of down payment assistance loans provided
307 325 325
Foster neighborhood driven revitalization and improvement
Number of active Keep Charlotte Beautiful Adopt-A-City Organizations engaged to assist with addressing neighborhood cleanliness throughout the city
249 250 350
100

Housing and Neighborhood Services
46 46
Performance Measure Highlights (continued)
FY 2018 FY 2019 FY 2020 Objective Measure Actual Target Target
Strategic Priority Area: Well-Managed Government (Efficient, Effective, Accountable, Responsive, Inclusive, and Customer Focused)
Provide services that efficiently meet the needs of 311 call center customers
Percent of 311 calls answered within 30 seconds
74% 70% 70%
Percent of all calls abandoned by the caller
4% ≤5% ≤5%
Percent of CharMeck 311 customers surveyed that are satisfied with the service
New measure ≥85% ≥85%
Implement on-line chat capability
New measure Research the best tools to employ for chat capability
Fully implement on-line chat capability
101

Housing and Neighborhood Services
47 47
Full-Time Equivalent (FTE) Position Summary
Position Title FY 2019 FTE Change in FTE FY 2020 FTE
311 Contact Center Program Administrator 3.00 - 3.00 311 Contact Center Representative 39.00 2.00 41.00 311 Contact Center Representative Lead 7.00 -2.00 5.00 311 Contact Center Representative Senior 25.75 -2.00 23.75 311 Contact Center Supervisor 7.00 - 7.00 311 Contact Center Program Analyst 7.00 2.00 9.00 311 Program Manager 3.00 - 3.00 Administrative Officer I 4.00 - 4.00 Administrative Officer II 4.00 -1.00 3.00 Administrative Officer III 6.00 - 6.00 Administrative Officer IV 1.00 - 1.00 Administrative Officer V 3.00 - 3.00 Assistant Neighborhood Business Services Director 4.00 1.00 5.00
Business Systems Specialist Intermediate 2.00 - 2.00 Business Systems Specialist Lead 1.00 - 1.00 Business System Specialist Senior 1.00 - 1.00 Business Systems Program Manager 1.00 - 1.00 Code Enforcement Coordinator 3.00 - 3.00 Code Enforcement Inspector 33.00 - 33.00Code Enforcement Inspector Lead 11.00 - 11.00Code Process Specialist 1.00 - 1.00 Community Relations Manager 1.00 - 1.00 Community & Commerce Specialist 12.00 1.00 13.00 Content Webmaster 1.00 - 1.00 Customer/Revenue Service Specialist 5.00 - 5.00 Deputy Neighborhood Business Services Director 1.00 - 1.00
Division Training Specialist 2.00 -1.00 1.00 Economic Development Program Manager 4.00 1.00 5.00 Economic Development Specialist 1.00 - 1.00 Operations Manager Senior 1.00 - 1.00 Housing Services Supervisor 1.00 - 1.00 Management Analyst 1.00 - 1.00 Area Supervisor 10.00 - 10.00Operations Manager 1.00 - 1.00
102

Housing and Neighborhood Services
48 48
Full-Time Equivalent (FTE) Position Summary (continued)
Position Title FY 2019 FTE Change in FTE FY 2020 FTE Program Coordinator 3.00 - 3.00 Services Division Manager 3.00 - 3.00 Neighborhood Development Specialist 3.00 - 3.00 Office Assistant IV 10.00 - 10.00Office Assistant V 4.00 - 4.00 Public Information Specialist Senior 1.00 - 1.00 Public Service Coordinator 1.00 - 1.00 Training Specialist 3.00 - 3.00
Department Total FTE 235.75 1.00 236.75
103

Human Resources
1 1
Human Resources Leadership
Human Resources Administrative Management
Organizational Development and Learning
Human Reources Information Systems and
Payroll
Talent Aquisition and Managment
Human Resources Department Managers
Mission Statement
Create engaging employee experiences that attract and retain qualified, productive, and motivated employees to
provide efficient and effective services to citizens.
Department Overview
Support the organization by managing change, designing and implementing organizational development
efforts, fostering a positive and inclusive work environment, and recruiting/retaining a skilled and diverse
workforce
Lead the workforce development programs to provide pre-apprenticeship, and internship opportunities to
the community
Provide a comprehensive portfolio of compensation, benefits, and retiree benefits to attract applicants and
support employees throughout their career lifestyle
Provide a dynamic learning and education environment that aligns with the city’s vision and values
Develop, deploy, and ensure compliance with Human Resources-related city policies and practices and all applicable laws
Manage the integrated Human Resource and Payroll system to include generating payroll and maintaining
employee and applicant records
Organizational Chart
Budget Overview Percent Change
FY 2017 FY 2018 FY 2019 FY 2020 FY 2019 Actual Actual Adopted Proposed FY 2020
Revenues
Other $4,000 $5,000 $0 $0 0.0 %
Total Revenues $4,000 $5,000 $0 $0 0.0 %
Expenditures
Personnel Services $3,657,280 $4,110,983 $5,287,202 $5,506,683 4.2 %
Operating Expenses $1,092,853 $1,351,912 $1,332,508 $954,989 -28.3 %Departmental Charges -$118,226 -$184,195 -$1,027,594 -$935,400 -9.0 %Total Expenditures $4,631,907 $5,278,700 $5,592,116 $5,526,272 -1.2 %
Net Expenditures $4,627,907 $5,273,700 $5,592,116 $5,526,272 -1.2 %
104

Human Resources
50 50
FY 2020 Funding Adjustments
Budget Action FTE Amount Provide funds for a citywide compensation increase - $95,862
Support compensation increase for employees in FY 2020 which includes: a three percent merit increase pool for salaried employees; a 1.5 percent market increase and 1.5 percent merit increase pool for hourly employees; and a 1.5 percent market increase and step increase (2.5 to five percent) for eligible public safety pay plan employees. Additional funds are included in the non-department budget to ensure that all general employees with a positive performance review receive at least a one dollar per hour increase by the end of FY 2020.
Transfer Human Resources software contracts to Innovation and Technology - -$454,646Technical adjustment to transfer the management and administration of software contracts from Human Resources to Innovation and Technology. A corresponding entry can be found in Innovation and Technology.
Provide funds for operating support - $73,933Provide funds for existing and expanding human resources initiatives such as staff development, career fairs, and tuition reimbursement. This action also includes support for non-personnel costs such as printing and memberships.
Add an Administrative Officer V 1.00 $103,703 Provide funds for an Administrative Officer V. The position will assist in providing human resources functions to the Fire Department.
Eliminate funds for Organization Development Manager - -$159,171Eliminate funds for an Organizational Development Manager that assisted with citywide organizational goals.
Update personnel expenditures - $226,375Technical adjustment to update department costs for personnel services. The update includes the full annual cost of salary increases approved in FY 2019, an update to employer healthcare costs, and the impact of staffing changes that have occurred in FY 2019. These are routine actions that occur at the beginning of the budget cycle. This adjustments also includes additional funding for a position previously funded through a department charge-out.
105

Human Resources
51 51
FY 2020 Funding Adjustments
Budget Action FTE Amount Adjust employer contribution to the North Carolina Local Governmental Employees' Retirement System (NCLGERS) - $44,906
Adjust required employer retirement contribution based on the NCLGERS Board of Trustees January action to increase employer rates from 7.75 percent to 8.95 percent for general employees and 8.50 percent to 9.70 percent for law enforcement officers.
Update allocations for Internal Service Providers (ISPs) - $3,194Technical adjustment to update funds needed to support ISPs based on anticipated cost of services. ISPs provide services to other city departments, including: building maintenance; rent of land and buildings; telecommunication; insurance liabilities; insurance premiums; and risk administration.
Net Change 1.00 -$65,844
106

Human Resources
1 1
Performance Measure Highlights
FY 2018 FY 2019 FY 2020
Objective Measure Actual Target Target
Strategic Priority Area: Economic Development (Economy, Jobs, and Upward Mobility)
Support the city's economic development goals through the Apprenticeship Program
Increase the number of people in the apprenticeship program
New Measure 8 Increase by 25%
Strategic Priority Area: Well-Managed Government (Efficient, Effective, Accountable, Responsive, Inclusive, and Customer Focused)
Create an enhanced applicant experience through increased transparency and communication into the recruitment and selection process
Percent of responding applicants satisfied with applicant experience
New Measure New Measure 80%
Promote Employee Wellness Percent of eligible employees opting for medical insurance who are electing the wellness incentive premium
93% 65% 70%
Review administrative policies with the goal of breaking down barriers to employment through a focus on diversity, equity and inclusion
Number of policies reviewed with a Diversity, Equity & Inclusion lens
New Measure New Measure ≥ 3
107

Human Resources
53 53
Full-Time Equivalent (FTE) Positions Summary
Position Title FY 2019 FTE Change in FTE FY 2020 FTE
Accountant II 1.00 - 1.00 Administrative Officer I 4.00 1.00 5.00 Administrative Officer II 1.00 - 1.00 Administrative Officer III 1.00 - 1.00 Administrative Officer IV 2.00 - 2.00 Administrative Officer V 3.00 - 3.00 Business Systems Specialist Intermediate 2.00 - 2.00 Deputy Human Resources Director 1.00 - 1.00 Human Resources Program Manager 5.00 1.00 6.00 Human Resources Analyst 19.00 -1.00 18.00 Human Resources Analyst Associate 1.00 1.00 2.00 Human Resources Director 1.00 - 1.00 Office Assistant IV 1.00 -1.00 0.00 Office Assistant V 1.00 - 1.00 Payroll Manager 1.00 - 1.00 Payroll Specialist 2.00 - 2.00
Department Total FTE 46.00 1.00 47.00
108

Innovation and
Technology
1 1
Office of the Director
Technology Services
Technology Business Services
Cyber Security
Enterprise Archetecture
Enterprise Applications
Data and Analytics
Project Management
Mission Statement To innovate, deliver, and secure technologies that empower Charlotte. Charlotte is a World-Class Digital City - Innovation and Technology is an essential part.
Department Overview
Enable access and use of civic data to empower our community
Secure and protect citywide data and technology from evolving threats
Deliver efficient, high-quality, solutions and services
Lead the technology conversation by aligning plans and designs for long-term success
Organizational Chart
Budget Overview Percent Change
FY 2017 FY 2018 FY 2019 FY 2020 FY 2019 Actual Actual Adopted Proposed FY 2020
Revenues
Radio Service Fees $3,591,107 $3,723,110 $3,772,289 $3,606,311 -4.4 %
Total Revenues $3,591,107 $3,723,110 $3,772,289 $3,606,311 -4.4 %
Expenditures
Personnel Services $14,282,954 $15,228,606 $17,439,289 $18,166,339 4.2 %Operating Expenses $18,295,721 $19,965,146 $19,456,878 $20,541,446 5.6 %Departmental Charges -$6,467,086 -$6,451,713 -$7,758,570 -$5,552,873 -28.4 %Total Expenditures $26,111,589 $28,742,039 $29,137,597 $33,154,912 13.8 %
Net Expenditures $22,520,482 $25,018,929 $25,365,308 $29,548,601 16.5 %
109

Innovation and Technology
55 55
FY 2020 Adjustments
Budget Action FTE Amount
Provide funds for a citywide compensation increase - $220,527Support compensation increase for employees in FY 2020 which includes: a three percent merit increase pool for salaried employees; a 1.5 percent market increase and 1.5 percent merit increase pool for hourly employees; and a 1.5 percent market increase and step increase (2.5 to five percent) for eligible public safety pay plan employees. Additional funds are included in the non-department budget to ensure that all general employees with a positive performance review receive at least a one dollar per hour increase by the end of FY 2020.
Support Blue Line Extension network monitoring 1.00 - Provide support for transit's growing transportation network technology requirements, notable the Blue Line Extension that began operations in 2018. The adjustment provides $111,567 in costs that will be reimbursed by CATS through a department chargeout, resulting in no net impact to the expenditure budget. A corresponding adjustment is included in the CATS budget.
Add Software licensing for new recruitment software - $95,000Provide maintenance and support for JobApps recruiting software. The system allows for citywide coordinated enhanced tracking and engagement with applicants.
Increase funds for Help Desk contract and other software licensing - $159,400Technical adjustment to increase funds for the city's Help Desk contract and other software licensing based on historical and anticipated utilization.
Support regional public safety radio network - $169,450Provide funds to support regional public safety radio network that is managed by Innovation and Technology. Changing technology standards require additional funds for contractual services to support the network. A portion of costs are reimbursed by regional partners.
Support Peoplesoft and Telephone systems - $144,863Provide funds to support Oracle Peoplesoft personnel system. The increased funds are based on utilization of temporary and contractual support for maintenance costs.
110

Innovation and Technology
56 56
FY 2020 Adjustments (continued)
Budget Action FTE Amount
Realign personnel and related expenses to improve data analytics and data management 2.00 $286,024
Executive adjustment to realign the Office of Data and Analytics to Innovation and Technology to improve data analytics and citywide data management. There is a corresponding entry in General Services for this adjustment.
Transfer Human Resources software contracts to Innovation and Technology - $454,646Technical adjustment to transfer the management and administration of software contracts from Human Resources to Innovation and Technology. A corresponding entry can be found in Innovation and Technology.
Reconcile funds for Information Technology financial management tool - $148,500Reconcile funds for Innovqation and Technology financial and technology tool software purchased in FY 2019. The software builds upon current business practices and allows technology managers to more accurately assess and plan costs associated with providing service.
Correct allocation for department charge out - $132,071Technical adjustment to correct a department changeout that was erroneously included during a previous budget cycle.
Transition telecommunication services to the city's Cost Allocation Plan - $2,153,925Transition the reimbursement model of department telecommunication costs to the city's cost allocation plan. This action results in an increase in expenditure costs that will be primarily offset by an increase in revenue to the General Fund from Enterprise Funds and a reduction in Internal Service Provider costs in the General Fund. This action is an accounting change that will not impact service.
Update personnel expenditures - -$38,799Technical adjustment to update department costs for personnel services. The update includes the full annual cost of salary increases approved in FY 2019, an update to employer healthcare costs, and the impact of staffing changes that have occurred in FY 2019. These are routine actions that occur at the beginning of the budget cycle.
111

Innovation and Technology
57 57
FY 2020 Adjustments (continued)
Budget Action FTE Amount
Adjust employer contribution to the North Carolina Local Governmental Employees' Retirement System (NCLGERS) - $160,000
Technical adjustment for the required employer retirement contribution based on required employer retirement contribution based on the NCLGERS Board of Trustees January action to increase employer rates from 7.75 percent to 8.95 percent for general employees and 8.50 percent to 9.70 percent for law enforcement officers.
Update allocations for Internal Service Providers (ISPs) - -$68,290Technical adjustment to update funds needed to support ISPs based on anticipated cost of services. ISPs provide services to other city departments, including: building maintenance; rent of land and buildings; telecommunication; insurance liabilities; insurance premiums; and risk administration.
Net Change 3.00 $4,017,317
112

Innovation and Technology
58 58
Performance Measure Highlights
FY 2018 FY 2019 FY 2020 Objective Measure Actual Target Target
Strategic Priority Area: Well-Managed Government (Efficient, Effective, Accountable, Responsive, Inclusive, and Customer Focused)
Educate customers, promote transparency, and enhance accountability to customers
Develop and implement service agreements for each department
New Measure New Measure Complete all departments by June 30, 2020
Improve effectiveness and efficiency though Organizational IT Alignment
Complete and publish data sharing standards
New Measure New Measure Complete by end of Q2, FY 2020
Identify city-wide technology processes critical for IT re-alignment
New Measure New Measure Implement at least 4
streamlined processes by end of Q4, FY 2020
Secure the city Launch a ‘Secure your Systems’ marketing campaign to educate and test employees on common security techniques by end of Q4.
New Measure New Measure Complete by end of Q4 FY 2020
Operational excellence Implement common App Delivery Models for critical enterprise applications
New Measure New Measure Complete HR product delivery model rollout by end of Q2, FY
2020
113

Innovation and Technology
59 59
Full-Time Equivalent (FTE) Position Summary
Position Title FY 2019 FTE Change in FTE FY 2020 FTE Accountant IV 1.00 - 1.00 Active Directory Administrator 1.00 1.00 2.00 Active Directory Specialist 1.00 - 1.00 Administrative Officer I 3.00 - 3.00 Administrative Officer II 1.00 - 1.00 Administrative Officer IV 1.00 - 1.00 Administrative Officer V 1.00 - 1.00 Administrative Services Manager 1.00 - 1.00 Application Development Manager 3.00 - 3.00 Application Services Manager 2.00 - 2.00 Business Systems Specialist Lead 6.00 - 6.00 Business Systems Manager 1.00 - 1.00 Chief Information Officer 1.00 - 1.00 Contracts Admin Specialist 1.00 - 1.00 Project Management Office Manager 1.00 - 1.00 Data Analytics Manager - 1.00 1.00 Data Analytics Specialist Lead - 1.00 1.00 Data Center Services Manager 1.00 - 1.00 Data Center Specialist 1.00 - 1.00 Data Services Manager 2.00 - 2.00 Data Storage Administrator 1.00 - 1.00 Data Warehouse Analyst 1.00 -1.00 - Database Administrator 2.00 - 2.00 Database Administrator Senior 4.00 - 4.00 Deputy Chief Information Officer 1.00 - 1.00 Electronics Technician II 9.00 - 9.00 Equipment Parts Manager 1.00 - 1.00 Information Security Administrator 4.00 1.00 5.00 Information Security Analyst 1.00 - 1.00 Information Security Officer 1.00 - 1.00 Information Security Supervisor 2.00 - 2.00 Information Tech Administrator 20.00 2.00 22.00 Information Tech Supervisor 3.00 - 3.00
114

Innovation and Technology
60 60
Full-Time Equivalent (FTE) Position Summary (continued)
Position Title FY 2019 FTE Change in FTE FY 2020 FTE Information Tech Team Lead 1.00 - 1.00 IT Business Process Manager 1.00 -1.00 - IT Business Relationship Manager 1.00 -1.00 - IT Client Services Manager 1.00 - 1.00 IT Client Support Manager 3.00 - 3.00 IT Communications Technician 1.00 - 1.00 IT Communicatons Svc Manager 1.00 - 1.00 IT Enterprise Architect 1.00 - 1.00 IT Process Manager 2.00 - 2.00 IT Project Manager 3.00 - 3.00 IT Project Manager Senior 4.00 - 4.00 IT Services Portfolio Manager 1.00 1.00 2.00 Management Analyst 1.00 - 1.00 Middleware Specialist 1.00 - 1.00 Network Architect Senior 3.00 - 3.00 Network Communications Integrator Associate 5.00 -1.00 4.00 Network Communications Integrator 11.00 2.00 13.00 Network Operations Supervisor 2.00 - 2.00 Network Communications Integrator Senior 2.00 - 2.00 Senior Tech Service Specialist 3.00 - 3.00 Server Administrator 4.00 - 4.00 Sharepoint Administrator 2.00 - 2.00 Software Developer Intermediate 2.00 -1.00 1.00 Software Developer Senior 4.00 -1.00 3.00 Technical Systems Specialist 2.00 - 2.00 Technology Services Officer 2.00 - 2.00 Training Specialist 1.00 - 1.00 Wireless Communications Manager 1.00 - 1.00
Department Total FTE 145.00 3.00 148.00
115

Internal Audit
1 1
Office of the Director
Performance Audits
Procedure Audits
Investigations
Mission Statement To provide reasonable assurance the city has an operating and effective system of internal controls.
Department Overview
Conduct independent reviews of the city’s system of internal controls
Assist management in evaluating the effectiveness of operations
Provide audit assistance for special projects
Provide recommendations for improvement in key control areas
Organizational Chart
Budget Overview Percent Change
FY 2017 FY 2018 FY 2019 FY 2020 FY 2019 Actual Actual Adopted Proposed FY 2020
Expenditures
Personnel Services $978,173 $1,046,204 $1,164,232 $1,297,816 11.5 %
Operating Expenses $382,214 $229,959 $121,017 $125,628 3.8 %
Total Expenditures $1,360,387 $1,276,163 $1,285,249 $1,423,444 10.8 %
116

Internal Audit
62 62
FY 2020 Adjustments
Budget Action FTE Amount
Provide funds for a citywide compensation increase - $19,485
Support compensation increase for employees in FY 2020 which includes: a three percent merit increase pool for salaried employees; a 1.5 percent market increase and 1.5 percent merit increase pool for hourly employees; and a 1.5 percent market increase and step increase (2.5 to five percent) for eligible public safety pay plan employees. Additional funds are included in the non-department budget to ensure that all general employees with a positive performance review receive at least a one dollar per hour increase by the end of FY 2020.
Add Senior Auditor position and contractual funds 1.00 $108,542 Provide funds for a Senior Auditor and contractual support to expand the service level of the department. Among other responsibilities, the funds will enhance review of technology and construction contracts.
Enhance Hotline Program - $12,728Provide funds to facilitate the Hotline Program's transition to a web-based platform. The Hotline Program allows employees to anonymously report issues of abuse or fraud. Support will also allow Internal Audit to effectively communicate these changes to all city employees, to increase the effectiveness of the program.
Update personnel expenditures - $30,000Technical adjustment to update department costs for personnel services. The update includes the full annual cost of salary increases approved in FY 2019, an update to employer healthcare costs, and the impact of staffing changes that have occurred in FY 2019. These are routine actions that occur at the beginning of the budget cycle.
Adjust employer contribution to the North Carolina Local Governmental Employees' Retirement System (NCLGERS) - $10,557
Technical adjustment for the required employer retirement contribution based on the NCLGERS Board of Trustees January action to increase employer rates from 7.75 percent to 8.95 percent for general employees and 8.50 percent to 9.70 percent for law enforcement officers.
117

Internal Audit
63 63
FY 2020 Adjustments (continued)
Budget Action FTE Amount
Update allocations for Internal Service Providers (ISPs) - -$43,117Technical adjustment to update funds needed to support ISPs based on anticipated cost of services. ISPs provide services to other city departments, including: building maintenance, rent of land and buildings, telecommunication, insurance liabilities, insurance premiums, and risk administration.
Net Change 1.00 $138,195
Performance Measure Highlights
FY 2018 FY 2019 FY 2020 Objective Measure Actual Target Target
Strategic Priority Area: Well-Managed Government (Efficient, Effective, Accountable, Responsive, Inclusive, and Customer Focused)
Deliver competitive audit services to facilitate a well-managed government
Number of audits issued 16 12 15
Full-Time Equivalent (FTE) Position Summary
Position Title FY 2019 FTE Change in FTE FY 2020 FTE
Deputy Internal Audit Manager 1.00 - 1.00 Internal Audit Manager 1.00 - 1.00 Internal Audit Supervisor 1.00 - 1.00 Internal Audit Supervisor IT 1.00 - 1.00 Internal Auditor 2.00 - 2.00 Internal Auditor Senior 4.00 1.00 5.00 Department Total FTE 10.00 1.00 11.00
118

Mayor and City Council
64 64
Mission Statement Set policies that ensure the delivery of quality public services and to promote the safety, health and quality of life of the city’s residents.
Department Overview
Appoint the City Manager, City Attorney, City Clerk and various members to Board and Commissions Adopt ordinances, resolutions, and orders Adopt the annual budget, which sets the tax rate and approve the financing of city operations
Budget Overview
FY 2017 FY 2018 FY 2019 FY 2020 Percent Change
Actual Actual Adopted Proposed FY 2019
Expenditures FY 2020
Personal Services $1,308,184 $541,452 $556,633 $569,203 2.2 % Operating Expenses $249,799 $212,683 $185,736 $178,065 -4.3 %Total Expenditures $1,557,983 $754,135 $742,369 $747,268 0.7 %
FY 2020 Adjustments
Budget Action FTE Amount
Provide funds for a citywide compensation increase - $7,828Support compensation increase for employees in FY 2020 which includes: a three percent increase for salaried employees.
Update personnel expenditures - $4,742Technical adjustment to update department costs for personnel services. The update includes the full annual cost of salary increases approved in FY 2019, an update to employer healthcare costs, and the impact of staffing changes that have occurred in FY 2019. These are routine actions that occur at the beginning of the budget cycle.
Update allocations for Internal Service Providers (ISPs) - -$7,671Technical adjustment to update funds needed to support ISPs based on anticipated cost of services. ISPs provide services to other city departments, including: building maintenance, rent of land and buildings, telecommunication, insurance liabilities, insurance premiums, and risk administration.
Net Change - $4,899
119

Mayor and City Council
65 65
Full-Time Equivalent (FTE) Position Summary
Position Title FY 2019 FTE Change in FTE FY 2020 FTE
Council Member 11.00 - 11.00Mayor 1.00 - 1.00
Department Total FTE 12.00 - 12.00
120

Planning, Design,
& Development
1 1
Office of the Director
Business & Executive Services
Land Development
Long Range & Strategic
Planning
Entitlement Services
Regional Transportation
Planning
Urban Design Center
Mission Statement To provide integrated planning services, create great places for our community, collaborate with community partners,
guide growth with innovative and creative solutions, sustain our natural environment and community character, and
design vibrant and inclusive places.
Department Overview
Provides planning services and regulatory services in support of the city’s priorities to advance affordable
housing and economic development initiatives
Provides a comprehensive array of long-range planning, development, and strategic planning services to
improve the quality of life in Charlotte, particularly focusing on facilitating more equitable development and
enhancing access to opportunities for all Develops plans and policies with the community to enhance livability, strengthen economic competitiveness,
improve economic mobility, and provide transportation options
Provides urban design and strategic planning functions to facilitate high quality development
Organizational Chart
Budget Overview
Percent Change
FY 2017 FY 2018 FY 2019 FY 2020 FY 2019 Actual Actual Adopted Proposed FY 2020
Revenues
Licenses, Fees, and Fines $587,600 $1,641,885 $1,777,081 $2,531,040 42.4 %
Charges for Current Services $470,774 $545,511 $543,675 $4,301,237 691.1 %
Total Revenues $1,058,374 $2,187,396 $2,320,756 $6,832,277 * 194.4 %
Expenditures
Personnel Services $5,415,325 $6,540,884 $9,932,328 $10,859,300 9.3 %
Operating Expenses $1,136,185 $1,146,158 $1,431,296 $2,530,148 76.8 %
Department Charges -$754,292 -$719,729 -$1,145,911 -$2,576,361 124.8 %
Total Expenditures $5,797,218 $6,967,312 $10,217,713 $10,813,087 5.8 %
Net Expenditures $4,738,844 $4,779,916 $7,896,957 $3,980,810 -49.6 %
*Total revenues reflect services transferred from General Services to Land Development's One Stop Shop. The revenues in General Services have been adjusted.
121

Planning, Design,
& Development
2 2
FY 2020 Adjustments
Budget Action FTE Amount
Provide funds for a citywide compensation increase - $140,800Support compensation increase for employees in FY 2020 which includes: a three percent merit increase pool for salaried employees; a 1.5 percent market increase and 1.5 percent merit increase pool for hourly employees; and a 1.5 percent market increase and step increase (2.5 to five percent) for eligible public safety pay plan employees. Additional funds are included in the non-department budget to ensure that all general employees with a positive performance review receive at least a one dollar per hour increase by the end of FY 2020.
Provide funds for Administrative Officer I Position 1.00 $54,812
Increase administrative support services to Land Development. The position will serve as enhancement to the customer service experience of the One-Stop Shop and support for development activities.
Provide funds for four Associate Planners 4.00 $261,973
Add four Associate Planner positions in Land Development's One Stop Shop. The Associate Planner positions will support the preliminary and enhanced review processes, manage plat reviews and rezoning petitions, and support customer inquiries. Two of the positions will be funded with User Fees.
Provide funds for two Principal Planners 2.00 $82,581
Add two Senior Principal Planner positions in Land Development's One Stop Shop and Regional Transportation Planning. These positions will provide support to the Unified Development Ordinance and Charlotte Regional Transportation Planning Organization (CRTPO) Grant. The Regional Transportation's Principal Planner will be fully funded by the CRTPO Grant.
Provide funds for two Senior Principal Planners 2.00 $179,400
Add two Senior Principal Planner positions in Land Development's One Stop Shop. The Senior Principal Planners will review and manage rezoning petitions and provide technical support to the Zoning Committee. These positions will be fully funded with User Fees.
Provide funds for an Urban Forestry Specialist 1.00 $60,846
Add an Urban Forestry Specialist in Land Development's One Stop Shop. The Urban Forestry Specialist will review and evaluate development plans for tree planting and preservation, conduct site inspections, and provide forestry enforcement and education programming. This position will be fully funded with User Fees.
122

Planning, Design,
& Development
3 3
FY 2020 Adjustments (continued)
Budget Action FTE Amount
Provide funds for technical adjustment for contractual increases - $74,335Provide funds to support contractual increases related to departmental software and contracts.
Transfer Comprehensive Plan funding from Operating - -$300,000Transfer funds for Comprehensive Plan implementation to the Pay-As-You-Go Fund. This adjustment will allow the department to use the funding source over multiple fiscal years. No impact to service is anticipated from this action.
Update personnel expenditures - -$19,536Technical adjustment to update department costs for personnel services. The update includes the full annual cost of salary increases approved in FY 2019, an update to employer healthcare costs, and the impact of staffing changes that have occurred in FY 2019. These are routine actions that occur at the beginning of the budget cycle. The update also includes funds for an Administrative Officer V that was added in FY 2019.
Adjust employer contribution to the North Carolina Local Governmental Employees' Retirement System (NCLGERS)
- $88,012
Technical adjustment for the required employer contribution based on the NCLGERS Board of Trustees January action to increase employer rates from 7.75 percent to 8.95 percent for general employees and 8.50 percent to 9.70 percent for law enforcement officers.
Update allocations for Internal Service Providers (ISPs) - -$27,849Technical adjustment to update funds needed to support ISPs based on anticipated cost of services. ISPs provide services to other city departments, including: building maintenance; rent of land and buildings; telecommunication; insurance liabilities; insurance premiums; and risk administration.
Net Change 10.00 $595,374
123

Planning, Design,
& Development
4 4
Performance Measure Highlights
FY 2018 FY 2019 FY 2020
Objective Measure Actual Target Target
Economic Development (Economy, Jobs and Upward Mobility)
Partner with our customers to approve development plans in an efficient and collaborative manner that helps build a safe and thriving community
Percent Land Development Reviews and Inspections completed by targeted timeframe within compliance
New Measure 95% 95%
Strategic Priority Area: Neighborhood Development (Safe, Healthy, and Inclusive Communities)
Charlotte Placemaking Program
Percent completion of Neighborhood Matching Grant and Placemaking Projects
New Measure 50% by 4th Quarter
100% by 2nd Quarter
Strategic Priority Area: Transportation and Planning (Mobility, Accessibility, and Connectivity)
Charlotte Future 2040 Comprehensive Plan & UDO Support
Engagement Plan and Phases 1 and 2 Strategies. Work in FY 2020 will focus on refining Place Types, developing growth scenarios, selecting a preferred growth scenario, developing the plan policies and recommendations, developing the plan outline & framework, and developing and drafting the plan
New Measure 100 % by 4th
Quarter
Plan and Policy Implementation
Percent completion of 2020-2029 Transportation Improvement Program
New Measure 75% by 4thQuarter
100% by 2nd Quarter
Strategic Priority Area: Well-Managed Government (Efficient, Effective, Accountable, Responsive, Inclusive, and Customer Focused)
Full implementation of One-Stop Shop for development reviews
Percent completion of Consolidation of One-Stop Shop
New Measure 80% by 4thQuarter
100% by 2nd
Quarter
124

Planning, Design,
& Development
5 5
Full-Time Equivalent (FTE) Position Summary
Position Title FY 2019 FTE Change in FTE FY 2020 FTE
Administrative Officer I 3.00 1.00 4.00
Administrative Officer II 2.00 - 2.00
Administrative Officer III 2.00 - 2.00
Administrative Officer IV 1.00 -1.00 - Administrative Officer V - 1.00 1.00
Administrative Services Manager - 1.00 1.00
Assistant Planner 1.00 - 1.00
Assistant Planning Director 5.00 - 5.00
Associate Planner 5.00 5.00 10.00
Business Systems Specialist Intermediate 1.00 - 1.00
Business System Specialist Senior 1.00 - 1.00
Code Enforcement Inspector 4.00 - 4.00
Code Enforcement Inspector Lead 2.00 - 2.00
Code Process Specialist 3.00 -1.00 2.00
Construction Inspector 4.00 - 4.00
Construction Inspector Senior 1.00 - 1.00
Construction Supervisor 1.00 - 1.00
Deputy Planning Director 1.00 - 1.00
Engineering Services Investigator 2.00 - 2.00
Engineering Services Supervisor 1.00 - 1.00
Area Supervisor 1.00 - 1.00
Office Assistant V 1.00 - 1.00
Plan Review Engineer 1.00 - 1.00
Planning Coordinator 11.00 -1.00 10.00
Planning Director 1.00 - 1.00
Planning Program Manager 7.00 3.00 10.00
Plans Reviewer 3.00 -1.00 2.00
Principal Planner 13.00 2.00 15.00
Public Information Specialist 1.00 -1.00 - Senior Planning Coordinator 5.00 -1.00 4.00
Senior Principal Planner 6.00 3.00 9.00
Urban Forestry Specialist 6.00 - 6.00
Urban Forestry Supervisor 1.00 1.00 2.00
Department Total FTE 97.00 11.00 108.00
125

Police
11
Mission StatementThe Charlotte-Mecklenburg Police Department builds problem-solving partnerships with residents to prevent the next crime and enhance the quality of life throughout the community, while treating people with fairness and respect.
Department Overview
Strengthen vulnerable communities by providing internal and external stakeholders knowledge and identification of crime prevention strategies that address causes of crime and quality of life concernsCreate an environment where police and communities work together to reduce crimeTimely and transparent exchange of information with victims and/or families
Organizational Chart
Budget Overview Percent Change
FY 2017 FY 2018 FY 2019 FY 2020 FY 2019Actual Actual Adopted Proposed FY 2020
RevenuesLaw Enforcement Services $21,663,160 $23,568,666 $20,199,514 $21,959,646 8.7 %Interfund Police Charges $6,903,765 $7,469,657 $8,530,919 $9,713,092 13.9 %Licenses, Fees, and Fines $1,838,065 $1,891,557 $1,796,476 $1,893,760 5.4 %Convention Center Traffic $0 $1,250,000 $250,000 $250,000 0.0 %Charges for Services $129,497 $144,339 $135,000 $142,500 5.6 %Other $311,321 $199,865 $76,500 $140,000 83.0 %Total Revenues $30,845,808 $34,524,083 $30,988,409 $34,098,998 10.0 %
ExpendituresPersonnel Services $213,962,342 $218,255,888 $232,385,687 $244,037,288 5.0 %Operating Expenses $36,358,263 $39,903,818 $42,668,075 $41,802,397 -2.0 %Capital Outlay $99,185 $2,444,142 $64,292 $37,900 -41.1 %Departmental Charges ($344,064) ($1,096,909) ($2,426,898) ($811,326) -66.6 %Total Expenditures $250,075,726 $259,506,939 $272,691,156 $285,066,260 4.5 %Net Expenditures $219,229,918 $224,982,856 $241,702,747 $250,967,261 3.8 %
Office of the Chief
Operations
Patrol Services
Special Services
Investigative Services
Support
Administrative Services
Support Services
126

Police
1 1
FY 2020 Adjustments
Budget Action FTE Amount
Provide funds for a citywide compensation increase - $4,736,332
Support compensation increase for employees in FY 2020 which includes: a three percent merit increase pool for salaried employees; a 1.5 percent market increase and 1.5 percent merit increase pool for hourly employees; and a 1.5 percent market increase and step increase (2.5 to five percent) for eligible public safety pay plan employees. Additional funds are included in the non-department budget to ensure that all general employees with a positive performance review receive at least a one dollar per hour increase by the end of FY 2020.
Provide funds for enhanced compensation and Police pay structure changes - $1,879,200Support additional pay actions in the Public Safety Pay Plan beyond a typical salary increase. Proposed FY 2020 actions include: an additional five percent salary increase for all Police Sergeants; a consolidation of Police Officer steps 7/8 and 9/10 to reduce the number of years it takes to achieve top pay; and adjusting all Police Officers in step 8 and above to a July merit date in order to reduce pay structure inequities.
Implement Senior Police Officer Program - $2,300,000Provide funds to implement Senior Police Officer Program that was approved in FY 2019. Beginning in July 2019, Police Officers who pass program requirements and who have been in the top Police Officer step for at least one year will receive a five percent salary increase.
Support Separation Allowance for Law Enforcement Officers - $1,724,940Technical adjustment to provide additional funds for the state mandated separation allowance for law enforcement officers from retirement until age 62.
Support body worn camera program - $229,165Provide three months of funding in FY 2020 to support continuation of a body worn camera contract that will expire in the spring of FY 2020. The previous contract was supported using nongeneral funds. This action will result in continuity of service.
Transfer and annualize costs of retiree health investment account program - $743,440Technical adjustment to transfer and annualize costs of the retiree health investment account program for sworn public safety employees. Funding for six months was included in the non-departmental budget in FY 2019. The program provides $1,040 annually to all sworn public safety employees hired on or after July 1, 2009 to assist with healthcare costs in retirement.
127

Police
2 2
FY 2020 Adjustments (continued)
Budget Action FTE Amount
Align personnel costs in FY 2019 - -$1,500,000Align the department's personnel budget in FY 2019 to anticipated costs including attrition and overtime. Previously, savings were utilized for technology and equipment replacement. In FY 2020, funds are included in the Pay-As-You-Go operating for this purpose. This alignment will occur annually and will not impact the department's staffing activities or target.
Provide increase for rent and leases - $59,996Technical adjustment to support rent and lease increases at various police sites throughout the city. The increase includes funds for the Animal Care and Control Facility located at the airport, Hickory Grove Division, Independence Division, South Division, North Division, University City Division, the Police Aviation Hangar, and Impound Lot.
Support video management software - $45,020Technical adjustment to provide contractual increase for closed circuit camera video management software.
Remove one-time funds provided in FY 2019 for Police equipment - -$805,737Remove one-time funds provided in FY 2019 for Police vehicles and equipment. Funding is available in the Pay-As-You-Go Fund for one-time Police Technology.
Update personnel expenditures -6.00 $857,408
Technical adjustment to update department costs for personnel services. The update includes the full annual cost of salary increases approved in FY 2019, an update to employer healthcare costs, a technical correction related to Aviation police reimbursement, and the impact of staffing changes that have occurred in FY 2019. These are routine actions that occur at the beginning of the budget cycle. This update also converts six counselor positions to contracted services to ensure compliance with professional certification requirements and maintain a high level of service.
Adjust employer contribution to the North Carolina Local Governmental Employees' Retirement System (NCLGERS) - $1,948,115
Adjust required employer retirement contribution based on the NCLGERS Board of Trustees January action to increase employer rates from 7.75 percent to 8.95 percent for general employees and 8.50 percent to 9.70 percent for law enforcement officers.
128

Police
44
FY 2020 Adjustments (continued)
Budget Action FTE Amount
Update allocations for Internal Service Providers (ISPs) - $157,225Technical adjustment to update funds needed to support ISPs based on anticipated cost of services. ISPs provide services to other city departments, including: building maintenance; rent of land and buildings; telecommunication; insurance liabilities; insurance premiums; and risk administration.
Net Change -6.00 $12,375,104
Performance Measure Highlights
FY 2018 FY 2019 FY 2020Objective Measure Actual Target Target
Strategic Priority Area: Neighborhood Development (Safe, Healthy, and Inclusive Communities)
Reduce VictimizationPercent increase in number of illegal guns seized over previous fiscal year
4.4% ≥5% ≥5%
Percent clearance rate for homicide cases 62.0% ≥75% ≥75%
% reduction in UCR crime rates per 100,000 population 2.8% >3% >3%
Build Trust and Confidence with Community
Answer 90% of 911 calls within 10 seconds or less 94.6% 90% 90%
Strategic Priority Area: Well-Managed Government (Efficient, Effective, Accountable, Responsive, Inclusive, and Customer Focused)
Maintain a Diverse workforce Percent of applicant base will be minorities and females 64.7% 40% 40%
129

Police
1 1
Full-Time Equivalent (FTE) Position Summary
Law Enforcement Officers FY 2019 FTE Change in FTE FY 2020 FTE Police Chief 1.00 - 1.00 Deputy Police Chief 5.00 - 5.00 Police Major 14.00 - 14.00Police Captain 35.00 - 35.00Police Lieutenant 45.00 - 45.00Police Sergeant 157.00 - 157.00Police Officer 1,725.00 - 1,725.00
Sworn Total 1,982.00 - 1,982.00
General Employees FY 2019 FTE Change in FTE FY 2020 FTE
911 Program Analyst 2.00 - 2.00 Administrative Officer I 19.00 2.00 21.00 Administrative Officer II 12.00 - 12.00Administrative Officer III 6.00 - 6.00 Administrative Officer IV 6.00 - 6.00 Administrative Officer V 2.00 - 2.00 Administrative Secretary I 1.00 - 1.00 Administrative Services Mgr 1.00 - 1.00 Animal Control Bureau Mgr 1.00 - 1.00 Animal Control Officer 21.00 - 21.00Animal Control Officer-lead 11.00 - 11.00Animal Control Officer-senior 6.00 - 6.00 Animal Control Officer-Spvr 8.00 - 8.00 Animal Health Technician 5.00 - 5.00 Animal Shelter Manager 1.00 - 1.00 Animal Trainer 1.00 - 1.00 Assistant City Attorney II 2.00 1.00 3.00 Bus Systems Spec Intrm 8.00 - 8.00 Bus Systems Spec Lead 3.00 - 3.00 Business System Spec Sr 4.00 - 4.00 Business Systems Prog Mgr 1.00 - 1.00 Business Systems Supervisor 1.00 - 1.00 Chief Criminalist 3.00 - 3.00 Community Relations Mgr 2.00 - 2.00 Community Relations Spec 2.00 - 2.00 Content Webmaster 1.00 - 1.00 Contract Technician 1.00 - 1.00
130

Police
2 2
Full-Time Equivalent (FTE) Position Summary (continued)
General Employees FY 2019 FTE Change in FTE FY 2020 FTE
Contracts Admin Coordinator 1.00 - 1.00 Crime Lab Technician 1.00 - 1.00 Crime Laboratory Director 1.00 - 1.00 Crime Scene Technician 28.00 - 28.00Crime Scene Technician Sr 6.00 - 6.00 Criminalist DNA Analyst 4.00 - 4.00 Criminalist Drug Chemistry 3.00 - 3.00 Criminalist Firearms Toolmarks 1.00 - 1.00 Criminalist Serology 1.00 - 1.00 Criminalist Trainee 1.00 - 1.00 Customer/Revenue Serv. Assist 7.00 - 7.00 Data Analytics Manager 1.00 - 1.00 Data Analytics Specialist 9.00 - 9.00 Data Analytics Specialist Lead 3.00 - 3.00 Data Analytics Specialist Senior 2.00 - 2.00 Data Analytics Supervisor 1.00 - 1.00 Database Administrator 2.00 - 2.00 Deputy City Attorney 1.00 - 1.00 DNA Analysis Team Leader 2.00 - 2.00 Domestic Violence Counselor 10.00 -6.00 4.00 Engineering Business Services Manager 1.00 - 1.00 Fleet Specification Analyst 1.00 - 1.00 GIS Analyst 1.00 - 1.00 Information Technology Administrator 1.00 - 1.00 Information Technology Supervisor 1.00 - 1.00 IT Project Manager Associate 1.00 - 1.00 Kennel Attendant 9.00 - 9.00 Kennel Supervisor 2.00 - 2.00 Latent Fingerprint Examiner 3.00 - 3.00 Latent Fingerprint Supervisor 1.00 - 1.00 Management Analyst 5.00 - 5.00 Management Analyst Senior 2.00 - 2.00 N&bs Program Coordinator 2.00 - 2.00 Network Commun Integrator 1.00 - 1.00 Non-Emergency Police Services Manager 1.00 - 1.00 Office Assistant IV 12.00 - 12.00Office Assistant V 6.00 - 6.00
131

Police
3 3
Full-Time Equivalent (FTE) Position Summary (continued)
General Employees FY 2019 FTE Change in FTE FY 2020 FTE
Operations Supervisor 1.00 - 1.00 Paralegal 1.00 - 1.00 Police Aircraft Mechanic 1.00 - 1.00 Police Communications Services Supervisor 1.00 - 1.00 Police Customer Service Team Lead 5.00 - 5.00 Police Investigation Tech 46.00 -2.00 44.00 Police Property Control Supervisor 3.00 - 3.00 Police Property Control Technician 15.00 -1.00 14.00 Police Property Manager 1.00 - 1.00 Police Records Supervisor 1.00 - 1.00 Police Records Support Technician 5.00 - 5.00 Police Support Technician 16.00 - 16.00Police Telecommun Supervisor 14.00 - 14.00Police Telecommunicator 125.50 - 125.50Polygraph Examiner 1.00 - 1.00 Public Info Specialist Senior 2.00 - 2.00 Public Service Coordinator 1.00 - 1.00 Public Services Division Manager 1.00 - 1.00 Quality Assurance Analyst 1.00 - 1.00 Questioned Documents Specialst 1.00 - 1.00 Recreation Specialist 1.00 - 1.00 Safety Coordinator - 1.00 1.00 Senior Assistant City Attorney 3.00 -1.00 2.00 Software Developer Intermediate 3.00 - 3.00 Software Developer Senior 1.00 - 1.00 Senior Business Systems Manager 1.00 - 1.00 Technical Systems Specialist 3.00 - 3.00 Training Specialist 1.00 - 1.00 Veterinary Technician 1.00 - 1.00
Non-LEO Total FTE 522.50 -6.00 516.50
Department Total FTE 2,504.50 -6.00 2,498.50
132

Solid Waste Services
1 1
Office of the Director
Director's Office Administration Contracted
Services Technology Operations Collections
Operations Special Services
Mission Statement To protect the public health of the City of Charlotte by providing services, in partnership with the community, that deliver environmentally friendly collection programs that are safe, competitive, and efficient.
Department Overview
Deliver weekly curbside collection service city-wide for garbage, yard waste, and bulky waste Provide bi-weekly curbside collection of recyclables Collect garbage, recycling, and bulky waste for multi-family complexes weekly Collect small business garbage and refuse, and recycling collection from public receptacles Remove of litter and dead animals from city streets and rights-of-way Participate in neighborhood clean-ups and other specialized cleaning programs, including continual maintenance of the Central Business District and support of special events
Organizational Chart
Budget Overview Percent Change
FY 2017 FY 2018 FY 2019 FY 2020 FY 2019
Actual Actual Adopted Proposed FY 2020
Revenues
Intergovernmental-state $0 $0 $0 $595,000 100.0 %
Licenses, fees, fines $11,255,110 $13,471,389 $15,932,724 $20,310,000 27.5 %
Miscellaneous $138,409 $299,053 $258,000 $190,000 -26.4 %
Total Revenues $11,393,519 $13,770,442 $16,190,724 $21,095,000 30.3 %
Expenditures
Personnel Services $19,186,340 $20,767,275 $22,146,561 $23,608,432 6.6 %
Operating Expenses $34,697,079 $35,529,886 $39,134,324 $41,709,790 6.6 %
Capital Outlay $0 $79,388 $32,872 $0 -100.0 %
Departmental Charges -$606,608 -$873,905 -$1,638,481 -$1,639,757 0.1 %
Total Expenditures $53,276,811 $55,502,644 $59,675,276 $63,678,465 6.7 %
Net Expenditures $41,883,292 $41,732,202 $43,484,552 $42,583,465 -2.1 %
133

Solid Waste Services
2 2
FY 2020 Adjustments
Budget Action FTE Amount
Provide funds for a citywide compensation increase - $252,286
Support compensation increase for employees in FY 2020 which includes: a three percent merit increase pool for salaried employees; a 1.5 percent market increase and 1.5 percent merit increase pool for hourly employees; and a 1.5 percent market increase and step increase (2.5 to five percent) for eligible public safety pay plan employees.
Support additional compensation to general employees - $168,925
Provide additional funds to hourly employees beyond a typical three percent salary increase. The adjustment includes acceleration of the hourly employee market increase to December (from February), and funds to ensure that all general employees with an acceptable performance review will receive at least a $1/hour increase in FY 2020.
Support Circular Economy Initiative - $25,000
Support Circular Economy Initiative by providing funds for continued membership in the Ellen MacArthur Foundation. The foundation aims to re-think, re-design, and build a positive future through the Circular Economy.
Add Senior Sanitation Equipment Operators for two additional automation garbage collection trucks. 2.00 $148,085
Provide funds for two Senior Sanitation Equipment Operators for two new vehicles that will be purchased in FY 2020. The new crews are necessary due to the growth of the city. Purchase of the trucks ($625,000) are purchased by the Municipal Debt Service Fund and repaid over five years.
Reimburse employees for commercial driver's license costs - $4,800
Provide funds to reimburse employee costs for maintaining a commercial driver's license. This action aligns Solid Waste with other city departments.
Provide funds for maintenance - $211,713Reconcile maintenance costs for fleet based on recent and anticipated utilization.
Provide funds for tipping and contractual fee incerases - $2,418,636
Technical adjustment to provide funds for contractual increases in garbage and recycling, and to update needed funds for tipping fees on garbage and yard waste disposed at the landfill.
134

Solid Waste Services
3 3
FY 2020 Adjustments (continued)Budget Action FTE Amount
Update personnel expenditures - $755,854
Technical adjustment to update department costs for personnel services. The update includes the full annual cost of salary increases approved in FY 2019, an update to employer healthcare costs, and the impact of staffing changes that have occurred in FY 2019. These are routine actions that occur at the beginning of the budget cycle.
Adjust employer contribution to the North Carolina Local Governmental Employees' Retirement System (NCLGERS)
- $167,786
Technical adjustment for the required employer retirement contribution based on the NCLGERS Board of Trustees January action to increase employer rates from 7.75 percent to 8.95 percent for general employees and 8.50 percent to 9.70 percent for law enforcement officers.
Update allocations for Internal Service Providers (ISPs) - -$149,896Technical adjustment to update funds needed to support ISPs based on anticipated cost of services. ISPs provide services to other city departments, including: building maintenance; rent of land and buildings; telecommunication; insurance liabilities; insurance premiums; and risk administration.
Net Change 2.00 $4,003,189
135

Solid Waste Services
4 4
Performance Measure Highlights
FY 2018 FY 2019 FY 2020
Objective Measure Actual Target Target
Strategic Priority Area: Neighborhood Development (Safe, Healthy, and Inclusive Communities)
Reduce the number of pounds of residential waste sent to the landfill
Number of pounds of food waste diverted from landfill
New Measure New Measure 30,000 pounds food waste
diverted
Maintain a clean city for all residents
Annual Keep Charlotte Beautiful Litter Index Rating assessment
1.75 ≤2.0 ≤2.0
Prevent vehicular accidents and personal injuries
Average number of hours of monthly safety training
197 100 200
Reduce harmful greenhouse gas emissions
Number of alternative fuel vehicles
30 >30 Increase alternative fuel vehicles over
preceding year Strategic Priority Area: Well-Managed Government
(Efficient, Effective, Accountable, Responsive, Inclusive, and Customer Focused)
Maintain low-cost recycling collection
Curbside collection cost per ton recyclable materials
$142/ton < North Carolina statewide average
< North Carolina statewide average
Curbside collection cost per ton refuse
$90/ton < North Carolina statewide average
< North Carolina statewide average
Operate efficient weekly curbside refuse collection
Average number of curbside garbage cart collections per hour
134 ≥ 125 ≥125
136

Solid Waste Services
5 5
Full-Time Equivalent (FTE) Position Summary
Position Title FY 2019 FTE Change in FTE FY 2020 FTE Administrative Officer I 6.00 -2.00 4.00
Administrative Officer II 1.00 1.00 2.00
Administrative Officer III 6.00 - 6.00
Administrative Officer IV 2.00 - 2.00
Administrative Officer V 2.00 - 2.00
Business System Specialist Senior 2.00 - 2.00
Business Systems Manager 1.00 - 1.00
Community Programs Coordinator 1.00 - 1.00
Contract Technician 8.00 - 8.00
Contracts Admin Specialist - 1.00 1.00
Deputy Solid Waste Services Director 2.00 - 2.00
Equipment Operator III 15.00 - 15.00
Facilities/Property Supervisor 1.00 -1.00 -
Field Operations Supervisor 4.00 - 4.00
GIS Analyst - 1.00 1.00
GIS Supervisor 1.00 - 1.00
GIS Technician 1.00 - 1.00
Labor Crew Chief II 15.00 - 15.00
Laborer* 58.00 -58.00 -
Laborer Senior* 21.00 -21.00 -
Management Analyst 1.00 - 1.00
Management Analyst Senior 1.00 - 1.00
Office Assistant IV 2.00 - 2.00
Office Assistant V 4.00 - 4.00
Operations Supervisor 5.00 - 5.00
Public Information Specialist Senior 1.00 - 1.00
Public Service Coordinator 1.00 - 1.00
Safety Coordinator 1.00 -1.00 -
Sanitation Equip Operator Senior 68.00 2.00 70.00
Sanitation Equipment Operator 69.00 - 69.00
Sanitation Team Leader 5.00 - 5.00
Sanitation Technician* - 58.00 58.00
Sanitation Technician Senior* 7.00 21.00 28.00
Solid Waste Services Director 1.00 - 1.00
Storekeeper Senior 1.00 - 1.00
Training Specialist - 1.00 1.00
Department Total FTE 314.00 2.00 316.00
* 58 Laborers were retitled to Sanitation Technician and 21 Laborer Sr. were retitled to SanitationTechnician Sr.
137

Strategy and Budget
1 1
Office of the Director
Strategic Planning
Budget Policy and Analysis
Council Agenda
Production
Economic Forecasting
Mission Statement To prepare a balanced annual budget that prioritizes community and organizational needs while supporting the goals of the city, and to increase efficiencies of city services through research, policy analysis, and long-range planning strategies.
Department Overview
Develop and monitor the city’s current fiscal year budget to ensure a balanced budget at year-end Plan for the current and future needs of the city through the utilization of a long-range capital investment program Implement strategic initiatives and economic analysis that support operational efficiency and data-driven public service delivery Coordinate the Council Business Agenda Administer the organization’s performance management and strategic planning processes Develop and recommend changes/improvements to city policy
Organizational Chart
Budget Overview Percent Change
FY 2017 FY 2018 FY 2019 FY 2020 FY 2019 Actual Actual Adopted Proposed FY 2020
Expenditures Personnel Services $1,569,947 $1,864,134 $2,354,082 $2,238,026 -4.9 %Operating Expenses $231,561 $240,730 $203,057 $196,145 -3.4 %
Departmental Charges -$63,077 -$71,169 -$110,384 -$110,384 0.0 %
Total Expenditures $1,738,431 $2,033,695 $2,446,755 $2,323,787 -5.0 %
138

Strategy and Budget
2 2
FY 2020 Adjustments
Budget Action FTE Amount
Provide funds for a citywide compensation increase - $38,815
Support compensation increase for employees in FY 2020 which includes: a three percent merit increase pool for salaried employees; a 1.5 percent market increase and 1.5 percent merit increase pool for hourly employees; and a 1.5 percent market increase and step increase (2.5 to five percent) for eligible public safety pay plan employees. Additional funds are included in the non-department budget to ensure that all general employees with a positive performance review receive at least a one dollar per hour increase by the end of FY 2020.
Transfer leadership position to General Services -1.00 -$182,094
Transfer vacant Special Assistant to the City Manager position to the newly created department of General Services to create a General Services Director position. There is a corresponding entry in General Services.
Update personnel expenditures - $6,191
Technical adjustment to update department costs for personnel services. The update includes the full annual cost of salary increases approved in FY 2019, an update to employer healthcare costs, and the impact of staffing changes that have occurred in FY 2019. These are routine actions that occur at the beginning of the budget cycle.
Adjust employer contribution to the North Carolina Local Governmental Employees' Retirement System (NCLGERS)
- $21,032
Technical adjustment for the required employer retirement contribution based on the NCLGERS Board of Trustees January action to increase employer rates from 7.75 percent to 8.95 percent for general employees and 8.50 percent to 9.70 percent for law enforcement officers.
Update allocations for Internal Service Providers (ISPs) - -$6,912
Technical adjustment to update funds needed to support ISPs based on anticipated cost of services. ISPs provide services to other city departments, including: building maintenance, rent of land and buildings, telecommunication, insurance liabilities, insurance premiums, and risk administration.
Net Change -1.00 -$122,968
139

Strategy and Budget
3 3
Performance Measure Highlights
FY 2018 FY 2019 FY 2020
Objective Measure Actual Target Target Strategic Priority Area: Well-Managed Government
(Efficient, Effective, Accountable, Responsive, Inclusive, and Customer Focused)
Prepare high quality budget documents that follow best practices
GFOA Distinguished Budget award
Received Receive Receive
Number of days between end of financial quarter and quarterly budget report published
New Measure New Measure 30 days
Promote strong financial management
Percent of variance between forecasted and actual revenue received
New Measure New Measure ≤ 3%
Provide for sustainable delivery of services
Propose a structurally balanced budget in which ongoing revenues meet ongoing expenditures
Achieved Achieve Achieve
Full-Time Equivalent (FTE) Position Summary
Position Title FY 2019 FTE Change in FTE FY 2020 FTE
Administrative Services Manager 1.00 -1.00 -
Administrative Officer III 1.00 - 1.00
Business Systems Supervisor - 1.00 1.00
Business Systems Specialist Lead 1.00 -1.00 -
Deputy Strategy & Budget Director 1.00 - 1.00
Economist 1.00 - 1.00
Management Analyst 1.00 - 1.00
Special Assistant To City Manager 1.00 -1.00 -
Strategy and Budget Director 1.00 - 1.00
Strategy and Budget Analyst 7.00 -3.00 4.00
Strategy and Budget Analyst Associate - 3.00 3.00
Strategy and Budget Analyst Senior - 2.00 2.00
Strategy and Budget Manager 3.00 -1.00 2.00
Department Total FTE 18.00 -1.00 17.00
140

Transportation
82 82
Mission Statement To connect Charlotte and enhance the driving, bicycling, and walking experience by providing a safe and efficient multi-modal transportation system that supports economic mobility and sustains the community’s quality of life.
Department Overview
• Maintain and preserve a multi-modal transportation system of 308 square miles including more than 5,300lane miles of streets, 760 traffic signals, 2,250 miles of sidewalks, 150 miles of bicycle facilities, and 145,000traffic signsKeep pace with growth and foster economic vitality by providing transportation choices throughtransportation planning and capital investment, land development, right-of-way management, special events,neighborhood services, and curb lane managementProvide safer streets for all using Vision Zero principles to eliminate traffic-related fatalities and seriousinjuries by focusing on engineering, education, and enforcement efforts
Organizational Chart
Budget Overview Percent Change
FY 2017 FY 2018 FY 2019 FY 2020 FY 2019 Actual Actual Adopted Proposed FY 2020
Revenues Intergovernmental - State $1,016,270 $1,418,722 $875,000 $875,000 0.0 % Licenses, Fees, Fines $3,481,872 $4,604,618 $5,347,012 $3,694,295 -30.9 % Charges for Current Services $3,900,913 $3,865,859 $2,939,100 $2,756,200 -6.2 % Miscellaneous $7,300 $6,050 $7,500 $6,000 -20.0 % Other $22,318 $96,526 $0 $19,550 100.0 % Total Revenues $8,428,672 $9,991,775 $9,168,612 $7,351,045 -19.8 %
Expenditures Personal Services $28,522,534 $29,598,029 $32,185,826 $33,788,016 5.0 % Operating Expenses $11,213,069 $11,162,521 $10,929,365 $10,932,822 0.0 % Departmental Charges -$15,752,057 -$15,830,428 -$16,480,428 -$16,747,600 1.6 % Total Expenditures $24,013,546 $24,930,122 $26,634,763 $27,973,238 5.0 % Net Expenditures $15,584,874 $14,938,347 $17,466,151 $20,622,193 18.1 %
Office of the Director
Street Maintenance
Engineering and
OperationsDevelopment
ServicesPlanning and
DesignPublic Service
and Communications
Business Management
ServicesHuman
Resources
141

Transportation
83 83
FY 2020 Adjustments
Budget Action FTE Amount
Provide funds for a citywide compensation increase - $389,358Support compensation increase for employees in FY 2020 which includes: a three percent merit increase pool for salaried employees; a 1.5 percent market increase and 1.5 percent merit increase pool for hourly employees; and a 1.5 percent market increase and step increase (2.5 to five percent) for eligible public safety pay plan employees. Additional funds are included in the non-department budget to ensure that all general employees with a positive performance review receive at least a one dollar per hour increase by the end of FY 2020.
Enhance travel demand modeling 1.00 - Support travel demand modeling by adding a position to develop sub-regional models for high growth and congestion areas across the region. This position is grant funded and has no impact to the General Fund.
Support Charlotte Water utility permitting 1.00 - Provide funds for an Engineering Assistant to review the increasing number of Charlotte Water utility permits. This position is supported with revenue from Charlotte Water; there is a corresponding adjustment in Charlotte Water.
Consolidate Transportation leadership positions -1.00 -$146,397 Consolidate the roles and the responsibilities of a vacant Assistant Transportation Director position with the remaining two Deputy Directors. No impact to service is anticipated from this action.
Update personnel expenditures - $775,610Technical adjustment to update department costs for personnel services. The update includes the full annual cost of salary increases approved in FY 2019, an update to employer healthcare costs, and the impact of staffing changes that have occurred in FY 2019. These are routine actions that occur at the beginning of the budget cycle.
142

Transportation
84 84
FY 2020 Adjustments (continued)
Budget Action FTE Amount
Adjust employer contribution to the North Carolina Local Governmental Employees' Retirement System (NCLGERS) - $282,949
Technical adjustment for the required employer retirement contribution based on the NCLGERS Board of Trustees January action to increase employer rates from 7.75 percent to 8.95 percent for general employees and 8.50 percent to 9.70 percent for law enforcement officers.
Update allocations for Internal Service Providers (ISPs) - $36,955Technical adjustment to update funds needed to support ISPs based on anticipated cost of services. ISPs provide services to other city departments, including: building maintenance; rent of land and buildings; telecommunication; insurance liabilities; insurance premiums; and risk administration.
Net Change 1.00 $1,338,475
143

Transportation
85 85
Performance Measure Highlights
FY 2018 FY 2019 FY 2020 Objective Measure Actual Target Target
Strategic Priority Area: Neighborhood Development (Safe, Healthy, and Inclusive Communities)
Identify barriers to Americans with Disabilities Act (ADA) compliance in public right-of-way
Number of improvements made in implementing ADA transition plan
New Measure New Measure 85
Strategic Priority Area: Transportation and Planning (Mobility, Accessibility, and Connectivity)
Advance transportation projects supporting growth, walkability, bicycle-friendliness, and Vision Zero Action Plan
Number of high injury network corridors that received street lighting
New Measure New Measure 3 Corridors
Miles of new sidewalks 11 ≥ 10 ≥ 10
Miles of new bikeways 8 ≥ 10 ≥ 10
Number of new pedestrian safety projects
New Measure New Measure ≥ 15
Number of new and upgrade signals
New Measure New Measure New ≥ 2 Upgraded ≥ 10
Maintain existing infrastructure
Percent of service requests responded to within 1 hour during regular shift; and percent of service requests responded to within 2 hours during on-call shift
New Measure New Measure 95%; 98%
Annual Pavement Condition Rating
82.05% ≥ 90% ≥ 82.05%
Percent of pothole service requests responded to within 3 - 5 business days; Percent of emergency service requests within 3 hours
New Measure New Measure 95%; 100%
Strategic Priority Area: Well-Managed Government (Efficient, Effective, Accountable, Responsive, Inclusive, and Customer Focused)
Encourage a safety conscious culture for employees
Percent of employee safety compliance
New Measure New Measure 100% Compliance
144

Transportation
86 86
Full-Time Equivalent (FTE) Position Summary
Position Title FY 2019 FTE Change in FTE FY 2020 FTE Administrative Officer I 7.00 - 7.00 Administrative Officer II 2.00 - 2.00 Administrative Officer III 4.00 - 4.00 Administrative Officer IV 3.00 - 3.00 Administrative Officer V 2.00 - 2.00 Administrative Secretary I 1.00 - 1.00 Assistant Transportation Director 1.00 -1.00 - Business Systems Specialist Intermediate 2.00 - 2.00 Business Systems Specialist Lead 1.00 - 1.00 Code Enforcement Coordinator - 1.00 1.00 Construction Inspector 11.00 - 11.00Construction Inspector Senior 5.00 - 5.00 Construction Supervisor 3.00 -1.00 2.00 Contract Estimator 3.00 - 3.00 Contract Estimator Supervisor 1.00 - 1.00 Contracts Admin Coordinator 1.00 1.00 2.00 Deputy Transportation Director 2.00 - 2.00 Drafting Technician 1.00 - 1.00 Engineering Services Investigator 4.00 -1.00 3.00 Engineering Assistant 4.00 1.00 5.00 Engineering Business Services Manager 1.00 - 1.00 Engineering Program Manager 7.00 - 7.00 Engineering Project Coordinator 9.00 - 9.00 Engineering Project Manager 13.00 - 13.00Engineering Services Supervisor 3.00 - 3.00Equipment Operator II 45.00 - 45.00Equipment Operator III 25.00 - 25.00Field Operations Supervisor 10.00 - 10.00GIS Analyst 1.00 - 1.00 GIS Supervisor 1.00 - 1.00 IT Program Coordinator 2.00 - 2.00 Labor Crew Chief I 17.00 - 17.00Labor Crew Chief II 43.00 - 43.00Mason 31.00 - 31.00Office Assistant IV 6.00 - 6.00 Office Assistant V 1.00 - 1.00 Operations Supervisor 6.00 - 6.00 Public Info Specialist Senior 2.00 - 2.00 Public Service Coordinator 1.00 - 1.00
145

Transportation
87 87
Full-Time Equivalent (FTE) Position Summary (continued)
Position Title FY 2019 FTE Change in FTE FY 2020 FTE Public Services Division Manager 1.00 -1.00 - Safety Coordinator Senior 2.00 - 2.00 Senior Drafting Technician 2.00 - 2.00 Senior Engineer 7.00 - 7.00 Senior Engineering Project Manager 10.00 - 10.00Service Dispatcher 2.00 - 2.00 Sign And Marking Technician 3.00 - 3.00 Sign Fabricator 3.00 - 3.00 Signal Systems Specialist 2.00 - 2.00 Signs Fabrication Supervisor 1.00 - 1.00 Special Events Coordinator 1.00 - 1.00 Special Events Coordinator Senior 1.00 - 1.00 Special Events Supervisor 1.00 - 1.00 Storekeeper Senior 3.00 - 3.00 Stores Supervisor 1.00 - 1.00 Street Crew Member 52.00 - 52.00Street Maintenance Operations Manager 2.00 - 2.00 Technology Support Coordinator 1.00 - 1.00 Traffic Counter II 0.75 - 0.75 Traffic Electronics Supervisor 1.00 - 1.00 Traffic Electronics Technician I 3.00 - 3.00 Traffic Signal Electrician 8.00 - 8.00 Traffic Signal Electrician Lead 4.00 - 4.00 Training Specialist 1.00 - 1.00 Transportation Engineering Manager 4.00 - 4.00 Transportation Planning Division Manager - 1.00 1.00 Transportation Planning Program Manager 2.00 - 2.00 Transportation Analyst 2.00 - 2.00 Transportation Director 1.00 - 1.00 Transportation Electronics Technician II 5.00 - 5.00 Transportation Electronics Technician II Lead 2.00 - 2.00 Transportation Planner I 1.00 - 1.00 Transportation Planner II 5.00 - 5.00 Transportation Planner III 3.00 - 3.00 Travel Demand Modeler 2.00 - 2.00 Travel Demand Modeler Senior 1.00 1.00 2.00 Travel Demand Modeling Program Manager 1.00 - 1.00 Department Total FTE 423.75 1.00 424.75
146

2
NON-DEPARTMENTAL ACCOUNTS
DEPARTMENT BUDGETS

62 62
This page intentionally left blank.

Non-Departmental
88 88
The City of Charlotte uses “Non-Departmental” accounts to reflect services or functions not specifically associated with a particular department. These functions are grouped into four categories: Community Investments, Infrastructure Investments, Organizational Investments, and Employee Investments.
COMMUNITY INVESTMENTS FY 2018 Actual
FY 2019 Adopted
FY 2020 Proposed
Arts and Science Council $3,190,913 $3,190,823 $3,190,823 Supports cultural and arts agencies throughout the city by providing cultural education programs, cultural planning, grant making, public art, and workshops for the cultural community.
Cable Access Television Support - - $636,313 The city receives sales tax revenue from the state, some of which is required to support the Charlotte Mecklenburg Public Access Corporation, as well as public, educational, or governmental access channels provided by CPCC, UNCC, and the city. Funding was transferred from Finance in FY 2020 and reduced to reflect lower collections of state revenue.
Charlotte Regional Visitors Authority (CRVA) $5,637,818 $5,752,992 $6,243,723 Funds the city's general tourism marketing services contract with CRVA. The annual amount is based on a portion of projected collections of the occupancy tax and a $35,000 city contribution for special events
Charlotte Regional Business Alliance $155,111 $158,250 $161,526 Supports business and economic development as well as regional marketing. FY 2020 increase is based on a $0.30 per capita formula.
CIAA Men's Basketball Tournament $300,000 $300,000 $300,000 Funds to host the CIAA Men's Basketball Tournament.
Citizens Review Board $118,458 $80,000 $80,000
Supports operating expenses for the volunteer committee, which reviews police-related incident complaints City Burials - $3,400 $3,400 Funds burials in city-owned cemeteries for indigent citizens
City Participation in Regional Grants and Organizations $348,584 $348,000 $348,000 Supports organizations such as the Charlotte Regional Transportation Planning Organization and provides a match for the Unified Planning Work Program grants for regional transportation planning to allow implementation in an efficient manner.
149

Non-Departmental
89 89
COMMUNITY INVESTMENTS (continued) FY 2018 Actual
FY 2019 Adopted
FY 2020 Proposed
Community Building Initiative $50,000 $50,000 $50,000 Serves as a community resource providing strategic assistance in promoting racial and ethnic inclusion and equity.
Elections Office $2,098,610 $2,040,998 $2,679,329 Provides the city's share of the normal expenses of the County Elections Office, per the cost-sharing formula in the City-County Interlocal Agreement. Increase in FY 2020 is for enhanced early voting for the Presidential Primary election and support for three additional positions.
Historic West End Initiative1 - $125,000 - Partner with Charlotte Center City Partners on the funding of west side municipal service district services to continue the work being done through an existing grant. In FY 2020, funds for the program are transferred into the PAYGO fund.
International and Immigrant Community Outreach - $50,000 $50,000 Partnership with the Office of International Relations and Charlotte-Mecklenburg Library to increase the outreach and programming for international and immigrant communities.
Jobs Collaborative - $100,000 - One-time funding was provided in FY 2019 to partner with Goodwill Industries, Charlotte-Mecklenburg Schools, and Central Piedmont Community College on a jobs training program.
Library $2,500 $2,500 $2,500 Provides funding for maintenance for the Charlotte-Mecklenburg Library.
Mecklenburg Towns' Tourism Subsidy $3,949,275 $3,986,127 $4,223,729 Distributes a portion of the occupancy and prepared food and beverage taxes to Mecklenburg County's six towns. The annual amount and distribution are determined per North Carolina General Statute.
1 In FY 2020 funding for the Historic West End Initiative is transferred to the Pay-As-You-Go Fund.
150

Non-Departmental
1 1
COMMUNITY INVESTMENTS (continued) FY 2018 Actual
FY 2019 Adopted
FY 2020 Proposed
Micro Grants2 - $100,000 - The JumpStart Community Safety Micro-Grant program was born out of the Community Empowerment Initiative and provides small grants to community organizations that focus on conflict resolution and mediation, crime fighting and prevention, and opportunities for youth and parents. In FY 2020 funding is transferred to PAYGO fund.
My Brother's Keeper - $50,000 $50,000 Partnership with the YMCA for the My Brother’s Keeper (MBK) initiative. The program was launched to address persistent opportunity gaps faced by boys and young men of color and to help ensure all young people can reach their full potential.
Safe Alliance $333,977 $382,977 $397,038 Provides counseling and guidance for crime victims and their families. FY 2019 included one-time funding to improve services for victims of domestic violence. FY 2020 increase provides additional resources for the Victim Assistance Program and helps fund an attorney position to assist with legal services.
Summer of Opportunity Partnership $50,000 - - Contributed one-time funding in FY 2018 to support the “Summer of Opportunity Partnership” pilot program between the Charlotte-Mecklenburg Police Department and the YMCA
Total Community Investments $16,235,246 $16,721,067 $18,416,381
2 In FY 2020 funding for the Micro Grant program has been transferred to the Pay-As-You-Go Fund
151

Non-Departmental
91 91
INFRASTRUCTURE INVESTMENTS FY 2018 Actual
FY 2019 Adopted
FY 2020 Proposed
Capital Support (Pay-As-You-Go Sales Tax) $22,788,842 $20,919,558 $22,330,119 Transfers sales tax revenues to the Pay-As-You-Go (PAYGO) Fund to support capital and other one-time programs funded with cash versus debt. This also includes a $200,000 transfer to PAYGO to fund a recurring parking meter program.
Other Transfers to Capital Funds $4,187,124 - - Miscellaneous transfers made to other capital funds to support infrastructure needs as available.
Maintenance of Public Spaces $140,917 $191,913 $195,751 Provides funding for facility maintenance expenses for overstreet walkways and other facilities not assigned to specific departments.
Street Lighting $11,009,472 $11,328,023 $9,828,023 Represents electrical operating costs for the city's street lighting program. FY 2020 captures savings from a realignment of Duke Energy's rate formula into a single Public Lighting rate for all street lights outside of the Uptown area.
Street Resurfacing $4,261,000 $4,261,000 $4,261,000 Supplemental funding to the Powell Bill street maintenance fund for street resurfacing.
Total Infrastructure Investments $42,387,355 $36,700,494 $36,614,893
ORGANIZATIONAL INVESTMENTS FY 2018 Actual
FY 2019 Adopted
FY 2020 Proposed
Annual Audit $2,643 $74,283 $74,283 Represents the pro rata amount charged to the General Fund for the city's annual audit.
Charlotte-Mecklenburg Government Center Rent $15,084 - $34,079Funds used for building rent in unoccupied areas.
City Memberships and Subscriptions UNC-Chapel Hill School of Government $100,264 $103,253 $106,753 NC League of Municipalities $104,127 $113,306 $109,806 Alliance for Innovation $9,000 $8,250 $8,250 US Conference of Mayors $13,108 $26,216 $26,216 National League of Cities $25,490 $25,490 $25,490 NC Metropolitan Coalition $20,225 $20,823 $20,823 Centralina Council of Governments $223,503 $199,262 $202,857
152
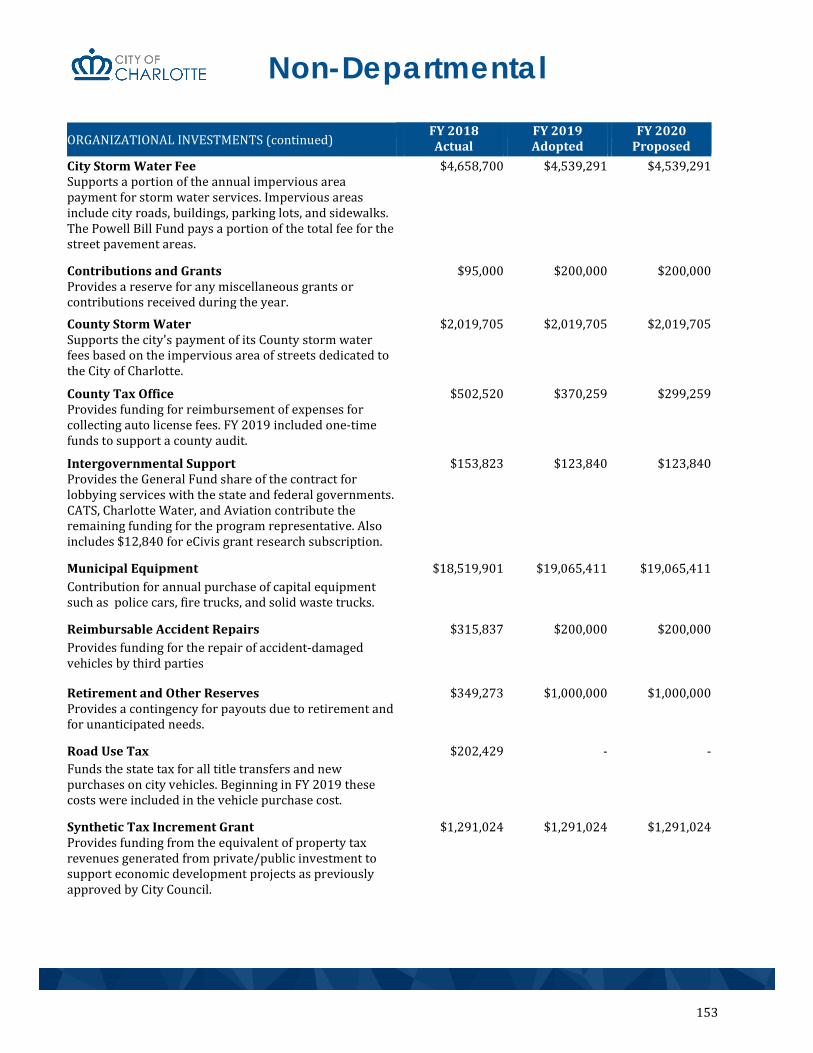
Non-Departmental
92 92
ORGANIZATIONAL INVESTMENTS (continued) FY 2018 Actual
FY 2019 Adopted
FY 2020 Proposed
City Storm Water Fee $4,658,700 $4,539,291 $4,539,291 Supports a portion of the annual impervious area payment for storm water services. Impervious areas include city roads, buildings, parking lots, and sidewalks. The Powell Bill Fund pays a portion of the total fee for the street pavement areas.
Contributions and Grants $95,000 $200,000 $200,000 Provides a reserve for any miscellaneous grants or contributions received during the year. County Storm Water $2,019,705 $2,019,705 $2,019,705 Supports the city's payment of its County storm water fees based on the impervious area of streets dedicated to the City of Charlotte.
County Tax Office $502,520 $370,259 $299,259 Provides funding for reimbursement of expenses for collecting auto license fees. FY 2019 included one-time funds to support a county audit.
Intergovernmental Support $153,823 $123,840 $123,840 Provides the General Fund share of the contract for lobbying services with the state and federal governments. CATS, Charlotte Water, and Aviation contribute the remaining funding for the program representative. Also includes $12,840 for eCivis grant research subscription.
Municipal Equipment $18,519,901 $19,065,411 $19,065,411 Contribution for annual purchase of capital equipment such as police cars, fire trucks, and solid waste trucks.
Reimbursable Accident Repairs $315,837 $200,000 $200,000 Provides funding for the repair of accident-damaged vehicles by third parties
Retirement and Other Reserves $349,273 $1,000,000 $1,000,000 Provides a contingency for payouts due to retirement and for unanticipated needs.
Road Use Tax $202,429 - - Funds the state tax for all title transfers and new purchases on city vehicles. Beginning in FY 2019 these costs were included in the vehicle purchase cost.
Synthetic Tax Increment Grant $1,291,024 $1,291,024 $1,291,024 Provides funding from the equivalent of property tax revenues generated from private/public investment to support economic development projects as previously approved by City Council.
153

Non-Departmental
93 93
ORGANIZATIONAL INVESTMENTS (continued) FY 2018 Actual
FY 2019 Adopted
FY 2020 Proposed
Undesignated Balance - $60,000 $85,438 Operating contingency funds used to mitigate risk associated with unforeseen challenges which may occur during the fiscal year.
Total Organizational Investments $28,272,383 $29,440,413 $29,432,525
EMPLOYEE INVESTMENTS FY 2018 Actual
FY 2019 Adopted
FY 2020 Proposed
Enhanced General Employee Compensation - $675,000 $1,000,000 Supports accelerating hourly employee market adjustment by three months, ensures all general employees with an acceptable performance review receive an increase of at least $1 per hour by the end of FY 2020, adjusts individual job classification based on comparative salary data, and provides for an end-of-year incentive if funds remain available. FY 2020 increase also includes funds for an apprenticeship or training program.
Charlotte-Mecklenburg Government Center (CMGC) Parking $378,738 $562,811 $469,517 Supports operations, utilities, and maintenance of the CMGC parking deck. This is a shared cost between the city and Mecklenburg County.
Health Care Premium Relief Program - $85,000 $100,000 Funds for a rebate incentive for city employees if their family income is below $55,000 and they are not able to elect the city’s basic PPO plan at their enrollment tier without spending more than 9.5 percent of their weekly salary. Retiree Healthcare Savings Plan3 - $600,000 - Established in FY 2019, a defined contribution retirement savings program for sworn personnel and firefighters, with an estimated amount of $1,000 annual employer contribution. In FY 2020, funding was transferred into the Police and Fire department budgets.
Transit Passes for City Employees - $334,484 $334,484 Provide all access transit passes to all city employees for an employee contribution of $33 per employee.
Total Employee Investments $378,738 $2,257,295 $1,904,001
Total Non-Departmental $87,617,334 $85,119,269 $86,367,800
3 In FY 2020, funding is transferred into Police and Fire department budgets.
154

4 4
NONGENERAL FUNDS

62 62
This page intentionally left blank.

2 2
ENTERPRISE FUNDS
NONGENERAL FUNDS

62 62
This page intentionally left blank.

Aviation
1 1
Mission Statement
We will be the preferred airport and airline hub by providing the highest quality product for the lowest possible
costs.
Department Overview
Ensure continuous operation of the Airport’s complex facilities, infrastructure, technology, and fleet providing an average of approximately 700 daily departures and serving approximately 46.2 million passgengers Develop the Aviation Capital Investment Plan and provide oversight of planning, design, and construction
of new facilities at the Airport to meet the demand of the nation’s sixth largest airport by operations
Organizational Chart
Budget Overview Percent Change
FY 2017 FY 2018 FY 2019 FY 2020 FY 2019 Actual Actual Adopted Proposed FY 2020
Revenues
Terminal Area $47,386,079 $54,782,322 $59,044,641 $72,858,392 23.4 %
Airfield $27,218,600 $28,437,369 $29,177,460 $31,321,579 7.3 %
Concessions $45,830,338 $51,991,446 $48,501,589 $59,733,245 23.2 %
Rental Car $14,886,706 $15,666,017 $16,101,460 $16,965,205 5.4 %
Parking $59,322,925 $59,642,084 $64,163,676 $60,371,123 -5.9 %
Fixed Base Operator $14,456,159 $18,475,833 $18,942,914 $25,596,121 35.1 %
Other $8,596,037 $10,392,718 $18,829,630 $14,210,319 -24.5 %
Total Operating Revenues $217,696,844 $239,387,789 $254,761,370 $281,055,984 10.3 %
Passenger Facility Charge Fund $58,854,860 $60,374,092 $27,923,609 $62,505,674 123.8 %
Contract Facility Charge Fund $12,898,163 $13,350,728 $7,776,507 $13,822,098 77.7 %
Total Revenues $289,449,867 $313,112,609 $290,461,486 $357,383,756 23.0 %
Office of the Director
Administrative Services
Business and Innovation
Finance OperationsOffice of Strategic Communications
Legal
159

Aviation
2 2
Budget Overview (continued) Percent Change
FY 2017 FY 2018 FY 2019 FY 2020 FY 2019
Actual Actual Adopted Proposed FY 2020
Expenditures
Personnel Services $38,123,499 $41,689,649 $50,285,336 $59,725,458 18.8 %
Operating Expenses $73,137,106 $79,297,171 $103,769,767 $112,555,744 8.5 %
Capital Outlay $952,121 $1,696,558 $1,570,511 $2,209,500 40.7 %
Grants, Contributions, and Other $17,919,631 $19,743,927 $20,115,000 $21,104,922 4.9 %
Departmental Charges -$1,963,156 -$1,153,597 -$3,687,498 -$4,318,245 17.1 %
Operating Expenditures $128,169,201 $141,273,708 $172,053,116 $191,277,379 11.2 %
Discretionary and Debt Support*
$161,280,666 $117,815,826 $118,408,370 $124,331,363 5.0 %
Total Expenditures $289,449,867 $257,935,936 $290,461,486 $315,608,742 8.7 %
Reserved for Future Years $0 $55,176,672 $0 $41,775,014 100.0 %
*Passenger Facility Charge and Customer Facility Charge are included.
160

Aviation
3 3
FY 2020 Adjustments
Budget Action FTE Amount
Provide funds for a citywide compensation increase - $738,235Provide funds for a compensation increase for city employees. FY 2020 includes: a three percent merit increase pool for salaried employees; a 1.5 percent general wage increase and 1.5 percent merit increase pool for hourly employees; and a 1.5 percent general wage increase and step increase (2.5 to 5 percent) for eligible public safety pay plan employees.
Provide additional compensation to general employees - $300,000Provide additional funds to general employees beyond a typical three percent salary increase. The adjustment includes acceleration of the hourly employee market increase to December (from February), and funds to ensure that all general employees with an acceptable performance review will receive at least a $1/hour increase in FY 2020.
Continue to build strong community partnerships 4.00 $209,001
Add positions to support initiatives that strengthen the relationship between the airport, the community and business partners.
Increase focus on customer experience 7.00 $695,119
Add positions to support customer experience initiatives implementing a new mobile application, building passenger experience programs, increasing marketing of new products and projects, and continuing to develop processes to more quickly respond to customer feedback.
Invest in our Employees 2.00 $95,439
Hire dedicated staff to support the education, training, and development of employees.
Support safety and security
Add positions to support key investments in security operations and technology. 18.00 $734,110
Support Strategic Growth
Add positions to support the continued expansion of the terminal and airfield. 7.00 $319,597
Technical Adjustment to Purchase Capital Equipment
Provide funding to purchase new vehicles and equipment based on Aviation's replacement schedule, new facilities and staff, and capital needs to support fixed based operations. Aviation owns and maintains a large fleet of vehicles and other equipment for airport operations.
-
$638,989
161

Aviation
4 4
FY 2020 Adjustments (continued)
Budget Action FTE Amount
Ensure asset preservation
Add positions to support the preventative maintenance of Airport facilities. 11.00 $523,829
Increased charge out to capital projects - -$630,750Charge out of new positions to support the capital program and charge out a higher percentage of existing staff's time spent on managing the capital program.
Recognize other contractual and programmatic savings - -$2,490,727Reduce funds for contractual services and programmatic support based on achieved savings with partners and internal resources.
Realize reduced utility costs - -$944,556Capture savings as a result of consistent improvements in energy efficiency and reduced consumption of electricity.
Increase contribution to discretionary and debt support - $5,922,993Technical adjustment to update the cash transfer to capital projects based on Aviation's financial planning and capital project schedule. This is a routine action that occurs at the beginning of the budget cycle.
Continue General Fund support - $820,298Technical adjustment to update funds needed to cover anticipated cost of the city's central support services as well as the critical life safety and law enforcement operations provided at the airport by Charlotte Mecklenburg Police Department and Charlotte Fire Department.
Add dedicated Command Staff positions at CLT airport - $263,033Provide funds for ongoing fire operations at the airport and one Division Chief and one Captain. These positions will fulfill supervisory and training roles for the existing two companies supporting the CLT airport.
Contractual obligations to support operations - $10,772,216Technical increase for new and ongoing contractual obligations related to airport facilities, operations, and system infrastructures, including fixed based operations for managing the airport’s private, charter, and other general aviation activities.
Update personnel expenditures - $6,705,216Technical adjustment to update department costs for personnel services. The update includes the full annual cost of salary increases approved in FY 2019, an update to employer healthcare costs, and the impact of staffing changes that have occurred in FY 2019. These are routine actions that occur at the beginning of the budget cycle.
162

Aviation
5 5
FY 2020 Adjustments (continued)
Budget Action FTE Amount
Adjust employer contribution to the North Carolina Local Governmental Employees' Retirement System (NCLGERS) - $475,214
Adjust required employer retirement contribution based on the NCLGERS Board of Trustees January action to increase employer rates from 7.75 percent to 8.95 percent for general employees and 8.50 percent to 9.70 percent for law enforcement officers.
Net Change 49.00 $25,147,256
163

Aviation
6 6
Performance Measure Highlights
FY 2018 FY 2019 FY 2020
Objective Measure Actual Target Target
Strategic Priority Area: Economic Development (Economy, Jobs and Upward Mobility)
Provide access to job training and employment opportunities for youth and adults
Number of apprentices in Aviation's Apprenticeship Program
New Measure New Measure ≥ 6
Number of students in summer and/or year-long internship opportunities
New Measure New Measure ≥ 8
Strategic Priority Area: Neighborhood Development (Safe, Healthy, and Inclusive Communities)
Engage with and support the community
Regularly meet with Aviation Neighborhood Committee
New Measure New Measure Meet quarterly with the Aviation Neighborhood Committee
Number of residents participating in the Aviation Academy (8-month program)
New Measure New Measure At least 25 community residents will complete the
Aviation Academy
Strategic Priority Area: Transportation and Planning (Mobility, Accessibility, and Connectivity)
Infrastructure growth that provides access to the Charlotte Douglas International Airport
Progress on studies and land acquisitions
Began refinement studies and land acquisition
projects in Central area of the Destination District
Begin implementing the Airport Area Strategic
Development Plan
Finalize on-going studies and land acquisition
projects in Central area of the Destination District
Maintain and support Charlotte's transportation assets
Progress to provide fully operational electric transit fleet services
New Measure New Measure Complete the infrastructure to support the
transition to all electric transit
fleet
164

Aviation
7 7
Performance Measure Highlights (continued)
FY 2018 FY 2019 FY 2020
Objective Measure Actual Target Target
Strategic Priority Area: Well-Managed Government (Efficient, Effective, Accountable, Responsive, Inclusive, and Customer Focused)
Maintain city's AAA Rating Debt service coverage ratio 3.5 Generate debt service coverage ratio of 1.25 or
greater
Generate debt service coverage ratio of 1.25 or
greater
Expand tax base and revenues
Cost per enplaned passenger for all large hub airports as defined by the Federal Aviation Administration
$1.26 ≤ $10.93 ≤ $10.65
165

Aviation
8 8
Full-Time Equivalent (FTE) Position Summary
Position Title FY 2019 FTE Change in FTE FY 2020 FTE
Accountant II 4.00 -1.00 3.00
Accountant III 1.00 1.00 2.00
Accountant IV 1.00 - 1.00Accounting Technician 3.00 - 3.00Administrative Officer I 10.00 - 10.00Administrative Officer II 15.00 3.00 18.00Administrative Officer III 11.00 3.00 14.00Administrative Officer IV 4.00 - 4.00Administrative Officer V 4.00 - 4.00Administrative Services Manager 1.00 - 1.00Airfield Maintenance Crew Chief 6.00 - 6.00Airfield Maintenance Technician I 13.00 - 13.00Airfield Maintenance Technician II 9.00 - 9.00Airfield Maintenance Technician III 9.00 - 9.00Airport Business Revenue Manager 2.00 - 2.00Airport Development Manager 2.00 - 2.00Airport Electronics Technician Lead 3.00 -1.00 2.00Airport Electronics Technician Senior 9.00 - 9.00Airport Engineer 2.00 - 2.00Airport Facilities Superintendent 1.00 - 1.00Airport Financial Services Manager 1.00 - 1.00Airport Operations Manager I 15.00 - 15.00Airport Operations Manager II 7.00 1.00 8.00Airport Operations Manager III 1.00 1.00 2.00Airport Operations Officer I 18.00 5.00 23.00Airport Operations Officer II 38.00 3.00 41.00Airport Operations Officer III 33.00 5.00 38.00Airport Operations Supervisor II 15.00 2.00 17.00Airport Operations Supervisor I 15.00 1.00 16.00Airport Operations Superintendent 1.00 - 1.00Airport Shuttlebus Dispatcher 6.00 - 6.00Airport Shuttlebus Driver 105.00 -1.00 104.00Airport Technology Manager 1.00 - 1.00Airports Services Representative 30.00 5.00 35.00Associate Planner 1.00 - 1.00Assistant Maintenance Mechanic 12.00 - 12.00
166

Aviation
9 9
Full-Time Equivalent (FTE) Position Summary (continued)
Position Title FY 2019 FTE Change in FTE FY 2020 FTE
Aviation Director 1.00 - 1.00Building Maintenance Assistant 2.00 - 2.00Business System Specialist Associate 5.00 1.00 6.00Business Systems Specialist Intermediate 1.00 - 1.00Business Systems Specialist Lead 2.00 - 2.00Business Systems Program Manager 1.00 - 1.00Business Systems Supervisor 5.00 - 5.00Carpenter Senior 4.00 1.00 5.00Chief Airport Construction Inspector 3.00 - 3.00Chief Locksmith 1.00 - 1.00Chief Maintenance Mechanic 14.00 1.00 15.00Community Programs Coordinator 1.00 - 1.00Construction Inspector 2.00 1.00 3.00Construction Inspector Senior 1.00 - 1.00Content Webmaster 1.00 - 1.00Contract Technician 1.00 - 1.00Contracts Admin Coordinator 5.00 - 5.00Contracts Admin Specialist 4.00 - 4.00Contracts Admin Specialist Lead 1.00 - 1.00Conveyor Load Bridge Technician 12.00 - 12.00Conveyor Load Bridge Technician Lead 2.00 1.00 3.00Conveyor Load Bridge Technician Senior 10.00 1.00 11.00Data Storage Administrator 1.00 - 1.00Deputy Aviation Director Business Innovation 1.00 - 1.00Deputy Aviation Director Operations 1.00 - 1.00Electronics Technician II 2.00 - 2.00Energy Sustainability Coordinator 1.00 - 1.00Engineering Assistant 1.00 3.00 4.00Engineering Program Manager 3.00 - 3.00Engineering Project Coordinator 6.00 - 6.00Engineering Project Manager 5.00 1.00 6.00Environmental Compliance Specialist 1.00 - 1.00Environmental Program Coordinator 1.00 - 1.00Equipment Operator I 1.00 - 1.00Equipment Operator II 2.00 - 2.00Equipment Shop Supervisor 1.00 - 1.00
167

Aviation
10 10
Full-Time Equivalent (FTE) Position Summary (continued)
Position Title FY 2019 FTE Change in FTE FY 2020 FTE
Facilities/Property Supervisor 1.00 - 1.00Field Operations Supervisor 3.00 - 3.00GIS Analyst 1.00 - 1.00GIS Technician 2.00 - 2.00Graphic Artist Senior 1.00 - 1.00Heavy Equipment Service Technician Lead 2.00 - 2.00Heavy Equipment Service Technician Master 2.00 - 2.00Heavy Equipment Service Technician Senior 8.00 2.00 10.00HVAC Technician 1.00 - 1.00HVAC Technician Senior 10.00 1.00 11.00Information Technology Administrator 9.00 - 9.00IT Communications Technician 1.00 - 1.00IT Project Manager 1.00 - 1.00Labor Crew Chief I 1.00 - 1.00Labor Crew Chief II 2.00 1.00 3.00Laborer 2.00 - 2.00Landscape Supervisor 1.00 - 1.00Light Equipment Service Technician 9.00 - 9.00Locksmith 3.00 - 3.00Management Analyst - 2.00 2.00Network Communications Integrator 3.00 -1.00 2.00Network Communications Integrator Senior 1.00 - 1.00Office Assistant III 2.00 1.00 3.00Office Assistant IV 6.00 - 6.00Office Assistant V 2.00 - 2.00Operations Supervisor 5.00 - 5.00Principal Planner 3.00 - 3.00Public Info Specialist Senior 4.00 - 4.00Public Information Specialist 4.00 1.00 5.00Public Service Coordinator 1.00 - 1.00Real Estate Agent II 2.00 - 2.00Real Estate Agent III - 1.00 1.00Safety Coordinator - 1.00 1.00Safety Coordinator Senior 1.00 -1.00 - Safety Supervisor 1.00 1.00 2.00
Senior Drafting Technician 1.00 - 1.00
168
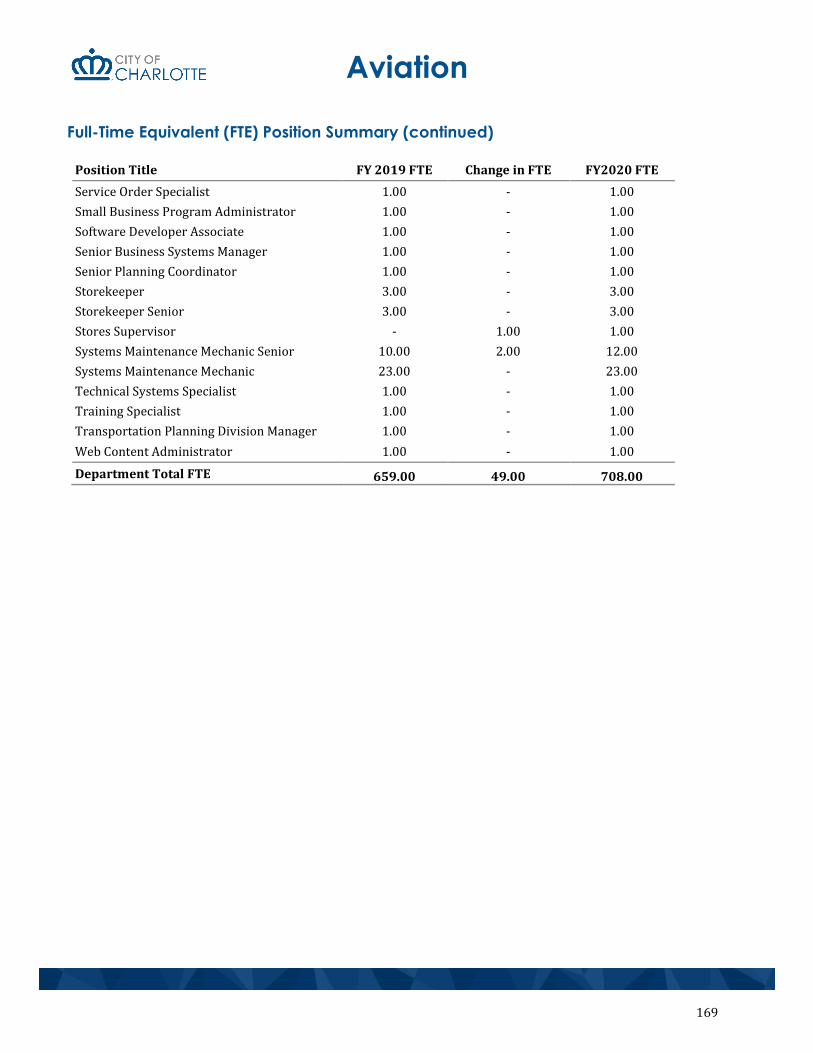
Aviation
11 11
Full-Time Equivalent (FTE) Position Summary (continued)
Position Title FY 2019 FTE Change in FTE FY2020 FTE
Service Order Specialist 1.00 - 1.00Small Business Program Administrator 1.00 - 1.00Software Developer Associate 1.00 - 1.00Senior Business Systems Manager 1.00 - 1.00Senior Planning Coordinator 1.00 - 1.00Storekeeper 3.00 - 3.00Storekeeper Senior 3.00 - 3.00Stores Supervisor - 1.00 1.00Systems Maintenance Mechanic Senior 10.00 2.00 12.00Systems Maintenance Mechanic 23.00 - 23.00Technical Systems Specialist 1.00 - 1.00Training Specialist 1.00 - 1.00Transportation Planning Division Manager 1.00 - 1.00Web Content Administrator 1.00 - 1.00
Department Total FTE 659.00 49.00 708.00
169

Aviation Debt Service Consolidated Fund
12 12
The Aviation Debt Service Funds represent the principal and interest payments for debt issued to the Aviation Department for specified purposes. Revenues are transferred from the Aviation operating fund to the debt service fund to meet annual principal and interest obligations.
Percent Change
FY 2017 FY 2018 FY 2019 FY 2020 FY 2019 Actual Actual Adopted Proposed FY 2020
Revenues
Contribution from Aviation Operating $43,032,513 $44,694,000 $51,724,616 $55,272,158 6.9%
Contribution from Rental Car Facilities $4,470,135 $4,447,869 $4,465,324 $4,469,501 0.1%
Proceeds from Sale of Debt $230,000,000 - - - 0.0%
Premium from Sale of Debt $1,500,000 - - $2,300,000 100.0%
Interest on Investments $10,000 $944,000 $10,000 - -100.0%
Total Revenues $279,012,648 $50,085,869 $56,199,940 $62,041,659 10.4%
Expenditures
Retirement of Debt $18,309,999 $13,135,000 $19,975,000 $22,085,000 10.6%
Interest on Debt $28,574,136 $35,883,000 $36,051,290 $39,353,259 9.2%
Cost of Bond Sale $1,500,000 $18,000 - - 0.0%
Fees and Other Charges $628,513 $524,000 $163,650 - -100.0%
Payment to Refunding Escrow Agent $230,000,000 - - $603,400 100.0%
Transfers to Operating Fund - $124,000 - - 0.0%
Total Expenditures $279,012,648 $49,684,000 $56,199,940 $62,041,659 10.4%
170

Charlotte Area Transit
System
1 1
Executive and Administration
Transit Development
Rail Operations and Facilities Bus Operations Finance
Marketing, Communications
& TechnologySafety & Security
Mission Statement To improve the quality of life for everyone in the greater Charlotte region by providing outstanding community-wide
public transportation services while proactively contributing to focused growth and sustainable regional development.
Department Overview
Provide core transportation services via bus, vanpool, light rail, streetcar and Americans with Disabilities Act (ADA) paratransit service. Provide regional transit service covering the cities of Concord and Gastonia, as well as Union County in North
Carolina and York County in South Carolina. CATS services the community with a fleet of buses, which
includes hybrid buses, ADA equipped buses, Vanpool vans, and light rail cars. Implement 2030 Transit Corridor System Plan, including the opening of the LYNX Blue Line Extension,
construction of CityLYNX Gold Line Phase 2, and the Charlotte Gateway Station.
Organizational Chart
Budget Overview
Percent Change
FY 2017 FY 2018 FY 2019 FY 2020 FY 2019 Actual Actual Adopted Proposed FY 2020
Revenues
Article 43 Sales Tax $92,601,412 $103,021,757 $98,211,941 $109,933,384 11.9 %
Federal Grants $390,749 $14,912,968 $11,376,605 $23,871,704 109.8 %
Interlocal Agreements $211,508 $211,508 $211,508 $211,508 0.0 %
State Grants $11,451,036 $11,218,295 $11,691,675 $8,104,818 -30.7 %
Advertising $1,466,865 $1,774,717 $1,545,000 $1,906,800 23.4 %
Other Charges $4,485,039 $2,767,527 $1,143,726 $1,359,972 18.9 %
Passanger Fares $25,870,837 $25,042,616 $30,412,342 $28,162,737 -7.4 %
Interest Earnings $241,245 $843,251 $641,000 $941,000 46.8 %
Miscellanous Revenue $324,719 $204,002 $2,637,339 $2,516,188 -4.6 %
Private Contribution $10,000 $0 $0 $0 0.0 %
Sale of Assets $29,900 $153,781 $0 $0 0.0 %
Transit Pay-Go Transfer $22,242,719 $23,251,239 $23,706,922 $24,101,575 1.7 %
CATS Control Account $2,967,366 $5,449,684 $2,000,000 $0 -100.0 %
Total Revenues $162,293,395 $188,851,345 $183,578,058 $201,109,686 9.5 %
171

Charlotte Area Transit
System
2 2
Budget Overview (continued)
Expenditures
Personnel Services $93,889,273 $99,644,938 $102,636,906 $105,188,459 2.5 %
Operating Expenses $37,342,521 $49,615,178 $49,762,653 $59,769,975 20.1 %
City Administrative Costs $3,539,549 $3,610,340 $4,880,357 $5,456,047 11.8 %
Department Charges -$13,674,704 -$4,980,262 -$2,879,018 -$887,568 -69.2 %Transfer to CIP $9,241,562 $4,607,165 $239,981 $981,601 309.0 %
Subtotal Operating $130,338,201 $152,497,359 $154,640,879 $170,508,514 10.3 %
Transfer to Debt Service $16,721,556 $15,661,328 $18,224,238 $17,667,788 -3.1 %Transfer to Control Account $15,709,208 $18,317,757 $10,712,941 $12,933,384 20.7 %Total Expenditures $162,768,965 $186,476,444 $183,578,058 $201,109,686 9.5 %
Both CATS operating and Sales Tax Consolidation funds are included.
FY 2020 Adjustments
Budget Action FTE Amount
Provide funds for a citywide compensation increase - $4,773,207Support compensation increase for employees in FY 2020 which includes: a three percent merit increase pool for salaried employees; and a 1.5 percent market increase and 1.5 percent merit increase pool for hourly employees.
Provide additional compensation to general employees - $300,000Provide additional funds to general employees beyond a typical three percent salary increase. The adjustment includes acceleration of the hourly employee market increase to December (from February), and funds to ensure that all general employees with an acceptable performance review will receive at least a $1/hour increase in FY 2020.
Provide funds for repairs to facilities - $412,000Support the replacement of the roof at the South Boulevard Light Rail Facility and additional maintenance on parking deck repairs.
Provide funds for corridor studies - $825,000Support an Americans with Disabilities Act study, Regional Transit Plan, North Corridor direct connect study, and Central Avenue study. Additional funds assist in the protection of corridor alignments and coordination to support Transit Oriented Development.
Provide funds for a safety and security gap analysis and staffing 3.00 $398,694
Support development of a Federal Transist Adminstration required Agency Safety Plan and for additional safety and security coordinators.
172

Charlotte Area Transit
System
3 3
FY 2020 Adjustments (continued)
Budget Action FTE Amount
Provide funds for Rail Maintenance Staff and Training Specialist 15.00 $1,146,346
Increase Rail support, safety, and maintenance to support the extended Blue Line. This action adds two work crews of six staff each, a training position, and two administrative positions.
Provide funds for human resources support 1.00 $81,361
Add an additonal Human Resources position to assist with difficult to fill vacancies.
Provide funds for Gold Line staffing to prepare for Phase II 23.00 $970,883
Hire additional staff to prepare for Gold Line Phase II operations. In FY 20 these costs will be included in the Capital Project for Phase II. After Phase II is complete, these costs will be funded by Gold Line operating support from Transit PAYGO.
Provide funds for fuel increase - $800,000Support an estimated increase in the usage and cost of fuel. CATS purchases fuel futures through a hedging program that locks in the price of diesel and provides budget stability.
Technical adjustment to adjust annual operating contribution to capital - $741,619Technical adjustment to increase required funding match from CATS operating fund. Local match is required to access most grant funds used for capital expenses. Additional Capital transfers are made from the Control Account Fund.
Technical adjustment to fund maintenance and repair of Blue Line Extension networking equipment
- $869,923
Provide funds for additional support required for to technology and networking assets added for the Blue Line Extension
Technical adjustment to provide additional funds for CATS mobile application - $222,376Technical adjustment to annualize the costs of CATS' mobile payment smart phone application. This applicantion provides Transit riders with a onvenient and easy way to purchase LYNX tickets with a smart phone.
Technical adjustment to fulfill federal requirements related to inspecting bridges
- $312,000
Technical adjustment to fulfill federal requirements related to inspecting bridges by contracting with engineers to assess infrastructure.
173

Charlotte Area Transit
System
4 4
FY 2020 Adjustments (continued)
Budget Action FTE Amount
Technical adjustment to match anticipated debt service requirements - -$556,450Technical adjustment to lower the amount of local funding for an annual debt service transfer. CATS pays debt service from federal, state, and local revenue sources. The Debt Service budget can be found later in the document.
Technical adjustment based on projected Article 43 Sales Tax revenue - $2,220,443Technical adjustment to account for the difference between projections of expected revenue and requirements for operating expenses and capital investments. This amount is transferred to the Control Account for future needs.
Update allocations for City Cost Allocation Plan - $575,690Technical adjustment to update funds needed to support central service staff and overhead based on accepted cost allocation principles. Central service staff and overhead include the personnel and operating costs for departments such as the City Manager's office, City Attorney's office, Finance, and Human Resources.
Adjust employer contribution to the North Carolina Local Governmental Employees' Retirement System (NCLGERS)
- $436,387
Adjust required employer retirement contribution based on the NCLGERS Board of Trustees January action to increase employer rates from 7.75 percent to 8.95 percent for general employees and 8.50 percent to 9.70 percent for law enforcement officers.
Update personnel expenditures 6.00 $2,375,268
Technical adjustment to update department costs for personnel services. The update includes the full annual cost of salary increases approved in FY 2019, an update to employer healthcare costs, and the impact of staffing changes that have occurred in FY 2019. These are routine actions that occur at the beginning of the budget cycle. A product of this update was the conversion of six long term temporary staff positions to full time equivalent positions.
Update allocations for Internal Service Providers (ISPs) - $626,881Technical adjustment to update funds needed to support ISPs based on anticipated cost of services. ISPs provide services to other city departments, including: building maintenance; rent of land and buildings; telecommunication; insurance liabilities; insurance premiums; and risk administration.
Net Change 48.00 $17,531,628
174
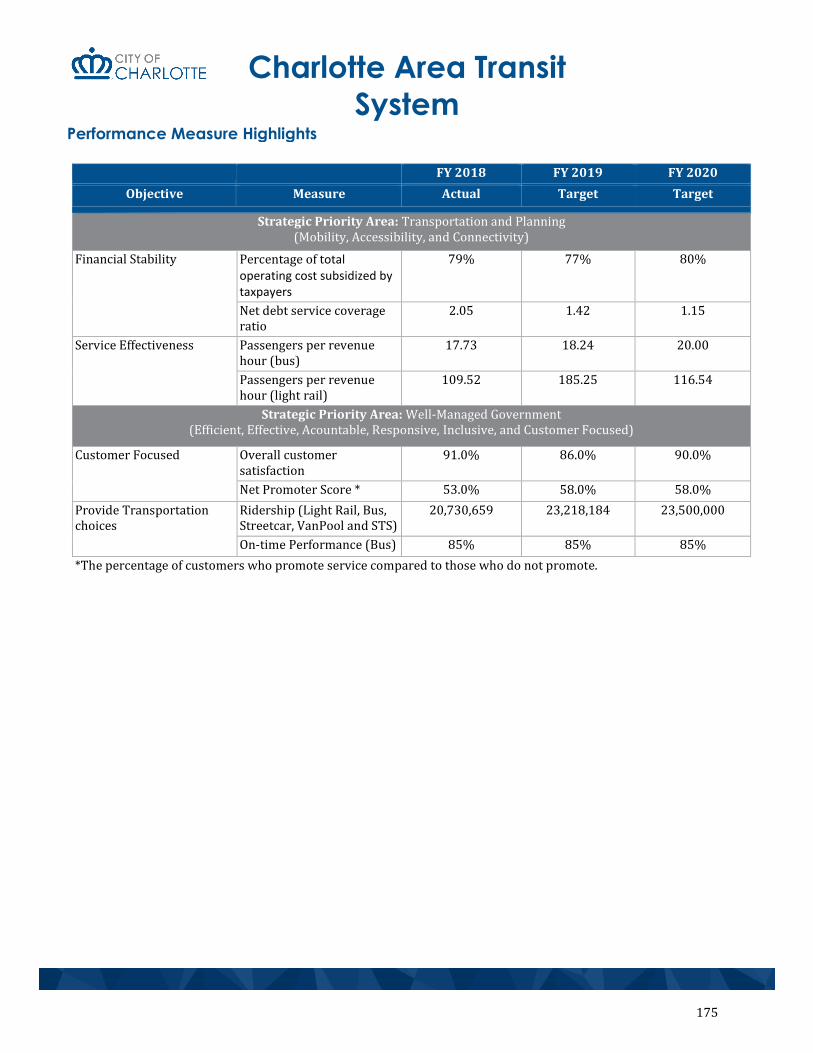
Charlotte Area Transit
System
5 5
Performance Measure Highlights
FY 2018 FY 2019 FY 2020
Objective Measure Actual Target Target
Strategic Priority Area: Transportation and Planning (Mobility, Accessibility, and Connectivity)
Financial Stability Percentage of total operating cost subsidized by taxpayers
79% 77% 80%
Net debt service coverage ratio
2.05 1.42 1.15
Service Effectiveness Passengers per revenue hour (bus)
17.73 18.24 20.00
Passengers per revenue hour (light rail)
109.52 185.25 116.54
Strategic Priority Area: Well-Managed Government (Efficient, Effective, Acountable, Responsive, Inclusive, and Customer Focused)
Customer Focused Overall customer satisfaction
91.0% 86.0% 90.0%
Net Promoter Score * 53.0% 58.0% 58.0%
Provide Transportation choices
Ridership (Light Rail, Bus, Streetcar, VanPool and STS)
20,730,659 23,218,184 23,500,000
On-time Performance (Bus) 85% 85% 85%
*The percentage of customers who promote service compared to those who do not promote.
175

Charlotte Area Transit
System
6 6
Full-Time Equivalent (FTE) Position Summary
Position Title FY 2019 FTE Change in FTE FY 2020 FTE
Accountant II 7.00 - 7.00Accountant III 2.00 - 2.00Accountant IV 1.00 1.00 2.00Administrative Officer I 7.00 - 7.00Administrative Officer II 7.00 1.00 8.00Administrative Officer III 3.00 6.00 9.00Administrative Officer IV 4.00 - 4.00Administrative Officer V 2.00 - 2.00Assistant Field Operations Supervisor 1.00 - 1.00Building Maintenance Asssistant 2.00 - 2.00Business Systems Specialist Lead 3.00 - 3.00Business System Specialist Senior 4.00 - 4.00Business Systems Program Manager 1.00 - 1.00Business Systems Supervisor 1.00 - 1.00Construction Contracts Admin Coordiantor Lead 2.00 - 2.00Content Webmaster 1.00 - 1.00Contracts Admin Coordinator 1.00 - 1.00Contracts Admin Specialist 2.00 - 2.00Customer Service Supervisor 1.00 - 1.00Customer/Revenue Service Assistant Senior 3.00 - 3.00Customer/Revenue Service Assistant 29.00 - 29.00Customer/Revenue Service Specialist 6.00 - 6.00Engineering Project Coordinator 2.00 - 2.00Equipment Operator I 6.00 - 6.00Equipment Parts Manager 1.00 - 1.00Facilities Services Coordinator 1.00 - 1.00Facilities/Property Supervisor 3.00 - 3.00Field Operations Supervisor 18.00 1.00 19.00Graphic Artist 1.00 - 1.00Graphic Artist Senior 1.00 - 1.00Labor Crew Chief II 8.00 - 8.00Laborer 1.00 - 1.00Light Rail Transit System Engineer 1.00 - 1.00Management Analyst 2.00 - 2.00Office Assistant III 1.00 - 1.00
176

Charlotte Area Transit
System
7 7
Full-Time Equivalent (FTE) Position Summary (continued)
Position Title FY 2019 FTE Change in FTE FY 2020 FTE
Office Assistant IV 10.00 - 10.00Office Assistant V 5.00 - 5.00Operations Supervisor 3.00 - 3.00Public Information Specialist Senior 2.00 - 2.00Public Information Specialist 2.00 - 2.00Public Service Coordinator 2.00 - 2.00Purchasing Agent 1.00 - 1.00Quality Assurance Analyst 1.00 - 1.00Rail Car Maintenance Supervisor 7.00 2.00 9.00Rail Car Technician 33.00 5.00 38.00Rail Car Technician Lead 2.00 1.00 3.00Rail Controller 11.00 - 11.00Rail Maintenance Assistant 12.00 - 12.00Rail Maintenance Of Way Supervisor 9.00 - 9.00Rail Mow Maintainer 14.00 15.00 29.00Rail Mow Maintainer Lead 4.00 3.00 7.00Rail Operations Manager 2.00 - 2.00Rail Operator 69.00 10.00 79.00Rail Track Maintainer 12.00 1.00 13.00Safety Coordinator 8.00 3.00 11.00Safety Coordinator Senior 4.00 - 4.00Safety Supervisor 3.00 - 3.00Senior Engineer 5.00 - 5.00Special Transportation Driver 100.75 - 100.75Special Transportation Manager 1.00 - 1.00Special Transportation Supervisor 1.00 - 1.00Special Transport Dispatcher 9.00 - 9.00Senior Business Systems Manager 1.00 - 1.00Storekeeper 5.00 - 5.00Traffic Counter I 2.00 - 2.00Traffic Counter II 1.00 - 1.00Training Specialist 3.00 2.00 5.00Transit Arts Program Manager 1.00 - 1.00Transit Budget Manager 3.00 -1.00 2.00Transit Bus Service Manager 1.00 - 1.00Transit Corridor Assistant Project Manager 2.00 - 2.00Transit Corridor Senior Project Manager 1.00 - 1.00
177

Charlotte Area Transit
System
8 8
Full-Time Equivalent (FTE) Position Summary (continued)
Position Title FY 2019 FTE Change in FTE FY 2020 FTE
Transit Deputy Director 1.00 - 1.00Transit Director 1.00 - 1.00Transit Marketing & Technology Manager 1.00 - 1.00Transit Operations Services Manager 2.00 - 2.00Transit Operations Manager 2.00 - 2.00Transit Planning Manager 1.00 - 1.00Transit Procure & Contracts Administrator 1.00 - 1.00Transit Project Development Manager 2.00 - 2.00Transit Quality Assurance Manager 1.00 - 1.00Transit Rail Operations Manager 1.00 - 1.00Transit Safety & Security Manager 1.00 - 1.00Transit Scheduling Analyst 1.00 - 1.00Transit Scheduling Manager 2.00 - 2.00Transportation Electronics Technician II 17.00 2.00 19.00Transportation Electronics Technician II Lead 4.00 -4.00 - Transportation Planner I 2.00 - 2.00Transportation Planner II 4.00 - 4.00Transportation Planner III 2.00 - 2.00
Department Total FTE 534.75 48.00 582.75
178

Charlotte Area Transit System Debt Service Fund
11
CATS’ Debt Service Fund is used to pay principal, interest, and related costs for outstanding debt related to capital investments in transit maintenance and expansion.
PercentChange
FY 2017 FY 2018 FY 2019 FY 2020 FY 2019Actual Actual Adopted Proposed FY 2020
RevenuesTransfers from CATS Operating $16,721,556 $15,661,328 $18,224,238 $17,667,788 -3.1 %Federal Grants $1,440,000 $6,047,604 $81,124,175 $71,893,163 -11.4 %State Grants $3,512,189 $1,562,706 $26,597,050 $26,036,050 -2.1 %Interest on Investments $31,960 $55,239 - - 0.0 %
Total Revenues $21,705,705 $23,326,877 $125,945,463 $115,597,001 -8.2 %
ExpendituresPrincipal Payments $4,755,000 $4,825,000 $108,805,857 $101,041,276 -7.1 %Interest Payments $13,018,571 $16,941,733 $17,025,606 $14,441,725 -15.2 %Other Fees $818,543 $110,487 $114,000 $114,000 0.0 %
Total Expenditures $18,592,114 $21,877,220 $125,945,463 $115,597,001 -8.2 %
Debt Service Reserve FundCATS’ Debt Service Reserve Fund is used to maintain a $30 million fund balance in accrodance with financial policies adopted by the Metropolitian Transit Commission. Excess funds over the $30 million are avaliable for one-time Capital and Operating expenses.
PercentChange
FY 2017 FY 2018 FY 2019 FY 2020 FY 2019Revenues Actual Actual Adopted Proposed FY 2020Transfer from CATS Operating $15,709,208 $18,317,757 $10,712,941 $12,933,384 20.7 %Interest on Investments $227,294 $603,307 - - 0.0 %
Total Revenues $15,936,502 $18,921,064 $10,712,941 $12,933,384 20.7 %
Fund Balance - - $13,571,716 $8,093,076 -40.4 %Total Revenues and Fund Balance $15,936,502 $18,921,064 $24,284,657 $21,026,460 -13.4 %
ExpendituresTransfer to CATS CIP $4,755,000 $4,825,000 $13,571,716 $8,093,076 -40.4 %Reserved for Future Years $11,181,502 $14,096,064 $10,712,941 $12,933,384 20.7 %
Total Expenditures $15,936,502 $18,921,064 $24,284,657 $21,026,460 -13.4 %
179

Charlotte Water
21 21
Office of the Director
Administration and Business
Customer Service Laboratory Planning and
DevelopmentField
OperationsWater
TreatmentEnvironmental Management
Facilities and Maintenance
Mission Statement Charlotte Water is committed to both customer satisfaction and customer confidence. We treat and distribute safe and sufficient drinking water to our customers. We protect the environment by collecting and treating wastewater, beneficially reusing residuals, and regulating system discharges. We accomplish our mission through well-trained and dedicated employees.
Department Overview
Provide customers with a well-managed utility committed to providing responsive services, reasonable rates,and effective communication
Promote a safe, healthy, and inclusive community by supplying high quality drinking water and the saferemoval of treated wastewater
Enable mobility, accessibility, and connectivity through strategic investments in maintaining water andwastewater infrastructure
Support job growth and economic development by providing the water and wastewater capacity needed forresidential, industrial, and commercial growth
Explore regional solutions to water and wastewater management and support the current and future needs ofthe region
Organizational Chart
180

Charlotte Water
11
Budget OverviewPercent Change
FY 2017 FY 2018 FY 2019 FY 2020 FY 2019Actual Actual Adopted Proposed FY 2020
Revenues
Volumetric user charges-water $125,105,992 $114,097,961 $128,550,479 $128,957,478 0.3 %Volumetric user charges-sewer $164,494,099 $160,909,954 $168,604,824 $179,785,179 6.6 %Fixed user charges - water $11,719,913 $13,649,637 $14,960,446 $16,027,889 7.1 %Fixed user charges - sewer $10,604,188 $12,321,278 $13,719,477 $14,693,518 7.1 %Availability fee - water $14,654,593 $16,460,565 $14,722,715 $6,251,628 -57.5 %Availability fee - sewer $30,258,964 $34,578,334 $33,935,053 $38,709,514 14.1 %Connection fees - water $6,808,075 $9,823,349 $5,500,000 $7,000,000 27.3 %Connection fees - sewer $2,846,742 $3,602,318 $2,750,000 $3,000,000 9.1 %System development fees - water $10,339,446 $13,081,735 $7,000,000 $5,050,500 -27.9 %System development fees - sewer $13,950,674 $15,233,969 $7,000,000 $4,900,000 -30.0 %BOD, SS, & IW surcharges $5,501,054 $5,315,951 $5,404,500 $6,040,000 11.8 %Interest Earnings $1,307,938 $4,377,161 $2,053,834 $9,000,000 338.2 %Specific service charges $4,711,539 $5,857,442 $4,805,000 $9,000,000 87.3 %Other operating revenue $7,300,742 $8,007,839 $3,967,000 $3,000,000 -24.4 %Union County Operations $2,879,872 $2,974,639 $3,201,542 $0 -100.0 %Uncollectable Revenue -$2,222,256 -$2,543,322 -$2,700,000 -$2,500,000 -7.4 %Fund Balance $0 $0 $56,156,580 $20,947,505 -62.7 %Total Revenues $410,261,575 $417,748,810 $469,631,450 $449,863,211 -4.2 %ExpendituresPersonnel Services $61,637,141 $65,324,735 $76,860,679 $83,649,748 8.8 %Operating Expenses $68,160,637 $65,223,991 $81,834,063 $82,640,647 1.0 %Capital Outlay $6,306,965 $2,710,322 $1,302,500 $823,500 -36.8 %Departmental Charges -$15,699,142 -$15,767,842 -$17,191,668 -$17,178,386 -0.1 %City Administrative Support $13,771,183 $14,777,397 $15,793,351 $18,165,018 15.0 %Transfer to Debt Service Funds $86,985,604 $96,354,670 $155,037,213 $151,762,684 -2.1 %Transfer to Capital Projects Fund $153,149,395 $151,855,904 $155,995,312 $130,000,000 -16.7 %Total Expenditures $374,311,783 $380,479,177 $469,631,450 $449,863,211 -4.2 %Reserved for Future Years $35,949,792 $37,269,633 $0 $0 0.0 %
181

Charlotte Water
1 1
FY 2020 Adjustments
Budget Action FTE Amount
Provide funds for citywide compensation increase - $908,661Support compensation increase for employees in FY 2020 which includes: a three percent merit increase pool for salaried employees; a 1.5 percent market increase and 1.5 percent merit increase pool for hourly employees; and a 1.5 percent market increase and step increase (2.5 to five percent) for eligible public safety pay plan employees.
Provide additional compensation for general employees - $500,000Provide additional funds to hourly employees beyond a typical three percent salary increase. The adjustment includes acceleration of the hourly employee market increase to December (from February), and funds to ensure that all general employees with an acceptable performance review will receive at least a $1/hour increase in FY 2020.
Enhance Charlotte Water's Rehabilitation and Replacement efforts with 16 new positions
16.00 $837,254
Add 16 positions, including a CCTV crew and two Right-of-Way clearing crews, to support the rehabilitation and replacement of water and sewer infrastructure. The renewal of aging infrastructure is necessary to maintain water quality standards and system pressures needed for fire protection, and to maintain resident and environmental health.
Enable Charlotte Water to keep pace with service area growth with six new positions
6.00 $595,425
Add six positions, including a Senior Engineer and Engineering Project Manager, to assist in prioritizing projects and effectively executing Charlotte Water's Capital Investment Plan. These positions will support enhanced water and sewer system capacity that can accommodate continued growth and economic development around Mecklenburg County.
Maintain compliance with regulatory requirements with 12 new positions 12.00 $964,128
Add 12 positions, including a Compliance Supervisor, Water Quality Program Specialist, and five Water Treatment Plant Operators, to ensure customers have the best water and wastewater service available.
Provide a well-managed utility with five new positions 5.00 $465,702
Add five positions, including an Administrative Officer III to support the city's Charlotte Business INClusion efforts and a Business Systems Specialist to support construction project management information systems.
182

Charlotte Water
2 2
FY 2020 Adjustments (continued)
Budget Action FTE Amount
Provide a well-managed utility by supporting positions in the General Fund - $537,888
Support the addition of positions located in the General Fund which will enable Charlotte Water to better serve its customers such as obtaining timely permitting from CDOT and making timely payment to vendors. Corresponding adjustments can be found in Finance, General Services, and Transportation.
Enhance Charlotte Water's Apprenticeship Program - $130,185Support Charlotte Water's FY 2020 goal to hire five additional apprentices to promote upward mobility and workforce development. This adjustment will increase the total number of Charlotte Water apprentices to 15.
Enhance Charlotte Water's Security and Emergency Response - $310,000Support additional security camera monitoring and patrolling, as well as updates to Charlotte Water's emergency response plan.
Provide additional funds for fuel - $195,945Support increased fuel costs for the Field Operations division, including $135,000 to purchase renewable diesel as part of the city's effort to be more sustainable.
Provide additional funds for interlocal agreements - $334,087Support contractual cost increases for interlocal agreements the city has with neighboring governments to utilize their water and wastewater infrastructure to ensure reliable service for Charlotte Water customers.
Provide additional funds for cost increases in repair and Right-of-Way maintenance contracts
- $900,000
Support cost increases in emergency, routine repair, and Right-of-Way clearing contracts.
Provide additional funds for cost increases in software maintenance - $470,000Support additional software maintenance costs for more than 30 systems used to operate infrastructure and serve customers.
Provide additional funds for cost increases in chemicals used for water and wastewater treatment
- $476,741
Support a 4.4 percent increase in the purchase of chemicals needed due to higher prices, as well as higher quantities as more customers join the system.
183

Charlotte Water
3 3
FY 2020 Adjustments (continued)
Budget Action FTE Amount
Align budget to reflect the termination of the Union County contract - -$1,938,404Reduce Charlotte Water's budget allocated for Union County operations. Charlotte Water's contract with Union County to operate its wastewater treatment plants ended in FY 2019. There is a corresponding revenue reduction associated with this budget adjustment.
Reduce Charlotte Water's Pay-As-You-Go contribution to its Capital Investment Plan
- -$25,995,312
Technical adjustment to update the cash transfer to capital projects based on Charlotte Water's financial planning and capital project schedule. This is a routine action that occurs at the beginning of the budget cycle.
Reduce funds transferred to debt service - -$3,274,529Technical adjustment to update the amount of funds dedicated to paying debt service. This reduction is partially the result of refinancing outstanding debt.
Align miscellaneous budgets to actual expenditures - -$148,233Update budgets in various operating categories to better reflect recent and anticipated spending.
Update personnel expenditures - $1,870,402Technical adjustment to update department costs for personnel services. The update includes the full annual cost of salary increases approved in FY 2019, an update to employer healthcare costs, and the impact of staffing changes that have occurred in FY 2019. These are routine actions that occur at the beginning of the budget cycle. This change also reflects an update to the reimbursement for staff time on capital projects.
Adjust employer contribution to the North Carolina Local Governmental Employees' Retirement System (NCLGERS)
- $638,271
Technical adjustment for the required employer retirement contribution based on the NCLGERS Board of Trustees January action to increase employer rates from 7.75 percent to 8.95 percent for general employees and 8.50 percent to 9.70 percent for law enforcement officers.
Update allocations for Internal Service Providers (ISPs) - $369,112Technical adjustment to update funds needed to support ISPs based on anticipated cost of services. ISPs provide services to other city departments, including: building maintenance; rent of land and buildings; telecommunication; insurance liabilities; insurance premiums; and risk administration.
184

Charlotte Water
4 4
FY 2020 Adjustments (continued)
Budget Action FTE Amount
Update allocations for City Cost Allocation Plan and ERP Support - $1,084,438Technical adjustment to update funds needed to support central service staff and overhead based on accepted cost allocation principles. Central service staff and overhead include the personnel and operating costs for departments such as the City Manager's office, City Attorney's office, Finance, and Human Resources.
Net Change 39.00 -$19,768,239
Performance Measure Highlights
2018 FY 2019 FY 2020
Objective Measure Actual Target Target
Strategic Priority Area: Transportation and Planning (Mobility, Accessibility, and Connectivity)
Enhance existing water infrastructure
Feet of aging pipe rehabilitated or replaced
34,300 ≥ 50,000 ≥ 55,000
Strategic Priority Area: Neighborhood Development (Safe, Healthy, and Inclusive Communities)
Protect the environment by reducing the number of sanitary sewer overflows
Sanitary sewer overflows per 100 miles of pipe
+/- 3.8 <4.0 <3.5
Strategic Priority Area: Well Managed Government (Efficient, Effective, Accountable, Responsive, Inclusive, and Customer Focused)
Enhance customer satisfaction through responsive service
Percentage of requests for service such as turn-ons and move-ins that meet customers' desired time-frame
96.24% 96.50% 96.75%
Promote customer safety through the delivery of clean water
Percentage of applicable requirements met for the Safe Drinking Water Act and Clean Water Act
100% compliance 100% compliance 100% compliance
Strategic Priority Area: Economic Development (Economy, Jobs, and Upward Mobility)
Create jobs and promote upward mobility through an Apprenticeship Program
Number of apprentices hired 6 >10 >15
185

Charlotte Water
27 27
Full-Time Equivalent (FTE) Position Summary
Position Title FY 2019 FTE Change in FTE FY 2020 FTE
Accountant II 2.00 - 2.00
Accountant III 1.00 - 1.00
Accountant IV - 1.00 1.00
Administrative Officer I 12.00 2.00 14.00
Administrative Officer II 8.00 - 8.00
Administrative Officer III 9.00 1.00 10.00
Administrative Officer IV 1.00 1.00 2.00
Administrative Officer V 1.00 - 1.00
Administrative Secretary I 1.00 - 1.00
Administrative Services Manager 1.00 - 1.00
Building Maintenance Assistant 1.00 - 1.00
Business Systems Specialist Intermediate 3.00 - 3.00
Business Systems Specialist Lead 6.00 1.00 7.00
Business System Specialist Senior 16.00 2.00 18.00
Business Systems Program Manager 3.00 - 3.00
Business Systems Supervisor 1.00 - 1.00
CCTV Crew Chief 4.00 - 4.00
CCTV Technician 4.00 - 4.00
Centrifuge/Solids Operator 1.00 - 1.00
Chief Construction Inspector 5.00 1.00 6.00
Chief Electrical Engineer 2.00 - 2.00
Chief Engineer- Utilities 2.00 - 2.00
Construction Inspector 39.00 - 39.00
Construction Supervisor 4.00 1.00 5.00
Content Webmaster 1.00 - 1.00
Contracts Admin Coordinator 2.00 - 2.00
Contracts Admin Specialist 1.00 - 1.00Customer/Revenue Service Assistant Senior
4.00 - 4.00
Customer/Revenue Service Assistant 12.00 5.00 17.00
Customer/Revenue Service Specialist 4.00 -1.00 3.00
Deputy Utilities Director 3.00 - 3.00
Division Training Specialist 7.00 -6.00 1.00
Drafting Technician 4.00 - 4.00
Electrical Engineer 1.00 - 1.00
Electrical Engineer Senior 3.00 - 3.00
186

Charlotte Water
28 28
Full-Time Equivalent (FTE) Position Summary (continued)
Position Title FY 2019 FTE Change in FTE FY 2020 FTE
Engineering Services Investigator 6.00 - 6.00
Engineering Assistant 10.00 1.00 11.00
Engineering Contracts Manager 1.00 - 1.00
Engineering Division Manager 6.00 - 6.00
Engineering Program Manager 1.00 - 1.00
Engineering Project Coordinator 14.00 2.00 16.00
Engineering Project Manager 9.00 1.00 10.00
Engineering Services Supervisor 1.00 - 1.00
Environmental Compliance Manager 3.00 1.00 4.00
Environmental Compliance Specialist 6.00 - 6.00
Environmental Compliance Supervisor 2.00 - 2.00
Environmental Program Inspector 11.00 - 11.00
Equipment Operator II 1.00 - 1.00
Equipment Operator III 12.00 - 12.00
Facilities Services Coordinator 2.00 1.00 3.00
Field Operations Supervisor 14.00 3.00 17.00
GIS Analyst 4.00 -1.00 3.00
GIS Coordinator 1.00 - 1.00
GIS Technician 2.00 - 2.00
Industrial Meter Repair Crew Chief 2.00 - 2.00
Industrial Meter Repair Technician 7.00 1.00 8.00
Information Security Analyst 1.00 -1.00 -
Instrument Technician 5.00 1.00 6.00
Instruments & Controls Supervisor 1.00 - 1.00
IT Project Manager 1.00 - 1.00
IT Project Manager Associate 1.00 - 1.00
Lab Quality Assurance Admininstrator 1.00 - 1.00
Lab Quality Assurance Analyst 1.00 - 1.00
Labor Crew Chief I 44.00 4.00 48.00
Labor Crew Chief II 36.00 - 36.00
Laboratory Analyst I 2.00 - 2.00
Laboratory Analyst II 17.00 -1.00 16.00
Laboratory Analyst III 7.00 1.00 8.00
Laboratory Manager 1.00 - 1.00
Laboratory Supervisor 5.00 - 5.00
Laborer 4.00 1.00 5.00
Lift Station Technician 4.00 - 4.00
187

Charlotte Water
29 29
Full-Time Equivalent (FTE) Position Summary (continued)
Position Title FY 2019 FTE Change in FTE FY 2020 FTE
Management Analyst 2.00 - 2.00
Management Analyst Senior 3.00 - 3.00
Manhole Inspector 6.00 2.00 8.00
Meter Services Supervisor 1.00 - 1.00
Office Assistant IV 3.00 - 3.00
Office Assistant V 9.00 - 9.00
Operations Supervisor 10.00 - 10.00
Plan Review Engineer 3.00 - 3.00
Planning/Design Engineer 2.00 - 2.00
Plans Reviewer 7.00 - 7.00
Public Information Specialist Senior 2.00 - 2.00
Public Services Division Manager 1.00 - 1.00
Pump Station Technician 3.00 - 3.00
Pumping Station Supervisor 1.00 - 1.00
Purchasing Agent 3.00 1.00 4.00
Revenue Collection & Credit Officer 1.00 - 1.00
Safety Coordinator 1.00 - 1.00
Safety Coordinator Senior 4.00 - 4.00
Safety Supervisor 1.00 - 1.00
Senior Engineer 10.00 2.00 12.00
Senior Engineering Project Manager 15.00 - 15.00
Senior Technician Service Specialist 1.00 - 1.00
Service Dispatcher 5.00 -5.00 -
Software Developer Senior 2.00 - 2.00
Senior Business Systems Manager 1.00 - 1.00
Senior Water Service Technician 16.00 2.00 18.00
Storekeeper 2.00 - 2.00
Stores Supervisor 2.00 -1.00 1.00
Survey Party Chief 4.00 - 4.00
Survey Supervisor 1.00 - 1.00
Survey Technician 25.00 - 25.00
Technical Systems Specialist 1.00 2.00 3.00
Technology Support Coordinator 1.00 -1.00 -
Training Specialist 1.00 6.00 7.00
Treatment Operations Coordinator 1.00 - 1.00
Treatment Plant Electrician 4.00 - 4.00
Treatment Plant Maintenance Manager 2.00 - 2.00
188

Charlotte Water
30 30
Full-Time Equivalent (FTE) Position Summary (continued)
Position Title FY 2019 FTE Change in FTE FY 2020 FTE
Treatment Plant Maintenance Supervisor 6.00 - 6.00
Treatment Plant Mechanic Assistant 6.00 - 6.00
Treatment Plant Mechanic I 5.00 -1.00 4.00
Treatment Plant Mechanic II 20.00 -1.00 19.00
Treatment Plant Mechanic III 7.00 2.00 9.00
Utilities Business Manager 1.00 - 1.00
Utilities Director 1.00 - 1.00
Utilities Manager 6.00 - 6.00
Utilities Operations Manager 6.00 - 6.00
Utilities Planner Scheduler 8.00 - 8.00
Utilities Services Manager 4.00 -1.00 3.00
Utilities Services Tech 5.00 - 5.00
Utilities Technican II 62.00 8.00 70.00
Utilities Technician I 63.00 -3.00 60.00
Water Chief Treatment Plant Operator 7.00 - 7.00
Water Meter Repair Technician 9.00 - 9.00
Water Quality Program Administrator 4.00 - 4.00
Water Quality Program Specialist 5.00 1.00 6.00
Water Quality Technician II 10.00 - 10.00
Water Quality Technician Lead 2.00 - 2.00
Water Service Technician 49.00 -1.00 48.00
Water Treatment Plant Operator A 15.00 3.00 18.00
Water Treatment Plant Operator B 2.00 5.00 7.00
Water Treatment Plant Operator C 5.00 -3.00 2.00
Water Treatment Plant Supervisor 2.00 - 2.00
Water Treatment Plant Supervisor Senior 1.00 - 1.00Wastewater Chief Treatment Plant Operator
7.00 - 7.00
Wastewater Treatment Plant Operator I 3.00 - 3.00
Wastewater Treatment Plant Operator II 5.00 -2.00 3.00
Wastewater Treatment Plant Operator III 3.00 1.00 4.00
Wastewater Treatment Plant Operator IV 34.00 2.00 36.00Wastewater Treatment Plant Operator IC Senior
17.00 -1.00 16.00
Wastewater Treatment Plant Supervisor 6.00 - 6.00
Department Total FTE 958.00 39.00 997.00
189

Charlotte Water
Debt Service Funds
1 1
The Water and Sewer Debt Service Funds represents the retirement of debt for Charlotte Water. Revenues are provided primarily from Charlotte Water's operating budget with expenses dedicated to retiring debt incurred to make capital investments in water and sewer infrastructure.
Percent
Change
FY 2017 FY 2018 FY 2019 FY 2020 FY 2019
Actual Actual Adopted Proposed FY 2020
Operating Revenues
Contribution from W/S Operating Fund $151,772,324 $151,455,830 $153,238,898 $149,640,083 -2.3 %Premium from Sale of Bonds - $57,954,648 $50,000 $50,000 0.0 %
Interest Transferred from other Funds: Water and Sewer Operating $1,626,022 $400,074 $1,798,316 $2,122,603 18.0 % Community Investment Plan and Other $47,991 $650,041 $255,518 $301,595 18.0 %
Proceeds from Refunding - $409,915,000 - - 0.0 %
Interest on Investments - $10,941 - - 0.0 %
Other Interest - $466,476 - - 0.0 %
Total Revenue $153,446,337 $620,853,010 $155,342,732 $152,114,281 -2.1 %
Operating Expenditures
Bond Retirement $76,487,662 $78,829,992 $83,524,238 $79,567,379 -4.7 %Interest on Bonds $69,460,931 $62,100,284 $64,771,083 $62,933,925 -2.8 %Bank Charges $746,132 $728,382 $834,000 $791,500 -5.1 %Cost of Bond Sales - $1,959,698 $50,000 $97,500 95.0 %
Equipment Lease - Purchase Principal $4,399,979 $4,093,630 $5,377,276 $6,301,769 0.2 %
Equipment Lease - Purchase Interest $470,095 $1,417,206 $786,135 $803,190 0.0 %
State Revolving Loan Principal - - - $1,365,653 0.0 %
State Revolving Loan Interest - - - $253,365 0.0 %
Payment to Escrow Agent - $465,812,638 - - 0.0 %
Reserved for Future Years $1,881,537 $5,911,180 - - 0.0 %
Total Expenditures $153,446,336 $620,853,010 $155,342,732 $152,114,281 -2.1 %
Note: Prior to the FY 2020 Budget, state revolving loan principal and interest payments were consolidated into "Bond Retirement" and "Interest on Bonds"; they are presented separately in FY 2020.
190

Storm Water
1 1
Storm Water Division
AdministrationStrategic Planning
Construction Design EngineeringSurface
Water Quality
Mission Statement Repairs the storm drainage system to reduce flood risks and protect the traveling public and assures storm water runoff is as clean as possible to protect surface waters.
Department Overview
Oversee more than 100,000 storm drains and 6,200 miles of pipes and open streams Plan, design, construct and maintain storm water infrastructure to reduce flood risks and protect the traveling public Improve and protect surface waters as required by the Federal Clean Water Act Calculate impervious surface area for fees collected from property owners to fund capital and operating expenses
Organizational Chart
Budget Overview Percent Change
FY 2017 FY 2018 FY 2019 FY 2020 FY 2019
Revenues Actual Actual Adopted Proposed FY 2020
-71169620
Charges for Storm Water Fees $67,229,015 $68,081,277 $71,169,620 $71,525,468 0.5 %
Investment Earnings $39,268 $331,945 $0 $0 0.0 %
Other $461 $693 $0 $0 0.0 %
Fund Balance $0 $0 $4,499,679 $19,278,161 328.4 %
Total Revenues $67,268,743 $68,413,915 $75,669,299 $90,803,629 20.0 %
191

Storm Water
2 2
Budget Overview (continued) Percent Change
FY 2017 FY 2018 FY 2019 FY 2020 FY 2019
Expenditures Actual Actual Adopted Proposed FY 2020
Personnel Services $10,937,982 $9,360,664 $14,660,512 $15,501,115 5.7 %
Operating Expenses $7,809,785 $7,976,098 $10,213,395 $10,100,069 -1.1 %Departmental Charges -$8,625,369 -$11,318,378 -$9,497,750 -$9,812,920 3.3 %
Sub-Total Operating $10,122,398 $6,018,384 $15,376,157 $15,788,264 2.7 %
Transfer to Other Funds: $0 $10,000 $0 0.0 %
Storm Water Capital Fund $43,000,000 $39,000,000 $47,000,000 $61,000,000 29.8 %
Storm Water Debt Service $12,544,230 $12,544,794 $13,293,142 $14,015,365 5.4 %
Sub-Total Transfers $55,544,230 $51,544,794 $60,293,142 $75,015,365 24.4 %
Reserved for Future Years $1,602,115 $10,840,737 $0 $0 0.0 %
Total Expenditures $67,268,743 $68,403,915 $75,669,299 $90,803,629 20.0 %
192

Storm Water
3 3
FY 2020 Adjustments
Budget Action FTE Amount
Provide funds for citywide compensation increase - $213,060Support compensation increase for employees in FY 2020 which includes: a three percent merit increase pool for salaried employees; a 1.5 percent market increase and 1.5 percent merit increase pool for hourly employees; and a 1.5 percent market increase and step increase (2.5 to five percent) for eligible public safety pay plan employees.
Provide additional compensation to general employees - $50,000Provide additional funds to general employees beyond a typical three percent salary increase. The adjustment includes acceleration of the hourly employee market increase to December (from February), and funds to ensure that all general employees with an acceptable performance review will receive at least a $1/hour increase in FY 2020.
Provide additional funding for the completion of Storm Water capital projects - $14,000,000Support for capital expenditures for projects prioritized with regards to standards of public safety and public liability.
Provide additional positions to increase the number of completed capital projects
18.00 $236,516
Provide funds for a planned increase in the number of storm water projects completed in FY 2020. Funding is provided in full for seven positions and in part for the remaining 11 positions.
Adjust debt service expenditures - $722,223Technical adjustment for an increase in debt service expenditures for general obligation bond refunding, interest on Bond Anticipation Notes, and miscellaneous debt charges such as debt issuances and debt fees.
Update departmental charges - -$742,500Technical adjustment to department charges resulting from the increase in capital expenditures. A reduction is the result of additional staff time anticipated to be devoted to projects in FY 2020.
Update personnel expenditures - $757,656Technical adjustment to update department costs for personnel services. The update includes the full annual cost of salary increases approved in FY 2019, an update to employer healthcare costs, and the impact of staffing changes that have occurred in FY 2019. These are routine actions that occur at the beginning of the budget cycle.
193

Storm Water
4 4
FY 2020 Adjustments (continued)
Budget Action FTE Amount
Adjust employer contribution to the North Carolina Local Governmental Employees' Retirement System (NCLGERS)
- $130,549
Technical adjustment for the required employer retirement contribution based on the NCLGERS Board of Trustees January action to increase employer rates from 7.75 percent to 8.95 percent for general employees and 8.50 percent to 9.70 percent for law enforcement officers.
Update allocations for Internal Service Providers (ISPs) - -$233,174Technical adjustment to update funds needed to support ISPs based on anticipated cost of services. ISPs provide services to other city departments, including: building maintenance; rent of land and buildings; telecommunication; insurance liabilities; insurance premiums; and risk administration.
Net Change 18.00 $15,134,330
Performance Measure Highlights
FY 2018 FY 2019 FY 2020
Objective Measure Actual Target Target
Strategic Priority Area: Neighborhood Development (Safe, Healthy, and Inclusive Communities)
Safely drain surface water runoff from rain.
Miles of storm water infrastructure system rehabilitated or installed
5 New Measure 20 miles over 3 years
Improve surface water quality and comply with the Clean Water Act.
Number of acres of impervious area runoff treated prior to entering stream
New Measure New Measure 100 acres over 3 years
Improve surface water quality and comply with the Clean Water Act.
Number of feet of impaired stream improvements
New Measure New Measure 5,000 feet over 3 years
194

Storm Water
5 5
Full-Time Equivalent (FTE) Position Summary
Position Title FY 2019 FTE Change in FTE FY 2020 FTE
Administrative Officer II 1.00 - 1.00Administrative Officer III 1.00 - 1.00Administrative Officer IV 1.00 - 1.00Administrative Officer V 1.00 - 1.00Arborist 1.00 - 1.00Business System Specialist Associate 1.00 - 1.00Business Systems Specialist Intermediate 2.00 - 2.00Business Systems Specialist Lead 1.00 - 1.00Business Systems Manager 1.00 - 1.00CCTV Crew Chief 1.00 - 1.00CCTV Technician 1.00 - 1.00Construction Inspector 33.00 1.00 34.00Construction Inspector Senior 9.00 - 9.00Construction Manager 2.00 2.00 4.00Construction Supervisor 7.00 - 7.00Drainage Specialist 6.00 - 6.00Engineering Services Investigator 1.00 - 1.00Engineering Assistant 4.00 - 4.00Engineering Division Manager 1.00 - 1.00Engineering Program Manager 5.00 5.00Engineering Project Coordinator 9.00 - 9.00Engineering Project Manager 31.00 -1.00 30.00GIS Coordinator 1.00 - 1.00GIS Supervisor 1.00 - 1.00GIS Technician 5.00 - 5.00Project Coordinator - 1.00 1.00Project Manager - 3.00 3.00Public Information Specialist Senior 3.00 - 3.00Public Service Coordinator - 1.00 1.00Real Estate Agent II - 1.00 1.00Senior Construction Inspector - 1.00 1.00Senior Engineer 1.00 6.00 7.00Senior Engineering Project Manager 12.00 1.00 13.00Water Quality Modeler 1.00 - 1.00Water Quality Program Administrator 3.00 - 3.00
195

Storm Water
6 6
Full-Time Equivalent (FTE) Position Summary (continued)
Position Title FY 2019 FTE Change in FTE FY 2020 FTE
Water Quality Program Manager 1.00 - 1.00Water Quality Program Specialist 3.00 2.00 5.00Web Content Administrator 1.00 - 1.00Wetland Specialist 1.00 - 1.00
Department Total FTE 153.00 18.00 171.00
196

Storm WaterDebt Service Fund
39 39
Storm Water Debt Service Fund is used to account for the payment of principal, interest, and related costs for long-term debt, primarily through the issuance of Revenue Bonds, to support the construction, repair, and maintenance of storm water capital infrastructure in the public right-of-way drainage system. Revenues are provided primarily through a transfer from the Storm Water Operating Fund with expenses dedicated to retirement of long-term debt.
Percent Change
FY 2017 FY 2018 FY 2019 FY 2020 FY 2019 Actual Actual Adopted Proposed FY 2020
Revenues
Contribution from Storm Water Operating
$12,544,230 $12,554,794 $13,293,142 $14,015,365 5.4%
Premium on Sale of Debt $0 $0 $0 $50,000 100.0% Proceeds from Sale of Bonds $0 $194,250 $0 $0 0.0%
Total Revenues $12,544,230 $12,749,044 $13,293,142 $14,065,365 5.8%
Fund Balance $2,788 $0 $0 $0 0.0%
Expenditures
Bond Retirement $6,016,337 $6,255,269 $6,347,294 $6,482,026 2.1% Interest on Bonds $6,521,848 $6,267,784 $6,733,580 $7,503,339 11.4% Cost of Bond Sale - $185,516 - $50,000 100.0% Fees $8,833 $13,026 $212,268 $30,000 -85.9%
Total Expenditures $12,547,018 $12,721,594 $13,293,142 $14,065,365 5.8%
Reserved for Future Years $0 $27,630 $0 $0 0.0%
197

62 62
This page intentionally left blank.

2 2
INTERNAL SERVICES
FUNDS
NONGENERAL FUNDS

62 62
This page intentionally left blank.

Employee Life
and Health Fund
1 1
Mission Statement Help employees thrive by creating and offering a comprehensive portfolio of benefits options that provides value to
the unique and changing needs of our workforce and supports health, well-being, and financial security for employees
through their career life cycle.
Fund Overview
• Recruit, retain, and support employees through a comprehensive portfolio of benefits designed to protecttheir health and well-being
• Provide group insurance coverages, including medical, prescription drug, life, dental, and disability• Offer benefits plans which provide income protection against unexpected health, life, and disability risks• Manage health care costs through employee cost-sharing• Mitigate health care costs and improve employee health through wellness initiatives that promote health and
engage employees
Budget Overview Percent Change
FY 2017 FY 2018 FY 2019 FY 2020 FY 2019 Actual Actual Adopted Proposed FY 2020
Revenues
Operating Revenues $111,677,102 $115,847,785 $118,383,800 $114,664,748 -3.1 %Fund Balance $0 $0 $0 $9,337,564 100.0 %
Total Revenues $111,677,102 $115,847,785 $118,383,800 $124,002,312 4.7 %
Expenditures
Operating Expeditures $104,623,059 $107,895,015 $118,383,800 $124,002,312 4.7 %
Reserved for Future Years $7,054,043 $7,952,770 $0 $0 0.0 %
Total Expenditures $111,677,102 $115,847,785 $118,383,800 $124,002,312 4.7 %
201

Risk Management Fund
2 2
Department of Finance
Office of Risk Manager
FinanceClaims
ManagementInsurance
ManagementRisk Control
Mission Statement To provide a safe environment for our employees and residents and ensure the protection of financial assets by
identifying, analyzing, and implementing risk prevention programs and developing effective channels of communication through excellent customer service.
Department Overview
• Identify and evaluate the risk and loss exposure for the City of Charlotte, Mecklenburg County, Charlotte-Mecklenburg School System, Charlotte Regional Visitors Authority, MEDIC, and the Public Library
• Provide risk control and consulting to all customers• Assist the City Attorney’s Office in litigation management• Collect monies due for damages to property and for liabilities incurred• Process property and casualty claims from external and internal customers
Organizational Chart
Budget Overview Percent Change
FY 2017 FY 2018 FY 2019 FY 2020 FY 2019 Actual Actual Adopted Proposed FY 2020
Revenues
Operating Revenues $22,521,350 $22,103,170 $23,435,634 $24,545,158 4.7%
Fund Balance $2,029,985 $12,650,956 $944,000 $1,562,000 65.5%
Total Revenues $24,551,335 $34,754,126 $24,379,634 $26,107,158 7.1%
Expenditures
Operating Expeditures $24,551,335 $34,754,126 $24,379,634 $26,107,158 7.1%
Total Expenditures $24,551,335 $34,754,126 $24,379,634 $26,107,158 7.1%
202
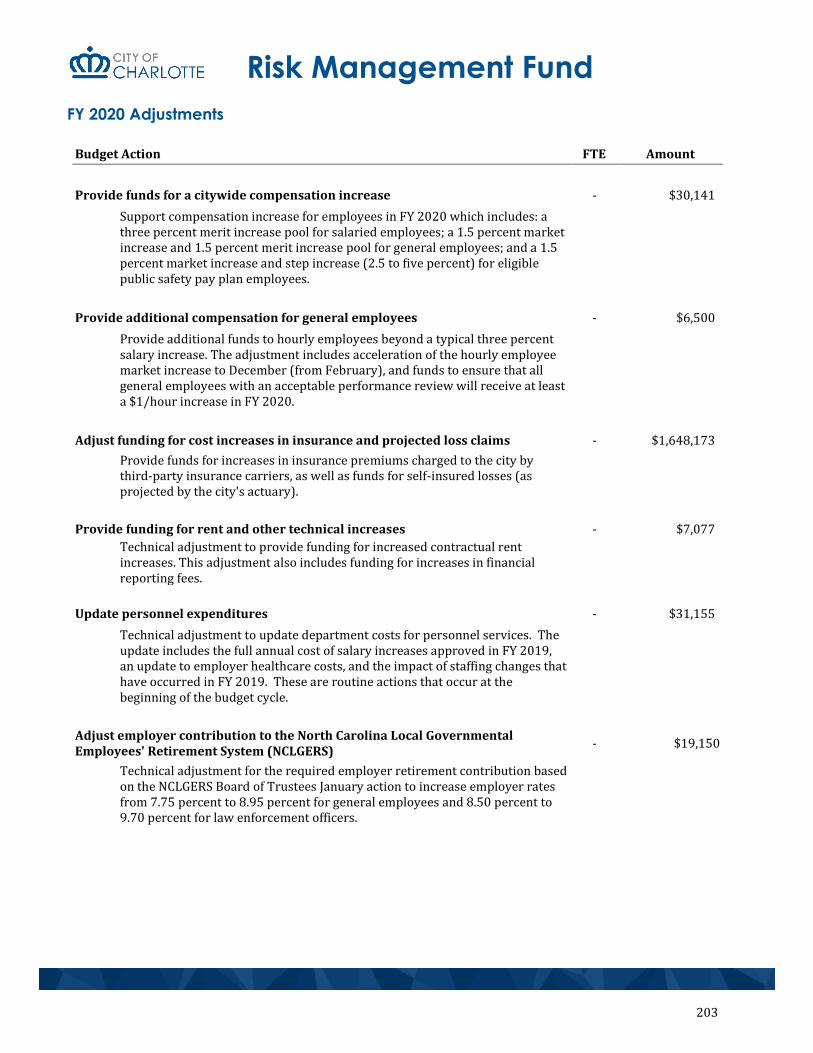
Risk Management Fund
3 3
FY 2020 Adjustments
Budget Action FTE Amount
Provide funds for a citywide compensation increase - $30,141Support compensation increase for employees in FY 2020 which includes: a three percent merit increase pool for salaried employees; a 1.5 percent market increase and 1.5 percent merit increase pool for general employees; and a 1.5 percent market increase and step increase (2.5 to five percent) for eligible public safety pay plan employees.
Provide additional compensation for general employees - $6,500Provide additional funds to hourly employees beyond a typical three percent salary increase. The adjustment includes acceleration of the hourly employee market increase to December (from February), and funds to ensure that all general employees with an acceptable performance review will receive at least a $1/hour increase in FY 2020.
Adjust funding for cost increases in insurance and projected loss claims - $1,648,173Provide funds for increases in insurance premiums charged to the city by third-party insurance carriers, as well as funds for self-insured losses (as projected by the city's actuary).
Provide funding for rent and other technical increases - $7,077Technical adjustment to provide funding for increased contractual rent increases. This adjustment also includes funding for increases in financial reporting fees.
Update personnel expenditures - $31,155Technical adjustment to update department costs for personnel services. The update includes the full annual cost of salary increases approved in FY 2019, an update to employer healthcare costs, and the impact of staffing changes that have occurred in FY 2019. These are routine actions that occur at the beginning of the budget cycle.
Adjust employer contribution to the North Carolina Local Governmental Employees' Retirement System (NCLGERS)
- $19,150
Technical adjustment for the required employer retirement contribution based on the NCLGERS Board of Trustees January action to increase employer rates from 7.75 percent to 8.95 percent for general employees and 8.50 percent to 9.70 percent for law enforcement officers.
203

Risk Management Fund
4 4
FY 2020 Adjustments
Budget Action FTE Amount
Update allocations for Internal Service Providers (ISPs) - -$14,672Technical adjustment to update funds needed to support ISPs based on anticipated cost of services. ISPs provide services to other city departments, including: building maintenance; rent of land and buildings; telecommunication; insurance liabilities; insurance premiums; and risk administration.
Net Change - $1,727,524
Full-Time Equivalent (FTE) Position Summary
Position Title FY 2019 FTE Change in FTE FY 2020 FTE
Accounting Technician 1.00 - 1.00
Administrative Officer I 1.00 - 1.00
Claims Assistant 4.00 - 4.00
Claims Manager 1.00 - 1.00
Claims Representative Senior 4.00 - 4.00
Contracts Admin Specialist 1.00 - 1.00
Insurance & Risk Coordinator 2.00 - 2.00
Insurance & Risk Manager 1.00 - 1.00
Risk Management Financial Coordinator 1.00 - 1.00
Safety Coordinator 1.00 - 1.00
Safety Coordinator Senior 4.00 - 4.00
Safety Supervisor 1.00 - 1.00
Workers' Compensation Claim Manager 1.00 - 1.00
Department Total FTE 23.00 - 23.00
204

3 3
SPECIAL REVENUE
FUNDS
NONGENERAL FUNDS

62 62
This page intentionally left blank.

Municipal Debt Service Fund
44 44
The Municipal Debt Service Fund is used to account for the accumulation of resources and the payment of principal, interest and related costs for all long-term debt other than debt issued for and serviced by business-type activities. Revenues are provided primarily through property and sales taxes.
Percent Change
FY 2017 FY 2018 FY 2019 FY 2020 FY 2019
Actual Actual Adopted Proposed FY 2020
Revenues Property Tax $87,107,281 $89,263,000 $94,010,494 $96,980,712 3.2 %
Sales Tax $19,805,977 $20,346,386 $20,521,284 $22,218,763 8.3 %
Interest on Investments $1,220,282 $2,677,628 $2,298,882 $4,284,000 86.4 % Interest Transferred from General Fund $948,643 $1,494,111 - - 0.0 %
Contribution from Other Funds
General Fund - Equipment $14,932,215 $15,071,933 $17,381,211 $19,065,411 9.7 % General Fund - Public Safety Communications $1,686,750 $1,685,950 $1,684,200 -
-100.0 %
Powell Bill Fund $1,652,678 $1,762,118 $2,131,697 $2,565,993 20.4 %
Proceeds from Lease Purchases - - $750,000 $750,000 0.0 %
Other $1,573,350 $1,925,000 $1,638,637 $1,956,691 19.4 %
Fund Balance - - - $33,059,067 100.0 %
Total Revenues $128,927,176 $134,226,126 $140,416,405 $180,880,637 28.8 %
Expenditures
Bonds
Principal $39,846,001 $45,631,105 $48,457,183 $45,228,877 -6.7 %
Interest $27,389,375 $30,468,486 $34,568,327 $30,068,746 -13.0 %
Debt Issue Expense $694,313 $579 $750,000 $750,000 0.0 %
Principal $21,658,094 $31,053,886 $19,456,875 $11,930,047 -38.7 %
Interest $7,382,524 $6,021,917 $10,247,474 $8,034,039 -21.6 %
Bank Charges and Other $720,154 $386,187 $2,027,388 $2,181,505 7.6 %
Contribution to
General Fund $1,214,599 $119,989 $122,859 $122,859 0.0 %
Capital Projects Fund - - - $82,245,000 100.0 %
Cultural Facilities Operating Fund $319,564 $319,564 $319,564 $319,564 0.0 %
Reserved for Future Years $29,702,552 $20,224,413 $24,466,735 --
100.0 %
Total Expenditures $128,927,176 $134,226,126 $140,416,405 $180,880,637 28.8 %
207
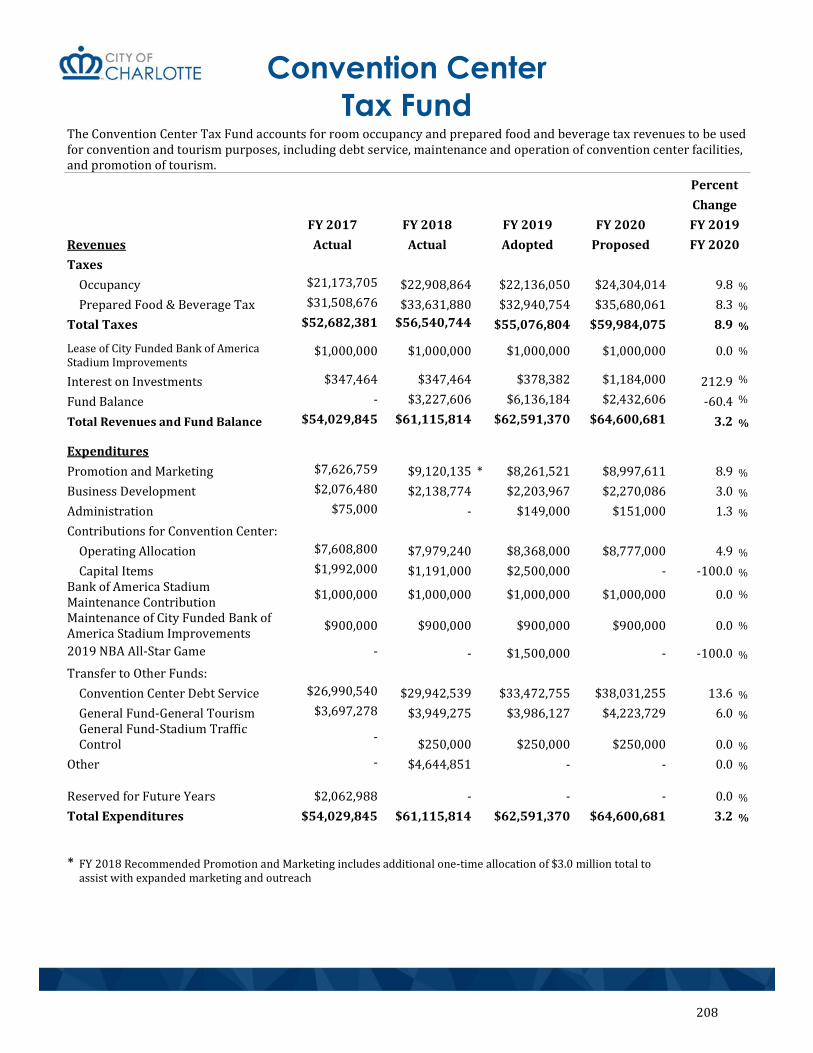
Convention Center Tax Fund
45 45
The Convention Center Tax Fund accounts for room occupancy and prepared food and beverage tax revenues to be used for convention and tourism purposes, including debt service, maintenance and operation of convention center facilities, and promotion of tourism.
Percent
Change
FY 2017 FY 2018 FY 2019 FY 2020 FY 2019
Revenues Actual Actual Adopted Proposed FY 2020
Taxes
Occupancy $21,173,705 $22,908,864 $22,136,050 $24,304,014 9.8 %
Prepared Food & Beverage Tax $31,508,676 $33,631,880 $32,940,754 $35,680,061 8.3 %
Total Taxes $52,682,381 $56,540,744 $55,076,804 $59,984,075 8.9 %
Lease of City Funded Bank of America Stadium Improvements
$1,000,000 $1,000,000 $1,000,000 $1,000,000 0.0 %
Interest on Investments $347,464 $347,464 $378,382 $1,184,000 212.9 %
Fund Balance - $3,227,606 $6,136,184 $2,432,606 -60.4 %
Total Revenues and Fund Balance $54,029,845 $61,115,814 $62,591,370 $64,600,681 3.2 %
Expenditures
Promotion and Marketing $7,626,759 $9,120,135 * $8,261,521 $8,997,611 8.9 %
Business Development $2,076,480 $2,138,774 $2,203,967 $2,270,086 3.0 %
Administration $75,000 - $149,000 $151,000 1.3 %
Contributions for Convention Center:
Operating Allocation $7,608,800 $7,979,240 $8,368,000 $8,777,000 4.9 %
Capital Items $1,992,000 $1,191,000 $2,500,000 - -100.0 % Bank of America Stadium Maintenance Contribution
$1,000,000 $1,000,000 $1,000,000 $1,000,000 0.0 %
Maintenance of City Funded Bank of America Stadium Improvements
$900,000 $900,000 $900,000 $900,000 0.0 %
2019 NBA All-Star Game - - $1,500,000 - -100.0 %
Transfer to Other Funds:
Convention Center Debt Service $26,990,540 $29,942,539 $33,472,755 $38,031,255 13.6 %
General Fund-General Tourism $3,697,278 $3,949,275 $3,986,127 $4,223,729 6.0 % General Fund-Stadium Traffic Control - $250,000 $250,000 $250,000 0.0 %
Other - $4,644,851 - - 0.0 %
Reserved for Future Years $2,062,988 - - - 0.0 %
Total Expenditures $54,029,845 $61,115,814 $62,591,370 $64,600,681 3.2 %
* FY 2018 Recommended Promotion and Marketing includes additional one-time allocation of $3.0 million total toassist with expanded marketing and outreach
208

Convention Center Debt Service Fund
46 46
The Convention Center Debt Service Fund is used to account for the accumulation of resources and the payment of principal, interest and related costs for long-term debt associated with the Convention Center. Revenue are provided primarily through a transfer of room occupancy tax and prepared food and beverage tax revenue from the Tourism Operating Fund.
Percent
Change FY 2017 FY 2018 FY 2019 FY 2020 FY 2019
Actual Actual Adopted Proposed FY 2020
Contribution from Convention Center Tax Fund $26,990,540 $29,942,539 $33,472,755 $38,031,255 13.6 %
Debt Proceeds - - $500,000 $250,000 -50.0 %
Total Revenues $26,990,540 $29,942,539 $33,972,755 $38,281,255 12.7 %
Debt Retirement $21,818,426 $25,204,464 $26,133,083 $28,907,472 10.6 %
Interest on Debt $5,148,567 $4,704,455 $7,269,422 $9,064,033 24.7 %
Bank Charges and Other $23,547 $31,128 $570,250 $309,750 -45.7 %
Reserved for Future Years - $2,492 - - 0.00 %
Total Expenditures $26,990,540 $29,942,539 $33,972,755 $38,281,255 12.7 %
209

Cultural Facilities Debt Service Fund
47 47
The Cultural Facilities Debt Service Fund is used to account for the accumulation of resources and the payment of principal, interest, and related costs for long-term debt associated with the city’s Cultural Facilities, including the construction of the Levine Center for the Arts Cultural Facilities (The Mint Museum, the Knight Theater, the Bechtler Museum of Modern Art, and the Harvey B. Gantt Center). Revenues are provided primarily through a transfer of sales tax revenue from the General Pay-As-You-Go Capital Fund.
Percent
Change FY 2017 FY 2018 FY 2019 FY 2020 FY 2019 Actual Actual Adopted Proposed FY 2020
Revenues
Tourism Operating Fund 9177614 $9,179,014 $9,189,413 $7,920,000 -13.8 %
Debt Proceeds - - $25,000 - -100.0 %
Total Revenues $9,177,614 $9,179,014 $9,214,413 $7,920,000 -14.0 %
Expenditures
Debt Retirement $3,155,000 $3,265,000 $3,395,000 $3,530,000 4.0 %
Interest on Debt $6,015,362 $5,905,013 $5,774,413 $4,370,000 -24.3 %
Cost of Sale - - $25,000 - -100.0 %
Bank Charges and Other $7,252 $7,252 $20,000 $20,000 0.0 %
Reserved for Future Years - $1,749 - - 0.0 %
Total Expenditures $9,177,614 $9,179,014 $9,214,413 $7,920,000 -14.0 %
210

Emergency Telephone System Fund
48 48
The Emergency Telephone System Fund receives revenue distributed by North Carolina State Treasury Department and authorized by N.C.G.S 149B. Revenues come from a charge imposed on voice communication that is distributed by the statewide 911 Board to offset the cost of 911 related services. The Charlotte-Mecklenburg Police Department is the Primary Public Safety Answering Point (PSAP) and Charlotte Fire Department and County Medic are Secondary PSAPs.
Percent Change
FY 2017 FY 2018 FY 2019 FY 2020 FY 2019 Actuals Actuals Adopted Proposed FY 2020
Revenues NC 911 Fund Distribution $3,598,629 $3,872,149 $3,290,691 $3,500,000 6.4 %
Interest Earnings $18,424 $37,663 $15,000 $15,000 0.0 %
Total Revenues $3,617,053 $3,909,812 $3,305,691 $3,515,000 6.3 %
Expenditures
911 Line Charges and Equipment $1,104,519 $870,706 $1,685,176 $1,428,473 -15.2 %
Software $778,730 $837,444 $834,704 $677,524 -18.8 %
Hardware $830,246 $776,511 $53,578 $161,749 201.9 %
Training $22,579 $20,906 $29,110 $29,984 3.0 %
Implementation of Projects $240,047 $226,508 $238,350 $245,501 3.0 %
Chalotte Fire Secondary PSAP $101,203 - $149,773 $150,000 0.2 %
County Medic Secondary PSAP $209,042 $299,901 $300,000 $350,000 16.7 %
Reserved for Future Years $330,687 $877,836 $15,000 $471,769 3,045.1 %
Total Expenditures $3,617,053 $3,909,812 $3,305,691 $3,515,000 6.3 %
211

General Grants Fund
49 49
The General Grants Fund comprises the majority of the Federal, State, and local grants that the city receives on an annual basis. Expenses are designated for a specific public purpose as required by the granting agency. Typical grants in this fund are for public safety, transportation, planning, and community relations.
Percent Change
FY 2017 FY 2018 FY 2019 FY 2020 FY 2019 Actual Budget Adopted Proposed FY 2020
Revenues Federal Grants $7,077,483 $8,868,416 $8,868,416 $8,561,333 -3.5%
State Grants $605,600 $359,600 $359,600 $340,100 -5.4%
Contributions $400,000 $853,217 $853,217 $1,603,949 88.0%
Assets Forfeiture $1,540,000 $1,400,000 $1,400,000 $1,750,000 25.0%
Contribution from General Fund $345,000 $649,638 $649,638 $322,181 -50.4%
Total Revenues $9,968,083 $12,130,871 $12,130,871 $12,577,563 3.7%
Expenditures Police
Assets Forfeiture Staffing $160,000 $169,000 - - 0.0%
Diversion Projects - - $245,000 $295,000 20.4%
DUI/Salaries - $30,000 $200,000 $200,000 0.0%
Forensics and Analysis $378,000 $725,000 $15,000 $15,000 0.0%
Grants Salaries and Benefits - - $1,874,924 $2,155,000 14.9%
Police Equipment and Overtime $1,722,000 $1,705,049 - - 0.0%
Federal Task Force - - $135,000 $250,000 85.2%
Federal Initiatives - - $109,500 $110,000 0.5%
JAG Grants - - $500,000 $600,000 20.0%
Youth/Community Initiatives $135,000 $177,000 $1,000,000 $1,121,000 12.1%
AF Equipment and Services - $1,058,000 $2,010,000 $1,750,000 -12.9%
AF Homicide Support Group $64,450 - - - 0.0%
AF Body Worn Cameras $1,250,550 $880,000 - - 0.0%
Fire Emergency Management $126,000 $120,000 $120,000 $80,000 -33.3%
Emergency Response $69,000 $1,001,400 $1,001,400 $2,085,000 108.2%
Medical Response $80,000 $80,000 $80,000 $72,000 -10.0%
Urban Area Security Initiative $2,400,000 $2,400,000 $2,400,000 - -100.0%
Transportation
Unified Planning Work Program $3,227,293 $3,297,152 $3,259,254 $3,351,797 2.8%
Metrolina Regional Travel Demand $141,790 $113,270 $141,586 $166,366 17.5%
Community Relations Fair Housing $102,000 $100,000 $100,000 $94,700 -5.3%
Dispute Settlement $100,000 $170,000 $170,000 $111,700 -34.3%
Private Contributions $12,000 $105,000 $105,000 $120,000 14.3%
Total Expenditures $9,968,083 $12,130,871 $13,466,664 $12,577,563 -6.6%
212

Hall of Fame
Tax Fund
1 1
The Hall of Fame Tax Fund accounts for room occupancy tax and private contribution revenues to be used for the NASCAR Hall of Fame.
Percent
Change
FY 2017 FY 2018 FY 2019 FY 2020 FY 2019
Actual Actual Adopted Proposed FY 2020
Revenues
Occupancy Tax $14,107,346 $15,195,604 $14,427,566 $16,121,017 11.7 %
Interest on Investments $117,923 $341,727 $113,639 $548,000 382.2 %
Fund Balance - - $313,429 - -100.0 %
Total Revenues $14,225,269 $15,537,331 $14,854,634 $16,669,017 12.2 %
Expenditures
Transfer to Debt Service $9,238,390 $9,265,600 $9,454,634 $9,290,024 -1.7 %
Contributions: Maintenance & Repair Allocation 1 $1,465,764 $2,216,106 $4,900,000 $2,900,000 -40.8 % Maintenance & Repair Reserve Deposit $500,000 $500,000 $500,000 $125,000 -75.0 %
Reserved for Future Years $3,021,115 $3,555,625 - $4,353,993 100.0 %
Total Expenditures $14,225,269 $15,537,331 $14,854,634 $16,669,017 12.2 %
1In FY 2019, one time capital funding of approximately $2 million was carried forward from FY 2018.
213

Hall of Fame Debt Service Fund
51 51
The Hall of Fame Debt Service Fund is used to account for the accumulation of resources and the payment of principal, interest and related costs for long-term debt associated with the Nascar Hall of Fame. Revenues are provided through transfer of room occupancy tax and private contribution revenues from the Hall of Fame Tax Fund.
Percent Change
FY 2017 FY 2018 FY 2019 FY 2020 FY 2019 Actual Actual Adopted Proposed FY 2020
Revenues
Hall of Fame Tax Fund $9,238,390 $9,265,600 $9,454,634 $9,290,024 -1.7 %
Fund Balance $131,294 $40,271 - - 0.0 %
Total Revenues $9,369,684 $9,305,871 $9,454,634 $9,290,024 -1.7 %
Expenditures
Debt Retirement $2,795,000 $2,955,000 $3,115,000 $3,280,000 5.3 % Interest on Debt $6,017,450 $5,796,744 $5,659,634 $5,147,700 -9.0 %Bank Charges and Other $557,234 $554,127 $680,000 $862,324 26.8 %
Total Expenditures $9,369,684 $9,305,871 $9,454,634 $9,290,024 -1.7 %
214

Tourism Operating Fund
1 1
Accounts for hotel room occupancy tax, rental car tax, and other tax revenue to be used for tourism and cultural purposes, including capital improvements, repairs, and maintenance of tourism- and cultural-related facilities.
Percent Change
FY 2017 FY 2018 FY 2019 FY 2020 FY 2019
Actuals Actuals Adopted Proposed FY 2020
Revenues
Occupancy Tax $11,152,226 $12,387,545 $11,659,095 $13,141,946 12.7 %
Rental Car Tax $3,605,511 $3,763,912 $3,714,488 $3,877,676 4.4 %
Interest on Investments $333,826 $883,000 $331,935 $1,364,000 310.9 %
Mint Museum Energy Repayment - $58,333 $87,000 $87,000 0.0 %
Contribution from Charlotte Hornets1, 2 $1,007,224 $1,027,584 $1,048,964 $1,071,412 2.1 %
Contribution from Center City Partners $50,694 $50,694 $50,694 $50,694 0.0 %
Transfers from General Capital PAYGO3 $9,121,084 $9,526,935 $9,235,176 $9,744,955 5.5 %
Transfers for Synthetic TIF: General Fund $1,291,024 $1,291,024 $1,291,024 $1,291,024 0.0 %
Municipal Debt Service $319,564 $319,564 $319,564 $319,564 0.0 %
PAYGO - - $41,412 $41,412 0.0 %
Contribution from County4 $2,948,040 $2,948,040 $2,948,040 $2,948,040 0.0 %
Miscellaneous $2,404,846 $2,233,856 - - 0.0 %
Fund Balance - - $3,682,705 $769,379 -79.1 %
Total Revenues $32,234,039 $34,490,487 $34,410,097 $34,707,102 0.9 %
Expenditures
Public Safety for PGA Championship - $269,471 - - Contributions to Tourism Capital:Baseball Stadium - City Share $632,088 $632,088 $632,088 $632,088 0.0 %
Baseball Stadium - Center City Partners $50,694 $50,694 $50,694 $50,694 0.0 %
Arena Maintenance Reserve $2,014,447 $2,055,170 $2,099,000 $2,144,000 2.1 %
Ovens/Bojangles Maintenance $400,000 $400,000 $400,000 $2,150,000 437.5 %
Cultural Facilities Maintenance $1,960,010 $2,063,000 $2,385,000 $3,410,000 43.0 %
Ovens Auditorium Special Projects - $1,500,000 $1,000,000 - -100.0 %
Contributions to Debt Service:Tourism Debt Service Fund $14,752,806 $14,817,779 $18,579,902 $18,324,320 -1.4 %
Cultural Facilities Debt Service Fund $9,177,614 $9,179,014 $9,189,413 $7,920,000 -13.8 %
Contractual Services - $3,099,702 $74,000 $76,000 2.7 %
Reserved for Future Years $3,246,380 $423,569 - - 0.0 %
Total Expenditures $32,234,039 $34,490,487 $34,410,097 $34,707,102 0.9 %
* Includes merged funds (formerly Cultural Facilities Operating and Tourism Operating Funds)1 In FY 2007 the city and Hornets each agreed to contribute $250,000 annually, with the amount increasing 5% each year up to an annual maximum level of$500,000 per party.
2 Per ammended agreement, the city and Hornets each contribute an additional $600,000 annually toward maintenance reserve for 10 year period beginningon 1/1/15.
3 Equivalent to rental car U-Drive-It tax.
4 In FY 2011, Mecklenburg County agreed to pay the city $2,948,040 for 25 years.
215
*

Tourism Debt Service Fund
53 53
The Tourism Debt Service Fund is used to account for the accumulation of resources and the payment of principal, interest, and related costs for long-term debt associated with Tourism related activities, including the construction of the Spectrum Arena. Revenue are provided primarily through a transfer of room occupancy tax, rental car tax, and other tax revenue from the Tourism Operating Fund.
Percent
Change
FY 2017 FY 2018 FY 2019 FY 2020 FY 2019
Actual Actual Budget Proposed FY 2020
Revenues
Contribution from Other Funds
Tourism Operating Fund $14,752,806 $14,817,779 $18,579,902 $18,324,320 -1.4 %
Debt Proceeds from Sale of Bonds - - $200,000 $200,000 0.0 %
Interest on Investments $48,870 - $78,595 - -100.0 %
Total Revenues $14,801,676 $14,817,779 $18,858,497 $18,524,320 -1.8 %
Expenditures
Debt Retirement $7,918,505 $8,306,168 $11,211,355 $11,492,056 2.5 %
Interest on Debt $6,137,099 $5,855,507 $6,652,142 $6,037,264 -9.2 %
Cost of Sale - - $200,000 $200,000 0.0 %
Bank Charges and Other $696,877 $654,854 $795,000 $795,000 0.0 %
Reserved for Future Years $49,195 $1,250 - - 0.0 %
Total Expenditures $14,801,676 $14,817,779 $18,858,497 $18,524,320 -1.8 %
216

Consolidated Housing and Neighborhood Services
Grants Funds
54 54
Housing and Neighborhood Services Consolidated Grants fund job training and placement for adults, youth, and dislocated workers; programs for people with AIDS; programs to prevent homelessness; programs to abate housing with lead-based paint; businesses that create jobs in Charlotte; redevelopment; and energy efficient improvements to homes.
Percent Change
FY 2017 FY 2018 FY 2019 FY 2020 FY 2019 Revenues Actual Budget Budget Proposed FY 2020
Housing Opportunities for People with AIDS (HOPWA) Grant $2,165,860 $1,962,622 $2,529,408 $2,725,653 7.8 % Double Oaks Loan Repayment $705,108 $705,108 $722,119 $730,688 1.2 % Emergency Solutions Grant $466,608 $466,608 $482,968 $507,237 5.0 % Continuum of Care $111,617 $47,388 $117,106 $127,124 8.6 % Bank of America Youth Grant $145,300 $122,700 $122,700 $122,700 0.0 % AARP Sustain Charlotte Swings Grant - - - $15,500 100.0 % Housing Grants Program Income $982,746 - - $865,000 100.0 % Sub-Total Housing Funding $4,577,239 $3,304,426 $3,974,301 $5,093,902 28.2 %
Federal HOME Investment Partnership Grant (HOME) $2,311,846 $2,330,231 $3,297,679 $2,972,112 -9.9 %HOME Program Income $773,248 $600,000 $600,000 $1,000,000 100.0 % Transfer from Other Funds: HOME Grant Local Match $574,884 $582,558 $824,420 $743,028 -9.9 %Sub-Total HOME Funding $3,659,978 $3,512,789 $4,722,099 $4,715,140 -0.1 %
Federal Community Development Block Grant (CDBG) $5,351,235 $5,364,974 $5,977,893 $5,827,128 -2.5 %CDBG Program Income $3,176,439 $300,000 $300,000 $385,000 100.0 % Sub-Total CDBG Funding $8,527,674 $5,664,974 $6,277,893 $6,212,128 -1.0 %
`
Workforce Investment Act (WIA) Adult $2,176,008 $1,962,622 $2,099,684 $2,099,684 0.0 %WIA Administration $603,916 $687,506 $713,861 $713,861 0.0 %WIA Youth $1,846,141 $2,155,438 $2,252,750 $2,252,750 0.0 %WIA Dislocated Worker $1,417,553 $2,065,200 $2,167,327 $2,167,327 0.0 %WIA Incentive $610,362 - - - 0.0 %Sub-Total WIA Funding $6,653,980 $6,870,766 $7,233,622 $7,233,622 0.0 %
Total Consolidated Housing and Neighborhood Grants Funding $23,418,872 $19,352,955 $22,207,915 $23,254,792 5.1 %
217

Consolidated Housing and Neighborhood Services
Grants Funds
55 55
Percent Change
FY 2017 FY 2018 FY 2019 FY 2020 FY 2019 Expenditures Actual Budget Budget Proposed FY 2020
Housing Opportunities for People with AIDS $2,165,860 $2,362,276 $2,529,408 $2,725,653 7.8 % Emergency Shelter Program $466,608 $466,608 $482,968 $507,237 5.0 % Continuum of Care $111,617 $47,388 $117,106 $127,124 8.6 % Double Oaks Loan Repayment $705,108 $705,108 $722,119 $730,688 1.2 % Bank of America Youth Grant $145,300 $122,700 $122,700 $122,700 0.0 % AARP Sustain Charlotte Swings Grant - - - $15,500 100.0 % Capital Expenditures - - - $865,000 100.0 % Sub-Total Housing Programs $3,594,493 $3,704,080 $3,974,301 $5,093,902 28.2 %
Sub-Total HOME Programs $3,659,978 $3,512,789 $4,722,099 $4,715,140 -0.1 %
Sub-Total Community Development Programs $8,527,674 $5,664,974 $6,277,893 $6,212,128 20.5 %
Education and Training Courses $2,786,370 $2,069,494 $2,097,468 $2,099,684 0.1 %
Contribution to Workforce Development $603,916 $687,506 $713,377 $713,861 8.4 % Summer and Year Round Youth Program $1,846,141 $2,155,439 $2,252,750 $2,252,750 0.0 % Dislocated Worker Contract $1,417,553 $2,065,200 $2,070,181 $2,167,327 4.7 % Sub-Total WIA Programs $6,653,980 $6,977,639 $7,133,776 $7,233,622 1.4 %
Total Consolidated Housing and Neighborhood Grants Expenditures $22,436,126 $19,859,482 $22,108,069 $23,254,792 5.1 %
218

Powell Bill Fund
56 56
Powell Bill Fund revenues consist mostly of State gas tax revenue distributed during the 4th quarter of each calendar year. Powell Bill funds are expended only for the purposes of maintaining, repairing, constructing, reconstructing, or widening of any street or public thoroughfare within municipal limits or for planning, construction, and maintenance of bikeways, greenways, or sidewalks.
Percent Change
FY 2017 FY 2018 FY 2019 FY 2020 FY 2019 Actual Actual Adopted Proposed FY 2020
Revenues
State Gas Tax Refund $20,394,270 $20,503,234 $20,503,333 $20,503,333 0.0%
Transfer from General Fund $4,261,000 $4,261,000 $4,261,000 $4,261,000 0.0%
Interest on Investments $70,853 $80,619 $80,000 $80,000 0.0%
Street Degradation Fee $752,124 $131,711 - - 0.0%
Other $141,973 $18,205 - - 0.0%
Sale of Used Vehicles $141,300 $278,400 - - 0.0%
Sale of Salvage $4,418 $3,782 - - 0.0%
Fund Balance $3,658,670 $188,678 $666,663 $1,000,000 50.0%
Total Revenues $29,424,608 $25,465,629 $25,510,996 $25,844,333 1.3%
Expenditures
Contracted Resurfacing $13,653,999 $13,504,445 $10,308,115 $10,641,452 3.2%
Repairs by City Forces $8,764,434 $6,657,787 $9,304,887 $8,501,012 -8.6%
Equipment Rent/Purchase $1,132,074 $1,056,003 $1,151,957 $1,151,957 0.0%
Street Drainage Maintenance $44,000 $15,077 $160,860 $160,860 0.0%
Traffic Control Improvements $581,786 $584,548 $623,786 $623,786 0.0%
Snow Removal $135,100 $207,422 $150,000 $150,000 0.0%
Physical Inventory of Streets - - $12,000 $12,000 0.0%
Pavement Management System $235,624 $90 $400,000 $400,000 0.0%
Wheel Chair Ramps $303,841 $540,854 $500,000 $500,000 0.0%
Annexation $1,783,785 - - - 0.0%
Storm Water Program Fees $1,137,273 $1,137,273 $1,137,273 $1,137,273 0.0%
Lease Purchase Contribution $1,652,692 $1,762,130 $1,762,118 $2,565,993 45.6%
Total Expenditures $29,424,608 $25,465,629 $25,510,996 $25,844,333 1.3%
219

Consolidated Municipal Service Districts
57 57
The Proposed FY 2020 Budget includes funding for the five Municipal Service Districts (MSDs) within the City of Charlotte. These special tax districts are designed to enhance the economic vitality and quality of life in the central business district or other commercial areas. Three of the MSDs are located in the Center City area, the fourth is located in the South End area, and the fifth is located in the University City area. All MSD revenues are generated through ad valorem property tax paid by the property owners (residential and commercial) in the designated districts and must be spent on programs and services that enhance the quality of the districts.
Percent Change
FY 2017 FY 2018 FY 2019 FY 2020 FY 2019 Operating Revenues Actual Actual Adopted Proposed FY 2020
Property Taxes $4,903,629 $5,088,593 $5,836,205 $6,124,775 4.9%
Total Revenues $4,903,629 $5,088,593 $5,836,205 $6,124,775 4.9%
Operating Expenditures
Contractual Services $4,875,114 $5,059,223 $5,805,954 $6,093,616 5.0%
City Services $28,515 $29,370 $30,251 $31,159 3.0%
Total Expenditures $4,903,629 $5,088,593 $5,836,205 $6,124,775 4.9%
220

Municipal Service Districts
58 58
There are five Municipal Service Districts (MSDs) in the City of Charlotte designed to enhance the economic viability and quality of life in select areas. Three MSDs are located in the Center City, the fourth is located in the South End area and a fifth district is located in the University City area. Revenues for these districts are generated through ad valorem taxes paid by property owners in the districts in addition to the city's regular tax rate.
District 1 (Center City)
Assessed value for FY 2020 is $12,892,535,666. The proposed budget includes an MSD neutral tax rate of 1.36¢ per $100 assessed valuation.
Budget Summary FY 2017 FY 2018 FY 2019 FY 2020 Actual Actual Adopted Proposed
Revenues
Property Taxes $1,307,066 $1,352,236 $1,685,156 $1,740,534
Total Municipal Service District 1 Revenues $1,307,066 $1,352,236 $1,685,156 $1,740,534
Expenditures
Contractual Services $1,307,066 $1,352,236 $1,685,156 $1,740,534
Total Municipal Service District 1 Expenditures $1,307,066 $1,352,236 $1,685,156 $1,740,534
District 2 (Center City) Assessed value for FY 2020 is $5,764,520,666. The proposed budget includes an MSD neutral tax rate of 1.83¢ per $100 assessed valuation.
Budget Summary FY 2017 FY 2018 FY 2019 FY 2020 Actual Actual Adopted Proposed
Revenues
Property Taxes $754,504 $781,036 $1,010,502 $1,045,668
Total Municipal Service District 2 Revenues $754,504 $781,036 $1,010,502 $1,045,668
Expenditures
Contractual Services $754,504 $781,036 $1,010,502 $1,045,668
Total Municipal Service District 2 Expenditures $754,504 $781,036 $1,010,502 $1,045,668
221

Municipal Service Districts
59 59
District 3 (Center City)
Assessed value for FY 2020 is $5,156,043,404. The proposed budget includes an MSD neutral tax rate of 2.89¢ per $100 assessed valuation.
Budget Summary FY 2017 FY 2018 FY 2019 FY 2020 Actual Actual Adopted Proposed
Revenues
Property Taxes $1,225,021 $1,240,883 $1,422,271 $1,476,230
Total Municipal Service District 3 Revenues $1,225,021 $1,240,883 $1,422,271 $1,476,230
Expenditures
Contractual Services $1,196,506 $1,211,513 $1,392,020 $1,445,071
City Services $28,515 $29,370 $30,251 $31,159
Total Municipal Service District 3 Expenditures $1,225,021 $1,240,883 $1,422,271 $1,476,230
District 4 (South End)
Assessed value for FY 2020 is $2,717,820,303. The proposed budget includes an MSD neutral tax rate of 3.90¢ per $100 assessed valuation.
Budget Summary FY 2017 FY 2018 FY 2019 FY 2020 Actual Actual Adopted Proposed
Revenues
Property Taxes $864,786 $937,323 $966,127 $1,048,569
Total Municipal Service District 4 Revenues $864,786 $937,323 $966,127 $1,048,569
Expenditures
Contractual Services $864,786 $937,323 $966,127 $1,048,569
Total Municipal Service District 4 Expenditures $864,786 $937,323 $966,127 $1,048,569
District 5 (University City) Assessed value for FY 2020 is $3,873,938,001. The proposed budget includes an MSD neutral tax rate of 2.12¢ per $100 assessed valuation.
Budget Summary FY 2017 FY 2018 FY 2019 FY 2020 Actual Actual Adopted Proposed
Revenues
Property Taxes $752,252 $777,348 $752,149 $813,774
Total Municipal Service District 5 Revenues $752,252 $777,348 $752,149 $813,774
Expenditures
Contractual Services $752,252 $777,348 $752,149 $813,774
Total Municipal Service District 5 Expenditures $752,252 $777,348 $752,149 $813,774
222

Synthetic Tax Increment Grants
60 60
Synthetic Tax Increment Grant (STIG) Program
The city uses Synthetic Tax Increment Grants (STIG) as a public/private partnership tool to advance Economic Development and land use planning goals. STIG does not require the establishment of a Tax Increment Financing district, as required by Self Financing Bonds, and utilizes locally approved financing, which is repaid by the incremental city/county property tax growth generated by the development. The three funds supported by the property tax (General Fund, Debt Service, and Pay-As-You-Go) each contribute its pro-rate share. Per City Council policy, the amount of total STIG assistance to all projects is limited to 3.0% of annual property tax levy in any given year.
City Council Approved Projects
The Levine Center for the Arts (Cultural Facilities) Project included development of four Cultural Facilities (Harvey B. Gantt African-American Cultural Center, Bechtler Art Museum, Knight Theater, and Mint Museum), the First Street office tower with retail and residential (200 units) components, and an underground parking garage to support the facilities. There is a guaranteed minimum incremental tax of $4.6 million annually, based on $360 million in tax base growth. Total city STIG payments paid into city debt fund not to exceed $41.3 million over 25 years.
FY 2020 FY 2021 FY 2022 FY 2023 FY 2024 5-Yr. TotalEst. % of investment
completed 100 % 100 % 100 % 100 % 100 %
Est. property tax increment $1,835,556 $1,835,556 $1,835,556 $1,835,556 $1,835,556 $9,177,778 Est. STIG Payment $1,652,000 $1,652,000 $1,652,000 $1,652,000 $1,652,000 $8,260,000
Wesley Village (Bryant Park) Project supports redevelopment of Bryant Park and funded construction of Stewart Creek Parkway from tax increment generated by the development of Wesley Village apartments - Phase I. Anticipated total private investment equals $33 million. Total STIG payments not to exceed $1.36 million. Completion of the Stewart Creek Parkway street triggered payment.
FY 2020 FY 2021 FY 2022 FY 2023 FY 2024 5-Yr. TotalEst. % of investment
completed 100 % 100 % 100 % 100 % 100 %
Est. property tax increment $136,955 $137,955 $134,031 - - $408,939 Est. STIG Payment $124,160 $124,160 $120,627 - - $368,947
Double Oaks Redevelopment Project supports redevelopment of Double Oaks apartments including 940 residential units and approximately 108,000 sq. ft. of non-residential development. Anticipated total private investment equals $96,058,000. Total STIG payments not to exceed $3.6 million to offset HUD 108 loan payments. Brownfield agreement in place, which offsets incremental tax payments.
FY 2020 FY 2021 FY 2022 FY 2023 FY 2024 5-Yr. TotalEst. % of investment
completed90 % 90 % 90 % 90 % 100 %
Est. property tax increment $210,000 $210,000 $250,000 $250,000 $250,000 $1,170,000 Est. STIG Payment $189,000 $189,000 $225,000 $225,000 $225,000 $1,053,000
Ballantyne Area Infrastructure Project supports construction of road improvement in the Ballantyne Synthetic Tax Increment Financing Zone through a private placement loan from Bissell Companies in an amount not to exceed $11 million, which will be repaid through 45% of incremental city and county property taxes from the TIF Zone over 15 years. Anticipated total private investment equals $276.2 million. Completions of infrastructure improvements will trigger payment.
FY 2020 FY 2021 FY 2022 FY 2023 FY 2024 5-Yr. TotalEst. % of investment completed 50 % 60 % 60 % 70 % 70 %
Est. property tax increment $1,600,000 $2,100,000 $2,100,000 $2,310,000 $2,310,000 $10,420,000 Est. STIG Payment $720,000 $945,000 $945,000 $1,039,500 $1,039,500 $4,689,000
223

Synthetic Tax Increment Grants
61 61
Ikea/City Boulevard Project supports the construction of a connector road between McCullough Drive to City Boulevard providing overall accessibility with North Tryon Street and City Boulevard. Contract for road extension extended until 2014. Anticipated total private investment equals $170 million. Total STIG payments not to exceed $5.4 million. Completion of the Ikea Road street connector triggers payment.
FY 2020 FY 2021 FY 2022 FY 2023 FY 2024 5-Yr. TotalEst. % of investment completed 40 % 60 % 60 % 70 % 70 %
Est. property tax increment $525,000 $575,000 $575,000 $632,500 $632,500 $2,940,000 Est. STIG Payment $472,500 $517,500 $517,500 $569,250 $569,250 $2,646,000
First Ward Parking Deck and Park Project supports redevelopment of eight blocks of land in First Ward into mixed use office, residential, retail, hotel, and park space. Project consists of two separate TIGs. The first TIG is a $2.315M five-year term that supports development of First Ward Park. Mecklenburg County provides $11.2 million for park development costs and leverages $19.0 million in land value. The second $23,705,792 TIG is a ten-year term that begins at the completion of the first TIG and supports 1,335 public parking spaces. An amendment approved in FY 2013 reduces the city/county deck grant amount by $6,044,208. Total estimated value of private investment is $700M.
FY 2020 FY 2021 FY 2022 FY 2023 FY 2024 5-Yr. TotalEst. % of investment completed
30 % 40 % 0 % 0 % 0 %
Est. property tax increment $180,000 $250,000 - - - $430,000 Est. STIG Payment $81,000 $112,500 - - - $193,500
Charlotte Premium Outlets Project provides up to $6.15 million for construction of roadway improvements supporting a 445,000 square foot retail Outlet Center at Steele Creek Road and I-485. Project includes additional retail and a 120-room hotel. The $6.15 million Tax Increment Grant will be repaid through 45 percent of incremental city and county property taxes from a designated area over ten years. Total private investment value is estimated at $100M. Payment is triggered by voluntary annexation of the property into the City of Charlotte estimated in 2018.
FY 2020 FY 2021 FY 2022 FY 2023 FY 2024 5-Yr. TotalEst. % of investment completed
60 % 70 % 80 % 90 % 100 %
Est. property tax increment $1,270,597 $400,000 $460,000 $520,000 $600,000 $3,250,597 Est. STIG Payment $571,769 $180,000 $207,000 $234,000 $270,000 $1,462,769
STIG Projects Combined Total FY 2020 FY 2021 FY 2022 FY 2023 FY 2024 5-Yr. Total
Est. property tax increment $5,759,108 $5,508,511 $5,354,587 $5,548,056 $5,628,056 $27,798,318Est. TOTAL STIG Payment $3,810,429 $3,720,160 $3,667,127 $3,719,750 $3,755,750 $18,673,216
Est. Total STIG Payment by Fund FY 2020 FY 2021 FY 2022 FY 2023 FY 2024 5-Yr. Total
General Fund $2,975,221 $2,904,739 $2,863,330 $2,904,418 $2,932,528 $14,580,236Municipal Debt Service $741,069 $723,513 $713,199 $723,433 $730,435 $3,631,648
Pay-As-You-Go $94,139 $91,909 $90,598 $91,898 $92,788 $461,332 Total $3,810,429 $3,720,161 $3,667,127 $3,719,749 $3,755,751 $18,673,216
224

5 5
CAPITAL INVESTMENT PLAN

62 62
This page intentionally left blank.

FY 2020 – FY 2024
Capital Investment Plan
1 1
Background The Capital Investment Plan (CIP) is a multi-year plan that makes investments to support the growth and vitality of the community and the quality of life. The CIP plans for long-term capital infrastructure, which is broadly defined as the construction or acquisition of fixed assets such as roads, sidewalks, buildings, capital building maintenance, real estate, equipment, culverts, or pipes. Consistent with best practices, the City of Charlotte annually proposes a five-year CIP; this year, the CIP presents a plan for Fiscal Year (FY) 2020 through FY 2024.
The CIP provides residents with an outline of how the city anticipates investing capital funds for the next five years. The first year of the five-year plan, FY 2020, is proposed for City Council adoption, while the remaining four out-years are provided as a plan. The inclusion of a project in the four out-years does not guarantee funding in the future as the needs and priorities of the city may change.
Projects included in the CIP are funded by various sources including debt instruments, grants, or cash. The use of long-term debt financing for CIP projects indicates that the anticipated life of the asset is greater than the life of the debt. Additional information about funding sources for projects identified in the CIP can be found in the Funding Sources and Uses Summary table. The Approved Budget document may include technical changes made after the City Manager’s presentation of the Proposed Budget to the City Council.
Guiding Principles A project may be identified for inclusion in the CIP based on its support or furtherance of one or more guiding principles. Collectively, these guiding principles help shape the five-year CIP. Several of the guiding principles are outlined below.
• Ensure the City Council-adopted Budget Principles are adhered to; these principles were developed inaccordance with the framework set forth by Chapter 159 of the North Carolina General Statutes, the LocalGovernment Budget and Fiscal Control Act,
• Promote City Council’s four priority areas:o Transportation and Planning (Mobility, Accessibility, and Connectivity),o Neighborhood Development (Safe, Healthy, and Inclusive Communities),o Economic Development (Economy, Jobs and Upward Mobility),o Well-Managed Government (Efficient, Effective, Accountable, Responsive, Inclusive, and Customer
Focused),• Support strong neighborhoods and communities, an enhanced street network, and increased housing
opportunities,• Preserve and enhance the existing tax base, and• Continue financial practices that maintain the highest credit ratings.
Capital Program Improvements During FY 2019, the city completed the first Capital Needs Inventory (CNI) in over 12 years. The CNI, which was a cross-department, collaborative effort, identified public infrastructure needs anticipated over the next 10 years (FY 2020 through FY 2029). Projects originated from many sources including master plans, studies, and City Council-
227

FY 2020 – FY 2024
Capital Investment Plan
2 2
Capital Program Improvements (continued) adopted action plans. The CNI serves as a long-term planning tool to help prioritize needs within the context of limited resources. The Proposed FY 2020 CIP directly reflects the CNI output, which is evident in the increased building maintenance budgets over the next five years, as well as inclusion of the four highest priority road and intersection projects in the newly established Advanced Planning and Design Program.
The first funding for advanced planning and design is proposed in the FY 2020 CIP. Seven, high-priority projects are included for planning and design. Through advanced planning work, project scopes become further defined and cost estimates are more precise, creating less risk of future cost overruns. After planning and design phases have produced cost estimates, total project funding will be considered for inclusion in a future budget. This work creates a “project pipeline” and a pool of potential projects for future funding. More information about the individual projects is available in the Advance Planning and Design Program section of the CIP.
This past year, Strategy and Budget, in partnership with Finance, the City Manager’s Office, and the city’s financial advisors, examined the existing debt model assumptions and updated key components of the model to better reflect the market, city performance, and long-term financing goals. Examples of model components that were adjusted based on analysis include interest rates, spend rates, and revenue growth rates. All adjustments are consistent with best practices and will help ensure the continuation of the city’s AAA credit rating.
Collectively, these program improvements ensure proper long-term financial planning and security of the CIP.
Highlights of the FY 2020 – 2024 CIP The Proposed FY 2020 – 2024 CIP contains the final “Big Ideas” bond referendum in November 2020 (FY 2021). In FY 2014, City Council adopted the Big Ideas CIP, which included projects planned across the 2014, 2016, 2018, and 2020 bonds. In November 2018, voters approved the second-to-last bond of the Big Ideas cycle.
FY 2020 represents an off-year for the City of Charlotte’s General Obligation (GO) Bond referenda, which are presented to the voters every other year for approval. Projects that are funded through GO Bonds are planned in FY 2021. Other debt, which does not require voter approval and may be issued as needed, is also programmed for projects in FY 2021 through FY 2024.
The proposed CIP presents several additions from the Adopted FY 2019 CIP. The changes include the completion of several projects, doubling the planned housing bond from $25.0 million to $50.0 million in FY 2021, and providing $65.3 million over the next five years to ensure proper maintenance of city-owned facilities. All FY 2020 General CIP changes proposed to be funded with cash are outlined in the Summary of Proposed FY 2020 Changes from FY 2019 table.
228

FY 2020 – FY 2024
Capital Investment Plan
3
229
Highlights of the FY 2020 – 2024 CIP (continued)
Summary of Proposed FY 2020 Changes from FY 2019
Adopted FY 2019 Proposed FY 2020
Project Planned FY Amount Planned FY Amount Funding Change
Advance the Cross Charlotte Trail N/A - FY 2020 $54,400,000 $54,400,000
Create Uptown Cycle Track N/A - FY 2020 $4,500,000 $4,500,000
Complete Central Division Station N/A - FY 2020 $1,800,000 $1,800,000
Transform Polk Park N/A - FY 2020 $1,000,000 $1,000,000
Construct Capital Building Improvements
N/A - FY 2020 $2,500,000 $2,500,000
Install New Government Center Generators
N/A - FY 2020 $2,200,000 $2,200,000
Replace Government Center heating, ventilation, and air conditioning (HVAC)
N/A - FY 2020 $1,500,000 $1,500,000
Repave Sweden Road Complex FY 2021 $4,000,000 FY 2020 $2,000,000 -$2,000,000
Establish Land Acquisition Fund N/A - FY 2020 $2,500,000 $2,500,000
Advanced Planning and Design N/A - FY 2020 $20,000,000 $20,000,000
Total $4,000,000 $92,400,000 $88,400,000
Funding CIP
Projects within the CIP are funded using various sources; descriptions of those sources are listed below.
General Capital Projects:
• Reappropriation of Prior Authorization: Funds available from projects that have been through the formalclose-out process.
• Advanced Planning and Design Program: Municipal Debt Service Fund balance available to initiate aproject pipeline through the advanced planning and design program.
• Other Debt: Dollars do not require voter approval. This debt may include Limited Obligation Bonds(LOBs)/Certificates of Participation (COPs), Special Obligation Bonds, and short-term financing.
• General Obligation (GO) Bonds: Dollars require voter approval through a bond referendum. Bondcategories for voter approval include streets, neighborhoods, and housing. GO debt is pledged to be repaidfrom a portion of property tax revenue.
• State Grants: Dollars received from state agencies such as the North Carolina Department of Transportation.

FY 2020 – FY 2024
Capital Investment Plan
4 4
Funding CIP (continued)
Cash:
Cash may be used as available to support completion of capital projects or pay-off existing debt funding. Other potential sources of cash are outlined below.
• Fund Balance: An accumulation of savings in an account.• Debt Refunding: Savings from previous bond issuances as a result of improved interest rates.
General Pay-As-You-Go (PAYGO):
• Property Tax: Of the total 34.81¢ property tax rate, 0.73¢ is dedicated to the Pay-As-You-Go (PAYGO)program (2.10%).
• Sales Tax: Dollars represent a portion of the total sales tax received by the General Fund and transferred tothe capital program. The equivalent to 0.5¢ of the city’s portion of sales tax is dedicated and transferred to thePAYGO program.
• Other Revenue: Dollars from parking meter revenue, sale of city-owned property, interest earnings, GeneralFund surplus, and nongeneral fund contributions for technology programs and services.
Transit Pay-As-You-Go:
• Vehicle Rental Tax (U-Drive-It): Mecklenburg County levies a five percent rental tax that applies topassenger cars, trucks, SUVs, motorcycles, and small property-hauling vehicles; the city does not havestatutory authority to assess a similar tax. As outlined in state statute and a 2006 Interlocal Agreement, theCounty passes the full amount of the U-Drive-It Rental Tax revenue to the city, which then distributesproportionate revenue to the towns in Mecklenburg County in which the rental originated (MecklenburgCounty keeps the revenue originated in the unincorporated areas).
• Motor Vehicle License: Dollars represent $30 of revenue per license.• CityLYNX Gold Line Fare: Currently, no fare is being collected for Gold Line ridership; however, fare
collection is planned to begin in FY 2021 once Phase II is fully operational.• Sales Tax: Currently, no sales tax is dedicated to transit PAYGO; however, a portion of the sales tax dedicated
to PAYGO is planned to begin being transferred in FY 2021 once Phase II is fully operational.
Nongeneral Fund Projects:
Projects funded with the sources outlined below are supported by nongeneral fund revenues, which are not levied
across all city taxpayers. Similar to General capital projects, nongeneral fund capital projects may also be funded
through the reappropriation of prior authorization or refunding savings from outstanding debt. • Aviation Revenue Bonds: Debt can be issued at any time and is supported by the revenue generated by CLT
Airport. Funds are pledged to be repaid from user fees.• Passenger Facility Charges: Dollars generated from user fees charged to airline travelers.• Customer Facility Charges: Dollars generated from rental car businesses at CLT Airport per the terms of the
concession agreement.• Aviation PAYGO: Dollars represent a portion of the total user fees collected from Aviation tenants and
customers.• Federal Grants: Dollars received from federal agencies such as the Federal Aviation Administration or
Federal Transit Administration.
230

FY 2020 – FY 2024
Capital Investment Plan
5
2315
Funding CIP (continued)
• State Grants: Dollars received from state agencies such as the North Carolina Department of Transportation.• CATS PAYGO: Dollars represent a portion of the total user fees collected from CATS riders and a portion of
the dedicated sales tax that represents 0.5¢ of the total sales tax generated within Mecklenburg County.• Charlotte Water Revenue Bonds: Debt can be issued at any time and is pledged to be repaid from user fees
generated by the Charlotte Water system.• Charlotte Water PAYGO: Dollars represent a portion of the total user fees collected from Charlotte Water
customers.• Storm Water Revenue Bonds: Debt can be issued at any time and is supported by the revenue generated by
the Storm Water system. Funds are pledged to be repaid from user fees.• Storm Water PAYGO: Dollars represent a portion of the total storm water fees collected from city residents.• Storm Water Program Revenue: Interest earnings generated from fund balance investments.

FY 2020 – 2024
Uses of Funds Project Index
6
2326
FY 2020 - 2024 Capital Investment Plan
General Pay-As-You-Go (PAYGO) and Transit PAYGO
Project Title Fund Page Proposed FY 2020
Transportation and Planning
Advance the Cross Charlotte Trail* General 263/289 -
Advance Comprehensive Plan General 263 $550,000
Complete Traffic Studies General 263 -
Purchase Transportation Equipment General 264 $200,000
Transfer Maintenance of Effort (MOE) to CATS General 265 $22,629,679
Allocate Proportional U-Drive-It Rental Tax to County and Towns General 265 $737,282
Contribute to CityLYNX Gold Line Phase I Operations General 265 $1,471,896
Contribute to CityLYNX Gold Line Phase II Operations General 266 -
Reserve Funds for CityLYNX Gold Line Equipment Replacement General 266 $2,000,000
Reserve Funds for CityLYNX Gold Line Phase III General 266 $2,479,839
Neighborhood Development
Support Environmental Services Program General 267 $1,700,000
Replace Trees General 267 $900,000
Trim and Remove Trees General 267 $1,625,000
Support for TreesCharlotte Endowment General 268 $250,000
Contribute to TreesCharlotte General 268 $100,000
Renovate Median Landscapes General 268 $250,000
Support Aging in Place General 269 $750,000
Provide HOME Grant Match General 269 $743,028
Support Innovative Housing General 269 $10,805,107
Offer In Rem Remedy - Residential General 270 $655,000
Increase JumpStart Microgrants General 270 $500,000
Support Neighborhood Grants General 270 $400,000
Accelerate Police Training General 271 $2,000,000
Support Placemaking General 271 $250,000

FY 2020 – 2024
Uses of Funds Project Index
7
2337
FY 2020 - 2024 Capital Investment Plan (continued)
PAYGO (continued)
Project Title Fund Page Proposed FY 2020
Economic Development
Improve Cultural Facilities General 272 $9,744,955
Revitalize Business Corridors General 272 -
Enhance Economic Development Programs General 272 $1,650,000
Initiate Project P.I.E.C.E. 2.0 Workforce Development Program General 273 $300,000
Build Minority, Women, and Small Business Enterprise (MWSBE) Capacity General 273 $450,000
Create Collaborative Service District, Westside General 273 $500,000
Create Collaborative Service District, Eastside General 274 $500,000
Advance Historic West End Initiative General 274 $150,000
Fund Synthetic Tax Increment Grant (TIG) Cultural Projects General 274 $41,412
Support Synthetic TIG Developer Payments General 275 $52,727
Well-Managed Government
Maintain City-owned Facilities General 276 $4,315,254
Repair City-owned Parking Lots and Parking Decks General 276 $300,000
Maintain Charlotte-Mecklenburg Government Center (CMGC) Parking Deck General 276 $200,000
Invest in Technology and Disaster Recovery General 277 $2,000,000
Upgrade Business System Software General 277 $2,099,906
Purchase Police Technology and Equipment General 277 $1,500,000
Purchase Municipal Equipment General 278 -
Contribute One-time to Firefighter Retirement General 278 $1,000,000
Reserve PAYGO Undesignated Balance General 278 - Sub-Total General PAYGO and Transit PAYGO* $75,801,085 *The total budget for the Cross Charlotte Trail is included in the Transportation and Planning project. The PAYGOcontribution to the total $54.4 million is $13.5 million.

FY 2020 – 2024
Uses of Funds Project Index
8 8
FY 2020 - 2024 Capital Investment Plan (continued)
Advanced Planning and Design Program
Project Title Fund Page Proposed FY 2020
Plan and Design Transportation and Planning Projects General 281 $15,000,000
Plan and Design Neighborhood Development Projects General 285 $5,000,000
Sub-Total Advanced Planning and Design Program $20,000,000
Transportation and Planning (Mobility, Accessibility, and Connectivity)
Advance the Cross Charlotte Trail General 263/289 $54,400,000
Create Uptown Cycle Track General 290 $4,500,000
Extend Bryant Farms Road General 291 -
Improve Idlewild Road and Monroe Road Intersection General 292 -
Develop Dixie Berryhill Area Roads General 293 -
Extend Park South Drive General 294 -
Connect Northeast Corridor Infrastructure General 295 -
Maintain Traffic Signal System Coordination General 296 -
Upgrade Traffic Control Devices General 297 -
Repair and Replace Bridges General 298 -
Plan and Design Silver Line Light Rail CATS 299 $9,000,000
Design South End Light Rail Station CATS 300 $1,415,608
Develop Transit Systems CATS 301 $1,232,804
Enhance Safety and Security on Transit CATS 302 $2,858,384
Purchase New Transit Support Systems CATS 303 $2,344,827
Purchase Vehicles for CATS CATS 304 $1,240,200
Relocate Water and Wastewater Infrastructure Charlotte Water 305 $5,000,000
Sub-Total Transportation and Planning $81,991,823
2347

FY 2020 – 2024
Uses of Funds Project Index
4 4
FY 2020 - 2024 Capital Investment Plan (continued)
Neighborhood Development (Safe, Healthy, and Inclusive Communities)
Project Title Fund Page Proposed FY 2020
Create and Preserve Affordable Housing General 309 - Complete Comprehensive Neighborhood Improvement Program (CNIP) General 310 -
Advance Central/Albemarle/Shamrock CNIP General 311 -
Support Prosperity Village CNIP General 312 -
Promote SouthPark CNIP General 314 -
Further Sunset/Beatties Ford CNIP General 315 -
Advance West Trade/Rozzelles Ferry CNIP General 316 -
Support Whitehall/Ayrsley CNIP General 318 -
Improve Pedestrian Safety General 319 -
Strengthen East/Southeast Sidewalk and Bikeway Connections General 320 -
Construct Fire Stations General 321 -
Complete Police Central Division Station General 322 $1,800,000
Construct Long Creek Wastewater Treatment Plant Charlotte Water 323 $12,000,000
Expand Mallard Creek Wastewater Treatment Plant Charlotte Water 324 $19,500,000
Improve McAlpine Creek Wastewater Treatment Plant Charlotte Water 325 $2,500,000
Upgrade McDowell Creek Wastewater Treatment Plant Charlotte Water 326 -
Upgrade Water Treatment Plants Charlotte Water 327 $8,550,000
Improve Wastewater Treatment Plants Charlotte Water 328 $13,000,000
Rehabilitate and Improve Wastewater Infrastructure Charlotte Water 329 $119,800,000
Rehabilitate and Improve Water Infrastructure Charlotte Water 330 $43,800,000
Increase Alternative Energy Production Charlotte Water 331 $6,750,000
Improve Drainage for Storm Water Storm Water 332 $58,308,000
Enhance Storm Water Mitigation Programs Storm Water 333 $2,692,000
Sub-Total Neighborhood Development $288,700,000
235

FY 2020 – 2024
Uses of Funds Project Index
5 5
FY 2020 - 2024 Capital Investment Plan (continued)
Economic Development (Economy, Jobs, and Upward Mobility)
Project Title Fund Page Proposed FY 2020
Transform Polk Park General 337 $1,000,000
Acquire Land and Create Street Connections General 338 -
Beautify Monroe Road Streetscape General 339 -
Renovate Airport Terminal Aviation 340 $196,093,335
Enhance Airfield Capacity Aviation 341 $238,671,898
Increase Airport Fuel Capacity Aviation 342 $12,330,935
Enhance Airport Services Facilities Aviation 343 $28,944,722
Expand Airport Cargo Capacity Aviation 344 $4,040,000
Expand Ground Transportation Capacity Aviation 345 $4,530,000
Improve Private Aircraft Area Aviation 346 $8,158,519
Install and Expand New Water and Sewer System Service Charlotte Water 347 $40,202,830
Mitigate Impacts to Streams and Wetlands Storm Water 348 $1,500,000
Sub-Total Economic Development $535,472,239
236

FY 2020 – 2024
Uses of Funds Project Index
6 6
FY 2020 - 2024 Capital Investment Plan (continued)
Well-Managed Government (Efficient, Effective, Accountable, Responsive, Inclusive, and Customer Focused)
Project Title Fund Page Proposed FY 2020
Construct Capital Building Improvements General 351 $2,500,000
Install New Government Center Generators General 352 $2,200,000 Replace Government Center Heating, Ventilation, and Air Conditioning (HVAC) General 353 $1,500,000
Repave Sweden Road Complex General 354 $2,000,000
Establish Land Acquisition Program General 355 $2,500,000
Implement American with Disabilities Act (ADA) Transition Plan General 356 -
Maintain Transit Facilities CATS 357 $1,129,656
Maintain Transit Vehicles CATS 358 $10,746,761
Replace and Upgrade Field and Administrative Facilities Charlotte Water 359 -
Enhance Security and Technology Charlotte Water 360 $4,306,000
Sub-Total Well-Managed Government $26,882,417
FY 2020 - 2024 Capital Investment Plan (continued)
Summary of Projects by Funds
Fund Proposed FY 2020
General $168,201,085
Transfers/Direct Payments from PAYGO -$36,420,979
Sub-Total General $131,780,106
Aviation $492,769,409
Charlotte Area Transit System (CATS) $29,968,240
Charlotte Water $275,408,830
Storm Water $62,500,000
TOTAL Capital Investment Plan $992,426,585
237

FY 2020 – 2024
General Capital Investment Plan
1 1
Funding Sources and Uses Summary
Funding Sources Proposed Planned
FY 2020 2020 Bond
FY 2021 FY 2022 2022 Bond
FY 2023 FY 2024 TOTAL Reappropriation of Prior Authorization
$11,700,000 - - - - $11,700,000
Cash $47,200,000 - - - - $47,200,000
General PAYGO $48,400,267 $24,967,645 $24,925,170 $24,921,143 $25,692,096 $148,906,321
Transit PAYGO $4,479,839 $5,815,053 $6,409,429 $6,505,653 $6,603,764 $29,813,738
GO Bonds - $197,232,000 - $190,000,000 - $387,232,000
Other Debt - $17,510,000 $11,300,000 $9,100,000 $11,900,000 $49,810,000
Sub-Total Sources $111,780,106 $245,524,698 $42,634,599 $230,526,796 $44,195,860 $674,662,059
Advanced Planning Revolving Account
$20,000,000 - - - - $20,000,000
Grand Total $131,780,106 $245,524,698 $42,634,599 $230,526,796 $44,195,860 $694,662,059
Funding Uses Proposed Planned
FY 2020 2020 Bond
FY 2021 FY 2022 2022 Bond
FY 2023 FY 2024 TOTAL Housing - $50,000,000 - - - $50,000,000
Neighborhoods - $117,232,000 - - - $117,232,000
Streets - $30,000,000 - - - $30,000,000
GO Bonds Sub-Total - $197,232,000 - $190,000,000 - $387,232,000
Facilities $13,500,000 $17,510,000 $11,300,000 $9,100,000 $11,900,000 $63,310,000
Cross Charlotte Trail $54,400,000 - - - - $54,400,000
Uptown Cycle Track $4,500,000 - - - - $4,500,000
Advanced Planning and Design Program
$20,000,000 - - - - $20,000,000
One-Time Projects $34,900,267 $24,967,645 $24,925,170 $24,921,143 $25,692,096 $135,406,321
CityLYNX Gold Line Reserves $4,479,839 $5,815,053 $6,409,429 $6,505,653 $6,603,764 $29,813,738
Uses Total $131,780,106 $245,524,698 $42,634,599 $230,526,796 $44,195,860 $694,662,059
238

FY 2020 – 2024
Nongeneral Capital Investment Plan
14 14
Funding Sources and Uses Summary (continued)
Funding Sources Proposed Planned
FY 2020 FY 2021 FY 2022 FY 2023 FY 2024 TOTAL AVIATION Aviation Revenue Bonds $241,292,746 $379,008,923 $257,133,229 $172,414,196 $62,170,840 $1,112,019,934 Passenger Facility Charges $90,521,487 $13,716,910 $33,749,499 $164,350,329 $27,659,867 $329,998,092 Customer Facility Charges $3,623,047 $27,753,906 $3,623,047 - - $35,000,000 Federal Grants $87,509,730 $10,344,500 $41,364,468 $167,750,709 $28,053,108 $335,022,515 Aviation PAYGO $68,500,900 $70,268,787 $23,393,331 $12,382,530 - $174,545,548 Other Funding $1,321,499 - - - - $1,321,499 Aviation Sub-Total $492,769,409 $501,093,026 $359,263,574 $516,897,764 $117,883,815 $1,987,907,588 CATS Federal Grants $13,288,053 $10,551,885 $10,259,855 $10,308,984 $10,298,388 $54,707,165 State Grants $1,627,828 $1,581,717 $1,105,948 $1,050,740 $1,126,780 $6,493,013 CATS PAYGO $15,052,359 $14,172,609 $16,564,964 $16,577,246 $15,574,597 $77,941,775 CATS Sub-Total $29,968,240 $26,306,211 $27,930,767 $27,936,970 $26,999,765 $139,141,953 CHARLOTTE WATER Charlotte Water Revenue Bonds - Water $33,000,000 $25,125,000 $47,975,000 $9,850,000 $11,100,000 $127,050,000 Charlotte Water Revenue Bonds - Sewer $112,408,830 $172,600,000 $225,500,000 $139,850,000 $157,954,500 $808,313,330 Charlotte Water PAYGO $130,000,000 $139,717,252 $151,147,252 $153,523,252 $128,312,280 $702,700,036 Water/Sewer Sub-Total $275,408,830 $337,442,252 $424,622,252 $303,223,252 $297,366,780 $1,638,063,366 STORM WATER Storm Water Revenue Bonds - $15,000,000 $15,000,000 $80,000,000 $80,000,000 $190,000,000 Storm Water PAYGO $61,000,000 $49,000,000 $46,500,000 $48,000,000 $48,000,000 $252,500,000 Storm Water Program Revenue $1,500,000 $1,500,000 $2,000,000 $2,000,000 $2,000,000 $9,000,000 Storm Water Sub-Total $62,500,000 $65,500,000 $63,500,000 $130,000,000 $130,000,000 $451,500,000 Sources Total $860,646,479 $930,341,489 $875,316,593 $978,057,986 $572,250,360 $4,216,612,907
239

FY 2020 – 2024
Nongeneral Capital Investment Plan
15 15
Funding Sources and Uses Summary (continued)
Funding Uses Proposed Planned
FY 2020 FY 2021 FY 2022 FY 2023 FY 2024 TOTAL AVIATION Terminal Renovations $196,093,335 $385,724,846 $191,663,789 $115,064,300 $57,220,271 $945,766,541 Enhance Airfield Capacity $238,671,898 $56,961,771 $148,199,785 $389,833,464 $60,663,544 $894,330,462 Increase Fuel Capacity $12,330,935 $1,189 - - - $12,332,124 Enhance Services Facility $28,944,722 $26,705,220 $8,100,000 $10,500,000 - $74,249,942 Expand Cargo Capacity $4,040,000 $9,050,000 $7,400,000 - - $20,490,000 Expand Ground Transportation $4,530,000 $16,400,000 $2,400,000 - - $23,330,000 Improve Private Aircraft Area $8,158,519 $6,250,000 $1,500,000 $1,500,000 - $17,408,519 Aviation Sub-Total $492,769,409 $501,093,026 $359,263,574 $516,897,764 $117,883,815 $1,987,907,588 CATS Silver Line Light Rail $9,000,000 $9,000,000 $11,000,000 $11,000,000 $10,000,000 $50,000,000 South End Station $1,415,608 $1,581,717 $3,000,000 $3,000,000 $3,000,000 $11,997,325 Transit Development $1,232,804 $200,000 $200,000 $200,000 $200,000 $2,032,804 Transit Safety and Security $2,858,384 $1,722,316 $1,222,144 $993,897 $226,136 $7,022,877 Transit Support Systems $2,344,827 $475,969 $364,959 $34,000 $538,000 $3,757,755 CATS Vehicles $1,240,200 $685,010 $530,320 $390,530 $320,740 $3,166,800 Transit Facilities $1,129,656 - - - - $1,129,656 Transit Vehicles $10,746,761 $12,641,199 $11,613,344 $12,318,543 $12,714,889 $60,034,736 CATS Sub-Total $29,968,240 $26,306,211 $27,930,767 $27,936,970 $26,999,765 $139,141,953 CHARLOTTE WATER Relocate Water/ Wastewater Infrastructure $5,000,000 $10,000,000 $22,500,000 $10,300,000 $10,609,000 $58,409,000 Long Creek WWTP $12,000,000 $44,000,000 $86,100,000 $91,400,000 $75,800,000 $309,300,000 Mallard Creek WWTP $19,500,000 $17,600,000 $31,000,000 $30,500,000 $24,750,000 $123,350,000 McAlpine Creek WWTP $2,500,000 $41,100,000 $53,100,000 - $4,800,000 $101,500,000 McDowell Creek WWTP - - - $1,500,000 $12,000,000 $13,500,000 Water Treatment Plants $8,550,000 $5,600,000 $17,350,000 $4,850,000 - $36,350,000 WWT Plants $13,000,000 $14,350,000 $19,250,000 $16,050,000 $11,050,000 $73,700,000 Wastewater Infrastructure $119,800,000 $107,485,000 $86,550,000 $78,255,000 $76,674,150 $468,764,150
240

FY 2020 – 2024
Nongeneral Capital Investment Plan
16 16
Funding Sources and Uses Summary (continued)
Funding Uses Proposed Planned
FY 2020 FY 2021 FY 2022 FY 2023 FY 2024 TOTAL CHARLOTTE WATER (continued) Water Infrastructure $43,800,000 $31,125,000 $35,125,000 $16,450,000 $23,313,500 $149,813,500 Alternative Energy Production $6,750,000 - $5,500,000 $7,000,000 $4,500,000 $23,750,000 New Water/Sewer Service $40,202,830 $43,142,252 $43,142,252 $43,913,252 $43,565,130 $213,965,716 Dixie Berryhill Projects - - - - $7,000,000 $7,000,000 Field and Admin Facilities - $18,000,000 $22,000,000 - - $40,000,000 Security and Technology $4,306,000 $5,040,000 $3,005,000 $3,005,000 $3,305,000 $18,661,000 Water/Sewer Sub-Total $275,408,830 $337,442,252 $424,622,252 $303,223,252 $297,366,780 $1,638,063,366 STORM WATER Storm Drainage Improvements $58,308,000 $62,496,000 $57,415,000 $118,095,000 $116,400,000 $412,714,000 Mitigation Programs $2,692,000 $1,504,000 $4,085,000 $9,905,000 $11,600,000 $29,786,000 Watershed Improvements $1,500,000 $1,500,000 $2,000,000 $2,000,000 $2,000,000 $9,000,000 Storm Water Sub-Total $62,500,000 $65,500,000 $63,500,000 $130,000,000 $130,000,000 $451,500,000 Uses Total $860,646,479 $930,341,489 $875,316,593 $978,057,986 $572,250,360 $4,216,612,907
241

General CIP Project Summary Schedule
17 17
PAY-AS-YOU-GO (PAYGO) Summary
PROJECT TITLE FY 2020 FY 2021 FY 2022 FY 2023 FY 2024 TOTAL
Transportation and Planning Advance Cross Charlotte Trail $13,500,000 - - - - $13,500,000 Advance Comprehensive Plan $550,000 $300,000 - - - $850,000 Complete Traffic Studies* - $400,000 $400,000 $400,000 $400,000 $1,600,000 Purchase Transportation Equipment $200,000 $200,000 $200,000 $200,000 $200,000 $1,000,000 Neighborhood Development Support Environmental Services Program $1,700,000 $1,700,000 $1,700,000 $1,700,000 $1,700,000 $8,500,000 Replace Trees $900,000 $900,000 $900,000 $900,000 $900,000 $4,500,000 Trim and Remove Trees $1,625,000 $1,625,000 $1,625,000 $1,625,000 $1,625,000 $8,125,000 Support for TreesCharlotte Endowment $250,000 - - - - $250,000 Contribute to TreesCharlotte $100,000 - - - - $100,000 Renovate Median Landscapes $250,000 $250,000 $250,000 $250,000 $250,000 $1,250,000 Support Aging in Place $750,000 - - - - $750,000 Provide HOME Grant Match $743,028 $743,028 $743,028 $743,028 $743,028 $3,715,140 Support Innovative Housing $10,805,107 $3,805,107 $3,805,107 $3,805,107 $3,805,107 $26,025,535 Offer In Rem Remedy - Residential $655,000 $655,000 $655,000 $655,000 $655,000 $3,275,000 Increase Jumpstart Microgrants $500,000 $250,000 $250,000 $250,000 $250,000 $1,500,000 Support Neighborhood Grants $400,000 $400,000 $400,000 $400,000 $400,000 $2,000,000 Accelerate Police Training $2,000,000 $1,000,000 - - - $3,000,000 Support Placemaking $250,000 - - - - $250,000 Economic Development Improve Cultural Facilities (a) $9,744,955 $9,891,129 $10,039,496 $10,190,089 $10,342,940 $50,208,609 Revitalize Business Corridors* - - $1,000,000 $1,000,000 $1,000,000 $3,000,000 Enhance Economic Development Programs $1,650,000 $1,000,000 $1,000,000 $1,000,000 $1,000,000 $5,650,000 Initiate Project P.I.E.C.E. 2.0 Workforce Development Program $300,000 - - - - $300,000
Build MWSBE Capacity $450,000 $450,000 - - - $900,000 Create Collaborative Service District,
$500,000 $500,000 - - - $1,000,000
Create Collaborative Service District,
$500,000 $500,000 - - - $1,000,000 Advance Historic West End Initiative $150,000 $150,000 - - - $300,000 Fund Synthetic TIG Cultural Projects $41,412 $41,412 $41,412 $41,412 $41,412 $207,060 Support Synthetic TIG Developer Payments $52,727 $54,610 $56,530 $58,489 $60,487 $282,843 Well-Managed Government Maintain City-Owned Facilities $4,315,254 $5,000,000 $5,000,000 $5,000,000 $5,000,000 $24,315,254 Repair City-Owned Parking Lots/Decks $300,000 $300,000 $300,000 $300,000 $300,000 $1,500,000 Maintain CMGC Parking Deck $200,000 $200,000 $200,000 $200,000 $200,000 $1,000,000 Invest in Technology and Disaster Recovery $2,000,000 $500,000 $1,000,000 $2,500,000 $2,500,000 $8,500,000 Upgrade Business System Software $2,099,906 $2,466,405 $1,978,286 - - $6,544,597 Purchase Police Technology and Equipment $1,500,000 $1,000,000 $1,000,000 $1,000,000 $1,000,000 $5,500,000 Purchase Municipal Equipment - $1,200,000 $1,200,000 $1,200,000 $1,200,000 $4,800,000 Contribute One-Time to Firefighter Retirement $1,000,000 - - - - $1,000,000
Undesignated Balance - $216,133 $2,061,777 $2,536,036 $3,306,989 $8,120,935 TOTAL PAYGO $59,982,389 $35,697,824 $35,805,636 $35,954,161 $36,879,963 $204,319,973
Use Categories Direct Payments $1,052,727 $54,610 $56,530 $58,489 $60,487 $1,282,843 Transfer to HOME $743,028 $743,028 $743,028 $743,028 $743,028 $3,715,140 Transfer to Cultural Facilities Operating $9,786,367 $9,932,541 $10,080,908 $10,231,501 $10,384,352 $50,415,669 Transfer to CIP $48,400,267 $24,967,645 $24,925,170 $24,921,143 $25,692,096 $148,906,321 TOTAL PAYGO $59,982,389 $35,697,824 $35,805,636 $35,954,161 $36,879,963 $204,319,973
242

General CIP Project Summary Schedule
18 18
PAYGO Summary (continued) Revenue Property Tax (0.73¢) $10,328,752 $10,535,327 $10,746,034 $10,960,954 $11,180,173 $53,751,240 Property Tax - Synthetic TIG $94,139 $96,022 $97,942 $99,901 $101,899 $489,903 PAYGO Fund - Interest Income $732,600 $732,600 $732,600 $732,600 $732,600 $3,663,000 Sales Tax $22,130,119 $23,125,974 $23,281,268 $23,960,706 $24,665,291 $117,163,358 Parking Meter Revenue $200,000 $200,000 $200,000 $200,000 $200,000 $1,000,000 Enterprise Business System Software $705,536 $1,007,901 $747,792 - - $2,461,229 Capital Reserve from FY 2018 $5,871,243 - - - - $5,871,243 PAYGO Available Cash Balance $19,920,000 - - - - $19,920,000 Sub-Total Revenue PAYGO $59,982,389 $35,697,824 $35,805,636 $35,954,161 $36,879,963 $204,319,973
TOTAL REVENUE PAYGO $59,982,389 $35,697,824 $35,805,636 $35,954,161 $36,879,963 $204,319,973
(a) Contribution to Cultural Facilities supported by Sales Tax equivalent to approximately 80 percent of the U-Drive-It Vehicle Rental tax net the contribution to County andTowns.*Fund balance is available to continue program operation despite no additional funding.
243

General CIP Project Summary Schedule
19 19
Transit PAYGO Summary
FY 2016 was the first full year of CityLYNX Gold Line Phase I operations, and federal funds to construct Phase II of the Gold Line were approved by Congress in FY 2016. In order to accept these federal funds and proceed with Phase II of the Gold Line, the city established the Transit PAYGO Fund to isolate the dedicated funding sources to support the current Phase I operations and future Phase II operations of the CityLYNX Gold Line.
Dedicated revenues totaling $161.4 million over five years to support Transit PAYGO include vehicle rental tax and motor vehicle license revenue, a portion of the city's sales taxes, and Gold Line fare revenue upon commencement of Phase II operations. Surplus revenue from vehicle rental tax and motor vehicle license in FY 2019 and FY 2020 is placed in a reserve for future needs associated with CityLYNX Gold Line Phase III.
All but one of the revenue sources dedicated to the Transit PAYGO are from existing revenue streams transferred from General PAYGO. Future Gold Line fare revenue is the only new revenue programmed into this fund. Sales tax revenue supporting Transit PAYGO in FY 2021 through FY 2023 is from a partial transfer from the General PAYGO sales tax allocation, not from General Fund operating sales tax or from the dedicated Transit Sales Tax. There is no use of property taxes, General Fund operating funds, or other new fees and taxes to support funding of the CityLYNX Gold Line or other transit-related expenses, such as the CATS Maintenance of Effort (MOE).
The five-year schedule of revenues and expenditures for Transit PAYGO is presented in the table below.
Transit PAYGO Summary
Revenue FY 2020 FY 2021 FY 2022 FY 2023 FY 2024 TOTAL
Vehicle Rental Tax (U-Drive-It) $12,944,463 $13,170,991 $13,401,484 $13,636,010 $13,874,640 $67,027,588
Motor Vehicle License $16,374,233 $16,701,717 $17,035,751 $17,376,466 $17,723,996 $85,212,163
CityLYNX Gold Line Fares - $1,500,000 $1,500,000 $1,500,000 $1,500,000 $6,000,000
Sales Tax-Partial Transfer from PAYGO - - $769,745 $1,052,348 $1,348,283 $3,170,376 TOTAL REVENUE TRANSIT PAYGO $29,318,696 $31,372,708 $32,706,980 $33,564,824 $34,446,919 $161,410,127
Expenditures
Transfer MOE to CATS $22,629,679 $23,308,569 $24,007,826 $24,728,061 $25,469,903 $120,144,038
Allocate U-Drive-It Tax to County/Towns $737,282 $748,341 $759,566 $770,959 $782,523 $3,798,671
Contribute to CityLYNX Gold Line Phase I $1,471,896 $1,500,745 $1,530,160 $1,560,151 $1,590,730 $7,653,682
Contribute to CityLYNX Gold Line Phase II - $4,815,053 $4,909,428 $5,005,653 $5,103,763 $19,833,897
Reserve for CityLYNX Gold Line Equipment $2,000,000 $1,000,000 1,500,000 1,500,000 1,500,000 7,500,000
Reserve for CityLYNX Gold Line Phase III $2,479,839 - - - - $2,479,839 TOTAL TRANSIT PAYGO $29,318,696 $31,372,708 $32,706,980 $33,564,824 $34,446,919 $161,410,127
Use Categories
Direct Payments $737,282 $748,341 $759,566 $770,959 $782,523 $3,798,671
Transfer to CATS $24,101,575 $24,809,314 $25,537,986 $26,288,212 $27,060,633 $127,797,720
Transfer to CIP $4,479,839 $5,815,053 $6,409,428 $6,505,653 $6,603,763 $29,813,736
TOTAL TRANSIT PAYGO $29,318,696 $31,372,708 $32,706,980 $33,564,824 $34,446,919 $161,410,127
244

General CIP Project Summary Schedule
4 4
AdvancedPlanningandDesignProgramSummary
PROJECTTITLE Total
TransportationandPlanning
Cross Charlotte Trail Segments 10 and 11 Ashley Road/Tuckaseegee Road/Freedom Drive Intersection Eastway Drive/Shamrock Drive Intersection Bryant Farms Road Extension Robinson Church Road NeighborhoodDevelopment
Construct and Renovate Fire Stations Complete Police Division Stations Upgrade Existing Animal Care and Control Facility
TOTALPLANNINGANDDESIGNPROGRAM $20,000,000
PlanningandDesignRevenueSummary
Municipal Debt Service Fund Balance $20,000,000 TOTALREVENUEPLANNINGANDDESIGNPROGRAM $20,000,000
245

General CIP Project Summary Schedule
21 21
2014 Bond 2016 Bond 2018 Bond 2020 Bond* Total PROJECTS FUNDED WITH GENERAL OBLIGATION BONDS
Transportation and Planning (Mobility, Accessibility, and Connectivity)
Extend Bryant Farms Road $2,000,000 $18,000,000 $20,000,000
Improve Idlewild/Monroe Intersection $6,100,000 $2,500,000 $8,600,000
Maintain Traffic Signal System Coordination $3,000,000 $3,000,000 $3,000,000 $6,000,000 $15,000,000
Upgrade Traffic Control Devices $7,000,000 $4,000,000 $4,000,000 $4,000,000 $19,000,000
Repair and Replace Bridges $4,000,000 $3,000,000 $3,000,000 $4,000,000 $14,000,000
Research Drive - J.W. Clay Connector $3,000,000 $12,480,000 $9,700,000 $25,180,000
University Pointe - IBM Drive to Ikea Boulevard $15,080,000 $15,080,000
Neighborhood Transportation Programs $5,200,000 $5,000,000 $10,200,000
Eastern Circumferential $12,064,000 $12,064,000
Bicycle Travel $4,000,000 $4,000,000
Transportation Safety (Vision Zero) $2,000,000 $2,000,000
McKee Road/Providence Road Intersection $800,000 $800,000
Neighborhood Development (Safe, Healthy, and Inclusive Communities) Create and Preserve Affordable Housing $15,000,000 $15,000,000 $50,000,000 $50,000,000 $130,000,000 Complete Comprehensive Neighborhood Improvement Program (CNIP) $20,000,000 $40,000,000 $30,000,000 $30,000,000 $120,000,000
Promote SouthPark CNIP $5,000,000 $10,000,000 $15,000,000
Improve Pedestrian Safety $15,000,000 $15,000,000 $30,000,000 $15,000,000 $75,000,000
Strengthen East/Southwest Sidewalk and Bikeway Connections $2,000,000 $4,000,000 $2,000,000 $8,000,000
Public/Private Redevelopment (Independence/Eastland Corridor) $10,000,000 $10,000,000 $20,000,000
South End Pedestrian/Bicycle Connector $2,000,000 $2,000,000
Cross Charlotte Multi-Use Trail $5,000,000 $25,000,000 $5,000,000 $35,000,000
Cross Charlotte Trail - South Charlotte Connector $3,000,000 $3,000,000
Neighborhood Reinvestment Program $5,000,000 $5,000,000
Economic Development (Economy, Jobs, and Upward Mobility)
Develop Dixie Berryhill Area Roads $16,200,000 $8,520,000 $21,480,000 $46,200,000
Acquire Land and Create Street Connections $12,500,000 $7,500,000 $2,000,000 $22,000,000
Beautify Monroe Road Streetscape $2,080,000 $1,000,000 $10,320,000 $13,400,000
Connect Northeast Corridor Infrastructure $16,640,000 $35,360,000 $27,300,000 $27,300,000 $106,600,000
Extend Park South Drive $4,000,000 $4,632,000 $8,632,000
Applied Innovation Corridor $12,480,000 $2,720,000 $13,760,000 $28,960,000
Total General Obligation Bonds $145,964,000 $218,440,000 $223,080,000 $197,232,000 $784,716,000
*The 2020 Bond, which will not occur until FY 2021, is currently planned and will be proposed for adoption during next year's budget.
246

General CIP Project Summary Schedule
22 22
2014 Bond 2016 Bond 2018 Bond 2020 Bond* Total PROJECTS FUNDED WITH OTHER DEBT (Does Not Require Voter Approval)**
Neighborhood Development (Safe, Healthy, and Inclusive Communities) Construct Fire Stations $9,350,000 $9,350,000
Joint Communications Center $68,000,000 $8,300,000 $76,300,000
Six Police Division Stations $10,500,000 $24,750,000 $46,100,000 $81,350,000
Animal Care and Control - Upgrades to Current Facility $4,000,000 $4,000,000
Circular Economy Innovation Barn $2,000,000 $2,000,000
Economic Development (Economy, Jobs, and Upward Mobility)
Bojangles/Ovens Area Redevelopment $25,000,000 $25,000,000
Hold for Charlotte Gateway Station and Other Contingencies $37,865,000 $37,865,000 Well-Managed Government (Efficient, Effective, Accountable, Responsive, Inclusive, and Customer Focused) Capital Building Improvements $2,500,000 $2,500,000 Replace Government Center HVAC $5,460,000 $5,460,000 Implement ADA Transition Plan $200,000 $200,000
Land Purchase for Future Fire Stations $4,000,000 $4,000,000
Infill Fire Station I-77 and Clanton Road Additional Funding $1,300,000 $1,300,000
Northeast Equipment Maintenance Facility $2,080,000 $11,500,000 $13,580,000
Innovation and Technology Relocation $2,500,000 $2,500,000
Total Other Debt $103,500,000 $76,995,000 $67,400,000 $17,510,000 $265,405,000
FY 2020 Proposed Total All Projects $249,464,000 $295,435,000 $290,480,000 $214,742,000 $1,050,121,00
FY 2019 Adopted Total All Projects $249,464,000 $295,435,000 $290,480,000 $182,232,000 $1,017,611,00
$ Change $0 $0 $32,510,000 $32,510,000 **Other debt does not require voter approval and may be issued at any time once approved by City Council.
247

General CIP Project Summary Schedule
23 23
Operating Impact from Major CIP Projects
Total Planned Project Cost Operating Cost
Estimated Annual
Operating Cost
Anticipated First Year
Needed Transportation and Planning Cross Charlotte Trail $92,400,000 Exact operating costs of city-maintained segments of the Trail cannot be determined until
the segment reaches the design phase. Cost to maintain city portions of the Trail will likely be covered by existing transportation maintenance program budgets. Costs could include periodic infrastructure maintenance, debris removal, or maintenance of security cameras.
$7,500 FY 2023
Uptown Cycle Track $6,500,000 Periodic maintenance of bicycle lanes and streetscape. Cost to maintain will be covered by existing capital maintenance budgets.
$3,375 FY 2021
Bryant Farms Road $20,000,000 Periodic repaving, as well as maintenance of street signs and traffic signals. Increases in street resurfacing costs are anticipated to be offset by increases in Powell Bill revenue. Street sign and traffic signal maintenance will be covered within existing capital maintenance budgets.
$15,000 FY 2024
Idlewild Road and Monroe Road Intersection
$12,500,000 Periodic maintenance of traffic signals and pedestrian crossings. Costs will be covered within existing capital maintenance budgets.
$9,375 FY 2023
Traffic Signal System Coordination
$15,000,000 Costs will be covered within existing traffic system maintenance budget. $6,750 FY 2020
Traffic Control Devices $19,000,000 Costs will be covered within existing traffic control devices budget. $6,000 FY 2020
Bridge Program $14,000,000 Costs will be covered within existing bridge program budget. $10,000 FY 2020 Neighborhood Development Comprehensive Neighborhood Improvement Program (CNIP)
$135,000,000 Periodic maintenance of sidewalks, curb and gutter, landscaping, and pedestrian crossings. Initial maintenance costs will be covered within existing capital maintenance budgets. At completion of all six CNIP areas, the capital maintenance budgets may require additional funding to fully support the new infrastructure.
$52,500 FY 2024
Pedestrian Safety $75,000,000 Costs will be covered within existing capital maintenance budgets. $56,250 FY 2021
East/Southeast Sidewalks and Bikeways
$8,000,000 Periodic maintenance of sidewalks, curb and gutter, and bicycle lanes. Costs will be covered within existing capital maintenance budgets.
$6,000 FY 2021
Infill Fire Station $9,350,000 Annual, ongoing facility maintenance and operations for a new fire station. The new station will house one Engine Company requiring the addition of 18 firefighters. Costs associated with the new Company include ongoing annual expenses for salaries, benefits, and operating supplies.
$2,100,000 FY 2024
Police Central Division Station
$27,800,000 This new facility relocates an existing division out of a leased facility. The city is currently funding Central Division salaries and benefits and maintenance on the leased facility; therefore, only a marginal increase in cost is expected from the new facility.
$25,000 FY 2021
Economic Development Polk Park $1,000,000 Periodic maintenance of additional public space that could include general upkeep, debris
removal, or landscaping. Costs are anticipated to be covered within existing capital maintenance budgets.
$1,500 FY 2021
Dixie Berryhill Area Roads $46,200,000 Periodic repaving, as well as maintenance of street signs and traffic signals. Increases in street resurfacing costs are anticipated to be offset by increases in Powell Bill revenue. Street sign and traffic signal maintenance will be covered within existing capital maintenance budgets.
$34,650 FY 2023
Land Acquisition and Street Connections
$22,000,000 Periodic repaving, as well as maintenance of street signs and traffic signals. Increases in street resurfacing costs are anticipated to be offset by increases in Powell Bill revenue. Street sign and traffic signal maintenance will be covered within existing capital maintenance budgets.
$16,500 FY 2022
248

General CIP Project Summary Schedule
24 24
Operating Impact from Major CIP Projects (continued)
Total Planned Project Cost Operating Cost
Estimated Annual
Operating Cost
Anticipated First Year
Needed Economic Development (continued) Monroe Road Streetscape $13,400,000 Periodic maintenance of sidewalks, curb and gutter, and landscaping. Costs will be
covered within existing capital maintenance budgets. $10,050 FY 2023
Northeast Corridor Infrastructure (NECI)
$106,600,000 Periodic maintenance of sidewalks, curb and gutter, and pedestrian crossings. Costs will be covered within existing capital maintenance budgets.
$79,950 FY 2023
Park South Drive $8,632,000 Minimal increase in repaving, as well as maintenance of street signs and traffic signals. Increases in street resurfacing costs are anticipated to be offset by increases in Powell Bill revenue. Street sign and traffic signal maintenance will be covered within existing capital maintenance budgets.
$6,474 FY 2021
Well-Managed Government Land Acquisition Program $2,500,000 Periodic maintenance cost of land between time of purchase and initiation of
construction. Costs could include mowing, debris removal, or securing existing infrastructure. Costs are estimated at $5,000 per acre.
$15,000 FY 2020
TOTAL OPERATING COSTS $2,461,874
249

General CIP Project Summary Schedule
25 25
Public Art Summary
The city promotes art in public spaces by including funding for artwork in capital project budgets. The City Council-adopted Public Art Ordinance provides guidance to the Public Art Program, which seeks to support the cultural heritage and artistic development of the city, contribute to economic development and tourism, and improve the aesthetic of public spaces. Eligible projects include buildings, facilities, or open spaces that are accessible to residents; projects below ground, such as pipes or utilities, are excluded from the program. The program is administered in partnership with the Arts & Science Council.
The amount of public art funding allocated per project is determined by project type and the anticipated construction costs associated with each type. Public art budgets are equivalent to one percent of 60 percent of the total projected construction costs for neighborhood improvement and public facility projects, and one percent of ten percent of the total projected construction costs for bikeway and bridge projects.
PROJECT TITLE FY 2020 FY 2021 FY 2022 FY 2023 FY 2024 TOTAL
Advance the Cross Charlotte Trail $326,400 - - - - $326,400 Create Uptown Cycle Track $4,500 - - - - $4,500 Repair and Replace Bridges - $4,000 - - - $4,000 Complete Comprehensive Neighborhood Improvement Program
- $180,000 - - - $180,000
Improve Pedestrian Safety - $15,000 - - - $15,000 Strengthen East/Southeast Sidewalk and Bikeway
- $2,000 - - - $2,000
Construct Fire Stations - $60,000 - - - $60,000 Beautify Monroe Road Streetscape - $10,320 - - - $10,320 Connect Northeast Corridor Infrastructure - $163,800 - - - $163,800
TOTAL PUBLIC ART $330,900 $435,120 - - - $766,020
PUBLIC ART REVENUE SUMMARY General Obligation (GO) Bonds (2020) - $375,120 - - - $375,120 Other Debt - $60,000 - - - $60,000 Cash $330,900 - - - - $330,900
TOTAL REVENUE PUBLIC ART $330,900 $435,120 - - - $766,020
250

Nongeneral Funds Project Summary Schedules
26 26
Aviation Summary
PROJECT TITLE FY 2020 FY 2021 FY 2022 FY 2023 FY 2024 TOTAL
Renovate Airport Terminal Terminal Rehabilitation $28,328,707 $3,579,340 - - - $31,908,047 Atrium Rehabilitation $1,428,471 $4,079,509 $382,472 - - $5,890,452 Concourse A North Expansion Phase II and III $5,267,575 $127,557,203 $60,594,534 - - $193,419,312 Concourse E Expansion - Phase VIII Amended $16,212,244 $9,141,896 - - - $25,354,140 Passenger Boarding Units and Bridges $7,719,832 $1,376,324 $36,213 $726,000 - $9,858,369Terminal Lobby Expansion $14,772,535 $68,536,107 $119,602,443 $114,338,300 $57,220,271 $374,469,656Terminal Lobby Canopy $7,152,930 $54,794,141 $7,152,930 - - $69,100,001Central Energy Plant $63,000,000 - - - - $63,000,000Mezzanine Expansion $2,218,203 $17,405,639 $3,225,861 - - $22,849,703Charter Terminal $15,228,114 - - - - $15,228,114CBP Renovations $12,998,057 $93,324,023 - - - $106,322,080Terminal Basement Rehabilitation - $4,930,664 $569,336 - - $5,500,000 Elevator Rehabilitation - - $100,000 - - $100,000 Fire Sprinklers (not covered in Terminal Rehab) $100,000 - - - - $100,000 Airport Comm Room Expansion $1,000,000 $1,000,000 - - - $2,000,000 Concourse A North Comm Room $500,000 - - - - $500,000 Emergency Notification System $166,667 - - - - $166,667 Centralized Receiving and Distribution Center $20,000,000 - - - - $20,000,000 Sub-Total Airport Terminal $196,093,335 $385,724,846 $191,663,789 $115,064,300 $57,220,271 $945,766,541
Enhanced Airfield Capacity West Ramp Expansion Phase II and Fuel Station $35,783,179 $1,316,821 - - - $37,100,000 EIS for Master Plan Projects - Phase II $1,471,530 - - - - $1,471,530 Taxiway M Rehabilitation $9,336,162 - - - - $9,336,162 North EAT and Relos (Old Dowd, Overlook, RTR, ASOS) $128,760,100 $27,288,527 $39,322,300 $2,693,613 - $198,064,540Taxiway F Extension, Deice Pad and Taxiway SCF $10,767,747 $1,287,943 $69,850,893 $109,205,679 $6,591,688 $197,703,950Runway 18L/36R Rehab and C7 Removal $8,485,134 - - - - $8,485,134 Corporate Hangars Site Development $13,392,000 - - - - $13,392,000 Airfield Pavement Improvements $1,500,000 $1,500,000 - - - $3,000,000 West Boulevard Relocation $809,510 $600,329 $11,205,183 $4,351,031 - $16,966,053Fourth Parallel Runway $6,991,283 $18,004,612 $23,097,756 $269,362,977 $52,953,120 $370,409,748South Ramp Expansion - $4,056,183 $3,387,634 $782,612 $8,226,429 General Aviation Group Hangar $11,022,222 $2,927,778 $667,470 $832,530 - $15,450,000Field Maintenance Facility $465,820 $4,034,180 - - - $4,500,000 Perimeter Fence Upgrade $2,280,411 $1,581 - - - $2,281,992 ARFF Truck Replacement $1,000,000 - - - - $1,000,000 Master Plan Land Acquisition Fifth Parallel Runway - - - - $336,124 $336,124 Multifunction Snow Plows $1,200,000 - - - - $1,200,000 Road Tractor $140,000 - - - - $140,000 Dump Trucks $200,000 - - - - $200,000 Crash Phone Replacement $66,800 - - - - $66,800 Building Maintenance Facility Renovation $5,000,000 - - - - $5,000,000 Sub-Total Airfield Capacity $238,671,898 $56,961,771 $148,199,785 $389,833,464 $60,663,544 $894,330,462
Increase Airport Fuel Capacity Terminal Fuel Farm Expansion - Phase III $10,000,000 - - - - $10,000,000 Fuel Farm Pumping Station Expansion $651,923 $1,189 - - - $653,112 Concourse A Reno Fueling $1,679,012 - - - - $1,679,012 Sub-Total Fuel Capacity $12,330,935 $1,189 - - - $12,332,124
251

Nongeneral Funds Project Summary Schedules
27 27
Aviation Summary (continued)
PROJECT TITLE FY 2020 FY 2021 FY 2022 FY 2023 FY 2024 TOTAL
Enhance Airport Services Facilities Joint Operations Center $10,161,976 $12,151,216 - - - $22,313,192 Part 150 (Sound Insulation) $3,270,996 $854,004 - - - $4,125,000 Roof Replacement $500,000 $500,000 - - - $1,000,000 Asphalt and Parking Lot Improvements $500,000 $500,000 - - - $1,000,000 Airfield Progressive Light Replacement $200,000 $200,000 - - - $400,000 FIDS for Cell Lot $250,000 - - - $250,000 Video Management System $3,765,250 - - - - $3,765,250 Software for Aviation Document Storage $125,000 - - - - $125,000 ECA Land Acquisition $5,000,000 $10,000,000 $8,100,000 $10,500,000 - $33,600,000Gateway Development District Central Site Readiness $350,000 - - - - $350,000Airport Phone System Replacement $2,050,000 $2,050,000 - - - $4,100,000Two Knuckle Boom Lifts $220,000 - - - - $220,000 Mobile Column Lifts $75,000 - - - - $75,000 Technology Projects $2,726,500 $200,000 - - - $2,926,500 Sub-Total Airport Services Facilities $28,944,722 $26,705,220 $8,100,000 $10,500,000 - $74,249,942
Expand Airport Cargo Capacity FedEx Projects $4,040,000 - - - - $4,040,000 Air Cargo Cold Storage Facility - $9,050,000 - - - $9,050,000 Steele Creek Cargo Facility - - $7,400,000 - - $7,400,000 Sub-Total Cargo Capacity $4,040,000 $9,050,000 $7,400,000 - - $20,490,000
Expand Ground Transportation Capacity Bus Purchase $2,720,000 $2,400,000 $2,400,000 - - $7,520,000 Other Maintenance Vehicles $310,000 - - - - $310,000 Parking Revenue Control System Replacement and Enhancements
- $14,000,000 - - - $14,000,000
Landscape - Josh Birmingham Old Roadway Landscape Renovation
$1,500,000 - - - - $1,500,000
Sub-Total Ground Transportation Capacity $4,530,000 $16,400,000 $2,400,000 - - $23,330,000
Improve Private Aircraft Area FBO Ramp Expansion $2,893,519 - - - - $2,893,519 FBO Terminal Expansion - $3,000,000 - - - $3,000,000 Wilson Air Vehicles $515,000 - - - - $515,000 On-Call Planning Services $1,000,000 - - - - $1,000,000 Architectural Consultation and Programming Services $1,500,000 $1,500,000 $1,500,000 $1,500,000 - $6,000,000Planning Support Services - Sustainability $250,000 $250,000 - - - $500,000 Professional Engineering Scoping and Programming Contracts
$2,000,000 $1,500,000 - - - $3,500,000
Sub-Total Private Aircraft Area $8,158,519 $6,250,000 $1,500,000 $1,500,000 - $17,408,519
TOTAL AVIATION $492,769,409 $501,093,026 $359,263,574 $516,897,764 $117,883,815 $1,987,907,588
AVIATION REVENUE SUMMARY Revenue Bonds $241,292,746 $379,008,923 $257,133,229 $172,414,196 $62,170,840 $1,112,019,934 Federal Grants $87,509,730 $10,344,500 $41,364,468 $167,750,709 $28,053,108 $335,022,515 Passenger Facility Charges $90,521,487 $13,716,910 $33,749,499 $164,350,329 $27,659,867 $329,998,092 Customer Facility Charges $3,623,047 $27,753,906 $3,623,047 - - $35,000,000 Aviation Pay-As-You-Go $68,500,900 $70,268,787 $23,393,331 $12,382,530 - $174,545,548Other Funding $1,321,499 - - - - $1,321,499
TOTAL REVENUE AVIATION $492,769,409 $501,093,026 $359,263,574 $516,897,764 $117,883,815 $1,987,907,588
252

Nongeneral Funds Project Summary Schedules
28 28
Charlotte Area Transit System (CATS) Summary
PROJECT TITLE FY 2020 FY 2021 FY 2022 FY 2023 FY 2024 TOTAL
Plan and Design Silver Line Light Rail $9,000,000 $9,000,000 $11,000,000 $11,000,000 $10,000,000 $50,000,000
Design South End Light Rail Station $1,415,608 $1,581,717 $3,000,000 $3,000,000 $3,000,000 $11,997,325
Develop Transit Systems American Disability Act Improvements - $200,000 $200,000 $200,000 $200,000 $800,000 Blue Line Extension Local Share $1,232,804 - - - - $1,232,804 Sub-Total Transit Systems $1,232,804 $200,000 $200,000 $200,000 $200,000 $2,032,804
Enhance Safety and Security on Transit Blue Line Extension Cameras $218,649 $220,395 $222,144 $223,897 $226,136 $1,111,221 Police Dispatch Upgrade (Transit Police) $172,069 - - - - $172,069 Mobile Video Replacements $967,666 $952,921 - - - $1,920,587 New Video Management System $1,500,000 $549,000 $1,000,000 $770,000 - $3,819,000Sub-Total Safety and Security on Transit $2,858,384 $1,722,316 $1,222,144 $993,897 $226,136 $7,022,877
Purchase New Transit Support Systems Server Refresh $130,500 $164,000 $133,500 $34,000 $538,000 $1,000,000 Steam Bay Lifts $379,391 - - - - $379,391 Maintenance of Way Backhoe $100,000 - - - - $100,000 Upgrade Business System Software $262,285 $311,969 $231,459 - - $805,713 Mobile Applications and Ticketing $218,051 - - - - $218,051 Technology Project Contingency $100,000 - - - - $100,000 Rail Shop Equipment $250,000 - - - - $250,000 Mobile Network Upgrade $904,600 - - - - $904,600 Sub-Total Transit Support Systems $2,344,827 $475,969 $364,959 $34,000 $538,000 $3,757,755
Purchase Vehicles for CATS Bus Operations Replacements $132,700 $136,450 $140,200 $143,950 $151,200 $704,500 Bus Maintenance Replacements $213,500 $219,800 $226,100 $79,800 - $739,200Special Transportation Service Replacements $98,500 $101,260 $104,020 $106,780 $109,540 $520,100Rail Operations Replacements $33,000 - - - - $33,000Track Maintenance Replacements $151,500 $60,000 - - - $211,500Train Control Replacements $133,000 - - - - $133,000Emergency Response Replacements $446,000 $107,500 - - - $553,500Facility Maintenance Replacements $32,000 $60,000 $60,000 $60,000 $60,000 $272,000Sub-Total Vehicles for CATS $1,240,200 $685,010 $530,320 $390,530 $320,740 $3,166,800
253

Nongeneral Funds Project Summary Schedules
29 29
CATS Summary (continued)
PROJECT TITLE FY 2020 FY 2021 FY 2022 FY 2023 FY 2024 TOTAL
Maintain Transit Facilities South Tryon HVAC Replacement $325,000 - - - - $325,000 North Davidson Bus Wash $400,000 - - - - $400,000 Contingency for Facilities $150,000 - - - - $150,000 Bus Shelter Repairs $254,656 - - - - $254,656 Sub-Total Facility State of Good Repair $1,129,656 - - - - $1,129,656
Maintain Transit Vehicles Bus Replacements $6,806,018 $8,566,897 $8,187,716 $9,068,182 $9,318,825 $41,947,638 Special Transportation Service Replacements $1,706,990 $1,758,995 $1,812,560 $1,867,731 $1,924,558 $9,070,834 Vanpool Replacements $818,145 $733,590 $507,120 $331,890 $344,726 $2,735,471 NC DOT Urban Match $1,415,608 $1,581,717 $1,105,948 $1,050,740 $1,126,780 $6,280,793 Sub-Total Vehicle State of Good Repair $10,746,761 $12,641,199 $11,613,344 $12,318,543 $12,714,889 $60,034,736
TOTAL CATS $29,968,240 $26,306,211 $27,930,767 $27,936,970 $26,999,765 $139,141,953
CATS REVENUE SUMMARY Federal Grants $13,288,053 $10,551,885 $10,259,855 $10,308,984 $10,298,388 $54,707,165 State Grants $1,627,828 $1,581,717 $1,105,948 $1,050,740 $1,126,780 $6,493,013 CATS Pay-As-You-Go $15,052,359 $14,172,609 $16,564,964 $16,577,246 $15,574,597 $77,941,775
TOTAL REVENUE CATS $29,968,240 $26,306,211 $27,930,767 $27,936,970 $26,999,765 $139,141,953
254

Nongeneral Funds Project Summary Schedules
30 30
Charlotte Water Summary PROJECT TITLE FY 2020 FY 2021 FY 2022 FY 2023 FY 2024 TOTAL
Relocate Water and Wastewater Infrastructure Independence Boulevard Widening-Water - - $7,000,000 - - $7,000,000 Independence Boulevard Widening-Sewer - - $3,000,000 - - $3,000,000 Water Lines for Street Improvements - $5,000,000 $5,000,000 $5,150,000 $5,304,500 $20,454,500 McKee Road Water Main Extension - - $2,500,000 - - $2,500,000 Sewer Line in Streets to be Widened $5,000,000 $5,000,000 $5,000,000 $5,150,000 $5,304,500 $25,454,500 Sub-Total Water and Wastewater Infrastructure $5,000,000 $10,000,000 $22,500,000 $10,300,000 $10,609,000 $58,409,000
Construct Long Creek Wastewater Treatment Plant (WWTP) Long Creek WWTP $12,000,000 $42,000,000 $81,600,000 $73,600,000 $75,800,000 $285,000,000 Belmont Lift Station and Forcemain - - $4,500,000 $17,800,000 - $22,300,000Mount Holly Lift Station and Forcemain - $2,000,000 - - - $2,000,000Sub-Total Long Creek WWTP $12,000,000 $44,000,000 $86,100,000 $91,400,000 $75,800,000 $309,300,000
Expand Mallard Creek WWTP Reliability Improvements $8,000,000 $9,000,000 $1,300,000 - - $18,300,000 Generator Project $10,000,000 - - - - $10,000,000 Solids Handling Improvements $1,500,000 $2,500,000 $6,500,000 $6,500,000 $750,000 $17,750,000 Expansion and Improvements - $6,100,000 $23,200,000 $24,000,000 $24,000,000 $77,300,000 Sub-Total Mallard Creek WWTP $19,500,000 $17,600,000 $31,000,000 $30,500,000 $24,750,000 $123,350,000
Improve McAlpine Creek WWTP Dewatering Complex Upgrade - $1,100,000 $8,200,000 - - $9,300,000 Facilities Improvements - - $4,900,000 - $4,800,000 $9,700,000 Digester Facility Rehabilitation $2,500,000 - - - - $2,500,000 Aeration and Clarifier Rehab and Upgrades - $40,000,000 $40,000,000 - - $80,000,000 Sub-Total McAlpine Creek WWTP $2,500,000 $41,100,000 $53,100,000 - $4,800,000 $101,500,000
Upgrade McDowell Creek WWTP Maintenance and Upgrades - - - $1,500,000 $12,000,000 $13,500,000 Sub-Total McDowell Creek WWTP - - - $1,500,000 $12,000,000 $13,500,000
Upgrade Water Treatment Plants (WTPs) WTP Rehabilitation and Upgrades - - $4,850,000 $4,850,000 - $9,700,000Franklin WTP Reliability Improvements Project - - $9,500,000 - - $9,500,000Franklin WTP Water Quality Improvement Project $500,000 - $3,000,000 - - $3,500,000Vest and Franklin WTP Rehabilitation and Upgrades $5,000,000 $5,000,000 - - - $10,000,000Energy Optimization-Pumping $550,000 - - - - $550,000 Generator for Lee S. Dukes WTP $2,500,000 $600,000 - - - $3,100,000 Sub-Total WTPs $8,550,000 $5,600,000 $17,350,000 $4,850,000 - $36,350,000
Improve WWTPs Ultraviolet Disinfection System Improvements - - - $2,000,000 - $2,000,000Vacuum Truck Debris Receiving Stations - - $1,200,000 - - $1,200,000Rehabilitation and Upgrades $10,700,000 $8,800,000 $7,800,000 $7,800,000 $7,800,000 $42,900,000Roofing at Wastewater Treatment Facilities $800,000 $700,000 - - - $1,500,000Site Work at all WWTPs $600,000 $250,000 $250,000 $250,000 $250,000 $1,600,000PS and WAS Pipeline from Long Creek WWTP to Irwin Creek WWTP
- $4,200,000 $6,000,000 $6,000,000 $1,000,000 $17,200,000
PS and WAS Pipeline from Irwin Creek WWTP to McAlpine Creek WWTP
- - - - $2,000,000 $2,000,000
Sugar and Irwin WAS Equalization Tanks at McAlpine Creek WWTP
$900,000 $400,000 $4,000,000 - - $5,300,000
Sub-Total WWTPs $13,000,000 $14,350,000 $19,250,000 $16,050,000 $11,050,000 $73,700,000
255
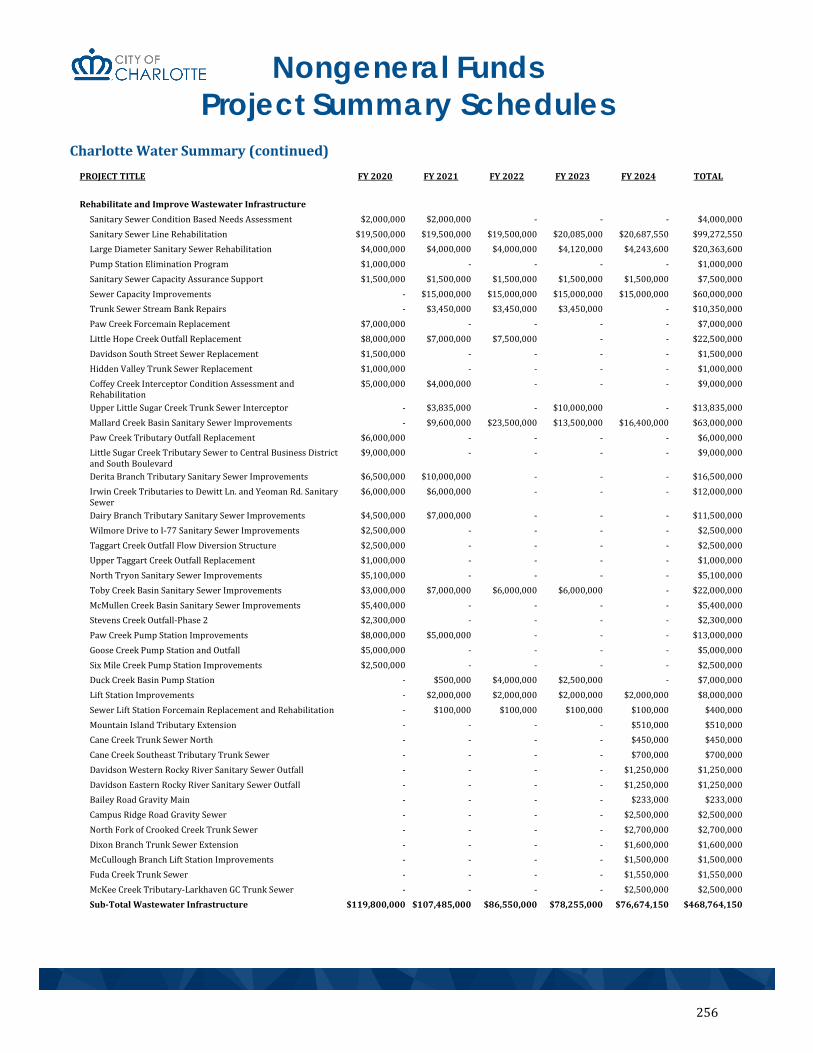
Nongeneral Funds Project Summary Schedules
31 31
Charlotte Water Summary (continued) PROJECT TITLE FY 2020 FY 2021 FY 2022 FY 2023 FY 2024 TOTAL
Rehabilitate and Improve Wastewater Infrastructure Sanitary Sewer Condition Based Needs Assessment
$2,000,000 $2,000,000 - - - $4,000,000 Sanitary Sewer Line Rehabilitation $19,500,000 $19,500,000 $19,500,000 $20,085,000 $20,687,550 $99,272,550 Large Diameter Sanitary Sewer Rehabilitation $4,000,000 $4,000,000 $4,000,000 $4,120,000 $4,243,600 $20,363,600 Pump Station Elimination Program $1,000,000 - - - - $1,000,000 Sanitary Sewer Capacity Assurance Support $1,500,000 $1,500,000 $1,500,000 $1,500,000 $1,500,000 $7,500,000 Sewer Capacity Improvements - $15,000,000 $15,000,000 $15,000,000 $15,000,000 $60,000,000 Trunk Sewer Stream Bank Repairs - $3,450,000 $3,450,000 $3,450,000 - $10,350,000Paw Creek Forcemain Replacement $7,000,000 - - - - $7,000,000Little Hope Creek Outfall Replacement $8,000,000 $7,000,000 $7,500,000 - - $22,500,000Davidson South Street Sewer Replacement $1,500,000 - - - - $1,500,000Hidden Valley Trunk Sewer Replacement $1,000,000 - - - - $1,000,000Coffey Creek Interceptor Condition Assessment and Rehabilitation
$5,000,000 $4,000,000 - - - $9,000,000
Upper Little Sugar Creek Trunk Sewer Interceptor - $3,835,000 - $10,000,000 - $13,835,000Mallard Creek Basin Sanitary Sewer Improvements - $9,600,000 $23,500,000 $13,500,000 $16,400,000 $63,000,000Paw Creek Tributary Outfall Replacement $6,000,000 - - - - $6,000,000Little Sugar Creek Tributary Sewer to Central Business District and South Boulevard
$9,000,000 - - - - $9,000,000
Derita Branch Tributary Sanitary Sewer Improvements $6,500,000 $10,000,000 - - - $16,500,000Irwin Creek Tributaries to Dewitt Ln. and Yeoman Rd. Sanitary Sewer
$6,000,000 $6,000,000 - - - $12,000,000
Dairy Branch Tributary Sanitary Sewer Improvements $4,500,000 $7,000,000 - - - $11,500,000Wilmore Drive to I-77 Sanitary Sewer Improvements $2,500,000 - - - - $2,500,000Taggart Creek Outfall Flow Diversion Structure $2,500,000 - - - - $2,500,000Upper Taggart Creek Outfall Replacement $1,000,000 - - - - $1,000,000North Tryon Sanitary Sewer Improvements $5,100,000 - - - - $5,100,000Toby Creek Basin Sanitary Sewer Improvements $3,000,000 $7,000,000 $6,000,000 $6,000,000 - $22,000,000McMullen Creek Basin Sanitary Sewer Improvements $5,400,000 - - - - $5,400,000Stevens Creek Outfall-Phase 2 $2,300,000 - - - - $2,300,000Paw Creek Pump Station Improvements $8,000,000 $5,000,000 - - - $13,000,000Goose Creek Pump Station and Outfall $5,000,000 - - - - $5,000,000Six Mile Creek Pump Station Improvements $2,500,000 - - - - $2,500,000Duck Creek Basin Pump Station - $500,000 $4,000,000 $2,500,000 - $7,000,000Lift Station Improvements - $2,000,000 $2,000,000 $2,000,000 $2,000,000 $8,000,000Sewer Lift Station Forcemain Replacement and Rehabilitation - $100,000 $100,000 $100,000 $100,000 $400,000 Mountain Island Tributary Extension - - - - $510,000 $510,000 Cane Creek Trunk Sewer North - - - - $450,000 $450,000 Cane Creek Southeast Tributary Trunk Sewer - - - - $700,000 $700,000 Davidson Western Rocky River Sanitary Sewer Outfall - - - - $1,250,000 $1,250,000 Davidson Eastern Rocky River Sanitary Sewer Outfall - - - - $1,250,000 $1,250,000 Bailey Road Gravity Main - - - - $233,000 $233,000 Campus Ridge Road Gravity Sewer - - - - $2,500,000 $2,500,000 North Fork of Crooked Creek Trunk Sewer - - - - $2,700,000 $2,700,000 Dixon Branch Trunk Sewer Extension - - - - $1,600,000 $1,600,000 McCullough Branch Lift Station Improvements - - - - $1,500,000 $1,500,000 Fuda Creek Trunk Sewer - - - - $1,550,000 $1,550,000 McKee Creek Tributary-Larkhaven GC Trunk Sewer - - - - $2,500,000 $2,500,000 Sub-Total Wastewater Infrastructure $119,800,000 $107,485,000 $86,550,000 $78,255,000 $76,674,150 $468,764,150
256

Nongeneral Funds Project Summary Schedules
32 32
Charlotte Water Summary (continued) PROJECT TITLE FY 2020 FY 2021 FY 2022 FY 2023 FY 2024 TOTAL
Rehabilitate and Improve Water Infrastructure Water Quality Sampling Stations - - $1,000,000 - - $1,000,000 Pressure Zone Boundary Changes - - $3,125,000 - - $3,125,000 Valve Rehabilitation and Replacement $1,300,000 - - - - $1,300,000 Water Line Rehabilitation and Replacement $15,000,000 $15,000,000 $15,000,000 $15,450,000 $15,913,500 $76,363,500 Water Distribution System Design and Reliability Improvements
$4,500,000 $1,000,000 $1,000,000 $1,000,000 $1,000,000 $8,500,000
Idlewild Booster Pump Station Supply Main - $5,125,000 - - - $5,125,000 Plaza Storage Tank Reinforcement Main - - $1,000,000 - - $1,000,000 Old Dowd Road Airport 24-inch Water Main Connection $10,000,000 - - - - $10,000,000 South Boulevard Water Main from Worthington Avenue to Clanton Road
$7,000,000 - - - - $7,000,000
Davidson Water Transmission Main from NC-115 $6,000,000 - - - - $6,000,000 960 Zone North-South Transmission Main - $10,000,000 $5,000,000 - - $15,000,000 960 Zone West-East Transmission Main - - $9,000,000 - - $9,000,000 Verhoeff Drive Water Main - - - - $1,300,000 $1,300,000 Hambright Road Water Main - - - - $500,000 $500,000 East Rocky River Rd to Shearer Rd Davidson Ext 16/12 Water Main
- - - - $3,100,000 $3,100,000
Brief Road Water Main Extension - - - - $1,500,000 $1,500,000 Sub-Total Water Infrastructure $43,800,000 $31,125,000 $35,125,000 $16,450,000 $23,313,500 $149,813,500
Increase Alternative Energy Production Biogas Use Pilot at Mallard Creek WWTP - - $2,000,000 $4,000,000 - $6,000,000Solar Panel Pilot at Irwin Creek WWTP - - $1,000,000 - - $1,000,000Thermal Hydrolysis System at McAlpine Creek WWTP - - $2,500,000 $3,000,000 $4,500,000 $10,000,000Combined Heat and Power-Phase II at McAlpine WWTP $6,750,000 - - - - $6,750,000Sub-Total Alternative Energy $6,750,000 - $5,500,000 $7,000,000 $4,500,000 $23,750,000
Install and Expand New Water and Sewer Service Street and Minor Water Main Extensions $5,000,000 $5,000,000 $5,000,000 $5,000,000 $5,500,000 $25,500,000 Street and Minor Sewer Main Extensions $7,000,000 $7,000,000 $7,000,000 $7,000,000 $7,500,000 $35,500,000 Water Meter Operations Program - $3,300,000 $3,300,000 $3,300,000 $3,300,000 $13,200,000 Reimbursable Developer Constructed-Water $268,289 $88,000 $88,000 $88,000 - $532,289Reimbursable Developer Constructed-Sewer $2,234,541 $2,054,252 $2,054,252 $2,054,252 - $8,397,297New Service Installation-Water $17,476,000 $17,476,000 $17,476,000 $18,000,280 $18,540,288 $88,968,568New Service Installation-Sewer $8,224,000 $8,224,000 $8,224,000 $8,470,720 $8,724,842 $41,867,562Sub-Total New Water and Sewer Service $40,202,830 $43,142,252 $43,142,252 $43,913,252 $43,565,130 $213,965,716
Construct Dixie Berryhill Water and Sewer Projects Dixie Berryhill Water Projects - - - - $1,000,000 $1,000,000 Beaver Dam Creek West Branch Outfall - - - - $2,500,000 $2,500,000 Beaver Dam Creek West Branch Outfall Phase II - - - - $2,500,000 $2,500,000 Beaver Dam Creek Lift Station Improvements - - - - $1,000,000 $1,000,000 Sub-Total Dixie Berryhill - - - - $7,000,000 $7,000,000
Replace and Upgrade Field and Administrative Facilities Zone 2 Field Operations Facility Expansion - $2,000,000 - - - $2,000,000 Zone 4 Field Operations Facility Replacement - $15,000,000 - - - $15,000,000 Brookshire Boulevard Campus Facility Improvements - $1,000,000 $22,000,000 - - $23,000,000 Sub-Total Field and Administrative Facilities - $18,000,000 $22,000,000 - - $40,000,000
257

Nongeneral Funds Project Summary Schedules
33 33
Charlotte Water Summary (continued) PROJECT TITLE FY 2020 FY 2021 FY 2022 FY 2023 FY 2024 TOTAL
Enhanced Security and Technology Security Improvements $200,000 $200,000 $200,000 $200,000 $200,000 $1,000,000 Technology Projects $2,000,000 $1,100,000 $1,100,000 $1,100,000 $1,100,000 $6,400,000 GIS Facilities Mapping $956,000 $1,760,000 $1,530,000 $1,530,000 $1,580,000 $7,356,000 UMS/Banner CIS and Billing System Improvements $700,000 $1,730,000 $150,000 $150,000 $150,000 $2,880,000 Automatic Vehicle Location System Implementation $300,000 $225,000 - - - $525,000 Water and Wastewater WIMS Program $150,000 $25,000 $25,000 $25,000 $25,000 $250,000 Work and Asset Management System - - - - $250,000 $250,000 Sub-Total Security and Technology $4,306,000 $5,040,000 $3,005,000 $3,005,000 $3,305,000 $18,661,000
TOTAL CHARLOTTE WATER 275,408,830 337,442,252 424,622,252 303,223,252 297,366,780 1,638,063,366
Charlotte Water Revenue Summary Water Revenue Bonds 33,000,000 25,125,000 47,975,000 9,850,000 11,100,000 127,050,000 Sewer Revenue Bonds 112,408,830 172,600,000 225,500,000 139,850,000 157,954,500 808,313,330 Pay-As-You-Go 130,000,000 139,717,252 151,147,252 153,523,252 128,312,280 702,700,036
TOTAL REVENUE CHARLOTTE WATER 275,408,830 337,442,252 424,622,252 303,223,252 297,366,780 1,638,063,366
258

Nongeneral Funds Project Summary Schedules
34 34
Storm Water Summary
PROJECT TITLE FY 2020 FY 2021 FY 2022 FY 2023 FY 2024 TOTAL
Improve Drainage for Storm Water Major Storm Water Projects $24,739,000 $22,560,750 $4,597,000 $25,508,000 $25,706,000 $103,110,750 Minor Storm Water Projects $29,289,000 $29,150,000 $23,600,000 $54,289,000 $60,602,000 $196,930,000 CNIP Projects $1,650,000 $800,000 $1,000,000 $1,000,000 $1,000,000 $5,450,000 Area Improvements 6th and Graham Storm Drainage Improvement Project (SDIP) $120,000 $200,000 $1,150,000 $6,910,000 $2,304,000 $10,684,000 Barrington Study Area - - - - $460,000 $460,000 Beckwith/Meadow SDIP - - $1,500,000 $2,770,000 $3,547,000 $7,817,000 Bonlyn Study Area - $460,000 $300,000 $1,000,000 $1,500,000 $3,260,000 Bonwood SDIP $131,000 $331,000 $562,000 - - $1,024,000 Camp Greene SDIP $224,000 $300,000 $650,000 $656,000 - $1,830,000Chandworth SDIP - $1,734,000 $3,470,000 $1,600,000 - $6,804,000Chatham SDIP - $128,000 $128,000 $7,107,000 $6,720,000 $14,083,000Country Club SDIP - $828,000 $167,000 - - $995,000 Distribution Study Area - $460,000 - $360,000 $50,000 $870,000 Eaglewood SDIP $126,000 $227,000 $1,020,000 - - $1,373,000 East 4th Study Area - - - $300,000 $930,000 $1,230,000 Edgewater/Rosecrest SDIP $336,000 - $1,170,000 $2,827,000 $1,651,000 $5,984,000 Elvis SDIP $105,000 $181,250 $530,000 $428,000 - $1,244,250Farmer SDIP $257,000 $434,000 $1,685,000 $2,810,000 - $5,186,000Foxrun Study Area $156,000 $127,000 $775,000 $1,204,000 $4,780,000 $7,042,000Hidden Valley Study Area $336,000 $84,000 $225,000 $940,000 $4,220,000 $5,805,000Hill Street SDIP - $1,300,000 $1,715,000 $2,260,000 $756,000 $6,031,000Hinsdale/Tinkerbell SDIP $550,000 $2,217,000 $1,660,000 - - $4,427,000Parkwood SDIP - - $815,000 $1,366,000 $114,000 $2,295,000Perth/Milton Study Area - - - - $300,000 $300,000 Queens Study Area - - $460,000 $300,000 $1,000,000 $1,760,000 Sharon Hills Study Area - - - $460,000 $300,000 $760,000 Toomey SDIP $163,000 $350,000 $1,550,000 - - $2,063,000 Valleyview/Bayswater Study Area - - $2,000,000 $1,000,000 $460,000 $3,460,000 Westbourne SDIP $126,000 $624,000 $1,686,000 - - $2,436,000 Sunnyvale - - $3,000,000 $2,000,000 - $5,000,000Shamrock Gardens - - $2,000,000 $1,000,000 - $3,000,000Sub-Total Storm Drainage $58,308,000 $62,496,000 $57,415,000 $118,095,000 $116,400,000 $412,714,000
Mitigate Impacts to Streams and Wetlands Post Construction Control Program $1,500,000 $1,500,000 $1,500,000 $1,500,000 $1,500,000 $7,500,000 Stream Mitigation Bank - - $500,000 $500,000 $500,000 $1,500,000 Total Streams and Wetlands $1,500,000 $1,500,000 $2,000,000 $2,000,000 $2,000,000 $9,000,000
259

Nongeneral Funds Project Summary Schedules
35 35
Storm Water Summary (continued)
PROJECT TITLE FY 2020 FY 2021 FY 2022 FY 2023 FY 2024 TOTAL
Enhance Storm Water Mitigation Programs Storm Water Pollution Control - $410,000 - $3,450,000 $3,980,000 $7,840,000 Stream Restoration/Mitigation $1,260,000 - $1,900,000 $2,185,000 $5,700,000 $11,045,000 Colonial Pond $484,000 $90,000 $730,000 $1,050,000 $400,000 $2,754,000 Johnson Creek Pond Study Area PC $50,000 - - - - $50,000 Little Rock Pond Study Area PC $358,000 $385,000 $455,000 $820,000 $620,000 $2,638,000 Coffey Creek Study Area SR - $400,000 $1,000,000 $1,350,000 $900,000 $3,650,000 Coulwood Branch SR - - $1,050,000 - $1,050,000Newell SR $382,000 $219,000 - - - $601,000 Ribbon Walk Wetland $158,000 - - - - $158,000 Total Mitigation Programs $2,692,000 $1,504,000 $4,085,000 $9,905,000 $11,600,000 $29,786,000
TOTAL STORM WATER $62,500,000 $65,500,000 $63,500,000 $130,000,000 $130,000,000 $451,500,000
STORM WATER REVENUE SUMMARY Revenue Bonds - $15,000,000 $15,000,000 $80,000,000 $80,000,000 $190,000,000 Storm Water Pay-As-You-Go $61,000,000 $49,000,000 $46,500,000 $48,000,000 $48,000,000 $252,500,000 Program Income $1,500,000 $1,500,000 $2,000,000 $2,000,000 $2,000,000 $9,000,000
TOTAL REVENUE STORM WATER $62,500,000 $65,500,000 $63,500,000 $130,000,000 $130,000,000 $451,500,000
260

37 37
PAY-AS-YOU-GO (PAYGO)
CAPITAL INVESTMENT PLAN

62 62
This page intentionally left blank.

PAYGO Transportation and Planning Projects
38 38
Advance the Cross Charlotte Trail
The Proposed FY 2020 Budget includes $13.5 million of PAYGO funding, combined with capital funding, to complete currently planned segments of the Cross Charlotte Trail.
Advance Comprehensive Plan
The Charlotte Future 2040 Comprehensive Plan is a long-range vision to guide city-wide decision making about physical growth and public infrastructure over the next 20 years. The plan is a four-phase process that includes the review of existing conditions and trends, community engagement, growth scenarios and place types, and implementation.
Budget Overview
Funding Category Proposed Planned FY 2020 FY 2021 FY 2022 FY 2023 FY 2024 TOTAL
PAYGO $550,000 $300,000 - - - $850,000 Total $550,000 $300,000 - - - $850,000
Complete Traffic Studies
This funding provides for traffic impact studies that help inform city rezoning requirements for private developments, as well as future city project prioritization. Traffic studies often report on traffic counts, movement patterns (including pedestrian, bicycle, and vehicle), peak travel times, and crash history. Existing program fund balance is available to continue operation despite no additional funding proposed in FY 2020.
Budget Overview
Funding Category Proposed Planned FY 2020 FY 2021 FY 2022 FY 2023 FY 2024 TOTAL
PAYGO - $400,000 $400,000 $400,000 $400,000 $1,600,000 Total - $400,000 $400,000 $400,000 $400,000 $1,600,000
263

PAYGO Transportation and Planning Projects
39 39
Purchase Transportation Equipment
Program funding allows for the purchase of transportation-related equipment, including parking meters or automated license plate readers.
Budget Overview
Funding Category Proposed Planned FY 2020 FY 2021 FY 2022 FY 2023 FY 2024 TOTAL
PAYGO $200,000 $200,000 $200,000 $200,000 $200,000 $1,000,000 Total $200,000 $200,000 $200,000 $200,000 $200,000 $1,000,000
264

Transit PAYGO Transportation and Planning Projects
40 40
Transfer Maintenance of Effort (MOE) to CATS
CATS was established as department in 1998, and an annual transfer was initiated from General PAYGO to the department to support the cost of service provision. Mecklenburg County, the City of Charlotte, and the Town of Huntersville are required to fund transit at the 1998 level as a maintenance of effort. Originally, this contribution was a constant annual amount of $18,400,000. In 2011, City Council revised the contribution to include three percent annual escalations, effective starting in FY 2014. In FY 2020, the MOE transfer totals $22,629,679.
Budget Overview
Funding Category Proposed Planned FY 2020 FY 2021 FY 2022 FY 2023 FY 2024 TOTAL
PAYGO $22,629,679 $23,308,569 $24,007,826 $24,728,061 $25,469,903 $120,144,038 Total $22,629,679 $23,308,569 $24,007,826 $24,728,061 $25,469,903 $120,144,038
Allocate Proportional U-Drive-It Rental Tax to County and Towns
These payments provide proportionate revenue of the 2006 U-Drive-It Rental Tax to Mecklenburg County and the towns of Cornelius, Davidson, Huntersville, Matthews, Mint Hill, and Pineville. Each town receives the equal tax proceeds from vehicle rental transactions initiated within the respective municipality; Mecklenburg County receives the vehicle rental revenue from the unincorporated areas.
Budget Overview
Funding Category Proposed Planned FY 2020 FY 2021 FY 2022 FY 2023 FY 2024 TOTAL
PAYGO $737,282 $748,341 $759,566 $770,959 $782,523 $3,798,671 Total $737,282 $748,341 $759,566 $770,959 $782,523 $3,798,671
Contribute to CityLYNX Gold Line Phase I Operations
This transfer to CATS is based on the anticipated cost of operations for Phase I of CityLYNX Gold Line. Phase I of the rail line is 1.5 miles and six-stops. This segment opened for service in 2015.
Budget Overview
Funding Category Proposed Planned FY 2020 FY 2021 FY 2022 FY 2023 FY 2024 TOTAL
PAYGO $1,471,896 $1,500,745 $1,530,160 $1,560,151 $1,590,730 $7,653,682 Total $1,471,896 $1,500,745 $1,530,160 $1,560,151 $1,590,730 $7,653,682
265

Transit PAYGO Transportation and Planning Projects
41 41
Contribute to CityLYNX Gold Line Phase II Operations
This transfer to CATS is based on the anticipated cost of operations for Phase II of CityLYNX Gold Line. Phase II adds 2.5 miles to Phase I, creating a total rail line of four miles. The first year of funding will coincide with the opening of Phase II service.
Budget Overview
Funding Category Proposed Planned FY 2020 FY 2021 FY 2022 FY 2023 FY 2024 TOTAL
PAYGO - $4,815,053 $4,909,428 $5,005,653 $5,103,763 $19,833,897 Total - $4,815,053 $4,909,428 $5,005,653 $5,103,763 $19,833,897
Reserve Funds for CityLYNX Gold Line Equipment Replacement
This funding is reserved for future replacement needs of capital assets associated with the CityLYNX Gold Line. Currently the city serves this line with vintage-style streetcars that are no longer supported with parts inventory. Phase II of the CityLYNX Gold Line will put modern streetcars into service and a replacement plan will be managed using this funding.
Budget Overview
Funding Category Proposed Planned FY 2020 FY 2021 FY 2022 FY 2023 FY 2024 TOTAL
PAYGO $2,000,000 $1,000,000 $1,500,000 $1,500,000 $1,500,000 $7,500,000 Total $2,000,000 $1,000,000 $1,500,000 $1,500,000 $1,500,000 $7,500,000
Reserve Funds for CityLYNX Gold Line Phase III
This funding is reserved for the future CityLYNX Gold Line Phase III. This funding could be utilized to initiate planning on Phase III, which may help capitalize on future federal funding opportunities.
Budget Overview
Funding Category Proposed Planned FY 2020 FY 2021 FY 2022 FY 2023 FY 2024 TOTAL
PAYGO $2,479,839 - - - - $2,479,839 Total $2,479,839 - - - - $2,479,839
266

PAYGO Neighborhood Development Projects
42 42
Support Environmental Services Program
This program supports environmental expenses incurred by the city as owners of property and facilities. The State of North Carolina and United States Environmental Protection Agency govern much of the required work, including maintenance of former landfills, underground storage tanks, environmental property audits, and environmental remediation. This funding also supports sustainability initiatives such as electric vehicle charging stations.
Budget Overview
Funding Category Proposed Planned FY 2020 FY 2021 FY 2022 FY 2023 FY 2024 TOTAL
PAYGO $1,700,000 $1,700,000 $1,700,000 $1,700,000 $1,700,000 $8,500,000 Total $1,700,000 $1,700,000 $1,700,000 $1,700,000 $1,700,000 $8,500,000
Replace Trees
Replacing trees along public streets and in public areas supports City Council’s-adopted Urban Forest Master Plan. This funding helps ensure that the city retains the ecosystem benefits and character that the tree canopy provides.
Budget Overview
Funding Category Proposed Planned FY 2020 FY 2021 FY 2022 FY 2023 FY 2024 TOTAL
PAYGO $900,000 $900,000 $900,000 $900,000 $900,000 $4,500,000 Total $900,000 $900,000 $900,000 $900,000 $900,000 $4,500,000
Trim and Remove Trees
As the city’s tree canopy ages and experiences loss due to storm damage, this funding supports the proactive pruning of trees before they become a hazard, as well as the rapid response to remove downed trees and limbs.
Budget Overview
Funding Category Proposed Planned FY 2020 FY 2021 FY 2022 FY 2023 FY 2024 TOTAL
PAYGO $1,625,000 $1,625,000 $1,625,000 $1,625,000 $1,625,000 $8,125,000 Total $1,625,000 $1,625,000 $1,625,000 $1,625,000 $1,625,000 $8,125,000
267

PAYGO Neighborhood Development Projects
43 43
Support for TreesCharlotte Endowment
Established in 2010, TreesCharlotte is a non-profit collaboration that works to grow and diversify Charlotte’s urban forest by engaging with residents to plant, preserve, and care for trees. In FY 2017, City Council committed $1.0 million to the TreesCharlotte Endowment Fund. The contribution was planned to be provided over four fiscal years; the proposed $250,000 contribution in FY 2020 represents the final installment.
Budget Overview
Funding Category Proposed Planned FY 2020 FY 2021 FY 2022 FY 2023 FY 2024 TOTAL
PAYGO $250,000 - - - - $250,000 Total $250,000 - - - - $250,000
Contribute to TreesCharlotte
Established in 2010, TreesCharlotte is a non-profit collaboration that works to grow and diversify Charlotte’s urban forest by engaging with residents to plant, preserve, and care for trees. The proposed FY 2020 contribution of $100,000 supports neighborhood engagement, education about the canopy in coordination with the city Arborist, and community tree plantings.
Budget Overview
Funding Category Proposed Planned FY 2020 FY 2021 FY 2022 FY 2023 FY 2024 TOTAL
PAYGO $100,000 - - - - $100,000 Total $100,000 - - - - $100,000
Renovate Median Landscapes
This funding supports the ongoing maintenance and renovation of medians in city streets. Renovation or replacement may be required when a traffic accident or weather event damages median shrubs, trees, or grasses.
Budget Overview
Funding Category Proposed Planned FY 2020 FY 2021 FY 2022 FY 2023 FY 2024 TOTAL
PAYGO $250,000 $250,000 $250,000 $250,000 $250,000 $1,250,000 Total $250,000 $250,000 $250,000 $250,000 $250,000 $1,250,000
268

PAYGO Neighborhood Development Projects
44 44
Support Aging in Place
The city will provide additional funds to assist homeowners with impacts from the 2019 revaluation. Homeowners must be 65 and older, must earn less than 80 percent of the area median income, must have owned the home for at least five years prior to the program application, and cannot be eligible for Mecklenburg County’s homestead exemption program.
Budget Overview
Funding Category Proposed Planned FY 2020 FY 2021 FY 2022 FY 2023 FY 2024 TOTAL
PAYGO $750,000 - - - - $750,000 Total $750,000 - - - - $750,000
Provide HOME Grant Match
The Federal HOME Grant requires a 25 percent match. Funds in PAYGO provide for the cash match, which is used for housing programs such as tenant based rental assistance, neighborhood revitalization, and down payment assistance.
Budget Overview
Funding Category Proposed Planned FY 2020 FY 2021 FY 2022 FY 2023 FY 2024 TOTAL
PAYGO $743,028 $743,028 $743,028 $743,028 $743,028 $3,715,140 Total $743,028 $743,028 $743,028 $743,028 $743,028 $3,715,140
Support Innovative Housing
The Innovative Housing program provides funds for partnerships such as the Charlotte-Mecklenburg Housing Partnership and the Local Initiative Support Corporation; and for programs such as down payment assistance, urgent repair, and environmental reviews. The Proposed FY 2020 Program also includes $7.0 million in funds for naturally occurring affordable housing (NOAH) and to enhance existing programs.
Budget Overview
Funding Category Proposed Planned FY 2020 FY 2021 FY 2022 FY 2023 FY 2024 TOTAL
PAYGO $10,805,107 $3,805,107 $3,805,107 $3,805,107 $3,805,107 $26,025,535 Total $10,805,107 $3,805,107 $3,805,107 $3,805,107 $3,805,107 $26,025,535
269

PAYGO Neighborhood Development Projects
45 45
Offer In Rem Remedy – Residential
The In Rem Remedy program provides funds for the demolition of residential properties due to safety or blight issues.
Budget Overview
Funding Category Proposed Planned FY 2020 FY 2021 FY 2022 FY 2023 FY 2024 TOTAL
PAYGO $655,000 $655,000 $655,000 $655,000 $655,000 $3,275,000 Total $655,000 $655,000 $655,000 $655,000 $655,000 $3,275,000
Increase JumpStart Microgrants
The JumpStart Community Safety microgrant program was born out of the community empowerment initiative and was first funded in FY 2019. Grants are provided to organizations that focus on conflict resolution and mediation, crime fighting and prevention, and opportunities for youth and parents. The Proposed FY 2020 funding expands the grant program by increasing the FY 2019 funding from $100,000 to $500,000.
Budget Overview
Funding Category Proposed Planned FY 2020 FY 2021 FY 2022 FY 2023 FY 2024 TOTAL
PAYGO $500,000 $250,000 $250,000 $250,000 $250,000 $1,500,000 Total $500,000 $250,000 $250,000 $250,000 $250,000 $1,500,000
Support Neighborhood Grants
The Neighborhood Matching Grants program awards funds to eligible neighborhood-based organizations to make neighborhoods better places to live, work, and play. The four primary goals of the program are to build neighborhood capacity and participation, empower neighborhoods to self-determine improvement priorities, leverage resident involvement and resources to revitalize and reinvest in low- and moderate-income neighborhoods, and stimulate development of partnerships between the city and community groups.
Budget Overview
Funding Category Proposed Planned FY 2020 FY 2021 FY 2022 FY 2023 FY 2024 TOTAL
PAYGO $400,000 $400,000 $400,000 $400,000 $400,000 $2,000,000 Total $400,000 $400,000 $400,000 $400,000 $400,000 $2,000,000
270

PAYGO Neighborhood Development Projects
46 46
Accelerate Police Training
The Accelerated Police Training program provides funds for the training of Police Officers without reducing the available daily staffing compliment. Program funds will be used for training costs and overtime of officers.
Budget Overview
Funding Category Proposed Planned FY 2020 FY 2021 FY 2022 FY 2023 FY 2024 TOTAL
PAYGO $2,000,000 $1,000,000 - - - $3,000,000 Total $2,000,000 $1,000,000 - - - $3,000,000
Support Placemaking
Funding is provided to continue placemaking efforts that were launched in FY 2019. The program intends to create active and inviting public spaces through: activating underutilized public spaces, implementing enhanced streetscapes, and enhancing vibrant gathering places.
Budget Overview
Funding Category Proposed Planned FY 2020 FY 2021 FY 2022 FY 2023 FY 2024 TOTAL
PAYGO $250,000 - - - - $250,000 Total $250,000 - - - - $250,000
271

PAYGO Economic Development Projects
47 47
Improve Cultural Facilities
This funding is used to repair, maintain, and make debt service payments on cultural arts and entertainment facilities that are owned and maintained by the city. These facilities include the Bechtler Museum of Modern Art, Blumenthal Performing Arts, Discovery Place, Harvey B. Gantt Center for African-American Arts + Culture, Knight Theater, Mint Museum Randolph, and Mint Museum Uptown.
Budget Overview
Funding Category Proposed Planned FY 2020 FY 2021 FY 2022 FY 2023 FY 2024 TOTAL
PAYGO $9,744,955 $9,891,129 $10,039,496 $10,190,089 $10,342,940 $50,208,609 Total $9,744,955 $9,891,129 $10,039,496 $10,190,089 $10,342,940 $50,208,609
Revitalize Business Corridors
The Business Matching Grant program provides commercial businesses within the Business Corridor geography the opportunity to apply for façade, security, and brownfield improvements grants. These grants are a 50 percent matching grant that are paid through reimbursement. Areas within the Business Corridor may have a pattern of disinvestment, higher vacancies of commercial properties, or declining property values. Existing program fund balance is available to continue operation despite no additional funding proposed in FY 2020 or planned in FY 2021.
Budget Overview
Funding Category Proposed Planned FY 2020 FY 2021 FY 2022 FY 2023 FY 2024 TOTAL
PAYGO - - $1,000,000 $1,000,000 $1,000,000 $3,000,000 Total - - $1,000,000 $1,000,000 $1,000,000 $3,000,000
Enhance Economic Development Programs
The city is providing additional funds to facilitate the Economic Development department taking a more active regional role around four core priorities. Included funds are for an innovation lab, mapping the talent development ecosystem, attracting and retaining prospective businesses, department communications, market research, and strategic plan continuation.
Budget Overview
Funding Category Proposed Planned FY 2020 FY 2021 FY 2022 FY 2023 FY 2024 TOTAL
PAYGO $1,650,000 $1,000,000 $1,000,000 $1,000,000 $1,000,000 $5,650,000 Total $1,650,000 $1,000,000 $1,000,000 $1,000,000 $1,000,000 $5,650,000
272

PAYGO Economic Development Projects
48 48
Initiate Project P.I.E.C.E. 2.0 Workforce Development Program
Project P.I.E.C.E. provides training and employment opportunities for individuals with multiple barriers to employment including homelessness, criminal records, health issues, and/or lack of transportation. FY 2020 provides funding to continue the city’s investment and to expand to trade and logistics training.
Budget Overview
Funding Category Proposed Planned FY 2020 FY 2021 FY 2022 FY 2023 FY 2024 TOTAL
PAYGO $300,000 - - - - $300,000 Total $300,000 - - - - $300,000
Build Minority, Women, and Small Business Enterprise (MWSBE) Capacity
The city will provide $450,000 in FY 2020 for MWSBEs. The funds will support the AmpUp Program, provide resources for training around procurement processes, target outreach about contracting opportunities, and provide additional capacity for needs and enhancements in the future.
Budget Overview
Funding Category Proposed Planned FY 2020 FY 2021 FY 2022 FY 2023 FY 2024 TOTAL
PAYGO $450,000 $450,000 - - - $900,000 Total $450,000 $450,000 - - - $900,000
Create Collaborative Service District, Westside
The city will provide $500,000 in funds to enhance community redevelopment objectives on the west side including loans and grants to support small businesses, façade and property improvements, community engagement, beautification, strengthening neighborhoods, and creating a financial opportunity center to help upward mobility of families.
Budget Overview
Funding Category Proposed Planned FY 2020 FY 2021 FY 2022 FY 2023 FY 2024 TOTAL
PAYGO $500,000 $500,000 - - - $1,000,000 Total $500,000 $500,000 - - - $1,000,000
273

PAYGO Economic Development Projects
49 49
Create Collaborative Service District, Eastside
The city will provide $500,000 in funds to enhance community redevelopment objectives on the east side including loans and grants to support small businesses, façade and property improvements, community engagement, beautification, strengthening neighborhoods, and creating a financial opportunity center to help upward mobility of families.
Budget Overview
Funding Category Proposed Planned FY 2020 FY 2021 FY 2022 FY 2023 FY 2024 TOTAL
PAYGO $500,000 $500,000 - - - $1,000,000 Total $500,000 $500,000 - - - $1,000,000
Advance Historic West End Initiative
Funds are provided to facilitate economic investment in historic west end. The work focuses on creating social and cultural connections, developing an anti-displacement strategy, and planning for future transportation development.
Budget Overview
Funding Category Proposed Planned FY 2020 FY 2021 FY 2022 FY 2023 FY 2024 TOTAL
PAYGO $150,000 $150,000 - - - $300,000 Total $150,000 $150,000 - - - $300,000
Fund Synthetic Tax Increment Grant (TIG) Cultural Projects
This funding represents debt service payments on the Levine Center for the Arts development, which includes the Harvey B. Gantt Center for African-American Arts + Culture, the Bechtler Museum of Modern Art, the Mint Museum Uptown, and the Knight Theater. Construction of these facilities, which opened in 2010, was funding through a combination of financing sources, including tourism revenues, private donations, and a synthetic TIG.
Budget Overview
Funding Category Proposed Planned FY 2020 FY 2021 FY 2022 FY 2023 FY 2024 TOTAL
PAYGO $41,412 $41,412 $41,412 $41,412 $41,412 $207,060 Total $41,412 $41,412 $41,412 $41,412 $41,412 $207,060
274

PAYGO Economic Development Projects
50 50
Support Synthetic TIG Developer Payments
This funding represents payments to various developers with whom the city has entered into synthetic TIG agreements.
Budget Overview
Funding Category Proposed Planned FY 2020 FY 2021 FY 2022 FY 2023 FY 2024 TOTAL
PAYGO $52,727 $54,610 $56,530 $58,489 $60,487 $282,843 Total $52,727 $54,610 $56,530 $58,489 $60,487 $282,843
275

PAYGO Well-Managed Government Projects
51 51
Maintain City-owned Facilities
This funding supports the maintenance and improvement of city-owned facilities. Maintenance items are prioritized across city departments based on need, urgency, and efficiency. Upgrades could include security upgrades, generator replacements, repairs, or new carpet and paint.
Budget Overview
Funding Category Proposed Planned FY 2020 FY 2021 FY 2022 FY 2023 FY 2024 TOTAL
PAYGO $4,315,254 $5,000,000 $5,000,000 $5,000,000 $5,000,000 $24,315,254 Total $4,315,254 $5,000,000 $5,000,000 $5,000,000 $5,000,000 $24,315,254
Repair City-owned Parking Lots and Parking Decks
The projects within this program seek to ensure city-owned parking lots and parking decks are structurally safe and in good repair. Projects could include concrete repairs, paint restriping, or structural repairs.
Budget Overview
Funding Category Proposed Planned FY 2020 FY 2021 FY 2022 FY 2023 FY 2024 TOTAL
PAYGO $300,000 $300,000 $300,000 $300,000 $300,000 $1,500,000 Total $300,000 $300,000 $300,000 $300,000 $300,000 $1,500,000
Maintain Charlotte-Mecklenburg Government Center (CMGC) Parking Deck
This program keeps the CMGC parking deck structurally safe and in good repair. Projects could include concrete repairs, structural repairs, or lighting upgrades.
Budget Overview
Funding Category Proposed Planned FY 2020 FY 2021 FY 2022 FY 2023 FY 2024 TOTAL
PAYGO $200,000 $200,000 $200,000 $200,000 $200,000 $1,000,000 Total $200,000 $200,000 $200,000 $200,000 $200,000 $1,000,000
276

PAYGO Well-Managed Government Projects
52 52
Invest in Technology and Disaster Recovery
In FY 2019, the city commissioned a review of city technology systems to assess their abilities to withstand the most common threats to city operations. This funding allows for system improvements, such as hardware redundancy, to ensure uninterrupted service provision. Additional funds are also included to maintain the city’s Human Resources management system.
Budget Overview
Funding Category Proposed Planned FY 2020 FY 2021 FY 2022 FY 2023 FY 2024 TOTAL
PAYGO $2,000,000 $500,000 $1,000,000 $2,500,000 $2,500,000 $8,500,000 Total $2,000,000 $500,000 $1,000,000 $2,500,000 $2,500,000 $8,500,000
Upgrade Business System Software
The city continues its commitment to streamlining business processes through technology. This funding will replace hardware and address several cross-department software efforts to align business processes.
Budget Overview
Funding Category Proposed Planned FY 2020 FY 2021 FY 2022 FY 2023 FY 2024 TOTAL
PAYGO $2,099,906 $2,466,405 $1,978,286 - - $6,544,597 Total $2,099,906 $2,466,405 $1,978,286 - - $6,544,597
Purchase Police Technology and Equipment
This funding addresses the changing landscape of law enforcement by replacing technology and communications equipment utilized in modern law enforcement. Technology that could be replaced includes radios, laptops, license plate readers, and security systems within Police facilities.
Budget Overview
Funding Category Proposed Planned FY 2020 FY 2021 FY 2022 FY 2023 FY 2024 TOTAL
PAYGO $1,500,000 $1,000,000 $1,000,000 $1,000,000 $1,000,000 $5,500,000 Total $1,500,000 $1,000,000 $1,000,000 $1,000,000 $1,000,000 $5,500,000
277

PAYGO Well-Managed Government Projects
53 53
Purchase Municipal Equipment
The Municipal Debt Service Fund purchases select equipment for the city to be paid back over a period of five years. FY 2021 through FY 2024 includes necessary funds to reimburse the Municipal Debt Service Fund for costs related to voting equipment. The city is required to contribute to the purchase as part of an interlocal agreement with Mecklenburg County.
Budget Overview
Funding Category Proposed Planned FY 2020 FY 2021 FY 2022 FY 2023 FY 2024 TOTAL
PAYGO - $1,200,000 $1,200,000 $1,200,000 $1,200,000 $4,800,000 Total - $1,200,000 $1,200,000 $1,200,000 $1,200,000 $4,800,000
Contribute One-time to Firefighter Retirement
Funds are included for a one-time payment to the Charlotte Firefighter’s Retirement System. The city anticipates working collaboratively with the Charlotte Firefighter’s Retirement System in FY 2020 on a long-term funding strategy recommendation.
Budget Overview
Funding Category Proposed Planned FY 2020 FY 2021 FY 2022 FY 2023 FY 2024 TOTAL
PAYGO $1,000,000 - - - - $1,000,000 Total $1,000,000 - - - - $1,000,000
Reserve PAYGO Undesignated Balance
This funding represents anticipated PAYGO revenue available to be appropriated in future years.
Budget Overview
Funding Category Proposed Planned FY 2020 FY 2021 FY 2022 FY 2023 FY 2024 TOTAL
PAYGO - $216,133 $2,061,777 $2,536,036 $3,306,989 $8,120,935 Total - $216,133 $2,061,777 $2,536,036 $3,306,989 $8,120,935
278

55 55
ADVANCED PLANNING AND
DESIGN PROGRAM
CAPITAL INVESTMENT PLAN

62 62
This page intentionally left blank.

Plan and Design Transportation and Planning Projects
56 56
Program Description
Funding for advanced planning and design is proposed to advance high-priority projects. Through advanced planning work, project scopes become better defined and cost estimates are more precise, creating less risk of future cost overruns. After planning and design phases have produced cost estimates, total project funding will be considered for inclusion in a future budget. This work creates a “project pipeline” and a pool of potential projects for future funding.
Projects within the Transportation and Planning (Mobility, Accessibility, and Connectivity) priority areas, included for planning and design, are outlined on the following pages. Each project contains a description and justification, as well as a concept drawing of one possible alignment. During planning and design, the scopes will be finalized and a final alignment will be selected prior to appropriating funding. Justifications of road and intersection projects revolve around four categories of technical analysis: safety, congestion, connectivity, and leveraged opportunities. Descriptions of each evaluation component are presented below.
Roadway Projects Intersection Projects
Safety (0-4 pts based on High Injury Network) Safety (0-4 pts based on High Injury Network) Number of crashes per mile Crash history
Congestion (1-10 pts based on calculated volume-to-capacity ratio)
Congestion (0-8 pts based on High Congestion List)
Traffic delays and backups Traffic delays and backups (as defined by the High Congestion Location map)
Connectivity (1-3 pts based on completing connections for pedestrians, cyclists, motorists (1 pt per category))
Connectivity (1-3 pts based on completing connections for pedestrians, cyclists, motorists (1 pt per category))
Number of jobs within a half-mile Addresses bottlenecks along major Population within a half-mile corridors New sidewalk connection New bicycle connection Transit station area Bus routes
Leverage (1 pt per opportunity) Leverage (1 pt per opportunity) Partnership opportunities Partnership opportunities (private development, NCDOT, and/or other programs)
(private development, NCDOT, and/or other programs)
Adoption of the pool of projects will initiate planning work on each project. If a project remains feasible after planning work has been completed, the project will enter the design phase. The feasibility of the project will continue to be assessed throughout design. Funding for the project may be considered in a future budget based on the final outcomes.
Funding for advanced planning and design will be available from the Municipal Debt Service Fund and reimbursed when the project is permanently financed.
281

Plan and Design Transportation and Planning Projects
57 57
Cross Charlotte Trail Segments 10 and 11
The Cross Charlotte Trail is a multi-use path that extends more than 30 miles from Ballantyne, through the Town of Pineville, Uptown, and UNC Charlotte, to the Cabarrus County line. The trail is divided into 11 segments; segment one is currently under construction, segments two and three are in design, and segment four is complete. Funding to complete design and construction on segments five, six, seven, eight, and nine is proposed in the FY 2020 – 2024 CIP. This proposed project would plan and design the final two segments, 10 and 11. Once planning and design have been completed for segments 10 and 11 and an accurate cost estimate has been determined, funding will be proposed in a future budget.
Council District: 4
Ashley Road/Tuckaseegee Road/Freedom Drive Intersection
This proposed project would modify the Ashley Road/Tuckaseegee Road/Freedom Drive intersection to improve pedestrian and bicycle safety and traffic operations. Improvements could include extending turn lanes, adding pedestrian refuge islands, and/or widening sidewalks and bicycle lanes. The project is intended to support a more connected pedestrian and bicycle network in the area.
Council District: 3
Priority Score:
Safety: 4
Congestion: 4
Connectivity: 3
Leverage: 3
Total Score: 14
282

Plan and Design Transportation and Planning Projects
58 58
Eastway Drive/Shamrock Drive Intersection
This proposed project would modify the Eastway Drive/Shamrock Drive/Frontenac Avenue intersection to improve safety and alleviate congestion. Safety improvements could include reduced pedestrian and bicycle crossing distances, and/or construction of pedestrian refuge islands, crosswalks, sidewalks, and bicycle lanes. All possible improvements complement the planned Shamrock Drive Complete Street project that is underway as part of the Central/Albemarle/Shamrock CNIP. This intersection project is anticipated to be completed in partnership with NCDOT. Additionally, the Central/Albemarle/Shamrock CNIP has dedicated funding to complete a pre-planning study in advance of the project.
Council District: 1
Priority Score:
Safety: 4
Congestion: 4
Connectivity: 3
Leverage: 3
Total Score: 14
Bryant Farms Road Extension
This proposed project would expand upon the current Bryant Farm Road project (phase one) and extend it further from Rea Road to Ardrey Kell Road (phase two). The full Bryant Farms Road extension to Ardrey Kell Road enhances the east/west capacity in the rapidly-growing Ballantyne area by providing a parallel alternative to Ardrey Kell Road and Ballantyne Commons Parkway.
Council District: 7
Priority Score:
Safety: 3
Congestion: 4
Connectivity: 3
Leverage: 2
Total Score: 12
283

Plan and Design Transportation and Planning Projects
59 59
Robinson Church Road
This proposed project would widen the existing two-lane, undivided Robinson Church Road between Harris Boulevard and Hood Road. Possible improvements could include a center space for turn lanes, landscaped medians, pedestrian refuge islands, bicycle lanes, sidewalks, street trees, and/or lighting. The possibility of a roundabout at the intersection of Plott Road will also be explored during planning. A roundabout could be used to safely and efficiently accommodate future projected traffic volumes.
Council District: 5
Priority Score:
Safety: 3
Congestion: 2
Connectivity: 2
Leverage: 3
Total Score: 10
284

Plan and Design Neighborhood Development Projects
60 60
Program Description
Neighborhood Development (Safe, Healthy, and Inclusive Communities) projects included for planning and design focus on enhancing public safety in our community. Each project is outlined on the following pages and contains a description and a photo of what the project could look like. During planning and design, each project’s scope will be finalized and a final design will be selected prior to appropriating funding. When constructing a new facility, it is critical to identify a site prior to design of the facility. The FY 2020 – 2024 CIP proposes funding for early land acquisition to support the new advanced planning and design initiative.
Construct and Renovate Fire Stations
The city is currently in the process of completing a Fire facilities master plan to establish station construction priorities. Station priorities are determined based on analysis of call load, street connectivity, resource availability, and response times. Once the master plan is complete and the priorities have been outlined, funding will be considered for additional fire stations.
The Proposed FY 2020 – 2024 CIP contains a new infill fire station planned to be funded in FY 2021 at $9,350,000. This station is anticipated to be 12,600 square feet with three fire truck bays. Once the master plan is complete and the highest priority infill location has been identified, land acquisition funds will be available to purchase property to begin planning and design of the facility.
In addition to constructing new fire stations, the Planning and Design Revolving Fund allows the advancement of fire station renovations that could include the addition of standalone female locker rooms, weight rooms, and/or dormitory expansions.
Complete Police Division Stations
The Charlotte-Mecklenburg Police Department currently operates a 13-division response area across the city. It is anticipated that Police may need to expand to 15 response areas in the future based on population growth and call volume. The new areas result from splitting the North and South response areas from two divisions into four. The South Division would carve out a portion called Park South, and the North division will be split in Northeast and Northwest. The addition of two response areas requires construction of a new division station in each. The FY 2020 Planning and Design Revolving Fund advances one of the new division stations based on priorities outlined in the Police Facilities Strategic Plan. Land acquisition is also anticipated.
285

Plan and Design Neighborhood Development Projects
61 61
Upgrade Existing Animal Care and Control Facility
The adopted FY 2019 – 2023 CIP included $4,000,000 in FY 2019 for upgrades to the existing Animal Care and Control facility located at 8315 Byrum Drive in Council District 3. Several upgrades have already been implemented. This
project is proposed for the FY 2020 Planning and Design Revolving Fund to determine if additional upgrades are needed.
286

63 63
TRANSPORTATION AND
PLANNING
CAPITAL INVESTMENT PLAN

62 62
This page intentionally left blank.

Advance the Cross Charlotte Trail
64 64
Project Description
The Cross Charlotte Trail, in partnership with Mecklenburg County, creates over 30 miles of trail and greenway facility from Ballantyne, through the Town of Pineville, Uptown, and UNC Charlotte, to the Cabarrus County line. Once complete, this multi-use path will offer residents transportation choices to travel seamlessly from one end of Charlotte to the other. Approximately 140,000 residents and 130,000 jobs will be within walking distance of the trail and connecting greenways.
The Cross Charlotte Trail is divided into 11 segments; segment one is currently under construction, segments two and three are in design, and segment four is complete. This funding would complete segments five, six, seven, eight, and nine, which have benefitted from planning and design work. Segments 10 and 11, which have received no planning or design money, are proposed for inclusion in the Advanced Planning and Design Program. Once planning and design has been completed for segments 10 and 11 and an accurate cost estimate has been determined, funding will be proposed in a future year.
Department Transportation
Location Ballantyne, through Pineville, Uptown, UNC Charlotte, to the Cabarrus County line
Council District 1, 4, 6, 7
Priority Area Transportation and Planning (Mobility, Accessibility, and Connectivity)
Budget Overview
Funding Category Proposed Planned FY 2020 FY 2021 FY 2022 FY 2023 FY 2024 TOTAL
Planning and Design $15,000,000 - - - - $15,000,000 Construction $39,073,600 - - - - $39,073,600 Public Art $326,400 - - - - $326,400 Total $54,400,000 - - - - $54,400,000 Prior Appropriations $38,000,000 Grand Total $92,400,000
289

Create Uptown Cycle Track
65 65
Project Description
This project plans, designs, and implements a two-way protected cycle track in Uptown along portions of 5th Street and 6th Street. The Uptown Cycle Track provides the only protected east/west bicycle connector through Uptown. It is approximately 1.6 miles long and connects Mecklenburg County’s Little Sugar Creek Greenway, Irwin Creek Greenway, and Stewart Creek Greenway.
The project is expected to be completed in two phases; the first phase was completed in April 2019, and the second phase is anticipated to be completed in 2021. This project originated from the Uptown Connects study and will increase accessibility and safety for pedestrians and bicyclists, advancing Charlotte towards becoming a true city of bikes.
Department Transportation
Location 5th Street and 6th Street
Council District 1 and 2
Priority Area Transportation and Planning (Mobility, Accessibility, and Connectivity)
Budget Overview
Funding Category Proposed Planned FY 2020 FY 2021 FY 2022 FY 2023 FY 2024 TOTAL
Planning and Design - - - - - - Construction $4,495,500 - - - - $4,495,500 Public Art $4,500 - - - - $4,500 Total $4,500,000 - - - - $4,500,000 Prior Appropriations $2,000,000 Grand Total $6,500,000
290

Extend Bryant Farms Road
66 66
Project Description
This project extends Bryant Farms Road by 0.4 miles from Elm Lane to Rea Road and rebuilds the intersection of Bryant Farms Road, Elm Lane, and Blakeney Heath Road. This extension provides a critical east/west connection in the rapidly-growing Ballantyne area. Pedestrian and bicycle facilities will also be included in this project.
The Adopted FY 2019 Budget included $2,000,000 for planning and design, which is currently underway.
Department Transportation
Location Bryant Farms Road from Elm Lane and Rea Road
Council District 7
Priority Area Transportation and Planning (Mobility, Accessibility, and Connectivity)
Budget Overview
Funding Category Proposed Planned FY 2020 FY 2021 FY 2022 FY 2023 FY 2024 TOTAL
Planning and Design - $2,000,000 - - - $2,000,000 Construction - $16,000,000 - - - $16,000,000 Public Art - - - - - - Total - $18,000,000 - - - $18,000,000 Prior Appropriations $2,000,000 Grand Total $20,000,000
291

Improve Idlewild Road and Monroe Road Intersection
67 67
Project Description
The Idlewild Road/Rama Road and Monroe Road intersection project will add a multi-use path, bike lanes, new turning lanes to increase vehicular capacity, and will support economic development. It is anticipated that $3,400,000 will be leveraged through the North Carolina Department of Transportation.
Department Transportation
Location Idlewild Road/Rama Road and Monroe Road Intersection
Council District 5
Priority Area Transportation and Planning (Mobility, Accessibility, and Connectivity)
Budget Overview
Funding Category Proposed Planned FY 2020 FY 2021 FY 2022 FY 2023 FY 2024 TOTAL
Planning and Design - - - - - - Construction - $2,500,000 - - - $2,500,000 Public Art - - - - - - Total - $2,500,000 - - - $2,500,000 Prior Appropriations $6,600,000 NCDOT Funding $3,400,000 Grand Total $12,500,000
292

Develop Dixie Berryhill Area Roads
68 68
Project Description
Dixie Berryhill Area Roads funding aims to improve the road system in the area west of CLT Airport by leveraging private funding and development efforts. Improvements will be made to major roads, which may include Dixie River Road, West Boulevard, and/or Garrison Road. This project will promote economic development and job growth around the Charlotte Regional Intermodal Facility at CLT Airport and provide access to underdeveloped land west of I-485.
A portion of the total project budget has been committed to the extension of West Boulevard, which is anticipated to be completed in partnership with a private developer. The remaining projects are also anticipated to be completed in partnership with a private developer. The city contribution outlined in the table below represents a portion of the total potential project costs. All road projects receiving funding will be annexed into the city limits.
Department Economic Development
Location Area west of CLT Airport
Council District 3
Priority Area Transportation and Planning (Mobility, Accessibility, and Connectivity)
Budget Overview
Funding Category Proposed Planned FY 2020 FY 2021 FY 2022 FY 2023 FY 2024 TOTAL
Public/Private Partnership - $21,480,000 - - - $21,480,000
Total - $21,480,000 - - - $21,480,000 Prior Appropriations $24,720,000 Grand Total $46,200,000
293

Extend Park South Drive
69 69
Project Description
This project extends Park South Drive by 0.2 miles from Fairview Road to a new roundabout at Carnegie Boulevard. The new connection will provide a two-lane street and extend the existing eastbound left-turn lane on Fairview Road will be extended.
This project is anticipated to be completed in partnership with a private developer. The city contribution outlined in the table below represents a portion of the total project costs.
Department Transportation
Location Park South Drive from Fairview Road to Carnegie Boulevard
Council District 6
Priority Area Transportation and Planning (Mobility, Accessibility, and Connectivity)
Budget Overview
Funding Category Proposed Planned FY 2020 FY 2021 FY 2022 FY 2023 FY 2024 TOTAL
Public/Private Partnership - $4,432,000 - - - $4,432,000
Total - $4,632,000 - - - $4,632,000 Prior Appropriations $4,000,000 Grand Total $8,632,000
294

Connect Northeast Corridor Infrastructure
70 70
Project Description
Northeast Corridor Infrastructure (NECI) is a collection of projects targeted at improving pedestrian, bicycle, and vehicular access to the CATS Blue Line Extension. These investments also make connections to other community assets like the Cross Charlotte Trail, Mecklenburg County greenway system, UNC Charlotte, NoDa, and the Applied Innovation Corridor.
Department General Services
Location Area around the CATS Blue Line Extension
Council District 1 and 4
Priority Area Transportation and Planning (Mobility, Accessibility, and Connectivity)
Budget Overview
Funding Category Proposed Planned FY 2020 FY 2021 FY 2022 FY 2023 FY 2024 TOTAL
Planning and Design - $6,700,000 - - - $6,700,000 Construction - $20,436,200 - - - $20,436,200 Public Art - $163,800 - - - $163,800 Total - $27,300,000 - - - $27,300,000 Prior Appropriations $79,300,000 Grand Total $106,600,000
295

Maintain Traffic Signal System Coordination
71 71
Project Description
This program installs equipment, such as fiber-optic cable and real-time traffic management cameras. New installations are prioritized based on the Traffic Signal Communications Master Plan. Work completed through this program promotes balanced traffic flow, walkability, and sustainable communities.
Department Transportation
Location Citywide
Council District Citywide
Priority Area Transportation and Planning (Mobility, Accessibility, and Connectivity)
Budget Overview
Uses Proposed Planned Expense Category FY 2020 FY 2021 FY 2022 FY 2023 FY 2024 TOTAL Planning and Design - - - - - - Construction - $6,000,000 - - - $6,000,000 Public Art - - - - - - Expenses Total - $6,000,000 - - - $6,000,000 Prior Appropriations $9,000,000 Grand Total $15,000,000
296

Upgrade Traffic Control Devices
72 72
Project Description
This program provides for maintenance and replacement of outdated traffic control equipment, such as traffic signals, pedestrian signals, detection devices, and signs. Work completed through this program helps maintain safe and optimal traffic flow.
Department Transportation
Location Citywide
Council District Citywide
Priority Area Transportation and Planning (Mobility, Accessibility, and Connectivity)
Budget Overview
Funding Category Proposed Planned FY 2020 FY 2021 FY 2022 FY 2023 FY 2024 TOTAL
Planning and Design - - - - - - Construction - $4,000,000 - - - $4,000,000 Public Art - - - - - - Total - $4,000,000 - - - $4,000,000 Prior Appropriations $15,000,000 Grand Total $19,000,000
297

Repair and Replace Bridges
73 73
Project Description
This program provides for the inspection, repair, and replacement of bridges throughout the city. Work completed through this program helps maintain a safe bridge system by repairing and replacing bridges that do not meet structural capacity and width standards. Locations for bridge repairs and replacements are identified through the city’s biennial inspection program, which is required by the North Carolina Department of Transportation.
Department Transportation
Location TBD
Council District TBD
Priority Area Transportation and Planning (Mobility, Accessibility, and Connectivity)
Budget Overview
Funding Category Proposed Planned FY 2020 FY 2021 FY 2022 FY 2023 FY 2024 TOTAL
Planning and Design - - - - - - Construction - $3,996,000 - - - $3,996,000 Public Art - $4,000 - - - $4,000 Total - $4,000,000 - - - $4,000,000 Prior Appropriations $10,000,000 Grand Total $14,000,000
298

Plan and Design Silver Line Light Rail
74 74
Project Description
The LYNX Silver Line light rail alignment is anticipated to run from the Town of Matthews, through Uptown, to CLT Airport, and beyond to Gaston County/City of Belmont. This begins early efforts to plan and design the line, which will continue over the next several years. Planning and design work is necessary prior to seeking federal funding.
Department Charlotte Area Transit System
Location Town of Matthews, through Uptown, to CLT Airport, and Gaston County/ the City of Belmont
Council District 1, 2, 3, 5, 6
Priority Area Transportation and Planning (Mobility, Accessibility, and Connectivity)
Budget Overview
Funding Category Proposed Planned FY 2020 FY 2021 FY 2022 FY 2023 FY 2024 TOTAL
Planning and Design $9,000,000 $9,000,000 $11,000,000 $11,000,000 $10,000,000 $50,000,000 Total $9,000,000 $9,000,000 $11,000,000 $11,000,000 $10,000,000 $50,000,000 Prior Appropriations $0 Grand Total $50,000,000
299

Design South End Light Rail Station
75 75
Project Description
Design for a new South End LYNX Blue Line light rail station explores conceptual alignments and adds a pedestrian crossing across the tracks. This project is anticipated to be completed in partnership with a private developer. The contribution outlined in the table below represents a portion of the total project costs.
Department Charlotte Area Transit System
Location LYNX Blue Line between the East/West and New Bern stations
Council District 3
Priority Area Transportation and Planning (Mobility, Accessibility, and Connectivity)
Budget Overview
Funding Category Proposed Planned FY 2020 FY 2021 FY 2022 FY 2023 FY 2024 TOTAL
Planning and Design $1,415,608 $1,581,717 - - - $2,997,325 Construction - - $3,000,000 $3,000,000 $3,000,000 $9,000,000 Total $1,415,608 $1,581,717 $3,000,000 $3,000,000 $3,000,000 $11,997,325 Prior Appropriations $0 Grand Total $11,997,325
300

Develop Transit Systems
76 76
Project Description
This funding supports the planning, design, and construction of major capital projects that promote the 2030 Transit Corridor System Plan. Projects rolled into this funding include the development of new light rail lines, light rail stations, and supporting infrastructure, such as Americans with Disabilities Act (ADA) enhancements. Two projects within this funding category, the Silver Line Light Rail and the South End Light Rail Station, have been outlined on individual project pages because of the size and scope of the projects.
Department Charlotte Area Transit System
Location Mecklenburg County/Citywide
Council District Citywide
Priority Area Transportation and Planning (Mobility, Accessibility, and Connectivity)
Budget Overview
Funding Category Proposed Planned FY 2020 FY 2021 FY 2022 FY 2023 FY 2024 TOTAL
Local Match Expense $1,232,804 - - - - $1,232,804 Design - $200,000 $200,000 $200,000 $200,000 $800,000 Total $1,232,804 $200,000 $200,000 $200,000 $200,000 $2,032,804 Prior Appropriations $1,167,965,699 Grand Total $1,169,998,503
301

Enhance Safety and Security on Transit
77 77
Project Description
These projects promote safe, reliable, and equitable transit service throughout the system. Investments protect passengers, employees, revenues, and property. Projects could include mobile video replacement on the existing bus fleet, transit police dispatch upgrade, cameras on the LYNX Blue Line Extension, or a video management system project.
Department Charlotte Area Transit System
Location Mecklenburg County/Citywide
Council District Citywide
Priority Area Transportation and Planning (Mobility, Accessibility, and Connectivity)
Budget Overview
Funding Category Proposed Planned FY 2020 FY 2021 FY 2022 FY 2023 FY 2024 TOTAL
Equipment $2,858,384 $1,722,316 $1,222,144 $993,897 $226,136 $7,022,877 Total $2,858,384 $1,722,316 $1,222,144 $993,897 $226,136 $7,022,877 Prior Appropriations $4,359,689 Grand Total $11,382,566
302

Purchase New Transit Support Systems
78 78
Project Description
This funding purchases new equipment required to sustain operations and address changing technology needs. Examples of items that may be purchased include mobile payment equipment and supportive technology for public Wi-Fi amenities. Equipment for maintenance and support such as vehicle bay lifts, backhoes, and shop equipment also support transit operations.
Department Charlotte Area Transit System
Location Mecklenburg County/Citywide
Council District Citywide
Priority Area Transportation and Planning (Mobility, Accessibility, and Connectivity)
Budget Overview
Uses Proposed Planned Expense Category FY 2020 FY 2021 FY 2022 FY 2023 FY 2024 TOTAL Equipment $2,344,827 $475,969 $364,959 $34,000 $538,000 $3,757,755 Expenses Total $2,344,827 $475,969 $364,959 $34,000 $538,000 $3,757,755 Prior Funding $64,838,100 Grand Total $68,595,855
303

Purchase Vehicles for CATS
79 79
Project Description
These vehicles are part of CATS non-revenue generating fleet and respond to maintenance needs. Service vehicles are used by many CATS divisions including bus operations, bus maintenance, special transportation services, and rail operations.
Department Charlotte Area Transit System
Location Mecklenburg County/Citywide
Council District Citywide
Priority Area Transportation and Planning (Mobility, Accessibility, and Connectivity)
Budget Overview
Funding Category Proposed Planned FY 2020 FY 2021 FY 2022 FY 2023 FY 2024 TOTAL
Equipment $1,240,200 $685,010 $530,320 $390,530 $320,740 $3,166,800 Total $1,240,200 $685,010 $530,320 $390,530 $320,740 $3,166,800 Prior Appropriations $2,081,446 Grand Total $5,248,246
304

Relocate Water and Wastewater Infrastructure
80 80
Project Description
These projects move water and wastewater lines when local, state, or federal agencies make road improvements, while also taking advantage of these opportunities to address future-identified Charlotte Water infrastructure improvements.
Department Charlotte Water
Location Citywide
Council District Citywide
Priority Area Transportation and Planning (Mobility, Accessibility, and Connectivity)
Budget Overview
Funding Category Proposed Planned FY 2020 FY 2021 FY 2022 FY 2023 FY 2024 TOTAL
Planning and Design $1,500,000 $3,000,000 $6,750,000 $3,090,000 $3,182,700 $17,522,700 Construction $3,500,000 $7,000,000 $15,750,000 $7,210,000 $7,426,300 $40,886,300 Total $5,000,000 $10,000,000 $22,500,000 $10,300,000 $10,609,000 $58,409,000 Prior Appropriations $111,598,975 Grand Total $170,007,975
305

62 62
This page intentionally left blank.

81 81
NEIGHBORHOOD DEVELOPMENT
CAPITAL INVESTMENT PLAN

62 62
This page intentionally left blank.
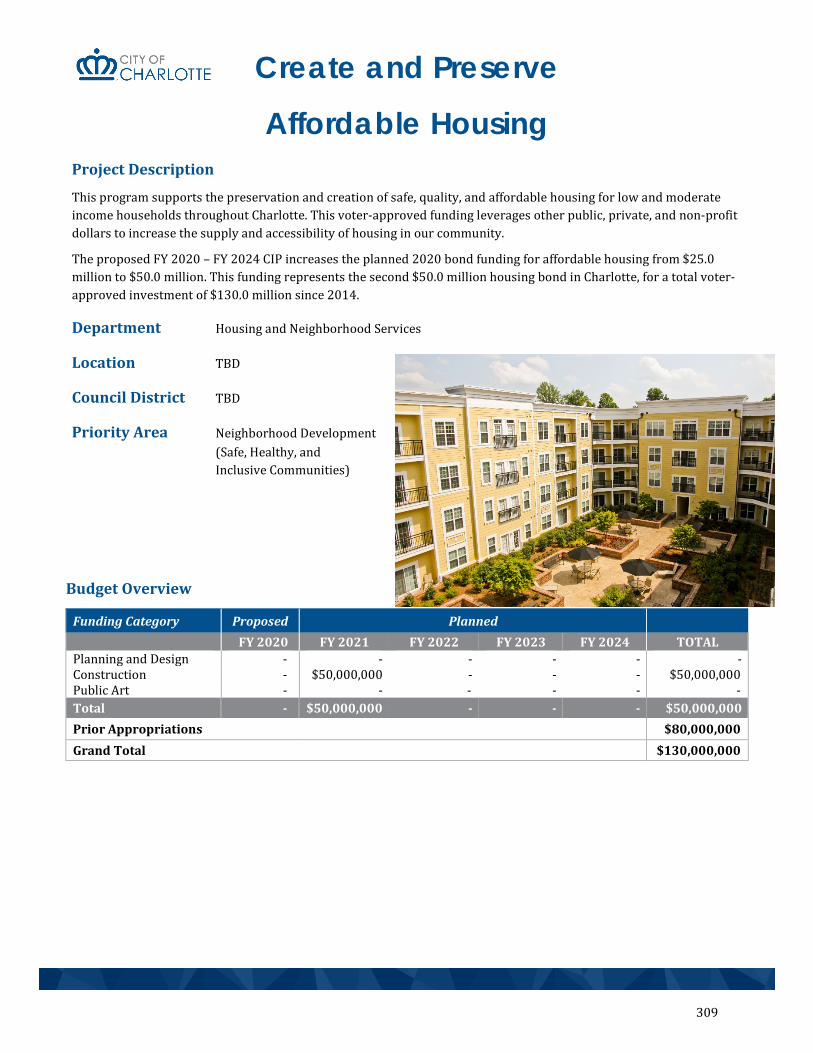
Create and Preserve
Affordable Housing
82 82
Project Description
This program supports the preservation and creation of safe, quality, and affordable housing for low and moderate income households throughout Charlotte. This voter-approved funding leverages other public, private, and non-profit dollars to increase the supply and accessibility of housing in our community.
The proposed FY 2020 – FY 2024 CIP increases the planned 2020 bond funding for affordable housing from $25.0 million to $50.0 million. This funding represents the second $50.0 million housing bond in Charlotte, for a total voter-approved investment of $130.0 million since 2014.
Department Housing and Neighborhood Services
Location TBD
Council District TBD
Priority Area Neighborhood Development (Safe, Healthy, and Inclusive Communities)
Budget Overview
Funding Category Proposed Planned FY 2020 FY 2021 FY 2022 FY 2023 FY 2024 TOTAL
Planning and Design - - - - - - Construction - $50,000,000 - - - $50,000,000 Public Art - - - - - - Total - $50,000,000 - - - $50,000,000 Prior Appropriations $80,000,000 Grand Total $130,000,000
309

Complete Comprehensive Neighborhood Improvement Program
83 83
Project Description
The Comprehensive Neighborhood Improvement Program (CNIP) focuses on connecting six, multi-neighborhood geographies to major employment, institutional, and retail areas through a network of streets, sidewalks, greenways, and bike lanes. This program provides a comprehensive approach to placemaking by promoting vibrant, diverse, and economically strong communities. The identification process for potential CNIP projects spanned across city departments and selection was influenced by active community engagement. The collection of projects within each area are intended to create impactful changes within the surrounding communities.
Each of the six CNIP areas are described in the following pages. The funding table below represents the overall program funding.
Department Housing and Neighborhood Services
Location Central/Albemarle/Shamrock, Prosperity Village, SouthPark, Sunset/Beatties Ford, West Trade/Rozzelles Ferry, Whitehall/Ayrsley
Council District 1, 2, 3, 4, 5, 6
Priority Area Neighborhood Development (Safe, Healthy, and Inclusive Communities)
Budget Overview
Funding Category Proposed Planned FY 2020 FY 2021 FY 2022 FY 2023 FY 2024 TOTAL
Planning and Design - - - - - - Construction - $29,820,000 - - - $29,820,000 Public Art - $180,000 - - - $180,000 Total - $30,000,000 - - - $30,000,000 Prior Appropriations $105,000,000 Grand Total $135,000,000
310

Advance Central/Albemarle/Shamrock CNIP
84 84
Project Description
The Central/Albemarle/Shamrock CNIP area is east of Uptown and encompasses the neighborhoods of Country Club Heights, Four Seasons, Farm Pond, Wilora Lake, Idlewild Farms, Winterfield, Windsor Park, Kilborne, Eastway-Sheffield, Plaza Shamrock, Shamrock Hills, Howie Acres, and Eastway Acres.
Points of interest within CNIP boundaries include the old Eastland Mall site, Evergreen Cemetery, Evergreen Nature Preserve, Kilborne Park, Shamrock Park, Methodist Home Park, Garinger High School, Eastway Middle School, Shamrock Gardens Elementary School, and Aldersgate Community. Projects listed below represent all CNIP projects in the area; projects are in various stages of completion.
Department Housing and Neighborhood Services
Council District 1 and 5
Priority Area Neighborhood Development (Safe, Healthy, and Inclusive Communities)
Budget CNIP: $20,000,000 Sidewalk Program: $2,000,000 Total: $22,000,000
Project List
Shamrock Drive Complete Street – Upgrade 0.9 miles of Shamrock Drive from Virginia Avenue to Cardiff Avenue with bicycle lanes, sidewalks, accessibility ramps, medians, and crosswalks. This project will complement future projects that result from the Eastway Drive/Shamrock Drive Intersection Planning Study.
Eastway Drive/Shamrock Drive Intersection Planning Study – Contribution to a larger intersection project proposed for early planning and design. The intersection project is anticipated to be completed in partnership with the North Carolina Department of Transportation (NCDOT).
Kilborne Drive Streetscape – Construct 0.9 miles of new sidewalk on the west side of Kilborne Drive from Eastway Drive to existing sidewalk adjacent to the entrance of Kilborne Apartments at Havenwood Road. This project will install new curb and gutter, storm drainage, planted medians, a pedestrian island and crosswalks, street trees, and bicycle facilities.
Central Avenue/Kilborne Drive/Norland Road Pedestrian and Bicycle Improvements – Highlight the historical attributes of the area, which includes a new pocket park, and construct 0.8 miles of bicycle lanes, sidewalks, accessibility ramps, crosswalks, and intersection improvements.
Public Art – Artwork will be integrated into the Potter’s Place green space that focuses on resident memories and experiences of the neighborhood. Art will also be included in the Shamrock Drive roundabouts.
311

Support Prosperity Village CNIP
85 85
Project Description
The Prosperity Village area is a high-growth area in northeast Charlotte in need of increased connectivity to regional nodes and employment centers. Charlotte’s largest planned neighborhood, Highland Creek, is located within the Prosperity Village community. Projects listed below represent all CNIP projects in the area; projects are in various stages of completion.
Department Housing and Neighborhood Services
Council District 4
Priority Area Neighborhood Development (Safe, Healthy, and Inclusive Communities)
Budget CNIP: $30,000,000 Sidewalk Program: $150,000 Charlotte Water/ Storm Water/Other: $120,000 Total: $30,270,000
Project List
Jimmy Oehler Road Sidewalk – Fill-in 0.1 mile of sidewalk gap.
Ridge Road Sidewalk – Fill-in 0.1 mile of sidewalk gap.
Craven Thomas Road/Robert Helms Road Streetscape – Design and install about 1.0 mile of streetscape beautification along Craven Thomas Road, Robert Helms Road, and the Prosperity Church Road exit off of the I-485. The beautification elements include widening the existing sidewalk into a multi-use trail, adding treesand shrubs, resting areas, lighting, and public art.
DeArmon Road Complete Street Improvements – Improve 0.75 miles of DeArmon Road from Browne Road to Benfield Road with a turn lane, curb and gutter, storm drainage, sidewalk, and a greenway crossing under DeArmon Road.
Prosperity Church Road Pedestrian Crossings – Install a traffic signal at Prosperity Church Road and Katelyn Drive, and pedestrian beacons at Prosperity Church Road and Prosperity Point Land, as well as 3700 Prosperity Church Road.
Prosperity Church Road Improvements – Widen approximately 0.3 miles of Prosperity Church Road between Old Ridge Road and Benfield Road. Improvements also include curb and gutter, sidewalk, storm drainage, bicycle lanes, on-street parking, and a roundabout at Prosperity Church Road and Prosperity Ridge Road.
312

Support Prosperity Village CNIP
86 86
Prosperity Village Pocket Park for CLT 250 – Create a pocket park on a 1.36-acre site north of the intersection of Benfield Road and DeArmon Road/Johnston Oehler Road. This new community asset will serve as a gateway to Prosperity Village.
Public Art – A series of eight sculptures will be installed along each side of the streetscape divided by I-485 that reference the community’s agrarian history. The artist has also proposed two, large-scale figures carved from stone to serve as trail markers along Robert Helms Road.
313

Promote SouthPark CNIP
87 87
Project Description
The SouthPark CNIP focuses on the identification and implementation of infrastructure to support and sustain private investment in the community. Strategic public investments will be made to maintain and advance SouthPark as an attractive and economically strong community, and to provide enhanced transportation choices in the area. Projects listed below represent all CNIP projects in the area; projects are in various stages of completion.
Department Housing and Neighborhood Services
Council District 6
Priority Area Neighborhood Development (Safe, Healthy, and Inclusive Communities)
Budget CNIP: $15,000,000 Total: $15,000,000
Project List
Enhanced CrossWalks – Improve pedestrian safety and mobility by adding high visibility crosswalks, new accessibility ramps, and leading pedestrian interval signal devices. The intersections of Sharon Road and Fairview Road, and Sharon Road and Morrison Boulevard have been identified for initial implementation.
Barclay Downs Drive Sidewalk – Improve pedestrian safety along a 0.6 mile stretch of Barclay Downs Drive between Sayre Road and Runnymede Lane through the addition of sidewalk, curb and gutter, accessibility ramps, and a planting strip.
Backlot Trail Phase I – Install 0.5 miles of pedestrian and bicycle facilities to connect Park South Drive to Park Road and Park Road Park. These facilities may include sidewalk, curb and gutter, planting strips, and concrete trails.
Cultural Loop Vision Framework Plan – Create a Framework Plan to vision and program an approximately 3.0-mile bicycle and pedestrian path connecting neighborhoods, shops, restaurants, hotels, and parks in the SouthPark activity center.
Cultural Loop Implementation – Support the future design and construction of the Cultural Loop once the Framework Plan is complete.
Partnership Opportunities – A portion of funding is set aside for public/private partnerships to construct the Cultural Loop once the Framework Plan is complete.
Briar Creek Greenway Wayfinding – Connect residents to Mecklenburg County’s Briar Creek Greenway through wayfinding via the future Cultural Loop.
Public Art – Actively in planning phase with scope and artist still to be determined.
314

Further Sunset/ Beatties Ford CNIP
88 88
Project Description
The Sunset/Beatties Ford CNIP area includes established communities in a high-growth area in north and northwest Charlotte. This area was selected as a CNIP due to opportunities for development, redevelopment, and leveraging existing assets within the community. The population in the Sunset/Beatties Ford area more than doubled between 2000 – 2010; as a result, there is increased demand for safe connections to parks, recreation, retail, transit, and jobs. Projects are focused on improving pedestrian safety, increasing pedestrian access to services, and expanding transportation choices.
Department Housing and Neighborhood Services
Council District 2
Priority Area Neighborhood Development (Safe, Healthy, and Inclusive Communities)
Budget CNIP: $20,000,000 NCDOT: $3,500,000 Sidewalk Program: $750,000 Total: $24,250,000
Project List
Beatties Ford Road Pedestrian Crossings – Improve pedestrian safety and access to services along Beatties Ford Road from Capps Hill Mine Road to I-85 by adding pedestrian islands, hybrid beacons, and/or traffic signals.
Lakeview Road/Reames Road Roundabout and Sidewalk – Construct a roundabout at Lakeview Road and Reames Road and install 1.4 miles of sidewalk on the south side of Lakeview Road from Reames Road to Beatties Ford Road.
Beatties Ford Road/Sunset Road Pedestrian Improvements – Improve accessibility in and around Hornet’s Nest Park and adjacent neighborhoods. A total of 3.5 miles of sidewalk will be added to Beatties Ford Road and Sunset Road, and a traffic signal will be installed at the intersection of Beatties Ford Road and Trinity Road.
Peachtree Road Sidewalks – Install a total of 1.1 miles of sidewalk along both sides of Peachtree Road from Oakdale Road to Crandon Drive, along Beam Lake Drive from Peachtree Road to the existing sidewalk, and fill in sidewalk gaps along Oak Drive.
Oakdale Road/Miranda Road/Sunset Road Intersection – Provide matching funds for NCDOT’s intersection improvement project to enhance safety.
Public Art – Actively in planning phase with scope and artist still to be determined.
315

Advance West Trade/ Rozzelles Ferry CNIP
89 89
Project Description
The West Trade/Rozzelles Ferry CNIP area is a high-growth area on the west side of Uptown. The area is home to a unique blend of historic landmarks, Johnson C. Smith University, retail and businesses, and neighborhoods including Smallwood, Lakewood, Seversville, Wesley Heights, Ashley Park, and Camp Greene. These projects will be transformative, help large multi-neighborhood areas strengthen important business corridors, reenergize established neighborhoods, capitalize on key economic activity centers, and connect the community to the CityLYNX Gold Line.
Department Housing and Neighborhood Services
Council District 2
Priority Area Neighborhood Development (Safe, Healthy, and Inclusive Communities)
Budget CNIP: $20,000,000 Total: $20,000,000
Project List
West 4th Street Extension – Increase pedestrian safety by decreasing 1.0 mile of four-lane roadway to two lanes. This project will also add sidewalk, curb and gutter, refuge medians, accessibility ramps, storm drainage improvements, landscaping and street trees, and street resurfacing.
Frazier Avenue Realignment – Improve 0.25 miles of Frazier Avenue between West Trade Street and 5th Street with new sidewalk, planting strips, and curb and gutter. The new section of Frazier Avenue will be aligned at the intersection with Wesley Heights Way. This new intersection installs pedestrian and traffic signals, storm drainage improvements, street trees, and new accessibility ramps.
I-77/West Trade Street Underpass Enhancements – Install new lighting, benches, public art, and newsidewalk along the I-77 underpass on West Trade Street.
Five Points Public Plaza – Create a new public plaza at the Five Points intersection including landscaping, public art, water splash pad, amphitheater, solar pavers, sings, and new sidewalk.
Morehead Street Projects – Construct wider sidewalks, curb and gutter, accessibility ramps, and new lighting along 0.17 miles of roadway at the intersection of West Morehead Street and I-77. A second project includes three pedestrian refuge islands on West Morehead Street between Wilkinson Boulevard and Suttle Avenue to improve connectivity to the CityLYNX Gold Line. This project is coordinated with NCDOT resurfacing of Morehead Street.
316

Advance West Trade/ Rozzelles Ferry CNIP
90 90
Rozzelles Ferry Road Pedscape Project – Build pedestrian refuge medians along 0.7 miles of Rozzelles Ferry Road from Zebulon Avenue to the Rozzelles Ferry Road/West 5th Street/West Trade Street/Beatties Ford Road intersection. Street resurfacing will also be completed in conjunction with this project.
State Street Pedestrian Improvements – Transform 0.5 miles of State Street into a pedestrian-friendly street connecting Johnson C. Smith University and Old Savona Mills creating a place for community interaction. The project will provide the Eleanor Heights community with access to the CityLYNX Gold Line and local businesses. Improvements might include planting strips, sidewalks, crosswalks, street trees, storm drainage improvements, and wayfinding signage.
Trail Crossing Improvements – Connect the existing Mecklenburg County greenway in the Wesley Heights neighborhood to the future Stewart Creek Greenway. The 0.1-mile project includes signage, pavement markings, and a high visibility crosswalk.
Street Connectivity – Improve access and visibility to Martin Luther King park and the future Mecklenburg County Stewart Creek Greenway via a 0.2-mile connection between Yellowstone Drive and Zebulon Drive. Connections will be made through roadway, bridges, and/or culverts.
Five Points Better Block – Engage the community and complete visioning via Better Block to promote a healthy and vibrant community.
Public Art – Create a monumental sculpture for Five Points Plaza and eight sculptures along West Trade Street at the I-77 underpass. Each sculpture is being designed to reflect the community’s rich history and character. The artists are preparing their schematic design through extensive collaboration with communities throughout Historic West End. The goal is to collect a surplus of oral histories and images for use in each sculpture.
317

Support Whitehall/ Ayrsley CNIP
91 91
Project Description
The Whitehall/Ayrsley CNIP is a high-growth area with established and emerging neighborhoods and a diverse mix of office, retail, and industrial employment. This area includes, or is adjacent to, some of the fastest growing areas, both commercial and residential areas, in Charlotte. These areas include the Steele Creek neighborhood, Charlotte Premium Outlets, River District, Westinghouse Free Trade Area, and South Tryon Street’s Rivergate area. Whitehall/Ayrsley is also in close proximity to the CLT Airport as well as other key transportation infrastructure.
CNIP projects in this area are expected to be transformative, help large multi-neighborhood areas strengthen important business corridors, reenergize established neighborhoods, and capitalize on key economic activity centers. Projects will improve pedestrian, bicyclist, and motorist safety while expanding transportation options for residents and businesses in the area.
Department Housing and Neighborhood Services
Council District 3
Priority Area Neighborhood Development (Safe, Healthy, and Inclusive Communities)
Budget CNIP: $30,000,000 Developer Contribution: $879,000 Total: $30,879,000
Project List
South Tryon Street/Whitehall Park Drive/Ayrsley Town Boulevard Intersection – Improve pedestrian safety and traffic calming by reducing 1,300 feet of Ayrsley Town Boulevard from four lanes to two lanes with a divided median and reverse angle parking. The project also includes pedestrian bump-outs, sidewalks, and crosswalks.
Brown Grier Road Upgrades – Convert 2.0 miles of Brown Grier Road between Steele Creek Road and Whitehall Park Drive from two lanes to a four-lane road with divided median and multi-use paths.
Sandy Porter Road/South Tryon Street Intersection Improvement – Construct a left turn lane from South Tryon Street onto Sandy Porter Road to enhance vehicle capacity. Additionally, 1,300 feet of sidewalk will be widened to improve pedestrian safety.
Multi-Use Path Along Westinghouse Boulevard – Build a 3.2-mile multi-use path along Westinghouse Boulevard from South Tryon Street to Shopton Road West to improve pedestrian safety, bicycle connectivity, and pedestrian access.
Public Art – Actively in planning phase with scope and artist still to be determined.
318

Improve Pedestrian Safety
92 92
Project Description
The pedestrian safety program aims to make Charlotte a more walkable city by creating a pedestrian experience that is safe, useful, and inviting. The work funded through this program is guided by the City Council-adopted Charlotte WALKS Pedestrian Plan and the Transportation Action Plan. Projects within the program focus on constructing new sidewalks, connecting sidewalk gaps, and installing pedestrian crossings, refuge islands, accessibility improvements, and pedestrian signals.
Department Transportation
Location Citywide
Council District Citywide
Priority Area Neighborhood Development (Safe, Healthy, and Inclusive Communities)
Budget Overview
Funding Category Proposed Planned FY 2020 FY 2021 FY 2022 FY 2023 FY 2024 TOTAL
Planning and Design - $3,000,000 - - - $3,000,000 Construction - $11,985,000 - - - $11,985,000 Public Art - $15,000 - - - $15,000 Total - $15,000,000 - - - $15,000,000 Prior Appropriations $60,000,000 Grand Total $75,000,000
319

Strengthen East/Southeast Sidewalk and Bikeway Connections
93 93
Project Description
The East/Southeast Corridor Sidewalk and Bikeway Improvements funding implements projects throughout the Independence Boulevard corridor in support of the Independence Boulevard Area Plan. Improvements provide pedestrian and bicycle facilities to increase safety, mobility, and accessibility between neighborhoods.
Department Transportation
Location Independence Boulevard Corridor and Independence Boulevard Area Plan
Council District 1 and 5
Priority Area Neighborhood Development (Safe, Healthy, and Inclusive Communities)
Budget Overview
Funding Category Proposed Planned FY 2020 FY 2021 FY 2022 FY 2023 FY 2024 TOTAL
Planning and Design - - - - - - Construction - $1,998,000 - - - $1,998,000 Public Art - $2,000 - - - $2,000 Total - $2,000,000 - - - $2,000,000 Prior Appropriations $6,000,000 Grand Total $8,000,000
320

Construct Fire Stations
94 94
Project Description
This program provides funding to construct new fire stations throughout the city. Analysis of call load, street connectivity, resource availability, and response times helps determine when and where new infill fire stations are needed. The city is in the process of completing a facilities Master Plan; once the Plan is complete, this funding will be available to construct fire stations in priority order.
In FY 2019, $6,000,000 was planned to construct a new infill fire station in FY 2021. Based on a revised scope that includes an approximately 12,600 square foot facility with three fire truck bays to meet community demand, the cost estimate has been increased by $3,350,000 for a total funding amount of $9,350,000 in FY 2021.
Department Fire
Location TBD
Council District TBD
Priority Area Neighborhood Development (Safe, Healthy, and Inclusive Communities)
Budget Overview
Funding Category Proposed Planned FY 2020 FY 2021 FY 2022 FY 2023 FY 2024 TOTAL
Planning and Design - $1,290,000 - - - $1,290,000 Construction - $8,000,000 - - - $8,000,000 Public Art - $60,000 - - - $60,000 Total - $9,350,000 - - - $9,350,000 Prior Appropriations $0 Grand Total $9,350,000
321

Complete Police
Central Division Station
95 95
Project Description
This funding will complete construction of the three-story, 31,000 square foot police station and adjacent, five-story parking deck that will serve the Charlotte-Mecklenburg Police Department's Central Division. The Central Division spans all of Uptown and portions of SouthEnd and Midtown. Currently, this Division operates out of a leased facility but will relocate to the new facility once construction is complete.
Department Police
Location 725 W 6th Street
Council District 2
Priority Area Neighborhood Development (Safe, Healthy, and Inclusive Communities)
Budget Overview
Funding Category Proposed Planned FY 2020 FY 2021 FY 2022 FY 2023 FY 2024 TOTAL
Planning and Design - - - - - - Construction $1,800,000 - - - - $1,800,000 Public Art - - - - - - Total $1,800,000 - - - - $1,800,000 Prior Appropriations $26,000,000 Grand Total $27,800,000
322

Construct Long Creek Wastewater Treatment Plant
96 96
Project Description
Wastewater from this area is currently pumped 27 miles to the McAlpine Wastewater Treatment Plant. Charlotte Water has identified the need for a new wastewater treatment facility to support expected growth and provide a cost-effective, regional solution for wastewater treatment for not only western Mecklenburg County, but for the Belmont and Mount Holly communities.
Department Charlotte Water
Location Hawfield Road
Council District Adjacent to 2 and 3
Priority Area Neighborhood Development (Safe, Healthy, and Inclusive Communities)
Budget Overview
Funding Category Proposed Planned FY 2020 FY 2021 FY 2022 FY 2023 FY 2024 TOTAL
Planning/Design $3,564,000 $13,074,000 $25,585,200 $27,199,200 $22,512,600 $91,935,000 Construction $8,316,000 $30,506,000 $59,698,800 $63,464,800 $52,529,400 $214,515,000 Public Art $120,000 $420,000 $816,000 $736,000 $758,000 $2,850,000 Total $12,000,000 $44,000,000 $86,100,000 $91,400,000 $75,800,000 $309,300,000 Prior Appropriations $46,771,335 Grand Total $356,071,335
323

Expand Mallard Creek Wastewater Treatment Plant
97 97
Project Description
Infrastructure improvements will be made to add capacity and rehabilitate equipment critical to the Mallard Creek Wastewater Treatment Plant. The plant was built in 1979 and handles wastewater treatment for residents and businesses in the Mallard Creek and Back Creek basins.
In the past few years, the Mallard Creek Wastewater Treatment Plant has operated close to its allowed limit due to increased growth in the area aligned with the extension of the Blue Line from Uptown to UNC-Charlotte. Expanding the plant’s capacity is critical to supporting future development in the area.
Improvements to the plant will increase its treatment capacity in a phased approach and replace equipment related to ultraviolet disinfection, filtration, and final clarification.
Department Charlotte Water
Location 12400 U.S. Highway 29
Council District Adjacent to 4
Priority Area Neighborhood Development (Safe, Healthy, and Inclusive Communities)
Budget Overview
Funding Category Proposed Planned FY 2020 FY 2021 FY 2022 FY 2023 FY 2024 TOTAL
Planning and Design $5,850,000 $5,280,000 $9,300,000 $9,150,000 $7,425,000 $37,005,000 Construction $13,650,000 $12,320,000 $21,700,000 $21,350,000 $17,325,000 $86,345,000 Total $19,500,000 $17,600,000 $31,000,000 $30,500,000 $24,750,000 $123,350,000 Prior Appropriations $19,693,784 Grand Total $143,043,784
324

Improve McAlpine Creek Wastewater Treatment Plant
98 98
Project Description
These projects will rehabilitate and upgrade critical equipment at the wastewater treatment plant which serves southern and western Mecklenburg County to accommodate growth, maintain regulatory compliance, and reduce maintenance costs.
Department Charlotte Water
Location Lancaster Highway
Council District 3, 4, 5; adjacent to 2 and 7
Priority Area Neighborhood Development (Safe, Healthy, and Inclusive Communities)
Budget Overview
Funding Category Proposed Planned FY 2020 FY 2021 FY 2022 FY 2023 FY 2024 TOTAL
Planning and Design $750,000 $12,330,000 $15,930,000 - $1,440,000 $30,450,000 Construction $1,750,000 $28,770,000 $37,170,000 - $3,360,000 $71,050,000 Total $2,500,000 $41,100,000 $53,100,000 - $4,800,000 $101,500,000 Prior Appropriations $41,529,344 Grand Total $143,029,344
325

Upgrade McDowell Creek Wastewater Treatment Plant
99 99
Project Description
Upgrades to the McDowell Creek Wastewater Treatment Plant will allow for the treatment process to continue while original treatment process equipment is taken out of service and rehabilitated or replaced. Equipment to be rehabilitated or replaced includes motors, pumps, pipelines, aeration systems, and electrical and control systems.
The plant was built in 1979 and handles wastewater treatment for residents and businesses in the Huntersville area.
Department Charlotte Water
Location Neck Road
Council District Adjacent to 2
Priority Area Neighborhood Development (Safe, Healthy, and Inclusive Communities)
Budget Overview
Funding Category Proposed Planned FY 2020 FY 2021 FY 2022 FY 2023 FY 2024 TOTAL
Planning and Design - - - $450,000 $3,600,000 $4,050,000 Construction - - - $1,050,000 $8,400,000 $9,450,000 Total - - - $1,500,000 $12,000,000 $13,500,000 Prior Appropriations $2,000,000 Grand Total $15,500,000
326

Upgrade Water Treatment Plants
100 100
Project Description
These projects will provide rehabilitation and improvements for water treatment plants, including upgrades and rehabilitation of filters and new generators to ensure uninterrupted service during power outages, which will reduce energy consumption and maintenance, as well as maintain regulatory compliance.
Department Charlotte Water
Location Franklin, Lee S. Dukes, and Vest Water Treatment Plants
Council District 2, adjacent to 2 and 4
Priority Area Neighborhood Development (Safe, Healthy, and Inclusive Communities)
Budget Overview
Funding Category Proposed Planned FY 2020 FY 2021 FY 2022 FY 2023 FY 2024 TOTAL
Planning and Design $2,565,000 $1,680,000 $5,205,000 $1,455,000 - $10,905,000 Construction $5,985,000 $3,920,000 $12,145,000 $3,395,000 - $25,445,000 Total $8,550,000 $5,600,000 $17,350,000 $4,850,000 - $36,350,000 Prior Appropriations $80,658,183 Grand Total $117,008,183
327

Improve Wastewater Treatment Plants
101 101
Project Description
These projects will provide improvements and rehabilitate components at various wastewater treatment plants. Projects include new tanks for waste-activated sludge, odor scrubbers, improvements to a clarifier tank, and roof repairs at five wastewater treatment plants which will protect critical electrical and mechanical equipment inside the plants.
Department Charlotte Water
Location Irwin Creek, Mallard Creek, McAlpine Creek, McDowell Creek, and Sugar Creek Wastewater Treatment Plants
Council District 3,4,6; adjacent to 2 and 7
Priority Area Neighborhood Development (Safe, Healthy, and Inclusive Communities)
Budget Overview
Funding Category Proposed Planned FY 2020 FY 2021 FY 2022 FY 2023 FY 2024 TOTAL
Planning and Design $3,900,000 $4,305,000 $5,775,000 $4,815,000 $3,315,000 $22,110,000 Construction $9,100,000 $10,045,000 $13,475,000 $11,235,000 $7,735,000 $51,590,000 Total $13,000,000 $14,350,000 $19,250,000 $16,050,000 $11,050,000 $73,700,000 Prior Appropriations $99,469,343 Grand Total $173,169,343
328

Rehabilitate and Improve Wastewater Infrastructure
102 102
Project Description
These projects prioritize and renew critical infrastructure, which will protect resident and environmental health by preventing sanitary sewer overflows, as well as reduce maintenance costs and accommodate future growth.
Department Charlotte Water
Location Citywide
Council District Citywide
Priority Area Neighborhood Development (Safe, Healthy, and Inclusive Communities)
Budget Overview
Funding Category Proposed Planned FY 2020 FY 2021 FY 2022 FY 2023 FY 2024 TOTAL
Planning and Design $35,940,000 $32,245,500 $25,965,000 $23,476,500 $23,002,245 $140,629,245 Construction $83,860,000 $75,239,500 $60,585,000 $54,778,500 $53,671,905 $328,134,905 Total $119,800,000 $107,485,000 $86,550,000 $78,255,000 $76,674,150 $468,764,150 Prior Appropriations $393,665,297 Grand Total $862,429,447
329

Rehabilitate and Improve Water Infrastructure
103 103
Project Description
These projects prioritize and renew critical water infrastructure, which will enable the city to reliably distribute an adequate supply of high-quality water and accommodate future growth.
Department Charlotte Water
Location Citywide
Council District Citywide
Priority Area Neighborhood Development (Safe, Healthy, and Inclusive Communities)
Budget Overview
Funding Category Proposed Planned FY 2020 FY 2021 FY 2022 FY 2023 FY 2024 TOTAL
Planning and Design $13,140,000 $9,337,500 $10,537,500 $4,935,000 $6,994,050 $44,944,050 Construction $30,660,000 $21,787,500 $24,587,500 $11,515,000 $16,319,450 $104,869,450 Total $43,800,000 $31,125,000 $35,125,000 $16,450,000 $23,313,500 $149,813,500 Prior Appropriations $236,080,155 Grand Total $385,893,655
330

Increase Alternative Energy Production
104 104
Project Description
These projects are intended to increase the production and use of alternative energy at three wastewater treatment plants, including a solar panel pilot, addition of a second combined heat and power engine, and biogas-to-fuel facility to provide a potential fuel source for city vehicles.
Department Charlotte Water
Location Irwin Creek, Mallard Creek, and McAlpine Wastewater Treatment Plants
Council District 3, 4, adjacent to 7
Priority Area Neighborhood Development (Safe, Healthy, and Inclusive Communities)
Budget Overview
Funding Category Proposed Planned FY 2020 FY 2021 FY 2022 FY 2023 FY 2024 TOTAL
Planning and Design $2,025,000 - $1,650,000 $2,100,000 $1,350,000 $7,125,000 Construction $4,725,000 - $3,850,000 $4,900,000 $3,150,000 $16,625,000 Total $6,750,000 - $5,500,000 $7,000,000 $4,500,000 $23,750,000 Prior Appropriations $3,429,682 Grand Total $27,179,682
331

Improve Drainage for Storm Water
2 2
Project Description
Major and Minor Storm Drainage Improvement Projects repair failing storm water infrastructure with the goals of reducing flooding, safely conveying storm water runoff from streets to streams, and protecting the traveling public. Projects range from small to very large scope, including pipe size, location and property owner involvement. This program manages over 400 projects to repair and replace approximately six miles of drainage pipe annually.
Department Storm Water Services
Location Citywide
Council District Citywide
Priority Area Neighborhood Development (Safe, Healthy, and Inclusive Communities)
Budget Overview
Funding Category Proposed Planned
FY 2020 FY 2021 FY 2022 FY 2023 FY 2024 TOTAL Planning and Design $6,372,000 $7,094,000 $4,187,000 $8,827,000 $14,274,000 $40,754,000 Real Estate $128,000 $2,510,000 $810,000 $1,404,500 $2,000,000 $6,852,500 Construction $51,808,000 $52,892,000 $52,418,000 $107,863,500 $100,126,000 $365,107,500 Total $58,308,000 $62,496,000 $57,415,000 $118,095,000 $116,400,000 $412,714,000 Prior Appropriations $308,417,500
Grand Total $721,131,500
332

Enhance Storm Water Mitigation Programs
1 1
Project Description
This program supports meeting the requirements of the Federal Clean Water Act. Most local surface waters are impaired and must be improved. The program funds watershed improvement projects, such as stream restoration and control measures, to filter storm water before reaching streams.
Department Storm Water Services
Location Citywide
Council District Citywide
Priority Area Neighborhood Development (Safe, Healthy, and Inclusive Communities)
Budget Overview
Funding Category Proposed Planned FY 2020 FY 2021 FY 2022 FY 2023 FY 2024 TOTAL
Planning and Design $520,000 $812,000 $2,716,000 $4,597,000 $6,949,000 $15,594,000 Construction $2,172,000 $692,000 $1,369,000 $5,308,000 $4,651,000 $14,192,000 Total $2,692,000 $1,504,000 $4,085,000 $9,905,000 $11,600,000 $29,786,000 Prior Appropriations $20,885,000 Grand Total $50,671,000
333

62 62
This page intentionally left blank.

2 2
ECONOMIC DEVELOPMENT
CAPITAL INVESTMENT PLAN

62 62
This page intentionally left blank.

Transform Polk Park
3 3
Project Description
This project will transform the city-owned Thomas Polk Park at the corner of Tryon Street and Trade Street. These enhancements will leverage private sector funding to create an urban public space in the heart of Uptown that could be programmed with new seating, greenspace, or retail.
Department Economic Development
Location 105 North Tryon Street
Council District 2
Priority Area Economic Development (Economy, Jobs, and Upward Mobility)
Budget Overview
Funding Category Proposed Planned FY 2020 FY 2021 FY 2022 FY 2023 FY 2024 TOTAL
Public/Private Partnership $1,000,000 - - - - $1,000,000
Total $1,000,000 - - - - $1,000,000 Prior Appropriations $0 Grand Total $1,000,000
337

Acquire Land and Create Street Connections
4 4
Project Description
Land acquisition and street connections funding supports the implementation of the Independence Boulevard Area Plan and the promotion of economic development along the Independence Boulevard corridor. Land acquisition in key locations support nodal development and help reorient development towards Central Avenue and Monroe Road. Street connections increase mobility and accessibility between neighborhoods and improve safety throughout the corridor.
Department Economic Development
Location Independence Boulevard Corridor
Council District 5
Priority Area Economic Development (Economy, Jobs, and Upward Mobility)
Budget Overview
Funding Category Proposed Planned FY 2020 FY 2021 FY 2022 FY 2023 FY 2024 TOTAL
Planning and Design - - - - - - Construction - $2,000,000 - - - $2,000,000 Public Art - - - - - - Total - $2,000,000 - - - $2,000,000 Prior Appropriations $20,000,000 Grand Total $22,000,000
338

Beautify Monroe Road Streetscape
5 5
Project Description
The Monroe Road Streetscape project makes improvements along two miles of Monroe Road between Briar Creek Road and North Sharon Amity Road to create a more pedestrian-oriented and mixed-use development corridor as recommended in the Independence Boulevard Area Plan. Possible improvements may include widened sidewalks, accessibility ramps, new bus shelters, bike lanes, on-street parking, pedestrian lighting, and improved neighborhood accessibility.
Department Economic Development
Location Monroe Road from Briar Creek Road to Sharon Amity Road
Council District 1 and 5
Priority Area Economic Development (Economy, Jobs, and Upward Mobility)
Budget Overview
Funding Category Proposed Planned FY 2020 FY 2021 FY 2022 FY 2023 FY 2024 TOTAL
Planning and Design - - - - - - Construction - $10,309,680 - - - $10,309,680 Public Art - $10,320 - - - $10,320 Total - $10,320,000 - - - $10,320,000 Prior Appropriations $3,080,000 Grand Total $13,400,000
339

Renovate Airport Terminal
6 6
Project Description
Terminal renovation projects provide for the expansion, rehabilitation, and improvement of the terminal building. This is the main thoroughfare passengers use to drop-off and pick-up luggage, navigate to a flight, and shop in a concession space. Renovations include updating all existing concourses with new terrazzo floors, remodeled restrooms, energy-efficient LED lighting, and new seating with device charges at every seat.
Department Aviation
Location CLT Airport
Council District 3
Priority Area Economic Development (Economy, Jobs, and Upward Mobility)
Budget Overview
Funding Category Proposed Planned FY 2020 FY 2021 FY 2022 FY 2023 FY 2024 TOTAL
Planning and Design $24,217,526 $47,637,019 $23,670,478 $14,210,441 $7,066,704 $116,802,168 Construction $162,071,142 $318,801,585 $158,410,122 $95,100,644 $47,292,553 $781,676,046 Other $9,804,667 $19,286,242 $9,583,189 $5,753,215 $2,861,014 $47,288,327 Total $196,093,335 $385,724,846 $191,663,789 $115,064,300 $57,220,271 $945,766,541 Prior Appropriations $316,385,410 Grand Total $1,262,151,951
340

Enhance Airfield Capacity
7 7
Project Description
These projects provide for capacity and safety enhancements to the multiple runways at CLT. These improvements facilitate the ability for more aircraft to fly to and out of CLT. The fourth parallel runway and related projects will enable more take-offs and landings and more space for aircraft to move quickly to and from gates.
Department Aviation
Location CLT Airport
Council District 3
Priority Area Economic Development (Economy, Jobs, and Upward Mobility)
Budget Overview
Funding Category Proposed Planned FY 2020 FY 2021 FY 2022 FY 2023 FY 2024 TOTAL
Planning and Design $22,758,250 $5,468,330 $14,227,179 $37,424,013 $5,823,700 $85,701,472 Construction $204,824,244 $49,214,970 $128,044,615 $336,816,112 $52,413,302 $771,313,243 Equipment $1,540,000 - - - - $1,540,000 Technology $66,800 - - - - $66,800 Other $9,482,604 $2,278,471 $5,927,991 $15,593,339 $2,426,542 $35,708,947 Total $238,671,898 $56,961,771 $148,199,785 $389,833,464 $60,663,544 $894,330,462 Prior Appropriations $89,075,442 Grand Total $983,405,904
341

Increase Airport Fuel Capacity
8 8
Project Description
These projects provide for increased fueling capacity required by the increase of both size and quantity of passenger aircraft that stop in CLT. The Terminal Fuel Farm expansion increases the pumping capacity and allows for shorter fueling times.
Department Aviation
Location CLT Airport
Council District 3
Priority Area Economic Development (Economy, Jobs, and Upward Mobility)
Budget Overview
Funding Category Proposed Planned FY 2020 FY 2021 FY 2022 FY 2023 FY 2024 TOTAL
Planning and Design $1,183,770 - - - - $1,183,770 Construction $10,653,928 $1,189 - - - $10,655,117 Other $493,237 - - - - $493,237 Total $12,330,935 $1,189 - - - $12,332,124 Prior Appropriations $6,422,876 Grand Total $18,755,000
342

Enhance Airport Services Facilities
9 9
Project Description
These projects provide for growth in technology infrastructure as well as supportive facilities that house employees and other partners. The video management system project will modernize the CLT Airport’s security cameras, improving passenger safety and security.
Department Aviation
Location CLT Airport
Council District 3
Priority Area Economic Development (Economy, Jobs, and Upward Mobility)
Budget Overview
Funding Category Proposed Planned FY 2020 FY 2021 FY 2022 FY 2023 FY 2024 TOTAL
Planning and Design $1,825,697 $1,729,645 - - - $3,555,342 Construction $12,218,126 $11,575,314 - - - $23,793,440 Equipment $495,000 $200,000 - - - $695,000 Technology $8,666,750 $2,500,000 - - - $11,166,750 Land Acquisition $5,000,000 $10,000,000 $8,100,000 $10,500,000 - $33,600,000 Other $739,149 $700,261 - - - $1,439,410 Total $28,944,722 $26,705,220 $8,100,000 $10,500,000 - $74,249,942 Prior Appropriations $28,730,558 Grand Total $102,980,500
343

Expand Airport Cargo Capacity
10 10
Project Description
Cargo facility growth allows for increased capacity and more frequent cargo carrier service. The Steele Creek cargo facility is a new facility that will increase efficiency and centralize existing cargo operations. The facility will also act as a catalyst for more cargo development around CLT.
Department Aviation
Location CLT Airport
Council District 3
Priority Area Economic Development (Economy, Jobs, and Upward Mobility)
Budget Overview
Funding Category Proposed Planned FY 2020 FY 2021 FY 2022 FY 2023 FY 2024 TOTAL
Planning and Design $498,940 $1,117,675 $913,900 - - $2,530,515 Construction $3,339,060 $7,479,825 $6,116,100 - - $16,934,985 Other $202,000 $452,500 $370,000 - - $1,024,500 Total $4,040,000 $9,050,000 $7,400,000 - - $20,490,000 Prior Appropriations $1,890,000 Grand Total $22,380,000
344

Expand Ground Transportation Capacity
11 11
Project Description
These projects provide for the replacement of the shuttle bus fleet and the implementation of a new parking and revenue control system. This project will provide local passengers with options for online booking, quicker payment, and more flexible parking choices.
Department Aviation
Location CLT Airport
Council District 3
Priority Area Economic Development (Economy, Jobs, and Upward Mobility)
Budget Overview
Funding Category Proposed Planned FY 2020 FY 2021 FY 2022 FY 2023 FY 2024 TOTAL
Planning and Design $185,250 - - - - $185,250 Construction $1,239,750 - - - - $1,239,750 Equipment $3,030,000 $2,400,000 $2,400,000 - - $7,830,000 Technology - $14,000,000 - - - $14,000,000 Other $75,000 - - - - $75,000 Total $4,530,000 $16,400,000 $2,400,000 - - $23,330,000 Prior Appropriations $262,000 Grand Total $23,592,000
345

Improve Private Aircraft Area
12 12
Project Description
These projects provide for the expansion and improvement of CLT’s main area for charter and private aircraft activity. The ramp expansion project will add ramp space to enable more aviation (private and charter) traffic.
Department Aviation
Location CLT Airport
Council District 3
Priority Area Economic Development (Economy, Jobs, and Upward Mobility)
Budget Overview
Funding Category Proposed Planned FY 2020 FY 2021 FY 2022 FY 2023 FY 2024 TOTAL
Planning and Design $5,107,350 $3,620,500 $1,500,000 $1,500,000 - $11,727,850 Construction $2,391,493 $2,479,500 - - - $4,870,993 Equipment $515,000 - - - - $515,000 Other $144,676 $150,000 - - - $294,676 Total $8,158,519 $6,250,000 $1,500,000 $1,500,000 - $17,408,519 Prior Appropriations $6,856,481 Grand Total $24,265,000
346

Install and Expand New Water and Sewer System Service
13 13
Project Description
These projects provide for the installation of residential or commercial water and sewer connections, water and sewer extensions and meter installation. Developer reimbursable projects are identified for the construction of water and sewer mains that benefit the developer and provide service for future growth.
Department Charlotte Water
Location Citywide
Council District Citywide
Priority Area Economic Development (Economy, Jobs, and Upward Mobility)
Budget Overview
Funding Category Proposed Planned FY 2020 FY 2021 FY 2022 FY 2023 FY 2024 TOTAL
Planning and Design $12,060,849 $12,942,676 $12,942,676 $13,173,976 $13,069,539 $64,189,716 Construction $28,141,981 $30,199,576 $30,199,576 $30,739,276 $30,495,591 $149,776,000 Total $40,202,830 $43,142,252 $43,142,252 $43,913,252 $43,565,130 $213,965,716 Prior Appropriations $465,012,375 Grand Total $678,978,091
347

Mitigate Impacts to Streams and Wetlands
1 1
Project Description
Stream and Wetland Mitigation Program This program supports city and county construction projects such as roads, buildings and airport additions by mitigating unavoidable stream and wetland impacts. This program ensures that the federally approved mitigation required is in place for these projects. Stream and wetland mitigation projects improve local surface waters.
Post Construction Stormwater Ordinance (PCSO) This mitigation program supports cost-effective and environmentally-protective public and private development and redevelopment projects. As these projects increase impervious surfaces, surface water impacts occur. Mitigation fee compliance options often reduce compliance costs and result in an environmentally preferable solution.
Department Storm Water Services
Location Citywide
Council District Citywide
Priority Area Economic Development (Economy, Jobs, and Upward Mobility)
Budget Overview
Funding Category Proposed Planned FY 2020 FY 2021 FY 2022 FY 2023 FY 2024 TOTAL
Planning and Design $500,000 $500,000 $500,000 $500,000 $500,000 $2,500,000 Construction $1,000,000 $1,000,000 $1,500,000 $1,500,000 $1,500,000 $6,500,000 Total $ 1,500,000 $1,500,000 $2,000,000 $2,000,000 $2,000,000 $9,000,000 Prior Appropriations $12,500,000 Grand Total $21,500,000
348

3 3
WELL-MANAGED GOVERNMENT
CAPITAL INVESTMENT PLAN

62 62
This page intentionally left blank.

Construct Capital Building Improvements
4 4
Project Description
This new program provides funding for capital building maintenance such as the replacement of roofs and mechanical systems, as well as facility expansions and capital renovations. This funding supports the priority area of Well-Managed Government by ensuring city-owned facilities are well-maintained, operating efficiently, and comfortable places for employees to work. PAYGO funding remains available for other, non-capital building maintenance needs such as carpet replacement and painting.
Department General Services
Location TBD
Council District TBD
Priority Area Well-Managed Government (Efficient, Effective, Accountable, Responsive, Inclusive, and Customer Focused)
Budget Overview
Funding Category Proposed Planned FY 2020 FY 2021 FY 2022 FY 2023 FY 2024 TOTAL
Planning and Design - - - - - - Construction $2,500,000 $2,500,000 $2,000,000 $2,000,000 $2,000,000 $11,000,000 Public Art - - - - - - Total $2,500,000 $2,500,000 $2,000,000 $2,000,000 $2,000,000 $11,000,000 Prior Appropriations $0 Grand Total $11,000,000
351

Install New Government Center Generators
5 5
Project Description
This project provides funding to purchase and install two new generators to serve the Charlotte-Mecklenburg Government Center (CMGC). The current emergency generators are at the end of their useful lives and need to be replaced to provide redundancy for building operations. The two generators will be replaced at the same time to ensure installation efficiency and safety.
Mecklenburg County is anticipated to reimburse the city for a portion of the total cost of the project per a CMGC contract that outlines responsibilities related to building improvements.
Department General Services
Location 600 East 4th Street
Council District 1
Priority Area Well-Managed Government (Efficient, Effective, Accountable, Responsive, Inclusive, and Customer Focused)
Budget Overview
Funding Category Proposed Planned FY 2020 FY 2021 FY 2022 FY 2023 FY 2024 TOTAL
Planning and Design $100,000 - - - - $100,000 Construction $2,100,000 - - - - $2,100,000 Public Art - - - - - - Total $2,200,000 - - - - $2,200,000 Prior Appropriations $0 Grand Total $2,200,000
352

Replace Government Center HVAC
6 6
Project Description
This funding will design, purchase, and install four major air handling units and associated duct work to serve the Charlotte-Mecklenburg Government Center. The current heating, ventilation, and air condition (HVAC) equipment is beyond its useful life and must be replaced to ensure proper heating, cooling, and air flow throughout the building. The planned funding over the next five years is consistent with the cash flow required for the project.
Mecklenburg County is anticipated to reimburse the city for a portion of the total cost of the project per a CMGC contract that outlines responsibilities related to building improvements.
Department General Services
Location 600 East 4th Street
Council District 1
Priority Area Well-Managed Government (Efficient, Effective, Accountable, Responsive, Inclusive, and Customer Focused)
Budget Overview
Funding Category Proposed Planned FY 2020 FY 2021 FY 2022 FY 2023 FY 2024 TOTAL
Planning and Design $1,500,000 - - - - $1,500,000 Construction - $5,460,000 $5,800,000 $6,100,000 $6,400,000 $23,760,000 Public Art - - - - - - Total $1,500,000 $5,460,000 $5,800,000 $6,100,000 $6,400,000 $25,260,000 Prior Appropriations $0 Grand Total $25,260,000
353

Repave Sweden Road Complex
7 7
Project Description
This funding will remedy the progressing pavement degradation at the city-owned Sweden Road facility, which is shared by one of General Services’ Fleet Maintenance facilities and Transportation's Southwest District Street Maintenance facility. Repaving also addresses functional concerns by improving parking utilization and equipment repair staging.
This project was originally included in the Adopted FY 2019 Budget with a project budget of $4.0 million. After further scope definition, the budget has been reduced to $2.0 million. The Adopted FY 2019 Budget planned for this project to be completed in FY 2021. Consistent with the new priority area of Well-Managed Government and the responsible maintenance of city-owned facilities, the project timeline has been advanced to FY 2020.
Department General Services and Transportation
Location 4600 Sweden Road
Council District 3
Priority Area Well-Managed Government (Efficient, Effective, Accountable, Responsive, Inclusive, and Customer Focused)
Budget Overview
Funding Category Proposed Planned FY 2020 FY 2021 FY 2022 FY 2023 FY 2024 TOTAL
Planning and Design $150,000 - - - - $150,000 Construction $1,850,000 - - - - $1,850,000 Public Art - - - - - - Total $2,000,000 - - - - $2,000,000 Prior Appropriations $0 Grand Total $2,000,000
354

Establish
Land Acquisition Program
8 8
Project Description
Establish a land acquisition program for the purchase of real estate for anticipated city needs. Consistent with the priority area of Well-Managed Government, this project provides opportunities to purchase properties strategically for upcoming projects as they become available on the market.
Department General Services
Location TBD
Council District TBD
Priority Area Well-Managed Government (Efficient, Effective, Accountable, Responsive, Inclusive, and Customer Focused)
Budget Overview
Funding Category Proposed Planned FY 2020 FY 2021 FY 2022 FY 2023 FY 2024 TOTAL
Land Acquisition $2,500,000 - $2,500,000 - $2,500,000 $7,500,000 Total $2,500,000 - $2,500,000 - $2,500,000 $7,500,000 Prior Appropriations $0 Grand Total $7,500,000
355

Implement ADA Transition Plan
9 9
Project Description
The city is currently undergoing a third-party assessment of all city-owned facilities for compliance with the federal Americans with Disabilities Act (ADA) standards. The assessment will produce an inventory of city-owned facilities that may pose barriers to ADA compliance. Projects will be prioritized in the city's Transition Plan. This program funding is planned to begin in FY 2022 when the Transition Plan is anticipated to be complete.
Department General Services
Location Citywide
Council District Citywide
Priority Area Well-Managed Government (Efficient, Effective, Accountable, Responsive, Inclusive, and Customer Focused)
Budget Overview
Funding Category Proposed Planned FY 2020 FY 2021 FY 2022 FY 2023 FY 2024 TOTAL
Planning and Design - $200,000 $200,000 $200,000 $200,000 $800,000 Construction - - $800,000 $800,000 $800,000 $2,400,000 Public Art - - - - - - Total - $200,000 $1,000,000 $1,000,000 $1,000,000 $3,200,000 Prior Appropriations $3,000,000 Grand Total $6,200,000
356

Maintain Transit Facilities
10 10
Project Description
Ensuring well-maintained facilities supports safe and dependable environments for residents, employees, and equipment. Projects could include new bus shelters, HVAC replacement, or construction of a new bus wash. These maintenance efforts support the State of Good Repair, which is required by the Federal Transit Administration.
Department Charlotte Area Transit System
Location Mecklenburg County/Citywide
Council District Citywide
Priority Area Well-Managed Government (Efficient, Effective, Accountable, Responsive, Inclusive, and Customer Focused)
Budget Overview
Funding Category Proposed Planned FY 2020 FY 2021 FY 2022 FY 2023 FY 2024 TOTAL
Construction $254,656 - - - - $254,656 Equipment $875,000 - - - - $875,000 Total $1,129,656 - - - - $1,129,656 Prior Appropriations $15,458,414 Grand Total $16,588,070
357

Maintain Transit Vehicles
11 11
Project Description
Maintaining transit vehicles could include bus replacements, Special Transportation Services vehicle replacements, vanpool replacements, or fleet expansions. Well-maintained, reliable transit vehicles help ensure safe, dependable, and accessible services for residents. These maintenance and replacement efforts support the State of Good Repair, which is required by the Federal Transit Administration.
Department Charlotte Area Transit System
Location Mecklenburg County/Citywide
Council District Citywide
Priority Area Well-Managed Government (Efficient, Effective, Accountable, Responsive, Inclusive, and Customer Focused)
Budget Overview
Funding Category Proposed Planned FY 2020 FY 2021 FY 2022 FY 2023 FY 2024 TOTAL
Equipment $10,746,761 $12,641,199 $11,613,344 $12,318,543 $12,714,889 $60,034,736 Total $10,746,761 $12,641,199 $11,613,344 $12,318,543 $12,714,889 $60,034,736 Prior Appropriations $71,426,472 Grand Total $131,461,208
358

Replace and Upgrade Field and Administrative Facilities
12 12
Project Description
Replace the Zone Four Field Operations facility and expand the Zone Two Field Operations facility at the Brookshire Boulevard campus to better meet customer needs. Field Operations facilities provide field offices for maintenance and repair crews, and contain a maintenance shop. The expanded Brookshire Boulevard campus will co-locate staff like customer service and engineering. It is anticipated that these facilities will be LEED-certified green facilities.
Department Charlotte Water
Location Various
Council District 1, 2, 3
Priority Area Well-Managed Government (Efficient, Effective, Accountable, Responsive, Inclusive, and Customer Focused)
Budget Overview
Funding Category Proposed Planned FY 2020 FY 2021 FY 2022 FY 2023 FY 2024 TOTAL
Planning and Design - $5,400,000 $6,600,000 - - $12,000,000 Construction - $12,600,000 $15,400,000 - - $28,000,000 Total - $18,000,000 $22,000,000 - - $40,000,000Prior Appropriations $16,500,000Grand Total $56,500,000
359
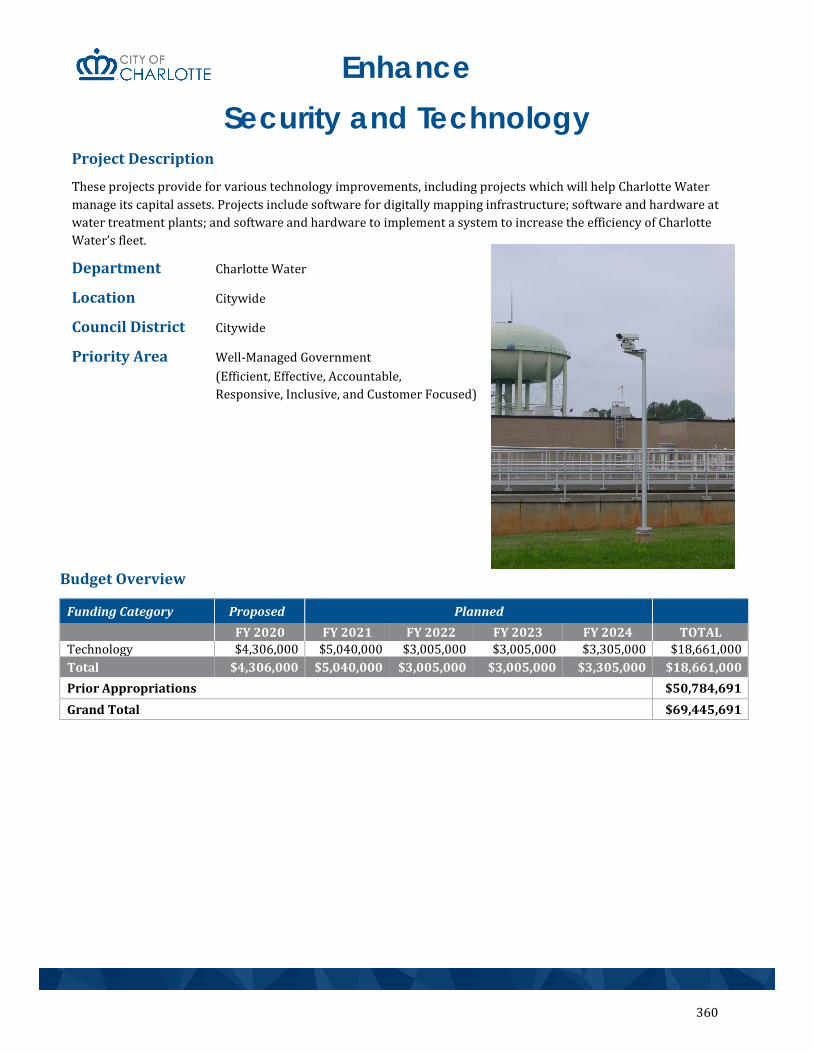
Enhance Security and Technology
13 13
Project Description
These projects provide for various technology improvements, including projects which will help Charlotte Water manage its capital assets. Projects include software for digitally mapping infrastructure; software and hardware at water treatment plants; and software and hardware to implement a system to increase the efficiency of Charlotte Water’s fleet.
Department Charlotte Water
Location Citywide
Council District Citywide
Priority Area Well-Managed Government (Efficient, Effective, Accountable, Responsive, Inclusive, and Customer Focused)
Budget Overview
Funding Category Proposed Planned FY 2020 FY 2021 FY 2022 FY 2023 FY 2024 TOTAL
Technology $4,306,000 $5,040,000 $3,005,000 $3,005,000 $3,305,000 $18,661,000 Total $4,306,000 $5,040,000 $3,005,000 $3,005,000 $3,305,000 $18,661,000 Prior Appropriations $50,784,691 Grand Total $69,445,691
360

6 6
USER FEES

62 62
This page intentionally left blank.

Proposed FY 2020 User Fees
1 1
User fees are costs charged to those who receive certain governmental services or use governmental facilities. These fees are categorized as regulatory or non-regulatory:
Regulatory user fees recoup costs associated with providing specific services that are required by law. These fees are associated with regulatory programs such as land use permits, subdivision reviews, dance hall licenses, and hazardous chemical permits.
• Effective July 1, 2005, City Council adopted a cost recovery policy in which the rate for each regulatory user fee shouldcover 100 percent of the cost to perform the service. The fully allocated cost recovery model includes direct and indirect costs. Staff time is an example of direct costs. Facility cost is an example of indirect costs.
• Included in the Proposed FY 2020 Budget is the continuation of the City Council’s Regulatory User Fee Policy of a fully allocated cost recovery rate of 100 percent for regulatory user fees. It includes a provision to allow the City Manager to recommend exceptions to the 100 percent regulatory user fee recovery for specific services as part of the annual budget process in order to:
1. Avoid significant jumps in price from year to year2. Ensure regulatory compliance3. Account for service costs that may include or be dedicated to public involvement
• Regulatory user fees are calculated based on the annual operating budget and are driven by the complexity of the service, number of units, occurrences and amount of staff time. Regulatory user fees may fluctuate from year to year because they are based on the annual operating budget.
• The appendix at the end of the User Fee section includes a detailed step-by-step example of the regulatory user fee cost recovery calculation.
Proposed FY 2020 Regulatory User Fee Highlights The city’s User Fee Ordinance requires the City Manager to notify City Council of any new or increased fees through the budget process. From July 2008 through June 2012, user fees remained flat to mitigate impacts from the economic decline. Effective July 1, 2012, City Council approved a multi-year approach to gradually return to the fully allocated cost recovery model for regulatory fees. In accordance with current Council direction, the Proposed FY 2020 User Fee schedule recovers 100 percent of costs for the majority of regulatory fees. However, the average cost recovery for the combined regulatory user fees decreased from 99.0 percent to 97.8 percent. The Proposed FY 2020 User Fees include a General Fund subsidy of 2.2 percent.
Summary of Recovery Rate for General Fund Regulatory User Fees
Department/Regulatory Service
FY 2018 Recovery
Rate
FY 2019 Recovery
Rate
FY 2020 Recovery
Rate
FY 2020 Subsidy
Rate 1 General Services: Land Development 100% 100% 100% 0.0%
2 Transportation: Land Development & Right-of-Way 100% 100% 99.0% 1.0%
3 Planning, Design & Development: Land Development, Rezoning, Subdivision, Urban Plan, and Zoning Administration 75.9% 97.0% 97.9% 2.1%
4 Fire: Fire Code and Plans Review 100% 100% 100% 0.0%
5 Police: Adult Businesses, Carnival, Dance Halls, and Passenger Vehicle For Hire 73.7% 86.7% 65.1% 34.9%
6 City Clerk’s Office: Legal Advertisements-Rezoning 100% 100% 100% 0.0%
Total Percentage (based on revenue projections) 93.8% 99.0% 97.8% 2.2% Note: Recovery rates for FY 2018 and FY 2019 for Planning, Design & Development do not include Land Development; they are reported as reported in the FY 2018 and FY 2019 Adopted Budgets. The recovery rate for FY 2020 includes Land Development fees.
The Proposed FY 2020 User Fees, along with the percentage of General Fund subsidy for regulatory fees, are included in the User Fee Schedule by department. New or restructured regulatory fees include the following:
o Planning, Design & Development (PDD) incorporated several fees from General Services to reflect the transfer of 22 FTEs from G.S. Land Development services to PDD in FY 2019 to form a citywide consolidated commercial and subdivision regulatory review team.
o Transportation created a new Pre-submittal fee for Right-of-Way Abandonment requests and consolidated parade permit fees from three to two fees.
363

Proposed FY 2020 User Fees
2 2
Non-regulatory user fees recoup costs associated with all other city services or facilities that are unrelated to regulations. These fees are associated with programs such as city-owned cemeteries and airport landing fees.
The fees associated with non-regulatory services are calculated using different methods than regulatory fees because City Council’s policy does not require non-regulatory fees to recover a specific percentage of the costs incurred by the city agency in the provision of the service. Aviation fees, for example, are based on negotiated contracts or to comply with federal requirements for the Airport to be financially self-sufficient. The goal for cemetery fees is to be competitive in the market while providing quality, affordable services, and stable perpetual care.
New non-regulatory fees include tenant background check and fingerprinting fees for Aviation, creating a stand-alone fee for cremains space in ground at Evergreen, creating a stand-alone fee for cremations and adult openings and closings on Saturdays, and separating cremation and traditional services for indigent burial services into two fees.
The following pages detail the rates for regulatory and non-regulatory user fees. This section also includes storm water fees and select water and sewer fees.
FY 2020 User Fee Highlights continued:
Regulatory Fees
1. General Services - Land Development• All Land Development fees are at 100 percent of fully-allocated costs• FY 2020 User Fees include:
o No new fees o Some existing staff are reallocated to enhancing development services and incorporated into user fees o Construction inspection services and fees are moved to Planning, Design, & Development.
2. Charlotte Department of Transportation - Land Development and Right-of-Way• FY 2020 User Fees include:
o No new FTEso One new fee
▪ Right-of-Way Pre-Submittal Meeting Fee
o The consolidation of the Parade Permit fee from three fees to two fees• General Fund subsidy for the following fees to avoid significant price increases from year to year:
o Food truck temporary infrastructure permit at 57.1 percento New annual valet parking permit at 41.1 percento Valet parking permit renewals at 42.9 percent
3. Planning, Design & Development Department – Land Development, Rezoning, Subdivision, UrbanPlan, and Zoning Administration
• FY 2020 User Fees include:o Fees moved to reflect movement of Land Development staff to Planning, Design & Development (PD&D)o Consolidated condo plat fee into final plat feeo Five new FTEs to manage rezoning petitions, preliminary and enhanced review processes, and review
and evaluate development for tree planting and preservation. ▪ Two Associate Planners ▪ Two Senior Principal Planners ▪ One Urban Forestry Specialist
o A General Fund subsidy for the following fees to account for service costs that may include or bededicated to public involvement or avoid significant jumps in price from year to year:▪ Conventional Rezoning at 15.0 percent ▪ Conditional Rezoning (Minor) at 15.0 percent▪ Conditional Rezoning (Major) at 15.0 percent
364

Proposed FY 2020 User Fees
3 3
FY 2020 User Fee Highlights continued:
4. Charlotte Fire Department - Fire Code and Plans Review
• All Fire fees are at 100 percent of fully-allocated costs.• FY 2020 User Fees remain the same as FY 2019
5. Charlotte-Mecklenburg Police Department – Adult Businesses, Carnivals, Dance Halls, and PassengerVehicle for Hire permits
• FY 2020 User Fees include: o No new FTEs and no new fees o The following fees are now at 100 percent cost recovery:
▪ Adult Business Background Check▪ Adult Business Building Design Change▪ Dance Hall Background Check
▪ Passenger Vehicle for Hire Vehicle Permito A General Fund subsidy for the following fees to ensure regulatory compliance and avoid significant
jumps in price from year to year:▪ Adult Business Application Fee at 26.6 percent▪ Adult Business License Fee at 26.3 percent ▪ Carnival Permit Fee at 36.7 percent▪ Dance Hall License – Application/Renewal Fee at 29.1 percent ▪ Dance Hall License – License Fee at 33.2 percent ▪ Dance Hall License – Building Design Change Fee at 54.2 percent▪ Passenger Vehicle for Hire – Company Certifications – Company Permit Fee at 27.8 percent▪ Passenger Vehicle for Hire – Company Certifications – Driver Application at 21.1 percent▪ Passenger Vehicle for Hire – Company Certifications – Transfer/Duplication Fee at 82.5 percent ▪ Passenger Vehicle for Hire – Reinstatement of Permit Fee at 47.5 percent
▪ Passenger Vehicle for Hire – Replace Vehicle Permit/Decal at 98.3 percent ▪ Passenger Vehicle for Hire – Transfer Vehicle Permit at 77.0 percent
6. City Clerk’s Office - Legal Advertisements for Rezoning Petitions• All City Clerk fees are at 100 percent of fully-allocated costs• No new fees or positions
7. Charlotte Water – Back Flow and Subdivision Plans Review/Inspection
• Fees are at 100 percent recovery for FY 2020• FY 2020 User Fees include:
o No new feeso Three new FTEs:
▪ One Engineering Assistant, one Construction Inspector, and one Construction Supervisor for
subdivision reviews and inspections
365

Proposed FY 2020 User Fees
4 4
FY 2020 User Fee Highlights continued:
Non-regulatory Fees
8. Aviation
• Airline fees are based on Aviation’s cost recovery model. FY 2020 non-regulatory fees include the following:o Airline Fees:
▪ Terminal rental rates, landing fees, common use gates/holdroom, common use ticket counter, international facility use, and loading bridge fees increase over FY 2019; however, baggage fees decrease 21.4 percent
and fuel through-put fees are unchanged from FY 2019.o Ground Transportation Operations:
▪ Fees for Transportation Network Companies increase to provide more effective cost recovery and to
align with other airports. All other fees are unchanged from FY 2019.o Parking Fees:
▪ Hourly parking deck rates, daily parking deck rates, long term lot, and all valet parking rates remain thesame as the current FY 2019 rates.
o Rental Rates: ▪ Ground rent and cargo facility rentals – warehouse rates are changing. However, rates for office, cargo-
facility rentals-office, and FBO hangar rates are unchanged from FY 2019.o Tenant Fees:
▪ Fees for ID cards, background checks, and fingerprinting are increasing.
9. City Clerk’s Office
• Voluntary Annexation Petition fee remains at $400.
10. General Services
• Most cemetery fees slightly increase to price services closer to private providers:o Open and closing fees increase an average of 10.4 percento Cremations and burials increase an average of 26.4 percento Disinternment and reinternment fees increase an average of 21.3 percento Sale of graves in city cemeteries increase an average of 37.9 percento Sale of amenities on a gravesite increase an average of 10.1 percent
• Some fees have been restructured in FY 2020:o Specific Saturday fees for adult opening and closings as well as cremationso Specific and slightly lower fee for the sale of cremain space in ground at Evergreen cemeteryo Separate fees for indigent traditional and cremation services
• Entombment fee eliminated• Public parking rates at the Charlotte Mecklenburg Parking Deck remain the same as in FY 2019.• Telecommunication tower fees remain the same as in FY 2019.
11. Planning, Design & Development
• Most fees related to the expedited and enhanced plan review program remain the same as in FY 2019.
12. Charlotte-Mecklenburg Police Department – Animal Care and Control
• Adoption fees remain unchanged from FY 2019 to encourage animal adoptions. • The canine neuter fee was separated from the canine spay fee and increased to $70 from $65.
366

Proposed FY 2020 User Fees
5 5
FY 2020 User Fee Highlights continued:
13. Solid Waste Services
• Fees for annual solid waste disposal for multi-family and single-family collection increase by $12.00, from $46.06 to
$58.06. • Small Business solid waste fee remains unchanged. • Veterinary Dead Animal Collection service and fee is eliminated.
14. Charlotte Department of Transportation
• Land Development expedited review remains at $1,000. • Off-Duty Police Officer Permits remain unchanged.• Parking Permits for Third and Fourth Ward residents remain unchanged. • Parking meter rates remain unchanged.
15. Charlotte Water
• Charlotte Water Land Development Expedited Review remains at $6,810.
Other Fees
16. Storm Water Fees
• Storm Water fees remain unchanged from FY 2019.
17. Charlotte Water – Water and Sewer Fees
• The fixed administrative billing charge per month increases from $4.45 to $4.73 for both water and sewer service.• The availability fee charge per month decreases from $2.95 to $1.24 for water and increases from $7.39 to $8.37 for
sewer service. • The water volume tier and non-residential rates remain unchanged from FY 2019.• The sewer volume rate increases from $4.65 to $4.99 per ccf (ccf = 100 cubic feet) for all sewer customers.• The connection fee increases from $2,328 to $3,197 for residential water and from $3,428 to $5,035 for residential
sewer. • The system development fee increases from $610 to $809 for residential water and from $1,848 to $2,541 for
residential sewer. • The typical monthly total water and sewer bill for residential customers is estimated to be $66.82 in FY 2020, an
average increase of $2.21 per month. • The typical bill assumes 5,236 gallons or seven ccf used each month. Based on the current rate structure, users
consuming more than the typical level of consumption are charged a higher rate to encourage conservation andresponsible use of this resource.
367

Proposed FY 2020 User Fees
6 6
General Services
1. Regulatory Fees: Land Development Basis FY 2019 FY 2020 %
Change % Subsidy
As-Built for Subdivisions > 2 years from approval date Per As-Built $785 $1,000 27.4 % 0.0 %
Commercial Plan Review Per project $2,165 $1,025 -52.7 % 0.0 %
Detention/Drainage Plan Review 4 Per project + denuded acre $940 + $100
$1,005 + $100 6.9 % 0.0 %
Grading/Erosion Control Permit 1 Per project + per acre
$3,425 + $100
$3,910 + $100 14.1 % 0.0 %
Major Commercial Subdivision Review 3, 4 Per project + denuded acre
$4,740 + $100
$2,925 + $100 -38.3 % 0.0 %
Major Residential Subdivision Review 1, 2, 3, 4 Per project + per acre
$5,700 + $100
$2,875 + $100 -49.6 % 0.0 %
Minor Administrative Review Per project $500 $280 -44.0 % 0.0 % Minor Residential Subdivision (without streets) and Final Plat Per project $835 $735 -12.0 % 0.0 % Revision to Approved Plan (Administrative Review)/Administrative Fee Per project $860 $750 -12.8 % 0.0 % Rezoning Staff Review 4 Per project $440 $255 -42.0 % 0.0 % Sketch Plan Review Per project $210 $330 57.1 % 0.0 %
Urban Design Plan Review and Inspection Per As-Built $2,920 $1,700 -41.8 % 0.0 % 1Grading, detention, and subdivision fees are based on exact acre. Fees are computed by adding the project fee and per acre fee. 2 Major subdivision includes Single-Family, Multi-Family, and Mixed-Use. 3Major subdivision costs are based on total acreage; commericial subdivision based on denuded acreage. 4FY 2019 fees include construction inspection services and fees. In FY 2020 these services are moved to Planning, Design, & Development.
368

Proposed FY 2020 User Fees
7 7
Charlotte Department of Transportation
2. Regulatory Fees: Land Development and Right-of-Way FY 2019 FY 2020 % Change % Subsidy
A. Land Development Permits and Fees:
Commercial Building/Driveway Permit/Site Plan* $700 $700 0.0 % 0.0 %
Rezoning - Minor* $870 $870 0.0 % 0.0 %
Rezoning - Major* $4,500 $4,745 5.4 % 0.0 %
Subdivision Processing* $1,100 $1,420 29.1 % 0.0 %
Urban Reviews $1,775 $1,775 0.0 % 0.0 %
B. Right-of-Way Permits:
Festival Permits:
Single Day $800 $800 0.0 % 0.0 % Multi-Day (a permit is required for each day for the duration of the event) $1,200 $1,500 25.0 % 0.0 %
Parade Permits:
Small< 1,000 attendees $200 $225 12.5 % 0.0 %
Large > 1,000 attendees $1,200 $1,550 29.2 % 0.0 %
Right-of-Way (ROW)
Right-of-Way Abandonment Pre-Submittal Administrative Fee $0 $250 N/A 0.0 %
Right-of-Way Abandonment (one street/alleyway) $3,500 $3,895 11.3 % 0.0 %
Right-of-Way Abandonment (additional street/alleyway) $1,675 $2,000 19.4 % 0.0 %
Right-of-Way Encroachment $1,840 $1,840 0.0 % 0.0 %
Temporary Infrastructure Permit
Parklets, art, decorative items, cabinets, filming activities, and little libraries $150 $150 0.0 % 0.0 %
Food trucks $150 $300 100.0 % 57.1 %
Sidewalk Dining Permit $950 $1,350 42.1 % 0.0 %
Valet Parking Permits
New Annual Permit $250 $500 100.0 % 41.1 %
Permit Renewals $100 $200 100.0 % 42.9 %
Temporary Permit $150 $150 0.0 % 0.0 % * Transportation's portion; additional fees collected by Planning, Design & Development
369

Proposed FY 2020 User Fees
8 8
Planning, Design, & Development 3. Regulatory Fees: Land Development, Rezoning, Subdivision, Urban Plan, and Zoning Administration FY 2019 FY 2020 % Change % Subsidy A. Rezoning:
Conventional $2,110 $2,550 20.9 % 15.0 %
Conditional (Minor) $3,530 $4,370 23.8 % 15.0 %
Conditional (Major) $6,800 $8,320 22.4 % 15.0 %
Text Amendment $1,500 $1,500 0.0 % 0.0 %
Amended Site Plan Approval $525 $550 4.8 % 0.0 %
Administrative Zoning Services (Sign Flex Option) $250 $280 12.0 % 0.0 %
B. Subdivision and Commercial Reviews and Inspections:
Minor Administrative $250 $280 12.0 % 0.0 %
Commercial Inspection $1,190 $1,010 -15.1 % 0.0 %
Detention Inspection $105 $115 9.5 % 0.0 %
Land Development Staff Rezoning $2,210 $1,100 -50.2 % 0.0 %
Commercial Tree Ordinance Review and Inspection$1,290+ 10/tree
$1,645+ 10/tree 27.5 % 0.0 %
Commercial Tree Preservation $1,350 $1,620 20.0 % 0.0 %
Residential Tree Ordinance and Preservation Review and Inspection $2,200 $3,080 40.0 % 0.0 %
Single Family Hold Release Inspection $70 $80 14.3 % 0.0 %
Preliminary Single-family (Streets) and Inspections $5,325 $5,955 11.8 % 0.0 %
Preliminary Non-Residential and Inspections $2,945 $3,580 21.6 % 0.0 %
Preliminary Plan Revisions and Inspections $1,175 $1,080 -8.1 % 0.0 %
Final Plats $700 $1,200 71.4 % 0.0 %
Final Plats Revision $265 $720 171.7 % 0.0 %
Not Subject Plats $195 $400 105.1 % 0.0 %
Planned Multi-Family Review and Inspection $5,770 $7,095 23.0 % 0.0 %
Sketch Plan Review $500 $585 17.0 % 0.0 %
Street Exceptions $590 $580 -1.7 % 0.0 %
Commercial Zoning Reviews1 $125 to $1,290 $160 to $1,625 N/A 0.0%
Variances & Appeals $2,500 $5,000 100.0 % 0.0 %
C. Urban Plan Review:
Urban Plan Review and Inspection $3,035 $3,615 19.1 % 0.0 %
Urban Plan Review - Minor Revision $260 $260 0.0 % 0.0 %
D. Zoning Administration:
Appeals (Residential) $260 $370 42.3 % 0.0 %
Appeals (Non-Residential) $510 $1,360 166.7 % 0.0 %
Variances (Residential) $735 $760 3.4 % 0.0 %
Variances (Non-Residential) $1,650 $1,650 0.0 % 0.0 %
Administrative Deviation (Residential) $255 $285 11.8 % 0.0 %
Administrative Deviation (Non-Residential) $465 $555 19.4 % 0.0 %
Residential Single Family Reviews $50 $85 70.0 % 0.0 %
Sign permits $110 $175 59.1 % 0.0 %
Verification Letters $65 $175 169.2 % 0.0 %
Zoning Use Permits $175 $270 54.3 % 0.0 %
E. Historic District Review:
Minor Review $555 $570 2.7 % 0.0 %
Major Review $1,125 $1,165 3.6 % 0.0 %
Major Review (with survey) $1,075 $1,075 0.0 % 0.0 % 1Construction costs of $1 to $3,000 = $195; $3001 to $50,000 = $310; $50,001 to $100,000 = $740; $100,001 to $1,000,000 = $1,550; over $1,000,000 = $1,625. RTAP/RTAC = $300. CTAC = $160.
Some construction inspection services and fees were moved from General Services to Planning, Design, & Development in FY 2019. Fees in this section incorporate other realignments of services and staff. For comparison purposes, FY 2019 fees are estimated and may not match fee data published in the adopted FY 2019 budget.
370
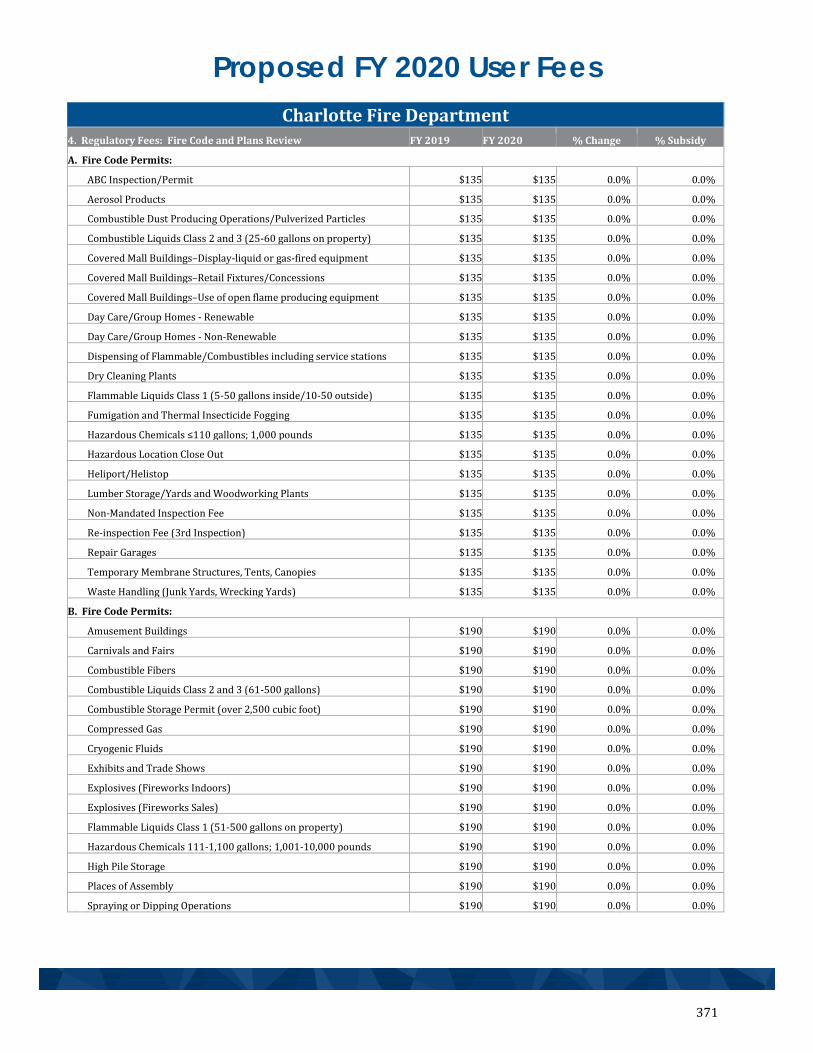
Proposed FY 2020 User Fees
9 9
Charlotte Fire Department 1
4. Regulatory Fees: Fire Code and Plans Review FY 2019 FY 2020 % Change % Subsidy 1
A. Fire Code Permits: 1
ABC Inspection/Permit $135 $135 0.0 % 0.0 % 1
Aerosol Products $135 $135 0.0 % 0.0 % 1
Combustible Dust Producing Operations/Pulverized Particles $135 $135 0.0 % 0.0 % 1
Combustible Liquids Class 2 and 3 (25-60 gallons on property) $135 $135 0.0 % 0.0 % 1
Covered Mall Buildings–Display-liquid or gas-fired equipment $135 $135 0.0 % 0.0 % 1
Covered Mall Buildings–Retail Fixtures/Concessions $135 $135 0.0 % 0.0 % 1
Covered Mall Buildings–Use of open flame producing equipment $135 $135 0.0 % 0.0 % 1
Day Care/Group Homes - Renewable $135 $135 0.0 % 0.0 % 1
Day Care/Group Homes - Non-Renewable $135 $135 0.0 % 0.0 % 1
Dispensing of Flammable/Combustibles including service stations $135 $135 0.0 % 0.0 % 1
Dry Cleaning Plants $135 $135 0.0 % 0.0 % 1
Flammable Liquids Class 1 (5-50 gallons inside/10-50 outside) $135 $135 0.0 % 0.0 % 1
Fumigation and Thermal Insecticide Fogging $135 $135 0.0 % 0.0 % 1
Hazardous Chemicals ≤110 gallons; 1,000 pounds $135 $135 0.0 % 0.0 % 1
Hazardous Location Close Out $135 $135 0.0 % 0.0 % 1
Heliport/Helistop $135 $135 0.0 % 0.0 % 1
Lumber Storage/Yards and Woodworking Plants $135 $135 0.0 % 0.0 % 1
Non-Mandated Inspection Fee $135 $135 0.0 % 0.0 % 1
Re-inspection Fee (3rd Inspection) $135 $135 0.0 % 0.0 % 1
Repair Garages $135 $135 0.0 % 0.0 % 1
Temporary Membrane Structures, Tents, Canopies $135 $135 0.0 % 0.0 % 1
Waste Handling (Junk Yards, Wrecking Yards) $135 $135 0.0 % 0.0 % 1
B. Fire Code Permits: 1
Amusement Buildings $190 $190 0.0 % 0.0 % 1
Carnivals and Fairs $190 $190 0.0 % 0.0 % 1
Combustible Fibers $190 $190 0.0 % 0.0 % 1
Combustible Liquids Class 2 and 3 (61-500 gallons) $190 $190 0.0 % 0.0 % 1
Combustible Storage Permit (over 2,500 cubic foot) $190 $190 0.0 % 0.0 % 1
Compressed Gas $190 $190 0.0 % 0.0 % 1
Cryogenic Fluids $190 $190 0.0 % 0.0 % 1
Exhibits and Trade Shows $190 $190 0.0 % 0.0 % 1
Explosives (Fireworks Indoors) $190 $190 0.0 % 0.0 % 1
Explosives (Fireworks Sales) $190 $190 0.0 % 0.0 %
Flammable Liquids Class 1 (51-500 gallons on property) $190 $190 0.0 % 0.0 % 1
Hazardous Chemicals 111-1,100 gallons; 1,001-10,000 pounds $190 $190 0.0 % 0.0 % 1
High Pile Storage $190 $190 0.0 % 0.0 % 1
Places of Assembly $190 $190 0.0 % 0.0 % 1
Spraying or Dipping Operations $190 $190 0.0 % 0.0 % 1
371
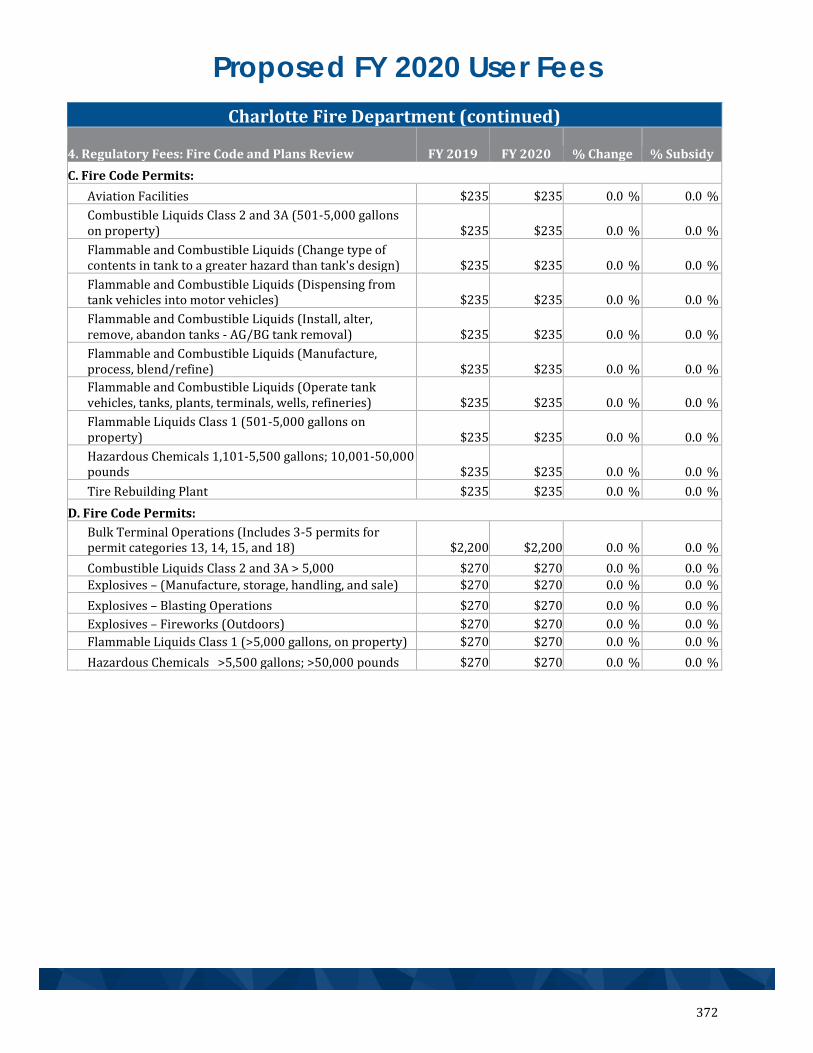
Proposed FY 2020 User Fees
10 10
Charlotte Fire Department (continued)
4. Regulatory Fees: Fire Code and Plans Review FY 2019 FY 2020 % Change % Subsidy
C. Fire Code Permits:
Aviation Facilities $235 $235 0.0 % 0.0 %
Combustible Liquids Class 2 and 3A (501-5,000 gallons on property) $235 $235 0.0 % 0.0 %
Flammable and Combustible Liquids (Change type of contents in tank to a greater hazard than tank's design) $235 $235 0.0 % 0.0 %
Flammable and Combustible Liquids (Dispensing from tank vehicles into motor vehicles) $235 $235 0.0 % 0.0 %
Flammable and Combustible Liquids (Install, alter, remove, abandon tanks - AG/BG tank removal) $235 $235 0.0 % 0.0 %
Flammable and Combustible Liquids (Manufacture, process, blend/refine) $235 $235 0.0 % 0.0 %
Flammable and Combustible Liquids (Operate tank vehicles, tanks, plants, terminals, wells, refineries) $235 $235 0.0 % 0.0 %
Flammable Liquids Class 1 (501-5,000 gallons on property) $235 $235 0.0 % 0.0 %
Hazardous Chemicals 1,101-5,500 gallons; 10,001-50,000 pounds $235 $235 0.0 % 0.0 %
Tire Rebuilding Plant $235 $235 0.0 % 0.0 %
D. Fire Code Permits:
Bulk Terminal Operations (Includes 3-5 permits for permit categories 13, 14, 15, and 18) $2,200 $2,200 0.0 % 0.0 %
Combustible Liquids Class 2 and 3A > 5,000 $270 $270 0.0 % 0.0 %
Explosives – (Manufacture, storage, handling, and sale) $270 $270 0.0 % 0.0 %
Explosives – Blasting Operations $270 $270 0.0 % 0.0 %
Explosives – Fireworks (Outdoors) $270 $270 0.0 % 0.0 %
Flammable Liquids Class 1 (>5,000 gallons, on property) $270 $270 0.0 % 0.0 %
Hazardous Chemicals >5,500 gallons; >50,000 pounds $270 $270 0.0 % 0.0 %
372

Proposed FY 2020 User Fees
11 11
Charlotte Fire Department (continued) 1
4. Regulatory Fees: Fire Code and Plans Review continued FY 2019 FY 2020 % Change % Subsidy 1
E. Plans Review: 1
Fire Alarm Plans (Shop drawings) $135 $135 0.0 % 0.0 % 1
Fire Sprinkler Plans (Shop drawings) $135 $135 0.0 % 0.0 % 1
Interactive Review $70 $70 0.0 % 0.0 %
Hydrant Test $170 $170 0.0 % 0.0 % 1
Multi-family $270 $270 0.0 % 0.0 % 1
Performance Tests - Automatic fire-extinguishing systems (Hood systems, halon systems, pre-action systems in computer rooms or alternatives) $170 $170 0.0 % 0.0 % 1
Performance Tests - Fire Alarm (Shell) (Smoke evacuation, atriums, and smoke detection systems) $270 $270 0.0 % 0.0 % 1
Performance Tests - Fire Alarm (Upfit) $135 $135 0.0 % 0.0 % 1
Performance Tests - Fire pumps $205 $205 0.0 % 0.0 % 1
Performance Tests - Private fire hydrants $170 $170 0.0 % 0.0 % 1
Performance Tests - Sprinkler System (13R, drain test, etc.) $205 $205 0.0 % 0.0 % 1
Performance Tests - Standpipe system tests $440 $440 0.0 % 0.0 % 1
Plans Review-Construction <$50,000 $205 $205 0.0 % 0.0 % 1
Plans Review-Construction $50,001 to $100,000 $235 $235 0.0 % 0.0 % 1
Plans Review-Construction $100,001 to $500,000 $270 $270 0.0 % 0.0 % 1
Plans Review-Construction $500,001 to $1,000,000 $340 $340 0.0 % 0.0 % 1
Plans Review-Construction $1,000,001 to $5,000,000 $575 $575 0.0 % 0.0 % 1
Plans Review-Construction $5,000,001 to $10,000,000 $880 $880 0.0 % 0.0 % 1
Plans Review-Construction > than $10,000,000 $1,350 $1,350 0.0 % 0.0 % 1
Mega/HCDT (Phased, Mixed-Use, and Design Build Projects) $2,700 $2,700 0.0 % 0.0 %
Rezoning Petitions - Major $70 $70 0.0 % 0.0 %
Rezoning Petitions - Minor $35 $35 0.0 % 0.0 % 1
F. State-Mandated Inspections (by square foot): 1
0 - 2,499 square feet $50 $50 0.0 % 0.0 % 1
2,500 - 4,499 square feet $60 $60 0.0 % 0.0 % 1
4,500 - 7,999 square feet $70 $70 0.0 % 0.0 % 1
8,000 - 15,999 square feet $90 $90 0.0 % 0.0 % 1
16,000 - 49,999 square feet $100 $100 0.0 % 0.0 % 1
50,000 - 99,999 square feet $135 $135 0.0 % 0.0 % 1
100,000 - 499,999 square feet $270 $270 0.0 % 0.0 % 1
500,000 + square feet $305 $305 0.0 % 0.0 %
Apartment Building with Direct Egress $50 $50 0.0 % 0.0 % 1
Interior Suite or Floor $35 $35 0.0 % 0.0 % 1
Parking Decks $70 $70 0.0 % 0.0 % 1
First Reinspection Fee $20 $20 0.0 % 0.0 %
Vacant Buildings $45 $45 0.0 % 0.0 % 1
373

Proposed FY 2020 User Fees
12 12
Charlotte-Mecklenburg Police Department 1
5. Regulatory Fees: Adult Business, Carnival, DanceHall, and Passenger Vehicle for Hire FY 2019 FY 2020 % Change % Subsidy
1
A. Adult Business Fees: 1
Application Fee $3,345 $3,580 7.0 % 26.6 % 1
Background Check Fee $20 $25 25.0 % 0.0 % 1
Building Design Change Fee $1,435 $1,435 0.0 % 0.0 % 1
License Fee $1,205 $1,290 7.1 % 26.3 % 1
B. Carnival Permit Fee: 1
Carnival Permit Fee $925 $990 7.0 % 36.7 % 1
C. Dance Hall License Fees: 1
Application/Renewal Fee $2,765 $2,960 7.1 % 29.1 % 1
License Fee $975 $1,045 7.2 % 33.2 % 1
Background Check Fee $10 $35 250.0 % 0.0 % 1
Building Design Change Fee $1,340 $1,435 7.1 % 54.2 % 1
D. Passenger Vehicle for Hire Fees: 1
Company Certifications Fees: 1
Company Permit Fee $510 $545 6.9 % 27.8 %
Late Renewal Charge (per day)1 $100 $100 0.0 % 0.0 % 1
Driver/Chauffeur Fees: 1
Driver Application (New/Renewal) $70 $75 7.1 % 21.1 %
Driver/Chauffeur Permit Fee2 $15 $15 0.0 % 0.0 %
Transfer/Add/Replace/Duplication Fee $80 $85 6.3 % 82.5 %
Reinstatement of Permit Fee $145 $155 6.9 % 47.5 % 1
Vehicle Fees: 1
Vehicle Permit Fee $15 $20 33.3 % 0.0 %
Replace Vehicle Permit/Decals $50 $55 10.0 % 98.3 % 1
Transfer Vehicle Permit $160 $170 6.3 % 77.0 % 1
Note 1: Penalty; not a regulatory fee 1
Note 2: Fee regulated by North Carolina General Statutes 1
City Clerk's Office 6. Regulatory Fees: Legal Advertisements FY 2019 FY 2020 % Change % Subsidy
Legal Advertisements for Rezoning Petitions* $270 $270 0.0 % 0.0 % *Clerk's legal advertisement fee is currently charged per petitioner. Fee also applies for reposting ofadvertisement, after second deferral. Fee is collected by Planning, Design, & Development.
374

Proposed FY 2020 User Fees
13 13
Charlotte Water 7. Regulatory Fees: PlansReview/Inspection Fees FY 2019 FY 2020 % Change % Subsidy
Backflow Review: Plan Review $188 $276 46.8% 0.0%
Backflow Inspection: Per Inspection $199 $284 42.7% 0.0%
Subdivision Review: Project Initiation $374 $395 5.6% 0.0%
Subdivision Plan Review: Per Linear Foot $1.73 $1.85 6.9% 0.0%
Subdivision Inspection: Per Linear Foot $3.25 $4.13 27.1% 0.0%
375

Proposed FY 2020 User Fees
14 14
Charlotte-Douglas International Airport 1
8. Non-Regulatory Fees:Aviation Fees Basis FY 2019 FY 2020 % Change
1
Airline Fees: 1
Landing Fees Per 1,000 pounds total landing weight $1.03 $1.06 2.9 % 1
Terminal Rental Rates Per square foot $46.74 $51.37 9.9 % 1
Common Use Gate /Holdroom: 1
Signatory CarrierPer available seat delivered $1.02 $1.04 2.0 % 1
Non-Signatory CarrierPer available seat delivered $1.29 $1.47 14.0 % 1
Common Use Ticket Counter Per hour used $23.69 $25.10 6.0 %
Baggage Fee Per bag $1.03 $0.81 -21.4 %
International Facility UsePer deplaned passenger $5.92 $6.26 5.7 % 1
Loading Bridge Fee Annual Fee $43,576 $44,503 2.1 %
Fuel through-put (fees for ground service equipment) Per gallon delivered $0.08 $0.08 0.0 % 1
Aircraft Ramp Parking: 1
0-3 hours Up to 3 hours $50.00 $50.00 0.0 % 1
>3-24 hours >3 and up to 24 hours $100.00 $100.00 0.0 % 1
Cargo Ground Handling % of gross revenue 8.00 % 8.00 % 0.0 % 1
Ground Transportation Operators: 1
1 Off Airport Rent-A-Cars % of gross revenue 10.00 % 10.00 % 0.0 % 1
1 Off Airport Parking % of gross revenue 10.00 % 10.00 % 0.0 % 1
Rental Car Concessions % of gross revenue 10.00 % 10.00 % 0.0 %
Hotel/Motel Courtesy Vans Annually per vehicle $500.00 $500.00 0.0 % 1
Commercial Courier Vehicles Per trip through lane $1.50 $1.50 0.0 % 1
Transportation Network Companies (TNCs) Per trip through lane $1.50 $3.25 116.7 %
Contract Vans or Limos Per trip through lane $1.50 $1.50 0.0 % 1
Parking Fees: 1
Hourly Deck ($20.00 daily maximum) Free first hour Per half hour $1.00 $1.00 0.0 % 1
Daily Deck and Daily North ($10.00 daily maximum) 0-1 hour $1.00 $1.00 0.0 % 1
Long Term Lots Daily maximum $7.00 $7.00 0.0 % 1
1 Curbside Valet ($35.00 daily maximum) Per half hour
$10 for 1st 1/2 hr; $2 for additional 1/2 hr
$10 for 1st 1/2 hr; $2 for additional 1/2 hr 0.0 % 1
1 Business Valet ($14.00 daily maximum) Per half hour
$5 for 1st 1/2 hr; $1 for additional 1/2 hr
$5 for 1st 1/2 hr; $1 for additional 1/2 hr 0.0 % 1
Cell Phone Lot N/A No Charge No Charge 0.0 % 1
376

Proposed FY 2020 User Fees
15 15
Charlotte-Douglas International Airport (continued) 8. Non-Regulatory Fees: AviationFees
Basis FY 2019 FY 2020 % Change
Rental Rates:
Ground Rent Per acre $8,000-$18,000 $12,000-$15,000 N/A
Warehouse/Office Rent Per square foot $5.92-7.46 $5.92-$7.46 0.0 %
Office Rent Per square foot $14.33 $14.33 0.0 %
Cargo Facility Rentals-Warehouse Per square foot $5.00-$7.70 $3.00-$7.70 N/A
Cargo Facility Rentals-Office Per square foot $8.25-$11.50 $8.25-$11.50 0.0 %
FBO Hangar Rentals Per square foot $9.00-$19.95 $9.00-$19.95 0.0 %
Tenant Fees:
Airport Identification Cards Per card $15 $35 133.3 %
Background Check Per Badge Issued $11 $13 18.2 %
Fingerprinting Per Application $27 $32 18.5 %
Employee Parking Cards Per card $420 $420 0.0 %
City Clerk's Office 9. Non-Regulatory Fees - Voluntary AnnexationPetition FY 2019 FY 2020 % Change
Voluntary Annexation Petition Fee $400 $400 0.0 %
377

Proposed FY 2020 User Fees
16 16
General Services 10a. Non-Regulatory Fees: Cemetery Fees FY 2019 FY 2020 % Change
Opening and Closing Fees - Adult
Weekdays $1,000 $1,100 10.0 %
Weekdays after 3:30 p.m. $1,500 $1,600 6.7 %
Saturdays $1,500 $2,250 50.0 %
Sunday and Holidays $2,000 $2,500 25.0 %
Indigent (Catholic Social Services-Weekdays) Traditional $300 $400 33.3 %
Indigent (Catholic Social Services-Weekdays) Cremation $200 $200 0.0 %
Opening and Closing Fees - Infant/Child (up to 3 feet):
Weekdays $400 $400 0.0 %
Weekdays after 3:30 p.m. and Saturday $600 $600 0.0 %
Sunday and Holidays $800 $800 0.0 %
Indigent (Catholic Social Services-Weekdays) Traditional $200 $200 0.0 %
Indigent (Catholic Social Services-Weekdays) Cremation $100 $100 0.0 %
Cremations (burial) (In-ground):
Weekdays $500 $500 0.0 %
Weekdays after 3:30 p.m. $700 $700 0.0 %
Saturdays $700 $1,000 42.9 %
Sunday and Holidays $900 $1,250 38.9 %
Second Right of Interment $500 $750 50.0 %
Disinterment:
Adult $2,000 $3,000 50.0 %
Infant/Child (up to 3 feet) $800 $1,000 25.0 %
Reinternment:
Adult $1,000 $1,100 10.0 %
Infant/Child (up to 3 feet) $400 $400 0.0 %
Sale of Grave Spaces:
Sale of Grave-Adult (Oaklawn, North Pinewood and West Pinewood) $1,000 $1,200 20.0 %
Sale of Grave-Adult (Elmwood, Ninth Street, and Pinewood) $1,600 $2,500 56.3 %
Sale of Grave-Adult (Evergreen) $1,200 $1,600 33.3 %
Sale of Grave-Infant $500 $600 20.0 %
Sale of Cremain Space In Ground (Elmwood, Ninth Street, and Pinewood) $600 $1,200 100.0 %
Sale of Cremain Space In Ground (Evergreen) $600 $900 50.0 %
Sale of Cremain Space In Ground (Oaklawn, North Pinewood, and West Pinewood) $600 $800 33.3 %
Sale of Cremain Single Space In Niche (Evergreen) $800 $1,000 25.0 %
Sale of Cremain Double Space in Niche (Evergreen) $1,200 $1,400 16.7 %
Perpetual Care Charge (one-time fee per grave space) 20% 20% 0.0 %
Perpetual Care Mausoleum Charge (per space) 50% 50% 0.0 %
Ossuary Burial for Cremation $150 $300 100.0 %
Amenities:
Flower Vase Installation $85 $100 17.6 %
Non-Permanent Burial Container/Adult $300 $300 0.0 %
Lettering of Niche Cover - Evergreen (two lines/name-date) $250 $350 40.0 %
Tent, Chair, or Cremation Setup $500 $500 0.0 %
Sale and Installation of City Vase $150 $200 33.3 %
Monument Foundation Construction (per square inch) $1.00 $1.00 0.0 %
Marker Installation (per square inch) $1.00 $1.00 0.0 %
Special Request maintenance per hour fee $50 $150 200.0 %
Transfer Burial Rights $100 $100 0.0 %
378

Proposed FY 2020 User Fees
17 17
General Services 10b: Non-Regulatory Fees: Land Development FY 2019 FY 2020 % Change
Letter of Intent $500 per project $560 per project 12.0 %
General Services 10c. Non-Regulatory: Public and Employee Parking Fees FY 2019 FY 2020 % Change
Employee Parking $25/Month $25/Month 0.0 %
Public Parking:
First 1/2 hour $1.50 $1.50 0.0 %
Additional time (1/2 hour increments) $1.50 $1.50 0.0 %
Maximum per day $15.00 $15.00 0.0 %
After Hours and Weekends:
Weekends Fri 7 p.m. - Mon 7 a.m. N/A Same as weekday N/A Same as weekday 0.0 %
General Services 10d. Non-Regulatory Fees: Telecommunication Tower Lease FY 2019 FY 2020 % Change
New lease:
Application Fee $500 $500 0.0 %
Installation/Inspection $5,000 $5,000 0.0 %
Closeout Documentation $2,500 $2,500 0.0 %
Lease Extension:
Application Fee $500 $500 0.0 %
Lease Extension $5,000 $5,000 0.0 %
Lease Amendment/Modification:
Application Fee $500 $500 0.0 %
Amendment/Modification $5,000 $5,000 0.0 %
Installation/Inspection $5,000 $5,000 0.0 %
Closeout Documentation $2,500 $2,500 0.0 %
Lease Termination:
Lease Termination $5,000 $5,000 0.0 %
379

Proposed FY 2020 User Fees
18 18
Planning, Design & Development
11: Non-Regulatory Fees: Land Development FY 2019 FY 2020 % Change Bond Administration Service $590/per surety posted,
extension, reduction, renewal, replacement, or release
$650/per surety posted, renewal, replacement, adjustment or release
10.2 %
Expedited Presubmittal Meeting $500 per meeting $560 per meeting 12.0 %
Expedited Minor Plat $1,000 $1,000 0.0 %
Expedited Revised Plat $1,000 $1,000 0.0 %
Expedited Final Plat $1,000 $1,000 0.0 % Expedited Plan RTAP/Commercial Review $5,000 per project $5,000 per project 0.0 %
Expedited Asbuilt Plan Review $2,500 per project $2,500 per project 0.0 %
Enhanced Plan Review $30,000 per project $30,000 per project 0.0 %
Tree Ordinance Payment in Lieu Fee $80,100 per acre $80,100 per acre 0.0 %
380

Proposed FY 2020 User Fees
19 19
Charlotte-Mecklenburg Police Department
12. Non-Regulatory Fees: Animal Care andControl Fees FY 2019 FY 2020 % Change Animal Control Adoption Fees:
Adult Dog/Cat $30 $30 0.0 %
1 Adult Dog/Cat for Senior Citizen 62 and older No Charge No Charge 0.0 %
Puppy/Kitten $30 $30 0.0 %
1 Puppy/Kitten for Senior Citizen 62 and older No Charge No Charge 0.0 %
1 Rescue Group Dog/Cat Approved Adoption No Charge No Charge 0.0 %
0 - 3 feet Snake $25 $25 0.0 %
> 3 - 6 feet Snake $50 $50 0.0 %
>6 feet Snake $75 $75 0.0 %
Small Pot Belly Pig $25 $25 0.0 %
Medium Pot Belly Pig $15 $15 0.0 %
Large Pot Belly Pig $5 $5 0.0 %
Rats $2 $2 0.0 %
Mice $1 $1 0.0 %
Hamster/Gerbil $3 $3 0.0 %
Chinchilla $35 $35 0.0 %
Guinea Pigs $5 $5 0.0 %
Rabbits $5 $5 0.0 %
Chickens $2 $2 0.0 %
Turkeys $5 $5 0.0 %
Ferrets $25 $25 0.0 %
Small Iguana $25 $25 0.0 %
Medium Iguana $50 $50 0.0 %
Large Iguana $75 $75 0.0 %
Finch $5 $5 0.0 %
Parakeet /Canary $10 $10 0.0 %
1 Parrot - Max Price Market Rate Market Rate 0.0 %
Gray Cockatiel $25 $25 0.0 %
Lutino Cockatiel $50 $50 0.0 %
Peach Faced Lovebird $25 $25 0.0 %
Other Lovebird $50 $50 0.0 %
1 Horse/Cow Auction Starting Price Auction Starting Price 0.0 %
Goats $15 $15 0.0 %
Animal Spay/Neuter Fees:
Canine Spay $65 $65 0.0 %
Canine Neuter $65 $70 7.7 %
Feline Spay $50 $50 0.0 %
Feline Neuter $45 $45 0.0 %
Rabbit Spay $45 $45 0.0 %
Rabbit Neuter $45 $45 0.0 %
Animal Reclaim/Boarding/Rabies Shot/Microchip:
1 Canine $40/$10/$15/$8 $40/$10/$15/$8 0.0 %
1 Feline $25/$6/$15/$8 $25/$6/$15/$8 0.0 %
1 Livestock $55/$12/$0/$0 $55/$12/$0/$0 0.0 %
Wildlife Processing Fee $40 $40 0.0 %
381

Proposed FY 2020 User Fees
20 20
Solid Waste Services 1
13. Non-Regulatory Fees: Annual Solid WasteDisposal Fee FY 2019 FY 2020 % Change 1
Annual Solid Waste Fee: 1
Residential: Multi-Family $46.06 $58.06 26.1 % 1
Residential: Single Family $46.06 $58.06 26.1 %
Small Business (<512 gallons/week) $250.00 $250.00 0.0 % 1
Any complex can request a fee refund if the city could not service the complex or the complex chooses to contract for its own solid waste services.
1
Charlotte Department of Transportation 1
14. Non-Regulatory Fees: Land Development, Parking Permits & Off-Duty Police OfficerPermit FY 2019 FY 2020 % Change 1
Land Development Expedited Review $1,000.00 $1,000.00 0.0 % 1
Shared Mobility ROW Permits:
eBikes/Bike Share (per unit) $10.00 $10.00 0.0 %
Parking Meters (Per hour) $1.00 $1.00 0.0 % 1
Parking Permits: 1
Parking Permits (4th Ward, 3rd Ward, etc.) $30.00 $30.00 0.0 % 1
Replacement Permits $5.00 $5.00 0.0 % 1
Off-Duty Police Officer Permit: 1
Permit $50.00 $50.00 0.0 % 1
Permit Renewal $50.00 $50.00 0.0 %
Charlotte Water
15. Non-Regulatory Fees: Land Development FY 2019 FY 2020 % Change
Charlotte Water Land Development Expedited Review $6,810.00 $6,810.00 0.0 %
382

Proposed FY 2020 User Fees
21 21
Storm Water Services 16. Other Fees: Storm Water Rates FY 2019 FY 2020 % Change
Single-family:
Tier I - <2,000 square feet of impervious area $5.85/month $5.85/month 0.0 % 1
Tier II - 2,000 to <3,000 square feet of impervious area $8.62/month $8.62/month 0.0 % 1
Tier III - 3,000 to <5,000 square feet of impervious area $12.76/month $12.76/month 0.0 % 1
Tier IV - ≥5,000 square feet of impervious area $21.11/month $21.11/month 0.0 % 1
Non-Detached Single-family and Commercial: 1
Per Acre of Impervious Area $152.35/month $152.35/month 0.0 % 1
Charlotte Water 17. Other Fees: Water & Sewer Rates FY 2019 FY 2020 % Change
Water Rates:
Fixed: Administrative Charge $4.45 $4.73 6.3 %
Availability Fee $2.95 $1.24 -58.0 % Volume Rate:
Tier I - (0-4 ccf*) $1.63 $1.63 0.0 %
Tier II - (5-8 ccf) $2.10 $2.10 0.0 %
Tier III - (9-16 ccf) $4.85 $4.85 0.0 %
Tier IV - (16+ ccf) $9.18 $9.18 0.0 %
Non-Residential (ccf) $2.81 $2.81 0.0 %
Sewer Rates:
Fixed: Administrative Charge $4.45 $4.73 6.3 %
Availability Fee $7.39 $8.37 13.3 %
Volumetric - residential, commercial, others (ccf)**: $4.65 $4.99 7.3 %
Industrial Waste $0.24 $0.24 0.0 %
Common Residential Connection Fee:
Water $2,328 $3,197 37.3 % Sewer $3,428 $5,035 46.9 %
Common Residential System Development Fee: Water $610 $809 32.6 % Sewer $1,848 $2,541 37.5 %
The typical monthly water and sewer bill for residential customers is estimated to be $66.82, an increase of $2.21 per month (3.42%). The typical bill assumes 5,236 gallons or 7 ccf used each month.
* 1 ccf = 748 gallons **Up to 16 ccf for residential customers
383

Proposed FY 2020 User Fees
22 22
User Fee Appendix
City of Charlotte Regulatory and Nonregulatory User Fee Ordinance
Chapter 2, Section 2-1 (a - e) (a) Definitions. The following words, terms and phrases, when used in this section, shall have the meanings ascribed to them in this subsection, except where the context clearly indicates a different meaning:
Nonregulatory user fees means fees charged to those who receive governmental services or use governmental facilities. The term "nonregulatory user fees" does not include fees charged incident to a regulatory program except to the extent that fees are to defray the cost of providing a higher degree of service than is otherwise provided in conjunction with the regulatory program whether or not regulatory user fees are charged. For purposes of this section, nonregulatory user fees shall not include stormwater service charges established pursuant to chapter 18, article II, of this Code or water and sewer service user charges and other fees and charges established pursuant to chapter 23 of this Code.
Regulatory user fees means fees associated with or incident to a regulatory program. The purpose of regulatory user fees is to meet some or all of the costs occasioned by the regulated action.
(b) Regulatory user fees. The City Manager, or his designee, may establish and revise from time to time regulatory user fees inaccordance with regulatory user fee policies established by the City Council, which policies shall be in accordance with generally accepted accounting principles.
(c) Nonregulatory user fees. The City Manager, or his designee, may establish and revise from time to time nonregulatory user fees. To the extent that the City Council has established policies regarding nonregulatory user fees, fees shall be in accordance with such policies. (d) Notification of council of new or increased fees. The City Manager shall notify the mayor and City Council of any new regulatoryor nonregulatory fee or any increase in a regulatory or nonregulatory fee through the budget process or, if not part of the budget process, at least 30 days prior to the effective date of the new or increased fee. (e) Schedule of fees. A complete schedule of regulatory user fees and nonregulatory user fees shall be available for inspection in theoffice of the City Clerk. (Code 1985, § 2-4)
Regulatory User Fee Cost Recovery Example:
Step 1: Department's total direct and indirect budgeted costs = Fully Allocated Cost
Direct & Indirect Costs Eligible Budget Fee Activity 1 Fee Activity 2 Fee Activity 3
Non User Fee Activity
Staff Member 1 $30,000 40 % $12,000 25 % $7,500 30 % $9,000 5 % $1,500
Staff Member 2 $35,000 15 % 5,250 10 % $3,500 35 % $12,250 40 % $14,000
Building Rent $12,000 25 % 3,000 20 % $2,400 15 % $1,800 40 % $4,800
Fully Allocated Cost $77,000 $20,250 $13,400 $23,050 $20,300
Step 2: Fully Allocated Cost divided by average number of units = Cost Per Unit Description Fee Activity 1 Fee Activity 2 Fee Activity 3
Fully Allocated Cost $20,250 $13,400 $23,050
Average # of permits/applications 500 40 24
100% Cost per Unit $40.50 $335.00 $960.40
Step 3: Cost per Unit multiplied by cost recovery rate = Fee Direct & Indirect Costs Fee Activity 1 Fee Activity 2 Fee Activity 3
100% Cost to Applicant/Customer $40.50 $335.00 $960.40
384

8 8
SUMMARY STATISTICS AND
POLICIES

62 62
This page intentionally left blank.

Charlotte City Profile
1 1
Location
Charlotte, located in Mecklenburg County, North Carolina, is the largest city between Baltimore, Maryland and Jacksonville, Florida. The city is in the Piedmont Region of the Carolinas, two hours east of the Appalachian Mountains
and three and one-half hours west of the Atlantic Ocean. New York City is 631 miles to the northeast and Atlanta is 256 miles to the southwest. Charlotte’s location and growth reinforce the city’s role as a regional center in the
Southeast.
Local History
• Charlotte was incorporated in 1768, and became the county seat in 1774. Charlotte celebrated its 250thAnniversary in 2018.
• The city presently covers 309 square miles of the 546 square miles in Mecklenburg County.
• Referred to as the “Queen City”, Charlotte earned its name from the German born Queen Charlotte, wife ofEngland’s King George III. The county earned its name from Queen Charlotte’s birthplace, Mecklenburg,Germany.
Governmental Structure
The City of Charlotte has had a Council-Manager form of government since 1929. Policy-making and legislative authority are vested in a governing council consisting of a mayor and eleven additional members elected every two
years on a partisan basis. The Mayor and four City Council members are elected at-large by a citywide vote. The remaining seven Council members are elected by district, from voters who reside in each district. The City Council is
responsible for appointing the City Manager, City Attorney, City Clerk, and members of various boards and commissions. City Council enacts ordinances, resolutions, and orders; review the annual budget, set the tax rate, and approve the financing of all city operations; and authorize contracts on behalf of the city. The City Manager is
responsible for the daily operations and implementing the policies set by City Council.
Transportation
Aviation
• Charlotte-Douglas International Airport (CLT) ranked second best airport in the nation for business travelers(TravelBank) providing over 700 flights daily and serves over 44 million passengers annually
• Second busiest domestic hub in the American Airlines system
Trucking
• More than half the nation’s population is within a 24-hour drive of Charlotte
• Interstates 85 and 77 provide key connections with the Northeast, Southeast, and Midwest
Rail
• Two major rail lines, Norfolk Southern and CSX connect over 40,000 miles of track along the eastern seaboardand Canada.
• In addition, Norfolk Southern Railway operates a state-of-the-art intermodal facility at Charlotte DouglasInternational Airport. Charlotte is further served via rail through the inland port that connects to the Port ofWilmington via CSX Double - Stack line, Norfolk Southern Crescent Rail Corridor that connects New Orleansto New York City passing through Charlotte.
387

Charlotte City Profile
2 2
Business Climate
Charlotte enjoys a vibrant, highly diversified economy that supports business development and expansion for companies of all sizes.
• Six Fortune 500 companies are headquartered in Charlotte; including Bank of America ranked at 24.
• WalletHub ranked Charlotte 9th best place to start a business in 2018.
• Over 1,000 foreign-owned firms region-wide that employ more than 66,000 people from 45 differentcountries.
Recreational, Visitor, and Cultural Events
Charlotte’s Venues
Charlotte’s eight percent hotel/motel and one percent prepared food and beverage taxes have provided a dedicated resource for the purpose of promoting the city as a destination for convention, business, and leisure travel.
Charlotte Regional Visitors Authority (CRVA), a component unit of the city, focuses on tourism promotions and facility
management for venues such as:
• Bojangles’ Coliseum
• Charlotte Convention Center
• Ovens Auditorium
• Spectrum Center
Additionally, CRVA operates the NASCAR Hall of Fame complex. The complex includes:
• NASCAR Hall of Fame
• 150,000 square foot museum
• 102,000 square foot expansion to the Convention Center, including 40,000 square foot ballroom and NASCARPlaza
• 19-story, 393,000 square foot Class A office tower
Activities and Sporting Events
Charlotte hosts a variety of sporting events and tournaments each year, in addition to two major and one minor league sports franchise.
• The Carolina Panthers of the National Football League (NFL) have played in Charlotte for over 20 years.The Panthers play at Bank of America Stadium, a privately owned, 73,778-seat stadium in uptown Charlotte.
• The Charlotte Hornets of the National Basketball Association returned to Charlotte in 2004. The Hornetsplay in uptown Charlotte at the Spectrum Center.
• The Charlotte Knights of Minor League Baseball (MiLB), a Triple-A affiliate of the Chicago White Sox, playat the BB&T Ballpark in Uptown.
388

Charlotte City Profile
3 3
• Charlotte Motor Speedway hosts events such as:
o The Monster Energy NASCAR Cup Series All-Star Race, Coco-Cola 600, and the Bank of AmericaROVAL 400
o The NASCAR XFINITY Series Hisense ALSCO 300 and the Drive for The Cure 200
o The Camping World Truck Series North Carolina Education Lottery 200
• Bank of America Stadium hosts the Belk Bowl, a post-season college football game featuring a matchupbetween an Atlantic Coast Conference (ACC) and Southeastern Conference (SEC) team.
• In 2018, the Professional Golfer’s Association’s (PGA) Wells Fargo Championship returned to Quail Hollowin Charlotte.
• The U.S. National Whitewater Center, located on the Catawba River, is the world’s largest artificialwhitewater river and the U.S. Olympic training site. The Whitewater Center includes 400 acres for activitiesincluding whitewater rafting, kayaking, mountain biking, rock climbing, and rope courses.
Arts, Culture, and Science
Charlotte is the cultural hub of the region and offers a diverse selection of performances, art collections, and interactive exhibits to engage residents and visitors of all ages.
• The Bechtler Museum of Modern Art opened in 2010 and features a collection of more than 1,400 works by20th century modern artists.
• The Knight Theater, part of the Blumenthal Performing Arts Center, is a performing arts venue home to theNorth Carolina Dance Theatre.
• The Harvey B. Gantt Center for African-American Arts + Culture, a 46,500 square foot facility, serves thecommunity through music, dance, theater, visual art, film, arts education, literature, and community outreach.
• The Mint Museum is five-story facility that combines four collections; Craft + Design, and American,contemporary, and European pieces.
• The North Carolina Blumenthal Center for the Performing Arts is home to a number of arts organizationsincluding the Charlotte Symphony and Charlotte Ballet.
• The Charlotte Nature Museum, founded in 1946, provides programs and exhibits centered on a science themeof “Nature and Man.”
• Discovery Place is a hands-on science and technology museum featuring an 184-seat IMAX Dome Theatre.
Educational Institution
Charlotte-Mecklenburg Schools (CMS)
• CMS is a consolidated city-county public school system with approximately 148,000 students. CMS studentsare educated in 175 schools that include magnet programs that develop the talents of students who haveinterests in talents in specific areas.
389

Charlotte City Profile
4 4
Higher Education
Within the greater Charlotte region are 50 colleges and universities.
• Central Piedmont Community College offers nearly 300 associate degree, diploma, and certificateprograms at six campuses within Mecklenburg County.
• University of North Carolina – Charlotte is a public urban research institution offering bachelor, graduate,and doctoral degrees through eight professional colleges.
• Davidson College is a liberal arts college serving nearly 2,000 students.
• Queens University offers 44 majors and the student body represents 40 countries.
• Johnson & Wales University’s Charlotte campus offers degrees ranging from Baking & Pastry Arts andFashion Merchandising & Retailing to Corporate Accounting and Financial Analysis.
• Johnson C. Smith University is a Historically Black College and University (HBCU) offering 26undergraduate or graduate degrees.
• Pfeiffer University at Charlotte has an urban campus, offering adult learners the opportunity to earn bothundergraduate and graduate degrees.
• Wake Forest University continues to have a strong graduate school presence in Charlotte with several top- ranked MBA programs.
• Northeastern University’s Charlotte campus has offered graduate programs in uptown Charlotte since2011.
Healthcare
Charlotte and Mecklenburg County are served by a number of healthcare providers ranging from nationally-recognized hospital systems to specialized practices.
• Atrium, known as Carolina’s Healthcare System, one of the nation’s largest public hospital systems, operatesor manages 40 hospitals with over 900 care locations across the Carolinas. A leader in healthcare, Carolina’sHealthcare System has been recognized as Charlotte’s top medical center by U.S. News and World report.
• With a 622-bed medical center and over 700 physicians on staff, Novant Health Presbyterian MedicalCenter is one of the largest medical providers in the region.
390

Charlotte City Profile
5 5
(all figures represent FY2020 unless overwise noted)
Total Full-Time-Equivalent Employees 8,232.75 Fire Protection 123
Total Budget $2.63 billion Fire Prevention Inspectors 40.00
General Fund (net of transfers) 648.6 million Firefighters 1,093.00
General Bonded Debt per capita (FY 2018) $880.0 million
General Bonded Debt % of Property Value (FY 2018)
0.80% Police Protection Sworn Police Officers 1,982.00
Debt Service % of Non Capital Expenditures (FY 2018)
16.9% Civilian 516.50
Assessed value (2019) $99.2 billion Storm Water Rates
Single Family (monthly) < 2,000 sq feet $5.85
Land Area (square miles) 309 Single Family (monthly) 2,000 to <3,000 sq ft $8.62
Single Family (monthly) 3,000 to <5,000 sq ft $12.76
Single Family (monthly) 5,000 sq ft & up $21.11
Retail Sales - Meck County (2018) $22.2 billion Commercial (monthly) per impervious acre $152.35
General Obligation Bond Rating AAA
Utilities
Water Accounts (projected) 282,380
Meck County Building Permits (2016) 18,301 Sewer Accounts (projected) 258,871
1 ccf = 748 gallons
Population Water Rates for ccf use (typical) $12.82
2010 Census 731,424 Fixed Charge $5.97
2018 875,318 Typical Total Water Rates $18.79
Unemployment Rate (Mecklenburg County) Sewer Rates $34.93
2016 (as of February) 4.9% Fixed Charge $13.10
2017 (as of February) 4.8% Typical Total Sewer Rates $48.03
2018 (as of February) 4.2%
2019 (as of February) 3.9% Typical Residential User's Monthly Fee $66.82
Top Principal Taxpayers (2018) Median Household Income - 2017 $58,202
Wells Fargo/Wachovia 1.6%
Duke energy Corporation 1.4% Principal Employers (2016)
Bank of America 1.1% Atrium Health 6.0%
American Airlines 0.9% Wells Fargo/Wachovia Corporation 4.0%
Southpark Mall 0.4% Charlotte-Mecklenburg Schools 3.1%
AT&T/BellSouth 0.3% Wal-Mart Stores, Incorporated 2.9%
Bank of America 2.5%
391

Charlotte City Profile
6 6
Real Property Tax Regional City and County Property Tax Rates
1-cent on the property tax rate $14,271,056 Charlotte FY 2020 Proposed 34.81 ¢
General Fund 27.31 ¢ Mecklenburg County FY 2020 Proposed 61.69 ¢
Muni Debt Service for Capital 6.77 ¢
Pay-As-You-Go Capital 0.73 ¢ FY 2019 Tax Rates for Towns/District Total Property Tax Rate (per $100 valuation) 34.81 ¢ Cornelius 25.50 ¢
Davidson 35.00 ¢
Local Sales Tax Huntersville 30.50 ¢
State 4.75 % Matthews 34.00 ¢
Local 2.00 % Mint Hill 27.00 ¢
Transit Tax - CATS 0.50 % Pineville 38.00 ¢
Total (as of July 1, 2019) 7.25 % Police Service District 21.46 ¢
Stallings 21.50 ¢
Occupancy Tax (FY 2019)
First 3-Percent 3.0 % Motor Vehicle Registration Fee (FY 2019)
Second 3-Percent 3.0 % Charlotte $30.00
NASCAR Hall of Fame Tax 2.0 %
Total 8.0 % Solid Waste Fees
Charlotte
Prepared Food Tax (FY 2019) Single-Family & Mobile Homes $56.06
City/County 1.0 % Multiple Family $56.06
County
Municipal Service Districts (FY 2020) Single-Family & Mobile Homes $33.50
District Multiple Family $33.50
01 - Center City 1.36 ¢
02 - Center City 1.83 ¢ Car Rental Taxes (FY 2019)
03 - Center City 2.89 ¢ Road Use Tax 8.0 %
04 - South End 3.90 ¢ Charlotte Vehicle Rental Tax 1.5 %
05 - University City 2.12 ¢ Mecklenburg Vehicle Rental Tax 1.5 %
*per $100 valuation Airport Tax (If applicable) 10.0 %
U-Drive-it Vehicle Rental tax 5.0 %
392

Budget Principles
7 7
Using the framework set forth by North Carolina General Statute 159, the Local Government Budget and Fiscal Control Act, the city charter, and city code, the city will follow the principles outlined below. The development of the city’s annual operating budget will be a transparent process that welcomes community input and involvement.
1. The city will adopt a balanced budget. The budget process will begin by first evaluating available revenues.Funds for operating and capital expenditures will then be budgeted where there is the greatest communityneed.
2. Program funding will be approved in the overall context of competing priorities across city services.Anticipated future needs will play a prominent role in the prioritization process.
3. The city will have a structurally balanced budget. Ongoing costs will be funded with recurring revenues. One-time monies, such as certain federal grants, will be used for one-time expenses. New and significant expensesbrought forward outside the budget process should be avoided, when feasible.
4. Provide funding to ensure that compensation and benefits are sufficient to recruit and retain the workforcetalent necessary to meet service delivery needs. Pay and compensation increases shall not exceed growth ingeneral revenue for any given year.
5. Provide adequate operating funding to maintain previous investments in assets including technology, tools,equipment, and infrastructure.
6. Engage in a continual evaluation of the most cost-effective means for providing city services.
7. Evaluate the total tax and fee burden – not just the property tax rate – the citizen pays in exchange forgovernment services as part of the budget development process.
8. The budget will maintain a General Fund fund balance equal to 16 percent of the operating budget. Capitalreserves in excess of the 16 percent General Fund balance will be available for transfer to the Pay-As-You-Gocapital program for one-time uses unless otherwise recommended by the City Manager and approved by CityCouncil for other purposes.
9. The budget will maintain the Municipal Debt Service Fund Balance at a ratio of debt service fund balance toactual annual debt service costs of approximately 50 percent.
10. The city will continue to promote a user fee goal of 100 percent cost recovery.
11. Enterprise funds shall set their rates and fees in a manner to recover the full cost of their operation andnecessary capital investments.
12. Restricted revenue (such as Asset Forfeiture funds) will only be used for the purpose intended and in fullcompliance with all applicable policies, rules, regulations, or laws.
13. Reimbursement to the General Fund will occur from enterprise and internal service funds for general andadministrative services provided. Reimbursement will be determined through generally accepted costaccounting principles.
14. Capital projects financed through the issuance of bonds shall be financed for a period not to exceed theanticipated useful life of the project.
15. The general government debt program will maintain adequate cash and fund balance reserves at levelsrequired to maintain top-tier credit ratings.
393

Financial Policies and Practices
8 8
The city’s budgetary policies are based and conform to North Carolina General Statute 159, the Local Government Budget and Fiscal Control Act, the city charter and city code, and generally accepted accounting principles for governmental entities. These broad policies and statutes set forth guidelines against which current budgetary performance can be measured and proposals for future programs can be evaluated. The policies and practices help to protect the fiscal integrity of the city and ensure that the city is poised for future growth.
Revenue Policies and Practices
1. As provided by the North Carolina Local Government Budget and Fiscal Control Act, estimated revenue fromAd Valorem Tax levy will be budgeted as follows:
a. Assessed valuation estimates are provided by the Mecklenburg County Tax Assessor’s Office;b. The estimated percentage rate of collection of the tax levy shall not exceed the rate of the preceding
fiscal year;c. The tax rate shall be set each year based on the cost of providing general government services;d. The city shall operate under an annual balanced budget ordinance adopted and administered in
accordance with North Carolina General Statute 159-8(a). A budget ordinance is balanced when thesum of estimated net revenues and appropriated fund balance is equal to appropriations.
2. The city will set fees for services to maximize user charges for identifiable services as follows:a. To the extent possible, the rate structure established for water, sewer, and storm water customers
will be sufficient to finance all operating, capital, and debt service costs for providing said services;b. To the extent practical, any general city service for which is of a higher level to benefit recipients
shall be supported by user fees designed to recover costs from those recipients. Examples includezoning and code enforcement activities funded through zoning permit fees and demolition charges;
c. Where user fees are based on cost recovery, costs should be reviewed annually during the budgetprocess and user fees adjusted as practicable.
3. In accordance with North Carolina General Statute 143C, the city will accumulate and maintain a general fundbalance equal to or greater than eight percent (city policy is higher at 16 percent) of the prior year’s GeneralFund operating budget to address unanticipated events and circumstances such as natural disasters,economic downturns, threats to public safety, health, welfare, and other emergencies. Balances in excess of 16percent are eligible for appropriation in the Pay-As-You-Go Capital Program.
4. Restricted revenue will only be used for the purpose intended and in a fiscally responsible manner.5. The city will strive to achieve a structurally, balanced budget in which one-time revenue and/or one-time
expenditure savings will be used for non-reoccurring or one-time expenditures.
Inter-fund Policies and Practices
The General Fund will be reimbursed annually by the Enterprise and Internal Service Funds for general and administrative services provided, such as self-insurance, accounting, personnel, and administration.
394

Financial Policies and Practices
9 9
Capital Investment Policies and Practices
1. The city will update annually a five-year Community Investment Plan (capital investment program), whichdetails the estimated cost, project description, and anticipated funding source for each capital project.
2. The city’s adopted Annual Budget Ordinance will include capital project appropriations for all projects withfunding identified in the first year of the five-year Community Investment Plan.
3. Operating Budget expenditures will be used to maintain and provide any salaries, operating costs, and smallcapital outlay that may be required for adopted Capital Improvement Projects once they are completed and inservice.
4. The city will strive to fund a portion of capital improvements with Pay-As-You-Go sources of financing that donot increase the city’s debt liability.
Accounting Policies and Practices
1. The city will establish and maintain its accounting systems in compliance with the North Carolina LocalGovernment Budget and Fiscal Control Act and the North Carolina Local Government Commission.
2. Financial systems will be maintained to monitor revenues and expenditures on a monthly basis.3. All revenue collections will be consolidated under the Finance Director and audited annually.4. The Finance Office’s Procedures Manual will be maintained as a central reference source and handbook for all
procedures, which have a fiscal impact within the city. It will serve as the city’s authoritative source for fiscalprocedure.
5. An annual audit will be performed by an independent certified public accounting firm, which will issue anofficial opinion on the annual financial statements, with a management letter explaining recommendedimprovements, if required.
6. The city’s Comprehensive Annual Financial Report (CAFR) will be prepared in compliance with the necessarycriteria established to obtain the Government Finance Officers Association’s Certificate of Achievement forExcellence in Financial Reporting submitted each year for that recognition.
Basis for Budgeting
1. In accordance with the North Carolina Budget and Fiscal Control Act, the budget is developed and adoptedunder the modified accrual basis of accounting. Under this format, revenues are recognized when measurableand available and obligations of the city are budgeted as expenditures. During the fiscal year, budgets aremonitored and accounted for using the modified accrual basis. At fiscal year-end, the city’s CAFR is preparedusing Generally Accepted Accounting Principles.
2. All governmental funds are reported on using the modified accrual basis of accounting. Although the CAFRreports all proprietary funds using the full accrual basis of accounting, whereby revenues are recognizedwhen earned and expenses are recognized in the period incurred, for simplicity, the budget document reportsall proprietary funds’ prior year actuals using the modified accrual method.
Debt Policies and Practices
1. Capital projects financed through the issuance of bonds shall be financed for a period not to exceed theanticipated useful life of the project.
2. Maintain a per capita debt ratio within the moderate range as defined by rating agency criteria as publishedperiodically sufficient to maintain current credit ratings.
395

Financial Policies and Practices
10 10
3. Outstanding long-term maturity variable rate bonds not to exceed a sum equal to the debt service fund equityrequirement plus 15 percent of total long-term fixed rate debt.
4. Continue the dedication of multiple revenues to a Pay-As-You-Go fund established to provide a materialportion of the non-enterprise, general government capital needs. The revenue sources include a dedicatedportion of the property tax rate, sales tax, and motor vehicle fees.
5. The debt issuance method will be periodically re-evaluated as city conditions change, or new or changedfinancial market methods emerge. The review and change of the issuance method, if any, will be with theobjective to utilize the method that offers the lowest effective market interest cost available to the city.Accordingly, the following issuance method(s) will be currently utilized: New money fixed rate bond issues may be placed on a competitive or negotiated basis New money variable rate bond issues will be placed on a negotiated basis Refunding bond issues may be placed on a competitive or negotiated basis Issuance methods will be continuously reviewed and changes made to various offerings methods as
appropriate and cost efficient for the city. 6. The city will maintain its financial condition so as to continue its AAA bond rating.
Cash Management and Investment Policies and Practices
1. The city maintains a cash management pool to facilitate disbursement and investment and maximizeinvestment income. Earnings on the pooled funds are apportioned and credited to the funds monthly, basedon the average daily balance of each fund. Since individual funds may deposit additional amounts at any timeand may withdraw funds at any time without prior notice or penalty, the pool is used essentially as a demanddeposit account and considered cash and cash equivalents. This pool is used by all funds except theFirefighters’ Retirement System Fund. For arbitrage purposes, the city also maintains separate pools for theproceeds of each bond sale subsequent to 1986 in compliance with the Internal Revenue Code relative toyield restrictions and rebate requirements. For funds not included in the pools described above, cash andcash equivalents consist of cash, demand deposits, and short-term, highly liquid investments.
2. North Carolina General Statute 159-30 authorizes the city to invest in obligations of the United States orobligations fully guaranteed both as to principal and interest by the United States; obligations of the state ofNorth Carolina; bonds and notes of any North Carolina local government or public authority; obligations ofcertain non-guaranteed federal agencies; certain high quality issues of commercial paper and bankers’acceptances; repurchase agreements having third-party safekeeping; and the North Carolina CapitalManagement Trust (NCCMT), a Securities and Exchange Commission (SEC) registered mutual fund. The city isnot authorized to enter into reverse repurchase agreements. Although the city does not have a formalinvestment policy, internal investment guidelines prohibit maturities longer than five years, which helpsmanage exposure to fair value losses in rising interest rate environments.
3. All deposits of the city are made in board-designated official depositories and are secured as required byNorth Carolina State Statutes. The city may designate as an official depository any bank or savings and loanassociation whose principal office is located in North Carolina. Also, the city may establish time depositaccounts such as Negotiable Order of Withdrawal (NOW) and SuperNOW accounts, money market accounts,and certificates of deposit.
4. The city has no formal policy on custodial credit risk. However, the city’s internal policy limits custodial creditrisk by providing that security in the collateral be delivered to a third-party safekeeping bank designated bythe city.
396

Financial Policies and Practices
11 11
5. The city’s informal investment policy limits the amount of commercial paper or bankers acceptances to amaximum of 25 percent of the portfolio. For commercial paper, a maximum of $20,000,000 may be investedin any one issuer. For bankers’ acceptances, the maximum investment is limited to 10 percent of the portfoliofor any one issuer.
6. The restricted cash and cash equivalents/investments are restricted pursuant to bond covenants and otherfinancing agreements. All restricted money market funds of the enterprise funds are considered cash or cashequivalents. The remaining amount of restricted assets is considered investments.
7. North Carolina state law limits investments in commercial paper to the top rating issued by NationallyRecognized Statistical Rating Organizations (NSRO’s). Although the city had no formal policy on managingcredit risk, internal investment guidelines for commercial paper require at least two ratings from eitherStandard & Poor’s (S&P), Fitch Ratings (Fitch), or Moody’s Investors Service (Moody’s).
8. Investments, except for North Carolina Capital Management Trust (NCCMT) and Firefighters’ RetirementSystem Fund, are reported at fair value as determined by quoted market prices. The securities of the NCCMTCash Portfolio, a Securities and Exchange Commission registered money market mutual fund, are valued atfair value, which is the NCCMT’s share price. The NCCMT Term Portfolio’s securities are valued at fair value.Money market investments that have a remaining maturity at the time of purchase of one year or less arereported at amortized cost. Non-participating interest earning investment contracts are reported at cost.Investments with an original maturity of three months or less are considered cash equivalents.
City Manager Contract Approval Policy
1. The City Manager is authorized to award contracts, reject bids, re-advertise to receive bids, and waive bidbonds or other deposit requirements pursuant to North Carolina General Statute Chapter 143-129(a).Specifically the Manager is authorized to:
a. Exempt particular projects from the provision of the North Carolina General Statute Chapter 143,Article 3D, Procurement of Architectural, Engineering and Surveying Services in cases where theestimated professional fee for a particular project is less than $50,000.
b. Approve and execute contracts involving informal bids of up to $500,000 for construction projectspreviously budgeted in the annual ordinance.
c. Approve and execute maintenance contracts in amounts under $500,000.d. Approve and execute leases of city real property in amounts under $500,000.e. Approve and execute engineering contracts under $500,000.f. Approve and execute professional service contracts in amounts under $500,000.g. Approve and execute change orders to all approved contracts not to exceed $500,000 in the total
amount of change order unless previous authority is authorized by City Council action for the specificcontract.
h. Approve and execute the purchases of apparatus, supplies, materials, or equipment for all purchasesthat do not exceed $500,000.
2. The City Manager is authorized to dispose of surplus property under the informal procedures described inNorth Carolina General Statute 160A-266(c).
3. The City Manager is authorized to approve the purchase of a capital item when the purchase price does notexceed $500,000.
397

CIP Program Policies
12 12
Improving the quality of life of residents is the City of Charlotte’s mission and the foundation of the CIP. The plan’s goal is to maintain or replace high priority infrastructure as needed. By facilitating economic development, enhancing the tax base, and protecting the community’s safety and environmental resources, the CIP benefits all segments of the community and supports all roles of municipal government.
City Council-adopted policies for developing and implementing the Capital Investment Plan
1. Evaluate capital projects requests according to the following priorities:
1st priority: Maintenance and/or retrofitting of existing infrastructure
2nd priority: Replacement of existing infrastructure
3rd priority: Expansion of existing infrastructure
4th priority: New infrastructure
2. Develop and implement a capital program based on smart growth principles:
Maintain land use planning Design for livability Sustain effective land use decisions Safeguard the environment Strengthen neighborhoods Expand transportation choices Build a competitive economic edge Use public investment as a catalyst
3. Preserve the existing tax base, a fundamental principle for city capital investment decision-making
4. Affirm neighborhoods as a foundation of the community and emphasize a reinvestment program forall neighborhoods
5. Form partnerships with residents and businesses to leverage public dollars and make the communityone of choice for living, working, and leisure activities
6. Serve as a platform for economic development through the funding of priority projects in targetedinvestment areas
7. Provide a balanced capital plan, which funds the highest priority community needs in a variety ofprogram areas
8. Anticipate infrastructure and facility needs resulting from future changes in the city’s boundaries anddensity that are consistent with Council’s development and growth policies
9. Comply with applicable federal and state mandates
398

CIP Financial Policies
13 13
1. General government debt policies:
Diversify revenue sources dedicated to capital formation and debt service
Maintain a balanced mix of financing strategies for funding capital projects without anexcessive reliance on any one source. Examples of financing strategies include:
Pay-As-You-Go Grants Debt
Provide for the issuance of additional debt at reasonable time intervals without increasingtaxes, and timed in such a way as to avoid erratic impacts on tax rate changes
Maintain the highest credit ratings by scheduling and issuing debt that sustains reasonableratios (e.g. percent of outstanding debt to assessed value)
2. Maintain revenues dedicated to the capital program in the Municipal Debt Service Fund:
Allocation of the property tax rate
Investment (interest) income
Sales Tax (one-half cent)
Other miscellaneous revenues including Alcoholic Beverage Control (ABC) profits, beer andwine license revenues, and a contribution from Mecklenburg County for its share of debt costs remaining from the consolidation of Park and Recreation
3. Maintain the Municipal Debt Service Fund Balance at an adequate level to cover debt costs:
The ratio of debt service fund balance to actual annual debt service costs will be approximately50 percent
4. Use the Pay-As-You-Go Tax Fund in conjunction with long-term debt financing to finance capitalprojects
5. Dedicate asset sales to the Capital Investment Plan:
The retirement of any outstanding debt on sold assets will be the first use of sale proceeds
6. Maintain the General Government fund balance at 16 percent of the operating budget:
Funding in excess of 16 percent of the General Fund balance is dedicated to Pay-As-You-Gocapital expenses, unless otherwise directed by Council
7. Maintain the Enterprise Funds' capital programs on a self-sustaining basis:
Charlotte Water, Storm Water, and Aviation capital projects are financed from revenuesgenerated from user fees and charges
The Charlotte Water rate study assumes maintenance of debt service coverage as required inRevenue Bond financing documents
Charlotte Area Transit System projects are supported by federal and state grants, and the one-half cent sales tax dedicated to transit
8. Pursuant to the North Carolina General Statutes, the city’s outstanding general obligation debt issubject to a legal limitation based on eight percent of the total assessed value of real and personalproperty
399

62 62
This page intentionally left blank.

9 9
KEY TERMS AND ACRONYMS

62 62
This page intentionally left blank.

Key Terms and Acronyms
1 1
Adjustments to Proposed Budget: This session provides the opportunity for preliminary Council decisions regarding the Manager’s Proposed Budget. By Council practice, each Council member has the opportunity to add or subtract any item or amount from the proposed budget. Council has traditionally required that the adjustments result in a balanced budget. Those items receiving five or more votes from Council members are then voted on at the straw votes session.
Allocation: The expenditure amount planned for a particular project or service that requires additional legislative action or appropriation before expenditures are authorized.
Appropriation: A legal authorization granted by the city’s legislative authority (City Council) to make expenditures and incur obligations for specific purposes.
Broadbanding Pay Plan: The city’s Broadbanding Pay Plan covers all city employees with the exception of non-managerial sworn Police and uniformed Fire employees. The Plan provides merit increases based on the employee’s performance and the employee’s pay rate in relation to market.
Budget Adoption: North Carolina State law requires local government to have an adopted budget ordinance by fiscal year-end (June 30) specifying the budget plan.
Budget and Effectiveness Committee: The Council organizes its Budget Committee as a mechanism for guiding the progression of the budget process and for providing oversight of agenda planning for the various sessions in the budget development process.
Budget Presentation: This session provides Council with a detailed overview of the Manager’s proposed budget. This provides a forum for the Manager to share highlights of the budget and for Council to ask initial questions as the budget process moves into the review stage.
Budget Workshop(s): This series of half-day workshops, conducted by Council, provide for detailed discussions of the budget issues and decisions that characterize the development of the budget plan. Staff is available to share pertinent information during these sessions as Council works to identify and confirm areas of focus, operating and capital investment policies, and review projected revenues and expense information, and review program and service delivery priorities.
Budget Plan-Proposed and Adopted: The City Manager submits to the City Council a proposed expenditure and revenue plan for all city operations for the coming fiscal year in the Preliminary Strategic Operating Plan. When City Council agrees upon the revenue and expenditure levels, the Proposed Budget becomes the Adopted Budget, funds are appropriated and legal expenditure limits are established.
403

Key Terms and Acronyms
2 2
Capital Expenditure: An amount of funds, through current operating dollars or debt, spent on an asset with a useful life of at least one year or more with a significant value.
Charlotte Regional Transportation Planning Organization (CRTPO): The transportation body that is responsible for overseeing the development of the transportation system in the greater Charlotte-Mecklenburg region of North Carolina.
Capital Investment Plan (CIP): Annual appropriations from specific funding sources are shown in the City’s budget for certain capital purposes such as street improvements, building construction, and facility maintenance. These appropriations are supported by a five-year allocation that details all projects, funding sources, and expenditure amounts. The allocation plan covers a five-year period.
Community Development Block Grant (CDBG): A United States Department of Housing and Urban Development grant that local governments receive annually to support economic development projects, low income housing, and services to low-income neighborhoods.
Objective: Organizational aims or purposes for the next 2-4 years that are the focal point of the organization’s initiatives.
Debt Service: Annual principal and interest payments that the local government owes on money that it has borrowed.
Department: City’s operating departments.
Enhancement: Requests for new projects, programs, or services or requests for additional funding to existing projects, programs or services.
Enterprise Funds: One of four city departments which are fully funded by operating revenues rather than property taxes. These are Charlotte Douglas Airport, Charlotte Area Transit System, Charlotte Water, and Storm Water.
Financial Partner: Private, non-profit organizations which provide services to citizens by use of partial funding from the City.
Fiscal Year: A one-year fiscal period. The City’s fiscal year extends from July 1st through June 30th.
Full-Time Equivalent (FTE): A term that expresses the amount of time for which a position has been budgeted in relation to the amount of time a regular, full-time employee normally works in a year.
Fund: An accounting entity with a set of self-balancing revenue and expenditure accounts used to record the financial affairs of a governmental organization.
Fund Balance: It is the difference between assets and liabilities of a particular fund. It incorporates the difference between the revenues and expenditures each year.
404

Key Terms and Acronyms
3 3
General Fund: A central fund into which most of the city’s general tax revenues and discretionary resources are pooled, which is allocated to support many of the operations of city government.
General Obligation Bonds: Bonds whose payment is guaranteed by the full faith and credit of the government body.
Governance Department: The city’s governance departments include the Mayor and City Council, City Attorney, City Clerk, and City Manager’s Office.
Internal Service Providers (ISPs): Business unit that provides services to other city departments and charges for those services. Each department budget receiving the service has an ISP budget which is charged by the department providing the service.
Manager/Council Strategy Session: This initial meeting serves to reaffirm Council priorities and identify citizen concerns and desires for service delivery during the next fiscal year. This discussion also includes any other additional parameters for possible changes to the budget plan under development. City Council adopts a strategic plan as a result of this discussion and the departments are charged with meeting these identified needs.
Metropolitan Transit Commission (MTC): is the policy board for the Charlotte Area Transit System (CATS) and has responsibility for reviewing and recommending all long-range public transportation plans.
Municipal Service District (MSD): Taxing districts designed to enhance economic vitality and quality of life in the central business district or other commercial areas. Three MSDs are located in the Center City area, one in the South End area, and one in the University City area.
Net of Transfers: Takes into account transfers between funds (General Fund, Enterprise Funds, and Capital Funds).
Non-Departmental Account: Those services or functions that are not specifically associated with a city department.
Nongeneral Funds: Those services or functions not included in the General Fund.
Operating Budget: The portion of the budget plan that represents recurring expenditures such as salaries, utilities, postage, office supplies, fuel, etc.
Pay-As-You-Go Projects (PAYGO): Relatively small capital projects that do not lend themselves to debt financing and are paid with current available revenue.
Performance Measure: A quantitative indicator of how programs and services are directly contributing to the achievement of an agency’s objectives. These indicators may include measures of inputs, outputs, outcomes, or activities.
Position Number: A term that refers to a unique position identification number assigned to each position authorized by the City Council through the budget or other ordinances. Positions may have a common title name, but each position has its own unique identification number assigned by the PeopleSoft Human Resources System. Only one person at a time can fill a regularly budgeted position.
405

Key Terms and Acronyms
4 4
Program: A group of services within a department, aligned by a common purpose.
Public Hearing on Proposed Budget: This session, as required by State law (Local Government Budget and Fiscal Control Act), provides an opportunity for citizens to comment on the published budget plan. Notice of the public hearing and the Council discussion process are included in the Charlotte Observer, on the City’s website, and on the Government Channel. The budget documents are made available to the public through the regional public libraries and the local university libraries.
Public Safety Pay Plan (PSPP): The City’s Public Safety Pay Plan covers all Police classes below the rank of Police Captain and all Fire classes below the rank of Battalion Fire Chief. There are two components to the Public Safety Pay Plan. The first is progression through steps, and the second is structural market adjustments to the steps.
Strategic Priorities: Four strategic areas of focus, which serve as the framework for allocating funds and resources. These are Economic Development, Neighborhood Development, Transportation and Planning, and Well-Managed Government.
Straw Votes: This session provides the opportunity for Council to vote on each of the items that moved from the adjustments session. Each of these items receiving six or more straw votes will be incorporated into the budget ordinance.
Support Department: The city’s support departments include Human Resources, Innovation and Technology, and Finance.
Target: Quantifiable and specific level of achievement, communicates the expected level of performance.
Technical Adjustment: Annual inflationary adjustments including existing contractual cost increases, annualization of costs, or state and federal mandates.
406

Key Terms and Acronyms
5 5
Acronym Definition
AF Asset Forfeiture
AMWA Association of Metropolitan Water Agencies
ARD Asset Recovery and Disposal
BLE Blue Line Extension
BSC Balanced Scorecard
BTOP Broadband Technology Opportunities Program
CATS Charlotte Area Transit System
CCF 100 Cubic Feet
CDBG Community Development Block Grant
CDOT Charlotte Department of Transportation
CIP Community Investment Plan
CLT Charlotte Douglas International Airport
CMDC Charlotte Mecklenburg Development Corporation
CMPD Charlotte Mecklenburg Police Department
CMS Charlotte Mecklenburg School
CNIP Comprehensive Neighborhood Improvement Program
COPs Certificates of Participation
CRC Charlotte-Mecklenburg Community Relations Committee
CRP Charlotte Regional Partnership
CRTPO Charlotte Regional Transportation Planning Organization
CRVA Charlotte Regional Visitors Authority
E&PM Engineering & Property Management
EBPP Electronic Bill Presentment and Payment
EIS Environmental Impact Statement
EMT Emergency Medical Technician
EPA Environmental Protection Agency
ERP Enterprise Resource Planning
EUI Energy Use Index
FAA Federal Aviation Administration
FBO Fixed Base Operation
407

Key Terms and Acronyms
6 6
Acronym Definition
FCC Federal Communications Commission
FTA Federal Transit Administration
FTE Full Time Equivalent
FY Fiscal Year
GEP Greater Enrichment Program
GIS Geographical Information System
GO General Obligation (bonds)
HOME Home Ownership Made Easy (Federal Housing grant)
HOPWA Housing Opportunities for People with AIDS
HNS Housing and Neighborhood Services
LEDs Light Emitting Diodes
MGD Million of Gallons per Day
MHz Megahertz
MOE Maintenance of Effort
MPO Metropolitan Planning Organization
MSD Municipal Service District
MTC Metropolitan Transit Commission
MYEP Mayor’s Youth Employment Program
NCHFA North Carolina Housing Finance Agency
NCDOT North Carolina Department of Transportation
NECI Northeast Corridor Infrastructure
NIP Neighborhood Improvement Projects
OSHA Occupational Safety and Health Act
PAYGO Pay-As-You-Go
POST Partners in Out-of-School Time
RFP Request for Proposal
SBE Small Business Enterprise
S/MWBE Small Business/Minority and Women Business Enterprise
SOP Strategic Operating Plan
SRO School Resource Officers
SSGC Shared Services Governance Committee
408

Key Terms and Acronyms
7 7
Acronym Definition
STIG Synthetic Tax Increment Grants
STS Special Transportation Service
SWS Solid Waste Services
TAP Transportation Action Plan
TBA To Be Authorized
UCR Uniform Crime Reporting
UDAG Urban Development Action Grant
UPWP Unified Planning Work Program
VMT Vehicles Miles Traveled
WIA Workforce Investment Act
409

62 62
This page intentionally left blank.

8 8
FY 2020 Compensation and Benefits

EXECUTIVE SUMMARY
Background Human resource programs are developed and administered according to the Human Resources Philosophy adopted by the City Council. The City of Charlotte is committed to attracting and retaining qualified, productive and motivated employees, who will provide efficient and effective services to its citizens. Compensation and benefits recommendations are guided by the mission to help employees THRIVE by creating a work environment that embraces diversity. The city recognizes and values the unique and changing needs of our workforce throughout their career life cycle. FY 2020 guiding principles: • Pay will be based on performance while considering market conditions. • Base pay is the primary type of pay used to maintain market competitiveness. City Council-approved policy is that
market competitiveness for a specific job is based on the median of actual salaries paid in the applicable recruitment area for jobs of a similar nature.
• Incentive pay will be the primary pay method used to communicate the changing goals of the city and encourage
teamwork. • Employees will also be rewarded for attaining skills which make them more flexible and useful in helping the city
meet its goals, such as language incentive. • Benefits plans will provide an appropriate level of income protection against unexpected health, life and disability
risks. • Health care costs will be aggressively managed with employees sharing in the cost of benefits. • Wellness initiatives will be integrated across our human resources programs. Survey of Market Conditions and Market Competitiveness Market competitiveness is determined through ongoing surveys of the pay and benefits practices of other employers. Human Resources recently completed a review of local, regional and national pay increase trends, as well as a review of employer benefits practices. Competitive practice information was gathered directly by the Human Resources staff and evaluated along with survey information compiled from several consulting firms representing a large number of employers. A summary of the average market movement can be found in Attachment A. Survey Findings • Mercer Consulting’s 2018/2019 U.S. Compensation Planning Survey reports 2019 expected increases are largely
consistent with the past 5 years at 2.9 percent.
• According to the World at Work’s 2018/2019 Salary Budget Survey, respondents report that total salary increase budgets in the United States increased slightly from one year ago to a 3.1 percent average.
• AON Hewitt’s 2018/2019 U.S. Salary Increase Survey reports projected salary increase spending for 2019 is
expected to increase to increase modestly to 3.1 percent and is the highest projected level of spending since 2008.

Page 2 • Mercer Consulting’s National Survey of Employer-Sponsored Health Plans 2018 Survey reports that 68% of all
larger employers offer consumer-directed health plans and most continue to provide these high-deductible plans alongside other medical choices. In addition, prescription drug benefit cost per employee rose 6.5 percent in 2018, driven by spending on specialty drugs, which rose nearly 12 percent. About half of employers (51 percent) now steer members to specialty pharmacies for better pricing and more intensive support for patients with complex disease states.
• Gallagher’s Best-In-Class Benchmarking Analysis reports that employer-subsidized hospital indemnity coverage is
more often offered by best in class employers. Providing employees greater financial security in the face of unexpected health issues and treatment costs.
Conclusions and Recommendations • Compensation
In the Public Safety Pay Plan, the following is recommended: Merit steps of 2.5 percent to five percent be funded.
Market adjustment to the pay steps funded at 1.5 percent effective July 6, 2019.
Revisions to Police Officer steps to increase the city’s ability to attract and retain Police Officers.
Create Senior Police Officer I step for eligible employees to move to on July 6, 2019.
Implement a Senior Police Officer II program in FY 2020.
Revisions to Fire steps to better align with market competitiveness.
Create new Salaried Pay Plan
Transition employees in Broadbanding to Salaried Pay Plan
A three percent merit pool increase is recommended.
In the Hourly Pay Plan, the following is recommended: Merit increase pool funded at 1.5 percent.
Market adjustment to the ranges of 1.5 percent, effective December 7, 2019.
Increase minimum starting hourly rate to $16.00 by the end of the fiscal year.
o Provide at least a $1.00 per hour increase to eligible employees, in the Salaried or Hourly Pay Plans, earning
less than $33.33 per hour by the end of FY 2020, as a combination of merit and market adjustment.
• Benefits
o No medical plan premium increase to HSA Plan A, PPO Plan D, or PPO Plan E, for all tiers.
o Reduce the current HSA Plan B premiums, for all tiers, by five percent in 2020.
o Discontinue HRA Plan C medical plan.

Page 3
o Enhance plan design in HSA Plan A medical plan.
o Enhance the specialty drug benefit in the prescription drug plan.
o Provide city-paid Hospital Indemnity coverage for all employees covered by the city’s health plan.
o Add adult orthodontia coverage to the dental plan.
o Add additional employee-paid voluntary benefits, such home, auto, ID theft, and legal.
o Replace leave awarded for non-use of sick time to one personal day per year.
o Increase city contribution to 401(k) for employees in the Charlotte Firefighters’ Retirement System to four
percent from three percent in January 2020.

Page 4
FY 2020 COMPENSATION RECOMMENDATIONS Public Safety Pay Plan The city’s Public Safety Pay Plan, as shown in Attachment B, covers all Police classes below the rank of Police Lieutenant and all Fire classes below the rank of Battalion Fire Chief. There are two components to the Public Safety Pay Plan. The first is progression through the steps, and the second is market adjustments to the steps. The following recommendations are made:
Merit steps of 2.5 percent to five percent be funded.
Market adjustment to the pay steps funded at 1.5 percent effective July 6, 2019.
Revisions to Police Officer steps to increase the city’s ability to attract and retain Police Officers.
Merge steps seven and eight from two 2.5 percent steps to one five percent step.
Merge steps nine and ten from two 2.5 percent steps to one five percent step.
Move the merit date of all Police Officers on step eight and above to July 6, to prevent
leapfrogging.
Create Senior Police Officer I step for eligible Police Officers to receive a five percent step the later of July 6, 2019, or one year from reaching the top police officer step.
Implement a Senior Police Officer II program in FY 2020
Officers who have completed SPO I requirements can enroll in the program in FY 2020 and be eligible to receive a five percent salary step the later of one year from reaching SPO I step or December 2020.
• Adjust Police Sergeant steps by 5 percent each.
Revisions to Fire steps to better align with market competitiveness.
Add a 2.5 percent step to Fire Engineer.
Adjust Fire Captain steps by 2.5 percent each. Salaried Pay Plan The city’s current Broadbanding Pay Plan covers all salaried city employees with the exception of non-managerial Sworn Police and Uniformed Fire employees. There is no general pay (market) adjustment for employees in this pay plan like there is for employees in the Public Safety and the Hourly Pay Plans. Merit increases are based on the employee’s performance and the employee’s pay rate in relation to market. FY 2020 recommendations include: • Create a salaried pay plan for employees, in professional, management, and executive positions, as reflected in
Attachment C. The proposed new pay plan will consist of 26 traditional ranges, each with a minimum and maximum equal to 80 percent and 125 percent, respectively, of benchmarked market data.
• Transition employees from Broadbanding to the new Salaried Pay Plan in FY 2020. No employee will receive an increase as a result of this recommendation, because no employee’s salary falls below the minimum of the range for their job classification.

Page 5 • Funding for a three percent merit pool. Department Directors will be held accountable for staying within
department personnel services budget. Pay decisions will be based on an employee’s level of performance and a comparison of current salary to the competitive rate for their specific job. Increases may be awarded as base pay and/or lump sum on the employee’s merit.
Hourly Pay Plan The city’s Hourly Pay Plan covers hourly employees in labor, trades, and administrative positions. This pay plan consists of 20 traditional ranges, each with a minimum and maximum. Hourly employees receive an annual market adjustment equal to half of the Salaried Pay Plan merit percentage increase. These employees also receive a merit increase each year equal to half of the Salaried Pay Plan merit percentage increase, on average. Merit increases are based on the employee’s performance and the employee’s pay rate in relation to the competitive rate for their specific job. The following recommendations are made:
• Funding for a 1.5 percent merit pool. Department Directors will be held accountable for staying within budget.
Pay decisions will be based on an employee’s level of performance and a comparison of current salary to the midpoint for their specific job. Increases may be awarded as base pay or lump sum on the employee’s merit date.
• A 1.5 percent market adjustment to the Hourly Pay Plan, as reflected in Attachment D. Hourly employees will
receive this increase effective December 7, 2019.
General Employees Currently Earning Below $16.00 per hour In FY 2018, City Council brought the minimum starting pay for City of Charlotte employees to $15.00 per hour. To continue to attract and retain employees in a competitive market, to remain an employer of choice, and to provide good paying jobs, it is recommended that the city’s minimum pay be increased to $16.00 per hour by the end of FY 2020. General Employees Currently Earning Below $33.33 per hour It is also recommended that eligible employees in the Salaried and Hourly Pay Plans, earning less than $33.33 per hour, receive at least a $1.00 per hour increase by the end of FY 2020, as a combination of merit and market adjustment. This will ensure these employees receive a three percent or higher increase and avoid any compression that may have resulted from the increase to minimum pay.

Page 6
FY 2020 BENEFITS RECOMMENDATIONS Funding for Insurance Coverages The following group insurance coverages are provided and consistent with the Human Resources Philosophy adopted by the City Council: medical, including prescription drug; medical stop-loss; life; dental; employee assistance program; and disability coverage. It is recommended that the city’s allocated funding remain flat for FY 2020. Health Coverage The city’s medical insurance program is self-insured for active employees and non-Medicare retirees. Stop-loss insurance is purchased by the city to cover catastrophic claims that exceed $475,000 per individual in a calendar year. Third-party claims administrators are retained to provide medical management services and pay medical and prescription drug claims. When budgeting for future costs, the two cost components for the medical insurance plan are the claims projected to incur and the administrative fees to be paid to the claims administrators. BlueCross BlueShield NC is the medical claims administrator and CVS Caremark is the prescription drug plan administrator. The city has a fully-insured medical and prescription drug plan administered by AmWINS for Medicare-eligible retirees. The following recommendations are being made: Medical Plans
• BlueCross BlueShield of North Carolina is the claims administrator for the self-funded medical insurance plan.
The city is currently conducting a rebidding process for these services.
• It is recommended that the City Manager or designee be authorized select the vendor and execute the contract and further contract amendments with the selected vendor upon completion of the rebidding process.
• Recommended plan design changes include:
o Discontinue HRA Plan C (PPO Plan with Health Reimbursement Account). o Reduce the Individual Deductible and Out-of-Pocket Maximums in HSA Plan A from $6,550 to
$4,000. o Reduce the Family Deductible and Out-of-Pocket Maximums in HSA Plan A from $13,100 to $8,000. o Reduce the prescription drug specialty tier maximum by $50 in PPO Plan D and PPO Plan E.
Active Employee Medical Premiums
Effective January 1, 2020 no medical plan premium increase to HSA Plan A, PPO Plan D, or PPO Plan E, for all tiers.
Effective January 1, 2020 reduce HSA Plan B premiums, for all tiers, by 5 percent.
• Provide the City Manager or designee the authority to establish the wellness incentive design within the overall health insurance budget.
• Provide the City Manager or designee the authority to continue the income based premium relief program, establish program criteria and income means testing.
Non-Medicare Retiree Premiums
• Effective January 1, 2020 reduce HSA Plan B premiums, all tiers, by 5 percent.

Page 7
• Effective January 1, 2020 no medical plan premium increase to HSA Plan A, PPO Plan D, or PPO Plan E, for all tiers, for retirees with 20 years of service.
Medicare-Eligible Retiree Premiums • As part of the FY 2010 budget process, City Council provided the City Manager or designee the authority to
approve changes including plan options, vendors, and future contracts/contract amendments to the fully-insured medical and prescription drug plans for Medicare-eligible retirees.
• Since these plans are fully insured, it is recommended that the City Manager or designee be authorized to approve rate increases and vendor changes as necessary to appropriately fund these plans upon receipt of renewal rates from the Administrator of the Medicare-eligible retiree coverage.
• No changes to the current cost share philosophy for retirees in this plan are recommended.
Employee Health Clinic
• Currently the MyHealth employee health clinic is administered by Our Health. The current contract will expire December 31, 2019 with one renewal remaining.
• Provide the City Manager or designee the authority to enhance the scope of services and execute the contract renewal.
Dental Plan/Premiums
• The dental plan is administered by Ameritas. The current policy will expire December 31, 2019. The City is
currently conducting a rebidding process for these services.
• It is recommended that the City Manager or designee be authorized select the vendor and execute the policy and further policy amendments with the selected vendor upon completion of the rebidding process.
• Provide the City Manager the authority to establish the dental premium structure within the overall health insurance budget.
• Recommended plan design changes include:
o Addition of adult orthodontic coverage. o Based on the rebidding, other plan design enhancements may be available. Provide the City
Manager or designee the authority to make plan design changes based on vendor selection outcome.
Vision Plan/Premiums
• The vision plan is fully insured and administered by VSP. It is recommended that the City Manager or
designee be authorized to approve plan design upon receipt of renewal from VSP. Employee Assistance Program
• The city currently offers an Employee Assistance Program (EAP) administered by Business Health Services
(BHS). The current contract will expire December 31, 2019. The city is currently conducting a rebidding process for these services.
• It is recommended that the City Manager or designee be authorized select the vendor and execute the contract and further contract amendments with the selected vendor upon completion of the rebidding process.

Page 8 Hospital Indemnity
• The city currently contracts with Voya to provide voluntary, employee-paid Hospital Indemnity coverage.
• It is recommended that this benefit be converted to a city paid benefit for employees as it is an enhancement
to the medical plan offering. The benefit would be provided to all employees covered by the city’s medical plan. Employees would have the opportunity to purchase coverage for their covered family members.
• The city is currently conducting a rebidding process for these services. It is recommended that the city Manager or designee be authorized select the vendor and execute the policy and further policy amendments with the selected vendor upon completion of the rebidding process.
Voluntary Benefits
• It is recommended the city continue to enhance the benefits offering by providing access for employees to purchase additional employee-paid voluntary benefits that would provide income protection and security. These insurance benefits may include home, auto, ID theft and legal. A bidding process is currently underway to assess the options available and secure the most favorable pricing for these options.
• It is recommended that the City Manager or designee be authorized to establish the new plans, select a vendor and execute the policy and further policy amendments with the selected vendor.
Stop Loss Insurance
• The city currently contracts with BlueCross BlueShield of North Carolina for stop-loss insurance to provide protection against catastrophic or unpredictable medical claims. The policy expires December 31, 2019.
• The city will be conducting a rebidding process for stop-loss insurance. It is recommended that the city Manager or designee be authorized to either renew the current contract or select a new vendor(s) and execute the contract and further contract amendments with the selected vendor(s) upon completion of the rebidding process.
Leave
• The city currently awards four hours of vacation for every thirteen weeks an employee does not use sick leave. It is recommended that the City Manager or designee be authorized to replace this leave program into an award of one personal day per calendar year, effective January 1, 2020. This personal day must be used in the year received and will not be eligible for carry-over to future years. In addition, the personal day will not be paid out upon termination or retirement.
401(k)
o It is recommended the City Manager or designee be authorized to increase the city contribution to 401(k) for employees in the Charlotte Firefighters’ Retirement System to four percent from three percent.

Page 9
Attachments
Attachment A – Market Movement Summary
Summary of actual market movement for 2015-2018, 2019 projected market movement, and the five-year market movement average.
Attachment B – Recommended FY 2020 Public Safety Pay Plan Structure
New minimum, maximum and step rates in the Public Safety Pay Plan based on the 1.5 percent structural market adjustment recommended for FY 2020.
Attachment C – Recommended FY 2020 Salaried Pay Plan Structure Twenty-six range Salaried Pay Plan recommended for FY 2020. Attachment D – Recommended FY 2020 Hourly Pay Plan Structure New minimum and maximum rates in the Hourly Pay Plan based on the 1.5 percent structural
adjustment recommended for FY 2020.

Attachment A
Source2016
Actual Market Movement
2017 Actual Market
Movement
2018 Actual Market
Movement
2019 Actual Market
Movement
2020 Projected Market
Movement (to date)
5 Year Average Market Movement
National Statistics Provided by World at Work, Hewitt, Mercer
3.0 3.0 3.1 3.0 3.0 3.0
National Municipalities 2.4 2.5 3.0 2.5 3.0 2.7
Charlotte Area Municipalities 3.0 3.2 3.2 3.0 3.0 3.1
Large Charlotte Employers (private sector) 2.8 2.8 2.7 3.0 3.0 2.9
The Employers Association 3.0 3.0 3.1 3.4 3.2 3.1
City of Charlotte Salaried Pay Plan 1.5 3.0 3.0 3.0 3.0 (Benchmark) 2.7
Market Movement Summary(Average Percent Change)

Attachment B
New HireStep 1 Step 2 Step 3 Step 4 Step 5 Step 6 Step 7 Step 8 Step 91 Step 101 Step 11 SPO I SPO II
5.0% 5.0% 5.0% 5.0% 5.0% 5.0% 5.0% 2.5% 2.5% 5.0% 5.0% 5.0%$866.94 $910.29 $955.80 $1,003.59 $1,053.77 $1,106.46 $1,161.78 $1,219.87 $1,250.36 $1,281.62 $1,345.71 $1,413.00 $1,483.65$45,081 $47,335 $49,702 $52,187 $54,796 $57,536 $60,413 $63,433 $65,019 $66,644 $69,977 $73,476 $77,150Step 12 Step 2 Step 3 Step 4 Step 5 Proposed15.4% 2.5% 2.5% 5.0% 5.0% Police Incentives beginning
$1,630.94 $1,671.70 $1,713.50 $1,799.17 $1,889.13 2nd Language, Training Officer 5% December 2020$84,809 $86,928 $89,102 $93,557 $98,235 2 Yr degree 5% (Srg and RAC not eligible)
Proposed 4 Yr degree 10% (Srg and RAC not eligible)Proposed FY 2021 pay actions beginning
1. Consolidate steps 9 and 10 in FY 2021 December 2020
2. Eliminate Sergeant step 1 in FY 2021
Note: Response Area Commanders will remain seven percent above top Sergeant pay.
Step 1 Step 2 Step 3 Step 4 Step 55.0% 5.0% 5.0% 5.0% 5.0%
$824.69 $865.92 $909.21 $954.66 $1,002.39$42,884 $45,028 $47,279 $49,642 $52,124
Step 1 Step 2 Step 3 Step 4 Step 5 Step 6 Step 7 Step 8 Step 9 Step 10 Step 115.0% 5.0% 5.0% 2.5% 2.5% 2.5% 2.5% 2.5% 2.5% 2.5% 2.5%
$954.66 $1,002.39 $1,052.52 $1,078.83 $1,105.80 $1,133.45 $1,161.79 $1,190.84 $1,220.61 $1,251.12 $1,282.40$49,642 $52,124 $54,371 $56,099 $57,502 $58,939 $60,413 $61,924 $63,472 $65,058 $66,685
Step 1 Step 2 Step 3 Step 4 Step 5 Step 6 Step 7 Step 8 Step 9 Step 102.5% 2.5% 2.5% 2.5% 2.5% 2.5% 2.5% 2.5% 2.5% 2.5%
$1,078.83 $1,105.80 $1,133.45 $1,161.79 $1,190.84 $1,220.61 $1,251.12 $1,282.40 $1,314.46 $1,347.32$56,099 $57,502 $58,939 $60,413 $61,924 $63,472 $65,058 $66,685 $68,352 $70,061
Step 1 Step 2 Step 3 Step 4 Step 512.5% 2.5% 2.5% 5.0% 5.0% Fire Incentives
$1,515.73 $1,553.63 $1,592.47 $1,672.09 $1,755.69 2nd Language, Haz‐Mat, Search & Rescue, $78,818 $80,789 $82,808 $86,949 $91,296 Dive, Aircraft Rescue 5%
2 Yr degree 5% (Captain not eligible)4 Yr degree 10% (Captain not eligible)
Proposed FY 2021 pay actions Consolidate two or more steps and add a 2.5 percent step to the top of Firefighter II in November 2020Consolidate two or more steps and add a five percent step to the top of Firefighter Engineer in November 2020Eliminate Fire Captain step 1 and adjust remaining steps by 3.75 percent each after any market adjustment has been applied effective November 2020
3016
3006
3008
FIRE CAPTAIN
FF ENGINEER
FIREFIGHTER I
FIREFIGHTER II
3011
Recommended FY 2020 Public Safety Pay PlanFY 2020 STEP RATES IN THE PUBLIC SAFETY PAY PLAN
Pay rates shown are weekly and annual rates
POLICE DEPARTMENTInitial increase at the end of recruit school and completion of field training (app 8 mos), then annually.
POLICE SERGEANT3110
POLICE OFFICER3102

Attachment C
Range Minimum Midpoint MaximumRange 1 $44,703 $55,879 $69,848Range 2 $46,938 $58,673 $73,341Range 3 $49,285 $61,606 $77,008Range 4 $51,750 $64,687 $80,859Range 5 $54,337 $67,922 $84,902Range 6 $57,054 $71,318 $89,147Range 7 $59,907 $74,884 $93,605Range 8 $62,902 $78,628 $98,285Range 9 $66,047 $82,559 $103,199Range 10 $69,350 $86,687 $108,359Range 11 $72,817 $91,021 $113,777Range 12 $76,458 $95,572 $119,466Range 13 $80,281 $100,351 $125,439Range 14 $84,295 $105,369 $131,711Range 15 $88,510 $110,637 $138,296Range 16 $92,935 $116,169 $145,211Range 17 $97,582 $121,977 $152,472Range 18 $102,461 $128,076 $160,095Range 19 $107,584 $134,480 $168,100Range 20 $112,963 $141,204 $176,505Range 21 $124,260 $155,324 $194,156Range 22 $136,686 $170,857 $213,571Range 23 $150,354 $187,943 $234,928Range 24 $165,389 $206,737 $258,421Range 25 $181,928 $227,411 $284,263Range 26 $209,218 $261,522 $326,903
Effective July 6, 2019
Recommended FY 2020 Salaried Pay Plan Structure

Attachment D
Range Minimum Midpoint MaximumRange 1 $33,280 $33,280 $41,600Range 2 $33,280 $34,304 $42,880Range 3 $33,280 $36,019 $45,024Range 4 $33,280 $37,820 $47,275Range 5 $33,280 $39,711 $49,639Range 6 $33,357 $41,696 $52,120Range 7 $35,025 $43,781 $54,726Range 8 $36,776 $45,970 $57,463Range 9 $38,615 $48,269 $60,337Range 10 $40,546 $50,683 $63,354Range 11 $42,574 $53,217 $66,522Range 12 $44,703 $55,879 $69,848Range 13 $46,938 $58,673 $73,341Range 14 $49,285 $61,606 $77,008Range 15 $51,750 $64,687 $80,859Range 16 $54,337 $67,922 $84,902Range 17 $57,054 $71,318 $89,147Range 18 $59,907 $74,884 $93,605Range 19 $62,902 $78,628 $98,285Range 20 $66,047 $82,559 $103,199
Recommended FY 2020Hourly Pay Plan StructureEffective December 7, 2020
Top Related
Copyright © 2022 FDOKUMEN

