


Bahasa
Halaman
Hukum

Promoting Energy Access Projects under the Clean Development Mechanism Standardized Baselines and Suppressed Demand
New concepts under the Clean Development Mechanism (CDM), namely standardized baselines and
suppressed demand, should facilitate the implementation of CDM energy access projects, particularly
in Least Developed Countries (LDCs), by reducing transaction costs and reflecting the real emission
reductions achieved. Governments and authorities in LDCs can play a prominent role in making these
new CDM opportunities available. The improvement of the regulatory framework can facilitate the
development of innovative carbon-based financing schemes required for successful scaling-up of
CDM energy access projects in LDCs.
This paper is part of a work program on technical aspects of CDM regulation and project cycle
improvement started by the World Bank in May 2011 at Carbon Expo in Barcelona. This work
benefited from intensive consultations with representatives from developing countries’ Designated
National Authorities and from Annex I countries, practitioners, and experts on the CDM during two
workshops held in 2011. The paper was prepared by a team from the Carbon Finance Unit of the
Climate Policy and Finance Department of the World Bank, consisting of Harikumar Gadde (lead
author), Affouda Leon Biaou, Alexandrina Platonova-Oquab, Julie Godin and Klaus Oppermann.
Financial support was provided by the CDCF Technical Assistance Trust Fund, the technical assistance
fund associated with the Community Development Carbon Fund and funded by contributions from
the governments of Canada, Italy, Spain, and of the Walloon Region of Belgium, as well as the United
Nations Environment Programme (UNEP).
Promoting Energy Access CDM Projects under the Clean Development Mechanism
2
Table of Contents 1.0 INTRODUCTION ................................................................................................................................. 3
2.0 CDM PROJECTS IN LDCS – STATUS UPDATE ....................................................................................... 4
3.0 ENERGY ACCESS PROJECTS IN LDCS .................................................................................................... 6
4.0 NEW APPROACHES UNDER THE CDM FOR ENERGY ACCESS PROJECTS IN LDCS ................................. 8
5.0 CHALLENGES IN THE APPLICATION OF STANDARDIZED BASELINE GUIDELINES FOR RURAL ENERGY
ACCESS PROJECTS............................................................................................................................. 15
6.0 RECOMMENDATIONS ...................................................................................................................... 17
7.0 CONCLUSION .................................................................................................................................... 18
BIBLIOGRAPHY ............................................................................................................................................... 19
ANNEX I: HOW MINIMUM SERVICE LEVEL IS ESTABLISHED FOR HOUSEHOLD ELECTRICITY CONSUMPTION .. 20
ANNEX II: STANDARDIZATION FOR RURAL ENERGY ACCESS PROJECTS .......................................................... 22
Table 1: Types of PoAs targeting energy access in LDCs ......................................................................... 4
Table 2: Simplified additionality rules for various project types in LDCs and small island developing
countries ................................................................................................................................................. 8
Table A 1: Selected values for electricity consumption in rural households ........................................ 21
Figure 1: Major initiatives taken by CDM EB .......................................................................................... 8
Figure 2: Expected benefits of standardization ...................................................................................... 9
Figure 3: Different standardization approaches ................................................................................... 11
Figure 4: Comparison of the two paths for standardization ................................................................. 12
Figure A 1: Baseline and emission factor under Path # 1 ..................................................................... 23

Promoting Energy Access CDM Projects under the Clean Development Mechanism
3
1.0 Introduction
About one in five people in least developed countries (LDCs) lack access to electricity.1 High
dependence on traditional fuels like fuel wood for cooking and heating and kerosene for lighting
contributes to unsustainable living conditions and greenhouse gas (GHG) emissions. In order to
achieve universal access to energy by 2030—one of the United Nation’s Sustainable Energy for All
Goals—LDCs need to scale up investments in the energy sector. Carbon crediting under the Clean
Development Mechanism (CDM) as well as other standards can support these investments by
providing an additional stream of revenues, both at the time of the initial investment and in the
operational phase, and make these investments sustainable. The economics of carbon crediting are
favorable to energy access projects such as rural electrification or improved cook stoves. However,
only a few of these projects have been implemented so far under the CDM in LDCs. This paper
argues that new developments in CDM regulation, in particular using standardized baselines and
taking into account suppressed demand, can accelerate the development and implementation of
energy access projects in LDCs, provided their operationalization is simplified and enhanced.2 Other
major building blocks in this context are the establishment of a positive list approach to additionality
demonstration for micro-scale project activities and the development of top-down methodologies.
However, an improved CDM is in itself not sufficient to promote energy access projects on a larger
scale. It has to be accompanied by innovative financial solutions that allow for the front-loading of
carbon revenues. It also relies on the host country governments and Designated National Authorities
(DNAs) to take on a more prominent role, something that is already anticipated in the new CDM
concepts.
The main purpose of this paper is to outline how the new CDM concepts of standardized baselines
and suppressed demand may be used to promote energy access projects under the CDM, in the
context of new and expanded role of host country DNAs. In the process, the paper also identifies
challenges in the use of these concepts and opportunities for further simplification. By way of
illustration, one specific energy access technology, solar home systems, is analyzed in detail. The
paper is organized as follows: Chapter 2 provides an overview of the current status of CDM projects
in LDCs; Chapter 3 introduces energy access projects in LDCs; Chapter 4 outlines new approaches
under the CDM for energy access projects; Chapter 5 goes into the challenges for the application of
standardized baselines in LDCs; and Chapter 6 gives recommendations on implementing the new
CDM concepts.
1 WEO 2011, UNDP, the World Bank 2 For more on this, refer to the recent World Bank report entitled “CDM Reform: Improving the efficiency and outreach of the Clean Development Mechanism through standardization.”

Promoting Energy Access CDM Projects under the Clean Development Mechanism
4
2.0 CDM projects in LDCs – status update To date, low-income regions with low energy access make little use of carbon finance mechanisms
for leveraging investments in the household energy sector. As of February 1, 2013, least developed
countries (LDC)3 only hosted 1.2 percent of all CDM projects worldwide4. Only 35 of all currently
registered CDM projects5 (that is, 0.6 percent of the total number of CDM projects) target increased
or improved energy access for households and of these, fourteen are located in LDCs. These 14
projects have the potential to reduce emissions by up to 0.5 million tons of CO2e per year6 but to
date less than 3,000 tCO2e emission reductions have been verified and issued.
Though the share of stand-alone CDM projects3 in LDCs, is very low, the share of programmes of
activities (PoAs)3 is higher (11 percent7). Many of the PoAs in these countries target enhanced and
higher-quality energy access. As of February 1, 2013, there were more than 42 PoAs from LDCs in the
CDM pipeline, mostly targeting energy access projects, as illustrated in Table 1 below
Table 1: Types of PoAs targeting energy access in LDCs
Host country Type of PoAs
Bangladesh Solar PV, EE households stoves, households lighting
Rwanda EE households stoves
Senegal Households lighting
Tanzania Solar lamps, micro hydro for off-grids
Togo EE household stoves
Nepal, Zambia, East & West Africa Cook stoves
Research suggests Sub-Saharan Africa could develop more than 3,000 CDM projects, which could
reduce GHG emissions by approximately 10 billion tons over a crediting period of 10 years8 (World
Bank, 2009). The realization of this CDM potential could significantly enhance sustainable
development in the region, as it would attract more than $200 billion in investment and could
generate annual carbon revenues in the range of $5–10 billion (based on a carbon price of $5–10 per
tCO2e). In comparison, the annual official developmental assistance (ODA) committed to Sub-
Saharan Africa (including South Africa) during 2010 amounted to $48 billion.9
3 LDCs included are Haiti, Bangladesh, Bhutan, Cambodia, Lao PDR, Myanmar, Nepal, Angola, Burkina Paso, Burundi, Chad, Congo DR,
Equatorial Guinea, Ethiopia, Lesotho, Liberia, Madagascar, Malawi, Mali, Mozambique, Niger, Rwanda, Senegal, Sierra Leone, Sudan, United Republic of Tanzania, Togo, Uganda and Zambia 4 Including projects under validation, requesting registration, and registered
5 Projects and programs (POA) using methodologies AMS-I.A., AMS-I.E., AMS-I.F., AMS-I.L., AMS-II.G, AMS-III.AR, and AMS-III.AW
6 For PoAs, only CPAs included during registration are considered.
7 Source: UNFCCC website, UNEP RISOE database
8 A recent study commissioned by the German Federal Ministry for the Environment (BMU) identifies a technical abatement potential of
10.7 million tCO2e from cook stove projects alone, in 11 selected LDCs in Sub-Saharan Africa. 9 Data for year 2010; source: OECD - http://stats.oecd.org/Index.aspx?DataSetCode=AEO11_OVERVIEW_CHAPTER2_FIG1_EN

Promoting Energy Access CDM Projects under the Clean Development Mechanism
5
Despite the low uptake of CDM projects in LDCs so far, consensus is building on the important role
that carbon finance can play in supporting the development agenda in poor countries. While Africa
has not benefited much from the CDM during the first commitment period of the Kyoto Protocol,
interest has been growing recently in using the CDM to deliver results-based financing for mitigation
and development projects. New generation instruments such as the World Bank’s Carbon Initiative
for Development (CiDev) are designed to support a portfolio of CDM programs in the energy sector
in Africa by purchasing and retiring the credits they will generate, in effect piloting an innovative
approach to results-based financing for energy access. These approaches do not rely on existing
carbon markets as they do not depend on demand for carbon credits from mitigation targets in
industrialized countries. In fact they are moving away from offsetting into climate finance. Applying
a logic of results-based finance to the CDM enables to rethink and to reposition the mechanism but
also shows the urgent need for further and more far reaching CDM reform efforts including on
simplifying the CDM project cycle.

Promoting Energy Access CDM Projects under the Clean Development Mechanism
6
Box 1. What is suppressed demand?
Suppressed demand arises when the actual demand of user groups
(mostly households) is insufficient to meet their basic human needs due
to low income (income effect), inadequate infrastructure, the high costs
of technology, or a combination of these. In many LDCs, household
consumption is constrained by these factors and, as a result, their basic
human needs go unmet. As the situation improves, for example, incomes
start rising, consumption levels are likely to go up as well and over time
basic human needs will be duly met. Moreover, as technology costs go
down and energy efficiency goes up, households may start using more
services (rebound effect). At present there are no accurate methods to
estimate suppressed demand or define basic (that is, minimum) human
needs or levels for services such as lighting and cooking.
3.0 Energy access projects in LDCs There are, generally speaking, two common types of energy access projects in LDCs—one that aims
to increase rural electricity supply and another one that aims to improve cooking facilities. Rural
electrification is usually achieved through (i) the installation of systems such as solar home systems
and solar lanterns (off-grid electrification); (ii) the development of mini and isolated grids by using
diesel generators, micro hydro plants, biomass plants, solar photo-voltaic systems, and the like; and
(iii) the extension of the main grid to areas that are close to grid-connected areas. Cooking facilities
are improved by providing efficient cook stoves, bio-digesters, and LPG stoves.
For rural electrification projects in off-grid areas, fossil fuel consumption is reduced primarily by
replacing fuel-based lighting with lighting that adopts new technologies like solar lanterns, PV based
systems, LEDs etc. For cook stove projects, improved combustion reduces fuel consumption and
thereby also reduces GHG emissions.
The high initial up-front costs associated with the deployment of these systems may be offset to
some extent by carbon revenues. A rough estimate of carbon finance potential reveals that the
installation of the most commonly used solar home system of 40–50 Wp capacity in a household
(costing around $500) can yield carbon revenues of $0.5–5 per year,10 while the installation of an
improved cook stove (costing $20–50) can earn up to $10–20 per year. Carbon revenues cover a
larger portion of the total costs of purchase and operation of cook stoves projects than solar home
or grid extension projects, mainly because of the high upfront costs involved and varying degree of
carbon reduction potential due to uncertainty with baseline establishment. The rural energy access
projects are also expected to result in considerable co-benefits in terms of improved health, reduced
indoor air pollution, and reduced forest degradation, to name just a few. More importantly, these
projects also expected to result in black carbon emission reductions which are considered to be one
of the largest contributor of the climate change, next to carbon dioxide emissions.
In the case of rural electrification
projects, the quantification of emission
reductions is generally based on
historical baseline consumption (or
reference) levels, which are low but do
not take into account the minimum
level of consumption that is necessary
for meeting basic human needs—a
situation known as suppressed
demand. Estimation of emission
reductions based on such low and
inadequate reference levels results in
low emission reductions. In addition, the grid emission factor in many LDCs is low due to the
10
Assuming a carbon saving potential of 0.1 to 0.5 tCO2 per year, depending on the amount of kerosene fuel saved.

Promoting Energy Access CDM Projects under the Clean Development Mechanism
7
Box 2. What is a standardized baseline?
Standardized baseline allows setting a baseline that is
not necessarily specific to one type of project activity,
but can be applicable to most of the possible project
activities in a sector. Also, additionality does not have to
be demonstrated for each individual project activity ex-
post (after its formulation) but rather for specific types
of measures and ex-ante. For example, for off-grid
electrification projects, this approach allows to set a
baseline, say for lighting service, at the sector level and
identify specific technology(ies)/measures that provide
services and can automatically be considered additional.
relatively high share of renewable energy-based generation.
Suppressed demand (see box 1), a feature highly relevant and applicable to projects targeting
improved energy access in low-income countries, is not yet duly recognized and covered under the
present CDM methodologies and guidelines. Yet following the recent approval of suppressed
demand guidelines, a few CDM methodologies have attempted to address this shortcoming.
Unfortunately, they still fail to properly take into account achievable emissions reductions, mainly
because of the lack of data for establishing baselines.
In addition, many of the existing methodologies
that target increased or improved energy access
require extensive data to establish baselines, and
data monitoring costs are high. The recent
approval of standardized baseline guidelines11
(see box 2) by the CDM EB makes it easier to set
baselines and determine the additionality for
these project types by doing so ex-ante at the
sector rather than the project level. Though these
guidelines are expected to simplify the process,
further improvements are possible and necessary,
especially regarding monitoring requirements.
Standardization can also be achieved through other methods, for example, using performance
benchmarks, that is, default values fed directly into the CDM methodologies.
11
http://cdm.unfccc.int/Reference/Guidclarif/meth/meth_guid42.pdf
Promoting Energy Access CDM Projects under the Clean Development Mechanism
8
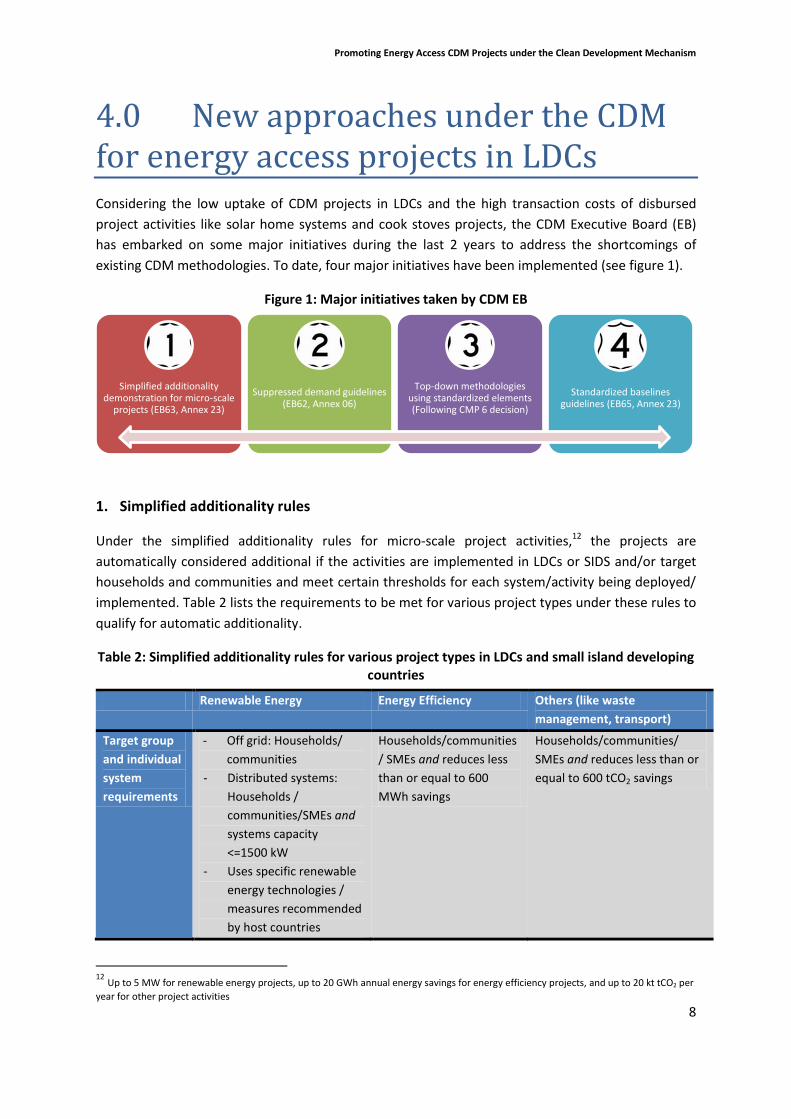
4.0 New approaches under the CDM for energy access projects in LDCs Considering the low uptake of CDM projects in LDCs and the high transaction costs of disbursed
project activities like solar home systems and cook stoves projects, the CDM Executive Board (EB)
has embarked on some major initiatives during the last 2 years to address the shortcomings of
existing CDM methodologies. To date, four major initiatives have been implemented (see figure 1).
Figure 1: Major initiatives taken by CDM EB
1. Simplified additionality rules
Under the simplified additionality rules for micro-scale project activities,12 the projects are
automatically considered additional if the activities are implemented in LDCs or SIDS and/or target
households and communities and meet certain thresholds for each system/activity being deployed/
implemented. Table 2 lists the requirements to be met for various project types under these rules to
qualify for automatic additionality.
Table 2: Simplified additionality rules for various project types in LDCs and small island developing countries
Renewable Energy Energy Efficiency Others (like waste
management, transport)
Target group
and individual
system
requirements
- Off grid: Households/
communities
- Distributed systems:
Households /
communities/SMEs and
systems capacity
<=1500 kW
- Uses specific renewable
energy technologies /
measures recommended
by host countries
Households/communities
/ SMEs and reduces less
than or equal to 600
MWh savings
Households/communities/
SMEs and reduces less than or
equal to 600 tCO2 savings
12
Up to 5 MW for renewable energy projects, up to 20 GWh annual energy savings for energy efficiency projects, and up to 20 kt tCO2 per
year for other project activities
Simplified additionality demonstration for micro-scale
projects (EB63, Annex 23)
Suppressed demand guidelines (EB62, Annex 06)
Top-down methodologies using standardized elements (Following CMP 6 decision)
Standardized baselines guidelines (EB65, Annex 23)

Promoting Energy Access CDM Projects under the Clean Development Mechanism
9
2. Suppressed demand guidelines
The approval of the suppressed demand guidelines recognizes a baseline scenario where future
emissions by sources are projected to rise above current levels, due to the specific circumstances of
the host party. They are applicable when the service level that was available to the end user of the
service prior to the implementation of the project activity was too low to meet basic human needs.
The application of these guidelines is expected to help with the identification of the baseline
technology/measure under a suppressed demand scenario and of a baseline service level to be used
to calculate baseline emissions. The guidelines allow for three ways of identifying baseline service
levels, depending on the type of project activity: (i) based on services provided prior to project
activity; (ii) based on services provided during the project activity, and (iii) based on minimum
service levels identified.
The identification of a minimum service level needs to ensure that it meets the basic human needs
and makes possible the development of the type of project at hand. However, financial viability
alone cannot be the deciding factor in determining the minimum service level, as this might
compromise environmental integrity. An approach that allows the selection of a service level that is
higher than the one provided prior to the implementation of the project (as it takes into account the
income and rebound effect) but entails an increase in baseline emissions, may provide an
opportunity for technological leapfrogging to a low emission path and clean development.
3. Standardized baselines
The establishment of standardized baselines is expected to improve CDM efficiency since
determining the baseline and demonstrating additionality are often among the most complex phases
of the CDM project cycle. Standardized baselines have the potential to increase the objectivity of
assessment and validation, and simplify data gathering at the project level. In addition, several
benefits are expected, including the reduction of transaction costs, increased transparency, better
predictability of emission reductions, and potentially scaling up of the abatement of GHG emissions
in underrepresented sectors and countries.
Figure 2: Expected benefits of standardization
•Sets appropriate baseline at aggregated level
•Can be linked to additionality demonstration
Baseline
•Certain types/measures can be declared as additional with positive lists
•Allows automatic additionality
Additionality •Reduces number of
parameters to be monitored
•Reduces monitoring costs
•Improves environmental integrity
Monitoring
Promoting Energy Access CDM Projects under the Clean Development Mechanism
10
Several approaches have been identified for standardization. These include the identification and
definition of criteria, the setting of reference values, and the selection of parameters considered
representative and applicable for a pre-defined population of project activities.13
Currently, standardization of baselines and additionality can be achieved through two paths:
(i) Path # 1: By introducing standardized elements into the development of new technologies or the
revision of approved methodologies; examples of this are approved methodologies such as
AM0070: Manufacturing of energy efficient domestic refrigerators, AM0091: Energy efficiency
technologies and fuel switching in new buildings, and AMS-III.AV.: Low greenhouse gas emitting
water purification systems.
(ii) Path # 2: By following the UNFCCC Guidelines on standardization14 for the ex-ante identification
at the country or regional level of technologies/measures that are additional and of baseline
technologies with the corresponding emission factor. No approved standardized baselines under
this path existed as of February 1, 2013.
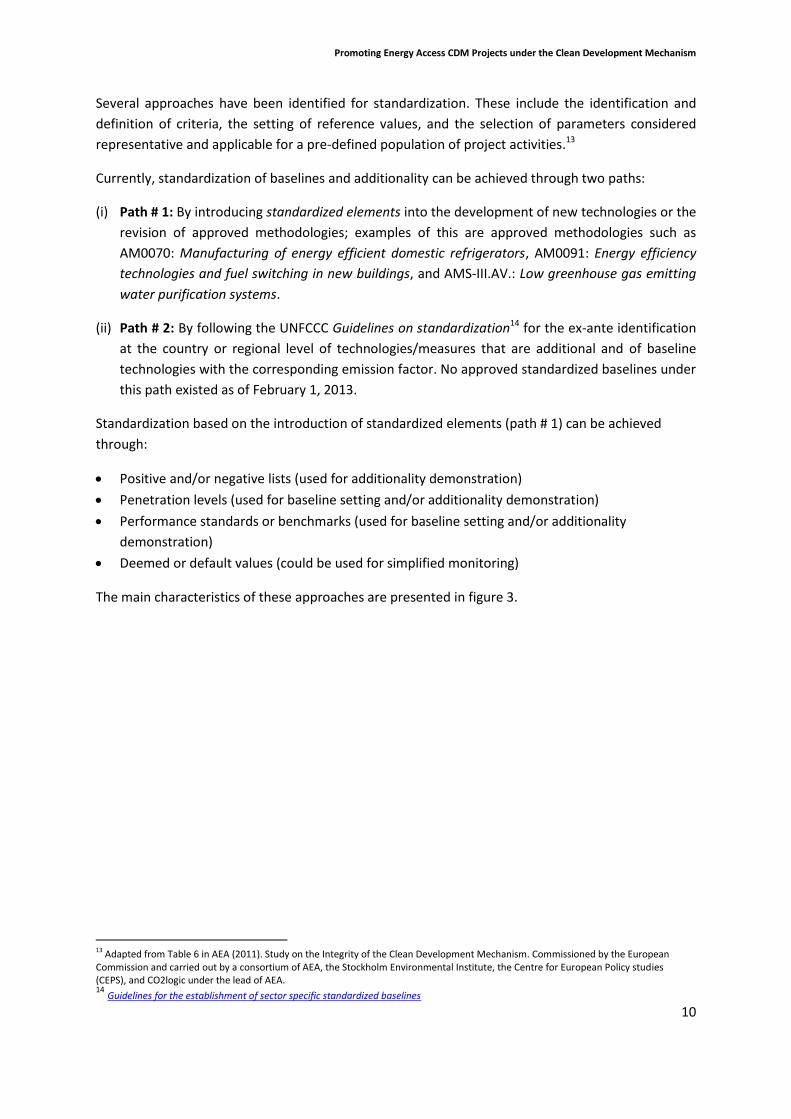
Standardization based on the introduction of standardized elements (path # 1) can be achieved
through:
Positive and/or negative lists (used for additionality demonstration)
Penetration levels (used for baseline setting and/or additionality demonstration)
Performance standards or benchmarks (used for baseline setting and/or additionality
demonstration)
Deemed or default values (could be used for simplified monitoring)
The main characteristics of these approaches are presented in figure 3.
13 Adapted from Table 6 in AEA (2011). Study on the Integrity of the Clean Development Mechanism. Commissioned by the European Commission and carried out by a consortium of AEA, the Stockholm Environmental Institute, the Centre for European Policy studies (CEPS), and CO2logic under the lead of AEA. 14
Guidelines for the establishment of sector specific standardized baselines
Promoting Energy Access CDM Projects under the Clean Development Mechanism
11
Figure 3: Different standardization approaches
Following CMP 6 decision, the CDM EB also initiated the development of standardized approaches
by “prioritizing methodologies that are applicable to least developed countries (LDCs), small island
developing states (SIDS), Parties with 10 or fewer registered CDM project activities as of 31
December 2010 and underrepresented project activity types or regions, inter alia, for energy
generation in isolated systems, transport and agriculture” under standard top-down approach. This
work is to be done in consultation with DNAs. Some of the methodologies approved by the EB to
date are AMS-I.J.: Solar water heating systems (SWH) and AMS-III.AR.: Substituting fossil fuel based
lighting with LED/CFL lighting systems.
Which path to choose for standardization depends on several important aspects such as:
Country CDM strategy
Potential in the sector
Measure/technology under consideration
Expected relative change in emission reduction volumes
Data availability and ease of access
Time required for development and approval
Existing development capacity (institutional and technical)
DNAs and project developers will base their choice on an assessment of the merits associated with
each path.
• Pre-identification of technologies/measures that are commercially unattractive and face barriers in a country/ region;
• Specific to technologies, project scale and conditions such as socio-economic, climate, energy prices, etc
Positive Lists
• Pre-identification of technologies/measures that are commercially very attractive and faces no barriers in a country/ region
• Specific to technologies, project scale and conditions such as socio-economic, climatic, energy prices etc
Negative Lists
• Based on market share of product sales, penetration rate of a technology or penetration level of a practice
Penetration Levels
• Based on emission rates of per unit of service or output
• Based on current/future performance of a peer group of similar plants
Performance Standards
• Available ex-ante
• Can be used directly for calculations
• Can be decided politically or justified by proper data sources
Default values

Promoting Energy Access CDM Projects under the Clean Development Mechanism
12
Standardization for rural energy access projects
In the case of improved energy access projects, standardization coupled with suppressed demand
considerations has the potential to: (i) improve the accuracy of baseline establishment; (ii) increase
the volume of claimable emission reductions; and (iii) reduce monitoring costs.
Table 3 compares the two paths of standardization for increasing electricity access15 through the use
of solar home systems (off-grid electrification; refer to annex II for a detailed analysis).
Standardization under path # 1 is demonstrated through the recently approved methodology AMS-
I.L.: Electrification of rural communities using renewable energy, developed by the World Bank.
Under this approach, the baseline technology and the fuel used for each category of household
application (such as lighting and other household appliances) are pre-established, based on a specific
minimum service level (that is, 250 KWh; please refer to annex 1 for details on how the minimum
service level for household electricity consumption was established). Depending on the electricity
use (or consumption) of each household in a project scenario, a tiered “default” emission factor is
established.
Figure 4: Comparison of the two paths for standardization
Parameter Path # 1: Using standardized
elements in to methodologies
Path # 2: Using UNFCCC guidelines
on standardized baselines
Applicability Global Country-specific
Owner Public good Country-specific (respective DNA16)
Standardization
approach
Using default values Following UNFCCC guidelines
Data needs for
development and its
approval
Low High (initially)
Additionality Can be eligible to use the
micro-scale guidelines
Identified technology will become
part of a positive list and hence
automatically additional at the
project level
Baseline identification Needs to use global data and
allows use of more default
data
Needs to use country-specific data
and data collection is required for
the “output” of the selected
technology/service provided
Suppressed demand
considerations
Possible using suppressed
demand guidelines but the
minimum service level value
identified will be common to
all countries
Possible using suppressed demand
guidelines but no clear guidance on
how to take this into account in the
guidelines; the minimum service
level value identified will be
specific to the country
15
Similar analyses may be done for projects targeting increased energy access through the use of improved cook stoves, bio-digesters,
etc. 16
Designated National Authority

Promoting Energy Access CDM Projects under the Clean Development Mechanism
13
Parameter Path # 1: Using standardized
elements in to methodologies
Path # 2: Using UNFCCC guidelines
on standardized baselines
Emission reduction
potential
Higher compared to
methodologies without
suppressed demand
accounting; depends on a
minimum service level
considered at a global level
Higher compared to methodologies
without suppressed demand
accounting; depends on a minimum
service level set a country level
Monitoring Simplified, as it requires only
the monitoring of the number
of systems in operation
Simplified, as it requires only the
monitoring of the number of
systems in operation
Costs for development
(relative)
Low High
Capacity needed
(relative)
Low High (and remain to be tested)
Approval procedure Developed and submitted by
project entity and approved by
the Small-scale working group
and finally by the CDM
Executive Board
Developed by either project entity
or any international organization or
DNA; submitted by DNA to the
CDM Executive Board for its
approval
Monitoring and standardization
Simplification of baseline identification and the use of more default values through standardization
are expected to reduce the number of parameters that have to be monitored ex-post. The
standardization approach and its impact on monitoring are expected to vary with the type of
technology and measure selected. A few existing methodologies already benefit from simplified
monitoring requirements by allowing a certain degree of standardization (for example, AMS-I.A:
Electricity generation by the user). Standardization of a few important ex-post monitoring parameter
values is expected to significantly lower monitoring costs. For example, standardization of the
“availability factor” of the solar home systems should reduce monitoring costs by not having to
measure the electricity generation of each system. The same goes for the standardization of
household level electricity consumption in relation to income levels and usage patterns. The
recognition of opportunities for simplified monitoring and verification under standardized baseline
approaches based on guidelines should encourage the development of more standardized baselines.
In view of the above, if DNAs and/or project developers have to choose a path, the decision matrix
presented below may help in the selection process (although the ideal path will depend on the type
of technology/measure and overall merits of each path chosen).

Promoting Energy Access CDM Projects under the Clean Development Mechanism
14
Path # 1: Methodology path:
Path # 2: UNFCCC standardized baseline guidelines path:
The establishment of standardized baselines following UNFCCC guidelines, which requires host
country DNA to submit to CDM EB, would make it easier to set baselines and determine additionality
for a select number of measures/technologies in a given country (valid for 3 years, under current
guidelines). In this way, all projects from that specific country would benefit from lower data
collection costs in terms of time and money. However, the associated maintenance aspects, such as
the need to update the data once every 3 years and budget more financial resources, also have to be
taken into account when deciding on the best path for achieving the standardization.
Global
Technology / Measure
Low
Data needs
High
Ease of data
availability
Low
Time for data
collection Low
Capacity for development
Specific to country circumstances
Technology / Measure
High
Data needs
Low
Ease of data
availability
High
Time for data
collection High
Capacity for development
Promoting Energy Access CDM Projects under the Clean Development Mechanism
15
5.0 Challenges in the application of standardized baseline guidelines for rural energy access projects Despite the advantages deriving from the identification of customized standardization and country-
specific circumstances, the application of guidelines to rural energy access projects faces challenges.
The main challenges foreseen (as this approach is yet to be tested) are the following:
Duly taking into account suppressed demand: The standardized baseline guidelines do not
provide enough guidance and clarification on how suppressed demand needs to be accounted
for while identifying the baseline technology and emission factor. Identification of baseline
technology and emission factor might be completely different in a scenario without proper
suppressed demand accounting.
Considering differences in the service quality: The guidelines only specify how to consider the
output in the sector and identify the corresponding technologies and fuels but fail to specify
clearly how to determine the service quality of the output for consideration. As there will always
be several technologies/fuels available to provide a given output (for example, heating for
cooking), selection and differentiation of technologies based on the quality of output provided
would narrow down the list of technologies (for example, this may eliminate LPG stove from the
list for heating).
Quantification of barriers: The guidelines provide little guidance on how to objectively quantify
barriers that the identified technologies face and whether they can be applied in
technologies/measures in rural energy projects to eliminate technologies that are commercially
unattractive. If cost is the principal and sole consideration for elimination of certain technologies
from the list, it is not clear how the impact of existing policy incentives is to be taken into
account, especially if such policy intervention is costly but makes the technology itself cheaper.
More important, focusing on capital or levelized cost analysis of technologies for additionality
demonstration completely ignores the practical difficulties and barriers that exist for the
implementation of certain technologies in poorer countries.
Use of sector-specific values: Considering the very diverse range of activities and the very
limited availability of data in any sector (in most countries), the establishment of a baseline
emission factor based on country-specific information may be too costly as it involves huge data
gathering requirements. Moreover, the collection of data in line with the quality
assurance/quality control guidelines set by the EB appears to be very labor-intensive and costly.
Data vintage and update frequency: Standardized baseline guidelines require updates every 3
years for all relevant parameters used in the development of the standardized baselines. A
period of 3 years may be considered short, compared to the effort needed to establish
standardized baselines; the effort is a data-intensive process that requires funding, and might
become a barrier to the development of standardized baselines, particularly for LDCs.
Furthermore, application of any updates to the baseline for already registered projects before
their crediting period renewal could affect the predictability of carbon revenues..

Promoting Energy Access CDM Projects under the Clean Development Mechanism
16
Unpredictable project cycle and regulatory procedures: Apart from the technical difficulties,
there are challenges and limitations related to the current regulatory and procedural gaps for
projects that are eligible for the use of sector-specific standardized baselines. Lengthy
registration cycles for projects with relatively short implementation timeframes, such as energy
access projects, provide a disincentive for project developers as they have to forego carbon
revenues in the period from the implementation date to the registration date. These issues
could be addressed more effectively by creating more certain, predictable, and standardized
project cycles.17
17 For more on this point, refer to the recent World Bank report entitled “CDM Reform: Improving the efficiency and outreach of the Clean Development Mechanism through standardization.”
Promoting Energy Access CDM Projects under the Clean Development Mechanism
17
6.0 Recommendations Considering challenges foreseen with development of standardized baseline guidelines for rural
energy access projects, the following recommendations are made for their improvement and easy
operationalization:
Allow the use of more default values: As the experience in LDCs shows data availability is often
a problem. It would therefore be useful to propose default values for various common
parameters that could be applied globally. Should a country DNA choose to use these default
values, these data could be used for all facilities that utilize standardized baselines. The adoption
of materiality standards in the application of this guidance would be useful.
Recognize the use of data already available—both nationally and internationally: Considering
the difficulties inherent in collecting facility-specific and user-specific data, the guidance
document should accept the use of existing data that have been collected for other purposes,
for instance, through household surveys. In addition, allow the use of secondary data collected
by relevant national institutes or government agencies for various purposes in addition to
country-specific data published by the International Energy Agency (IEA), the Food and
Agricultural Organization (FAO), etc.
Be flexible as far as data vintage and update frequency goes: As pointed out earlier, a
mandatory update every 3 years may be especially costly in the context of LDCs. A preferred
approach would be to allow cross-checking of data every 3 years, based on a relevant indicator
such as market penetration with a pre-defined threshold, and update after 5 years only if it falls
below that threshold.
Guidance on minimum service levels: Whenever information on minimum service levels is not
available or varying minimum service levels are reported, a procedure for defining default values
for minimum service levels by DNAs and communication to the UNFCCC needs to be specified to
avoid variations on the minimum service levels identified by the project developers. Guidelines
need to be defined on the procedure for requesting the revision of a minimum service level
approved by DNA or EB for situations in which the approved minimum service level is not
relevant to the project/program contexts.
Allow the use of service quality as a criterion: Guidance on how to recognize the quality of
service needed and provided would help the developer narrow down the list of relevant
technologies/measures and thus reduce the amount of data and data analysis needed. This
would also help identify the technologies that are substitutable while eliminating the
technologies that are too costly.
Promoting Energy Access CDM Projects under the Clean Development Mechanism
18
7.0 Conclusion More options are now available to standardize the way baselines are established and additionality is
demonstrated for projects and PoAs under the CDM, in a way that could reduce transaction costs
and increase predictability. DNAs have the prerogative to submit standardized baselines that define
additionality as well as baseline emissions for specific sectors suited to their country’s
circumstances. DNAs have been given a much more important role in order to enhance the regional
distribution of CDM projects; they have a major role to play in the establishment of sector-specific,
standardized baselines that take into account their national circumstances so as to promote the
taking-up of CDM projects. In addition, development of standardized baselines could simplify the
CDM project cycle procedures and hence reduced transaction costs, increased predictability and
efficiency. Setting standardized baselines at the national level in priority sectors could provide
important incentives for transitioning to low carbon development. Coordination among government
agencies in identifying the priority sectors and collecting data is also likely to be an important
element of the implementation. Given the pragmatic nature of the approach and its sectoral
implications, the implementation of this concept could represent a bridge as well as a learning
opportunity toward new market mechanisms. Implementation could be linked to government
priorities to create incentives for low carbon development in key sectors. However, whether to opt
for the use of the Guidelines to establish sector-specific standardized baselines or a use of
standardized elements in to a methodology will depend on different factors, among other things the
potential for GHG emission reductions at the national level, and the availability of data and
resources.

Promoting Energy Access CDM Projects under the Clean Development Mechanism
19
Bibliography AEA. 2011. “Study on the Integrity of the Clean Development Mechanism.” Commissioned by the
European Commission and carried out by a consortium of AEA, the Stockholm Environmental
Institute, the Centre for European Policy studies (CEPS), and CO2logic under the lead of AEA.
ESMAP (Energy Sector Management Assistance Programme). 2007. “Technical and Economic
Assessment of Off-grid, Mini-grid and Grid Electrification Technologies.” ESMAP Technical Paper
121/07. Washington, DC: World Bank.
Lazarus, M., S. Kartha, and S. Bernow. 2000. Key Issues in Benchmark Baselines for the CDM:
Aggregation, Stringency, Cohorts, and Updating. Stockholm Environmental Institute.
Probase. 2002. “Procedures for Accounting and Baselines for JI and CDM Projects.” Final Report,
Groningen.
World Bank. 2011. Quantifying Carbon and Distributional Benefits of Solar Home System
Programmes in Bangladesh. Washington, DC: World Bank.
UNEP RISOE 2012. CDM Pipeline Analysis and Database as of April 1, 2012.
UNFCCC 2011. Guidelines for the establishment of sector specific standardized baselines v2.0 EB 65
Annex 23 (http://cdm.unfccc.int/Reference/Guidclarif/meth/meth_guid42.pdf)
UNFCCC 2011. Guidelines on the consideration of suppressed demand in CDM methodologies
(http://cdm.unfccc.int/Reference/Guidclarif/meth/meth_guid41.pdf).
Promoting Energy Access CDM Projects under the Clean Development Mechanism
20
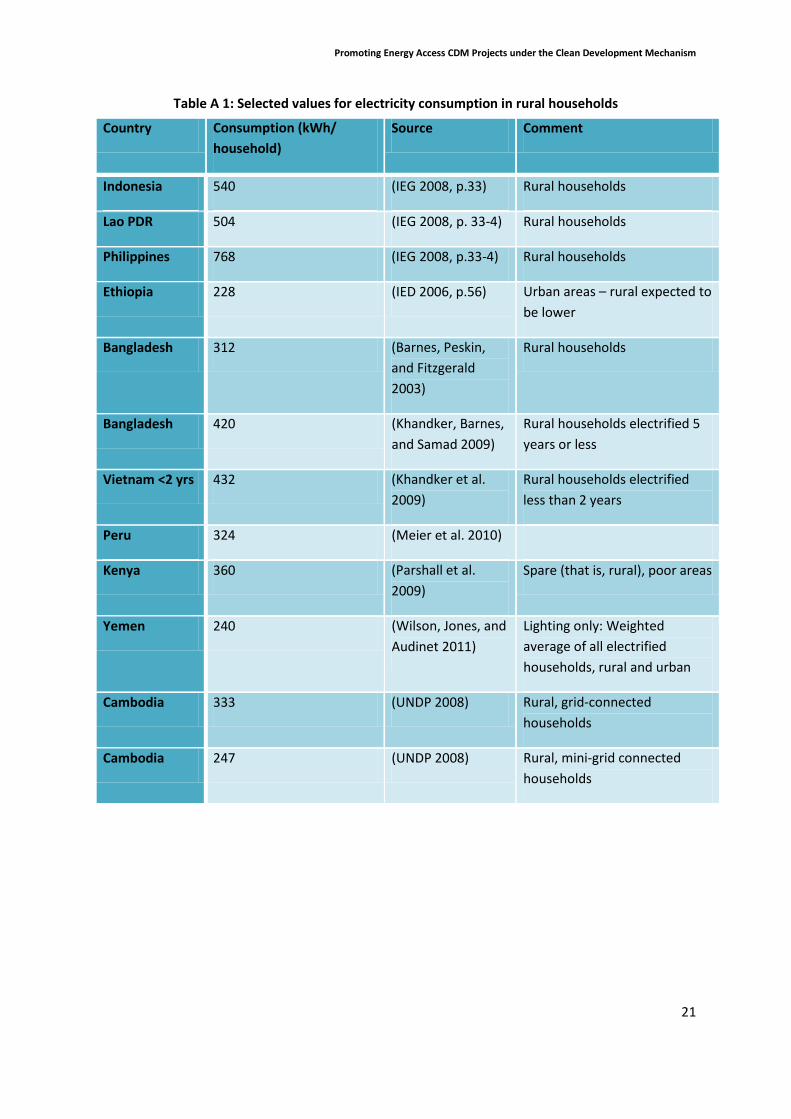
Annex I: How minimum service level is established for household electricity consumption
The most prominent source for a minimum service level related to household electricity
consumption is the work of the International Energy Agency (IEA), UNPD, and UNIDO on the amount
of energy required to eliminate energy poverty worldwide by 2030 (IEA 2010). The analysis of
electricity requirements states:
“To assess the extent of the additional generating capacity required to achieve universal access, we
have made assumptions about minimum levels of consumption at both the rural and urban level:
rural households are assumed to consume at least 250 kWh per year and urban households 500 kWh
per year. In rural areas, this level of consumption could provide for the use, for example, of a floor
fan, two compact fluorescent light bulbs and a radio for about five hours per day. In urban areas,
consumption could also include a television and another appliance, such as an efficient refrigerator
or a computer. Consumption is assumed to rise every year until reaching the average national level.”
(IEA 2010)
Note that while the latest analysis gives a floor fan, CFLs and a radio as an example, other
combinations of appliances are also possible (see the reference to the IEA study above).
This most recent analysis of basic energy needs follows a similar analysis and values presented in
earlier IEA and United Nations reports (AGECC 2010; IEA 2009).18 This value for household electricity
consumption is even less than the “subsistence household consumption” used in the Africa
Infrastructure Country Diagnostic (Banerjee et al. 2008),19 and is only a third of the medium estimate
of rural electricity consumption cited in a study by researchers from UNIDO, IAEA, and KTH (Bazilian,
Nussbaumer, Haites et al. 2010).20 By way of comparison, Table A1 gives rural electricity
consumption data for a variety of countries, almost all higher than 250 kWh per household,
suggesting that this is a conservative default factor. The methodology therefore sets the minimum
service level for overall household electricity services at 250 kWh per household per year, and then
distributes this among lighting and other purposes.
18
The IEA World Energy Outlook 2009 (p. 132) “universal energy access case” is based on 50 kWh per person per year in rural areas and
100 kWh per year in urban areas. Assuming an average household size of 5 people, annual energy consumption per rural household would amount to 250 kWh. The AGECC report (p. 9) refers to an on-going UN Energy analysis and states that the lowest values considered are 100 kWh per person per year. The AGECC report refers to this electricity as being for “lighting, health, education, communication and community services” but does not specify the shares of these services. The IEA 2009 analysis specifies neither the end uses nor the shares of those end uses. 19 This study used 300–600 kWh per household per year. 20 To calculate the energy and investment requirements for universal energy access, this study uses the IEA numbers as the “low scenario” and three times those consumption values for the “medium scenario.”
Promoting Energy Access CDM Projects under the Clean Development Mechanism
21
Table A 1: Selected values for electricity consumption in rural households
Country Consumption (kWh/
household)
Source Comment
Indonesia 540 (IEG 2008, p.33) Rural households
Lao PDR 504 (IEG 2008, p. 33-4) Rural households
Philippines 768 (IEG 2008, p.33-4) Rural households
Ethiopia 228 (IED 2006, p.56) Urban areas – rural expected to
be lower
Bangladesh 312 (Barnes, Peskin,
and Fitzgerald
2003)
Rural households
Bangladesh 420 (Khandker, Barnes,
and Samad 2009)
Rural households electrified 5
years or less
Vietnam <2 yrs 432 (Khandker et al.
2009)
Rural households electrified
less than 2 years
Peru 324 (Meier et al. 2010)
Kenya 360 (Parshall et al.
2009)
Spare (that is, rural), poor areas
Yemen 240 (Wilson, Jones, and
Audinet 2011)
Lighting only: Weighted
average of all electrified
households, rural and urban
Cambodia 333 (UNDP 2008) Rural, grid-connected
households
Cambodia 247 (UNDP 2008) Rural, mini-grid connected
households

Promoting Energy Access CDM Projects under the Clean Development Mechanism
22
Annex II: Standardization for rural energy access projects The following section discusses how the standardization is achieved for baseline establishment,
additionality demonstration, and baseline emission factor determination for the methodology that is
applicable for solar home systems using the two paths discussed above.
Methodology AMS-I.A.: Electricity generation by the user
Existing small-scale methodology AMS-I.A.: Electricity generation by the user is selected for a base-
case scenario to demonstrate how standardization can be achieved. Despite its approval back in
2004, only three projects21 have been registered to date that use this methodology for rural
electrification applications.
Baseline and its emission factor
The baseline and its emission factor under AMS-I.A22. is based on fuel consumption of the
technology in use or that would have been used in the absence of the project activity to generate
the equivalent quantity of energy using any of the following three options, based on the results of
direct metering or on a performance comparison of the peer group:
Direct metering (Option #1): Based on the estimated or metered average annual individual
energy consumption observed in similar systems;
Comparison of performance with a peer group (Option #2): Based on the estimated annual
output of the group of renewable energy technologies installed;
Historical level (Option #3): Based on trend-adjusted projection of historic fuel consumption.
The establishment of baselines using the above options requires large volumes of data that are
difficult to get. Moreover, the approach suggested yields low emission reduction volumes due to the
fact that suppressed demand is not properly taken into account.
Additionality demonstration
As the individual systems have a capacity of less than 1500 kW, and are used for household or
community applications, primarily in LDCs, a simplified additionality criterion for micro-scale project
activities can be applied for the demonstration of additionality. Consequently, these systems are
most likely automatically deemed additional.
a) Standardization under path # 1 (as evidenced in the new methodology AMS-I.L.)
The potential for standardization of off-grid electrification projects using technologies such as solar
home systems based on methodological improvements (Path # 1) that take into account suppressed
demand can be illustrated with a new (alternative) methodology for off-grid rural electrification
submitted by the World Bank to the Small-scale working group and approved by the CDM EB in 21
http://cdm.unfccc.int/Projects/projsearch.html 22
At the time of writing this section, SSC-WG is working on improving this methodology to account suppressed demand

Promoting Energy Access CDM Projects under the Clean Development Mechanism
23
March 2012 as methodology AMS-I.L.: Electrification of rural communities using renewable energy
(EB65, Annex 53).
Baseline and its emission factor
Figure A1 illustrates how standardization of the approved methodology AMS-I.A.: Electricity
generation by the user can be achieved (in the case of solar home systems) following Path # 1 as
approved under AMS-I.L.
Figure A 1: Baseline and emission factor under Path # 1
Under this approach, for each category of household application (that is, lighting, household
appliances), a baseline technology and fuel used are pre-established for their respective electricity
consumption based on the minimum service level identified for the household (that is, 250 KWh;
refer to Annex 1 for details on the establishment of the minimum service level for household
electricity consumption). Depending on the electricity use (or consumption) of each household, a
tiered default emission factor is established so that no data will have to be collected for baseline
establishment other than the system capacity and its availability factor (for systems with a capacity
of less than 1 KW).
Additionality demonstration
As in the case of methodology AMS-I.A., these systems will automatically be deemed additional
given their size (< 1500 KW), application (household/communities), and project location (LDCs).
b) Standardization using newly approved standardized baseline guidelines (Path # 2)
The standardization achieved through the above methodology path is applicable to similar projects
implemented anywhere on the globe. However, if one wants “customized standardization,” one that
takes into account and reflects country-specific circumstances and could bring potential benefits in
terms of identification of country-specific technologies/measures that will automatically be
additional and duly accounted for in their emission reductions, this can be achieved by following the
Elec. consumption
Elec. consumption
Residential lighting. Fixed, based on service level equi. to one light of ~1700-1800 lumens. Fuel: kerosene. Technology: pressure lamps; 6.8 kgCO
2e/year/kWh up to 55 KWh
Other HH electrical appliances: car batteries. Default EF: - 1.3 kgCO
2e/year/kWh for 55<Elec<250 kWh
- 1.0 tCO2e /year/kWh for >250 KWh
Other customers (businesses and services) Assume diesel generator is displaced
- 6.8 kgCO2e/year/kWh up to 55 KWh plus
- 1.3 kgCO2e/year/kWh for 55 <Elec<250 kWh
plus

Promoting Energy Access CDM Projects under the Clean Development Mechanism
24
guidelines recently approved for standardization by the CDM EB. The recently approved
standardized baseline procedures propose the following stepwise procedure for the establishment
of baselines, the demonstration of additionality, and the determination of the emission factor.
Step 1: Identify host country(ies), sectors, output(s) and measures
In any particular country, the sector, output, and measure for rural electrification using solar home
systems can be defined as follows:
Step 2: Establish additionality criteria for the identified measures
The choice of baseline technology and fuel for providing lighting and electricity for other appliances
is based on a generic list of technology and fuel options identified (through a survey or information
available with a relevant government agency) in a sector (household) identified. The information
collected needs to be assessed to determine how the technologies and fuels in un-electrified areas
can provide the minimum service level for each output and their likely availability, based on capital
and running costs for the households, and must face no barriers. Based on the identified
technologies and fuel, the following appliances have been identified for lighting:
Kerosene wick lamps
Kerosene hurricane lamps
Kerosene pressure lamps and
Solar home systems (SHS)
In accordance with the guidelines, the cumulative percentage of output (Oi) produced for lighting
application—that is, providing light services using the identified technologies—is arranged in
descending order of carbon intensity of the technologies:
Similarly, the cumulative percentage of output (Oi) produced for household appliance application—
that is, providing electricity to other household appliances based on identified technologies—is
arranged in descending order of carbon intensity of the technologies:
Domestic/ household electricity supply in rural areas
Sector Electricity use for lighting and other appliances
Output, Oi Change of technology with or without change of energy source
Measure
Wick Hurricane Pressure Solar
80%
Ya
Car battery Community DG Solar
grid
80%
Ya
Promoting Energy Access CDM Projects under the Clean Development Mechanism
25
The next step is to prove that renewable technologies are commercially less attractive than any of
the other technologies and meets both national and subnational regulations, if any. According to the
guidelines, those technologies that (i) have lower GHG intensity than any of the technologies used to
produce, in aggregate, more than Ya percent of the output(s) Oi of the sector; and (ii) are
commercially less attractive are included in positive lists and hence deemed automatically
additional. According to the guidelines, a Ya threshold of 80 percent is chosen in this example.
The most commonly used solar home system has a capacity of a 40–50 Wp and costs around $500,23
which in many cases is 3 to 5 times higher than the annual rural household’s expenditure. A 1kW
household diesel generator, which is the common size available, would cost around $700,24 while a
car battery would cost under $100. Considering the high purchase costs and low incomes of
households, deployment of these systems faces significant financial, technical, and institutional
barriers. In view of this, solar home systems for non-grid connected households would fall under
positive lists and hence can be considered additional25 in a country.
Step 3: Identify the baseline for the measures (for example, baseline fuel, technology, level of GHG
destruction)
The guidelines request the identification of the technologies with the highest emission factor and
contributing to Yb percent of the output Oi in the sector. The technology with the lowest carbon
emission factor is considered the baseline technology. According to the guidelines, the threshold Yb
has been fixed at 80%.
As these services are known to involve suppressed demand, it is very important to take this into
account when identifying the baseline (and its emission factor) for these measures. However, the
guidelines do not provide any specific guidance on how to do so when establishing the baseline
technology using standardized baselines. In order to duly consider suppressed demand, attempts
have been made to identify the baseline technology for supplying the required service levels by
using the “Guidelines on the consideration of suppressed demand in CDM methodologies.26
Given that the project activity will reduce the unit cost of providing lighting services dramatically,
one approach to estimating the service level would be to use the project energy service level as the
proxy for “satisfied demand”. In other words, it is assumed that, after the implementation of the
project activity, the households will face lower energy service prices and so will purchase adequate
levels of those services. However, there are two challenges to this approach:
Measuring energy consumption for one particular end use in rural households is challenging and
measuring the actual service levels (for example, lumens of light) is not operationally feasible.
Even with lower-cost services, the high poverty levels of the target population means that
project service levels may not reach “satisfied demand” levels for many years. The gradual
23 The example is based on a project implemented in Bangladesh: the RERED project. Source: Quantifying Carbon and Distributional Benefits of Solar Home System Programs in Bangladesh, The World Bank, January 2011. 24 ESMAP (Energy Sector Management Assistance Programme). 2007. Technical and Economic Assessment of Off-grid, Mini-grid and Grid Electrification Technologies. ESMAP Technical Paper 121/07. Washington, D. C.: World Bank. 25 Unless solar home systems are heavily subsidized and their cost is brought down below that of other alternatives. 26 http://cdm.unfccc.int/Reference/Guidclarif/meth/meth_guid41.pdf.
Promoting Energy Access CDM Projects under the Clean Development Mechanism
26
increase of electricity consumption over time after electrification, sometimes by a factor 2 to 3
in a few years, supports the view that the initial consumption levels may not be adequate
(Madubansi and Shackleton 2006; IED 2006; IEG 2008; IEA 2010)
Considering these factors, a more straightforward approach would be to establish a proxy for the
“satisfied demand” level by defining a “minimum service level” of lighting, which would represent an
adequate service to meet basic human needs. A similar approach could be applied to other services
such as cooking and space heating.
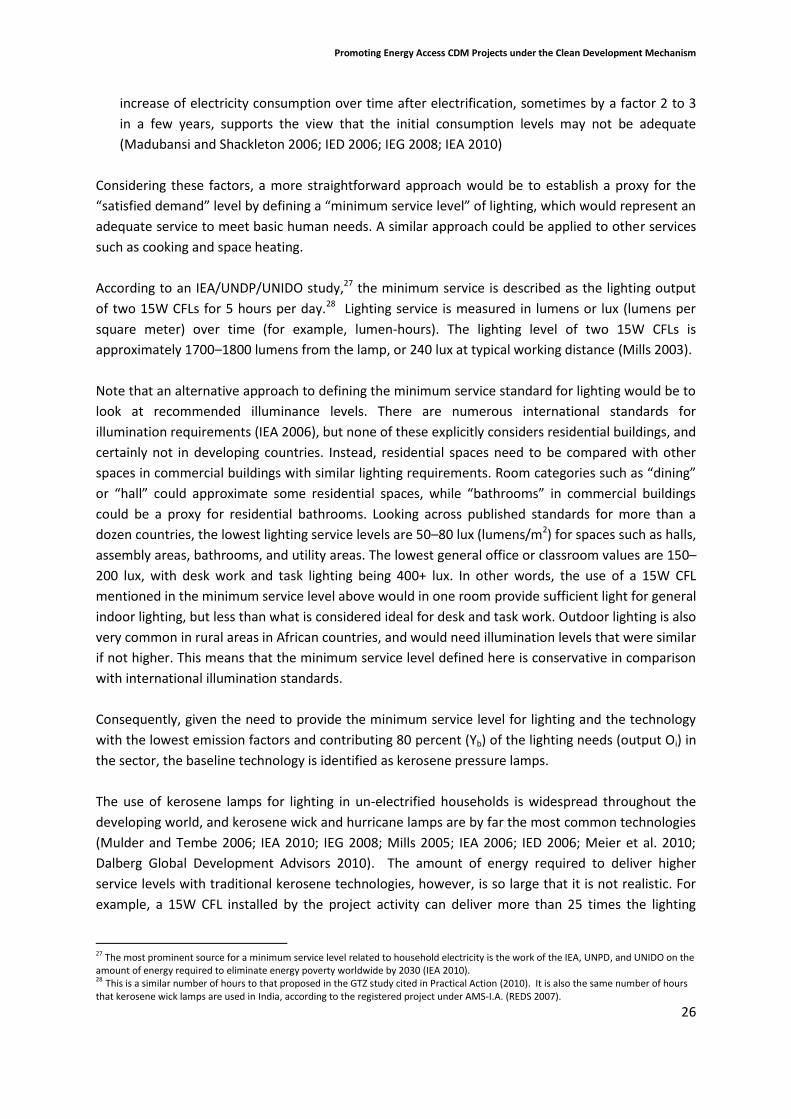
According to an IEA/UNDP/UNIDO study,27 the minimum service is described as the lighting output
of two 15W CFLs for 5 hours per day.28 Lighting service is measured in lumens or lux (lumens per
square meter) over time (for example, lumen-hours). The lighting level of two 15W CFLs is
approximately 1700–1800 lumens from the lamp, or 240 lux at typical working distance (Mills 2003).
Note that an alternative approach to defining the minimum service standard for lighting would be to
look at recommended illuminance levels. There are numerous international standards for
illumination requirements (IEA 2006), but none of these explicitly considers residential buildings, and
certainly not in developing countries. Instead, residential spaces need to be compared with other
spaces in commercial buildings with similar lighting requirements. Room categories such as “dining”
or “hall” could approximate some residential spaces, while “bathrooms” in commercial buildings
could be a proxy for residential bathrooms. Looking across published standards for more than a
dozen countries, the lowest lighting service levels are 50–80 lux (lumens/m2) for spaces such as halls,
assembly areas, bathrooms, and utility areas. The lowest general office or classroom values are 150–
200 lux, with desk work and task lighting being 400+ lux. In other words, the use of a 15W CFL
mentioned in the minimum service level above would in one room provide sufficient light for general
indoor lighting, but less than what is considered ideal for desk and task work. Outdoor lighting is also
very common in rural areas in African countries, and would need illumination levels that were similar
if not higher. This means that the minimum service level defined here is conservative in comparison
with international illumination standards.
Consequently, given the need to provide the minimum service level for lighting and the technology
with the lowest emission factors and contributing 80 percent (Yb) of the lighting needs (output Oi) in
the sector, the baseline technology is identified as kerosene pressure lamps.
The use of kerosene lamps for lighting in un-electrified households is widespread throughout the
developing world, and kerosene wick and hurricane lamps are by far the most common technologies
(Mulder and Tembe 2006; IEA 2010; IEG 2008; Mills 2005; IEA 2006; IED 2006; Meier et al. 2010;
Dalberg Global Development Advisors 2010). The amount of energy required to deliver higher
service levels with traditional kerosene technologies, however, is so large that it is not realistic. For
example, a 15W CFL installed by the project activity can deliver more than 25 times the lighting
27 The most prominent source for a minimum service level related to household electricity is the work of the IEA, UNPD, and UNIDO on the amount of energy required to eliminate energy poverty worldwide by 2030 (IEA 2010). 28 This is a similar number of hours to that proposed in the GTZ study cited in Practical Action (2010). It is also the same number of hours that kerosene wick lamps are used in India, according to the registered project under AMS-I.A. (REDS 2007).

Promoting Energy Access CDM Projects under the Clean Development Mechanism
27
service of a kerosene hurricane lamp, and these 25 hurricane lamps would consume 350 times more
energy than one CFL. Obviously a household would not use this many hurricane lamps, but would
instead switch to the next more expensive technology that would deliver more lighting service and
was available in that area. For a household that does not have access to electricity, this would mean
switching to a kerosene pressure lamp, because the investment is far smaller than a car battery or
small generator, and the technology is also widely available. This switch is determined by the capital
cost.29 A typical pressure lamp can provide as much light as 15W CFL (O’Sullivan and Barnes 2007;
Mills 2003).30 For that reason, the baseline technology for the minimum service level for lighting is
the use of two kerosene pressure lamps per household. However, under this path, the baseline
technology could be different and is country-specific, as it also depends on the income levels of
targeted households and the cost of various technologies available.
Country-specific minimum service levels for a targeted population can be assessed based on data
collected from areas of comparable socio-economic characteristics that are already availed of similar
services (see table A1 for electricity consumption values for various countries). The agreement on
the minimum service level needed for a targeted population is generally political in nature and
involves trade-offs between agreeing to provide certain minimum service levels to the population
and maintaining environmental integrity by achieving adequate emission reductions and hence
carbon revenues. Thus, the minimum service level identified using Path # 2 could be higher than the
value under Path # 1, where a global minimum service value of 250 KWh was used, as a potential
higher value was witnessed in countries like mentioned in Table A1.
A similar approach, be it without establishing minimum service levels as there is no pertinent
information available, has been followed to identify the baseline technology for applications other
than lighting for households. For appliances such as TV, radio, fans, and cell phone chargers, the
baseline technology, as identified above, is car batteries; as the car battery involves a much lower
up-front cost, this would be the lowest capital cost option (IEG 2008; IED 2006; Meier et al. 2010;
ESMAP 2002) and also one that faces no barriers. While there are examples of car batteries being
taken to a nearby village with grid or mini-grid electricity to be charged, this is the exception rather
than the rule, because it raises the price of the power (due to transport costs) and is more difficult in
the remote poor communities covered by this methodology. Therefore, the baseline technology
identified is the car battery for other household applications.
Step 4: Determine the baseline emission factor where relevant
A baseline emission factor could be determined for the SHS considering the emissions from baseline
technology for the minimum service level established.
29 Another way to express this, in terms of section III.A of the “Guidelines on the consideration of suppressed demand in CDM methodologies” (EB62, Annex 6), is that capital cost is the major barrier considered by households, and is the reason to eliminate more efficient options such as a household-scale diesel generator. 30 The useful lighting rating for a pressure lamp at typical working distance is 182 lux, as opposed to a 15W CFL at 122 lux (Mills 2003). Although the pressure lamp can provide 50 percent more light, having only one pressure lamp could not provide the service of two CFLs. In addition, the CFLs might be needed in different rooms of the house, so one brighter light source could not provide the same service as two light sources.

Promoting Energy Access CDM Projects under the Clean Development Mechanism
28
Kerosene pressure lamps consume 0.08 liters of kerosene per hour (Mills 2003).31 At standard
density, net calorific value and IPCC emissions factors, and 5 hours lighting per day, this amounts to
292 liters/year or 0.75 tCO2/year per household for two pressure lamps.32 In other words, providing
the minimum service level for lighting (that is, 55 kWh) in households that do not have access to
electricity would emit 0.75 tCO2 per year from kerosene combustion. This value could be even higher
if a country-specific minimum service level value were established and used under this Path.
For other applications, it is proposed that small-scale diesel generators used for battery charging use
an emission factor of 2.4 tCO2/MWh because of their small size and low load factors (based on the
table in AMS-I.F.). The typical efficiency of a battery charging system is 75 percent (Mills 2010), so
the resulting emission factor is 3.4 tCO2 per MWh.
Summary
The standardization achieved though guidelines for household level application of solar home
systems is graphically summarized below.
31 This is a conservative estimate because the source cited by O’Sullivan and Barnes (O’Sullivan and Barnes 2007) shows 0.14 litres/hour. 32 Emissions per lamp would be 0.375 tCO2/yr or 0.206 kgCO2/hr.
Elect. consumption
Residential lighting. Fixed, based on service level equivalent to more than one light of ~1700-1800 lumens each. Fuel: kerosene. Technology: pressure lamps; 0.75 tCO2/household/year or even more.
Other HH electrical appliances: car batteries and charging using small community diesel generator. Default EF: 3.4 tCO2/MWh
Top Related
Copyright © 2022 FDOKUMEN

