


Bahasa
Halaman
Hukum


CER Comparative European Research 2016
Proceedings | Research Track
of the 5th Biannual CER Comparative European Research
Conference
International Scientific Conference for Ph.D. students of EU countries
March 28-31, 2016 | London

CER Comparative European Research 2016
Proceedings | Research Track
of the 5th Biannual CER Comparative European Research
Conference
International Scientific Conference for Ph.D. students of EU countries
October 28-31, 2016 | London
Statement of review All papers reproduced in these proceedings have been independently reviewed with consideration for SCIEMCEE reporting requirements. All papers reproduced in these proceedings were presented at the CER Comparative European Research Conference.
Disclaimer Any opinions, advices and information contained in this publication do not necessarily reflect the views or polices of the CER or SCIEMCEE Executive or its members. Whilst all due care was taken in the compilation of these proceedings, the CER Executive does not warrant that the information is free from errors or omission, or accept any liability in relation to the quality, accuracy and currency of the information.
Copyright Copyright © 2016 CER Comparative European Research and the Authors.
Published in March, 2016 by Sciemcee Publishing, London.
Proceedings document published in collaboration with SCIEMCEE - Scientific Conference Platform. The proceedings with all papers are available at www.sciemcee.org.
ISBN 978-0-9928772-9-3

Introduction
The conference Proceedings you are holding is a collection of selected peer-reviewed texts presented at the international scientific conference Comparative European Research - CER 2016 (March 28-31).
The biannual international scientific conference is organized under the auspices of the SCIEMCEE scientific platform every March and October and follows up on activities aimed at providing greater support for the scientific activities of Ph.D. students and beginning researchers. The various biannual CER conferences represent a space for the international assessment of the qualitative standard of scientists and the results achieved by the various academic institutes. The CER conference is an ideal place for comparing the standard of scientific work, particularly on a European scale.
The Proceedings from the 2016 CER conference contains several dozen academic texts whose main purpose is the presentation and sharing of knowledge always in one of nine conference sections. The conference Proceedings prioritize only those articles which are good enough to offer readers new insights into the issues analyzed, or which extend the known boundaries of science. The guarantor of the CER 2016 conference is a signatory of the Berlin Declaration on Open Access to Knowledge in the Sciences and Humanities, and therefore all papers are made available to professionals and the general public via OpenAccess.
The conference committee, comprising experts from several university departments, believes that the CER international scientific conference will attract an ever wider base of participants to join in the discussions and will stimulate further scientific work and interdisciplinary development.
CER Conference Scientific Committee
Editors Michael McGreevy, Robert Rita
International Scientific Committee - Reviewers prof. UWM dr hab. Henryk Mizerek - Head of Chair of General Education, University of Warmia and Mazury, Poland prof. RNDr. Martin Mihaljevič, CSc. - Charles University in Prague, Czech Republic prof. Ing. Adriana Csikósová, CSc. - Department of Business and Management, Technical University of Košice, Slovakia prof. Dr. Hab. Stasys Vaitekūnas - Klaipėda University, Lithuania prof. PhDr. Libor Pavera, CSc. - The Institute of Hospitality Management in Prague, Czech Republic prof. dr hab. Wojciech Lis - Poznan University of Life Sciences, Poland prof. zw. dr hab. Krystian Heffner - University of Economics in Katowice, Poland prof. dr. Vladimiras Gražulis - Mykolas Romeris University, Lithuania prof. ThDr. Ing. Jakub Schwarz Trojan - Charles University in Prague, Czech Republic dr hab. Piotr Cichoracki - University of Wroclaw, Poland dr hab. prof UZ Andrzej Małkiewicz - University of Zielona Góra, Poland doc. PhDr. Petr Kaleta, Ph.D. - Charles University in Prague, Czech Republic dr hab. prof. UO Mikołaj Iwanow - University of Opole, Poland dr hab. Krzysztof Jaskułowski, prof. SWPS - University of Social Sciences and Humanities doc. Fazekas Csaba, PhD. - University of Miskolc, Faculty of Arts, Miskolc, Hungary doc. PhDr. Peter Káša, CSc. - University of Presov in Presov, Slovakia doc. Ing. Katarína Čulková, PhD. - Technical University of Košice, Slovakia doc. Pálosi Dániel, PhD. - Dennis Gabor College, Institute of Economics and Social Sciences, Budapest, Hungary doc. Ing. Peter Tauš, PhD. - Technical University of Košice, Slovakia doc. PhDr. Martina Kášová, Ph.D. - University of Presov in Presov, Slovakia doc. Kaiser Tamás PhD. - National University of Public Service, Faculty of Public Administration, Budapest, Hungary doc. Ing. Martin Blašková, Ph.D. - University of Zilina, Slovakia doc. Urbán Anna - Faculty of Arts of the University of Miskolc, Department of Sociology, Miskolc, Hungary doc. PhDr. Mária Antošová, PhD. - Technical University of Košice, Slovakia
3

Table of Contents Session: Management, Marketing ALTERNATIVE DISPUTE RESOLUTIONS IN THE ELECTRONIC COMMUNICATIONS MARKET Tomáš Liškutín ............................................................................................................................................................................................................................................................. 8 THE AGENCY THEORY AND RESOURCE BASED THEORY IN CONTEXT WITH FAMILY BUSINESSES Markus Erharter ........................................................................................................................................................................................................................................................ 11 URBAN PROFILING - ASPECTS OF PROFILE ORIENTED MARKETING AND ADAPTION MANAGEMENT IN CONJUNCTION WITH CITIES AND THEIR SUSTAINABLE URBAN SOCIO-ECONOMIC DEVELOPMENT Rebecca Reschreiter ................................................................................................................................................................................................................................................. 15 IMPORTANCE OF THE FACILITY MANAGEMENT (ACTIVITIES) FOR THE COMPANY SUSTAINABILITY Mehedinţu Gabriela ................................................................................................................................................................................................................................................. 20 GEOGRAPHIC INFORMATION SYSTEM (GIS) CONTEMPORARY SYSTEM CRUCIAL FOR LAW ENFORCEMENT AGENCIES Afërdita Qekaj-Thaqi ............................................................................................................................................................................................................................................... 24 SPECIAL ECONOMIC ZONES IN POLAND AND IN THE WORLD Beata Glinkowska ...................................................................................................................................................................................................................................................... 28 MANAGEMENT PRACTICES IN PUBLIC INSTITUTIONS OF THE REPUBLIC OF KOSOVO AND THE CHALLENGES OF THE PROJECT MANAGER Agim Derguti ............................................................................................................................................................................................................................................................. 32 THE IMPACT OF CORPORATE GOVERNANCE ON FIRM PERFORMANCE - A LITERATURE REVIEW Knut Michelberger .................................................................................................................................................................................................................................................... 38 VALIDITY AND RELIABILITY OF PERSONALITY TESTS Bernhard Stocker ...................................................................................................................................................................................................................................................... 43 Session: Economy, Financing, Public Administration IMBALANCE OF THE PUBLIC FINANCE IN THE CONTEXT OF KEYNESIAN AND NONKEYENSIAN EFFECTS OF FISCAL POLICY LIMITATION Joanna Stawska ......................................................................................................................................................................................................................................................... 48 IMPACT OF CROSS BORDER COOPERATION PROJECTS BETWEEN SLOVAKIA AND HUNGARY IN TERMS OF COHESION POLICY René Pawera - Lívia Bott Domonkos - Richard Hakszer ................................................................................................................................................................................ 52 VERIFICATION OF THE THEORY OF PERMANENT INCOME IN CZECH REPUBLIC AND DISTRIBUTION OF TOTAL SAVINGS OF CZECH HOUSEHOLDS Michal Bock - Jaromír Tichý ................................................................................................................................................................................................................................... 57 ANALYSIS OF THE ENERGY SECTOR IN POLAND ON THE EXAMPLE OF ENERGY INDUSTRY COMPANIES QUOTED ON THE STOCK EXCHANGE Rafał Parvi .................................................................................................................................................................................................................................................................. 60 VALUATION OF SHARES AND THEIR FAIR VALUR OF THE COMPANIES LISTED ON THE RAW MATERIALS SECTOR QUOTED ON THE WARSAW STOCK EXCHANGE IN POLAND WITHIN 2011-2016 AND THEIR FAIR VALUE Rafał Parvi .................................................................................................................................................................................................................................................................. 64 THE EUROPEAN UNION'S NEW STRATEGY FOR TRADE AND INVESTMENT IN THE LIGHT OF NEGOTIATIONS WITH LATIN AMERICA Jana Bališová .............................................................................................................................................................................................................................................................. 68 SYSTEMIC BIAS OF OFFICIALS Kateřina Švarcová ..................................................................................................................................................................................................................................................... 72 FINANCING OF ENERGY FROM RENEWABLE SOURCES UNDER EU LAW: SELECTED ISSUES Magdalena Brodawka .............................................................................................................................................................................................................................................. 77
Comparative European Research CER 2016 (issue I.)
4

TRENDS IN THE DEVELOPMENT OF INTERNATIONAL TRADE Katarzyna Brożek ...................................................................................................................................................................................................................................................... 81 ANALYSIS OF LINEAR ALGEBRA APPLICATIONS IN ECONOMICS - MATRICES BRIEFLY Katarzyna Brożek ...................................................................................................................................................................................................................................................... 85 COUNTERVAILING MARKET POWER ANALYSIS: ASESSING MONOPOLISATION TENDENCIES IN BUSINESS ENVIRONMENT OF THE MODERN FINANCIAL SERVICE SECTOR Dmitrijs Skoruks - Jekaterina Nazarova - Maija Šenfelde ................................................................................................................................................................................ 89 Session: Industrial Engineering, Innovations TESTING OF AUTOMOTIVE SAFETY TECHNOLOGIES Luboš Nouzovský – Josef Burket – Jan Novák ................................................................................................................................................................................................... 95 TRAFFIC SAFETY IN ROAD TUNNELS Radka Matuszková – Michal Radimský ................................................................................................................................................................................................................ 98 IDEOLOGICAL PROPOSE IMPROVEMENTS TO THE INNOVATION POTENTIAL SIZING MANUFACTURING COMPANIES IN SLOVAKIA Klaudia Gubová – Patrik Richnák ........................................................................................................................................................................................................................ 102 Session: Applied Informatics OPTIMAL OPENCL KERNEL CREATION FOR DIGITAL IMAGE CORRELATION ALGORITHM Petr Ječmen, Pavel Satrapa .................................................................................................................................................................................................................................. 107 EXPLORING THE EFFECTIVENES OF OMEGAT IN TECHNICAL TRANSLATION Małgorzata Anna Łuszcz ...................................................................................................................................................................................................................................... 112 Session: Natural Sciences THE EFFICIENCY OF CADMIUM AND ZINC ACCUMULATION AND INFLUENCE ON NUTRIENT UPTAKE AND WATER STRESS IN BRASSICA NAPUS L. Martina Benakova – Zuzana Ducaiova – Jiri Tuma ......................................................................................................................................................................................... 116 POPULATION SIZE AND DISPERSION OF POPULATION OF SNOWDROP IN TWO DECIDUOUS FORESTS IN SOUTH-WEST SLOVAKIA Patrícia Mariničová - Pavol Eliáš .......................................................................................................................................................................................................................... 120 BIOACCUMULATION OF IRON, ZINC, COPPER AND LEAD IN HONEY BEES, BEE POLLEN AND HONEYCOMB Miriama Kopernická – Tomáš Tóth – Ľuboš Harangozo – Rastislav Sabo – Tatiana Kopernická ........................................................................................................ 123 Session: Medical Sciences ANALYSIS OF THE ARCH OF FOOT IN WOMEN AGED 19 AND 23 YEARS AND RISK FACTORS CAUSING FOOT DEFORMITY Mária Fuchsová ....................................................................................................................................................................................................................................................... 128 Session: Physics, Mathematics APPLICATION OF THE FINITE ELEMENT METHOD IN DETERMINATION OF MODAL AND SPECTRAL PROPERTIES OF PROPELLER SHAFT´S BENDING VIBRATIONS Petr Hrubý, Zdeněk Hlaváč, Pavla Židková....................................................................................................................................................................................................... 132 PHYSICAL AND MATHEMATICAL MODELS OF SHAFTS IN DRIVES WITH HOOK´S JOINTS Petr Hrubý, Zdeněk Hlaváč, Pavla Židková....................................................................................................................................................................................................... 136 THE TRANSFER-MATRIX METHOD IN THE APPLICATION FOR AN ONE-DIMENSIONAL LINEAR CONTINUUM SPEED RESONANCE Petr Hrubý, Zdeněk Hlaváč, Pavla Židková....................................................................................................................................................................................................... 141
Comparative European Research CER 2016 (issue I.)
5

Session: Pedagogy, Psychology THE RISKS AND POSSIBILITIES OF REDUCTION THE IMPACT OF CODEPENDENCE FOR FAMILY MEMBERS Andrea Juhásová .................................................................................................................................................................................................................................................... 146 QUANTITATIVE AND QUALITATIVE APPROACHES IN THE DISSERTATION RESEARCH Marie Bajnarová ...................................................................................................................................................................................................................................................... 150 INFLUENCE OF FAMILY ENVIROMENT ON ADOLESCENT DEVIANT BEHAVIOR Barbora Odraskova - Michal Kozubik – Lukas Odraska ................................................................................................................................................................................ 154 CROSS-GENERATIONAL LEARNING AND CROSS-GENERATIONAL PROGRAMMES Petra Kaduchová..................................................................................................................................................................................................................................................... 158 DEVELOPING VALUE SYSTEM OF YOUTH THROUGH PARTICIPATION IN VOLUNTARY SERVICE Lucia Ludvigh Cintulová ........................................................................................................................................................................................................................................ 161 USING WEBQUESTS TO TEACH CULTURE-RELATED ENGLISH VOCABULARY - HOLIDAYS AND FOLK TRADITIONS Małgorzata Anna Łuszcz ...................................................................................................................................................................................................................................... 166 SEX DIFFERENCES IN THE ASSESSMENT OF SOCIAL FUNCTIONING Agata Złotogórska ................................................................................................................................................................................................................................................. 171 FAIRY TALE IN THE BIBLE Ján Vido .................................................................................................................................................................................................................................................................... 174 DIDACTIC SITUATIONS IN MATHEMATICS AS A TOOL FOR TEACHING THE CZECH LANGUAGE Jana Martáková Styblíková ................................................................................................................................................................................................................................... 177 Session: History, Sociology CONSIDERATIONS AROUND THE DEVELOPMENT OF POLITICAL DISCOURSE Elżbieta Pieniążek-Niemczuk ............................................................................................................................................................................................................................... 181 A FEW EXAMPLES OF DEATH PENALTY IN ROMAN LAW Darina Kmecová ...................................................................................................................................................................................................................................................... 185 DEFINITION OF THEFT IN THE ROMAN LAW AND IN ACTUAL LEGAL SYSTEM OF LAW OF SLOVAK REPUBLIC Kamila Kočišová ...................................................................................................................................................................................................................................................... 188
Comparative European Research CER 2016 (issue I.)
6

Session: Management, Marketing Index of Author(s)
Derguti, Agim Erharter, Markus Glinkowska, Beata Liškutín, Tomáš Mehedinţu, Gabriela Michelberger, Knut Qekaj-Thaqi, Afërdita Reschreiter, Rebecca Stocker, Bernhard
Comparative European Research CER 2016 (issue I.)
7

ALTERNATIVE DISPUTE RESOLUTIONS IN THE ELECTRONIC COMMUNICATIONS MARKET
Tomáš Liškutín
Law School, Masaryk University
Veveří 70
Brno, ZIP Code 611 80, Czech Republic
+420 – 720 350 250
Abstract: The regulation establishes a system of alternative dispute resolution of consumer disputes. The system of alternative
dispute resolution offers consumers a way of resolving their disputes with businesses. This measure in the Czech electronic
communications market involves the Czech Telecommunication Office that is the competent body for resolving disputes in the
field of electronic communications and postal services and the Czech Trade Inspection that is responsible for resolving
disputes in the field of the content of mentioned services and the purchase of telecommunication equipment. The outcome of
ADR at the CTO is binding. In contrast, the proceedings at CTI is a conciliation, during which the parties are encouraged to
settle the dispute by an independent mediator. The possible outcome is a private settlement agreement between the parties. It is
not enforceable, but parties should have an easier position in possible court proceedings. Both ADR entities are linked to the
European online dispute resolution platform for resolving consumer disputes online. The aim of this platform is to help
consumers solve cross-border disputes of online purchases and service contracts.
Key words: alternative dispute resolutions, online dispute resolution, electronic communications, consumer protection, EU
internal market
1. Introduction
The reason for specific procedures to be introduced is that,
in most cases, it would be too expensive for consumers to
litigate against undertakings.[1] Ensuring access to simple,
efficient, fast and low-cost ways of resolving domestic and
cross-border consumer disputes which arise from sales or
service contracts should benefit consumers and therefore
boost their confidence in the EU internal market. That
access should apply to online as well as to offline
transactions, and is particularly important when consumers
shop across borders. Fragmentation of the EU internal
market is detrimental to competitiveness, growth and job
creation within the EU. Eliminating direct and indirect
obstacles to the proper functioning of the internal market
and improving citizens’ trust is essential for the
completion of the EU internal market.
For the purpose of a simple, fast and low-cost out-of-court
solution to disputes between consumers and entrepreneurs
in the electronic communications market, Directive
2013/11/EU of the European Parliament and of the
Council of 21 May 2013 on alternative dispute resolution
for consumer disputes (hereinafter the “ADR Directive”),
Regulation EU 524/2013 of the European Parliament and
of the Council Of 21 May 2013 on online dispute
resolution for consumer disputes (hereinafter the “ODR
Regulation”) and Directive 2002/22/EC of the European
Parliament and of the Council of 7 March 2002 on
universal service and users' rights relating to electronic
communications networks and services (hereinafter the
“Universal Service Directive”) were adopted.
The ADR Directive and the ODR Regulation are two
interlinked and complementary legislative instruments.
The ODR Regulation provides the establishment of an
online dispute resolution platform (hereinafter the “ODR
platform”) which offers consumers and entrepreneurs a
single point of entry for the out-of-court resolution of
online disputes, through ADR entities which are linked to
the platform and offer ADR through quality ADR
procedures. The availability of quality ADR entities across
the EU is a precondition for the proper functioning of the
ODR platform.
2. New Information Duties of Entrepreneurs
Entrepreneurs established on the EU territory shall inform
consumers about the ADR entity or ADR entities by which
those entrepreneurs are covered, when those entrepreneurs
are obliged to use those entities to resolve disputes with
consumers.[3] That information shall include the website
address of the relevant ADR entity or ADR entities.
In the Czech Republic, the ADR entities in the electronic
communications market for the provision of publicly
available electronic communications service is the Czech
Telecommunication Office (in Czech Český telekomunikační
úřad) and for the content of these services and the purchase
of telecommunication equipment is the Czech Trade
Inspection (in Czech Česká obchodní inspekce).[4][5]
The information about the ADR entities shall be provided
in a clear, comprehensible and easily accessible way on the
entrepreneurs’ website, where one exists, and, if
applicable, in the general terms and conditions of sales or
service contracts between the entrepreneur and the
consumer. In cases where a dispute between a consumer
and an entrepreneur could not be settled further to a
complaint submitted directly by the consumer to the
entrepreneur, the entrepreneur shall provide the consumer
with the information about the ADR entities, specifying
whether he will make use of the relevant ADR entities to
settle the dispute. That information shall be provided on
paper or on another durable medium.
Entrepreneurs engaging in online sales or service contracts
shall further inform consumers about the existence of the
ODR platform and the possibility of using the ODR
Comparative European Research CER 2016 (issue I.)
8
platform for resolving their disputes. They shall provide an
electronic link to the ODR platform on their websites (that
link shall be easily accessible for consumers) and, if the
offer is made by e-mail, in that e-mail. The information
shall be also provided, where applicable, in the general
terms and conditions applicable to online sales and service
contracts. Entrepreneurs engaging in online sales or
service contracts shall also state their e-mail addresses.
When entrepreneurs are obliged to provide both above
mentioned information, they shall, where possible, provide
that information together.
In the Czech Republic, the rule on penalty applicable to
infringements of the provisions on the above mentioned
information duties of CZK 1,000,000 (circa EUR 40,000)
at maximum were laid down as effective, proportionate
and dissuasive.
3. ADR at the Czech Telecommunication Office (CTO)
The CTO resolves disputes between entrepreneurs on the
one hand and consumers on the other, on the basis of a
motion filed by any of the parties to the dispute, as far as
the dispute relates to obligations imposed by, or on the
basis of, the Act on Electronic Communications.
An administrative fee in the amount of CZK 100 (circa
EUR 4) is charged for the presentation of the motion at the
request of consumer and in the amount of 4% of disputable
amount, CZK 200 (circa EUR 8) at least is charged for the
presentation of the motion at the request of entrepreneur
regarding financial settlement.
The motion of entrepreneurs that refers to the consumer’s
obligation regarding financial settlement shall be filed on
an electronic form. The CTO makes these forms available
in a manner allowing remote access.
In the notice of initiation of the ADR at the consumer's
request, the CTO shall inform the parties on the right to
legal assistance and that they are not obliged to legal
representation. Submitting a proposal consumer agrees
with the legal effects of the outcome of the ADR.
3.1 Prerequisites for ADR
The consumer is entitled to raise a claim in respect of the
billing of the price or a claim in respect of the publicly
available electronic communications service provided to
him.
The consumer is entitled to raise a claim in respect of the
billing of the price without undue delay no later than 2
months after the date of delivery of the bill containing the
price for the service provided, otherwise the entitlement to
raise a claim shall lapse. If no bill is delivered because of
the type of service provided (e.g. pre-paid services), the
consumer is entitled to raise a claim within 2 months of the
provision of the service. The filing of a claim does not
have a suspensive effect; however, in justified cases the
CTO may, if so requested by the consumer, decide that the
filing of a claim has a suspensive effect.
The consumer is entitled to raise a claim in respect of the
provided service without undue delay no later than 2
months after the date of faulty provision of service;
otherwise the entitlement to raise a claim shall lapse.
If the entrepreneur fails to meet an above mentioned
consumer claim, the consumer is entitled to file with the
CTO a motion to initiate ADR in respect of objection
against the settlement of a claim, which the consumer shall
do without undue delay but no later than 1 month after the
delivery of the claim settlement.[2] This motion does not
have a suspensive effect again; however, in justified cases
the CTO also may, if so requested by the consumer, decide
that the motion has a suspensive effect.
3.2 Deadline for Issuing a Decision
The deadline for issuing a decision in a dispute initiated at
the request of entrepreneur is 4 months, in particularly
complex cases 6 months. The deadline for issuing a
decision in a dispute initiated at the request of consumers
is 90 days. This period may be extended at particularly
complex disputes. In such a case, parties must be promptly
informed of any extension and the total time to when to
expect a decision.
3.3. Appeal against the Decision of CTO
Against the ADR decision issued in the first instance of
CTO, the party has the right to appeal within 15 days from
the date of delivery of this decision. The appeal is decided
by the chairperson of the CTO. In the Czech Republic,
these outcomes of the ADR in the electronic
communications market is legally binding for both parties.
Nevertheless, these decisions of the Chairman of the CTO
on the appeal are reviewable by the courts in civil
proceedings.
3.4 Compensation for the Costs of ADR
The CTO awards to the party who fully succeeded in the
proceedings a compensation for the costs required for
effective enforcement of rights against the losing party to
the proceedings.
In the event that a party succeeded only partially in the
proceedings, the CTO may split the compensation for the
costs to appropriate proportions, or may decide that neither
of the parties is entitled to such compensation. Even in the
case that a party succeeded only partially the CTO may
award full compensation for such costs to such a party
provided that such a party was unsuccessful in only a
negligible part of the proceedings or that the decision on
the amount to be discharged depended on an expert
opinion or was at the discretion of the CTO.
The CTO also awards a compensation for the costs in full
to the party who has withdrawn the reasonable motion
because of a subsequent behaviour of the other party.
4. ADR at the Czech Trade Inspection (CTI)
The CTI resolves disputes in the electronic
communications market between entrepreneurs on the one
hand and consumers on the other, on the basis of a motion
filed by a consumer, as far as the dispute relates to the
purchase of telecommunications equipment or the content
of electronic communications services.
The motion may be presented exclusively by a consumer
and there is no administrative fee for the presentation of
the motion.
Comparative European Research CER 2016 (issue I.)
9

4.1 Prerequisites for ADR
The consumer has the right to ADR of consumer disputes
related to sales or service contracts with the exception of
contracts concluded non-economic services of general
interest, health services provided by health professionals to
patients to assess, maintain or restore their state of health,
including the prescription, dispensation and provision of
medicinal products and medical devices and public
providers of further or higher education.
The consumer is entitled to file the motion to the CTI
within one year from the date upon which the consumer
submitted the complaint to the entrepreneur first.
The motion shall contain identification of the parties to the
dispute, complete and understandable statement of the
facts, an indication of what the consumer claims, the date
when the consumer raise a claim at the entrepreneur first, a
statement that the case has not been ruled by a court,
arbitration and is not a subject of such proceedings, date
and signature of the consumer.
The CTI is allowed to refuse to deal with a presented
consumer dispute on the grounds that the consumer did not
attempt to contact the entrepreneur in order to discuss the
complaint and seek, as a first step, to resolve the matter
directly with the entrepreneur. The motion shall be
accompanied by proof of the fact that the consumer failed
to resolve the dispute with the entrepreneur directly.
The CTI is also allowed to refuse to deal with a presented
consumer dispute on the grounds that the dispute is
frivolous or vexatious.
4.2 Deadline for Issuing a Decision
The entrepreneur shall within 15 working days from
delivery of the CTI notification provide the CTI with an
answer to facts mentioned in the consumer motion. The
entrepreneur is further obliged to cooperate closely with
the CTI for the efficient conduct of ADR of consumer
disputes.
In the Czech Republic, the rule on penalty applicable to
infringements of the provisions on the above mentioned
cooperation duties of CZK 1,000,000 (circa EUR 40,000)
at maximum were laid down.
The outcome of the ADR procedure at the CTI is made
available within a period of 90 calendar days from the date
on which the CTI has received the complete motion. In the
case of highly complex disputes, the CTI may, at its own
discretion, extend the 90 calendar days’ time period. The
parties shall be informed of any extension of that period
and of the expected length of time that will be needed for
the conclusion of the dispute (but no more than other 90
days).
4.3 Legal Aspects of ADR at CTI
In the Czech Republic, the outcome of ADR at CTI is
dependent on the will of the parties to the dispute and it is
also called a gentleman agreement because it is not
enforceable comparing to a court judgment in force.
Within this procedure, no compensation for the costs of
proceeding is awarded and each of the parties to the
dispute bears its own costs.
It is also necessary to draw attention to the fact that ADR
proceeding pauses running of the limitation periods.
5. ODR Platform
For consumer disputes of online sales or service contracts,
the ODR platform may be used. Upon delivery of a fully
completed complaint form, the ODR platform shall,
transmit it to the respondent party with the information
about inter alia the ADR entity or entities which are
competent to deal with the complaint and the fact that the
parties have to agree on an ADR entity in order for the
complaint to be transmitted to it.
The ODR platform shall automatically and without delay
transmit the complaint to the ADR entity that the parties
have agreed to use. The ADR entity which has agreed to
deal with a dispute shall conclude the ADR procedure.
Where the parties fail to agree within 30 calendar days
after submission of the complaint form on an ADR entity,
or the ADR entity refuses to deal with the dispute, the
complaint shall not be processed further by this platform.
6. Conclusion
Alternative dispute resolutions in the electronic
communications market should ensure that all disputes
between consumers and entrepreneurs which arise from
the provisions of services or sale of goods can be
submitted to an ADR entity. Entrepreneurs should provide
consumers with information regarding the ADR of
consumer disputes. On the other hand, before presenting a
motion to an ADR entity, consumers should contact
entrepreneurs by any appropriate means, with the aim of
resolving the dispute amicably.
In case of online purchase of goods or service contracts,
the ODR platform should build on existing ADR entities to
which a consumer motion should be transmitted through
this platform. The effectiveness should be increased by the
rule ensuring that such dispute resolution does not require
the physical presence of the parties before the ADR entity.
These measures should contribute to the attainment of a
high level of consumer protection and the effectiveness of
EU internal market.
References [1] NIHOUL PAUL AND RODFORD PETER. EU
electronic communications law: competition and
regulation in the European telecommunications market.
Oxford : Oxford University Press, 2011, p. 404.
[2] VANÍČEK ZDENĚK, Zákon o elektronických
komunikacích Komentář, Praha : Linde Praha, 2008, p.
407.
[3] http://www.epravo.cz/top/clanky/nove-povinnosti-pod
nikatelu-pri-reseni-spotrebitelskych-sporu-100689.html
[4] http://www.mpo.cz/dokument169867.html
[5] http://www.ctu.cz/ochrana-spotrebitele
Comparative European Research CER 2016 (issue I.)
10

THE AGENCY THEORY AND RESOURCE BASED THEORY IN CONTEXT WITH FAMILY BUSINESSES
Markus Erharter
University of Latvia Raina bulvaris 19
Riga, LV-1586, Latvia +43650/3027687
Abstract: Family business research has grown in the past. In many countries family businesses form the majority of firms. First theories and the different levels of analysis in family business studies are . First the agency theory is used to explain relations in firms. Altruism and entrenchment are the major differences between family and non family firms. They can have positive and negative effects on family firms. Secondly the resource based view of the family firms is discussed. Herby the entrepreneurial attitude may be the key to success in family firm succession. The resource based view helps to explain the possession of resources which could lead to competitive advantages and explains how family resources have been or can be acquired through family involvement. The different levels of family involvement are analyzed in a next step. Herby the separation in circles, the F-Pec scale and the Substantial Family Influence (SFI) are discussed. Then family firm may be characterized as having both financial and non financial goals. Keywords: family business, agency theory, resource based view, level of familiness, financial and nonfinancial goals, 1. Introduction Family business research is a rather young field because it has only intensified in the 1990s. In most industrialised countries family businesses form the majority of firms. Family business scholars have so far focused on the processes of business succession and professionalization. Further more different approaches have evolved to analyse the lifecycle stages of family businesses and the premise that a family business remains as such and does not develop into a non family business. There is empirical evidence that the share of family businesses among larger companies is significantly smaller than that among small and medium-sized companies. This means the larger a company grows the more likely it is that a significant amount of family businesses become non-family businesses and family influence is likely to diminish gradually. The family influence is a family-business specific resource, which explains the performance difference in family businesses and non family businesses [1]. 2. Theories and level of analysis in family business
studies Strategic management, organizational theory, economics, sociology, anthropology, and psychology are some of the many promising approaches used by researchers to study family firms. The ultimate aim of the field of family business studies is to develop “theories of family firms” that consider the reciprocal relationships between family and business systems. Therefore a starting point is to reexamine the current theories in the family and organizational fields to test the extent of their validity when these two systems are intertwined [9].
Figure 1 Toward the development of theories of family
firms [3]
The family business literature can be organized according to the individual, the interpersonal/group level, the organisational level and the societal/environmental level [3]. On the individual level reasearch has been done concerning the founders, the next generation, women and nonfamily employees. One theory in use is the social network theory which argues that the founder has a significant influence on the culture, values and performance. Different adaptive leadership styles are used by the next generation. The principal agent theory and the stewardship theory may be of use when looking at the relationship with nonfamily employees. On the interpersonal or group level contractual agreements, sources of conflicts and management and intergenerational transitions have been analysed. The theories used in this circumstances are variants of agency theory as well the resourc-based view of the firm. The latter states the importance of transferring tacit knowledge, networks and social capital as well as passion, which then should lead to a competitive advantage. On an organizational level the resource based theory is used as well. Types of sources identified on this level are human, social survivability, patience and governance
Family Firm Filter (when the two systems operate as one)
Organizational Theories Family System Theories
Theories of family firms
Comparative European Research CER 2016 (issue I.)
11

structures. It is important to understand the beliefs and culture. On an organizational level the impact of the fiscal system has been analysed and the institutional theory, contingency theory at the the structural level and the transaction cost theory of Williamson at the ecological level have been used. Even though it is possible to theorize across multiple levels, most of the literature has focused on one level rather than the complex domain of multiple-level theorizing [3]. In the following two strategic management oriented explanations which are the agency and resource based view will be used. Both approaches have a performance orientation and assist in explaining important strategic management issues such as formulation and content of goals and strategies, strategy implementation and control, leadership and succession in family firms [2].
2.1 Agency Theory and family business
On the individual level the agency theory is used to explain relationships. Agency costs arise due to conflicts of interest and asymmetric information between two parties to a contract [16]. This theory can be applied on the capital structure decision of the firm. Here agency costs can be defined as to include all actions by an agent that are contradictory to the interests of a principal plus all activities, incentives, policies, and structures used to support the interests and actions of agents with the interests of principals. Researchers proposed that altruism and the tendency for entrenchment are the fundamental differences in terms of agency costs between family and nonfamily firms [2]. The economics literature [17] showed that that a tendency toward altruism can lead to a problem of self-control and create agency cost in family firms due to a lack of planning, a given perception of a child’s performance, difficulty in enforcing a contract and generosity in terms of perquisite consumption. These researchers argued that agency problems cannot controlled easily because family members are residual owners of the firm. However if both family owner and family manager are altruistic toward each other, reciprocal, and altruism is equally strong agency problems can diminish [18]. Family businesses with reciprocal altruism have a competitive advantage in following certain business opportunities as they will have lower reservation prices for those business opportunities [12]. Altruism can lead to the result that family members are willing to suffer from short-term deprivation for a long-term firm survival, to reach low overheads, be flexible in decision making and to reduce bureaucratic processes to a minimum. These can lead to a competitive advantage. Especially in environments of scarcity characterized by low entry barriers and labor-intensive production costs this could help to explain the dominance of family firms in service industries, small-scale manufacturing and franchising environments where margins are low and labor costs high.
Agency issues in family firms have broad implications. Altruism and entrenchment can have positive and negative effects on family firm performance. The generation managing the firm, the extent of ownership control, corporate and business strategy and the industry appear to have some influence on whether the influence is positive or negative.
2.2. Resource-based view of the family firm
An important question in the process of establishing a theory of the family firm is whether family involvement leads to a competitive advantage or not. The answer to this question will provide some understanding why family firms exist and why they are of particular scope and scale [2]. The resource-based view helps to identify the resources and capabilities that make family firms unique and allows them to develop family-based competitive advantages [10]. This view suggests that valuable, rare, imperfectly imitable, and nonsubsitutional resources can lead to sustainable competitive advantage and superior performance [11]. Sirmon and Hitt outlined five sources of family firm capital: 1. Human 2. Social 3. Survivability 4. Patient 5. Governance structures. These five sources allow family firms to develop competitive advantages. Additionally Carney described three characteristics of family firm governance (parsimony, personalism, and particularism) which lead to cost advantages , help in the development of social capital, and encourage entrepreneurial investments [12]. Another study of large, long-living family firms showed that continuity and the ability to institute changes without influence or control from outside enables family firms to generate and make exceptional long-term use of patient strategies and relationships with stakeholders. Some resources such as human resources may have negative impacts on economic performance [13]. Zahra, Hayton, and Salvato [14] observed that the relationship between entrepreneurship and the cultural dimension of individualism is nonlinear, which means that too little individualism discourages the recognition of radical innovation while too much inhibits the trust, acceptance, and cooperation required to adopt the innovation. They found out that the relationships between entrepreneurship and three other cultural dimensions as the external orientation, distinctive familiness and long-versus short-term orientation are linear and positive. The entrepreneurial attitude, as a resource, and abilities in a successor may be the key to success in family firm succession. There is evidence that integrity and commitment are more important to the selection and success of a successor than technical skills [2]. Cabrera-Suárez, Saá-Pérez & Garcia-Almeida [15] used the resource and knowledge-based theories to advance the conept of tacit knowledge transfer in succession. They defined it as situation-specific knowledge that is gained through experience and actions. This knowledge is far
Comparative European Research CER 2016 (issue I.)
12

more difficult to transfer than explicit knowledge because this one is based on facts and theories which can be articulated and codified. The resource based view helps to explain the possession of resources which can lead to competitive advantages and shows how family resources have been or can be acquired through family involvement (e.g. the development of tacit knowledge) [2]. 3. The levels of familiness It is important to define the family business exactly when comparing data. The involvement of the family or the so called level of familiness measures how much or how strong the family is involved in the business. Herby the level of family influence ranges from no influence to a maximum influence. Depending on where the business is in its life cycle different criteria which can distinguish between these businesses are percentage of ownership, strategic control, involvement of multiple generations and the intention to keep the business in the family. One way herby is to separate the level of influence in three circles. The outer circle requires only some family participation in the business and involvement in business’s strategic direction. The middle circle requires that the business owner intends to pass on the business to another member of family and that the founder or descendant runs the company. In the narrowest definition multiple generations have a significant influence on the business [4]. Another way to asses the “familiness” of a firm is the F-PEC scale where the three subscales power, experience and culture are used to distinguish. It enables the assessment on a continuous scale rather than restrict its use as a categorical variable. The power subscale measures if there is a direct or indirect ownership. Furthermore the numbers of family vs. nonfamily members in the governance and management board are compared. In the F-Pec questionnaire the experience dimension is determined by the question what generation owns the company and what generation manages the company or participates actively in the business. Additionally the number of contributing and interested family members is asked. The subscale culture indicates - on a scale from 1 to 5 (not at all … to … to a large extent) – which influence the family has on the business, if the values of the family members are the same or if the family and business values are the same and shared [5]. The commitment is a result of different questions regarding the effort, the support of the family, the loyalty, the compatibility of values, the proudness and other factors concerning the relation to the company. Lindow found that the power dimension of the F-PEC scale shows a significant correlation with organizational structure [6]. The power dimension was introduced by Klein and termed “Substantial Family Influence “SFI”. It distinguishes between family and non-family businesses. The “level of family influence” consists of family ownership, family management and family directorship [7]. The SFI formula:
> 0 => : + + ≥ 1
S = stock SFI = substantial family influence Fam = family member MoSB = members of supervisory board MoMB = members of management board
The SFI score can be calculated by the addition of the family’s share in stock members of the management board and members of supervisory board. As a result it ranges from 0 (no family influence) to 3 (maximum family influence). Klein defined a family business as a firm that has an SFI score of at least 1 and some family ownership in the firm. The SFI score shows a strong connection with the organisational structure of the firm, has fewer questions than the F-PEC and is often used in the German speaking area [1]. Three levels can be distinguished 1. A firm that has an SFI score between 2 and 3 is
referred to as a firm that has a high level of family influence.
2. A firm that has an SFI score between 1 and 2 is referred to as a firm that has a medium level of family influence.
3. A firm that has an SFI score between 0 and 1 is referred to as a firm that has a low level of family influence.
First level firms include all firms that are newly founded by individuals or families, because they are regularly both owned and managed by family members. More mature firms can have also a high level of family influence. If, for example, a family holds all shares and supervisory board members and the management board consists of one family manager and one non-family manager, the result is an SFI score of 2,5. A second level firm that has medium level of family influence may have an SFI score of 1,5 if a family holds the entire share in a firm and half of the firm’s directorships, but is managed entirely by non-family members. The third level firm is one that has lost most of its family-business-specific characteristics and may be seen as non-family-business with a small fraction of family ownership and management teams that consist entirely of professionals that own only small share’s of the firm’s equity. The SFI score is a simple way to measure family influence and therefore it has certain shortcomings. Firstly it measures family influence at a certain point in time. Secondly it does not include historical or future developments. Additionally the SFI score only covers the influence of equity owners in the firm and not that of creditors such as banks or corporate bondholders. 3.1. Combination of financial and non-Financial goals Goals and priorities of the family and business systems may not be complementary. Family goals are created and supported by family members. Business goals are for example to make profit, increase the market share be more efficient or other economic goals. Therefore family firms may be characterized as having both financial and non-financial goals. The emotional attachment to family issues
Comparative European Research CER 2016 (issue I.)
13

may distract from a firm’s focus on purely financial goals. In such situations, non-financial goals often become equally or more important than financial goals. Non-financial goals in family firms include family harmony, family employment opportunities, corporate independence and privacy, cross-generational sustainability and management succession. High levels of family ownership empower the family as the ultimate authority and allow the family to reflect its vision on the business. The family firm’s tendency to hold non-financial goals increase when family ownership increases. Studies show that with higher family ownership, goals change towards greater independence and private wealth. As a result family firms are expected to take both economic and (family-centered) non-financial goals into account while making business decisions. It seems that strategic and structuring decisions are made in order to achieve these combined financial and non-financial goals. Therefore it can be assumed that the family is expected to influence strategic and structuring decisions indirectly through their idiosyncratic goal setting [8]. 4. Strategic renewal The above mentioned theories can be used to analyze the influence of familiness on decisions concerning financial and non financial factors. What interests me is the question how the familiness affects management decisions in a narrower sense, as for example the choice and change of legal form – which can lead to a strategic renewal - the effect of taxes and other financial factors. References [1] Hiebl, Feldbauer-Durstmüller and Duller, The Changing Role of Management Accounting in the the Transition from a Family Business to a Non‐family Business, Journal of Accounting & Organizational Change, Vol. 9, No 2, pp. 119-154, 2013 [2] Chrisman, Chua and Pramodita, Trends and Directions in the Development of a Strategic Management Theory of the Family Firm.” Entrepreneurship Theory and Practice, No.5, pp. 555-57, 2005 [3] Pramodita Sharma, An Overview of the Field of Family Business Studies: Current Status and Directions for the Future,” Family Business Review, No. 17, pp. 1–36, 2004 [4] Astrachan, and Shanker, Family Businesses ’ Contribution to the U . S . Economy : A Closer Look., Family Business Review, XVI, No. 3, pp. 211–219, 2003 [5] Astrachan, Klein, and Smyrnios, The F-PEC Scale of Family Influence: A Proposal for Solving the Family Business Definition Problem., Family Business Review, Vol 15, No. 1, pp 45–58, 2002 [6] Lindow, Stubner, and Wulf., Strategic Fit within Family Firms: The Role of Family Influence and the Effect on Performance., Journal of Family Business Strategy 1, no. 3, pp. 167-178, 2010 [7] Klein, Family Businesses in Germany: Significance and Structure., Family Business Review, 13, no. 3, pp. 157–182 , 2000 [8] Lindow, A Strategic Fit Perspective on Family Firm Performance. Vol. 1. Wiesbaden: Springer Gabler, 2013.
[9] Sharma, An Overview of the Field of Family Business Studies: Current Status and Directions for the Future.” Family Business Review 17, no. 1, pp 1–36, 2004 [10] Habbershon, Williams, MacMillan, A unified systems perspective of family firm performance, Journal of Business Venturing, Vol 18, pp. 451-465, 2003 [11] Sirmon and Hitt, Managing resources: Linking unique resources, management, and wealth creation in family firms, Entrepreneurship Theory and Practice, Vol 27, pp. 339-358, 2003 [12] Carney, Corporate goverenance and competitive advantage in family-controlled firms, Entrepreneurship Theory and Practice, Vol 29. pp, 249-265, 2005 [13] Miller & LeBreton-Miller, Managing for the long run: Lessons in competitive advantage from great family businesses, 2005, Boston: Harvard Business School Press [14] Zahra, Hayton & Salvato, Entrepreneurship in family vs. Nonfamily fimrs.: A resource-based analysis of the effect of organizational culture, Entrepreneurship Theory and Practice, Vol 28, pp 363-381, 2004 [15] Cabrera-Suárez, Saá-Pérez, Garcia-Almeida, The succession process form a resouce and knowledge–based view of the family firm, Family Business Review, Vol 14, pp 37-46, 2001 [16] Jensen & Meckling, Theory of the firm: Managerial behaviour, agency costs, and ownership structure, Journal of Financial Economics, 1976, Vol 3, pp. 305-360 [17] Schulze, Lubatkin, Dino & Buchholtz, Agency relationships in family firms. Theory and evidence, Organization Science, Vol 12, pp. 99-116, 2001 [18] Eaton, Yuan & Wu, Reciprocal altruism and the theory of the family firm, Paper presented at the 2nd Annual Conference on Theories of the Family Enterprise, 2002, Wharton School of Business
Comparative European Research CER 2016 (issue I.)
14

URBAN PROFILING - ASPECTS OF PROFILE ORIENTED MARKETING AND ADAPTION MANAGEMENT IN
CONJUNCTION WITH CITIES AND THEIR SUSTAINABLE URBAN SOCIO-ECONOMIC DEVELOPMENT
Rebecca Reschreiter
University of Latvia
Raina bulvaris 19
Riga, LV-1586, Latvia
+43676/9706657
Abstract: Cities are the carriers and pioneers of socio-economic change and diverse development trends. The impact of
globalization and the demographic change shows a significant, unambiguous direction. Therefore cities definitely need clearly
structured and consistent development plans. In this context demands in reference to the planning and usage of urban living
space of cities are increasing and require the use of new profiling systems. The main purpose of this paper is to provide an
empirical evidence and give a short insight in the complex coherence and their important role to position and improve in an
effective way the uniquely and competitiveness of a city in a dynamic global environment among cities around the world in
conjunction with an profile oriented marketing systems so that city and public manager can foster a clearly structured future
vision and profile for an innovative, competitive and sustainable urban developmental planning to guarantee a high quality of
living for their inhabitants to live and work in. This future oriented development, create a challenging situation for the diverse
districts. With the help of systematic, dynamic development processes the goal can be achieved. Firstly you have to figure out,
how you can link and implement profile oriented marketing and adaption management. Therefore you have to clear the
question, is adaption management important to profile oriented marketing and development systems? The Answer is: Yes, it is!
Adaption management is a valuable tool and significantly correlated with sustainable marketing development procecses.
Keywords: adaption management, urban/city development, planning process, profile-oriented marketing, sustainability
1. Introduction and research method
The world is changing fast and entire industries are
reinventing themselves in response to complex transitions
in economic, social and environmental areas. The
increasing urbanization is a key trend and the design of
city systems will play an essential role in shaping a
sustainable, innovative and livable future. Therefore, cities
are subject to constant change and diverse development
trends. [16] The demographic change shows a significant,
unambiguous direction. Over the coming years cities
substantially continue with strong growth. On the other
side, it is likely that many peripheral and structurally weak
regions are currently standing at a watershed in terms of
their regional orientation and in particular are affected by
struggle with massive declining population levels and an
increasing number of elderly people. [13] However, in this
connection, we must also bear in mind that today
innovation, diversity and networked thinking, are
significant and even more important aspects in a
sustainable urban and competitiveness regional
development and go hand in hand. Moreover, the basis of
an efficient communication strategy, focus in particular on
developing long-term, innovative and interlinked thinking.
Cities are also the carriers and pioneers of socio-economic
change and are embossed by their urban living space.
According to current reports of the United Nations, half of
the world’s population is living in cities and it is expected
that this number increase to two thirds of the world’s
population by 2050.
There has been an increasing process of merging cities and
their surrounding regions into a metropolitan figure and a
distinct separation and hierachization of spaces has
become difficult. Therefore cities are expanding to regions
[22], creating a homogenous entity of space regarding
geographic, economic or political criteria.
Therefore, the importance of urban living space is
constantly increasing, as cities are the housing-, work-, and
life-centers of most people. In this context demands in
reference to the usage, planning and design of urban living
spaces and cities are increasing [21] thus require an
innovative thinking manager, planer, leader and the use of
new profiling systems.
Urban living space has long been viewed as the setting of
social and economical developments. However, urban
living space can be viewed as more than that. Current
theorists argue that people are constantly reconstructing
space in their daily actions and space however, has in the
past few decades been redifined by sociologists. [18] Also
the scientific attentiveness towards spatial phenomenon is
currently exceedingly high. [21] [18] Therefore, urban
space is no longer the setting but becomes an integral part
of social and economic processes and is characterized by
suburbanization and structural change and requires to
understand city planning as a dynamic development
process. [14] According to Heinrichs [7], there is a
growing mutual competition between cities and regions,
much like between companies on a free market.
The paradigm shift in the understanding of urban living
space mirrors current paradigm shifts in marketing. Where
the brand itself was in the center of marketing strategies
until recently, new marketing models focus their efforts on
people. Profile oriented marketing [12] has demonstrated
successful in distinguishing goods and services from those
of competitors, because the profile, incorporating the
values of an organization gives the product an emotional
fingerprint.
Comparative European Research CER 2016 (issue I.)
15
The aim of this work is to link current trends in city
development and the understanding of urban public living
space to current trends in marketing strategies, i.e. to link
the attractiveness of a future-oriented city/region to profile
oriented marketing and adaption management. Thereby,
the linking concept between both theories is the concept of
identity/culture. The focus and ultimately outcome of the
doctoral thesis is to design an action-oriented model for
strengthening and accelerating sustainable city
development in the light of current and future challenges
of urbanization. Already existing successful management
models are adapted from organizations and are sharpened
and enriched in their application to cities. Thus in this
thesis – for the first time – will these two important trends
in marketing and management be merged for utilization in
city development planning.
Therefore, the proposed thesis focuses on the following
research question(s):
1. Is profile oriented marketing a suitable tool to increase
(i) the attractivity of a city/region to individuals (citizens)
or organizations (companies) and thereby enhance the
social and economic development
(ii) the sustainability of said development.
2. Which adaptations to profile oriented marketing could
increase (i) and (ii).
This topic is very fresh and important, which is
demonstrated by the fact that 2015 the science year is
dedicated towards defining future cities.
The cities of tomorrow will differ essentially from today´s
city principles.
Thereby it is out of question that in times to come, cities,
definitely need clearly structured and consistent
development plans in order to provide a secure social and
economic environment for their inhabitants to work and
live in. Normative goals are replaced by strategic guiding
principles for the construction of competitive and
sustainable urban structure. Therefore it is the task of
public manager, city- and communal manager and those
who took on responsibility to make sure that short-,
middle- and long-term requirements of the citizens are met
as best as possible, so that a high, sustainable, innovative,
urban development quality can be achieved. [11] This
work is dedicated towards developing such a profiling
system for city development planners as an adaption of
marketing strategies from organizational theory to define a
new “city of the future” – paradigm.
The themes and content of adaption management and
sustainable urban city development cannot easily be
separated from each other, as they are often both
overlapping and interrelated. Thus, it appears to be
important to address the question from a management
perspective of the role of adaption management in profile
oriented marketing for sustainable, innovative economic
and social development on the one hand and from a
marketing perspective on the other hand.
1.1 Knowledge base for the derivation of the new
approach
The derivation of the approach lies in the need for city
development consulting, which will increase through the
growing complexity and integration of the global world,
which also will increase the responsibility of the cities to
ensure a high quality of living for its citizens. Not all city
managers and politicians will methodically be able nor
have the time themselves, to master and steer the necessary
city development process, with clear content, consequent
and durable, in all city divisions. Apart from city
development and urbanization, the theoretical foundations
of this work are based on the holistic management theory,
change and adaptive management and new marketing
models, such as profile-oriented marketing, as well as their
application to cities in form of urban management and city
marketing. Additionally, the model receives input from
findings of current case studies and research projects on
urban development. The focus lies on the usability of these
marketing concepts to increase the sustainability and
development quality of urban spaces within city structures.
Dynamic profiling models shall increase the visibility and
uniqueness of competitive sustainable urban structures and
provide solutions to optimize the urban living
environment. Current European and international
phenomena and technological potential of shaping urban
space are discussed.
1.2 Method of the proceeding The adaptive urban profiling system could be applied by city
planners and public managers purposefully and efficiently for
these future and practice-oriented tasks and shall help them
prioritize and tackle next innovative and future steps. It is to
be understood as a planned, innovative, flexible methodology
for initiating, directing and controlling urban development
processes. Profile oriented individual development concepts
can initially be developed with his help, which could then be
implemented as a systematic planned development process.
This type of method/system also allows the evaluation of
various practical development cases, the identification of
possible problem areas and its corrections. The reflection on
the practical cases, depending on the new method/system
used, allows the gaining of knowledge for the continual
improvement of the mthod/system itself. It is supposed to
design case-specific future-oriented development concepts
and integrate them into a systematic realization process. The
procedure can be applied to any city in order to recognize and
correct its specific problematic. [8]. Thereby, the procedure
will continuously improve with each application. [8] In
accordance with the integrated St. Galler management theory,
the profiling system shall provide a mental roadmap, but not a
patent solution. The system “adaptive urban profiling”
postulates in its core the Cause-Effect-Connection between
the content clarity of a profile oriented, i.e. identity creating
and future oriented city development planning and the
resulting efficient use of resources, the fundamental change of
the participating development actors, as well as, the
consequent profile oriented and iterative permanent process of
the implemented development planning in reality. The
adaptive urban profiling system shall enable city development
planners, public managers and communal polititians to
identify specific and interdisciplinary sucess factors for
managing the transition towards sustainable cities. [2] [17]
Comparative European Research CER 2016 (issue I.)
16

1.3 Derivation of the new approach
Prior to the empirical work, a new urban profiling system
will be developed based on Kellners model for profile
oriented marketing and active adaption management (->
adaptive urban profiling system). The adaptive urban
profiling system will be developed using market oriented
innovation management. [9] Available knowledge based
on the analysis of the current situation is summarized and a
multi-layered concept can be developed and afterwards
applied and tested. [5] [19] At last a critical reflection of
the results of the application will give indications about
potential improvements of the adaptive urban profiling
system. [1] [3] [4] [6] [20]
2 Theoretical foundation
2.1 Adaptive management It is important to translate and describe the term and
aspects of adaptive management in an easily, clearly and
comprehensible way to put it in practice, to ensure that
becomes reality and are systematically integrated into
daily actions that are oriented towards the specific needs
and the new usage and planning. Adaptive management
was introduced in the 1970s, by a group of ecologists.
Their definition basically translates into „learning by
doing’. Adaptive management is now used for all kinds of
projects outside the field of ecology. The key to adaptive
project management is to manage projects based on
learning from actual project performance and to learn via
the use of quantitative methods. Therefore, adaptive
management includes the following elements [10]:
The formulation of management objectives, which are
regularly visited and revised.
A model of the system being managed.
A range of management choices.
Responsive power structures.
Monitoring and evaluation of outcomes.
A mechanism(s) for incorporating learning into future
decisions.
The goal of adaptive management is to determine the best
management strategy through experimentation. Thereby,
adaptive management aims to enhance knowledge and
reduce uncertainties from natural variability, incomplete
data [15] or social and economic changes. Furthermore,
adaptive management aims at a timely response to such
changes, i.e. flexibility in decisions.
Adaption management can be distinguished in passive and
active approaches [10].
2.2 The role of adaption management in profile
oriented marketing for sustainable regional economic
and social development
Cities or regions are constantly subject to social and
economic change, reshaped by the daily actions of their
inhabitants and resident organizations. Therefore
uncertainties can be expected to be high and management
processes have to be highly flexible. Thus, adaption
management measures could be valuable to the aim of
increasing the attractiveness of cities, regions and enhance
the sustainable social and economic development quality
via profile oriented marketing. The paradigm shift in the
understanding of urban living space mirrors current
paradigm shifts in marketing. Where the brand itself was
in the center of marketing strategies until recently, new
marketing models focus their efforts on people. Marketing
strategies need to be monitored, evaluated and updated
accordingly.
2.3 Profile Oriented Marketing Profile Oriented Marketing adds a new dimension to the
concept of marketing: the philosophy. Profile Oriented
Marketing is strategic marketing with a profile.
A profile is a bundle of individual, as unique as possible
characteristics of a communality. These characteristics
include the quality statement (mission), the aspired state
(vision), a clear and valid mind-set (principles) and the
appearance (corporate identity) of the organization.
By defining its aspired state, the profile gives an
organization a clear direction of development, a
perspective to work future oriented. Therefore, the profile
is the pivotal point of marketing actions, as outlined in the
Profiling-Structure Modell by Kellner. [12]
The profile is in itself a result of constant analysis and
prognosis of the own organization (city), the environment,
the competitors and a prognosis of future market
development. Once the profile is established clear goals
can be defined and strategies and measures to achieve
these goals can be developed, which can then be realized
by a strict organization and control mechanisms at each
implementation step. Thereby, profile-oriented marketing
sets an example of how the management processes
formulated by the St. Galler management model should be
implemented in marketing The profile is provided by the
normative management, the strategic management is
responsible for the conception of the marketing strategy
and the operative management for its realization. In that
respect, profile-oriented marketing implements measures
of adaption management. It is however a challenge to
bridge the gap between providing a clear perspective and
keeping values constant and recognizable, as intended by
the profile, on the one hand, and constantly updating and
flexibly changing marketing strategies on the other hand.
2.4 The role of marketing for city development and the
parallels between trends in this two fields
Globalization is the major challenge for both, marketing as
well for city development. Both companies and cities do
now exist in an international environment requiring global
thinking and increasing interconnectedness to other cities
and companies. This process of globalization results in
increasing competition for both cities and companies.
Therefore, both companies and cities have to increase their
adaptive capacity in order to survive.
Another common denominator among the current
challenges for marketing and cities is change. The
environment of cities and organizations is constantly
changing at an increasingly faster rate, such that both cities
and organizations are challenged in their adaptive capacity.
Historically both organization management and cities
development was reactive. When social or economic
changes occurred, the spatial organization of cities or the
Comparative European Research CER 2016 (issue I.)
17

management strategies of organizations were changed
accordingly. For both companies and cities, counter-
movements emerged to change from a simple reactivity to
proactive planning. These movements came in the form of
strategic marketing for companies and (new) urbanism for
cities. However, for both companies and cities it is now
necessary to move from a proactive planning to an
interactive management process.
3 Research Methods - Potential empirical and
statistical design
The object of investigation in this thesis will be cities. In
order to fully capture the breath of the research question, it
will be necessary to collect data from city manager, city
planners, the cities citizens and the local companies. 200
cities in Austria will be randomly selected and asked for
their participation.
The study design will therefore be a multi-level design and
combine qualitative and quantitative data sources.
The independent variable in Research Question 1 is profile
oriented marketing or the elements thereof. The
independent variable in Research Question 2 are possible
adaptations of profile oriented marketing by elements of
adaption management.
The dependent variables are the urban development on the
one hand and the sustainability of the same on the other
hand. Thereby both the social and the economic
development will be taken into account.
Assessment methods: These independent variables shall be
assessed from city managers, municipals and planners via
expert interviews (qualitative) on the one hand and via a
standardized questionnaire on the other hand.
For the assessment of the dependent variable a multi-
method approach will be taken into account in two steps.
On the one hand, and as first step, the status quo of the
urban systems shall be identified. To achieve this status
and derive a city profile, the attractiveness of the city to
citizens (quality of living) and companies will be assessed
referring to a mixture of adaptations of the Mercer study
on Quality of Living.
On the other hand, and in the second step, the
sustainability performance of the city shall be evaluated.
Measuring sustainability represents a long-standing issue
in urban studies. Also population and economic growth
indices will be taken into account. The two data-sources
(citizens and companies) are interlinked, since
employment options as well as income of the citizens will
depend on the local companies.
Statistical analysis will be carried out via structural
equation modelling. Structural equation modelling is
particularly suitable to assess complex interdependencies
between multiple variables. After the model has been
defined, covariance matrices are estimated and fit indices
to assess the fit of the model to the data are computed.
These fit indices can also be used to compare multiple
models for their suitability.
For this thesis the fit indices of the structural equation
models using classical profile oriented marketing as
independent latent variable and an adapted model of
profile oriented marketing (to be developed in the
theoretical phase of the thesis) as independent latent
variable will be compared. The dependent latent variables
are development on the one hand and sustainability on the
other hand, which are both split into a social and an
economic factor. The observed variables are the interview
and questionnaire data. The models are depicted in Figure
1 and Figure 2.
Figure 1 Structural Equation Model 1 – Profile Oriented
Marketing, own representation by author
Figure 2 Structural Equation Model 2 – Adaptive Urban
Profiling System, own representation by author
Expected outcomes
It is expected that the more and the more consciously and
clearly city planners orient their strategies towards profile
oriented marketing, the more is the profile visible to its
citizens and local companies, which leads to identification
with the city and higher proactivity to achieve the common
goal of increasing the cities attractiveness. Therefore,
higher quality of life and attractiveness ratings, as well as
higher expected sustainability of these ratings are expected
in cities with a clear profile/culture. However, it is also
expected that an adaptation of profile oriented marketing is
more suitable for city planning and more successful for
city development and sustainability. Possible adaptations
include a stronger focus on the people and higher
flexibility and the possibility of constant modifications and
updating to the profile.
4. Conclusion
In summary adaption management is a valuable tool to be
integrated in marketing approaches for sustainable regional
and economic development. Profile oriented marketing
Comparative European Research CER 2016 (issue I.)
18

appears to be the option of choice too increase
attractiveness of cities or regions and can give important
impulses. It may be helpful to assess the adaptive capacity
of a city or a region in case of social or economic change.
This capacity may even be integrated into the profile as
part of the marketing strategy: We are attractive, because
we are adaptive.
References
[1] Becker, J. (2006) Marketing-Konzeption Grundlagen
des zielstrategischen und operativen Marketing-
Managements. 8., überarbeitete und erweiterte Auflage
2006. Verlag Franz Vahlen GmbH. München. p. 705
[2] Bleicher, K. (2004) Das Konzept Integriertes
Management: Visionen - Missionen - Programme,
Auflage: 7, Campus Verlag; Frankfurt/Main, p.16
[3] Böhler, H. & Scigliano, D. (2005) Marketing-
Management. Kohlhammer Verlag. Stuttgart, p. 84
[4] Bruhn, M. & Homburg, C. (Hrsg.) (2004). Gabler
Lexikon Marketing. 2. Aufl. 2004 Betriebswirtschaftlicher
Verlag Gabler. Wiesbaden, p. 332
[5] Brunotte, E. (2002) Lexikon der Geographie S. 250 in
Werner, S. (2012) Steuerung von Kooperationen in der
integrierten und sozialen Stadtentwicklung
Machtverhältnisse und Beteiligungen im Prozessraum -
(Artikel) Kooperation in der Stadtentwicklung. Springer
Verlag Wiesbaden, p. 70
[6] Geml, R., Geisbüsch, H.G., Lauer, H. (1999). Das
kleine Marketing-Lexikon, 2. Aufl. Düsseldorf , p. 172f
[7] Heinrichs, W. (1999). Kulturmanagement. Eine
praxisorientierte Einführung, Darmstadt 2.nd Edition:
Primus‐Verlag, p. 9
[8] Hilpert, M. (2002) Streit um die
Weltwirtschaftsordnung: muss die WTO Umwelt- und
Sozialstandards in ihrem Regelwerk verankern? Band
2912 von Europäische Hochschulschriften / 5: Volks- und
Betriebswirtschaft. Lange Verlag, p. 61
[9] Huber, F. Regier, S., Vollhardt, K., Sauer, S. (2006).
Relevanz der Markenpersönlichkeit für den Wert der Marke
- Eine kausalanalytische Studie. F 12 der wissenschaftlichen
Arbeitspapiere, Center of Market-Oriented Product and
Production Management, Mainz, p. 72
[10] Intaver Institute (2014). Adaptive Project
Management.http://www.intaver.com/Articles/Article_Ada
ptativeProjectManagement.pdf (last viewed 20.09.2015)
[11] Kellner, K. (2006). Entwicklungsqualität in
Kommunen steigern. Profilierung als systematisch
gesteuerter Planungs und Durchsetzungsprozess, in:
Mitteilungen der Österreichischen Geographischen
Gesellschaft, 148. Jg, p. 223
[12] Kellner, K. (2007). Kommunale Profilierung – Ein
neuer Ansatz für das Consulting in der Angewandten
Sozial- und Wirtschaftsgeographie. Augsburg:
Geographica Augustana. p. 60
[13] Kern, A. (2015). Public. Communal Magazin,
PBMedia GmbH, Wien, Brüssel. p. 3
[14] Löw, M. & Steets, S. & Stoetzer, S. (2008).
Einführung in die Stadt und Raumsoziologie, 2nd Edition.
Ulm: Verlag Barbara Budrich, p.51
[15] National Research Council (2004). Adaptive
Management for Water Resources Project Planning.
Washington, DC: The National Academies Press
[16] Ramsauer, P., (2012) Stadt der Zukunft – Ideen,
Konzepte, Chancen, In/pact Media Verlag, Berlin, p. 2
[17] Rüegg-Stürm, J. (2003). Das neue St. Galler
Management Modell. Haupt: Bern,
[18] Schroer, M. (2006). Räume, Orte, Grenzen. Auf dem
Weg zu einer Soziologie des Raums. Frankfurt/M.:
Suhrkamp, p. 9
[19] Schmidt, S. (2004). Hoschulmarketing. Grundlagen,
Konzepte, Perspektiven. VDM Müller Verlag, p. 319
[20] Thommen, J. P. (2004). Managementorientierte
Betriebswirtschaftslehre. 7. Auflage, Versus Verlag:
Zürich, p. 294f.
[21] Welch Guerra, M. (2010). "Städtebau“ und
„Stadtplanung“ in Intraurban. Stadt erfinden, erproben,
erneuern. In: Sulzer, J. (Hrsg.) Berlin, p. 5
[22] Zibell, B. (2003). Zur Zukunft des Raumes:
Perspektiven für Stadt - Region - Kultur - Landschaft
(Stadt und Region ALS Handlungsfeld). Peter Lang
Publishing, p. 23
Comparative European Research CER 2016 (issue I.)
19

IMPORTANCE OF THE FACILITY MANAGEMENT (ACTIVITIES) FOR THE COMPANY SUSTAINABILITY
Mehedinţu Gabriela
Technical University of Civil Engineering of Bucharest
Lacul Tei Bvd. no. 122 - 124
Bucharest, 020396, Romania
+40723757085
Abstract: Nowadays, the need for sustainable business has the highest importance. Organizations worldwide understand that
and this need reflects in their policies and decisions. As facility management is also a driver in the nowadays business, the
companies from this field develop practices according to the global developing strategies and are careful to the social,
environmental and economic aspects.
Keywords: sustainability, facility management, responsibility, progress
1. Introduction
The modern perspective on the evolution of mankind in
relation with the environment, social environment and
economic environment has developed new tendencies and
created connections between concepts.
According to the definition from the Explanatory
Dictionary of Romanian Language, sustainability is the
quality of an anthropic activity (determined by human
action) that takes place without using up the available
resources and without destroying the environment, and
without compromising the ability of future generations to
meet their own needs.
The world conference on environment held in Rio de
Janeiro in 1992 paid special attention to the concept,
implying the balance between the economic growth and
the protection of environment and finding alternative
resources. When speaking about the economic growth of a
country or region as a whole, the synonymous term
sustainable development is preferred.
The concept of "sustainability" considered as a solution for
the ecological crisis, as a reconciliation between economy
and environment entered more and more into the everyday
speech, thus acquiring a major significance in the business
language, where it became a priority of the business
environment.
In the same way, the concept of facility management was
taken over in the specialty economic language around the
70's; the concept is more and more present in the business
language, the specialists in the field considering that there
are real opportunities for the facility management to
integrate in the near future the support services of an
organization as a whole.
People talk more and more about sustainability or
sustainable development at micro- and macroeconomic
level, about minimising the costs, about looking into the
future taking into account the social, economic and
environmental effects of the actions performed. Facility
management through its essential services offer sets the
same objectives and aims as the sustainable development.
The stake is to identify as soon as possible the wishes and
needs of the parties the company interacts with, to adapt to
new reality, to be innovative and open to progress. By
taking into account all these aspects, the evolution of the
companies is steady.
2. Sustainability – general presentation
Sustainability is a well rooted concept introduced in the
current vocabulary. The definition most commonly
accepted and used is the one given by The World
Commission on Environment and Development (1987):
“Sustainable development is development that meets the
needs of the present without compromising the ability of
future generations to meet their own needs” [1]. As such
we understand that society, mainly the companies, must be
responsible to the whole mankind and to the future
generations.
The development of the concept is based in the field of the
environment. In time, the concept has acquired three
dimensions. According to the "Triple bottom line", a
sustainable development can be achieved only when the
following three aspects are taken into consideration
equally: economic, ecologic and social [2].
Figure 1: The triple bottom line
The practices of the facility management have the ability
to provide sustainability by their ability to impact upon the
economic environment and to attain the targets, by
activities of campus planning and design, building
construction, waste management, environmental
Comparative European Research CER 2016 (issue I.)
20

management, and building and grounds maintenance and
cleaning.
3. Current and future trends on European level
The European Union's priority is favouring a sustainable
and competitive community. Its strategy 2020 aims at
providing an intelligent economic growth (by innovations
in education), improving the environment (by reducing the
carbon dioxide emissions) and at social inclusion. In order
to develop the three axes, five major objectives are
proposed [3]:
Attaining the employment rate of 75% for the active
population (20-64 years);
Allocating 3% of GDP for research and development;
20% climate change: increasing energy efficiency,
increasing the weight of the renewable energy sources,
reduction of the gas emissions as compared to the year
1990;
Enhancing the education level;
Fighting against social exclusion.
As for the situation of Romania, the following targets
have been set, under the coordination of the
Department for European Affairs of the Romanian
Government [4]:
Reducing the consumption of the primary energy;
Increasing the weight of the energy derived from
renewable sources on the whole by 24%;
Reducing by 20% the greenhouse gas emissions;
Allocating 3% of GDP for research and development –
a difficult objective to achieve due to the current
structures in the field;
Increasing by 40% the share of the population under 30
years having completed tertiary education – aim that is
achievable only by reforms in education and economy;
Increasing the social inclusion by an increase of the
funds for social work and by reforms in the health
field;
Reducing the early school leaving – by implementing
social programmes;
Increase of the employment rate to 75% by reforming
the legal frameworks for the stimulus of employment
and continuous training.
In the following table are highlighted the results of a
comparative study of objectives, regarding the strategy of
Romania and Austria as member states of EU [5]:
Table 1 Objectives for Europe 2020 Strategy
EU/member
states objectives
Employment
rate (%)
C&D
(% of GDP)
Reductions
of CO2
emissions
Renewable
sources of energy
AT 77-78 % 4% -16% 34%
RO 70% 2% 19% 24%
EU/member states
objectives
Reduction of
energy
consumption (Mtoe)
Early
school
leaving (%)
Tertiary education
(%)
Reduction
poverty/social exclusion
(number of
person)
AT 7,16 10% 38% 235.000
RO 10,00 11% 27% 580.000
All these desired directions are different for the two
countries because of the development stage of each one.
Although, in both cases, these directions are transposed
into carefully organized activities at microeconomic levels,
and together with a supporting legal framework they shall
achieve the proposed objectives and develop a healthy and
long-lasting society.
4. Activities of Sustainability within companies
Supplementing the strategy of sustainability of EU, the
European Commission adopted in 2014 the Directive
2014/95/ EU as an amendment to the Directive
2013/34/EU referring to the requirement for the companies
of more than 500 employees to report non-financial
information [6].
During the years 2015-2016 the member states shall
transpose the directive into the national legislation, and
until December 2016, the European Commission shall
prepare the guidelines on the methodology for reporting
non-financial information.
The aim is to prevent abuses and encourage the sustainable
and development activities at a micro- and macroeconomic
level, as well as for a spirit of transparency that shall
improve the business behaviour.
The KPMG study about the Corporate Social
Responsibility (CSR) reporting shows that in Europe, the
reporting percent shall increase significantly until 2017
due to the European regulations and it draws the attention
upon the fact that, for the time being, there are significant
differences within Europe (see Figure 2) which ranked
Europe third on an international level (see Figure 3) [7].
After complying with the legislative rules, these
differences will disappear, and Europe will experience a
revival in terms of the attention offered to reporting and to
the related business activities.
Figure 2: Reporting rates across Europe
79%
61%
74%
0%
10%
20%
30%
40%
50%
60%
70%
80%
90%
Western Europe Eastern Europe Average Europe
Comparative European Research CER 2016 (issue I.)
21

Figure 3: Global trends in CSR Reporting
5. Importance of facility management in the sustainable
development of the company
CSR reporting is an instrument of reporting the annual
performances, supplementing the financial statements. It
covers the reference fields for sustainability (environment,
social, economic) by waste management, emissions,
environmental performance, social performance,
community engagement.
Facility management represents a field taken over into the
economic language in the '70's and it is defined as
"integration of processes within an organization to
maintain and develop the agreed services which support
and improve the effectiveness of its primary activities”. [8]
It includes a wide range of activities that agree with
concepts like efficient costs, improvement of productivity,
innovation, efficient technologies, and high quality of life.
Facility management plays a significant part in supporting
the sustainable performances, beginning with the
purchases, management of the buildings, management of
the employees (healthy and safely), waste management
(recycling, reduction of energy consumption), and until the
facilities performance, aspects that impact directly upon
the social and environmental indicators.
As a part of the sustainable development initiative, the
suppliers of facility management services may offer to
their customers the implementation of some future
oriented technologies and practices. The aim is not only
economic but to change the global mentality towards a
large responsible opening to the social and environmental
needs.
This long term responsibility orientation should take into
account the impact the activities of an organization have at
a community level. Thus, adopting a CSR strategy in the
FM activities, it will result a strategy based on moral
values, development, improvement of the situation in the
entire internal and external environment of the
organization, transparency, risks reduction and last but not
least, it will bring improved financial results by the
efficient use of the resources, improving the image and the
quality of the relations with the stakeholders.
Analysing the Triple Bottom Line Approach, it can easily
be noticed in practice that the following aspects are
accomplished [9], as presented in figure 5:
At an economic level:
The efficient planning of the budget by taking into
account the global impact of an activity;
Cost savings by the efficient use of the resources and
of space;
Effectiveness of decisions for the entire supply chain
by having some common sustainable perspectives;
At a social level:
At the internal level of an organization: respect for the
human rights and improvement of the work
environment, hence productivity increase;
At the external level of the organization: community
development and care for the future generations by
protecting and improving the present situation;
At an environmental level:
The indoor and outdoor air quality by using the green
devices (ventilation, sanitary, gas etc.) and the
environment-friendly building materials;
Development of economic buildings with low energy
and water consumption;
Application of waste minimisation techniques.
Figure 4: Incorporating sustainability into facility
management
6. Impact of the facility management upon the
sustainable policy of the company – case study OMV
Group
The international oil and gas company, OMV Group, has
been reporting on sustainability since 2001, in order to
describe their attitude to the environmental, social and
governance issues. The sustainable strategy called
„Resourcefulness” wants to create a long-term win-win
situation between this three dimensions and the company.
During the year 2014, OMV Group had an active
environmental and energy management, invested EUR 108
mn in environmental protection and carried out 1,250 actions
in their top 43 facilities. They supported local economies
through local employment and by developing local suppliers
and also educational initiatives, with a particular focus on
technical education for women and entrepreneurship [10].
The department of facility management from Romania is
responsible for a wide range of activities such as: Business
Suport (Canteen and catering services, stationery
management and travel services), Facility Servies ( standard
working places or office relocation, maintenance services -
69% 71% 61%
49%
76% 73%
54%
71% 77% 74%
53%
79%
0% 10% 20% 30% 40% 50% 60% 70% 80% 90%
America Europe Middle East,
Africa
Asia, Pacific
2011
2013
2015
Comparative European Research CER 2016 (issue I.)
22

electricity, elevator, furniture, cleaning, temperature, outdoor
services), fleet management, Real Estate asset Project
Management ( to increase transparency of the OMV Petrom’s
real estate asset portfolio in Romania (location, building, legal
status, financials), and to provide recommendations for
portfolio size optimization, modernization and consolidation)
[11].
All these activities are centered in such a manner as to attain
the objectives of the sustainable policy of OMV group.
One of the fields of interest, pertaining to the facility
management, which have been remarked and contributed to
the sustainable development of the group in 2014 is „Health,
Safety and Security“: activities focused on the employees’
physical and mental well-being, accident prevention, and
international cooperation on security. The desire/objective is
to implement in the future the HSSE standards in order to
prevent the possible human injuries [10]. Under the global
conditions, the risks of disease outbreaks by biological
vectors increase, and ensuring a high level hygiene and safety
against pathogens in the environment we work or live,
represent an essential element for the people's health.
The company integrated within the group a Health
Management Department promoting the awareness of health
at the workplace. In the meantime, there is a network of
physicians, nurses and medical experts who work in
Romania, offering medical and advisory services (PetroMed).
Medical analyses and vaccination programmes are organized.
Hygiene is another aspect of high concern. The disinfection
and pest control activities are performed both inside and
outside the company, as often the health rules in force
provide.
Due to the specific field of industry the company activates in,
the prevention of accidents is essential and guided by strict
rules. We train, empower and encourage people to work
safely at all times and invest in technology, programs and
processes to ensure that our facilities and operations are safe
for employees, external stakeholders and the environment.
The management of the vehicle fleet takes into account the
safety of the employees, by service activities and by ensuring
safety travel conditions through special trainings.
Another component, as part of the employees' ensuring a high
level of wellbeing and comfort is the management performed
by the Department of Facility Management of the reception,
catering and canteen services by a careful selection of healthy
products able to cover the diversity of the employees' tastes.
By the management of the spaces and areas, the facility
management team offers modern workplaces, ergonomic
lights according to standards. Projects of planning, design and
relocation take place continuously in order to create an
attractive work environment, always new and healthy for the
employees.
Environmental Management – this field of interest, for the
OMV Group, is closely linked to the basic activity of the
company, but also to the way facility management deals with
the wells, refineries and corporate offices, which are
preserved and maintained at high levels of energy and
environment efficiency by the facility management. The
waste management, the management of energy, water
consumption and carbon emissions are the lines of interest in
this respect.
In Romania, the company finished in the year 2011 the
campus called Petrom City that is endowed with a tri-
generation plant (producing electrical power, heat and cooling
energy) unique in the country, and in the year 2014 the
company finished Petrobrazi refinery modernization, thus
improving the economic efficiency by 25% to the year 2009.
The Facility Management Department offers
recommendations for optimising, modernising and
strengthening the real estate portfolio. It performs technical
assessments, identifies solutions and starts projects up to the
delivery stage of the investment to the recipient, respectively
the company.
The facility management department coordinates all these
activities, performs internally facility management initiatives
and in the meantime it works with subcontractors, specialized
companies in the field, adding more value to the activity and
supporting the sustainable development.
7. Conclusions
Sustainability is an important subject on the agenda of the
superior levels of management. Companies develop
policies in accordance with these international trends and
develop society and environment-friendly practices, but in
the meantime in compliance with the economic conditions.
Reporting these practices is part of the strategy, and the
trend is upward. Being new and in a process of
development, the field of facility management is directly
interested by the compliance with these requirements. All
the activities related to this field are developed in order to
contribute to the wellbeing of the society at large.
8. References
[1] Report of the World Commission on Environment and
Development: Our Common Future, 1987
[2] Crane, A.; Matten, D, Business Ethics. An European
Perspective. Managing Corporate Citizenship and
Sustainability in the Age of Globalization, Oxford,
University Press, 2004, p. 24-29.
[3] http://ec.europa.eu/europe2020/index_en.htm
[4] Pînzaru, A.-I., Prociop, C.-I., Strategia Europa 2020 și
stadiul implementării în România, Bucureşti, 2014.
[5] http://ec.europa.eu/europe2020/pdf/targets_ro.pdf
[6] European Commission, http://ec.europa.eu/finance/co
mpany-reporting/non-financial_reporting/index_en.htm
#news
[7] KPMG, The KPMG Survey of Corporate
Responsibility Reporting 2015, http://www.kpmg.co
m/CN/en/IssuesAndInsights/ArticlesPublications/Docume
nts/kpmg-survey-of-corporate-responsibility-reporting-
2015-O-201511.pdf
[8] European Committee For Standardization, 2006,
Facility Management – part 1: Terms and definitions,
Brussels
[9] TEFMA, A Guide to incorporating Sustainability into
Facilities Management – Draft, 2004, http://www.tefm
a.com/uploads/assets/conference_papers/SustGuideDraft.pdf
[10] OMV Group, Sustainability Report 2014
[11] http://intranet.petrom.com
Comparative European Research CER 2016 (issue I.)
23

GEOGRAPHIC INFORMATION SYSTEM (GIS)
CONTEMPORARY SYSTEM CRUCIAL FOR LAW ENFORCEMENT AGENCIES
MSc Afërdita Qekaj-Thaqi, PhD candidate
European University of Tirana
Tirana, Albania
Abstract: Geographical Information System- GIS is called from many professionals as a next step in the evolution of
information technology. GIS system is the basis of information and analytical equipment that aides in managing large number
of data not only from one source but enabling gathering of data from many sources at once. Nonetheless, GIS at the same time
accelerates the responding time and better understandings of data importance especially to law enforcement officers whose
time for crime prevention and rapid solution of problems is a prime. Using GIS is worth for every penny invested in it.
Everyone from its users has benefited from the introduction and continuous development of GIS, but it has been considered as
the most powerful technological change from the law enforcement agencies. Application of the system from law enforcement
agencies made a huge progress on its performance and service providing on Administration, Management, Patrol operations,
Analyses of crime, Information and Reporting. This paper will explain why GIS is considered as such from these agencies, how
it is used by them and also the implementation of GIS into these institutions. Additionally, GIS has increased the effectiveness
within law enforcement agencies enabling them progressing much more, being precise, accurate and efficient on a scope of the
work especially on crime analysis and public safety.
Keywords: GIS, Law enforcement, data, analyses, safety.
1. Introduction
Geographic Information System (GIS) is the new
emerging field and grows at very rapid pace. Currently,
GIS is being used by many professionals in miscellaneous
disciplines. Due to its importance the system has become a
billion dollar industry with applications in various fields
and disciplines As any of technology is developed out of
necessity, GIS has no exception. In fast moving livings
trends, nowadays it is unimaginable and impossible either
manually collecting, storing and retrieving bundle of
documents with data in it. Therefore, when large amount
of data available are needed to be processed, technology
takes place by giving hand to its users via using a
computer and other similar tools in order data to be
gathered, stored, organized, and retrieved for later current
or later utilization. This is exactly what GIS is about. So,
merely GIS is a system which in general integrates, stores,
edits, analyses, shares, and retrieves various and diverse
type of data by displaying them as information for later
usage (Elengovan, 2006). Geographic information system
plays an important role not only on spatial history. From
its the very beginning of this technology development, the
application of GIS contributed mainly to the spatial data
which helped the way people work; distribute their
knowledge and also how people live. Along with GIS, the
technological advancements had a great impact on GIS
developments through years by becoming much more
powerful and user-friendly (Silveira, 2014). Since GIS
technology is growing faster and becoming much more
powerful, it has been seen as a great tool for managing and
analyzing spatial data and information for public security.
Simply, we are all walking with GIS. This means that, in
today’s world we are able to find a map, look at it and
question about it, plan trips, find camping locations etc.
So, in essence, we are able to learn new things from
computerized maps provided by GIS technology (Cox,
1995). With abundance of characteristics GIS has been
employed by many different organizations and agencies
as: governmental agencies, private businesses, national
organizations, scholars, and pointing out law enforcement
agencies, in particular.
2. Applications of GIS
Applying the law means the solution. As commanding,
officer is engaged to answer a scene or an analyst collect
pieces of the elements to unite as examples of the incident
to make decisions, as part of the daily work. Such
important decisions have a direct impact on citizens and
colleagues of law enforcement personnel. To successfully
carry out the work with GIS - geographic information
technology offers geographical advantages for law
enforcement at the same time by transforming data into
actionable knowledge.
GIS combines layers of data on locations enabling users,
police officers, who have deeper knowledge of the location
where he/she operates also have information on what is
happening in the surroundings. Data and information may
be collected depending on the intended use either
reconstruction or construction area, for better allocation of
resources, analysis for discovery of crimes in emergency
cases, best examination of the locations to conduct
research on crimes last / series of crimes, or for creating
perimeter of crime scenes or natural disasters. GIS
technology combines dynamically many layers of data on
display enabling the necessary data and information to
reach the hands of those who need them and who will use
them for the common good for all citizens (ESRI, 2008).
Comparative European Research CER 2016 (issue I.)
24
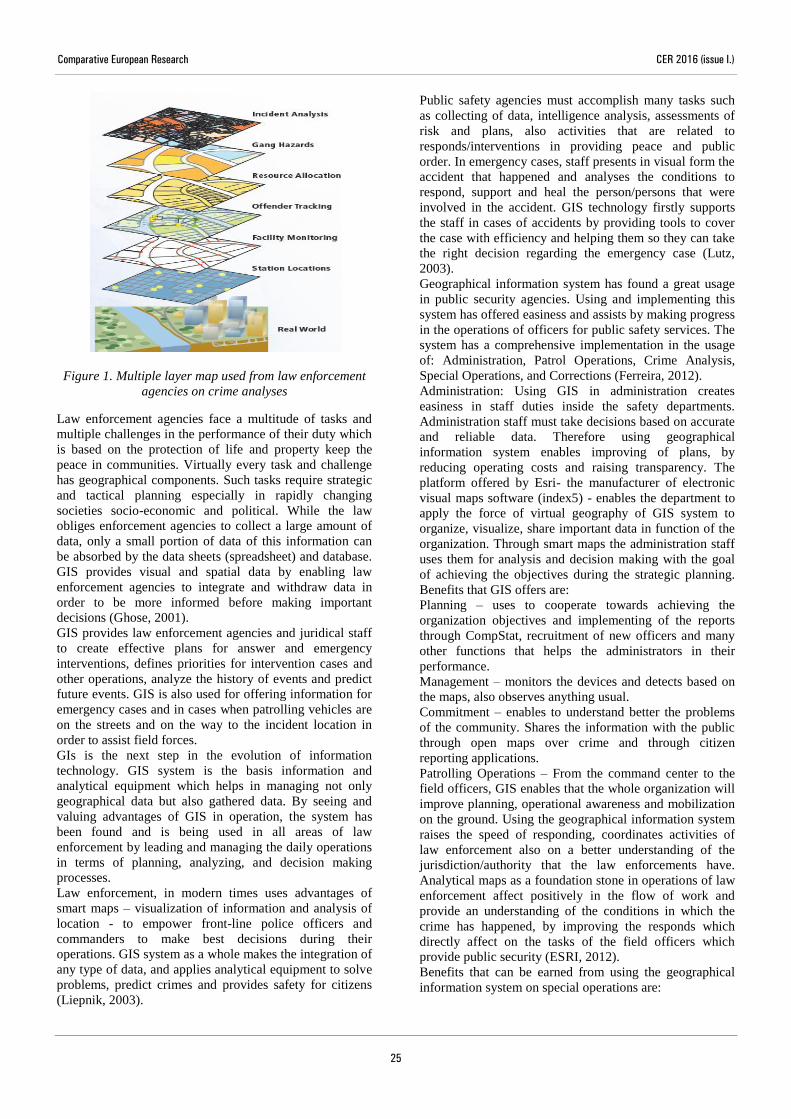
Figure 1. Multiple layer map used from law enforcement
agencies on crime analyses
Law enforcement agencies face a multitude of tasks and
multiple challenges in the performance of their duty which
is based on the protection of life and property keep the
peace in communities. Virtually every task and challenge
has geographical components. Such tasks require strategic
and tactical planning especially in rapidly changing
societies socio-economic and political. While the law
obliges enforcement agencies to collect a large amount of
data, only a small portion of data of this information can
be absorbed by the data sheets (spreadsheet) and database.
GIS provides visual and spatial data by enabling law
enforcement agencies to integrate and withdraw data in
order to be more informed before making important
decisions (Ghose, 2001).
GIS provides law enforcement agencies and juridical staff
to create effective plans for answer and emergency
interventions, defines priorities for intervention cases and
other operations, analyze the history of events and predict
future events. GIS is also used for offering information for
emergency cases and in cases when patrolling vehicles are
on the streets and on the way to the incident location in
order to assist field forces.
GIs is the next step in the evolution of information
technology. GIS system is the basis information and
analytical equipment which helps in managing not only
geographical data but also gathered data. By seeing and
valuing advantages of GIS in operation, the system has
been found and is being used in all areas of law
enforcement by leading and managing the daily operations
in terms of planning, analyzing, and decision making
processes.
Law enforcement, in modern times uses advantages of
smart maps – visualization of information and analysis of
location - to empower front-line police officers and
commanders to make best decisions during their
operations. GIS system as a whole makes the integration of
any type of data, and applies analytical equipment to solve
problems, predict crimes and provides safety for citizens
(Liepnik, 2003).
Public safety agencies must accomplish many tasks such
as collecting of data, intelligence analysis, assessments of
risk and plans, also activities that are related to
responds/interventions in providing peace and public
order. In emergency cases, staff presents in visual form the
accident that happened and analyses the conditions to
respond, support and heal the person/persons that were
involved in the accident. GIS technology firstly supports
the staff in cases of accidents by providing tools to cover
the case with efficiency and helping them so they can take
the right decision regarding the emergency case (Lutz,
2003).
Geographical information system has found a great usage
in public security agencies. Using and implementing this
system has offered easiness and assists by making progress
in the operations of officers for public safety services. The
system has a comprehensive implementation in the usage
of: Administration, Patrol Operations, Crime Analysis,
Special Operations, and Corrections (Ferreira, 2012).
Administration: Using GIS in administration creates
easiness in staff duties inside the safety departments.
Administration staff must take decisions based on accurate
and reliable data. Therefore using geographical
information system enables improving of plans, by
reducing operating costs and raising transparency. The
platform offered by Esri- the manufacturer of electronic
visual maps software (index5) - enables the department to
apply the force of virtual geography of GIS system to
organize, visualize, share important data in function of the
organization. Through smart maps the administration staff
uses them for analysis and decision making with the goal
of achieving the objectives during the strategic planning.
Benefits that GIS offers are:
Planning – uses to cooperate towards achieving the
organization objectives and implementing of the reports
through CompStat, recruitment of new officers and many
other functions that helps the administrators in their
performance.
Management – monitors the devices and detects based on
the maps, also observes anything usual.
Commitment – enables to understand better the problems
of the community. Shares the information with the public
through open maps over crime and through citizen
reporting applications.
Patrolling Operations – From the command center to the
field officers, GIS enables that the whole organization will
improve planning, operational awareness and mobilization
on the ground. Using the geographical information system
raises the speed of responding, coordinates activities of
law enforcement also on a better understanding of the
jurisdiction/authority that the law enforcements have.
Analytical maps as a foundation stone in operations of law
enforcement affect positively in the flow of work and
provide an understanding of the conditions in which the
crime has happened, by improving the responds which
directly affect on the tasks of the field officers which
provide public security (ESRI, 2012).
Benefits that can be earned from using the geographical
information system on special operations are:
Comparative European Research CER 2016 (issue I.)
25
Sharing: transferring the scarce resources by using the
maps to observe anything on a place such as: staff,
incidents, assets, traffic and other useful things for field
officers that have patrol duties.
Improving by using CompStat you improve the plans,
whether they are short-term plans or long-term plans or
daily operating tactics using maps as usual operational
views.
Protecting-provides: protects and serves the officers and
the community using intuition maps and offers a better
meaning in local level (Johnston, 2001).
Analysis of crime: All agencies pull out data from the
CAD (Computer-Aided dispatch) or RMS (Record
Management System) system and from all other systems or
police sensors, the staff of law enforcement may have
difficulties to summarize all the needed data in one place.
With ArcGIS platform, the crime analysis department can
generate large amounts of data from one single place from
the examples of crime and the appropriate police strategies
become evident.
Benefits of using GIS in crime analysis are:
Prediction: Location analysis makes the connection and
identifies the samples/models. Convert the historical data
and actual trends in knowledge.
Optimizes: Makes the connections inside the
organization/police service – telephone calls for services,
locations of crimes/incidents, data and information about
the suspects. It uses the maps to provide the content of the
data.
Shares/uses together: operational data taken from the panel
of the devices which is located on the front part of the
police car on which is put a front camera and mobile
devices with the potential of analyzing fingerprints- all of
the from the center of command in real-time to the patrol
car.
Special Operations: Special management of events and
operations is a part of the law enforcement mission which
part is growing day to day even more. Whether there
events are planned or not, preparing for them is important.
Esri through GIS helps you to plan even the worst case
events through the space solution which supports initial
planning, tactical operations and final debriefing.
Gathering spaces, location of officers, assets and the
needed cars are used to fulfill the mission (Groff, 2002).
Positive effects of using GIS in special operations are
because it helps to:
Prepare: that in case of operations, the officers must be
prepared with maps which support the initial planning for
the special events, interventions in case of natural disaster
also other tactical operations on a larger scale.
Manage: Raise awareness in real time in situations that can
only happen during the operations and at the same time it
adds possibilities for interventions in incidents at the time
that they happen.
Inform: Organize, analyze and shares for usage the
timelines (deadlines) of events and all of these in
understandable forms. It collects the data and locations all
together in a narrative form-in speaking (Chainey, 2013).
Corrections: mission of those responsible/officers of law
enforcement is more than detention and arrest of persons
with criminal record. All types of crime management
benefit from analysis over locations and visualizations.
Regardless if the departments deal with arrests,
detainment, fines or monitoring of those released on bail,
the correction officers must use integrated maps that also
can be used from other units by sharing them, these maps
are used to improve corrections, releases on bail and the
duties of persons released on bail. Improving in decision
making is supported by data that are offered from using
GIS system which enables to observe and monitor the
situation and also react if it is requested.
The same as using in administration, patrol operations,
crime analysis and special operation even at corrections
the application of GIS brings its benefits which separate as
following:
Tracking: helps in managing the activities of prisoners,
identification of dangerous prisoners and places with
possible violence using the comprehensive maps.
Monitoring: it offers opportunities for observations of
many locations in one place while enabling that the
observe officers to have the chance in real time to have it
clear what is happening in field or spaces where the
arrested or the prisoners are held.
Reporting: collects the observation reports, manages
uploaded works, develops automatic alarms and offers
more accurate information in communication with the
interested parties.
For the advantages that GIS offers in corrective issues,
Alphonzo Albright, director of Correctional Center in New
York, USA, says that: Plans and responsibilities grow with
the application of GIS in the correctional departments,
inmates and released on bail (ESRI).
3. GIS in police intelligence services
New developing trends between agencies of future
thinking, through the force of GIS it is enabled to them the
transformation of police officers to protect and serve the
community. GIS at the same time offers methods based on
information and supports all roles and aspects of law
enforcement. The use of GIS was proved to be very
effective in many departments and police units while
offering help for the staff:
Staff in field – can have access in the intelligence
information from their mobile devices while identifying
suspicious activities, enabling them to expand the field of
investigation, to have access on data about the
suspect/suspects and accomplish crime analysis.
Incident commanders – can use GIS to understand the
trends, to make important decisions in cases when crimes
happen and they can cooperate with other agencies that
have also the responsibility of law enforcement.
Crime and intelligence analysts – use sophisticated
/advanced devices to support decisions during the
operations and address issues of tactical strategies whether
they are short-term or long-term.
Police chiefs - GIS can offer the chief of police
comprehensive view in long-term decision making. Also,
they-police chiefs can look and analyze predictive models
of crime with the purpose of developing detailed and
comprehensive strategic plans in support of the staff.
Comparative European Research CER 2016 (issue I.)
26

Also the enforcers can use GIS as a solution for:
Defining optimal locations for resource sharing,
Analyzing the dynamics of incidents to take decisions
based on accurate information and for supporting
operations,
Identifying and examining suspicious activities and
threats,
Improve the safety of the officials and officers by
offering them information and attention from incidents
that can be repeated,
Create a crime scene in a visual form in order to
provide integrity for investigation,
Exchange information with the neighboring
authorities or other authorities in many countries of
the world (Ratcliffe, 2012).
4.Conclusion
At this time of rapid technological changes, the interaction
of technology and GIS is more than necessary.
Additionally, there are a lot of benefits, as above
mentioned, from this cooperation between technology and
GIS. Called as a computational geography, GIS is simply
an interaction of environment and humans in space and
time (Frank, 2000). Last two decades, GIS has
revolutionized the world. Given that GIS technology has
evolved and grew very quickly with other integrated
technologies, it has affected the planners by making
important changes in geospatial technology. Nowadays,
GIs is a tool kit for planners as a standard item. This
means that GIS is having a great impact in the way we live
and the way we work (Drummond, 2008).
References
[1] Da Silveira, LE. Geographic Information Systems and
Historical Research: An Appraisal. Journal of Humanities
& Arts Computing: A Journal of Digital Humanities. 8, 1,
28-45, Mar. 2014
[2] Cox, AB. An overview to geographic information
systems. Journal of Academic Librarianship. 21, 4, 237,
July 1995
[3] http://www.esri.com/news/arcnews/summer08article
s/gis-in-law-enforcement.html
[4] Ghose, R. Use of Information Technology for
Community Empowerment: Transforming Geographic
Information Systems into Community Information
Systems. Transactions in GIS. 5, 2, Mar. 2001.
[5] Leipnik, Mark R., and Donald P. Albert, eds. GIS in
law enforcement: Implementation issues and case studies.
CRC Press, 2003.
[6] Lutz, W. Low-cost technology for public safety.
American City & County. 118, 3, 10, Mar. 2003.
[7] Ferreira, J; Joao, P; Martins, J. GIS for Crime Analysis:
Geography for Predictive Models. Electronic Journal of
Information Systems Evaluation. 15, 1, 36-49, Jan. 2012
[8] http://www.esri.com/~/media/Files/Pdfs/library/broc
hures/pdfs/esri-technology-law-enforcement.pdf
[9] Johnston, Kevin, et al. Using ArcGIS Geostatistical
analyst. Vol. 380. Redlands: Esri, 2001.
[10] Groff, Elizabeth R., and Nancy G. La Vigne.
"Forecasting the future of predictive crime mapping."
Crime Prevention Studies 13 (2002): 29-58.
[11] Chainey, Spencer, and Jerry Ratcliffe. GIS and crime
mapping. John Wiley & Sons, 2013.
[12] http://www.esri.com/industries/law-
enforcement/corrections
[13] Ratcliffe, Jerry H. Intelligence-led policing.
Routledge, 2012.
[14] Drummond, WJ; Frenc, SP. The Future of GIS in
Planning: Converging Technologies and Diverging
Interests. Journal of the American Planning Association.
74, 2, 161-174, 2008.
[15] FRANK, AU. Part 4 Technology and the future of
GIS and spatial analysis: Geographic Information Science:
New methods and technology. Journal of Geographical
Systems. 2, 1, 99, Feb. 2000.
[16] Elengovan. K. Fundamentals, Applications and
Implementations. New India Publishing Agency. 1. 2006.
Comparative European Research CER 2016 (issue I.)
27

SPECIAL ECONOMIC ZONES IN POLAND AND IN THE WORLD
Beata Glinkowska
University of Lodz, Faculty of Management
Address
Lodz, 90-237, Poland
Telephone number (+48) 608 405 470
Abstract: The study is an analysis of the quantitative and territorial functioning of special economic zones in Poland and in the
world. It provides definitions and origins relating to economic zones as well as examples of the existence of special economic
zones in highly developed countries and developing countries. It also highlighted other reasons for the creation of economic
zones in countries with a high degree of development and in rapidly developing countries.
Keywords: special economic zone, enterprise, investments
1. Introduction
The special economic zone is currently the most common
form of economically privileged zones in the world, that
is, where the government of the country concerned has
applied extraordinary facilitations, reliefs, and tax
reductions. Legal environment considers it as a special
place - enclave on the territory of a state where the rules
governing the overall national economic activity do not
apply. The aim of the study is to show the real state of the
quantitative and territorial existence of economic zones in
selected countries, distinguishing between developed
countries and developing countries. The study was based
on the literature and statistical data of the Central
Statistical Office in Poland.
1.1 Economic zones - essence, definitions, objectives
According to the economic approach, special economic
zone is an element of the global economy, whose aim is to
create special economic and financial incentives and to
build mechanisms of connections in the international
market. The concept of "special economic zone" is not
accurate, even at the level of a single country. In each
country there is an even greater diversity of the term. The
definition of this term is the sum of many meanings,
consisting primarily of its individual parts:
"Special", because of specific regulations applied
exclusively to the areas covered by the zone,
"Zone", as it represents an enclave within the territory
of the country,
"Economic" because the companies located on its
territory may benefit from the economic privileges for
their own activities [1].
"The term zone, although it implies a clearly defined
territory, is variously applied in practice. In some countries
the zones include clearly segregated enclaves (e.g.
Dominican Republic), in the others a "zone" is the whole
country (Mauritius, Sri Lanka) or provinces or cities
(China). In Poland, the "zone" usually consists of a number
of enclaves which are located dozens of (...) kilometres
away from one another"[2]. Economic zones in the world
have different legal status: "(...) from the full economic
autonomy to areas under direct state administration. In
some countries a uniform law relating to special economic
zones is in force in the entire country, while in the other
regulations are created for each zone separately (e.g.
China, Malaysia) "[3].”The privilege of zones - areas that
are identified spatially - involves mainly releasing the
operations conducted within them from fees and
regulations that are in force outside their territories" [4]. In
Poland, the legislature decided to describe economic zones
as closed territorial enclaves. It is in Poland a relatively
new concept. According to the Act of 20 October 1994
years Special Economic Zone is an administratively ring
fenced, uninhabited area of Polish territory, where
business activity may be conducted based on preferential
terms [5]. Economic zones have no legal personality, are a
separate part of Polish territory. They are not subject to
court registration [6, 7]. They are created by the Council of
Ministers by means of decrees at the request of the
Minister of Economy, after the completion of all the
necessary arrangements with the local authorities [8]. The
functioning of the zones is regulated by the specific
decrees, which define, among other things: the zone's
terms of use, rules of the tender or development plans for
the zone [8].
Goals that are set before economic zones show that on the
one hand they are to be an important instrument for the
development of regional policy, on the other , however, -
tools of economic policy in the sphere of specific
industries [8]. The essence of the development of the zones
is mainly the introduction of new strategic investors, often
foreign, attracted by the good investment conditions.
Special zones are to use in their own development goals
the capital and technology of new investors.
In Poland, only a commercial company can manage the
Special Economic Zone (SEZ), provided that the Treasury
or the provincial government has an absolute majority of
votes at the general meeting. The supervisory board of the
management company consists of up to five people. They
are the representatives of the Office of Competition and
Consumer Protection, the Ministry of Economy and the
province governor [8]. The activities in the SEZ are
conducted on preferential terms, which gives entrepreneurs
tangible benefits. One of them is exempt from corporate
income tax or personal income tax, only from the income
earned in the zone and on the basis of the authorization
Comparative European Research CER 2016 (issue I.)
28

granted [9]. Another benefit for the enterprises is the zone
fund, regulated in Poland by the decree of the Council of
Ministers on granting aid to new investments under the
zone fund, announced 10th April 2006 [8]. SEZs cannot be
accessed by businesses related to the production of tobacco
products, fuels, spirits and activities associated with the
numerical games and games of chance [8].
The creation of SEZ aims to stimulate economic growth
and development in the region. The essence of the
existence of the SEZ is the realization of goals:
revival of certain economic activities,
an increase in exports of goods,
utilization of unused natural resources, taking into
account ecological principles,
creating new jobs,
the use of modern technology in the economy,
an increase in competitiveness of the region,
utilization of existing infrastructure and industrial
assets [10].
1.2 The origins of economic zones in Poland and in the
world
Special economic zones have a long history. Their sources
are all areas where any relief or privilege for commercial
or production activity was applied. The first known
privileged zone was the Greek island of Delos in the
Aegean Sea [11]. In the year 146 BC in the history of the
island of Delos, the destruction of Corinth and Carthage
was the beginning of the development of the most
important ancient commercial and port cities. The idea of
creating privileged zones is more than two thousand years
old, because some port cities of ancient Greece and Rome
did not charge customs duties. In the sixteenth-century
Italy there were economically privileged areas. In an
Italian port special areas were designated where goods
could be stored and repackaged without paying customs
duties. This was to encourage the ship-owners to direct
their ships into these and not other ports [11]. The first
privileges offered to entrepreneurs were relieves in
customs duties, which also contributed to the development
of Hamburg (the most important of ports in Europe).
Hamburg, Lübeck, Rostock and Riga belonged to the most
important cities of the Hanseatic League, which in the XII-
XVI monopolized the trade in the Baltic Sea. In the ports
of the Hanseatic League there were designated areas where
the goods could be stored and repackaged, and then
exported without paying customs duty. [12] In Puerto Rico
in 1951 the first duty-free zone of the production nature
was created; and an export processing zone in Shannon in
Ireland, founded in 1959, is an economic zone much better
known in the world. Such zones were created also in the
Far East (the turn of the seventies and eighties of the last
century) and focused primarily on the production and
export of goods [10, p. 43]. The existence of zones in a
number of countries was affected by economic conditions
of those countries, availability of labour, the strengths and
weaknesses of the regions and the availability of natural
resources [10, p. 100]. Table 1 presents the state and
development of SEZ in the world by 2006.
Table 1 Basic values associated with Special Economic
Zones in selected years
Source: R. Patusiak, "Specjalne Strefy Ekonomiczne jako
stymulator rozwoju gospodarczego", ed. University of
Lodz, Lodz 2011, p. 106.
The table shows the dynamic development of SEZ in
recent years. In 1997-2006, the number of Special
Economic Zones in the world increased by 2,655 and the
number of people employed in them by 21.5 million. In
2006, the existence of these zones was noted in 130
countries. Currently, the growth rate is much lower, and
economic zones in some countries have a definite short
life. In Poland it is assumed that they will exist until 2026.
In Central and Eastern Europe, as well as in Poland, SSE
became an instrument of economic change. After the
change of regime, governments in 1989 sought to
transform the economy from a centrally planned to a
market economy [8, p. 86]. The help of the state was
necessary to solve many economic problems. On 20
October 1994, pursuant to the Act, Special Economic
Zones came into existence in Poland [10, p. 34. They were
to attract outside strategic investors and stimulate the
economy of the state. In Poland, there is no single
economic zone. As the first in 1995, Special Economic
Zone Euro-Park Mielec was established for a period of
twenty years. In 1997 as many as 14 economic zones were
created, and their total area amounted to more than 6,000
hectares [10, p. 43]. At present there are still 14 SEZs in
Poland. They occupy a total area of over 15,673 hectares
and the investment value of companies operating in the
Polish economic zones exceeded 85 billion dollars. There
were 247,451 people employed in the zones at the end of
2012. The largest capital expenditures have been incurred
in the zones by investors from Poland, Germany, the
United States and the Netherlands [13].
1.3 Examples of special economic zones in highly
developed countries
In the so-called highly developed countries the special
economic zones are established primarily to solve the
specific regional or local problems, or to develop specific
industries, and accelerate the development of new
technologies. Due to the relatively high supply of foreign
capital, there is no need to stimulate additional inflow of
direct foreign investments through the creation of special
Specification Year
1975 1986 1995 1997 2002 2006
The number of countries where
special
economic zones exist
25 47 73 93 116 130
The number of special
economic zones
79 176 500 845 3000 3500
Employment in
mln 0,8 1,9
No
data 4,5 13 26
Comparative European Research CER 2016 (issue I.)
29

economic zones, which distinguishes the essence of the
creation of zones in these countries from the developing
countries [14]. For example, the reason for establishing of
the economic zone in Shannon, Ireland, was the threat of
job losses at the airport for several thousand people.
Shannon Airport had international significance until the
end of '40s of the twentieth century, because of the
stopovers and refuelling of aircraft. After the introduction
of jet planes - stopovers were no longer necessary. Then
the idea arose to create a production zone in Shannon, and
to tempt the potential manufacturers with the reliefs
established there to start production. It was noted that in
three years from the start of the industrial zone (1962) - the
employment increased in relation to the number of jobs
from before the loss of the position by the airport. Today, a
special economic zone in Shannon is the most important
industrial district in Ireland [15].
A major failure turned out to be the idea of setting up a
special economic zone in the UK. In 1981, the government
established 11 enterprise zones, and in 1983, a further 13
zones. A rich package of incentives was established, which
was to encourage investors to invest their capital in regions
threatened by structural unemployment. Unfortunately,
most companies that located operations in the zones at the
same time had eliminated the previous activities and the
reason for investing in the zone were not the offered
reliefs, but earlier plans. Many companies did not
introduce industrial activity but trade - retail trade to that
[14, p. 32]. Economic zones were also created in the
United States. In the years 1981 to 1998 as many as 37
states created 230 zones economically privileged. Most
often they were created by the airports, major road and rail
junctions. The offer was addressed primarily to companies
in the automobile, computer and information technology
industry [4, p. 18].
1.4 Examples of special economic zones in developing
countries
In developing countries, special economic zones played
and play a more important role than in developed
countries. They supported the development of specific
industries and helped to solve local problems. They were
and are an important tool for restructuring of the region
and the country. Zones create new jobs, help in the
development of exports, and bring in new technologies and
management methods. They are the reason for the
existence and attracting direct foreign investments. In
contrast to the zones in highly developed countries, the
privileged areas in developing countries constitute a sort of
enclave. "Typically, the surface of such a zone is from 10
to 300 hectares (...). Companies operating on its territory
rarely establish cooperative links with companies
operating outside the zone. In order to avoid the threat of
competition from companies operating in the zone for
domestic companies, such solutions are usually
implemented which require the export of goods
manufactured in the zone "[14, p. 24].
The fastest and successfully established were the economic
zones in Turkey. The first ones - of a service and
commercial nature - were created in 1962. The success of
the functioning of Turkish zones is ensured by low
production costs and not very rigorous administrative and
legal formalities [4, pp. 19-20].
A large number of special economic zones (so-called
maquiladoras) also function in Mexico. They are mostly
located near the border with the United States and
constitute an important state instrument of pro-export
policy and combating unemployment "[1, p. 47]. Chinese
economic zones were an idea for bringing in direct foreign
investment. In the thirties, China chose the strategy of
economic development based on the decisions not of the
market, but of the government. Enterprises did not actually
make decisions in the field of investment and disposition
of the effects of their economic activity [16]. Economic
life of the country was formed in a completely arbitrary
manner, which also concerned the area of economic
relations with foreign countries "[16, p. 34]. It was not
until the 1980 that the National People's Congress
approved the project to create privileged industrial centres
along the east coast, which a few years later resulted in a
creation of four special economic zones: Shenzhen,
Zhuhai, Shantou in Guangdong Province and Xiamen in
Fujian province. There was a large liberalization of
entrepreneurial activity in the zones, mainly due to lower
costs and lower taxes. Chinese zones were very
successful, because 1/3 of all investments of foreign
capital in China were located in special economic zones.
Total in China in 2005, there were 120 different zones,
including 54 in a technological-economic development
zone [4, pp. 22-23].
General and export zones have been in Thailand since
1972. They were an idea for accelerating the development
of eight eastern provinces of the country. Until 2002 there
were created 30 economic zones, which meant that the
areas, on which they were established are today better
industrialized than other parts of the country [4, p. 20].
"The biggest zone is located in Rayong and occupies 1,200
ha. There are 200 companies that conduct their activities
there, which employ about 16 thousand workers (...)
including 33 companies from the automotive industry, e.g.
Toyota, Nissan, Mazda, Ford, and G. M. The firms which
lease the surfaces and operate in the area enjoy the many
investment privileges and tax reliefs"[17].
The special economic zone in Sri Lanka was established in
the area of Katunayake in 1978. The activity in the
clothing industry was predominant in that area [14, p. 27].
Also India, Malaysia, the Philippines, Fiji, Pakistan,
Kenya, Egypt, Iran, Jordan and Cyprus have experience of
economic zones. They are formed also in North and South
America, Brazil, Honduras, Colombia, Costa Rica,
Dominican Republic. Relatively late special economic
zones began to appear in Central Europe, which was
associated with the political situation of countries.
Centrally controlled economy was not conducive to
foreign direct investment. Economic zones in Russia have
been established for 20 years and this period shall not be
extended [18]. Liepaja and Rezekne are two special
economic zones in Latvia, which also were created for 20
years (1997) - with the possibility of extension. In
Lithuania, zones have been set up in Kaunas, Klaipeda and
Comparative European Research CER 2016 (issue I.)
30

Siauliai. Just like in Latvia and Slovenia, the period of
transformation in Poland opened the country to foreign
investments. The "Law on business with foreign capital"
came into force in Poland only in 1988; it allowed for
100% foreign capital, and foreigners could set up a joint
venture with Polish companies [19].
2. Conclusions
In the years 1997- 2006 there was a rapid development of
the amount of economic zones in the world and in Poland.
After 2006 the process of creating zones has slowed down
and stabilized, though still within the zones new economic
activities appear, mainly based on modern technologies.
Particularly desirable in the zones is the placement of
direct foreign investments, which are the reason for the
development of regions and local communities, and which
by creating new jobs contribute to decreased
unemployment. Various reasons are related to the location
of economic zones and businesses in networks, but the
main reason is to alleviate administrative procedures,
reduction or abolition of taxes or duties. Currently in the
world there are nearly 4,000 economic zones, which
employ around 30 million people.
References
[1] Mazur K., Specjalne strefy ekonomiczne jako nowe
obszary przemysłowe, Gliwice, p 8, 2004
[2] Domański B, Gwosdz K. (ed.), Dziesięć lat
doświadczeń pierwszej polskiej strefy ekonomicznej.
Mielec 1995 – 2005, Mielec, p 18, 2005
[3] Ofiarska M., Specjalne strefy ekonomiczne w Polsce.
Zagadnienia publicznoprawne, Szczecin, p 48, 2000
[4] Kozaczka M., Specjalne strefy ekonomiczne w Polsce
1995-2007, Lublin, p 11, 2007
[5] Dz.U. 2007 No 42, item 274
[6] Owczarski M., Specjalne Strefy Ekonomiczne, Inwestia
Sp. z o.o., Katowice, p 14, 1997
[7] Ustawa o specjalnych strefach ekonomicznych z dnia
20 października 1994 r., Dz.U. 1994, No 42, item 274
[8] Patusiak R., Specjalne Strefy Ekonomiczne jako
stymulator rozwoju gospodarczego, Uniwersytet Łódzki,
Łódź, pp 192-194, 2011
[9] Tałasiewicz A., Prawne i podatkowe aspekty
prowadzenia działalności w specjalnych strefach
ekonomicznych, Wolters Kluwer Sp. z o.o., Warszaw, p.
14, 2010
[10] Kryńska E., Polskie specjalne strefy ekonomiczne -
zamierzenie i efekty, Scholar, Warszawa, p 35, 2000
[11] Durski A., Strefy uprzywilejowane w gospodarce
światowej. Sprawy Międzynarodowe, No. 10, p 93, 1988
[12] Wielka Historia Świata, T.XIX, Oxford, pp 191-197
[13]http://orka.sejm.gov.pl/Druki7ka.nsf/0/53C2CEC2950
B0C6CC1257B7F002BF6B5/%24File/1412
[14] Bazydło A., Smętkowski M., Specjalne strefy
ekonomiczne – światowe zróżnicowanie instrumentu [in:]
Polskie specjalne strefy ekonomiczne, Kryńska E. (Ed.),
Warszawa, p 29, 2000
[15] Grywalska M., Shannon - irlandzka dolina krzemowa.
[in:] Wspólnoty Europejskie, No. 5, pp 26-29, 2002; [in:]
Rozprawy i Studia Uniwersytetu Szczecińskiego No. 346,
Szczecin, pp 59-62, 2000
[16] Starzyk K., Zagraniczne inwestycje bezpośrednie w
rozwoju gospodarczym Chin [in:] Zagraniczne inwestycje
bezpośrednie w gospodarkach Azji Pacyfiku, Starzyk K.
(ed.), Warszawa, p 34, 2001
[17] Sajdłowska-Martini E., Calak R., Specjalne strefy
ekonomiczne w wybranych krajach i w Polsce [in:]
Wspólnoty Europejskie 2002, No. 5 (128), p 16, 2002
[18] Nowak M., Specjalne strefy ekonomiczne w Rosji,
[in:] www.goldenline
[19] Ustawa o działalności gospodarczej z dn.
23.12.1988r. Dz.U. 1988 No 41, item 324
Comparative European Research CER 2016 (issue I.)
31

MANAGEMENT PRACTICES IN PUBLIC INSTITUTIONS OF THE REPUBLIC OF KOSOVO
AND THE CHALLENGES OF THE PROJECT MANAGER
Agim Derguti
European University of Tirana
Bulevardi "Gjergj Fishta", Nd.70, H.1.
Tirana, +355, Albania
+377 44 432 715
Abstract: Government and organizations usually start different projects aiming the creation of new services or improving
operational effectiveness of the existing ones. Project management (PM) approach in public administration is becoming an
applied tool to the implementation of various programs and public activities. Applying the tools and techniques of Project
Management (PM) in the public sector is gradually becoming an important issue in developing economies, particularly in
countries like Kosovo where have been undertaken projects of various sizes and structures. The paper examines the
application of project management practices in the public sector in Kosovo. A big concern of the project management field and
a repeated theme in the literature is that of the project success of and the factors that contribute to it. The study was conducted
in the institutions of Kosovo (Municipality and Ministry) and it is widespread throughout the country. 38 copies of the
questionnaire were administered to 38 public institutions of Kosovo to generate the primary data. Techniques of descriptive
analysis by using percentages and presentations on the table associated with the coefficient of correlation were used for
analyzing the data. The study noted that there is a deep lack of knowledge of the PM tools and techniques in public sector
institutions. Also, the study recommends inter alia that the PM tools and techniques should be applied gradually, especially in
government institutions where is noted a high resistance for changing.
Keywords: public sector, project management, practices
1. Introduction
The project can be defined simply as "a temporary
endeavor undertaken to create a unique product, service or
result" (PMBOK Guide 2004, p.5). In our daily life we are
constantly in the management of small projects such as
personal holidays, school assignments, organizing dinners
etc. Projects are considered unique in the sense that even if
the objectives and results are the same they may differ in
different degrees, from the context in which they operate
to the uncertainty to which they are exposed and vary from
project to project. Project management (PM) as a formal
discipline is relatively new, has evolved in the past 60
years by a military operation during the defense programs
of the Cold War (Verzuh 2005). Project management, in
particular project planning, is a critical factor in the
success or failure of the new product development (NPD)
in projects (Patanakul et al.,2012). PM has been
traditionally associated with engineering or construction
projects, such as the pyramids, the Great Wall of China,
irrigation systems created by early civilization, but its
purpose has expanded recently. According to Crawford
(2005) the use of PM to achieve the business objectives is
becoming increasingly popular in organizations. Project
management on the other hand, according to Abbas and
El-Mharmah (2000) "is the art and science of planning,
designing and management work in all phases of the
project life cycle." PM is also regarded as a system or
process of planning, designing, management and control of
activities related to the project in order to achieve specific
objectives or targets within a certain term, budget and
standards (Lewis, 2007). Project management is an
innovative management practice that tends to achieve the
stated objectives or defined within certain deadlines and
budget through optimal use of resources (Stuckenbruck &
Zomorrodian, 1987).
Project managers have taken an important role in the
business world and the increase of interest has caused the
creation of standards and certification programs that
describe practices, provide definitions, explain the main
techniques and serve as basis for the assessment of
competences in PM (Crawford, 1999).
Studies have confirmed that the application of modern
methods and techniques of project management has a
major effect on public institutions. Arnaboldi et al (2004)
observed that the implementation of the project
management strategy in the public sector has been the
result of pressure on governments to abandon the
bureaucratic organization in favor of more focused
structures. In their study White & Fortune (2002) have
examined the current practice of project management in
the public sector in the UK by collecting data from 236
project managers in some public institutions. The survey
asked respondents to judge the effectiveness of project
management methods, tools, and techniques that they have
used in the success of the project. The result of the study
revealed that 41% of the projects reported were judged to
be fully successful (using time, budget and specifications),
although some shortcomings were reported. Similarly,
Abbas and Al-Mharmah (2000) researched the project
management tools and techniques used by the public sector
in Jordan by recording 50 industrial public firms. The
study found that the use of tools of project management
and techniques among public sector companies has been
quite low, but when is practiced efficiently will result in
vulnerable benefit in all aspects of planning, and
monitoring of time, cost and specifications of the projects.
Comparative European Research CER 2016 (issue I.)
32

In Kosovo, the application of modern tools of project
management, methods and techniques has not yet reached
the required level in the public sector, this results in the
failure of public institutions and contractors in the
performance of their duties in connection with the budget,
specifications and contract deadlines projects.
Various studies have recognized the social and political
systems, cultural blocks and lack of financial support as
barriers to successful project planning and implementation
in the public sector of Kosovo. Therefore, this paper aims
to investigate the project management tools and techniques
that are being used in the public sector, their benefits,
obstacles and shortcomings, with the aim to recommend
the appropriate action. This study has used 35 central and
local public agency of the state of Kosovo.
2. Phases of project management The project manager and project team have a common
goal: to carry out the project work in order to fulfill the
objectives of the project. Each project has a beginning, a
middle period in which the activities move the project
toward its completion, and an end (successful or
unsuccessful). (Pinto 2007) identified four distinct phases
of the project life cycle which are: conceptualization,
planning, execution, and completion. Taken together, these
stages represent the way that a project takes from the
beginning to the end of it and are commonly referred as
the life cycle of the project. Knowledge, skills and
experience required in the project may change at any stage.
During the early stages of a project, project leadership
needs good conceptual skills, ability to build a team, and
experience to build a project plan. During the closure of
the project, project leadership ensures a high degree of
motivation and attention to detail. In a big project, lasting
two or more years, it is common to see the project
management team to change the leadership to provide the
skills that are appropriate for the final stages of the project.
Conception (Initiation) according to Pinto (2007) refers to
the original purpose and developing technical
specifications for a project. The scope of work is defined,
necessary resources (people, money, materials and
machinery) have been identified, and important
organizational contributions or stakeholders have signed.
A feasibility study was conducted to investigate whether
each option addresses the objective of the project and a
final recommended solution is determined. Feasibility
issues ("can we do the project?") and reasoning ("should
we do the project?") are treated. Once the recommended
solution is approved, a project was initiated to provide
solutions approved and a project manager is appointed.
Planning is the stage where detailed specifications, plans,
schedules and other plans are developed. It is also a stage
where the solution of the project is further developed in as
much detail as possible and the necessary steps to meet the
objectives of the project are put in place. The project tasks
and resources requirements are identified, along with their
strategy of the production. This is also referred as scope
management. A project plan is created that describes the
activities, tasks, dependencies and timelines. The project
manager coordinates the preparation of the project budget;
providing cost assessment for the cost of labor, equipment
and materials. The budget is used to monitor and control
costs during project implementation. Once the project team
has identified the work, prepares the schedule and
estimated costs, the three basic components of the
planning process are completed. Everything that could
pose a threat to the successful completion of the project
has been identified at this stage. At the end, all project
stakeholders must be identified at this stage of the project,
in order to create a communication plan that describes the
required information and the method of delivery that will
be used to keep informed the stakeholders (Patel, 2008).
Execution (implementation) is the stage that deals with the
actual performance of the project work. Progress is
continuously monitored and appropriate adjustments are
made, are registered discrepancies in order to preserve the
original project plan. During the execution of the project,
project tasks are performed and information is reported
through regular team meetings. The project manager uses
this information to maintain control over the direction of
the project by measuring the performance of project
activities compared the results to the project plan and take
corrective actions as needed (Westland 2006). During this
step, project sponsors and other key stakeholders should be
kept informed about the project status. The plan should be
updated and published on a regular basis. Status reports
should emphasize the anticipated point of completion in
terms of cost, schedule and quality of results.
Termination (closure) occurs when the completed project
is transferred to the customer, project documentation is
submitted, the suppliers contracts are terminated, the
resources of the project are released and the closure of the
project is communicated to all stakeholders. The last step
is to examine what went well and what did not. Through
this analysis, the experience is transferred back to the
organization of a future project that will help the future
management teams.
3. The tools and techniques of project management
Different tools and techniques are used in project
management to a desired result. Some of these tools and
techniques are Work Breakdown Structure, Gantt Charts,
PRINCE 2, Project Networks (Critical Path Method and
Program Evaluation and Review Techniques), Project
Sensitivity Analysis, Cost Benefit Analysis, Graphical
Evaluation and Review Technique (GERT), and Project
Software.
Work Breakdown Structure (WBS) deals with the
breakdown of projects in individual manageable
components in a hierarchical structure. Such a structure
defines the tasks that can be completed independently
toward other tasks, allocation of resources that facilitates
the assignment of responsibilities and the measurement
and control of the project. Wysocki (2009) also noted that
it is a real tool for defining the work packages and the
development and tracking of cost and schedule for the
project. WBS provides a common framework for the
natural development of the overall planning and control of
a project. WBS shows the relation of each task to other
tasks, for all and the final product (the purpose or
Comparative European Research CER 2016 (issue I.)
33

objectives). It shows the division of responsibility, and
identifies the necessary resources and time available, at
any stage of the project management and monitoring. It is
called the graph of diffraction of activities. Gantt chart is a
useful tool for scheduling and project planning. It shows
the graphical representation of the duration of tasks versus
the progression of time. It was developed by Henry Gantt
in 1915 in order to monitor the progress of projects and
their tracking. Gantt charts have become a common
technique for representing the phases and activities of the
division of labor structure of the project (WBS) so that
they can be understood by a wider audience worldwide
(Wysocki, 2009). Gantt charts have a serious obstacle - the
determination of the impact of an error in a task in the rest
of the project is very difficult.
PRINCE 2 which means Project in Controlled
Environment 2 is a process based in the method for
effective project management. This is a de facto standard
used extensively by the UK Government and is widely
recognized in the public and private sector, as in the UK
and internationally. Its features includes, focusing on
business grounds, splitting the project into manageable and
controllable phases, flexible implementation at an
appropriate level for project management team. PRINCE 2
basically outlines the basic product planning, change
control technique and quality review technique. Project
sensitivity analysis determines which variables have more
potential to influence in the project. Variables include the
duration of the tasks, the degree of success and the costs,
risks, the duration of the project, the total cost of the
project and so on. It is also helpful in decisions making
based on uncertainty and risk.
Cost Benefit Analysis (CBA) is one of the most widely
accepted methods and is applied to the evaluation of
projects for large-scale infrastructure in the public and
private sector. CBA is a prescriptive approach that
provides guidance on the criteria to consider decisions
making, providing that the total net benefits to society
exceed the total net costs (Patel, 2008). A formal CBA
aligns all the planned expenses of the project, evaluates
each of the tangible benefits and calculates key
measurements of the financial performance such as return
on investment (ROI), net present value (NPV), internal
rate of return (IRR) and the return on investment period.
Costs that relate to measures then are deducted from the
benefits obtained. As a general rule, the cost should be less
than 50 percent of the benefits and payback period should
not exceed 12 months.
Graphical Evaluation and Review Technique (GERT) is a
network technique that allows the conditional analysis and
probabilistic treatment of the logical relationships. A type
of diagram GERT- represents a system of linear equations
from which a network function is set to analyze and
forecast the expected system behavior (Whitehouse, 1973).
It is a management beneficial tool for planning,
coordination, and control of complex projects (Westland
2006). The main objective GERT is to assess on the basis
of logic in the network and expected duration of the
activity and draw a conclusion about some activities that
cannot be performed. Despite the benefits and flexibility
offered by GERT, it seems that this technique has not
gained compelling acceptance in the management of new
product development (NPD) and the research community
(Liberatore and Titus ,, 1983).
Critical Path Method (CPM) is one of several techniques
related to planning of the project. CPM is for projects that
are composed of a number of individual "activities". If
some of the activities require other activities to complete
before they can begin, the project becomes a complex site
of activities.
Program Evaluation and Review Technique (PERT) is a
project management tool used to schedule, organize, and
coordinate tasks within a project. It is basically a method
to analyze the tasks involved in completing a given
project, especially the time needed to complete each task,
and identifying the minimum time needed to complete the
overall project. PERT planning involves the following
steps: Identifies the specific activities and milestones,
determines the appropriate sequence of activities, builds a
network diagram, estimates the required time for each
activity, determines the critical path and updates PERT
chart during the project. PERT is a management tool
designed to define and coordinate what needs to be done to
achieve the target set within the allotted time. Therefore it
is a decision-making tool.
4. Research Methodology The sample selected for this study is consisted of 38 public
institutions of Republic of Kosovo, such as; municipalities,
ministries and public companies. The questionnaire was
used as an instrument of data collection for the purpose of
collecting information about project management practices
in the public sector; the used tools of the project
management, benefits, problems and obstacles. Relevant
statistical analysis was conducted on data collected to
examine the various issues of this research. The
questionnaire was completed by interviewing those
responsible persons for planning and project management
of each sector responsible in different agencies. This
method has increased the data accuracy and reliability, and
can be considered 100% the response rate that is achieved
in data collection. The questionnaire was developed by
review of literature related to the study. He is pre-tested
with ten managers of the sample size to control and to
ensure that there is no irrelevant present question.
5. Results and Discussion Table 1 has covered the personal characteristics of the
respondents "such as gender, educational qualifications
and work experience. The data in the table show that men
represent 78.95% of respondents, while 21.05% are
women. From the table, respondents with a master's degree
are of the highest ranking with 55.27%, followed by
respondents with bachelor's degree with 23.68%, while the
rest of 21.05% have professional qualifications. As noted,
all respondents are educated; it provides a solid basis for
understanding a better use and implementation of
techniques and project management tools. The further
survey revealed that the most of the respondents have
worked more than five years in institutions under study
Comparative European Research CER 2016 (issue I.)
34
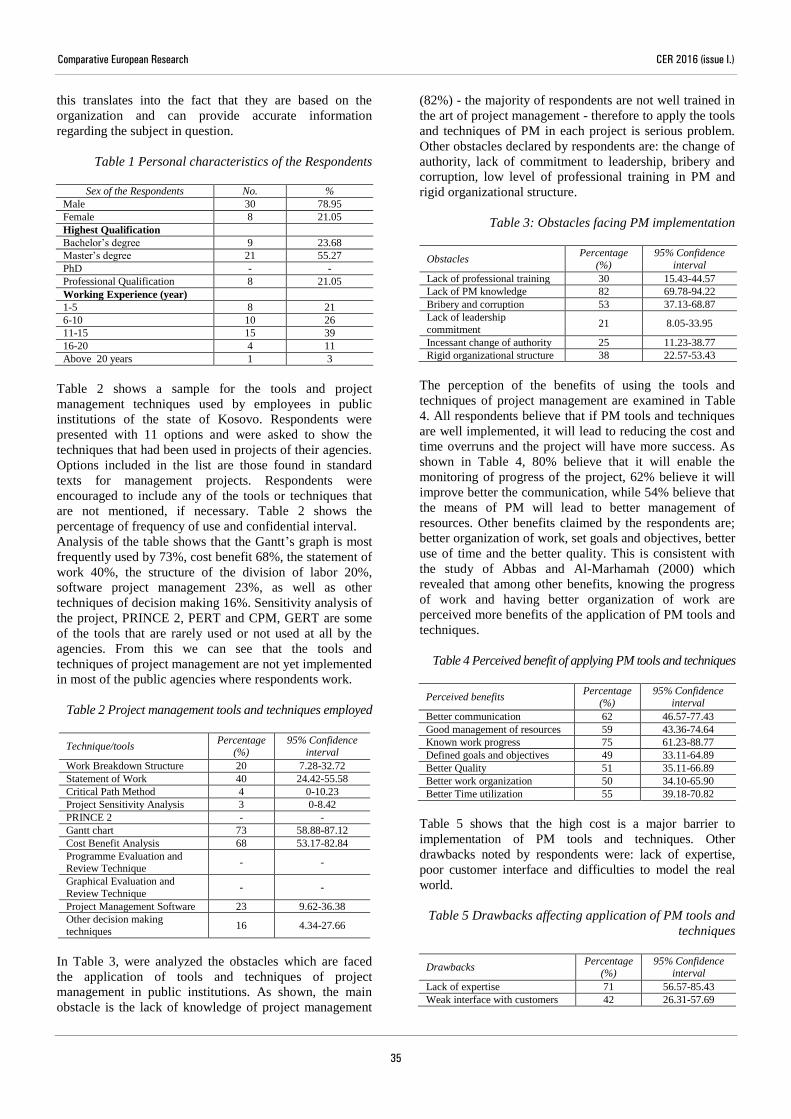
this translates into the fact that they are based on the
organization and can provide accurate information
regarding the subject in question.
Table 1 Personal characteristics of the Respondents
Sex of the Respondents No. %
Male 30 78.95
Female 8 21.05
Highest Qualification
Bachelor’s degree 9 23.68
Master’s degree 21 55.27
PhD - -
Professional Qualification 8 21.05
Working Experience (year)
1-5 8 21
6-10 10 26
11-15 15 39
16-20 4 11
Above 20 years 1 3
Table 2 shows a sample for the tools and project
management techniques used by employees in public
institutions of the state of Kosovo. Respondents were
presented with 11 options and were asked to show the
techniques that had been used in projects of their agencies.
Options included in the list are those found in standard
texts for management projects. Respondents were
encouraged to include any of the tools or techniques that
are not mentioned, if necessary. Table 2 shows the
percentage of frequency of use and confidential interval.
Analysis of the table shows that the Gantt’s graph is most
frequently used by 73%, cost benefit 68%, the statement of
work 40%, the structure of the division of labor 20%,
software project management 23%, as well as other
techniques of decision making 16%. Sensitivity analysis of
the project, PRINCE 2, PERT and CPM, GERT are some
of the tools that are rarely used or not used at all by the
agencies. From this we can see that the tools and
techniques of project management are not yet implemented
in most of the public agencies where respondents work.
Table 2 Project management tools and techniques employed
Technique/tools Percentage
(%) 95% Confidence
interval
Work Breakdown Structure 20 7.28-32.72
Statement of Work 40 24.42-55.58
Critical Path Method 4 0-10.23
Project Sensitivity Analysis 3 0-8.42
PRINCE 2 - -
Gantt chart 73 58.88-87.12
Cost Benefit Analysis 68 53.17-82.84
Programme Evaluation and Review Technique
- -
Graphical Evaluation and
Review Technique - -
Project Management Software 23 9.62-36.38
Other decision making
techniques 16 4.34-27.66
In Table 3, were analyzed the obstacles which are faced
the application of tools and techniques of project
management in public institutions. As shown, the main
obstacle is the lack of knowledge of project management
(82%) - the majority of respondents are not well trained in
the art of project management - therefore to apply the tools
and techniques of PM in each project is serious problem.
Other obstacles declared by respondents are: the change of
authority, lack of commitment to leadership, bribery and
corruption, low level of professional training in PM and
rigid organizational structure.
Table 3: Obstacles facing PM implementation
Obstacles Percentage
(%)
95% Confidence
interval
Lack of professional training 30 15.43-44.57
Lack of PM knowledge 82 69.78-94.22
Bribery and corruption 53 37.13-68.87
Lack of leadership
commitment 21 8.05-33.95
Incessant change of authority 25 11.23-38.77
Rigid organizational structure 38 22.57-53.43
The perception of the benefits of using the tools and
techniques of project management are examined in Table
4. All respondents believe that if PM tools and techniques
are well implemented, it will lead to reducing the cost and
time overruns and the project will have more success. As
shown in Table 4, 80% believe that it will enable the
monitoring of progress of the project, 62% believe it will
improve better the communication, while 54% believe that
the means of PM will lead to better management of
resources. Other benefits claimed by the respondents are;
better organization of work, set goals and objectives, better
use of time and the better quality. This is consistent with
the study of Abbas and Al-Marhamah (2000) which
revealed that among other benefits, knowing the progress
of work and having better organization of work are
perceived more benefits of the application of PM tools and
techniques.
Table 4 Perceived benefit of applying PM tools and techniques
Perceived benefits Percentage
(%) 95% Confidence
interval
Better communication 62 46.57-77.43
Good management of resources 59 43.36-74.64
Known work progress 75 61.23-88.77
Defined goals and objectives 49 33.11-64.89
Better Quality 51 35.11-66.89
Better work organization 50 34.10-65.90
Better Time utilization 55 39.18-70.82
Table 5 shows that the high cost is a major barrier to
implementation of PM tools and techniques. Other
drawbacks noted by respondents were: lack of expertise,
poor customer interface and difficulties to model the real
world.
Table 5 Drawbacks affecting application of PM tools and
techniques
Drawbacks Percentage
(%) 95% Confidence
interval
Lack of expertise 71 56.57-85.43
Weak interface with customers 42 26.31-57.69
Comparative European Research CER 2016 (issue I.)
35

High cost of application 85 73.65-96.35
Difficulty in modeling real world 56 40.22-71.78
Table 6 shows the opinion of respondents on how to
improve the implementation of PM tools and techniques in
the public sector. Providing adequate training in PM for all
persons in charge of projects, recruitment of professionals
of project management, high commitment from the
government, the establishment of the Office of Project
Management (OPM) in each agency are some of the
solutions suggested by respondents.
Table 6 Suggestion for improving application of PM tools
and techniques
Suggestions Percentage
(%)
95%
Confidence
interval
Recruitment of PM professionals 69 54.29-83.71
Higher commitment from
government 50 34.10-65.90
Establishment of PMO 43 27.26-58.74
Provision of adequate PM training 61 45.49-76.51
The coefficients of correlation between the different
factors that can affect the level of enforcement of PM tools
and techniques, obstacles and perceived benefits are
analyzed and presented in Table 7. Some of the considered
factors are; type of business, the cost of application, the
age of the agency (institution), the experience of
employees, the commitment of the government and the
total number of employees. The results showed that the
age of governmental institutions and commitment of the
government have a negative correlation with the tools and
techniques applied in PM, obstacles and perceived
benefits. Therefore, we can conclude that government
institutions still resist to the implementation of PM tools
and techniques, and the government is not doing enough to
create the tools and techniques of PM in most institutions.
Table 7 Correlation coefficients
Applied PM tools and techniques
Obstacles Perceived benefits
Type of business 0.392 0.512 0.392
Cost of
implementation 0.451 0.405 0.211
Age of the firm -0.511 -0.438 -0.379
Employee
experience 0.684 0.527 0.264
Government commitment
-0.492 -0.498 0.388
Total number of
employee 0.563 0.473 0.324
6. Conclusion Application of PM tools and techniques in public
institutions has become an important issue in many
developing countries, due to its successful application in
private organizations and its proven effectiveness and
flexibility in achieving the goals and objectives of the
project. The study of the implementation of the PM tools
and techniques in the public sector in Kosovo would serve
to open the eyes of the government and other creators to
better plan their efforts towards effective implementation
of PM tools and techniques.
If implemented properly, PM tools and techniques will
result in tangible benefits in all aspects of project planning,
scheduling and cost control, time and quality. Educational
qualification of respondents shows that most of the
sampled population are educated and provide a solid
foundation for better use and implementation of PM tools
and techniques.
Gantt charts, WBS and CBA are some of the applied PM
tools and techniques of respondents due to their simple and
understanding nature, however, the lack of deep
knowledge of these tools and techniques still form a
crucial obstacle. In terms of perceived benefits, the
consensus is that the effective application of the means of
PM will help to pursue the project, better communication
and better use of resources.
To address the shortcomings, respondents believed they
should be given adequate training to the workers in the art
of PM; professionals must be employed in PM and must
settle project management offices in all government
institutions. In view of the findings of this research, we can
recommend the following actions to the proper application
of PM tools and techniques to local institutions, central
institutions and in all public institutions in the Republic of
Kosovo;
Must be chosen organizational compatible form in
order to make the implementation of PM tools and
techniques in accordance with the culture and political
environment of government institutions.
Tools and Project Management techniques should be
implemented gradually, especially in government
institutions where resistance to change is perceived to
be high.
The government should increase its commitment to
the application of PM tools and techniques in all its
projects
The professional staff, who deal with the management
of projects, should be supported in all appropriate
forms and not obstruct their professional work.
As suggested by respondents, the Project Management
Office should be established in all government
institutions aiming the management, monitoring and
control of projects improving the efficient and
effective application of tools and techniques PM.
PM adequate training should be given to employees in
charge of the projects; this would increase employees'
knowledge about the tools and techniques of PM. Also
should be hired PM professionals to apply the proper
and adequate tools and techniques of PM.
Finally, the proper application of PM tools and
techniques can serve as a tool for change. It may also
be a wonderful training base for future managers and
skilled workers, and to be an effective tool that will
bring administrative reform in public institutions.
References
[1] Abbasi, Y. G. & Al-Mharmah (2000) ‘Project
management practice by the public sector in a developing
Comparative European Research CER 2016 (issue I.)
36

country’ International Journal of Project Management,
18(3), pp105-109.
[2] Abdelsalam, H., Bao, H., 2006. A simulation-based
optimization framework for product development cycle
time reduction. IEEE Transactions on Engineering
Management 53 (1), 69–85.
[3] Akewushola, Raheem Olasupo Olateju, Olawale
Ibrahim and Hammed, Olawale Gazal (2012) Effect of
Project Management on Project Success, Australian
Journal of Business and Management Research Vol.2
No.03 pp. 01-11
[4] Bailey, M.T. and R.T. Meyer. 1992. Public
Management in an Interconnected World. New York:
Greenwood Press.
[5] Bovaird, T. and E. Löffler. 2009. Public Management
and Governance. 2nd ed. London: Routledge.
[6] Chandler, J.A. 1991. Public administration and private
management. Is there a difference? Public Administration.
Vol. 69. No. 3. pp.385-392.
[7] Drucker, P.F. (1995) Managing in a Time of Great
Change, New York: Truman Talley
[8] Kerzner, Harold. 2005. Using the Project Management
Maturity Model: Strategic Planning for Project
Management. USA: John Wiley&Sons, Inc.
[9] Kerzner, Harold. 2003. Project Management: A
Systems Approach to Planning, Scheduling, and
Controlling. USA: John Wiley&Sons Inc.
[10] Lewis, J. P. (2007), ‘Fundamentals of Project
Management, 3rd ed, New York: AMACOM.
[11] Levine, H.A., Wideman, M., 2005. Project Portfolio
management: a practical guide to selecting projects.
Jossey-Bass, Hoboken.
[12] Maylor, H. 1996. Project Management. London:
Pitman
[13] Mohan, K. 1997. The New Public Administration:
Management Innovations in Government. Public
Administration and Development: The International
Journal of Management. Research and Practice. Vol 17,
No 1, Feb 1997.
[14] Muller, R. & Turner, R. (2007) ‘Matching the project
manager’s leadership style to project type’. International
Journal of Project Management, 25(4), pp. 21-32.
[15] Müller, R. & Turner, J. R. (2007). Matching the
project manager's leadership style to project type,
International Journal of Project Management, Vol. 25.
[16] Morris, P.W.G., 1994. The management of projects.
Thomas Telford, London.
[17] Olateju, O. I., Abdul-Azeez, I. A., & Alamutu, S. A.
(2011). Project management practice in Nigerian public
sector–an empirical study. Australian Journal of Business
and Management Research, 1(8), 01-07.
[18] Robbins, S. P. (1997). Essentials of organizational
behaviour, Prentice-Hall, Englewood Cliffs.
[19] Venter, F. 2005. Project management in Ghana:
expectations, realities and barriers to use. TD, The Journal
for Transdisciplinary Research in Southern Africa. Vol. 1
No. 1, December 2005. pp. 77-96.
[20] Willson-Murray, R. 1997. Managing Projects: A New
Approach. Brisbane: John Wiley & Sons.
[21] Wysocki, Robert K., and James P. Lewis. The World-
Class Project Manager. Boston: Perseus, 2000.
Comparative European Research CER 2016 (issue I.)
37

THE IMPACT OF CORPORATE GOVERNANCE ON FIRM PERFORMANCE - A LITERATURE REVIEW
Knut Michelberger
University of Latvia
Riga, LV-1050, Latvia
Mail address: Jaminstrasse 10, 61476 Kronberg, Germany,
Cell phone +491622681417
Abstract: The objective of this paper is to analyze the results of recent empirical research concerning the impact of corporate
governance on firm performance and reflect potential research design problems which lead to inconsistent results. With the
means of a literature review including all articles of academic journal articles with a VHB-Journal ranking from A to C, the
recent empirical research articles are analyzed regarding their main results. Two main groups of studies are identified:
studies on company level to determine the impact of single corporate governance variables such as board size, chairman-CEO
duality, etc. on a small set of performance measures, and studies with a larger sample and a longer time period using
multivariate analysis to determine the overall impact of corporate governance on companies measured with an extended set of
financial research variables measuring multiple dimensions of impact. Overall, the results of recent research show no
consistent impact of corporate governance on firm performance. Beside this, a trend to studies with larger samples and longer
time periods can be seen. However, also these studies come to inconsistent results. The inconsistencies of empirical research
may be grounded in mostly small size of samples and small time periods, and the application of research constructs instead of
financial research metrics to measure firm performance. As this is a conceptual paper, the objective is to define a research
design based on the findings of this analysis. Thus, the paper develops a research design for future research.
Keywords: corporate governance, firm performance, corporate performance, business performance
1. Introduction
The failure of several corporations (Enron, Tyco, Parmalat,
Skandia, Lehman Brothers, etc.) in the last decade made it
clear that firms should undergo further modifications in
their corporate governance (CG) to increase transparency
and to guarantee shareholders’ reliance on directors’
management (Sun, Chuk and Weisbach 2012, p. 326).
There seems to be a large consensus among both
academics and professionals that new efforts are important
to improve corporate governance practices to protect the
shareholders’ interests and to stabilize thus the basics of
market economy due to the fact that many scholars,
economic analysts and corporate practitioners have linked
the severity and increasingly circular nature of financial
and economic crisis to failures of corporate governance
(Sun, Stewart & Pollard, 2011, p. 1; Gupta, Chandrasekhar
and Tourani-Rad 2013, p. 86)
Although CG codices are introduced in many countries,
they are not legally binding, but provide more or less
recommendations for ‘good’ corporate governance.
However, more and more public companies are
introducing CG systems as a means of regulating
stakeholder-management relations. There are many
different concepts of corporate governance around the
world which differ according to the variety of capitalism in
which they are embedded. The liberal model that is
common in the U.S. and U.K. tend to prioritize
shareholder interests. The ‘coordinated’ model in Europe
and Japan additionally recognizes the interests of
employees, managers, suppliers, customers, and the
community (Odenius, 2008, p. 3). Each model has its own
distinct competitive advantage. The liberal (U.S/U.K.)
model of corporate governance encourages more radical
innovation and cost competition, whereas the coordinated
model of corporate governance encourages more
incremental innovation and quality.
The term ‘corporate governance’ summarizes efforts to
optimize a company’s management system and its
monitoring and is based mainly on the agency theory and
the problem of information asymmetries (Schillhofer,
2003, p. 11). The essence of the agency theory is the
separation of management and finance, or – in more
standard terminology—the separation of Management,
ownership and control. An entrepreneur, or a manager,
raises funds from investors either to put them to productive
use or to cash out his holdings in the firm. The financiers
need the manager's specialized human capital to generate
returns on their funds. The manager needs the financiers'
funds, since he either does not have enough capital of his
own to invest or he wants to cash out his holdings.
In this context, the agency theory refers to the difficulties
financiers have in assuring that their funds are not ‘wasted’
on unprofitable projects. In general terms, financiers and
managers sign a contract that specifies what the manager
does with the funds, and how the returns are divided
between him and the financiers (Rani & Mishra, 2008, p.
24). A materialization of this mostly implicit contract
between principal and agent is a corporate governance
code that defines the mechanisms, processes and relations
by which corporations are controlled and directed.
Agency problems may arise from (1) the separation of
ownership and management or (2) from conflicts of
interest between controlling and non-controlling
shareholders. Governance structures in form of a
corporate governance codex should identify the
distribution of rights and responsibilities among the
corporation’s different stakeholders such as the
supervisory board, management board, shareholders,
Comparative European Research CER 2016 (issue I.)
38

creditors, auditors, regulators, and others and should
include rules and procedures for decisions making in
corporate affairs. Furthermore, corporate governance
includes the processes through which the corporation’s
objectives are defined and pursued in the context of the
social, regulatory and market environment. Governance
mechanisms include monitoring the actions, policies and
decisions of corporations and their agents. Therefore, the
main characteristics of corporate governance systems
include definitions and regulations concerning (1)
ownership structure, (2) supervisory board characteristics,
and (3) management controlling regulations.
According to the agency theory (Jensen & Meckling
1976), a positive relationship between corporate-
governance and company performance should exist which
is to be clarified in this paper that is structured in two
parts: Section 1 (“Approach”) defines the basic
requirements to measure firm performance and clarifies the
approach applied in the literature review. Section 2
(“Results”) provides and discusses the literature review’s
results. The paper closes with Conclusions and
Recommendations relative to an improved a research
design.
2. Approach
Well governed firms should have a higher firm
performance and value. Here, the question arises what
performance and value really means. Milton Friedman and
Peter Drucker may be helpful testimonials. According to
Friedman, it is in the responsibility of a company's
management “to use the resources to generate income and
thus delivering benefit for owners, because they are the
stakeholder group which really took over risk. Due to
taking risks, the reward is the return on equity for which
managers are employed by owners” (Friedman 1970, p.
32) Managers are employed to increase the owners’ profits
(Friedman 1970, p. 32). In contrast to Friedman, Drucker
states that profit is not a goal but “a measurement of how
well the business discharges its functions in serving market
and customer” (Drucker 1993, p. 64, 98-99). Thus,
Drucker and Friedman define implicitly and explicitly
three main metrics to measure whether management
fulfills its functions: profit, return on equity, and market
success. In terms of financial research, the appropriate
metrics are revenue (and market share) as measurement
for ‘market success’, net income, earning per share and
return on equity for ‘profit’. According to these
reflections, the main benchmark for evaluating empirical
studies in this paper is the application of such basic metrics
to measure performance.
Due to the objective of this paper, which is the
accumulation and discussion of research findings
concerning the link between corporate governance and
firm performance, the application of these ‘meta’-metrics
may be seen as basic requirement to define performance in
the context of corporate governance in the sense of the
theory of the firm (Brigham and Ehrhardt 2013, p. 592).
The following literature review is based on the academic
journal data bases from Sage, Elsevier, Wiley, EBSCO,
and Tayler Francis. Only articles from “A” and “B”
journals, according to the VHB Journal ranking, are
included. Additionally, only empirical studies conducted in
‘western’ advanced economies are used. The keywords for
identifying relevant articles are ‘firm performance’,
‘financial performance’, ‘corporate governance’ and
‘impact’.
3. Results
Dalton et al. (1998) stated in a meta-analysis of empirical
studies that both the supervisory board composition
(insider/outsider proportion) and as well as leadership
structure do not have any effect on financial performance
(Dalton et al. 1998, p. 282). Since then, further studies
have been published which come to different results.
Table 1: Findings on Correlations between ‚Good CG‘
and Firm Performance
Positive Correlation
Jensen (1986); Hermalin & Weisbach (1991); Byrd & Hickmann
(1992); Lipton & Lorsch (1992); Jensen (1993); Brickley et al. (1994); Eisenberg, Sundgren & Wells (1998); Hossain, Cahan & Adams (2000);
Gompers et al. (2001); Demsetz & Villalonga (2001); Chung, Wright &
Kedial (2003); Callahan, Millar & Schulman (2003); Mak & Kusnadi (2005); Krivogorsky (2006); Brown and Caylor (2006); Nicholson and
Kiel (2007); Larcker et al. (2007); Bhagat and Bolton (2007); Sunday
(2008); Daines et al. (2008); Carline et al. (2009); Renders, Gaeremynck & Sercu (2010)
21 empirical studies
No Correlation
Grove et al. (2011); Brenes et al. (2011); Castaner and Kavadis (2013); Shank, Hill and Stand (2013); Gupta, Chandrasekhar and Tourani-Rad
(2013)
5 empirical studies
Negative Correlation
Bathala & Rao (1995); Hutchinson (2002); Bauer et al. (2004); Giroud
and Mueller (2010)
4 empirical studies
Regarding the synopsis in Table 1, the first impression is
that, overall, a positive effect of corporate governance on
firm performance must be assumed. However, the number
of studies which determine no or a negative impact is not
negligible. Therefore, it is necessary to analyze the
variables set and the size of samples to examine whether
the research design of the mentioned studies explains the
more or less inconsistent research results.
Most of the studies listed in Table 1 do not use a
standardized general measure to define ‘good’ corporate
governance. They measure single aspects of a corporate
governance system such as the leadership structure
(Castaner and Kavadis 2013), board ownership (Carline et
al. 2009), or board independence (Nicholson and Kiel
2007) and their impact on firm performance. Some studies
determine a relationship between only two variables, such
as financial performance with board or management
structures (Hermalin & Weisbach 1991; Krivogorsky
2006; Demsetz & Villalonga 2001). The findings of such
studies with a reduced set of variables are mostly that a
single aspects of a corporate governance has a positive
impact, others not. Brenes et al. (2011), for example,
determine that the more intensive the evaluation of
management performance by the board is, the better is the
company performance to vis-à-vis competitors. Castaner
Comparative European Research CER 2016 (issue I.)
39

and Kavadis (2013) note, that leadership structure has
positive impact: a “chairman-manager non-duality”1
increases the financial performance. Carline et al. (2009)
state that “board ownership”2 shows a positive impact on
company performance. Nicholson and Kiel (2007) also
show that an “independent board” has a positive impact on
firm performance.
Others, such as Bauer et al. (2004), Larcker et al. (2007),
Bhagat and Bolton (2007), Daines et al. (2008), Renders,
Gaeremynck, and Sercu (2010), and Gupta, Chandrasekhar
and Tourani-Rad (2013), use corporate governance rankings
to compare the corporate governance ‘culture’ of countries,
in which companies are embedded, with the overall
performance of companies in this country. Thus, they are
not interested in measuring the impact of single aspects of
corporate governance of on company performance.
Some studies use a very small sample. Only Bauer et al.
(2004), Brown and Caylor (2006), Bhagat and Bolton
(2007), Daines et al. (2008), Renders, Gaeremynck and
Sercu (2010), and Gupta, Chandrasekhar and Tourani-Rad
(2013) use samples with more than 250 companies. Taking
this into account, the ratio between studies stating a positive
impact and studies with neutral or negative impact shows a
relatively balanced ratio.
Additionally, most studies examine only short time periods
from two to four years. Only Gompers et al. (2001) examine
a longer time period (from 1990 to 1999). Therefore, it
seems to be questionable if such short-term studies really
measure what they pretend to measure: performance is not a
spot check. The performance of a company cannot be
measured at a single time or a year. Thus, relevant metrics
such as revenue growth year-over-year, market
capitalization growth year-over-year, etc. cannot be applied
to level the impact of outlier data and to really measure
performance.
In summary, most studies use a small set of variables in
particular in respect to measuring firm performance, and
determine only the relationship between single aspects of
corporate governance with one or two firm performance
variables. Almost all studies use a very short time period.
Only two studies differ in all these points from all other
studies. Renders, Gaeremynck, and Sercu (2010) apply a
comprehensible set of typical standard metrics of financial
research such as P/B ratio (price-book ratio), ROA (return
on assets), P/S ratio (price-sales ratio), ROE (return on
equity), market capitalization, etc. in relation to corporate
governance rankings, and monitor across-country sample,
including stock listed companies from the 16 largest
countries of the EU, in a time period of four years. They
expected a positive relationship between the corporate-
governance rating of the companies’ countries and company
performance, assuming that companies from countries with
a higher corporate governance rating show better corporate-
governance practices and thus a better operating and
financial performance and a higher market value. Their
multivariate analysis shows that this is indeed the fact: The
1 CEO and chairman of the board are not represented by
the same individual. 2 Owner are also board member.
“coefficient of corporate-governance ratings has a highly
significant positive effect on performance” (Renders,
Gaeremynck, and Sercu 2010, p. 100). Their main
conclusion is that companies can improve performance by
adhering to ‘good’ corporate-governance practices (Renders,
Gaeremynck, and Sercu 2010, p. 100). According to
Renders, Gaeremynck, and Sercu (2010) this clear evidence
is only possible when a larger set of financial accounting
variables is applied in the combination with corporate
governance indices and a longer time period (p. 100-101).
The second study with a multivariate approach, an enlarged
variable set, financial analysis metrics, and a longer time
period originate from Gupta, Chandrasekhar and Tourani-
Rad (2013). They used a large set of variables including
such variables as CAPEX, financial leverage, revenue, P/B
ratio, ROA etc. in a multivariate analysis. Gupta,
Chandrasekhar and Tourani-Rad (2013) determine that well-
governed firms do not outperform poorly governed firms in
particular in the financial crisis. The cross-country sample
consists of 2,704 companies from 27 economically leading
countries worldwide. The main result is that ‘good’
corporate governance, measured by the corporate
governance rating of a firm’s country, has no impact on firm
performance on country-level (Gupta, Chandrasekhar and
Tourani-Rad 2013, p. 97-98). They conclude that the wide-
held belief that corporate governance failure explains market
price or firm performance cannot be verified (Gupta,
Chandrasekhar and Tourani-Rad 2013, p. 107).
4. Conclusions and Recommendation
Summarizing, it can be stated that a lot of studies examine
only small samples with a restricted set of variables which
are mostly not standard financial research variables.
Secondly, they state only moderate correlations between
single differences in corporate governance variances and
mostly one performance metric. Only two studies differ in
this regard. Both studies differ in their results: Whereas
Renders, Gaeremynck, and Sercu (2010) find a positive
correlation between ‘good’ corporate governance and
financial performance of a firm, Gupta, Chandrasekhar and
Tourani-Rad (2013) cannot confirm a positive relationship.
Therefore, further research should examine the degree of
deviations from CG codices as a measure for ‘good’
corporate governance and its relation to market and
operating performance on company-level. A wider set of
variables should be used, containing only standard metrics
of financial research. Therefore, the recommendation for
further research is:
Samples with a higher number of companies (> 200)
should be examined.
To compare real differences between companies, and
not between groups of companies in relation to the
corporate governance country ranking, a sample
should be differentiated in terms of variations in the
company-specific corporate governance.
The performance metrics should not be research
constructs, but standardized financial research metric.
The following variables should be measured for
comparing companies:
Comparative European Research CER 2016 (issue I.)
40

Table 2: Recommended Variables Set
Variable
Groups
Variable
Subgroups Variables
Performance Management
Efficiency
ROA, ROE, Financial Leverage, ROIC, Receivables Turnover,
Inventory Turnover, Fixed
Assets Turnover, etc.
Growth
Revenue Growth, Operating
Income Growth, Net Income
Growth, etc.
Cash Flow Operating Cash Flow Growth,
Free Cash Flow Growth, etc.
Value
Market capitalization, Price-
earnings Ratio (P/E Ratio), EVA (Economic Value Added), EVA
Growth
Corporate
Governance
‘Quality’
Supervisory
Board
Composition
Board Size, Board Process (frequency of meetings, etc.)
Responsibilities, Composition,
Quality of Targets, Nomination Procedure, Remuneration
Policy, etc.
Chairmen Status
Existence of rules for
appointment and removal of Chairmen, existence of a
definition of the Chairman’s role
and his responsibilities, existence of an information
policy process
Audit Committee
Composition, Definition Auditing Process, Frequency of
meetings, etc.), Nomination
Procedure, Reporting Frequency, Definition of
Control Procedures, etc.
CEO Status Existence of rules for
appointment and removal of
CEOs, existence of a definition
of the CEO’s role and his
responsibilities, existence of an
information policy process definition, etc.
Ownership Structure
Number of Owner, Ownership
structure, Regulations
concerning Role of Owners
Auditing Indicators
Frequency of auditing, Key
Performance Indicators (growth,
value, etc.)
Corporate
Governance Codex
Measuring the deviations from
the country corporate
governance codex as number of deviations in total and as
number of deviations concerning
critical aspects such as the existence/non-existence of a
audit committee, etc.
Communication
with
Shareholders
Definition Communication
Policy, Frequency General
Meetings
The multivariate comparative analysis of companies of
only one country may lead to clearer findings concerning
the variations of corporate governance practices and
financial performance of companies subordinated to
comparable regulatory environments and corporate
governance codices of one country to exclude intervening
variables such as the regulatory environment or accounting
‘cultures’. Only then, in a second step, a cross-country
analysis which includes corporate governance country
indices seems plausible.
References
[1] Bathala, CT & Rao, RP 1995, ‘The Determinants of
Board Composition: An Agency Theory Perspective’, in
Managerial & Decision Economics, vol. 16, pp. 59-69.
[2] Bauer, R., Gunster, N., & Otten, R. (2004). Empirical
evidence on corporate governance in Europe: The effect on
stock returns, firm value, and performance. Journal of
Asset Management, 5, 91–104.
[3] Bebchuk, L & Weisbach M 2010, ‘The State of
Corporate Governance Research’, Review of Financial
Studies, no. 23, pp. 939-961.
[4] Bhagat, S & Bolton, B 2007, Corporate governance
and firm performance. Unpublished working paper,
University of Colorado.
[5] Brenes, ER, Madrigal, K & Requena, B 2011,
‘Corporate governance and family business performance’,
Journal of Business Research, no. 64, pp. 280–285.
[6] Brickley, J A, Coles, JL & Terry, RL 1994, ‘Outside
Directors & the Adoption of Poison Pills’, in Journal of
Financial Economics, vol. 35, pp. 371-390.
[7] Brown, LD & Caylor, ML 2006, ‘Corporate
governance and firm valuation’, Journal of Accounting and
Public Policy, vol. 25, pp. 409–430.
[8] Byrd, JW & Hickman, KA 1992, ‘Do Outside
Directors Monitor Managers: Evidence from Tender Offer
Birds’, in Journal of Financial Economics, vol. 32, no. 2,
pp. 195-221.
[9] Callahan, WT, Millar, JA & Schulman, C 2003, 'An
analysis of the effect of management participation in
director selection on the long-term performance of the
firm', in Journal of Corporate Finance, vol. 9, no. 2, pp.
169-181.
[10] Carline, NF, Linn, SC & Yadav, PK 2009, ‘Operating
performance changes associated with corporate mergers
and the role of corporate governance’, Journal of Banking
& Finance, no. 33, pp. 1829–1841.
[11] Castaner, X & Kavadis, N 2013, ‘Does Good
Governance Prevent Bad Strategy? A Study of Corporate
Governance, Financial Diversification, and Value Creation
by French Corporations, 2000-2006’, Strategic
Management Journal, no. 34, pp. 863-876.
[12] Chung, KH, Wright, P & Kedia, BB 2003, ‘Corporate
Governance & Market Valuation of Capital & R & D
Investment, in Review of Financial Economics, 12, pp.
161-172.
[13] Daines, R, Gow, I, & Larcker, D 2008, Rating the
ratings: How good are commercial governance ratings?
Unpublished working paper, Stanford University.
[14] Dalton, DR, Daily, CM, Certo, ST & Roengpitya, R
1998. ‘Meta-Analyses of Financial Performance and
Equity: Fusion or Confusion?’, Strategic Management
Journal, vol. 19, pp. 269–290.
Comparative European Research CER 2016 (issue I.)
41

[15] Demsetz, H & Villalonga, B 2001, Ownership
structure & corporate performance. Working Paper,
UCLA.
[16] Drucker, P. (1993). Management: Tasks,
Responsibilities, Practices. New York: Harper & Row.
[17] Eisenberg, T, Sundgren, S & Wells, M 1998, ‘Larger
Board Size and Decreasing Firm Value in Small Firms’, in
Journal of Financial Economics, vol. 48, pp. 35-54.
[18] Eugene Brigham,Michael Ehrhardt 2014. Financial
Management: Theory & Practice. Mason: South-Western.
[19] Friedman, M 1970, ‘The Social Responsibility of
Business is to Increase its Profits, The New York Times
Magazine, 23 September, pp. 32-33.
[20] Giroud, X., & Mueller, H. M. (2010). Does corporate
governance matter in competitive industries?. Journal of
Financial Economics, 95, 312–331.
[21] Gompers, P, Ishii, J & Metrick, A 2001, ‘Corporate
governance and equity prices’, Quarterly Journal of
Economics, vol. 116, no. 1, pp. 107–155.
[22] Grove, H, Patelli, L, Victoravich, LM & Xu, P 2011,
‘Corporate Governance and Performance in the Wake of
the Financial Crisis: Evidence from U.S. Commercial
Banks’, Corporate Governance, vol. 19, no. 5, pp. 418–
436.
[23] Gupta, K, Chandrasekhar K & Tourani-Rad, A 2013,
‘Is corporate governance relevant during the financial
crisis?’, Journal of International Financial Markets,
Institutions and Money, vol. 23, pp. 85-110.
[24] Hermalin, B & Weisbach, M 1991, ‘The effects of
board composition & direct incentives on firm
performance’, in Financial Management, vol. 20, no. 4, pp.
101-112.
[25] Hossain, M., Cahan, SF & Adams, MB 2000, ‘The
investment opportunity set & the voluntary use of outside
directors: new zeal & evidence’, in Accounting &
Business Research, vol. 30, no. 4, pp. 263-273.
[26] Hutchinson, M 2002, ‘An Analysis of the Association
between Firms’ Investment Opportunities, Board
Composition, and Firm Performance’, Asia Pacific Journal
of Accounting and Economics, no. 9, pp. 17-39.
[27] Jensen, M 1986, ‘The Agency Costs of Free Cash
Flow’, in American Economic Review, vol. 76, pp. 326-
29.
[28] Jensen, M 1993, ‘The Modern Industrial Revolution,
Exit, and the Failure of Internal Control Systems’, in
Journal of Finance, vol. 48, pp. 831-80.
[29] Jensen, MC & Meckling, WH 1976, 'Theory of the
firm: managerial behavior, agency costs & ownership
structure', Journal of Financial Economics, vol. 3, no. 4,
pp. 405-360.
[30] Krivogorsky, V 2006, ‘Ownership, board structure, &
performance in continental Europe’, in The International
Journal of Accounting, vol. 41, no. 7, pp. 176-197.
[31] Larcker, D., Richardson, S., & Tuna, I. 2007,
‘Corporate governance, accounting outcomes, and
organizational performance’, The Accounting Review, vol.
82, pp. 963–1008.
[32] Lipton, M & Lorsch, J 1992, ‘A Modest Proposal for
Improved Corporate Governance’, in Business Lawyer,
vol. 48, pp. 59-77.
[33] Mak, Y & Kusnadi, Y 2005, 'Size really matters:
Further evidence on the negative relationship between
board size and firm value', in Pacific-Basin Finance
Journal, vol. 13, pp. 301-318.
[34] Nicholson, GJ & Kiel, GC 2007, ‘Can Directors
Impact Performance? A case-based test of three theories of
corporate governance’, Corporate Governance, vol. 15, no.
4, pp. 585-608.
[35] Odenius, J. (2008). Germany’s Corporate Governance
Reofrms. IMF Working Paper WP/08/179. International
Monetary Fund: New York.
[36] Rani, G. G. & Mischr, R. (2008). Corporate
Governance: Theory and Practice. Excel Books: New
Dehli.
[37] Renders A, Gaeremynck A and Sercu P 2010,
‘Corporate Governance and Performance: Controlling for
Sample Selection Bias and Endogeneity’, Corporate
Governance, no. 18, vol. 2, pp. 87-106..
[38] Sun, W., Stewart, J. Pollard 2011: Corporate
Governance and the Global Financial Crisis. Cambridge
University Press, Cambridge.
[39] Schillhofer, A. (2003). Corporate Gonvernacne and
Expected Stock Returns: Empirical Evidence from
Germany. Gabler: Wiesbaden.
[40] Shank, T., Hill, R. P., & Stang, J. (2013). Do
investors benefit from good corporate governance? The
International Journal of Business in Society, 13(4), 384 -
396.
[41] Sun, W, Stewart, J & Pollard, D 2011, ‘Introduction:
rethinking corporate governance – lessons from the global
financial crisis’ in Corporate Governance and the Global
Financial Crisis: International Perspectives, eds W Sun, J
Stewart & D Pollard, D, Cambridge University Press:
Cambridge, pp. 1-22.
[42] Yermack, D 1996, 'Higher market valuation of
companies with a small board of directors', in Journal of
Financial Economics, vol. 40, pp. 185- 211.
[43] Young, B 2003, ‘Corporate governance & firm
performance: is there a relationship?’, in Ivey Business
Journal Online, pp. 1-4.
Comparative European Research CER 2016 (issue I.)
42

VALIDITY AND RELIABILITY OF PERSONALITY TESTS
Bernhard Stocker
University of Latvia
Bernhard Stocker
Koppstrasse 23/19, 1160 Vienna
Tel. +43-664-4767827
Abstract: The purpose of this study is to determine the most valid and reliable personality type test in order to be able to set up
an empirical study to connect personality types with motivational factors. The ultimate aim is to establish motivational factors
that would lead to an increase in productivity and efficiency in certain specific personality types.
Keywords: motivation, personality type, validity, reliability, performance
1. Introduction
Personality predetermines the variance of motivation
factors to 20-30%. [6] A meta-analysis has shown that
such personality tests as Big Five could be used as an
important source of performance motivation.[6, 11]
Since there are dozens of personality type tests in
existence and the number is still growing, it is quite
important to choose the most appropriate and valid one in
order to conduct proper research. Therefore the author’s
main priorities for conducting this research is to choose the
most reliable and valid personality type test in existence as
well as to analyse motivational factors and how they are
related to certain behaviour and personality types.
2. Motivation
“Personality refers to an individual’s characteristic patterns
of thought, emotion, and behaviour, together with the
psychological mechanisms—hidden or not—behind those
patterns.”[5]
As mentioned above, personality predetermines the
variance of motivation factors to 20-30%.[6] Authors also
argue that for example extraverts could be motivated by
intrinsic factors, such as recognition, positive feedback or
other reward factors, whereas introverts will be motivated
to avoid punishment. [5] Extrinsic traits have a positive
impact on creativity, whereas intrinsic traits have an
impact on innovative behaviour. [1]
From the point of view of behavioural theory the decisions
individuals make are influenced by their values and
believes. From this point of view personality
characteristics play an important role in behaviour.
Individual’s characteristics are responsible for the way an
individual perceives a world, including working
environment. Existing research on the influence of
personality on motivation is divided into two main trends,
which sometimes are interconnected, namely a link
between personal traits and job satisfaction [5, 6] and a
link between personal traits and achievement motivation.
Herzberg examined in his work the relationship between
motivation and job satisfaction. [10] He suggested a two-
factor model of motivation, which proposes that
dissatisfaction is not the opposite of satisfaction, but
means absence of satisfaction. He distinguishes between
two facets of work “hygiene factors” and “motivators”.
Hygiene factors are based on extrinsic approach to
motivation and could lead to employee dissatisfaction, if
they are not met. Hygiene factors include supervision,
working conditions, company policies, salary, and
relations with co-workers. Motivators are based on
intrinsic approach to motivation and include aspects such
as achievement, development, responsibility and
recognition. [6] Developing the two-factor model of
motivation, Furnham [6] points out an important role of
intrinsic factors such as recognition and positive feedback
as motivating factors for extraverts. Furnham [5] analysed
the relationships between personality and work values.
They found out the motivator factors were positively
associated with extraversion and negatively with openness.
Hygiene factor were negatively associated with both
extraversion and openness. [5, 6] Furnham [5] points out
that job satisfaction is higher for individuals that have
higher score in openness. This let them be more innovative
and learn new skills. According to researchers, work vales
and attitudes are accounted to 40% by genetic factors [6],
and may stay stable despite the changes of occupation and
employers.[21]
Other researchers focus on the analysis of the relationship
between personality and achievement motivation.
Cassidy and Lynn [22] developed a system to measure
achievement motivation. They propose seven dimensions.
Work ethic refers to the desire to work hard, which effect a
person’s values, attributes and behaviour [22]. Pursuit of
excellence refers to the desire to perform the best personal
results in order to achieve the personally defined standard
of excellence. Status aspiration refers to evaluation of an
individuals’ status in view of others and is inspired with
the desire to be a leader and to achieve a certain
hierarchical status. Dominance, which sometimes is
described as a part of status aspiration, has been identified
as a separate factor referring to be in a position of
authority. Competitiveness shows a high desire to compete
with the ultimate goal to outperform others in the
competitive task or activity. Acquisitiveness for money
and material wealth refers to socio-economic status, which
can be achieved by means of money and other material
objects. Mastery in nature is similar to competitiveness but
Comparative European Research CER 2016 (issue I.)
43

with oneself instead of with others. Difficult tasks and
problem solving are functioning as motivation factors.[22]
Furthermore, the system explored by Cassidy and Lynn
[22] could be integrated into a widely used two-
dimensional model of achievement motivation, intrinsic
and extrinsic motivation.[9] The status aspiration,
dominance, competitiveness, and acquisitiveness measures
fall on extrinsic motivation, whereas mastery, work ethic,
and excellence fall on intrinsic motivation.[9]
Developing further this approach, Deci and Ryan (2008)
differentiated autonomous and controlled motivation.
Autonomous motivation is based on internal demands
through willingness and sense of choice. Controlled
motivation is based on external demands through pressure
or demand. Autonomous motivation plays an important
role in feeling of satisfaction, and helps to achieve
effective performance in education, work, sport or other
activities.[23] Elliot and Dweck [4] developed the theory
of motivation identifying two types of motivation.
Achievement motivation is focusing on completion of
tasks, which are characterised by moderate challenges and
risks. Competence or self-efficacy motivation is derived
from the belief that people can solve difficult tasks in their
own ability. [4]
The literature review has shown a fair amount of research
on the relationship of personality traits and achievement
motivation in education or among students. [9] Hart,
Stasson, Mahoney & Story, P. [9] examined the
relationship between Big Five and achievement
motivation. The study examined 777 students. The
researchers have found out that “...[c]onscientiousness,
openness, and extraversion were positively associated with
intrinsic achievement motivation, whereas extraversion,
conscientiousness, and neuroticism were positively related
to extrinsic achievement motivation.“ (p. 267). [9] In a
further study Rahman [17] has examined 180
undergraduate and postgraduate students, and have found
that “[a]mong the personality factors, PG students seem to
have more agreeableness, conscientiousness and openness
and they also show lesser neuroticism. Among the UG
[undergraduate] students, openness and neuroticism were
found to be positively correlated with achievement
motivation” (p. 40). Rahmen [17] made some gender
comparison, the results of which have shown that women
are more achievement oriented than men, whereas
conscientiousness and openness have higher score among
men. ”For women; extraversion, conscientiousness and
openness and for men, agreeableness and
conscientiousness correlated with achievement
motivation.” (p. 40).[17]
Smola and Sutton [20] argue that the social context in an
individual has an impact of an individual’s attitude
towards authority, their understanding of organisations, the
value of work define goals of work and shape work ethic.
This is being confirmed by the finding of Wong, Gardiner,
Lang & Coulon [26], who identified a relationship
between socio-cultural context and personality
development. They argue that social context of every
generation impacts the value of work and individual’s
expectations from work.[26]
2.1. Personality and Leadership
One of the biggest questions in management is, whether
leaders are born to be leaders, or whether these skills could
be acquired.
Furnham [6] found out that high scores in extrinsic
rewards (such as pay and bonuses) were negatively
associated with job status. The reason for that is that for
those who are lower in the hierarchy, hygiene factors are
more important than for those, who are higher up in status
However, those who are higher in status accept hygiene
factors as granted, and for them power and status - or
motivators - are more important. This goes in line with the
Maslow theory of motivation.
As a rule, leadership is connected with taking risks.
Several researchers analysed the correlation between
personality and risky behaviour.
Tok [23] found out a positive correlation between
readiness to take risks and extraversion and openness, and
a negative correlation with conscientiousness and
neuroticism.
Seibokaite and Endriulaitiene [19] analysed the impact of
personality traits on risky behaviour, particularly on
driving behaviour. They found out that conscientiousness
is positively associated with risky behaviour.
Conscientiousness showed a strong correlation with higher
levels of work motivation and higher levels of perceived
safety climate. Less risky behaviour was associated with
extraversion, agreeableness, conscientiousness and lower
levels of neuroticism. Seibokaite and Endriulaitiene [19]
explain this with high social responsiveness, performance
norms, low aggressiveness and sociability of individuals
with high score in these traits.
2.2. Reliability and validity
The main criteria to judge the worth of a test are validity
and reliability. However, many tests fail on both criteria.
For example, according to the survey of the Federal Office
of Technology Assessment, 73% to 97% of people who
fail integrity test are incorrectly classified as dishonest.
[25] Several researches [27], which have been taken
recently, do not show high validity score of such tests. A
meta-analysis of personality tests published between 1964
and 1982 showed relative low levels of validity (about
0.2). [3] Ghiselli [8], by analysing the validity of tests for
personnel selection, has concluded that personality tests
can only predict the level of proficiency likely to be
attained by executives, but they are less useful for
foremen. Ones [15] analysed personality tests from the
point of view of predictors of performance. This analysis
showed a positive correlation. Reddock [18] refers to two
factors that could enhance the validity of personality tests -
namely the frame-of-reference (FOR) and intra-individual
or within-person variability.
Other tests fail on reliability criteria. For example, three-
quarters of the Myer-Briggs-test takers are assigned to a
different type when re-taking the test, although the test
claims to test their inborn, unchanging personality types.
[16]
Comparative European Research CER 2016 (issue I.)
44

In order to understand the complexity of concepts of
validity and reliability, the following theoretical overview
of these two constraints needs to be provided.
2.3. Reliability of personality tests
Test reliability consists of two parts: a test-retest
reliability, which refers to the outcome stability over time,
and internal consistency reliability.[13] Research
measuring a mood can have perfect internal consistency
but poor retest reliability. Conversely, a research
measuring such data as date of birth, social security
number, height or weight is an example of a scale with low
internal consistency but near-perfect retest reliability,
because they might stay constant for many years.[14]
Test-retest (or just retest) reliability is scored in a rage
from +1 to -1. The higher the correlation coefficient, the
more similar the tests are. If the correlation equals to 0,
there is no relationship between two sets of scores. In
general, test-retest reliability of most psychological test is
less than one. This can be explained by several factors.
[13]
Time gap: if test takers will retake a test after a short
period of time, they can remember the expressions, and
therefore the test-retest reliability will be low. In order to
avoid that, researchers suggest retaking the test not earlier
as three months.
Changes of the test subject: in a gap period between the
tests some changes of subject can occur, and the results
may differ from the previous attempt.
Subject group: it is important to provide a retest to the
same (sample) group. For example, if the first test has been
done by jobseekers, and the second test by managers, the
test-retest reliability will be low, as it does not cover the
same target group.
Subject group size: in order to reduce a standard error, the
group size should be sufficiently large. Kline (1999)
suggests using groups of at least 100 participants.
Measurement error: such factors as uncomfortable chair, a
poor pen or headache or just fatigue may lower test-retest
reliability scores. Poor test instructions, subjective scoring
or guessing only increases confusion of a test taker and
lower the test-retake reliability score.
Internal consistency reliability reflects the cohesion of the
components of a test.[14] The most common measurement
of internal consistency is coefficient (Cronbach's) alpha,
which (according to researchers) should be at least .07 or
even .09 in order to provide high validity of a test.[13; 14]
Coefficient alpha is represented by a formula:
rtt =
(1 –
); (i=1,2,3,…n).
where:
rtt = the alpha coefficient of attest of n items;
n = the number of items;
= the item variance;
= the test variance [2; 14]
For good tests, high internal consistency reliability is
desirable but not sufficient.
4.2. Validity of personality tests
Validity is a much more complex constraint. Generally, a
test is valid if it measures what it claims to measure.[13]
There is no widely approved coefficient to calculate
validity. A test is always made for some purpose and
certain conditions, which differ from test to test. [13]
Researchers distinguish several types of validity:
Face validity: Face validity means that a test appears to be
measuring what it claims to measure. [13] The problem
with this is that test-subjects are able to guess what a face-
valid test is measuring. Therefore personality tests are
structured in a way, that they have a lack of face validity
and still possess general validity. [24]
Concurrent validity: “A test is said to possess concurrent
validity if it can be shown to correlate highly with another
test of the same variable which was administered at the
same time." [13]
Predictive validity: refers to the extent to which scores
from the test are able to predict some criteria or other. [13]
Content validity: enables to measure the extent of content
representativeness. Sometimes it might be overlapping
with face validity, but it represents a different aspect. For
example, the question “Do you sometimes feel anxious, for
no particular reason?”, the face-valid item is the
measurement of anxiety. However, this anxiety can be
distorted by deliberate lying, by imperfect self-awareness,
or by ignorance. A fearful subject might put some negative
result. [13]
5. References
[1] Chen, S.C.,Wu, M.C. and Chen, C.H. (2010).
Employee's Personality Traits, Work Motivation and
Innovative Behavior in Marine Tourism Industry. Journal
of Service Science and Management, 3, 198-205.
doi:10.4236/jssm.2010.32024
[2] Cronbach, L.J. (1951). Coefficient alpha and the
internal structure of tests. Psychometrika,16, 297-333
[3] Dakin, S., Nilakant, V., & Jensen, R. (1994). The role
of personality testing in managerial selection. Journal of
Managerial Psychology, 9(5), 3. Retrieved from
http://search.proquest.com/docview/215866104?accountid
=15518
[4] Elliot, A., J. & Dweck, D.C. (Eds.) (2005). Handbook
of Competence and Motivation. New York, USA: The
Guilford Press.
[5] Funder, D.C. (2013). The Personality Puzzle, 6th ed.
New York: Lindaxo
[6] Furnham, A., Eracleous, A., & Chamorro-Premuzic, T.
(2009). Personality, motivation and job satisfaction:
Hertzberg meets the Big Five. Journal of Managerial
Psychology, 24(8), 765–779.
http://doi.org/10.1108/02683940910996789
[7] Furnham, A., Petrides, K. V, Tsaousis, I., Pappas, K.,
& Garrod, D. (2005). A cross-cultural investigation into
the relationships between personality traits and work
values. The Journal of Psychology, 139(1), 5–32.
http://doi.org/10.3200/JRLP.139.1.5-32
Comparative European Research CER 2016 (issue I.)
45

[8] Ghiselli, E.E. (1973). The Validity of Aptitude Tests in
Personnel Selection, Personnel Psychology, 26 (4)
[9] Hart, J.W; Stasson, M. F; Mahoney, J. M; Story, P.
(2007). The Big Five and Achievement Motivation:
Exploring the Relationship Between Personality and a
Two-factor Model of Motivation. Individual Differences
Research, 5 (4), 267-274
[10] Herzberg, F., Mausner, B. and Snyderman, B.B.
(1959), The Motivation to Work, 2nd ed., John Wiley &
Sons, New York, NY.
[11] Judge, T. and Illies, R. (2002), Relationship of
personality to performance motivation, Journal of Applied
Psychology, 87, 797-807.
[13] Kline, P. (1999). Handbook of Psychological Testing
(2nd Ed.) London, UK: Routledge
[14] McCrae, R. R., Kurtz,J. E., Yamagata, S., &
Terracciano, A. (2011). Internal consistency, retest
reliability, and their implications for personality scale
validity. Personality and Social Psychology Review, 15(1)
28–50. doi: 10.1177/1088868310366253
[15] Ones, D. S., Dilchert, S., Viswesvaran, C., & Judge,
T. A. (2007). In support of personality assessment in
organizational settings. Personnel Psychology
[16] Paul, A.M. (2005, February 13): The cult of
personality tests. A flawed but trendy management tool.
Globe Newspaper Company, Inc., Retrieved from
http://www.boston.com/news/globe/editorial_opinion/oped
/articles/2005/02/13/the_cult_of_personality_tests?pg=full
[17] Rahman, S. (2014). Effect of personality factor on
achievement motivation. Indian Journal of Health and
Wellbeing, 5(1), 40-45.
[18] Reddock. C, Biderman M. and Nguyen, N. (2011).
The Relationship of Reliability and Validity of Personality
Tests to Frame-of-Reference. Instructions and Within-
Person Inconsistency. International Journal of Selection
and Assessment, 19 (2)
[19] Seibokaite, L., & Endriulaitiene, A. (2012). The role
of personality traits, work motivation and organizational
safety climate in risky occupational performance of
professional drivers. Baltic Journal of Management, 7(1),
103–118. http://doi.org/10.1108/17465261211195892
[20] Smola, K. W. E. Y., & Sutton, C. D. (2002).
Generational differences : revisiting generational work
values for the new millennium. Journal of Organizational
Behavior, 23, 363–382. http://doi.org/10.1002/job.l47
[21] Staw, B.M. and Ross, J. (1985), Stability in the midst
of change: a dispositional approach to job attitudes,
Journal of Applied Psychology, 70, 469-80.
[22] Cassidy, T and Lynn, R (1989) A multifactorial
approach to achievement motivation: Development of a
comprehensive measure. Journal of Occupational
Psychology, 62 . pp. 301-312.
[23] Deci, E. L., & Ryan, R. M. (2008). Self-determination
theory: A macrotheory of human motivation, development
and health. Canadian Psychology, 49, 182-185.
[23] Tok, S. (2011). The Big Five Personality Traits and
Risky Sport Participation. Social Behavior and Personality,
1105-1112. http://dx.doi.org/10.2224/sbp.2011.39.8.1105
[24] Segal, D.L. and Coolidge, F.L. (2003). Objective
Assessment of Personality and Psychopathology: An
Overview. In Hilsenroth, M.J. et. All. (Eds.)
Comprehensive Handbook of Psychological Assessment,
Volume 2, Personality Assessment
[25] U.S. Congress, Office of Technology Assessment
(1990). The use of integrity tests for pre-employment
screening, OTA-SET-442.Washington, DC: US.
Government Printing Office, September 1990). Retrieved
from http://www.fas.org/ota/reports/9042.pdf
[26] Wong, M., Gardiner, E., Lang, W., & Coulon, L.
(2008). Generational differences in personality and
motivation: do they exist and what are the implications for
the workplace? Journal of Managerial Psychology, 23(8),
878–890. http://doi.org/10.1108/02683940810904376
[27] Morgeson, F. P. (2007). Job analysis methods. In S.
G. Rogelberg (Ed.), Encyclopedia of industrial/org
anizational psychology (Vol.1, pp. 380-383). Thousand
Oaks, CA: Sage.
Comparative European Research CER 2016 (issue I.)
46

Session: Economy, Financing, Public Administration Index of Author(s)
Bališová, Jana Bock, Michal Bott Domonkos, Lívia Brodawka, Magdalena Brożek, Katarzyna Hakszer, Richard Nazarova, Jekaterina Parvi, Rafał Pawera, René Skoruks, Dmitrijs Stawska, Joanna Šenfelde, Maija Švarcová, Kateřina Tichý, Jaromír
Comparative European Research CER 2016 (issue I.)
47
IMBALANCE OF THE PUBLIC FINANCE IN THE CONTEXT OF KEYNESIAN AND NONKEYENSIAN
EFFECTS OF FISCAL POLICY LIMITATION
Joanna Stawska
University of Lodz
39 Rewolucji 1905 Street
Lodz, 90-214, Poland
(+48) 42 635 52 49
Abstract: The purpose of this article is to point out the importance of the size of public debt and deficit in the context of
Keynesian and non-Keynesian effects of fiscal policy limit. To achieve this objective primarily were used methods of analysis
of the available literature and presentation of statistical data. Considerations include, among others, the presentation of public
debt and deficit in the context of economic growth. Expansionary fiscal policy often caused by economic fluctuations
contributes to the deepening of public finance imbalance with frequent decline in GDP growth. The restrictive policy
influences on improving the situation of the public finance sector in the long-term with at least moderate economic growth.
Keywords: fiscal policy, public finance imbalance, financial crisis
1. Introduction
In the economy, there are mechanisms that cause the
budget deficit is formed in a pro-cyclical way [1], [2]. This
is a relatively common phenomenon. As shown by
empirical research, as far as fiscal policy in developing
countries tends to be pro-cyclical, so in the G7 countries,
fiscal policy is conducted in a rather anti-cyclical way [3].
Similar results of studies conducted on different samples
reached the Lane [4], Alesina, Tabellini [5] and others. C.
Adam and D. Bevan indicate that sustained in the long
term budget deficit contributes to a slowdown in economic
growth [6]. C.Reinhart and K.Rogoff give significant
results of the analysis covering 44 countries highly
economically developed and developing countries. In their
opinion, the high level of public debt in relation to GDP
(over 90%) is associated with lower levels of GDP growth
[7]. Disputes about the negative or positive impact of the
public finance imbalance on the growth are taking place
for many years, but recently has been intensified. Hence,
the purpose of this article is to point out the importance of
the size of the general government debt in the context of
Keynesian and non-Keynesian effects of fiscal policy
limitation.
2. Reflections on Keynesian and NonKeynesian effects
of limiting public finances
Public debt is a consequence of the budget deficit (a
negative balance of the consolidated balance sheet of the
public sector). The literature mentions several reasons for
the budget deficit among others: 1) between budgetary
expenditure and revenue from taxes and other sources,
there is a lack of synchronization; 2) too extended
functions of the state; 3) between the tax burdens which do
not reduce the rate of economic growth and the size of
government spending is difficult to find the optimum
relationship; 4) adverse demographic trends; 5) use of
fiscal intervention in the conditions of economic recession,
for example: "Fiscal packages"; 6) often politicians in pre-
election declarations consist society promises that at the
moment of require of funds they are higher than obtained
in a natural manner through taxes;7) over developed
welfare state mainly in relation to GDP growth and ability
to raise budget revenues (excessive social policy, social
privileges) [8]. Occurring in the economy, the budget
deficit and public debt impact on economic growth in
different ways. Many economists have on this completely
different opinion and theories. One of the popular models
describing the influence of Keynesian demand of the
public sector on economic growth is P. Samuelson model.
Based on the model it was noted that the increase in
demand of the public sector contributes to GDP growth,
while the decline in the demand by tightening fiscal policy
to drop the product. In this model, it is assumed that the
total demand is below the potential level, and the prices
have excellent rigidity. Hence with such assumptions the
aggregate demand determines the amount of product in the
economy. Therefore, higher public spending ceteris
paribus cause an increase in global demand and product,
and lower public spending, ceteris paribus, lead to a
decline in global demand and product. In addition, in the
model Samuelson is pointed out that the increase in
savings contributes to the decline in demand, ceteris
paribus, a decline in savings causes an increase in demand,
this is called. the paradox of savings. Model Samuelson
and other Keynesian models are used in the analysis of
economic processes in the short term. As a result of fiscal
expansion (increase in budgetary expenditure), occurs the
output growth in the short term - but this does not mean
growth in the long term. This is due to the fact that
economic growth in the long term, influenced by fiscal
factors such as : the structure of public expenditure, the
level of public spending, the amount and types of taxes
and the scale of imbalances in public finances [9]. In the
80s of the twentieth century, there have appeared studies
on the positive effect of reducing public spending or raise
taxes on the growth of aggregate demand in the short term.
These studies related to non-Keynesian effects of fiscal
tightening that can occur when public finances stand
before the crisis, taxes are high and despite the public debt
is growing rapidly. It turns out, however, that to
Comparative European Research CER 2016 (issue I.)
48

appearance the Keynesian effects may lead the sufficiently
strong deficit reduction. In the literature, there are also
opinions that the occurrence of non-Keynesian effects of
the tightening of fiscal policy significantly influenced not
the size of the original imbalances in public finances but
rather a way of their reduction. Deficit reduction may be
accompanied by acceleration of the product, not by raising
taxes, but by cuts in expenditure, mainly in spending on
public sector wages and social transfers [10]. An
interesting model describing non-Keynesian effects of
fiscal tightening is, among others, model O. J. Blanchard
(1985.1990) [11], [12]. This model connects non-
Keynesian effects with changes in the uncertainty felt by
households caused by fiscal impulses. In this model, the
probability of the occurrence of uncertainty of households
is addicted to not only the rate of tax burden and public
debt levels but also on the degree of development of the
financial system or the horizon of maximizing of the
utility by the household [9]. Analyzing the assumptions of
Blanchard model should be noted that households may
have a certain myopia that results from continuous risk of
death or expiration of the family, or the underdevelopment
of the financial system, which in turn prevents the
smoothing consumption over time. Decisions taken by
households are within the range of choices from the
Keynesian (only the current period) to the Ricardian
(infinite time horizon). Among the assumptions in the
model is also listed zero level of tax rate, which the
exceeding result in the permanent decline of the product.
Moreover, in each period the probability of carrying out
consolidation of public finances is the same. The
consolidation is understood as a reduction of the deficit,
which will affect the stabilization of the public debt in
relation to the product. Taking this into account, tax
increase produces two effects: a) First of all it is related to
the increase in the expected value of lifelong household
assets, which determines their consumption possibilities. It
also allows you to stop the accumulation of public debt to
the size at which it would be necessary to raise tax rates to
a level causing abnormal lowering the product; b) Tax
increase ensures households in the current period that taxes
will not increase in the future above the critical level.
However, such an increase, assuming maximizing the
utility by households in a finite time horizon, is the same
as the increase in the expected value of the total tax
burden. With the deposition of consolidation are increasing
the chances of at least a partial shift of the debt cost for
the next generation. As a result, the first effect dominates
the effect of the other. This is due to the fact that tax
increase contributes to the growth of private consumption
and aggregate demand only in extraordinary circumstances
- i.e. when bringing closer an extraordinary expense in the
process of balancing public finances (public debt reaches
high levels and still increases despite the tax rate close to
the critical value). A. Rzońca adds that the range of tax
rates, in which achieve fiscal balance as a result of tax
increases could lead to an increase in private consumption,
is relatively narrow [10]. Based on the model of Blanchard
it can be concluded that the fiscal tightening rarely may
lead to non-Keynesian effects, so to an increase in
aggregate demand. In order for that to happen, the rate of
tax burden and public debt should be at a sufficiently high
level. Then a further tax increase may contribute to non-
Keynesian effects [13]. Among other Alesina and Perotti
[14]; Alesina and Ardagna [15] or Alesina, Ardagna,
Perotti and Schiantarelli [16], who conducted empirical
research on non-keynesian effects of fiscal tightening,
emphasized that the increase in aggregate demand in the
time of consolidation of public finances seems more likely
if they are balanced by cuts in public spending and not by
raising taxes. On the base of the modified model of
Blanchard can be concluded that the probability of non -
Keynesian effects of fiscal tightening is higher in countries
where: 1) the financial condition is bad, the public debt is
substantial and it continues to grow despite high taxes; 2)
Households are aware of the impossibility of postponing
fiscal consolidation and thus they know about the negative
consequences for the level of the product by raising taxes;
3) the persons responsible for fiscal policy - according to
households - as the only form of balancing the budget they
see an increase in taxes (and not a limitation of
expenditure); 4) as a result, the government surprises
households and reduces the level of state spending. Thus,
the reduction of public expenditure does not mean worse
results than a tax increase. [13] In the short term reduction
of the deficit in public finances may reduce the rate of
economic growth but not always which is indicated by the
theory and empiricism.
3. Analysis of economic situation in Poland, with
particular emphasis on public finances
Recent economic and financial crisis, which began in 2008
contributed to the need to pay attention to the public
finances of many countries. Typically, the tendency to
increase budget deficits and debts of public finances are
intensified by the recession phenomena. In order to
analyze the situation of public finances and the size of the
economic growth in Poland, are presented in Table 1 of
revenue, government expenditure and the general
government deficit and GDP in Poland in the years 2000-
2014 in current prices.
Table 1 Public finances revenues and expenditure,
General Government deficit and GDP in million zloty, in
Poland
Year
Public
finances
revenue_nominal
Public
finances
expenditure_nominal
GG
DEF_nomi
nal
GDP_nom
inal
2000 271 641,9 293 115,8 -22 194 747 032
2001 291 491,0 329 682,6 -37 309 779 975
2002 304 822,9 351 064,8 -39 280 810 617
2003 319 955,5 365 252,8 -51 408 845 930
2004 345 933,7 387 834,6 -47 796 927 306
2005 382 496,8 412 130,7 -39 288 984 919
2006 420 411,1 442 609,5 -38 228 1 065 209
2007 484 853,3 483 182,4 -21 972 1 186 773
2008 515 204,6 535 837,6 -46 369 1 277 322
2009 539 890,2 590 019,8 -99 666 1 361 850
2010 551 098,5 635 774,3 -109 728 1 437 357
2011 604 203,0 660 082,1 -76 174 1 553 582
2012 651 121,5 689 280,6 -60 433 1 615 894
Comparative European Research CER 2016 (issue I.)
49

2013 650 315,1 699 177,5 -66 735 1 662 052
2014 677 159,0 716 857,5 -55 241 1 724 723
The largest increase in the deficit of the general
government in Poland took place during the financial crisis
in the years 2009 - 2010. Then the increase in spending
was much higher than the increase in public revenues. In
the years 2000 - 2014 only two times the general
government deficit was below 3%, which meant meeting
the fiscal rules. In Poland there are fiscal rules contained at
international level, namely the Treaty on European Union
(Maastricht Treaty) of 7 February 1992 and the
accompanying Protocol on the excessive deficit procedure.
They set the maximum level of public debt at 60% of GDP
at market prices and the deficit at 3% of GDP at market
prices [17]. On the other hand, national fiscal rules have
been enshrined in the Constitution of Republic of Poland
of 1997 and in the Public Finance Act. In the Constitution
was placed a provision that prohibits the granting of loans
or guarantees and financial sureties in the aftermath, the
amount of public debt would exceed 3/5 of GDP [18].
Similarly, the Public Finance Law stipulates that the public
debt cannot exceed 60% of the annual GDP [19]. In
periods of decline in GDP in the economy were also
noticeable increases in deficits of general government
(although the increase in the deficit of public finances was
a factor mitigating the impact of the crisis on the Polish
economy). In 2009 this deficit was 7.3% of GDP and in
2010 already 7.6% of GDP. This debt began to fall in 2011
from 4.9% of GDP to 3.2% of GDP in 2014 (Table 2). The
increase in the deficit of public finances among others, had
its roots in the activities of anti-crisis measures of the
government. Fiscal authorities reduced the burden on
social security contributions, tax and administrative
barriers, and increased spending on public investment.
Table 2 General Government debt and deficit and GDP
growth (% GDP) in Poland
Year GG debt GG deficit GDP_growth
2000 -36,5 2,97 4,3
2001 -37,3 4,78 1,2
2002 -41,8 4,85 1,4
2003 -46,6 6,08 3,9
2004 -45,3 5,15 5,3
2005 -46,7 3,99 3,6
2006 -47,1 3,59 6,2
2007 -44,2 1,85 6,8
2008 -46,6 3,63 5,1
2009 -49,8 7,32 1,6
2010 -53,60 7,63 3,9
2011 -54,80 4,90 4,5
2012 -54,40 3,74 2,0
2013 -55,70 4,02 1,6
2014 -50,10 3,20 3,3
Observing the dynamics of economic growth in Poland
since 2000 we notice that while in 2000 recorded the
growth of 4.3%, in 2001-2002 there was a drop in GDP
and fluctuated between 1.2-1.4% . In subsequent years
2003-2006, GDP in Poland was on a path of moderate
growth reaching even in 2006 the level of 6.2%. Analyzing
the level of GDP in Poland, especially in the period
approaching the financial crisis it must be noted that from
2007 onwards. Until mid-2008 observed a relatively high
level of GDP, oscillating in individual quarters in the range
from 7.5% to 6.1% and the average from 6.8% in 2007 to
5.2% in 2008 in the second half of 2008 it was seen a
significant slowdown in economic growth (GDP in 2009
increased by about 1.8 The years 2010 - 2014 was a period
of many changes in GDP growth because, while in 2011
was an increase of 4.5%, already in 2013 - a decrease of
1.6% (Table 2). In turn, Table 3 presents the percentage
changes of selected variables - current year to the previous
year (R1-R0) / R0).
Table 3 Percentage changes of selected variables in
Poland (change year to year)
Year
Public finances
revenue_
real
Public finances
expenditure
_real
GG debt_
real
GG
deficit_real
2001 1,71 6,61 1,35 59,34
2002 2,63 4,50 14,14 3,32
2003 4,09 3,18 15,40 29,79
2004 4,46 2,59 2,90 -10,17
2005 8,25 4,04 7,19 -19,52
2006 8,87 6,37 8,16 -3,62
2007 12,51 6,50 1,93 -43,93
2008 1,96 6,41 8,95 102,50
2009 1,27 6,41 10,10 107,71
2010 -0,49 5,04 10,72 7,33
2011 5,15 -0,43 5,99 -33,42
2012 3,89 0,67 -0,54 -23,52
2013 -1,03 0,51 4,47 9,43
2014 4,13 2,53 -6,44 -17,22
The variables presented in the table are in real terms by the
CPI (I1= 2000 = 100). Analyzing the results in Table 3, we
note that in 2007, in Poland has performed a significant
increase (change of 12.51%) of government revenues
(compared to 2006), the increase in spending of public
finances (change of 6.5%), and slight decline in public
debt and a significant decrease in the deficit of General
Government (change of -43.93%), with sustained high
economic growth of 6.8% of GDP. During the crisis, there
was a slight increase in government revenues (1.96%) in
2008 compared to 2007, the increase in spending of public
finances (change of 6.41%), the increase in public debt
(change of 8.95%) and a significant increase in the GG
deficit (change of 102.5%), with slightly lower, but still
high GDP growth rate (5.1%). In turn, the year 2009 was
characterized by low economic growth of 1.6% of GDP
with a much lower gain public revenues (change of 1.27%)
compared to 2008., increased spending of public finances
(change of 6.41%), a higher deficit (change of 10.10%)
and public debt (change of 107.71%) compared to the
previous year. However, in 2014 (compared to 2013)
observed decrease in the deficit (change of -17.22%) and
public debt (change of -6.44%) with an increase in public
revenue (change of 4.13%) and growth public expenditure
(change of 2.53%). On the other hand, economic growth in
2014 was higher (3.3% GDP) compared to 1.6% of GDP
in 2013. It seems that it is difficult to indicate at which
point there were strictly Keynesian and non-Keynesian
Comparative European Research CER 2016 (issue I.)
50

effects of fiscal tightening in Poland in the period under
review. This is partly due to the fluctuations
koninkturalnych as gopodarcze slowdown of 2001-2002
and the recent financial crisis, which began in 2008.
3. Conclusions
The considerations discussed in this article focus on the
relationship between the deficit and the debt of public
finance sector and economic growth in Poland. The deficit
and public debt are the key indicator of the direction of
fiscal policy in the country. The time of the restrictive
fiscal policy necessary to reduce the level of debt was
interrupted in 2008 with the arrival of the global financial
crisis. As a result, in 2009-2010, many countries applied
expansive fiscal stimulus, which had a base in the
Keynesian approach to stimulate the economy. In Poland,
even before the crisis was limited deficit and public debt,
with high economic growth, while during the crisis
increased the imbalance of public finance at a lower rate of
economic growth. It was only from 2011 began the process
of tightening fiscal policy which the effects of improving
public finances, with moderate growth (3.3% of GDP), is
visible only from 2014. Expansionary fiscal policy often
caused by economic fluctuations contributes to the
deepening of public finance imbalance with frequent
decline in GDP growth. The restrictive policy influences
on improving the situation of the public finance sector in
the long-term with at least moderate economic growth.
References
[1] Mackiewicz M., Stabilizacyjna polityka fiskalna w
krajach OECD, PWE Warsaw 2010, p.51.
[2] Stawska J., Wpływ policy-mix na wzrost gospodarczy i
poziom bezrobocia w Polsce, „Zeszyty Naukowe No. 804,
Finanse, Rynki finansowe, Ubezpieczenia” No. 67,
University of Szczecin, 2014, p.673.
[3] Talvi E., Vegh C. A., Tax base variability and
procyclical fiscal policy, NBER Working Paper,
Cambridge, 2000.
[4] Lane P., The Cyclical Behavior of Fiscal Policy:
Evidence from the OECD, “Journal of Public Economics”,
nr 87,2003, pp. 2661-2675.
[5] Alesina A., Tabellini G., Why is Fiscal Policy often
Procyclical? NBER Working Paper, 2005, No. 11600.
[6] Adam C., Bevan D., Fiscal deficits and growth in
developing countries, “Journal of Public Economics”,
2005, No. 89, pp. 571 – 597.
[7] Reinhart C. M., Rogoff K. S., Growth in a time of debt,
“NBER Working Paper”, 2010, No. 15639.
[8] Bukowski S.I., Czy gospodarka może funkcjonować
bez długu publicznego? IX Congress of Polish Economists,
2013, pp. 2 – 3.
[9] Rzońca A., Czy Keynes się pomylił? Skutki redukcji
deficytu w Europie Środkowej, Scientific Publishing
SCHOLAR, Warsaw 2007, pp. 32 – 56; 115-116.
[10] Rzońca A., Niekeynesowskie skutki zacieśniania
polityki fiskalnej. Zmodyfikowany model Blancharda.
Część I, “Bank i Kredyt” No. 10/2004, pp. 41- 42; 53-54.
[11] Blanchard O.J., Debt, deficits, and finite horizons,
The Journal of Political Economy, No. 93(2), 1985.
[12] Blanchard O.J., Comment on Giavazzi and Pagano,
NBER Macroeconomics Annual, 1990.
[13] Rzońca A., Niekeynesowskie skutki zacieśniania
polityki fiskalnej. Zmodyfikowany model Blancharda.
Część II, “Bank i Kredyt” No. 11-12/2004, p. 24.
[14] Alesina A., Perotti R., Fiscal Adjustments in OECD
Countries: Composition and Macroeconomic Effects,
NBER Working Paper, No. 5730, National Bureau of
Economic Research, Cambridge, August 1996.
[15] Alesina A., Ardagna S., Tales of fiscal adjustment,
Economic Policy: A European Forum, Vol. 27, October
1998, pp.487-546.
[16] Alesina A., Ardagna S., Perotti R., Schiantarelli F.,
Fiscal policy, profits, and investment, American Economic
Review 92(3), 2002, pp. 571-589.
[17] Traktach o Unii Europejskiej Dz. U. C191 z 29.
7.1992.
[18] Konstytucja RP, Dz. U. z 1997 r. No. 78, poz. 483 and
others.
[19] Ustawa o finansach publicznych, Dz. U. 2013 poz. 85,
art.74.
Comparative European Research CER 2016 (issue I.)
51

IMPACT OF CROSS BORDER COOPERATION PROJECTS BETWEEN SLOVAKIA AND HUNGARY IN TERMS
OF COHESION POLICY
1René Pawera -
2 Lívia Bott Domonkos-
3Richard Hakszer
1,2
Comenius University, Faculty of Management
Odbojárov 10, Bratislava, SK-820 05, Slovakia
[email protected] – [email protected]
3Eötvös Loránd University (ELTE), Faculty of Science
H-1117 Budapest, Pázmány Péter sétány 1/C, Hungary
Abstract: Cooperation is the key to a better Europe. European Union supports territorial cooperation between border-regions,
especially in the border settlements. Border regions, towns and districts promote cooperation as a tool for growth and change
through policy development and strategic orientation within territorial cooperation and beyond regional development.
Regional disparities in Slovakia are actually the highest among EU countries and the Cohesion policy tries to balance with
European. The aim of the study is to analyze the impact of projects on disparity and economic growth in border areas mainly
in the context of Slovak indicators. The comparative study also hypothesis whether the cross-border region in Hungary and
Slovakia behave differently in terms of absorption in the 2007-2013 programming period. Finally, it is focusing on future
prognosis and possible trend of the current 2014-2020 period.
Keywords: Regional Development, Cohesion Policy, Cross Border Cooperation, Disparity, Economic Growth
1. Introduction
Nowadays, the efficient development of regions is hard to
imagine without utilization of opportunities from
development funds and EU sources. This is especially
typical for settlements in cross-border areas, which are
located near to the state’s border and relatively far from
centralized industry and community centre of a country. It
is particularly necessary to use allocation resources of the
European Regional Development Fund in order to
maximize their impact on achieving the target goals and to
approach the EU‘s average, both in the terms of GDP and
unemployment rate. In case of Slovakia and Hungary this
resource is the Cross Border Cooperation Programme
between Hungary and Slovakia (hereafter as “CBC HU
SK’)
The research is conducting mainly on testing the
hypothesis:“Realisation of CBC HU SK projects and its
absorption positively influences the regional development
of Slovakia.“
Finally, the perspectives and the current cross-border
cooperation programmes in the period of 2014-2020 will
briefly introduced. Special focus is taken on the role of
regions in Slovakia in terms of disparities and project
absorption where it is also presented whether the numbers
and amounts of approved CBC HU SK grants resulting
the cohesion of regions in Slovakia.
Methods used: Statistical data analysis, Convergence
analysis by disparities, Comparative studies, Absorption
Maps of CBC projects, Cohesion analysis of the region.
2. Theoretical background
In search for efficiency, effectiveness and fiscal
sustainability of cross border territory projects, NUTS 3
regions gather more performance and information on
funding than ever before. As many of them have thought
to incorporate and use this kind of information in
budgeting of local government and planning cooperation
continuously and simultaneously with regards to EU
Cohesion Policy.
2.1. Cohesion Policy of the EU
Economic, social and territorial disparities at regional and
national level have increased in the enlarged European
Union. In order to strengthen economic and social
cohesion the Community is aiming at reducing these
disparities between the levels of development of various
regions and the declining of the least favored regions,
including rural areas. Achieving the highest possible
efficiency in the use of EU Funds for the development of
education and employment in the Slovak border regions is
a priority and one of the main objectives of the
Commission, national governments and the regions
themselves. Role of the European Regional Development
Fund in Slovakia is mainly expressed with the main goal
of European territorial cooperation. Cohesion Policy is
helped by Cohesion Fund which is one of the five
European Structural and Investment Funds. From 2014,
these operate under a common framework and pursue
complementary policy objectives. They are the main
sources of investment at EU level to help Member States
to restore and increase growth and ensure a job rich
recovery while ensuring sustainable development, in line
with the Europe 2020 objectives. [1] The number of
projects is surprisingly very high in this areas, however
according to the public awareness whereas those towns
where the Cohesion Policy rule of convergence criteria of
GDP< 75 % is already fulfilled. [2] In terms of the number
of project we can find that there are higher amount of
contracted amount in Southern regions of Slovakia in
Operation Programmes. [3] In accordance with the new
design of the European Cohesion Policy of 2014-2020 and
the targets set in Europe 2020, the programs have been
Comparative European Research CER 2016 (issue I.)
52
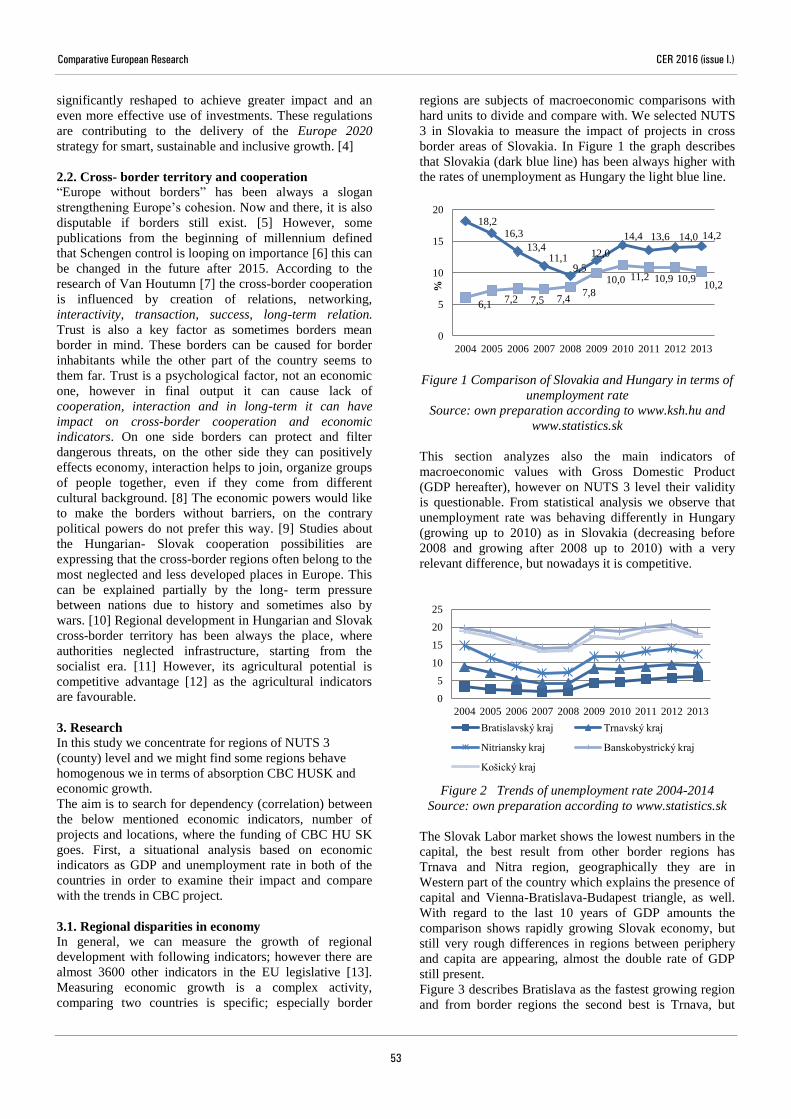
significantly reshaped to achieve greater impact and an
even more effective use of investments. These regulations
are contributing to the delivery of the Europe 2020
strategy for smart, sustainable and inclusive growth. [4]
2.2. Cross- border territory and cooperation
“Europe without borders” has been always a slogan
strengthening Europe’s cohesion. Now and there, it is also
disputable if borders still exist. [5] However, some
publications from the beginning of millennium defined
that Schengen control is looping on importance [6] this can
be changed in the future after 2015. According to the
research of Van Houtumn [7] the cross-border cooperation
is influenced by creation of relations, networking,
interactivity, transaction, success, long-term relation.
Trust is also a key factor as sometimes borders mean
border in mind. These borders can be caused for border
inhabitants while the other part of the country seems to
them far. Trust is a psychological factor, not an economic
one, however in final output it can cause lack of
cooperation, interaction and in long-term it can have
impact on cross-border cooperation and economic
indicators. On one side borders can protect and filter
dangerous threats, on the other side they can positively
effects economy, interaction helps to join, organize groups
of people together, even if they come from different
cultural background. [8] The economic powers would like
to make the borders without barriers, on the contrary
political powers do not prefer this way. [9] Studies about
the Hungarian- Slovak cooperation possibilities are
expressing that the cross-border regions often belong to the
most neglected and less developed places in Europe. This
can be explained partially by the long- term pressure
between nations due to history and sometimes also by
wars. [10] Regional development in Hungarian and Slovak
cross-border territory has been always the place, where
authorities neglected infrastructure, starting from the
socialist era. [11] However, its agricultural potential is
competitive advantage [12] as the agricultural indicators
are favourable.
3. Research
In this study we concentrate for regions of NUTS 3
(county) level and we might find some regions behave
homogenous we in terms of absorption CBC HUSK and
economic growth. The aim is to search for dependency (correlation) between
the below mentioned economic indicators, number of
projects and locations, where the funding of CBC HU SK
goes. First, a situational analysis based on economic
indicators as GDP and unemployment rate in both of the
countries in order to examine their impact and compare
with the trends in CBC project.
3.1. Regional disparities in economy
In general, we can measure the growth of regional
development with following indicators; however there are
almost 3600 other indicators in the EU legislative [13].
Measuring economic growth is a complex activity,
comparing two countries is specific; especially border
regions are subjects of macroeconomic comparisons with
hard units to divide and compare with. We selected NUTS
3 in Slovakia to measure the impact of projects in cross
border areas of Slovakia. In Figure 1 the graph describes
that Slovakia (dark blue line) has been always higher with
the rates of unemployment as Hungary the light blue line.
Figure 1 Comparison of Slovakia and Hungary in terms of
unemployment rate
Source: own preparation according to www.ksh.hu and
www.statistics.sk
This section analyzes also the main indicators of
macroeconomic values with Gross Domestic Product
(GDP hereafter), however on NUTS 3 level their validity
is questionable. From statistical analysis we observe that
unemployment rate was behaving differently in Hungary
(growing up to 2010) as in Slovakia (decreasing before
2008 and growing after 2008 up to 2010) with a very
relevant difference, but nowadays it is competitive.
Figure 2 Trends of unemployment rate 2004-2014
Source: own preparation according to www.statistics.sk
The Slovak Labor market shows the lowest numbers in the
capital, the best result from other border regions has
Trnava and Nitra region, geographically they are in
Western part of the country which explains the presence of
capital and Vienna-Bratislava-Budapest triangle, as well.
With regard to the last 10 years of GDP amounts the
comparison shows rapidly growing Slovak economy, but
still very rough differences in regions between periphery
and capita are appearing, almost the double rate of GDP
still present.
Figure 3 describes Bratislava as the fastest growing region
and from border regions the second best is Trnava, but
18,2 16,3
13,4 11,1
9,5
12,0
14,4 13,6 14,0 14,2
6,1 7,2 7,5 7,4
7,8
10,0 11,2 10,9 10,9 10,2
0
5
10
15
20
2004 2005 2006 2007 2008 2009 2010 2011 2012 2013
%
0
5
10
15
20
25
2004 2005 2006 2007 2008 2009 2010 2011 2012 2013
Bratislavský kraj Trnavský kraj
Nitriansky kraj Banskobystrický kraj
Košický kraj
Comparative European Research CER 2016 (issue I.)
53

surprisingly not just Nitra follows. Here we find relevant
importance of Košice city agglomeration, too.
Summarizing the indicators of GDP and unemployment
rate at border regions have not changed significantly
comparing to Bratislava region. This can also be explained
by the long-term effect of economic processes.
Figure 3 Trends of GDP level in selected Slovak cross-
border NUTS 3 regions
Source: own preparation according www.statistics.sk
3.2. Trends in Cross Border Cooperation
Development of cross-border activities is defined by
primarily encouraging entrepreneurship, in particular the
economic development, tourism and also border-road and -
bridge construction, culture, health cooperation and cross-
border trade cooperation. In those 5 calls of Hungary-
Slovakia Cross Border Programme 2007-2013 there were
more than 300 joint cross-border projects accepted and the
majority contracted [14] and implemented. In above
mentioned projects there were involved more than 400
project partners from Slovakia [15 – p. 105].
Table 1 Absorption of CBC HU SK projects in eligible
NUTS 3 counties
Source: own processing based on IMIS (monitoring system
for HU-SK CBC Programme 2007-2013)
The subject of the research selected direct border regions
to analyze with the suggestion that their relevance will be
higher, above there is a NUTS 4 map of regions which
suggest the highest rate of absorption in the agglomeration
of the capital Bratislava and Košice city.
Figure 4 Absorption map describing number of supported
projects per districts NUTS 4 in HU-SK 2007-201
Source: Hakszer: Cross-border cooperation programmes
and regional inequalities in South Slovakian cross-border
regions. Dissertation thesis
However, Košice and Bratislava as two major cities
possess with agglomerations (marked as red in Figure 4)
and they are absorbing in general a lot of funds, also
because of the seats of many (primary all of governmental)
organisation is centralized here. According to the analysis
we can see the dependence of the size of the town or city,
which is indicated by red logically the number is high.
The correlation analysis will be testing whether there is an
existing relation between the economic indicators and
regions of projects. The direct cross-border districts
(NUTS 4 level regions) are 12 in Southern Slovakia in this
case (in SK-HU border area). The figure 5 shows
contracted amounts in EUR in HU-SK 2007-2013 CBC
programme for each direct border district. Trendline is
very flat (R2 is only 0,0026), but we can find, that the
western and eastern districts are strong, in contrary with
middle part (see districts of Veľký Krtíš, Rimavská Sobota
and Revúca), where is very low number of projects (see
also [15]) and contracted amount.
Figure 5 Linear regression of absorption level (in EUR) of
funds of HU-SK CBC Programme 2007-2013 in Slovak
direct cross-border districts
Source: own preparation
(Abbreviations : SC-Senec, DS-Dunajská Streda, KN-Komárno, NZ-Nové Zámky, LV-Levice, VK-Veľký Krtíš, LC-Lučenec, RS-Rimavská Sobota,
RA-Revúca, RV-Rožňava, KS-Košice-surroundings, TV-Trebišov)
0
10000
20000
30000
40000
Bratislava Trnava
Nitra Banska Bystrica
Košice
y = -64077x + 5E+06
R² = 0,0026
0 2000000 4000000 6000000 8000000
10000000 12000000 14000000 16000000
SC DS KN NZ LV VK LC RS RA RV KS TV
Contracted amount- projects under
development
County
Contracted amount in
EUR
(according to the seat
of lead
partners)
Contracted
sum in EUR (detailed
data for
project
partners)
Inhabitants
Sum per
capita
in EUR
Bratislava 8 223 653 9 325 181 485 469 23
Trnava 9 149 633 12 240 882 403 356 109
Nitra 22 133 406 21 884 765 647 061 196
Banská
Bystrica 19 366 908 16 343 568 583 521 238
Košice 29 096 707 34 158 075 771 186 279
SUM SK
eligible area
87 970 308 93 952 471 2 890 593
Comparative European Research CER 2016 (issue I.)
54

The calculation per capita is more precise: the second trend
line (Figure 6) shows that contracted amounts in districts
per inhabitants living in district and gives a R=-0,353
value, in favor of Eastern Slovakia: which counts that in
Eastern Slovakia there were contracted in average much
bigger amounts per projects in comparison with western
part of border area.
Figure 6 Linear regression of absorption level per capita
(in EUR) in direct Slovak cross-border districts
Source: own preparation
Finally, the goal is to reach supporting links between urban
and rural areas and by establishment and development of
cross-border co-operation, primarily on the following
priority areas as innovation, environment, accessibility,
sustainable urban development.
However, the trend of absorption is rather characteristic of
behavior so basically a qualitative indicator, it can be
deducted by the most common topics and popular success
stories, or sustainable development and long-term project
possibility.
Looking at the priorities of the calls in Cross-border
Cooperation programme Hungary-Slovakia 2007-2013
was focused primary on “Economy and society” and it is
planned to aim at actually promoting cooperation
initiatives contributing to an integrated development these
areas. Second major priority in this programming period
was aiming to support environment, nature protection and
accessibility incorporates interventions aimed at improving
the physical conditions of cross-border co-operation,
primarily in the fields of transport and communication, as
well as interventions to improve the natural
environment.[16] Taking into consideration applicant’s
legal status this calls are not specifically designed for
SMEs. There is a new legal status from 2008 the European
Grouping of Territorial Cooperation. [17]
Every country is economically and regionally diverse and
unique in Central Europe; also the employment rate differs
even if they are neighboring, so absorption rate is usually
higher in those which are less developed. [18]
4. Impacts of CBC HU SK Projects and Discussion
The subject of this part is to summarize the previous facts
about macroeconomic measures, correlation and
convergence and analyse contracted project numbers,
success rate, density and appearance and type of project.
Measuring convergence between regions where projects
were realised: We found out that the correlation in the
western and eastern part of Slovakia is higher in terms of
CBC HU SK.
Measuring with success ratio of project by number of
requested and approved projects divided, in percentages:
Here we found the number of highest amount was Trnava
and Nitra county with the districts of Dunajská Streda and
Komárno.
The support under INTERREG V-A Slovakia-Hungary
2014-2020 CBC Programme will be directed towards the
protection and improvement of the environment, building
transport infrastructure (i.e. cross-border roads and
bridges), strengthening of cross-border mobility, use of the
river for freight and passenger transport and the
construction of modern transport network of border
regions. There is growing need of regional development,
creation of jobs, workmarket, information people to people
cooperation across borders and infrastructure. [19]
Generally, the impact cross border territory might be the
highest, as geographically those regions are the furthest
located from the capitals as Bratislava, Budapest. [20]
The new trends of 2014-2020 in the programming periods
according to Strategic Framework of supports the fields
such as environmental innovation, infrastructure,
economic growth, development of human capital,
sustainable and effective usage of nature sources, modern
and professional public administration. [21]
Although, it seems that available performance information
is incorporated fairly well, measurement and effective
usage as well as sustainable development and continuity
are sometimes missing in long term plans. Considering the
existing social and economic relationships of Southern
Slovakia the key to the social and economic renewal of the
subject region are the small- and middle enterprises. [22]
Regional development, project evaluation activities along
with the objectives and activities, priorities and programs
of CBC HU-SK could be more effective in the next or
current period. There is a future expectation that
Hungarian-Slovak Border Strategy will be reducing
isolation and expanding synergy through improved
information change between actors, access to cross-border
transport and communication networks and service by
cycle-path and other infrastructural road enhances
cooperation of various offices, public institution
environmental, nature protection, promoting sustainable
and quality employment. [23]
5. Conclusions
Summing up, the main goal of this article was to discover
how the cross border projects correlate to the regional
growth of Slovakia.
We can partially reject the hypothesis according to which
the CBC HU SK specifically creates economic and
regional growth for Slovakia. Statistically, this cannot be
observed, yet. This does not mean that the programme is
not useful, just the opposite, it creates added value in
networking, international cooperation and common use of
the tools of EU.
y = 5,6955x
R² = -0,353
0
20
40
60
80
100
120
140
160
SC DS KN NZ LV VK LC RS RA RV KS TV
Amounts of CBC HUSK
grants counted per …
Comparative European Research CER 2016 (issue I.)
55

In order to analyse the effectiveness of projects it is
important to see the previous and current status, also
analyse the economic indicators long-term. The numbers
of projects in programming period 2007-2013 - in
comparison with previous programmes - was relatively
high and also amount of approved support, but it will be
taken into the consideration that, the overall allocation for
CBC HU SK programmes (and generally for all CBC
programmes) is very small in comparison with available
sources for “national programmes” founded by EU.[24]
It can be concluded that measuring the effectiveness of
economic indicators remains sometimes just an objective
evaluation given that the macroeconomic indicators does
not show any relevant grow, yet. However, budgeting in
new period of 2014-2020 for regions offers interesting
insights in the way this kind of distribution of allocation is
practiced in EU funds located in cross border regions.
Regions of Northern Hungary and South Slovakia are very
different as it was showed in cohesion policy analysis they
differ within countries (Bratislava, Komárno), both the
priorities and stages of development are facing new
development.
Changes in priorities for 2014-2020 as Integrated
Territorial Cooperation will be more effective and he
cross-border programs with improvement of concentration
principle (reduction of number of priorities) and with
respect to the creation of synergy or strengthening of a
tangible result are places of social innovation, networking
and soft development. [25] They should show a best
practice for central regions as Bratislava and Budapest and
prove that peripheries can also be successful by developing
collaboration, capacity building and joint use of
infrastructure as the common cycle roads. This can be
achieved by planning common projects in economic
development the best practice remains in sharing in
particular in sectors such as traffic, events, health, culture,
tourism and education.
References
[1] European Comisson, Building Across Europe. Portal
of CoR. Available online at: < https://portal.cor.europa.e
u/egtc/about/Pages/What%20is%20the%20EGTC.aspx>
[2] European Comission, Territorial Cohesion. Available
onlinehttp://ec.europa.eu/regional_policy/en/policy/what/te
rritorial-cohesion
[3] Pawera, R- Šmehýlová, Z, Trend in absorption of EU
funds. Case of Slovakia. CER Comparative European
Research Conference, CER, pp. 55-59, Sciemcee, October,
2015
[4] European Commission, EUROPE 2020 Strategy, A
strategy for smart, sustainable and inclusive growth.
[5] Hagett, P, Geography. Global Synthesis. Typotex.
Budapest : Typotext, 2006
[6] Dimitrovova, B., Re-making of Europe’s Borders
through the European Neighbourhood Policy’, Journal for
Borderlands Studies, 2008
[7] Houtum, van H, The development of cross-border
economic relations. Dissertation Series, 40. Centre for
Economic Research, Tilburg University, The Netherlands,
1998
[8] Leimgruber, W. Boundaries and transborder relations,
or the hole in the prison wall: On the necessity of
superfluous limits and boundaries. In: GeoJournal 2005.
64. pp. 239–248., 2005
[9] Kovács, A. , A határok és a határgazdaságtan néhány
elméleti vonatkozása. In: Cégek célkeresztben.
Vállakozások a szlovák-magyar határmentén.,2010
[10] Mezei et al: Relations of Local and Regional
Governments along the Hungarian and Slovak Border.
Available at online: http://mek.oszk.hu/08700/08744/0874
4.pdf
[11] Korec P., Regionálny rozvoj Slovenska v rokoch
1989—2004.;Regional development in Slovakia in
1989/2004] Bratislava, Geografika.2005
[12] Lelkes G.,Dél-Szlovákia fejlődési irányai — Térségi
adottságok. In Dél-Szlovákia. Budapest—Pécs, Magyar
Tudományos Akadémia—Regionális Kutatások
Központja,465—479. p.,2004
[13] Domonkos. L, Cross Border Cooperation
Projects’impact on enterprises in Southern Slovakia
Horizonty II , Comenius University: Bratislava. 2015
[14] CBC HU SK.2013. Financed Programmes of CBC
HU SK. http://www.husk-cbc.eu/en/financed_projects
[15] Hakszer, R., Cross border cooperation projects in the
Hungarian Slovak border area. Acta Universitatis
Palackianae Olomucensis – Geographica, Vol. 44, No. 2,
2013, pp. 93-109
[16] Bott Domonkos, L. Project of Cross Border
Cooperation of EU and their impact on the business
environment and the region in Southern Slovakia
Bratislava, Faculty of Mamagement, Comenius University
UK, Slovakia, 2014
[17] Domonkos, L. Economic growth of cross border
regions in Slovakia In : Súčasné trendy a problémy v
manažmente, Univerzita Komenského v Bratislave,
Fakulta managementu: Bratislava, Slovakia, 2016
[18] Evaluation report of the Hungarian Government
2015. Available at http://www.palyazat.gov.hu/ertekelesek
[19] SK HU.EU. What is Interreg.: Availible online at : <
http://www.skhu.eu/programme/what-is-interreg>
[20] Mezei, I. (2010): Urban Development in Slovakia.
CRR of the HAS, Pécs – Forum Minority Research
Institute Šamorín.
[21] Domonkos, L.- Pawera, R., Trendy v cezhraničnej
spolupráci 2014-2020 In : Súčasné trendy a problémy v
manažmente, Univerzita Komenského v Bratislave,
Fakulta managementu: Bratislava, Slovakia, 2013
[22] Lelkes, G, Régiók és gazdaság, Fórum Institute,
Slovakia, 2008
[23] Programme Guide of CBC HU-SK– programming
document and results of implementation is available at:
http://www.husk-cbc.eu/uploads/editors/SKHU%20
OP%20english%20version%202014%2011%2028.pdf
[24] Hakszer, R., Regional Development with emphasis on
CBC HU SK projects Dissertation Thesis. Budapest.
ELTE, 2016
[25] Hakszer, R., Local development by using of EU
founds in the Hungarian-Slovakian border region. Young
regionalists VIII., Győr. 19-22., July, 2013, 2013
Comparative European Research CER 2016 (issue I.)
56

VERIFICATION OF THE THEORY OF PERMANENT INCOME IN CZECH REPUBLIC AND DISTRIBUTION
OF TOTAL SAVINGS OF CZECH HOUSEHOLDS
Michal Bock - Jaromír Tichý
Faculty of Economic Studies
University of Finance and Administration
Estonská 500
Prague 10, 101 00, Czech Republic
(+420) 210 088 800
[email protected] - [email protected]
Abstract: The paper deals with the verification of the theory of permanent income in the Czech Republic during the recession,
and this work also deals with the distribution of savings of Czech households in individual instruments. The aim of this paper
is to confirm or disprove the hypothesis that during the recession Czech households withdraw savings to cover the loss or
reduction of their íncome. Another hypothesis, which is discussed in this paper, is the correlation between the development of
overnight deposits of households and GDP development. This hypothesis was disproved by means of Pearson correlation in
this paper, it was found that these two variables do not correlate directly. The final goal of this paper is to split the total
savings of Czech households into individual instruments.
Keywords: overnight deposits, correlation, savings, income, GDP development
1. Introduction
Permanent income can be defined as income that is more
or less constant and is consumed at the time. From this
income a stable consumption is derived. This paper deals
with the confirmation of this theory in the Czech Republic
for the medium-term period 2008-2013, with emphasis on
the years 2009, 2012 and 2013, when the Czech economy
was in recession. The paper should answer the basic
question of whether households behave according to this
theory, or conversely generate more savings because of
future economic uncertainty. In particular short-term
savings (overnight deposits), which are characterized as
very liquid, and if necessary they can be immediately
withdrawn, are solved.
This paper aims to prove or disprove the following
hypotheses:
1. During the recession of the Czech economy household
withdraw savings to cover the loss or reduction of
their income.
2. There is no direct correlation between the
development of overnight deposits of households and
GDP development.
Another aim of the article is to determine overall savings
of Czech households in the individual instruments.
2. Permanent income theory
This theory was first formulated in 1957 by economist
Milton Friedman, who split income into two components:
permanent income, which is income that households
expect in the course of their economic life, and then
temporary (transient) income, which deviates from the
permanent [1]. This includes mainly disposable income
(inheritance, insurance payment, etc.). Households use
savings and borrowings to smooth out their consumption
as a result of temporary changes in their income.
Permanent income theory says that in the latter stages of
the economic life the household consumes resources
(assets) generated in the active economic life.
3. Development of short-term household savings in the
Czech Republic for the period 2008-2013
In this section the development of short-term household
savings (overnight deposits) for that period is analyzed,
which was chosen because it captures the beginning and
end of recession in the Czech Republic. Also because it is
medium-term, so there is a higher predictive value of
conclusions.
On this development of short-term household savings the
hypothesis that households behave according to the theory
of permanent income, i.e. during the recession consume
their savings, is confirmed or disproved. In Table 1. steady
growth in overnight deposits by households for all quarters
of the selected period 2008-2013 is noticeable.
Table 1 Development of overnight deposits of households
for 2008-2013 in quarters, in billions of crowns [2]
Year 1st quarter 2nd quarter 3rd quarter 4th quarter
2008 1 236,2 1 269,6 1 298,1 1 309,3
2009 1 332,8 1 369,4 1 370,9 1 418,3
2010 1 452,3 1 546,3 1 626,1 1 664,2
2011 1 665,9 1 679,5 1 694,5 1 723,1
2012 1 783,8 1 988,0 2 037,1 2 050,1
2013 2 050,3 2 050,6 2 051,0 2 051,2
Table 2 GDP development in the Czech Republic, 2008-
2013 [3]
Year GDP development in %
2008 3,1
2009 -4,5
2010 2,5
2011 1,8
2012 -1,0
2013 -0,9
Comparative European Research CER 2016 (issue I.)
57

Table 3 GDP development in the Czech Republic and the
annual change in the volume of overnight deposits of
households [3]
Year GDP/decrease in % Annual change of in deposits in %
2009 -4,5 8,3
2012 -1,0 10,4
2013 -0,9 7,8
The table 3 shows that in that period, when the economy
was in recession, households increased volumes of
overnight deposits annually, which disproves the theory of
permanent income, which states that at a time of recession,
households consume their savings because their incomes
are reduced. In 2009, the Czech economy was in the
deepest recession since 1997, and yet year households
were able to increase the volume of short-term savings of
8,32 % annually, which corresponds to an absolute 109
billion crowns. Annual increase was also recorded for the
years 2012 and 2013.
4. Determining of correlation between quantitative
variables of GDP and overnight deposits between 2008-
2013 in the Czech Republic
This chapter deals with correlation analysis. The
correlation analysis has the following parameters:
It is the Pearson correlation.
Correlation analysis assumes the probability level of
95 %, which is considered as adequate in economy.
The number of parameters: 5.
Table 4 Yearly change of overnight deposits of households
in % [2]
Year Change in overnight deposits of households in %
2009 8,32
2010 17,32
2011 3,54
2012 10,39
2013 7,77
From the data in Tables 2 and 4 the Pearson correlation in
Excel program (which has functions of statistics) was
calculated, and the correlation came out 0,878, indicating
that there is a linear (straight) relationship between GDP
development and annual change in overnight deposits by
households. The calculated figure 0,878, however
indicates the existence of indirect correlation relationship
between these two variables.
This is the Pearson correlation, which reflects the linear
relationship between the quantities. In this case, they are
quarterly changes in the volume of overnight deposits of
households and quarterly changes in GDP development.
Both quantities are in annual comparison for the relevant
period 2008-2013.
From Table 5 is indicated that deepest crisis was in 2009,
when GDP declined throughout all four quarters. In the
second quarter of 2009 the annual decline of GDP was
almost 5 %, which is a very big decline. In the years 2010-
2011, there was a growth of GDP, but in 2012-2013 the
annual GDP fell down again.
Table 5 Quarterly GDP development in 2008-2013
annually in % [4]
Year 1st quarter 2nd quarter 3rd quarter 4th quarter
2008 5,3 4,6 4,7 0,7
2009 -4,0 -4,9 -4,4 -3,2
2010 1,2 2,3 2,8 2,6
2011 2,8 2,2 1,2 0,6
2012 -0,7 -1,0 -1,5 -1,7
2013 -1,9 -1,2 -1,6 0,8
From Table 6 implies the annual growth of overnight
deposits of households on a quarterly periods in each
reference year. In annual comparison in the second, third
and fourth quarter of 2013 the lowest creation of overnight
deposits of households was recorded, which grew in this
period by an average of 0,04 %. The highest annual
increase of overnight deposits of households was in the
first quarter of 2008, the third quarter 2010 and third
quarter of 2012, when it grew annually by 20 %.
Table 6 Quarterly developments of overnight deposits in
2008-2013 annually in % [2]
Year 1st quarter 2nd quarter 3rd quarter 4th quarter
2008 19,41 14,46 14,42 8,81
2009 7,81 7,47 6,30 8,32
2010 8,97 13,33 17,84 17,33
2011 14,71 8,61 4,21 3,54
2012 7,01 18,37 20,22 18,98
2013 14,95 3,15 0,68 0,54
Based on the data in Tables 5 and 6 the Pearson correlation
was calculated in the program excel, which provides
statistical functions and correlation equaled 0,942, which
means that there is no linear (straight) relationship between
these two variables.
5. Allocation of savings of Czech households
The chapter addresses in detail the allocation of household
savings in the Czech Republic with an emphasis on
instruments/institutions where they are deposited. Czech
households make savings primarily from precautionary
reasons (to cover adverse life situations), but also to cover
future expenses associated with the period when they will
not be economically active. It is mainly for retirement.
Table 7 Status and distribution of savings in 2014, in
billions of crowns [5] [6] [7]
Investment instrument Value
Bank deposits 2 000
Deposit in building savings 450
Life Insurance 350
Mutual funds 350
Pension funds 450
Total 3 600
The table 7 shows that the largest part of the savings in the
Czech Republic is stored in bank deposits (term, demand
deposits). So in deposits, where deposit insurance up to a
certain amount by the Deposit Insurance Fund is
guaranteed. Deposits in building savings are thanks to
Comparative European Research CER 2016 (issue I.)
58

government support also very popular way to store
savings. The volume of these instruments makes up to
68 % of total savings, thus represent a significant role. The
reason for this distribution of savings is likely guarantee of
return, safety and state allowance for building savings.
Life insurance functions primarily as a mean of securing in
case of negative life events aimed at disbursement. Life
insurance apart from the insurance component includes an
investment (or equity) component, where means get
evaluated based to the development of the underlying
asset, which could be any asset. Mutual funds are more
risky, and therefore the volume of savings in them is
relatively small, since it is non-guaranteed investment,
which is influenced by many technical and fundamental
parameters of the capital market. Pension funds represent
in this case so called transformed funds offering
guaranteed, non-negative evaluation and allow tax
deductions. These funds can no longer be entered, so the
premise for the future is that the volume of resources in
these funds will decline because of client’s withdrawals.
5. Conclusions
The aim of the article was to confirm or disprove the
following hypotheses:
1. During the recession of the Czech economy
households withdraw savings to cover the loss or
reduction of their income.
2. There is no direct correlation between the
development of overnight deposits of households and
GDP development.
Another aim of the paper was to determine the distribution
of total savings of Czech households in individual
instruments.
The first hypothesis is refuted by analysis of the volume of
overnight deposits of households during the periods of
recession, when households in the recession conversely
generate much higher volumes of deposits, probably
because of adverse future economic expectations (negative
sentiment of Czech households).
The second hypothesis is confirmed by the correlation
calculation, the result was clear, that there is no direct
correlation between these two variables. However, the
calculation showed an indirect relationship.
Another aim, namely the distribution of total household
savings have been accomplished.
Acknowledgements
Paper in specific research was supported by the Internal
Grant Agency of the University of Finance and
Administration, Faculty of Economic Studies.
References
[1] DORNBUSCH, Rudiger a Stanley FISCHER.
Makroekonomie. 1. vyd. Praha: SPN, 1994. 277 s.
Odborná literatura pro učitele a veřejnost. ISBN 80-04-
25556-6.
[2] ČNB: Česká národní banka. Statistika: Publikace
měnové statistiky (pdf) – rok 2013. [online]. [cit. 2015-11-
01]. Copyright © Česká národní banka, 2003-2016.
Available at: https://www.cnb.cz/cs/statistika/menova_
bankovni_stat/menova_stat_publ/2013/.
[3] Finance.cz. Makrodata a EU: HDP: Statistiky: Vývoj
hrubého domácího produktu. [online]. [cit. 2016-01-12].
Finance media a.s. Available at: http://www.finance
.cz/makrodata-eu/hdp/statistiky/vyvoj-hdp/.
[4] Český statistický úřad: HDP, národní účty [online].
[cit. 2015-12-07]. Aktualizováno dne: 21.01.2015.
Available at: https://www.czso.cz/csu/czso/hdp_narodni_u
cty.
[5] AČSS: Asociace českých stavebních spořitelen. Grafy
stavebního spoření. [online]. [cit. 2016-01-16]. © 2014
AČSS. Available at: http://www.acss.cz/cz/novinari-a-
odbornici/grafy-stavebniho-sporeni/.
[6] AKAT: ČR. Asociace pro kapitálový trh České
Republiky. Výroční zpráva 2014/2015. [online]. [cit. 2016-
01-16]. (c) 2016 - All rights reserved – AKAT: ČR.
Available at: http://www.akatcr.cz/public/vypisUniversal.
do;jsessionid=864E4382D66FEE4C9C1CBA6EA82A56F
D?typZpravy=6.
[7] ČAP: Česká asociace pojišťoven: Statistické údaje:
Vývoj pojistného trhu 2014. [online]. [cit. 2016-01-16]. ©
ČAP 2014. Available at: http://www.cap.cz/statisticke-
udaje/vyvoj-pojistneho-trhu.
Comparative European Research CER 2016 (issue I.)
59

ANALYSIS OF THE ENERGY SECTOR IN POLAND ON THE EXAMPLE OF ENERGY INDUSTRY
COMPANIES QUOTED ON THE STOCK EXCHANGE
Rafał Parvi
WSB University in Wroclaw, Faculty of Economics in Opole
Fabryczna 29-31
53-609 Wroclaw, Poland
+48601536917
Abstract: This paper examines share price of the companies listed on the WIG-ENERGIA and their fair value between 2010-
2016. Data from 2010 to 2016 were collected from the Stooq.pl (Polish portal of shares). Two hypotheses are tested: (1) value
of the shares based on the market price; (2) value of the shares as the fair value of shares. The energy market was analysed
and characterised, also the companies participating in it were described. Nevertheless, the market value of shares does not
reflect the fair value of the shares which is currently assigned to different companies in the sector. The research analysed the
key financial ratios, the actual value of shares; also the fair value of the energy sector companies listed on the Warsaw Stock
Exchange was calculated.
Keywords: power engineering, fair value of shares, company, market value of shares.
1. Introduction
The energy security is a strategic issue for every country.
For every country, the generation and transmission of
electricity is the economic lifeblood, which in addition to
the transport system, determines efficient functioning of
the economy, and even makes a country independent from
other countries and economies.
The economic development of the country is dependent on
the access to energy. It is predicted that until 2040, the
global economy will be growing at an average rate of 2.8%
per year. Taking into account the predicted steady increase
of efficiency in the energy production, the increase of the
global energy sector will be 1.1% per year. It is anticipated
that the importance of conventional sources (energy from
coal and oil – the expected increase of 0.4% per year) will
be decreasing, with the concurrent increase of participation
of the renewable sources (solar, wind and geothermal
energy – the increase of 7.4% per year). The development
of the renewable energy should contribute to the
achievement of its share of approx. 20% in the energy
production in 2040.
2. Fair value of listed companies
Share price of the companies listed on the Stock Exchange
should reflect also their fair value. The fair value can be
defined in several ways. In view of the foregoing, the fair
value is a value used repeatedly in accounting, and thus in
Article 28 (6) of the Accounting Act of 29.09.1994 as "the
amount for which a given asset component could be
exchanged, and the liability could be paid on market
transaction terms between interested and well-informed,
unrelated parties.
In view of whether the price of shares that are quoted on
the stock exchange corresponds to their fair value, should
be found in the value alone, since, after all, the values may
be diverse, like the value of a similar company, producing
similar goods and operating in the same industry, will also
be diverse for various reasons.
The subject of trade covers minority shares, and the main
market participants are retail investors or minority
institutional investors, thus the price of shares should
reflect the fair value characterizing the liquid minority
interest. The value presented in this way seems righteous, which is
confirmed by the premium paid by the investors who
announce calls for subscription for shares and plan in this
way the purchase of the controlling interest. Then the
premium reflects the difference between the level of liquid
minority interest and the level of controlling interest.
Sometimes the level takes into account benefits resulting
from synergy. An investor purchasing the controlling
interest in this way receives premiums that appear after
taking over control of a company, in the form of funds,
business management and making a number of strategic
decisions.
The fair value of the share price should be determined in
accordance with the idea of capital market, namely the
market participants should have equal access to data,
information and all messages concerning a given company
[10, 11]. However, the investors are divided into three
groups:
a) People with access to the most closely guarded
information that affects the price and the business
value, namely those can the company’s management
board or shareholders,
b) Institutional investors with blocks of shares with
simultaneous access to the company's management
board,
c) Individual investors who have access to public
information.
There is one premise more to determine the fair value of
share price. The investors are fond of investing in shares,
namely they buy them as in the past they managed to earn
on them and they feel that presently the share price is ideal
and reflects their fair value and will enable them to obtain
fair dividend in the future [1, 3].
Comparative European Research CER 2016 (issue I.)
60

Such a purchase or sale of shares can largely overestimate
or underestimate the share value of a quoted company.
Here the chemical industry may serve as an example,
namely shares in chemical companies at the beginning of
the new millennium, when shares in these companies were
being purchased without any analysis in technical terms,
but looking at their name and value, which was increasing
overnight. In view of the foregoing, this led to excessively
high business value above its fair value.
The share price should thus reflect the fair value of a
company listed on the Warsaw Stock Exchange. For the
value of these companies be fair, the market must make
available to all investors information regarding companies
listed on the Warsaw Stock Exchange. The shareholders
should be treated equally; therefore we cannot distinguish
majority shareholders as those who should have
information unavailable for minority shareholders. First of
all, shares should be liquid securities, therefore they should
be in free float and have real-time transferability, namely
at any moment and at any time during the office hours of
the Warsaw Stock Exchange on a business day.
3. The development of the energy market in Poland
The WIG-ENERGIA index, presented in Figure 1, shows
that from 2011 to 03.2016, the energy sector companies in
Poland showed a lateral trend in their values.
Figure 1: WIG-ENERGY in the period from 01.2010 to
03.2016 [12].
However, from the first quarter of 2016, a significant
upward trend as well as the achievement of the highest
levels, up to the level of 3121 points in the index. The
values reported on 18.03.2016 reflect the upward trend and
confirm it. However, the market values do not reflect the
fair value of the energy sector companies.
4. Analysis and valuation of the energy sector’s
companies quoted on the Warsaw Stock Exchange
(WSE) in Poland
In the energy sector, it is possible to record one company,
the value of which approached to its next to the maximum
price on 18.03.2016, and this is TAURONPE. The
remaining companies did not have its maximum or even
fair value, though they can show the net profit and good
financial condition, and it is INTERAOLT. Some
companies were overvalued by even 75%. These
companies are ZEPAK, CEZ, PEP and ENEA. However,
the flagship companies, such as ENERGA and
KOGENERA, stay ahead (Table 1-2).
Table 1 The Energy sector’s companies quoted on the
Warsaw Stock Exchange in Poland as of 18.03.2016 (own
development based on the data of the Warsaw Stock
Exchange)
Name Average rating rating
CEZ 3.5/5.0 BBB-
ENEA 3.5/5.0 AA+
ENERGA 4.0/5.0 BBB
INTERAOLT 4.0/5.0 AA
KOGENERA 4.0/5.0 BBB+
PEP 4.0/5.0 BB-
PGE 3.5/5.0 BBB-
TAURONPE 3.5/5.0 CCC
ZEPAK 4.0/5.0 BB
Table 2 The Energy sector’s companies quoted on the
Warsaw Stock Exchange in Poland as of 18.03.2016 (own
development based on the data of the Warsaw Stock
Exchange)
Name Current
price PLN
Maximum price PLN
from the beginning of the stock exchange quotation
CEZ 65.60 134.5
ENEA 12.22 20.78
ENERGA 12.22 23.58
INTERAOLT 18.75 24.31
KOGENERA 75.00 101.60
PEP 21.00 40.66
PGE 14.26 20.94
TAURONPE 3.03 5.44
ZEPAK 7.44 29.03
Table 3-4 presents the key ratios that show the financial
condition of the energy sector’s companies. Within the
nine examined companies, the generated profit per share
was reported in 8 companies. It shows that the energy
companies prosper properly on the financial market and
are able to record higher or lower profits. However, the
profit was not reported in one companies, and he was
TAURONPE.
The price to the operating earnings shows the losses of the
company at the negative, and this state of affairs was
reported in two stock exchange quoted company, and they
were PGE and TAURONPE. CEZ and PEP generated a
positive ratio, and the other companies, KOGENERA,
ENEA, and ENERGA generated a positive one-digit ratio
but it is a satisfactory result [6].
In contrast, analysing P/BV and P/P, it should be noted
that both the price to the book value and the price to profit
demonstrate that three companies operate exemplary on
the market and have a value of about 1.0, and these are:
INTERAOLT, CEZ and KOGENERA [4, 5, 7].
Other companies do not significantly differ from the
average values, and these are ZEPAK, ENERGA.
Comparative European Research CER 2016 (issue I.)
61

Table 3 Technical evaluation of the Energy sector’s
companies quoted on the Warsaw Stock Exchange in
Poland as of 18.03.2016 (own development based on the
financial data of the of the Warsaw Stock Exchange)
Name P/OE (price/
operating
earnings)
P/BV (price/ book value)
CEZ 7.72 0.82
ENEA 4.31 0.42
ENERGA 3.95 0.57
INTERAOLT 5.25 3.52
KOGENERA 6.61 0.82
PEP 7.19 0.68
PGE -7.43 0.66
TAURONPE -2.79 0.33
ZEPAK 4.61 0.10
Table 4 Technical evaluation of the Energy sector’s
companies quoted on the Warsaw Stock Exchange in
Poland as of 31.12.2015 (own development based on the
financial data of the Warsaw Stock Exchange)
Name P/P
(price/ profit)
Profit per share
CEZ 1.09 (CZK) 7.578
ENEA 0.55 0.952
ENERGA 0.27 0.328
INTERAOLT 0.48 0.266
KOGENERA 1.15 3.349
PEP 0.34 0.368
PGE 0.93 0.532
TAURONPE 0.29 -1.646
ZEPAK 0.13 0.120
Table 5-6 presents the studies concerning, among others,
the net profit, depreciation, EBITDA and assets of the
telecommunication sector's companies [8, 9].
According to the obtained values, it is clear that only
TAURONPE showed a loss, which was confirmed by the
previous ratios included in Table 2.
Table 5 Technical evaluation of the Energy sector’s
companies quoted on the Warsaw Stock Exchange in
Poland as of 31.12.2015 (own development based on the
financial data of the Warsaw Stock Exchange)
Name Net profit (net loss)
in thousands PLN
Depreciation in
thousands PLN
CEZ (CZK) 4077000 (CZK) 8008000
ENEA 420179 188337
ENERGA 136004 237808
INTERAOLT 5325 619
KOGENERA 49907 33665
PEP 16721 21615
PGE 994000 741000
TAURONPE -2883958 517983
ZEPAK 6076 90921
Other companies have shown a substantial profit which
was generated in 2015.
Table 6 Technical evaluation of the Energy sector’s
companies quoted on the Warsaw Stock Exchange in
Poland as of 31.12.2015 (own development based on the
financial data of the companies quoted on the Warsaw
Stock Exchange in Poland)
Name EBITDA in
thousands PLN
Assets in thousands
PLN
CEZ (CZK) 12346000 (CZK) 602686000
ENEA 711101 21462175
ENERGA 481011 18456000
INTERAOLT 7083 67685
KOGENERA 99895 2256509
PEP 52594 3014486
PGE 2014000 61296000
TAURONPE -2915418 32071433
ZEPAK 111119 6820538
According to the book value per share, it is possible to
deduce that some companies are overvalued, and these are
ENEA, ENERGA, KOGENERA, PEP, PGE and ZEPAK,
and in the case of the INTERAOLT company, undervalued
(Table 7).
Table 7 The Energy sector’s companies quoted on the
Warsaw Stock Exchange in Poland as of 31.12.2015 (own
development based on the data of the Warsaw Stock
Exchange)
However, it is important not to follow this opinion because
the values are only the book values, and the calculation of
them is purely mathematical and financial.
In the case of using the economic attitude and
interpretation, it would occur that the companies do not
have the fair value [2, 11].
The profitability of the equity as well as the profitability of
assets is shown only by CEZ, ENEA, ENERGA,
INTERAOLT, KOGENERA, PGE, ZEPAK however, PEP
and TAURONPE do not have it.
Therefore, according to the presented study, it is possible
to observe that the flagship energy concerns have the
profitability and they are not threatened by any disturbance
of the financial liquidity (Table 8).
Name Book value per share in PLN
CEZ (CZK) 497.952
ENEA 28.650
ENERGA 21.180
INTERAOLT 1.250
KOGENERA 91.739
PEP 30.567
PGE 21.565
TAURONPE 9.140
ZEPAK 74.431
Comparative European Research CER 2016 (issue I.)
62

Table 8 The Energy sector’s companies quoted on the
Warsaw Stock Exchange in Poland as of 31.12.2015 (own
development based on the data of the Warsaw Stock
Exchange)
Currently, the value of companies significantly deviates
from the maximum value achieved a few years ago. The
only one exception is INTERAOLT, which achieved the
maximum value in its history. Other companies have the
value less than 50%, and even 75% of the maximum one
(Table 9).
Table 9 The Energy sector’s companies quoted on the
Warsaw Stock Exchange in Poland as of 18.03.2016 (own
development based on the data of the Warsaw Stock
Exchange)
Name Current value Maximum value
CEZ 65.60 134.5
ENEA 12.22 20.78
ENERGA 12.22 23.58
INTERAOLT 18.75 24.31
KOGENERA 75.00 101.60
PEP 21.00 40.66
PGE 14.26 20.94
TAURONPE 3.03 5.44
ZEPAK 7.44 29.03
However, the fair value which should be reflected by the
share prices of the examined companies significantly
differs from the calculated value, which was presented in
Table 10. In some cases, it is even 25% of the current
value. The fair value is considerable higher than the
current value of the examined companies, and only similar
in one company, ZEPAK.
Table 10 The Energy sector’s companies quoted on the
Warsaw Stock Exchange in Poland as of 09.03.2015 (own
development based on the data of the Warsaw Stock
Exchange)
Name Fair value Deviation from the fair
value in PLN
CEZ 88.25 46.25
ENEA 20.00 7.78
ENERGA 21.00 8.78
INTERAOLT 22.00 3.25
KOGENERA 95.52 20.52
PEP 35.00 14.00
PGE 18.55 4.29
TAURONPE 4.50 1.47
ZEPAK 17.64 10.20
5. Conclusion
The share price of the energy sector companies quoted on
the Warsaw Stock Exchange in Poland is similar to the fair
value because there is a high demand for energy in the
world. Though, energy companies demonstrate a profit and
the fair value at the same time because the energy market
in Poland is developing very well, and even promising
bigger development for the future years. In some European
Union countries, the development of the energy market is
faster because these countries have access, in larger
quantities, to the resources, such as oil or natural gas
which means that they do not have to import significant
amounts outside its borders.
The fair value of all the energy sector companies quoted
on the Warsaw Stock Exchange in Poland should be
achieved within one year, by 2017, because the energy
sector is developing very rapidly.
References
[1] Borowski K., „Wyznaczanie punktów zwrotnych
indeksu Wig przy pomocy wybranych metod analizy
czasowej”. Bossa.pl, pp. 1-5.
[2] Jajuga K., Jajuga T. „Inwestycje". Wydawnictwo
Naukowe PWN, Warszawa 1996, pp. 34-57.
[3] Jędrzejczak M., „Estymacja wartości godziwej.
Podejście symulacyjne”, Powszechne Wydawnictwo
Ekonomiczne, Warszawa 2011, pp. 133-138.
[4] Parvi R., “Share price of the companies listed on the
WIG-UKRAINE and their fair value”, Share price of the
companies listed on the WIG-UKRAINE and their fair
value”, Itall Ltd., 2014, pp. 179-185.
[5] Parvi R., “Investment funds and their financial
effectiveness”, Goce Delchev University Macedonia &
THOMSON Ltd. Slovakia, EDIS - Publishing Institution
of the University of Zilina, 2014, pp. 262-267.
[6] Parvi R., “Share price of companies listed on WIG20
and their fair value”. EDIS - Publishing Institution of the
University of Zilina EIIC – 3 rd Electronic International
Interdisciplinary Conference 2014, pp. 169-177.
[7] Parvi R., “Valuation of shares and their fair value of
the companies listed on the WIG30 quoted on the Warsaw
Stock Exchange in Poland within 2005-2015”, Czech
Technical University in Prague. Czech Institute of
Academic Education z.s. 2015. pp. 177-184.
[8] Pastusiak R., “Przedsiębiorstwo na rynku
kapitałowym”. Wydawnictwo CeDeWu, Warszawa 2010,
pp. 34-46.
[9] Pierce R., “Stocks, Options & Spreads, Infinity
Publishing” 2004, pp. 110-115.
[10] Thompson B., “Stock Market Superstar”, Insomniac
Press 2008, pp. 52-54.
[11] Veale S., “Stocks, Bonds, Options, Futures”, Prentice
Hall Press 2001, pp. 88-125.
[12] Stooq.pl, “WIG-ENERGIA”,
stooq.pl/q/?s=wig_chemia, accessed: March 18th
, 2016.
Name ROE ROA
CEZ 10.17 3.85
ENEA 7.77 6.83
ENERGA 10.54 5.49
INTERAOLT 42.47 14.55
KOGENERA 15.46 11.07
PEP -2.56 -1.72
PGE 17.35 15.92
TAURONPE -18.75 -12.16
ZEPAK 8.56 6.96
Comparative European Research CER 2016 (issue I.)
63

VALUATION OF SHARES AND THEIR FAIR VALUR OF THE COMPANIES LISTED ON THE RAW
MATERIALS SECTOR QUOTED ON THE WARSAW STOCK EXCHANGE IN POLAND WITHIN 2011-2016 AND
THEIR FAIR VALUE
Rafał Parvi
WSB University in Wroclaw, Faculty of Economics in Opole
Fabryczna 29-31
53-609 Wroclaw, Poland
+48601536917
Abstract: This paper examines share price of the companies listed on the WIG-SUROWCE and their fair value between 2011-
2016. Data from 2011 to 2016 were collected from the Stooq.pl (Polish portal of shares). Two hypotheses are tested: (1) value
of the shares based on the market price; (2) value of the shares as the fair value of shares.
Keywords: raw materials, fair value of shares, company, market value of shares.
1. Introduction
The intensive development of the raw materials extraction
in Poland has occurred especially since the mid '50s of the
last century and has been continuing for the '60s and '70s.
Since the '80s, in the case of many raw materials, the
limitation of their exploitation, and in some other cases,
the abandonment of extraction, have been reported,
whether for economic reasons or due to the depletion of
resources, and finally because of the environmental or
spatial conflict. The economic transformation towards the
market system, started in 1989, significantly contributed to
these phenomena. Currently, since 2000, the large growth
of the raw materials market has taken place [2, 3].
2. Fair value of listed companies
Share price of the companies listed on the Stock Exchange
should reflect also their fair value. The fair value can be
defined in several ways. In view of the foregoing, the fair
value is a value used repeatedly in accounting, and thus in
Article 28 (6) of the Accounting Act of 29.09.1994 as "the
amount for which a given asset component could be
exchanged, and the liability could be paid on market
transaction terms between interested and well-informed,
unrelated parties.
In view of whether the price of shares that are quoted on
the stock exchange corresponds to their fair value, should
be found in the value alone, since, after all, the values may
be diverse, like the value of a similar company, producing
similar goods and operating in the same industry, will also
be diverse for various reasons.
The subject of trade covers minority shares, and the main
market participants are retail investors or minority
institutional investors, thus the price of shares should
reflect the fair value characterizing the liquid minority
interest. The value presented in this way seems righteous, which is
confirmed by the premium paid by the investors who
announce calls for subscription for shares and plan in this
way the purchase of the controlling interest. Then the
premium reflects the difference between the level of liquid
minority interest and the level of controlling interest.
Sometimes the level takes into account benefits resulting
from synergy. An investor purchasing the controlling
interest in this way receives premiums that appear after
taking over control of a company, in the form of funds,
business management and making a number of strategic
decisions.
The fair value of the share price should be determined in
accordance with the idea of capital market, namely the
market participants should have equal access to data,
information and all messages concerning a given company
[10, 11]. However, the investors are divided into three
groups:
a) People with access to the most closely guarded
information that affects the price and the business
value, namely those can the company’s management
board or shareholders,
b) Institutional investors with blocks of shares with
simultaneous access to the company's management
board,
c) Individual investors who have access to public
information.
There is one premise more to determine the fair value of
share price. The investors are fond of investing in shares,
namely they buy them as in the past they managed to earn
on them and they feel that presently the share price is ideal
and reflects their fair value and will enable them to obtain
fair dividend in the future [1, 3].
Such a purchase or sale of shares can largely overestimate
or underestimate the share value of a quoted company.
Here the chemical industry may serve as an example,
namely shares in chemical companies at the beginning of
the new millennium, when shares in these companies were
being purchased without any analysis in technical terms,
but looking at their name and value, which was increasing
overnight. In view of the foregoing, this led to excessively
high business value above its fair value.
The share price should thus reflect the fair value of a
company listed on the Warsaw Stock Exchange. For the
value of these companies be fair, the market must make
available to all investors information regarding companies
listed on the Warsaw Stock Exchange. The shareholders
Comparative European Research CER 2016 (issue I.)
64

should be treated equally; therefore we cannot distinguish
majority shareholders as those who should have
information unavailable for minority shareholders. First of
all, shares should be liquid securities, therefore they should
be in free float and have real-time transferability, namely
at any moment and at any time during the office hours of
the Warsaw Stock Exchange on a business day.
3. The development of the raw materials market in
Poland
The WIG-SUROWCE index, presented in Figure 1, shows
that from 2011 to 03.2016, the raw materials sector
companies in Poland showed a downward trend in their
values.
Figure 1: WIG-SUROWCE in the period from 01.2011 to
03.2016 [16].
However, from the first quarter of 2016, a significant
upward trend as well as the achievement of the highest
levels, up to the level of 2332 points in the index. The
values reported on 18.03.2016 reflect the upward trend and
confirm it. However, the market values do not reflect the
fair value of the raw materials sector companies.
4. Analysis and valuation of the raw materials sector’s
companies quoted on the Warsaw Stock Exchange
(WSE) in Poland
In the raw materials sector, it is possible to record one
company, the value of which approached to its next to the
maximum price on 18.03.2016, and this is KGHM. The
remaining companies did not have its maximum or even
fair value, though they can show the net profit and good
financial condition, and it is PRAIRIE. Some companies
were overvalued by even 90%. These companies are
BOGDANKA and JSW. However, the flagship companies,
such as KGHM, stay ahead (Table 1-2).
Table 1 The Raw materials sector’s companies quoted on
the Warsaw Stock Exchange in Poland as of 18.03.2016
(own development based on the data of the Warsaw Stock
Exchange)
Name Average rating rating
BOGDANKA 4.0/5.0 BBB-
JSW 3.5/5.0 D
KGHM 4.0/5.0 BB
PRAIRIE No data No data
Table 2 The Raw materials sector’s companies quoted on
the Warsaw Stock Exchange in Poland as of 18.03.2016
(own development based on the data of the Warsaw Stock
Exchange)
Name Current
price PLN
Maximum price PLN from the beginning of the stock
exchange quotation
BOGDANKA 38.50 124.30
JSW 12.28 124.20
KGHM 76.12 162.50
PRAIRIE 0.51 3.11
Table 3-4 presents the key ratios that show the financial
condition of the raw materials sector’s companies. Within
the nine examined companies, the generated profit per
share was reported in 1 companies (BOGDANKA). It
shows that the raw materials companies prosper properly
on the financial market and are able to record higher or
lower profits. However, the profit was not reported in two
companies, and he was JSW and KGHM.
The price to the operating earnings shows the losses of the
company at the negative, and this state of affairs was
reported in two stock exchange quoted company, and they
were JSW and KGHM. BOGDANKA generated a positive
ratio[6, 10].
Table 3 Technical evaluation of the Raw materials
sector’s companies quoted on the Warsaw Stock Exchange
in Poland as of 18.03.2016 (own development based on the
financial data of the of the Warsaw Stock Exchange)
Name P/OE (price/
operating
earnings)
P/BV (price/ book value)
BOGDANKA 4.22 0.52
JSW -0.38 0.36
KGHM -3.16 0.75
PRAIRIE No data No data
In contrast, analysing P/BV and P/P, it should be noted
that both the price to the book value and the price to profit
demonstrate that three companies operate exemplary on
the market and have a value under 1.0, and these are:
BOGDANKA, JSW and KGHM [4, 5, 7, 14].
Other companies do not significantly differ from the
average values, and it is PRAIRE (No data)
Table 4 Technical evaluation of the Raw materials
sector’s companies quoted on the Warsaw Stock Exchange
in Poland as of 31.12.2015 (own development based on the
financial data of the Warsaw Stock Exchange)
Name P/P
(price/ profit)
Profit per share
BOGDANKA 0.71 1.667
JSW 0.21 -21.467
Comparative European Research CER 2016 (issue I.)
65

KGHM 0.76 -31.185
PRAIRIE No data No data
Table 5-6 presents the studies concerning, among others,
the net profit, depreciation, EBITDA and assets of the raw
materials sector's companies [8, 9, 12, 13].
According to the obtained values, it is clear that only JSW
and KGHM showed a loss, which was confirmed by the
previous ratios included in Table 2.
Table 5 Technical evaluation of the Raw materials
sector’s companies quoted on the Warsaw Stock Exchange
in Poland as of 31.12.2015 (own development based on the
financial data of the Warsaw Stock Exchange)
Name Net profit (net loss)
in thousands PLN
Depreciation in
thousands PLN
BOGDANKA 56696 93109
JSW -2520500 331600
KGHM -6237000 469000
PRAIRIE No data No data
Other companies have shown a substantial profit which
was generated in 2015.
Table 6 Technical evaluation of the Raw materials
sector’s companies quoted on the Warsaw Stock Exchange
in Poland as of 31.12.2015 (own development based on the
financial data of the companies quoted on the Warsaw
Stock Exchange in Poland)
Name EBITDA in
thousands PLN
Assets in thousands
PLN
BOGDANKA 166334 4289335
JSW -2763900 11970900
KGHM -6724000 36764000
PRAIRIE No data 18623
Table 7 The Raw materials sector’s companies quoted on
the Warsaw Stock Exchange in Poland as of 31.12.2015
(own development based on the data of the Warsaw Stock
Exchange)
According to the book value per share, it is possible to
deduce that some companies are overvalued, and these are
BOGDANKA, JSW and KGHM, and in the case of the
PRAIRIE company, undervalued (Table 7).
However, it is important not to follow this opinion because
the values are only the book values, and the calculation of
them is purely mathematical and financial.
In the case of using the economic attitude and
interpretation, it would occur that the companies do not
have the fair value [2, 10, 15].
The profitability of the equity as well as the profitability of
assets is shown only by BOGDANKA and KGHM
however, JSW do not have it.
Therefore, according to the presented study, it is possible
to observe that the flagship raw materials concerns have
the profitability and they are not threatened by any
disturbance of the financial liquidity (Table 8).
Table 8 The Raw materials sector’s companies quoted on
the Warsaw Stock Exchange in Poland as of 31.12.2015
(own development based on the data of the Warsaw Stock
Exchange)
Currently, the value of companies significantly deviates
from the maximum value achieved a few years ago. The
only one exception is KGHM, which achieved the
maximum value in its history. Other companies have the
value less than 60%, and even 90% of the maximum one
(Table 9).
Table 9 The Raw materials sector’s companies quoted on
the Warsaw Stock Exchange in Poland as of 18.03.2016
(own development based on the data of the Warsaw Stock
Exchange)
Name Current value Maximum value
BOGDANKA 38.50 124.30
JSW 12.28 124.20
KGHM 76.12 162.50
PRAIRIE 0.51 3.11
However, the fair value which should be reflected by the
share prices of the examined companies significantly
differs from the calculated value, which was presented in
Table 10.
In some cases, it is even 10% of the current value. The fair
value is considerable higher than the current value of the
examined companies, and only similar in one company,
KGHM [6, 7, 9, 11].
Table 10 The Raw materials sector’s companies quoted on
the Warsaw Stock Exchange in Poland as of 09.03.2015
(own development based on the data of the Warsaw Stock
Exchange) Name Fair value Deviation from the fair
value in PLN
BOGDANKA 110.00 71.50
JSW 50.50 73.70
KGHM 125.00 48.88
PRAIRIE 1.90 1.21
5. Conclusion
The share price of the raw materials sector's companies
quoted on the Warsaw Stock Exchange in Poland is
significantly underestimated by the current financial
Name Book value per share in PLN
BOGDANKA 74.379
JSW 33.699
KGHM 101.055
PRAIRIE 0.119
Name ROE ROA
BOGDANKA 13.85 8.97
JSW -14.14 -7.37
KGHM 10.15 7.87
PRAIRIE No data No data
Comparative European Research CER 2016 (issue I.)
66

situation in the world, especially at such unstable values of
the resources [5, 6, 7, 12]. Raw materials companies
should demonstrate the higher value, and at least the fair
value because the raw materials market in Poland is
developing very well, and even promising bigger
development for the future years. In some European Union
countries, the development of the raw materials market is
slower or completely inactive because the countries do not
have access to raw materials and do not extract them or
their value is low [2, 4, 13].
Raw materials companies earn money because they largely
focus on the sale of raw materials resources which are
necessary to feed power plants with hard coal and lignite.
The flagship raw materials companies achieve huge profits
which was confirmed in the studies of ratios in the last few
years and the net profit studies in 2014, and such an
example can be KGHM, which achieved a net profit of
PLN 2,450,000 thousand.
The fair value of the raw materials sector's companies
quoted on the Warsaw Stock Exchange in Poland should
be achieved within five years, until 2020, because for this
period, the further rapid development of the raw materials
sector in Poland should be estimated.
References
[1] Borowski K., „Wyznaczanie punktów zwrotnych
indeksu Wig przy pomocy wybranych metod analizy
czasowej”. Bossa.pl, pp. 1-5.
[2] Jajuga K., Jajuga T. „Inwestycje". Wydawnictwo
Naukowe PWN, Warszawa 1996, pp. 34-57.
[3] Jędrzejczak M., „Estymacja wartości godziwej.
Podejście symulacyjne”, Powszechne Wydawnictwo
Ekonomiczne, Warszawa 2011, pp. 133-138.
[4] Parvi R., “Share price of the companies listed on the
WIG-UKRAINE and their fair value”, Share price of the
companies listed on the WIG-UKRAINE and their fair
value”, Itall Ltd., 2014, pp. 179-185.
[5] Parvi R., “Investment funds and their financial
effectiveness”, Goce Delchev University Macedonia &
THOMSON Ltd. Slovakia, EDIS - Publishing Institution
of the University of Zilina, 2014, pp. 262-267.
[6] Parvi R., “Share price of companies listed on WIG20
and their fair value”. EDIS - Publishing Institution of the
University of Zilina EIIC – 3 rd Electronic International
Interdisciplinary Conference 2014, pp. 169-177.
[7] Parvi R., “Valuation of shares and their fair value of
the companies listed on the WIG30 quoted on the Warsaw
Stock Exchange in Poland within 2005-2015”, Czech
Technical University in Prague. Czech Institute of
Academic Education z.s. 2015. pp. 177-184.
[8] Parvi R., “Valuation of shares and their fair value of
the companies listed on the WIG20 quoted on the Warsaw
Stock Exchange in Poland within 2005-2015”, December
2015, EDIS Publishing Institution of the University of
Zilina, Volume 3, Issue 1, December 2015, ISSN 2453-
7144, CD ROM ISSN 1339-5572, ISBN 978-80-554-
1170-5, pages 51-67.
[9] Parvi R., “Analysis of the Chemical sector in Poland on
the example of chemical industry companies quoted on
the stock exchange”, Sciemce Publishing London. ISBN
978-0-9928772-8-6. London, November 2015. Volume II,
Issue II. pp. 82-85.
[10] Parvi R., “Fair value of the banking sector companies
quoted on the Warsaw Stock Exchange in Poland within
2006-015 and their financial analysis”, ISSN 2453-6962,
CD-ROM ISSN 1338-9831, ISBN 978-80-554-1126-2,
Volume 4 Issue 1, November 2015, EDIS Publishing
Institution of the University of Zilina, pp. 83-88.
[11] Parvi R., “The analysis of companies of the fuel
sector based on the example of companies quoted on the
Warsaw Stock Exchange in Poland and their fair value”,
ISSN 1339-9071, CD-ROM ISSN 1339-3561, ISBN 978-
80-554-0891-0, Volume 3 Issue 1, May 2015, EDIS
Publishing Institution of the University of Zilina, pp. 109-
114.
[12] Pastusiak R., “Przedsiębiorstwo na rynku
kapitałowym”. Wydawnictwo CeDeWu, Warszawa 2010,
pp. 34-46.
[13] Pierce R., “Stocks, Options & Spreads, Infinity
Publishing” 2004, pp. 110-115.
[14] Thompson B., “Stock Market Superstar”, Insomniac
Press 2008, pp. 52-54.
[15] Veale S., “Stocks, Bonds, Options, Futures”, Prentice
Hall Press 2001, pp. 88-125.
[16] Stooq.pl, “WIG-SUROWCE”,
stooq.pl/q/?s=wig_surowc, accessed: March 18th
, 2016.
Comparative European Research CER 2016 (issue I.)
67

THE EUROPEAN UNION'S NEW STRATEGY FOR TRADE AND INVESTMENT IN THE LIGHT OF
NEGOTIATIONS WITH LATIN AMERICA
Jana Bališová
Paneurópska vysoká škola
Tomášikova 20
Bratislava, 821 02, Slovakia
Abstract: Following the new trade and investment strategy also known as Trade for All, the European Union recently
redoubled its efforts to expand trade relations with Latin American countries – particularly, in regards to updating existing
trade agreements with Mexico and Chile, and relaunching negotiations with Mercosur. Each agreement has been disclosed to
include a full chapter on foreign direct investment, a circumstance that raises the question of dispute settlement as the
European Union is currently in the midst of establishing a novel mechanism of investment adjudication: the Investment Court
System. Whether this arrangement matches the specifics of investment relations between the European Union and Latin
American countries remains to be seen.
Keywords: European Union, Latin America, Trade for All, Investment Court System
1. Introduction
Following the new trade and investment strategy also
known as Trade for All announced by Trade
Commissioner Cecilia Malmström in October 2015, the
European Union (EU) recently redoubled its efforts to
expand trade relations with Latin American countries. In
particular, the European Union plans on updating both –
the EU-Mexico and EU-Chile – trade agreements,
renewing trade negotiations with Mercosur as well as
closing the Political Cooperation and Dialogue Agreement
with Cuba [1]. Whereas the Cuban agreement acts only as
a rudimentary conduit for more elaborate sectoral
negotiations to come in the near future, the deals with
Mexico, Chile, and Mercosur aspire to incorporate all the
hallmarks of “new generation” free trade agreements
(FTAs), namely, provisions on trade in services,
intellectual property, competition, public procurement,
sustainable development, and, most prominently,
investment [2]. Each of said agreements has also been disclosed to include
a full chapter on investment, a circumstance that raises the
question of dispute settlement as the European Union is
currently in the midst of establishing a novel mechanism
of investment adjudication: the Investment Court System
[3]. Whether this arrangement matches the specifics of
investment relations between the European Union and
Latin American countries remains to be seen. Whilst
attempting to answer this highly politicized question
directly appears preposterous, approaching it from the
side, by comparing and confronting the two regimes along
with the legal arguments supporting them, may yield some
very feasible and interesting conclusions.
This paper strives to deliver, firstly, a fresh perspective on
the European Union’s new trade and investment strategy,
secondly, a précis on the current status of commercial
relations between the European Union and Latin America,
and thirdly, an assessment of the marriage between the
envisaged Investment Court System and the idiosyncrasies
of the Latin American approach to investment protection.
2. The new trade and investment strategy
The European Union’s newly unveiled strategy “Trade for
all: Towards a more responsible trade and investment
policy” (TFA) endeavors to cover both trade as well as
investment while taking a more responsible approach
responding to new economic realities in line with the
European Union’s foreign policy [4]. TFA is expected to
deliver a decisive growth boost to the European Union’s
economy through new opportunities for employment and
enterprise (explicitly including SMEs), the completion of
the digital trade agenda, and simplified movement of high-
skilled workers – chiefly for the purposes of expanding
and accelerating research, innovation and exchange of
knowledge [5]. To that effect, the Commission claims
having “developed an ambitious bilateral agenda
complementing the EU’s engagement at the WTO” that is
striving to reach a two thirds coverage of all EU trade
solely by FTAs – up from current one third [6]. Thus,
European Union’s trade negotiations now comprise not
only the top priority partners, such as the United States
(Transatlantic Trade and Investment Partnership – TTIP),
Japan (free trade agreement) or China (investment treaty),
but also the Asia-Pacific region, Africa and Latin America
[7]. The TFA concept has been conceived on the basis of
three key principles: effectiveness, transparency, and
values [8].
2.1 Effectiveness
With regards to effectiveness, the European Union pledges
to not only modernize future trade and investment
agreements in order to enable the best possible outcomes,
but also to ensure their proper implementation and
fulfillment. Whereas the modernization aims primarily at
realizing the fullest potential of the new policy areas
having gained momentum in the last decades (i. e.,
investment, digital trade, trade in services, etc.), proper
Comparative European Research CER 2016 (issue I.)
68

implementation and fulfillment carry the promise of
coordinating the advantages of the prospective agreements
with existing regulatory safeguards [9]. In practice, as a
telling example of these, occasionally conflicting
tendencies, serves the determined promotion by the
European Union of free cross-border data flows –
particularly combining the accomplishment of digital trade
agenda with restrictive regulatory measures protecting
personal data of consumers and securing their right to
privacy. Other prominent policy fields strongly influenced
by the effectiveness principle feature mobility and
migration (especially in regard to recognition of
professional qualifications), regulatory cooperation
concerning technical matters (e. g., non-trade barriers),
customs, trade in energy and commodities, intellectual
property rights, and competition (i. e., implementation and
enforcement of anti-dumping and state aid measures) [10].
2.2 Transparency
Equally important to effectiveness, the transparency
principle has instituted a slow, yet progressive reduction of
the democratic deficit in relation to the trade and
investment agreements by way of enhanced involvement
of the European Parliament [11]. Furthermore, the
commitment to conduct trade and investment negotiations
transparently helped bring to light the treaty texts and
various related documents in a timely manner as well as
invited the civil society and other stakeholders to
participate on the creation of the negotiation proposals
through public hearings and debates [12]. The Commission
considers comparably crucial also the impact assessment
aspect of transparency, which is to predict the effects of
the envisaged agreements on important issues such as
sustainable development, human rights, human health and
environment protection [13].
2.3 Values
The value orientation of trade and investment ought to
preserve, on one hand, consumer protection, including
consumer information and maintenance of high product
and service regulation standards as well as, on the other
hand, represent a firm commitment to promoting human
rights, good governance, fair and ethical trading and
investment schemes along with fight against corruption at
all levels [14]. Moreover, this principle aims to uphold
high social and environmental protection standards, and
facilitate social justice and sustainable development [15].
Whist the intentions behind this particular resolution may
appear honest and noble in their entirety, it seems quite
unclear how the European Union wishes to combine the
maintenance of high regulatory standards with the
principle of mutual recognition that ordinarily permeates
these types of agreements.
2.4 Interim outcome: a proposal to establish the
Investment Court System
The controversial TTIP negotiations between the
representatives of the European Union and United States
concerning the investment portion of the agreement, most
particularly the investor-state dispute settlement, prompted
a broad public debate in respect to legitimacy, necessity
and pitfalls of the ISDS mechanism [16]. While the
European Union has already been aware of increasing
dissent to such provisions, and prepared ahead to face the
discord by introducing safeguards to prevent frivolous
investor lawsuits against member states and/or the
European Union itself, the subsequent backlash against
TTIP rendered those efforts fruitless. At this point, it
became quite clear that unless the European Union
presents a prudent solution soon, the adamant opposition
towards TTIP in general, and ISDS in particular, would
only grow stronger. And thus, to assuage the grievances
against TTIP contended by the civil society, various
stakeholders, several member state governments, and even
members of the European Parliament, the idea to establish
a permanent, multilateral institution for investment dispute
adjudication has been reawakened [17].
Originally, the European Union intended to involve just
the United States at first – as an experiment of sorts – and,
only if met with success, to eventually invite other
investment treaty partners to join in [18]. In the long term
perspective, the Commission has far-reaching ambitions
for the Investment Court System to gradually replace the
ad hoc ISDS, and not just in regards to investment treaty
relations between European Union, the member states and
their counterparts, but also, in investment disputes between
third states [19]. Conversely, since United States took a
rather aloof stance on the issue, and TTIP has been
maligned by the public even more firmly, the European
Union turned to looking for other partners to test the new
waters with. The initial plan of action – to only involve
one investment treaty partner at first – changed, and the
European Union has cast its nets wider [20]. In
consequence to the new TFA strategy, the European Union
now negotiates the provisions on investment dispute
settlement under the rules of the envisaged Investment
Court System by default [21].
The Commission emphasizes as decisive advantages of the
proposed Investment Court System, beside its permanent
and multilateral character, high qualification requirements
imposed on the prospective judges, establishment of an
appeals tribunal similar to the WTO Appellate Body,
precisely defined access to adjudication for investors, and
a guarantee of the member states’ right to regulate [22].
On the other hand, the Investment Court System acts in an
analogous fashion to ISDS since investors are still
accorded, albeit to a lesser extent, direct claims against
member states and/or the European Union, each of whom
may be held liable to pay compensation and/or damages.
Finally, with regards to the multilateral character of the
new investment dispute settlement proposal, it should be
noted that all previous attempts to facilitate a global
international investment regime – such as the Draft
Convention on the Protection of Foreign Property (1967),
the Multilateral Agreement on Investment (1995-1998),
and the Doha round of the WTO negotiations – have
failed. Yet, despite of the perceived defeat in terms of
Comparative European Research CER 2016 (issue I.)
69

universal investment regimes, several sectorial,
investment-related agreements prevailed – e. g., the WTO
Agreement on Trade-Related Investment Measures (1994)
and the Energy Charter Treaty (1991).
3. Commercial relations between European Union and
Latin America
Even though the European Union has already developed
significant commercial ties to Latin America, these appear
mostly trade related or touching upon investment and other
“new” areas of commercial interest just marginally.
Among the most notable agreements with Latin American
countries and regional entities belong the EU-Mexico
Economic Partnership, Political Coordination and
Cooperation Agreement (1997), the Framework
Cooperation Agreement with Mercosur (1999), and the
EU-Chile Association Agreement (2002). Additionally,
multiple bilateral partnership and cooperation agreements
exist between Mercosur member states and the European
Union, as well as several bilateral investment treaties are
in force between Latin American countries and EU
member states. To consolidate these fragmented relations
under systematic, comprehensive trade and investment
agreements conveys yet another goal of the new EU
strategy [23].
The TFA strategy, however, predominantly aspires to
modernize the existing agreements with a view to include,
beside a full chapter on investment protection and dispute
settlement, provisions on public procurement, expanded
trade in services, digital trade, competition, state aid,
intellectual property rights, etc. [24]. Whilst the other new
areas of commercial interest will most certainly be tailored
individually – to suit the partner country or regional
organization in the best way possible, the investment
protection and dispute settlement, in line with TFA, are to
be dealt with in a predefined manner; ideally, resulting into
subjection under the envisaged Investment Court System
regime [25]. Currently, the European Union restarted
negotiations with several partners in Latin America –
specifically, Mexico, Chile, and Mercosur.
4. The Investment Court System and Latin American
countries
Considering the historical circumstances predating the
self-government of Latin American countries – explicitly,
in regards to colonial exploitation of natural resources and
populations, the initial hostile attitude of the region
towards increased protection of foreign investors’ property
has not been surprising at all. The Calvo doctrine, having
emerged in the mid-nineteenth century, epitomized said
philosophy, and gave rise to the Calvo clause often used in
investor-state contracts as well as concession agreements.
4.1 The Calvo doctrine and Calvo clause
The Calvo doctrine, named after its originator – the
Argentinian jurist Carlos Calvo, opposed the idea of
granting greater protection (by way of international
minimum standards) to foreign investors than that
accorded to own citizens [26]. Furthermore, beside the
preference for equal treatment of foreign and national
property, the Calvo doctrine also subscribed to the
principle of economic sovereignty of states (covering, for
example, ownership of natural resources, right to regulate,
right to expropriate, etc.) [27]. In a similar vein, based on
the principle of territorial sovereignty, the Calvo doctrine
required aliens to “submit disputes arising in a country to
that country’s courts” and rejected interference of foreign
governments on behalf of their nationals (i. e., diplomatic
protection) [28].
In consequence to widespread entrenchment of the Calvo
doctrine within the region of Latin America, several local
constitutions were expanded to contain corresponding
provisions [29]. Moreover, Calvo clauses, as a forcible
means for an investor to denounce diplomatic protection of
his or hers country of origin, were being inserted into
public contracts and concessions with intensifying
frequency. The validity of said practices has been fiercely
contested by the capital exporting countries and former
colonial powers; with the view that diplomatic protection
is the sole prerogative of states and as such at their
absolute discretion [30]. A viable solution to this dilemma
was proffered by the US-Mexican General Claims
Commission (GCC) in its award concerning the dispute
between North American Dredging Company of Texas and
the United Mexican States [31]. The GCC indicated a
distinction between rights that a claimant can defer, and
the prerogatives belonging to his or hers country’s
government, i. e., those he or she cannot relinquish [32].
Whereas diplomatic protection, and thusly the espousal of
claims by foreign governments on behalf of their citizens
against host countries, has served as the initial target of the
Calvo doctrine upon its creation, rapid development in the
international trade and investment realm rendered this
objective progressively obsolete. Especially, the inception
and advancement of diverse – multilateral, bilateral,
universal, and regional – regimes governing international
commerce coupled with the establishment of multiple
dispute settlement mechanisms, redirected the focus of the
newer Calvo clauses to prevent the admissibility of
potential investor claims to extraterritorial courts or
tribunals.
Eventually, the last major manifestation of the Calvo
doctrine’s influence has been observed in the 1970’s New
International Economic Order (NIEO) series of proposals
advocated by the developing countries before the United
Nations Conference for Trade and Development. The
NIEO was based on four key policy demands: firstly,
increasing the amount of development aid; secondly,
adopting a unilateral preference system for manufactured
exports of less developed countries; thirdly, establishing
international commodity agreements to stabilize prices of
primary products exported by developing countries; and
finally, creating new international financial reserves to be
redistributed as aid to the less-developed countries [33].
Comparative European Research CER 2016 (issue I.)
70

4.2 Recent developments of the Latin American trade
and investment policy
Since then, the rapid developments in the international
trade and investment environment along with the fast-
paced progression of globalization triggered changes in the
Latin American attitudes towards extraterritorial
jurisdiction. Not only have the Latin American countries
initiated cooperation among each other, resulting in the
conclusion of several regional cooperation agreements and
establishment of regional integrated markets, but they also
embarked on a journey of forming interregional and global
relations, most notably to Europe and the United States.
By the virtue of being party to a multitude of trade and
investment instruments such as the WTO, countless free
trade agreements, and bilateral investment treaties, most of
the Latin American countries have already distanced
themselves from the Calvo doctrine and other protectionist
theoretical underpinnings. Additionally, their willingness
to cooperate and negotiate with the European Union vis-à-
vis the common goal of concluding new (or updating
existing) trade and investment agreements, in conjunction
with adopting rules on investment dispute settlement,
implies a deeper change in the Latin American philosophy
on the exercise of commercial relations. Pursuant to this
new way of conduct, it does not seem preposterous that the
current European Union’s negotiating partners from the
region of Latin America, particularly Mexico, Chile and
Mercosur, appear to be amenable to the idea of the
proposed Investment Court System. Actually, considering
the narrow range of claims admissible to the ICS, joining
this sort of investment dispute settlement mechanism could
be a step up from the traditional ISDS-ridden bilateral
investment treaties.
5. Conclusion
Considering the European Union’s eagerness for
conducting trade and investment relations accompanied by
enthusiasm for upholding its values, advocating for
transparency and effectiveness as well as promoting fair
and sustainable development, on one side, and the previous
Latin American reticence and reservations in regards to the
opening of economies and submission to extraterritorial
jurisdictions, on the other, the current manner of
conducting trade and investment negotiations between the
European Union and Mexico, Chile and Mercosur
respectively, may actually be the right fit for all parties
concerned. Moreover, the proposed Investment Court
System, which the Latin American parties showed interest
to join, offers additional safeguards to preserve the public
policy space as well as reduces the grounds for
admissibility of investor claims, and thusly carries fewer
risks for countries to be sued.
References
[1] http://ec.europa.eu/trade/policy/in-focus/new-trade-
strategy (last visited 24.03.2016).
[2] http://europa.eu/rapid/press-release_MEMO-15-
5807_en.htm (last visited 24.03.2016).
[3] http://europa.eu/rapid/press-release_IP-15-
5651_en.htm (last visited 24.03.2016).
[4] http://trade.ec.europa.eu/doclib/docs/2015/octob
er/tradoc_153846.pdf (last visited 24.03.2016).
[5] Ibid., p. 9.
[6] Ibid.
[7] Ibid., p. 5.
[8] See ref. [2].
[9] See ref. [4], pp. 9-17.
[10] Ibid., p. 16.
[11] Ibid., p. 18.
[12] Ibid.
[13] Ibid.
[14] Ibid., pp. 19-26.
[15] Ibid., p. 22.
[16] http://ec.europa.eu/commission/2014-2019/mal
mstrom/blog/proposing-investment-court-system_en (last
visited 24.03.2016).
[17] http://europa.eu/rapid/press-release_IP-15-
5651_en.htm (last visited 24.03.2016).
[18] Ibid.
[19] Ibid.
[20] Ibid.
[21] See ref. [4], pp. 21-22.
[22] http://europa.eu/rapid/press-release_IP-15-
5651_en.htm (last visited 24.03.2016).
[23] See ref. [4], p. 13.
[24] http://www.euractiv.com/section/trade-
society/news/eu-in-latin-america-trade-push/ (last visited
24.03.2016).
[25] See ref. [4], pp. 21-22.
[26] Surya P. Subedi, International Investment Law, in
Malcolm D. Evans (ed.), International Law, 4th
edition,
Oxford, Oxford University Press, 2014, pp. 730.
[27] Ibid., p. 731.
[28] Ibid.
[29] Patrick Julliard, Calvo Doctrine/Calvo Clause, in Max
Planck Encyclopedia of Public International Law, Oxford,
Oxford Public International Law, 2007, at http://opil.ouplaw.com (last visited 24.03.2016).
[30] Ibid.
[31] North American Dredging Company of Texas
(U.S.A.) v. United Mexican States, in Reports of
International Arbitral Awards, Volume IV pp. 26-35,
United Nations, 31 March 1926.
[32] Ibid., p. 34.
[33] Harry G. Johnson, The New International Economic
Order, Woodward Court Lecture at the University of
Chicago, 5 October 1976, reproduced in Selected Papers
No. 49 of the Graduate School of Business at the
University of Chicago.
Comparative European Research CER 2016 (issue I.)
71

SYSTEMIC BIAS OF OFFICIALS
Kateřina Švarcová
Masaryk University in Brno, Faculty of Law
Veveří 70, Brno, 611 80, Czech Republic
Tel.: + 420 607 971 885
Abstract: The basic assumptions of legislation regulating bias or systemic bias in administrative proceedings, relevant judicial
decisions as well as opinions of the professional public, all form a platform by which the author approaches this analysis of
one of the phenomena of our time – systemic bias. With regard to sufficient material covering this issue (either the numerous
judicial decisions or opinions of the professional public), one may conclude that this concerns a highly relevant and widely
discussed question on which no unified opinion exists in the applied and scientific theory legal world. In reflecting upon the
attained findings, the author arrives at the opinion on systemic bias as a defined type of bias in general, determined by a
society-wide trend to name occurring phenomena, to distinguish them and analyze them. It comes inherently from the
established mixed model of public administration. However it does not exist a priori, but only ad hoc in specific cases.
Visibility and clarity of systemic bias are not simple nor can they be, however, in light of the potential of danger of bias.
Established legislation or its interpretive case law does not facilitate the functioning and decision-making activity of officials
today. Nevertheless, more attention should focus rather on the means of exercising an objection to this bias, and on the time
and formal structure of the relating procedure.
Keywords: local governments, officials, systemic bias, risk of bias, employment relationship
1. Introduction
Systemic bias of officials in public administration is a
fundamental and widely discussed problem in our time.
Essential assumptions of this phenomenon, if one focuses
on this question on the general plane, can be seen in the
model of mixed public administration as established in the
1990s by the restructuring of local government. One may
say that at the municipal level, powers are exercised within
the framework of independent and delegated powers "by
these same" entities. Situations sometimes occur where the
municipality, from its position of having delegated powers,
is the deciding entity, and simultaneously, based on
independent powers, is either the sole participant in
proceedings or some other involved participant. A typical
expression of systemic bias appears in the question of
cutting down trees on which numerous instances of case
law have developed. Can officials – municipal employees
– deciding on a specific request for permission to cut trees
where the applicant and the participant in proceedings is
the municipality – thus the employer of these officials –
decide impartially, uninfluenced and independently? Is
bias absent here or should these officials be excluded from
deciding in this matter ad hoc or a priori? One may not
expect that officials of the affected municipalities will
succeed when deciding in thoroughly overlooking the fact
that local authorities have available relatively substantial
powers that may interfere in their professional, and
consequently their private lives. How does the current
legislation, case law or opinions of the professional public
reflect this condition?
2. Legislation, case law, opinions of the professional
public
The current legislation on "bias" is introduced in Sec 15 in
affiliation with Sec 131(4) of Act No. 500/2004 Coll.,
Code of Administrative Procedure (hereinafter "CAP").
These provisions regulate the question of exclusion from
negotiations and deciding on a matter due to "bias" and
change of competence through delegation by authorization
of a different materially competent subordinate
administrative body. The relative newness of this
legislation and the existing fundamental case law compels
one to mention the previous legislation that was found in
Sec 9 an. of Act No. 71/1967 Coll., on Administrative
Procedure (Code of Administrative Procedure) valid and
effective up until 31 December 2005. There is a gradually
occurring determination of bias as such and its further
definition, whereupon there is no appearance in legislation
of the term "systemic bias", a specific bias reflecting the
affected relationship of an official towards a matter or
participants in procedures or their representatives, arising
from his employment position towards the municipality as
his employer – where this official is the sole participant in
the given proceedings or some other involved participant.
Objections to systemic bias are raised by participants in
proceedings, as proven by numerous instances of case law
relating to typical communal questions and others. One
example is the decision of the Regional Court in Ústí nad
Labem of 31 May 2006, case no. 75Ad 9/2014-48 (in
proceedings regarding disability pension), where in terms
of systemic bias, the court only expressed itself curtly,
regarding elucidation of systemic bias as such "...systemic
bias is a form of bias bound to specific persons in
individual matters."
A non-biased official making decisions is one of the basic
guarantees of the right to due process before administrative
bodies, which is generally a prerequisite of trust in law and
the legal state [1], as arising mainly from the regulation of
the Code of Ethics of Public Administration Officials and
Employees. Impartiality can be identified with inter alias
from the absence of bias. Other than legal aspects may not
be taken into consideration by administrative bodies, if this
Comparative European Research CER 2016 (issue I.)
72
does not arise from within the space of administrative
consideration provided by law. Officials must prevent
situations in which they would be exposed to potential
conflict of a private interest and the held functional
classification. One may consider the legal definition in Sec
14 of the CAP as a circular definition [2], when "the
official is biased in case it is possible to doubt his lack of
bias". Bias expresses the state of crookedness of the
relationship of the deciding official towards the matter
itself or to those who are or could be interested therein.
The deciding official should decide legally, impartially and
objectively. If reasonable doubt exists (in the wording of
Act No. 71/1967 Coll. "only" doubt; but in fact the stated
variants of legislation do not differ in practice, because
legitimacy based on objective criteria and real rational
reasons is necessary [3]) regarding the quality of the stated
relationship of the deciding official, this constitutes
grounds for elimination of this official from deciding in
the given matter. A potential risk for the origin of a biased
relationship to a specific case may be posed by anything,
thus also by an employment relationship of the official
with the municipality.
Under Sec 16(a) to (d) of Act No. 312/2002 Coll., on
officials of local governments and on amendment to
certain acts, local government officials are obliged to
uphold the constitutional order of the Czech Republic,
legal and other regulations relating to work performed by
them, to defend the public interest upon executing
administrative activity, and to fulfill instructions of senior
officials provided they do not run contrary to legislation.
The legal regulation itself does not provide, in the nature
of the employment relationship, any guarantees of the
absence of bias when exercising their powers. Officials are
economically dependent upon their employer, which has
an undesirable influence on their decision-making activity.
This condition is called systemic bias. As stated above, the
laws of the Czech Republic do not recognize the term
"systemic bias". In the quoted provisions of the CAP,
lawmakers work with so-called bias. Bias is a specific
quality of a relationship of an official to the relationship of
a thing, to participants of these specific proceedings or
their representatives. Systemic bias has been defined
gradually with regard to more raised questions of decision-
making at the level of mixed public administration. Does
systemic bias therefore even exist as a specific quality of
the relationship of the official in his decision-making
activity reflecting in itself the established model of mixed
public administration, or is it merely a figment of the
professional public and case law?
Based argumentatively on the current case law, it is
appropriate to mention at least certain decisions.
According to the decision of the Supreme Administrative
Court (hereinafter the "SAC") of 16 December 2004, case
no. 2As 21/2004-67 linked to the legislation Sec 9 of Act
No. 71/1967 Coll. “If a municipal authority decides within
its delegated powers on a right or obligation of the
municipality, it is not possible absolutely to consider for
exclusion its employees due to doubts about their lack of
bias in the wording of the provisions of Sec 9(1) of the
Code of Administrative Procedure." In this case, it
concerned decision-making of an official of the Municipal
Authority of Jičín, on permission to cut a silver maple,
where the very applicant was the City of Jičín. Officials of
municipalities are permitted in many cases to decide on
matters concerning the municipality, therefore factually
their employers, but this situation is explicitly permitted by
the law and expected, so it cannot absolutely constitute a
reason for bias of the employee of the municipal body,
despite an employment or similar relationship with such
municipality as a participant in proceedings. Doubt about
bias of a specific official would be given in such cases
only if another fact entered, especially the justified concern
of influencing of the official by the employer in a specific
case. According to the decision of the SAC of 30 January
2008, case no 6As 24/2007-89, employees of a municipal
authority are excluded from negotiating and deciding on a
matter, if the municipality as their employer has an
immediate and private interest in the result of a decision
issued within its delegated powers given by the fact that a
property benefit for the municipality would result from
such decision. Furthermore, in the decision of the SAC of
10 October 2007, case no. 2As 29/2007-74, dependence is
emphasized between the person deciding and the person
about whom the decision is made.
An utterly fundamental decision is the resolution of the
expanded panel of judges of the SAC of 20 November
2012, case no. 1As 89/2010-119, by which the expanded
panel of judges replied to the question of the first panel of
judges of the SAC. "If a local government body decides in
administrative proceedings on a matter that concerns the
interest of that local government, this is a reason for
doubting the lack of bias of the official under Sec 14(1) of
Act No. 500/2004 Coll., CAP, the official's employment
relationship to the local government at the time, if from the
nature of the matter or its circumstances there exists the
suspicion that in consequence of this employment
relationship, his position towards the matter could be
influence also by other than legal aspects." In this case, the
Municipal Authority of the District of Prague 7 permitted
the cutting down of trees and shrubs growing on grounds
owned by the applicants, where one of them included the
City of Prague. In this decision, the Supreme
Administrative Court deals in detail with legislation
concerning bias, an interpretation of the term bias, the
sense and purpose of protection from a biased person when
exercising powers of the administrative body, impartiality
and independence, the position of officials of local
governments and its specifics, the danger of systemic bias
of local government officials in competition with other
constitutional and legally protected interests and values,
and not the least of which, it examines existing case law.
In the opinion of the first panel of judges of the SAC,
when judging bias, it should by understood that nobody
may be a judge in one's own matter, and that in a dispute
between two entities, a third independent entity must
always be the one to decide ("nemo iudex in causa sua").
An integral part of the right to due process is the guarantee
that an independent and impartial person decides.
Impartiality and disinterestedness of this person form one
of the main prerequisites of just decision-making, and one
Comparative European Research CER 2016 (issue I.)
73

of the main premises of trust of citizens and other legal
entities in the law and the legal state. According to the
expanded panel of judges of the SAC, one may not view
the position of officials of a municipality automatically
from the nature of the employment relationship as being
"systematically" biased, mainly in light of the aim of
lawmakers and the model of public administration in the
Czech Republic. Indeed, upon approving the CAP, a
variant impacting this systemic (general) bias was
considered, but it was not adopted for its lack of
sustainability (financial, organizational and structural
impracticability of holding the given administrative
proceedings in some other municipality). Systemic bias is
therefore not a priori, i.e. not an a priori reason for
decision-making by other than a materially and locally
competent body. Systemic bias is not given broadly. After
all, the very legislation and established model of mixed
public administration has several legitimate aims,
including economy, ensuring the necessary expertise with
regard to the expected type difficulty, type character and
number of cases, the ability to express local knowledge
and achieve sustainable levels of administrative
complexity of the decision-making process. The expanded
panel of judges conceives so-called systemic risk of bias,
given by the mentioned employment relationship as well
as the mutual potential danger of impartiality in decision-
making, reflecting reality and not its absolute occurrence
in all considered cases. Relevance is placed on clarity of
the suspicion of the potential for an official to be
influenced by other than legal aspects, whereas even a very
low level of suspicion suffices. This will concern facts
indicating that somebody here exists with an interest in a
certain result of proceedings facing decision; meanwhile
he has or could have the ability to influence the relevant
official through his employment relationship with the local
government. These may be phenomena in the political or
media sphere, the interest of others within the community
of influential persons, behind-the-scenes actors in local
politics or business entities, interest traced back to media
statements, election campaign promises, specific
investment or commercial activities, the very nature and
essence of the matter up for decision, its level of
controversy or political importance and interests thereto
related, suspicion of pressure or an effort to directly
influence the decision-making of the relevant official
(moreover with the awareness of the government of
communal political entities implementing oftentimes
particular interests). On the contrary, this will not involve
a generally uncontroversial impact on the assets or other
sphere of the municipality. Meanwhile, the material
interest in the result of the proceedings will be decisive,
i.e. not reflecting the formal position of the municipality
(e.g. as a participant in the proceedings under Sec 27(1)
and Sec 27(2) of the CAP respectively, or a participant
under a different law or even in the situation where it will
not even participate in the proceedings at all – acting as a
different stakeholder altogether). These facts would not be
complete without reference to a different opinion,
according to which "the employment relationship of an
official with local government is not an absolute reason
for doubt on the person's lack of bias in the matter in
which this official is to decide within delegated powers in
administrative proceedings in favor of the interest of his
employer." One may conclude that this fundamental
decision indicates a strong accent on the interest of the
municipality and not on this official alone within the
fundamental meaning of the employment relationship.
However, systemic bias cannot be judged automatically,
but rather case by case, and one must therefore speak
rather of the risk of systemic bias. Regarding the question
of systemic bias or its aspects, other judicial decisions may
be mentioned, e.g. the resolution of the Constitutional
Court of 23 October 2008, case no. II.ÚS 555/07, the
decision of the Regional Court in Prague of 28 November
2014, case no. 45A 61/2012-46, the decision of the SAC of
16 July 2008, case no. 8As 35/2007-92, the decision of the
SAC of 10 October 2007, case no. 2As 29/2007-74, etc.
One of the latest decisions is the decision of the SAC of 13
February 2015, case no. 7As 158/2014-30, refusing the
cassation complaint against the decision of the Regional
Court in Ústí nad Labem of 02 July 2014, case no. 15A
127/2012-137, annulling, due to breach of provisions of
the CAP on the procedure of administrative bodies after
raising the objection of bias under Sec 14(2) and (3), the
decision of the defendant and the decision of the
Municipal Authority of Most, Building Office – issued by
one of the persons participating in zoning proceedings
regarding placement of a construction, specifically energy
recovery equipment. Meanwhile, in both administrative
and judicial proceedings, the defendant raised the
objection of bias against building office employees,
particularly leaning on the organizational and personnel-
related authority of the mayor of the City of Most, having
substantial influence on the professional lives of building
office officials and their economic dependency. The
Regional Court concluded in this specific case that there
exists a high level of doubt about the potential (systemic)
bias of all officials of the Municipality of Most, when
moreover, neither the building authority nor regional
authority reacted to the raised objection of bias through
administrative proceedings. This could influence the
legality of the decision and the preservation of the right to
due process. Despite the introduced decision-making
practice and the need to object to bias of specific officials,
supported by specific arguments, one may consider, with
reference to the aforementioned, an objection leading
towards all building office officials, as well as employees
of the Municipal Authority of Most, as being sufficiently
specific. When judging this specific matter, the Supreme
Administrative Court refers to its resolution of 20
November 2012, case no. 1As 89/2010-119, where the
existence of "systemic risk of bias" excludes officials of an
authority, whose systemic bias it concerns in the wording
of the provisions of Sec 14(1) and (4) of the CAP,
especially in regard to the indisputable existence of
agreements concluded between the City of Most and the
sole shareholder of the petitioner, in which the City of
Most had declared support for the investment aims of the
relevant company. Therefore, the plaintiff could have
relevantly objected to the systemic bias of all building
Comparative European Research CER 2016 (issue I.)
74
office employees. The procedure of Sec 14(2) and (3) of
the CAP, i.e. if a participant in the proceedings raises an
objection of bias of an official, is as follows. The official's
immediate supervisor or the one holding a similar position
decides by order on the objection of bias without delay.
Until a decision on the objection of bias is forthcoming,
this official can only perform such acts that cannot be
delayed. For there to be any sense in having a process
decision about whether or not an employee of an
administrative body is excluded, a decision on the matter
itself must precede this. Therefore, if the objection of bias
is raised, the employee otherwise authorized to negotiate
on and decide in the matter is obliged to wait until the
decision on the raised objection is passed. The law does
not allow for deciding on this objection later (compare the
decision of the SAC of 11 March 2004, case no. 7A
192/2000-76). In this case, the decisions of the bodies of
first instance and appeal were annulled due to the illegal
procedure exercised by administrative bodies, when they
handled the objection of bias only in the final substantive
decision. By referring to this decision, the author wishes to
point out not only the relevance of regulating bias as such,
but also the upholding of the legal procedure upon
suspicion of this bias (whether systemic or not).
Stanislav Kadečka also brings forth an important thought
and argumentation in his article published in Právní
rozhledy [Legal Perspectives] 13/2005, p. 477 entitled "Is
decision-making of the municipality in its own matter truly
unbiased?" According to him, the actual employment
relationship forms sufficient grounds for a procedure upon
the potential of bias, or that the conclusions of the SAC
that the "simple" fact when a municipality decides on its
own rights and obligations is not a reason in today's
regulation for exclusion due to bias, are incorrect
conclusions. On the contrary, the author believes, mainly
in relation to officials – employees of municipalities
employed in municipal authorities – that in such cases,
there can always objectively exist doubts on their lack of
bias. In her article, the author also refers inter alias to
legislation from the time of the so-called First Republic.
3. Conclusion
If we are to achieve objectivity and impartiality of
decision-making of officials, strengthening of trust in the
correctness of decision-making, fulfillment of the principle
of material truth, legality, equality of participants in
proceedings, decision-making in accord with the public
interest and not a private interest, one cannot help but
agree with the need for legislation of possible "systemic
bias" of officials deciding on specific matters. However, is
it possible to consider a person deciding in the situations
outlined above, thus deciding in a matter in which the
municipality itself as the employer of a specific official is
involved, as a priori biased? Is it necessary to accept the
concept of systemic bias or not?
With regards to the aforementioned, the legislation of "bias
(generally)" is an essential component of the legal system
of the Czech Republic as a modern democratic state,
reflecting not only the potential purely personal interest of
an official, but also the established model of mixed public
administration and the person, the human face of the
official as a person entering as an employee into a
relationship towards his employer, while applying all
characteristics of an employment relationship (superiority,
economic dependence, the binding nature of the
employer's orders – which is always closer than an
"abstract" state, to which the official is responsible by
virtue of his office as a person exercising public powers).
It is not possible to rely on the legislation on exercising
delegated powers, or the obligation of officials to act and
decide impartially. Impartiality is an utterly crucial aspect
that must be judged not only in subjective but mainly
objective terms. According to the finding of the
Constitutional Court of 03.07.2001, case no. II. ÚS 105/01,
the subjective perspective of participants in proceedings on
bias may be a stimulus for its examination, but decision-
making must take place exclusively based on an objective
perspective. There is an apparent fear of possible
influencing of officials, because it is hard and perhaps
even naive to expect that employees will decide
impartially on a request of his employer. At the same time
however, this in essence cannot be reliably proven.
The author believes that the actual employment
relationship of officials towards participants in
proceedings or other involved participants is not a reason
for the primary application of systemic bias (if one
considers this to be a real phenomenon). It is always
necessary to judge specific circumstances of the given
case, thus – whether it concerns cutting down several trees
due to their poor health or danger in a municipal park, or
substantial clearance of trees out of a developer interest.
Systemic risk of bias arises from institutional arrangement
and the nature of legal relationships between
municipalities and their officials. Systemic risk of bias
exists something that always is with regard to the nature of
the relevant relationships. Whether, in a specific case, this
systemic bias also appears must be judged ad hoc. The
legislation starts from the "potential" for bias, and this is
characterized by uncertain terms of the relationship
towards the matter, towards participants in proceedings or
their representatives. If the original drafting of the CAP
contained explicit regulation of systemic bias, which was
not adopted however – one may consider that
subordination of this is occurring by the professional
public and case law of a defined and specially named type
of bias under general administrative law legislation, where
moreover, certain regulations contain their own special
regulation, such as Sec 182(4) of Act No. 183/2006 Coll.,
on town planning and the building code (Building Act).
The Czech Provincial Act No. 71/1870 Czech Coll.
already contained similar special regulation. Reflecting
upon this, it is clear that the desirable special regulation of
"systemic bias" and the procedure in such case are a part of
the Czech legal system in the most problematic areas still
today, whereas in others, one may refer to the subsidiary of
the CAP. The author believes that systemic bias exists, but
only as the naming of one of several types of potential
aspects upon which one may judge bias. Regarding others,
one may refer for example to the categorization according
to O´Brien published in 2011 in the Irish Journal of Legal
Comparative European Research CER 2016 (issue I.)
75

Studies, in his article entitled "Nemo Iudex in Causa Sua:
Aspects of the No-Bias Rule of Constitutional Justice in
Courts and Administrative Bodies"[2]. In the mixed model
of public administration itself, aspects of the hierarchical
relationship, the employment relationship and property
dependence, along with the relationship of collegiality and
loyalty towards the institution, will be undoubtedly
important. Naming systemic risk of bias is then just a
definition of the condition that systemic bias does not
appear always in all possible cases, but rather only ad hoc.
In conclusion one may state – systemic bias does exist.
This is true either as the naming of the phenomenon,
which arose inherently from the established organization
of public administration, or a special institute – named by
the decision-making activity of courts, naming the
resulting condition in our country. What is much more
important is knowing how to correctly establish the system
of exercising this bias, its recognition and avoidance of
matters of public administration decision-making by
biased persons. A further stimulus is rather to consider a
system of exercising the objection of a bias, the time and
formal structure of the procedure during proceedings,
whereas the author attempted to point out at least briefly
the relevance of this through one of the latest judgments.
References
[1] Bursíková L. Podjatost úředníků územně
samosprávných celků. In: Dny práva 2011 – Days of Law
2011 [online]. Brno Masaryk University, 2012 ISBN 978-
80-210-5910-8. Available from: https://www.law.muni.cz/.
[2] Novosadová K. Podjatost úředníků v podmínkách
smíšeného modelu veřejné správy. Thesis. Faculty of Law,
Masaryk University, 2014/2015. S. 20. Available from:
http://theses.cz.
[3] Kadečka S. Je rozhodování obce ve vlastní věci
opravdu nepodjaté? In Právní rozhledy č. 13/2005, s. 477.
Available from: http://www.beck-online.cz.
[4] Personal notes of the author from the lecture by prof.
JUDr. Petr Průcha, CSc. on the topic Systemic Bias of
Officials in Public Administration, given on 20 October
2015.
Comparative European Research CER 2016 (issue I.)
76
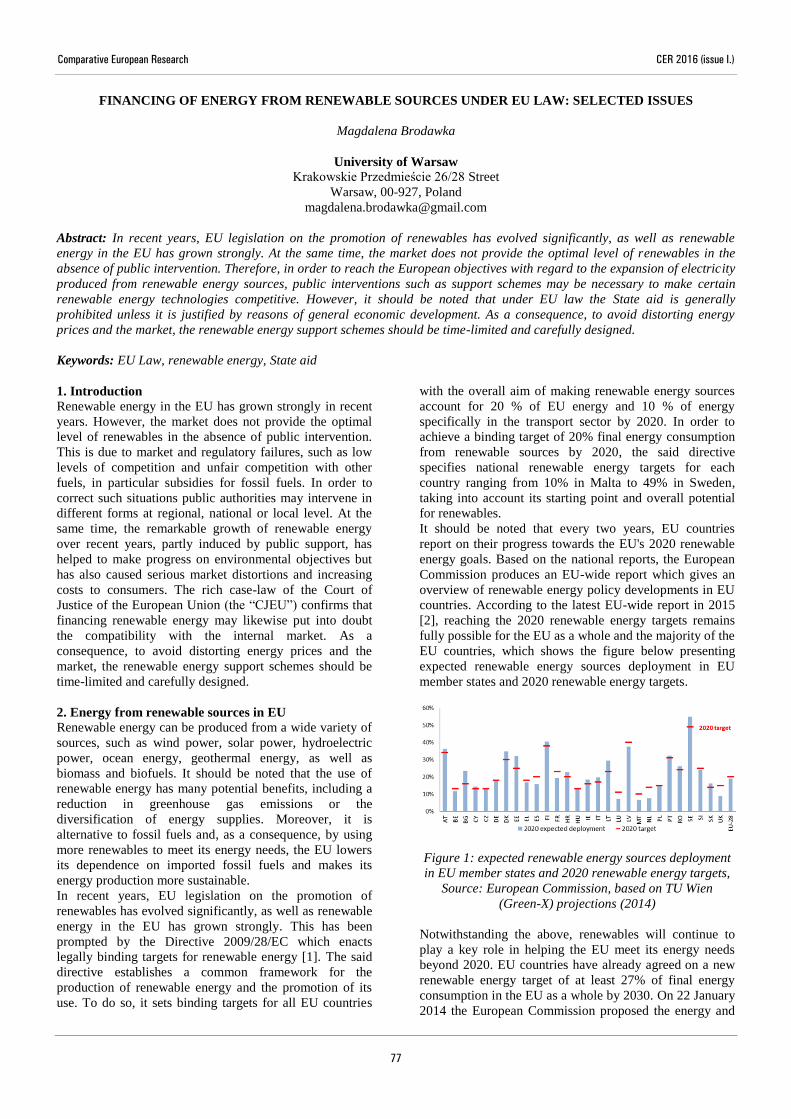
FINANCING OF ENERGY FROM RENEWABLE SOURCES UNDER EU LAW: SELECTED ISSUES
Magdalena Brodawka
University of Warsaw
Krakowskie Przedmieście 26/28 Street
Warsaw, 00-927, Poland
Abstract: In recent years, EU legislation on the promotion of renewables has evolved significantly, as well as renewable
energy in the EU has grown strongly. At the same time, the market does not provide the optimal level of renewables in the
absence of public intervention. Therefore, in order to reach the European objectives with regard to the expansion of electricity
produced from renewable energy sources, public interventions such as support schemes may be necessary to make certain
renewable energy technologies competitive. However, it should be noted that under EU law the State aid is generally
prohibited unless it is justified by reasons of general economic development. As a consequence, to avoid distorting energy
prices and the market, the renewable energy support schemes should be time-limited and carefully designed.
Keywords: EU Law, renewable energy, State aid
1. Introduction
Renewable energy in the EU has grown strongly in recent
years. However, the market does not provide the optimal
level of renewables in the absence of public intervention.
This is due to market and regulatory failures, such as low
levels of competition and unfair competition with other
fuels, in particular subsidies for fossil fuels. In order to
correct such situations public authorities may intervene in
different forms at regional, national or local level. At the
same time, the remarkable growth of renewable energy
over recent years, partly induced by public support, has
helped to make progress on environmental objectives but
has also caused serious market distortions and increasing
costs to consumers. The rich case-law of the Court of
Justice of the European Union (the “CJEU”) confirms that
financing renewable energy may likewise put into doubt
the compatibility with the internal market. As a
consequence, to avoid distorting energy prices and the
market, the renewable energy support schemes should be
time-limited and carefully designed.
2. Energy from renewable sources in EU
Renewable energy can be produced from a wide variety of
sources, such as wind power, solar power, hydroelectric
power, ocean energy, geothermal energy, as well as
biomass and biofuels. It should be noted that the use of
renewable energy has many potential benefits, including a
reduction in greenhouse gas emissions or the
diversification of energy supplies. Moreover, it is
alternative to fossil fuels and, as a consequence, by using
more renewables to meet its energy needs, the EU lowers
its dependence on imported fossil fuels and makes its
energy production more sustainable.
In recent years, EU legislation on the promotion of
renewables has evolved significantly, as well as renewable
energy in the EU has grown strongly. This has been
prompted by the Directive 2009/28/EC which enacts
legally binding targets for renewable energy [1]. The said
directive establishes a common framework for the
production of renewable energy and the promotion of its
use. To do so, it sets binding targets for all EU countries
with the overall aim of making renewable energy sources
account for 20 % of EU energy and 10 % of energy
specifically in the transport sector by 2020. In order to
achieve a binding target of 20% final energy consumption
from renewable sources by 2020, the said directive
specifies national renewable energy targets for each
country ranging from 10% in Malta to 49% in Sweden,
taking into account its starting point and overall potential
for renewables.
It should be noted that every two years, EU countries
report on their progress towards the EU's 2020 renewable
energy goals. Based on the national reports, the European
Commission produces an EU-wide report which gives an
overview of renewable energy policy developments in EU
countries. According to the latest EU-wide report in 2015
[2], reaching the 2020 renewable energy targets remains
fully possible for the EU as a whole and the majority of the
EU countries, which shows the figure below presenting
expected renewable energy sources deployment in EU
member states and 2020 renewable energy targets.
Figure 1: expected renewable energy sources deployment
in EU member states and 2020 renewable energy targets,
Source: European Commission, based on TU Wien
(Green-X) projections (2014)
Notwithstanding the above, renewables will continue to
play a key role in helping the EU meet its energy needs
beyond 2020. EU countries have already agreed on a new
renewable energy target of at least 27% of final energy
consumption in the EU as a whole by 2030. On 22 January
2014 the European Commission proposed the energy and
Comparative European Research CER 2016 (issue I.)
77

climate objectives to be met by 2030 in a Communication
“A policy Framework for climate and energy in the period
from 2020 to 2030”(the “2030 Framework”)[3]. The
pillars of the 2030 Framework are: a reduction in
greenhouse gas emissions by 40 % relative to the 1990
level, an EU-wide binding target for renewable energy of
at least 27 %, renewed ambitions for energy efficiency
policies and a new governance system and a set of new
indicators to ensure a competitive and secure energy
system.
In order to reach the European objectives with regard to
the expansion of electricity produced from renewable
energy sources, public interventions such as support
schemes may be necessary to make certain renewable
energy technologies competitive. However, it should be
noted that under EU law the State aid is generally
prohibited unless it is justified by reasons of general
economic development.
3. State aid under EU law
In order to prevent State aid from distorting competition in
the internal market and affecting trade between Member
States in a way which is contrary to the common interest,
the Treaty on the Functioning of the European Union (the
“TFEU”) lays down the principle that State aid is
prohibited. According to Article 107(1) TFEU any aid
granted by a Member State or through State resources in
any form whatsoever which distorts or threatens to distort
competition by favouring certain undertakings or the
production of certain goods shall, in so far as it affects
trade between Member States, be incompatible with the
internal market.
Thus, to be covered by the prohibition of the State aid
within the meaning of Article 107(1) TFEU, a national
measure must fulfill the following conditions: (i) there
must be an intervention by the State or through State
resources; (ii) it must confer an advantage on the recipient;
(iii) it must distort or threaten to distort competition; (iv)
the intervention must be liable to affect trade between
Member States [4]. According to settled case-law of the
CJEU, categorization as aid requires that all the above
conditions be fulfilled [5].
In the light of the case-law of the CJEU, only advantages
which are granted directly or indirectly through State
resources are to be regarded as State aid within the
meaning of 107(1) TFEU. The wording of this provision
itself and the procedural rules laid down in Article 108
TFEU show that advantages granted from resources other
than those of the State do not fall within the scope of the
mentioned provisions [6].
It should be noted that an economic advantage granted by
a Member State constitutes an aid only if it is such as to
favour certain undertakings or the production of certain
goods. Thus, in order to prove that the measure at issue
applies selectively to certain undertakings or to the
production of certain goods, it is for the European
Commission to prove that it creates differences between
undertakings which, with regard to the objective of the
measure at issue, are in a comparable factual and legal
situation [7].
Moreover, the aid must distort of threaten to distort
competition by favouring certain undertakings or the
production of certain goods. The case-law of the CJEU
indicates that not only aid which distorts competition is
incompatible with the common market but also aid which
threatens to do so [8].
In addition, Article 107(1) TFEU applies to State aid in so
far as it affects trade between EU countries. Under the
case-law of the CJEU, the concept of an ‘effect’ on trade
between Member States, which must be understood as
requiring that there be an impact on such trade, or at least
that there be the possibility of such an impact, means that
an interpretation which renders the recovery of the whole
of the aid subject to a criterion that trade should be ‘fully’
affected, in contrast to a ‘partial’ effect on it, where only a
proportion of the aid would be recoverable by virtue of the
principle of proportionality, is unfounded [9]. Therefore,
the national renewables support schemes that satisfy all the
abovementioned criteria, are, in general, incompatible with
the internal market, regardless of their purpose,
justification or objective [10]. However, in some
circumstances government interventions is necessary for a
well-functioning and equitable economy. In number of
cases, therefore, State aid could be considered acceptable.
First, certain aid is declared by Article 107(2) TFEU to be
compatible with the internal market. Secondly, the
European Commission has a discretion under Article
107(3) TFEU enabling it to determine that certain aid is
compatible with the internal market. Thirdly, according to
Article 107 (3)(e) TFEU, the Council may decide that
other categories of aid which are indicated in the Article
107(3) may be permissible under decision issued on a
proposal from the European Commission. Therefore, the
Treaty leaves room for a number of policy objectives for
which State aid can be considered compatible [11]. In this
context, there is a need to refer to so-called environmental
integration rule. According to Article 11 TFEU,
environmental protection requirements must be integrated
into the definition and implementation of the Union's
policies and activities, in particular with a view to
promoting sustainable development. It follows from the
wording of Article 11 TFEU that environmental protection
requirements should be implemented in the all EU policies
and activities. The legal doctrine indicates that the
mentioned provision has a double objective. On the one
hand, it aims to promote sustainable development. On the
other hand, it is a provision with the objective to reach the
objectives of EU environmental policy laid down in
Article 191 TFEU establishing EU policy on the
environment and in the overarching objectives [12]. In
accordance with the so-called environmental integration
rule, said objectives of EU environmental policy should be
taken into account and fully considered in all EU policies,
including the decisions and activities of other sectors. It is
beyond doubt, that using renewable energy contributes
notably to achieving objectives of Articles 11 and 191(1)
TFEU, including preservation and improvement of the
environmental quality through limiting the impact of
energy use on the latter. Consequently, financing of energy
Comparative European Research CER 2016 (issue I.)
78

from renewable sources may be permissible in a number of
cases, however, may be subject to specific conditions.
4. Permissible renewable energy support schemes
In general, to avoid distorting energy prices and the
market, the renewable energy support schemes should be
time-limited and carefully designed. In order to ensure
transparency and to create predictability and legal certainty
in the application of the exemptions of general prohibition
of State aid, the European Commission has made public
the guidance for EU countries when designing and
reforming renewable energy support schemes, as well as
the criteria when deciding whether aid measures notified to
it qualified for exemptions. These publications have taken
the form of regulations, communications, notices,
frameworks, guidelines, and letters to Member States [13].
As already indicated, the EU has issued a guidance on
support schemes [14](the “Guidance”) to help
governments when they design or revise support schemes.
The Guidance indicates that the market does not provide
the optimal level of renewables in the absence of public
intervention. This is due to market and regulatory failures,
such as low levels of competition and unfair competition
with other fuels, in particular subsidies for fossil fuels. In
order to correct such situations public authorities may
intervene in different forms at regional, national or local
level. Examples include State aid to certain sectors or
companies in the form of grants or exemptions from taxes
and charges, the imposition of public service obligations,
and regulation through general measures. At the same
time, while such measures are necessary to correct market
failures and achieve the desired level of renewables, public
interventions need to be well designed and proportionate to
avoid additional market distortions. Therefore, the
Guidance suggests that financial support for renewables
should be limited to what is necessary and should aim to
make renewables competitive in the market.
Moreover, the European Commission has adopted the new
rules on public support for projects in the field of
environmental protection and energy i.e. Guidelines on
State aid for environmental protection and energy 2014-
2020 (the “Guidelines”) [15]. Despite the fact that the
Guidelines are not a binding act of European Union
secondary law they certainly have significance not only for
the proper functioning of the internal market, but also,
more importantly, they include an obligation to execute the
objectives resulting from the EU’s political framework
concerning climate and energy. In fact, the aim of the new
guidelines it to support Member States in reaching their
2020 climate targets, while ensuring that subsidies granted
to renewable energy do not cause distortions of
competition or a fragmentation of the internal market.
Thus, the Guidelines has replaced and extended the scope
of the previous guidelines i.e. the Guidelines on State aid
for environmental protection published on 1 April 2008
(OJ C 82, 1.4.2008, p. 1.) to the energy field, in particular
to cover State aid to energy from renewable sources, which
is based on case practice and policy developments of the
recent years. The European Commission has emphasised
that during the years of the application of the previous
guidelines, a large part of expenditure assessed under those
guidelines has served to promote energy from renewable
energy sources. Bearing the above in mind, the rules for
supporting renewable energy have been modernised to
take account of their increasing share in the electricity
market and the need to make support systems sustainable
for society.
The European Commission has reflected, however, that the
remarkable growth of renewable energy over recent years,
partly induced by public support, has helped to make
progress on environmental objectives but has also caused
serious market distortions and increasing costs to
consumers. The rich case-law of the CJEU confirms that
financing renewable energy may likewise put into doubt
the compatibility with the internal market [16].
Thus, the Guidelines and the Guidance aim to better
integrate renewables into the internal electricity market in
a gradual way, limiting support to what is truly necessary.
It is apparent from the Guidelines that in order to allow
Member States to achieve their targets in line with the EU
2020 objectives, the European Commission presumes the
appropriateness of aid and the limited distortive effects of
the aid provided all other conditions detailed in the
Guidelines are met (see points 107-137 of the Guidelines).
5. Conclusion
As already indicated, the market does not provide the
optimal level of renewables in the absence of public
intervention. Therefore, in order to reach the EU objectives
with regard to the expansion of electricity produced from
renewable energy sources, public interventions such as
support schemes may be necessary to make certain
renewable energy technologies competitive. However, as
indicated in this article, financing renewable energy may
likewise put into doubt the compatibility with the internal
market. Therefore, to avoid distorting energy prices and
the market, the renewable energy support schemes should
be time-limited and carefully designed. For that purpose, it
is necessary to take into account both the Guidelines and
the Guidance, as well as case-law of the CJEU.
References
[1] Directive 2009/28/EC of the European Parliament and
of the Council of 23 April 2009 on the promotion of the
use of energy from renewable sources and amending and
subsequently repealing Directives 2001/77/EC and
2003/30/EC, OJ L 140, 5.6.2009, p. 16–62
[2] Renewable energy progress report from the
Commission to the European Parliament, the Council, the
European Economic and Social Committee and the
Committee of the Regions, (COM (2015) 295 final) of
15.6.2015
[3] Communication from the Commission to the European
Parliament, the Council, the European Economic and
Social Committee and the Committee of the Regions — A
policy framework for climate and energy in the period
from 2020 to 2030 (COM(2014) 15 final) of 22.1.2014.
[4] Evangelia Psychogiopolou, State aid to the Press in the
EU: Legal Issues and Trends, in: Paul C. Murschetz (Ed.)
Comparative European Research CER 2016 (issue I.)
79

State aid for Newspapers: Theories, Cases, Actions,
Germany, Springer-Verlag Berlin Heidelberg, 2013, pp. 86
[5] Case C-142/87 Belgium v Commission [1990] ECR I-
959, paragraph 25; Joined Cases C-278/92 to C-280/92
Spain v Commission [1994] ECR I-4103, paragraph 20;
Case C-482/99 France v Commission [2002] ECR I-4397,
paragraph 68, and Case C-280/00 Altmark Trans and
Regierungspräsidium Magdeburg [2003] ECR I-7747,
paragraph 74
[6] Case 82/77 Openbaar Ministerie of the Netherlands v
Van Tiggele [1978] ECR 25, paragraphs 23-25; Joined
cases C-72/91 and C-73/91 Firma Sloman Neptun
Schiffahrts AG v Seebetriebsrat Bodo Ziesemer der
Sloman Neptun Schiffahrts AG [1993] ECR I-887
paragraph 19
[7] Case C-279/09 P Commission v Netherlands [2011]
ECR I-551, paragraph 62; Case T-538/11 Kingdom of
Belgium v European Commission [2015] ECR I-188,
paragraph 102
[8] Case T-35/99 Keller and Keller Meccanica v
Commission, [2002] ECR II-261, paragraph 85; Joined
Cases T-239/04 and T-323/04 Italian Republic and Brandt
Italia SpA v Commission of the European Communities
[2007] ECR II-3265
[9] Case C-66/02 Italian Republic v. Commission of the
European Communities, [2005] ECR I-10936, paragraph 112
[10] Larmilnery Kreiser, Ana Yabar Sterrling, Pedro,
Herrera, Janet E. MILNE and Hope Ashiabor, Green
Taxation and Environmental Sustainability, Edward Elgar
Pub, 2012.
[11] Conor Quigley European State Aid Law and Policy.
Hart Publishing, 2009, pp. 193
[12] Beate Sjaffel and Anja Wiesbrock, The Greening of
European Business under EU Law: Taking Article 11
TFEU Seriously, Routledge, 2014, pp. 47
[13] Thomas Nordby, Espen Bakken , Competition no. 1,
pp. 23-27, 2010
[14] Staff working document Generation Adequacy in the
internal electricity market — guidance on public
interventions (SWD(2013) 438 final) of 5.11.2013
accompanying the Communication Delivering the internal
market in electricity and making the most of public
intervention of 5.11.2013 (C(2013) 7243 final)
[15] Guidelines on State aid for environmental protection
and energy 2014-2020, OJ C 200, 28.6.2014, p. 1
[16] see Case C-379/98 PreussenElektra AG v Schhleswag
AG, in the presence of Windpark Reußenköge III GmbH
and Land Schleswig-Holstein [2001] I-02099; Case C-
262/12 Association Vent De Colère! Fédération nationale
and Others v Ministre de l’Écologie, du Développement
durable, des Transports et du Logement and Ministre de
l’Économie, des Finances et de l’Industrie,
EU:C:2013:851)
Comparative European Research CER 2016 (issue I.)
80
TRENDS IN THE DEVELOPMENT OF INTERNATIONAL TRADE
Katarzyna Brożek
Kazimierz Pulaski University of Technology and Humanities in Radom
Address: Malczewskiego 29
Radom, 26-600, Poland
telephone number: +48 504174290
mail: [email protected]
Abstract: This paper is concerned with the matter related to the broad development of world trade. The general objective of
the article was therefore to examine the trends in the development of international trade. In order to systematize the problems
of the above-mentioned range, articles have been divided into three parts - (each on a different issue). First the nature of
international trade was discussed, then the concept and the importance of foreign trade policy was presented, and the last part
of the study was dedicated to the general trends in international trade. Considerations are based on two research methods.
Due to the prevailing theoretical nature of the work, analysis of the content of available literature on the subject was used,
while in the empirical part, statistical analysis proved to be the crucial method.
Keywords: economics, trade, development, trends
1. Introduction
Since the second half of the twentieth century, foreign
trade has had a major impact on management processes in
individual countries, but it also determines the size and
structure of the GDP of most countries in the world. The
direction of trade policy is beneficial for the world trade.
Limited use of trade barriers requires the coordination of
international trade policy. Initially, GATT organization
played such a role, and now the World Trade Organization
(WTO) deals with it.
The general objective of the article was to assess and
analyze the changes in the structure of international trade.
The proposed issues are extremely important both from a
scientific and practical point of view, because the
following questions are still bothering: is significant
economic development without the state's participation in
world trade possible in a developed economy? Can we
therefore talk about economic self-sufficiency?
Commercial policy measures are widely used in many
countries in order to achieve certain goals. This means,
therefore, that national governments sometimes opt for less
economically rational solutions to achieve certain social or
political goals. Because achieving certain important social
and political objectives often requires sacrifices in the field
of economic rationality. However, there is a risk that such
arguments can sometimes be abused. The two following
circumstances support this fact, namely: the irrational
political and social arguments and economic interests of
certain entities that can benefit from restrictions on free
trade.
1.1 The essence of international trade
In the literature we can find many different definitions of
international trade. Most, however, it is determined that
this is the charge exchange of goods or services with
partners, with permanent residence outside the customs
border of the state. There are two areas of this concept:
narrower and broader [1]. The first one applies only to
material goods that are sold or bought in order to:
a) ensure the supply of goods not produced in the country
or to sell abroad the goods produced in excess;
b) gain export profits resulting from obtaining a relative
(comparative costs) or absolute advantage in
production costs in relation to foreign partners, or
purchase the goods abroad in respect to which such
advantage was achieved by foreign partners;
c) achieve the scale of production that ensures cost-
effectiveness;
d) implementation of long-term and annual plans of trade
with individual countries in relation to goods which are
important for the country of export and the country of
import.
In the broad sense, the foreign trade is determined as the
property and credit turnovers (including repayments of
loans, borrowings and others) of specific state and current
turnovers, which, in addition to trade in goods, consist of
purchases and sales abroad (license and know-how),
exchange of transport and brokerage services, and other
receivables and liabilities resulting from the movement of
the population outside the borders and maintaining their
own diplomatic and trade posts abroad, pensions,
retirements, contributions, international organizations,
interest on loans (received and paid), and costs of
maintenance of immovable property abroad.
International trade is the source of civilization
development, economic progress and bringing nations
closer. Without it, economies of the countries would not
have the possibility of effective development.
The essence of foreign trade is that the goods and service
which is the subject of exchange are moved outside the
border of the country. The result of foreign trade is the
international division of labor. It was formed by the
economic policies of individual countries. It gives the
opportunity to specialize production. In addition, it
expands domestic consumption possibilities.
The benefits of foreign trade have an impact on many
areas, e.g. the society standard of living, or even an
increase in prosperity because they are the result of
efficient use of resources, labor, capital, but moreover,
Comparative European Research CER 2016 (issue I.)
81

intellectual resources and different nature and culture
conditions of each country. The consequence of foreign
trade is to stimulate economic development, but also
technical progress which also results in the development of
new technologies. To sum up, this trade creates new needs
of the population and the economy, so it expands the
external market [2].
There are four groups of factors that influence the
development of international trade:
a) the first one concerns the political factors (defined as
the presence or absence of various types of political or
military conflicts in the international arena),
b) The second group are economic factors, because the
state of the economic situation in the markets of the
country, and consequently the good economic situation
causes an increase in demand for imported goods, and
vice versa,
c) the third group consists of implemented trade policy,
which is reflected in the four subgroups, namely in the
general trends of international trade, liberalism,
protectionism and trade policy implemented by the
partners,
d) the last, the fourth group of factors are actions resulting
from the activities of international organizations GATT
/ WTO, IMF.
1.2 The concept and essence of foreign trade policy
Foreign Trade Policy is a part of economic policy. It is a
set of objectives and measures for their implementation. Its
basic tasks include optimal formation of relations of the
tested country with other countries. Optimality in this case
depends on the political and economic situation, but also
on the objectives motivating those who are in power. We
can distinguish the following objectives of foreign trade
policy [3]:
a) more exports,
b) sustainability of the payment balance,
c) improving commodity structure of trade,
d) increase of country participation in the world trade,
e) getting new sales markets,
f) improving the competitiveness of the domestic
industry,
g) foreign debt servicing,
h) restructuring of liabilities.
Due to the fact that the above objectives cannot be
achieved at the same time, the hierarchy of their validity
and the timetable for implementation should be
determined.
In the literature, there are two approaches to foreign trade
policy [4]. The first assumes that the policy of free trade is
pursued, that is, there is no state intervention in economic
relations with foreign countries. This type of policy is
based on the belief that market forces shape relations with
foreign countries so as to ensure maximization of benefits
from the exchange.
The second approach to international trade policy, also
called protectionism, assumes that the state affects the
economic cooperation with foreign countries through
economic and administrative instruments (direct or
indirect).
Tools of foreign trade policy may restrict import or
stimulate export [3]. There are three groups of barriers:
a) tariff, which include duties, which are taxes on goods
crossing the state border,
b) para tariff measures are similar to customs duties,
artificially raising the price of imported goods, most
often they include variable levies, import deposits,
import taxes, and anti-dumping and anti-subsidy duties,
c) non-tariff include administrative measures which
specify the conditions for participation in foreign trade,
e.g.:
bans (on import and/or export),
import quotas (amounts),
permits (licenses),
voluntary import restrictions,
technical, sanitary and other standards,
anti-dumping procedures,
exchange restrictions.
Measures, that are able to stimulate the export, are the
various types of direct subsidies (subventions), that is the
provisions of the state budget for producers of exported
goods. There are also indirect subsidies that are used in the
form of e.g. tax breaks, preferential credits, or refund of
charged taxes. The para tariff tool is therefore sale of
goods at dumped prices, that is selling one's products
abroad at lower prices than on the domestic market, or at
prices below production costs [5].
1.3 General trends in international trade
Among the economic factors (which increasingly shape
domestic and foreign policy of individual countries), there
is the role of economic cooperation at the international
level, which has grown steadily. The current industrial
civilization ruins internal markets and determines the
expansion outside, at the same time requiring power to
achieve different goals, strengthening the position in the
competitive struggle [6].
In the twentieth and twenty-first century we can
distinguish a number of phenomena and trends that are
challenging both for the theory and business practice. The
most important ones are outlined below.
1) An important issue is economic growth across the
global economy but also in specific areas. It determines
the possibilities of solving the socio-economic,
environmental and even demographic problems.
2) The subject of the battle for the growth and economic
stability, and to take the best location in the
international division of labor is international trade,
both in practice and in theory it manifests two
tendencies (the liberalization of world trade and
increasing protectionism).
3) Foreign exchange and financial market. The main area
of market self-regulation and regulation by negotiating
and institutional mechanism is the exchange rate.
4) International payment situation and the enormity of the
debt of part of the global economy relatively to its
second part. This imbalance is relatively stable and
results from the structural developmental imbalance.
Comparative European Research CER 2016 (issue I.)
82

Removing it means a long-term process of deep
structural changes.
5) In the branch-layout there is phenomenon of
transferring the entire branch of production in other
regions of the world. Then, the economies of the most
developed countries (post-industrial) transform in the
service and information economies.
6) Implementation of new techniques and technologies.
There may be, on the one hand, deepening of the
developmental gap between the leading economy and
backwardness extremities. On the other hand, the new
technologies and the information revolution create
opportunities to skip stages of development by the
countries that are economically delayed.
7) The contradiction between the requirements of the
internationalized economic space and its division into
countries jealously guarding their sovereignty. It means
changing the state's role in the world economy.
8) Another trend is the growing importance of
microeconomic level (small and medium-sized
businesses are attributed to a growing role in shaping
technical progress). This is accompanied by the
growing role of mezoeconomical level - large
manufacturing, commercial, service and financial
organizations, which, using the positive effects of scale
and more and more often the formula of multinational
companies, apply with their scope the entire world
economy.
Thanks to the favorable economic situation and liberal
trade policy in international trade, the system of economic
triad was created in the 60s with centers in the United
States, the EEC and Japan. Their growing role in the
global economy and closer trade links have increased the
concentration of the world trade in the group of the most
economically developed countries. The dynamics of
exchange of manufactured goods have also increased, as it
exceeded the rate of trade in fuels and mineral resources,
and articles of agricultural origin. The size of the world
export volume at the turn of 1950-2012 is presented in
Figure 1 (and accurate data, describing the size of that
export in individual years, was placed in a table attached to
the chart).
Figure 1: The size of the global export volume
(USD million) [7]
The high rate of growth in world trade has sharply slowed
in the years 1975-1982, since then there has been a
reduction of turnovers, which was caused by a large
increase of prices, mainly for raw materials and crude oil.
During this period, countries exporting oil (OPEC) and
dynamically developing countries of South-east Asia, and,
among economically developed countries - Japan, became
very important. From 1950 to 1985 there was a decrease in
the size of world export in the two groups (industrial
goods, and fuels and raw materials, but products of
agricultural origin remained at a constant low level). With
regard to industrial goods there was a decline in export in
the years 1995-2009, excluding 2006-2007 - during this
period there has been a slight increase. Products of
agricultural origin from 2006-2012 were at the constant
(0.2) level. While a third group that is fuels and raw
materials remained a decreasing trend from an audited year
(excluding 2004, 2006) and constantly from 2010 to 2012
there was the growth. Since 2010, we can observe an
increase in the size of world export in the three presented
groups.
Economic problems such as inflation, high unemployment,
declining demand and declining work productivity after
the collapse of the Bretton Woods system, intensified in
economically developed countries protectionist tendency,
which limited the achievements of the GATT in the
liberalization of the world trade.
Along with the recovery of the economic situation of the
world since the second half of the 80s the international
trade also entered a new stage of development, which was
characterized by high growth, an increasing share of
industrial goods, and above all, the technologically
advanced development of trade in commercial services.
The processes of regionalization taking place around the
world contributed to the geographical structure of
international trade. The greater part of the exchange is
currently taking place within the existing economic
groupings deepening the development of international
specialization. Technological progress in the globalization
of production processes, the growing importance of
multinational corporations and the liberalization of the
world trade influenced the development of intra-industry
trade, where export and import are made within the same
branch of industry.
In recent years, foreign trade has undergone significant
changes in the dynamics, geographical structure as well as
in objective one. In 2000-2005, world export developed at
a rate of 10% per year, reaching at the end of the period
the value of 12,574 billion dollars (including 10,159
0
10
20
30
19
50
19
62
19
70
19
85
19
90
19
95
20
00
20
04
20
05
20
06
20
07
20
08
20
09
20
10
20
11
20
12
Industrial goods
Fuels and raw materials
1950 1962 1970 1985 1990 1995 2000 2004
16,8 16,2 15,7 15 23 27,5 24,8 23,4
0,1 0,2 0,1 0,2 0,2 0,2 0,1 0,1
18,9 18,4 16,4 15,7 10,7 8,2 5,1 5,4
2005 2006 2007 2008 2009 2010 2011 2012
22,6 23,1 23,2 21,3 19,5 20,3 21,3 21,6
0,1 0,2 0,2 0,2 0,2 0,2 0,2 0,2
5,3 4,5 3,8 3,5 3,1 4,1 4,8 4,9
Comparative European Research CER 2016 (issue I.)
83

billion dollars of export of goods and 2,415 billion -
exports of services) [7]. In 2005, there was a significant
slowdown while deepening differences in the dynamics of
export growth. Prices, mainly of industrial and agricultural
articles, rose moderately in 2005, but the prices of fuels
and raw materials increased by 33% [7]. Such a high
increase in the prices of this type of materials may depend
on the high demand, which is exceeding supply and
inventories and is reported by rapidly developing countries
such as China and India, and countries that have high
economic growth (United States) and entering a growth
phase Japan.
The rapid increase in prices of fuel and raw materials
compared with industrial goods led to a deterioration in the
terms of trade of well economically developed countries,
for countries exporting raw materials, especially fuels. The
deterioration of terms of trade could be offset by high
growth in export volume. However, it will be possible, if
the country has high productivity in sectors with a high
share in export.
Analyzing the main directions of trade flows we can
indicate several centers and major streams focusing most
exchanges. So we can mention the three main centers of
export:
a) the European with the European Union,
b) the North American with the United States,
c) Asian with China and Japan.
The main stream of commerce is the exchange of goods
between EU member states, moreover, the European
Union trade with the United States and exchange between
China and the United States should also be mentioned
here. It is worth noting that with the increase of mutual
trade in the world trade, the problem of imbalance in
payment exacerbates. The United States have the largest
deficit. It applies mainly to exchanges with China, the
European Union and Japan. According to UNCTAD, the
size of this deficit is about 2/3 of the world's payment
surplus [8]. The European Union and other well
economically developed countries also record a high trade
deficit.
The share of the leading exporters in world export in the
years 1950-2011 is presented in Table 1.
Table 1 The share of the leading exporters in world export
in the years 1950-2011 (in%) [9]
1950 1960 1970 1980 1990
USSR 28,8 USSR 29,4 USSR 35,3 USSR 31,2 GER 25,1
GDR 12,2 GDR 9,4 GDR 9,3 FRG 8,1 USSR 15,3
CSK 9,2 CSK 8,5 CSK 7,5 GDR 6,9 GB 7,1
2000 2001 2002 2003 2004
US 12,3 US 11,9 US 10,7 GER 10,0 GER 10,0
GER 8,7 GER 9,3 GER 9,5 US 9,6 US 8,9
JPN 7,5 JPN 6,6 JPN 6,5 JPN 6,3 CHN 6,5
2005 2009 2010 2011
GER 9,3 GER 26,2 GER 26,1 GER 26,1
US 8,7 FRA 6,9 FRA 6,8 GB 6,4
CHN 7,3 ITA 6,9 GB 6,3 CZE 6,2
GB – United Kingdom; GDR – Democratic Republic of Germany; FRG – Federal Republic of Germany; USSR – Soviet Union; CSK –
Czechoslovakia; GER – Germany; US- United States of America; JPN –
Japan; CHN – China; FRA – France; ITA – Italy; CZE – Czech
Republic.
Reallocations in the direction of foreign trade flow caused
significant changes in the strength of the main exporter.
These changes include: the decreasing importance of the
US and Japan, for Russia and China; and weakening of the
United Kingdom position.
6. Conclusions
To sum up, the trade is very beneficial for many regions.
International exchange brings economies of individual
countries together and is a necessary condition for the
continuation of economic processes and economic
development. One of the basic functions of international
trade is changing the structure of the national income. By
exports of commodities, in which the country has achieved
high specialization, it is possible to import consumer and
manufacturing products, the production of which is
impossible in the country, they are made in insufficient
quantities or the production of them is not profitable. Up
against the multiplicity and diversity of goods, even the
biggest countries are not able to provide the full range of
them to its citizens by themselves. Giving up the exchange
means the impoverishment of the market with the products
made only abroad.
References
[1] Białecki K., Operacje handlu zagranicznego,
Warszawa, PWE, 1999, pp. 97-98.
[2] Rymarczyk J., Handel zagraniczny. Organizacja
i technika, Warszawa, PWE, 2012, pp. 269-270.
[3] Drabowski E., Międzynarodowe stosunki ekonomiczne
i finansowe, Warszawa, PWE, 1986, pp. 38-42; 45-47.
[4] Bożyk P., Międzynarodowe stosunki ekonomiczne.
Teoria i praktyka, Warszawa, PWE, 2008, p. 59-62.
[5] Budnikowski A., Międzynarodowe Stosunki
Gospodarcze, Warszawa, PWE, 2006, p. 225.
[6] Albinowski S., Handel między krajami o różnych
ustrojach po II wojnie światowej i prognozy do r. 1980,
Warszawa, Książka i Wiedza, 1968, p. 5.
[7] WTO, International Trade Statistics 2006,
Switzerland, WTO Publications, 2006, p. 3, 189.
[8] UNCTAD, Trade and Development Report 2005: New
features of global interdependence, New York, United
Nations, 2005, p. III.
[9] Rocznik Statystyczny Handlu Zagranicznego 2012
(Foreign Trade Statistical Yearbook 2012), Warszawa,
Zakład Wydawnictw Statystycznych, 2012.
Comparative European Research CER 2016 (issue I.)
84

ANALYSIS OF LINEAR ALGEBRA APPLICATIONS IN ECONOMICS - MATRICES BRIEFLY
Katarzyna Brożek
Kazimierz Pulaski University of Technology and Humanities in Radom
Address: Malczewskiego 29
Radom, 26-600, Poland
telephone number: +48 504174290
mail: [email protected]
Abstract: The proposed article presents the application of linear algebra in economics. Therefore, the scope of this discussion
mainly concerns the analysis of the matrices. The priority objective of the article was to identify the most important
applications of linear algebra in economics and to remind briefly the most important information related to the matrices.
So, presented article is a kind of repetition and consolidation of knowledge of students taking up the discussed issues of
mathematical economics. In order to receive the subject clearly, the work is divided into five main parts. Development was
created using the following test method, namely, it was a content analysis of the available literature.
Keywords: algebra, matrices, mathematical economics
1. Introduction
Algebra is a very large branch of mathematics. However, it
is a universal field because it provides different scientific
disciplines with modern research tools. The linear algebra
and matrix analysis have extensive applications in various
branches of mathematics. However, it is also important in
the fields of science, technology and economics. Even in
economy, the developed methods are used for effective
modeling and solving problems related to resource
allocation. The methods of linear algebra which were
formulated at the beginning of the twentieth century are
constantly improving and developing in different
directions. It is worth noting that this area has developed in
a natural way on the basis of the linear equations systems
study. However, the infinitely dimensional part has gone
toward functional analysis. While the computational
aspects (especially important in the age of computers) are
reflected in the separate sciences.
Linear algebra belongs to the department of algebra which
concerns the study of space and linear transformations.
The composition of its scope should include, among
others, the theory of matrices and determinants.
The matrix analysis is an essential tool of modern
mathematics, since it allows to present many very
complicated relationships in a simple form. Therefore, it is
very often used in business practice.
The general objective of the study is the analysis of linear
algebra with the special emphasis on matrix. Therefore, the
work is a kind of repetition and systematization of the
knowledge of the presented area. In addition, the paper
discusses the general application of the matrix in
economics and other related sciences.
Considering the extensiveness of the presented subject
matter, the work is divided into five main parts. Namely,
the first one presents the genesis of algebra, while the next
ones concern only matrices. So, among others, definition,
types and matrix operations were discussed. Finally, the
last part of the work introduces the use of the discussed
matter in economics.
1.1 The origins of algebra
An important issue that comes to mind for the analysis of
algebra is its origin, and therefore, the question - where
does algebra really begin? Generally speaking, it can be
assumed that the sources of algebra are already in the skills
of addition, multiplication or exponentiation of integers.
Replacement of numbers into the letters which is used,
allows to do similar operations in the context of much
more general algebraic systems. An attempt to answer this
question refers to the very birth of mathematical idea [1].
In the source materials there are ideas about
"algebraization" of mathematics. We are talking about the
penetration of algebra methods and spirit to all theoretical
and applied branches of mathematics. In particular, it
could be observed since the mid-twentieth century [2].
1.2 The definition of a matrix
In economics matrices play a very important role, because
a lot of economic relations can be defined using them.
Then it refers to the matrix of positive elements. It is worth
noting that the concept of matrix is a kind of generalization
of the concept of the vector [3].
I. Nykowski in his scientific publications gives the
following definition of the matrix: a rectangular array
arranged in m rows and n columns or the matrix of the
dimensions m x n (the dimension of the matrix) is called an
array of the form [3]:
in which the expressions of matrix are arranged in m rows
and n columns in such a way that the symbol ai,j is in the i -
this row and j - this column. Therefore, double indicator
matrix is called a rectangular matrix. If, however, in the
rectangular matrix there is m = n then it is called the
square matrix of order n [4], wherein for each i = 1,2, ...,
m and j = 1,2, ..., n aij symbols, also known as elements of
the matrix, represent the real numbers.
Matrices are marked with large letters of the alphabet and,
for example:
Comparative European Research CER 2016 (issue I.)
85

A = [aij] i=1…m, j=1…m lub Am x n.
It is worth noting that the elements of the square matrix for
which the number of row and column is the same (i = j)
form so-called the main diagonal [5].
Example 1. The main diagonal of a square matrix of size
3 x 3
A =
will take the form
,
when it is composed of the elements a11= -1, a22=0, a33= 3.
Furthermore, the two matrices A = [aij]m x n i B = [bij]m x n
are equal if and only if their dimensions are the same but
also the corresponding elements of these matrices are
equal [6], i.e.:
A = B ↔[ (m = k ∧ n = l) ∧ (
aij = bij )]
1.3 Types of matrices
In the literature we can find several basic types of
matrices. One of the most popular divisions is the one
dividing matrices into rectangular and square.
Among the matrices we can distinguish the following most
common types:
a) symmetric matrices - are ones in which the
numbers on both sides of the main diagonal are
equal, i.e. aij = aji, e.g.:
B =
Square matrix is symmetric if and only if AT = A
b) anti-symmetric matrices – the matrix is anti-
symmetric when its elements arranged
symmetrically with the main diagonal differ only
in the sign and the elements of the main diagonal
equal zero, e.g.:
C =
Square matrix A is antisymmetric if and only if AT = -A.
c) diagonal matrices - those in which the numbers
outside the main diagonal are all zero, e.g.:
C =
d) identity matrices (unit matrices) - are diagonal
matrices in which all the entries on the main
diagonal are equal to 1. Examples of the matrix
first, second and third order are presented further:
I1 = I2 =
I3=
e) column matrices - are rectangular matrices which
consist of only one column (which has
a dimension m x 1), e.g.:
K2 x 1=
f) row matrices - rectangular matrices consisting of
only one row (dimension 1 x n), e.g.:
L1 x 3 = g) zero matrices - are arrays of any dimension with
all its entries being zero, e.g. [7]
0 =
or 0 =
h) triangular matrices:
- lower triangular – it is a square matrix where all
the entries above the main diagonal are zero, e.g.:
A =
- upper triangular – if all the entries below the
main diagonal are zero, e.g.:
U =
i) matrix of ones or all-ones matrix – is a matrix
where every element aij = 1, e.g.:
B =
j) skew-symmetric matrices – matrices where for
each duad (i, j) aij = aji, e.g.:
A =
B =
C =
k) the transpose of matrices (transposed matrices) –
when matrices are created from particular matrix
by transposition of rows with columns while
maintaining their order. If the matrix A has
dimensions m x n then the transposed matrix AT is
a matrix of dimensions n x m.
The definition of the transposed matrix shows that
(AT)
T = A, e.g.:
A =
AT=
l) singular matrices - a square matrix is singular if
and only if its determinant is 0.
A =
or B =
because det A and det B = 0
m) non-singular matrices - they occur when their
determinants are different from 0.
det A ≠ 0
If a matrix
=
[8]
n) inverse matrix of the matrix A is called the matrix
determined by A-1
, which satisfies the equation:
AA-1
= A-1
A = In, where In is the identity matrix of
order n.
Comparative European Research CER 2016 (issue I.)
86

If a square matrix A = [aik] is a non-singular matrix, i.e. det
A ≠ 0, there is exactly one inverse matrix A-1
for it, which
is equal to the adjugate matrix multiplied by the reciprocal
of the determinant of the particular matrix.
Determinant of the inverse matrix is equal to the inverse of
the determinant of a matrix, i.e, det A-1
=
Theorem of inverse matrix:
1) A square matrix is reversible if and only if it is
non-singular;
2) If the matrix A = [aij] of order n is non-singular,
then
where Dij represent the cofactor of the elements aij of
a matrix A.
Matrix [Dij] is designated as a symbol AD and is called the
matrix of cofactors. Therefore A-1
=
[9]
1.4 Matrix operations
Just like in the case of real numbers set, also in the set of
matrices operations are applied, namely, there are three
types of matrix algebraic operations. Since we can
distinguish matrix addition / subtraction, scalar
multiplication and matrix multiplication. It is worth noting
that from the listed operations only the second one is
always feasible [10].
a) Matrix addition and subtraction
Two matrices can be added / subtracted if and only if they
have the same dimensions. When this condition is met,
then we can say that arrays have the compatible dimension
for adding. Briefly we can add / subtract the corresponding
entries. Thus, the sum / difference A ± B of matrices
A = [aij]m x n and B = [bij]k x l of equal dimensions
(i.e. m = k and n = l) will be obtained by:
A ± B =
±
=
b) Scalar multiplication
Each matrix can be multiplied by any scalar (it can, of
course, also be a negative number). To multiply the matrix
by the number (or in the terminology of linear algebra by a
scalar) we must then multiply each element of the matrix
by this scalar. Thus, α K and A M m, n (K). Matrix α A
is defined as follows [10]:
α A =
c) Matrix multiplication
Matrix multiplication A = [aij]m x n by B = [bij]k x l is
feasible if and only if the number of columns of the matrix
A (first matrix) is equal to the number of rows of matrix B
(second matrix) that is n = k, and the result the
multiplication will have a dimension m x l (multiplication
has the same number of rows as the leading matrix and the
same number of columns as the closing matrix).
Accordingly, the multiplication of two matrices is strictly
depended on meeting the requirement for dimension
(scalar, in contrast, can be multiplied by a matrix of any
size). It should be noted that matrix multiplication is not
commutative.
Matrix multiplication Am x n * Bn x l is equal to the matrix:
Cm x n = [cij]m x l, where cij =
.
1.5 The use in economics
Algebra is widely used in number theory, functional
analysis, theory of differential equations, geometry, linear
programming but also in other disciplines of mathematics.
In contrast, linear algebra is used to study rings groups,
etc. By providing their representation in linear spaces -
linear representation.
It should also be noted that algebra is also of great use in
others so very important studies. Namely, it refers to
physics (even by group theory in quantum mechanics), or
computer science, statistics (there are often huge sets of
data) and econometrics [11].
In the multi-equation econometric linear models matrices
define a mechanism of explaining the changes and the
interdependence of the model variables (i.e. matrices of
coincidence and information capacity).
Matrices are used to quickly solve complex systems of
linear equations, i.e. in those in which there are many
unknowns and there are many equations. Using matrices
we can achieve:
notation of each system of equations;
determinant of matrices is used to find the inverse
matrix and solving systems of equations using
Cramer's formulas;
the row of matrices allows to specify how many
solutions a system of linear equations has [12].
The whole theory of the matrix simplifies solving systems
of equations, which, in turn, are used to describe many real
phenomena:
in economics to describe phenomena such as inflation
and capital growth;
in the meteorology for the description of physical
phenomena and processes in the atmosphere (weather
forecast);
in physics to describe the motion of two or more
interacting bodies;
in any field in which there is an optimization problem,
i.e. minimising or maximising of the particular size or
trends of a complex nature (many factors affecting the
Comparative European Research CER 2016 (issue I.)
87

phenomenon and many relationships between these
factors).
Matrices in addition to the use in solving systems of
equations are applied in many other areas, namely to store
large data sets, which are in mutual relationship.
Matrices are often used for modeling and measurement of
the economic phenomena. They occur as the kernel
integral operators defined in sets of probability measures.
They are also a part of the inequality degree measurement
of wealth distribution, comparing the variation and the risk
(convex orderings, Lorenz, Schur), they are also used to
construct the mixtures of probability measures, and also to
determine the dynamics of Markov processes [13].
The matrix form of economic phenomena presentation can
also be found in a variety of contexts, both microeconomic
and the macroeconomic: Marx diagram, Leontief and von
Neumann models, etc.
2. Conclusions
Algebra is one of the oldest fields of mathematics.
Initially, i.e. in ancient times it involved the creation of
methods for solving equations. One of its most important
areas is linear algebra that deals with study of linear
spaces. For the origins of linear algebra we can consider an
attempt to solve systems of linear equations using the
theory of determinants, matrices, linear spaces and linear
transformations.
The arrays have enormous information potential. They are
the media of substantial methodological ideas. They are
used to present the ordered structures of phenomena in the
natural and social sciences. In addition, arrays in a great
way help, and sometimes even allow the modeling of
objects and processes emerging out of "pure mathematics".
What is important is the duality of roles that matrices play
in the research process. On the one hand, they are a school
of abstraction, and on the other hand they allow the
visualization of more general construction.
At the end we should mention a certain very important
matter associated with matrices. Well, matrix algebra is
applied only in systems of linear equations. So, there is the
problem of realism in description of real economic
relations by using linear equations - (it depends on the
nature of the tested relations). If the assumption of
linearity causes a certain degree of realism resignation,
then an accepted linear relationship can be such an
approximation of the actual non-linear relationship, that its
use is justified and reasonable.
References
[1] Kostrikin A. I., Wstęp do algebry. Podstawy algebry,
pt. 1, Warsaw, Wydawnictwo Naukowe PWN, 2004,
pp. 1-2.
[2] Leksykon matematyczny, Warszawa, Wiedza
Powszechna, 1993, pp. 220-221.
[3] Żółtowska E., Żółtowski J., Algebra. Macierze i ich
charakterystyki liczbowe, Łódź, Wydawnictwo
Przedsiębiorstwo Specjalistyczne Absolwent, 1994, p. 6.
[4] Leitner R., Zacharski J., Zarys matematyki wyższej dla
studentów, pt. 3, ninth edition, Warsaw, Wydawnictwo
Naukowo-Techniczne, 2005, p. 113.
[5] Klepacz H., Porazińska E., Wprowadzenie do
zastosowań matematyki i ekonomii. Przykłady i zadania,
VII revised edition, Łódź, Wydawnictwo Uniwersytetu
Łódzkiego, 2000, pp. 102-103.
[6] Gurgul H., Suder M., Matematyka dla kierunków
ekonomicznych, IV edition, Warsaw, Oficyna a Wolters
Kluwer Business, 2012, pp. 136-138.
[7] Ostoja-Ostaszewski A., Matematyka w ekonomii.
Modele i metody. Algebra elementarna, II edition,
Warsaw, Wydawnictwo Naukowe PWN, 2006, p. 33.
[8] Jurlewicz T., Skoczylas Z., Algebra liniowa 1.
Definicje, twierdzenia, wzory, IX edition, Wrocław,
Oficyna Wydawnicza GiS, 2002, p. 80.
[9] Klukowski J., Nabiałek I., Algebra dla studentów,
2 edition, Warsaw, Wydawnictwa Naukowo-Techniczne,
1999, p. 144.
[10] Banaszak G., Gajda, W., Elementy algebry liniowej,
pt. 1, Warsaw, Wydawnictwa Naukowo-Techniczne, 2002,
pp. 82-83.
[11] Encyklopedia dla wszystkich. Matematyka, Warsaw,
Wydawnictwa Naukowo-Techniczne, 2000, pp. 2-3.
[12] Poradnik Inżyniera. Matematyka. Second revised
edition, volume 1, Warsaw, Wydawnictwa Naukowo-
Techniczne, 1986, p. 102.
[13] Rybicki W., Kilka powodów dla których opowiadamy
studentom ekonomii o macierzach, Didactics of
Mathematics, 2010, No. 7(11), pp. 109-110.
Comparative European Research CER 2016 (issue I.)
88

COUNTERVAILING MARKET POWER ANALYSIS: ASESSING MONOPOLISATION TENDENCIES IN
BUSINESS ENVIRONMENT OF THE MODERN FINANCIAL SERVICE SECTOR
Dmitrijs Skoruks - Jekaterina Nazarova - Maija Šenfelde
Riga Technical University
Kaļķu iela 1
Riga, LV–1658, Latvia
+317 67089333
[email protected] – [email protected] – [email protected]
Abstract. The research “Countervailing market power analysis: assessing monopolisation tendencies in business environment
of the modern financial service sector” provides a multi – perspective description of the nature, the occurrence sources and
the specifics of monopolisation process development in the business environment of the modern financial service sector. The
conducted research provides an example of quantitative analysis method application within a unified evaluation framework,
while focusing on competitive environment evaluation in the relevant specific industry. The main scope of the aforementioned
research is devoted to further developing the existing monopolistic tendency detecting techniques and quantitative analysis
practices, while simultaneously considering the broader context of the market power phenomenon, its structure, influence and
effects within the chosen specific industry.
Keywords: monopolisation, market power, competition level analysis.
1. Introduction
With the vast development of modern business practices
and the advent of the globalized trade system, numerous
formerly unquestioned and unchallenged visions of
economy functioning paradigms, market mechanisms and
conformity of natural laws had already been and still find
themselves in a stage of productive transformation, re-
evaluated and positively – critical analysis from various
scholarly as well as practical perspectives.
As shown by the previous research [2], one of such
discussion areas is the process of monopolisation, which
takes place in an open market economy and seemingly
contradicting with both the economic reasoning for
competition – bases resource utilization, product
distribution as well as means of production allocation, and
the core benefit to society, brought by consumer choice
possibilities, namely, need satisfaction in the context of
market functioning efficiency.
As it had been previously argued by numerous scholars,
while the presence of the full monopoly undoubtedly bring
unrecoverable (deadweight) losses to the society, the
process of monopolisation is a natural state of affairs,
based on both resource limitations and enterprise struggle
for profitability, with the mentioned tendencies becoming
excessively persistent and particularly visible in time of
economic downslide and external shock occurrences
[5][10]. The first deviation from the situation of
competition, sufficient in terms of intensity and efficiency,
is the obtaining of a dominant market position, which is
recognized by the European Union Competition Law as
not an infringement per se, but rather as a potentially risky
situation of possible future negative market trend
development. As defined in Article 102 of the Treaty on
the Functioning of the European Union, “any abuse by one
or more undertakings of a dominant position within the
common market or in a substantial part of it shall be
prohibited as incompatible with the common market
insofar as it may affect trade between Member States”
[15].
Therefore, it may be concluded that monopolisation
tendencies are a potentially negative development, forever,
in certain situation, such state of affair may be “the least of
two evils” with regards to the only other economically
efficient option being public body interference or even
nationalisation, the latter being absolutely incompliant
with the current developments in the European Single
Market [4]. In this respect, the main question arises in
defining the limits of monopolisation process remaining an
economically natural and mostly tolerable development in
terms of market functioning efficiency fluctuations,
adjusted by the consideration of the present stage of
business cycle evolutionary maturity and the
correspondently generated economic shocks, both internal
and external, and defining a boundary, which, if crossed,
leads the industry down the path of excessive market
power concentration and counterproductive entrepreneurial
practices, creating a sufficient basis for competition
monitoring public bodies to interfere with the goal of
deterring further escalation of monopolisation process
unfavourable development [13]. The mentioned
development poses an even greater socially - economic
threat if affecting relevant markets in the modern financial
service sector due to the high dependence of entire
economic systems on loan capital attraction and insurance
of the conjugate solvency risks.
The objective of the current research is to conduct a full –
scale study on the nature of monopolisation process, the
role of market power concentration in monopolisation
tendencies’ progressive evolution and define the degree of
external factor influence in accelerating the mentioned
occurrences, contextualized within the existing business
cycle theories, with the use of analytical, comparative,
coherently – logical and economic index analysis methods
with the goal of adapting the developed methodology to
Comparative European Research CER 2016 (issue I.)
89

the specifics of the modern financial service sector
business environment.
2. Theoretical background of the conducted research
Monopoly (from Greek μονο (mono) – one and πωλέω
(poleo) – to sell) is a situation of unique advantage
presence in any industry, organization or branch that
enables the acquiring of benefits, rooting from such state
of affairs. In terms of economic evaluation, a monopoly is
defined as a special market situation, ensuring a higher
level of profitability on the behalf of price growth and
production cost cutting with the use of the so-called
monopoly position advantages [12]. It may be stated that a
position of full monopoly is the exact opposite of a perfect
competition scenario and therefore the conduct of
competition in the former case would contradict the
relevant process in the latter. The main problem at this
point may be defined as reality risk assessment in
comparison with those of strictly hypothetically –
theoretical origins: can an enterprise, if its actions are left
unchecked by the authorised competition situation
monitoring public bodies, may firstly reach for a dominant
position in the market and, if successful, push for a full
economic monopoly through the abuse of its leader status-
generated advantages [1]?
Therefore, the process of monopolisation may be described
as a trend or push towards obtaining a de facto full
monopoly status by consolidating market power through
implementing risks or costs on the existing competitors
and accumulating a necessary amount of the mentioned
market power to gain a dominant position in the market in
order to create internal barriers for potential competitor
possible future entry preventive blocking. Such process,
while generally being lengthy and in a sense incremental,
commonly occurs under competitive economic conditions
in contrast to an industry – level shock occurrence
scenario, in which case the process of monopolisation may
accelerate and conduct at a rather swift pace.
Through a qualitative analysis of the relevant scientific
literature, it may be concluded that the existing empirically
– theoretical framework provides a solid basis for
development of a quantitative analysis of competition
structural composition in various heterogeneous product
relevant markets and the establishment of a conceptual
methodology for the previously mentioned evaluation
conduction seems empirically possible. In line with the
mentioned logic, a quantitative analysis of the researched
problem shall require both an empirical model, capable of
detecting monopolistic tendencies under competitive
economic conditions or, simply put, a situation of
consistent yet commensurate economic growth, and a
specialised input data levering derivative algorithm, which,
when applied, will reflect the business cycle-imposed
market correction in the context of nominal competition
conjuncture effective reconfiguration. Furthermore, the
specifics of modern financial sector business environment
needs to be taken into consideration.
3. Concept of the developed monopolisation process
evaluation methodology
An important development in the context of the conducted
analysis may be expressed in the form of previously
defined factor mutual economic influence and the causality
of the relevant process. Considering both prices and
market capacity structural composition, it is imperative to
acknowledge that, while focusing on supplier market
power, the most logical perception of the situation would
be achieved through the prism of demand – side analysis.
If, as argued Christopher and Shughart [14] an enterprises’
market power is proportionate to its size, the measurement
of that very aspect shall deliver a precise answer to the
addressed question of monopolistic tendency dependence
on disproportionate market influence concentration in
certain supplier clusters, thus leading to the need of
defining an enterprises’ size in an analysed relevant
market.
Individual supply amount is critically affected by the
existing or potential demand amount, with both of the
mentioned fundamental economic factors being equalized
or mutually balanced by the common denominator of
competitive price. Therefore, it may be concluded that the
effective size of an enterprise, measured by its presence in
a relevant market, is determined by the symbiosis of its
individual supply amount and the corresponding sale price.
Taking the next step forward, it may be deduced that the
individual supply amount multiplied by the relevant
existing sale price would equal the turnover of the
mentioned enterprise over a defined timeframe.
Consequentially, it may be concluded that, if an industry
level market power distribution analysis is being
conducted or the required perspective dictates an
evaluation, only focusing on a certain product type or non
– supplementary market structures, the turnover of the
supply – constituting enterprises shall deliver the required
accurate and objective results [2].
It is important to note that, in terms of harmonizing the
used quantitative data, it would be advisable to use the net
turnover as the main input element of econometric
modelling due to the nature of the mentioned information
and the unification of value added tax, excise and other
duty rates within the context of a relevant market that is
usually the existing state of affairs in most if not all of the
modern developed economies. In quantitative terms,
dividing the net turnover of an enterprise by the total
market consumption capacity, defined as the sum of all
involved supplier individual net turnover, expressed in per
cent measurements, constitutes an adequate method of
individual market share calculation. As a side note, the
European Commission takes a similar approach to the
problem of enterprise individual market share definition
[7].
As argued by various authors [3][8] including Chamberlin
[7] and Robinson [9], in a situation of perfect competition
no enterprise possesses any market power at all, therefore,
by applying the same logic as above, it may be concluded
that the market shares in the mentioned situation should be
evenly distributed between the involved suppliers, thus
constituting a mutually proportionate involvement in the
aggregate supply amount creation. If an enterprise
increases its individual supply amount in order to
Comparative European Research CER 2016 (issue I.)
90

maximize its profit, the marginal revenue sealing,
determined by the constantly fixed, industry level unified
price will quickly set a maximum financially profitable
individual supply amount, which, ceteris paribus, shall be
common for all the involved suppliers. Therefore, a
situation of perfect competition not only constitutes a
completely equal market share distribution, it
simultaneously creates a situation of equivalence between
the aggregate quantitative measurement of common
average market shares and the cumulative individual
market power interactional output.
Consequentially, for the purpose of further conducting the
current research, the theorem of perfect competition as a
structural market conjuncture type creating a situation of
non – existent individual market power, based of equal
market share distribution, deriving from objective
economic limitations to individual supply amount
profitable delivering, shall be perceived as having been
rationally proven in the above described empirical
causality rationalising experiment, conducted with full
accordance to Austrian economic school’s tradition [11].
Therefore, in case of imperfect or, as defined by
Chamberlin [6], monopolistic competition, which is the
source of monopolisation process development and
monopolistic tendency emergence, market power is
distributed unevenly between the suppliers, active in a
relevant market, and the trend of exercising the available
influence derives precisely from the ability to either
neglect or predetermine the retaliation actions of the
effective competitors, which consequentially leads to
monopolistic tendency strengthening and potential
dominant position establishing.
Following such logic, the ratio of cumulative individual
market power distribution in case of the existing
monopolistic competition to the equivalent value in
situation of perfect competition would objectively and
rationally reflect on the current state of monopolistic
tendency development and, if a dynamic trend is analysed,
enable the calculation of such occurrence future emergence
probability. The mentioned concept may be graphically
interpreted as a deviation interval, reflected in Figure 1[2]:
Figure 1: Empirical concept of market power distribution reflecting indicator
As it may be seen from figure 1, the cumulative
distribution of market power is reflected in terms of the
relevant values’ proximity to the conditionality of perfect
competition situation, thus establishing an experimental
reference framework, enabling the analytical definition of
the assessed market to shift from the field of theoretical
description to the area of applicable characterising and
practical quantitative analysis of the detected peculiarities.
4. The quantitative structure and functioning
principles of the developed methodology
In order to incorporate an indicator, reflecting the role and
magnitude of individual market power distribution
between suppliers, involved in economic activities in a
relevant market into the econometrical structure of the
developed methodology, while simultaneously considering
the theoretical and conceptual basis, established in the
previous empirical research [2], an understanding of
cumulative market power amount and its disproportionate
allocation within a market must be reformatted to suit the
specifics of the modern financial service sector.
The number of enterprises in the relevant industry, their
net turnover amounts and the corresponding divergence
from the state of perfect competition are the necessary
structural elements of the relevant indicator. Assuming,
that in a situation of perfect competition no market actor,
engaged in economic activity on the supply – side of the
existing equilibrium, has any market power vis – a – vis
direct competitors, the individual market shares must be
equal for all of the mentioned supplier in terms of their
percentage proportion of the cumulative market
consumption maximum level [2]. The mentioned state of
affairs had been found to remain relevant for modern
financial service sector, if the latter is being assessed
through the prism of the relevant market concept, widely
used in EU Competition Law. Therefore, the relative
market share of a supplier, operating within a market of
perfect competition, is inversely proportionate to the
number of suppliers, involved in economic activities,
which uphold a certain equilibrium sale price and have no
artificial entrance or exit barriers [2].
As it had been previously argued, an indicator of market
power concentration distribution is based on measuring the
state of de facto market condition being divergent from
those, found in the situation of a perfect competition in the
context of enterprise mutual interconnectedness on the
supply – side of the general market equilibrium [2].
Therefore, an element of individual market power mutual
compensation arises, meaning that competing entities, both
exercising their respective market influence with profit
maximization goal, simultaneously engage each other in a
struggle for and of market power, with the results of the
mentioned competitive collision being determined by the
difference in employed market power. While presuming
that each enterprise is rationally motivated to exploit their
maximum market power on a largest possible scale and
that every enterprise in a competitive environment
theoretically engages every other opponent with the
synergetic effect of marker power being a holistic
economic phenomenon, the aggregated disproportionality
of market power distribution in a relevant market may be
determined as the opposite of simultaneous individual
market power cumulative mutual compensation, to be
Comparative European Research CER 2016 (issue I.)
91

more precise, its excessive amount, which is not being
cancelled out by a pro rata competitors influence [2].
Therefore, mutual cumulative individual market power
compensation, occurring in the relevant markets of the
modern financial service sector may be reflected by what
for the purpose of the current research shall further be
referred to as the financial sector mutual compensation
index, which may be calculated in the quantitative fashion,
described in Formula 1:
(1.)
where:
MSHi – de facto individual market share of a supplier, %;
MSHe – nominal individual market share of a supplier if
the relevant market is in a state of perfect competition, %;
MCIf – financial service sector mutual compensation
index, scalar values.
The introduced financial sector mutual compensation
index, as any other economic indicator, delivers
quantitative outputs that fall under a certain numerical
threshold, enabling the interpretation of the acquired
results on a conceptually – qualitative level. In order to
objectively assess the detected market power distribution,
the output value ranges and their corresponding
interpretations, specifically relevant for such financial
service sector markets like, for example banking or
insurance, are summarizes in Table 1:
Table 1 Financial service sector mutual compensation index’s quantitative value ranges and their respective interpretation Value range [0] (0;0.19] (0.19;0.39] (0.39;0.71] (0.71;1]
Level of individual marker
power mutual compensation Absent Insufficient
Fractionally
sufficient Sufficient Fully sufficient
Economic characteristics De facto full
monopoly Dominant market
position or oligopoly Cross – niche competition
Differentiated
monopolistic
competition
Classic monopolistic competition
Competitive situation Absence of efficient
competition
Uncompetitive
environment
Fractionally competitive
environment
Competitive
environment
Sustainable competitive
environment
As it may be seen from Table 1, the mutual compensation
index reflects both the specifics of the analysed relevant
market’s conjuncture and the state of competition within
the mentioned economic unit, thus enabling a multi – scale
assessment of business processes from a dual, private and
public actor, perspective, the former comprising of market
entry attractiveness and the required entrance effort
evaluation, while the latter focusing on the health of the
existing competition environment in the context of
regulatory intervention necessity in line with the
established competition policy enforcement. The value
ranges, reflecting the relevant competition situation, differ
from those of the empirical model [2] due to the
functioning and differentiation specifics of relevant
markets, comprising the modern financial sector.
5. Conclusions
Taking into account the conduct, results and findings of
the described research, the following may be concluded:
Monopolisation process is most likely to develop in
situations of disproportionate individual market power
distribution between financial service suppliers,
involved in economic activities within a defined
relevant market and in this respect does not
empirically differ in terms of conduction, depending
on the type of the mentioned relevant market;
Monopolisation process origins are common for most
modern business environments, including financial
service sector comprising relevant markets, and may
be traced to the disproportionate distribution of
individual market power within a defined relevant
market, while
being closely related to the overall interaction
intensity between niche – targeting supplier groups;
Monopolisation development trends and their
magnitudes may be evaluated through analysis of
individual market power mutual compensation effect
in the context of the aforementioned niche – level
competition in financial service sector as well as most
other types of relevant markets.
References
[1] Dmitrijs Skoruks, Procedia - Social and Behavioral
Sciences, Vol. 110, No. 1, pp. 202-214, 2014.
[2] Dmitrijs Skoruks, Jekaterina Nazarova, Maija
Šenfelde, Sciemcee Publishing: Proceedings of the 4th
Biannual CER Comparative European Research
Conference, Vol. 2, No. 2, pp. 67-71, 2015.
[3] Massimiliano Vatiero, European Competition
Journal, Vol. 6, No. 3, pp. 689–707, 2010.
[4] Maurice Stucke, Oxford Journal of Antitrust
Enforcement, Vol. 1, No. 1, pp. 162-197, 2013.
[5] Paul Samuelson, Review of Economic Statistics, Vol.
21, No. 1, pp. 75–78, 1939. [6] Edward Chamberlin, On the Origin of Oligopoly:
Reediting, Cambridge, Cambridge University Press,
2010, pp. 113–149.
[7] European Commission, Commission Notice on the
Definition of Relevant Market for the Purposes of
Community Competition Law, Brussels, Official Journal
of the European Communities, 1997. Pp. 5 – 13.
[8] Irving Fisher, The Nature of Capital and Income,
London, Macmillan, 2012, pp. 173–198.
Comparative European Research CER 2016 (issue I.)
92

[9] Joan Robinson, The Economics of Imperfect
Competition: 1969–2012 Anthology Edition, London,
Macmillan, 2012, pp. 189–211.
[10] John Maynard Keynes, The General Theory of
Money, Interest and Employment, London, Macmillan,
2011, pp. 289–315.
[11] Joseph Schumpeter, History of Economic Analysis,
London, George Allen & Unwin, 1954, pp. 657-721.
[12] Milton Friedman, Capitalism and Freedom,
Chicago, The University of Chicago Press, 1962, p. 208.
[13] Directorate for Financial, Fiscal and Enterprise
Affairs, Glossary of Industrial Organisation Economics
and Competition Law, Paris, Organisation for Economic
Cooperation and Development (OECD), 1993, p. 57.
http://www.oecd.org/regreform/sectors/2376087.pdf.
[14] Lawrence White, Market Power: How Does It
Arise? How Is It Measured? New York: New York
University, Leonard N. Stern School of Business,
Department of Economics, Working papers, EC-12-06,
2012. http://web-docs.stern.nyu.edu/old_web/economics
/docs/workingpapers/2012/White_MarketPowerRiseand
Measure.pdf.
[15] Treaty on the Functioning of the European Union
(TFEU) [Consolidated version], Rome, 1958, pp. 88 –
89. http://eur-lex.europa.eu/legal-content/EN/TXT/PDF
/?uri=CELEX:12012E/TXT&from=EN
Comparative European Research CER 2016 (issue I.)
93

Session: Industrial Engineering, Innovations Index of Author(s)
Burket, Josef Gubová, Klaudia Matuszková, Radka Nouzovský, Luboš Novák, Jan Radimský, Michal Richnák, Patrik
Comparative European Research CER 2016 (issue I.)
94

TESTING OF AUTOMOTIVE SAFETY TECHNOLOGIES
Luboš Nouzovský – Josef Burket – Jan Novák
CTU in Prague, FTS, Department of Forensic Experts in Transportation
Horská 3
128 03, Prague 2, Czech Republic
+420 224 359 003
[email protected] - [email protected] - [email protected]
Abstract: The paper aims to particular elements of automotive active safety elements and their testing. Experiments were made
with Volvo V40, which is equipped with many modern technologies. Tested were collision warning with automatic brake and
pedestrian detection, which are based on laser, radar and camera.
Keywords: active safety, modern technologies, pedestrian detection, automatic braking
1. Introduction
Since the beginning of the age of motor transport, the
attention of vehicle manufacturers was primarily focused
on ensuring the safety of the driver and occupants. Thanks
the development of modern technologies it could be more
focused on other road users with them the vehicle may
crash. The most vulnerable of them are considered
pedestrians. Vehicle manufacturers therefore endeavor to
develop components and automated systems that could
mitigate consequences of collision with them or other
vulnerable road users (children, cyclists etc.). These are
mainly design crumple zones and car equipment
technology that can detect pedestrians and avoid a
collision or mitigate its consequences.
Technologies, which are the main object of this article, can
be classified as active safety features – they should prevent
from an accident. Passive safety features mitigate crash
consequences of occupants or pedestrians in a collision
with a vehicle. Passive safety elements - it are for example
subsystems implemented primarily in front of the vehicle.
Basic measures are modifications of bow’s shape, such as
the rounded edges, the front edge of the bonnet moved
behind bumper etc.
Testing of modern active safety systems of Volvo V40 was
carried out by members of Department of Forensic Experts
in Transportation, Faculty of Transportation Sciences CTU
in Prague. This car is a hatchback lower middle-class,
which shares a chassis platform and some engines with its
relative Ford Focus. Volvo V40 is worldwide first mass-
produced car with airbag for pedestrians, which is located
under hood. Tested model was equipped with active
electronic safety systems newest generation including
pedestrian detection with automatic braking.
2. Safety equipment
Volvo cars are generally equipped with a lot of active and
passive safety elements. These include various active
systems such as ABS, DSTC (ESP) - dynamic stability and
traction control, EBA – braking assistant, EBL –
emergency brake lights, City Safety 2nd generation and
others. Tested model had a supplement package „Driver
Support Packet 1“, which includes newest electronic
elements. This above-standard equipment uses radar, laser
and camera. Position these components are portrayed on
the picture.
Figure 1: Position of camera, radar and laser
3. Tested safety programs
Most of safety programs, which are included in the car, use
components noted above. Tested were two programs,
which should reduce probability of collision with another
object or minimize its impact by decreasing collision
speed.
3.1 Collision warning and auto brake and pedestrian
detection
The driver is warned and system automatically brakes if
the car risks collision with another vehicle in front or with
pedestrian. This is based on recognition algorithms and
aggregated data from radar and camera. If the car system
evaluates, that the situation is dangerous - for example into
the track of a vehicle enters a pedestrian, the car warns the
driver visually and acoustically (blinking red LEDs). Car
brakes automatically and stop (under ideal conditions)
before obstacle, if the driver do not react. In the case of a
manual gearbox, car turns off the engine and the on-board
computer display messages "Automatic braking was
activated". After re-pressing the clutch pedal the engine
starts.
Comparative European Research CER 2016 (issue I.)
95

Collision warning has 3 phases:
1) Visual and acoustical warning
2) Brake support
3) Automatic braking
Whole algorithm works with data from radar and camera.
The car should according to predefined scenarios in a
particular situation optimally respond. In case of detection
of pedestrians, it is necessary that figure fit the parameters
of body silhouette. It means that it has to have a head,
shoulders, arms, torso and legs. This functionality is
however limited by variety of boundary conditions
including for example:
Pedestrian has to be 80 cm tall or taller.
The system doesn’t detect pedestrian carrying some
package or bicycle.
The system isn’t active during dusk and night.
The system is active between 4 and 80 km/h.
The system effectively brakes up the speed to
50 km/h.
3.2 City Safety The system helps the driver to avoid the collision in
congestion, active is at speeds to 50 km/h. Its task is
automatic braking in front of solid obstacle and is based on
laser (transmitter and receiver behind windscreen). The
automatic braking is activated at the last moment like in
case of a collision warning. The system reacts at the last
moment, in a situation, when the driver should have started
braking because of the elimination of car's intervention
into the driver control. It can prevent from the collision, if
the difference in speeds between cars is less than 15 km/h.
Again, the system is inactive up to the speed of 4 km/h.
3.3 Other features [1] A) DA (Distance Alert)
Feature that helps the driver keep a safe distance to the
vehicle in front. Active is in speed higher than 30 km/h.
B) RSI (Road Sign Information)
It is an application that through the camera reads vertical
traffic signs and shows them on the panel display next to
the speedometer.
C) BLIS (Blind Spot Information System)
The system is based on radar sensors located in the rear
corners of the car, behind the bumper cover. The radars
continuously scan the area behind and alongside the
vehicle and alert the driver to rapidly approaching vehicles
up to 70 m behind the car too.
D) CTA (Cross Traffic Alert)
Cross Traffic Alert uses the radar sensors at the rear end of
the car to alert the driver to crossing traffic from the sides
when reversing out of a parking space.
E) DAC (Driver Alert Control)
Application designed to attract the driver’s attention when
losing concentration while driving. Compares the lane
markings with steering wheel movements, if these two
facts are too different from each other, the car alerts the
driver to rest.
F) LKA (Lane Keeping Aid)
This feature applies extra steering torque to the steering
column when the car gets close to a lane marking and is
about to leave the lane. The system is active at speeds
between 65 km/h and 200 km/h.
4. Testing For every program, or changed boundary conditions, were
carried out series of tests. Testing was realized during one
day for almost stable conditions. Temperature was 12°C,
road was almost dry with a local occurrence of small
puddles. On wheels were winter tires Dunlop SP Winter
Sport 4D 225/40 R18 with tread pattern over 7 mm. Test
speeds were 1 – 45 km/h.
Due to the expected edge case testing of the systems was
needed primarily to ensure safety for all participants. For
tests was made special dummy from fabric and similar
materials, so that in the case of collision wasn’t tested
vehicle damaged. This dummy was during the tests
attached to a pulley system, through which was simulated
crossing the road. Besides the dummy were used to test
other objects - obstacles in the traffic (e.g. traffic cone).
Figure 2: Volvo V40, dummy and a pulley system
4.1 Standing person The series of tests were carried out at various
predetermined speeds and identical conditions. The system
was at a very low speed inactive, by speed over 4 km/h
and standing “person” worked without problems.
Maximum absolutely safe speed for stopping was 35 km/h.
At a speed of 43 km/h there was a slight touch of the front
bumper with lower limbs the dummy, which would be in a
collision with a pedestrian without serious consequences.
The smaller figure than the 80 cm system does not
recognize.
4.2 Moving person
If the dummy was during a collision in the axis of the car,
then the car launched detection, audio visual warning and
automatically stopped in all test trials. But when dummy
was off car’s axis, i.e. in the area of lights/fender was
launched only audiovisual warning without subsequent
braking. The car thus identified the presence of
pedestrians, didn’t start however automatic braking.
Comparative European Research CER 2016 (issue I.)
96

4.3 Two persons and unknown objects When in front of the car were two moving dummies, either
in the same direction or against each other, audiovisual
alarm was launched, but the vehicle never stopped. This
can be considered as a serious shortcoming because on
pedestrian crossings often occurs more than one person.
The dummy leading bicycle was not detected, thus the car
didn’t brake. This result is in accordance with the owner's
manual, which states that the silhouette of the body must
not be disturbed by other objects.
4.4 Pedestrian detection at night Unfortunately the system doesn’t detect persons during
dusk and night. But time of poor visibility should be a
target of using, because it is period, when the system could
be best utilisable, which shows accident rates in the Czech
Republic. Every year more than one third of accidents in
the village (i.e. at speeds to 50 km/h, when the system
should work with maximum efficiency) involving
pedestrians happened in poor visibility. But their
consequences are approximately 3 times worse than in
good conditions. [2, 3]
The fact that in poor visibility system doesn’t work is due
to the fact that it is primarily based on image recognition
from cameras and radar object distance measurement. So
called night vision is under ideal conditions based on
recognition of heat emitted by objects – humans. It is
system using thermal imaging cameras, which measure
and evaluate object’s temperature. Considering the price, it
has so far used the cheaper technology - infrared cameras
coupled with infrared emitters.
4.5 City Safety
Tested was braking and stopping ahead of some solid
obstacles various shapes and heights. If the longitudinal
axis of the vehicle was directed to object, the car actually
braked in time, without any warning. In the case of
inattention such a system can significantly contribute to
protecting the health and property. Positive aspect is also
that the system works even in poor visibility, and in worse
weather conditions, because it uses a laser.
5. Conclusions
Pedestrian detection with automatic braking is very
perspective function, which can prevent from mortal and
serious collisions. The tests show that system has
significant limitations and isn’t absolutely faultless.
For a fully-fledged and smooth operation the system
should be in the future improved especially in the
following ways:
Detect not only one but more pedestrians in front of
the car and brakes ahead of them.
Detect persons smaller than 80 cm (children)
Detection in poor visibility
References
[1] Volvo Cars. https://www.media.volvocars.com/glo
bal/en-gb/media/pressreleases/45562/the-all-new-volvo-
v40-safety-and-support-the-most-intellisafe-car-in-the-
segment
[2] Nouzovský, L. Effect of visibility and lighting
conditions on pedestrian safety in traffic. International
Masaryk conference for Ph.D. Students and young
researchers, pp. 2534-2537, Sciemcee, 2015.
[3] Ředitelství služby dopravní policie Policejního prezidia
ČR.
Comparative European Research CER 2016 (issue I.)
97

TRAFFIC SAFETY IN ROAD TUNNELS
Radka Matuszková – Michal Radimský
Brno University of Technology, Faculty of Civil Engineering
Veveří 331/95
Brno, 602 00, Czech Republic
+420 724 573 969
Abstract: Construction of tunnels has positive effect both economical and ecological, as tunnels lower travel time and has low
impact on environment. This paper focuses on traffic safety in road tunnels and describes specific issues which may effect how
drivers perceive situation or help towards the accident. Paper also describes three the most tragic accidents in road tunnels
which led to significant increase of safety requirements. According to analysis of traffic accidents in selected highway tunnels,
accident rate in tunnels isn’t any different comparing to road infrastructure in rural areas. Relative accident rate which
considers length of tunnel, traffic intensity and time, shows that there are 0.10 to 0.73 accidents per million vehicle-kilometers
per year.
Keywords: tunnel, traffic safety, accident rate
1. Introduction
Tunnel is civil structure which underpass obstacles like
elevated landscape, sea, river or city. Usually serves for
roads, railways or pathways. The longest road tunnel in the
world is Laerdal tunnel in Norway, which connects cities
Laerdal and Aurland. It is 24.5 km long and operates since
27th November 2000 [1]. The longest road tunnel in Czech
Republic is Tunnel complex Blanka which is 5.5 km long
and operates since 19th September 2015. Tunnel is divided
in three partial tunnels (Brusnický, Dejvický, Bubenečský)
and is considered as the longest city tunnel in Europe [2].
Construction of tunnels has positive effect both
economical and ecological, as tunnels lower travel time
and has minimal impact on environment. According to
analysis of traffic accidents in selected highway tunnels
accident rate isn’t any different comparing to road
infrastructure in rural areas. But tunnels also represent
dangerous places on civil infrastructure because
consequences of traffic accidents are more serious than on
open roads, especially when accident results into fire [3]
[4].
2. Specific issues of road traffic safety in tunnels
Behavior of drivers in tunnels is different than on open
roads. Enclosed space in tunnel may summon specific
issues like feelings of imprisonment, claustrophobia, fear,
issues with sight distance due to dimness or transition from
light to dimness, monotony of surrounding and loss of
orientation where vehicle is. Drivers tend to behave in
tunnels more carefully but also more convulsively and are
easily subject to abbreviated behavior [5].
Next specific issue in tunnel is worse lateral friction of
carriageway. That is why speed limit in tunnel is lowered
to 80 km/h or 60 km/h. Worse friction is caused by
different climate inside the tunnel compared to outside.
Accumulation of exhausted gas, dust and debris which
settle on carriageway has (due to lack of wind, rain, etc.)
negative effect on lateral friction. Effective measure is
consistent maintenance [6].
3. Tragic traffic accidents in tunnels
Three the most tragic accidents in road tunnels happened
in European tunnels under Mont Blanc, Tauern and St.
Gotthard. These accidents caused numerous fatalities and
bring more attention to traffic safety in road tunnels.
3.1 Accident in Mont Blanc tunnel
March 1999, in 11.6 km long road tunnel, accident of truck
full of four and margarine resulted into fire. Cargo wasn’t
any dangerous, however due to fire 39 people died. Fire
lasted for 53 hours and caused major damage to the tunnel,
tunnel was closed till March 2002 [7] [8].
Tragedy was amplified due to mistakes in tunnel security
and coordination of rescue operations. Rescue was done by
French rescue units, Italians weren’t even informed. Next
mistake was made in ventilation set up, which brought
fresh air inside the tunnel and helped to spread the fire.
Lack of oxygen (due to fire) inside the tunnel made it
impossible for cars to leave the tunnel, because engines
weren’t able to work, same problem forced firefighters to
walk the tunnel on foot [7] [8].
Figure 1: Accident in Mont Blanc tunnel [9].
Leaders of security of both sides of tunnel were found guilty
and sentenced to 6 months in jail. Driver of the truck was
Comparative European Research CER 2016 (issue I.)
98

sentenced to 4 months conditionally. Original cause of fire
was never found, speculations inclined to cigarette butt [7].
3.2 Tauern tunnel disaster
May 1999, in 6.4 km long highway tunnel between
Salzburg and Villach started fire. Due to tragedy 12 people
died and 49 were seriously injured. Fire lasted for 14 hours
and caused damage to the tunnel, which resulted in 3
months of repairs. Cause of the fire was truck carrying
paint accident, driver was unable to slow down fast enough
and smashed 5 other vehicles. Driver of the truck was
sentenced to 2 years in jail [10].
Figure 2: Tauern tunnel disaster [11]
3.3 St. Gotthard tunnel accident
St. Gotthard tunnel through Alps from Germany to Italy is
16.9 km long. In October 2001 widespread fire occurred in
tunnel, cause was head-on trucks collision. Afterwards
alcohol was found in blood of one of the drivers. Due to
accident 11 people died. Fire last for about 6 hours and
tunnel was for 2 more months closed for repairs [12].
Figure 3: St. Gotthard tunnel accident [12]
4. Accident rate in selected Czech tunnels
Not long ago Czech press presented article, which says
that Czech drivers cause in tunnels more traffic accidents
than Austrian or German drivers. Article says, that in
German tunnels happen 0.23 accidents per million vehicle-
kilometers, in Austrian tunnels 0.01 accidents and in
Czech tunnels it is 0.31 accidents per million vehicle-
kilometers. Recent research, which monitored behaving of
Czech drivers in tunnels, revealed that Czech drivers drive
0.3 m closer to the middle of the carriage way in than they
are on open roads [4].
To analyze accidents four tunnels on Czech highways were
selected. Klimkovice tunnel on highway D1, Valík tunnel
on highway D5 and Libouchec tunnel and Panenská tunnel
both on highway D8. Analyzed were all traffic accidents
which, according to Czech Police’s identification,
happened in tunnel. However, results show that this
identification may not be accurate enough, especially
accidents near tunnel portals are sometimes identified as
“in tunnel” and sometimes not. This may be caused by
different approach of different police officers or inaccurate
determining of accident’s location in map. And especially
near tunnel portals count of accidents are higher.
For comparative analysis were selected standard indicator
of relative accident rate, which included not only absolute
number of accidents, but also traffic volume, duration or
time period.
Indicator of relative accident rate is the most common used
characteristic which indicates the probability of an
accident on selected section of road in relation to traffic
flow.
where, R = relative accident rate (number of accidents/
millions of vehiclekilometers per year) and NO = number
of accidents and I = average daily traffic (vehicle/24h) and
L = length of section (km) and t = monitored period of
time (year).
4.1 Klimkovice tunnel
Kimkovice tunnel is located on highway D1 near Ostrava
city and contains two tunnel tubes 1076 and 1088 meters
long. Each tube has 2 traffic lanes and carriageway is 9.5
m wide. Speed limit is set to 80 km/h. Tunnel started
operation in May 2008. Tubes are connected by evacuation
passages. During construction was for the first time in
Czech Republic used so called fireproof concrete, which
contains polypropylene fibers. Fibers vaporize during fire,
creates space for concrete to spread and helps to avoid
structure failure [14].
Since start of the operation 5 accidents happened. The
most common type of accident is collision with solid
obstacle. Just one accident resulted in injury and only light
injury. Main cause of three accidents was not enough
driver attention. Two from these accidents happened on
icy road and two happened during night. One accident
resulted in fuel or oil leakage. Relative accident rate is
0.12 accidents per million vehicle-kilometers per year
[13].
Comparative European Research CER 2016 (issue I.)
99

Figure 4: Traffic accidents in Klimkovice tunnel (all
accidents regardless accident place)
4.2 Valík tunnel
Valík tunnel is located on highway D5 near Pilsen city and
contains two tunnel tubes 380 and 390 meters long. Each
tube has two traffic lanes and carriageway is 11.5 m wide.
Tunnel operates since October 2006 and speed limit is set
to 80 km/h. Tunnel fulfills requirements of European
standards, such as automated ventilation, surveillance and
control systems, SOS system, etc [15].
Figure 5: Traffic accidents in Valík tunnel (all accidents
regardless accident place)
In Valík tunnel only 3 traffic accidents happened since
2007, one of these resulted in light injury of 3 people.
Most common type of accident is collision with solid
obstacle. Main cause of two accidents was insufficient
attention of driver. Two accidents happened on dry
carriageway, one on wet surface. One accident resulted in
fuel or oil leakage. Relative accident rate is 0.10 accidents
per million vehicle-kilometers per year [13].
4.3 Libouchec tunnel
Libouchec tunnel is located on highway D8 near
Libouchec village. Tunnel contains two tunnel tubes 670
and 520 meters long. Tunnel operates since December
2006 and has carriageway 9.5 meters wide. Speed limit is
set to 80 km/h. Tunnel fulfills requirements of European
standards such as automated ventilation, surveillance and
control systems, SOS system, etc [16].
Figure 6: Traffic accidents in Libouchec tunnel (all
accidents regardless accident place)
Since 2007 there were 13 traffic accidents, none resulted in
health damage. More than half of accidents were identified
as collision with solid obstacle, almost 70 % of accidents
were caused by insufficient driver attention. Five accidents
happened while carriageway in tunnel was wet or icy and
five accidents happened during night. Two accidents
resulted in fuel or oil leakage. Relative accident rate is
0.73 accidents per million vehicle-kilometers per year
[13].
4.4 Panenská tunnel
Panenská tunnel is located on highway D8 close to
Libouchec tunnel. Tunnel contains two tunnel tubes 2168
and 2116 meters long. It operates since December 2006
and has carriageway 9.5 m wide. Speed limit is set to 80
km/h. Tunnel fulfills requirements of European standards
such as automated ventilation, surveillance and control
systems, SOS system, etc [17].
Since 2007 23 traffic accidents happened in tunnel, none
resulted in health damage. 16 accidents were identified as
collision with solid obstacle, 65 % accidents were caused
mainly by insufficient driver attention. Carriageway was
wet or icy during 6 of these accidents, 10 accidents
happened during night. One accident resulted in fuel or oil
leakage. Relative accident rate is 0.36 accidents per
million vehicle-kilometers per year [13].
Comparative European Research CER 2016 (issue I.)
100

Figure 7: Traffic accidents in Panenská tunnel (all
accidents regardless accident place)
6. Conclusions
Analysis of accidents on selected highway tunnels shows
that accident rate isn’t any different in tunnels than on
open roads in rural areas. Relative accident rate, which
reflects length of tunnel, traffic intensity and time, shows
that there are 0.10 to 0.73 traffic accidents per million
vehicle-kilometers per year. The most dangerous from
analyzed tunnels is Libouchec tunnel located on highway
D8. The least dangerous is Valík tunnel which is also the
shortest one and the widest one analyzed. Most common
type of accidents are collisions with solid obstacles, mostly
tunnel walls or guard stones. Most common cause of
accidents are situations where drivers don’t pay enough
attention to driving. Important safety measures to prevent
tragedies are primarily adequate tunnel lighting,
ventilation, surveillance systems, emergency lines and
bays and emergency exists.
Acknowledgements
This paper has been worked out under the project No.
LO0108 "AdMaS UP - Advanced Materials, Structures
and Technologies", supported by Ministry of Education,
Youth and Sports under the „National Sustainability
Programme I.
References
[1] https://cs.wikipedia.org/wiki/Lærdalský_tunel
[2] https://cs.wikipedia.org/wiki/Tunelový_komplex_ Blan
ka
[3] POŠUSTA, Pavel. Hrozí v dálničních tunelech
katastrofy? Dálnice.com. 2004.
[4] http://zpravy.idnes.cz/cesi-bouraji-v-tunelech-casteji-ne
z-nemci-a-rakusane-fh5-/domaci.aspx?c=A150921_09
0312_domaci_pku
[5] SIKOROVÁ, Kateřina a Aleš BERNATÍK. Analýza a
hodnocení rizik při dopravě nebezpečných látek. Ostrava:
VŠB-TUO, 2014. ISBN 978-80-248-3492-4.
[6] ŠRŮTKA, Jiří. Protismykové vlastnosti
cementobetonových krytů v tunelech. ASB-portal.cz:
odborný stavební portál. October, 2012.
[7] https://cs.wikipedia.org/wiki/Montblancký_tunel
[8] http://www.ceskatelevize.cz/ct24/archiv/1415748-poza
r-v-tunelu-pod-mont-blankem-si-vyzadal-39-zivotu
[9] http://www.landroverclub.net/Club/HTML/MontBlanc.htm
[10] http://www.ceskatelevize.cz/ct24/svet/1405869-pozar -v-
tauernskem-tunelu-znamenal-trimesicni-preruseni-provozu
[11] http://www.hpb.at/galleries/main/news/slides/Tauern
tunnel.html
[12] http://zpravy.idnes.cz/vinik-nehody-v-tunelu-byl-opily-
dn0-/zahranicni.aspx?c=A011031_123512_zahranicni_tom
[13] http://www.jdvm.cz/
[14] https://cs.wikipedia.org/wiki/Tunel_Klimkovice
[15] https://cs.wikipedia.org/wiki/Tunel_Valík
[16] https://cs.wikipedia.org/wiki/Tunel_Libouchec
[17] https://cs.wikipedia.org/wiki/Tunel_Panenská
Comparative European Research CER 2016 (issue I.)
101

IDEOLOGICAL PROPOSE IMPROVEMENTS TO THE INNOVATION POTENTIAL SIZING
MANUFACTURING COMPANIES IN SLOVAKIA
Klaudia Gubová – Patrik Richnák
University of Economics in Bratislava
Dolnozemská cesta 1
Bratislava, 852 35, Slovakia
+421 2 6729 5519
[email protected] – [email protected]
Abstract: New trends of business are created, such as business outside of business. Currently people do not always require
particular space provided by an employer to perform their work, but the new information techniques and technologies enable
performing the work outside the company. Here, we can point out, that in comparison of tangible and intangible sources, the
importance of intangible sources is still rising. In the past man had to travel for work, however, currently there is a trend that
man create work himself, with his own creative activities and ideas. This is what vision of modern businesses is built upon. The
aim of this research was to analyse innovation potential of manufacturing businesses using searched data about innovating
activities of businesses in Slovakia. Given coefficients at statistical verification were the measure for research and
development in businesses. Out of asked 80 manufacturing businesses, 31 took part on the research, which represents 38,75 %
of returned questionnaires. Research was conducted on a basis of combination of selecting random businesses. We could
establish that it is necessary to seek further forms of creative possibilities, because they are the single perspective source of
economic development in the future.
Keywords: innovation, innovation potential, intangible capital
1. Introduction
Innovations are the main drive mechanism of competition
growth. This growth capability is directly dependent on an
acceptable concentration on knowledge, which is based
especially on education, resourcefulness, creativity,
experimenting and ability to be innovative. The core of
innovation is in creating new knowledge, as a result of
scientific, experimental and developmental activities and
ability of workers to apply this knowledge in business
environment, in an area of product manufacturing, creation
of service as well as process creation. In order to succeed
in an environment of market economy, business must seek
new opportunities offered by market and thus increase its
innovation activity that leads to development of innovation
potential. In fact, it is innovation potential that describes
innovation environment of a company in which
innovations are created, implemented and improved.
Innovations are the main moving mechanism of economy
development and its implementation is a necessity that
guarantees business to survive in ever changing business
environment. Innovation and innovation potential of
businesses contribute to growth of work productivity,
growth of product quality, development of innovating
activities and qualification of working labour. Innovation
process contributes to growth and development of product
quality in every phase of production process and thus
increases economic prosperity of business, satisfaction of
consumers and is one of the most significant means in
competition.
1.1 Literature review
In a current dynamic world of constant technological
development, the importance of intangible capital as a
competition tool of business grows. Intangible capital
represents valuable source for creating of economic wealth
of a business. Manufacturing businesses have started
assessing its value and seek effective steps of process
management aiming to maximise profit coming from
intellectual wealth. Turbulent technological progress
impacted definition of innovation also from author
perception of the world. The term innovation has its origin
in Latin innovare which means create something new. In
its previous meaning innovation was understood as a
change in behaviour. An attempt for closer specification
resulted in a vast amount of definitions.
In general, term innovation is defined as a creative process
which combines two or more existing objects in a new
manner with an aim to create a unique new product [1].
Innovations are fundamental source of economic growth of
society. Actions such as inventing human activities,
thinking, changes of intellectual character, and changes in
human know how, e.g. new inventions, discoveries, and
knowledge of scientific and technological development
could be all considered a source of innovation. The term
innovation is used to name this universal source [2].
J. A. Schumpeter is considered the founder of economic
discipline dealing with research of innovations and their
processes. His understanding became a fundamental base
for further studies. However, at first he does not define
innovations as we know them, but only as new
combinations of development changes especially in a
market production. Modern definitions of innovations are
discussed by G. Mulgan and D. Albury according to whom
we can define innovations as implementation of a new or
significantly improved product, process or service, new
marketing or new organisational method which brings vital
improvement in effectiveness, efficiency and quality [3].
P. F. Drucker identified 7 sources of innovation
opportunities which include unexpected events, differences
between the real and the ideal state, the need of process
Comparative European Research CER 2016 (issue I.)
102

change, change of the market and sectors, demographic
changes, changes in customer moods and perceptions and
new knowledge [4]. Innovation is not a single process; it is
a long and cumulative process of number of organisational
decisions, starting from the creation of a new idea until its
realisation phase. New thought regards perception of new
needs of customers or new way how to produce [5].
K. Atuahene-Gima researched innovations in China and
came to conclusion that innovations of product must
support innovations in areas of marketing, branding,
distributions, delivery and production in order for product
to be successfully established on the market [6].
J. R. Cooper provides an alternative view. The emphasise
is given on the fact that innovations are realised in
different ways and he takes into account demands on
structural changes in organisations and divides innovations
as follows: revolution and value added innovations,
technological and administrative innovations, regarding
processes and product innovations [7].
Accoridng to E. B. Bayercelik, F. Tasel, S. Apak the most
significant factors influencing the development of
innovation activities involve financial factors, size of a
company, institutional factors, technological capabilities,
customer preferences, economy factors, cultural factors,
managerial skills, ability to learn, orientation on market
and competition advantages [8].
J. DeGraff states that it is crucial to know the definition of
innovation, because if there is not a collective definition to
explain innovation there is a small chance to reach the
same aim together with your co-workers. This is especially
important for entrepreneurial businesses which mark fast
increase to something better and bigger. J. DeGraff warns
that everyone works on innovations, but if the same
definition is not shared everyone creates their own opinion
on what innovation means and then it is very difficult to
work towards the same objective. According to J. DeGraff,
functional definitions are easily recognisable for anyone
without regards on type of an organisation. He shares the
view on innovations together with M. McLuhan and sees
innovations as increasing of something, elimination of
something else, return of demands from the past and
change in process other way round [9].
Analysis of all above mentioned definitions led us to
abstract definition involving characteristic treats of
innovation. Innovation is a qualitative and quantitative
change of product or process; it comes from intelligence of
human mind that leads to improvement of uniqueness of a
product or process by increasing its qualitative function
ensuring the growth of management and efficiency of the
subject in time. It creates monetary and added value for
consumer depending on the essence of given innovation.
2. Methodology and data
The aim of this research was to analyse innovation
potential of manufacturing businesses using searched data
about innovating activities of businesses in Slovakia.
Given coefficients at statistical verification were the
measure for research and development in businesses. Out
of asked 80 manufacturing businesses, 31 took part on the
research, which represents 38,75 % of returned
questionnaires. Research was conducted on a basis of
combination of selecting random businesses.
Critical area: χ2P > χ
21-α [(r-1).(s-1)] when α is level of
importance, or (1-α) is credibility. χ21-α [(r-1).(s-1)]
At level of importance 0,05:
χ21-α [(r-1).(s-1)] = χ
20,95 [(5-1).(5-1)] = 16
With credibility 0,95 or at the level of importance 0,05
we accept the hypothesis that there is statistically
important dependency between coefficients.
Calculation for chi-quadrat:
E
EO 22 )(
Chi -quadrat = 80,786
Calculation for degree of freedom: df=(s-1)*(r-1)
df =(5-1)*(5-1)
df=16
p= 0.00000106
Hypothesis was confirmed as the value of p < than 0,05
If we discovered, there is an association between statistical
elements we can precede to the next analysis which is
characterization of intensity of association based on
relation.
[10] where, a = statistical variation and b = statistical variation;
Q = 0,9568
3. Data analysis
Total budget of expenditures for research and development
depends on gross domestic product of a country within
given year. Total GDP (gross domestic product) of Slovak
Republic in researched period 2010 - 2013 has an
increasing character. The share of expenditure for research
and development of the GDP in researched period grew. It
is interesting that in a year 2009 (62794,40 mil. Euro) total
GDP decreased by 4048 mil. Euro in comparison with year
2008 (66842,40 mil. Euro), although the share of
expenditure for research and development increased by
0,01 % that means from 0,47 % to 0,48 % of the GDP.
Annually, in a researched period, the budget for science
and research grew by 0,05 % for first 4 monitored years. In
a year 2012, according to the statistical figures there were
allocated means for science and research in amount of
113,9626 mil. Euro which is more than in 2011 by 0,14. In
2013 the budget for science and research was at the level
of 0,83 %. In comparison with a year 2012 this represents
growth by 0,01 %. In 2013, member countries of European
Comparative European Research CER 2016 (issue I.)
103

Union spent on research and development all together 275
milliard Euro
Slovakia in comparison with other world countries belongs
to countries with lowest innovation efficiency, while it
also reaches very low average amongst the countries of
EU. Out of 28 countries of EU we have reached the 23.
Place in innovation performance and we belong to the
group of so called three catching-up countries. There are
several reasons to fall behind, e.g. low budgets of public
and private sector businesses for research and
development. Average budget of EU 28 is 1,82 % of the
GDP, while in Slovakia it is only 0,48 % of the GDP,
where public means represent 55 % out of all expenditures
for research and development. Despite growing tendencies
the level of expenditure for research and development is
still very low in comparison with other EU counties with
strong economies. For example, in 2011 Korean Republic
reached 4,04 % of GDP and in Japan it was 3,38 % of the
GDP. In 2012 in the USA budget for research and
development reached 2,91 % of GDP. However, in China
(1,98 % in 2012) and Russia (1,11 % ) budget for research
and development remains below the average of European
Union.
Government considers as the main causes of this state poor
research base without specific goals, lack of large
businesses investing into research, ineffective support
from public sector, low motivation of researchers etc. The
share of expenditure of the GDP for science and research
in individual countries of EU is shown in chart 1. The
share of expenditure on research and development of the
GDP of states of European Union.
Chart 1 The share of expenditure on research and
development of the GDP of states of European Union.
0,63 1,4 1,17 2,8 0,74 3,9 3,39 1,93
0,68 1,64 1,22 2,89 0,763,8 3,39 1,97
0,82 1,88 1,27 2,92 0,9 3,55 3,41 2,01
0,83 1,91 1,41 2,85 0,87 3,32 3,3 2,02
2010 2011 2012 2013
Depending on researched data we defined parameters of
statistical dependency between surveyed elements of
statistical sample, which were manufacturing businesses in
Slovakia.
4. Results and discussion
Within the research we paid attention to main pass of
production of a new product. After analysing responses of
participants of the research regarding the time period of
pre-production and production cycle of the main product
we came to conclusion that this time period is influenced
by number of factors of the industry, to which the business
belongs to, including complexity of their products, type of
production program, type of production. Collected time
periods were different. Some manufacturers state that both
pre-production and production cycles could be measured
in minutes, hours, even days, months or years. However it
is clear that pre-production cycle, research and
development of a product takes longer than the production
process itself. This information comes from division of
pre-production phase into several important activities that
are necessary to be performed precisely in order to achieve
the most positive results in production.
Project phase itself may last couple of years and the aim of
businesses is to shorten the duration of each step. Time
period of production phase differs based on the demand for
product, whether it is a new production or repeated
production, difficulty of requested solution, complexity
and character of the product and its complexity. In an
automobile industry it may take 5 and more years
considering one model of car. The lowest time period
could be 2 -3 years. Brand is still on high demand on the
market. The company registers elastic demand for selected
product and therefore there has been number of
modification - facelifts within more than 10 years of its
production. As stated before the longest phase is the pre-
production cycle which is decided into various activities.
One of the most important activities is design of new
products, which consists of development, construction and
technological preparation.
By conducting research of manufacturing businesses in
Slovakia we found out that the share of development phase
is less than 50 % out of the whole cycle period.
Development in the most cases represents 0 % - 5 %. This
means that Slovak business devote minimum time to
research and development. Companies that stated their
shaw of development phase in-between 21 % and 40 %,
even 41 % - 60 % include into this stage also activities
such as modification, corrections, innovations of first
degree, building and testing of prototypes and models,
building of tools, template, forma and chip using new
technologies, construction and processing of chosen
alternative for new or improved materials, facilities,
products, processes, systems etc. They are, however, not
developing entirely new product. Businesses replace
research and development phase of new product with
external form, using passive license, often also by
obtaining production or pre-production know how.
Performing development on their own includes activities
such as creation product proposal, proposal of product
construction, construction preparation of prototype
production, technological preparation of prototype
production, production, trials, and prototype approval. The
main reasons why businesses prefer purchasing licenses
are time and financial aspects. By purchasing patent of a
new product, business is able to respond to the demand of
the market faster. From the point of fast technological
development, license purchasing is the most effective
alternative for most businesses.
Businesses indicated they put bigger emphasise on phases
Comparative European Research CER 2016 (issue I.)
104

of construction and preparation of a new product. The
main objective of subsidiaries is put on technological
preparation of a product. As mentioned before, there is
couple of reasons for that. We could mention connection
between low level of granted patents and given low share
of development in businesses. It is clear that if there is no
research and development, there will be no results that
could be later patented.
Individual phases of production of a new product depend
on good strategic decisions and constant investments.
Within the support of small and minim businesses it is
necessary to use tools and methods that could be
sustainable for a long term. Slovak economy is represented
in 99,89 % by small and medium businesses that employ
72,23 % of all employees within the private sector. As a
result of conducted research we came to the following
recommendations, which are presented in form of
algorithm, ideological model:
Parent company should motivate to transfer certain part of
research and development of prototypes to its subsidiaries.
The next proposal in the area of innovations, research and
development is implementation of spin-off projects into
business activities. Building of technological parks,
centres, divisions, this would act as organizations for
scientific, production, construction and project activities
which would bring benefit to economy and educational
system. Their main purpose is development of mechanics,
technologies and their following transfer.
Creation of program supporting the start-up businesses is
funded especially in form of risk financing. In comparison
with start-ups, strategic alliances are more favourable
especially due to better spreading of risk, which in case of
start-ups is all risk beard by businesses itself. The main
disadvantage of strategic alliances is undesirable evasion
of know-how, which is cause by co-operation and mutual
decision making on serious strategic questions of business.
The tool that could increase competitiveness of small and
medium businesses as well as increase prosperity of
regions through innovation stimulations and transfer of
knowledge and skills in area of innovation is a program to
support the transfer of knowledge - Knowledge transfer
partnership - KTP.
Implementation of program to support use and filing of
patents would provide help in form of offering sufficient
information associated with patents.
There is revitalization of support for starting small and
medium innovating businesses through incubators. This
program includes creation of investment funds, execution
of supporting activities to ensure guidance and partial
coverage of operational activities of engaged incubators.
6. Conclusions
We could establish that it is necessary to seek further
forms of creative possibilities, because they are the single
perspective source of economic development in the future.
New trends of business are created, such as business
outside of business. Currently people do not always
require particular space provided by an employer to
perform their work, but the new information techniques
and technologies enable performing the work outside the
company. Here, we can point out, that in comparison of
tangible and intangible sources, the importance of
intangible sources is still rising. In the past man had to
travel for work, however, currently there is a trend that
man create work himself, with his own creative activities
and ideas. This is what vision of modern businesses is built
upon.
Acknowledgements
The article is prepared as one of the outcomes of a research
project VEGA nr. 1/0305/15 "Impact of environmental
tools on the growth of competitiveness and sustainability
of businesses" conducted by Department of Production
Management and Logistics of Economic University in
Bratislava, Slovak Republic.
References
[1] Molnár, P., Dupaľ, A., Manažment inovácií
podniku: manažment výrobkových inovácií v podniku,
Bratislava, EKONÓM, 2005, pp. 7-8
[2] Leščišin, M., Organizácia a riadenie výroby
priemyselných podnikov, Bratislava, ALFA, 1979, pp. 8-20
[3] Mulgan, G., Albury, D., Innovation In The Public
Sector, London, Prime Minister’s StrategyUnit/Cabinet
Office, 2003, pp. 3-4
[4] Drucker, F. P., Innovation and Entrepreneurship, New
York, HarperCollins Publishers, 2006, pp. 133-140
[5] Urabe, K., Child, J., Kagono, T., Innovation and
management: International Comparisons, Berlin, Walterde
De Gruyter&Co, 1988, p. 3-4
[6] Atuahene-Gima, K., What Is Innovation?, New
African, London, October, 2012, Available at:
http://newafricanmagazine.com/what-is-innovation/
[7] Cooper, J. R., A multidimensional approach to the
adoption of innovation, In Management Decision, Vol. 36,
No. 8, pp. 493-502, 1998
[8] Bayercelik, B. E., Tasel, F., Apak, S., A Research on
Determining Innovation Factors for SMEs, 10th
International Strategic Management Conference, pp. 203-
206, Elsevier, September, 2014
[9] DeGraff, J., What Is Innovation?, The Huffington Post,
New York, June, 2014, Available at:
http://www.huffingtonpost.com/jeff-degraff/what-is-
innovation_b_5939508.html
[10] Pacáková, V., Štatistická indukcia pre ekonómov a
manažérov, Bratislava, Wolters Kluwer, 2015, pp. 67-90
Comparative European Research CER 2016 (issue I.)
105

Session: Applied Informatics Index of Author(s)
Ječmen, Petr Łuszcz, Małgorzata Anna Satrapa, Pavel
Comparative European Research CER 2016 (issue I.)
106
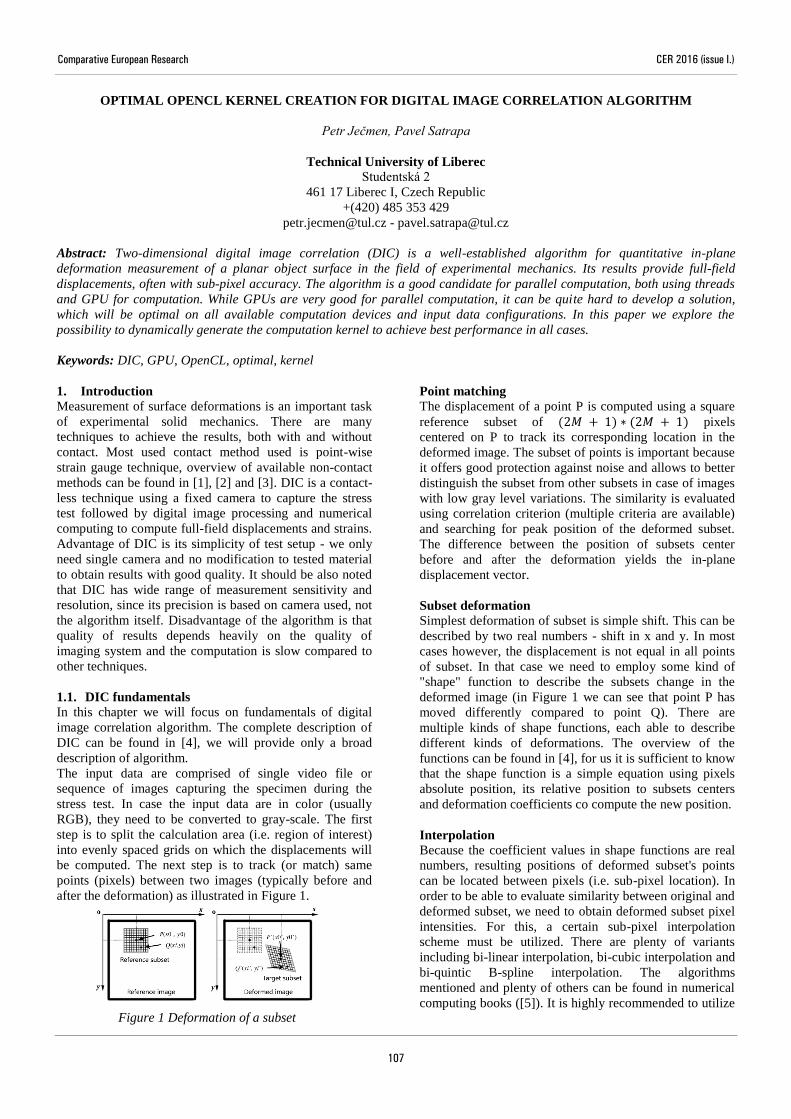
OPTIMAL OPENCL KERNEL CREATION FOR DIGITAL IMAGE CORRELATION ALGORITHM
Petr Ječmen, Pavel Satrapa
Technical University of Liberec
Studentská 2
461 17 Liberec I, Czech Republic
+(420) 485 353 429
[email protected] - [email protected]
Abstract: Two-dimensional digital image correlation (DIC) is a well-established algorithm for quantitative in-plane
deformation measurement of a planar object surface in the field of experimental mechanics. Its results provide full-field
displacements, often with sub-pixel accuracy. The algorithm is a good candidate for parallel computation, both using threads
and GPU for computation. While GPUs are very good for parallel computation, it can be quite hard to develop a solution,
which will be optimal on all available computation devices and input data configurations. In this paper we explore the
possibility to dynamically generate the computation kernel to achieve best performance in all cases.
Keywords: DIC, GPU, OpenCL, optimal, kernel
1. Introduction
Measurement of surface deformations is an important task
of experimental solid mechanics. There are many
techniques to achieve the results, both with and without
contact. Most used contact method used is point-wise
strain gauge technique, overview of available non-contact
methods can be found in [1], [2] and [3]. DIC is a contact-
less technique using a fixed camera to capture the stress
test followed by digital image processing and numerical
computing to compute full-field displacements and strains.
Advantage of DIC is its simplicity of test setup - we only
need single camera and no modification to tested material
to obtain results with good quality. It should be also noted
that DIC has wide range of measurement sensitivity and
resolution, since its precision is based on camera used, not
the algorithm itself. Disadvantage of the algorithm is that
quality of results depends heavily on the quality of
imaging system and the computation is slow compared to
other techniques.
1.1. DIC fundamentals
In this chapter we will focus on fundamentals of digital
image correlation algorithm. The complete description of
DIC can be found in [4], we will provide only a broad
description of algorithm.
The input data are comprised of single video file or
sequence of images capturing the specimen during the
stress test. In case the input data are in color (usually
RGB), they need to be converted to gray-scale. The first
step is to split the calculation area (i.e. region of interest)
into evenly spaced grids on which the displacements will
be computed. The next step is to track (or match) same
points (pixels) between two images (typically before and
after the deformation) as illustrated in Figure 1.
Point matching
The displacement of a point P is computed using a square
reference subset of pixels
centered on P to track its corresponding location in the
deformed image. The subset of points is important because
it offers good protection against noise and allows to better
distinguish the subset from other subsets in case of images
with low gray level variations. The similarity is evaluated
using correlation criterion (multiple criteria are available)
and searching for peak position of the deformed subset.
The difference between the position of subsets center
before and after the deformation yields the in-plane
displacement vector.
Subset deformation
Simplest deformation of subset is simple shift. This can be
described by two real numbers - shift in x and y. In most
cases however, the displacement is not equal in all points
of subset. In that case we need to employ some kind of
"shape" function to describe the subsets change in the
deformed image (in Figure 1 we can see that point P has
moved differently compared to point Q). There are
multiple kinds of shape functions, each able to describe
different kinds of deformations. The overview of the
functions can be found in [4], for us it is sufficient to know
that the shape function is a simple equation using pixels
absolute position, its relative position to subsets centers
and deformation coefficients co compute the new position.
Interpolation
Because the coefficient values in shape functions are real
numbers, resulting positions of deformed subset's points
can be located between pixels (i.e. sub-pixel location). In
order to be able to evaluate similarity between original and
deformed subset, we need to obtain deformed subset pixel
intensities. For this, a certain sub-pixel interpolation
scheme must be utilized. There are plenty of variants
including bi-linear interpolation, bi-cubic interpolation and
bi-quintic B-spline interpolation. The algorithms
mentioned and plenty of others can be found in numerical
computing books ([5]). It is highly recommended to utilize Figure 1 Deformation of a subset
Comparative European Research CER 2016 (issue I.)
107

some kind of higher order interpolation (e.g. bi-cubic
spline interpolation) scheme to provide higher registration
accuracy.
Correlation
As mentioned earlier, to evaluate similarity between
original and deformed subset, some kind of correlation
criterion needs to be employed. There are multiple classes
of correlation criteria available, all of them can be found in
[6]. This paper also present an important result, that all
criteria all in fact numerically equal, so we can choose any
criteria we want and we will achieve same precision.
1.2. Parallel computation
DIC algorithm is a good candidate for parallel
computation. An overview of how one can achieve parallel
computation can be found in [7]. The basic idea is that
every subset solution can be independent from others, thus
we can compute multiple solutions at once. The biggest
issue with GPU approach is data transfer. The GPU's
global memory is often too slow to deliver all the data
required by all computation units. This can be partially
solved by generating data on the computation unit, not
beforehand. Deeper description of this approach can be
seen in [8].
1.3. Motivation
While running the computation on GPU using OpenCL
and generating data online can provide very good
performance, the performance of the solution can vary a
lot depending on hardware used. It is well known that
solution that works well on NVIDIA GPUs can be quite
slow on AMD cards and vice-versa. But OpenCL also
allows the computation to be run on integrated GPUs and
also CPU and its architectures are different from standard
GPUs, thus the performance might be also bad.
One solution to this problem is to have multiple kernels,
each one optimized for different conditions (computation
device, input data configuration). The downside of this
approach is the count of kernels we would need to create
(using optimizations found in [7] and [8]. In worst case
scenario we would end up with 72 different kernels - input
data in form of array / image2d_t, ZNCC / ZNSSD /
WZNSSD correlation criterion (W meaning weighed), 1D
/ 1.5D / 2D kernel, use of memory coalescing and lastly
use of online data generation. While possible, it would be
extremely difficult to create and maintain this code base.
We have noticed that source code differences between
kernel types are not big so it could be possible to generate
kernel types dynamically. The user (or some kind of
computation driver) will provide a kernel type
configuration (input data form, correlation criterion, kernel
dimension and memory coalescing and online data
generation usage) and a function will generate a valid
OpenCL kernel source code.
With that in mind we have created a solution, which can
generate valid OpenCL kernel given a configuration.
Along with it we have created a test suite, which executes
different kernel configurations with various input data
configurations and measures the execution time.
2. Test setup
Input data configuration consist of two parameters - subset
count and deformation count. As mentioned earlier, the
deformation can be of different order, in out tests we have
tested zero and first order. The subset size was set to 31
pixels. The counts of subsets and deformation we used can
be seen in
Table 1.
Subset count 1 2 8 32
Zero order deformations
3 21 169 441
First order
deformations 160 486
Table 1 Input data configuration
The kernel generation is as a task of generative
programming. We have created a base template, which can
be seen in Listing 1. Each token (text surrounded with
percent signs) is then replaced with valid OpenCL code
according to kernel specification.
%INT% // interpolation function
%CORR-G% // gauss distribution function
kernel void DIC(%HEAD%) // function header
%INIT% // id checks, memory init
%DEF-C% // prepare deformation coeffs
%DEF-S% // deform subset
%CORR-M% // compute mean
%CORR-D% // compute delta
%CORR-C% // compute correlation
%S% // store result
Listing 1 OpenCL kernel base file
OpenCL code itself is not enough to commence the
computation. We also need a "host" code, which
essentially launches and drives the computation. The host
code must copy the data to the device and then launch the
kernel with proper parameters. We have used Java and
JogAmp's JOCL library ([9]) to access OpenCL
functionality. The Java code is not universal as OpenCL
code, we have created separate classes for 1D, 1.5D and
2D kernel launch. JOCL library offers CLMemory
interface for all data that can be copied to GPU, so the data
generation is also universal, because we only pass a list of
CLMemory objects to JOCL function.
Comparative European Research CER 2016 (issue I.)
108

Figure 2 OpenCL dynamic kernel generaetion
To evaluate the performance of all kernels, we have
measured the total time of execution, both host and device
code. The execution time of device code is not enough to
properly assess the performance of the kernel, because
different configurations are launched a bit differently and
the data generation in Java code is also different. In order
to further improve the precision of the results, we launch a
couple of kernels before the test in order to allow the
device to initialize and load appropriate drivers.
As mentioned earlier, the performance of the kernel can
vary a lot for different device, so we ran the test on
multiple devices, the list follows:
AMD Radeon HD 8750
NVIDIA GeForce GT650M
NVIDIA GeForce GTX765M
Intel HD Graphics 4600 on HP ProBook 650
Intel Core i7-3610QM
3. Results
The results will be presented in the form of graphs, where
horizontal axis will enumerate input data configurations
and vertical axis will denote execution time in
milliseconds. The input data configurations will be
described using a shortcut consisting of [subset count:
deformation order - deformation count]. For example the
configuration "02:Z:169" denotes a configurations with 2
subsets and 169 zero-order deformations. Each line in the
graphs represents a kernel configurations. The kernel
configurations are also described by a shortcut consisting
of [kernel dimension; input data type; correlation criterion;
memory coalescing; online data generation]. We will use
AMD Radeon HD 8750M as a baseline and compare other
results to this device.
3.1. Kernel dimension
First kernel parameter we have tested was kernel
dimension. The dimension determines if we let OpenCL
handle data indexing or if we provide some kind control
using Java. Further details on kernel dimension can be
found in [7].
Figure 3 Kernel dimension performance comparison
Figure 3 presents comparison of best performing kernels
for each dimension. The fastest is 2D kernel for almost all
data configurations. The 1.5D kernel provides comparable
performance as 2D kernel for data configurations with
lower subset counts, but with higher subset counts the
performance plummets. The 1D kernel's performance trend
is same as for 2D kernel, but it is always 10% slower.
3.2. Best 2D kernel
Figure 4 2D kernel comparison for AMD Radeon HD
8750M
Figure 4 presents full results for 2D kernels launched on
AMD Radeon HD 8750M. The trends for all kernels are
comparable, none of the kernels behaves differently when
compared to others. The best kernels are the ones without
memory coalescing and online data generation. In terms of
correlation criterion, ZNCC is probably a bit better, but for
larger data sets, it might be good to use ZNSSD. WZNSSD
is always worse than other two options simply because the
criterion is more complex and thus harder to compute.
3.3. NVIDIA GPU
While AMD GPU provides good performance for all data
configurations, we are more interested if one kernel can
provide good performance on other devices as well. We
ran the same tests on NVIDIA GPUs, namely models
Geforce GT 650M and Geforce GTX 765M. The results
are presented if
Figure 5 and
Figure 6.
Figure 5 2D kernel comparison for NVIDIA GT 650M
Comparative European Research CER 2016 (issue I.)
109

Figure 6 2D kernel comparison for NVIDIA GTX 765M
From the trend we can see that the performance of all
kernels is almost the same. The absolute performance is
much better in comparison with AMD card. The GeForce
GT 650M card should be a little bit better than AMD
Radeon 8750M in terms of performance, but in our test the
GeForce cards dominated by factor of 10 or more in all
cases. Only for larger data sets the AMD card's
performance gets better. The absolute performance still
isn't better, but the performance drop is smaller for AMD
card than for NVIDIA cards.
3.4. Integrated GPU
The devices we have tested so far have all been dedicated
graphic cards. A lot of user have laptop as main working
station and usually they don't have dedicated graphics
card, in most cases the graphics is handled by on-board
Intel HD graphics card (or similar integrated solution from
other vendors). These graphics cards have inherently
different architecture and usually they don't have any
dedicated video memory, they use system memory (RAM)
instead. We ran out test on Intel HD 4600 (Haswell
architecture) graphics card to see how it behaves.
Figure 7 2D kernel comparison for Intel HD 4600
Figure 8 1.5D kernel comparison for Intel HD 4600
First surprise was that 2D kernel's (
Figure 7) performance was about 5% worse than
performance of 1.5D kernel (
Figure 8). 1D kernel was at least 10% slower for smaller
data sets and for larger one the 1D kernel was almost 2
times slower than 1.D kernel.
Figure 8 also show good performance even for larger data
sets and for the biggest one (32 subsets with 486 first order
deformations) the performance is almost the same as for
AMD Radeon HD 8750M.
3.5. CPU
Last option to run OpenCL is to run it on CPU. CPUs
generally are not good candidates for OpenCL
computation due to different architecture, so we ran the
test on Intel Core i7-3610QM CPU to see how it behaves.
Figure 9 2D kernel comparison for Intel Core i7-3610QM
The CPU performs best with 2D kernel. For small input
data configurations, the CPU outperforms the integrated
GPU, for larger configurations the performance drops
significantly and behaves much like dedicated GPUs.
4. Conclusions
During our tests we came to several conclusions. It is
appropriate to use different kernel depending on used
device. While 2D kernel offers good performance on all
devices, on integrated GPUs it is good to use 1.5D kernel,
because it handles larger data sets better.
Next we have compared all kernel configurations (input
data type, use of memory coalescing and use of online data
generation) in order to determine, if there is a best kernel
for all correlation criteria and data configurations. For both
dedicated and integrated GPUs, the best variant was
without memory coalescing and without online data
generation. The use of image as input data type isn't
always an advantage, mainly for smaller data
configurations the use of array proved to be better choice.
For CPU, the use of online data generation showed
significant performance improvement, in some cases up to
10%. The results confirm that the use of image as input
data type is counter-productive. This due to the fact, that
CPUs don't have dedicated pipeline for texture processing.
We also wanted to find out, if it is viable to use different
kernels for different input data configurations. After
inspecting all obtained results, we can conclude that it is
not necessary to switch kernels. If we ignore the worst
kernel configurations, we see that the performance trends
of all configurations are comparable, so there is no need to
use different kernel for different data configurations.
Our main focus and question was wherever it is beneficial
to dynamically generate the kernel according to input data
configuration and computation device. Dynamic kernel
generation can provide best performance for all scenarios,
even for new and unreleased devices, which support
OpenCL. But dynamic kernel generation has also some
drawbacks, such us as the lack of ability to use OpenCL
code editor to check the code for errors before compilation
and profilers for performance tuning. We can conclude that
dynamic kernel generation, while being harder to create
and maintain, is a good choice when performance is the
main concern.
Comparative European Research CER 2016 (issue I.)
110

5. Acknowledgments
This work was supported by the Ministry of Education of
the Czech Republic within the SGS project no. 21066/115
on the Technical University of Liberec.
6. References
[1] Rastogi P.K., 2000, Photomechanics, (Topics in
Applied Physics) (Berlin: Springer)
[2] Sirkis J.S. and Lim T.J., 1991, Displacement and
strain-measurement with automated grid methods, Exp.
Mech. 31 382–8
[3] Goldrein H.T., Palmer S.J.P. and Huntley J.M., 1995,
Automated fine grid technique for measurement of large-
strain deformation maps, Opt. Lasers Eng. 23 305–18
[4] Bing Pan, Kemao Qian, Huimin Xie, Anand Asundi,
2009, Two-dimensional digital image correlation for in-
plane displacement and strain measurement: a review,
Meas. Sci. Technol. 20 062001, http://iopscie
nce.iop.org/0957-0233/20/6/062001.
[5] Press William H, 2003, C ++ Numerical Algorithms
(Beijing: Publishing House of Electronics Industry)
[6] Bing Pan, Huimin Xie, Zhaoyang Wan, 2010,
Equivalence of digital image correlation criteria, Applied
optics for pattern matching
[7] Petr Ječmen, Pavel Satrapa, 2015, Improving speed of
digital image correlation algorithm using OpenCL, CER
2015
[8] Petr Ječmen, Pavel Satrapa, 2015, Reducing memory
requirements of digital image correlation algorithm
running on GPU, MMK 2015
[9] JogAmp JOCL library, http://jogamp.org/jocl/www/,
29.2.2016
Comparative European Research CER 2016 (issue I.)
111

EXPLORING THE EFFECTIVENES OF OMEGAT IN TECHNICAL TRANSLATION
Małgorzata Anna Łuszcz
Wyższa Szkoła Filologiczna
Sienkiewicza 32
50-335 Wrocław
+48 71 328 14 14
Abstract: The aim of this paper is to investigate the use of OmegaT in technical translation. Empirical research, consisting in
the observations of students and pre- and post-study tests administered among Polish college students, was performed to
assess the development of technical translation skills. The idea of integrating OmegaT into technical translation to achieve
students’ success in translation is explained in the article. The main argument is that this tool facilitate the process of
translation.
Keywords: technical translation, machine translation, OmegaT in technical translation
1. Introduction
Many scholars point out that new technologies opens up
new horizons in translation (see for example Hutchins,
1999 or Carl and Way, 2003). However, they did not agree
on what tool should be used.
The present article aims to present OmegaT as an effective
tool for developing translation skills connected with
technical issues among Polish college students. The choice
of application was motivated by the desire to propose a
free and professional tool to use in technical translation
and to find out whether such application is effective.
Two groups of Polish students translate technical texts
with the use of different approaches – one in a traditional
manner, and the other with the help of OmegaT. The
results of the students’ pre- and post-tests as well as
observations of their traslation show that OmegaT
facilitate translation process and cause less errors than
traditional translation.
2. Theoretical background
Literature shows that scholars are interested in the possible
outcome of the incorporation of new technologies into
translation. Most research studies have discussed strategies
and guidelines for using such tools in the translation.
However, little attention has been paid to how much
translation users gain from using modern applications.
Thus, this research aims at showing the results of
incorporating OmegaT in technical translation among
Polish college students.
2.1. Brief history of Machine Translation
The first idea of using computers in translation is
attributed to Andrew Booth (1946) and Warren Weaver
(1947). In 1950s and 1960s, there were three approaches to
Machine Translation:
direct translation model – programming rules were
developed for one source language to one particular
target language with only some analysis and syntactic
reorganization;
“interlingua” model – programming rules were
developed in two stages: from source language to
interlingua and from interlingua to target language;
transfer approach model – programming rules were
developed in three stages: analysis, transfer, and
generation (synthesis).
In 1980s translators were becoming familiar with vendors
of workstations, for instance, Trados, STAR AG, and
IBM. In 1990s and 2000s many more were available: Atril,
SDL, Xerox, Terminotix, MultiCorpora, MetaTexis, and
ProMemoria. The mentioned tools were playable for the
users. However, there are also free applications, for
example, Wordfast Anywhere or OmegaT. After 1990s
corpus-based approaches, rule-based approaches, speech
translation, and hybrid systems were visible in translations.
2.2. Advantages of using Machine Translation
In many research papers, machine translation has been
found beneficial. Some advantages include (see Bass, 1999
or Okpor, 2014):
speed – translating the text with the use of machine
translation is faster than human translation, for
instance, Globalink claimed that their tools help to
translate 61 200 words per hour whereas people in
their traditional translation translate 650 words per
hour;
drop-dead consistency – translating the text with the
use of machine translation helps to translate the same
word in the same way without the risk of forgetting
the exact word;
cost – translating the text with the use of machine
translation is cheaper than traditional people’s
translations.
Despite the fact that machine translation has a lot of
advantages, human involvement should not be omitted.
2.3. OmegaT as a free and professional translation tool
For the purpose of the present research OmegaT was
chosen as a free and professional tool for translation. The
use of such tools is very easy since the users need to
follow the steps through the assistant. The most important
functions of such tool are:
selection of language,
segmentation of sentences,
auto-propagation for automatic translation,
Comparative European Research CER 2016 (issue I.)
112

removing tags,
location of the saved folders.,
glossary function,
search function.
OmegaT supports the current Microsoft Office file formats
and is compatible with XLIFF, ResX files, WiX
Localization, Flash XML export, Wordfast TXML, or
QuarkXPress CopyFlowGold. Moreover, OmegaT enables
the users to use a machine translation, for instance, Google
Translate, Belazar, Apertium, and Microsoft Translator,
however they are independent tools and not all of them are
free.
3. Methodology
This section describes the project that has been created to
explore technical translation with the use of OmegaT.
There were two groups of Polish college students who
participated in the study and used different practices in
translating technical issues.
The first group of Polish college learners used traditional
methods in translation and the second group of Polish
college students used OmegaT. The results of students’
tests and observations indicate that the use of OmegaT
facilitate the translations and cause less errors.
3.1. The goal of the project
The goal of the project was to bridge the gap between the
use of OmegaT and technical translation among Polish
college students. It is claimed that OmegaT gives the most
freedom and power to the users. However, it would be
useful to investigate whether such application lead to the
development of students’ translation skills connected with
technical issues.
3.2. Participants
Two groups of Polish college students were selected to
take part in this project. They were at the same level of
English proficiency and they were selected randomly from
all groups in the college. There were 60 learners
altogether. The gender distribution was 62% males and
38% females.
3.3. Location
The research took place in Polish college in Sanok. There
are not many studies conducted on the problem of
technical translation and the use of OmegaT in Polish
colleges. Thus, conducting a study in Polish college was
aimed at bridging this gap in Polish literaure of the subject.
3.4. Design and procedure
Two groups of learners of Polish college participated in
this project were randomly selected from all groups in the
college. There were 30 students in each group and gender
distribution was randomized. They were instructed by the
same teacher. The project was one term long.
The first group of Polish college was named the
Traditional Group. The students from this group translate
technical texts with the use of traditional approach. They
used traditional dictionaries while translating.
The second group of Polish college was named the
Experimental Group. The students from this group
translate technical texts with the use of OmegaT.
Before the project started, all students’ results from
technical translation tests (pre-tests) were analysed and the
average number of points from all the tests was calculated.
Then, the students were translate technical issues using
different pedagogical approaches: the Traditional Group
translate with the use of traditional methods, whereas the
Experimental Group translate with the use of OmegaT. At
the end of the project students took technical translation
tests (post-tests). The tests’ results were analysed and the
average number of points from the tests was calculated.
All the students were also observed and interviewed on the
topic of methods employed in the translation processes.
3.5. Data analysis
The analysis of the data was conducted in two stages.
Firstly, the average results of technical translation tests
before the project for all groups were compared. Secondly,
the avarage results of technical translation tests at the end
of the project were compared. This was to assess any
potential differences in the selection of translation tools
between the Traditional Group and the Experimental
Group. This was conducted with the use of Mann-
Whitney’s test to show whether the difference concerning
technical translation skills between the groups was
statistically significant and to determine whether the
implementation of OmegaT is useful for technical
translation.
The students from two groups made progress in translatin
technical texts at the end of the project. Figure 1 presents
the findings.
Figure 1. The distribution of points of the Traditional
Group and the Experimental Group of Polish college
students in tests results.
The data present a 22% difference between traditional
translation and translation with the use of OmegaT among
Polish college students connected with technical issues.
According to Mann-Whitney’s test, the difference in
translation correctness between the Traditional Group and
the Experimental Group at the end of the project was
statistically significant (p-value <0,0001). OmegaT turned
out to be more effective in technical translation. Moreover,
the project boosted Traditional Group’s and Experimental
0 20 40 60 80 100
Pre-test
Post-test
Tests results
Experimental Group Traditional Group
Comparative European Research CER 2016 (issue I.)
113

Group’s motivation to translate technical texts, enriched
students’ technical vocabulary, and developed their
cooperation with peers. Figure 2 presents acquired lexical
and grammatical translation skills at the beginning of the
project and Figure 3 presents acquired lexical and
grammatical translation skills at the end of the project.
Figure 2. Acquired lexical and grammatical translation
skills among the Traditional Group and the Experimental
Group of Polish college students at the beginning of the
project.
Figure 3. Acquired lexical and grammatical translation
skills among the Traditional Group and the Experimental
Group of Polish college students at the end of the project.
4. Conclusion
New technologies constitute significant support in
translation. Teachers and translation instructors should be
aware of the variety of translation applications available.
OmegaT represents competitive modern technological
solution for the students and translators. Such application
enable the users to acquire its functions with pleasure and
help them in the translation process. Moreover, it boosts
confidence while working in groups on different
translation projects.
The results of the present project show that OmegaT
enhance students’ technical translation. Texts translated
with the use of OmegaT contained appropriate use of
technical vocabulary and grammar structures as compared
to the texts translated with the only use of traditional
dictionaries. The great advantage of this application is the
fact that it is free and it is really professional. The project
was a success.
The findings allow for putting forward the hypothesis that
other new technological tools that are free (e.g. Wordfast
Anywhere) can also serve as a perfect tool in different
types of translation and further research should be carried
out in order to check it.
References
[1] Bass, S. 1999. “Machine vs. Human Translation” in
Advanced Language Translation. (Retrieved from:
http://www.advancedlanguage.com)
[2] Carl, M. and Way, A. (eds.) 2003. Recent advances in
example-based machine translation. Dordrecht: Kluwer.
(Text, Speech and Language Technology, 21)
[3] Hutchins, W. J. 1999. “The development and use of
machine translation systems and computer-based
translation tools.” International Conference on Machine
Translation & Computer Language Information
Processing, 1-16. [4] Okpor, M. D. 2014. “Machine Translation Approaches:
Issues and Challenges.” International Journal of Computer
Science Issues, Vol. 11, Issue 5, No. 2, 159-165.
52 54 56 58 60 62 64
vocabulary in general
technical equipment
technical activities
technical jobs
technical adjectives
technical synonyms
appropriate article
singular and plural form
appropriate tense
Passive Voice
grammar in general
Acquired lexical and grammatical
translation skills in pre-test
Experimental group Traditional Group
0 20 40 60 80 100 120
vocabulary in general
technical equipment
technical activities
technical jobs
technical adjectives
technical synonyms
appropriate article
singular and plural form
appropriate tense
Passive Voice
grammar in general
Acquired lexical and grammatical
translation skills in post-test
Experimental group Traditional Group
Comparative European Research CER 2016 (issue I.)
114

Session: Natural Sciences Index of Author(s)
Benakova, Martina Ducaiova, Zuzana Eliáš, Pavol Harangozo, Ľuboš Kopernická, Miriama Kopernická, Tatiana Mariničová, Patrícia Sabo, Rastislav Tóth, Tomáš Tuma, Jiri
Comparative European Research CER 2016 (issue I.)
115

THE EFFICIENCY OF CADMIUM AND ZINC ACCUMULATION AND INFLUENCE ON NUTRIENT UPTAKE
AND WATER STRESS IN BRASSICA NAPUS L.
Martina Benakova – Zuzana Ducaiova – Jiri Tuma
University of Hradec Kralove
Faculty of Science, Rokitanskeho 62
Hradec Kralove, 500 02, Czech Republic
+420 493331185
[email protected] – [email protected]
Abstract: A hydroponic screening experiment was carried out to test phytoextraction ability and the effect of Zn supply on the
response of Brassica napus L. on water stress. Plants were exposed to 5 μM cadmium (CdCl2) and 10 μM zinc (ZnSO4) and to
induce drought stress, 4% polyethylene glycol (PEG) was added 48 hour before harvesting. Subsequently, nutrient uptake such
as K+, Na
+, Ca
2+ and Mg
2+ was determined. Cd significantly reduced root growth and shoot biomass. The highest
concentrations of Cd and Zn were found in roots of all tested plants. PEG application decreased Zn uptake by roots and shoots
while having no effect on Cd uptake. Similarly, PEG application had no visible effect on nutrient uptake. The concentration of
Na+ and Mg
2+ was slightly higher whereas K
+ uptake was reduced in shoots of Cd treated plants. Reduction of Ca
2+
concentration was observed in Zn treated plants.
Keywords: cadmium, Brassica napus, polyethylene glycol, zinc
1. Introduction
Heavy metal contamination is an increasing worldwide
problem caused by industrial, agricultural and urban
activities [1]. Trace elements in the soils are easy available
to plants which results in their excessive uptake into plant
aboveground tissues and influences the yield production
and quality. Cadmium (Cd) is one of the most toxic
pollutant uptaken by crop plants and thus it causes serious
problems to human health [2]. Although zinc (Zn) belongs
to common environmental pollutant too, in small amounts
represents an essential micronutrient which can influence
water use efficiency by plants [3], [4].
Phytoremediation is an effective, inexpensive and
environmentally friendly technology using capacity of
some plants to uptake metals from polluted soil and water
and accumulate them in their tissues [5].
Hyperaccumulator plants are tolerant to the metals they
accumulate and usually show higher metal content in the
shoots than in the roots (shoot/root metal concentration
ratio >1). Some members of family Brassicaceae are
known to accumulate high levels of heavy metals into their
shoots. One of the most studied plants of Brassicaceae is
Brassica napus L., economically important oilseed plant
with all ideal criteria for phytoremediation such as fast and
easy growth, high biomass production and considerable
tolerance to some heavy metals such as Cd, Zn and Pb [6].
However, in the field, plants have to cope with mixture of
different abiotic and biotic stresses. Although these
stresses may occur together, they have been generally
examined separately and there has been very little
evidence on how they may interact. For example, it has
been demonstrated, that elevating levels of Zn resulted in
increase in growth and also in partly tolerance to drought
stress [4].
The aim of the present study was to investigate the
phytoextraction potential of B. napus and possible
interaction between water stress and Zn nutrition with a
focus on the plant´s metal and nutrient accumulation.
2. Material and methods
Seeds of oilseed rape (Brassica napus L.) cv. Cadeli were
obtained from the Crop Research Institute of the Czech
Republic. Plants were grown hydroponically for 14 days in
a modified 1/10 Hoagland medium with pH 5.7. Four
independent experiments with two sets of plants were
tested. Plants in the first set were grown in a medium with
addition of 5 µM CdCl2 (5Cd) or 10 µM ZnSO4 (10Zn).
The second set of plants was grown in the same
conditions, but 48 hours before harvesting, 4% PEG 6000
was added. Polyethylene glycol (PEG) is a polymer which
can be used to modify the osmotic potential of nutrient
solution and thus induce plant water deficit in a relatively
controlled manner [7]. After 14 days, plants were
harvested, weighted, dried, wet digested and used for
elemental profiling using ICP-OES.
3. Results
3.1 Effect of Cd and Zn accumulation on plant growth
In preliminary experiments, we tested different Cd
concentrations to find suitable Cd treatment which will
reduce the root length by 50%. The following
concentrations were tested: 5 µM and 10 µM CdCl2. The
required reduction of root growth was seen at 5 µM Cd
(Figure 1), therefore we used this concentration for the
following experiments.
Comparative European Research CER 2016 (issue I.)
116

Figure 1: Root length of B. napus cv. Cadeli grown in
control medium (cont) and in medium with 5 µM Cd (5Cd)
or 10 µM Cd (10 Cd). Mean values (n = 3); bars represent
standard errors.
We observed a good correlation between the appearance of
visual symptoms of metal toxicity and a root and shoot
growth inhibition. Except for plants grown in a medium
with Cd, no chlorosis was visually observed during the
treatment. Plants growth characteristics including fresh
root and shoot weight and root lengths are shown in Table
1. The fresh shoot weight and root length decreased in Cd
treated plants compared to the control and Zn treated
plants. The application of PEG had no significant effect on
the plant growth characteristics.
Table 1: Changes in root length (cm), root and shoot
weight (mg) of B. napus grown with or without Cd, Zn or
PEG. Data are means± SD (n = 3). Values within column,
followed by the same letter(s), are not significantly
different according to Tukey’s test (P<0.05).
3.2 Uptake and translocation of Cd and Zn
The Cd and Zn accumulation in B. napus is shown in
Figure 2. As expected, the content of heavy metals in
plants increased after their addition into the medium. Rape
plants retain much more Cd and Zn in their roots then it
was translocated into the shoots. The addition of PEG
caused lower uptake only in Zn, but the translocation into
the shoots was affected in both, Cd and Zn treatments.
0
2
4
6
8
10
12
14
Cadeli cont Cadeli 5Cd Cadeli 10 Cd
Ro
ot
len
gh
t (c
m)
0
1000
2000
3000
cont 5 Cd 10 Zn
Ro
ot
Cd
co
ncen
tra
tio
n (μ
g/g
DW
)
Hoagland
Hoagland+PEG
B B
A A
B B
0
500
1000
1500
2000
cont 5 Cd 10 Zn
Sh
oo
t C
d c
on
cen
tra
tio
n
(μg
/g D
W)
Hoagland
Hoagland+PE
G
C C
A B
C C
0
1000
2000
3000
4000
cont 5Cd 10 Zn
Ro
ot
Zn
co
ncen
tra
tio
n (μ
g/g
DW
)
Hoagland
Hoagland+PEG
C C C C
A
B
0
500
1000
1500
cont 5Cd 10 Zn
Sh
oo
t Z
n c
on
cen
tra
tio
n (μ
g/g
DW
) Hoagland
Hoagland+PEG
C C C C
A
B
Treatment Root length Root weight Shoot weight
Cont 14.57±4.78A 45.92±16.13A 468.58±211.44AB
5Cd 3.74±0.65B 16.5±1.44A 163.42±35.67B
10Zn 13.4±2.63A 36.67±10.23A 346.25±95.02AB
Cont+PEG 13.37±4.48A 28.67±13.70A 476.89±152.14A
5Cd+PEG 4.96±1.46B 20.78±8.14A 201.69±57.12B
10Zn+PEG 15.75±1.72A 24.89±3.60A 444.33±70.85A
Comparative European Research CER 2016 (issue I.)
117
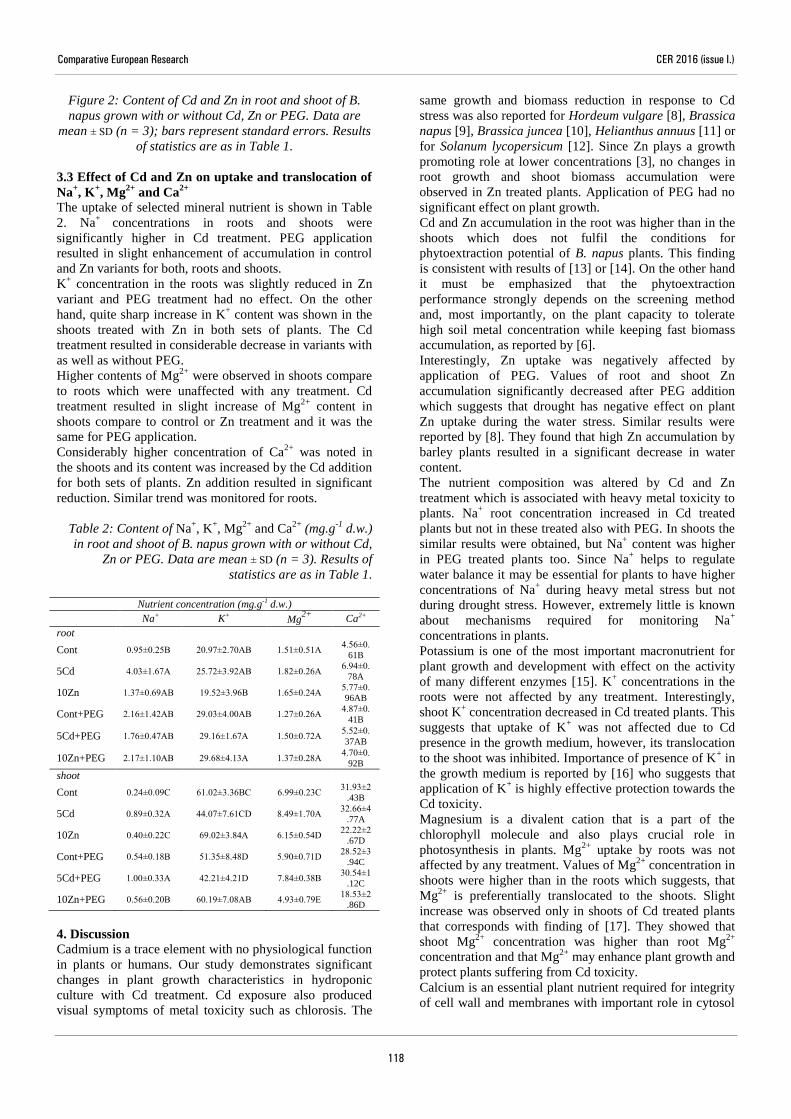
Figure 2: Content of Cd and Zn in root and shoot of B.
napus grown with or without Cd, Zn or PEG. Data are
mean ± SD (n = 3); bars represent standard errors. Results
of statistics are as in Table 1.
3.3 Effect of Cd and Zn on uptake and translocation of
Na+, K
+, Mg
2+ and Ca
2+
The uptake of selected mineral nutrient is shown in Table
2. Na+
concentrations in roots and shoots were
significantly higher in Cd treatment. PEG application
resulted in slight enhancement of accumulation in control
and Zn variants for both, roots and shoots.
K+ concentration in the roots was slightly reduced in Zn
variant and PEG treatment had no effect. On the other
hand, quite sharp increase in K+ content was shown in the
shoots treated with Zn in both sets of plants. The Cd
treatment resulted in considerable decrease in variants with
as well as without PEG.
Higher contents of Mg2+
were observed in shoots compare
to roots which were unaffected with any treatment. Cd
treatment resulted in slight increase of Mg2+
content in
shoots compare to control or Zn treatment and it was the
same for PEG application.
Considerably higher concentration of Ca2+
was noted in
the shoots and its content was increased by the Cd addition
for both sets of plants. Zn addition resulted in significant
reduction. Similar trend was monitored for roots.
Table 2: Content of Na+, K
+, Mg
2+ and Ca
2+ (mg.g
-1 d.w.)
in root and shoot of B. napus grown with or without Cd,
Zn or PEG. Data are mean ± SD (n = 3). Results of
statistics are as in Table 1.
Nutrient concentration (mg.g-1 d.w.)
Na+ K+ Mg2+
Ca2+
root
Cont 0.95±0.25B 20.97±2.70AB 1.51±0.51A 4.56±0.
61B
5Cd 4.03±1.67A 25.72±3.92AB 1.82±0.26A 6.94±0.
78A
10Zn 1.37±0.69AB 19.52±3.96B 1.65±0.24A 5.77±0.
96AB
Cont+PEG 2.16±1.42AB 29.03±4.00AB 1.27±0.26A 4.87±0.
41B
5Cd+PEG 1.76±0.47AB 29.16±1.67A 1.50±0.72A 5.52±0.
37AB
10Zn+PEG 2.17±1.10AB 29.68±4.13A 1.37±0.28A 4.70±0.
92B
shoot
Cont 0.24±0.09C 61.02±3.36BC 6.99±0.23C 31.93±2
.43B
5Cd 0.89±0.32A 44.07±7.61CD 8.49±1.70A 32.66±4
.77A
10Zn 0.40±0.22C 69.02±3.84A 6.15±0.54D 22.22±2
.67D
Cont+PEG 0.54±0.18B 51.35±8.48D 5.90±0.71D 28.52±3
.94C
5Cd+PEG 1.00±0.33A 42.21±4.21D 7.84±0.38B 30.54±1
.12C
10Zn+PEG 0.56±0.20B 60.19±7.08AB 4.93±0.79E 18.53±2
.86D
4. Discussion
Cadmium is a trace element with no physiological function
in plants or humans. Our study demonstrates significant
changes in plant growth characteristics in hydroponic
culture with Cd treatment. Cd exposure also produced
visual symptoms of metal toxicity such as chlorosis. The
same growth and biomass reduction in response to Cd
stress was also reported for Hordeum vulgare [8], Brassica
napus [9], Brassica juncea [10], Helianthus annuus [11] or
for Solanum lycopersicum [12]. Since Zn plays a growth
promoting role at lower concentrations [3], no changes in
root growth and shoot biomass accumulation were
observed in Zn treated plants. Application of PEG had no
significant effect on plant growth.
Cd and Zn accumulation in the root was higher than in the
shoots which does not fulfil the conditions for
phytoextraction potential of B. napus plants. This finding
is consistent with results of [13] or [14]. On the other hand
it must be emphasized that the phytoextraction
performance strongly depends on the screening method
and, most importantly, on the plant capacity to tolerate
high soil metal concentration while keeping fast biomass
accumulation, as reported by [6].
Interestingly, Zn uptake was negatively affected by
application of PEG. Values of root and shoot Zn
accumulation significantly decreased after PEG addition
which suggests that drought has negative effect on plant
Zn uptake during the water stress. Similar results were
reported by [8]. They found that high Zn accumulation by
barley plants resulted in a significant decrease in water
content.
The nutrient composition was altered by Cd and Zn
treatment which is associated with heavy metal toxicity to
plants. Na+ root concentration increased in Cd treated
plants but not in these treated also with PEG. In shoots the
similar results were obtained, but Na+ content was higher
in PEG treated plants too. Since Na+ helps to regulate
water balance it may be essential for plants to have higher
concentrations of Na+ during heavy metal stress but not
during drought stress. However, extremely little is known
about mechanisms required for monitoring Na+
concentrations in plants.
Potassium is one of the most important macronutrient for
plant growth and development with effect on the activity
of many different enzymes [15]. K+ concentrations in the
roots were not affected by any treatment. Interestingly,
shoot K+ concentration decreased in Cd treated plants. This
suggests that uptake of K+ was not affected due to Cd
presence in the growth medium, however, its translocation
to the shoot was inhibited. Importance of presence of K+ in
the growth medium is reported by [16] who suggests that
application of K+ is highly effective protection towards the
Cd toxicity.
Magnesium is a divalent cation that is a part of the
chlorophyll molecule and also plays crucial role in
photosynthesis in plants. Mg2+
uptake by roots was not
affected by any treatment. Values of Mg2+
concentration in
shoots were higher than in the roots which suggests, that
Mg2+
is preferentially translocated to the shoots. Slight
increase was observed only in shoots of Cd treated plants
that corresponds with finding of [17]. They showed that
shoot Mg2+
concentration was higher than root Mg2+
concentration and that Mg2+
may enhance plant growth and
protect plants suffering from Cd toxicity.
Calcium is an essential plant nutrient required for integrity
of cell wall and membranes with important role in cytosol
Comparative European Research CER 2016 (issue I.)
118

as an intracellular messenger [18]. Ca2+
concentrations
decreased significantly in shoots of Zn treated plants in
both sets. Similar as for K+, uptake of Ca
2+ was not
affected by Zn in growth medium, but the translocation to
the shoot was limited. Ca2+
enters plant cell trough Ca2+
permeable ion channels in the plasmatic membrane [19]
which are permeable to many divalent cations such as
Mg2+
, Cd2+
or Zn2+
. Thus there might be competition
between Ca2+
and Zn2+
in their transport to the shoot.
5. Conclusion
The aim of this study was to evaluate the phytoextraction
potential of B. napus L. and the possible interaction
between drought stress (PEG) and Zn nutrition in B. napus
plants. PEG application had no effect on plant growth,
whereas Cd treatment significantly reduced plant growth
with the same pattern for PEG. Root heavy metal uptake
was greater than shoot heavy metal uptake on both Cd and
Zn treated plants. In PEG treated plants, lower uptake of
Zn was found. Nutrient uptake and translocation to shoot
was disturbed both in Cd and Zn treated plants with similar
pattern for PEG. Whereas root Na+ uptake increased
during Cd treatment, K+ and Ca
2+ uptake by shoot
decreased in Cd and Zn treatment, respectively.
Acknowledgements
This study was financially supported by Particular
Research Program, University of Hradec Kralove, 2016.
References
[1] “Trace Elements in Soils and Plants, Fourth Edition,”
CRC Press, 18-Oct-2010. [Online]. Available:
https://www.crcpress.com/Trace-Elements-in-Soils-and-
Plants-Fourth-Edition/KabataPendias/9781420093681.
[Accessed: 21-Mar-2016].
[2] J. P. Buchet, R. Lauwerys, H. Roels, A. Bernard, P.
Bruaux, F. Claeys, G. Ducoffre, P. de Plaen, J. Staessen, and
A. Amery, “Renal effects of cadmium body burden of the
general population,” Lancet, vol. 336, no. 8717, pp. 699–
702, Sep. 1990.
[3] M. R. Broadley, P. J. White, J. P. Hammond, I. Zelko,
and A. Lux, “Zinc in plants,” New Phytol., vol. 173, no. 4,
pp. 677–702, 2007.
[4] H. R. Khan, G. K. McDonald, and Z. Rengel, “Zn
fertilization improves water use efficiency, grain yield and
seed Zn content in chickpea,” Plant and Soil, vol. 249, no. 2,
pp. 389–400, Feb. 2003.
[5] M. N. V. Prasad and H. M. De Oliveira Freitas, “Metal
hyperaccumulation in plants - Biodiversity prospecting for
phytoremediation technology,” Electronic Journal of
Biotechnology, vol. 6, no. 3, Dec. 2003.
[6] J. Hernández-Allica, J. M. Becerril, and C. Garbisu,
“Assessment of the phytoextraction potential of high
biomass crop plants,” Environ. Pollut., vol. 152, no. 1, pp.
32–40, Mar. 2008.
[7] M. Hamayun, A. L. Khan, N. Ahmad, I.-J. Lee, S. A.
Khan, and Z. K. Shinwari, “Effect of polyethylene glycol
induced drought stress on physio-hormonal attributes of
soybean,” Pakistan Journal of Botany, vol. 42, no. 2, pp.
977–986, 2010.
[8] B. B. M. Sridhar, F. X. Han, S. V. Diehl, D. L. Monts,
and Y. Su, “Effects of Zn and Cd accumulation on structural
and physiological characteristics of barley plants,” Brazilian
Journal of Plant Physiology, vol. 19, no. 1, pp. 15–22, Mar.
2007.
[9] E. Benyas, A. D. M. Nassab, S. Oustan, and others,
“Effects of cadmium on some morphological and
physiological traits of amaranth (Amaranthus caudatus L.)
and oilseed rape (Brassica napus L.).,” International Journal
of Biosciences (IJB), vol. 3, no. 4, pp. 17–26, 2013.
[10] A. A. Mohamed, A. Castagna, A. Ranieri, and L.
Sanità di Toppi, “Cadmium tolerance in Brassica juncea
roots and shoots is affected by antioxidant status and
phytochelatin biosynthesis,” Plant Physiol. Biochem., vol.
57, pp. 15–22, Aug. 2012.
[11] M. M. Hatata and E. A. Abdel-Aal, “Oxidative stress
and antioxidant defense mechanisms in response to
cadmium treatments,” American-Eurasian J Agric Environ
Sci, vol. 4, no. 6, pp. 655–669, 2008.
[12] W. Djebali, H. Hediji, Z. Abbes, Z. Barhoumi, H.
Yaakoubi, L. B. Zoghlami, W. Chaibi, and others, “Aspects
on growth and anatomy of internodes and leaves of
cadmium-treated Solanum lycopersicum L. plants,” J Biol
Res (Thessaloniki), vol. 13, pp. 75–84, 2010.
[13] M. Turan and A. Esringu, “Phytoremediation based on
canola (Brassica napus L.) and Indian mustard (Brassica
juncea L.) planted on spiked soil by aliquot amount of Cd,
Cu, Pb, and Zn,” Plant Soil and Environment, vol. 53, no. 1,
p. 7, 2007.
[14] R. Yu, J. Ji, X. Yuan, Y. Song, and C. Wang,
“Accumulation and translocation of heavy metals in the
canola (Brassica napus L.)—soil system in Yangtze River
Delta, China,” Plant and soil, vol. 353, no. 1–2, pp. 33–45,
2012.
[15] I. S. Bhandal and C. P. Malik, “Potassium Estimation,
Uptake, and Its Role in the Physiology and Metabolism of
Flowering Plants,” in International Review of Cytology, vol.
110, Elsevier, 1988, pp. 205–254.
[16] M. H. Siddiqui, M. H. Al-Whaibi, A. M. Sakran, M.
O. Basalah, and H. M. Ali, “Effect of Calcium and
Potassium on Antioxidant System of Vicia faba L. Under
Cadmium Stress,” Int J Mol Sci, vol. 13, no. 6, pp. 6604–
6619, May 2012.
[17] M. A. Kashem and S. Kawai, “Alleviation of cadmium
phytotoxicity by magnesium in Japanese mustard spinach,”
Soil Science & Plant Nutrition, vol. 53, no. 3, pp. 246–251,
Jun. 2007.
[18] P. J. White and M. R. Broadley, “Calcium in Plants,”
Ann Bot, vol. 92, no. 4, pp. 487–511, Oct. 2003.
[19] P. J. White, “The pathways of calcium movement to
the xylem,” J. Exp. Bot., vol. 52, no. 358, pp. 891–899, May
2001.
Comparative European Research CER 2016 (issue I.)
119

POPULATION SIZE AND DISPERSION OF POPULATION OF SNOWDROP IN TWO DECIDUOUS FORESTS IN
SOUTH-WEST SLOVAKIA
Patrícia Mariničová - Pavol Eliáš
Slovak University of Agriculture in Nitra
Mariánska 10
Nitra, 949 01, Slovakia
+421 37 641 5620
[email protected] – [email protected]
Abstract: The field work was performed on a cenopopulation of Galanthus nivalis L. It is a bulbous ephemeroid geophyte of
the family Amaryllidaceae, naturally inhabit humid places that may be flooded for short periods. It is rare type of plant of
clonal growth in Central Europe with the belowground organ, bulb, it occurs in deciduous forests, especially in floodplain
forests, scrub and meadows from lowlands to mountains. Research was conducted in Báb forest, located in south-west of
Slovakia, in two forest communities (Carici pilosae-Carpinetum betuli and Primulo veris-Carpinetum betuli) in March 2015.
For estimation of population density, dispersion of population and frequency of cenopopulation of flowering plants we used
standard line-transect method. Transect was 100 m long and 1 m wide. Non-destructive method was used. Number of
flowering individuals varied from 1 to 231 i.m-2
. Population density of flowering plants was higher in Carici pilosae-
Carpinetum community at all. Dispersion index of population according to aggregation coefficient in both of forest
communities was confirmed by aggregated dispersion, which represents clumped population. These data shows, that Báb
forest has better conditions for growth for Galanthus nivalis L. in Carici pilosae-Carpinetum betuli.
Keywords: Galanthus nivalis, dispersion of population, population size, deciduous forest, Báb
1. Introduction
Galanthus nivalis L. – is one of the earliest flowering
bulbs in European gardens, growing up to 15–20 cm height
with normally one nodding milky white bell flower, early
spring species appearing between January and March. It is
a bulbous ephemeroid geophyte of the family
Amaryllidaceae [1]. It is a highly decorative, good honey
bearing and perspective medicinal plant, which contains
a number of alakaloids, the most valuable of them being
galantamin and nivalidin [2, 11]. Spring geophyte
represents in forest communities a specific functional
group of plants. Coupled with the summer synusia species
we consider them as temporal guilds, because these herbs
used different quantity and quality of resources during the
year [3, 4]. Plants of Galanthus nivalis naturally inhabit
humid places that may be flooded for short periods [10].
The plant is being and indicator of humidity and
impermeability of the soils [2]. Its populations can survive
below zero degrees (-10 ºC) during winter. Galanthus spp.,
in particular, has attracted attention for their potential in
treating Alzheimer's disease [10]. Galanthus nivalis is rare
type of plant of clonal growth in Central Europe with the
belowground organ, bulb [11]. Plant occurs in deciduous
forests, especially in floodplain forests, scrub and
meadows from lowlands to mountains. Often it is grown as
one of the first spring flowers in gardens [17]. Since 2003
is not protected in Slovakia, with the obvious exception of
national parks and protected area. In neighboring
countries, the common is snowdrop protected.
2. Material and Methods
The field work was performed on cenopopulation of
Galanthus nivalis L. in two deciduous forests in Báb forest
in March 2015.
2.1 Study area
The study was conducted in Báb forest, located in south-
west of Slovakia. Administratively, the Báb forest area
belongs to cadastre of village Veľký Báb, district Nitra and
to Nitra Region. It is situated on Nitra loess upland, 19 km
from Nitra and 15 km from Sereď. Two reserve areas can
be found here – National Nature Reserve Báb forest and
the Protected Area Báb Park. This forest is remnant of
original native forest complexes. Its total area is 66 ha. In
the past, it was marked by anthropogenic impacts
especially short rotation management. Its surroundings
were mainly turned into wide-area fields and vineyards
[12]. The Báb forest represents a climax stage of forest
succession on loess [5].
Research of cenopopulation of Galanthus nivalis L. was
carried out in two deciduous forest communities, that are
in the associations Carici pilosae-Carpinetum betuli
Neuhäusl, Neuhäuslová-Novotná, 1964 and Primulo veris-
Carpinetum betuli Neuhäusl et Neuhäuslová-Novotná,
1963 [12] included. Slovakia was chosen, in a global
network of study areas IBP, as a representative ecosystem
of oak-hornbeam forest in the loess upland. Institute of
Landscape Ecology of the Slovak Academy of Sciences
(ILE SAS) initiated establishment of the national network
LTER Slovakia and established own LTER site – Báb [8].
2.2 Line transect method
For estimation of population density, dispersion of
population and frequency of cenopopulation of flowering
plants we used standard line-transect method (figure 1).
Length of transect was 100 m, 1 m wide, where were 100
quadrats in two forest communities (Carici pilosae-
Carpinetum betuli, Primulo veris-Carpinetum betuli). Plot
sites 1x1 m (basic plots N = 100) along the line-transect,
were divided into 4 parts: 0.5 x 0.5 m (small plots N =
Comparative European Research CER 2016 (issue I.)
120

400). For this part of research we used non-destructive
method, just counting of flowering individuals of
Galanthus nivalis L. It belongs to protected area.
Figure 1: Picture of line-transect method
The population density and frequency of population of
flowering plants was determined on the line transect in two
ways: in the occupied quadrats and across whole line-
transect for both of plots (basic and small plots).
The population density was determined as the number of
individuals per m2 from across line-transect area,
respectively, as the number of individuals per m2 of
surface squares.
The frequency of population of flowering plants we
calculated as follow:
Fr [%] = (n1/N) x 100
n1 - number of sites where it was observed the
presence of the species,
N - number of monitored sites
The dispersion index of population of flowering plants was
identified by quadrat method from quadrat across the line-
transect. For population was calculated the rate of
aggregation (quadratic method) for basic and small plots:
k = V/x
V- variance
x- average number of species in quadrat
The aggregation coefficient indicates population of spatial
structure as follow:
k = 1 – uniform dispersion
k > 1 – aggregated dispersion
k < 1 – random dispersion
3. Results and discussion
In conditions of Báb forest in two different communities
with cenopopulation of snowdrop blossoming in March
2015, the presence of flowering individuals in both of
forest communities was found out. Number of flowering
individuals varied from 1 to 231 i.m-2
. In Báb forest was
Galanthus nivalis identified in 3 plot sites with 8 – 148
individuals per 1m2
[9]. Number of flowering plants in
forest community Carici pilosae-Carpinetum betuli
dominated with total flowering plants 701, in Primulo
veris-Carpinetum betuli community were only 11
flowering plants found, on 4 basic plots. Before 40 years
ago, there was conducted a synecology research under the
International Biological Program (IBP) and the ‘Man and
Biosphere’ (MaB) program, where was present of
Galanthus nivalis L found out [13] in forest community
Carici pilosae-Carpinetum betuli. In recent years many
autors dealed about the research of snowdrops and other
spring geophytes in the Báb forest [7, 9, 14].
Population density of flowering plants in 2015 was higher
in Carici pilosae-Carpinetum community at all, with 7 i.m-
2 in basic plots and 1.7525 i.m
-2 in small plots, when just
occupied quadrats (basic and small plots) were taken into
account population density values were even higher (table
1).
Table 1 Population density (i.m-2
) of flowering plants of
Galanthus nivalis along the transect in two forest
communities
In research frequency of spring geophytes cenopopulation
[6], the highest 100 % Anemona ranunculoides, Corydalis
solida, 89 % Ficaria bulbifera, 75 % Gagea lutea, 40 %
Isopyrum thalictroides, 12 % Dentaria bulbifera, 1 %
Corydalis cava. Frequency of flowering individuals of
Galanthus nivalis in Carici pilosae-Carpinetum betuli it is
moderate-low 22 % in basic plots and about 15 % for
small plots, for Primulo veris-Carpinetum betuli it is
extremely low frequency 4 % basic plots, 1 % small plots
(table 2).
Table 2 Frequency (%) of flowering
individuals of Galanthus nivalis
Dispersion index of population according to aggregation
coefficient in both of forest communities was confirmed
by aggregated dispersion, which represents clumped
population (table 3). In plant distribution over the cenosis,
plants with vegetative reproduction it is aggregated in
more or less distinct groups and Galanthus nivalis
cenopopulation creates dense and compact clones [15].
This argument is also supported by other observation [9],
which was seen similar pattern in 4 microgroups located in
oak-hornbeam forest.
Whole transect Occupied quadrats only
Basic
plots
Small
plots Basic plots
Small
plots
Carici pilosae-
Carpinetum betuli 7.01 1.7525 31.9 11.49
Primulo veris-
Carpinetum betuli 0.11 0.0275 2.75 2.75
Whole transect
Basic plots Small plots
Carici pilosae-Carpinetum betuli 22 15.25
Primulo veris-Carpinetum betuli 4 1
Comparative European Research CER 2016 (issue I.)
121

Table 3 Dispersion of population of flowering plants of
Galanthus nivalis according to aggregation coefficient in
two forest communities
These data shows, that in Báb forest has better conditions
for growth for Galanthus nivalis L. in Carici pilosae-
Carpinetum betuli community than in Primulo veris-
Carpinetum betuli. The florsitic composition of the nautral
and semi-natural oak-hornbeam forests (Carici pilose-
Carpinetum betuli) is typical by a high abundance of
spring geophytes, while Primula veris-Carpinetum betuli
is distinguished by the presence of thermophilous species
and species occuring intermittently moist sites [18].
4. Conclusion Assesment of population structure of spring geophyte
Galanthus nivalis were found numerous cenopopulations
in Carici pilosae-Carpinetum betuli with higher population
density and more flowering individuals along the line-
transect than in Primulo veris-Carpinetum betuli.
Spatial dispersion of population was confirmed by index of
dispersion, where clumped population was found.
Research does not deal about vegetative individuals of
snowdrop, what means, that population of Galanthus
nivalis in both deciduous forests are higher than is
estimated in this paper. Attention for vegetative
individuals not only for generative we will focus on other
research.
Acknowledgements
This work was supported by the Slovak Grant Agency for
Science (VEGA) Grant No. 1/0813/14 Ecosystems and
their benefits - ecosystem services in rural countryside at
Department of Ecology of Faculty of European Studies
and Regional Development.
References
[1] Aschan, G., Pfanz, H. Why Snowdrop (Galanthus
nivalis L.) tepals have green marks? In Flora, Vol. 201,
No. 8, pp. 623 – 632, 2006
[2] Budnikov, G. - Kricsfalusy V. Bioecological study of
Galanthus nivalis L. in the East Carpathians. In Thaiszia.
J. Bot., Košice, Vol. 4, pp. 49 – 75, 1994
[3] Eliáš, P. Functional groups of plant species in
phytocoenoses In Ecological sudies I/97. SEKOS printed.
STU Bratislava, 152 p. ISBN 80-967883-1-0, 1997.
[4] Eliáš, P. Functional diversity of forest communities. In
Dynamic, stability and diversity of forest communities.
Zvolen: TU, pp. 175 – 181. ISBN 978-80-228-1821-6.
2007
[5] Eliáš, P. Changes in biodiversity in Bab forest and their
vicinity (Nitra lowland hill areas, South-Western
Slovakia). In Eliášová M., Starostlivosť o biodiverzitu vo
vidieckej krajine. Nitra: Vydavateľstvo SPU, pp. 150−161.
2010
[6] Eliáš, P., Halada, Ľ., David, S., Eliášová, M.,
Cenopopulation of spring geophytes in deciduous forest In
Population biology of plants IX. Nitra, 12 p, 2007
[7] Eliáš, P., Mariničová, P. Population structure of
a bulbiferous clonal plant Galanthus nivalis in two
temperate deciduous forests in SW Slovakia. In Clone
2015. Praha: Czech Academy of Sciences, pp. 55, 2015
[8] Eliáš, P., Oszlányi, J. Long Term Ecological Research
in Slovakia: In The International Long Term Ecological
Research Network. University of New Mexico,
Department of Biology, pp. 48-50. 2000
[9] Eliáš, P., Pauková, Ž. Population density and structure
of spring geophytes in an oak-hornbeam forest at Báb near
Nitra, Sout-West Slovakia In Rosalia, Vol. 21, pp 47-56.
2010
[10] Heinrich, M., Teoh, HL. Galanthamine from
snowdrop – the development of a modern drug against
Alzheimer's disease from local Caucasian knowledge. In
Journal of Ethnopharmacology, Vol. 92, No 2-3, pp 147–
162. 2004.
[11] Klimešová, J. Klimeš, L. Clonal growth diversity and
bud banks of plants in the Czech flora: an evaluation
using the CLO-PLA3 database. In Preslia, Vol. 80, pp
255-275. 2008
[12] Kricsfalusy V. – Budnikov, G. Threatened vascular
plants in the Ukrainian Carpathians: current status,
distribution and conservation. In Thaiszia. J. Bot., Košice,
Vol. 17, pp. 11 – 32. 2007
[13] Kubíček, F., Brechtl, J. Charakteristika skupín
lesných typov výskumnej plochy v Bábe pri Nitre. In
Biológia (Bratislava) Vol. 25, pp 27−38. 1970.
[14] Kubiček, F., Šimonovič, V. Dynamics and phenology
of the total biomass of the herbaceous layer in two forest
communities. In Biologia, Vol. 30, No. 7, pp. 505 – 522.
1975
[15] Pauková, Ž. 2012. Age structure of spring geophyte
Galanthus nivalis populations in Babsky les. In Acta
Horticulturae et regiotecturae. Slovak university of
agriculture in Nitra, Vol. 2, pp 29-31, 2012
[16] Shorina, N.I., Smirnova, O.V. The population biology
of ephemeroids.In White, J. The Population Structure of
Vegetation. Dr. W. Junk Publs., Dordrecht, p. 225 – 240.
1985
[17] Šula, J., Spring herbs of groves and forests. Praha,
216 p, 1976
[18] Zlínska, J., Holecová, M. 2012. Ecological
characteristics of studied oak- hornbeam forests and forest
fragments on the territory of Bratislava In Holecová et al.,
2012. Biodiversity of soil micro- and macrofauna in oak-
hornbeam forest ecosystem on the territory of Bratislava.
Comenius University Bratislava, pp. 3-18, ISBN 978-80-
223-3319-1, 2012
Dispersion of population (k)
Basic plots Small plots
Carici pilosae-Carpinetum betuli 367.32 1469.3
Primulo veris-Carpinetum betuli 33.522 134.1
Comparative European Research CER 2016 (issue I.)
122

BIOACCUMULATION OF IRON, ZINC, COPPER AND LEAD IN HONEY BEES, BEE POLLEN AND
HONEYCOMB
Miriama Kopernická – Tomáš Tóth – Ľuboš Harangozo – Rastislav Sabo – Tatiana Kopernická
Department of Chemistry, Faculty of Biotechnology and Food Sciences, Slovak University of Agriculture in Nitra
Tr. A. Hlinku 2
Nitra, 949 76, Slovakia
+421 37 641 4370
[email protected] – [email protected] – [email protected] – [email protected]
Abstract: Heavy metal pollution has become a major problem in many countries, because of their presence in drinking and
waste water often exceeds the permitted standards. Subsequently are contaminated soil and aboveground biomass. Some of the
metal ions in the natural environment pass through the food chain. They are accumulated in the tissues of animals, as well as
human body. Contamination of food raw material by heavy metals can significantly affect human health. In this research, we
focused on the determination of iron, zinc, copper and lead in honey bees, bee pollen and honeycomb from two localities
(Košice, Rozhanovce) of Eastern Slovakia. The tested bees and their products were collected from apiaries located in the area
of the University of Veterinary Medicine and Pharmacy in Košice and the apiary in Rozhanovce. Homogenised samples were
mineralized. We used microwave digestion unit MARS X-press. The end of determination was analysed by using atomic
absorption spectrometer VARIAN AA 240 Z with GTA120 graphite furnace. The obtained results were statistically evaluated
by program STATGRAPHICS Plus 5.1. The contaminated bee pollen and honeycomb poses not only a risk of iron entry into
the food chain but also cause a danger for human health. Statistically significant relationship was confirmed between the
locality and content of zinc, copper and lead in bee pollen.
Keywords: honey bee, bee pollen, honeycomb, heavy metals, contamination
1. Introduction
To the end of the fifties of last century, Slovakia was more
agrarian country with small industrial site, which formed
closed ecological units. Subsequently began to build heavy
industry. Industrialization meant a great impact on natural
resources and the need to build a large energy systems
usually without perfect separation technology. There has
been contamination of the components of the environment.
Agricultural use of chemicals in many cases left on
the country a negative effect. This created problem areas
where it is disturbed quality of air, water and soil. These
components consequently affect local flora and fauna.
These areas are old environmental burdens that create
a threat to the future. There are not a large territories
but living there nearly a third of our population, often
without knowledge of what risks constitute those areas
for their health. In eastern part of Slovakia has been
defined the burdened areas by size of territory
and population. They are territories: Jelšava-Ľubeník
Rudňany-Gelnica, Košice-Prešov and Zemplín [1].
Human activities have become a determining factor in the
changed conditions of biogenic elements in the natural
environment, and the accumulation of substances that
naturally did not occur previously. We are called foreign
substances, because they are not part of abiotic or biotic
components of the environment. An important
characteristic of these substances is persistence
of contaminants (transformation in the environment)
and accumulation in biological systems. During
accumulation of contaminants has an important role
adipose tissue with the ability to accumulate fat-soluble
substances [2].
Nowadays modern medicine focused on the use of natural
products. The main argument for the deployment natural
products in the therapy are low cost of treatment
and the absence of antibiotic resistance. Bee products
as a potential source of microbial active substances
and their use in medicine as a drug or a means
of promoting the healing of chronic wounds infected
by resistant microorganisms is a growing interest [3].
Honey bees are responsible for more than half of the
pollination across the world, hence they have an important
role in agriculture. In recent years, the number of honey
bees have declined due to the Colony Collapse Disorder
(CCD), which may be due to possible causes that include
climate change and pollution. Since honey bees start from
their hives to go for pollination, their activities around the
hive are a good indicator of their health [4, 5, 6].
Bee pollen has gained reputation as an important source of
energy and beneficial substances from the nutritional and
health points of view. However, in the recent years this
natural product has gained much interest, either from the
scientific community, increasing the number of works
about it, or from the general population, that buy it as
natural functional food. This review intends on one hand to
focus on the chemical composition of the bee pollen, since
it is the chemical components that provide it with
beneficial properties. On the other hand, it also addresses
the health effects of this product, by referring the different
studies that have been published [7, 8].
Important fatty acids counterparts in the diet are the ω-3
fatty acid α-linolenic acid (ALA) and the ω-6 fatty acid
linoleic acid (LA). The optimal ratio of unsaturated fatty
acids (ω-6) : (ω-3) in the diet is thought to be 1 : 2, but in
modern diet, however, this ratio is in unbalance (1: 15–20).
Bee pollen and beebread (honeycomb) are a source which
partly could restore this unbalance [9, 10].
Comparative European Research CER 2016 (issue I.)
123

2. Material and Methods
The tested bees and their products were collected from
apiaries located in the area of the University of Veterinary
Medicine and Pharmacy in Košice and the apiary
in Rozhanovce. The samples were treted by 10 cm3
of aqua regia (2.5 cm3 HNO3 and 7.5 cm
3 HCl) using
microwave digestion unit Mars X-press 5 (CEM Corp.,
USA). The mineralization was carried out in teflon vessels
at elevated temperature. The concentrations of metals were
measured using atomic absorption spectrometry (AAS)
in a Varian AA 240 Z (Varian, Australia) with GTA120
graphite furnace. Statistical analyses were performed using
descriptive data analysis. The significance of each variable
was verified by LSD test. We used Pearson
correlation coefficients at significance level of p˂0.05
(weak statistical significance) and p˂0.01 (very strong
statistical significance) available at STATGRAPHICS 5.1.
3. Results and Discussion
The content of iron in honey bees from apiary in Košice
varied over a value 146.90±12.40 mg.kg-1
of dry matter
(DM). Iron content in bee pollen was 133.80±9.10 mg.kg-1
(was about 1.10 times smaller compared to honey bees)
and in honeycomb was 182.00±13.70 mg.kg-1
(was about
1.24 times higher compared to honey bees) of DM.
The iron content in honey bees from apiary in Rozhanovce
varied over a value 110.20±8.30 mg.kg-1
of DM.
The content of iron in bee pollen was 100.70±7.70 mg.kg-1
(was about 1.09 times smaller compared to honey bees)
and in honeycomb was 57.50±10.70 mg.kg-1
of DM
(was about 1.92 times smaller compared to honey bees).
Results are shown in the figure 1.
Figure 1: The evaluation of Fe content in honey bees,
bee pollen and honeycomb
Very strong statistical significance of the correlations
of iron content is between all evaluated parameters,
but only between content of iron in honey bees and locality
is weak statistical significance of correlations (table 1).
Table 1 Statistical analysis of Fe content in honey bees
and their products and their relationship to the locality
Locality Honey bees Bee pollen Honeycomb
Locality -0,9052* -0,9233** -0,9873**
Honey bees -0,9052* +0,9980** +0,9611**
Bee pollen -0,9233** +0,9980** +0,9726**
Honeycomb -0,9873** +0,9611** +0,9726**
* weak statistical significance of the correlations (p<0.05) ** very strong statistical significance of the correlations (p<0.01)
The content of zinc in honey bees from apiary in Košice
varied over a value 56.40±6.70 mg.kg-1
of dry matter.
Zinc content in bee pollen was 14.50±2.70 mg.kg-1
(was about 3.89 times smaller compared to honey bees)
and in honeycomb was 21.80±1.70 mg.kg-1
(was about 2.59 times smaller compared to honey bees)
of DM. The zinc content in honey bees from apiary
in Rozhanovce varied over a value 152.40±11.70 mg.kg-1
of DM. The content of zinc in bee pollen was
20.40±1.70 mg.kg-1
(was about 7.47 times smaller
compared to honey bees) and in honeycomb
was 18.20±3.30 mg.kg-1
of DM (was about 8.37 times
smaller compared to honey bees). Results are shown
in the figure 2.
Figure 2: The evaluation of Zn content in honey bees,
bee pollen and honeycomb
Very strong statistical significance of the correlations
is between content of zinc in honey bees and locality,
and between content of zinc in bee pollen and in honey
bees and locality is weak statistical significance
of correlations (table 2).
Table 2 Statistical analysis of Zn content in honey bees
and their products and their relationship to the locality
Locality Honey
bees Bee pollen Honeycomb
Locality +0,9871** +0,8482* -0,6431
Honey bees +0,9871** +0,9121* -0,5124
Bee pollen +0,8482* +0,9121* -0,1962
Honeycomb -0,6431 -0,5124 -0,1962
* weak statistical significance of the correlations (p<0.05)
** very strong statistical significance of the correlations (p<0.01)
The content of copper in honey bees from apiary in Košice
varied over a value 22.00±3.20 mg.kg-1
of dry matter.
Copper content in bee pollen was 4.90±0.40 mg.kg-1
(was about 4.49 times smaller compared to honey bees)
and in honeycomb was 4.30±0.60 mg.kg-1
(was about 5.12 times smaller compared to honey bees)
of DM. The copper content in honey bees from apiary
in Rozhanovce varied over a value 22.00±1.70 mg.kg-1
of DM. The content of copper in bee pollen
was 7.10±0.50 mg.kg-1
(was about 3.09 times smaller
compared to honey bees) and in honeycomb
was 3.90±0.30 mg.kg-1
of DM (was about 5.64 times
smaller compared to honey bees). Results are shown
in the figure 3.
0,00
50,00
100,00
150,00
200,00
250,00
honey bees bee pollen honeycomb
mg
.kg
-1
Košice Rozhanovce
0,00
50,00
100,00
150,00
200,00
honey bees bee pollen honeycomb
mg
.kg
-1
Košice Rozhanovce
Comparative European Research CER 2016 (issue I.)
124
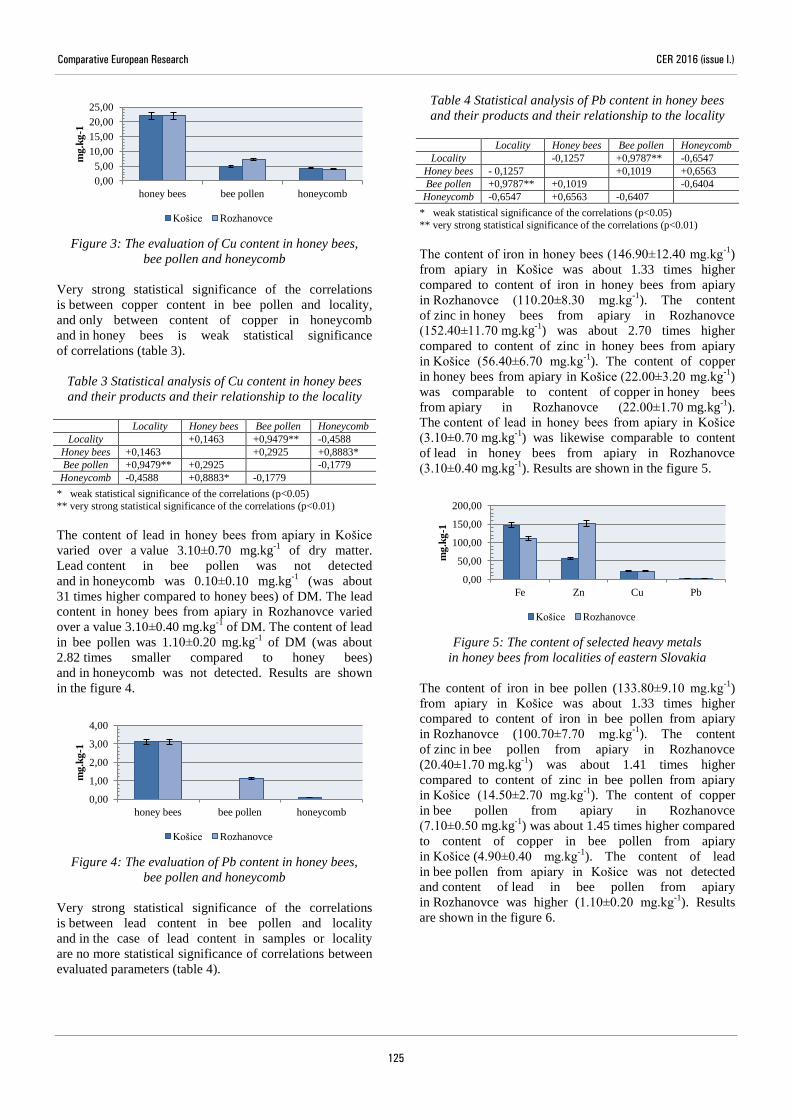
Figure 3: The evaluation of Cu content in honey bees,
bee pollen and honeycomb
Very strong statistical significance of the correlations
is between copper content in bee pollen and locality,
and only between content of copper in honeycomb
and in honey bees is weak statistical significance
of correlations (table 3).
Table 3 Statistical analysis of Cu content in honey bees
and their products and their relationship to the locality
Locality Honey bees Bee pollen Honeycomb
Locality +0,1463 +0,9479** -0,4588
Honey bees +0,1463 +0,2925 +0,8883*
Bee pollen +0,9479** +0,2925 -0,1779
Honeycomb -0,4588 +0,8883* -0,1779
* weak statistical significance of the correlations (p<0.05)
** very strong statistical significance of the correlations (p<0.01)
The content of lead in honey bees from apiary in Košice
varied over a value 3.10±0.70 mg.kg-1
of dry matter.
Lead content in bee pollen was not detected
and in honeycomb was 0.10±0.10 mg.kg-1
(was about
31 times higher compared to honey bees) of DM. The lead
content in honey bees from apiary in Rozhanovce varied
over a value 3.10±0.40 mg.kg-1
of DM. The content of lead
in bee pollen was 1.10±0.20 mg.kg-1
of DM (was about
2.82 times smaller compared to honey bees)
and in honeycomb was not detected. Results are shown
in the figure 4.
Figure 4: The evaluation of Pb content in honey bees,
bee pollen and honeycomb
Very strong statistical significance of the correlations
is between lead content in bee pollen and locality
and in the case of lead content in samples or locality
are no more statistical significance of correlations between
evaluated parameters (table 4).
Table 4 Statistical analysis of Pb content in honey bees
and their products and their relationship to the locality
Locality Honey bees Bee pollen Honeycomb
Locality -0,1257 +0,9787** -0,6547
Honey bees - 0,1257 +0,1019 +0,6563
Bee pollen +0,9787** +0,1019 -0,6404
Honeycomb -0,6547 +0,6563 -0,6407
* weak statistical significance of the correlations (p<0.05)
** very strong statistical significance of the correlations (p<0.01)
The content of iron in honey bees (146.90±12.40 mg.kg-1
)
from apiary in Košice was about 1.33 times higher
compared to content of iron in honey bees from apiary
in Rozhanovce (110.20±8.30 mg.kg-1
). The content
of zinc in honey bees from apiary in Rozhanovce
(152.40±11.70 mg.kg-1
) was about 2.70 times higher
compared to content of zinc in honey bees from apiary
in Košice (56.40±6.70 mg.kg-1
). The content of copper
in honey bees from apiary in Košice (22.00±3.20 mg.kg-1
)
was comparable to content of copper in honey bees
from apiary in Rozhanovce (22.00±1.70 mg.kg-1
).
The content of lead in honey bees from apiary in Košice
(3.10±0.70 mg.kg-1
) was likewise comparable to content
of lead in honey bees from apiary in Rozhanovce
(3.10±0.40 mg.kg-1
). Results are shown in the figure 5.
Figure 5: The content of selected heavy metals
in honey bees from localities of eastern Slovakia
The content of iron in bee pollen (133.80±9.10 mg.kg-1
)
from apiary in Košice was about 1.33 times higher
compared to content of iron in bee pollen from apiary
in Rozhanovce (100.70±7.70 mg.kg-1
). The content
of zinc in bee pollen from apiary in Rozhanovce
(20.40±1.70 mg.kg-1
) was about 1.41 times higher
compared to content of zinc in bee pollen from apiary
in Košice (14.50±2.70 mg.kg-1
). The content of copper
in bee pollen from apiary in Rozhanovce
(7.10±0.50 mg.kg-1
) was about 1.45 times higher compared
to content of copper in bee pollen from apiary
in Košice (4.90±0.40 mg.kg-1
). The content of lead
in bee pollen from apiary in Košice was not detected
and content of lead in bee pollen from apiary
in Rozhanovce was higher (1.10±0.20 mg.kg-1
). Results
are shown in the figure 6.
0,00
5,00
10,00
15,00
20,00
25,00
honey bees bee pollen honeycomb
mg
.kg
-1
Košice Rozhanovce
0,00
1,00
2,00
3,00
4,00
honey bees bee pollen honeycomb
mg
.kg
-1
Košice Rozhanovce
0,00
50,00
100,00
150,00
200,00
Fe Zn Cu Pb
mg
.kg
-1
Košice Rozhanovce
Comparative European Research CER 2016 (issue I.)
125

Figure 6: The content of selected heavy metals
in bee pollen from localities of eastern Slovakia
The content of iron in honeycomb (182.00±13.70 mg.kg-1
)
from apiary in Košice was about 3.17 times higher
compared to content of iron in honeycomb from apiary
in Rozhanovce (57.50±10.70 mg.kg-1
). The content of zinc
in honeycomb from apiary in Košice (21.80±1.70 mg.kg-1
)
was about 1.18 times higher compared to content
of zinc in honeycomb from apiary in Rozhanovce
(18.20±3.30 mg.kg-1
).The content of copper in honeycomb
from apiary in Košice (4.30±0.60 mg.kg-1
) was about 1.10
times higher compared to content of copper in honeycomb
from apiary in Rozhanovce (3.90±0.30 mg.kg-1
). The
content of lead in honeycomb from apiary in Košice was
higher (0.10±0.10 mg.kg-1
), because lead content in
honeycomb from apiary in Rozhanovce was not detected.
Results are shown in the figure 7.
Figure 7: The content of selected heavy metals
in honeycomb from localities of eastern Slovakia
4. Conclusions
Accumulation of iron in analysed samples from locality
Košice based on obtained results was in the order bee
pollen < honey bees < honeycomb, contamination with
zinc was increased in the order bee pollen < honeycomb <
honey bees. The content of copper was increased in the
order honeycomb < bee pollen < honey bees and lead
content in samples was increased in the order bee pollen <
honeycomb < honeybees. Accumulation of iron in
analysed samples from locality Rozhanovce based on
obtained results was in the order honeycomb < bee pollen
< honey bees, contamination with zinc was increased in
the order honeycomb < bee pollen < honey bees. The
content of copper was increased in the order honeycomb <
bee pollen < honey bees, that is same as in the case of
locality Košice and lead content in samples was increased
in the order honeycomb < bee pollen < honeybees.
To evaluate of the obtained result it can be concluded that
analysed samples are mostly contaminated with iron. The
contaminated bee pollen and honeycomb poses not only
a risk of iron entry into the food chain but also cause
a danger for human health. Statistically significant
relationship was confirmed between the locality and
content of zinc, copper and lead in bee pollen.
Acknowledgements
The research was supported by by grant VEGA 1/0724/12,
VEGA 1/0630/13 and KEGA 014SPU-4/201.
References
[1] Hronec O, Vilček J, Tomáš J, Adamšin P, Huttmanová
E. Kvalita zložiekživotného prostredia v problémových
oblastiach Slovenska, Brno, Mendelova universita v Brne,
2010, 8-10 p.
[2] Hronec O, Tóth J, Tomáš J, Cudzorodé látky a ich
riziká, Košice, Harlequin Quality, 2002, 7-25 p.
[3] Kačániová M, Horská E, Haščík P,Folšöciová S,
Využitie antimikrobiálnych vlastností včelích produktov
proti vybraným druhom mikroorganizmov, Nitra,
Slovenská poľnohospodárska univerzita v Nitre, 2015, 80-
82 p.
[4] Sponsler DB, Johnson RM. Honey bee success
predicted by landscape composition in Ohio, USA, PeerJ,
Vol. 3, pp. E838, 2015. http://dx.doi.org/10.7717/peerj.838
[5] Tashakkori R, Ghadiri A. Image processing for honey
bee hive health monitoring, SoutheastCon, 2015.
http://dx.doi.org/10.1109/secon.2015.7133029
[6] Johnson RM, Honey Bee Toxicology, Annual Review
of Entomology, Vol. 60, No. 1, pp. 415-434, 2015.
http://dx.doi.org/10.1146/annurev-ento-011613-162005
[7] Guine R. Bee Pollen: Chemical Composition and
Potential Beneficial Effects on Health, Current Nutrition
& Food Science, Vol. 11, No. 4, pp. 301-308, 2015.
http://dx.doi.org/10.2174/1573401311666150630181615
[8] Mohdaly AAA, Mahmoud AA, Roby MHH,
Smetanska I, Ramadan MF. Phenolic Extract from
Propolis and Bee Pollen: Composition, Antioxidant and
Antibacterial Activities, Journal of Food
Biochemistry, Vol. 39, No. 1, pp. 73-82, 2015.
http://dx.doi.org/10.1111/jfbc.12160
[9] Čeksterytė V, Jansen E. HJM. Composition and
content of fatty acids of various floral origin beebread
collected in Lithuania and prepared for storage in different,
Chemical Technology, Vol. 60, No. 2, 2015.
http://dx.doi.org/10.5755/j01.ct.60.2.1961
[10] Čeksterytė V, Balžekas J, Baltuškevičius A,
Jurgevičius E. The use of beebread-honey mixture in the
treatment of liver diseases in alcohol-dependent patients,
Chemical Technology, Vol. 60, No. 2, 2012.
http://dx.doi.org/10.5755/j01.ct.60.2.1930
0,00
25,00
50,00
75,00
100,00
125,00
150,00
Fe Zn Cu Pb
mg
.kg
-1
Košice Rozhanovce
0,00
50,00
100,00
150,00
200,00
250,00
Fe Zn Cu Pb
mg
.kg
-1
Košice Rozhanovce
Comparative European Research CER 2016 (issue I.)
126

Session: Medical Sciences Index of Author(s)
Fuchsová, Mária
Comparative European Research CER 2016 (issue I.)
127

ANALYSIS OF THE ARCH OF FOOT IN WOMEN AGED 19 AND 23 YEARS AND RISK FACTORS CAUSING
FOOT DEFORMITY
Mária Fuchsová
Department of Special Education, Faculty of Education
Račianska 59
Bratislava, 813 34, Slovakia
00421 2 49287104
Abstract: The arch of the foot absorbs shocks and is an important factor for flexibility of walk. It is easily vulnerable and its
failure belongs to the most common orthopaedic diseases. The aim of this study was to determine a percentage of flatfoot in
women aged 19 and 23 years, in their mothers and fathers aged 40 and 60 years and to reveal risk factors for this deformity
(age, obesity and genetic predisposition). The Chippaux-Šmiřák index was calculated to determine a flatfoot and the body
mass index and waist to hip ratio were calculated to determine obesity. The percentage of flatfoot was 4.84 % on the left and
6.45 % on the right in women aged 19 and 23 years. The occurrence of flatfoot in women aged 40-60 years (mothers of young
women) was higher. The positive correlation between age and the prevalence of flatfoot was confirmed only on the left foot.
The high arch of foot occurred only in older men (fathers of young women). The risk of developing flatfoot has increased with
increasing body weight. A similar percentage of occurrences of left and right flatfoot in women whose parents also had a
flatfoot can reveal genetic predisposition of the deformity.
Keywords: flatfoot, age, obesity, genetic predisposition
1. Introduction
The arch of the foot acts as shock absorber. It absorbs
shocks and is an important factor for flexibility of walk
[1]. Its main task is to protect the soft structures of the foot
and partial absorption of the force resulting from the load
weighing [2]. We distinguish normal, low and high arch.
They can by observed in the footprint. The print of a
normal arch of the foot is medium width; a low arch of the
foot is wider. The foot with a high arch creates a narrow
print [3]. The arch of the foot is easily vulnerable and its
failure belongs to the most common orthopaedic diseases.
The often causes of these errors are hypokinesia or obesity
[1]. In adult acquired flatfoot is a progressive disease of
soft tissue structures, leading to a change of curvature of
the foot bones [4]. Volpone [5] believes that flatfoot is
common in children of early age and later disappears
spontaneously without any treatment. Some authors
subsequently confirmed statistically significant
relationship between the occurrence of deformities and age
of a person, or a genetic predisposition to the deformity [6,
7]. The aim of this study was to determine a percentage of
flatfoot in women aged 19 and 23 years, in their mothers
and fathers aged 40 and 60 years and to reveal risk factors
for this deformity (age, obesity and genetic
predisposition).
2. Material and methods
The object of this study were 186 women in aged 19 and
23 years (the mean age 20,80), which are the students of
Faculty of Education in Bratislava. We evaluated the
highest and lowest width of foot from the footprint
(left/right) and calculated the Chippaux-Šmiřák index to
determine a flatfoot [8]. The flatfoot was also determined
in 165 their mothers in aged 40 an 60 years (the mean age
47,80) and 123 their fathers in aged 40 and 60 years (the
mean age 48,98). The Chippaux-Šmiřák index
distinguishes three types of normal foot (N1, N2, N3),
three types of flatfoot (P1, P2, P3) and three types of foot
with high arch (V1, V2, V3). Somatometric standard
procedures were examined: body height, body weight,
ankle height (left/right), waist and hip circumference. For
the determination of obesity, we calculated the body mass
index and waist to hip ratio, which we correlated with
Chippaux-Šmiřák index (Table 1). There was used
statistical program SPSS vs. 17 for statistical data
processing.
Table 1 The basic statistics anthropometric parameters
Parameters Median Min Max SD
Body height (cm) 164,00 149,40 179,90 5,30
Body weight (kg) 60,50 44,00 89,00 10,37
Body mass index (kg/m2) 22,32 17,29 30,94 3,20
Ankle height/left (cm) 7,70 6,00 10,50 0,63
Ankle height/right (cm) 7,85 6,00 10,50 0,69
Waist to hip ratio 0,76 0,59 1,86 0,15
Chippaux-Šmiřák/left 34,50 16,80 72,16 8,31
Chippaux-Šmiřák/right 35,83 15,00 75,79 8,94
3. Results and discussion
The idiopathic flatfoot is a common finding in children
and youth. When the weight is carrying on the heel valgus
direction, the medial arch flattens [9]. Some authors have
hypothesized that in many cases flatfoot in children lead to
disability in adulthood [6, 7]. In our study 4.84 % of
women aged 19 and 23 years had a left flatfoot and 6.45 %
of women had a right flatfoot (Table 2). We reported a
bilateral flatfoot in 6 women (3.23 %). The bilateral
flatfoot is more rehabilitation issues as unilateral [8]. 30
women reported a diagnostic flatfoot in mean aged 10.44
years. The flatfoot in adults persists in three women aged
19 and 23 years. Chang et al. evaluated the prevalence of
flexible flatfoot in Taiwanese school-aged children [10].
Comparative European Research CER 2016 (issue I.)
128

They showed a negative correlation between flatfoot and
age. The cause is continuing evolution of the structures of
the foot or a successful treatment of flatfoot deformity.
Table 2 The percentage of flatfoot in young women
Type of foot Left Right Left
(%)
Right
(%)
N1 36 30 19,35 16,13
Normal foot N2 123 114 66,13 61,29
N3 18 30 9,68 16,13
P1 6 9 3,23 4,84
Flatfoot P2 0 0 0,00 0,00
P3 3 3 1,61 1,61
186 186 100,00 100,00
Next, we assessed the occurrence of flatfoot by the same
method in women aged 40-60 years (mothers of young
women). The percentage of flatfoot increased to 14.54 %
on the left and 16.37 % on the right (Table 3). The positive
correlation between age and the prevalence of flatfoot was
confirmed only on the left foot (left foot: rs = 0,107, p =
0,046, right foot: rs = 0,087, p = 0,144).
Table 3 The percentage of flatfoot in old women (mothers)
Type of foot Left Right Left
(%)
Right
(%)
N1 36 30 21,81 18,18
Normal foot N2 81 87 49,09 52,72
N3 24 21 14,55 12,73
P1 18 21 10,91 12,73
Flatfoot P2 6 6 3,64 3,64
P3 0 0 0,00 0,00
165 165 100,00 100,00
The percentage of flatfoot in fathers of young women was
19.52 % on both feet. The high arch of foot had 2.44 % of
men on the left and 4.88 % of men on the right (Table 4).
This type of foot deformity did not exist in women.
Table 4 The percentage of flatfoot in old men (fathers)
Type of foot Left Right Left
(%)
Right
(%)
N1 18 15 14,63 12,19
Normal foot N2 69 60 56,09 48,78
N3 9 21 7,32 17,07
P1 12 12 9,76 9,76
Flatfoot P2 6 3 4,88 2,44
P3 6 6 4,88 4,88
V1 0 3 0,00 2,44
High arch of foot V2 3 0 2,44 0,00
V3 0 3 0,00 2,44
123 123 100,00 100,00
Shibuya et al. [7] evaluated the incidence of flatfoot in
adults (the mean age of men was 43.14 years and women
44.22 years). The gender was not a significant factor for
flatfoot deformity. They experienced a statistically
significant correlation between age and the presence of
flatfoot deformity in women. The risk of developing
flatfoot has reduced with increasing age. Therefore we
were looking for other risk factors to cause the flatfoot in
our study. We investigated whether the greater body
weight is a cause of the higher occurrence of flatfoot in
young women. For the determination of obesity, we
calculated the body mass index and waist to hip ratio,
which we correlated with Chippaux-Šmiřák index. We
observed a statistically significant positive correlation
(Table 5). The risk of developing flatfoot has increased
with increasing body weight. Several authors also revealed
a higher incidence of flatfoot in obese adolescents or
overweight individuals [10, 11 and 12].
Table 5 The correlations between indexes of obesity and
index of flatfoot (α = 0,05)
Parameters in correlation Correlation
coefficient p value
Body mass index/ 0,057 0,441
Chippaux-Šmiřák/left
Body mass index/ 0,171 0,019
Chippaux-Šmiřák/right
Waist to hip ratio/ 0,253 0,001
Chippaux-Šmiřák/left
Waist to hip ratio/ 0,218 0,003
Chippaux-Šmiřák/right
The flatfoot in adults is a foot deformity that reduces
longitudinal and transverse arch of the foot [13]. We found
that the occurrence of flatfoot significantly decreases the
arch of the foot. All correlations were negative. That
means if the value of the index was higher, the ankle
height was lower (Table 6). The flatfoot causes problems
that reduce the ability to manage static loads [13].
Table 6 The correlations between ankle height and index
of flatfoot (α = 0,05)
Parameters in correlation Correlation
coefficient p value
Ankle height/left - 0,168 0,026
Chippaux-Šmiřák/left
Ankle height/right - 0,251 0,001
Chippaux-Šmiřák/right
A higher incidence of flatfoot in older women may be also
the result of weight gain. In the absence of information of
the body composition in older women, this fact cannot be
statistically confirmed. Some authors have confirmed the
correlation between higher BMI and flatfoot in older
women. Arangio et al. [14] found significantly higher BMI
in an adult-acquired flatfoot group compared with a
control group without flatfoot. However, the precise
meaning of the association was not described, as they did
not stratify their analyses on the other variables (in fact,
the mean age of the adult-acquired flatfoot group was 51.1
years, whereas that of the control group was 36.7 years).
Otsuka et al. [15] found a linear correlation between
prevalence of flatfoot and BMI in Japanese women older
than 60 years.
Some authors subsequently confirmed statistically
significant relationship between the occurrence of
deformities and age of a person, or a genetic predisposition
to the deformity [6, 7]. We evaluated the incidence of
Comparative European Research CER 2016 (issue I.)
129

flatfoot among women whose parents also had flatfoot to
detect possible genetic predisposition of flatfoot. If the
parents have a left flatfoot, 20.83 % of their daughters also
had a left flatfoot. If the parents have a right flatfoot, 26-28
% of their daughters also had a right flatfoot (Table 7). A
similar percentage of occurrences of left and right flatfoot
in women whose parents also had a flatfoot can reveal
genetic predisposition of the deformity.
Table 7 The percentage of flatfoot in women whose
parents also had flatfoot
Flatfoot Left Right Left
(%)
Right
(%)
mothers 24 27 100,00 100,00
their daughter 5 7 20,83 25,93
fathers 24 21 100,00 100,00
their daughter 5 6 20,83 28,57
4. Conclusions
In the study the Chippaux-Šmiřák index was used to
determine a flatfoot. The percentage of flatfoot was 4.84 %
on the left and 6.45 % on the right in women aged 19 and
23 years. The occurrence of flatfoot in women aged 40-60
years (mothers of young women) was higher (14.54 % on
the left foot and 16.37 % on the right foot). The positive
correlation between age and the prevalence of flatfoot was
confirmed only on the left foot. The high arch of foot had
2.44 % of men (fathers of young women) on the left and
4.88 % of men on the right. This type of foot deformity did
not exist in women. The risk of developing flatfoot has
increased with increasing body weight. The occurrence of
flatfoot significantly decreases the arch of the foot. A
similar percentage of occurrences of left and right flatfoot
in women whose parents also had a flatfoot can reveal
genetic predisposition of the deformity.
Acknowledgements
This study is the result of the project VEGA 1/0789/14.
References
[1] Riegerová, J., Přidalová, M., Morfologie nohy a její
hodnocení. In: Riegerová, J., Přidalová, M., Ulbrichová, M.
(ed.): Aplikace fyzické antropologie v tělesné výchově a
sportu (příručka funkční antropológie). Olomouc,
Nakladatelství HANEX, 2006, pp. 163-181 [2] Čihák, R., Anatomie I. 3. vyd. Praha, GRADA, 2011,
552 p. ISBN 978-80-247-3817-8.
[3] Di Maggio, J. A., The Role of Feet and Footwear in
Medicolegal Investigations. In: Rich, J., Dean, D. E.,
Powers, R. H. (ed.): Forensic Medicine of the Lower
Extremity. Human Identification and Trauma Analysis of
the Thigh, Leg and Foot. Totowa, Humana Press, 2005, pp.
375-400. [4] Deland, J. T., de Asla, R. J., Sung, I-H., Ernberg, L. A.,
Potter, H. G., Posterior tibial tendon insufficiency: which
ligaments are involved? Foot Ankle Int, Vol. 26, pp. 427–
435, 2005 [5] Volpon, J.B., Footprint analysis during the growth
period. J. Pediatr. Orthop. Vol. 14, pp. 83–85, 1994
[6] Abolarin, T., Aiyegbusi, A., Tellaa, A., Akinboa, S.,
Predictive factors for flatfoot: The role of age and footwear
in children in urban and rural communities in South West
Nigeria. The Foot, Vol. 21, pp. 188-192, 2011 [7] Shibuya, N., Jupiter, D. C., Ciliberti, L. J., VanBuren,
V., La Fontaine, J., Characteristics of adult flatfoot in the
United States. J Foot Ankle Surg, Vol. 49, pp. 363–368,
2010 [8] Klementa, J., Somatometrie nohy. Praha, SPN, 1988
[9] Mosca, V. S., Flexible flatfoot skewfoot. In: Drennans
the child’s foot and ankle. Philadelphia: Lippincott
Williams & Wilkins, 2010
[10] Chang, J. H., Wang, S., H., Kuo, CH. L., Shen, H.
CH., Hong, Y. W., Lin, L. CH., Prevalence of flexible
flatfoot in Taiwanese school-aged children in relation to
obesity, gender, and age, Eur J Pediatr, Vol. 169, pp. 447-
452, 2010
[11] Villarrova, M., Esquivel, J. M., Tomás, C., Moreno,
L. A., Buenafé, A., Bueno, G., Assessment of the medial
longitudinal arch in children and adolescents with obesity:
footprints and radiographic study, Eur J Pediatr, Vol.
168, pp. 559–567, 2009 [12] Mauch, M., Grau, S., Krauss, I., Maiwald, C.,
Horstmann, T., Foot morphology of normal, underweight
and overweight children. International Journal of
Obesity, Vol. 32, pp. 1068–1075, 2008
[13] Medek, V., Plochá noha dospělých. Interní medicína
pro praxi, Vol. 6, pp. 315-316, 2003
[14] Arangio, G. A., Wasser, T., Rogman, A.,
Radiographic comparison of standing medial cuneiform
arch height in adults with and without acquired flatfoot
deformity. Foot Ankle Int, Vol. 27, pp. 636–638, 2006.
[15] Otsuka, R., Yatsuya, H., Miura, Y., Murata, C.,
Tamakoshi, K., Oshiro, K., Nishio, N., Ishikawa, M.,
Zhang, H. M., Shiozawa, M., Kobayashi, A., Ito, M., Hori,
Y., Kondo, T., Toyoshima, H.., Association of flatfoot
with pain, fatigue and obesity in Japanese over sixties.
Nippon Koshu Eisei Zasshi, Vol. 50, pp. 988–998, 2003
Comparative European Research CER 2016 (issue I.)
130

Session: Physics, Mathematics Index of Author(s)
Hlaváč, Zdeněk Hrubý, Petr Židková, Pavla
Comparative European Research CER 2016 (issue I.)
131

APPLICATION OF THE FINITE ELEMENT METHOD IN DETERMINATION OF MODAL AND SPECTRAL
PROPERTIES OF PROPELLER SHAFT´S BENDING VIBRATIONS
Petr Hrubý, Zdeněk Hlaváč, Pavla Židková
The Institute of Technology and Business
Okružní 10
České Budějovice, 37001, Czech Republic
+420736228787
Abstract: The drive with articulated joints is an evolutionary dynamical system. Modal and spectral properties of the relative
lateral vibration in a rotating space are dependent on the angular velocity of the shaft rotation. This problem can be the first
solved analytically. More complex systems can be solved either by discretization using the finite element method and
converting it to eigenvalues, eigenvectors, or using the transfer-matrix method, which is a combination of analytical solutions
and numerical methods. The article is derived a finite element for the one-dimensional linear continuum in the state of
combined bending-gyratory vibration. Furthermore, the applicaton of the finite element method designed and tuned a method
for calculating eigenvalues and vectors of a stepped shaft in the state of combined bending-gyratory vibration. It is made a
comparison of the mentioned methods.
Keywords: vibration, combined, finite elements, continuum
1. Introduction
Propeller shafts drives vehicles transmit torque at
relatively large distances. Shafts are based on long and
slender and must be dimensioned not only in terms of
torsional stress (it must eventualy solve torsional vibration
of a drive), but it is also necessary to solve the problems of
bending vibrations. The authors focused on developing
methods for solving modal and spectral properties of
Cardan shaft mechanism based on FEM. Propeller shaft
does combined gyratory-bending vibrations. The natural
frequency of relative lateral vibration depend on the
angular velocity of rotation. The authors formulated an
element respecting this influence. They compared the
results with those obtained by analytical solution and using
the transfer-matrix method – for the parameters of the
propshaft of the real vehicle.
2. Mathematical model derivation of a finite element of
the connecting shaft in a state of combined bending-
gyratory vibration.
Consider an element of the shaft in the shape of a
prismatic section with the circular cross-section (Figure 1).
Figure 1: The element of propshaft in a state of combined
bending-gyratory vibration
Choose for generalized coordinates, , i = 1,2, ... 4,
immediately displacements and rotations at the edges of
the cross section. The deflection „yv“ of the range 0≤ x ≤ 1
is expressed as
y (x, t) = (t) (x) , (2.1)
where
(x) = + + +
. (2.2)
Coefficients - choose to apply the following
conditions:
(2.3)
We get the following values:
(x) = 1 – 3
+ 2
,
(x) = x –2
+
,
(x) = 3
- 2
,
(x) = -
+
.
(2.4)
Then write the equation (2.1) in matrix form:
y (x, t) = , (2.5)
where
= [ , , , ] , =
.
(2.6)
Comparative European Research CER 2016 (issue I.)
132

The potential energy of an element is equal to the strain
energy:
=
EJ
dx ,
respectively, after modification:
=
EJ
. (2.7)
The kinetic energy of the element can be expressed in the
following form:
=
dx +
dx +
dx ,
respectively, after modification:
=
+
+
,
(2.8)
where
=
, =
,
J =
.
(2.9)
Mathematical model of the element is obtained through
Lagrange´s Equation, which has the following form:
-
+
= 0 . (2.10)
Make the appropriate derivations.
We get the following:
=
+
+
,
=
=
,
=
= EJ
.
(2.11)
These expressions, (2.11), substitute into this equation:
(2.10). So, the following applies:
+
+
= 0 .
(2.12)
Rewrite the equation (2.12) into the shape:
+ + = 0 ,
(2.13)
where
=
dx =
·
∙
,
(2.14)
=
dx =
=
,
(2.15)
= EJ
dx =
=
,
(2.16)
=
dx =
=
.
(2.17)
The equation (2.13) represents the mathematical model of
the shaft element according to Figure 1 in a state of
bending-gyratory vibration.
3. Mathematical model for bending-gyratory vibrations
of the graduated shaft
Consider a dynamic model of the graduated shaft portions
determinated by “n” sections of the annular cross-section
of the “n” parts (outer radii , inner radii , lengths ), mounted on bearings transversely deformable rigidity,
( left and right) and rotating angular velocity – see
Figure 2.
Figure 2
If for generalized coordinate is chosen lateral
displacement of the i-th node and for generalized
coordinate
(i = 1 , ... , n+1) is chosen angle of the i-th section,
applies obviously for the kinetic and potential energy of
the system following:
Comparative European Research CER 2016 (issue I.)
133

=
,
=
+
+
.
(3.1)
In this expression, a are mass matrix and stifness
matrix of the i-th element, see (2.13), (2.14), (2.15), (2.16)
and (2.17), where instead of r, R, l use , , . Subvectors the from the vector q of generalized
coordinates have the following form:
=
.
As further applies
=
M , =
, (3.2)
where M and K are mass matrix and stiffness matrix of the
entire system, we get through comparing (3.1) and
Chyba! Nenalezen zdroj odkazů., that the total
mass and stiffness matrix has a block tridiagonal form:
M =
,
(3.3a)
K =
.
(3.3b)
Individual blocks are square matrixes of 2 and have the
following form:
=
,
=
i,j = 1 ,
=
,
=
,
for k = 2 , ... , n ,
=
,
=
,
=
,
=
4,
(3.4)
for k = 1 , ... , .
Here is denoted
=
, =
for the mass matrix and the stiffness of the individual
elements k = 1 , .. , n of the expressions (2.13), (2.14),
(2.15), (2.16) a (2.17).
Mathematical model of free oscillations has the following
form:
M + Kq = 0 .
Natural frequency system, , satisfies the frequency
equation:
det (- M
+ K) = 0 . (3.5)
The eigenvalues (belonging to the i-th natural
frequency) satisfy the relation
(- M + K) = 0 . (3.6)
Because this relation is ambiguous, we normalize these
vectors using the so-called M-norm, ie the relation
= , (3.7)
where is the Kronecker symbol. Natural frequencies
and eigenvectors choos at the base coordinates „y“ that are
related to the original coordinates „q“ through
transformational relation
y = q , (3.8)
where L is lower triangular matrix, for which the following
applies:
M = L .
Such a matrix exists due to the regularity and the positive
definiteness of the matrix weight. The mathematical model
in the coordinates „y“ apparently has the form:
+ K y = 0 . (3.9)
Because a symmetric matrix
A = K
is similar to the matrix K = K (despite the
similarity matrix ), are the eigenvalues of the original
model the same as its own model number (3.9).
Generalized eigenvalue problem, (3.5), was thus
transferred to the common problem of eigenvalues:
Comparative European Research CER 2016 (issue I.)
134

det (- E + A) = 0 . (3.10)
Among the eigenvectors there is a relation analogous to
(3.8). If vectors are eigenvectors of the model (3.9) and
are eigenvectors of the basic model, then the following
applies:
= ⇒ = .
The eigenvectors satisfy the equation
(A - E ) = 0 ,
analogous to (3.6). If these eigenvectors are normalized
with Euclidean norm (that is satisfied by = ), we
obtain for the corresponding eigenvectors the
normalization (3.7). Indeed applies:
= =
L = M .
The eigenvalue problem (3.10) is solved by standard
procedure. Convert the matrixes „A“ by orthogonal
similarity transformation into tridiagonal form and
eigenvalues of the tridiagonal matrix determinate by use of
Ql – algorithm (see [3] , [4]). The natural frequency
depends on the angular velocity of shaft rotation, with
increasing speed decreasing. In the case of = = 0 is
an isolated system with the first zero natural frequency. It
makes sense to evaluate the critical angular velocity, when
the first (non-zero) natural frequency due to the angular
velocity becomes zero, and the system becomes unstable.
4. Numerical verification method
Input parameters of the processed computational model for
the regime shaft portions of the annular cross-section of
the „n“ sections are the following:
1. n – number of elements
2. - [the program (i)] – inner radius vector of
elements in order from left to right
3. - [the program (i)] – outer radius vector of
elements in order from left to right
4. - [v programu eel(i)] – vector lenghts of elements in
order from left to right
5. – 10. – the same inputs as the previous regime
The following input parameters were specified for shaft
having a constant cross-section:
= 0 , = 0,0105 m, l = 0,65 m .
The natural frequency (for = 0), the same as the value
obtained by the transfer matrix method has been obtained
by specifying = = N . The results were
gradually specified by entering n = 1,2,5,10 elements.
As expected rotation speed resonance (the first natural
frequency decrease with increasing angular speed of shaft
rotation to zero) is expected in the interval , was taken to = 0 , = 700 rad , = 100
rad with potential further specifying the place of speed
resonance. The results are shown graphically in the figure
number 4. It shows that a significant shift of the natural
frequency (the lowest rate) occurs a transition from n = 1
to n = 2. Further increases in the number of elements
doesn´t bring substantial changes. Graph ( ) for each
of the elements with considerable precision approaching a
circle centered at the origin of ( ) with a radius ( ) .
Figure 3
5. Conclusions
Propeller shaft represents a dynamic evolute system.
Frequency of relative transverse oscillations are dependent
on the angular velocity of the frame (transportation)
rotation. Vibration analysis driveshafts in areas of the
spectrum, where the transfer matrix method is unstable, it
is a advisable to carry out on the models formulated by
FEM.
The authors formulated an element that the influence of
the frame (transportation) rotation respect. The element is
formulated in a rotating plane. Created software allows
automatic compilation of the global mass and stiffness
matrices of the connecting shaft Cardan mechanism,
solving its spectral and modal properties and evaluate the
speed resonance.
References
[1] HRUBÝ, P., HLAVÁČ, Z. Cardan long driveshaft
vibrations mechanism of Tatra trucks. Research Report no.
102 02 79. VŠSE. Plzeň, 1979.
[2] HRUBÝ, P., HLAVÁČ, Z. FEM application of
spectral and modal properties of the propeller shaft.
Research Report no. 102 07 91. ZČU. Plzeň, 1991.
[3] HRUBÝ, P. Bending-gyratory vibrations of shafts in
drives with joints. The candidate´s dissertation. VŠSE
(Faculty of mechanical engineering). Plzeň, 1981.
[4] HÖSCHL, C. Using small computers in the dynamics
of systems. DT ČSVTS Prague, 1983.
[5] RALSTON, A. Numerical Mathematics. Academia
Prague, 1978.
[6] WILKINSON, J., REINSCH, C. Handbook for
Automatic Computation, Linear Algebra. The russian
translation of Mašinostrojenije. Moscow, 1976.
Comparative European Research CER 2016 (issue I.)
135

PHYSICAL AND MATHEMATICAL MODELS OF SHAFTS IN DRIVES WITH HOOK´S JOINTS
Petr Hrubý, Zdeněk Hlaváč, Pavla Židková
Institute of Technology and Economics
Okružní 10
České Budějovice, 37001, Czech Republic
+420736228787
Abstract: The torque of drive vehicles is transmitted at relatively large distances. When dimensioning to the torsion under
static and cyclic load, shafts are in many cases long, slender, and are susceptible to bending vibrations. The shafts must be
checked not only to torsion, but also to bending in terms of shaft´s modal and spectral properties. The paper formulated a
mathematical model of an one-dimensional linear continuum in a state of bending-gyratory vibration. It is performed an
analytical solution of natural frequencies relative lateral vibration and it is analyzed the influence of a rotating shaft to
spectrum of natural frequencies section of the continuum, that form the basis of shaft´s physical model when calculating its
natural and forced vibration.
Keywords: physical, mathematical, model, shaft, vibration
1. Introduction
Propeller shafts of drive vehicles transmit a torque at
relatively large distances. The shafts are based on long and
slender, and must be dimensioned not only in terms of
torsional stress, but it is also necessary to monitor its
resistance to lateral vibration. Due to the continuous
operational area, the shafts are needed to operate in
subcritical speed. Results of previous works which were
also confronted with experiments showed that the
propeller shafts represent strong evolutionary systems
(increasing the angular velocity of rotation significantly
reduce the spectrum of natural frequency relative lateral
vibrations) and in practical calculations it is necessary to
respect this influence. For that reason, it is not possible to
model the shafts using procedures that are commonly
reported in the literatura, but it is necessary to formulate a
model that allows this effect respected.
2. Formulation of a problem, used processing methods
Propeller shafts are in a steady state stressed by excitation
bending moments harmonic, and their vectors are
orthogonal to the rotating plane of a relevant fork Hook´s
joints (Figure 1). The drive torque mentioned generate in a
steady state due to the transmission flow through Hook´s
joints and cause lateral oscillations of the propeller shafts
in its rotating space. In formulating a mathematical model,
it is necessary to start from the assumption of formation
relative spatial bending vibration in the shaft system 0(x,
y, z) (Figure 2), which rotates at an angular speed x
. If
we neglect the Coriolis force and gyroscopic moments
acting on the element of the shaft, we can solve the
problem in the rotating plane 0(x, y). The instantaneous
state of the element is determined by the angular velocity
x
, the velocity
and the angular velocity . This article aims to build a
mathematical model of a coupling shaft to calculate
spectral and modal properties of the connecting shaft with
respect to the field of centrifugal forces that is causing the
addiction of natural frequencies of bending vibrations
relative to the angular velocity of the shaft´s rotation.
Figure 1
Figure 2
Comparative European Research CER 2016 (issue I.)
136

The problem is solved step by step. In the third chapter,
there is constructed by the method of physical
discretization a simple model (of the solved problem),
which is evident from the nature of the centrifugal force
field´s influence on the spectral properties of the shaft. In
the chapter 4, there is performed an analytical solution of
speed resonances propshaft´s test model, whose aim is to
obtain values for verification subsequently processed
models based on the transfer-matrix method and the finite
element method.
3. Solving the problem by physical discretization
Let´s replace the driveshaft which is shown in the Figure 1
(consider solid bearings) by discrete mechanical system
with one degree of freedom. Divide it into two equal
halves which will represent an intangible spring (Figure 3)
having rigidity
.
Figure 3
Concentrate the weight to endpoints of the springs so that
two fixed points belong to their supports (for x = 0, resp. x
= 1), the other two fixed points merge into one with a
weight m = Sl /2 in the middle of the shaft (x = 1/2). The
resulting discrete model of a connecting shaft is shown in
the Figure 4. Let´s determine the spring stiffness of the
relation:
k =
, (3.1)
further determine weight discrete compensation (weight of
fixed point) from the relationship
m =
, (3.2)
where
J =
, S = . (3.3)
Description of physical quantities above relationships is
the following:
l [m] ... shaft length,
r [m] ... radius shaft,
[kg ] ... material density,
E [Pa] ... modulus of elasticity in tension.
Assuming a constant angular velocity , it is necessary to
induce the moment . We compile equations of motion
using the Lagrange´s equations. For generalized
coordinates we choose rotation x and displacement y (in
the static equilibrum position, there assumed fixed point
on the axis of rotation). The kinetic energy of a fixed point
is expressed in the form:
=
m 2 +
m (y x)
2 , (3.4)
the potential energy stored in the spring is expressed in the
form:
V =
ky
2 . (3.5)
Figure 4
We receive equations of motion in the form:
m + (k - m ) y = 0 , M – 2my = 0 (3.6)
Then we rewrite the equation of relative oscillating
movement in the rotating plane in the form:
+ y = 0 , (3.7)
where
=
(3.8)
it is the natural frequency of relative undamped
oscillations.
From the equation ((3.8) it is obvious that the frequency of
relative oscillations depends on the relative angular
velocity of rotation. The system is obvious stable only in
cases the following condition is satisfied:
<
. (3.9)
We modifie the equation ((3.8) into this form:
+ =
, (3.10)
Comparative European Research CER 2016 (issue I.)
137

which is the equation of a circle with a radius
centered
at the origin of the system 0( ). Due to the physical
nature of the problem, it applies to only a quarter of the
circle in the first quadrant. The above procedure will be
applied to the propeller shaft of the following parameters
(it is the propeller shaft of the vehicle Š 781):
r = 0,0105 [m] , l = 0,65 [m] ,
E = 2,1.1011
[Pa] , = 7,8.103[kg.m
-3] .
You will receive the following calculations:
J =
r
4 =
(0,0105)
4 = 9 · 10
-4 [m
4],
S = r2 = (0,0105)
2 = 3,46 · 10
-4 [m
2] ,
k =
=
= 3,3 · [N/m],
m =
=
= 0,88 [kg],
(0) =
=
= 612,4 [rad ].
In this case, the natural frequency dependence of the
relative transversal oscillations is shown in the Figure 5.
Figure 5: The natural frequency dependence of discrete
model´s relative transverse vibration (shown in Figure 4)
on the angular velocity of rotation
4. Speed resonance analytical solution of propeller
shaft´s test model
In the reference number [1], there was derived an equation
of an one-dimensional continuum oscillating in a plane in
the following form:
·
+
+
y = 0 ,
(4.1)
where is:
y = y(x,t) .... instantaneous displacement of centre-
section
in the rotating plane
[kgm-3 .... material density
S [m-2 .... cross sectional area
J [ .... geometrical moment of inertia about an
axis
perpendicular to the neutral axis
E [ .... modulus of elasticity in tension or
compression
r [ .... radius of the circular cross section of the
shaft
[ .... the angular velocity of rotation of the plane
0(x,y) around the axis x
The above equation of motion will be applied when
calculating the natural frequencies of propeller shaft´s test
model. This is a shaft of constant circular cross section in
rigid bearings which does the bending vibration during
rotation (see Figure 6).
Figure 6: Test model for calculation of propeller shaft´s
speed resonance
Assume that each shaft section is held oscillating
movement with an amplitude dependent on the place are of
the time course the same for the whole shaft. Then we can
look for solution in the following form:
y (x,t) = Y (x) , (4.2)
where it is:
Y(x) … an amplitude of deflection on the x-coordinate
[rad ] … the desired angular frequency oscillations
of
its own
The solution (4.2) is substituted for (4.1):
S 2EJ Yx S 2EJ Y(x)ei t = 0
(4.3)
If the equation (4.3) has to be satisfied identically at each
time, must apply:
(x) – cY(x) = 0 ,
where
Comparative European Research CER 2016 (issue I.)
138

b =
,
c =
.
(4.4)
Due to boundary conditions (the shaft is mounted on rigid
bearings), we look for solution of the amplitude equation
in the form:
Y(x) = Y sin x , (4.5)
where
=
, n = 1,2, ... , (4.6)
l is the lenght of the shaft. Then we substitute the
envisaged solution (4.5) into the amplitude´s equation
(4.4):
Y sin x = 0 . (4.7)
From the condition of nontrivial solution of the equation
(4.7) we obtain a frequency equation of the form:
– c = 0 . (4.8)
From the equation (4.8) we obtain the relation for angular
frequencies of shaft´s relative transverse oscillations in the
form:
=
.
(4.9)
For the first angular frequency, when focusing on long,
slender shafts (l >> r), the term (4.9) is in simplified form:
=
.
(4.10)
In case = 0
=
·
,
or, if we substitute for J, S
=
·
. (4.11)
a known relationship to its angular frequency of beam´s
transverse oscillations of constant circular cross-section on
solid supports. Before we proceed to the quantification of
the above relationships, analyze the impact of the angular
velocity of rotation on its angular frequency of transverse
oscillations of the shaft. We modify the expression (4.10)
in the form:
= , (4.12)
where
a =
, b =
, c =
=
. (4.13)
We modify the expression (4.12) to the form:
+
= 1 , (4.14)
where
b =
·
= ,
=
·
= .
Thus, the equation (4.14) can therefore be rewritten into
the
form:
+
= 1 , (4.15)
which is in the coordinate system of the 0( ) a equation
of a circle of radius:
R =
=
. (4.16)
The radius is equal to its angular frequency of shaft´s
transverse oscillations at zero speed. The calculation is
performed for
E = 2,1. [Pa], = 7,8. [kg. ] , r = 0,0105 [m] ,l
= 0,65 [m] .
R =
·
= 636,35 [rad .
The functional dependence graph = ( for the
considered test example is shown in Figure 7.
Figure 7: The graph functional dependence of the angular
frequency ( ) lateral vibrations relative to the angular
speed of rotation of the proppeller shaft´s test model.
5. Conclusions
As a result of the torque transmission through Hook´s
joints, the connecting shaft is loaded by additional
dynamic bending moments in the plane of the rotating
propeller shaft. We can not accept the assumption that
shaft deflection wheels, as in the case of a simple circular
Comparative European Research CER 2016 (issue I.)
139

vibration of the continuum, but as a result of excitation
rotating torque is obviously forced to hold the relative
transversal oscillations. In the first step we formulate a
mathematical model of transverse oscillations in the
rotating plane. It is performed an analytical solution. On
the test model, there is performed numerical solution that
is used in the next step for tuning accurate models based
on the transfer-matrix method and on the finite element
method.
References
[1] HRUBÝ, P. Cardan coupling shaft vibrations in the
rotating plane. The written work to the professional exam
candidate. VŠSE. Plzeň, 1979.
[2] HÁJEK, E., REIF, P., VALENTA, F. The elasticity
and strength I. , SNTL/ALFA. Prag, 1988. 04-224-88.
[3] Team of authors and HÁJEK, E. The elasticity and
strength II. ČVUT Publishing. Publication number - 3251.
Prag, 1979.
Comparative European Research CER 2016 (issue I.)
140

THE TRANSFER-MATRIX METHOD IN THE APPLICATION FOR AN ONE-DIMENSIONAL LINEAR
CONTINUUM SPEED RESONANCE
Petr Hrubý, Zdeněk Hlaváč, Pavla Židková
Institute of Technology and Economics
Okružní 10
České Budějovice, 37001, Czech Republic
+420736228787
Abstract: The basic element for creating computational models of shafts is an one-dimensional linear continuum. Consider the
one-dimensional continuum in a state of combined bending-gyratory vibration. Modal and spectral properties of relative
lateral vibration in the rotating area are dependent on the angular velocity of shaft rotation. The problem can be after a first
approximation solved analytically. More complex systems can be solved either using the finite element discretization method
and converting to the problem of eigenvalues, eigenvectors, or using the transfer-matrix method, which is combination of
analytical solution and numerical methods. The paper described the use of the transfer-matrix method for solving of one-
dimensional linear continuum speed resonance in a state of bending-gyratory vibration. The authors drew a comparison
between the results achieved by the transfer-matrix method and the results of the analytical solution.
Keywords: vibration, combined, bending, gyratory
1. Introduction
Propeller shafts of drive vehicles transmit a torque at
relatively large distances. The shafts are long and slender,
and must be dimensioned not only in terms of torsional
stress, but it is also necessary to monitor their resistance to
the lateral vibration. Due to the continuous operational
area, the shafts must be operated in the region below the
critical speed. A lot of failures in the operating of shafts in
drive vehicles were an incentive to the formations of
academic works dealing with the analysis of the shaft´s
lateral vibration in drives with Hook´s joints. The results
of previous academic works which were also confronted
with experiments showed that propeller shafts represent
strong evolutionary systems (increasing the angular
velocity of rotation significantly reduce the spectrum of
natural frequencies relative transverse vibrations) and it is
necessary to respect this influence in practical calculations.
In specific cases of structural variants, the critical values
decline was 50 %. The paper described the basic approach
using the transfer-matrix method for calculating the natural
frequencies of the relativ lateral vibration and resonance
speed evalution. The authors drew a comparison between
the results of analytical solution and the results obtained
using the transfer-matrix method.
2. Formulation of the problem, objective solutions
Propeller shafts are in a steady state stressed by bending
moments harmonic, and their vectors are orthogonal to the
rotating plane of Hook´s joints relevant fork. The
mentioned exciting moments generate in a steady state due
to the transmission power flow through Hook´s joints and
cause lateral oscillations of propeller shaft in the rotating
plane. The basic element of propeller shaft´s physical
models is an one-dimensional continuum section. The
authors of the paper focused on application of the transfer-
matrix method in determination of speed resonance of that
element.
3. Physical model of continuum test section
This is a shaft of constant circular cross section in rigid
bearings which makes the bending vibration during
rotation, i. e. the relative transverse vibrations in the
rotating plane or combined bending-gyratory vibration (see
Figure 1).
Figure 1: The test model for calculation of propeller
shaft´s speed resonance.
The physical model is constituted by an one-dimensional
continuum of constant circular cross section.
It is defined by
geometrical parameters:
l [m] …the length of the one-dimensional continuum,
r [m] … the radius of the circular cross section of the shaft,
material constants:
[kgm-3 … the material density,
E [ … the modulus of elasticity in tension or
compression,
operating parameter:
[ …the angular velocity of rotation of the plane
0(x,y) around the axis x.
Comparative European Research CER 2016 (issue I.)
141

4. Mathematical model of the one-dimensional linear
continuum in a state of combined bending-gyratory
vibration
Let´s focus first on calculation the relative transverse
vibrations´ angular frequency of the propeller shaft´s test
model using the transfer-matrix method which is described
in detail in the reference number [1]. In [1] it was in detail
derived a equation of motion of the one-dimensional
continuum oscillating in the rotating plane in the following
form:
·
+
y = 0 ,
(4.1)
y = y(x,t) …the immediate deflection of center section in
the rotating plane,
S [m2 … the cross sectional area,
J [ … the geometrical moment of inertia (quadratic
moment of inertia) to an axis perpendicular to the neutral
axis.
5. Application of the transfer-matrix method in
calculating natural frequencies of the relative
transversal oscillations
The equation (4.1), respectively its solution, is used when
calculating the relative transverse vibrations´ natural
frequency of the propeller shaft´s test model in a state of
steady bending-gyratory vibration, using the transfer-
matrix method. Assume that each shaft section makes
oscillating movement with an amplitude dependent on the
site are of the time course the same for the entire shaft.
The solution is found in the following form:
y (x,t) = Y (x) , (5.1)
where Y(x) is the deflection amplitude at the coordinate x,
[rad ] is the desired angular frequency oscillations of
its own. The solving the equation, i.e. its deflection, slope
deflection lines, bending moment and shear force to
coordinate of x) are arranged in that order into a vector
state of V(x) which is bound with the initial vector state to
a coordinate of x=0 by the following custodial
relationship:
V(x) = H(x)V(0) . (5.2)
The boundary vectors of the shaft condition
V(0) , V(1)
are bound by transfer matrix of continuum section
H(l) .
The following applies:
V(l) = H(l)V(0) , (5.3)
where
V (l) =
, V (0) =
(5.4)
these are marginal state vectors for the intended type of
deposit, i.e. zero deflection, zero bending moments at the
edges.
Figure 2
Single row deep groov ball bearings or double row self-
aligning best meet these boundary conditions in structural
design (structural, functional model). Their pliability
neglect, they are considered perfectly rigid (see Figure
2.a,b). In the case of tapered roller bearings, as shown in
Figure 2 c, we consider zero deflection and the slope of the
line deflection, then zero bending moment and shear force.
In the coupling equation (4), there represents the matrix
H =
(5.5)
not only the transfer matrix of continuum section, but in
this simple case, also transfer matrix system.
(0), (l) are the amplitudes of the deflection slope line,
Q(0), Q(1) are the amplitudes of shear forces at the edges
of the shaft. Transfer matrix elements mentioned in the
paper below.
From relationships (5.1), (5.2), (5.3) we obtain a system of
linear homogeneous equations for the unknown amplitudes
of state variables in the following form:
·
= 0 .
(5.6)
From the condition of nontrivial solution of (5.4) we
obtain the frequency equation in the following form:
- = 0 . (5.7)
Comparative European Research CER 2016 (issue I.)
142

According to the reference number [1] is
=
,
=
,
=
,
=
,
(5.8)
where
=
,
=
,
= +
,
b =
, c =
,
= ch l , = sh l , = cos , = sin l .
(5.9)
The expressions of (5.6) are substituted into the frequency
equation (5.5):
=
2 1 2 Z2Z4+ 12Z42 ,
whence further follows (for > 0 , > 0 )
= 0 .
(5.10)
The equation (5.8) has a nontrivial solution for = 0 , i.e. for
l = , n , where n = 1,2, ... (5.11)
Let´s substitute the expressions from (5.7):
=
. (5.12)
We receive after modyfying the following equation:
c + b
-
= 0 . (5.13)
For expressions c, b substitute the expressions from (5.7):
+
-
= 0 .
(5.14)
From the relations (5.12) we obtain the wanted circular
frequencies (due to the physical nature of the problem we
are interested only in real positive roots)
=
·
. (5.15)
Comparing the expressions (5.13) with the results of
analytical solutionss
=
, (5.16)
we conclude that application of the transfer-matrix method
gives the same resulst as direct anlytical solution of the
problem. It is due to the fact that formulation of the
transfer matrix for the shaft is based on an exact analytical
solution of continuum´s differential equations throughout
the length l of constant cross-section. The expression
(5.16) can be for the first angular frequency – if we focus
on long, slender shafts (l >> r) – simplified to the
following form:
=
. (5.17)
The mentioned expression we got when neglecting the
Coriolis acceleration and gyroscopic effects. The
dependence of the frequency spectrum to the angular
velocity of rotation brings to system the centrifugal force
field when the propeller shaft oscillates laterally by
simultaneous rotation.
When = 0, the following applies:
=
·
,
or if we substitute for J, S:
=
·
, (5.18)
which is the known relationship for the natural angular
frequency of plane transverse oscillations of constant
circular cross-section´s one dimensional prism bonded to
the frame by two general kinematic pairs.
The calculation performed for:
E = 2,1. [Pa] , = 7,8. [kg. ] ,
r = 0,0105 [m] , l = 0,65 [m] .
R =
·
= 636,35 [rad .
Comparative European Research CER 2016 (issue I.)
143

The functional dependence graph of the first natural
angular frequency of the relative lateral vibration to the
angular rotation speed of the propeller shaft´s test model
= ( (5.19)
is shown in Figure 3. Given that these are the geometrical
parameters and material constants of the real vehicle
propulsion, it is evident that the drives of vehicles
normally operate in the areas of speed when it is necessary
(when considering the resistance of the connecting shaft to
the transverse oscillation) the effect of the fall of the
frequency relative transverse oscillations spectrum
(depending on the rotation angular velocity ) take into
account.
Figure 3: The functional dependence graph of the first
natural angular frequency of the relative lateral
vibration to the angular rotation speed ω of the propeller
shaft´s test model
6. Speed continuum resonance in a state of combined
bending-gyratory vibration
Let´s deal with evaluating of critical speed of the one-
dimensional continuum´s section of constant circular
cross-section. Using the transfer-matrix method, we solved
the natural frequency of relative transverse oscillation
which results from excitation by rotating dynamic bending
moments and takes place in a plane rotating at a constant
angular velocity. For the continuum is critical status when
the relevant circular frequency of relative transversal
oscillations is equal just the angular velocity of the
rotation.
As seen from Figure 4, this state occurs when
simultaneously fulfilled Ω= and functional dependence
(5.19).
Figure 4: Evaluation of the speed resonance of the
propeller shaft´s test model
7. Conclusions
The transfer-matrix method is one of the most used
methods when solving problems of the dynamics of an
one-dimensional continuum. It is particularly suited for
cases where applies for the geometric parameters of the
continuum element (segment) the r<< l. The method is
relatively simple and not increase the order of the transfer
matrix. The method is also suitable for „manual“
calculations on a desktop or a laptop. Regarding the planar
oscillation which the authors of the paper dealing with, this
is the fourth order matrix. The method is combination of
an exact analytical solution and numerical solution of the
frequency determinant. According to the literature, the
method is generally in some areas of calculations
numerically unstable. The authors of such a problem in
solving concrete problems of real drive cars especially
trucks not seen, however, in this case it is applied the finite
element method. The paper described the use of the
transfer matrix method to the propeller shaft test model in
the shape of an one-dimensional continuum stored in rigid
bearings. The paper described the methodology of
evaluation of speed resonance. The results obtained are
compared with the analytical solution.
References
[1] HRUBÝ, P., HLAVÁČ, Z. The Vibrations of Cardan
Mechanism Long Driveshafts of Tatra Trucks. The
Research Report no. 102 02 79. VŠSE Plzeň, 1979.
[2] HÖSCHL, C. The Use of Small Computers in the
Dynamics of Systems. DT ČSVTS Prag, 1983.
[3] RALSTON, A. Foundations of Numerical
Mathematics. Academia Prag, 1978.
[4] WILKINSON, J., REINSCH, C. Handbook for
Automatic Computation, Linear Algebra. The russian
translation of Mašinostrojenije. Moscow, 1976.
[5] BOLEK, A., KOCHMAN, J. The Machine Parts. The
first volume. SNTL Prag, 1989. The publication no.
10806. 04-202-89.
Comparative European Research CER 2016 (issue I.)
144

Session: Pedagogy, Psychology Index of Author(s)
Bajnarová, Marie Cintulová Ludvigh, Lucia Juhásová, Andrea Kaduchová, Petra Kozubik, Michal Łuszcz, Małgorzata Anna Martáková Styblíková, Jana Odraska, Lukas Odraskova, Barbora Vido, Ján Złotogórska, Agata
Comparative European Research CER 2016 (issue I.)
145

THE RISKS AND POSSIBILITIES OF REDUCTION THE IMPACT OF CODEPENDENCE FOR FAMILY
MEMBERS
Andrea Juhásová
Constantin the Philosopher University in Nitra, Faculty of Education
Drážovská cesta 4, 949 74 Nitra, Slovakia
Tel.: +421 37 6408 272
Abstract: This contribution deals with the influence of addiction in parents on social aspects of their childrens´ lives. It
describes the scenario of addiction in the family, its impact on the family and codependence syndrome. The author´s priority
was to identify the consequences of parents´ alcoholism on childrens´ socialization and to describe the influence of alcohol
dependence on the childrens´ adult lives. In the conclusion of this article the author offers options of solving this issue caused
by codependence.
Keywords: family, dependence, codependence, adult children of alcoholics
1.Introduction
An addiction is an obsession which enslaves humans, rids
them of their freedom and personal integrity. Without
trying to fight to overcome it, great destruction awaits the
human in their life (Křivohlavý, 2003). According to the
World Helath Organisation, addiction is “The state of
regularly repeated or chronic intoxication by psychotropic
substances. The WHO considers an addiction an
intoxication, as in, a consequence of repetitive ingestion
of natural or synthetic drugs, when it shows an undeniably
harmful effect on the individual, social group, or society.“
(Gohlert, Kuhn, 2001) The issue of addiction is
worldwide. Many international - scale experts are looking
for effective ways to get over an addiction or prevent it.
(Fischer, Škoda, 2009). According to Gebsattel´s theory(In
Längle, Probst, 1997), addiction arises as a consequence of
the feeling of emptiness and impulse leading to self-
destruction, which every human carries inside of them.
2. Alcohol dependence and its impact on a family
Alcohol dependence is often called an illness. Alcohol is
the most used and most socially acceptable addictive
substance. It is used in many social rituals. One can obtain
it without difficulty, for fairly little money, and it is
available most everywhere. (Straka, 2005).
WHO (In Drogy, 2014)states : „The dependence on
alcohol comes in when one cannot, despite their best
judgment, stop the usual excessive consumption of
alcohol, or lower its intake without the apparition of
abstinence symptoms.
Mentions of alcoholism and its harmful effects were made
as early as in the works of Hippocrates, Aristoteles,
Galeanos or Avicennos, but the breakthrough in medical
perception of alcoholism occurred on the turn of the
18/19th century. In 1849, the Swedish doctor Magnuss
Huss, for the first time in human history, described
alcoholism as an illness with a wholesome clinical
description. (Kunda a kol., 1988). Alcoholism was
officially accepted by the WHO as a medical problem 100
years later. (Kalina, 2003).
The medical point of view differentiates among five basic
types of addiction. Gohlert and Kuhn (2001) state:
1. Alpha Type, in which temporary mental addiction
occurs, the individual does not lose control, he is
though a conflictual, tipsy type, whose drunkenness
causes minor familial and social misunderstandings.
2. Beta Type, typical by excessive, but not regular
consumption of alcohol. The weekend or occasional
drinker, not developing psychological or somatic
addiction, but some somatic problems occur when
consuming alcohol, such as nerve inflammation or
gastritis.
3. Gamma Type, significant by the loss of control under
the influence of the addictive substance, accompanied
by psychological, and at a later stage, even somatic
addiction. The alcoholic is still able to abstain,
although the tolerance margin rises. Alcohol
poisoning is regular in this type.
4. Delta Type is unable to abstain, but maintains control
over the consumation, therefore excessive drinking
and poisoning do not occur. This type has to drink
alcohol daily, so they are almost never sober.
5. Epsilon Type is quite rare. After a couple of months,
disturbances lasting more than one day occur due to
compulsory drinking. Control is lost and a state of
distortion occurs. These individuals tend to be
clinically and socially inconspicuous.
Different types of alcoholism overlap, thus the
development of the illness is marked by transitions among
them.
Alcohol dependence not only influences the life of an
individual, but also has a great impact on theier family, A
family with an addicted member has a range of
complications, relationships get disturbed among its
members, divorces occur. (Vasilescu, 2011).
We differentiate three basic types of alcoholic families:
1. Families where the father is addicted to alcohol
In the present, the father is still perceived as the main
breadwinner whose most important duty is to sustain the
family, mainly on the material side. This means that if the
father is the one addicted to alcohol, the family suffers not
only mentally, but also financially and/or materially. An
alcohol-dependent father does not support his family
financially, instead he uses his salary to satisfy his
Comparative European Research CER 2016 (issue I.)
146

interests. It often happens that the father loses his job due
to addiction, becoming unemployed, which is when he
starts buying alcohol using the financial resources of his
wife. In the behavior of an alcohol-dependent father we
recognise two situations: one, when he is under the
influence of intoxication, and another in the periods of
sobriety. A difficult situation for the relatives starts when
the addict becomes agressive in the period of intoxication,
be it brachially or verbally. In the time of the father´s
sobriety the family members are exposed to incessant
promises, breaking of said promises, repetitive lying,
evading answers, denying the alcohol problem and
rationalization of the driniking. In a family like this, the
mother tries to take on the father´s role. Many times, due
to financial hardship, she works several jobs at a time to
compensate for the financial deficit of the family, caused
by the father´s alcoholism. Caring for the family and the
functioning of the household are all on her shoulders.
Often, she spends extra energy to deny the alcoholic´s
problems and misdemeanours. She is chronically tired and
overworked, which shows significantly on her behaviour,
even towards her children. She is irritated and has
inadequate reactions to her children and their needs. She
tries to realise the situation and behave kindly towards her
children, but given her state she oftentimes is left without
even enough energy to smile. She is glad if the children do
not have any bigger problems at school, which she would
have to solve, and when she doesn´t have to pay the least
bit of attention to the child. The child is often screamed at,
and in case some problems appear with the child, the
mother emotionally blackmails them using the family´s
situation (Phrases like “Why are you making up more
problems for me?”, “Can´t you see I´m busy?”). The child
cannot understand the mother´s behaviour, they reproach
the mother mentally because they are unable to realise that
her behaviour is caused by overworkedness and the
tiredness and exhaustion that comes with it. A big paradox
in this situation is that the child often tends to have a closer
relationship with their father. The relationship with the
alcohol-dependent father is not always negative. In fact,
ambivalent emotions prevail : love and hate, hope and
disappointment, friendliness, understaning, but also
resentment, fear, refusal. The child is disappointed many
times and this disappointment can lead to a lack of
confidence not only towards the father, but is also
generalised as a lack of confidence in the whole “outer
world”.
2. The mother addicted to alcohol
In our society the mother is perceived as the one who
makes the househod function properly, cares for the
children. If the mother is addicted to alcohol, the family
suffers in this aspect, too. In a more advanced stage of the
mother´s addiction, the children are neglected not only
mentally, but also physically, they are dirty, hungry and go
to school unprepared. The situation goes unnoticed by the
father/husband, probably because of work duties keeping
him out of the house and family. The mother´s duties are
most frequently taken on by the grandparents, or the eldest
child of the family. In the case of the duties being taken on
by the eldest, premature maturity occurs, because the tasks
are not ones they would normally accomplish, regarding
their age. The mother realises her addiction, she
reproaches herself for the arisen situation, tries to start
again and live a “normal life“. She seeks impulses which
would mean this new start, such as painting the house or
moving, or a change of personal image or profession. The
addiction is habitually stronger, though, so the mother
fights with repeating failure, which only reinforces her
alcohol addiction. She also repro herself for neglecting her
children. In alcohol-dependent women, apart from the
frequent remorse, we als observe, mainly at the start, a
strong tendency of hiding the addiction from her
surroundings, normally they manage to do this for a quite
long time. Lies, evading and denying the problem take on
a bizarre form. Uhlinger and Tschui (2009) state that one
out of every three alcohol addicts is a woman.
3. Both parents addicted to alcohol
According to Okruhlica et al. (1998) this is a serious
pathological situation, which, paradoxically, sometimes
holds the partners together substantially longer than in
asymmetric pairs, where there is only one alcohol-
dependent person. In this case, the partners are not bonded
by deep feelings or love, but by a common passion –
drinking alcohol. They realise that a different, non-
dependent partner would not stay with them, whereas with
this one they have feelings, problems in common, that are
the center of their thinking. Even if they manage to get
over the addiction and abstain, the relationship is almost
always doomed. The abuse of alcohol in both partners has
catastrophic consequences on the lives of their children.
They are very vulnerable, mentally and physically
neglected, sometimes abused. Many times, the
phenomenon of parents alternating in drinking occurs.The
worst situation arises if both parents drink parallelly, at the
same time. The atmosphere of the family is emotionally
unstable, agressivity prevails and the parents fail to bring
up their children. The eldest children take care of the
younger siblings. The parents´ behaviour represents a
difficulty for them. In many cases this supports the
siblingly cohesion, but this is not always true. They could
be aggressive and maladaptive and they fail in school.
Influenced by the situation, they try to run away from
home, many times they show suicidal thoughts or
intentions. As adults, they show mental and social
problems – they get into a repetitive, vicious violent circle
– men become alcoholics and girls, more frequently than
average, find addicted partners again. (Bentovim, 1998).
Pathological addiction to alcohol and focus on it and its
acquiring means the loss of interest for oneself in man, but
also loss of interest in one´s family, their sentimental life
weakens, the family is disrupted. (Višňovský, Valentík,
1989). A dysfunctional family system can create
individual psychopathology, which then complicatedly
affects the optimal functioning of the family as a
whole.(Matoušek In Sobotková, 1997).
The conduct of a family member within the family system
is affected by the conduct of the other family members.
Uncontrolled alcoholism menaces the effectiviy of
communication in the family, emotinal relationships crash,
the family members feel loneliness, emptiness. Often, the
Comparative European Research CER 2016 (issue I.)
147

most important conclusion of alcoholism in the family is
the children leaving at the first opportunity, although they
are not ready for a self-sustaining life. (Profous, 2011).
A family with an alcohol-dependent member gradually
passes from a healthy one to being a codependent family,
its viewpoint on addiction changes, it passes through
several phases shown by changes in the members´
behaviour and are acompanied by diverse feelings.
3. Codependence syndrome
The term codependence emerged in the 80s in the United
States of America. It started being used in treatment
centers in Minnesota. They used it in alcoholics
anonymous groups, where the members of the addicts´
families. In the 40s, groups founded by addicts´ spouses
started to arise gradually. Their main goal was to
understand the system and main principles of
codependence and to learn to handle situations caused by
it. (Laskovská, 2007).
Either a child, adult child, adult, partner, wife, grandparent
or friend can be codependent. The nature of codependent
behaviour is an uncontrollable need to help and control.
(Vasilescu, 2011).
Codependence is frequently the main reason why the
family member´s alcohol dependence persists.
It shows these characteristic signs
1. the need of caring after others,
2. pathological behaviour
3. lack of self-confidence
4. incessant controlling and self-blame for the situation
arisen in the family
5. long-time denial of the existing problem
6. predispositions for addiction
7. failing communication
8. insufficient boundary determination,
9. litlle shown confidence,
10. anger.
Jackson 1958 (In Gabura, 2012) describes the stages
through which a family with an alcohol-dependent
member passes
1. the family tries to deny the problem and have
everything under control
2. the faimily tries to rid itself of the problem, isolating
the member
3. the family is disorganised, conflictual situations and
threats occur
4. the family desperately tries to find solutions, shows
effort to reorganise
5. the family wants to flee the problem, the addict is
isolated
6. the family reorganises by seeking specialised help
7. Alcohol dependence in a family member remarkably
affects their children.
4. Helping children with alcohol-dependent parents
Pavelová (2009) states, that in the current time, very little
attention is paid to the codependent. She considers the
existing self-help groups meaningful groups of people
trying to achieve a new quality of life. She considers
elements which help weaken the feeling of isolation in
people with any type of problems, while also offering
emotional support, or other help mutually offered among
the group members, substantial in the work of any self-
help group. A significant element of the system is dealing
with hardship through mutual help among people with
similar difficulties. (Matoušek, 2001). In Slovakia, the
self-help groups Al-Anon exist as an option of self-help. In
1935, the first of such groups emerged in the US. In these
groups, friends and relatives of alcohol addicts come
together to support each other, exchange experience, give
each other strength to solve their common problem. The
group was founded with the goal of helping families.
Within Al-Anon, adult children of alcohol addicts meet
because their parents´ drinking has left consequences on
them. There are no professional therapists nor specialised
expets in Al-Anon. They create informal discussion
groups, where group members talk about their feelings,
learn to work with their fear, to understand their feelings,
and work together on their healing.
Another option of effective help for adult children of
alcoholics is social counseling. The primary goal of social
counseling should be removing the victim, sufferer, or
codependent role. It is necessary to help in removing
feelings of anger, hate toward the addict and fear. Within
individual counseling, there are solutions to any neurotic
problems, which are the result of long-term trauma or
vicitmisation. Importance is mainly attributed to education
in the matters of alcoholism to exclude myths forthcoming
from distorted information and possible stigmatisation.
Okruhlica (1998) is of the opinion that professional
counseling in the area of addiction should be left in the
hands of medical workers, as in, specialised doctors
working in the area of addiction,psychologists and trained
nurses. Pavelová (2008) opposes this, stating that
specialised social counseling aimed at the area of addiction
belongs not only into the competence of medical workers,
but also social workers having acquired the necessary
knowledge and having the personal prerequisites to work
with an addicted client.
5. Conclusions
Children who, in the family of an alcohol addict, are
constantly injured and ofttimes confused by what´s
happening around them, protect themselves by lying,
denying and hiding their feelings, and evading close
relationships. The addiction of the parent greatly affects
the child´s self-confidence. The child is not capable of
social contact and constantly blame themselves for the
pathological situation in the family. The lives of children
with parents addicted to alcohol are affected even into
adulthood. They have low self-esteem, feelings of
inferiority, they are unable to finish tasks. They have a big
problem relaxing in company, which stems from their high
levels of self-control, and an inability to confide in other
people. They use the form of defense, acquired in
childhood and adolescence, in adulthood, without realising
it. (Šavrnochová, 2011). It is necessary for children of
alcohol-dependent people to get adequate help and could
thus fully live their life. In our society, though, we do not
yet realise the need of help for children who, during their
Comparative European Research CER 2016 (issue I.)
148

whole life, have suffered due to the alcohol addiction of
their parents. It is necessary to support specialised
education of competent people working in this field. It is
also indispensable to get a multidisciplinary team into their
treatment, consisiting of a social worker, a psychologist
and a psychotherapist. Systematic implemetation of
specialised teams into practice can perspectively influence
not only the mental health of alcoholics´ children, but also
diminish the risk of addiction in families they will further
create themselves.
Acknowledgements
VEGA no. 1/0462/14: Youth delinquency of the Slovak
Republic in the context of selected factors – self report
study.
References
[1] BEATTIEOVÁ, M. Koniec spoluzávislosti. Trnava:
Spolok Svätého Vojtecha, 2006, 275 s. ISBN 80-7162-
631-7
[2] BENTOVIM, A. Týrání a sexuální zneužívaní v
rodinách. Praha:Grada 1998, 120 s. ISBN 80-7169-629-3
[3] Drogy nie [online]. 2014. Dostupné na internete:
http://www.drogynie.sk/alkohol.php
[4] FISHER, S. -ŠKODA, J. Sociální patologie. Praha:
Grada, 2009. 224 s. ISBN 978-80-247-2781-3
[5] GABURA, J. Teória rodiny a proces práce s rodinou.
Bratislava: Iris 2012, 318 s. ISBN 978-80-89256-95-2
[6] GOHLERT, CH. A KUHN, F. Falošné vedomie.
Bratislava : Ikar 2001, 142 s. ISBN 80-551-0207-4
[7] KALINA, K. Drogy a drogové závislosti. Úrad vlády
ČR 2003, 319.s ISBN 80-86734-05-6
[8] Křivohlavý J. Psychologie zdraví, Portál: Praha 2003,
278 s. ISBN –80-7178-774-4
[9] KUNDA, S. a kol. Klinika alkoholizmu. Martin:
Osveta, 1998, 248.s ISBN 70-020-88
10] LASKOVSKÁ, Š. Kodependencia In Psychiatria pre
prax. ISSN 1335-9584, 2007, roč. 4, č.4, s.163-165
[11] LÄNGE, A., PROBST, Ch. Süchtig sein. Entstehung,
Formen und Behandlung von Abhängigkeiten. WUV-
Universitätsverlag, Wien 1997, ISBN 3-85076-428-1
[12] MATOUŠEK, O. a kol. Základy sociální práce.
Praha: Portál, 2001, 309 s. ISBN 80-7178-473-7
[13] OKRUHLICA, L. a kol. Ako sa prakticky orientovať
v závislostiach. Príručka pre poradenskú činnosť.
Bratislava: Centrum pre liečbu drogových závislostí, 1998.
ISBN 80-968111-1-8
[14] PAVELOVÁ, Ľ. Sociálna práca v oblasti závislostí.
Aké má šance? In Čistý deň. ISSN 1336-4243, 2008, roč.
6, č.3, s. 24-25
[15] PAVELOVÁ, Ľ. Systémová práca s rodinou
závislého. In: Akční pole sociální práce III. Aktuální
otázky sociální práce a sociální pedagogiky : sborník z
konference, Olomouc : Univerzita Palackého, 2009. ISBN
978-80-244-2449-1
[16] PROFOUS, J. Průvodce alkoholovou závislostí.
Praha: Galén, 2011. 108 s. ISBN 978-80-7262-820-9
[17] SOBOTKOVÁ, I. Psychologie rodiny. 2. vydanie.
Praha : Portál, 2007. 219 s. ISBN 978-80-7367-250-8
[18] STRAKA, M. ...až na dno. In Čistý deň. ISSN 1336-
4243, 2005, roč.3, č.4, s. 12
[19] ŠAVRNOCHVÁ, M. Vplyv rodinného prostredia v
prevencii drogových závislostí
terapeuticke centrum [online]. 2014 [citované 12.03 2014].
Dostupné na internete: http://www.terapeutickecentrum.
com/wp- content/uploads/2011/12/Z%C3%A1vislos%C5
%A5-od-alkoholu-z-poh%C4%BEadu-rodinn%C3%A9ho-
terapeuta.pdf
[20] UHLINGER, C. - TSCHUI, M. Když nekdo blízky
pije. Portál: Praha, 140 s. ISBN: 978-807367-610-0
[21] VASILESCU, A. Sociálna práca so spoluzávislými.
In MÁTEL, A. - JANECHOVÁ, L. - ROMAN, L. (eds.).
Sociálna patológia a intervencia sociálnej práce. Zborník
medzinárodnej vedeckej konferencie. Bratislava: VŠZaSP
sv. Alžbety. 2011, ISBN 978-80-8132-018-7
[22] VIŠŇOVSKÝ, P. - VALENTÍK, M. Človek v
bludnom kruhu. Martin: Osveta 1989. 74 s. ISBN 80-217-
0062-9
Comparative European Research CER 2016 (issue I.)
149

QUANTITATIVE AND QUALITATIVE APPROACHES IN THE DISSERTATION RESEARCH
Marie Bajnarová
Masaryk University in Brno
Faculty of Education, Department of Art
Poříčí 7, 603 00 Brno, Czech Republic
Abstract: The text is focused on drawing peculiarities of individuals from Juvenile Detention Centres (JDC). Mixed research is
focused on the research questions and hypotheses dissertation. This text focuses on motivations and spontaneous artistic
expression of the delinquents. Through the art creation one opens himself up to others and reveals his secret sides. The aim is
also to find out what is the nature of the drawing process in troubled individuals.
Keywords: mixed methods, research questions, research hypotheses, Juvenile Detention Centre, drawing process
1. Youth with Behavioral Disorders and Significant
Education Problems in the Process of Drawing
The puberty brings about plenty of personality changes.
Turning inward into one's own world, especially one's own
self, is a typical feature of an adolescent. Such thinking,
through all criticality, is usually ruled by emotions, moods
and desires. According to Cacka the age of puberty is a
period for the frequent occurrence of adverse reactions like
lies, slanders, frauds, fights and the like [1]. He also
describes this period as a lust and hunger for life, which is
an expression of the natural need of broadening one's
experience horizon. He mentions the huge danger of
stumbling on the road to adulthood by which he means an
immature attitude of the whole personality. Mental
instabilities, social and ethical deformations take place
often during adolescence and that might cause the
occurrence of behavioral disorders that can indicate the
future delinquent behavior of the person. The person has to
face various types of mental burdens whether they are
exams in the school, stressful moments or conflicts in
themselves or in relations with people around and family.
Strigacova as well mentions personality problems and
among them she considers membership in gangs,
alienation from family, drug addiction, alcoholism, drug
dealing, tendencies towards violent behavior, low IQ or
mental disorders (not feeling responsibility, deviations,
etc) [2]. The mentioned factors can be understood as some
kind of signal of the future delinquent behavior of the
adolescents.
1.1 Spontaneous Artistic Expression as Self-Expression
The individuals' spontaneous drawing expression has
become the centre of attention. Further I examines the
artistic expression that accompanies the spontaneous
individual's expression. The meaning of spontaneous
expression lies within the present moment, which is being
experienced by the creator. Therefore the author seeks the
answer to the question, what the young delinquent is
experiencing during the process of his artistic formation.
By spontaneous artistic expression we mean a creative
activity that is not directly or intentionally encouraged or
stimulated by another. It is about an impulse which arises
from the internal needs of a person who decides to
creatively and artistically respond to external and internal
stimulus. A spontaneous expression is related to the artist's
relationship to reality and that is why this artistic form
does not require a true presentation nor respecting
proportions nor precision regarding details, it is about
expressing the artist's essence. This is also about being
able to reach one's deep feelings and experiences. At this
moment, the artist authentically devotes himself into his
own perceptions and the art form. A spontaneous creation
is about the artist focusing primarily on capturing his
current mental state, impressions, feelings and moods,
thoughts or his attitudes. Problematic children from JDC
are not mentally ill, however are different from ordinary
young children. According to one nurse problematic
children are "Emotionally Handicapped". They experience
internal conflicts, conflicts with their loved ones or with
their surroundings. They are rebellious, they feel under
pressure and are frustrated. Many of them already at their
age have gone through so many experiences and have so
much life experience, that an adult could be astonished by
this. In my opinion their experiences then express their
distinctive and impulsive incentives in their self-
expression, thus it is helpful for them to express their
personality through art activities.
1.2 Motivational Process for the a JDC to Provide
Drawing Expression
The essence of drawing expression is based on motivation.
The drawing process is the action of both external and
internal forces as well as the person's interaction with the
group, their environment or their ideas. Good conditions
must be created for the drawing process of an individual.
Motivation for drawing expression should be in a friendly
atmosphere and should stimulate the troubled individual
for creation, not dampen them. Unrest and noise at the
beginning of creation is never beneficial and it rather leads
to anxiety and suppresses the drawing expression. Also
negative influences made before the drawing might cause a
state of anxiety, leading the artist to superficial expressions
and the final works a sign of parody. If we know that the
individual is not totally in the mood for a drawing process
it is not appropriate if they are actively forced into it.
Motivation and the drawing process should be created
without prejudices that the individuals would commit
something during the activity. There should of course be
Comparative European Research CER 2016 (issue I.)
150

some supervision over the wards but only to the extent that
safety measures do not disrupt the drawing. To make the
drawing process authentic and identical to the artist’s
perception it is necessary that the drawing person not have
a feeling they are being watched over, observed,
controlled, corrected and warned. If the individual draws
under pressure and the motivation is somehow based on an
order it is sure that the individual will rebel in their
drawing expression, be influenced by disgust caused by
the task and the result may appear to be an expression of
defiance. Read thinks that when the adolescent draws
anything under someone's influence or guidance they draw
especially for themselves, that they should follow their
own hidden aims and that "It is about the independence of
their activity firstly provided." [3] The key person for the
drawing process is therefore the coordinator of the whole
process, who controls the atmosphere during the activity,
motivates, stimulates and praises the individual, regulates
unconforming behavior, gives space to free expression,
communicates with the individuals, gains feedback from
the task and evaluates the results. It is necessary for the
coordinator of a drawing event to be able to create the
right atmosphere. "If they are to create a free creative
space around them they, at the same time, have to suppress
personal opinions, not impose their ideas or art opinions."
[4] It is necessary to create such conditions that they
become a source of motivation. Not only a friendly and
creative atmosphere but also the name of the drawing task
will become a motivation. A relaxation exercise before
drawing is usually beneficial and helps one to calm down
and think about one's feelings and thoughts. An individual
should understand motivation and drawing as a relaxing
creative activity that will enrich their knowledge. It is also
supposed to detract from destructive tendencies and play a
significant role in overcoming mental troubles [5]. The
coordinator of a drawing activity should choose proper
words, sentences and questions. It is a crucial mistake to
look down on the individuals and talk extremely correctly
during the motivation. The attention of the wards cannot
be gained like that. As well as that, it is necessary to
organize the drawing activity and adapt the environment in
a way that the individuals will feel relaxed during their
drawing. The wards should not sit in the way they sit at
school desks and they should draw at one table and the
coordinator should sit next to them. They should in no case
stand above them. Motivation not only for drawing process
but also for finding one's own identity through creative
activity is not supposed to be an effort for a perfect result,
but a tool for understanding troubled individuals.
2. Formulation of the Research
At the center of the research is the youth who has a
difficult temperament and grows up in educational
institutions. The aim is also to find out what is the nature
of the drawing process in troubled individuals. My aim is
to find and point out specific drawing originality, signs and
symbolism. It is focused on the artist themselves, their
distinctive drawing message and the creative process. I
also watch the behavior and attitude of the tutors and
supervisors during the creative process of the youth. The
research work includes a variety of views on respondent's
visual art submission. This research specifically addresses
questions of how conduct disorder among adolescents is
reflected in their drawing expressions, what affects the
youths during their artistic process and how they can work
with drawing tools. The main aim was to conduct Art
meetings / Art Therapy, which allow me to monitor the
distinctive artistic expression of an individual who has
fixed and repetitive inappropriate behavior. The purpose of
the meetings is to listen to the authentic testimony, which
reflects the current mental state of the youth from the JDC.
This paper also summarizes current results of this research
for this thesis. This dissertation work is focused on
children and adolescents with conduct disorder. I would
like to put emphasis on the art meetings where their main
purpose is to motivate the artists to create a spontaneous
drawing, then watch these respondents during their artistic
process, make subsequent conclusions that can be drawn
from the art meeting and then make an interpretation of the
distinctive artistic expression. This artistic expression can
be seen as an instrument through which we can get to
know and understand the problematic individuals who
show occurrence of conduct disorder or frustration. The
drawing activity or any other artistic activity in the end
becomes a means of communication between myself and
the respondent. I emphasize that I do not intend to
diagnose an individual, I have no authorization to do such
a thing and I do not wish to evaluate or judge anyone. The
purpose of this thesis is to acquire authentic testimonies of
the problematic individual or an individual in the
delinquent perspective, where his current mental state,
thoughts, experiences or interests are reflected. Another
aim is to highlight the artistic features, the artist's hand
moves, dynamics, tempo, graphic elements and symbols.
The research was launched in October 2013-2015. Part of
the research actions is to evoke the creative atmosphere
and good motivation to artwork. The respondent has to feel
relaxed during the process of drawing. The length of the
research action is going to be 15 to 20 minutes. The
drawing is oriented on 43 troubled individuals.
2.1 Design Mixed Methods Research
The mixed research identifies the quantitative and
qualitative data which are analysed and presented
separately. Explanation of the mixed research: 1. Subject
of interest – Children and teens with behavioral problems,
the drawing process of problem individuals and their
characters and symbols in the artifacts, reflection of artistic
communication, communication and the relationship
between the respondent and the teacher. 2. Object and
purpose – Provide recommendations and information
about approaches to children and adolescents with
disorders of behavior in art activities, insight and
understanding of the speech on the authentic drawing
individuals with behavioral disorders, provide a valuable
source of interpretative practices not only for educators or
therapists but also for parents, point out the reactions and
behavior of teachers during the drawing of the activity, the
use of communication and reflective dialogue as a tool of
cognition of children and adolescents with behavioral
Comparative European Research CER 2016 (issue I.)
151

problems. 3. Definition of the research environment –
Three Juvenile Detention Centres / Czech Republic (Data
collection was carried out also in kindergarten, elementary
school, middle school, the grammar school, orphanage and
also primary and secondary school for mentally
handicapped children and adolescents. The research
sample contains 125 drawing artifacts). 4. Definition of the
research sample – Children and adolescents with
behavioral disorders living in JDC, 36 respondents aged
from 12 to 20 years. 5. Qualitative research – A research
study of the creative environment/creative atmosphere, the
drawing process and the motivation to create. 5.1
Observational studies – Monitoring of the phenomena that
affect authors throughout the research objectives. 5.2
Interpretation – Interpreting and evaluating the drawing
processes, resulting products, effects of the atmosphere
and the behavior of the respondents during the creative
expression. 6. Quantitative research – The General
hypotheses and opinion.
2.2 Research Questions and Hypothesis
Research Questions: 1. How can we detect the reflection of
contrived violation of standards, deranged or deviated
behavior in the expressed features of the drawings? 2.
What are the most common drawing elements and their
symbolic interpretation? 3. What kind of an attitude has a
person with conduct disorder towards his drawing and the
given task? 4. How does he use drawing tools to capture
his current mental state, memories, experiences and
wishes? Quantitative research / General hypotheses and
opinion: H1 – What are the differences in the drawing
spontaneity of a troubled individual depending on the
presence/absence of a tutor during the drawing process?
H2 – Is drawing spontaneity and the candid drawing
expression of an individual with education problems a
reflection of their values, attitudes, thoughts, opinions and
current mental condition? Opinion – Is it truth that "[…] when
it comes to children with behavioral disorders the drawing has
less motives, details and colors, depressive children often
using dark colors, mostly black and brown? " [6]
3. Drawing Process in Mixed Research
The center of the experiment becomes a drawing task. The
essence of the drawing task and motivation is also invoked
by the respondents to the memories of family, loved ones,
friends, home, neighborhood, nature, experiences, etc. The
author has seen the association of motivation and creative
task. The drawing task is to open the contents to a personal
experience of the authors. "Drawing should be an activity
performed without effort, it should rather be desire than a
reluctant effort." [7] The research is split into two groups.
Group A will consist of 18 respondents who will draw
under the supervision of a tutor and also the following
drawing tools will be offered to them: papers, crayons,
pencils, rubbers and sharpeners. Group B consisting of 18
respondents will express themselves by drawing without a
tutor's supervision and be offered only pencils and papers.
It is assumed that Group A will be more nervous, uptight
and use the offered tools more often. Group A – The
drawing process in Group A took place in the presence of
tutors. Safety precautions were exceedingly provided and
the creative atmosphere was becoming more like a
"prison". The beginning of the creative atmosphere did not
go well. Some of the tutors did not make a positive
impression on the respondents by mocking the
respondents. The respondents did not protest but started to
be bored and disgusted. They also started the drawing
process so as the not to be given a punishment. It means
the respondents drew because they were told to by the
tutors. They did not draw on their own initiative. They did
not enjoy the drawing and the creative activity brought
them no satisfaction. They did not show interest in creative
activity. Some of the drawings had some parody in them;
they were not personal, original and seemed to be forced.
The drawings were dirty, very easy and linear, without a
story, the characters were bizarre and nonsensical as well
as the perspective. The respondents erased and re-drew the
drawing lines more often. They were nervous during the
drawing process. Some of them suppressed anger, which
was visible on thick drawing lines. Group B – The
respondents who were drawing without supervision or the
presence of a tutor or in a room with not such a large
amount of security measures did not re-do their drawings,
did not erase and their drawing expression was more
confident. A more positive relation to the creating process
could be observed. The respondents were more
communicative. They were pleased by the drawing task
and were able to dive into the process more. Fantastic and
fairy tales motifs occurred. Some of them had a sense for
the elaboration of details. The artists tried to talk about
what they were making up and what they were drawing.
Interest for drawing and fine art was aroused among the
respondents. In this case it was found that drawing
spontaneity and honest drawing expression without
parody, defiance or disgust took place in the absence of a
tutor. The wards were more open in both art expression
and communication. They used a reflective dialogue on
their creations. During the drawing process they did not
need a rubber, did not re-draw the drawing lines, the
drawings full and the creations joyful.
3.1. Reflection on the Gained Data
The drawing process of a troubled individual is more
relaxed when the relations of the ward with their tutor are
positive, friendly and security measures are not too strict.
Security measures should be at such an extent not to
discourage artistic creativity and not intervene in the
concentrated artistic process of the artist. Drawing
spontaneity depends on the relation of the artist with
behavioral disorders to the tutor. When the presence of the
tutor intervenes in the drawing process or any creative
impulse of the ward, relaxed drawing, a distinctive artistic
message and original artistic expression cannot be
expected. The assumption that the respondents will be
more nervous and uptight during the drawing process in
the presence of a tutor was proven true in the case when
there were more tutors or negative relations between the
tutor and a respondent prevailed (see Table No. 1).
Spontaneous drawing and candid drawing expression of
the artist becomes a reflection of their values, attitudes,
Comparative European Research CER 2016 (issue I.)
152

thoughts, opinions and mental condition (see Table No. 2).
Moments during the creation with an artistic tool left
permanent marks (in the form of an artifact, lines and
pencil strokes, traces after the drawing, etc). The claim that
a drawing by children with behavioral disorders usually
contains less motifs, details and colors is not completely
right. Drawings poor in motifs appeared only in Group A
(drawing process in the presence of a tutor). However, the
respondents who were relaxed, focused and not under
pressure were able to grasp gained experiences and their
emotions through drawing. The respondents felt the need
to say something about themselves through a drawing tool
(pencil). They perceived their drawing as writing a letter
for a close person but the text of their thoughts was hidden
in symbols, motifs, artistic handwriting, tempo and the
entire presentation (see Table No. 3). Some individuals
clung to details and their drawings were sophisticated.
Precise drawings also appeared. As for the claim about
depressive children it is correct. It was observed in the
research that depressive unstable individuals or individuals
with suicidal tendencies blurred their drawings with their
fingers, blackening them.
Table 1 Comparison of the drawing process of groups
Group A Group B
Dislike and uncertainly from drawing 82 % 21 %
Relax and joyful from drawing 22 % 81 %
Spontaneous drawing 11 % 82 %
Emotionality during drawing 32 % 79 %
Table 2 Drawing expressions of individuals suffering from
behavioral disorders
Groups A and B
Blacken and shady drawing 28 %
Incomplete details 18 %
Poor drawing 36 %
Table 3 The most common drawing symbols in the
drawings of troubled individuals
Symbols in the drawings Drawing in JDCs
Symbols of TV 28 %
Act of defiance 20 %
House 70 %
Fence 26 %
Portrait 10 %
Nature 45 %
Fabulous creature 23 %
Figure 28 %
Marijuana 43 %
Sun 47 %
Car 22 %
Highlighted eyes 5 %
4. Conclusions
Physical constitution, mental constitution, individual
characters and also the external environment influencing
the artist were reflected in the drawing expressions. The
values of the respondents were also reflected in the
drawing symbols. We can understand the drawing
expression as a picture language and with this language the
artist talks about their feelings that fulfill them. The
research has shown that an individual with behavioral
disorder expresses themselves by drawing in an
environment where there is a friendly and relaxing
atmosphere without pressure and strict artistry. If there is
pressure put on an individual, many disciplinary measures
taken or if the relation between the individual and tutor is
negative it is almost completely clear that the individual
will resent fine art and drawing. It turned out that art has a
positive influence for troubled individuals. The assumption
that drawings by individuals with behavioral disorders are
poor on motifs and details was disproven. On the other
hand, the individuals have a rich imagination; they can
think about their drawn motives and further develop them.
Poor, styled, childish and naive motifs appeared when the
artist felt under pressure, anxious and afraid of
punishment. In any case, the artists projected their
emotions and personality on their drawings. Their
drawings became a reflection of all their desires, thoughts,
attitudes, experiences and opinions. They displayed their
values in their drawing expression and they are visible in
the drawings. A relatively major part of the respondents
were able to draw what has value for them and what they
are not indifferent to.
References
[1] Cacka, O., A Survey of Common Psychology, Growing
up and Work Efficiency, Brno, Masaryk University, pp. 55-
56, 1995.
[2] Strigacova, D., Preventive and Interventional
Programs with Special Focus on Family as a Risk Factor.
Criminology: Current Problems, Prague, Police Academy,
pp. 214, 2013.
[3] Read, H., Education through Art, Prague, Odeon, pp.
147, 1967.
[4] Roesel, V., Didactics of Art Education, Prague, Charles
University, pp. 17, 2003.
[5] Campbell, J., Creative Art in Group work, Prague,
Portal, pp. 13, 1998.
[6] Pogady, J., Children's Drawing in Diagnostic and
Treatment, Bratislava, SAP, pp. 38, 1993.
[7] Meglen, D., Drawing as a Way to Express themselves,
Prague, Portal, pp. 44, 2011.
Comparative European Research CER 2016 (issue I.)
153

INFLUENCE OF FAMILY ENVIROMENT ON ADOLESCENT DEVIANT BEHAVIOR
1Barbora Odraskova -
1Michal Kozubik –
2Lukas Odraska
1Constantine the Philosopher University in Nitra, Faculty of Social Sciences and Health Care
Kraskova 1 Nitra, 949 74,
Slovak Republic
+421917801428
[email protected] - [email protected]
2Comenius University of Bratislava, Faculty of Physical Education and Sports
Nabr. arm. gen.L.Svobodu 9
814 69 Bratislava, Slovakia
Abstract: The paper focuses on family environment, social deviation and socio-pathological phenomena. The contribution
contains the results of a qualitative research study which we conducted using semi-structured interviews in a re-education
facility; sampling was purposive. The research results confirmed that disharmonious environment, poor emotional bonding
and neglectful parenting styles have an impact on the deviant behaviour of juveniles.
Keywords: family environment, social deviation, socio-pathological phenomena
1 Introduction
The period of adolescence can be considered as the most
risky period in the life span. The young persons’ opinions,
attitudes, values, overall behaviour and moral habits are
formed. Healthy mental and physical development
depends also on the family an individual grows up in
because family is one of the most significant factors for
individual’s personality development. Family is of a great
significance for each of us. It affects our lives not only in
the period of childhood; it is significant also in the periods
of adolescence and adulthood. Families differ from each
other, they can mean something different for each of us.
Aggression, alcoholism, disinterest and a lack of care from
the next of kin cause the feelings of uselessness,
helplessness, hopelessness and rejection in young people,
which can result in their future deviant behaviours.
1.1 Family environment, social deviation, socio-
pathological phenomena
A family in which children and adults feel loved, accepted
and safe is a kind of a safety island which provides space
for healthy self-development and full life.
Functional family formed and developing according to
standards and mechanisms of the solid of the community
as a maintained and an informal group of the institution
has the best conditions for establish a suitable environment
for the formation of healthy personality of man and to
become the prevention deviation in the company [7].
If a family does not fulfil its functions, it is disharmonic.
Typically, such a family cannot meet the basic needs of its
members; its climate is full of tension, dissatisfaction and
frustration; often there are also hostility and violence. In
such an environment, norm violation is rather common,
which results in behavioural deviations in the family
members.
The characteristics of a dysfunctional family include:
internal family relationships are affected by the
atmosphere of distrust; behaviour among family members
is unfriendly; responsibilities are unclear; communication
between family members is full of contradictions,
misunderstanding and vagueness; there are many negative
emotional relationships; hopelessness and despair are
dominant; there are problems with general household
functioning; upbringing of children is neglected; and there
is a lack of adequate care [8].
In individuals, inadequate family environment can result in
violation of the social norms and the rules valid in the
society and community. Deviations from norms can vary
in forms, intensity, levels, and causes. The main concept in
this context is deviation.
Social deviation is a way of behaviour which does not fit
the social norm but it is accepted by the majority of
population. Deviation is defined as any divergence from
normal structures or functions [10].
As deviant behaviour is defined as a divergence from the
norms valid in the society, we define the concept norm as
well. We can understand a norm as an institutionalized and
specified value or rule which is obligatory and enforced
[2].
Natural part of each society which guarantees the
possibility of liberal actions is such behaviour of its
members which can be considered undesirable, unwanted,
refused, and unacceptable. They are the phenomena that
are present in the society but which are perceived as
unacceptable, and we try to prevent them.
Social pathology deals with the principles of behaviours
which the society perceives as undesirable because they
violate legal, social, or moral norms [4].
Socio-pathological phenomena are socially undesirable,
cause harm, and violate the society we live in, as well as
its specific individuals; not only those individuals who are
threatened by pathology and become the victims of
undesirable actions, but also those who conduct it directly,
so those whose behaviour is considered deviant. It is good
to realize that socio-pathological phenomena are a result of
the society, i.e. what the society considers undesirable and
Comparative European Research CER 2016 (issue I.)
154

abnormal in the given historic, social and political contexts
[2].
Socio-pathological phenomena are present in each society
and they reflect health of the society. Of course, if they are
maintained in certain limits. Undesirable behaviours can
be maintained in acceptable limits by sanctions and
prevention. Prevention is considered the most effective and
efficient tool to fight socio-pathological phenomena.
2 Methods
In the survey, we focused on family environment influence
on deviant behaviour in adolescent girls. We studied the
areas which focused on influence of parenting styles,
physical punishment, disharmonic family environment,
and the failure to meet emotional needs. For the purposes
of this paper, we discuss parenting styles in the chapter
focused on the results.
To study the issue, we used the qualitative survey;
methods in this survey provide deeper understanding of
social phenomena than would be obtained by the use of the
quantitative survey [11].
Data were collected in the re-education centre in Zlaté
Moravce by semi-structured interviews.
A researcher has a prepared content framework, a list of
questions, but the questions are adapted to the interview
development, which means that he/she can use new
questions and omit those which do not fit. The fact that the
semi-structured interview is limited to some extent allows
thematic concentration, which makes the data collection
more efficient than non-structured interview [1].
We recorded the participants’ answers on a dictation
machine, and then we used them in case studies.
Sampling in the qualitative survey as purposive to match
the survey objectives. Based on these backgrounds, the
sample is purposive, purposefully selected [1].
The basic criterion for our sample was being a resident in a
re-education centre. The sample included ten 14-16-year-
old girls.
We used three methods in our survey. The first method
was an interview which is the most advantageous method
to obtain qualitative data [9].
Another method that we used was the method of content
analysis of the documents that we were provided with.
Documents can provide a data background for the study or
they complete the data obtained in interviews. He
differentiates between personal documents, official
documents, archived data, mass media information, and
virtual data [3].
The last method that we used was a case study which is a
scientific analysis of a specific case. Mostly, it is used ex
post, i.e. after data collection. It is a method of scientific
studying of reality, whose objective is scientific
generalization of the information obtained by systematic
analysis of individual studies [5].
The method of a case study includes the use of multiple
methods such as observation, interview, questionnaire,
analysis of activity results, or anamnestic methods.
Basically, it collects all data about an individual available,
and then it sorts, systematizes, analyses, compares, and
chronologically classifies them; it also detects
relationships, connections, characters and nature of the
signs or characteristics, and developmental trends and
anomalies [12].
In the case studies, we focused on detailed descriptions of
participants’ family conditions. Specifically, we focused
on demographic, material, psychological and cultural
conditions of family environments.
3 Survey results
In the first participant, the preferred parenting style was
inconsistent, even neglecting. The minor’s parents are
divorced; her mother has worked mainly abroad, so her
grandmother took care of her most of the time. The minor
said there was a lack of love and praise in her family.
Inconsistent parenting by her mother resulted in the
situation that the minor is not able to manage her
emotional habits, solve conflicts, respect the rules, and
bear the responsibility for her actions. It resulted in the
problems such as truancy, thefts, tobaccoism, alcohol
abuse, and disrespect to authorities.
In the second participant, there was a double standard in
parenting; her father was authoritarian and her mother was
liberal. The minor perceives her parents differently, which
could be seen in her responds in the interview where she
stated that she got on rather well with her mother, but it
was different with her father. She respects her mother
because she praises and appreciates her more often; her
father uses authoritarian parenting and she says that his
behaviour towards her is inadequate as he often used
physical punishment and restrictions.
In the next participant, there was a liberal, even neglecting
parenting style; there was a lack of authority in the family,
and behavioural problems occurred. Specifically, a lack of
authority means a lack of mother’s authority who did not
have a stabile position in the family, particularly in the
relationship to the minor. The mother concealed her
daughter’s misdemeanours and did not deal with them.
Based on the information from the documentation we
studied, the rules and limitations were not given by the
mother, but by the daughter. On the other hand, she
realizes that she does things she should be punished for but
she is not. It proves that there is liberal, even neglecting
parenting in the family, which results in wrong life habits.
Minor’s behaviour which resulted in truancy, crime and
behavioural problems is a result of mother’s limitless
parenting.
In the next participant, liberal parenting prevailed. It was
manifested also by the situations when the minor did not
obey the rules and came home several hours late, and her
mother encouraged such actions. In the minor’s
documentation we found out that mother’s parenting was
affected by liberality and inconsistency.
In the next case, a double standard in parenting was used; a
mother was authoritarian and a father was liberal. The
minor describes her relationship with her parents as not a
very good one, because her mother often punished her and
her father spoiled her and gave her money whenever she
wanted. Her mother punished her and forbade the things.
Her father did not use such authoritarian methods as her
mother did; on the contrary, he was too liberal and he,
Comparative European Research CER 2016 (issue I.)
155
basically, bought his daughter’s interest and obedience.
The minor perceived her father’s behaviour as rewarding.
These failures result in disrespect for social norms and
inner defiance which is manifested particularly by passive
aggression, which resulted in minor’s deviant behaviour
which was manifested by truancy, thefts, early sexual
activity, and excessive interest in the opposite sex.
In the next participant, there was inadequate, even
neglecting parenting. It was neglecting on the mother’s
side and authoritarian on the mother’s partner’s side. The
minor did not respect her mother as an authority at all, and
she lied to her constantly. At first, her mother supported
her but later she admitted that she lied to her. Her mother’s
partner was often aggressive and used physical punishment
against the minor and her brother. So, from the mother’s
side we can talk about neglecting parenting and failure to
meet the minor’s needs. From the mother’s partner’s side,
authoritarian parenting was preferred with a tendency to
physical punishment and inappropriate sexual behaviour
towards the minor.
In the next case, there was liberal and neglecting parenting
by a mother. In childhood, a grandmother looked after the
minor because the mother was not able to do it. The
mother was not able to provide a stable family
environment for her daughter. The minor stated that she
considers her mother’s parenting methods as adequate
even if she punished her often, according to her; now she
realizes that she did it for her. The mother was not
interested in her daughter very much in her childhood,
that’s why her grandmother took care of her. This
neglecting parenting by the mother resulted in truancy,
rude and aggressive behaviour, and disrespect to
authorities both at home and school. There was no father
to provide a role model.
In the next participant, there was neglecting, even
inconsistent parenting. The minor does not have a close
relationship with her mother, and does not respect her as an
authority. She likes her father better and would like to live
with him. There is a tension between her and her mother.
She does not visit her daughter in the re-education centre
and writes her only sporadically. The relationships with her
father are better, their contact is more frequent. In the
family, the minor would need a bigger authority than her
mother is. Such parenting caused that the minor consistently
breaks the rules and has a lack of respect for authorities.
In the next case, inconsistent parenting dominates. A father
left the minor in her childhood and nowadays he is not
interested in her. A mother and her partner said they took
care of the minor but she did not respect them at all. That’s
why we deduce disrespect for authorities in the minor. The
parents failed. The mother used to pick up her daughter
from school, but when the daughter saw her, she ran away
and came home late at night. The minor’s behaviour defies
the principles of good behaviour; she does not respect her
mother or teachers at school. Such inconsistent parenting
and a lack of authority in the family resulted in truancy,
thefts, and early sexual activity. In this case, authoritarian
parenting dominates along with physical punishment by
the biological father and later by the stepfather. From the
mother’s side, it was inconsistent parenting.
In the last participant, there was authoritarian parenting by
her father and inconsistent parenting by her mother. Her
childhood was affected by physical and psychological
punishments by her biological father. When the mother left
for work, the father kept her closed in a room for hours.
The minor does not have a good relationship with her
mother. The mother’s new partner also used punishment in
the minor, so authoritarian parenting dominates also in
him. The minor respects the mother’s partner and she has a
good relationship with him, according to her.
4 Conclusion
Based on the analysed and interpreted results, we can state
neglecting and liberal parenting styles dominated in the
participants’ families. To sum it up, in six participants
there was neglecting, even inconsistent parenting. A
double standard in parenting occurred in four participants.
In our case, a double standard parenting means that one of
the parents was liberal and the other one was authoritarian.
In some participants, authoritarian parenting was
accompanied by physical punishment, mostly by a father
or stepfather.
There was liberal parenting style in six participants; for
this style is characteristic a parent’s passive approach
towards parenting and insufficient guidance for children. A
lack of organization and security, and inadequate
effectiveness of parenting are typical for this parenting
style. Relationships between parents and their children are
too vague and the limits are not set [6].
We agree with it, because there were the indicators stated
by the above-mentioned author in the case studies with the
liberal parenting style. We can say that there is not only
one parenting style which influences deviant behaviour but
there are several of them. They include authoritarian,
liberal, neglecting, and inconsistent parenting styles. These
parenting styles dominated in the participants, so we can
state that they influence deviant behaviour in adolescents.
However, these results are valid only for the studied
sample and cannot be generalized.
Parenting is a multiform, complicated and mutual process
in which there is not one donor and the other recipient; but
everybody’s actions and thinking are mutually influenced
and depend on each other. Parents influence children,
positively or negatively. If parents respect and understand
their children, give them love, meet their needs, allow
spontaneity and freedom, and support creativity, we can
evaluate such parenting as an act encouraging children’s
personalities. In our case, parenting can also be a
deforming process if parents use inappropriate methods, if
they understand punishment as revenge for wrong-doing
with the aim to cause psychological or physical suffering
in their children, if they limit children by orders and
restrictions, and limit their freedom.
References
[1] Gavora, P. Sprievodca metodológiou kvalitatívneho
výskumu. Bratislava : Regent, 2006. 239 p. ISBN 80-
88904-46-3.
[2] Határ, C. – Szíjjártóová,, K. – Hupková, M. Základy
sociálnej pedagogiky pre pomáhajúce profesie. Nitra :
Comparative European Research CER 2016 (issue I.)
156

Pedagogická fakulta UKF, 2007. 66-136 p. ISBN 978-80-
8094-174-1.
[3] Hendl, J. Kvalitativní výzkum : základní metody
a aplikace. Praha : Portál, 2005. 408 p. ISBN 80-7367040-
2.
[4] Hrčka, M. Sociální deviace. Praha : Slon, 2001. 302 p.
ISBN 80-85850-68-0.
[5] Hučík, J – Hučíková, A. Kazuistika v sociálnej práci.
Bratislava : VŠZaSP sv. Alžbety, 2009. 203 p. ISBN 978-
80-89271-66-5.
[6] Koteková,R – Šimová, E – Gecková, A. Psychológia
rodiny. Michalovce : Pegas s.r.o. 1998. 96-109 p. ISBN
80-967901-0-2
[7] Kovačič, V. Model funkčnej rodiny a formovania
osobnosti. Vrútky : ProKonzult, 2002, 216 p. ISBN 80-
88754-09-7.
[8] Matoušek, O. Rodina jako instituce a vztahová síť.
Praha : Slon, 2003. 144 p. ISBN 80-85-850-24-9.
[9] Miovský, M. Kvalitativní prístup a metódy
v psychologickém výzkumu. Praha : Grada publishing,
2006. 332 p. ISBN 80-247-1262-4
[10] Rác, I. Sociálna patológia a prevencia sociálno-
patologických javov. Nitra : Univerzita Konštantína
filozofa. Fakulta sociálnych vied a zdravotníctva. 2011.
141 p. ISBN 978-80-8094-913-6.
[11] Silverman, D. Ako robiť kvalitatívny výskum.
Bratislava : Ikar, 2005. 327 p. ISBN 80-551-0904-4.
[12] Vančová, A. Základy predagogiky mentálne
postihnutých. Bratislava: Sapientia, 2005. 332 p. ISBN
80-968797-6-6.
Comparative European Research CER 2016 (issue I.)
157

CROSS-GENERATIONAL LEARNING AND CROSS-GENERATIONAL PROGRAMMES
Petra Kaduchová
Palacky University Olomouc
Faculty of Pedagogy, Institute of pedagogy and social studies
Žižkovo náměstí 5
Olomouc, 771 40, Czech Republic
+420724828655
Abstract: The paper deals with the topic of cross-generational learning, mainly aimed at cross-generational programmes. At
first the basic terminology is explained. The paper is focused on particular manifestations of cross-generational learning and
cross-generational programmes and their mutual interconnection which are illustrated through specific examples, reflecting
the Czech situation. The conclusion of the paper brings the reflection of new options and relations of the Czech interpretation
of cross-generational learning and programmes, as a support for the cross-generational educational aspect in the society.
Keywords: Lifelong education and learning, cross-generational learning, cross-generational programmes
1. Introduction
The society is composed of individuals of various age
categories, we speak about various age groups, cohorts,
orgenerations [7]. In everyday life these groups come into
reciprocal interactions with various level of intensity and
these interactions form cross-generational relationships. In
this interaction there is a transfer of knowledge, skills,
attitudes, values, experience or other information from
elderly subjects to young subjects, and vice versa. Thus it
can be assumed that members of different generations
learn from one another in various contexts and
environments. The typical example of such learning is the
environment of a family (among children, parents,
grandparents, relatives), of a workplace (among senior
experienced employees and juniors). Cross-generational
learning also takes place in education, or in the care
providing system.
2. Defining the basic terminology
2.1 Lifelong education and learning It deals with the functional formalized as well as informal
activities, associated with learning. These activities are
realized continuously and focus on improving knowledge,
skills and special requirements. It is a continuous lifelong
process which supposes completing and pervading the
forms of education given above. The contemporary
preference of term lifelong learning to term education is
associated with the responsibility to get and to develop
skills and abilities, knowledge and competences of an
individual. However, the lifelong learning is only linked to
the issue of the time specification, thus an updated term
life-wide learning has been implemented, involving the
education at its diversity of activities of an individual´s
life. Lifelong leasing is divided into two phases, they are
the primary education and further education [6].
2.2 Cross-generational learning and cross-generational
education
This term involves various educational processes, present
in the contact of individuals of different generations. It is
the intentional and unintentional, conscious and
unconscious, formal and informal learning. It always
appears in the interaction between individuals of different
age, i.e. in families (among children, parents and
grandparents and other family members), in school
(between teachers and students), at workplaces (between
junior and senior employees and superiors and the like) [6].
The aim of the cross-generational education is to prepare
suitable and functional cross-generational environment so
that the young and the old individuals had the equal
conditions to share their opinions and attitudes with others.
Cross-generational education is an interdisciplinary field
which is not firmly anchored in scientific branches. It uses
the knowledge of andragogy, applies the principles of
geragogy and gerontology (especially the social
gerontology). Cross-generational education is further
based on the knowledge of academic pedagogy, sociology
and psychology.
2.3 Cross-generational learning concept
It is the concept which is considered to be “the collection
of theoretical, research and applying knowledge and
activities which are focused on creating the benefits from
the cross-generational interactions. It is meeting and
sharing among people of different generations.” [7]
2.4. Cross-generational programmes
These are programmes in which mutual learning and
enriching between members of both young and old
generation take place being beneficial for the individual as
well as the whole society. They are carriedout with the aim
of prevention against cross-generational tension, age
segregation and elderly age stereotypes. These stereotypes
mean an opportunity for children to understand age
diversity in society and cultivation of their own attitude
towards elderly age. Cross-generational programmes thus
support the development of generation intelligence and
help to bring up children to be able to accept their own
ageing [8].
Comparative European Research CER 2016 (issue I.)
158

3. Cross-generational programmes issue The first cross-generational programmes appeared as early
as 1960s. They were originated as reflexion to social
changes which have been characteristic by among others
growing social and cultural gap between young and old
generation.
Diversity in particular concepts of cross-generational
programmes lies in various aspects, e.g. which target
group they are aimed at (programmes for grandparents and
their grandchildren; programmes for the elderly and
children who do not know each other etc.) Among other
aspects are the number of participants (e.g. programmes
for several individuals, others for bigger groups etc.) and
target age group (programmes for pre-school children to
adolescents, programmes for the elderly). Programmes
aimed at the elderly population are adjusted to this target
age group (programmes for healthy and active senior
citizens, others for immobile people, etc.) Cross-
generational programmes vary according to purpose,
target, content, place of carrying out or provider, frequency
of interaction among members of various age groups, then
according to length and time of carrying out.
Herrmann et al. suggest dividing cross-generational
programmes according to a form of interaction among
members of various generations into three common types:
programmes in which the elderly are beneficial for
children (teach them), programmes in which children are
beneficial for the elderly (escort them etc.), programmes
for mutual cooperation between both generations [8].
4. Examples of cross-generational programmes in
practice An international programme Nature for Care (Nature as a
bridge between generations) unites the elderly and children
together taking part in these activities, which are aimed at
nature and ecology. The goal of this programme was to
„create a functional model of environmental education of
pupils and the elderly“. The „Chaloupky“ (little cabins)
community targeted their activities for children and the
elderly on herbs recognition, making products from them,
and memory training as well. This project took place in
Přibyslav, Velké Meziříčí and Náměšť nad Oslavou.
Several meetings of the elderly and elementary school
children were organised [4].
3 G Programme – Three generations is organised by a
non-profit organisation Hestia. The aim of this programme
is to enhance and mediate cross-generational co-living.
The implementation team composed of social workers and
psychologists. This programme was based on the principle
of friendly relationship of a child (usually of pre-school or
school age), from a family which do not have their own
grandparents, with a volunteer of 50+ generation who does
not have grandchildren or is not or not able to contact them
on regular basis. These participants take part in free time
activities together once or twice a week. It might also
relate to looking after children, giving extra lessons or
accompany children to after school activities, which help
family functioning. Requirement for this program was to
undergo initiate training. Supervision taking place every
month and was compulsory for the participants was
included in the programme [3].
Another example of a different type, which is aimed at the
elderly benefit for children is a programme of the same
organisation called „Pět P (Pomoc, Přátelství, Podpora,
Péče a Prevence)“(help, friendship, support, care and
prevention), in which an adult volunteer meets a child with
school issues, such as behaviour or learning, because there
is a lack of support in the family whatever the causes
might be [3].
Experimental university for grandparents and
grandchildren has been organised every year since 2004. It
is the only one targeted on family members. Within this
cross-generational programme children and their
grandchildren are able to study together on academic
ground. Children are aged 6 to 12 and there are around 25
and enlarge their general knowledge. The lessons last 90
minutes and take place in Prague on Saturday morning
once a month from October to May. The elderly take the
role of supervisors and the children discover new
disciplines and knowledge. All lectures deal with the same
topic through whole year. At the end of each school year a
summer camp is organised aimed at topics connected with
the year lectures [1].
Among other Czech projects is also a project called
„Adoption of the elderly” organised by Maltese help. This
project deals with volunteer help and psychological
support of the senior citizens and disabled persons.
Participants of this project are volunteers, mainly students of
secondary schools or universities meeting their „adopted„
person for an hour or two once a week. The volunteers are
instructed before entering the project. This service is also
available for the elderly who are lonely, live alone or in senior
homes. The parallel aim of the project is creating a
relationship in which the volunteer arranges connection with
the outer world for the elderly becomes their companion and
helps them with personal errands. This project thus helps the
elderly with new social contacts [5].
5. Conclusion
The outcomes of the surveys show that the Czech Republic
doesn´t pay enough attention to prevent the presence of
age discrimination and cross-generational animosity.
Fortunately, the society is aware of the problem and the
issue of cultivation and development of cross-generation
relationships and programmes aimed at this issue focus in
the Czech Republic is about to start its journey. Finally, it
is necessary to emphasize the activity and cooperation of
educational politics, i.e. the developing the curriculum in
respect of the lifelong education which has a significant
impact on supporting cross-generational aspect in society
and development of cross-generational education.
References
[1] http://www.aktivnistari.eu/57-experimentalni-
univerzita-pro-prarodice-a-vnoucata
[2] Corsten, M., Čas generací, Sociální studia, pp. 45 – 46,
January - February, 2007
[3] http://www.hestia.cz/cs-CZ/#co-delame/program-3-g-
tri-generace
Comparative European Research CER 2016 (issue I.)
159

[4] http://www.chaloupky.cz/cs/1-nature-for-care-care-for-
nature-grundtvig.html
[5] http://www.maltezskapomoc.cz/predstavujeme-vam-do
brovonice-a-dobrovolnici-z-projektu-adopce-senioru-
praha/
[6] Průcha, J. and Veteška, J, Andragogický slovník,
Praha, Grada, 2014, 320 P.
[7] Sanchéz, M., Journal of intergenerational studies, No.
2, pp. 107–110, 2006
[8] Štěpánková, H., and Höschl, C., and Vidovićová, L.,
Gerontologie, Současné otázky z pohledu biomedicíny a
společenských věd, Praha, Karolinum, 2014, 288 P.
Comparative European Research CER 2016 (issue I.)
160

DEVELOPING VALUE SYSTEM OF YOUTH THROUGH PARTICIPATION IN VOLUNTARY SERVICE
Lucia Ludvigh Cintulová
St. Elizabeth University of Health and Social Sciences
Palackého 1
Bratislava, 801 01, Slovakia
Abstract: Volunteering constitutes one of the most important pro-social activities leading to higher social and human capital
in society. It is also clear that levels of volunteering vary a great deal across cultures and countries due to the millions of
people involved in helping for free. Helping others is the way to higher individual well-being and better impact on solving
social problems. The paper discusses theoretical consideration about why volunteering might influence self-development of
youth as well as the results of research aimed at human values forming by doing voluntary service in Slovakia. The second
part of research is focused on relationship between community based learning / lifelong learning and carrying voluntary
service and its importance for youth development and achievement of life abilities.
Keywords: active citizenship, volunteering, human values, youth
1. Introduction
Baková points, that as the first in the history of the
importance of volunteering mentioned by Alice Salomon.
Voluntary service brings the opportunities for the youth to
develop instrumental and interpersonal skills through their
work with community organizations, a form of learning
that could be deepened and expanded with strategy of
community based learning and active long-life education.
Lifelong learning may be broadly defined as learning that
is pursued throughout life: learning that is flexible, diverse
and available at different times and in different places. [1]
The European Commission (2001) found that lifelong
learning has “Four broad and mutually supporting
objectives: personal fulfilment, active citizenship, social
inclusion and employability/adaptability”. In this regard,
lifelong learning has lifewide dimensions that transcend
narrow economic and vocational aspects [3].
The European Lifelong Learning Initiative defines lifelong
learning as “…a continuously supportive process which
stimulates and empowers individuals to acquire all the
knowledge, values, skills and understanding they will
require throughout their lifetimes and to apply them with
confidence, creativity and enjoyment, in all roles
circumstances, and environments.” [6]
Volunteering allows young people to active in their
communities and communities empowered abilities to
succeed. This link between voluntary service and
community partners is an element of supporting
development and community-based learning offering
youth ways to develop the skills and knowledge necessary
for success in adulthood. The aim of these is to more fully
engage young people, by harnessing their natural interest
in where and how they live and by using their own
community as a source of learning and action.
Volunteering can positively affect individuals’
development and well-being due to various motivational
reasons. People’s well-being increases because they enjoy
helping others. The reward is internally due to an intrinsic
motivation. People volunteer instrumentally in order to
receive a by-product of volunteering. Their feeling of
utility is increased by obtaining an extrinsic reward from
it.
Intrinsic motivation - the motivation to engage in a
volunteering arises from within the individual because it is
intrinsically rewarding. Volunteer simply enjoys an
activity or sees it as an opportunity to explore, learn, and
actualize his potentials [2].
1. Pro-social attitude – to produce the good work and
useful help might enjoy the outcomes of volunteering
even more when the effort is provided by themselves.
Involvement in community and organizational life
through volunteering) support public engagement;
create social norms – shared civic values, norms and
social values.
2. Utility of the service - about the benefits of
volunteering, more than 55% of volunteers stated that
an important source of satisfaction is seeing the results
of their work.
3. Supporting environment – volunteers are freely
engaging in activities that they find interesting, that
provide creativity, novelty and optimal challenge.
4. Helping others gives good feeling and enjoyment –
volunteers receive a ‘warm glow’ from contributing
time to the provision of a public good.
Extrinsic motivation occurs when we are motivated to
perform a behavior or engage in voluntary service in order
to earn a reward or avoid a personal falling. If the reason
to do volunteering is based on external motivation, they
see volunteering as an investment and expect external
benefits or payoffs.
1. Investment in longlife learning and informal education
- it is widely accepted that as knowledge and skills
become obsolete, individuals continuously update
their competencies in a process of continuous
learning.
2. Investment in human capital – voluntary work can
enhance individual employment prospects, if it is done
long therm. It helps to improve social skill and
competences and obtain new knowledge and
experience by providing different type of activities,
training and educational programmes.
Comparative European Research CER 2016 (issue I.)
161

3. Investment in the social network – Doing voluntary
service volunteers can get in touch with authorities or
make valuable contacts needed for getting well-paid
job or achieving career.
4. Investment in society and active citizenship –
voluntary work contribute to increase active
involvement of youth in the society, formation of the
civic society with prosocial values and interpersonal
relations between different people in different regions.
5. investment in community based learning via
volunteering - volunteers have more connections with
others in their community; are more likely to attend
community events; are more likely to take on a caring
role for others and are more likely to believe that
others can be trusted. When asked about their overall
life satisfaction, they are more happy due to
possibility to be part of community based learning to
achieve to the best of their ability, and become
Examining the premise that volunteering is beneficial for
the helper as well as the helped, a number of studies have
looked at the impact of volunteering on subjective and
objective well-being. Positive effects are found for life-
satisfaction, self-esteem, self-rated health, and for
educational and occupational achievement, functional
ability, and mortality. Studies of youth also suggest that
volunteering reduces the likelihood of engaging in
problem behaviors such as school truancy and drug abuse
[2].
Who volunteer during their studies develop more pro-
social attitudes and are more likely to volunteer in the
future. Volunteering takes many forms, each inspired by a
different set of values and on the other hand, it can
influence setting life priorities and human values by
engaging youth in the active citizenship.
Individuals have unique experiences (trauma, relations
with parents, helping others, social networks) that affect
their value priorities. Values as desirable, trans-situational
goals, varying in importance, that serve as guiding
principles in people's lives. The crucial content aspect that
distinguishes among values is the type of motivational goal
they express. In the case, value priorities influence
decision to be a volunteer and there is point in influence of
volunteering on self-development and forming unique
values in youth lives.
2. Research methods
The purpose of this research is to develop knowledge
about pro-social attitudes of youth volunteers. It provides a
framework for understanding how volunteers’ values and
reasons for volunteering influence volunteers’ pro-social
attitudes and make an impact on forming values of youth.
Research was held in march-may 2013.
Our empirical analysis considers three indices of prosocial
values of volunteering, aimed at measuring both the
quantitative (number) and the qualitative (degree of
familiarity and cooperation) character of human values,
and intrinsic and extrinsic motivations to voluntary work
and recognition of human values identified by young
participants. Indicators: volunteering frequency, religion,
university department and studies, human values according
to Schwarz Value Survey, factors leading to volunteering
(family and education of parents, positive example, social
or university environment, a non-profit organization, self
belief and self-value orientation);
As the tool of the research we use two questionnaires: 1.
standardized questionnaire Schwartz Value Survey (SVS) -
Basic Human Value Scale including 21 scales and 2. PVQ
The Portrait Values Questionnaire.
The PVQ comprises 40 items. Each item consists of a
description of a person (“portrait”) with two sentences.
The subjects are asked to assess how similar to the
portrayed person they are. Each portrait describes a
person’s goals, aspirations, or desires that point implicitly
to the importance of one of the 10 basic values in the
original theory. For example, “Thinking up new ideas and
being creative is important to her. She likes to do things in
her own original way” describes a person for whom self-
direction values are important. For each portrait,
respondents answer “How much like you is this person?”
on a scale from 1 (not like me at all) to 6 (very much like
me).
Table 1 Factorial structure of PVQ
Openness
to change
Self-
enhancement
Conserva-
tism
Selftrans-
cedence
Self-direction ,758 -,118 ,054 -,194
Stimulation ,694 ,551 ,528 ,429
Hedonism -,591 -,133 -,449 -,200
Achievement ,958 ,884 ,103 ,183
Power ,199 ,951 -,464 -,039
Security ,152 -,497 -,375 ,778
Conformity ,212 ,125 ,868 ,018
Tradition ,045 ,338 ,780 ,362
Benevolence ,027 ,111 ,059 ,815
Universalism ,467 ,187 ,094 ,912
Power: Social status, dominance over people.
Achievement: Personal success according to social
standards.
Hedonism: Pleasure or sensuous gratification.
Stimulation: Excitement, challenge, and novelty.
Self-direction: Independence of thought and activity.
Universalism: Understanding and concern for welfare of
people and nature.
Benevolence: Enhancing the welfare of people to whom
one is close.
Tradition: Respect and commitment to cultural customs
and ideas.
Conformity: Restraint of actions that may harm others.
Security: Safety,stability of society, relationships, and self.
2.1 Sample
Responses were obtained in their native language from
1070 adult volunteers from 6 universities: UKF Nitra, SPU
Nitra, Comenius university Bratislava, Slovak Technical
university Bratislava, UMB Banská Bystrica, Art academy
Banská Bystrica, Prešov university UNIPO,
Catholic university Ružomberok, Trnava university in
Trnava.
The sample is consisted of 51.4% of women compared
with 48.6% for men at age of 19-25, total 1070 volunteers.
An important indicator of research is religion. 35.2% of
Comparative European Research CER 2016 (issue I.)
162

respondents identified themselves as people with a firm
faith. 25.9% said they practiced the faith and regularly
attend church. 25.3% of respondents believe “in
something”, but do not go to any church. The remaining
13.6% of those without faith, nor do not practice it.
3. Results
The PortraitValues Questionnaire (PVQ) comprises 10
basic values that guide behavior. The Schwartz model
postulates that these 10 values build a circumplex
structure.
Table 2 Correlation between the values and sex
10 Value Scale Value df P R
Self-direction 11,208 5 0,057 -0,078
Achievement 17,26 5 0,082 0,119
Security 8,44 5 0,133 0,091
Stimulation 7,22 5 0,204 0,023
Tradition 12,98 5 0,024 0,065
Hedonism 14,06 5 0,015 -0,049
Benevolence 20,80 5 0,001 0,120
Conformity 45,48 5 0,000 0,096
Power 20,80 5 0,001 -0,097
Universalism 36,96 5 0,000 0,162
We indicated values such as power, achievement and
stimulation as stronger preferred by men comparing to
women. Men increasingly prefer the value of power than
women, which results from the overall social status in
professional and family life (37.5% to 23.3%).
The results show strong correlation between gender-
woman and value scale – benevolence, self-direction and
universalism.
We examined zero-order correlations between the two
indicators (p = 0.001; r = 0,189) - sex and the value of
helping others pointed to an important feature more
common in female, such as warmth and related social
helpful interactions leading to the strengthening of pro-
social behavior.
The value of benevolence implies protecting and
promoting the welfare of those whom the individual is
often in the touch. High score at this value appeared in
26.9% of women compared with 17.8% for men.
The value of universalism as opposed to the value of
benevolence applies generally to all people and nature, the
person with a high score of this value is more likely to be
tolerant, empathic, willing to help and get involved for the
good of others. The correlation between sex and value
universalism p=0.015, r =0,074.
47.6% of women absolutely think it is important that every
person in the world are treated equally compared to men -
39.8%. For 29.2% of men it is important that all have
equal opportunities in life, compared with 25.2% of
women
Similarly, men and women want to be successful in life
and hope that people appreciate what they do as
volunteers. 14.4% of men considered it very important to
be successful and 14.2% of women also consider success
as very important (they want to achieve success while
doing voluntary service). A similar view was held by men
(19.2%) and women (18.7%) in claims that are deemed to
be people who are not covet recognized for what they have
achieved.
Young people have many opportunities in life that can be
used to achieve career and especially women want to hold
important positions as men. Many of young people
consider volunteering as an investment in self-
development to achieve new skills, as well as the
opportunity to help others.
Table 3 Correlation between the values and religion 10 Value scale Value Df P R
Universalism 89,95 15 0,000 0,178
Achievement 37,84 15 0,001 -0,71
Security 36,96 15 0,001 0,013
Stimulation 67,65 15 0,000 -0,156
Self-direction 69,16 15 0,000 0,197
Tradition 84,51 15 0,000 0,241
Hedonism 47,94 15 0,000 -0,140
Benevolence 36,03 15 0,002 0,069
Conformity 39,46 15 0,001 0,104
Power 74,68 15 0,000 -0,252
The results show correlation between wealth and religion.
The stronger the faith is, the less young man longs for
tangible assets and money, because faith gives him the
necessary spiritual values that stand above the wealth.
Respondents who reported a firm belief are the 31% who
cannot covet, and only 9.3% of them are similar to the
statement "I have a lot of money and expensive things."
The value of money is very important, confirming 43.2%
for respondents who do not believe in God. 24.5% of
respondents with occasional faith have no significant
relationship to wealth compared with respondents without
faith, wealth is not important for them (17.4%). On the
other hand, those who are craving power and money,
represent the total sample 33.8% compared to those for
whom this is not at all important - 37.4%.
The study discovered a relationship between the value of
hedonism and faith (p <0.001; r = 0,197). The faithful
young people appear low level of hedonism. Although the
most of them are aware of the importance to have
everything in life that one needs from a material point of
view, faith in God gives them the belief that hedonism is
not priority value in the first place
26.7% of strong believer and 15.5% respondent with faith
indicated value the importance to listen to people who are
different than them. Although, they dont agree with them,
but want to help them.
The level of significance indicates a significant difference
in the amount of universalism in various stages of faith p
<0.001; that allows us to conclude that the believer has
higher scores in social values is more likely to behave
prosocial as unbelievers. The person with a high score of
universalism and benevolence wants to help others.
Volunteering is linked with value priorities such as utility,
tolerance, empathic understanding and love of neighbour.
The value of conformity is determined by the power of
belief in God. The results show statistically significant
correlation between the various stages of respondents´
belief and the value of conformity (p= 0.001, r=0.104). We
can make the argument that the stronger the belief in God
is the greater tendency to behave in conformity volunteer
Comparative European Research CER 2016 (issue I.)
163

do. He believes that people should respect standards and
rules even when no one sees them. Only 13.3% of the
faithful young people said that the standards of society is
not at all important to them. On the contrary, young people
without faith (33.7%) consider that person is independent
and do not have to respect other people.
Young people without faith or with a poor attitude to
religion are individuals who prefer independent lifestyle
without feeling guilty for their behavior because strict
social rules are not considered as highly important for
them.
Table 4 Correlation between the values and volunteering
10 Value Scale Value df P R
Self-direction 25,73 5 0,000 -0,009
Power 24,642 5 0,070 0,313
Univerzalism 24,62 5 0,000 -0,290
Achievement 13,05 5 0,023 -0,160
Security 10,88 5 0,060 -0,017
Stimulation 3,71 5 0,059 0,075
Conformity 23,36 5 0,000 -0,286
Benevolence 48,87 5 0,000 -0,409
Tradition 9,01 5 0,109 0,025
Hedonism 14,48 5 0,013 -0,130
Young people who are involved in volunteering indicate
more social values than power, achievement and money.
The value of achievement is important for young people.
Volunteers indicate the value of achievement as important
because they need to get acknowledgement, what they do.
39.2% of volunteers confirmed that success is very
important to them, compared with 60.8% of students
without volunteering experience. The opposite view is
37.4% of volunteers for whom success is not significant
compared with 50.7% of students who are not engaged as
volunteers.
The value of benevolence (p<0.001) presenting love,
charity and care of others and nature was strongly
indicated in people who become volunteers comparing to
no volunteers.
68% of students-volunteers said that people should be
interested in others, problems and taking care of nature,
compared with 32% of students without volunteering
experience. Only 35.2% of volunteers think that people
should not care about the interests of others and things
around them, compared with 64.8% of those who do
volunteering.
Value of conformity (p<0.001) and universalism (p
<0.001) in Analytical Testing data showed statistically
significant differences in relation to the field of study.
These values appeared in the higher score at students in
social sciences (social work, theology, psychology,
pedagogy) in compared with another science (technical,
natural and agro sciences, economics, law and arts).
Women (67.3%) are increasingly involved in volunteering
than men (32.7%), and it is more significantly important
for female compared to male (p<0.01).
Table 5 Correlation self-development and volunteering
sex
Self-development via
Total Volunteering
Longlife learning
Community based learn.
Female N 70 79 55 204
% 34,3% 34,3% 27,0% 100,0%
Male N 79 42 20 141
% 38,7% 29,2% 13,9% 100,0%
Total N 149 121 75 345
% 44,3% 34,2% 21,6% 100,0%
Young people identified importance of self-development
for achieving competencies and social skills trough
involvement in volunteering as a way to achieve personal
development (44,3%); active participation in longlife
learning (34,2%) and long-term community based learning
(21,6%).
Table 6 Outcomes of learning via volunteering
Outcomes Value df P R
Need to learning 3,17 3 0,351 -0,071
Self-development 0,38 3 0,910 0,09
heightened sense of
agency in your own
education
7,59 3 0,044 0,102
greater understanding
of how you are
engaged in practices
3,12 3 0,034 0,83
Enhancement of skills 1,59 3 0,040 0,066
Interesting activity 13,50 3 0,030 0,182
Ability to
communicate effectively and work
with a diverse range
of people
1,48 3 0,665 0,032
Heightened sense of civic responsibility
10,0 3 0,021 0,148
Increased sense of
personal efficacy 10,68 3 0,034 0,159
Realistic self-appraisal and
enhanced self-esteem
2,84 3 0,410 -0,056
Increased awareness of the world and
appreciation for
diversity
9,75 3 0,018 0,131
These outcomes of learning which proved significant in
relation to involvement in volunteering, categorize
personal motives/outcomes, including the following:
personal efficacy (p = 0.034); an interesting activity (p =
0.030) and self-development (p = 0.910).
Data analysis show significant differences in outcomes of
learning due to volunteering and to the normative motives.
This means that with increasing citizens' initiative (p
<0.018; r = 0.131) women increases the assumption that
they will be more likely to engage in volunteering than
men for whom the normative motive represented in a
slightly lesser extent.
Table 7 Reasons for community based learning
Comparative European Research CER 2016 (issue I.)
164

Benefity and impacts N Min Max Mean Modus
empowerment of community
548 1 4 2,03 1
active nembers of
community 548 1 4 2,72 4
I find myself and beter understanding
548 1 4 2,13 1
meet community
relationship 548 1 4 2,29 2
new social contact and friendships
548 1 4 2,25 1
a lof of beneficts for self-
development, more skilled 548 1 4 2,36 2
higher self esteem and self-confidence
548 1 4 2,45 2
support of life-long
learning 548 1 4 2,13 1
There is significant correlation between impacts of
volunteering and the changing and/or forming value
priorities and awareness of importance of longlife and
community based learning. The most of volunteers agreed
that their value priorities have been changed while
participating in long-term voluntary programme, especially
they are more likely to be keen on responsibility for own
leaning. Volunteering helps them to make clear in the
advantage of community based learning, they became
more empathic to community needs also find sense of life
in doing voluntary service for others. It gives them
opportunity to obtain new skills and get new social
contacts and also support longlife learning.
Volunteering is not a primitive stage of social work, which
must be overcome, but it is the social conscience of civil
society and other forms of social work. Many social
workers could improve their work if supported each other
and to train volunteers. Danger, however, is the abuse of
volunteer work as a substitute for professional work [1].
4. Conclusion
We find that the creation of social capital through
participation in voluntary associations is not indifferent to
the motivations which induced the volunteer to start
his/her unpaid activity. In particular, we show that intrinsic
motivations enable people to extend their social networks
by creating relations characterized by a significant degree
of familiarity. By contrast, extrinsic motivations, and in
particular the decision to join an association in order to
increase the number of acquaintances or friends, promote
the creation of networks from a quantitative point of view,
but they do not facilitate the creation of relations based on
a particular degree of confidence.
References
[1] Bakova, D. 2015. Osobnosti sociálnej práce. Život a
činnosť osobností a ich vzťah k sociálnej práci.
Sládkovičovo: VŠD, 2015. 178 s. ISBN 978-80-8167-018-
3.
[2] Coon, D, Mitterer, J. O. 2010. Introduction to
psychology: Gateways to mind and behavior with concept
maps. Belmont, CA: Wadsworth, 2010.
[3] European Commission (2001) Making a European area
of lifelong learning a reality, Brussels, COM(2001) 428
final
[4] Melaville, A., Berg, C. A., Blank, J.M. 2006. Community based learning. Engaging Students for Success
and Citizenship. Washington : Coalition for Community
Schools, Institute for Educational – Leadership, 2006.
ISBN 1-933493-04-6
[5] Nordstrom N. 2006. Learning Later: Living Greater,
Sentient Publications, United States.
[6] Watson, L. 2003. Lifelong Learning in Australia,
Canberra. University of Canberra : Department of
Education, Science and Training. 2003
[7] Wilson, J. Volunteeering. 2000. In Annual Review of
Sociology. 2000, Vol. 26, p. 215-40
Comparative European Research CER 2016 (issue I.)
165

USING WEBQUESTS TO TEACH CULTURE-RELATED ENGLISH VOCABULARY - HOLIDAYS AND FOLK
TRADITIONS
Małgorzata Anna Łuszcz
Wyższa Szkoła Filologiczna
Sienkiewicza 32
50-335 Wrocław
+48 71 328 14 14
Abstract: The aim of this paper is to investigate the use of WebQuests in teaching and learning vocabulary connected with
English culture. Empirical research, consisting in the observations of students and pre- and post-study tests administered
among third-form junior-high school learners in Poland, was performed to assess the development of their command of
English and their memorization of facts related to British holidays and traditions. The idea of integrating WebQuests into
English lessons to achieve students’ success in learning is thoroughly explained in the article. The main argument is that this
procedure boosts students’ creativity. The article also includes a sample WebQuest created during the research project.
Keywords: WebQuest in education, web-based teaching, teaching culture-related English vocabulary
1. Introduction
There are many trends in recent methodological theory
regarding the teaching of English. Nowadays, the impact
of computer science on English teaching is becoming more
and more significant, hence some of the latest methods
encourage teachers to use digital tools (Noblitt, 1991;
Sandholtz, Ringstaff, and Dwyer, 1997; Brown, 1998;
Logan and Scheffler, 1999, Schrock, 2002; Raia, 2009). A
WebQuest is an example of such a solution.
The present study is based on empirical research into
English vocabulary teaching. Two groups of Polish
learners were instructed with the use of different
pedagogical approaches – one in a traditional manner, and
the other with the help of a WebQuest. The results of the
students’ pre- and post-tests as well as observations of
their lexical efficiency improvement indicate that
WebQuests enhance their English vocabulary acquisition
and facilitate knowledge storage. The choice of the tool
was motivated by the desire to offer an easily accessible
solution for language teachers and by the aim of the study,
i.e. the teaching of culture-related vocabulary. The study
demonstrates that teaching English vocabulary connected
with the target language culture naturally benefits from the
use of the Internet in the process, as it engages students
more than traditional books and provides them with an
incentive to actively pursue their interests.
2. Theoretical background
A WebQuest is an enquiry-oriented activity. The technique
was devised in 1995 by Bernie Dodge and Tom March at
San Diego University. It provides directed learning using a
number of sites as sources of information.
WebQuests can be divided into short-term (1÷3 classes)
and long-term (1÷4 weeks) ones. The instructional goal of
a short-term WebQuest is knowledge acquisition and
integration – the learner deals with a significant amount of
new information. The objective of a long-term WebQuest
is to extend and refine already established knowledge – the
learner deeply analyzes a body of data, transforms it, and
demonstrates understanding. Short-term WebQuests can be
more common due to their simplified procedure. Long-
term WebQuests require special skills, such as (Schrock,
2002: 5): the ability to classify, induce, deduce, analyze
errors, construct support, abstract, and estimate
perspectives.
There are critical attributes which are parts of the
WebQuest model, such as (Schrock, 2002: 6; Raia, 2009:
2): introduction, task, process, information sources /
resources, evaluation, and conclusion. There are also
important non-critical attributes, including group activities,
role-plays, and single discipline or interdisciplinary
elements.
The WebQuest method provides opportunities for the use
of information technologies, which is a way of realizing
constructivist ideas of education in full-time education as
well as distance learning, involving the use of the Internet
and its resources.
3. Methodology
The following section illustrates the project developed by
the present author for introducing English culture to
students with the help of a WebQuest; the topic was
thematically organized around British holidays. The
project was interdisciplinary and involved teamwork; its
essence was the use of computers during English lessons
for the purpose of doing various exercises. The main
method was the WebQuest, and the students also had the
chance to practise its use at home as they completed their
homework. In fact, one of the goals of the project was to
prepare the students for using information technology and
WebQuests outside the classroom, providing an incentive
to learn both at school and at home. As part of the project,
the students presented their own work, which was based on
the comparison of British customs with the ones they knew
from their own country. The project aimed to prepare
students for the application of information technology in
their own work, and so the teachers’ task had to be focused
on assisting them in reaching the sources of information
and in interpretation of the collected data. The students felt
that they actively participated in the process of education –
Comparative European Research CER 2016 (issue I.)
166
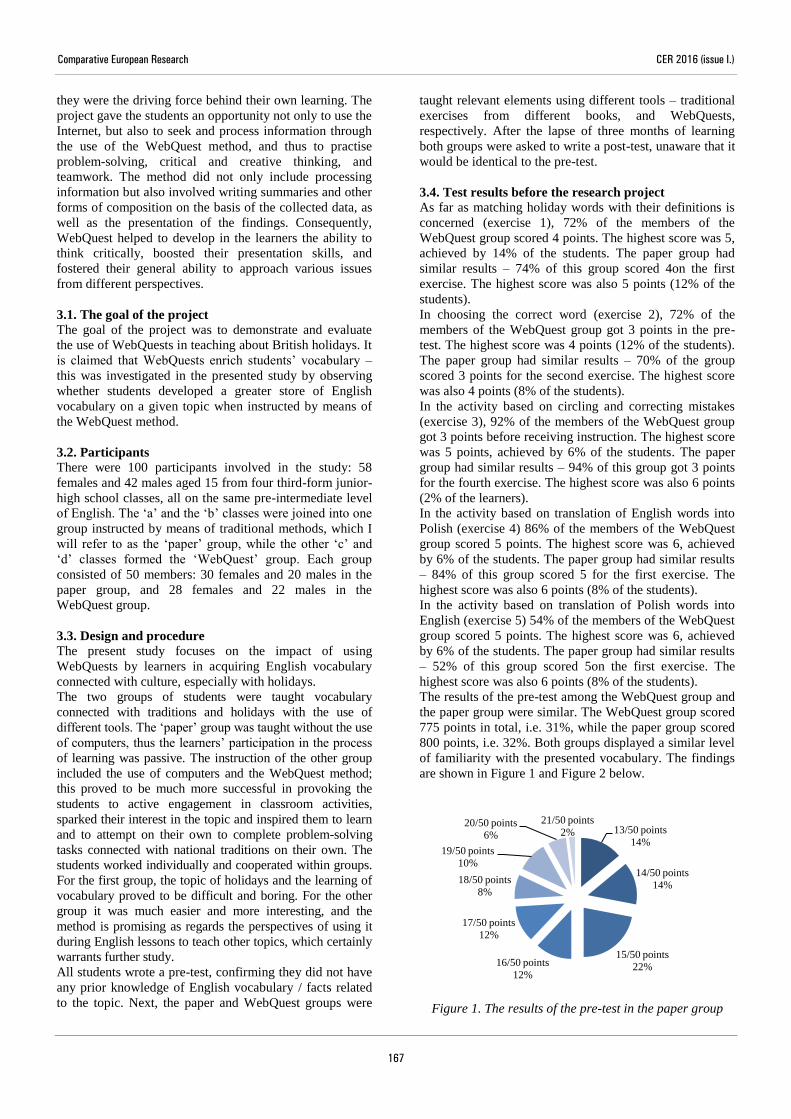
they were the driving force behind their own learning. The
project gave the students an opportunity not only to use the
Internet, but also to seek and process information through
the use of the WebQuest method, and thus to practise
problem-solving, critical and creative thinking, and
teamwork. The method did not only include processing
information but also involved writing summaries and other
forms of composition on the basis of the collected data, as
well as the presentation of the findings. Consequently,
WebQuest helped to develop in the learners the ability to
think critically, boosted their presentation skills, and
fostered their general ability to approach various issues
from different perspectives.
3.1. The goal of the project
The goal of the project was to demonstrate and evaluate
the use of WebQuests in teaching about British holidays. It
is claimed that WebQuests enrich students’ vocabulary –
this was investigated in the presented study by observing
whether students developed a greater store of English
vocabulary on a given topic when instructed by means of
the WebQuest method.
3.2. Participants
There were 100 participants involved in the study: 58
females and 42 males aged 15 from four third-form junior-
high school classes, all on the same pre-intermediate level
of English. The ‘a’ and the ‘b’ classes were joined into one
group instructed by means of traditional methods, which I
will refer to as the ‘paper’ group, while the other ‘c’ and
‘d’ classes formed the ‘WebQuest’ group. Each group
consisted of 50 members: 30 females and 20 males in the
paper group, and 28 females and 22 males in the
WebQuest group.
3.3. Design and procedure
The present study focuses on the impact of using
WebQuests by learners in acquiring English vocabulary
connected with culture, especially with holidays.
The two groups of students were taught vocabulary
connected with traditions and holidays with the use of
different tools. The ‘paper’ group was taught without the use
of computers, thus the learners’ participation in the process
of learning was passive. The instruction of the other group
included the use of computers and the WebQuest method;
this proved to be much more successful in provoking the
students to active engagement in classroom activities,
sparked their interest in the topic and inspired them to learn
and to attempt on their own to complete problem-solving
tasks connected with national traditions on their own. The
students worked individually and cooperated within groups.
For the first group, the topic of holidays and the learning of
vocabulary proved to be difficult and boring. For the other
group it was much easier and more interesting, and the
method is promising as regards the perspectives of using it
during English lessons to teach other topics, which certainly
warrants further study.
All students wrote a pre-test, confirming they did not have
any prior knowledge of English vocabulary / facts related
to the topic. Next, the paper and WebQuest groups were
taught relevant elements using different tools – traditional
exercises from different books, and WebQuests,
respectively. After the lapse of three months of learning
both groups were asked to write a post-test, unaware that it
would be identical to the pre-test.
3.4. Test results before the research project
As far as matching holiday words with their definitions is
concerned (exercise 1), 72% of the members of the
WebQuest group scored 4 points. The highest score was 5,
achieved by 14% of the students. The paper group had
similar results – 74% of this group scored 4on the first
exercise. The highest score was also 5 points (12% of the
students).
In choosing the correct word (exercise 2), 72% of the
members of the WebQuest group got 3 points in the pre-
test. The highest score was 4 points (12% of the students).
The paper group had similar results – 70% of the group
scored 3 points for the second exercise. The highest score
was also 4 points (8% of the students).
In the activity based on circling and correcting mistakes
(exercise 3), 92% of the members of the WebQuest group
got 3 points before receiving instruction. The highest score
was 5 points, achieved by 6% of the students. The paper
group had similar results – 94% of this group got 3 points
for the fourth exercise. The highest score was also 6 points
(2% of the learners).
In the activity based on translation of English words into
Polish (exercise 4) 86% of the members of the WebQuest
group scored 5 points. The highest score was 6, achieved
by 6% of the students. The paper group had similar results
– 84% of this group scored 5 for the first exercise. The
highest score was also 6 points (8% of the students).
In the activity based on translation of Polish words into
English (exercise 5) 54% of the members of the WebQuest
group scored 5 points. The highest score was 6, achieved
by 6% of the students. The paper group had similar results
– 52% of this group scored 5on the first exercise. The
highest score was also 6 points (8% of the students).
The results of the pre-test among the WebQuest group and
the paper group were similar. The WebQuest group scored
775 points in total, i.e. 31%, while the paper group scored
800 points, i.e. 32%. Both groups displayed a similar level
of familiarity with the presented vocabulary. The findings
are shown in Figure 1 and Figure 2 below.
Figure 1. The results of the pre-test in the paper group
13/50 points
14%
14/50 points
14%
15/50 points
22% 16/50 points
12%
17/50 points
12%
18/50 points
8%
19/50 points
10%
20/50 points
6%
21/50 points
2%
Comparative European Research CER 2016 (issue I.)
167

Figure 2. The results of the pre-test in
the WebQuest group
3.5. The sample WebQuest created by the author
Elements of a foreign culture can be a very engaging topic
for students in their English lessons. April Fools’ Day was
selected on the basis of the student’s suggestions, and an
appropriate WebQuest was created for this purpose. The
author provided the students with information about the
origins of April Fools’ Day, dating back to 1582 when
confusion was created upon replacing the Julian Calendar
with the Gregorian one.
The students were to conduct their research on observing
April Fools’ Day in various countries. This web-search
project was performed as an extension of course book
material. To make this activity unique, the participants had
to prepare a special writing feature which involved the
creation of imaginary interviews with people from
different countries. In their interviews, the students had to
include facts concerning their observations of this day in
different countries, the exact date, and the time of day
when the observances are usually held.
In the process each team-member was assigned the task of
researching, recording, and reporting this information. The
students had to consult two webpages suggested to them:
http://wilstar.com/holidays/aprilfool.htm;
http://www.april-fools.us/history-april-fools.htm.
While browsing through materials connected with April
Fools’ Day, they had to notice where, when and how it is
observed.
The next step was to create a list of countries that observe
the April Fools’ Day traditions, including short
descriptions and links to other websites for each country.
At this stage, the students had to make a decision about
three countries they wished to cover. They were to start
writing by explaining the “who, why, where, and how”.
While answering these questions, they were asked to add
information about the celebrations in each selected
country.
Furthermore, the teacher provided the students with the
examples of other supplementary webpages, for instance:
http://teacherlink.ed.usu.edu/tlresources/units/byrnes-
celebrations/april.html
http://www.museumofhoaxes.com/hoax/aprilfool/
http://aprilfoolzone.com/
The outcome of the project was to have the students notice
the diversity of April Fools’ Day related traditions around
the world. The students’ understanding of the impact this
day may have on people misled by the information
fabricated and published on the day of the festival
broadened due to their exposure to extended information
about it. They could also use the materials from the
WebQuest as a reference point for future study of other
nations’ cultures and their traditions.
3.6. Test results after the research project
After completing the classes, both groups were
administered a two-page post-test (identical with the pre-
test), whose results form the basis of this analysis. The five
constituent tasks involved: matching holiday terms with
their definitions (I), choosing the correct word (II),
correcting mistakes (IV), translating English words (V),
and translating Polish words (VI).
In the final test concerning the vocabulary and data
connected with British holidays the paper group scored
only 75% as compared to 96% in the WebQuest group.
As far as matching holidays words with their definitions is
concerned (exercise 1), 86% of the members of the
WebQuest group got 10 points. The lowest score was
8 points (6% of the students in this group). The paper
group displayed worse results – 28% of the group scored
10 points for the first exercise. The lowest score was 5
points (14% of the group).
In the activity which involved choosing the correct word
(exercise 2), 82% of the members of the WebQuest group
got 10 points. The lowest score was 8 points (8% of the
learners). The paper group’s results were considerably
worse – 30% of the group scored 10 points for the second
exercise. The lowest score was 5 points (26% of the
group’s members).
As far as correcting the mistakes is concerned (exercise 3),
80% of the members of the WebQuest group got 10 points.
The lowest score was 7 points (10% of the group’s
members). The paper group came up with had worse
results – 24% of the group scored 10 points on the fourth
exercise. The lowest score was 4 points (20% of the
group).
As far as translating English words into Polish is
concerned (exercise 4), 90% of the members of the
WebQuest group got 10 points. The lowest score was 8
points (8% of the group’s members).The paper group had
worse results – 32% of the group scored 10 points for the
fourth exercise. The lowest score was 4 points (18% of the
group).
As far as translating Polish words into English is
concerned (exercise 5), 82% of the members of the
WebQuest group got 10 points. The lowest score was 7
points (6% of the group’s members).The paper group had
worse results – 28% of the group scored 10 points for the
fourth exercise. The lowest score was 3 points (12% of the
group).
The results of the post-test among the WebQuest group
and the paper group differ, as compared to the pre-test –
the former group scored a total of 2400 points (96%),
while the latter only 1900 points (75%). The data shown in
13/50 points
18%
14/50 points
12%
15/50 points
38%
16/50 points
10%
17/50 points
2%
18/50 points
4%
19/50 points
8%
20/50 points
8%
Comparative European Research CER 2016 (issue I.)
168

Figure 3 and Figure 4 present a 21% difference between
the groups that was according to Mann-Whitney’s test
statistically significant (p-value <0,0001).
Figure 3. The results of the post-test in
the WebQuest group
Figure 4. The results of the post-test in the paper group
4. Conclusion
Internet tools constitute valuable resources and support in
teaching. Teachers should be aware of the variety of
WebQuests, as they represent a reasonable Internet
solution for FLT. They enhance students’ creativity, allow
them to acquire knowledge with enthusiasm, and boost
their confidence. WebQuests are often completed in small
groups to have greater chance to interact with one another,
which facilitates peer evaluation and correction.
Additionally, WebQuests often include questions that
encourage mental effort and discussion, hence they support
critical thinking, knowledge application, social skills, and
scaffolded learning. WebQuests are great motivators for
students, who are likely to enjoy innovative project-based
activities.
The results of the present project indicate that WebQuests
enhance students’ language learning and acquisition.
Students that used WebQuests during English lessons
achieved better results, displaying enhanced vocabulary
and data retention. The project was a pedagogical success.
The findings allow for putting forward the hypothesis that
other Internet tools (e.g. blogs) can also enhance students’
language acquisition. Therefore, further research should be
carried out in order to evaluate additional solutions.
Definitely, WebQuest is not suitable for the
implementation of each and every topic. However, using
WebQuest in teaching vocabulary connected with culture
and holidays proved to be successful and effective. This is
confirmed by the results of the research, which clearly
indicate that the group where the implemented method was
the WebQuest – an approach that is far more engaging and
interesting – the level of the retention of the presented
material was much higher. Learners from this group were
also much more apt at using the knowledge they acquired
in the course of their lessons and at applying the skills
gained with the help of the WebQuest. Moreover, they
were more creative and completed problem-solving tasks
faster than students instructed using traditional methods.
They also improved their group work skills in the process.
The use of the WebQuest method effectively engaged the
students in the didactic process, as it was them who
directed their own learning, and selected and processed
information, thus actively participating in the lesson.
Furthermore, they had a chance to use computers,
engaging in an activity that they knew and enjoyed. The
use of photographs, videos and audio files constituted an
additional positive factor that boosted students’ level of
retention of the presented material.
All in all, it may be concluded, that WebQuests are of
particular use in teaching cultural-related vocabulary.
According to the experiment outlined above, this form of
learning seems to be more effective than the traditional
methods. The reason is the fact that WebQuestsare
designed to develop students’ thinking skills and improve
their problem-solving abilities. The application and
advantages of the WebQuest method are important,
because WebQuests offer an opportunity for groupwork,
but can also be used for self-study and individual, distance
learning, within the system of non-formal education and in
lifelong learning.
WebQuests develop skills such as communication,
teamwork, problem solving, as well as critical and creative
thinking, which have proved to be more important in
today’s world than having students use memorized
material. They allow students to explore controversial
issues and find their own answers to interesting questions.
A well-designed WebQuest allows the students to work
independently and enables teacher-assisted learning, thus
helping to develop their imagination and creativity.
Activities than can be successfully implemented by
teachers in the process of their students’ learning of
English include, among others, building online databases
on different areas of knowledge by the students, moving in
virtual space, creating interactive stories, preparing
documents describing various situations, or imitating
personalities from the world of politics, art and business
during simulated online conferences.
The results of the research strongly suggest that
WebQuests have an advantage over traditional methods.
They are designed to motivate students to use information
in a creative way and not just to search for a particular
information item. They also encourage them to seek
support for their opinions on higher taxonomic levels of
analysis, synthesis, and evaluation. Using WebQuests
leads to discovering new information. They can be used
both as the main and as a supporting method for expanding
students' knowledge. They allow students to work at their
own pace and develop creative thinking needed in
learners’ lives. Above all, WebQuests motivate students to
47/50 points
12%
48/50 points
14%
49/50 points
37%
50/50 points
37%
35/50 points
16%
36/50 points
16%
37/50 points
22%
38/50 points
20%
39/50 points
10%
40/50 points
8%
41/50 points
6%
42/50 points
2%
Comparative European Research CER 2016 (issue I.)
169

learning and they are more effective than traditional
approaches.
References
[1] Brown, J. D. 1998. “Computers in language testing:
Present research and some future directions” in Language
Learning & Technology, 1(1), 44-59.
[2] Logan J. P. and Scheffler F. L. 1999. “Computer
technology in schools: What teachers should know and be
able to do” in Journal of Research on Computing in
Education. No. 31: 305-326.
[3] Noblitt, J. S. and Bland, S. K. 1991. “Tracking the
learner in computer-aided language learning” in B. Freed
(Ed.), Foreign Language Acquisition Research and the
Classroom. Lexington, MA: D. C. Heath and Company,
120-13.
[4] Raia O. 2009. “Keys to Inclusion. The Webquest
Issue” in Webquests. The New Jersey Coalition, Vol. 3,
Issue 1.
[5] Sandholtz, J. H., Ringstaff, C., and Dwyer, D. C. 1997.
Teaching with technology: Creating student-centered
classrooms. New York: Teachers College Press.
[6] Schrock K. 2002. The Teacher’s Role in Cyberspace.
WebQuests in Our Future.
Comparative European Research CER 2016 (issue I.)
170

SEX DIFFERENCES IN THE ASSESSMENT OF SOCIAL FUNCTIONING
Agata Złotogórska
Adam Mickiewicz University
ul. Szamarzewskiego 89/AB
Poznań, 60 – 513, Poland
Abstract: Research in the field of social cognition is focused not only on ability to understanding others minds but also on
assess the ability to do it. The key question of this study was whether male and female differ in their assessment of social
functioning. 75 people aged 18 to 60 years were studied. Into the studies Cambridge Behavior Scale, Liebowitz Social Anxiety
Scale Test and B. Wojciszke Q-sort method for estimate social self-esteem and social-acceptance were used. The results
confirmed established hypothesis partially. Women and men did not differ in the assessment of self-esteem but in self-
acceptance. Female have higher social anxiety then male. However, they have the same level of avoidance social situations.
Furthermore, women characterized by higher empathy level than men. Results indicate that there are gender differences in
estimate social functioning, that may results from stereotype and social expectations.
Keywords: social functioning, social anxiety, self-esteem, gender
1. Introduction
Social cognition is a broad construct that lies between
cognitive and social psychology. It explores the way
people think about themselves, about the social world,
especially methods of selection, interpretation,
storage and use of information for formulating social
courts
and decision-making [1]. Currently, the most commonly
studied area of social cognition is the theory of mind
(ToM) - the way people try to understand others minds [2].
Whereas, for the purpose of this article we examined how
people think about themselves as social beings and how it
is depended on their gender.
1.1 Sex differences in social functioning
Many studies show that women and men behave
differently in social situations. For example, women shows
greater empathy [3] and less autistic traits [4]. Studies have
shown that the male infants demonstrated a stronger
interest in the items like mobile phone while the female
infants demonstrated a stronger interest in the face [5].
Then, in 3- to 5-years old children, theory of mind
understanding significantly predicted aggressive or
disruptive behavior for boys and prosocial behavior for
girls [6]. A meta-analytic review revealed that men exert
more influence than women [7]. Even analyses on 50-95
years old women reveal that women have larger networks
and receive supports from multiple sources, while men
tend to rely on their spouses exclusively [8].
1.2 Self-knowledge and social self-esteem
Self-knowledge is essential for social functioning. It is
deliberated, organized and constant getting to know
yourself, learning about your characteristics, opportunities
and weaknesses [9]. On the basis of social self-knowledge
people create social self-esteem, which is affective
reaction of a man on himself [10]. Most of people have a
positive attitude toward themselves [11]. However, a
stereotype suggests that women have better social skills
then men. Therefore, social expectations of the social
functioning are higher for women.
1.3 The Present Study
The key question of this study was whether male and
female differ in in their assessment of their social
functioning. First of all, it was examined whether sex
differentiates social self-esteem and self-acceptance. Since
women cope statistically better in social situations, they
should estimate higher their own social abilities. On the
other hand social expectations for female social skills may
be too high so a woman lowers estimation of her own
social abilities. While men have more autistic traits, they
may not notice their poor social skills.
Secondly, it was examined if gender differentiates social
anxiety. Study show that autistic people have higher social
anxiety and even social phobia [12]. It was assumed that
men, who have higher autistic traits, estimate higher their
own social anxiety than women. If women are better in
social functioning, they should estimate lower social
anxiety.
The third hypothesis assumes that women have higher
empathy than men. Many studies show that empathy
depends on gender. Women are statistically more sensitive
than men for social clues like eyes and faces, as well as for
emotions [3]. They should estimate higher their empathy
level.
2. Method
2.1 Participants
Subjects of the study were recruited by interviewers in
Gdańsk. The study involved 75 participants, aged 18-60
years old (M age = 28; SD = 10). However, most
participants were young adults. 56% of participants were
men. 52% of subjects were students, 2 persons had
primary education degree, 2 persons had professional
education degree, 14 people had secondary education
degree and 18 people had higher education degree. 32
people studied science, 31 humanities and 12 people
studied natural science.
Comparative European Research CER 2016 (issue I.)
171

All respondents received an explanation of the purpose of
the test and its procedure. The test was proceeded after a
consent of participant.
2.2 Measures
The study used three questionnaires. First was B.
Wojciszke Q-sort method (QFS) estimated self-knowledge
about social functioning [13]. The purpose of the test was
to attribute positive and negative terms about social skills
into 11 categories, marked with letters from A to F. Where
the "A" determined the least matching scheme and the "K"
determined best match. In the category "A" and "K" can be
placed only two expressions, and in the intermediate
category "F" there was ten expressions. Finished test took
a form of pyramid of cards. It represented the structure of
self-esteem. Subsequently, the participant had to repeat the
task by fitting expressions into the pattern of ideal him/her.
As a result, using the model created by the authors of this
method, a rate of self-acceptance was received.
Second method was Liebowitz Social Anxiety Scale
(LSAS) [14]. The reliability coefficient was measured and
internal compliance was α=0,96. Polish version of this
method have reliability between 0,92-0,96 (α Cronbacha).
The scale consists of six sub-scales - the fear of
performing tasks in social situations, to avoid such
situations, fear of social interaction, avoidance of such
interaction, general anxiety and general avoiding.
Third method was The Empathy Quotient (EQ) - a scale
developed by Baron-Cohen and Sally Wheelwright in
2004 [15]. The selected version of this scale consists of 60
items, which participants can respond in 4 possible ways –
I definitely not agree, tend to disagree, tend to agree and
strongly agree. Out of this amount, 40 sentences relate to
empathy (cognitive and affective), and the remaining 20
serves to distract the participant from the true purpose of
the study.
2.3 Procedure
First subjects performed the Q-SORT method for real I
and then for ideal I. Next, they complete an anxiety and
empathy questionnaires. Finally, to avoid the stereotype
threat, participants completed their profile with basic
information – age, gender, education, specialization.
3. Results
Basic statistics can be found in Table 1.
Table 1. Descriptive statistics
M min max SD
QFS self-esteem 41.80 8 57 10.19
self-acceptance 0.7 -0.09 1 0.27
LSAS
anxiety 23.96 1 58 12.25
avoidance 24.03 2 58 12.64
overall result 44.79 4 116 24.02
EQ 38.41 6 60 10.56
3.1. Self-esteem and self-acceptance
For analysis used U Mann-Whitney test. Results showed
that women and men statistically significant differ in social
self-acceptance (p < 0.05) but not in social self-esteem (p
= 0.86). Women estimate their self-acceptance lower (M =
0.65; SD = 0.25) then men (M = 0.75; SD = 0.27).
Figure 1. Social self-acceptance in women and men.
3.2. Social anxiety and avoidance
For analysis it was also used U Mann-Whitney test. There
was difference between men and women in social anxiety
(p < 0.05) but not in social avoidance (p = 0.27) and
overall result (p = 0.13). Women had higher anxiety (M =
26.48, SD = 12.44) then men (M = 21.98; SD = 11.88).
Moreover, women had significant higher anxiety
especially in social activities than men (women: M =
14.67; SD = 6.22; men: M = 12.05; SD = 5.88; p < 0.05).
Figure 2. Social anxiety in women and men.
3.3. Empathy
For analysis the level of empathy in women and men also
used U Mann-Whitney test. There was statistically
significant difference between men and women in empathy
level (p < 0.001). Women assessed their level of empathy
higher (M = 43.36, SD = 7.66) then men (M = 34.52; SD =
10.97).
Figure 3. Empathy level in women and men.
4. Conclusions
This study aimed to establish whether gender differentiates
assessment of social functioning. The results was very
interesting and partially compliant with hypotheses.
Women and men did not differ in social self-esteem. It is
compatible with two major reviews [16,17]. Although
0,6
0,65
0,7
0,75
0,8
social self-acceptance
QF
S
women
men
0
5
10
15
20
25
30
social anxiety
LS
AS
women
men
0
10
20
30
40
50
empathy level
EQ
women
men
Comparative European Research CER 2016 (issue I.)
172

male and female did not differ in social self-esteem,
female more often have lower self-acceptance in social
situations. It may be result of stereotype and higher social
expatiations toward women [18]. It is possible that men,
who have more autistic traits then women, do not see as
many aspects of social interactions as women, so they do
not see their failures.
Furthermore, female showed higher social anxiety then
male. It is inconsistent with earlier studies [19]. Since
women are better at understands other minds, they can be
more afraid then men of judging by others. Studies showed
that socially anxious women made significantly more
negative and fewer positive self-statements in a dyadic
encounter than women low in social anxiety [20]. It can be
vicious circle – social anxiety may lead to lower social-
acceptance, and lower social-acceptance may lead to social
anxiety.
Clearest gender differences are related to the empathy
level. According to earlier studies women are better than
men in empathize. There are more sensitive to social clues,
such as eyes, facial expressions, voice prosody, body
posture or gesticulation [21]. Many researches suggests
that females empathy is evolutionary adaptation for their
social role [22].
References
[1] Aronson, E., Wilson, T. i Akert, R. (2006).
Psychologia społeczna. Poznań: Zysk i S-ka
Wydawnictwo.
[2] Kucharska-Pietura, K., Zaburzenie procesów
społecznego poznania w schizofrenii, Warszawa, Instytut
Psychiatrii i Neurologii, 2008
[3] Baron-Cohen, S., Wheelwrigh, S. (2004). The Empathy
Quotient: An Investigation of Adults with Asperger
Syndrome or High Functioning Autism, and Normal Sex
Differences. Journal of Autism and Developmental
Disorders, 34(2), 163-173.
[4] Baron-Cohen, S., Wheelwright, S., Skinner, R., Martin,
J., Clubley, E. (2001). The Autism-Spectrum Quotient
(AQ): evidence from Asperger Syndrome/highfunctioning
autism, males and females, scientists and mathematicians.
Journal of Autism and Developmental Disorders, 31, 5-17.
[5] Connellan, J., Baron-Cohen, S., Wheelwright, S.,
Batki, A., & Ahluwalia, J. (2000). Sex differences in
human neonatal social perception. Infant Behavior and
Development, 23(1), 113-118.
[6] Walker, S. (2005). Gender differences in the
relationship between young children's peer-related social
competence and individual differences in theory of mind.
The Journal of genetic psychology, 166(3), 297-312.
[7] Lockheed, M. E. (1985). Sex and social influence: A
meta-analysis guided by theory. Status, rewards, and
influence, 406-427.
[8] Antonucci, T. C., & Akiyama, H. (1987). An
examination of sex differences in social support among
older men and women. Sex roles, 17(11-12), 737-749.
[9] Borkowski, J. (2003). Podstawy psychologii
społecznej. Warszawa: Elipsa
[10] Wojciszke, B., Doliński, D. (2011). Psychologia
społeczna. W: J. Strelau, D. Doliński, Psychologia
akademicka. Podręcznik (tom 2). Gdańsk: Gdańskie
Wydawnictwo Psychologiczne, 316-335.
[11] Banaji, M. R, & Prentice, D.A. (1994). The self in
social contexts. Annual Revivew of Psychology, 45, 297-
332.
[12] Kuusikko, S., Pollock-Wurman, R., Jussila, K.,
Carter, K., Mattila, M., Ebeling, H., i in. (2008). Social
Anxiety in High-functioning Children and Adolescents
with Autism and Asperger Syndrome. Journal of Autism
and Developmental Disorders, 38(2008), 1697-1709.
[13] Wojciszke, B., Pieńkowski, R. (1985). Q-SORT
funkcjonowania społecznego (OFS) - prezentacja
narzędzia i przykłady jego zastosowań. Przegląd
Psychologiczny, 28(2), 527-542.
[14] Liebowitz, M. R., Hemiberg, R. G., Horner, K. J.,
Juster, H. R., Safren, S. A., Brown, E. J., i in. (1999).
Psychometric properties of the Liebowitz Social Anxiety
Scale. Psychological Medicine, 1999(29), 199-212.
[15] Baron-Cohen, S., Wheelwrigh, S. (2004). The
Empathy Quotient: An Investigation of Adults with
Asperger Syndrome or High Functioning Autism, and
Normal Sex Differences. Journal of Autism and
Developmental Disorders, 34(2), 163-173.
[16] Maccoby, E. E., & Jacklin, C. N. (1974). The
psychology of sex differences. Stanford, CA: Stanford
University Press.
[17] Wylie, R. (1979). The self-concept (Vol. 2). Lincoln:
University of Nebraska Press.
[18] Crocker, J., & Major, B. (1989). Social stigma and
self-esteem: The self-protective properties of stigma.
Psychological review, 96(4), 608.
[19] Fresco, D. M., Coles, M. E., Heimberg, R. G.,
Liebowitz, M. R., Hami, S., Stein, M. B., & Goetz, D.
(2001). The Liebowitz Social Anxiety Scale: a comparison
of the psychometric properties of self-report and clinician-
administered formats. Psychological medicine, 31(06),
1025-1035.
[20] Glass, C. R., Merluzzi, T. V., Biever, J. L., & Larsen,
K. H. Cognitive assessment of social anxiety:
Development and validation of a self-assessment
questionnaire. Cognitive Therapy and Research, 1982, 6,
37-56.
[21] Baron‐Cohen, S., Wheelwright, S., Hill, J., Raste, Y.,
& Plumb, I. (2001). The “Reading the Mind in the Eyes”
test revised version: A study with normal adults, and adults
with Asperger syndrome or high‐functioning autism.
Journal of child psychology and psychiatry, 42(2), 241-
251.
[22] Smith, A. (2010). Cognitive empathy and emotional
empathy in human behavior and evolution. The
Psychological Record, 56(1), 1.
Comparative European Research CER 2016 (issue I.)
173

FAIRY TALE IN THE BIBLE
Ján Vido
Catholic University in Ruzomberok
Hrabovská 1
Ruzomberok, 036 01, Slovakia
+421 910 842 142
Abstract: Nowadays – in 21st century, can we take the Bible seriously? Isn´t it perhaps full of contradiction, nonsense and
historical inaccuracies? Haven´t the archaeological discoveries contradicted its authenticity? A rationally thinking man
believes that reliability of each historical document must be verified. What the Bible is offering us "the history of salvation".
Thus, the content from which we should learn a lesson a urselves inpired so that we can come happily to the finish line…
Objective of this paper is to point at the fact why are some biblical texts understood in certain cases ar fairy tales.
Keywords: Pavol Dobšinský, fairy-tale, three coppers, life, work
1. Introduction
The Bible has no ambition to become a fairy tale book at
all. What it is offering us is "the history of salvation", thus
the content from which we should learn a lesson and let
ourselves inspired so that we can come happily to the
finish line... . The Bible is valuable by offering the correct
value orientation for life, being a modern GPS1, because it
shows the correct direction in life, outlines some borders –
what to cling to and what to avoid, so that the man does
not get lost on their way of life. Therefore, it is frequently
confronted as being a fairy tale, containing wisdom and
will of fight of the good against the evil. In the past more
often, nowadays less frequently, but still there are people
who would say: ""Who would believe in the Bible? It is
only a collection of old legends and fairy tales." Every
nation has it in its cultural heritage and since Israel is an
old nation, they are really old.
Nowadays, in the times of liberty and freedom in literature
publishing, many different versions of the Bible appear on
the book market. Adapted biblical texts for children belong
nowadays to respected genres of children literature.
However, to adapt the texts to child´s perception means
intervention in the literature type in the Bible. Then, there
is a sensation that the biblical texts are fairy tale-like.
Original authors wrote individual biblical books in three
languages: Hebrew, Aramaic or Greek. Hebrew has been
used until today, it is the language of today´s Israel,
Aramaic is used in Syrian area and Greek language is used
in current Greece and also out of it. Nearly all books of
Old Testament are written in Hebrew. Unlike the western
languages, its writing is read and written from the right to
the left and there are no vowels used. (Lightfood, 1984, p.
13).
Particular biblical books originated in long time horizon,
in different parts of the world, in different political
situations and were written by authors of different
1 GPS – Global Positioning System is a satellite navigation system used
to obtain accurate position and providing very accurate time reference
nearly anywhere on Earth or on Earth´s orbit.
nationalities and education. Therefore, the Bible is a
collection of books which frequently vary by their
different style. Actually, within one and the same book
there are frequently different literary types. The issue of
literature type is significant for correct understanding of a
biblical text. Simple narration of a story, for example in
the Old Testament book Ruth, is perceived by the reader in
a different way than a poetic book the Song of Songs,
reading which it is definite that the used metaphors and
hyperbolas are not deemed word for word. Bible reader
should look at individual books with knowledge that the
biblical texts must be read and interpreted according to
particular literary type and its concrete version is in
question. (Petrů, 2000, p. 71). We can find all three literary
types in the Bible, thus the ways how it is possible to
divide the literary works.
2. Epic poetry in the Bible Epic poetry is the most represented in the Bible and it is
characterized more or less by developed narrative
procedure, frequently replenished with a description (it is
predominated for instance in the book Leviticus) and a
reflection (predominant in the books Preacher and
Proverbs). Narration is set in certain time and space and
written mainly by prose. Typical representative of simple
narration is the book Genesis. There we can find a number
of significantly epic stories with minimum lyrical turnings,
for example Creation of the world (Gn 1,1 – 2,4a),
construction of Noah´s arch (Gn 6), life stories of great
Old Testament characters: Abraham, Moses, Isaac, Jacob
and Joseph. Other documents where the story goes first are
the books: Ruth, 1st and 2
nd Samuel book, the Book of
Esther and also Jonah as the only from Prophet Books.
2.1 Lyrics in the Bible
Lyrical genres are characterized, in the Bible as well as
generally, by timeless narration constructed from the
subjective point of view. Verse is typical for lyrics, but it
is not a condition and the texts with complicated internal
bonds contain large amount of metaphors and symbols.
The field of lyrics includes a significant part of Old
Testament: Book of Psalms, Proverbs, Preacher, the Song
Comparative European Research CER 2016 (issue I.)
174
of Songs and prophet Jeremiah. Poetic passages can also
be found in the Books of Moses and prophet´s scripts, and
on the contrary, in purely poetic books we can
occasionally find epic extracts. The mentioned books of
poems were written in Hebrew, and therefore we can find
there the poetry different from classic European way
of poetry writing. Hebrew poets did not create any rhymes,
but different rhythmical verses of different length.
(Lightfood, 1984, p. 144). A key element for Hebrew
poetry is the so-called parallelism that occurs in two
modifications. Synonymous parallelism is more simple in
the form where there are some ideas repeated in the second
line of a typical poetic two-verse included already
in the first line but with the help of other words ”Who may
ascend the mountain of the Lord // who may stand in his
holy place? (Psalm 20,3). Against that, in the form of
antithetic parallelism the same idea is said in the way that
the first part of the two-verse expresses the main idea
positively and the other part transfers it to negation „The
name of the righteous is used in blessings // but the name
of the wicked will rot. (Proverb 10,7). A significant
element of biblical poetry is poem in the form of akrostich,
or an alphabet song. It is a longer poem, in which each
verse or stanza is starting gradually with particular letters
of Hebrew alphabet, starting with the first and ending with
the last one. However, this characteristic is lost
in translation. An example of akrostich in the Bible in
Psalm 119 (at the same time, it is the longest psalm of all
biblical psalms) and in the shortened version this form is
in the 31st chapter of the Book of Psalms and in the third
chapter of the book of Jeremiah. (Šándorová, 2013, p. 15 –
19). In such verses, names of particular phonemes of
Hebrew alphabet are set in the brackets at the beginning of
the stanza: Aleph, Beth, Gimel, Daleth, He, Wav, Zayin,
Heth, Teth, Yodh, Kaph, Lamedh, Mem, Nun, Samekh,
Ayin, Pe, Tsadhe, Qoph, Resh, Shin, Taw“ (Psalm 119).
2.2 Drama in the Bible
A typical drama book in the Bible is the book of Job. The
Old Testament document includes all basic elements of
drama: sujet line divided into particular narrations and
scenes, text with dialogues, plot embodied in fictitious
time and space and also the language corresponding with
nature of the character. This spiritual drama in verse (with
prosaic prologue and epilogue) is divided, apart from
typical biblical division into verses and chapters, into
initial picture, leading the reader in the issue of the whole
book. What follows is the main, most extensive part, in
which Job and his friends were discussing the situation
which he had found himself in despite his saintliness.
Before each dialogue, it is stated who is speaking - always
according to the same scheme, only the name of narrator is
changed „Then Eliphaz the Temanite replied: ... (Job 4,1).
The book finishes by Job´s prayer for his friends and final
paragraph Job´s new welfare.
3 Interpretation of the Bible as a fairy tale
Biblical issues have been penetrating in different areas of
human life, such as painting, sculpture, literature, theatre,
as well as children´s literature and film. Importance of
knowing the Bible has been generally grasped by
Vladislav Stanovský in his article published
in the magazine Zlatý Máj in 1990. We are living in the
period when everybody suddenly meets the Christianity
and does not know what to do with it. Television
broadcasts some Christian worship, but who knows what
the mass is and what it means. The children, of course,
cannot know it and mostly neither their parents,
nevertheless they are professed Christian church. Thus, I
think what is important, and it should be the first task, is to
give children some reading, explaining them what
Christianity is.(Stanovský, 1990, p. 477).
Reading of the Bible itself is not easy even for an adult
(especially without religious education), not for a child.
The main reason is plenty of biblical books, different in
terms of genre, but also different attitude of reader to the
Bible. It is perceived otherwise by a theologian who can
see God´s word in it, a reader for whom the Bible is only
one of many well-preserved historical documents and
otherwise by a child. Therefore, lots of biblical adaptations
have been created during history of literature, whose main
idea was to inform the child reader, in a responsible form,
about the Bible, its stories and its message, and
on the basis of biblical stories´ narration to differentiate
between the good and the evil, and thus to contribute to
creating their value orientation. The best way of getting
acquainted with biblical texts was to transfer them into
children´s fairy-tale language. Adaptation of the Bible for
child reader may be summed up in the following items:
Authors of adaptations extensively limit, redo and
drop the texts which are too complicated as for their
ideas, which contain extensive descriptions, directions
and rituals, or the stories not suitable for child readers
due to violence and erotic motives (in adaptations for
children there is no reference to Israelite wars with
surrounding nations or to polygamy of King
Solomon);
Major parts of biblical adaptations contain significant
narrative stories, based on narration, which are
interesting for children thanks to a fetching story,
often with fairy-tale features and thanks to
extraordinary characters (Noah´s Arch, David and
Goliath, Queen Esther);
Adaptations intended for readers emphasise
presentation and clarification of basic Christian
values, such as love, belief, responsibility for own life
and lives of other people, liberty, patience or
goodness;
An important feature of biblical adaptation intended
for children is adaptation of language and stylistic
aspect. Authors simplify and make the original terms,
word order and total structure of the text more clear,
replace the incomprehensible words, drop descriptions
of passages and plot turnings, replenish the text
with historical or geographic information and help the
reader understand the character, their nature and acts;
Biblical adaptations, regardless of their period of
origin or author´s association keep, in most cases,
Comparative European Research CER 2016 (issue I.)
175
progression of individual stories according to their
structure in the Bible. However, there are also some
cases when the author changes order of particular
events, thus not complying with biblical chronology.
Change of order of particular stories occurs when the
author wishes to highlight certain event and enable the
child to understand it better;
Typical for adaptations intended for children and
youth is an effort to keep child´s attention and make
contact with them. Child readers are placed also in the
role of listeners, addressed at the beginning of the
story, and the following story is as if being narrated to
them. The method appears in adaptations indented
mainly for thesmallest children, where the child may
be addressed by the author and their attention may be
drawn to different interesting facts or connections in
the story, also in the course of the story.
Adaptations intended for children and the youth
appear mainly in the form of the text replenished with
illustrations, whose aim is to grasp child´s attention
and help them orientate better in the story, or to make
some biblical facts, such as dwelling, appearance and
clothing of characters or the surroundings in which the
story takes place, more clear with the help of
illustrations. (Kovalčík, 1993, p. 301-308).
Nowadays, we can experience the biblical stories also in
an untraditional way - comic book2. It is generally very
popular among child´s readers due to its simplicity, clarity
and action. In the publication Komiksy pre zábavu
a zamysleniu (Comic book for fun and speculation), for the
first time in 2003 in the publishing house FATYM, we can
find totally sixteen comic strips which mostly relate to the
topics of truth and justice, thus generally valid moral
principles. However, two stories from the Comic book by
Záhradník are of purely biblical nature: How was it at first
Christmas and what happened at Easter. Author bases it
directly on biblical issues. The first one is starting with the
journey of Mary and Joseph to Bethlehem and birth of
Jesus Christ and finishing by narrator´s words: „When
Herod in year 4 BC died, the Holy Family returned to
Nazareth. Jesus was growing up there up to his thirteenth
year...“(Záhradníček, 2006, p.22). In the second one,
author deals with the New Testament events like birth,
death and Resurrection of Jesus, as well as spread of
Christianity. Both comic stripes are well organized and the
author respects the biblical language. Comic strips
publication has also influenced spreading the idea to point
at the biblical text as a fairy-tale one.
Despite certainly positive modern publications, we must
beware of putting the Bible on one level with comic books
and fairy tales. Therefore, it must be highlighted at the RE
lessons that as for the Bible, there are historical events,
2 Comic strip means sequentially organized gradual pictures or similar
signs (apart from cartoons) which exchanges information (mostly narrates
a story or describes a plot) and is affecting the reader aesthetically. Pictures are mostly drawn and mostly some text is added. The text may
be placed in the so-called bubbles in the middle of the picture or may be
in marginal part of the picture.
which may be substantiated by archaeological or out-of-
Bible acts.
3. Conclusion
Object of Christians´ belief is God. And the God used the
Bible to show us what He is like and how we can learn
Him. The Bible is not only a book of inspirations. Through
the Bible we can understand life and God himself. It does
not give us answers to all of our questions but to plenty of
them. It encourages us to address God to get power and
direction in life and to enjoy his love to us. And the last
but not the least, the Bible talks about how we can get
eternal life through Jesus Christ. Thus, it is not a fairy tale
at all, but a direction showing a path to correct life.
References
[1] Kovalčík, Z, Literatúra pro děti a mládež s
náboženskou tematikou diel V, Prague, Academia, 1993, p.
301-308.
[1] Lightfood, R. Neil, How We Got the Bible, Vienna,
Logopress, 1984, p. 13.
[2] Petrů, E, Úvod do studia literární vědy, Olomouc,
Rubico, 2000, p. 71.
[3] Stanovský, V, Pár poznámek o křesťanství a dětské
literatuře, Prague, The Czech literatury fund, 1990, p. 477.
[3] Šándorová, V, Akrostich, Bratislava, Methodical –
pedagogical centre, 2013, p. 15-19.
[4] Záhradníček, P. Comicsy pro zábavu i k zamyšlení,
Bítov, A.M.I.M.S, 2006, p. 22.
Comparative European Research CER 2016 (issue I.)
176

DIDACTIC SITUATIONS IN MATHEMATICS AS A TOOL FOR TEACHING THE CZECH LANGUAGE
Jana Martáková Styblíková
Faculty of Education at Charles University in Prague Magdalény Rettigové 4
Prague 1, 116 39
Czech Republic
776 637 850
Abstract: The paper focuses on the theory of didactic situations in Mathematics and their subsequent utilisation in the teaching
of the Czech language. It describes a priori analysis as a tool in the didactic process of teaching Mathematics — with the
mathematical "Puzzle" game serving as the basis for individual activities in teaching the Czech language to pupils in the fifth
grade of primary school.
Keywords: didactic situation, Mathematics, didactics of the Czech language, a priori analysis, applications
1. Introduction
Mathematics is an exact natural science, dealing with
logical operational thought, numerical operations, the
solution of word problems, description of basic
geometrical objects, proofs and other principles. A
characteristic feature of Mathematics is the emphasis on
the absolute accuracy of methods and the irrefutability of
results. These features which distinguish Mathematics
from other scientific disciplines can be implemented into
the didactic process of teaching the Czech language. These
include, in particular, sophisticated logical processes and
thought operations. Maths, as a science with an affinity for
knowledge and understanding, is also concerned with
creating abstract entities1 and the search for principal
relationships between them. Šmejkalová states: "The
difference between the Czech language and Mathematics,
of course, lies in the fact that, for the average user, while
Mathematics is basically axiomatic and stable (two and
two were, are and always will be four), language as a
phenomenon closely related to the phylogeny of mankind,
is variable. In addition, the number of phenomena that are
traditionally the subject of teaching is primarily a matter
of convention (typically, lexical spelling). Moreover, the
Czech language is irregular, as is evidenced by the many
exceptions and variations." (Šmejkalová, 2012, pp. 44–
45).
Despite this fact, it is possible to find phenomena that are
also universal in language. It is precisely such phenomena,
or the understanding of them, that can become the subject
of a didactic situation.
1.1 Didactic situation in Mathematics
Firstly, it is necessary to clarify what is meant by a
"didactic situation"2. A didactic situation is the situation in
which a teacher achieves educational goals through the
overshadowing of his or her own role, while transferring
1 Entity (from Latin entitas, ens – being) filos., the essence of things,
ability to exist, existence 2 The opposite of a didactic situation is a “non-didactic situation”. Under the concept of non-didactic situation, we understand such a situation in
which there is no intention to teach. Examples include situations from
daily life when no teaching is expected (but may happen coincidentally).
part of the teacher's responsibility for the learning process
to the pupils. Pupils find and discover something on their
own, without outside interference, create a model and
check its accuracy and usefulness. Thus the pupil becomes
responsible for obtaining the desired results, and for
constructing knowledge alone through problem solving.
The teacher further utilises and develops this knowledge.
An important phase in the teaching situation is the stage
where pupils themselves attempt to formulate their own
strategies and, if necessary, to explain them to others3.
In the field of didactic situations, the term a-didactic
situation is used, which has the purpose of enabling the
pupil to acquire knowledge without overt intervention by
the teacher. A related term is devolution, which is the
process by which the teacher passes the responsibility for
the act of learning on to the pupil.
The a-didactic situation consists of three stages:
action – the result is an expected (implicit) model,
strategy, initial tactics
formulation – formulation of the conditions under
which the strategy functions
verification (validation) – verification of the validity
of the strategy
Another important concept is institutionalisation, within
which the pupil him- or herself draws up a strategy for
solving various problems applicable to various problem
situations.
The contribution of the theory of didactic situations to the
didactics of the Czech language can be seen in the
following areas:
influence on the model of pedagogical communication
in teaching the Czech language;
contribution of the independent formulation of
educational strategies for the development of
communication skills and language literacy of the
pupil;
benefit of independent formulation of educational
strategies in the achievement of the cognitive
objectives of language teaching.
3 Ibid., pp. 45-46.
Comparative European Research CER 2016 (issue I.)
177
The proportion of and competition between natural and
didactic situations may be perceived as a specific problem
of teaching the Czech language, when we want to combine
the known experience by the pupil, in natural way
(communicatively) acquired language, with the conscious
adoption of the language. Hájková states that "...the pupil
gradually uncovers a certain reality, gets to know it, i.e.
constructs his or her knowledge of it and then formulates a
summary, a conclusion and a definition, with the help of
the teacher. In other words, the pupil becomes familiar
primarily with his or her own content of the activity and
only then the definition, or verbalisation of this activity..."4
Thanks to the spontaneous alignment with the linguistic
competence of the pupil, as well as with his or her
preconcepts5, it is possible to:
use natural language situations, define their
relationship to didactic situations;
elaborate the preparatory process of transforming
natural situations into didactic situations;
identify parts of the language curriculum/schoolwork
on language suitable for being made the subject of a
didactic situation.6
1.2 A priori analysis
A priori analysis is one of the most important tools for
teaching situations. It is carried out by the teacher before
the start of the didactic process. The teacher attempts to
prepare a plan of activities, estimates the actual course of
the teaching process, suggests the division of the lesson
into separate phases, thinks about possible reactions and
attitudes of the pupils and thinks in advance about his own
possible reactions to them. At the same, the teacher
examines the strategies of solving problems that may arise
during the teaching process and considers what knowledge
and findings are essential for the strategy and which of
them pupils will be able to apply spontaneously. This
method has a great informational value for the teacher,
highlighting the potential pitfalls of the lesson and the
possible difficulties that pupils may face in solving the
tasks.
A priori analysis7 was originally part of the didactic
process of Mathematics teaching, where this method is
applied during the explanation of fractions and decimals
(Novotná8, 2006, pp. 17– 22).
4 Hájková, 2012, p. 70. 5 Kucharská explains: “...creation of concepts is connected with
experience acquired by the child from the earliest developmental stages. The child lives in the world of people and is learning to understand this
world. Understanding the world is connected with the development of
cognition, i.e. cognitive functions…“ (Kucharská, 2012, p. 44). 6 Ibid., p. 46 7 Charnay (2003) deals with a posteriori analysis, i.e. analysis which is
carried out after teaching a specific lesson. 8 The publication by J. Novotná is devoted to the preparation of didactic
situations, i.e. situations in the classroom whose purpose is to teach pupils
something. Attention is devoted especially to the preparation of such situations during which the teacher transfers part of the responsibility for
the teaching process, i.e. part of his/her powers, to the pupils. Pupils then
discover specific findings on their own. Their activity is based only on the environment and their knowledge, but not on the didactic activity of
the teacher. The pupil becomes responsible for obtaining the required
results. The task of the teacher is to prepare such a situation and to
In the following section, we present a priori analysis of
"Puzzle", a task which is taken from the publication
(Brousseau9, 1981).
Instructions for the "Puzzle" task (intended for 5th
-grade
pupils)
Pupils are divided into four- to five-member groups.
The teacher:
gives a puzzle to each group;
hangs up (or draws on the blackboard) an
enlarged copy of the puzzle;
writes on the blackboard: 4 cm → 7 cm.
The challenge is to produce similar puzzles that will
be larger than the given model.
Pupils must observe the following rule: a piece that is
4 cm in size in the model must correspond to 7 cm in
the new puzzle.
Each pupil produces one or two pieces of the puzzle.
After the termination, pupils should be able to
assemble the same shapes as those made with the
model.
After a brief discussion within the group, pupils each
work on his or her puzzle piece individually.
2. The application of a priori analysis to the didactic
process of teaching the Czech language
A priori analysis can be well implemented in the didactic
process of teaching the Czech language at primary school
(see activities below). As a basis, we employ the didactic
"Puzzle" game, which is used as a means of understanding
specific mathematical concepts.
Work with conjunctions (intended for 5th
-grade pupils)
Pupils are divided into four- to five-member groups.
The teacher:
gives 5 sentences to each group (see below);
writes the sentences on the blackboard.
Pupils substitute conjunctions with other conjunctions
and observe how the stylistic character of the given
sentences is, or is not altered.
Pupils should be able to construct their own sentences
and replace the conjunctions used.
Example sentences:
Ondřej does not know whether he will be able to come.
The repair took them a long time, although they had not
interrupted their work at all.
Peace would be maintained if all people strived for it with
equal sincerity.
institutionalise the acquired information. These findings are subsequently
used and developed by the teacher. 9The Theory of Didactic Situations in Mathematics (TDSM) was suggested by Guy Brousseau, Professor Emeritus at IUFM d’Aquitaine
and Université Bordeaux II in France, a holder of the Felix Klein medal.
He worked on his theory already from the 1970s and introduced it in a comprehensive form for the first time in 1986. Gradually it was also
positively accepted over the borders of France. In the beginning, its wider
dispersal was prevented by the fact that most of the works were only published in the French language. However, this situation has recently
been changing and the theory is also making its way into other European
countries (e.g. the United Kingdom, Slovakia, the Czech Republic). It has also evoked great interest in the French-speaking part of Canada and
other francophone countries.
Comparative European Research CER 2016 (issue I.)
178

The weather was cloudy, but warm.
We achieved success, although various obstacles got in the way.
Object and complement subordinate clause (intended for
5th
-grade pupils)
Pupils are divided into four- to five-member groups.
The teacher:
gives 7 sentences to each group (see below);
writes the sentences on the blackboard.
The task of the pupils is to change the complement
clause into an object clause.
Pupils should be able to create their own example
sentences and realise whether the stylistic character of
the given sentences is or is not altered.
Example sentences:
He watched the bees quickly flying into the hollow tree stump.
I heard Grandfather entering his study.
The girls watched the boys playing football passionately.
I saw the dog eagerly looking out for his master.
The teacher noticed Tomáš copying the homework.
I saw sparrows pecking small seeds from the feeder in the park.
Suddenly we saw Anna gracefully jumping over a skipping
rope.
Congruent and incongruent attributes (intended for 5th
-
grade pupils)
Pupils are divided into four- to five-member groups.
The teacher:
gives 6 sentences to each group (see below);
writes the sentences on the blackboard.
The task is to substitute incongruent attributes with
congruent attributes.
Pupils should be able to create their own examples
and explain whether the nature of the communicated
information has changed.
Example sentences:
During the break, the joyous laughter of children echoed
in the school hallway.
The barking of a dog was heard from the courtyard.
The observation tower on Petřín Hill is 60 metres high and
is a copy of the Eiffel Tower in Paris.
The path across the field seemed shorter to us than the
route through the forest.
The Chateau in Lednice is one of the most visited locations
in South Moravia.
The juice from carrots is very important for our health.
Verbal forms (intended for 5th
-grade pupils)
Pupils are divided into four- to five-member groups.
The teacher:
gives 6 sentences to each group (see below);
writes the sentences on the blackboard.
The task is to substitute forms of the verb to be with
verbs with a full meaning.
Pupils should be able to provide their own examples
and explain whether the replaced sentence is identical
or not.
Example sentences:
There were many beautiful flowers in the garden.
We will be at the station in time.
Grandpa's violin was on the shelf.
There is a bowl of fruit on the table.
There are many surprised people in the building.
The plane was already on the runway.
Number citations consecutively in square brackets [1]. The
sentence punctuation follows the brackets. Refer simply to
the reference number, as in [2]. Do not use "Ref. [3]" or
"reference [4]". The reference list at the end shows
examples of journals, proceedings papers, books and web
link. Footnotes are not to be used.
Give all authors' name; do not use "et al." papers that have
not been published, even if they have been submitted for
publication, should be cited as "unpublished". Papers that
have been accepted for publication should be cited as "in
press" or "in print". For papers published in non-English
journals, please give the English citation first, followed by
the original citation. Only the cited papers or books in the
main text appear in reference list.
3. Conclusions
The theory of didactic situations and its implementation in
Czech language teaching seems to be effective and
beneficial. Pupils themselves become familiar with the
issues of the exercises, use logical and intellectual
operations, and get to know various linguistic phenomena
without the teacher's direct intervention in the explanation.
They also learn to think constructively, analyse different
problem situations and critically assess their performance
and the performance of others.
The connection of the Czech language to Mathematics is
in many ways inspirational, as well as a challenge for
teachers of other subjects. Teachers should always be
interested in these methods, promote new trends in
education, as well as develop the creativity of pupils and
their interest in the taught subject
References
[1] BROUSSEAU, G. Theory of Didactical Situations in
Mathematics. Edited and translated by N. Balacheff, M.
Cooper, R. Sutherland, V. Warfield. Dordrecht/Boston/
London: Kluwer Academic Publishers, 1997.
[2] HÁJKOVÁ, E. Účinnost edukačních postupů při
budování poznatkových struktur. In Čeština ve škole 21.
století – Úvodní studie. Praha: PedF UK, 2012, p. 69-81.
ISBN 978-80-7290-617-8.
[3] CHARNAY, R. L’analyse a priori, un outil pour
l’enseignant. In Grugnetti, Jaquet,
Medici, Polo, Rinaldi (Eds.) Actes des journees d’etude
sur le Rally mathematique transalpin, RMT: potentialites
pour la classe et la formation, Vol. 3, p. 199–213.
ARMT: Dip. di Mat. Universita di Parma, Dip. Mat.
Universita di Cagliari, 2003.
[4] KUCHARSKÁ, A. Dětské prekoncepty a možnosti
jejich sledování v oblasti jazykového systému. In Čeština
ve škole 21. století – Úvodní studie. Praha: PedF UK,
2012, p. 43-57. ISBN 978-80-7290-617-8.
[5] NOVOTNÁ, J. a kol. Příprava a analýza didaktických
situací. Praha: JČMF, 2006.
[6] ŠMEJKALOVÁ, M. Teorie didaktických situací – nová
výzva pro didaktiku morfologie českého jazyka.
Didaktické studie, 2012, year 4, No. 1, p. 42– 62.
Comparative European Research CER 2016 (issue I.)
179

Session: History, Sociology Index of Author(s)
Kmecová, Darina Kočišová, Kamila Pieniążek-Niemczuk, Elżbieta
Comparative European Research CER 2016 (issue I.)
180

CONSIDERATIONS AROUND THE DEVELOPMENT OF POLITICAL DISCOURSE
Elżbieta Pieniążek-Niemczuk
University of Rzeszów
Al. mjr. W. Kopisto 2 B
Rzeszów, 35-315, Poland
+48 17 872 12 14
Abstract: The public communication domain has always been dominated by the language of politics. As a result, political
discourse has become one of the components of culture. This paper aims to present a discussion of selected theories and
approaches that have contributed to the development of political discourse and broadened its understanding. Attention will be
paid to the historically elaborated features of political discourse and the tools used as instruments to increase power in
addition to conveying knowledge about the world suggestively and subjectively.
Keywords: political discourse, language of politics, rhetorical devices, metaphor, speech
1. Introduction
Language has multiple functions: expressive, informative,
etc. The language of politics is based on one particular
function of the language, i.e. persuasion. Persuasion is
designed to change the attitudes and beliefs of the
recipient, and – ultimately – his actions. Due to the fact
‘rhetoric’ has ancient roots, the art of effective speaking
and writing, also including persuasion, is one of the oldest
disciplines. Indeed, in all public appearances oral or
written artifacts of rhetoric are significant, and this is a
consequence of the fact that they are so often repeated that
they become imperceptible to an ordinary receiver.
2. The phenomenon of communication The simplest definition of the phenomenon of
communication states that communication involves a
sender (encoder) and a receiver (decoder). The former
encodes a message, deciding what content and relationship
codes to use, and then sends it through a communication
channel such as face-to-face (verbal and non-verbal) or
written (frequently using electronic technology).
As stated by the American non-verbal behavior researcher
Albert Mahrabiana, 55% of information is derived from
non-verbal communication, 38% from tone of voice, and
only 7% from the verbal messages themselves. As
evidenced by numerous scholars, verbal communication
forms a relatively small part of the message transmitted
from sender to receiver. Unquestionably, the frame rates
are not fixed and depend on context. Non-verbal
communication includes body language, time, space and
appearance. These elements consist further of: gestures,
facial expressions, body posture, touch, communication
distance zone, smell, eye contact and appearance. Non-
verbal communication reflects our attitude toward others,
our emotional state, and sometimes even our material
condition. Non-verbal signals can reveal our intentions,
but they are also able to camouflage them. According to
some scholars, e.g. Charles Darwin, non-verbal
communication is the most original and congenital form of
communication, because of the fact that people used
gestures for communication purposes even before speech
emerged.
3. The definition of speech
Important aspects of political discourse include the
principle of expression defined by J.R. Searle, and the
speech act hierarchy defined by J.L Austin. These provide
some key terms, for instance locution and illocution.
Another key term is ‘speech’. Some studies use the term
‘utterance’ to refer to speech. In pragmatics these
underlined the essential language skills, involving social
knowledge and the ability to communicate with other
people [1]. The theory of speech acts was propounded by
the Oxford School group of linguists on the basis of a
series of lectures delivered by John L. Austin, where gave
an overview of his theory of performative acts (1953). His
book entitled How to do things with words (1962) contains
a discourse about the nature of speech acts, their
characteristics, component parts and their division.
Thereafter, many linguists argued with Austin`s theory,
adding some new concepts, as well as proposing new
solutions to this problematic issue. The most important
followers of Austin’s study are such scholars as: John
Searle, Peter Strawson, Paul Grice and Anna Wierzbicka
who introduced speech act theory to Poland in the 1970s.
J.L Austin divided speech acts into performative and
constative. According to his proposition, an expression is
performative when a sentence contains verbs in the first
person singular present indicative active. The label is
derived from ‘perform’, the usual verb with the noun
‘action’ [2]. Performative speech contains specific verbs
(performative verbs), however it is worth adding that
speech formulated without the use of performative verbs
may also occur.
There are also sentences that do not include performative
verbs, but can have an attached performative force. Austin
distinguished these types of utterances as explicit and
implicit performatives. It should be stressed that those
utterances containing sentences in the performative cannot
possibly be false, and therefore cannot be legitimately
described as true either. Austin stated that implicit
performatives are ambiguous with regard to the act they
perform and concluded that implicit performatives must be
examined by relating them to the correct explicit
performative [3]. Another important issue considered by
Comparative European Research CER 2016 (issue I.)
181

Austin refers to the identification of speech without
explicit performative qualities. Austin noticed that the
conditions of promising are clearly based on the normal
use of the verb promise. He stated that a complete account
of the conventions of illocutionary acts relies on a
complete account of the meaning of the performative verb.
Austin called primary performatives those simple
sentences that correspond to basic types such as
declarative, interrogative, and imperative. Moreover, he
noticed that some expressions may have explicit
counterparts as well and can be explicitly paraphrased. He
added that performative verbs are very important for
utterance interpretation because of the belief that all
primary (or implicit) performatives have explicit
counterparts. Austin`s speech act hierarchy includes: 1.
locution; 2. illocution; and 3. perlocution. Locution is a
phenomenon based on using a certain language code,
which creates a specific expression, without taking into
account the situation and the participants of the given
speech act. Three aspects of locution can be distinguished:
phonetic (articulation of sounds), factual (correct
pronunciation of sounds in a grammatical manner), and
usage of words in context and a reference. Thus, the
locution action is based on sound articulation, and
combining morphemes and words in a finite creation.
Illocution refers to the intention of the broadcaster, which
results in saying certain words. On the other hand, the
effect of perlocution can be mental. It can cause emotional
changes which can be evinced from the response of the
recipient (amusement, contempt, anger, change of
decision, and suppression of action), a specified action
being performed or statement reaction [4]. Later scholars
noticed that Austin`s taxonomy had some weak points.
Regarding “illocutionary force” Austin distinguishes
several categories: 1. verdicatives – including judgements,
evaluations and views made either by judges or arbitrators
or in everyday expression. Presentation is related to facts
or values. Example verbs in this class are: acquit, hold,
calculate, describe, analyze, estimate, date, rank, assess,
and characterize. 2. exercitivies – one of these “is the
giving of a decision in favor of or against a certain course
of action on advocacy of it...”, “a decision that something
is to be so, as distinct from a judgment that it is so” [5].
Examples are: order, command, direct, plead, beg,
recommend, entreat and advise. Some scholars emphasize
the fact that Austin omits request, which is also an obvious
example.
Following Austin`s theory, Searle evaluated the felicity
conditions of illocutionary acts. He proposed that a
performative verb corresponding to each possible act must
exist. Illocutionary acts proposed by Searle carry the
functional notion of representing. Moreover, in his theory
the force of a speech act is separated from its content. In
explicit performatives, separating the performative verb
from the proposition that it takes is essential.
Symbolically, we might represent the sentence as
containing an illocutionary force-indicating device and a
propositional content indicator. To sum up, despite some
critical voices, J.R. Searle’s taxonomy of speech acts is
considered more useful, because it avoids the difficulty of
reliably connecting an illocutionary act to a performative
verb and having to account for the ambiguity of implicit
performatives.
The discussion below will present the characteristic
features of discourse, preceded by some remarks
connected with the circumstances in which the discourse is
used.
4. Various concepts of discourse
According to Lakoff and Johnson, persuasive texts often
use figurative language that is full of comparisons,
metaphors and metonymy [6]. The art of persuasion was
known in ancient times and its rules were first defined by
Aristotle. Nowadays, one of the persuasive techniques is
known as ELM (Elaboration likelihood model). This is a
theoretical model of the persuasion process and its subject
are the mechanisms employed to change the attitude of the
receiver, such change being the result of the message
received from the sender. The persuasive effect can be
achieved as a result of the use of arguments.
Two types of argument can be distinguished: weak and
strong. Moreover, according to ELM theory, the
personality of the receiver and the context are often very
important. According to Aristotle, the arguments in a
speech should be presented in an order – from the weakest
to the strongest. Another famous philosopher, Socrates,
used a rule based on asking the questions – the opponent
was asked several questions and was thereby led to
conclude in the way the interlocutor wanted. The famous
orator Cicero used a similar method, but he would ask
questions which included a hidden hypothesis. In the 20th
century American psychologists proved that the order
should be reversed. According to contemporary theory,
those speeches that start from the strongest arguments are
most influential, because their effectiveness is greater [7].
5. The features of a discourse
It should be stressed that there were many philosophers
and scholars who considered the function language plays
in a society. The issue of the linguistic characteristics of a
discourse occurs in numerous studies. Discourse requires
the use of some characteristic devices and figures.
According to Brown & Yule, the language of a discourse
has to fulfill two main functions: transactional and
interactional. The first function refers to the situation
where language is used to express content, whereas the
second refers to expressing social relations and personal
attitudes [8]. This distinction refers to the dichotomy that
had been previously made by Buhler (1934) who divided
the functions of language into representative and
expressive categories. Moreover, numerous persuasive
techniques are used. Indeed, language can play numerous
communicative functions. However, as Brown & Yule
mention, language also fulfills a very important
informative function, which refers to our cultural
mythology.
As these scholars state, it is due to language that the
human race has been able to develop different cultures.
Especially important here is the written language, which
helped to develop philosophy, science and literature. This
Comparative European Research CER 2016 (issue I.)
182

was possible due to the fact that language is able to
transfer information. This aspect of language is called
‘primarily transactional language’ and it refers to that
language function that is directed at conveying messages;
hence, it is called ‘message oriented’ language. On the
other hand, in a wider perspective, language is understood
as a tool for establishing social relationships, the so-called
“phatic” use of language. Jakobson (1960) added the
emotive function, and then Halliday (1970) mentioned
such functions as: ideational and interpersonal; finally,
Lyons (1977) added the function called descriptive
(social–expressive). According to Biber & Gray, who
analyzed the linguistic features of a discourse, the typical
discourse contains collocations based on such verbs and
phrasal verbs: get + rid, give + an assignment, have + the
chance/ a good day/ a problem/ the opportunity, Take + an
exam/test/ care/ part, get + along/ better/a job/ good
grades, give + an example, have + an ability/an
advantage/a choice/ no interest/ an opinion/a problem/
time, make a decision/ money/sense, take care/ classes/
course/subjects/ care of [9]. Apart from this, language
often emphasizes an expressive function. Below it will be
shown how language tools, especially the devices used in
speeches and discourse, function in contemporary political
rhetoric.
6. The characteristic features of political discourse
Political discourse has some characteristic features. First of
all, it is worth mentioning that the connections between
politics and discourse are very rigid. As stated by David
Bell, each human being is a political being. The same
author adds that politics is a special kind of
communication, in which the public should carefully
consider who speaks to whom and what the subject of the
discourse is [10].
Schaffner claimed political speeches are not a
homogeneous genre [11]. Lakoff (1990) noted that all
political speeches are based on similar language tools. This
refers to the special way of saying, and to the use of some
special adjectives, as well as to the use of figurative
language to explore some topics. With reference to
Fillmore, Lakoff underlines the fact that political speeches
are characterized by framing [12]. Moreover, Lakoff
together with the other scholars from the Rockridge
Institute described the way in which language influences
the terms of political debate [13].
In the so-called “political framing” each word is related to
the overall of conceptual framework of the speech.
Explaining the term “conceptual framework,” Lakoff
states that it means “the mental structures that determine
how we understand the word” [14]. The result is that a new
understanding of political issues is created that produces
new demands for concrete actions.
Moreover, Lakoff analyzes Schwarzenegger`s speeches,
where he built sentences in such a way that it was clear
that Democrats are against people. Analyzing
Schwarzenegger`s speeches, Lakoff describes the
framework of conservative thought, claiming that the
common recurring issue is the conviction that the world
we live in is not only dangerous, but also difficult. In such
a vision, the role of the authority is to defend families and
be like a father for every citizen. [15] Obviously, there is a
clear difference between oral and written discourse.
According to Locke and Simpson text analysis involves
such areas as vocabulary, grammar, cohesion and
intertextuality.
As far as vocabulary is concerned, the following issues
are of importance: formal and informal language,
metaphors, expressive values and wording [16]. Grammar
involves modality, transitivity, types of verbs, voice and
pronouns. Cohesion consists of such aspects as:
connections, argumentation and parallelism. On the other
hand, the term intertextuality refers to such items as:
allusion, reference and quotation. The analysis of syntax
refers not only to verbs and such characteristic features as
modality, voice and transitivity, but it also involves
pronouns and conjunctions. The highest level of text
analysis involves argumentation and parallelisms, as well
connectives.
7. Rhetorical devices in public speaking
Among the numerous devices that are used in public
speaking the most often encountered are: alliteration,
allusion, amplification, anadiplosis, analogy, anaphora,
anastrophe, antistrophe, antithesis, assonance, asyndeton,
chiasmus, climax, diacope, eponym, expletive, hypophora,
hyperbole, litotes, meiosis, metabasis, metanoia, simile,
parallelism, polysyndeton, praeteritio, scesis onomaton,
sententia, symploce and ticolon.
It should be stressed that a very important language device,
occurring mostly in figurative language, and often used in
political speeches is metaphor.
The theory of metaphor has deep roots; however, most
important here is the cognitive theory of metaphor. It
should be mentioned that cognitive linguists have observed
that most important is not the structure of a language, but
the meaning. For cognitive linguistics, language is
symbolic in its character and this can be seen on all its
levels: morphology, syntax, lexis and pragmatics.
George Lakoff and Mark Johnson, in the book entitled
“Metaphors we live by” pointed out that the literal
meaning of a sentence constitutes only from two to five
percent of all types of constructions used in customary acts
of communication [17]. Lakoff and Johnson noticed that a
great number of metaphors are connected with spatial
orientation: e.g. up-down, in-out, front-back, and on-off.
These metaphors play an important role in our physical
and cultural experience. Selected examples of such
metaphors are: e.g. HAPPY IS UP, GOOD IS UP, BAD IS
DOWN, VIRTUE IS UP, SICKNESS IS DOWN, MORE
IS UP. These authors, whose book revolutionized the
traditional view of metaphor, stated that metaphors are
nothing but “understanding and experiencing one kind of
thing in terms of another.” Giving examples of such
metaphors as “Argument is war” and “Time is money”
they showed that we often talk about time in the categories
we use to talk about money-such metaphors are evidence
that we have a coherent system of metaphorical
expressions to use in our everyday life. The first of the
above metaphors can be seen in sentences such as: “His
Comparative European Research CER 2016 (issue I.)
183

criticisms were right on target”; “If you use that strategy,
he`ll wipe you out” [18]. As Lakoff and Johnson state,
metaphors such as “Time is money” form a coherent
system based on subcategorization.
It appears in sentences such as: “I don`t have the time to
give you”; “I`ve invested a lot of time in her.” This kind of
metaphor is based on the fact that in our culture time is
considered a valuable commodity [19]. Among the
rhetorical devices used in political speeches words such as
“people,” “we,” and “must” are frequently used.
8. Conclusions
Language has always been used as an instrument in
politics. The power of language is of great importance.
History shows that various political systems frequently
rely on similar language tools to achieve their goals and
political communication is a process that becomes a part of
social communication.
References
[1] G. Kasper, Communication Strategies:
Psycholinguistic and Sociolinguistic Perspectives books.
google.pl/books?id=98W3AwAAQBAJ&pg=PA2&dq=ka
sper+1984&hl=pl&sa=X&ei=tzohVKS_OoX-
ygOP2IGACw&redir_esc=y#v=onepage&q=kasper
1984&f=false
[2] E.Oishi, Austin`s Speech Act`s Theory and the Speech
Situation, Esercizi Filosofici 1, http://www2.units.it/eserfil
o/art106/oishi106.pdf, 2006
[3] Ibidem, p.3
[4] Ibidem, p.5
[5] J. L. Austin, How to Do Things with Words, Oxford:
Clarendon Press, 1962, p. 155
[6] G.Lakoff, M.Johnson, Metaphors we live by, 1981.p.2
[7] M.Tokarz, Argumentacja, Perswazja, Manipulacja,
Wykłady z teorii komunikacji, Gdańskie Wydawnictwo
Psychologiczne,Gdańsk,2006, pp. 220-239.
[8] G.Brown & G.Yule, Discourse analysis, 2003: p.xiii
[9] D.Biber &B.Gray. 2013.Discourse Characteristics of
Writing and Speaking Task Types on the TOEFLi BT Test:
A Lexico Grammatical Analysis, p.21
[10] H.Guerra, Textual, Intertextual and Rhetorical
Features in Political Discourse: The Case of President
Obama in Europe, Revista de Lingüística y Lenguas
Aplicadas, Vol. 8, p.5, 2013
[11] Ibidem, p.57
[12] http://georgelakoff.com/tag/political-framing/
[13] http://www.berkeley.edu/news/media/releases/200
3/10/27_lakoff.shtml
[14] G.Lakoff, The Washington Post, https://www.wa
shingtonpost.com/opinions/obamas-speeches-are-not-just-
words--they-are-political-action/2013/02/08/25bee9e4-
6fdb-11e2-aa58-243de81040ba_story.html
[15] http://www.berkeley.edu/news/media/releases/2003/
10/27_lakoff.shtml
[16] H.Guerra, Textual, Intertextual and Rhetorical
Features in Political Discourse: The Case of President
Obama in Europe, Revista de Lingüística y Lenguas
Aplicadas, Vol. 8, p.59, 2013
[17] G.Lakoff, M.Johnson, Metaphors we live by, Chicago,
The University of Chicago Press, 1981, p. 1.
[18] Ibidem, p.9
[19] http://www.speaklikeapro.co.uk
Comparative European Research CER 2016 (issue I.)
184

A FEW EXAMPLES OF DEATH PENALTY IN ROMAN LAW
Darina Kmecová
Pavol Jozef Šafárik University in Košice, Fakulty of law
Kováčska 26
Košice, 040 01, Slovak Republic
Abstract: This article briefly deals with the issue of penalties in Roman law. It refers to sentence development and defines
basic terms connected with punishment in ancient Rome. The author of the article points out the selected types of death
sentences by using the specific examples reflecting the real application in practice. Article enshrines the importance of funeral
perception of the afterlife former Roman society in the death penalty and its prohibition in connection with selected sentences
such as punishment post mortem. These facts point to the typical blending fas and ius in Roman law as one of its basic
characteristics.
Keywords: death penalty, Roman law, execution, criminal law
1. Introduction
Criminal law was also a part of the Roman law. In Rome,
in the oldest period, many social distortions were dealt
within the family – family discipline, whereas, public
authority dealt with the case very rarely. Later, however,
began to emerge reprehensible acts that disturb the public
order, thus encroaching upon the interests of the
inhabitants of Rome, especially its ruling class. For these
reasons, it was necessary to develop and begin to apply the
law and repressive means to prevent such acts. Gradually,
the range of offenses – crimina and the range of all types
of criminal offenses with it began to extend. Sentence was
largely an effective deterrent. Criminal proceedings were
called the public ones, because they were allowed to carry
out to any member of their people. Several criminal cases
were capital, which meant that for these the death sentence
was awarded or prohibition of fire and water, or lifelong
exile on the island or in mines. Other criminal cases in
which the offender was sentenced to the loss of honor or
disabled with property offenses were also considered as
public criminal proceedings, but did not belong to the
group of capital proceedings. [1]
It was Roman law, which introduced the typical criminal
principles such as nullum crimen sine lege and also the
principle of nulla poena sine lege. [2]
2. A brief look into the history of punishment in Roman
law
The term used in ancient Rome in connection with the
sentence was talio, representing retaliation. This term
meant the same criminal mischief for perpetrator as he
committed to the victim. It was one of the phases of
development of choosing the option of killing the
perpetrator or taking a fine from him. It was the
embodiment of the idea that the perpetrator must endure
for his transgressions the same physical pain as the victim
suffered from. A similar meaning for the most serious
crimes in Roman law bears the term poena which had its
basis in Greek and which highlights in particular the
sacred elements – cleansing the society from crime by
dedication of an offender to deity. Penalty – poena does
not always match the committed crime. In comparison
with the presence, therein substantially it reflects the
nature of revenge with intimidating effect. Therefore, the
death sentences were often implemented, usually
associated with the loss of property – convicted offender
had become a victim of gods by the religious beliefs and
his assets was imputed to the temple of the god. [3]
These facts were typical features of blending fas and ius in
Roman law, where religious elements entered to the law
itself and thus influenced public policy. As time goes the
law has begun to exempt purely ecclesiastical character,
even if some of its elements retained. Similar to
distinguish the perpetrators but also accomplices, in
Roman law is that whoever has participated in a criminal
offense (particeps, socius), whether natural or other help,
instructions or incitement, was considered the same culprit
as the main offender and was therefore punished as well as
the perpetrator. [4]
3. Selected types of death penalties in Roman law
As noted above, the punishment was largely an effective
deterrent in Roman law intimidate of consideration and
should arouse menacing impression, until the post-classic
period. For these reasons, it was not unusual for such
frequent application of the death penalty for the crimes
that do not correspond that. At this point it is important to
note that as mentioned earlier, the Roman law was in the
certain time under a strong influence of religion, the deities
in the legal field too, and it had also a great importance for
the punishment. The death penalty was often associated
with the so-called post mortem punishment, which was
about to punish the offender, even after the death. Romans
believed that a person who has not been properly buried
was in addition to the death penalty execution, doomed to
eternal wandering of her soul. In the following chapters
there are some typical methods of capital punishment for
various crimes in the days of the Roman Empire.
3.1 The death penalty for patricide or matricide
Death penalty, which was considered one of the most
heinous one, was punishment for patricide or matricide –
parricidium, which included caning of convicted and then
sewing him into a bag with viper, cock, monkey and dog.
Comparative European Research CER 2016 (issue I.)
185

Thus sack was thrown into the nearest sea or thrown to
wild animals if the execution did not take place near the
sea. The Romans believed that when the body of the
offender has not been destroyed, it should not remain of
everyone's eyes for the shame, and that was the main
reason why it was thrown into the sea. [5] This sentence in
itself carries many religious elements, because the Romans
believed that the souls of the dead could not break through
the water and was executed among other things, denied the
opportunity to find eternal peace. Cicero wrote to this
sentence: „O singularem sapientiam, iudices! Nonne
videntur hunc hominem ex rerum natura sustulisse et
eripuisse cui repente caelum, solem, aquam terramque
ademerint ut, qui eum necasset unde ipse natus esset,
careret eis rebus omnibus ex quibus omnia nata esse
dicuntur? Noluerunt feris corpus obicere ne bestiis quoque
quae tantum scelus attigissent immanioribus uteremur:
non sic nudos in flumen deicere ne, cum delati essent in
mare, ipsum polluerent quo cetera quae violata sunt
expiari putantur; denique nihil tam vile neque tam volgare
est cuius partem ullam reliquerint.Etenim quid tam est
commune quam spiritus vivis, terra mortuis, mare
fluctuantibus, litus eiectis? Ita vivunt, dum possunt, ut
ducere animam de caelo non queant, ita moriuntur ut
eorum ossa terra non tangat, ita iactantur fluctibus ut
numquam adluantur, ita postremo eiciuntur ut ne ad saxa
quidem mortui conquiescant. Tanti malefici crimen, cui
maleficio tam insigne supplicium est constitutum, probare
te, Eruci, censes posse talibus viris, si ne causam quidem
malefici protuleris?“ [6]
This penalty also regulates Digest 48th book, in which a
lawyer Modestinus wrote: „According to the custom of our
ancestors, he punishment instituted for parricide was
follows: A parricide is flogged with blood-coloured rods,
hen sewn up in sack with dog, a dunghill cock, a viper, and
a monkey; then the sack is thrown into the depths of the
sea. This is the procedure if the sea is close at hand;
otherwise, he is thrown to the beasts, according to the
constitution of the deified Hadrian.“ [7]
The very idea of punishment is terrible, therefore, it was
applied in such serious crimes, like the killing of a relative
certainly was. In addition to mentioned punishment
Marcian listed the number of relatives whose killing
resulted in the imposition of the death penalty. That
sentence thus affected the person who killed not only
mother or father, but also grandfather, grandmother,
brother, sister, cousins in the first place, but also the
father-in-law, mother-in-law and so on. [8]
Provision governing the death penalty and the offense
continues: „Truly, if anyone kills a parent in a fit of
madness, he shall not be punished, as the deified brothers
wrote in a rescript in the case of man who had killed his
mother in a fit of madness; for it was enough for him to be
punished by the madness itself, and he must be guarded
the more carefully, or even confined with chains.“ [9]
3.2 Other kinds of death sentences
Typical death penalty included the death penalty by
burning – crematio, which various offenses were
criminalized, the most common offense arson, which was a
clear example for consideration of the death penalty,
which carries the principle of "an eye for an eye, a tooth
for a tooth" in itself.
Another death penalty was for instance the dropping out of
the rock sentence. The case of Maria Sexta, the largest
Hispanic rich man, was guilty of incest with his daughter,
and for this reason he was punished by the dropping of
Tarpej rocks. Emperor Tiberius, who sentenced him then
kept the gold and silver mines for himself, even though the
state confiscated them formally. He wanted to show the
people that his great fortune actually destroyed him and
brought him such a disaster and death. [10]
The procedure in case of application of the death penalty
by hanging or decapitation, which was also relatively
frequent death penalty, was very interesting. In some
cases, as a warning for people there used to hang a head on
the wall or on rounds. In Roman history we meet with
cases of committing a crime of terror for which this
penalty was imposed, the execution took place in front of
the people, the execution of the offender to become his
head and subjecting it to the place of execution, on top of a
column or wall, as a warning to others. [11]
The group of death sentences awarded in Roman law is
closed by – enforcement of the sentence in the form of
crucifixion, the burial alive, stoning, thrown to wild
animals in the circus or conviction for wrestling in the
gladiator school.
4. The punishment of exile or keeping on a desert
island
The history is quite often applied expulsion, banishment
(exile) or kept in an abandoned area or desert island as a
punishment, too, which was enshrined in the Digests. [12]
Although it was not a typical death penalty and can be
classified as liberty penalties, its connection with the ban
on burial in their homeland under Roman law makes it
different from other criminal records. Under this
punishment the offender was punished not only alive, but
even after death. The lawyer Macianus wrote in Digests,
the one who was sentenced to deportation to the island or
elsewhere, was also convicted of post-mortem, which
meant that the sentence of convicted continued after his
death, because the possibility of burial of his remains in
the country was subject to the approval of the monarch.
This was for a convicted perhaps the worst punishment,
along with the notion that not only spends his life in exile,
but even in death he will not be able to return to his
homeland. In Roman law, the horrible manifestation of
inhumanity was when someone could not be properly
buried with all the funeral ceremony. In regard to this
punishment the case of a woman Lollie Pauline is known,
who was, as reported by sources, sentenced penalty of
banishment, without the possibility of burial in her
homeland. Thus, she not only had to spend all her life in
exile, but even after her death her remains could not be
brought into her country. An act that was committed and
the punishment that it missed was the temerity to compete
for the marriage of the emperor Claudius with another
woman, Agrippina. Lollia was portended by an astrologer
and magician the marriage with the Emperor himself.
Comparative European Research CER 2016 (issue I.)
186

Agrippina, who became the wife of the Emperor Claudius,
the proceedings of Lollie did not like and persuaded the
emperor to get her cast into exile. Her sentence was
eventually seizure of all assets, expelled from Italy and
following it was sent to the tribunal which it had to catch
up to death. A few years after the death of Lollie, Emperor
Nero allowed to import her ashes from exile and carried
out the appropriate funeral rites. [13]
This punishment was also covered in Cornelius Act of
assassins and those who served poisons, their deportation
to the island coupled with confiscation of all property. [14]
5. Conclusions From the origins of Rome to the Justinian codification we
can see quite a significant development in the field of
criminal law. By applying a "criminal policy" at homeland,
through the creation of public authority prosecuted
offenses defined to a wide range of penalties. Punishment
in Roman law had several meanings, but unlike the current
humanizing punishment was in ancient Rome, especially
the element of retaliation, which resulted in many cases of
favouring the death penalty from the penalty on the liberty
or property crimes. The Influence of Roman law on
legislation, whether in criminal or other areas, can also be
seen today. It was the famous Roman jurists like Ulpian,
Marcian, and Paul, who through their multiple fragments
enshrined still applied principles that built the basis for
criminal proceedings.
References
[1] Inst. 4, 18.
[2] Ulp. D. 48, 19, 6.
[3] BARTOŠEK, M. Dějiny římského práva. Praha:
Academia, 1995, p. 105.
[4] Op. cit. BARTOŠEK, M. p. 141.
[5] Atti dei Martiri – a cura di Salvatore Di Meglio.
Miláno: Arnoldo Mondadori Editore S.p.A., 1989. p. 206.
[6] CICERO, M. T. Pro Publi Quinctio: Pro Sexto Roscio
Amerino; Pro Quincto Roscio Comoedo, De lege agraria
I, II, III. Cambridge: Harward University Press, 1930.
p. 184.
[7] Mod. D. 48, 9, 9.
[8] Marci. D. 48, 9, 1.
[9] Mod. D. 48, 9, 9.
[10] Op. cit. TACITUS, P. C. p. 242.
[11] http://www.pinomiscione.it/historica/vita/prime-tom be/
[12] Marci. D. 48, 24, 2.
[13] TACITUS, P. C. Agricola. Anály. Germánia.
Histórie. Bratislava: Tatran, 1980. p. 244.
[14] Marci. D. 48, 8, 3.
Comparative European Research CER 2016 (issue I.)
187

DEFINITION OF THEFT IN THE ROMAN LAW AND IN ACTUAL LEGAL SYSTEM OF LAW OF
SLOVAK REPUBLIC
Kamila Kočišová
Pavol Jozef Šafárik University in Košice
Kováčska 26, P.O.BOX A-45
Košice, 040 75, Slovak republic
+421915943214
Abstract: Theft is one of the oldest unlawful acts committed by human beings. In particular stages of evolution the society and
legal system of law, understanding and interpretation of individual wrongful acts including the theft changes, and not just their
legal qualifying, process of punishment, but also their classification as public wrongs or, on the other side, as civil wrongs.
The prefatory part of this paper is dedicated to general differences between the terms crimina publica and delicta privata. The
aim of this paper is to point out to defining the theft in the roman classic law and Justinian roman law, where the furtum was
belonging under delicta privata and consequently to definition of the body of theft in actual legal system of law of Slovak
republic, that defines theft as a criminal offence. In contrast to roman law, theft as the criminal offence has public nature.
Keywords: furtum, theft, Roman law, delicts, Criminal Code
1. Introduction
The Roman Empire as a political organization passed away
centuries ago, but Roman jurisprudence through its
influence still remains a world power. In its modernized
form Roman Law has become the law of more than three-
fourths of the civilized globe, and Gibbon’s words written
in the eighteenth century: „the laws of Justinian still
command the respect or obedience of independent
nations“. [7]
The term furtum - theft derives from the word furvus, that
means dark, for the reason that realization of such act is
coming up in secret and in furtiveness and very often at
night or from the word fraus, despicable action, or from
the word ferre, take away, in the sense as illegal take
away, or from the Greek, where fures, thieves, are being
called phores.
2. Explanation of the terms crimina publica and delicta
privata
Crimina publica in Roman law were wrongs against the
state or community as a whole and were prosecuted before
public tribunal. On the other side, delicta privata were
wrongs against private individuals and gave rise to suits
for penalties or damages. The boundary between these
two groups of wrongful acts was not changeless and was
moving in successive steps. The idea of public wrongs or
crimes was slow in developing, however, and the long
prevailing theory as to the proper method of dealing with
wrongs was that the individual who had suffered a wrong
should pursue his own remedy by a civil action. The
growing needs of society demanded more adequate and
satisfactory remedies for the suppression of great wrongs.
Some acts belonging under the category delicta were later
considered to be dangerous insomuch that they were
reclassified to the category of public wrongs – for example
robbery, as well as some serious cases of iniuria. The
difference between delicta privata and crimina publica
was also in the sphere of process of punishment these acts.
At the beginning of punishing the delicts was at first
allowed self-help, later just established actions. In the
centre of attention there is an injured party, to whom the
damage was incurred, or injustice and that is why he is
interested and demands punishment for the offender.
At the beginning punishment was determined by injured
party; with fixation of actions also comes defined
establishment of punishments that injured party could
demand. In the case of acts classified as crimina is the
sanction of the offender realized by reason of interest of
the state and society of his punishment.
3. Lex XII. tabularum
The basis of roman public and private law became Lex XII.
tabularum (r. 449 B.C.), that arised out of writing up
(codification) of common law. Until this time the law had
sacral nature and its interpreters and advisers were
pontificates. Lex XII. tabularum has two sources. Roman
tradition, law of patricians and pontificates and Greek
codifications of law. It was the first and for the long period
the only one listing of roman law. Lex XII. tabularum has
never been abrogated, formally was valid until time of
Justinian and we can find references to Lex XII. tabularum
also in Digests and later comments to roman law.
Lex XII. tabularum contains also provisions of criminal
law. As the most important public wrongs according Lex
XII. tabularum were considered these: high treason,
murder of free citizen, fire raising, theft of harvest, false
testimony, public affront, as well as practising sorcery of
any kind connected with malicious intent to harm
somebody. Punishment did not have to be adequate to
wrongdoing but had strong character of revenge with
intimidating effect. Wrongful act aimed contra state and
social structure, prosecuted according to the law by public
action was the crime (crimen). Delictum was wrongful act,
harm to individual person, his or her family or property by
violating the command or prohibition. Delict has private
nature, so the offender was prosecuted by injured party
with an action. Roman criminal law had from the
Comparative European Research CER 2016 (issue I.)
188

beginning mixed, assorted character, i.e. as public as
private character.
Plínius describes another provision of Lex XII. tabularum.
This provision is about adult who grazed livestock at night
on a foreign fundus or chopped the crop plants gained by
ploughing. Such offender did not compensate the damage
but he was sacrificed to goddess Cera. Theft of the
agricultural products was punished essentially harder that
theft of anything other - the punishment for “ordinary”
theft was the fine. On the other side, punishment for the
theft of corn and slaves was the death sentence. Such theft
has signs of sacral crime. Injured party did not have a right
to private revenge. This revenge belonged to divinity.
4. Classic Roman law
In classic roman law the bases was the definition of furtum
in such way, as was defined by the jurist Paulus: „Furtum
est contrectatio rei fraudulosa lucri faciendi gratia vel
ipsius rei vel etiamusus eius possessionisve“, that could be
freely translated as follows – theft is the fraudulent
interference with a foreign thing, whether with the thing
itself or the use or possession of it, with a view to gain.
Compared to modern public law, classic roman law and its
understanding the extent and content of furtum differs in
several matters, for example - according to roman jurists,
if somebody used or misused a thing belonging to other
person otherwise than in agreed (maybe also in exerted)
way, such person committed the theft. Institutes, whose
author is Gaius, mention [3] as examples the situations, in
which borrower, bailee or lien creditor used borrowed
things other that it was agreed in advance. Another
cardinal difference consisted in the fact that in roman law
the theft of possession was also considered as furtum. [4]
Equally important difference is the fact that furtum in so
manner, as was understood in roman law, included also (in
modern criminal law separate bodies of criminal offences)
embezzlement and fraud.
Objective assumption of the theft is particularly capable
object. [12] Furtum can be committed solely on moveable
things or on free persons that are under potestas of other
person. [8] In the matter of moveable things, it is assumed
that particular thing is in private property. Res nullius,
especially res derelict cannot be object of the theft. Also, it
is not possible to commit theft on res divini iuris and
things belonging to state, but wilful wrongful
appropriation of these things is prosecuted ex offo as
sacrilegium, as far as concerns divine property, or as
peculatus, as far as concerns stealing the state property. [9]
Subjective assumption of the theft was dolus – animus
furandi (an intent to commit the theft). So, theft at this
stage cannot be committed by negligence, and not even in
the case that thief mistakenly supposes that the thing he is
stealing belongs to other person. Subjective conceptual
sign is also intent to richen (lucri faciendi gratia), on the
other side, driving motive is not important.
Another objective assumption of the theft was contrectatio
rei that means the real impact to the, real handling of it,
only intention to commit the theft was not sufficient –
animus furandi needs to be manifested outwards by certain
actions.
4.1 Furtum manifestum and furtum nec manifestum
Manifest thief is not just the one that is caught up at the
place where the theft was committed, for example as thief
who steals in the house but has not leaved outside yet and
is caught. Furtum manifestum is also a case when the thief
together with stolen thing is still situated in public place,
or on private land of the owner, or was seen and caught in
the other place, before he left the place where the thing
was stolen and did not bring it to the safe place. Manifest
thief is not the one that brought the thing to the in planned
place even if such thief was caught with stolen thing – this
is the case of furtum nec manifestum. [10]
4.2. Furtum conceptum and furtum prohibitum
Furtum conceptum was the discovery of stolen goods in
another’s house after a search therein by the owner of the
goods. In case stolen property was thus sought and found,
the owner of the house, although not the actual thief, was
liable as a receiver of stolen goods. [11]
This ancient right of the owner of stolen goods to
prosecute a search within the house of a suspected person
was, doubtless, connected with the owner’s right to
question any person suspected of having possession of the
property. [13]
If the occupier of the house prevented the owner of the
stolen property from making his search (furtum
prohibitum), he became liable to an action (actio furti
prohibiti) given by the praetor involving a penalty of
fourhold the value of the thing stolen. [5]
4.3. Furtum oblatum
Furtum oblatum consisted in giving stolen property to an
innocent person, or in placing it in his house, in order that
he might be thought to be the thief. The person who was
thus imposed upon had an action known as actio furti
oblati, carrying a threefold penalty against the wrongdoer
whether he was the actual thief or not. [6] After the
Institutes of Justinian was published, actio furti oblati
became obsolete and the person guilty of furtum oblatum
was punishable for furtum nec manifestum. [11].
5. Corpus Iuris Civilis
The compilation of what was adjudged to be all the ten
existing law was the most important event in the history of
the law of the Roman people. This great work consisted
originally of three parts – the Digest (Pandect), the
Institutes and the Code. The Digest was a comprehensive
collection of extracts from the writings of the accepted
legal authorities from the time of the Emperor Trajan to
that of Constantine. The Institutes was elementary book
for those beginning the study of the law. The Code was a
transcript of imperial laws still recognized as in force.
According to the Institutes of Justinian, all obligations
connected with delicts arise from the fact of some
wrongful act (ex ipso maleficio), such as furtum (theft),
rapina (robbery), damnum (damage), or iniuria (injury).
Furtum, or theft, is defined in the Institutes as follows:
Furtum est ontre tatio rei rau ulosa vel ipsius rei vel
etiam usus eius possessionisve quod lege naturali
prohibitum est admittere Furtum autem vel a urvo, i
Comparative European Research CER 2016 (issue I.)
189

est ni ro, i tum est, uo lam et o s ure it et plerum ue
no te vel a rau e vel a eren o, i est au eren o vel a
rae o sermone, ui appellant ures immo etiam re i
o dixerunt [10] - as the unlawful
appropriation of property either in its entirety, or merely
for the purpose of making use of it, or of getting
possession of it. Paulus, in the Digest, adds words lucri
faciendi gratia (for the sake of gain). Words lucri faciendi
gratia were not limited in meaning to pecuniary profit, but
included any kind of advantage, gain or satisfaction, even
the mere malicious pleasure of the owner’s loss.
Furtum is ergo wrongful act, when the thief appropriates
specific moveable thing or also a person under potestas of
another, without permission to such handling with this
thing. Such an act is committed consciously with intent to
richen. According to such determination of the conception
of furtum two conceptual attributes of theft can be
deducted: animus furandi et contrectatio rei.
6. Definition of theft in the Act 300/2005 Coll. Criminal
Code as amended
The criminal protection of proprietary rights, regardless of
the kind and form of property, ensures Criminal Code
especially in its part two – special part, chapter four –
offences against the right of property. In this chapter four
we can find criminal offences that have the only one or the
primary object of the criminal offence and this object is
property right or rights related to property right. That is the
reason of categorisation the criminal offence of theft to the
chapter four of the special part of Criminal Code,
concretely in § 212.
Paragraph 1 and 2 of § 212 have following wording:
(1) Any person who appropriates a thing belonging to
other by seizing it and thus causes small damage shall be
liable to a term of imprisonment of up to two years.
(2) The same sentence as referred to in paragraph 1 shall
be imposed on the offender who appropriates a thing
belonging to other by seizing it, and
a) commits the offence by housebreaking,
b) immediately after the commission of the offence he
attempts to keep possession of the thing by violence or the
threat of imminent violence,
c) commits such offence on a thing that another person has
on him or with him,
d) such thing is from the harvest from a land belonging to
the agricultural land fund, or wood from a land belonging
to the forest land fund, or fish from the pond under intense
rearing conditions,
e) commits the offence on a thing whose collection is
subject to payment under a separate regulation, or
f) has been sanctioned for such offence in the past twelve
months. [1]
From above mentioned body of the theft it is possible to
deduce elements of the body of this criminal offence –
object, objective aspects, subject and subjective aspects.
Object of the theft according to Criminal Code are
proprietary rights or rights related to proprietary right.
Objective aspects consist in attacks to property of other
foreign person described in the wording of § 212. Subject
of this criminal offence is universal and is expressed by the
word “who”. Offender is defined in § 19 of the Criminal
Code as follows: An offender of a criminal offence is the
person who committed criminal offence acting on his own.
Only a natural person may be considered as the offender of
a criminal offence. Compulsory attribute of subjective
aspect is intentional causation.
7. Conclusions
Defining the theft, its attributes and body of this wrongful
act has come through radical progress since the classic
roman law until present days. The most cardinal first step
in this development was tendency to incorporate furtum
into public wrongs, formal external expression of what
was incorporation of furtum do 47. book of Digest, that
was, together with 48. book, labelled as books dedicated to
criminal – public law, i.e. libri terribiles.
Particular conceptual attributes of theft depended always
on actual social situation and reflected priorities that were
protected by society.
Roman concept of furtum was broader in scope than the
modern concept of theft. It encompassed not only the
actual removal of another’s thing but also a diversity of
acts involving intentional interference with a movable
object without the knowledge of, or contrary to an
agreement with, the owner of such object.
According to current criminal code of Slovak republic also
co-owner may commit the criminal offence of theft if he
appropriates a thing that is in his divided co-ownership,
with intention to dispose with it as with his own. The other
cases of theft as were defined in roman law, are in actual
criminal code incorporated as separate bodies of the
criminal offences - § 213 – Embezzlement - Any person
who takes possession of property of another that has been
entrusted to him, thus causing small damage to the
property belonging to another, shall be liable to a term of
imprisonment of up to two years; § 215 - Unlawful
enjoyment of a thing of another - Any person who
appropriates a thing of small value belonging to another
with the intention to temporarily use it, or who, without
authorization, temporarily uses a thing that has been
entrusted to him and thus causes small damage to the
property of another, shall be liable to a term of
imprisonment of up to one year; § 221 – Fraud - Any
person who enriches himself or other to the detriment of
another person’s property through misrepresentation of
another person or through taking advantage of another
person’s mistake, and thus causes small damage to the
property of another, shall be liable to a term of
imprisonment of up to two years. [2]
References
[1] Act no. 300/2005 Coll. Criminal Code as amended, §
212
[2] Act no. 300/2005 Coll. Criminal Code as amended, §
213, § 215 and § 221
[3] Gai Inst. 3, 195-196; Paul. D 47,2,40 a D 47,2,83
[4] Gai Inst. 2, 199-200
[5] Gaius 3,102
[6] Gaius, 3, 187
Comparative European Research CER 2016 (issue I.)
190

[7] Gibbon, E.: The History of the Decline and Fall of the
Roman Empire, Oxford, 1821, p. 359
[8] Heyrovský L., Dějiny a systém soukromého práva
římského, Vydanie siedme, Svazek 25 Bratislava 1929, p.
304
[9] Heyrovský L., Dějiny a systém soukromého práva
římského, Vydanie štvrté, Kníhkupec C.K. České
univerzity J. Otto v Prahe, 1910, p. 780-781
[10] Inst. 4,1
[11] Inst. 4,1, 4
[12] Kincl, K., Urfus, V., Skřejpek, M.: Římske právo 1.
Vydání, Praha: C.H.Beck, 1995 p. 262
[13] Paulus, Sent. 2,31,22, Plaut. Poen. i. 1, 51f
Comparative European Research CER 2016 (issue I.)
191

Index of Author(s)
Bajnarová, Marie Bališová, Jana Benakova, Martina Bock, Michal Bott Domonkos, Lívia Brodawka, Magdalena Brożek, Katarzyna Burket, Josef Cintulová Ludvigh, Lucia Derguti, Agim Ducaiova, Zuzana Eliáš, Pavol Erharter, Markus Fuchsová, Mária Glinkowska, Beata Gubová, Klaudia Hakszer, Richard Harangozo, Ľuboš Hlaváč, Zdeněk Hrubý, Petr Ječmen, Petr Juhásová, Andrea Kaduchová, Petra Kmecová, Darina Kočišová, Kamila Kopernická, Miriama Kopernická, Tatiana Kozubik, Michal Liškutín, Tomáš Łuszcz, Małgorzata Anna Mariničová, Patrícia
Martáková Styblíková, Jana Matuszková, Radka Mehedinţu, Gabriela Michelberger, Knut Nazarova, Jekaterina Nouzovský, Luboš Novák, Jan Odraska, Lukas Odraskova, Barbora Parvi, Rafał Pawera, René Pieniążek-Niemczuk, Elżbieta Qekaj-Thaqi, Afërdita Radimský, Michal Reschreiter, Rebecca Richnák, Patrik Sabo, Rastislav Satrapa, Pavel Skoruks, Dmitrijs Stawska, Joanna Stocker, Bernhard Šenfelde, Maija Švarcová, Kateřina Tichý, Jaromír Tóth, Tomáš Tuma, Jiri Vido, Ján Złotogórska, Agata Židková, Pavla
Comparative European Research CER 2016 (issue I.)
192

Proceedings | Research Track
Copyright © 2016 CER Comparative European Research and the Authors. Published in November, 2016 by Sciemcee Publishing, London. Proceedings document published in collaboration with SCIEMCEE - Scientific Conference Platform. The proceedings with all papers are available at www.sciemcee.org. ISBN 978-0-9928772-9-3
9 780992 877293
Top Related
Copyright © 2022 FDOKUMEN

