


Bahasa
Halaman
Hukum


RESULTS - THE VIET NAM POPULATION AND HOUSING CENSUS OF 00:00 HOURS ON 1 APRIL 2019 / 3 RESULTS - THE VIET NAM POPULATION AND HOUSING CENSUS OF 00:00 HOURS ON 1 APRIL 2019 | 3
FOREWORD
The 2019 Population and Housing Census was implemented at time-point 00:00 on 1 April 2019 in accordance with Decision No. 772/QD-TTg from the Prime Minister dated 26 June 2018. This is the fifth Population and Housing Census in Viet Nam since the country's reunification in 1975. The 2019 Population and Housing Census collected basic information on population and housing throughout the territory of the Socialist Republic of Viet Nam to inform socio-economic development policies and to monitor the Government of Viet Nam’s progress toward the Sustainable Development Goals it committed to.
The 2019 Population and Housing Census collected basic information on population and demographics from over 96.2 million usual residents in nearly 26.9 million households in the territory of Viet Nam at time-point 00:00 on 1 April 2019. The survey was conducted among a sample size of 9% of households nationwide (approximately 8.2 million people living in more than 2.3 million households) to supplement and assess demographic changes in fertility, mortality and migration as well as gather information on labor and employment, and household living conditions. The application of information technology in all phases of the Census, as opposed to using traditional data collection methods, was designed to improve information quality, increase statistical transparency, shorten the time required for data publication, and to save resources.
The preliminary results of the 2019 Population and Housing Census were published on 11 July 2019, just over two months after the completion of the enumeration fieldwork. The final results were summarized and published as “Results - the Viet Nam Population and Housing Census of 00:00 hours on 1 April 2019”. This publication presents the process of preparing and organizing data collection together with the Census results, consisting of three main parts as follows:
Part I: Design and implementation of the 2019 Population and Housing Census. This part includes three chapters on the Census design, implementation, assessment and appraisal of the Census results and lessons learned.
Part II: Key findings. This includes seven chapters covering population size and structure, fertility, mortality, migration and urbanization, education and training, labor and employment, housing and living conditions of households.
Part III: Data tables. This part presents a system of tables summarized from the results of the completed survey and the sample survey.
The publication summarizes the results from the 2019 Population and Housing Census data. A comparison of figures from 1979 to 2009 with the 2019 Population and Housing Census are
4 / RESULTS - THE VIET NAM POPULATION AND HOUSING CENSUS OF 00:00 HOURS ON 1 APRIL 2019 4 | RESULTS - THE VIET NAM POPULATION AND HOUSING CENSUS OF 00:00 HOURS ON 1 APRIL 2019
referenced from publications of the Population and Housing Census results in the respective years. Other data are cited as reference sources in each part of the publication.
The publication “Results - the Viet Nam Population and Housing Census of 00:00 hours on 1 April 2019” was prepared by the Central Census Steering Committee in coordination with localities and with technical assistance from the United Nations Population Fund (UNFPA) and comments from national and international experts. The Central Census Steering Committee highly appreciates the cooperation and support from UNFPA during the implementation of the 2019 Population and Housing Census and particularly during the compilation of the publication. The committee also sincerely thanks the experts who contributed their knowledge and expertise during the preparation of this publication.
The publication was compiled shortly after the completion of enumeration fieldwork. Thus, shortcomings and limitations are unavoidable, especially for in-depth data use requirements. We look forward to receiving constructive comments to enable improvement in future upcoming publications of the 2019 Population and Housing Census.
CENTRAL POPULATION AND HOUSING CENSUS STEERING COMMITTEE
RESULTS - THE VIET NAM POPULATION AND HOUSING CENSUS OF 00:00 HOURS ON 1 APRIL 2019 / 5 RESULTS - THE VIET NAM POPULATION AND HOUSING CENSUS OF 00:00 HOURS ON 1 APRIL 2019 | 5
TABLE OF CONTENTS
Page
Foreword 3
Acronym list 11
PART I. DESIGN AND IMPLEMENTATION OF THE 2019 POPULATION AND HOUSING CENSUS 19
CHAPTER 1: CENSUS DESIGN 21 1.1. General introduction to the Population and Housing Census in Viet Nam 21
1.2. Preparatory work for the 2019 Population and Housing Census 23
1.3. Survey sample design 28
1.4. Initial information to server the 2019 Census 31
CHAPTER 2: IMPLEMENTATION OF THE 2019 CENSUS 34 2.1. Direction and coordination in preparing and organizing the 2019 Census 34
2.2. Communications 35
2.3. Data collection and survey supervision 36
2.4. Data monitoring, verifying, processing, and analyzing 38
CHAPTER 3: ASSESSMENT AND APPRAISAL OF THE CENSUS RESULTS, AND LESSONS LEARNED 41 3.1. Assessment and appraisal of the 2019 Census results 41
3.2. Lessons learned 45
PART II. KEY FINDINGS 51
CHAPTER 4: POPULATION SIZE AND STRUCTURE 53 4.1. Population size 53
4.2. Population density 55
4.3. Household size 55
4.4. Sex ratio 57
4.5. Population distribution 59
4.6. Population structure by age group and sex 61
4.7. Birth registration for children under 5 years old 65
4.8. Marriage 66
4.9. Disability 70
CHAPTER 5: FERTILITY 75 5.1. Total fertility rate 75
5.2. Age-specific fertility rates 81
5.3. Adolescent childbearing 83
6 / RESULTS - THE VIET NAM POPULATION AND HOUSING CENSUS OF 00:00 HOURS ON 1 APRIL 2019 6 | RESULTS - THE VIET NAM POPULATION AND HOUSING CENSUS OF 00:00 HOURS ON 1 APRIL 2019
5.4. Crude birth rate 84
5.5. Sex ratio at birth 85
CHAPTER 6: MORTALITY 88
6.1. Crude death rate 88
6.2. Infant mortality rate 90
6.3. Under-five mortality rate 91
6.4. Maternal mortality ratio 92
6.5. Cause of death 93
6.6. Life expectancy 95
CHAPTER 7: MIGRATION AND URBANIZATION 99
7.1. Level of migration by administrative levels 100
7.2. Basic migrant characteristics 107
7.3. Urbanization and the impact of migration on urbanization 113
CHAPTER 8: EDUCATION AND TRAINING 117
8.1. Gross school enrollment rate and net school enrollment rate 117
8.2. Out-of-school children 119
8.3. Literacy situation 121
8.4. Highest education attainment 123
8.5. Mean years of schooling and expected years of schooling 126
CHAPTER 9: LABOR AND EMPLOYMENT 129
9.1. Labor force 129
9.2. Employment 135
9.3. Unemployment 141
CHAPTER 10: HOUSING AND LIVING CONDITIONS 145
10.1. Housing ownership status 145
10.2. Housing classification 146
10.3. Accommodation and living conditions 151
PART III. DATA TABLES 155Table 1. Population by urban, rural, sex, socio-economic region and province, city, 1 April 2019 157
Table 2. Population by ethnic, urban, rural and sex, 1 April 2019 160
Table 3. Population by religion, urban, rural and sex, 1 April 2019 162
Table 4. Population by age group, urban, rural, sex and province, city, 1 April 2019 163
RESULTS - THE VIET NAM POPULATION AND HOUSING CENSUS OF 00:00 HOURS ON 1 APRIL 2019 / 7 RESULTS - THE VIET NAM POPULATION AND HOUSING CENSUS OF 00:00 HOURS ON 1 APRIL 2019 | 7
Table 5. Population by age group, sex, ethnic, urban, rural, socio-economic region and province, city, 1 April 2019 195
Table 6. Average population growth rate, population density by socio-economic region and province, city 201
Table 7. Number of households by urban, rural, socio-economic region and province, city, 1 April 2019 203
Table 8. Number of households by household size, urban, rural, socio-economic region and province, city, 1 April 2019 205
Table 9. Sex ratio, aging index and proportion of population aged 0-14 years old, 15-64 years old, 65 years old and above by socio-economic region and province, city, 1 April 2019 207
Table 10. Proportion of children under 5 yeas old having birth certificate by urban, rural, sex, socio-economic region and province, city, 1 April 2019 209
Table 11. Population aged 15 years old and above by marital status, age group, sex and urban, rural, 1 April 2019 211
Table 12. Singulate mean age at marriage by sex, urban, rural, socio-economic region and province, city, 1 April 2019 213
Table 13. Proportion of women aged 20-24 years old first married before the age of 15 and before the age of 18 by ethnic, urban, rural, socio-economic region and province, city, 1 April 2019 215
Table 14. Proportion of population aged 5 years old and above without health difficulties by sex, urban, rural and province, city, 1 April 2019 218
Table 15. Disability rate of population aged 5 years old and above by urban, rural, sex, socio-economic region and province, city, 1 April 2019 220
Table 16. Proportion of women aged 10-49 by number of children ever born, age group, urban, rural and socio-economic region, 1 April 2019 222
Table 17. Proportion of women aged 10-49 years old by number of children surviving, age group, urban, rural and socio-economic region, 1 April 2019 224
Table 18. Proportion of women giving birth with health staff’s help from April 2017 to March 2019 by ethnic, urban, rural, socio-economic region and province, city, 1 April 2019 226
Table 19. Total fertility rate (TFR), crude birth rate (CBR), sex ratio at birth (SRB) in 12 months prior to the Census by urban, rural, socio-economic region and province, city 229
Table 20. Age-specific fertility rate in 12 months prior to the Census by urban, rural and socio-economic region 231
Table 21. Proportion of women aged 10-17 years old giving birth in 12 months prior to the Census by urban, rural, socio-economic region and province, city 233
Table 22. Crude death rate (CDR), infant mortality rate (IMR), under-five mortality rate (U5MR) and life expectancy at birth by sex, urban, rural, socio-economic region and province, city, 1 April 2019 235
Table 23. Proportion of deaths in 12 months prior to the Census by reason, urban, rural, socio-economic region and province, city, 1 April 2019 237
8 / RESULTS - THE VIET NAM POPULATION AND HOUSING CENSUS OF 00:00 HOURS ON 1 APRIL 2019 8 | RESULTS - THE VIET NAM POPULATION AND HOUSING CENSUS OF 00:00 HOURS ON 1 APRIL 2019
Table 24. In-migration rate, out-migration rate and net migration rate by sex, socio-economic region and province, city, 1 April 2019 239
Table 25. Proportion of population aged 5 years and above by place of usual residence 5 years prior to the Census 241
Table 26. Proportion of migration flows by socio-economic region and province, city, 1 April 2019 246
Table 27. Proportion of population aged 5 years and above by school attendance status, urban, rural, sex, socio-economic region and province, city, 1 April 2019 248
Table 28. Gross school enrollment rate, net school enrollment rate at the primary school level by sex, urban, rural, socio-economic region and province, city, 1 April 2019 250
Table 29. Gross school enrollment rate, net school enrollment rate at the lower secondary school level by sex, urban, rural, socio-economic region and province, city, 1 April 2019 252
Table 30. Gross school enrollment rate, net school enrollment rate at the upper secondary school level by sex, urban, rural, socio-economic region and province, city, 1 April 2019 254
Table 31. Proportion of out-of-school children by urban, rural, sex, socio-economic region and province, city, 1 April 2019 256
Table 32. Proportion of out-of-school children at the primary school level by urban, rural, sex, socio-economic region and province, city, 1 April 2019 258
Table 33. Proportion of out-of-school children at the lower secondary school level by urban, rural, sex, socio-economic region and province, city, 1 April 2019 260
Table 34. Proportion of out-of-school children at the upper secondary school level by urban, rural, sex, socio-economic region and province, city, 1 April 2019 262
Table 35. Proportion of population aged 15 years and above by literacy status, urban, rural, sex, socio-economic region and province, city, 1 April 2019 264
Table 36. Proportion of population aged 15 years and above by highest educational attainment, sex, urban, rural, socio-economic region and province, city, 1 April 2019 266
Table 37. Proportion of population aged 15 years and above by technical/professional qualifications, sex, urban, rural, socio-economic region and province, city, 1 April 2019 268
Table 38. Mean years of schooling, expected years of schooling by urban, rural, socio-economic region and province, city, 1 April 2019 271
Table 39. Proportion of labor force aged 15 years and above by age group, sex, urban, rural, socio-economic region and province, city, 1 April 2019 273
Table 40. Proportion of trained labor force aged 15 years and above by sex, urban, rural, socio-economic region and province, city, 1 April 2019 275
Table 41. Proportion of employed workers by occupation, economic sector, sex, socio-economic region and province, city, 1 April 2019 277
Table 42. Proportion of employed workers aged 15 years and above by highest educational attainment, urban, rural, sex, socio-economic region and province, city, 1 April 2019 279
Table 43. Proportion of employed workers aged 15 years and above by occupation, urban, rural, sex, socio-economic region and province, city, 1 April 2019 282
Table 44. Proportion of employed workers aged 15 years and above by employment status, sex, urban, rural, socio-economic region and province, city, 1 April 2019 285
RESULTS - THE VIET NAM POPULATION AND HOUSING CENSUS OF 00:00 HOURS ON 1 APRIL 2019 / 9 RESULTS - THE VIET NAM POPULATION AND HOUSING CENSUS OF 00:00 HOURS ON 1 APRIL 2019 | 9
Table 45. Unemployment rate of population aged 15 years and above by age group, sex, urban, rural, socio-economic region and province, city, 1 April 2019 287
Table 46. Unemployment rate of working age population by age group, sex, urban, rural, socio-economic region and province, city, 1 April 2019 290
Table 47. Unemployment rate of population aged 15-24 years old by urban, rural, sex, socio-economic region and province, city, 1 April 2019 293
Table 48. Number of households and proportion of households without dwelling by urban, rural, socio-economic region and province, city, 1 April 2019 296
Table 49. Proportion of households with dwellings by type of house, first year of use, urban, rural, socio-economic region and province, city, 1 April 2019 298
Table 50. Proportion of households with dwelling by number of separated bedrooms, urban, rural, socio-economic region and province, city, 1 April 2019 300
Table 51. Housing area per capita by type of house, urban, rural, socio-economic region and province, city, 1 April 2019 302
Table 52. Proportion of households with dwellings by housing area per capita, urban, rural, socio-economic region and province, city, 1 April 2019 304
Table 53. Proportion of households with dwellings by first year of use, urban, rural, socio-economic region and province, city, 1 April 2019 306
Table 54. Proportion of households with dwellings by type of ownership, first year of use, urban, rural, socio-economic region and province, city, 1 April 2019 308
Table 55. Proportion of households planning to buy a new house by urban, rural, socio-economic region and province, city, 1 April 2019 310
Table 56. Proportion of households by main fuel used for lighting, urban, rural, socio-economic region and province, city, 1 April 2019 312
Table 57. Proportion of households by main fuel used for cooking, urban, rural, socio-economic region and province, city, 1 April 2019 314
Table 58. Proportion of households by main water resource for living, urban, rural, socio-economic region and province, city, 1 April 2019 316
Table 59. Proportion of households by type of toilet facility, urban, rural, socio-economic region and province, city, 1 April 2019 319
Table 60. Proportion of households by living condition, urban, rural, socio-economic region and province, city, 1 April 2019 321
ANNEX 325
Annex 1: Questionnaire 327
Annex 2: Some definitions and concepts in the Census 351
Annex 3: Estimation methods for fertility and mortality 357
Annex 4: Detailed allocation of sample enumeration areas by urban, rural areas, provinces, cities and district 362
Annex 5: Sample errors 372
Annex 6: Publications from the 2019 Census 378

10 | RESULTS - THE VIET NAM POPULATION AND HOUSING CENSUS OF 00:00 HOURS ON 1 APRIL 2019
RESULTS - THE VIET NAM POPULATION AND HOUSING CENSUS OF 00:00 HOURS ON 1 APRIL 2019 / 11 RESULTS - THE VIET NAM POPULATION AND HOUSING CENSUS OF 00:00 HOURS ON 1 APRIL 2019 | 11
ACRONYM LIST
Symbol/acronym Explanation/Fully written
ASFR Age-Specific Fertility Rate
CAPI Computer Assisted Personal Interviews
CBR Crude Birth Rate
CDR Crude Death Rate
EA Enumeration Area
GPS Global Positioning System
GSO General Statistics Office
HDI Human Development Index
ICR Intelligent Character Recognition
IMR Infant Mortality Rate
IT Information Technology
MMR Maternal Mortality Rate
Myer Age Preference Index
PAPI Paper and Pencil Personal Interviews
SDGs Sustainable Development Goals
SMAM Singulate Mean Age at Marriage
TFR Total Fertility Rate
Census Population and Housing Census
U5MR Under 5 Mortality Rate
UNFPA United Nations Population Fund
UNI Age-sex accuracy index
V-SDGs Viet Nam Sustainable Development Goals
Whipple Age Heaping Index
Webform Online Questionnaire

12 | RESULTS - THE VIET NAM POPULATION AND HOUSING CENSUS OF 00:00 HOURS ON 1 APRIL 2019
RESULTS - THE VIET NAM POPULATION AND HOUSING CENSUS OF 00:00 HOURS ON 1 APRIL 2019 / 13
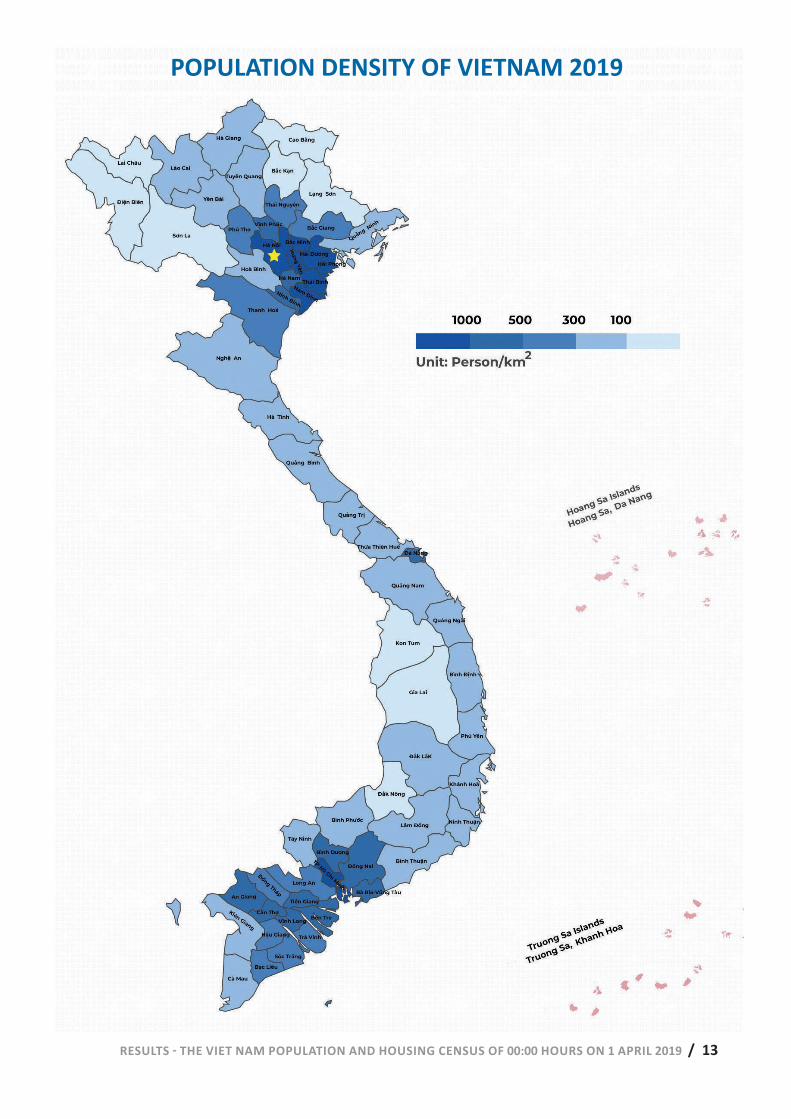
POPULATION DENSITY OF VIETNAM 2019
14 / RESULTS - THE VIET NAM POPULATION AND HOUSING CENSUS OF 00:00 HOURS ON 1 APRIL 2019
RESULTS - THE VIET NAM POPULATION AND HOUSING CENSUS OF 00:00 HOURS ON 1 APRIL 2019 / 15 RESULTS - THE VIET NAM POPULATION AND HOUSING CENSUS OF 00:00 HOURS ON 1 APRIL 2019 | 15
16 / RESULTS - THE VIET NAM POPULATION AND HOUSING CENSUS OF 00:00 HOURS ON 1 APRIL 2019
16 | RESULTS - THE VIET NAM POPULATION AND HOUSING CENSUS OF 00:00 HOURS ON 1 APRIL 2019
RESULTS - THE VIET NAM POPULATION AND HOUSING CENSUS OF 00:00 HOURS ON 1 APRIL 2019 / 17
RESULTS - THE VIET NAM POPULATION AND HOUSING CENSUS OF 00:00 HOURS ON 1 APRIL 2019 | 17

18 / RESULTS - THE VIET NAM POPULATION AND HOUSING CENSUS OF 00:00 HOURS ON 1 APRIL 2019
18 | RESULTS - THE VIET NAM POPULATION AND HOUSING CENSUS OF 00:00 HOURS ON 1 APRIL 2019

RESULTS - THE VIET NAM POPULATION AND HOUSING CENSUS OF 00:00 HOURS ON 1 APRIL 2019 / 19
RESULTS - THE VIET NAM POPULATION AND HOUSING CENSUS OF 00:00 HOURS ON 1 APRIL 2019 | 19
PART I
DESIGN AND IMPLEMENTATION OF THE 2019 POPULATION AND HOUSING CENSUS
PART IDESIGN AND IMPLEMENTATION
OF THE 2019 POPULATION AND HOUSING CENSUS
Photo: Figures and Events Journal
20 / RESULTS - THE VIET NAM POPULATION AND HOUSING CENSUS OF 00:00 HOURS ON 1 APRIL 2019
Photo: Provincial Statistics Office of Da Nang

RESULTS - THE VIET NAM POPULATION AND HOUSING CENSUS OF 00:00 HOURS ON 1 APRIL 2019 / 21 RESULTS - THE VIET NAM POPULATION AND HOUSING CENSUS OF 00:00 HOURS ON 1 APRIL 2019 | 21
CHAPTER 1: CENSUS DESIGN 1.1. General introduction to the Population and Housing Census in Viet Nam
1.1.1. History of the Population and Housing Census in Viet Nam
A population and housing census has been conducted in Viet Nam every 10 years in recent decades to provide comprehensive population information, including characteristics of the population and housing status and living conditions.
Prior to the implementation of the Population and Housing Census in Viet Nam, there were wide area population censuses and enumerations in both the North and the South. During the building of socialism in the North and the struggle to unify the nation (1954-1975), the Democratic Republic of Viet Nam implemented two population Censuses extending through the North, one in March 1960 and one in April 1974. After the end of the war and reunification in 1975, in order to serve the National Assembly elections throughout the country and to carry out the national construction cause in 1975, the General Population Enumeration in the South was conducted in early 1976.
The first population Census conducted throughout the entire territory of the Socialist Republic of Viet Nam was in October 1979. The results of this Census included basic information on the population that became the foundation for developing and implementing important decisions for the nation's development.
The second population Census in Viet Nam was in April 1989. This is considered to be the first modern population Census in Viet Nam, applying internationally accepted concepts, definitions, design methods and data processing using a sample survey and a completed survey. The sample size consisted of 5% of households across the country to provide representative estimates of provincial level indicators. The results of the 1989 Census provided many data users and stakeholders with a rich source of information on demographic trends, society and the economy.
The third population Census in Viet Nam was in April 1999. The Census was renamed the Population and Housing Census in order to fully reflect the scope of information. A number of new indicators were to the 1999 Population and Housing Census compared to 1989. The 1999 Population and Housing Census used both methods of sample surveys and completed surveys, and the sample size was 3% of households across the country to ensure representative estimates of provincial level indicators.
The fourth Population and Housing Census was in April 2009 to collect information on population and housing conditions. This Census had an even broader scope and expanded content through the application of intelligent character recognition (ICR) technology to improve accuracy and shorten data processing time compared to manual data entry. The 2009 Population and Housing Census used both methods of sample surveys and completed surveys, and the sample size was 15% of households across the country to sufficiently represent estimates of district level indicators.
22 / RESULTS - THE VIET NAM POPULATION AND HOUSING CENSUS OF 00:00 HOURS ON 1 APRIL 2019 22 | RESULTS - THE VIET NAM POPULATION AND HOUSING CENSUS OF 00:00 HOURS ON 1 APRIL 2019
The fifth Population and Housing Census was in April 2019. This was the first Census to apply information technology in all phases of the Census. In particular, this Census used two interview methods simultaneously. The first was conducting face-to-face interviews while completing the electronic questionnaire assisted by tablets and smart phones (also known as Computer Assisted Personal Interviews - CAPI) and to complete the paper questionnaire (also called Paper and Pencil Personal Interviews - PAPI). The second method involved householder self-enumeration of data using an online electronic form (also called a Webform). This was one of the breakthrough strategies of the 2019 Census, and the first time that the General Statistics Office applied CAPI and Webform in a large-scale Census. This improvement brought practical benefits for data quality by increasing transparency and coherence of the statistical information production process, shortening the time required to publish the results of the Census and reducing the amount of resources needed for statistical surveys. Further, it ensured the Census process was aligned with global survey trends. As a result, after just two months of enumeration fieldwork, data was finalized and compiled for inclusion in the Census results report for use in operational and management processes at both central and local levels.
The 2019 Population and Housing Census used both methods of sample surveys and completed surveys, and the sample size was 9% of households across the country-sufficiently representative to estimate district level indicators. As the standing agency to carry out the Census, the General Statistics Office received the “excellent state agency in digital transformation” award from the Viet Nam Digital Communications Association on 6 September 2019 to honor their contribution to digital technology development, digital transformation and national digital economic development.
1.1.2. Subjects and contents of the Population and Housing Census
The defined reference point for all survey respondents in the five Population and Housing Censuses conducted in Viet Nam from 1979 to 2019, was: Vietnamese citizen regularly residing in the territory of the Socialist Republic of Viet Nam; Vietnamese citizens given permission by the authorities to travel overseas within the authorized period; deaths (members of the household) that occurred between the first day of the Lunar Year to 31 March of the Solar Year during the year the census was conducted and; residential housing of the population (from the second Census in 1989 to present).
The key indicator of the Population and Housing Census in Viet Nam - as is the case in other countries in the world - is a population count, but it also goes beyond to collect information on population characteristics and the quality of household dwelling and living conditions. The indicators are analyzed and prepared with the following basic requirements in mind: ensuring comparability with the previous Population and Housing Censuses; meeting the information requirements to inform socio-economic development strategies from 2021-2030; complying with the socio-economic development plan from 2021-2025; and providing data to monitor the progress toward Viet Nam’s Sustainable Development Goals (V-SDGs). The key indicators of the 2019 Population and Housing Census consisted of 10 information groups, as follows:
RESULTS - THE VIET NAM POPULATION AND HOUSING CENSUS OF 00:00 HOURS ON 1 APRIL 2019 / 23 RESULTS - THE VIET NAM POPULATION AND HOUSING CENSUS OF 00:00 HOURS ON 1 APRIL 2019 | 23
- General population information;
- Fertility rate, mortality rate, and population growth;
- Level of education and training attainment;
- Disability status;
- Marital status;
- Migration status;
- Birth certificate registration status for children;
- Labor and employment status;
- Current dwelling status; and
- Household living conditions.
1.2. Preparatory work for the 2019 Population and Housing Census
Pursuant to the Statistics Law and Law on Housing of Viet Nam, the Minister of Planning and Investment submitted documents to the Prime Minister directing the implementation of the 2019 Population and Housing Census. Decision No. 772/QD-TTg dated 26 June 2018 from the Prime Minister regarding the organization of the Population and Housing Census (hereinafter shortly named the Census) in 2019 laid an important legal basis for developing the Census Plan, implementing preparatory work and organizing data collection. The 2019 Census Plan was issued in accordance with Decision No 01/QD-BCDTW dated 15 August 2018 to ensure work was properly aligned with the schedule and specified content.
1.2.1. Improvement of organization and implementation system for the 2019 Census
Decision No. 772/QD-TTg dated 26 June 2018 from the Prime Minister on organizing the Census in 2019 defined the Central Steering Committee on the Population and Housing Census as comprised of 15 members, Vice Prime Minister Vuong Dinh Hue as the Chairman of Committee; Mr. Nguyen Chi Dung, Minister of Planning and Investment as Standing Vice Chairman of Committee; Mr. Nguyen Bich Lam, Director General of the General Statistics Office as Vice Chairman of Committee; and 12 representatives from Leadership of Ministries, ministerial equivalent agencies as members. The Central Steering Committee issued the Decision for establishing the Office of the Central Steering Committee to assist the Central Steering Committee to implement the 2019 Census. The Office of the Central Steering Committee consisted of 26 members representing units within the Ministry of Planning and Investment (General Statistics Office) and ministries and ministerial equivalent agencies related to the organization and implementation of the Census.
The 2019 Census Project was issued in accordance with Decision No. 01/QD-BCDTW dated 15 August 2018 from the Chairman of Central Steering Committee and defined the establishment of Steering Committees at provincial, district and commune levels. The Provincial and District Steering Committees set up corresponding offices to assist with directing and implementing the Census in designated localities.
24 / RESULTS - THE VIET NAM POPULATION AND HOUSING CENSUS OF 00:00 HOURS ON 1 APRIL 2019 24 | RESULTS - THE VIET NAM POPULATION AND HOUSING CENSUS OF 00:00 HOURS ON 1 APRIL 2019
For the 2019 Census, the Ministry of National Defense, the Ministry of Public Security and the Ministry of Foreign Affairs implemented their specific plans for surveying the population within the designation of these ministries and in line with the assignment of the Central Steering Committee. In conjunction, the Ministry of Public Security assumed responsibility for guaranteeing Census safety nationwide. The Ministry of National Defense, Ministry of Public Security and Ministry of Foreign Affairs set up their own Steering Committees on the Census to fulfill their designated tasks.
1.2.2. Pilot survey and rehearsal survey
In order to study and comprehensively apply the advantages of information technology and to innovate processes and resulting data, the 2019 Census conducted four pilot surveys and one rehearsal survey in 2017 and 2018.
The first pilot survey was conducted in 20171 in four provinces, Yen Bai, Thanh Hoa, Binh Dinh and Ca Mau to test the feasibility of computer-assisted personal interviews (CAPI), the survey management process, and the application of information technology as well as to identify information to be collected. This pilot tested the adaptive level of the survey personnel when moving from pen and pencil personal interviews (PAPI) to CAPI with the provided equipment. The connection between CAPI and the Census information system (the Census Operational Website) for synchronizing, finalizing, and validating data was not piloted during this first survey.
The second pilot survey2 was held in March 2018 in Ha Noi and Ha Giang to test CAPI software, the operational web portal, and the adaptability of the system while high volumes of simultaneous use on personal mobile devices. The pilot also tested information for new indicators. In the second pilot survey, all households in the selected communes and wards were interviewed simultaneously to test the capacity of the information technology infrastructure. The pilot provided evidence on feasibility of using enumerator personal mobile devices for the 2019 Census. The pilot survey was conducted in two areas with significant different access to information technology and provided important results that formed the basis for the Central Census Steering Committee encouraging the use of CAPI in the 2019 Census. In addition, the second pilot survey tested the Webform format of self-filling data by households in both of the pilot localities. Due to the small number of households registering for Webforms, the results of the pilot survey were not sufficient to confirm the value added from the use of Webforms, nor were there lessons to be further considered in the design and implementation of Webforms.
The third pilot survey3 was held in May 2018 at a high-quality apartment building in Ha Noi to test the survey method of Webforms. The results showed that, although the Webform registration and completion rates were higher than the second pilot survey, there were still a number of issues to be rectified in the design and implementation of the Census, especially regarding the quality of information provided.
1 According to Decision No. 1160/QD-TCTK dated 2 August 2017 from the Director General of the General Statistics Office, the
2017 pilot surveys were conducted in two phases: phase I in September 2017 in Binh Dinh and Ca Mau provinces; and phase II in October 2017 in Yen Bai and Thanh Hoa provinces. Each province had four enumeration areas in four communes/wards of two districts.
2 According to Decision No. 66/QD-TCTK dated 23 February 2018 from the Director General of the General Statistics Office. 3 According to Decision No. 376/QD-TCTK dated 24 May 2018 from the Director General of the General Statistics Office.
RESULTS - THE VIET NAM POPULATION AND HOUSING CENSUS OF 00:00 HOURS ON 1 APRIL 2019 / 25 RESULTS - THE VIET NAM POPULATION AND HOUSING CENSUS OF 00:00 HOURS ON 1 APRIL 2019 | 25
The first three pilot surveys for the 2019 Census all used CAPI with a free CSPro platform developed by the U.S. Census Bureau for Android mobile devices. Synchronized data from CAPI to the General Statistics Office’s servers equipped with SQL data management systems did not meet the requirement of real time data synchronization between fieldwork (conducted by enumerators) and the online verification process (conducted by supervisors at all levels). Additionally, with the huge number of enumerators involved in the Census, the proportion of enumerators using iOS mobile devices (not compatible with the CSPro platform) was considerable.
The fourth pilot survey4 was conducted in November 2018 in Quang Ninh province, following the completion of the rehearsal survey to test the CAPI software built on a new platform, developed under the leadership of the Center of Statistical Information Service 1, General Statistics Office. The CAPI software was developed and tested for both Android and iOS operating systems. The pilot results helped the software developer complete the CAPI program for the implementation of the 2019 Census.
The Central Census Steering Committee coordinated with four localities to organize the rehearsal survey5 of the Census in October 2018 - Quang Ninh, Quang Nam, Dak Lak, and Can Tho -to complete professional guidance documents and to apply information technology in collecting and aggregating results, as well as to improve the professional and organizational capacity and direction of core staff of the Central Census Steering Committee and the Steering Committees within ministries and localities. The rehearsal survey fully implemented the processes of the 2019 Census, including applying information technology. The results of the rehearsal survey helped the Census Steering Committees at central and provincial levels and ministries to improve their professional and organizational capacity, and to summarize important lessons for directing and operating the implementation of the Census beginning on 1 April 2019.
In addition to the four pilot surveys and rehearsal survey of the 2019 Census, the application of information technology in the Population Change and Family Planning Survey6 at time-point 00:00 on 1 April 2018 in 63 provinces and cities with a sample population size of about 1.2% helped localities understand data collection using electronic questionnaires and to prepare them for data application during the 2019 Census.
1.2.3. Developing the questionnaires and guidance documents
1.2.3.1. Questionnaires
The content of the 2019 Census was heavily researched and designed to enable collection of information through the complete questionnaire and the sample questionnaire. There were 22 questions in the complete questionnaire and 65 questions in the sample questionnaire.
4 According to Decision No. 04/QD-BCDTW dated 5 November 2018 from the Chairman of the Central Census Steering
Committee. 5 According to Decision No. 02/QD-BCDTW dated 15 August 2018 from the Chairman of the Central Census Steering
Committee. 6 According to Decision No. 76/QD-TCKT dated 02 March 2018 of the Director General of the General Statistics Office.

26 / RESULTS - THE VIET NAM POPULATION AND HOUSING CENSUS OF 00:00 HOURS ON 1 APRIL 2019 26 | RESULTS - THE VIET NAM POPULATION AND HOUSING CENSUS OF 00:00 HOURS ON 1 APRIL 2019
Due to the use of information technology in the 2019 Census, the questionnaires were designed in three stages. Stage 1 involved full information about questions, answers and skips. This phase was implemented as with other Census and statistical sample surveys. Stage 2 involved researching and designing the questionnaires in electronic form for CAPI and Webform software, with the latter questionnaire in short form. Stage 3 involved developing a logic test algorithm for information collected in the same questionnaire (information required to verify corrections).
The design of the questionnaires in the first phase was carried out in parallel with the process of conducting pilot surveys to supplement and modify questions to suit information requirements and ensure the quality of information collected.
In addition to the design of questionnaires in phase 3, the logic test algorithm for information in the same enumeration areas was also developed to verify and synchronize with collected data on the Operational Web Portal.
1.2.3.2. Information technology and professional guidance documents
The Central Census Steering Committee directed the compilation of information technology and professional guidance documents so that provincial Steering Committees could undertake the preparation and implementation of the Census. In total, there were 13 professional and information technology guidance documents developed from August 2018 to January 2019. These documents were divided into the following main groups: preparing enumeration areas, management, preparing and updating household lists, professional guidance, information technology, communication, post-enumeration surveys, and entering codes for economic activities and occupations.
The Central Census Steering Committee coordinated with the United Nations Population Fund (UNFPA) to finalize the script and the video clip guiding enumerators on how to conduct interviews and record information with CAPI. The 30-minute video clip was played to enumerators in designated localities during their training.
1.2.4. Developing programs and application software
Changes in methods and forms of data collection in the 2019 Census directed the application of information technology in the implementation of other phases of the Census, including: preparing and updating the list of households, storing and using commune/ward base maps, automatic household sampling, sending messages to registered households for self-completion online, and checking and validating online data (in conjunction with enumeration fieldwork). In order to meet the requirements of the 2019 Census, programs and software were researched, developed and implemented. In particular, the main software groups in the Census included:
- Making a list of villages, hamlets and population groups;
- Dividing enumeration areas and storing commune/ward base maps;
- Listing households, updating the household list, and automatic household sampling;
- CAPI electronic questionnaires;
- Online Webform electronic questionnaires;

RESULTS - THE VIET NAM POPULATION AND HOUSING CENSUS OF 00:00 HOURS ON 1 APRIL 2019 / 27 RESULTS - THE VIET NAM POPULATION AND HOUSING CENSUS OF 00:00 HOURS ON 1 APRIL 2019 | 27
- Data entry for PAPI questionnaires;
- Establishing a network of enumeration areas and census personnel;
- Software for the Operational Website;
- Coding economic activities and occupations;
- Converting PAPI questionnaires on the Operational Website for inspection, examination and completion of questionnaires.
1.2.5. Preparing information technology infrastructure
The application of CAPI and Webform for collecting information led to new requirements for information technology infrastructure to allow for simultaneous implementation on a national scale. Approximately 150,000 people participated in the system (including enumerators, supervisors and members of the Steering Committees from central to commune levels).
CAPI and Webforms were applied for the first time in data collection. Because the information technology infrastructure in the Statistical System did not meet the work requirements, the Central Census Steering Committee directed various measures to overcome said difficulties, including upgrading the information technology infrastructure of the Statistical System and asking main server providers to receive data from CAPI and Webforms. In order to prevent risks and ensure data safety and confidentiality, the Emergency Response Team for the Information Technology System for the 2019 Population and Housing Census was established7 with the active participation of the Viet Nam Computer Emergency Response Team under the Ministry of Information and Communications.
In addition, the Central Census Steering Committee together with the Ministry of Information and Communications and the Ministry of Public Security inspected and appraised the 2019 Census software to ensure information safety and security.
1.2.6. Preparations of 03 Ministries implementing the Census under their specific plans
The Ministry of National Defense, the Ministry of Public Security and the Ministry of Foreign Affairs all contributed to preparations for the 2019 Census.
The Ministry of National Defense completed the Census questionnaires and guidance documents based on the questionnaires and the professional guidance documents from the Central Census Steering Committee, as well as implemented instructions for data collection staff. Due to the characteristics of the military, the Ministry of National Defense used direct interviews with paper questionnaires to guarantee information security and protect military secrets. To encrypt electronic information, the Ministry of National Defense prepared and continuously updated photo-scanning software in the data scanning process.
The Ministry of Public Security finalized the guidance documents for Census data collection based on the questionnaires and guidance documents from the Central Census Steering Committee and provided guidelines on data collection for units and persons in charge of collecting Census data.
7 According to Decision No. 247/QD-TCTK dated 23 May 2019 of the Director General of the General Statistics Office.
28 / RESULTS - THE VIET NAM POPULATION AND HOUSING CENSUS OF 00:00 HOURS ON 1 APRIL 2019 28 | RESULTS - THE VIET NAM POPULATION AND HOUSING CENSUS OF 00:00 HOURS ON 1 APRIL 2019
Due to the characteristics of the police, the Ministry of Public Security also used direct interviews with paper questionnaires to ensure information safety and confidentiality. The Ministry of Public Security developed data entry software to input information to encrypt completed questionnaires within the time requirement of the Census. Performing its task of safeguarding the Census nationwide, the Ministry of Public Security developed a plan and assigned tasks to its units nationwide from the first days of Census preparation to safeguard both the Census and the people participating in it.
The Ministry of Foreign Affairs finalized the questionnaires, guidance documents based on the questionnaires, guidance documents of the Central Census Steering Committee and implemented instructions on data collection for staff. The Ministry of Foreign Affairs built online software to collect and synthesize Census data that enabled enumeration data to be processed and readied for immediate use following the completion of fieldwork.
1.2.7. Organizing training workshops for the 2019 Census
The Central Steering Committee and local level Steering Committees organized training workshops for the 2019 Census to provide guidelines for those managing the Census process and professionalism as well as to review the various stages of information technology (IT) application. Specifically, training workshops on enumeration area divisions and drawing commune/ward/town base maps at district levels were held in September 2018; training workshops on management and preparing household lists were held in October and November 2018; and training workshops on census professionalism and IT were organized between December 2018 and March 2019.
1.3. Survey sample design
The 2019 Census collected basic population and housing information from usual residents and designated households; in-depth information on population, demography, employment, household living conditions, etc., were only collected from the representative population identified in the sample survey of the Census. Designing a sample survey parallel with the complete survey within the Census enabled expanded survey content; reduced the workload; improved survey information quality, especially for sensitive and complicated questions; and conserved Census budget and resources.
1.3.1. Sampling method
The 2019 Census applied a stratified two-stage sample design as follows: Stage 1: number of sample enumeration areas (EA) per district was determined by the method of distribution proportional to the square root of the household size and select sample EAs. Due to significant variability in the number of households in EAs in each district and to maximize statistical efficiency, EAs per district were selected using probability proportional to size (PPS). Stage 2: select sample households from the list of households in sample EA. Sample households were selected systematically by intervals.
The strength of the stratified two-stage sample design reduced design effect and improved the accuracy of estimated indicators in comparison with the one-stage cluster sample design as used in the 2009 Census.
RESULTS - THE VIET NAM POPULATION AND HOUSING CENSUS OF 00:00 HOURS ON 1 APRIL 2019 / 29 RESULTS - THE VIET NAM POPULATION AND HOUSING CENSUS OF 00:00 HOURS ON 1 APRIL 2019 | 29
1.3.2. Sample distribution and sampling
1.3.2.1. Sample distribution
The General Statistics Office prepared a list of EAs (excluding specific areas which included those who live in specific accommodations such as common houses, pagodas, hostels, hospitals, armed campuses, etc.) in 712 districts and towns, excluding Hoang Sa island district. In coordination with an international sample expert provided by UNFPA, the GSO calculated and identified a sample size of around 9% households in the whole country. Taking these factors into account allowed this sample size to serve as an adequate representation in estimating statistical indicators at the district level. The distribution of sample EAs in 712 districts was conducted based on sample household rate estimations.
The size of population and households in districts differed, thus EA distribution for districts was achieved using method of proportion to square root of household size (Square Root Allocation). This method enabled an increased sample size in the smaller districts and a decreased number of sample EAs in larger districts, compared to proportional allocation.
Since information collected through sample questionnaires would be used to estimate statistical indicators at the district level, smaller districts had to have sufficiently representative samples. Thus, after allocating sample EAs, very small districts (with 80 or fewer EAs) that had a distribution of at least 85% EAs and over had their sample size increased to 100% EAs. As a result, there were 14 districts where all EAs were sampled, districts with 81 to 500 EAs had an average sampling rate of 47.2%, and districts with 500 or more EAs had average sampling rate of 27.3%. There were 78,702 total sample EAs in the whole country. Detailed information on the results of the sample distribution at the district level can be found in Annex 4.
Using this distribution method meant districts with large populations and many households had a smaller sampling rate than the overall national sampling rate, while districts with small populations and fewer households had a larger sampling rate. This helped increase sample representation for all districts, while facilitating aggregation for provincial and national levels.
Because the urban and rural areas in each district had different characteristics, sample allocation was continuously divided by rural and urban strata in each district based on the number of allocated EAs. This ensured both urban and rural samples were represented as well as improved the sample design effect.
1.3.2.2. Sampling procedures
Stage 1: Sampling EAs
After the EAs were allocated by urban and rural strata in each district using the methods detailed above, sample EAs were selected from each stratum using probability proportional to size (PPS) through the following steps:
30 / RESULTS - THE VIET NAM POPULATION AND HOUSING CENSUS OF 00:00 HOURS ON 1 APRIL 2019 30 | RESULTS - THE VIET NAM POPULATION AND HOUSING CENSUS OF 00:00 HOURS ON 1 APRIL 2019
- Remove specific areas in each district to generate a list of normal areas for sampling EAs;
- Divide the list of EAs in each district into 2 sub-lists: urban areas and rural areas;
- List the order of EAs in the 2 sub-lists by commune code, village code and EA code; and
- Sample EAs.
Stage 1 sampling generated 78,702 sample EAs, or around 40% of total EAs in the whole country.
Stage 2: Sampling households
Based on the list of sample EAs selected in stage 1 and the list of households in these sample EAs8, households registered to self-enumerate via Webform were filtered out and 30 households were then selected from each sample EA. Sample households were selected using systematic random method via the Census Operational Website.
The stage 2 sampling resulted in 2,360,000 sample households (30 randomly selected sample households), equivalent to 9% of total households.
1.3.3. Sample weighted estimate
1.3.3.1. Identifying design weight (basic weight)
The basic weight was calculated as the inverse of the overall probability of selection, expressed as follows:
𝑊𝑊�� =𝑀𝑀� × 𝑀𝑀′��
𝑛𝑛� × 𝑀𝑀�� × 𝑚𝑚��
Where:
Whi Basic weight for sample households in the i sample EA of district h
nh Number of sample EAs selected in district h
Mhi Total number of households in the pre-census sampling frame for the i sample EA in district h
Mh Total number of households in the pre-census sampling frame for district h
mhi Equal to 30, number of households selected in the i sample EA of district h
M’hi Total number of households in the updated listing for the i sample EA in district h
1.3.3.2. Identify adjusted household weight
This household weight was then adjusted using the basic weight and the total number of households in each district from the full 2019 Census enumeration. This adjusted household weight
8 The list of households were set up in the stage of updating household list conducted in March 2019
RESULTS - THE VIET NAM POPULATION AND HOUSING CENSUS OF 00:00 HOURS ON 1 APRIL 2019 / 31 RESULTS - THE VIET NAM POPULATION AND HOUSING CENSUS OF 00:00 HOURS ON 1 APRIL 2019 | 31
was used to ensure the weighted total households from sample survey data were consistent with the final data from the 2019 Census enumeration for each district by rural and urban areas.
The adjusted household weights were calculated as follows:
𝑊𝑊′�� = 𝑊𝑊�� ×𝑀𝑀��
∑ 𝑊𝑊�� × 𝑚𝑚����
Where:
W’hi Adjusted weight for the sample households in the i sample EA of district h
Whi Basic weight for sample households in the i sample EA of district h
mhi Equal to 30, number of households selected in the i sample EA of district h
MCh Total number of households in district h from the final 2019 Census enumeration
1.3.3.3. Identify adjusted person weight
The person weight was then adjusted based on adjusted household weight. This adjusted household weight guided the weighted total persons from sample survey data to be consistent with the complete Census count of household-based population in each district, by rural and urban areas, sex and 10-year age groups.
Using this approach, the adjusted person weights were calculated as follows:
𝑊𝑊���� = 𝑊𝑊′�� ×𝑃𝑃���
∑ 𝑊𝑊�� × 𝑝𝑝������
Trong đó:
Where:
Whisa Weight for the sample persons in sex s and 10-year age group a in the sample households in the i sample EA of district h
W’hi Adjusted household weight for the sample households in the i sample EA of district h
Phsa Total number of persons in sex s and age group a in all sample households of district h based on the 2019 Census enumeration
phisa Number of persons in sex s and age group a in the sample households of the i sample EA of district h
1.4. Initial information to serve the 2019 Census
1.4.1. Drawing commune/ward base map and EA division EAs used in statistical work refers to the geographical residence area with clear or relatively
clear boundaries. An EA is essentially a village, hamlet, mountain village, living quarter, urban block,
32 / RESULTS - THE VIET NAM POPULATION AND HOUSING CENSUS OF 00:00 HOURS ON 1 APRIL 2019 32 | RESULTS - THE VIET NAM POPULATION AND HOUSING CENSUS OF 00:00 HOURS ON 1 APRIL 2019
or sub-area. As stipulated by the 2019 Population and Housing Census, the average size of an EA was about 120 households. Each commune/ward consisted of many EAs and the EA boundaries were matched to create a map of the commune/ward.
According to international principles, the EA map used in the Population and Housing Census was detailed according to each house/dwelling unit to ensure no overlaps or omissions during fieldwork. The previous population and housing censuses also prepared detailed EA maps. However, the available budget allocated for this effort in the 2019 Population and Housing Census was reduced from previous Censuses, and maps included communes/wards/towns (clearly showing the boundary between the EAs and including orienting landmarks). The simplification of drawing detailed EA maps helped to reduce costs, but it also increased the risk of overlapping or omitting households and household members during fieldwork. To limit such risks, significant attention was paid to ensuring household lists were as comprehensive as possible.
1.4.2. Preparing and updating household lists
Comprehensive household lists are essential for facilitating survey networks prior to data collection using CAPI and Webforms. The lists assist organizational implementation, data collection plan development, and information collection management in the field. Since there were no detailed EA maps in the 2019 Census, compiling accurate household lists was crucial to improve data collection quality. Household lists were completed on 20 January 2019.
During this process, households were asked whether they wished to register voluntarily for self-enumeration on the Census’s Website via Internet (Webforms). To update household lists with changes in households prior to the survey time point, household lists were reviewed and updated from 15 to 20 March 2019.
1.4.3. Developing the 2019 Census network
Developing the 2019 Census network was a significant task, particularly in applying IT during data collection. The survey network helped facilitate assignments for staff and decentralized management in a clear and transparent manner. The Census network enabled enumerators to carry out data collection from each household or EA accurately, avoiding overlaps or omissions.
The 2019 Census network included the following information:
- Household lists with information on households registered to self-enumerate via Webforms;
- EA lists linked to administrative categories from provincial to commune level and categories of villages, hamlets, and living quarters;
- Commune/ward/town base map;
- List of enumerators and their assigned households or EAs;
- List of supervisors from the central level to district level and their assigned EAs;
RESULTS - THE VIET NAM POPULATION AND HOUSING CENSUS OF 00:00 HOURS ON 1 APRIL 2019 / 33 RESULTS - THE VIET NAM POPULATION AND HOUSING CENSUS OF 00:00 HOURS ON 1 APRIL 2019 | 33
- List of Steering Committees from the central level to commune level and their assigned EAs;
The 2019 Census network was developed concurrently with the process of household lists, and updated both prior to the Census time point and during field data collection when there were changes in Census personnel.
34 / RESULTS - THE VIET NAM POPULATION AND HOUSING CENSUS OF 00:00 HOURS ON 1 APRIL 2019 34 | RESULTS - THE VIET NAM POPULATION AND HOUSING CENSUS OF 00:00 HOURS ON 1 APRIL 2019
CHAPTER 2: IMPLEMENTATION OF THE 2019 CENSUS
2.1. Direction and coordination in preparing and organizing the 2019 Census
2.1.1. Direction and management personnel
The direction and coordination for preparing and implementing the 2019 Census began in 2017 with many key activities in 2018. To prepare for and implement the 2019 Census, leadership and management personnel units were established at four levels from the central to the commune level and at three Ministries implementing the Census (Ministry of National Defense, Ministry of Public Security and Ministry of Foreign Affairs). Total, there were 11,944 Steering Committees at all levels (one Central Steering Committee, three ministerial Steering Committees, 63 provincial Steering Committees, 712 district steering committees, and 11,165 communal steering committees) and 779 Steering Committee Offices established from the central to district level. There were 69,521 members of Steering Committees and 8,898 office staff.
2.1.2. Direction and implementation
To unify the direction of the implementation of the 2019 Census, Provincial/City Party Committees and People's Committees of the provinces and cities directly under central management issued directives and documents on leadership, direction and implementation of the Population and Housing Census in their respective localities. These documents emphasized the purpose, requirements, meaning, and importance of the Census.
During the implementation of the 2019 Census, the Party Committees and People's Committees at provincial, district, and commune levels provided intensive direction to the members of the Steering Committees, supervisors, team leaders, and enumerators, as well as local specialized agencies, to successfully organize and implement the 2019 Census.
In addition, the Provincial Steering Committees engaged every single agency, unit, department and association from the provincial to the commune level in the 2019 Census during People’s Committee and People’s Council meetings. Notably, the Department of Information and Communication in some provinces and cities directly under Central management steered enterprises to review telecommunication infrastructure and networks to ensure consistent broadband and internet service quality during the 2019 Census. The Department of Education and Training, and Post offices in the respective localities, actively dispatched teachers, students and workers to act as enumerators. The Public Security sector sent staff to support enumerator access to households for interviews and data collecting, and to protect census personnel in complicated and unstable areas.
During data collection, the Central Steering Committee Office issued guiding documents on professionalism, information technology application, and data completion procedures. The Provincial Steering Committees communicated and disseminated the Central Steering Committee’s guidance to the subordinate steering committees, supervisors, team leaders and enumerators for implementation.
RESULTS - THE VIET NAM POPULATION AND HOUSING CENSUS OF 00:00 HOURS ON 1 APRIL 2019 / 35 RESULTS - THE VIET NAM POPULATION AND HOUSING CENSUS OF 00:00 HOURS ON 1 APRIL 2019 | 35
2.2. Communications
There were intensive and extensive communications about the 2019 Census among the population, armed forces, and political system. The Provincial Party Committee, People's Committee, all levels of Steering Committees, and relevant ministries and agencies issued and disseminated the Directive and Decision of the Prime Minister, Provincial Party Committee, and People's Committee at all levels; the Census plan; and the Steering Committee communications plans at all levels. The communications emphasized the purpose, requirements, meaning, and importance of the 2019 Census.
The 2019 Census maximized various communication channels, including intensive use of IT, to convey information across the nation. The main communications channels of the 2019 Census included:
- Online channels including the GSO website (www.gso.gov.vn); the 2019 Census website (www.tongdieutradanso.vn); provincial websites (People's Committee, Provincial Statistics Office, Radio and Television Stations);
- Newspapers in various forms (written, audio, images) from the central to local level, particularly focused on subjects specific to the 2019 Census;
- Census trailer on VTV, talk shows on central and local television, radio interviews, electronic news articles and news banners on prime-time TV programs, social networks (GSO and UNFPA Facebook, Twitter, Zalo, etc.);
- Messages to mobile phone subscribers with information about the 2019 Census;
- Organizing neighborhood meetings and community meetings; translating Census communications materials into local ethnic languages; promoting information on radio systems and loudspeakers; hanging banners, slogans, and posters; placing logos in public places or other high-visibility high-traffic places; and using branded vehicles driving around main roads.
- Establishing a free hotline to support Census personnel with IT application and general Census issues, and to provide a platform for feedback the public regarding Census implementation.
The intensive communications efforts achieved the anticipated results; most people knew about the 2019 Census and responded to the information received. In the first days of data collection, the Census hotline received numerous calls and significant feedback from local people reporting absent enumerators and inconsistent information and survey forms with communicated regulations. Thus, the Central Steering Committee had access to more information and insight for correcting issues according to Census directives and regulations.
36 / RESULTS - THE VIET NAM POPULATION AND HOUSING CENSUS OF 00:00 HOURS ON 1 APRIL 2019 36 | RESULTS - THE VIET NAM POPULATION AND HOUSING CENSUS OF 00:00 HOURS ON 1 APRIL 2019
2.3. Data collection and survey supervision 2.3.1. Census personnel
The 2019 Census convened 125,358 enumerators, 10,983 of which were teachers and students at educational and training institutions within the EAs (8.8%). The average age of enumerators was 35.8 years old.
The number of persons participating in the Census as team leaders and supervisors at all levels was 21,587. Specifically, 11,502 were team leaders, 1,823 were provincial supervisors and 8,262 were district supervisors.
2.3.2. Methods and forms of information collection
The 2019 Census used two methods of information collection simultaneously: face-to-face interviews and self-enumeration. Three further forms of information collection were applied as follows:
Paper-based questionnaire (PAPI): A form of traditional information collection whereby the enumerator visits the household and conducts a face-to-face interview and records information on a printed paper-based questionnaire.
Electronic questionnaire installed in mobile devices (computer-assisted personal interviewing [CAPI]): An information technology application whereby the questionnaire is designed for installation in a tablet or smartphone to facilitate the recording of information at the same time the enumerator conducts a face-to-face interview.
Online questionnaire via Internet (Webforms): A questionnaire that allows households to self-enumerate information online about population and housing. The households that registered to use Webforms were provided with an account name and password for logging on to the Census information system.
Among the aforementioned, CAPI was the major form of information collection of the 2019 Census with 99.9% of households surveyed using this approach. The percentage of households surveyed by PAPI and Webform was very small, accounting for just 0.05% of the total number of households nationwide respectively.
2.3.3. Data collection in the enumeration areas
2.3.3.1. Census Steering Committee in localities
Data collection in the EAs occurred concurrently across the country following the launching Ceremony, from 7.30 am on 1 April 2019 to 25 April 2019. In order to rectify and process feedback received about reported missing household interviews, supplementary data collection was carried out between 26 April 2019 and 2 May 2019.
The EA information collection process proved to be relatively convenient and high-quality. The Central Steering Committee worked with Steering Committees at local levels, Ministries and line-ministries to tackle obstacles that arose, including the following:
RESULTS - THE VIET NAM POPULATION AND HOUSING CENSUS OF 00:00 HOURS ON 1 APRIL 2019 / 37 RESULTS - THE VIET NAM POPULATION AND HOUSING CENSUS OF 00:00 HOURS ON 1 APRIL 2019 | 37
- Access to households in some localities posed difficulties, especially in remote areas where people lived in dispersed communities. In certain high-class apartment blocks, homeowners were often away or worked late. Some households also experienced conflicts with local authorities.
- Some senior enumerators heading urban blocks or villages with convenient access to households were often confronted with professional technical requirements that inhibited their ability to operate smart devices efficiently. On the other hand, younger enumerators, despite their efficient technical proficiency, often faced difficulties in accessing EAs and households.
- The use of a variety of enumerator devices also caused difficulties in guiding users experiencing issues. During the survey, the CAPI program was updated on numerous occasions in response to an emerging variety of issues. These changes were compounded by overloaded information technology support systems operated by a technician team which was too small to cope with the total number of enumerator requests for assistance.
- The amount of data collected in the 2019 Census was large. In the final stage of fieldwork, when survey progress reached over 80%, the system experienced an overload. Further, the operational website was occasionally interrupted, impacting on the work of error monitoring and correction.
- During data collection, some localities faced risks that affected Census implementation, such as heavy rain and hail that impeded travel; traffic accidents among enumerators in transit to training courses and households; and lost or broken Census enumerator mobile devices.
- During the survey duration, some localities were affected by the African swine fever. This impeded access to respondents living in communities with pig farms. In addition, the work of personnel participating in the Census experienced interruptions because the affected locality mobilized them to help stamp out epidemics.
2.3.3.2. Census Steering Committee in Ministries
The Ministry of National Defense set up 1,092 enumeration teams with 3,672 enumerators to take part in information collection in 1,332 survey units and enterprises belonging to the military. The Ministry of National Defense collaborated with all levels of Steering Committees to define their management enumeration areas to avoid duplication, regularly exchange and reach professional consensus with the Central Steering Committee’s Office, and to collect sufficient information to prevent population duplication.
As of 20 April 2019, the Ministry of National Defense completed their enumeration fieldwork, five days earlier than anticipated. Due to the specific characteristics of the Ministry of National Defense, the fieldwork data collection was conducted with paper-based questionnaires and with scanning technology and artificial intelligence to encode the questionnaires. Before transferring data, the Central Steering Committee’s Office checked data from the Ministry of National Defense and, if necessary, provided instructions for correcting and completing the data. Data collected by
38 / RESULTS - THE VIET NAM POPULATION AND HOUSING CENSUS OF 00:00 HOURS ON 1 APRIL 2019 38 | RESULTS - THE VIET NAM POPULATION AND HOUSING CENSUS OF 00:00 HOURS ON 1 APRIL 2019
the Ministry of National Defense was then transferred to the Central Steering Committee’s Office on 10 June 2019.
The Steering Committee of the Ministry of Public Security directed the implementation of the 2019 Census, collecting information in survey units managed by the Ministry of Public Security from 1-10 April 2019, 15 days earlier than anticipated. Because of the specific characteristics of the armed forces, the Ministry of Public Security applied paper-based questionnaires to collect data at 3,164 EAs nationwide, and conducted data entry of all data collected. The implementation fully complied with Census regulations; respondents demonstrated a significant sense of responsibility, cooperated well with enumerators in providing complete and accurate information. Monitoring and supervision was implemented fully in line with regulations. Before completing the data, the Central Steering Committee’s Office coordinated with Ministry of Public Security to check and finalize data; data collected by the Ministry of Public Security was transferred to the Central Steering Committee Office on 11 June 2019.
In addition to collecting population information under its management, the Ministry of Public Security successfully ensured security and safety for the 2019 Census nationwide.
The Steering Committee of the Ministry of Foreign Affairs directed 94 Vietnamese representative missions abroad to implement the 2019 Census. Data collection was carried out from 1-15 April 2019 (local time in Viet Nam), and completed 15 days earlier than anticipated. The Ministry of Foreign Affairs gathered data using electronic questionnaires, improving the quality of questionnaire checks. The 2019 Census data was then transferred to the Central Steering Committee on 25 April 2019. The Ministry of Foreign Affairs was the first unit to complete its 2019 Census data.
2.4. Data monitoring, verifying, processing, and analyzing
The 2019 Census vigorously applied information technology in data collection within EAs. Data monitoring, checking, and processing was conducted parallel to EAs’ information collection and continued after the stage of information collection was completed.
With the application of the Operational Website in monitoring, the 2019 Census made a breakthrough in improving statistical surveys and particularly in monitoring and checking. This was the first statistical survey with full information on the progress, quantity, and quality of questionnaires of each EA available to each enumerator at the same time, thereby helping the Steering Committee and supervisors at all levels capture information in a timely fashion and with the ability to provide appropriate directions to guide Census quality and progress.
2.4.1. Monitoring and checking data during collection in enumeration areas
The 2019 Census applied two forms of monitoring: Direct monitoring through central and provincial missions and district supervisors in the EAs, and indirect monitoring through the Census Operational Website. Supervisory activities helped detect problems in EAs, directly support
RESULTS - THE VIET NAM POPULATION AND HOUSING CENSUS OF 00:00 HOURS ON 1 APRIL 2019 / 39 RESULTS - THE VIET NAM POPULATION AND HOUSING CENSUS OF 00:00 HOURS ON 1 APRIL 2019 | 39
enumerators, and promptly notify the Central Steering Committee and the Steering Committees at all levels to address arising problems.
On the Operational Website, the software program automatically flagged errors to be checked and requested district supervisors to confirm team leaders and enumerators had completed the questionnaires for synchronizing with the data system. One error that required verification and correction in the early days was determining if time spent on household information collection was too short and whether households had the same geographic positioning system (GPS) information.
In addition to checking and processing data errors which were automatically flagged by the system on the Operational Website, supervisors at all levels performed checks on the Operational Website through the progress report features for each EA and enumerator schedule to urge and remind enumerators to stay on schedule. They were also able to check information through the local population preliminary statistics tables and by cross-tabulating tables on population, housing, and education to detect systematic errors and remind enumerators about survey processes.
Questionnaire error correction was undertaken in conjunction with EA information collection. However, in some localities with larger numbers of households, there were difficulties in access to verification information. Error correction continued after data collection in the EAs.
2.4.2. Checking and finalizing database after information collection in the enumeration areas
Due to the application of IT and following the completion of the EA collection period, sufficient data was available on the server to facilitate a final verification and finalization of the Census database. The verification and finalization process was conducted as follows:
Step 1: Steering Committees at all levels verified and finalized the data through the Operational Website from 3 May 2019 to the end of 10 June 2019. Information on labor and employment was continuously checked and encoded by the Steering Committees at all levels in localities by industry code and occupation code directly on the Operational Website through 31 July 2019.
Step 2: The Central Steering Committee verified data with local Steering Committees in finalizing data from completed questionnaires.
After any necessary corrections, the Census database on the Operational Website was finalized on 10 June 2019 and the data was converted to the SQL management system and SPSS from 11 to 27 June 2019 at the central level.
The results of the 2019 Census from the three Ministries - Ministry of National Defense, Ministry of Public Security, and Ministry of Foreign Affairs - were merged into the general data to synthesize and compile statistical indicators for the Census preliminary results reporting. The Census preliminary results report was completed and published on 11 July 2019. Thus, only two months
40 / RESULTS - THE VIET NAM POPULATION AND HOUSING CENSUS OF 00:00 HOURS ON 1 APRIL 2019 40 | RESULTS - THE VIET NAM POPULATION AND HOUSING CENSUS OF 00:00 HOURS ON 1 APRIL 2019
after the completion of EA data collection, the 2019 Census data was available for data synthesis and analysis. Compared to the 2009 Census, the 2019 Census data was verified and finalized a full year sooner.
Step 3: The Central Steering Committee verified the sample survey data with Steering Committees in the localities.
After encoding industries and occupations, data on labor and employment were merged into the Census data to enable sample questionnaire information verification and finalization. The entire Census data (including the information from both the complete and the sample questionnaire) was aggregated and compiled for the final report on the 2019 Census results. Data processing and synthesis ended in mid-November 2019. The 2019 Census results report was compiled and published in December 2019.
RESULTS - THE VIET NAM POPULATION AND HOUSING CENSUS OF 00:00 HOURS ON 1 APRIL 2019 / 41 RESULTS - THE VIET NAM POPULATION AND HOUSING CENSUS OF 00:00 HOURS ON 1 APRIL 2019 | 41
CHAPTER 3: ASSESSMENT AND APPRAISAL OF THE CENSUS RESULTS, AND LESSONS LEARNED
3.1. Assessment and appraisal of the 2019 Census results To have a solid basis for publishing the results of the 2019 Census, contributing to
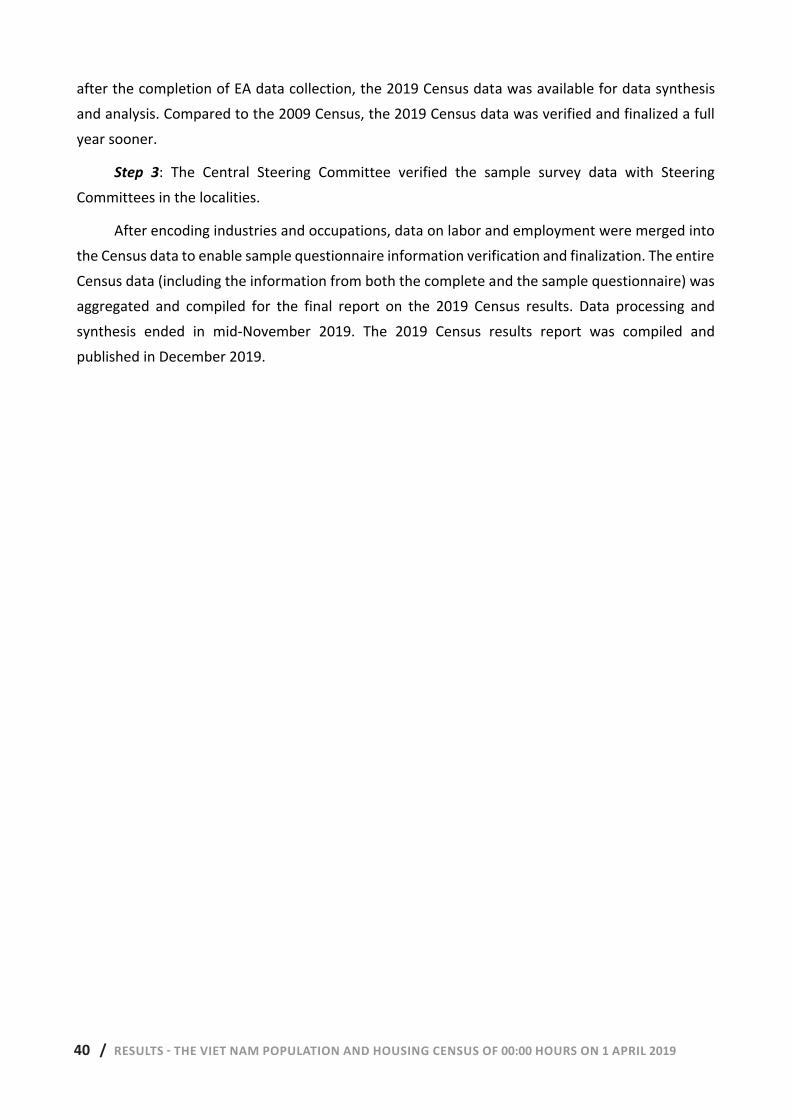
consolidating user beliefs and understanding of the collected data, the Central Steering Committee conducted a post-enumeration survey9 for the 2019 Census immediately after completing EA data collection. In addition, UNFPA assisted by sending an international expert to Viet Nam to conduct an objective assessment of the quality of the Census data in the first 10 days of August 2019. Some results of the 2019 census data quality assessment are as follows.
3.1.1. Population size
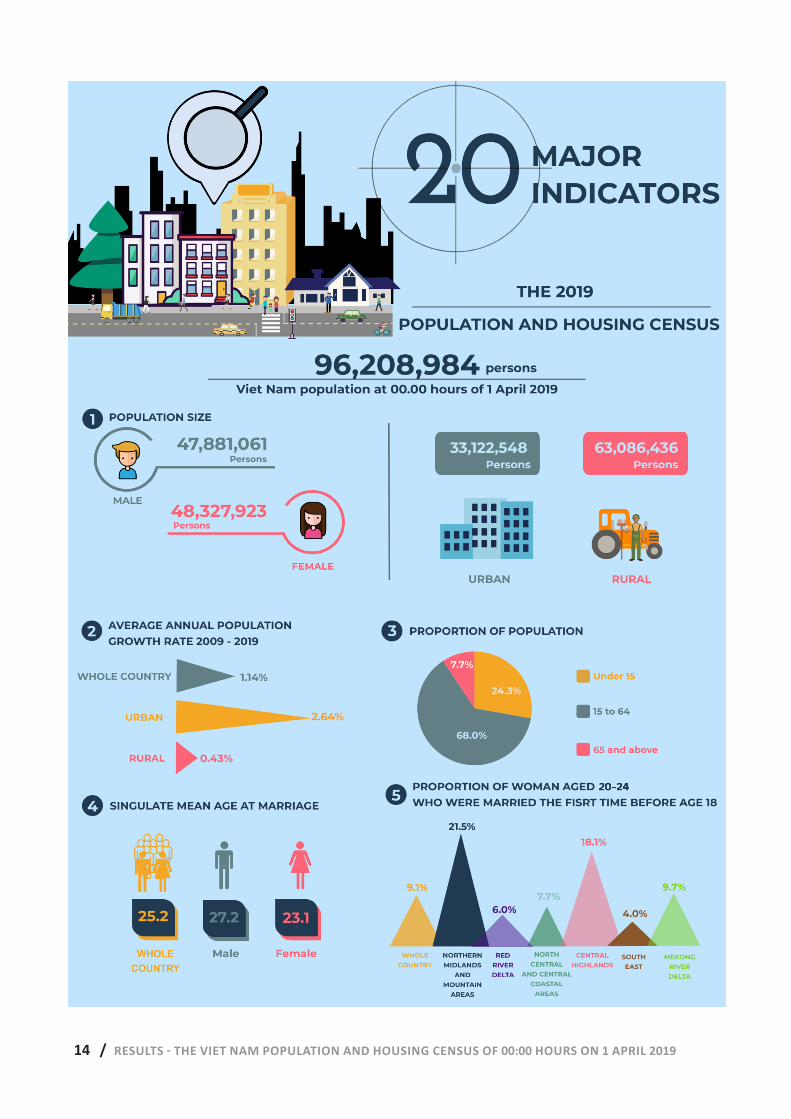
The Population and Housing Census in Viet Nam determined population size based on concept of usual residents (de jure). The results show that total population of Viet Nam at the time-point 00:00 on 1 April 2019 was 96.2 million persons.
The post enumeration survey was used to determine the coverage error (defining the completeness of the Census), so each usual resident in the post enumeration areas was interviewed with 4 questions: (1) full name; (2) relationship to household head; (3) sex; and (4) month and year of birth or rounded age. Information gathered from these questions during the post-enumeration survey was compared with the Census results to find cases of duplication or omission in the Census.
The results of the post-enumeration survey showed that the net coverage error of the Census was 0.2%, equivalent to about 143,000 persons, an acceptable threshold. Compared to the error rate of 1.5%-4.5% of the total population, commonly found in the Population and Housing Censuses of other countries, the completeness of the 2019 Census of Viet Nam was quite high.
Table 3.1: The results of the post enumeration survey on the 2019 Population and Housing Census
Unit: %
Duplication rates Omission rates Net coverage error
(Omission - Duplication)
ENTIRE COUNTRY 3.4 3.6 0.2
Northern midlands and mountain areas 3.2 2.4 -0.8
Red River Delta 2.3 2.9 0.6
North Central and Central coastal areas 2.9 2.3 -0.6
Central Highlands 4.1 5.4 1.3
South East 3.0 3.9 0.9
Mekong River Delta 5.6 6.0 0.4
9 Post enumeration survey of the 2019 Population and Housing Census was conducted in May 2019 in accordance with Plan
No.31/KH-BCDTW dated 27 March 2019 at 70 EAs in 63 provinces and cities directly under the Central Government.
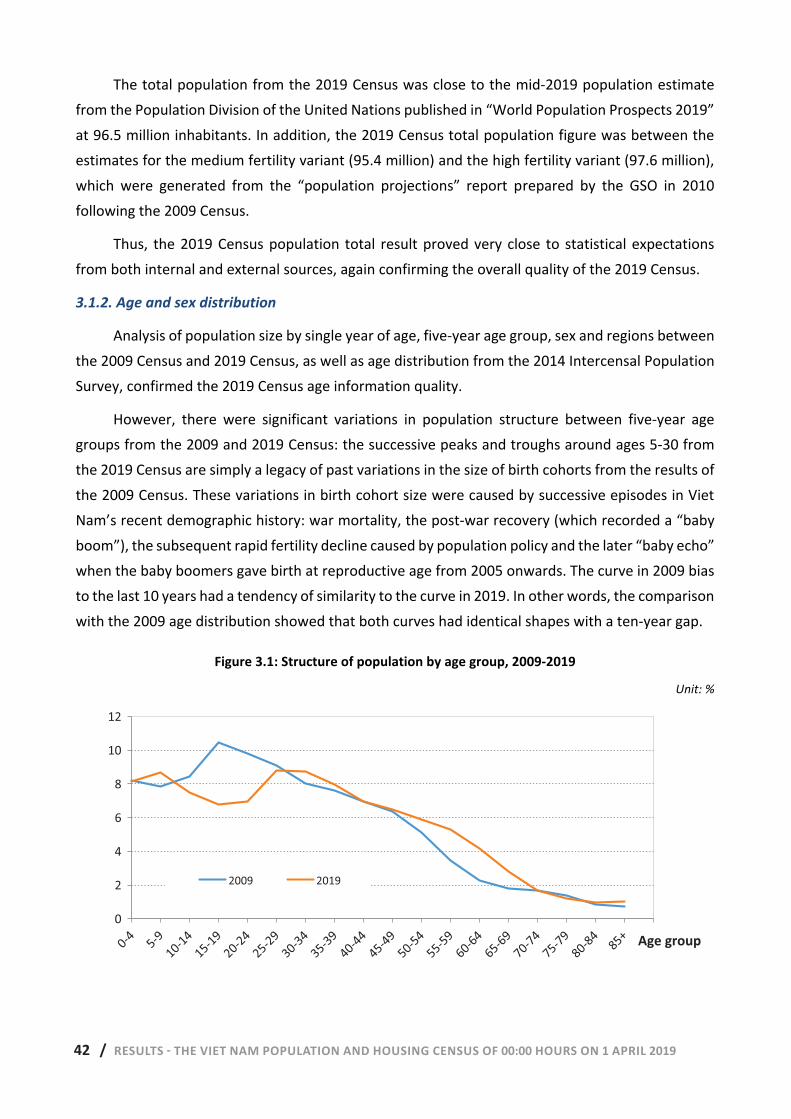
42 / RESULTS - THE VIET NAM POPULATION AND HOUSING CENSUS OF 00:00 HOURS ON 1 APRIL 2019 42 | RESULTS - THE VIET NAM POPULATION AND HOUSING CENSUS OF 00:00 HOURS ON 1 APRIL 2019
The total population from the 2019 Census was close to the mid-2019 population estimate from the Population Division of the United Nations published in “World Population Prospects 2019” at 96.5 million inhabitants. In addition, the 2019 Census total population figure was between the estimates for the medium fertility variant (95.4 million) and the high fertility variant (97.6 million), which were generated from the “population projections” report prepared by the GSO in 2010 following the 2009 Census.
Thus, the 2019 Census population total result proved very close to statistical expectations from both internal and external sources, again confirming the overall quality of the 2019 Census.
3.1.2. Age and sex distribution
Analysis of population size by single year of age, five-year age group, sex and regions between the 2009 Census and 2019 Census, as well as age distribution from the 2014 Intercensal Population Survey, confirmed the 2019 Census age information quality.
However, there were significant variations in population structure between five-year age groups from the 2009 and 2019 Census: the successive peaks and troughs around ages 5-30 from the 2019 Census are simply a legacy of past variations in the size of birth cohorts from the results of the 2009 Census. These variations in birth cohort size were caused by successive episodes in Viet Nam’s recent demographic history: war mortality, the post-war recovery (which recorded a “baby boom”), the subsequent rapid fertility decline caused by population policy and the later “baby echo” when the baby boomers gave birth at reproductive age from 2005 onwards. The curve in 2009 bias to the last 10 years had a tendency of similarity to the curve in 2019. In other words, the comparison with the 2009 age distribution showed that both curves had identical shapes with a ten-year gap.
Figure 3.1: Structure of population by age group, 2009-2019 Unit: %
0%
2%
4%
6%
8%
10%
12%
2009 20190
2
4
6
8
10
12
2009 2019
Age group
RESULTS - THE VIET NAM POPULATION AND HOUSING CENSUS OF 00:00 HOURS ON 1 APRIL 2019 / 43 RESULTS - THE VIET NAM POPULATION AND HOUSING CENSUS OF 00:00 HOURS ON 1 APRIL 2019 | 43
The following figure depicts the age structure of 5-year birth cohorts by sex; the population structure by age group was identical in both males and females. There was a higher sex ratio than expected below age 20 in males and females linked to sex imbalances at birth in Viet Nam over the last two decades. The lower sex ratio than expected from age 50 onwards in males and females could possibly be linked to excess male (war-related) mortality in the past.
Figure 3.2: Differentials in sex by age group from the 2019 Census results
Unit: %
3.1.3. Assessment of quality of age information
Although there were very strict regulations in collecting age-related information, there were discrepancies between gathered information and reality, for many different reasons. Common errors in age reporting included respondents not correctly remembering their age or the age of other family members, respondents choosing to report a more socially desirable age and respondents choosing lucky numbers. Some respondents round their age to end in 0 or 5. These inaccuracies can lead to abnormal population concentrations in preferred ages, and underrepresentation in unpopular ages, ultimately distorting data on population distribution by age.
According to United Nations recommendations, three indices are often used to assess the quality of age information in population statistical surveys: Whipple’s index, Myers’ index and the UNI index.
The Whipple’s index is used to measure preferences for ages ending in 0 and 5. This index’s value ranges from 100 to 500: 100 or less indicates no preference for ages ending in 0 and 5; conversely, a Whipple’s index of 500 would indicate all respondents declared their age ended in a 0 or a 5.
0%1%2%3%4%5%6%7%8%9%
10%
Males Females0
1
2
3
4
5
6
7
8
9
10
Males Female
Age group
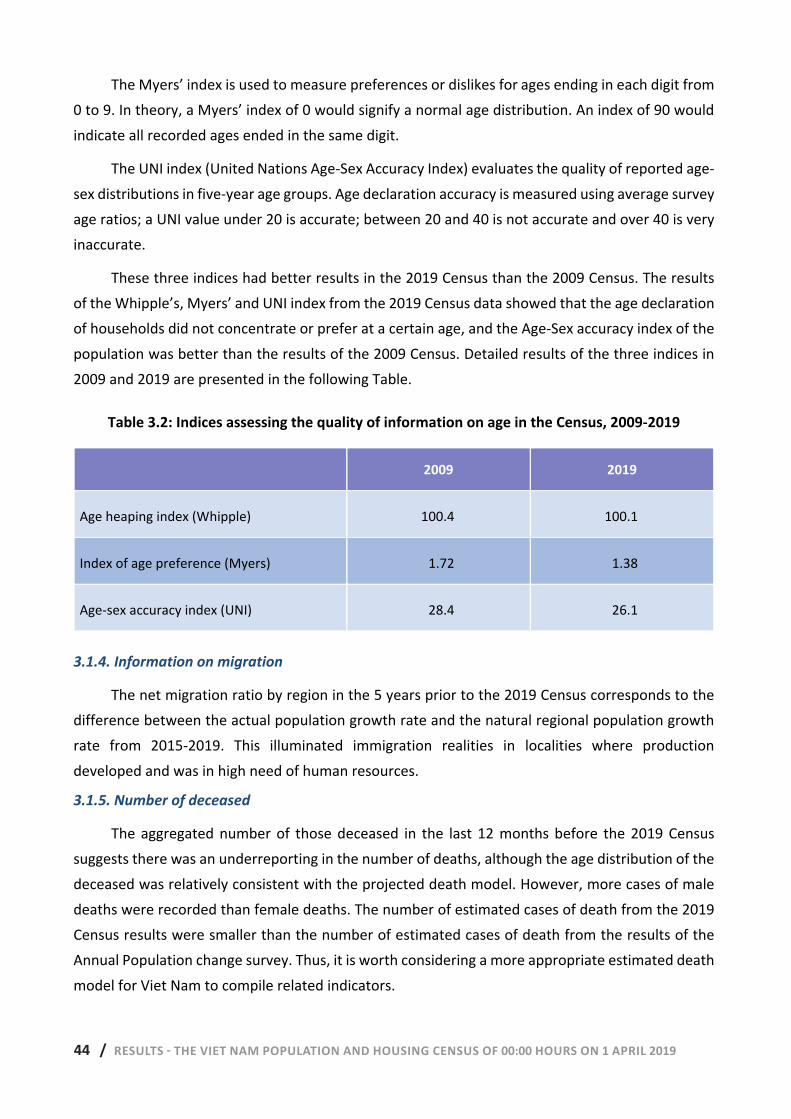
44 / RESULTS - THE VIET NAM POPULATION AND HOUSING CENSUS OF 00:00 HOURS ON 1 APRIL 2019 44 | RESULTS - THE VIET NAM POPULATION AND HOUSING CENSUS OF 00:00 HOURS ON 1 APRIL 2019
The Myers’ index is used to measure preferences or dislikes for ages ending in each digit from 0 to 9. In theory, a Myers’ index of 0 would signify a normal age distribution. An index of 90 would indicate all recorded ages ended in the same digit.
The UNI index (United Nations Age-Sex Accuracy Index) evaluates the quality of reported age-sex distributions in five-year age groups. Age declaration accuracy is measured using average survey age ratios; a UNI value under 20 is accurate; between 20 and 40 is not accurate and over 40 is very inaccurate.
These three indices had better results in the 2019 Census than the 2009 Census. The results of the Whipple’s, Myers’ and UNI index from the 2019 Census data showed that the age declaration of households did not concentrate or prefer at a certain age, and the Age-Sex accuracy index of the population was better than the results of the 2009 Census. Detailed results of the three indices in 2009 and 2019 are presented in the following Table.
Table 3.2: Indices assessing the quality of information on age in the Census, 2009-2019
2009 2019
Age heaping index (Whipple) 100.4 100.1
Index of age preference (Myers) 1.72 1.38
Age-sex accuracy index (UNI) 28.4 26.1
3.1.4. Information on migration
The net migration ratio by region in the 5 years prior to the 2019 Census corresponds to the difference between the actual population growth rate and the natural regional population growth rate from 2015-2019. This illuminated immigration realities in localities where production developed and was in high need of human resources.
3.1.5. Number of deceased
The aggregated number of those deceased in the last 12 months before the 2019 Census suggests there was an underreporting in the number of deaths, although the age distribution of the deceased was relatively consistent with the projected death model. However, more cases of male deaths were recorded than female deaths. The number of estimated cases of death from the 2019 Census results were smaller than the number of estimated cases of death from the results of the Annual Population change survey. Thus, it is worth considering a more appropriate estimated death model for Viet Nam to compile related indicators.
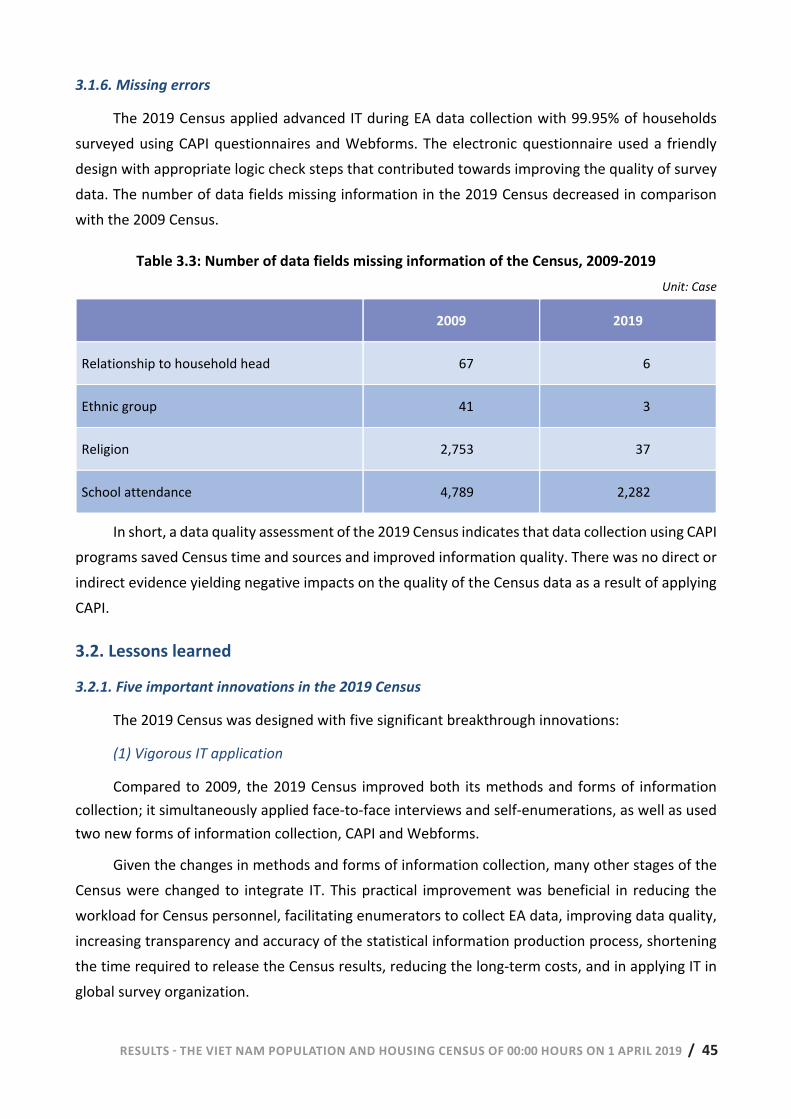
RESULTS - THE VIET NAM POPULATION AND HOUSING CENSUS OF 00:00 HOURS ON 1 APRIL 2019 / 45 RESULTS - THE VIET NAM POPULATION AND HOUSING CENSUS OF 00:00 HOURS ON 1 APRIL 2019 | 45
3.1.6. Missing errors
The 2019 Census applied advanced IT during EA data collection with 99.95% of households surveyed using CAPI questionnaires and Webforms. The electronic questionnaire used a friendly design with appropriate logic check steps that contributed towards improving the quality of survey data. The number of data fields missing information in the 2019 Census decreased in comparison with the 2009 Census.
Table 3.3: Number of data fields missing information of the Census, 2009-2019 Unit: Case
2009 2019
Relationship to household head 67 6
Ethnic group 41 3
Religion 2,753 37
School attendance 4,789 2,282
In short, a data quality assessment of the 2019 Census indicates that data collection using CAPI programs saved Census time and sources and improved information quality. There was no direct or indirect evidence yielding negative impacts on the quality of the Census data as a result of applying CAPI.
3.2. Lessons learned
3.2.1. Five important innovations in the 2019 Census
The 2019 Census was designed with five significant breakthrough innovations:
(1) Vigorous IT application
Compared to 2009, the 2019 Census improved both its methods and forms of information collection; it simultaneously applied face-to-face interviews and self-enumerations, as well as used two new forms of information collection, CAPI and Webforms.
Given the changes in methods and forms of information collection, many other stages of the Census were changed to integrate IT. This practical improvement was beneficial in reducing the workload for Census personnel, facilitating enumerators to collect EA data, improving data quality, increasing transparency and accuracy of the statistical information production process, shortening the time required to release the Census results, reducing the long-term costs, and in applying IT in global survey organization.
46 / RESULTS - THE VIET NAM POPULATION AND HOUSING CENSUS OF 00:00 HOURS ON 1 APRIL 2019 46 | RESULTS - THE VIET NAM POPULATION AND HOUSING CENSUS OF 00:00 HOURS ON 1 APRIL 2019
(2) Improving survey sampling method
The 2019 Census was designed to collect intensive information on population, demographics and housing through a sample survey to ensure the representation of district-level indicators, while reducing overall workload and conserving Census budget.
The 2019 Census applied a stratified two-stage sampling method with around 40% of total sample EAs and a sample size of about 9% of households across the country (the 2009 Census had 17.9% and 15%, respectively).
The sample design of the 2019 Census tackled obstacles faced in designing the 2009 Census sample to improve design effect and reduce sampling errors, especially indicator errors related to household living conditions, as well as to reduce the budget required to implement the Census due to the influence of the sample size.
(3) Integrate information to estimate sustainable development indicators
The global sustainable development goals are universal objectives designed to end poverty, protect the planet and ensure that everyone enjoys peace and prosperity by 2030 in each member state of the United Nations. On 10 May 2017, the Prime Minister issued a National Action Plan for implementing the 2030 Agenda for Sustainable Development with 17 goals and 115 targets corresponding to the global Sustainable Development Goals. Pursuant to this Decision, on 22 January 2019, the Minister of Planning and Investment issued Circular No. 03/2019/TT-BKHDT regulating a Set of Viet Nam Sustainable Development Statistical Indicators consisting of 158 statistical indicators to meet Viet Nam Sustainable Development Goals (V-SDGs).
The 2019 Census was designed to integrate collected information on progress toward meeting the international sustainable development goals (SDGs) and the Viet Nam sustainable development goals (V-SDGs). Accordingly, the 2019 Census provided information that can be used to directly evaluate about 15% of the V-SDGs indicators. Information on population collected by the 2019 Census can also be used to indirectly calculate other V-SDGs indicators.
(4) Improving commune/ward base map and enumeration area division
According to international methodology, maps used in the Population and Housing Census include commune/ward base maps and detailed maps for each house/dwelling unit (also called detailed EA map) to avoid overlaps or omissions in the EA data collection process. The previous population and housing censuses compiled detailed maps with a diagram for each house. However, given the comparatively limited budget of the 2019 Population and Housing Census, maps were adjusted to include drawing commune/ward base maps only while still clearly defining the boundary between the EAs with orienting objects and residences. Although simplifying the detailed EA maps
RESULTS - THE VIET NAM POPULATION AND HOUSING CENSUS OF 00:00 HOURS ON 1 APRIL 2019 / 47 RESULTS - THE VIET NAM POPULATION AND HOUSING CENSUS OF 00:00 HOURS ON 1 APRIL 2019 | 47
helped reduce costs, it also increased the risk of overlapping or omitting households and household members during fieldwork. To address this, the Central Steering Committee developed specific guidelines with emphasis on the importance of drawing accurate commune/ward base maps and compiling detailed household lists.
(5) Developing a system of centralized data management and decentralized utilization
The 2019 Census data was managed at the central level through the information transmission system and data storage server. With three forms of information collection (CAPI, Webform, and PAPI), data was merged into a database for verification, processing and completion. In particular, the paper-based questionnaire, was checked after data entry and merged with CAPI and Webform data. Data from the three ministries - Ministry of National Defense, Ministry of Public Security, and Ministry of Foreign Affairs-were also verified for completeness and accuracy before merging into the common Census database. Any data changes during and after the EA data collection process was done on the server and stored for search and reference work.
The 2019 Census data was distributed in a detailed decentralized manner for each level of management and supervision during and after the EA data collection process. From this, the Operational Website was used to check Census progress and the quality of collected questionnaires; to generate preliminary statistical reports for all levels of management, direction and administration; and to check and confirm information with warning errors and edit data as needed.
Thus, the centralized data management and decentralized utilization of the 2019 Census helped avoid unsafe data risks and reduce the quantity of servers required to store CAPI and Webform data in 63 provinces and cities. Additionally, data management was carried out transparently and consistently at all levels. This enabled management and supervision be fully caught up on with Census information, particularly in the EA data collection stage.
3.2.2. Achievements
These five important breakthrough innovations improved upon and applied in the 2019 Census, generated strong results and set a good foundation for future censuses and surveys. The key results were as follows:
Improving quality of statistical information
The 2019 Census used the CAPI and Webform e-questionnaires to help control the EA information collection process, reduce the workload for enumerators and households, and ease the workload for enumerators by reducing the number of documents they had to carry and store. The software automatically checked for skips and created alerts for enumerators to check information
48 / RESULTS - THE VIET NAM POPULATION AND HOUSING CENSUS OF 00:00 HOURS ON 1 APRIL 2019 48 | RESULTS - THE VIET NAM POPULATION AND HOUSING CENSUS OF 00:00 HOURS ON 1 APRIL 2019
while still at the household. As a result, the information quality of the 2019 Census was strong. The assessment and appraisal of results in section 3.1 of this chapter details the effectiveness of the Census, partially due to the application of CAPI and Webforms.
Shortening the time for statistical information production
The convenience of electronic questionnaires using CAPI and Webforms helped shorten the time required to collect information for each questionnaire, leaving enumerators more time to check and complete the questionnaire.
Information collected from the Census was synchronized immediately following completion of each questionnaire. Thus, at the conclusion of the interview, the synchronized data was immediately available on the central server. The 2019 Census data was available one year earlier than the traditional survey method, which processed data with an intelligent character recognition tool. The preliminary results of the 2019 Census were published earlier with more detail and were promptly in the service of the National Assembly, the Government, Ministries, line-ministries and localities.
Transparency in direction, management and monitoring of the implementation of the Census
The 2019 Census data was centrally managed and disseminated by Steering Committee members and supervisors from central to local levels. With about 10,000 people authorized to access the system during data collection, progress and data information was made public to ensure timely and effective management and implementation of the Census. As a result, the emulation movement in the Census among local Steering Committees at the same level was strengthened, helping improve the overall information quality and implementation progress of the Census.
Improving IT application capacity
Given the innovations in IT applied across the Census, participating staff from enumerators to supervisors had to meet basic application requirements. For enumerators, in addition to the basic requirements of conducting a regular survey, they also needed to have access to mobile electronic devices such as tablets or smartphones and knowledge on how to use the basic features of these devices for data collection. Supervisors were required to be familiar with using CAPI software and clearly understand the process of verification and supervision via the Operational Website.
During the 25 days of the Census, supervisors monitored the EA data collection process daily through the Operational Website. This process helped supervisors direct and adjust as necessary to improve information quality, improve skills in software use and address raised issues. The capacity of Steering Committee members and supervisors at all levels in using the software strengthened, demonstrating that advanced learning through work was effective.
RESULTS - THE VIET NAM POPULATION AND HOUSING CENSUS OF 00:00 HOURS ON 1 APRIL 2019 / 49 RESULTS - THE VIET NAM POPULATION AND HOUSING CENSUS OF 00:00 HOURS ON 1 APRIL 2019 | 49
Use effectively state budget
IT application in the Census improved quality, shortened the time needed to publish data, and reduced costs as follows:
- No printed questionnaires cut down on the costs of printing, transporting and storing documents.
- Reduced the duration of training courses: The 2019 Census reduced the maximum number of training days but ensured the quality of training courses at all levels. Compared to the 2009 Census, and despite the increase in IT training, the number of training days at all levels of the 2019 Census decreased between 30% and 55%.
- Drawing only commune/ward base maps in the 2019 Census helped reduce the workload that had previously required 197,000 detailed EA maps.
- Reduced the time to review households prior to the survey: Although the average household size in each EA in 2019 increased compared to the 2009 Census, reviewing and updating the information from households registered to self-enumerate using Webforms significantly reduced the time required to conduct interviews in each EA. The resulting reduction from 2 days to 0.5 days also conserved Census resources.
- Reduction in the number of team leaders: Due to the IT application in data collection, the number of team leaders mobilized for the 2019 Census decreased markedly compared to 2009, approximately tenfold. This contributed significantly to the reduction in wages and conserving Census resources.
- Reduced cost of checking and finalizing questionnaires at all levels: The IT application in data collection enabled immediate data checking and finalizing on the Operational Website, contributing to saving resources. In 2009, the Central Acceptance Teams alone had to work within one month continuously to carry out acceptance tests in 63 provinces and cities directly under the Central Government.
- Reduced communication costs: The 2019 Census used many effective forms of communication, including communication through messages sent to more than 120 million mobile subscribers across the country. The cost of sending text messages was supported by the network operators.
- No purchasing of machinery and equipment for processing paper-based Census questionnaires: The 2019 Census mainly used electronic questionnaires to collect information, negating the need to buy an intelligent character recognition (ICR) device (specialized photo scanner) and copyright programs for scanning images.

50 / RESULTS - THE VIET NAM POPULATION AND HOUSING CENSUS OF 00:00 HOURS ON 1 APRIL 2019 50 | RESULTS - THE VIET NAM POPULATION AND HOUSING CENSUS OF 00:00 HOURS ON 1 APRIL 2019
- Tablets and smartphones for enumerators: The decision to mobilize personal smart phones and laptops belonging to enumerators for the 2019 Census helped to save budget by eliminating the need to purchase about 125,000 devices.
However, due to the IT application, a number of investment items in building software and upgrading information technology infrastructure system arose compared to the traditional paper-based method. In particular, there was an increase in costs for equipping minimum server systems, renting data receipt systems and transmission lines, as well as establishing software application programs.

RESULTS - THE VIET NAM POPULATION AND HOUSING CENSUS OF 00:00 HOURS ON 1 APRIL 2019 / 51
RESULTS - THE VIET NAM POPULATION AND HOUSING CENSUS OF 00:00 HOURS ON 1 APRIL 2019 | 51
PART II
KEY FINDINGS
PART IIKEY FINDINGS
Photo: Figures and Events Journal
52 / RESULTS - THE VIET NAM POPULATION AND HOUSING CENSUS OF 00:00 HOURS ON 1 APRIL 2019
Photo: UNFPA Viet Nam/ Nguyen Minh Duc
RESULTS - THE VIET NAM POPULATION AND HOUSING CENSUS OF 00:00 HOURS ON 1 APRIL 2019 / 53 RESULTS - THE VIET NAM POPULATION AND HOUSING CENSUS OF 00:00 HOURS ON 1 APRIL 2019 | 53
CHAPTER 4: POPULATION SIZE AND STRUCTURE 4.1. Population size
Though the population of Viet Nam has surpassed 96 million, the population growth rate from 2009-2019 was lower than that from 1999-2009, reducing Viet Nam’s rank on the world population map.
The total population of Viet Nam at time-point 00:00 on 1 April 2019 was 96,208,984 persons. Of which, the male population was 47,881,061 persons, or 49.8%, while the female population was 48,327,923 persons, or 50.2%. Viet Nam is the third most populous country in Southeast Asia (after Indonesia and the Philippines) and the fifteenth most populous country in the world10.
Over the last 10 years, the population of Viet Nam increased by 10.4 million persons. The average annual population growth rate from 2009-2019 was 1.14% per year, a slight reduction compared to the same rate from 1999-2009 (1.18% per year).
Table 4.1: Population size and population growth rate, 1979-2019
Population (Thousand persons)
Average annual population growth rate (%)
1979 52,742 -
1989 64,376 2.10
1999 76,323 1.70
2009 85,847 1.18
2019 96,209 1.14
Of the 54 ethnic groups in Viet Nam, the majority of the population identify as Kinh (85.3%) with 82.1 million persons. The average annual population growth rate of the Kinh community from 2009-2019 was 1.09% per year, below both the national average (1.14% per year) and the average annual population growth rate of other ethnic groups (1.42%).
Six of the 53 ethnic minority groups have a population of over 1 million, including the Tay, Thai, Muong, Mong, Khmer and Nung communities. The Tay ethnic group had the largest population among ethnic minority groups with 1.85 million. Eleven of the 53 ethnic minority groups had a population of less than 5,000 persons. O Du ethnic group had the smallest population with just 428 persons.
10 Source: United Nations Economic and Social Commission for Asia and the Pacific (ESCAP) and Population Reference Bureau
(PRB).
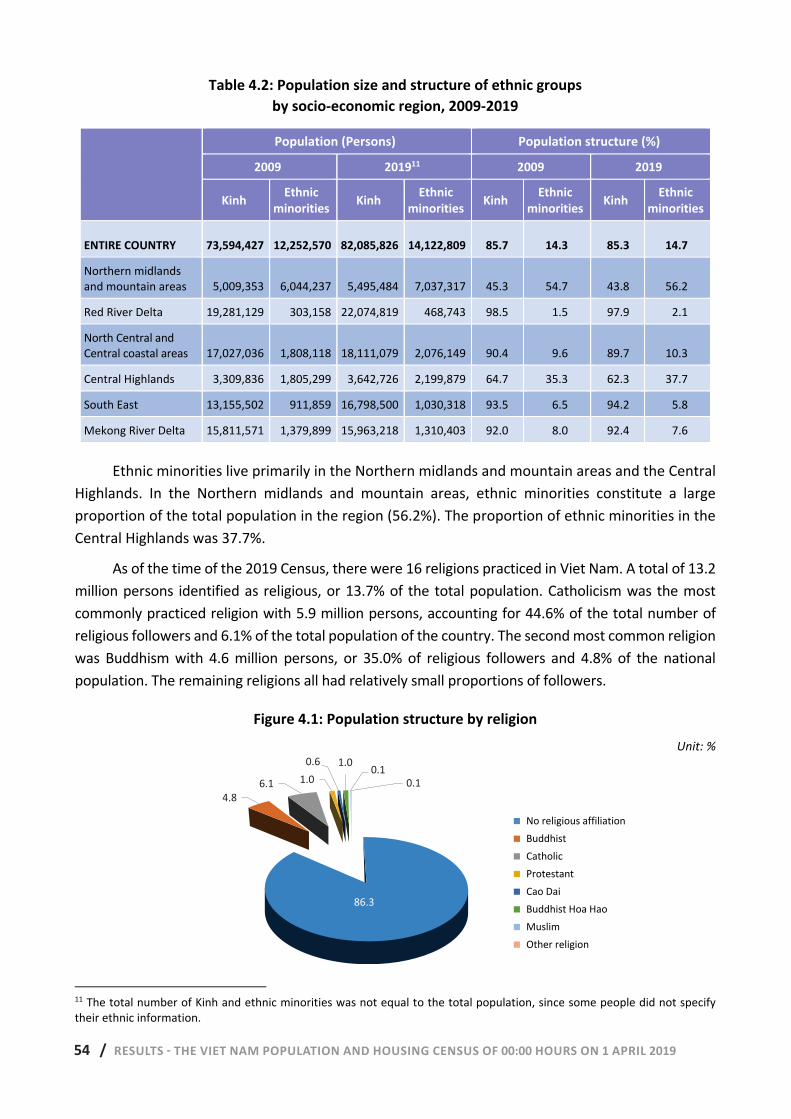
54 / RESULTS - THE VIET NAM POPULATION AND HOUSING CENSUS OF 00:00 HOURS ON 1 APRIL 2019 54 | RESULTS - THE VIET NAM POPULATION AND HOUSING CENSUS OF 00:00 HOURS ON 1 APRIL 2019
Table 4.2: Population size and structure of ethnic groups by socio-economic region, 2009-2019
Population (Persons) Population structure (%)
2009 201911 2009 2019
Kinh Ethnic minorities Kinh Ethnic
minorities Kinh Ethnic minorities Kinh Ethnic
minorities
ENTIRE COUNTRY 73,594,427 12,252,570 82,085,826 14,122,809 85.7 14.3 85.3 14.7
Northern midlands and mountain areas 5,009,353 6,044,237 5,495,484 7,037,317 45.3 54.7 43.8 56.2
Red River Delta 19,281,129 303,158 22,074,819 468,743 98.5 1.5 97.9 2.1
North Central and Central coastal areas 17,027,036 1,808,118 18,111,079 2,076,149 90.4 9.6 89.7 10.3
Central Highlands 3,309,836 1,805,299 3,642,726 2,199,879 64.7 35.3 62.3 37.7
South East 13,155,502 911,859 16,798,500 1,030,318 93.5 6.5 94.2 5.8
Mekong River Delta 15,811,571 1,379,899 15,963,218 1,310,403 92.0 8.0 92.4 7.6
Ethnic minorities live primarily in the Northern midlands and mountain areas and the Central Highlands. In the Northern midlands and mountain areas, ethnic minorities constitute a large proportion of the total population in the region (56.2%). The proportion of ethnic minorities in the Central Highlands was 37.7%.
As of the time of the 2019 Census, there were 16 religions practiced in Viet Nam. A total of 13.2 million persons identified as religious, or 13.7% of the total population. Catholicism was the most commonly practiced religion with 5.9 million persons, accounting for 44.6% of the total number of religious followers and 6.1% of the total population of the country. The second most common religion was Buddhism with 4.6 million persons, or 35.0% of religious followers and 4.8% of the national population. The remaining religions all had relatively small proportions of followers.
Figure 4.1: Population structure by religion Unit: %
11 The total number of Kinh and ethnic minorities was not equal to the total population, since some people did not specify their ethnic information.
86.3
4.86.1 1.0 0.6 1.0 0.1
0.1 No religious affiliationBuddhistCatholicProtestantCao DaiBuddhist Hoa HaoMuslimOther religion
8,3
6.1 1.01.0
4.8
0.60 .1
0.1
86.3
No religious affiliation BuddhistCatholicProtestantCao DaiBuddhist Hoa Hao MuslimOther religion
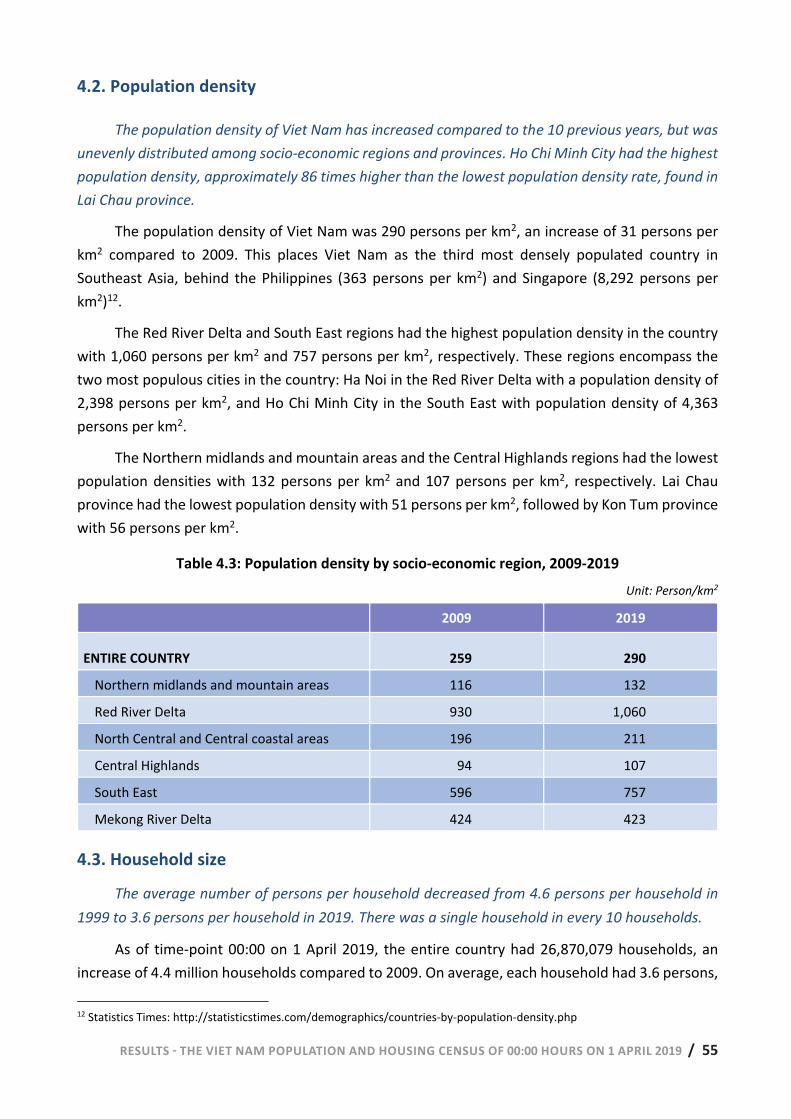
RESULTS - THE VIET NAM POPULATION AND HOUSING CENSUS OF 00:00 HOURS ON 1 APRIL 2019 / 55 RESULTS - THE VIET NAM POPULATION AND HOUSING CENSUS OF 00:00 HOURS ON 1 APRIL 2019 | 55
4.2. Population density
The population density of Viet Nam has increased compared to the 10 previous years, but was unevenly distributed among socio-economic regions and provinces. Ho Chi Minh City had the highest population density, approximately 86 times higher than the lowest population density rate, found in Lai Chau province.
The population density of Viet Nam was 290 persons per km2, an increase of 31 persons per km2 compared to 2009. This places Viet Nam as the third most densely populated country in Southeast Asia, behind the Philippines (363 persons per km2) and Singapore (8,292 persons per km2)12.
The Red River Delta and South East regions had the highest population density in the country with 1,060 persons per km2 and 757 persons per km2, respectively. These regions encompass the two most populous cities in the country: Ha Noi in the Red River Delta with a population density of 2,398 persons per km2, and Ho Chi Minh City in the South East with population density of 4,363 persons per km2.
The Northern midlands and mountain areas and the Central Highlands regions had the lowest population densities with 132 persons per km2 and 107 persons per km2, respectively. Lai Chau province had the lowest population density with 51 persons per km2, followed by Kon Tum province with 56 persons per km2.
Table 4.3: Population density by socio-economic region, 2009-2019 Unit: Person/km2
2009 2019
ENTIRE COUNTRY 259 290 Northern midlands and mountain areas 116 132
Red River Delta 930 1,060
North Central and Central coastal areas 196 211
Central Highlands 94 107
South East 596 757
Mekong River Delta 424 423
4.3. Household size
The average number of persons per household decreased from 4.6 persons per household in 1999 to 3.6 persons per household in 2019. There was a single household in every 10 households.
As of time-point 00:00 on 1 April 2019, the entire country had 26,870,079 households, an increase of 4.4 million households compared to 2009. On average, each household had 3.6 persons,
12 Statistics Times: http://statisticstimes.com/demographics/countries-by-population-density.php
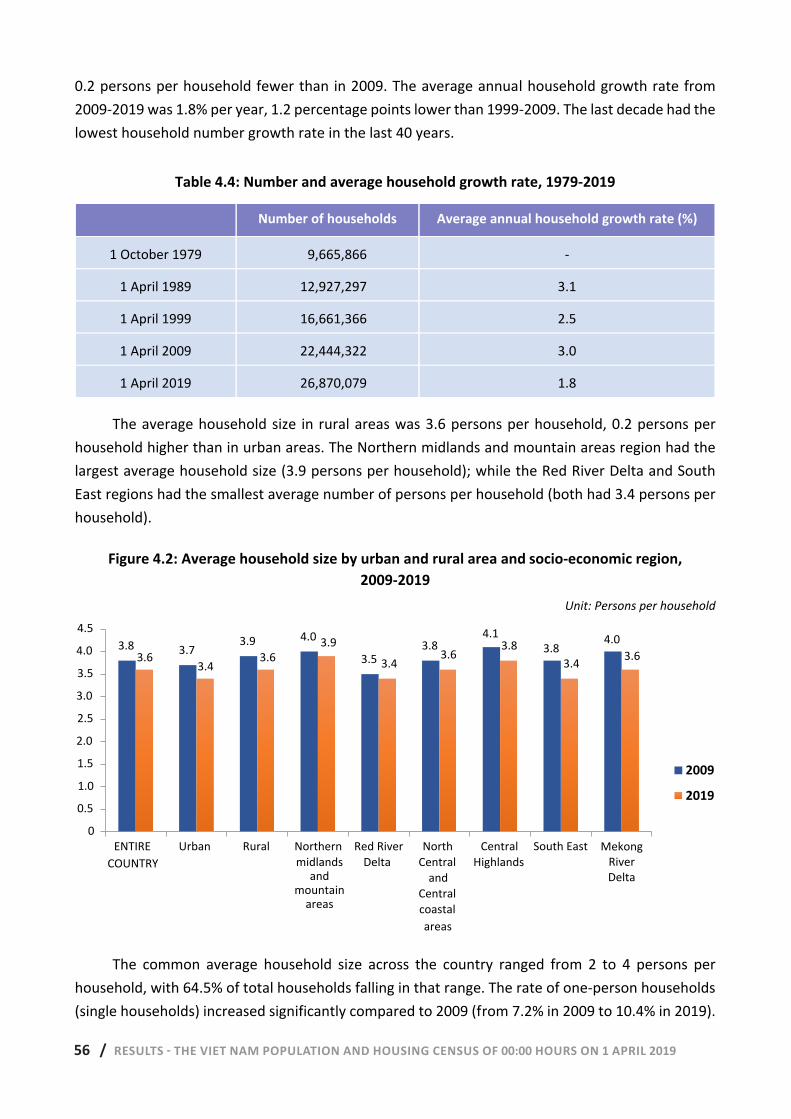
56 / RESULTS - THE VIET NAM POPULATION AND HOUSING CENSUS OF 00:00 HOURS ON 1 APRIL 2019 56 | RESULTS - THE VIET NAM POPULATION AND HOUSING CENSUS OF 00:00 HOURS ON 1 APRIL 2019
0.2 persons per household fewer than in 2009. The average annual household growth rate from 2009-2019 was 1.8% per year, 1.2 percentage points lower than 1999-2009. The last decade had the lowest household number growth rate in the last 40 years.
Table 4.4: Number and average household growth rate, 1979-2019
Number of households Average annual household growth rate (%)
1 October 1979 9,665,866 -
1 April 1989 12,927,297 3.1
1 April 1999 16,661,366 2.5
1 April 2009 22,444,322 3.0
1 April 2019 26,870,079 1.8
The average household size in rural areas was 3.6 persons per household, 0.2 persons per household higher than in urban areas. The Northern midlands and mountain areas region had the largest average household size (3.9 persons per household); while the Red River Delta and South East regions had the smallest average number of persons per household (both had 3.4 persons per household).
Figure 4.2: Average household size by urban and rural area and socio-economic region, 2009-2019
Unit: Persons per household
The common average household size across the country ranged from 2 to 4 persons per
household, with 64.5% of total households falling in that range. The rate of one-person households (single households) increased significantly compared to 2009 (from 7.2% in 2009 to 10.4% in 2019).
3.8 3.73.9 4.0
3.53.8
4.13.8
4.03.6
3.43.6
3.9
3.43.6
3.83.4
3.6
00.5
11.5
22.5
33.5
44.5
WHOLECOUNTRY
Urban Rural Northernmidlands
andmountain
areas
Red RiverDelta
NorthCentral
andCentralcoastalareas
CentralHighlands
South East MekongRiverDelta
2009
2019
3.8 3.73.9 4.0
3.53.8
4.13.8
4.03.6
3.43.6
3.93.4
3.63.8
3.4 3.6
0
0.5
1.0
1.5
2.0
2.5
3.0
3.5
4.0
4.5
ENTIRECOUNTRY
Urban Rural Northernmidlands
andmountain
areas
Red RiverDelta
NorthCentral
andCentralcoastalareas
CentralHighlands
South East MekongRiverDelta
2009
2019
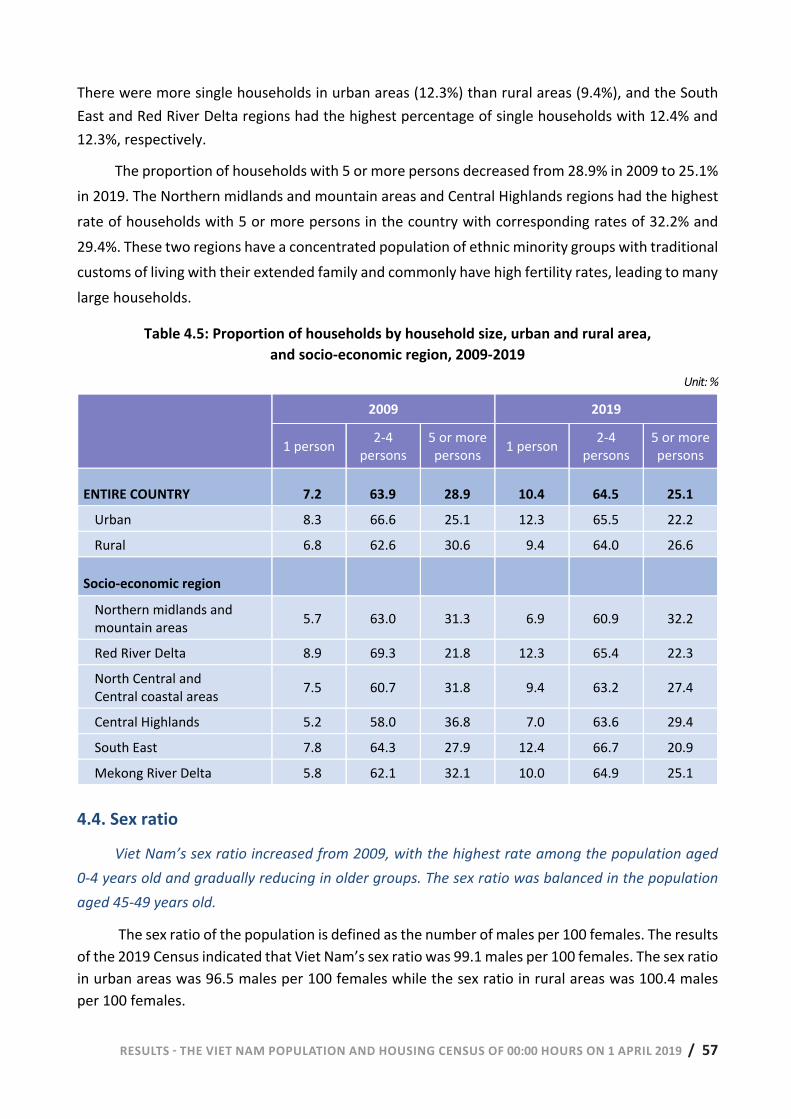
RESULTS - THE VIET NAM POPULATION AND HOUSING CENSUS OF 00:00 HOURS ON 1 APRIL 2019 / 57 RESULTS - THE VIET NAM POPULATION AND HOUSING CENSUS OF 00:00 HOURS ON 1 APRIL 2019 | 57
There were more single households in urban areas (12.3%) than rural areas (9.4%), and the South East and Red River Delta regions had the highest percentage of single households with 12.4% and 12.3%, respectively.
The proportion of households with 5 or more persons decreased from 28.9% in 2009 to 25.1% in 2019. The Northern midlands and mountain areas and Central Highlands regions had the highest rate of households with 5 or more persons in the country with corresponding rates of 32.2% and 29.4%. These two regions have a concentrated population of ethnic minority groups with traditional customs of living with their extended family and commonly have high fertility rates, leading to many large households.
Table 4.5: Proportion of households by household size, urban and rural area, and socio-economic region, 2009-2019
Unit: %
2009 2019
1 person 2-4 persons
5 or more persons 1 person 2-4
persons 5 or more persons
ENTIRE COUNTRY 7.2 63.9 28.9 10.4 64.5 25.1 Urban 8.3 66.6 25.1 12.3 65.5 22.2 Rural 6.8 62.6 30.6 9.4 64.0 26.6
Socio-economic region Northern midlands and mountain areas 5.7 63.0 31.3 6.9 60.9 32.2
Red River Delta 8.9 69.3 21.8 12.3 65.4 22.3 North Central and Central coastal areas 7.5 60.7 31.8 9.4 63.2 27.4
Central Highlands 5.2 58.0 36.8 7.0 63.6 29.4 South East 7.8 64.3 27.9 12.4 66.7 20.9 Mekong River Delta 5.8 62.1 32.1 10.0 64.9 25.1
4.4. Sex ratio
Viet Nam’s sex ratio increased from 2009, with the highest rate among the population aged 0-4 years old and gradually reducing in older groups. The sex ratio was balanced in the population aged 45-49 years old.
The sex ratio of the population is defined as the number of males per 100 females. The results of the 2019 Census indicated that Viet Nam’s sex ratio was 99.1 males per 100 females. The sex ratio in urban areas was 96.5 males per 100 females while the sex ratio in rural areas was 100.4 males per 100 females.
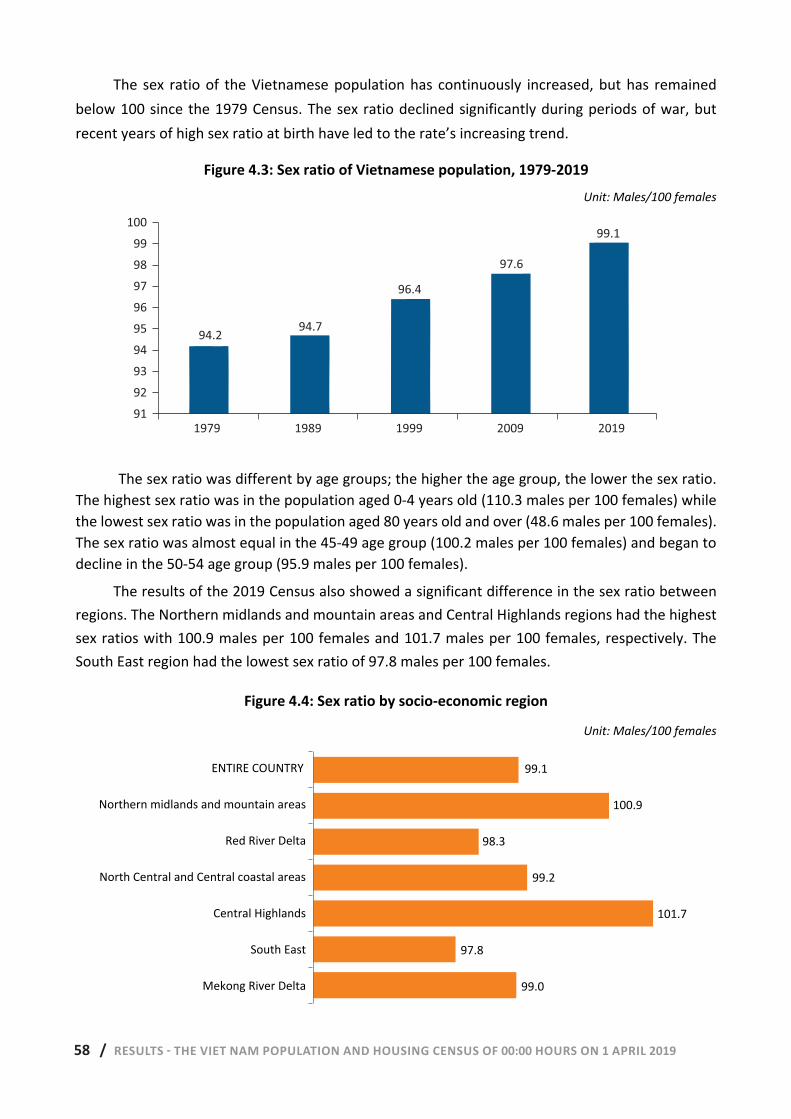
58 / RESULTS - THE VIET NAM POPULATION AND HOUSING CENSUS OF 00:00 HOURS ON 1 APRIL 2019 58 | RESULTS - THE VIET NAM POPULATION AND HOUSING CENSUS OF 00:00 HOURS ON 1 APRIL 2019
The sex ratio of the Vietnamese population has continuously increased, but has remained below 100 since the 1979 Census. The sex ratio declined significantly during periods of war, but recent years of high sex ratio at birth have led to the rate’s increasing trend.
Figure 4.3: Sex ratio of Vietnamese population, 1979-2019 Unit: Males/100 females
The sex ratio was different by age groups; the higher the age group, the lower the sex ratio.
The highest sex ratio was in the population aged 0-4 years old (110.3 males per 100 females) while the lowest sex ratio was in the population aged 80 years old and over (48.6 males per 100 females). The sex ratio was almost equal in the 45-49 age group (100.2 males per 100 females) and began to decline in the 50-54 age group (95.9 males per 100 females).
The results of the 2019 Census also showed a significant difference in the sex ratio between regions. The Northern midlands and mountain areas and Central Highlands regions had the highest sex ratios with 100.9 males per 100 females and 101.7 males per 100 females, respectively. The South East region had the lowest sex ratio of 97.8 males per 100 females.
Figure 4.4: Sex ratio by socio-economic region
Unit: Males/100 females
94.294.7
96.4
97.6
99.1
91
92
93
94
95
96
97
98
99
100
1979 1989 1999 2009 2019
99.0
97.8
101.7
99.2
98.3
100.9
99.1
Mekong River Delta
South East
Central Highlands
North Central and Central coastal areas
Red River Delta
Northern midlands and mountain areas
WHOLE COUNTRY
99.0
97.8
101.7
99.2
98.3
100.9
99.1
Mekong River Delta
South East
Central Highlands
North Central and Central coastal areas
Red River Delta
Northern midlands and mountain areas
ENTIRE COUNTRY
100
99
98
97
96
95
94
93
92
91
94.294.7
96.4
97.6
99.1
1979 1989 1999 2009 2019
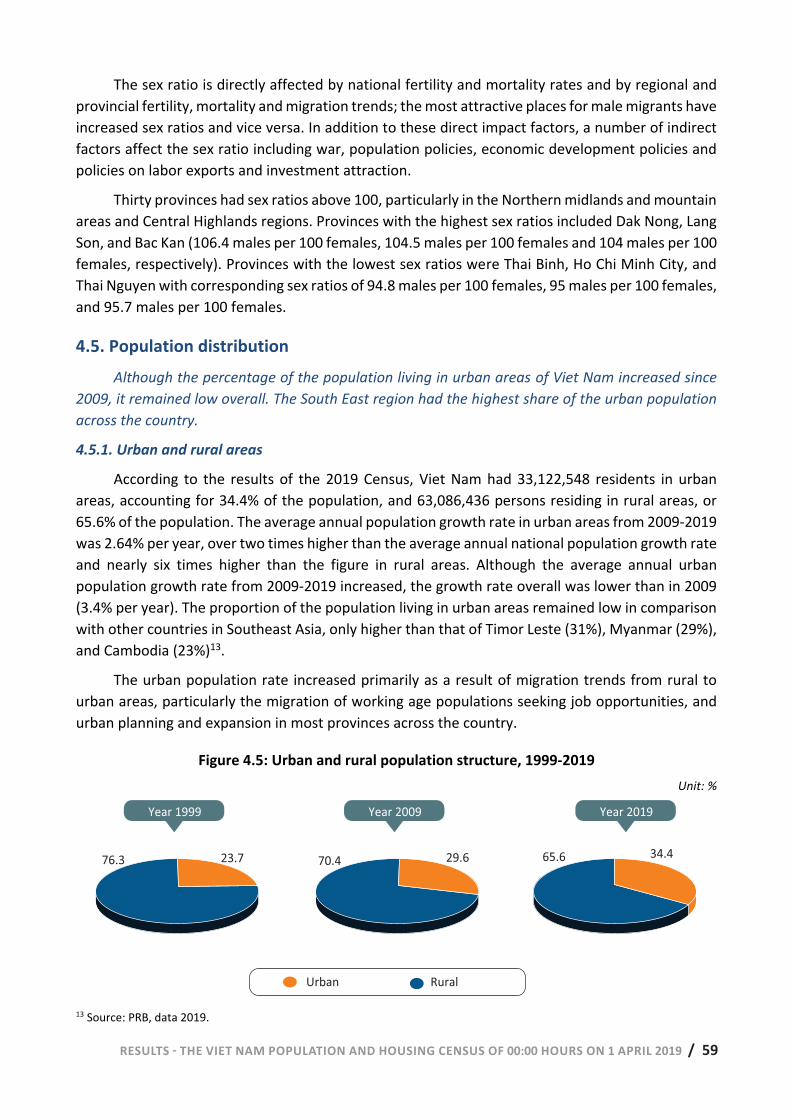
RESULTS - THE VIET NAM POPULATION AND HOUSING CENSUS OF 00:00 HOURS ON 1 APRIL 2019 / 59 RESULTS - THE VIET NAM POPULATION AND HOUSING CENSUS OF 00:00 HOURS ON 1 APRIL 2019 | 59
The sex ratio is directly affected by national fertility and mortality rates and by regional and provincial fertility, mortality and migration trends; the most attractive places for male migrants have increased sex ratios and vice versa. In addition to these direct impact factors, a number of indirect factors affect the sex ratio including war, population policies, economic development policies and policies on labor exports and investment attraction.
Thirty provinces had sex ratios above 100, particularly in the Northern midlands and mountain areas and Central Highlands regions. Provinces with the highest sex ratios included Dak Nong, Lang Son, and Bac Kan (106.4 males per 100 females, 104.5 males per 100 females and 104 males per 100 females, respectively). Provinces with the lowest sex ratios were Thai Binh, Ho Chi Minh City, and Thai Nguyen with corresponding sex ratios of 94.8 males per 100 females, 95 males per 100 females, and 95.7 males per 100 females.
4.5. Population distribution Although the percentage of the population living in urban areas of Viet Nam increased since
2009, it remained low overall. The South East region had the highest share of the urban population across the country.
4.5.1. Urban and rural areas
According to the results of the 2019 Census, Viet Nam had 33,122,548 residents in urban areas, accounting for 34.4% of the population, and 63,086,436 persons residing in rural areas, or 65.6% of the population. The average annual population growth rate in urban areas from 2009-2019 was 2.64% per year, over two times higher than the average annual national population growth rate and nearly six times higher than the figure in rural areas. Although the average annual urban population growth rate from 2009-2019 increased, the growth rate overall was lower than in 2009 (3.4% per year). The proportion of the population living in urban areas remained low in comparison with other countries in Southeast Asia, only higher than that of Timor Leste (31%), Myanmar (29%), and Cambodia (23%)13.
The urban population rate increased primarily as a result of migration trends from rural to urban areas, particularly the migration of working age populations seeking job opportunities, and urban planning and expansion in most provinces across the country.
Figure 4.5: Urban and rural population structure, 1999-2019 Unit: %
13 Source: PRB, data 2019.
Year 1999
76.3 23.7
Year 2009 Year 2019
70.4 65.629.6 34.4
Urban Rural
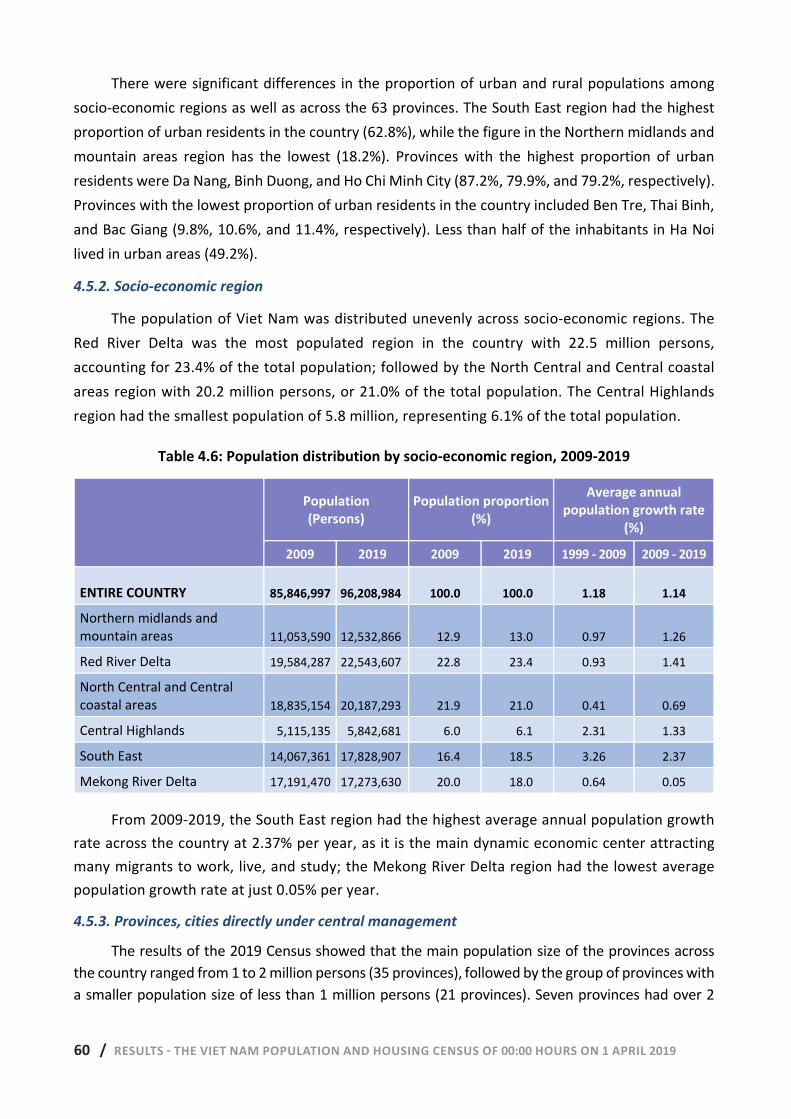
60 / RESULTS - THE VIET NAM POPULATION AND HOUSING CENSUS OF 00:00 HOURS ON 1 APRIL 2019 60 | RESULTS - THE VIET NAM POPULATION AND HOUSING CENSUS OF 00:00 HOURS ON 1 APRIL 2019
There were significant differences in the proportion of urban and rural populations among socio-economic regions as well as across the 63 provinces. The South East region had the highest proportion of urban residents in the country (62.8%), while the figure in the Northern midlands and mountain areas region has the lowest (18.2%). Provinces with the highest proportion of urban residents were Da Nang, Binh Duong, and Ho Chi Minh City (87.2%, 79.9%, and 79.2%, respectively). Provinces with the lowest proportion of urban residents in the country included Ben Tre, Thai Binh, and Bac Giang (9.8%, 10.6%, and 11.4%, respectively). Less than half of the inhabitants in Ha Noi lived in urban areas (49.2%).
4.5.2. Socio-economic region
The population of Viet Nam was distributed unevenly across socio-economic regions. The Red River Delta was the most populated region in the country with 22.5 million persons, accounting for 23.4% of the total population; followed by the North Central and Central coastal areas region with 20.2 million persons, or 21.0% of the total population. The Central Highlands region had the smallest population of 5.8 million, representing 6.1% of the total population.
Table 4.6: Population distribution by socio-economic region, 2009-2019
Population (Persons)
Population proportion (%)
Average annual population growth rate
(%)
2009 2019 2009 2019 1999 - 2009 2009 - 2019
ENTIRE COUNTRY 85,846,997 96,208,984 100.0 100.0 1.18 1.14
Northern midlands and mountain areas 11,053,590 12,532,866 12.9 13.0 0.97 1.26
Red River Delta 19,584,287 22,543,607 22.8 23.4 0.93 1.41
North Central and Central coastal areas 18,835,154 20,187,293 21.9 21.0 0.41 0.69
Central Highlands 5,115,135 5,842,681 6.0 6.1 2.31 1.33
South East 14,067,361 17,828,907 16.4 18.5 3.26 2.37
Mekong River Delta 17,191,470 17,273,630 20.0 18.0 0.64 0.05
From 2009-2019, the South East region had the highest average annual population growth rate across the country at 2.37% per year, as it is the main dynamic economic center attracting many migrants to work, live, and study; the Mekong River Delta region had the lowest average population growth rate at just 0.05% per year.
4.5.3. Provinces, cities directly under central management
The results of the 2019 Census showed that the main population size of the provinces across the country ranged from 1 to 2 million persons (35 provinces), followed by the group of provinces with a smaller population size of less than 1 million persons (21 provinces). Seven provinces had over 2
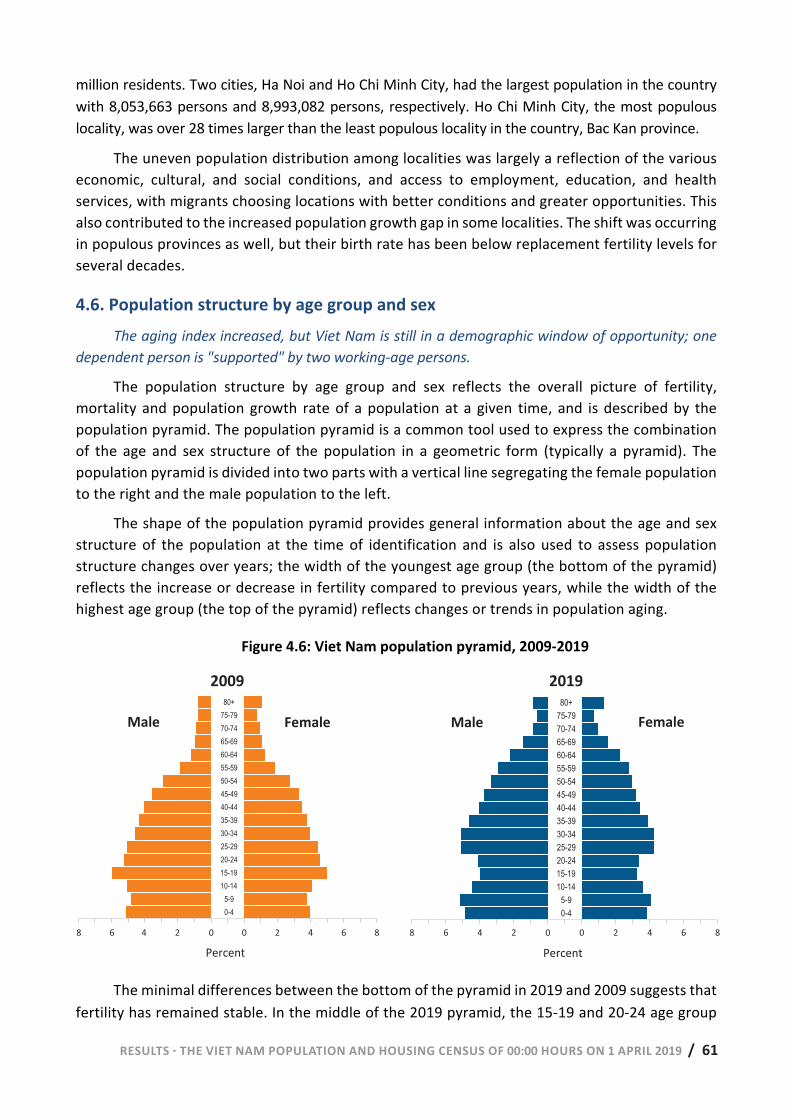
RESULTS - THE VIET NAM POPULATION AND HOUSING CENSUS OF 00:00 HOURS ON 1 APRIL 2019 / 61 RESULTS - THE VIET NAM POPULATION AND HOUSING CENSUS OF 00:00 HOURS ON 1 APRIL 2019 | 61
million residents. Two cities, Ha Noi and Ho Chi Minh City, had the largest population in the country with 8,053,663 persons and 8,993,082 persons, respectively. Ho Chi Minh City, the most populous locality, was over 28 times larger than the least populous locality in the country, Bac Kan province.
The uneven population distribution among localities was largely a reflection of the various economic, cultural, and social conditions, and access to employment, education, and health services, with migrants choosing locations with better conditions and greater opportunities. This also contributed to the increased population growth gap in some localities. The shift was occurring in populous provinces as well, but their birth rate has been below replacement fertility levels for several decades.
4.6. Population structure by age group and sex The aging index increased, but Viet Nam is still in a demographic window of opportunity; one
dependent person is "supported" by two working-age persons.
The population structure by age group and sex reflects the overall picture of fertility, mortality and population growth rate of a population at a given time, and is described by the population pyramid. The population pyramid is a common tool used to express the combination of the age and sex structure of the population in a geometric form (typically a pyramid). The population pyramid is divided into two parts with a vertical line segregating the female population to the right and the male population to the left.
The shape of the population pyramid provides general information about the age and sex structure of the population at the time of identification and is also used to assess population structure changes over years; the width of the youngest age group (the bottom of the pyramid) reflects the increase or decrease in fertility compared to previous years, while the width of the highest age group (the top of the pyramid) reflects changes or trends in population aging.
Figure 4.6: Viet Nam population pyramid, 2009-2019
2009 2019
The minimal differences between the bottom of the pyramid in 2019 and 2009 suggests that fertility has remained stable. In the middle of the 2019 pyramid, the 15-19 and 20-24 age group
0-4 5-9
10-1415-1920-2425-2930-3435-3940-4445-4950-5455-5960-6465-6970-7475-79
80+
0-4 5-9
10-1415-1920-2425-2930-3435-3940-4445-4950-5455-5960-6465-6970-7475-79
80+
Female
8 6 4 2 0 0 2 4 6 8 Percent
Male Male
8 6 4 2 0 0 2 4 6 8 Percent
Female
8
2009 2019
0-4
5-9
10-14
15-19
20-24
25-29
30-34
35-39
40-44
45-49
50-54
55-59
60-64
65-69
70-74
75-79
80+
0-4
5-9
10-14
15-19
20-24
25-29
30-34
35-39
40-44
45-49
50-54
55-59
60-64
65-69
70-74
75-79
80+
Female Female
0 2 4 6 8
Percent
Male
Percent
Male
6 4 2 0 0 2 4 6 8 8 6 4 2 0
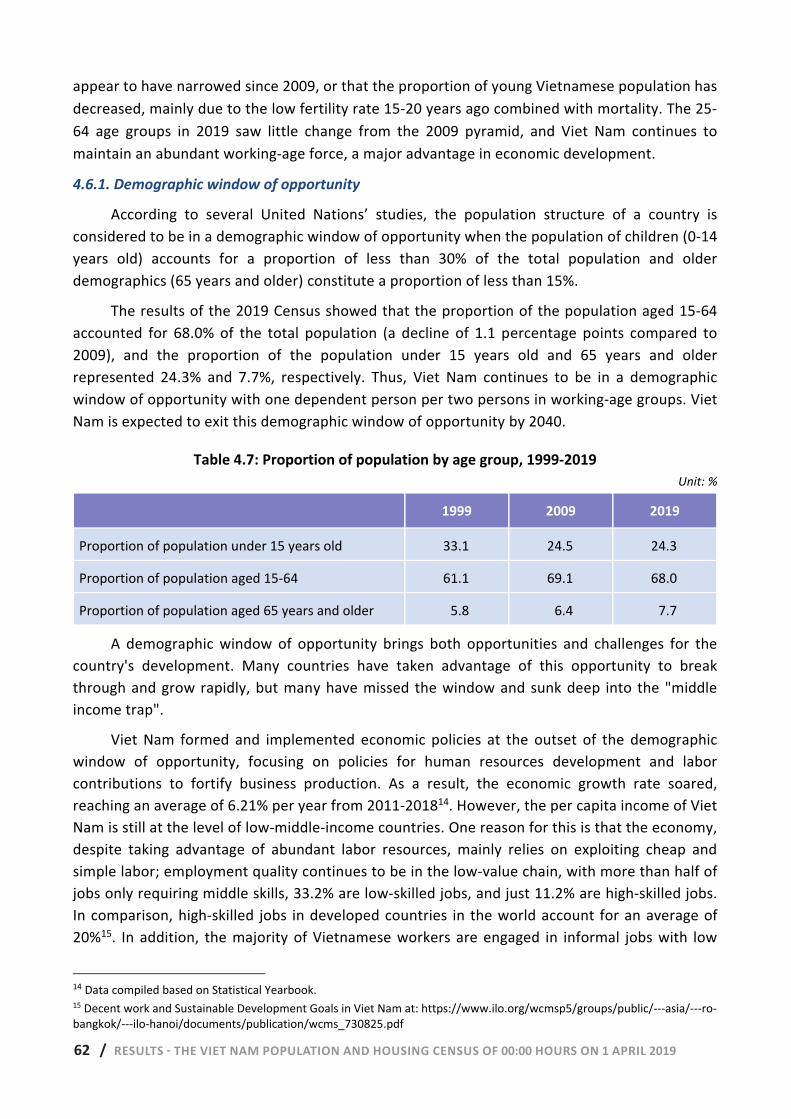
62 / RESULTS - THE VIET NAM POPULATION AND HOUSING CENSUS OF 00:00 HOURS ON 1 APRIL 2019 62 | RESULTS - THE VIET NAM POPULATION AND HOUSING CENSUS OF 00:00 HOURS ON 1 APRIL 2019
appear to have narrowed since 2009, or that the proportion of young Vietnamese population has decreased, mainly due to the low fertility rate 15-20 years ago combined with mortality. The 25-64 age groups in 2019 saw little change from the 2009 pyramid, and Viet Nam continues to maintain an abundant working-age force, a major advantage in economic development.
4.6.1. Demographic window of opportunity
According to several United Nations’ studies, the population structure of a country is considered to be in a demographic window of opportunity when the population of children (0-14 years old) accounts for a proportion of less than 30% of the total population and older demographics (65 years and older) constitute a proportion of less than 15%.
The results of the 2019 Census showed that the proportion of the population aged 15-64 accounted for 68.0% of the total population (a decline of 1.1 percentage points compared to 2009), and the proportion of the population under 15 years old and 65 years and older represented 24.3% and 7.7%, respectively. Thus, Viet Nam continues to be in a demographic window of opportunity with one dependent person per two persons in working-age groups. Viet Nam is expected to exit this demographic window of opportunity by 2040.
Table 4.7: Proportion of population by age group, 1999-2019 Unit: %
1999 2009 2019
Proportion of population under 15 years old 33.1 24.5 24.3
Proportion of population aged 15-64 61.1 69.1 68.0
Proportion of population aged 65 years and older 5.8 6.4 7.7
A demographic window of opportunity brings both opportunities and challenges for the country's development. Many countries have taken advantage of this opportunity to break through and grow rapidly, but many have missed the window and sunk deep into the "middle income trap".
Viet Nam formed and implemented economic policies at the outset of the demographic window of opportunity, focusing on policies for human resources development and labor contributions to fortify business production. As a result, the economic growth rate soared, reaching an average of 6.21% per year from 2011-201814. However, the per capita income of Viet Nam is still at the level of low-middle-income countries. One reason for this is that the economy, despite taking advantage of abundant labor resources, mainly relies on exploiting cheap and simple labor; employment quality continues to be in the low-value chain, with more than half of jobs only requiring middle skills, 33.2% are low-skilled jobs, and just 11.2% are high-skilled jobs. In comparison, high-skilled jobs in developed countries in the world account for an average of 20%15. In addition, the majority of Vietnamese workers are engaged in informal jobs with low
14 Data compiled based on Statistical Yearbook. 15 Decent work and Sustainable Development Goals in Viet Nam at: https://www.ilo.org/wcmsp5/groups/public/---asia/---ro-bangkok/---ilo-hanoi/documents/publication/wcms_730825.pdf
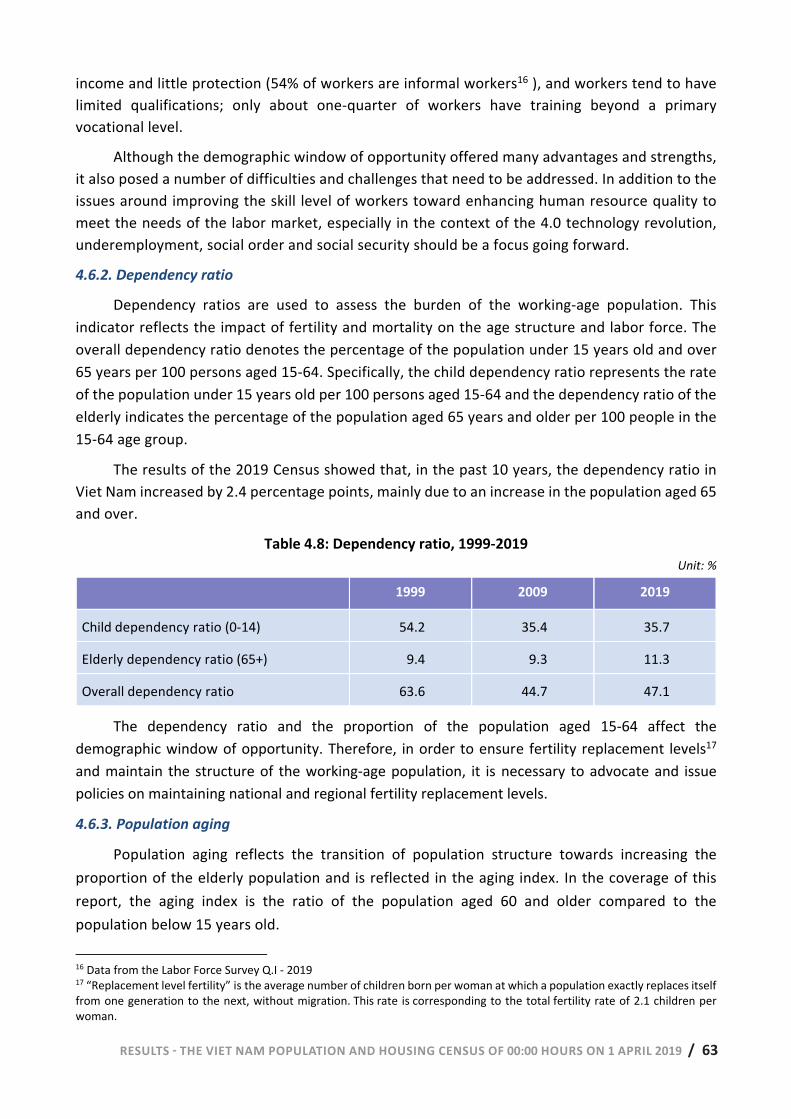
RESULTS - THE VIET NAM POPULATION AND HOUSING CENSUS OF 00:00 HOURS ON 1 APRIL 2019 / 63 RESULTS - THE VIET NAM POPULATION AND HOUSING CENSUS OF 00:00 HOURS ON 1 APRIL 2019 | 63
income and little protection (54% of workers are informal workers16 ), and workers tend to have limited qualifications; only about one-quarter of workers have training beyond a primary vocational level.
Although the demographic window of opportunity offered many advantages and strengths, it also posed a number of difficulties and challenges that need to be addressed. In addition to the issues around improving the skill level of workers toward enhancing human resource quality to meet the needs of the labor market, especially in the context of the 4.0 technology revolution, underemployment, social order and social security should be a focus going forward.
4.6.2. Dependency ratio
Dependency ratios are used to assess the burden of the working-age population. This indicator reflects the impact of fertility and mortality on the age structure and labor force. The overall dependency ratio denotes the percentage of the population under 15 years old and over 65 years per 100 persons aged 15-64. Specifically, the child dependency ratio represents the rate of the population under 15 years old per 100 persons aged 15-64 and the dependency ratio of the elderly indicates the percentage of the population aged 65 years and older per 100 people in the 15-64 age group.
The results of the 2019 Census showed that, in the past 10 years, the dependency ratio in Viet Nam increased by 2.4 percentage points, mainly due to an increase in the population aged 65 and over.
Table 4.8: Dependency ratio, 1999-2019 Unit: %
1999 2009 2019
Child dependency ratio (0-14) 54.2 35.4 35.7
Elderly dependency ratio (65+) 9.4 9.3 11.3
Overall dependency ratio 63.6 44.7 47.1
The dependency ratio and the proportion of the population aged 15-64 affect the demographic window of opportunity. Therefore, in order to ensure fertility replacement levels17 and maintain the structure of the working-age population, it is necessary to advocate and issue policies on maintaining national and regional fertility replacement levels.
4.6.3. Population aging
Population aging reflects the transition of population structure towards increasing the proportion of the elderly population and is reflected in the aging index. In the coverage of this report, the aging index is the ratio of the population aged 60 and older compared to the population below 15 years old.
16 Data from the Labor Force Survey Q.I - 2019 17 “Replacement level fertility” is the average number of children born per woman at which a population exactly replaces itself from one generation to the next, without migration. This rate is corresponding to the total fertility rate of 2.1 children per woman.
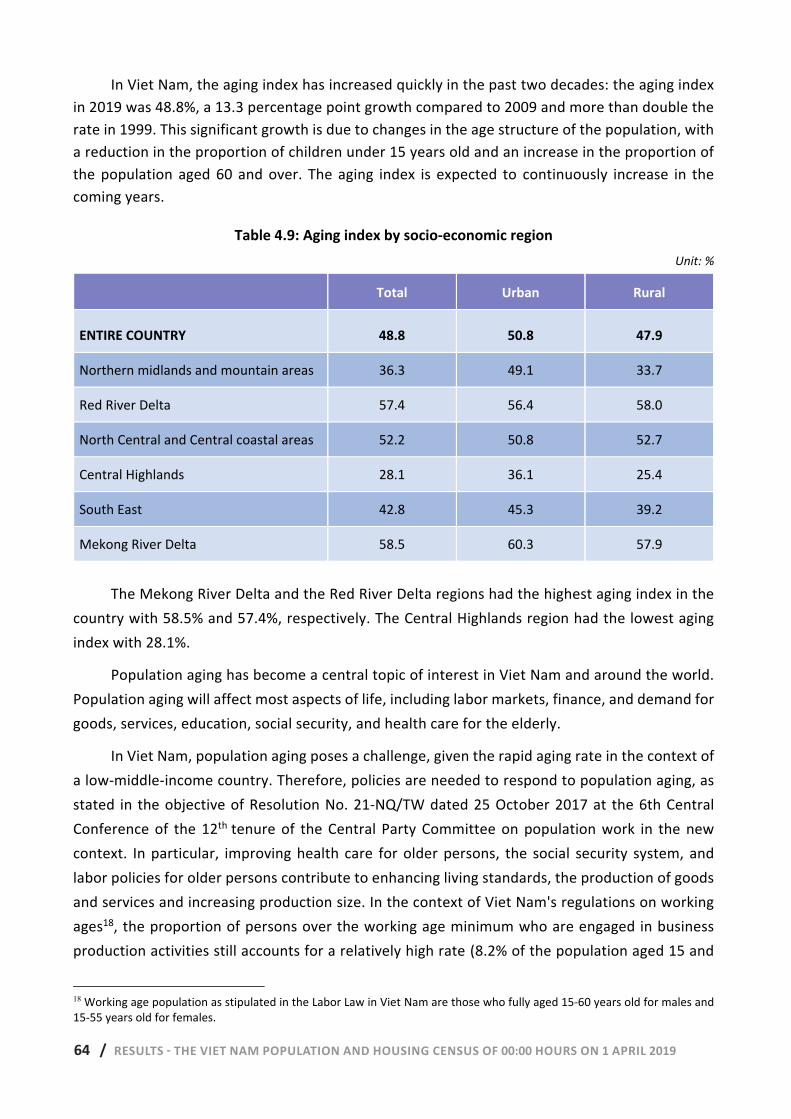
64 / RESULTS - THE VIET NAM POPULATION AND HOUSING CENSUS OF 00:00 HOURS ON 1 APRIL 2019 64 | RESULTS - THE VIET NAM POPULATION AND HOUSING CENSUS OF 00:00 HOURS ON 1 APRIL 2019
In Viet Nam, the aging index has increased quickly in the past two decades: the aging index in 2019 was 48.8%, a 13.3 percentage point growth compared to 2009 and more than double the rate in 1999. This significant growth is due to changes in the age structure of the population, with a reduction in the proportion of children under 15 years old and an increase in the proportion of the population aged 60 and over. The aging index is expected to continuously increase in the coming years.
Table 4.9: Aging index by socio-economic region Unit: %
Total Urban Rural
ENTIRE COUNTRY 48.8 50.8 47.9
Northern midlands and mountain areas 36.3 49.1 33.7
Red River Delta 57.4 56.4 58.0
North Central and Central coastal areas 52.2 50.8 52.7
Central Highlands 28.1 36.1 25.4
South East 42.8 45.3 39.2
Mekong River Delta 58.5 60.3 57.9
The Mekong River Delta and the Red River Delta regions had the highest aging index in the country with 58.5% and 57.4%, respectively. The Central Highlands region had the lowest aging index with 28.1%.
Population aging has become a central topic of interest in Viet Nam and around the world. Population aging will affect most aspects of life, including labor markets, finance, and demand for goods, services, education, social security, and health care for the elderly.
In Viet Nam, population aging poses a challenge, given the rapid aging rate in the context of a low-middle-income country. Therefore, policies are needed to respond to population aging, as stated in the objective of Resolution No. 21-NQ/TW dated 25 October 2017 at the 6th Central Conference of the 12th tenure of the Central Party Committee on population work in the new context. In particular, improving health care for older persons, the social security system, and labor policies for older persons contribute to enhancing living standards, the production of goods and services and increasing production size. In the context of Viet Nam's regulations on working ages18, the proportion of persons over the working age minimum who are engaged in business production activities still accounts for a relatively high rate (8.2% of the population aged 15 and
18 Working age population as stipulated in the Labor Law in Viet Nam are those who fully aged 15-60 years old for males and 15-55 years old for females.
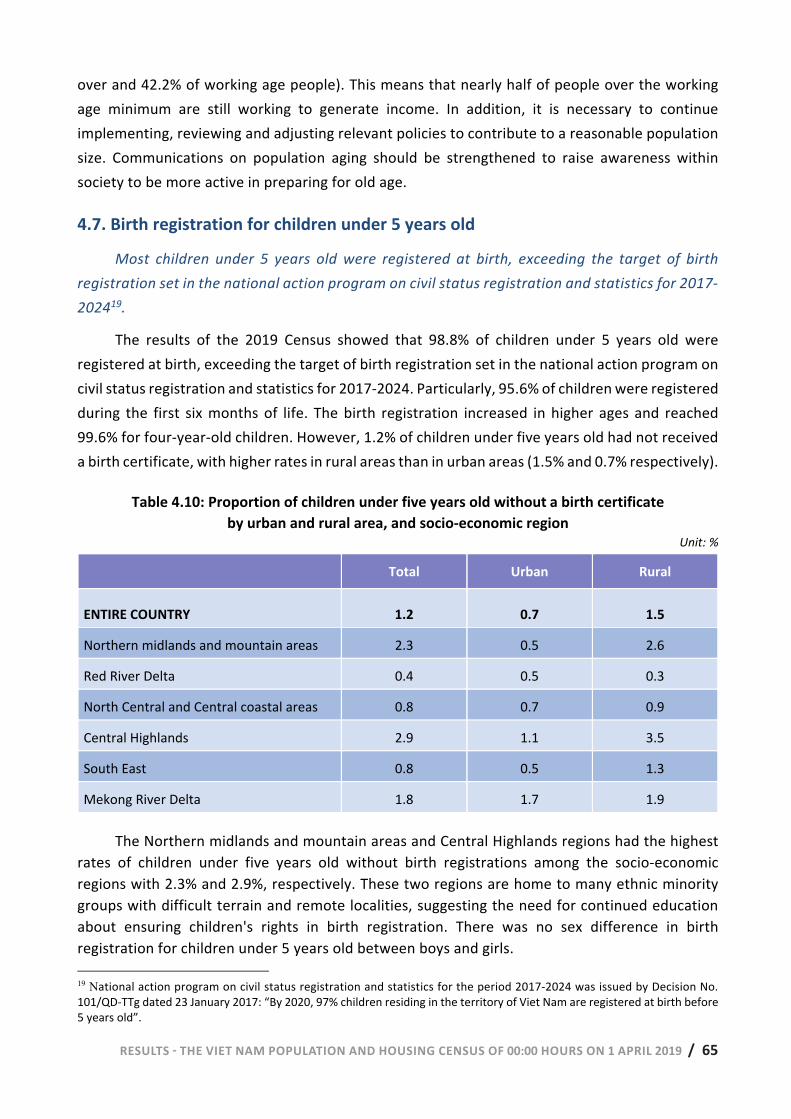
RESULTS - THE VIET NAM POPULATION AND HOUSING CENSUS OF 00:00 HOURS ON 1 APRIL 2019 / 65 RESULTS - THE VIET NAM POPULATION AND HOUSING CENSUS OF 00:00 HOURS ON 1 APRIL 2019 | 65
over and 42.2% of working age people). This means that nearly half of people over the working age minimum are still working to generate income. In addition, it is necessary to continue implementing, reviewing and adjusting relevant policies to contribute to a reasonable population size. Communications on population aging should be strengthened to raise awareness within society to be more active in preparing for old age.
4.7. Birth registration for children under 5 years old
Most children under 5 years old were registered at birth, exceeding the target of birth registration set in the national action program on civil status registration and statistics for 2017-202419.
The results of the 2019 Census showed that 98.8% of children under 5 years old were registered at birth, exceeding the target of birth registration set in the national action program on civil status registration and statistics for 2017-2024. Particularly, 95.6% of children were registered during the first six months of life. The birth registration increased in higher ages and reached 99.6% for four-year-old children. However, 1.2% of children under five years old had not received a birth certificate, with higher rates in rural areas than in urban areas (1.5% and 0.7% respectively).
Table 4.10: Proportion of children under five years old without a birth certificate by urban and rural area, and socio-economic region
Unit: %
Total Urban Rural
ENTIRE COUNTRY 1.2 0.7 1.5
Northern midlands and mountain areas 2.3 0.5 2.6
Red River Delta 0.4 0.5 0.3
North Central and Central coastal areas 0.8 0.7 0.9
Central Highlands 2.9 1.1 3.5
South East 0.8 0.5 1.3
Mekong River Delta 1.8 1.7 1.9
The Northern midlands and mountain areas and Central Highlands regions had the highest rates of children under five years old without birth registrations among the socio-economic regions with 2.3% and 2.9%, respectively. These two regions are home to many ethnic minority groups with difficult terrain and remote localities, suggesting the need for continued education about ensuring children's rights in birth registration. There was no sex difference in birth registration for children under 5 years old between boys and girls. 19 National action program on civil status registration and statistics for the period 2017-2024 was issued by Decision No. 101/QD-TTg dated 23 January 2017: “By 2020, 97% children residing in the territory of Viet Nam are registered at birth before 5 years old”.
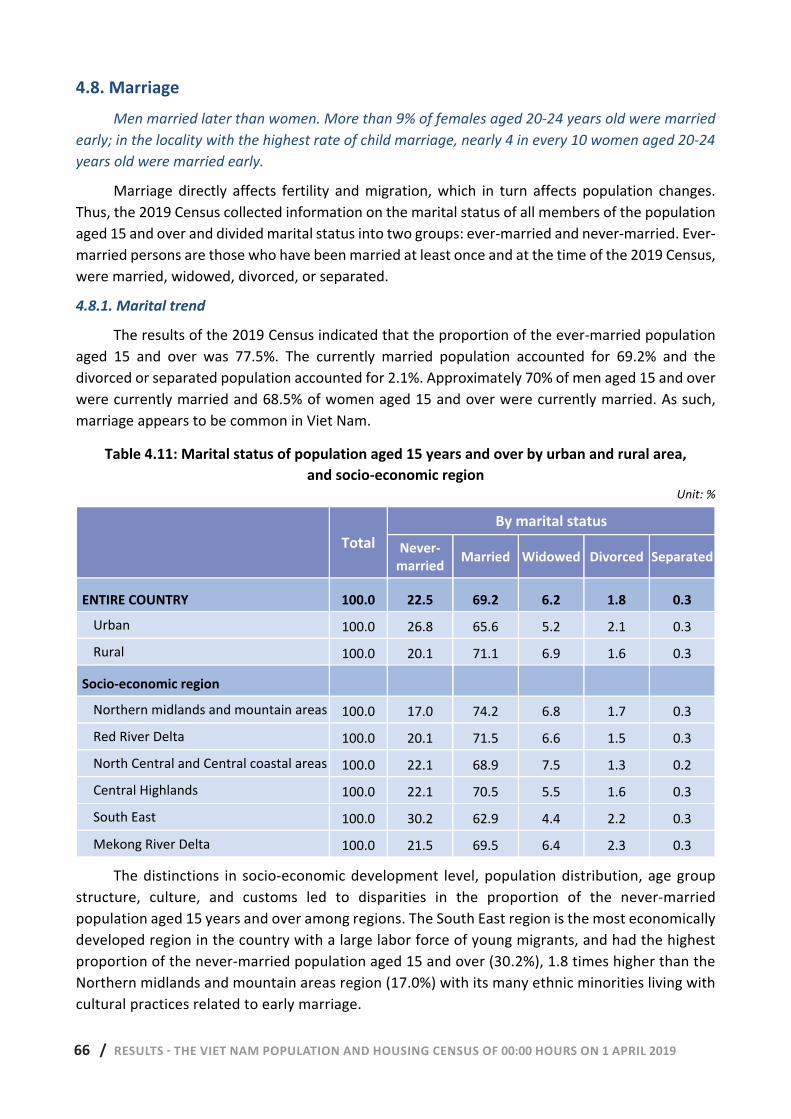
66 / RESULTS - THE VIET NAM POPULATION AND HOUSING CENSUS OF 00:00 HOURS ON 1 APRIL 2019 66 | RESULTS - THE VIET NAM POPULATION AND HOUSING CENSUS OF 00:00 HOURS ON 1 APRIL 2019
4.8. Marriage Men married later than women. More than 9% of females aged 20-24 years old were married
early; in the locality with the highest rate of child marriage, nearly 4 in every 10 women aged 20-24 years old were married early.
Marriage directly affects fertility and migration, which in turn affects population changes. Thus, the 2019 Census collected information on the marital status of all members of the population aged 15 and over and divided marital status into two groups: ever-married and never-married. Ever-married persons are those who have been married at least once and at the time of the 2019 Census, were married, widowed, divorced, or separated.
4.8.1. Marital trend
The results of the 2019 Census indicated that the proportion of the ever-married population aged 15 and over was 77.5%. The currently married population accounted for 69.2% and the divorced or separated population accounted for 2.1%. Approximately 70% of men aged 15 and over were currently married and 68.5% of women aged 15 and over were currently married. As such, marriage appears to be common in Viet Nam.
Table 4.11: Marital status of population aged 15 years and over by urban and rural area, and socio-economic region
Unit: %
Total By marital status
Never-married Married Widowed Divorced Separated
ENTIRE COUNTRY 100.0 22.5 69.2 6.2 1.8 0.3 Urban 100.0 26.8 65.6 5.2 2.1 0.3 Rural 100.0 20.1 71.1 6.9 1.6 0.3
Socio-economic region Northern midlands and mountain areas 100.0 17.0 74.2 6.8 1.7 0.3 Red River Delta 100.0 20.1 71.5 6.6 1.5 0.3 North Central and Central coastal areas 100.0 22.1 68.9 7.5 1.3 0.2 Central Highlands 100.0 22.1 70.5 5.5 1.6 0.3 South East 100.0 30.2 62.9 4.4 2.2 0.3 Mekong River Delta 100.0 21.5 69.5 6.4 2.3 0.3
The distinctions in socio-economic development level, population distribution, age group structure, culture, and customs led to disparities in the proportion of the never-married population aged 15 years and over among regions. The South East region is the most economically developed region in the country with a large labor force of young migrants, and had the highest proportion of the never-married population aged 15 and over (30.2%), 1.8 times higher than the Northern midlands and mountain areas region (17.0%) with its many ethnic minorities living with cultural practices related to early marriage.
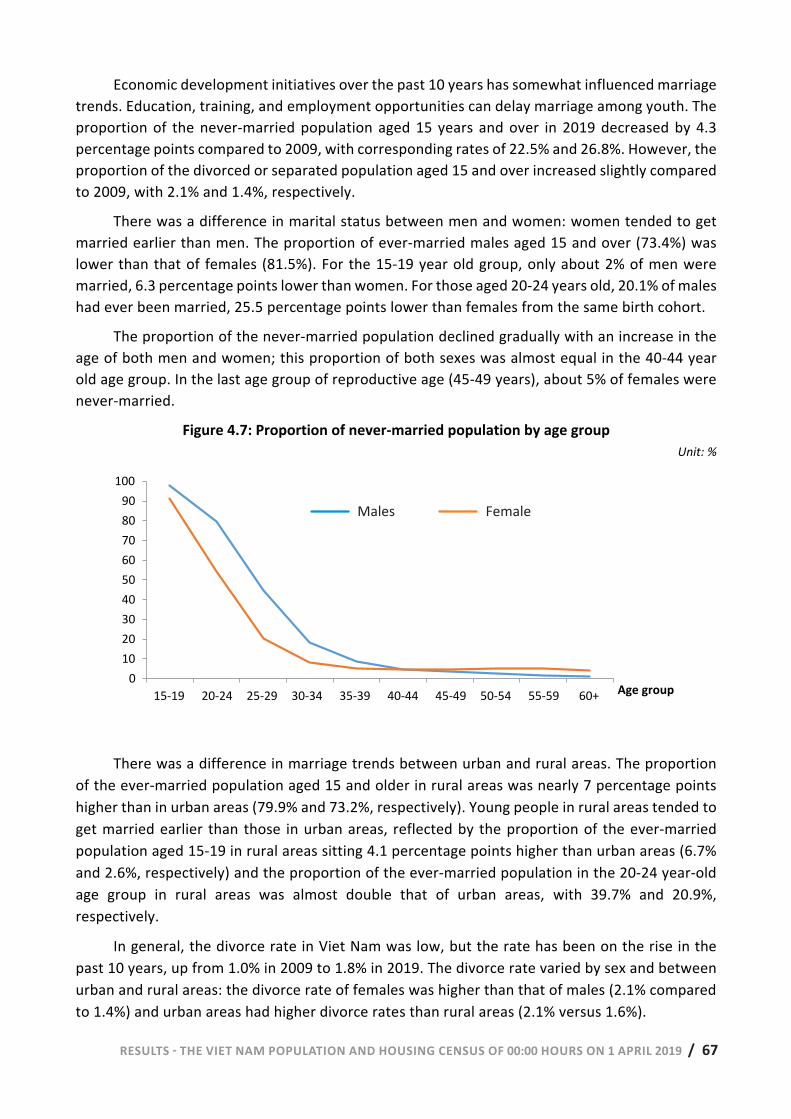
RESULTS - THE VIET NAM POPULATION AND HOUSING CENSUS OF 00:00 HOURS ON 1 APRIL 2019 / 67 RESULTS - THE VIET NAM POPULATION AND HOUSING CENSUS OF 00:00 HOURS ON 1 APRIL 2019 | 67
Economic development initiatives over the past 10 years has somewhat influenced marriage trends. Education, training, and employment opportunities can delay marriage among youth. The proportion of the never-married population aged 15 years and over in 2019 decreased by 4.3 percentage points compared to 2009, with corresponding rates of 22.5% and 26.8%. However, the proportion of the divorced or separated population aged 15 and over increased slightly compared to 2009, with 2.1% and 1.4%, respectively.
There was a difference in marital status between men and women: women tended to get married earlier than men. The proportion of ever-married males aged 15 and over (73.4%) was lower than that of females (81.5%). For the 15-19 year old group, only about 2% of men were married, 6.3 percentage points lower than women. For those aged 20-24 years old, 20.1% of males had ever been married, 25.5 percentage points lower than females from the same birth cohort.
The proportion of the never-married population declined gradually with an increase in the age of both men and women; this proportion of both sexes was almost equal in the 40-44 year old age group. In the last age group of reproductive age (45-49 years), about 5% of females were never-married.
Figure 4.7: Proportion of never-married population by age group Unit: %
There was a difference in marriage trends between urban and rural areas. The proportion
of the ever-married population aged 15 and older in rural areas was nearly 7 percentage points higher than in urban areas (79.9% and 73.2%, respectively). Young people in rural areas tended to get married earlier than those in urban areas, reflected by the proportion of the ever-married population aged 15-19 in rural areas sitting 4.1 percentage points higher than urban areas (6.7% and 2.6%, respectively) and the proportion of the ever-married population in the 20-24 year-old age group in rural areas was almost double that of urban areas, with 39.7% and 20.9%, respectively.
In general, the divorce rate in Viet Nam was low, but the rate has been on the rise in the past 10 years, up from 1.0% in 2009 to 1.8% in 2019. The divorce rate varied by sex and between urban and rural areas: the divorce rate of females was higher than that of males (2.1% compared to 1.4%) and urban areas had higher divorce rates than rural areas (2.1% versus 1.6%).
0102030405060708090
100
15-19 20-24 25-29 30-34 35-39 40-44 45-49 50-54 55-59 60+Age group
Percent
0102030405060708090
100
15-19 20-24 25-29 30-34 35-39 40-44 45-49 50-54 55-59 60+ Age group
Males Female
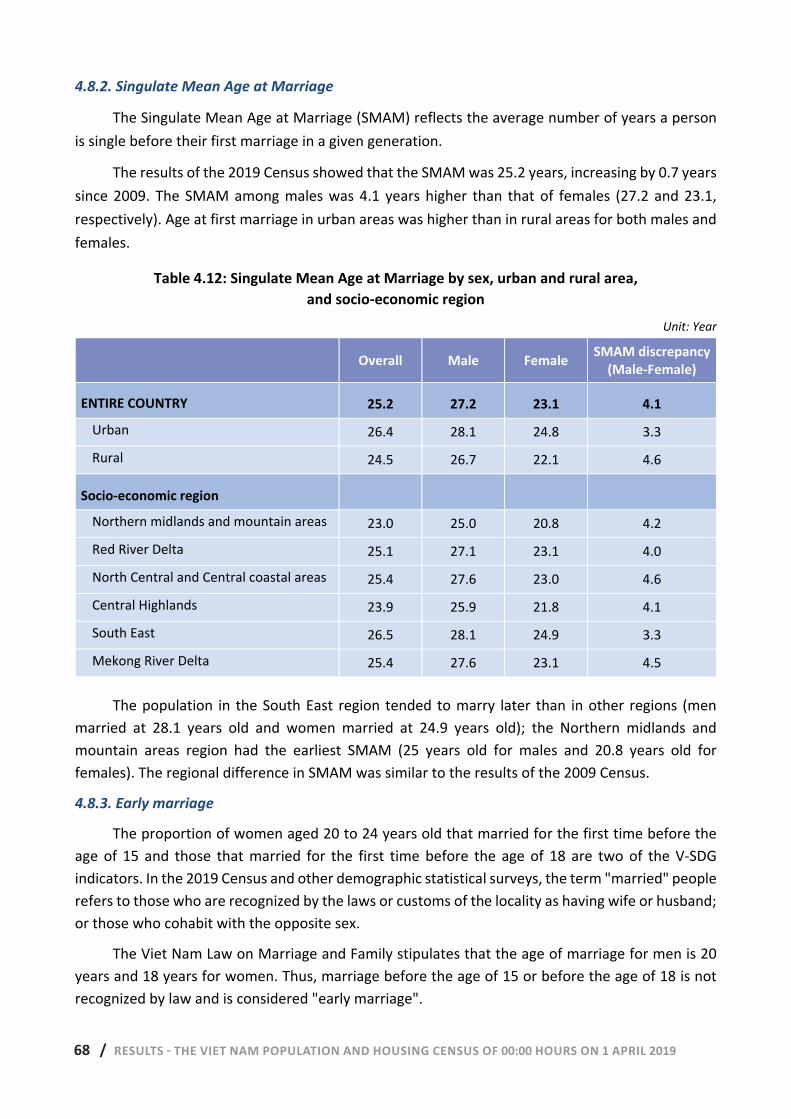
68 / RESULTS - THE VIET NAM POPULATION AND HOUSING CENSUS OF 00:00 HOURS ON 1 APRIL 2019 68 | RESULTS - THE VIET NAM POPULATION AND HOUSING CENSUS OF 00:00 HOURS ON 1 APRIL 2019
4.8.2. Singulate Mean Age at Marriage
The Singulate Mean Age at Marriage (SMAM) reflects the average number of years a person is single before their first marriage in a given generation.
The results of the 2019 Census showed that the SMAM was 25.2 years, increasing by 0.7 years since 2009. The SMAM among males was 4.1 years higher than that of females (27.2 and 23.1, respectively). Age at first marriage in urban areas was higher than in rural areas for both males and females.
Table 4.12: Singulate Mean Age at Marriage by sex, urban and rural area, and socio-economic region
Unit: Year
Overall Male Female SMAM discrepancy (Male-Female)
ENTIRE COUNTRY 25.2 27.2 23.1 4.1
Urban 26.4 28.1 24.8 3.3
Rural 24.5 26.7 22.1 4.6
Socio-economic region
Northern midlands and mountain areas 23.0 25.0 20.8 4.2
Red River Delta 25.1 27.1 23.1 4.0
North Central and Central coastal areas 25.4 27.6 23.0 4.6
Central Highlands 23.9 25.9 21.8 4.1
South East 26.5 28.1 24.9 3.3
Mekong River Delta 25.4 27.6 23.1 4.5
The population in the South East region tended to marry later than in other regions (men married at 28.1 years old and women married at 24.9 years old); the Northern midlands and mountain areas region had the earliest SMAM (25 years old for males and 20.8 years old for females). The regional difference in SMAM was similar to the results of the 2009 Census.
4.8.3. Early marriage
The proportion of women aged 20 to 24 years old that married for the first time before the age of 15 and those that married for the first time before the age of 18 are two of the V-SDG indicators. In the 2019 Census and other demographic statistical surveys, the term "married" people refers to those who are recognized by the laws or customs of the locality as having wife or husband; or those who cohabit with the opposite sex.
The Viet Nam Law on Marriage and Family stipulates that the age of marriage for men is 20 years and 18 years for women. Thus, marriage before the age of 15 or before the age of 18 is not recognized by law and is considered "early marriage".
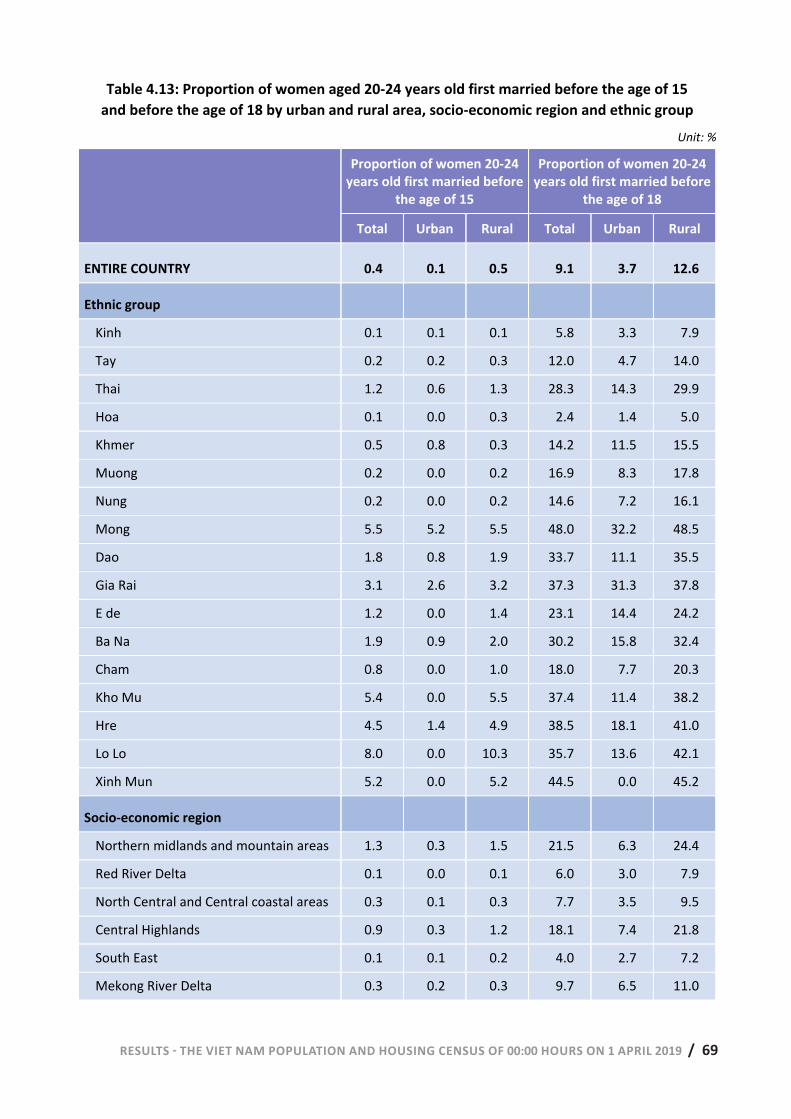
RESULTS - THE VIET NAM POPULATION AND HOUSING CENSUS OF 00:00 HOURS ON 1 APRIL 2019 / 69 RESULTS - THE VIET NAM POPULATION AND HOUSING CENSUS OF 00:00 HOURS ON 1 APRIL 2019 | 69
Table 4.13: Proportion of women aged 20-24 years old first married before the age of 15 and before the age of 18 by urban and rural area, socio-economic region and ethnic group
Unit: %
Proportion of women 20-24 years old first married before
the age of 15
Proportion of women 20-24 years old first married before
the age of 18
Total Urban Rural Total Urban Rural
ENTIRE COUNTRY 0.4 0.1 0.5 9.1 3.7 12.6
Ethnic group
Kinh 0.1 0.1 0.1 5.8 3.3 7.9
Tay 0.2 0.2 0.3 12.0 4.7 14.0
Thai 1.2 0.6 1.3 28.3 14.3 29.9
Hoa 0.1 0.0 0.3 2.4 1.4 5.0
Khmer 0.5 0.8 0.3 14.2 11.5 15.5
Muong 0.2 0.0 0.2 16.9 8.3 17.8
Nung 0.2 0.0 0.2 14.6 7.2 16.1
Mong 5.5 5.2 5.5 48.0 32.2 48.5
Dao 1.8 0.8 1.9 33.7 11.1 35.5
Gia Rai 3.1 2.6 3.2 37.3 31.3 37.8
E de 1.2 0.0 1.4 23.1 14.4 24.2
Ba Na 1.9 0.9 2.0 30.2 15.8 32.4
Cham 0.8 0.0 1.0 18.0 7.7 20.3
Kho Mu 5.4 0.0 5.5 37.4 11.4 38.2
Hre 4.5 1.4 4.9 38.5 18.1 41.0
Lo Lo 8.0 0.0 10.3 35.7 13.6 42.1
Xinh Mun 5.2 0.0 5.2 44.5 0.0 45.2
Socio-economic region
Northern midlands and mountain areas 1.3 0.3 1.5 21.5 6.3 24.4
Red River Delta 0.1 0.0 0.1 6.0 3.0 7.9
North Central and Central coastal areas 0.3 0.1 0.3 7.7 3.5 9.5
Central Highlands 0.9 0.3 1.2 18.1 7.4 21.8
South East 0.1 0.1 0.2 4.0 2.7 7.2
Mekong River Delta 0.3 0.2 0.3 9.7 6.5 11.0
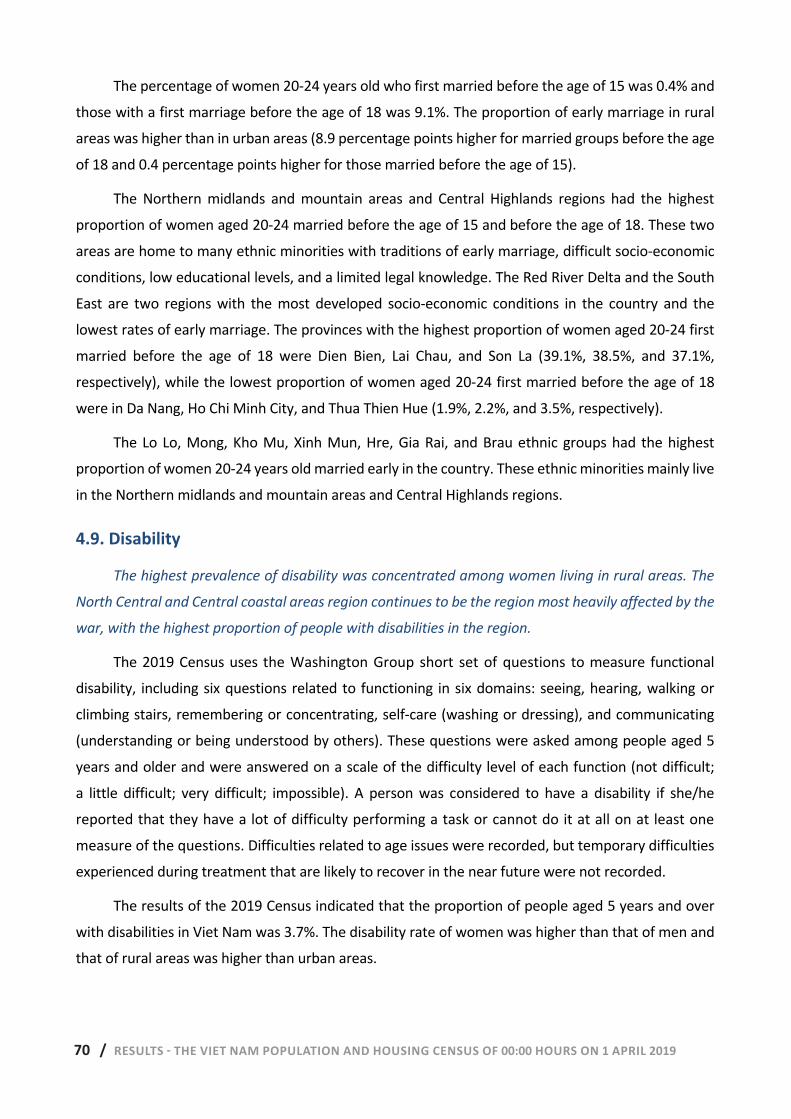
70 / RESULTS - THE VIET NAM POPULATION AND HOUSING CENSUS OF 00:00 HOURS ON 1 APRIL 2019 70 | RESULTS - THE VIET NAM POPULATION AND HOUSING CENSUS OF 00:00 HOURS ON 1 APRIL 2019
The percentage of women 20-24 years old who first married before the age of 15 was 0.4% and those with a first marriage before the age of 18 was 9.1%. The proportion of early marriage in rural areas was higher than in urban areas (8.9 percentage points higher for married groups before the age of 18 and 0.4 percentage points higher for those married before the age of 15).
The Northern midlands and mountain areas and Central Highlands regions had the highest proportion of women aged 20-24 married before the age of 15 and before the age of 18. These two areas are home to many ethnic minorities with traditions of early marriage, difficult socio-economic conditions, low educational levels, and a limited legal knowledge. The Red River Delta and the South East are two regions with the most developed socio-economic conditions in the country and the lowest rates of early marriage. The provinces with the highest proportion of women aged 20-24 first married before the age of 18 were Dien Bien, Lai Chau, and Son La (39.1%, 38.5%, and 37.1%, respectively), while the lowest proportion of women aged 20-24 first married before the age of 18 were in Da Nang, Ho Chi Minh City, and Thua Thien Hue (1.9%, 2.2%, and 3.5%, respectively).
The Lo Lo, Mong, Kho Mu, Xinh Mun, Hre, Gia Rai, and Brau ethnic groups had the highest proportion of women 20-24 years old married early in the country. These ethnic minorities mainly live in the Northern midlands and mountain areas and Central Highlands regions.
4.9. Disability
The highest prevalence of disability was concentrated among women living in rural areas. The
North Central and Central coastal areas region continues to be the region most heavily affected by the
war, with the highest proportion of people with disabilities in the region.
The 2019 Census uses the Washington Group short set of questions to measure functional disability, including six questions related to functioning in six domains: seeing, hearing, walking or climbing stairs, remembering or concentrating, self-care (washing or dressing), and communicating (understanding or being understood by others). These questions were asked among people aged 5 years and older and were answered on a scale of the difficulty level of each function (not difficult; a little difficult; very difficult; impossible). A person was considered to have a disability if she/he reported that they have a lot of difficulty performing a task or cannot do it at all on at least one measure of the questions. Difficulties related to age issues were recorded, but temporary difficulties experienced during treatment that are likely to recover in the near future were not recorded.
The results of the 2019 Census indicated that the proportion of people aged 5 years and over with disabilities in Viet Nam was 3.7%. The disability rate of women was higher than that of men and that of rural areas was higher than urban areas.
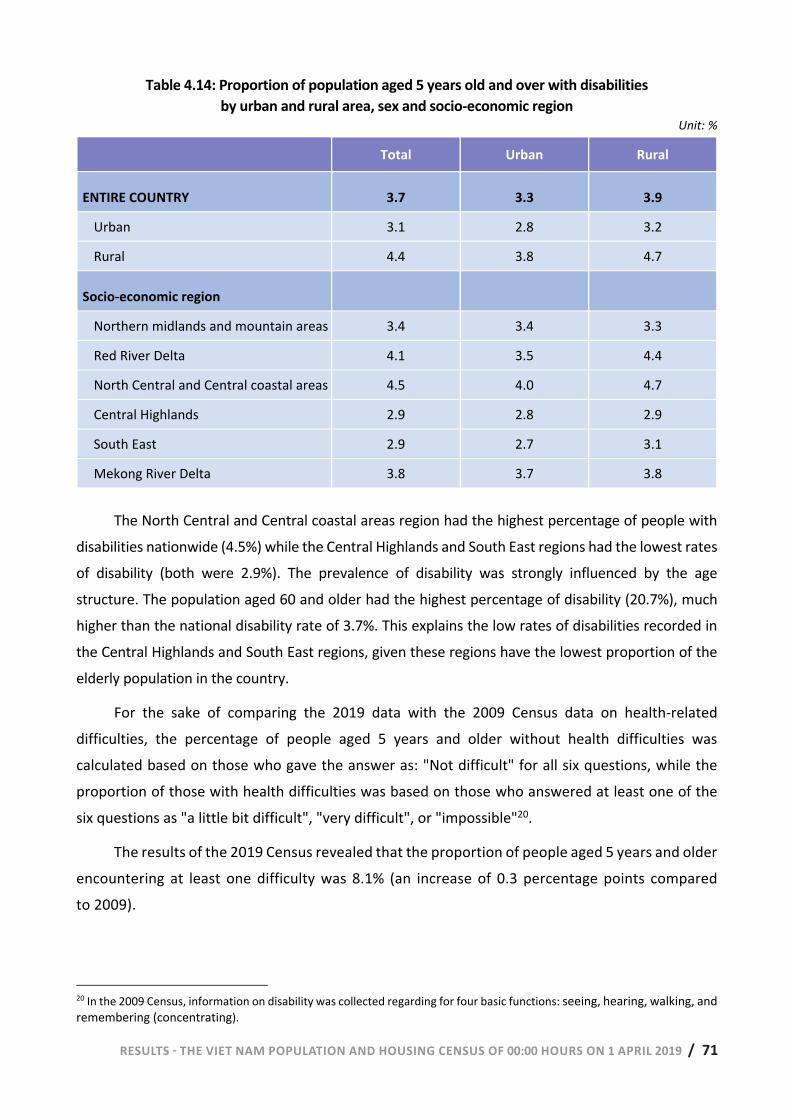
RESULTS - THE VIET NAM POPULATION AND HOUSING CENSUS OF 00:00 HOURS ON 1 APRIL 2019 / 71 RESULTS - THE VIET NAM POPULATION AND HOUSING CENSUS OF 00:00 HOURS ON 1 APRIL 2019 | 71
Table 4.14: Proportion of population aged 5 years old and over with disabilities by urban and rural area, sex and socio-economic region
Unit: %
Total Urban Rural
ENTIRE COUNTRY 3.7 3.3 3.9
Urban 3.1 2.8 3.2
Rural 4.4 3.8 4.7
Socio-economic region
Northern midlands and mountain areas 3.4 3.4 3.3
Red River Delta 4.1 3.5 4.4
North Central and Central coastal areas 4.5 4.0 4.7
Central Highlands 2.9 2.8 2.9
South East 2.9 2.7 3.1
Mekong River Delta 3.8 3.7 3.8
The North Central and Central coastal areas region had the highest percentage of people with disabilities nationwide (4.5%) while the Central Highlands and South East regions had the lowest rates of disability (both were 2.9%). The prevalence of disability was strongly influenced by the age structure. The population aged 60 and older had the highest percentage of disability (20.7%), much higher than the national disability rate of 3.7%. This explains the low rates of disabilities recorded in the Central Highlands and South East regions, given these regions have the lowest proportion of the elderly population in the country.
For the sake of comparing the 2019 data with the 2009 Census data on health-related difficulties, the percentage of people aged 5 years and older without health difficulties was calculated based on those who gave the answer as: "Not difficult" for all six questions, while the proportion of those with health difficulties was based on those who answered at least one of the six questions as "a little bit difficult", "very difficult", or "impossible"20.
The results of the 2019 Census revealed that the proportion of people aged 5 years and older encountering at least one difficulty was 8.1% (an increase of 0.3 percentage points compared to 2009).
20 In the 2009 Census, information on disability was collected regarding for four basic functions: seeing, hearing, walking, and remembering (concentrating).
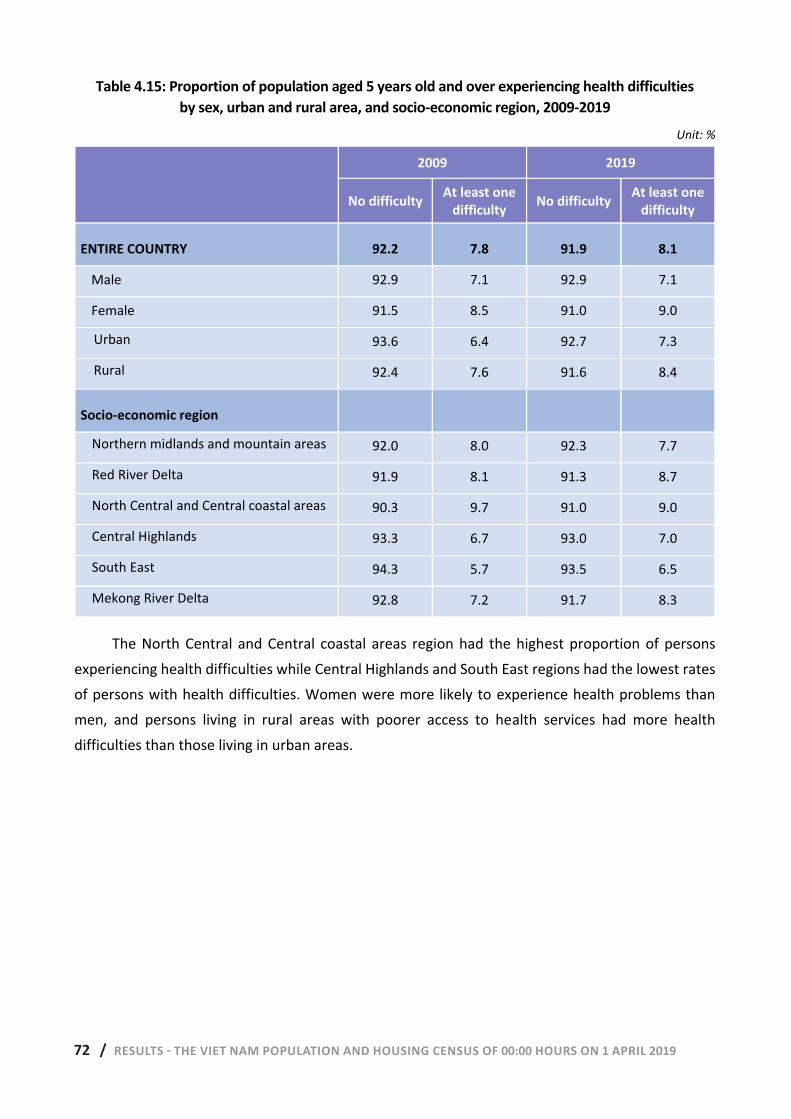
72 / RESULTS - THE VIET NAM POPULATION AND HOUSING CENSUS OF 00:00 HOURS ON 1 APRIL 2019 72 | RESULTS - THE VIET NAM POPULATION AND HOUSING CENSUS OF 00:00 HOURS ON 1 APRIL 2019
Table 4.15: Proportion of population aged 5 years old and over experiencing health difficulties by sex, urban and rural area, and socio-economic region, 2009-2019
Unit: %
2009 2019
No difficulty At least one difficulty No difficulty At least one
difficulty
ENTIRE COUNTRY 92.2 7.8 91.9 8.1
Male 92.9 7.1 92.9 7.1
Female 91.5 8.5 91.0 9.0
Urban 93.6 6.4 92.7 7.3
Rural 92.4 7.6 91.6 8.4
Socio-economic region
Northern midlands and mountain areas 92.0 8.0 92.3 7.7
Red River Delta 91.9 8.1 91.3 8.7
North Central and Central coastal areas 90.3 9.7 91.0 9.0
Central Highlands 93.3 6.7 93.0 7.0
South East 94.3 5.7 93.5 6.5
Mekong River Delta 92.8 7.2 91.7 8.3
The North Central and Central coastal areas region had the highest proportion of persons experiencing health difficulties while Central Highlands and South East regions had the lowest rates of persons with health difficulties. Women were more likely to experience health problems than men, and persons living in rural areas with poorer access to health services had more health difficulties than those living in urban areas.

RESULTS - THE VIET NAM POPULATION AND HOUSING CENSUS OF 00:00 HOURS ON 1 APRIL 2019 / 73
Photo: Provincial Statistics Office of Binh Dinh

74 / RESULTS - THE VIET NAM POPULATION AND HOUSING CENSUS OF 00:00 HOURS ON 1 APRIL 2019
Photo: UNFPA Viet Nam/ Vu Ngoc Dung
RESULTS - THE VIET NAM POPULATION AND HOUSING CENSUS OF 00:00 HOURS ON 1 APRIL 2019 / 75 RESULTS - THE VIET NAM POPULATION AND HOUSING CENSUS OF 00:00 HOURS ON 1 APRIL 2019 | 73
CHAPTER 5: FERTILITY
Fertility is a crucial determinant of population growth and a central indicator for the formulation and implementation of population and development policies. Fertility is affected by biological, economic, cultural, social, health, and environmental factors. The 2019 Census collected information about the birth history of women aged 10-49 years in the sample enumeration areas (including information on the number of children ever born, number of children born alive, number of deceased children, solar calendar month and year of most recent birth, number of male and female children from the most recent birth, and number of male and female children born between April 2018 and March 2019) to estimate fertility indicators.
5.1. Total fertility rate
Viet Nam's fertility has remained relatively stable for over a decade. Fertility in rural areas has
plummeted while fertility in urban areas has been almost unchanged.
The estimated total fertility rate (TFR)21 from the 2019 Census results was 2.09 children per woman, very slightly below replacement fertility. Viet Nam has maintained a stable fertility rate for more than a decade, with the common trend of having two children in Viet Nam. As stated in Resolution No. 21-NQ/TW dated 25 October 2017 of the 6th Conference, Session XII, the Party Central Committee on population work in the new context: "Communication and advocacy, education, awareness among population and family planning at all administrative levels and across the whole population have had a breakthrough. A couple with two children has become the norm, which has spread and deeply permeated within the whole society”. Viet Nam’s TFR has steadily decreased from 2.25 children per woman in 2001 to 1.99 children per woman in 2011 to replacement levels or below from 2012-2019 (fluctuated between 2.04 and 2.10 children per woman).
21 Total fertility rate (TFR) is the average number of children that would be born by a woman during the time of child-bearing years (15-49 years), if the woman is to pass through the child-bearing years according to age-specific fertility rate (ASFR) as observed during the study period, usually 12 months prior to the time of Census.
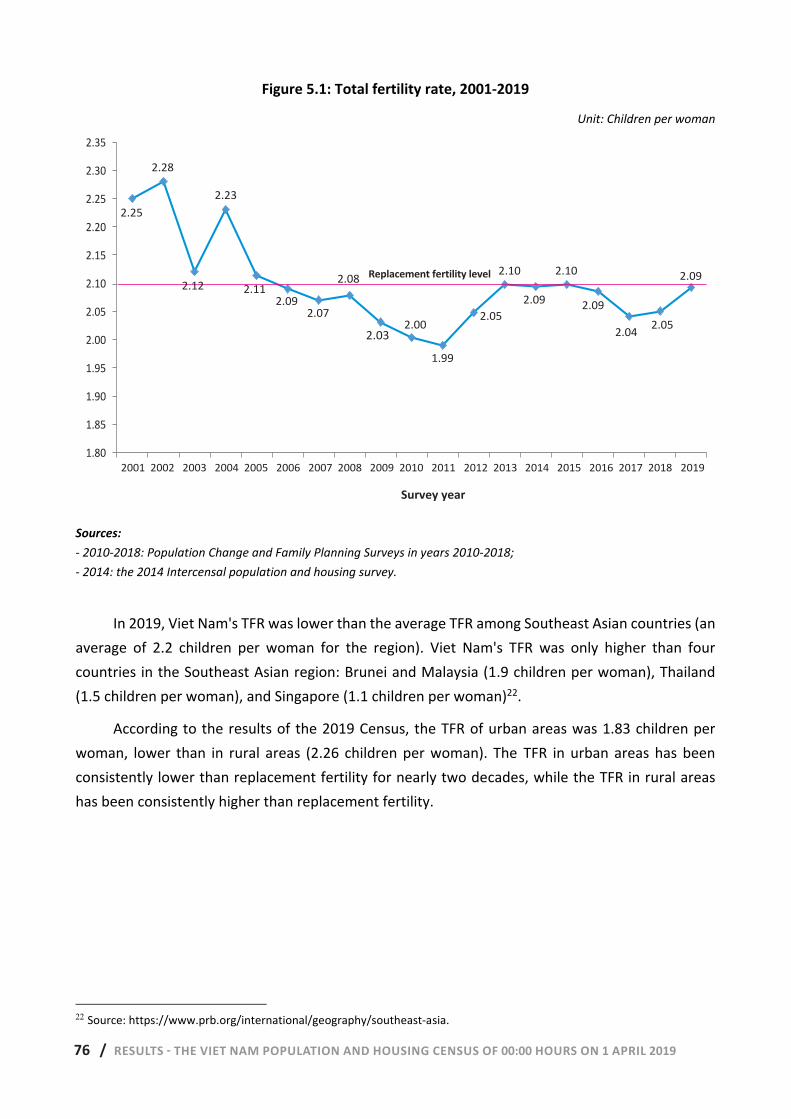
76 / RESULTS - THE VIET NAM POPULATION AND HOUSING CENSUS OF 00:00 HOURS ON 1 APRIL 2019 74 | RESULTS - THE VIET NAM POPULATION AND HOUSING CENSUS OF 00:00 HOURS ON 1 APRIL 2019
Figure 5.1: Total fertility rate, 2001-2019
Unit: Children per woman
Sources: - 2010-2018: Population Change and Family Planning Surveys in years 2010-2018; - 2014: the 2014 Intercensal population and housing survey.
In 2019, Viet Nam's TFR was lower than the average TFR among Southeast Asian countries (an average of 2.2 children per woman for the region). Viet Nam's TFR was only higher than four countries in the Southeast Asian region: Brunei and Malaysia (1.9 children per woman), Thailand (1.5 children per woman), and Singapore (1.1 children per woman)22.
According to the results of the 2019 Census, the TFR of urban areas was 1.83 children per woman, lower than in rural areas (2.26 children per woman). The TFR in urban areas has been consistently lower than replacement fertility for nearly two decades, while the TFR in rural areas has been consistently higher than replacement fertility.
22 Source: https://www.prb.org/international/geography/southeast-asia.
2.252.28
2.12
2.23
2.112.09
2.07 2.082.03
2.00 1.99
2.05
2.10 2.09 2.10 2.092.04 2.05
2.09
1.80
1.85
1.90
1.95
2.00
2.05
2.10
2.15
2.20
2.25
2.30
2.35
2001 2002 2003 2004 2005 2006 2007 2008 2009 2010 2011 2012 2013 2014 2015 2016 2017 2018 2019
Năm điều tra
Mức sinh thay thế
2.25
2.28
2.12
2.23
2.112.09
2.07
2.08
2.032.00
1.99
2.052.09
2.10
2.09
2.05
2.09
2.35
2.30
2.25
2.20
2.15
2.10
2.05
2.00
1.95
1.90
1.85
1.802001 2002 2003 2004 2005 2006 2007 2008 2009 2010 2011 2012 2013 2014 2015 2016 2017 2018 2019
Survey year
Replacement fertility level
2.04
2.10
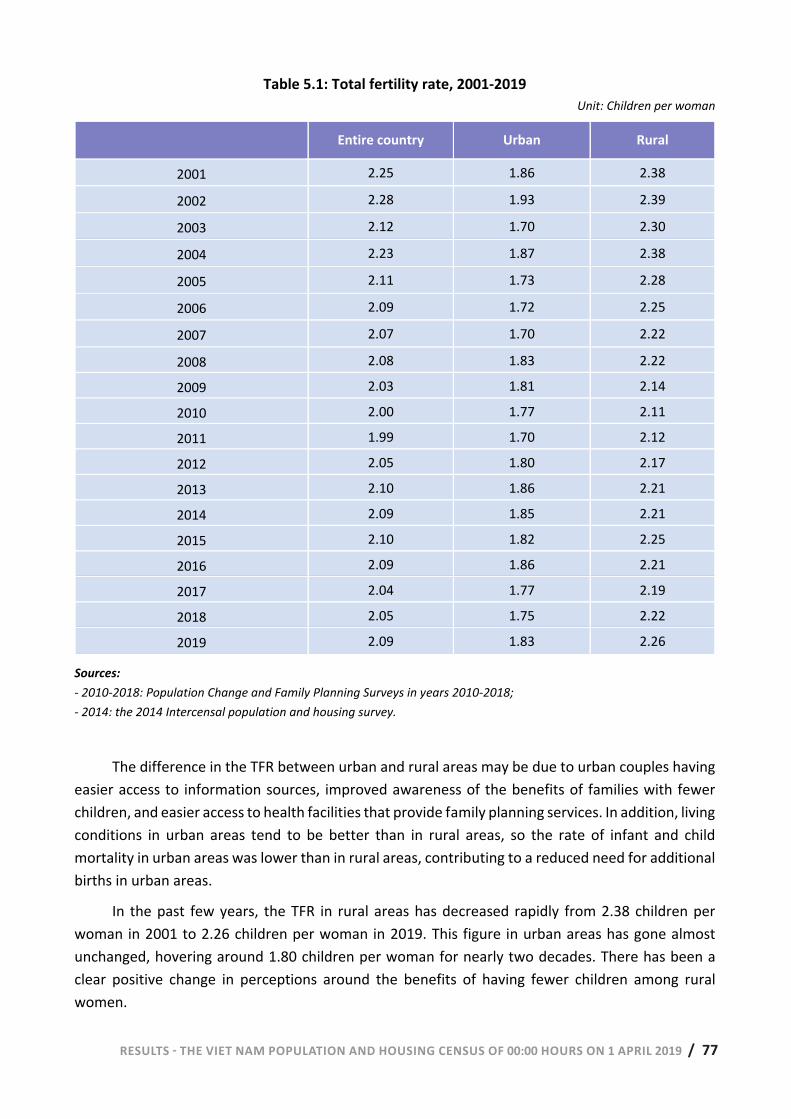
RESULTS - THE VIET NAM POPULATION AND HOUSING CENSUS OF 00:00 HOURS ON 1 APRIL 2019 / 77 RESULTS - THE VIET NAM POPULATION AND HOUSING CENSUS OF 00:00 HOURS ON 1 APRIL 2019 | 75
Table 5.1: Total fertility rate, 2001-2019 Unit: Children per woman
Entire country Urban Rural
2001 2.25 1.86 2.38
2002 2.28 1.93 2.39
2003 2.12 1.70 2.30
2004 2.23 1.87 2.38
2005 2.11 1.73 2.28
2006 2.09 1.72 2.25
2007 2.07 1.70 2.22
2008 2.08 1.83 2.22
2009 2.03 1.81 2.14
2010 2.00 1.77 2.11
2011 1.99 1.70 2.12
2012 2.05 1.80 2.17
2013 2.10 1.86 2.21
2014 2.09 1.85 2.21
2015 2.10 1.82 2.25
2016 2.09 1.86 2.21
2017 2.04 1.77 2.19
2018 2.05 1.75 2.22
2019 2.09 1.83 2.26
Sources: - 2010-2018: Population Change and Family Planning Surveys in years 2010-2018; - 2014: the 2014 Intercensal population and housing survey.
The difference in the TFR between urban and rural areas may be due to urban couples having easier access to information sources, improved awareness of the benefits of families with fewer children, and easier access to health facilities that provide family planning services. In addition, living conditions in urban areas tend to be better than in rural areas, so the rate of infant and child mortality in urban areas was lower than in rural areas, contributing to a reduced need for additional births in urban areas.
In the past few years, the TFR in rural areas has decreased rapidly from 2.38 children per woman in 2001 to 2.26 children per woman in 2019. This figure in urban areas has gone almost unchanged, hovering around 1.80 children per woman for nearly two decades. There has been a clear positive change in perceptions around the benefits of having fewer children among rural women.
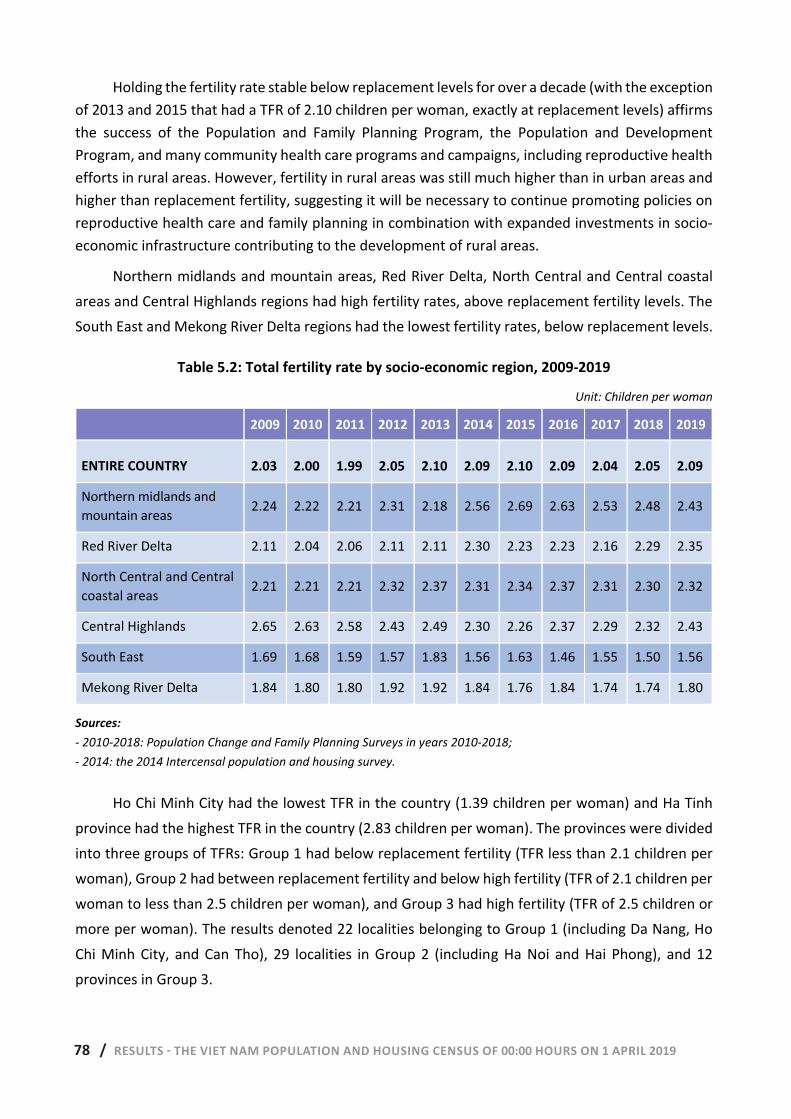
78 / RESULTS - THE VIET NAM POPULATION AND HOUSING CENSUS OF 00:00 HOURS ON 1 APRIL 2019 76 | RESULTS - THE VIET NAM POPULATION AND HOUSING CENSUS OF 00:00 HOURS ON 1 APRIL 2019
Holding the fertility rate stable below replacement levels for over a decade (with the exception of 2013 and 2015 that had a TFR of 2.10 children per woman, exactly at replacement levels) affirms the success of the Population and Family Planning Program, the Population and Development Program, and many community health care programs and campaigns, including reproductive health efforts in rural areas. However, fertility in rural areas was still much higher than in urban areas and higher than replacement fertility, suggesting it will be necessary to continue promoting policies on reproductive health care and family planning in combination with expanded investments in socio-economic infrastructure contributing to the development of rural areas.
Northern midlands and mountain areas, Red River Delta, North Central and Central coastal areas and Central Highlands regions had high fertility rates, above replacement fertility levels. The South East and Mekong River Delta regions had the lowest fertility rates, below replacement levels.
Table 5.2: Total fertility rate by socio-economic region, 2009-2019
Unit: Children per woman
2009 2010 2011 2012 2013 2014 2015 2016 2017 2018 2019
ENTIRE COUNTRY 2.03 2.00 1.99 2.05 2.10 2.09 2.10 2.09 2.04 2.05 2.09
Northern midlands and mountain areas 2.24 2.22 2.21 2.31 2.18 2.56 2.69 2.63 2.53 2.48 2.43
Red River Delta 2.11 2.04 2.06 2.11 2.11 2.30 2.23 2.23 2.16 2.29 2.35
North Central and Central coastal areas 2.21 2.21 2.21 2.32 2.37 2.31 2.34 2.37 2.31 2.30 2.32
Central Highlands 2.65 2.63 2.58 2.43 2.49 2.30 2.26 2.37 2.29 2.32 2.43
South East 1.69 1.68 1.59 1.57 1.83 1.56 1.63 1.46 1.55 1.50 1.56
Mekong River Delta 1.84 1.80 1.80 1.92 1.92 1.84 1.76 1.84 1.74 1.74 1.80
Sources: - 2010-2018: Population Change and Family Planning Surveys in years 2010-2018; - 2014: the 2014 Intercensal population and housing survey.
Ho Chi Minh City had the lowest TFR in the country (1.39 children per woman) and Ha Tinh province had the highest TFR in the country (2.83 children per woman). The provinces were divided into three groups of TFRs: Group 1 had below replacement fertility (TFR less than 2.1 children per woman), Group 2 had between replacement fertility and below high fertility (TFR of 2.1 children per woman to less than 2.5 children per woman), and Group 3 had high fertility (TFR of 2.5 children or more per woman). The results denoted 22 localities belonging to Group 1 (including Da Nang, Ho Chi Minh City, and Can Tho), 29 localities in Group 2 (including Ha Noi and Hai Phong), and 12 provinces in Group 3.
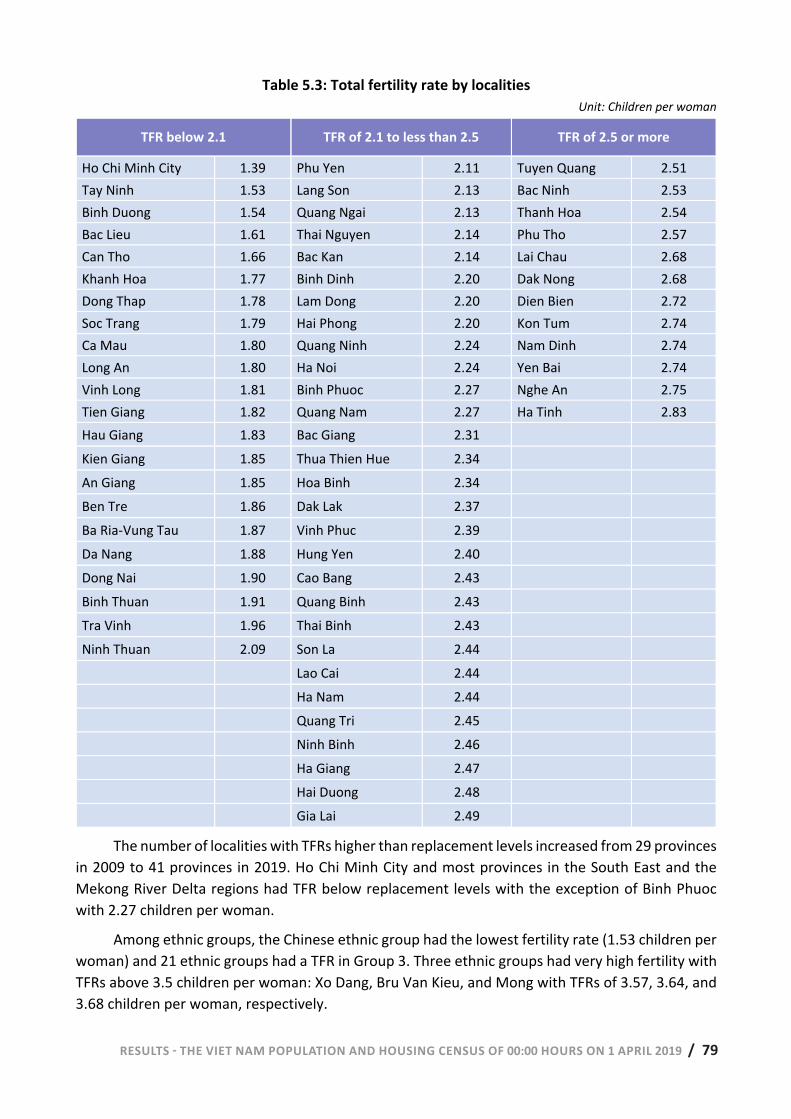
RESULTS - THE VIET NAM POPULATION AND HOUSING CENSUS OF 00:00 HOURS ON 1 APRIL 2019 / 79 RESULTS - THE VIET NAM POPULATION AND HOUSING CENSUS OF 00:00 HOURS ON 1 APRIL 2019 | 77
Table 5.3: Total fertility rate by localities Unit: Children per woman
TFR below 2.1 TFR of 2.1 to less than 2.5 TFR of 2.5 or more
Ho Chi Minh City 1.39 Phu Yen 2.11 Tuyen Quang 2.51 Tay Ninh 1.53 Lang Son 2.13 Bac Ninh 2.53 Binh Duong 1.54 Quang Ngai 2.13 Thanh Hoa 2.54 Bac Lieu 1.61 Thai Nguyen 2.14 Phu Tho 2.57 Can Tho 1.66 Bac Kan 2.14 Lai Chau 2.68 Khanh Hoa 1.77 Binh Dinh 2.20 Dak Nong 2.68 Dong Thap 1.78 Lam Dong 2.20 Dien Bien 2.72 Soc Trang 1.79 Hai Phong 2.20 Kon Tum 2.74 Ca Mau 1.80 Quang Ninh 2.24 Nam Dinh 2.74 Long An 1.80 Ha Noi 2.24 Yen Bai 2.74 Vinh Long 1.81 Binh Phuoc 2.27 Nghe An 2.75 Tien Giang 1.82 Quang Nam 2.27 Ha Tinh 2.83 Hau Giang 1.83 Bac Giang 2.31 Kien Giang 1.85 Thua Thien Hue 2.34 An Giang 1.85 Hoa Binh 2.34 Ben Tre 1.86 Dak Lak 2.37 Ba Ria-Vung Tau 1.87 Vinh Phuc 2.39 Da Nang 1.88 Hung Yen 2.40 Dong Nai 1.90 Cao Bang 2.43 Binh Thuan 1.91 Quang Binh 2.43 Tra Vinh 1.96 Thai Binh 2.43 Ninh Thuan 2.09 Son La 2.44
Lao Cai 2.44 Ha Nam 2.44 Quang Tri 2.45 Ninh Binh 2.46 Ha Giang 2.47 Hai Duong 2.48 Gia Lai 2.49
The number of localities with TFRs higher than replacement levels increased from 29 provinces in 2009 to 41 provinces in 2019. Ho Chi Minh City and most provinces in the South East and the Mekong River Delta regions had TFR below replacement levels with the exception of Binh Phuoc with 2.27 children per woman.
Among ethnic groups, the Chinese ethnic group had the lowest fertility rate (1.53 children per woman) and 21 ethnic groups had a TFR in Group 3. Three ethnic groups had very high fertility with TFRs above 3.5 children per woman: Xo Dang, Bru Van Kieu, and Mong with TFRs of 3.57, 3.64, and 3.68 children per woman, respectively.
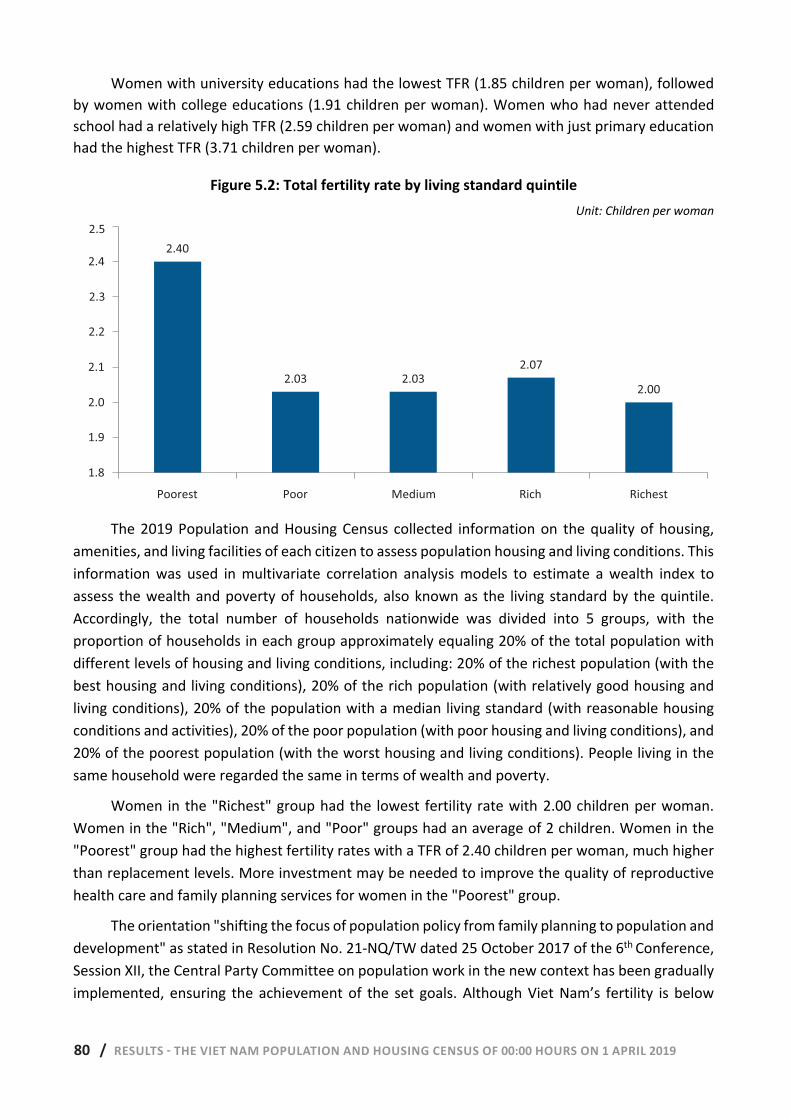
80 / RESULTS - THE VIET NAM POPULATION AND HOUSING CENSUS OF 00:00 HOURS ON 1 APRIL 2019 78 | RESULTS - THE VIET NAM POPULATION AND HOUSING CENSUS OF 00:00 HOURS ON 1 APRIL 2019
Women with university educations had the lowest TFR (1.85 children per woman), followed by women with college educations (1.91 children per woman). Women who had never attended school had a relatively high TFR (2.59 children per woman) and women with just primary education had the highest TFR (3.71 children per woman).
Figure 5.2: Total fertility rate by living standard quintile Unit: Children per woman
The 2019 Population and Housing Census collected information on the quality of housing, amenities, and living facilities of each citizen to assess population housing and living conditions. This information was used in multivariate correlation analysis models to estimate a wealth index to assess the wealth and poverty of households, also known as the living standard by the quintile. Accordingly, the total number of households nationwide was divided into 5 groups, with the proportion of households in each group approximately equaling 20% of the total population with different levels of housing and living conditions, including: 20% of the richest population (with the best housing and living conditions), 20% of the rich population (with relatively good housing and living conditions), 20% of the population with a median living standard (with reasonable housing conditions and activities), 20% of the poor population (with poor housing and living conditions), and 20% of the poorest population (with the worst housing and living conditions). People living in the same household were regarded the same in terms of wealth and poverty.
Women in the "Richest" group had the lowest fertility rate with 2.00 children per woman. Women in the "Rich", "Medium", and "Poor" groups had an average of 2 children. Women in the "Poorest" group had the highest fertility rates with a TFR of 2.40 children per woman, much higher than replacement levels. More investment may be needed to improve the quality of reproductive health care and family planning services for women in the "Poorest" group.
The orientation "shifting the focus of population policy from family planning to population and development" as stated in Resolution No. 21-NQ/TW dated 25 October 2017 of the 6th Conference, Session XII, the Central Party Committee on population work in the new context has been gradually implemented, ensuring the achievement of the set goals. Although Viet Nam’s fertility is below
2.40
2.03 2.032.07
2.00
1.80
1.90
2.00
2.10
2.20
2.30
2.40
2.50
Poorest Poor Medium Rich Richest
2.40
2.03 2.032.07
2.00
1.8
1.9
2.0
2.1
2.2
2.3
2.4
2.5
Poorest Poor Medium Rich Richest
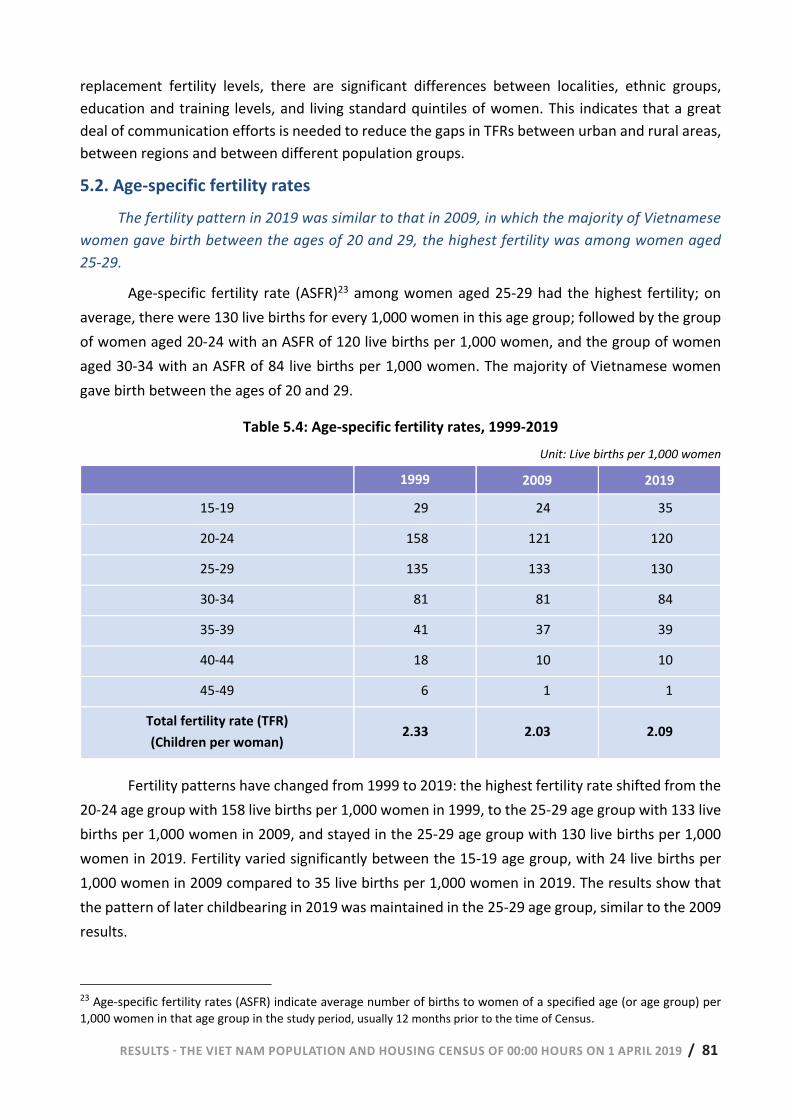
RESULTS - THE VIET NAM POPULATION AND HOUSING CENSUS OF 00:00 HOURS ON 1 APRIL 2019 / 81 RESULTS - THE VIET NAM POPULATION AND HOUSING CENSUS OF 00:00 HOURS ON 1 APRIL 2019 | 79
replacement fertility levels, there are significant differences between localities, ethnic groups, education and training levels, and living standard quintiles of women. This indicates that a great deal of communication efforts is needed to reduce the gaps in TFRs between urban and rural areas, between regions and between different population groups.
5.2. Age-specific fertility rates The fertility pattern in 2019 was similar to that in 2009, in which the majority of Vietnamese
women gave birth between the ages of 20 and 29, the highest fertility was among women aged 25-29.
Age-specific fertility rate (ASFR)23 among women aged 25-29 had the highest fertility; on average, there were 130 live births for every 1,000 women in this age group; followed by the group of women aged 20-24 with an ASFR of 120 live births per 1,000 women, and the group of women aged 30-34 with an ASFR of 84 live births per 1,000 women. The majority of Vietnamese women gave birth between the ages of 20 and 29.
Table 5.4: Age-specific fertility rates, 1999-2019 Unit: Live births per 1,000 women
1999 2009 2019
15-19 29 24 35
20-24 158 121 120
25-29 135 133 130
30-34 81 81 84
35-39 41 37 39
40-44 18 10 10
45-49 6 1 1
Total fertility rate (TFR) (Children per woman) 2.33 2.03 2.09
Fertility patterns have changed from 1999 to 2019: the highest fertility rate shifted from the 20-24 age group with 158 live births per 1,000 women in 1999, to the 25-29 age group with 133 live births per 1,000 women in 2009, and stayed in the 25-29 age group with 130 live births per 1,000 women in 2019. Fertility varied significantly between the 15-19 age group, with 24 live births per 1,000 women in 2009 compared to 35 live births per 1,000 women in 2019. The results show that the pattern of later childbearing in 2019 was maintained in the 25-29 age group, similar to the 2009 results.
23 Age-specific fertility rates (ASFR) indicate average number of births to women of a specified age (or age group) per 1,000 women in that age group in the study period, usually 12 months prior to the time of Census.
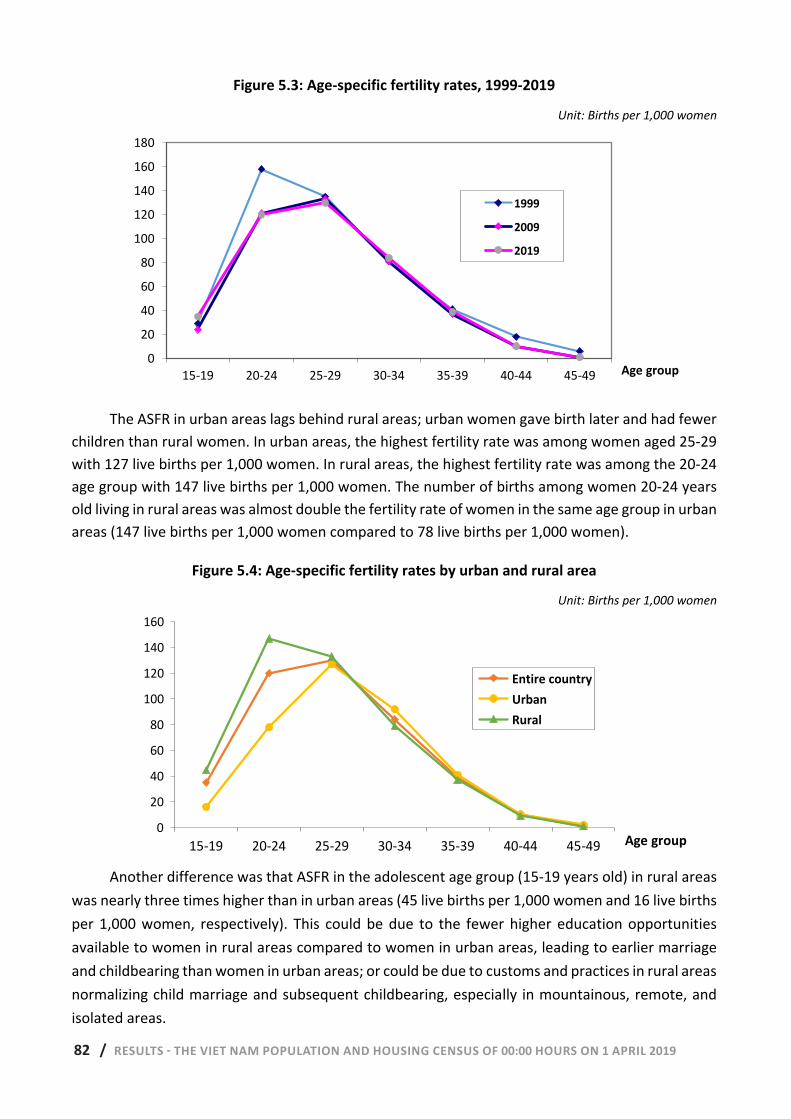
82 / RESULTS - THE VIET NAM POPULATION AND HOUSING CENSUS OF 00:00 HOURS ON 1 APRIL 2019 80 | RESULTS - THE VIET NAM POPULATION AND HOUSING CENSUS OF 00:00 HOURS ON 1 APRIL 2019
Figure 5.3: Age-specific fertility rates, 1999-2019
Unit: Births per 1,000 women
The ASFR in urban areas lags behind rural areas; urban women gave birth later and had fewer
children than rural women. In urban areas, the highest fertility rate was among women aged 25-29 with 127 live births per 1,000 women. In rural areas, the highest fertility rate was among the 20-24 age group with 147 live births per 1,000 women. The number of births among women 20-24 years old living in rural areas was almost double the fertility rate of women in the same age group in urban areas (147 live births per 1,000 women compared to 78 live births per 1,000 women).
Figure 5.4: Age-specific fertility rates by urban and rural area
Unit: Births per 1,000 women
Another difference was that ASFR in the adolescent age group (15-19 years old) in rural areas was nearly three times higher than in urban areas (45 live births per 1,000 women and 16 live births per 1,000 women, respectively). This could be due to the fewer higher education opportunities available to women in rural areas compared to women in urban areas, leading to earlier marriage and childbearing than women in urban areas; or could be due to customs and practices in rural areas normalizing child marriage and subsequent childbearing, especially in mountainous, remote, and isolated areas.
0
20
40
60
80
100
120
140
160
180
15-19 20-24 25-29 30-34 35-39 40-44 45-49 Age group
1999
2009
2019
0
20
40
60
80
100
120
140
160
15-19 20-24 25-29 30-34 35-39 40-44 45-49 Age group
Entire countryUrbanRural
0
20
40
60
80
100
120
140
160
15-19 20-24 25-29 30-34 35-39 40-44 45-49 Age group
Entire countryUrbanRural
0
20
40
60
80
100
120
140
160
180
15-19 20-24 25-29 30-34 35-39 40-44 45-49 Age group
1999
2009
2019
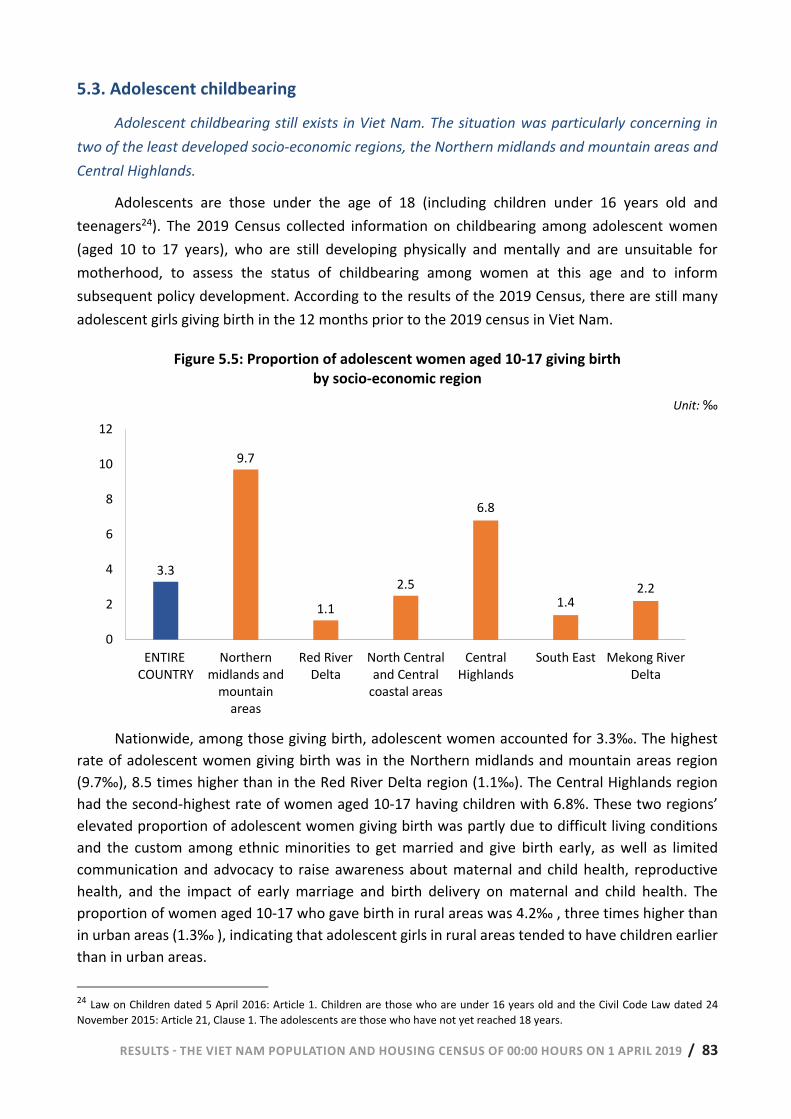
RESULTS - THE VIET NAM POPULATION AND HOUSING CENSUS OF 00:00 HOURS ON 1 APRIL 2019 / 83 RESULTS - THE VIET NAM POPULATION AND HOUSING CENSUS OF 00:00 HOURS ON 1 APRIL 2019 | 81
5.3. Adolescent childbearing
Adolescent childbearing still exists in Viet Nam. The situation was particularly concerning in two of the least developed socio-economic regions, the Northern midlands and mountain areas and Central Highlands.
Adolescents are those under the age of 18 (including children under 16 years old and teenagers24). The 2019 Census collected information on childbearing among adolescent women (aged 10 to 17 years), who are still developing physically and mentally and are unsuitable for motherhood, to assess the status of childbearing among women at this age and to inform subsequent policy development. According to the results of the 2019 Census, there are still many adolescent girls giving birth in the 12 months prior to the 2019 census in Viet Nam.
Figure 5.5: Proportion of adolescent women aged 10-17 giving birth by socio-economic region
Unit: ‰
Nationwide, among those giving birth, adolescent women accounted for 3.3‰. The highest
rate of adolescent women giving birth was in the Northern midlands and mountain areas region (9.7‰), 8.5 times higher than in the Red River Delta region (1.1‰). The Central Highlands region had the second-highest rate of women aged 10-17 having children with 6.8%. These two regions’ elevated proportion of adolescent women giving birth was partly due to difficult living conditions and the custom among ethnic minorities to get married and give birth early, as well as limited communication and advocacy to raise awareness about maternal and child health, reproductive health, and the impact of early marriage and birth delivery on maternal and child health. The proportion of women aged 10-17 who gave birth in rural areas was 4.2‰ , three times higher than in urban areas (1.3‰ ), indicating that adolescent girls in rural areas tended to have children earlier than in urban areas.
24 Law on Children dated 5 April 2016: Article 1. Children are those who are under 16 years old and the Civil Code Law dated 24 November 2015: Article 21, Clause 1. The adolescents are those who have not yet reached 18 years.
3.3
9.7
1.1
2.5
6.8
1.42.2
0
2
4
6
8
10
12
WHOLECOUNTRY
Northernmidlands and
mountainareas
Red RiverDelta
North Centraland Central
coastal areas
CentralHighlands
South East Mekong RiverDelta
3.3
9.7
1.1
2.5
6.8
1.42.2
0
2
4
6
8
10
12
ENTIRE COUNTRY
Northernmidlands and
mountainareas
Red RiverDelta
North Centraland Central
coastal areas
CentralHighlands
South East Mekong RiverDelta
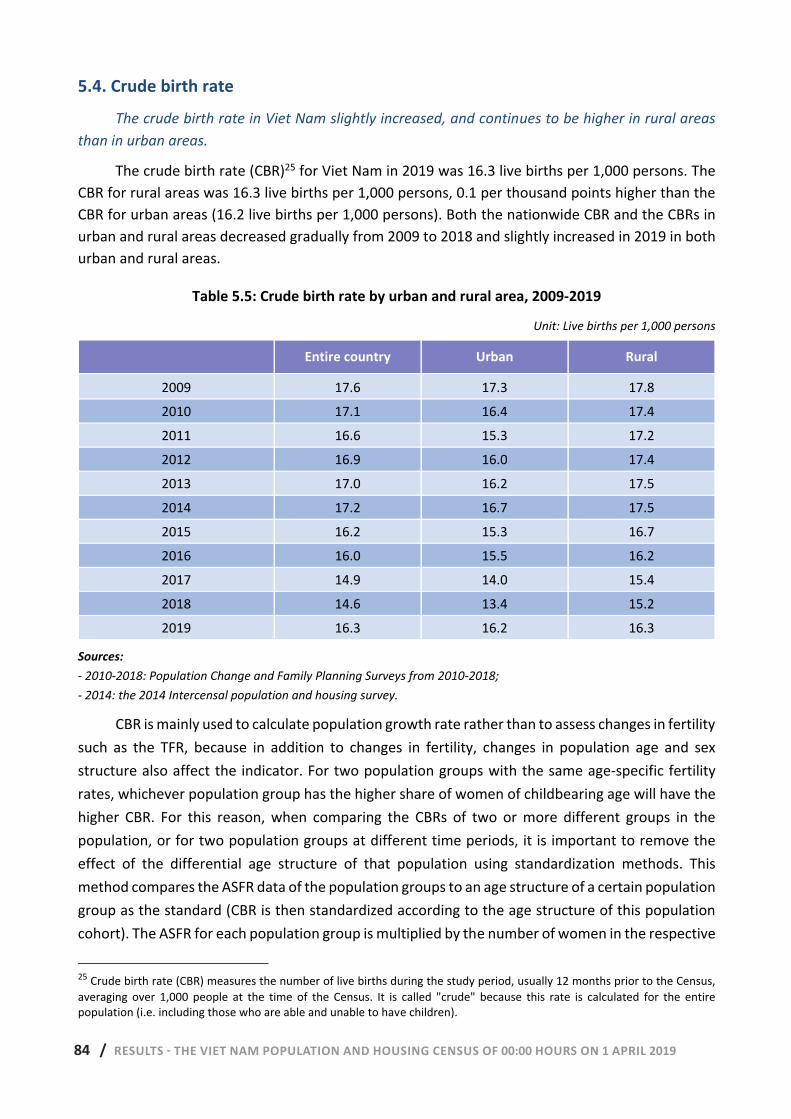
84 / RESULTS - THE VIET NAM POPULATION AND HOUSING CENSUS OF 00:00 HOURS ON 1 APRIL 2019 82 | RESULTS - THE VIET NAM POPULATION AND HOUSING CENSUS OF 00:00 HOURS ON 1 APRIL 2019
5.4. Crude birth rate The crude birth rate in Viet Nam slightly increased, and continues to be higher in rural areas
than in urban areas. The crude birth rate (CBR)25 for Viet Nam in 2019 was 16.3 live births per 1,000 persons. The
CBR for rural areas was 16.3 live births per 1,000 persons, 0.1 per thousand points higher than the CBR for urban areas (16.2 live births per 1,000 persons). Both the nationwide CBR and the CBRs in urban and rural areas decreased gradually from 2009 to 2018 and slightly increased in 2019 in both urban and rural areas.
Table 5.5: Crude birth rate by urban and rural area, 2009-2019 Unit: Live births per 1,000 persons
Entire country Urban Rural
2009 17.6 17.3 17.8 2010 17.1 16.4 17.4 2011 16.6 15.3 17.2 2012 16.9 16.0 17.4 2013 17.0 16.2 17.5 2014 17.2 16.7 17.5 2015 16.2 15.3 16.7 2016 16.0 15.5 16.2 2017 14.9 14.0 15.4 2018 14.6 13.4 15.2 2019 16.3 16.2 16.3
Sources: - 2010-2018: Population Change and Family Planning Surveys from 2010-2018; - 2014: the 2014 Intercensal population and housing survey.
CBR is mainly used to calculate population growth rate rather than to assess changes in fertility such as the TFR, because in addition to changes in fertility, changes in population age and sex structure also affect the indicator. For two population groups with the same age-specific fertility rates, whichever population group has the higher share of women of childbearing age will have the higher CBR. For this reason, when comparing the CBRs of two or more different groups in the population, or for two population groups at different time periods, it is important to remove the effect of the differential age structure of that population using standardization methods. This method compares the ASFR data of the population groups to an age structure of a certain population group as the standard (CBR is then standardized according to the age structure of this population cohort). The ASFR for each population group is multiplied by the number of women in the respective
25 Crude birth rate (CBR) measures the number of live births during the study period, usually 12 months prior to the Census, averaging over 1,000 people at the time of the Census. It is called "crude" because this rate is calculated for the entire population (i.e. including those who are able and unable to have children).
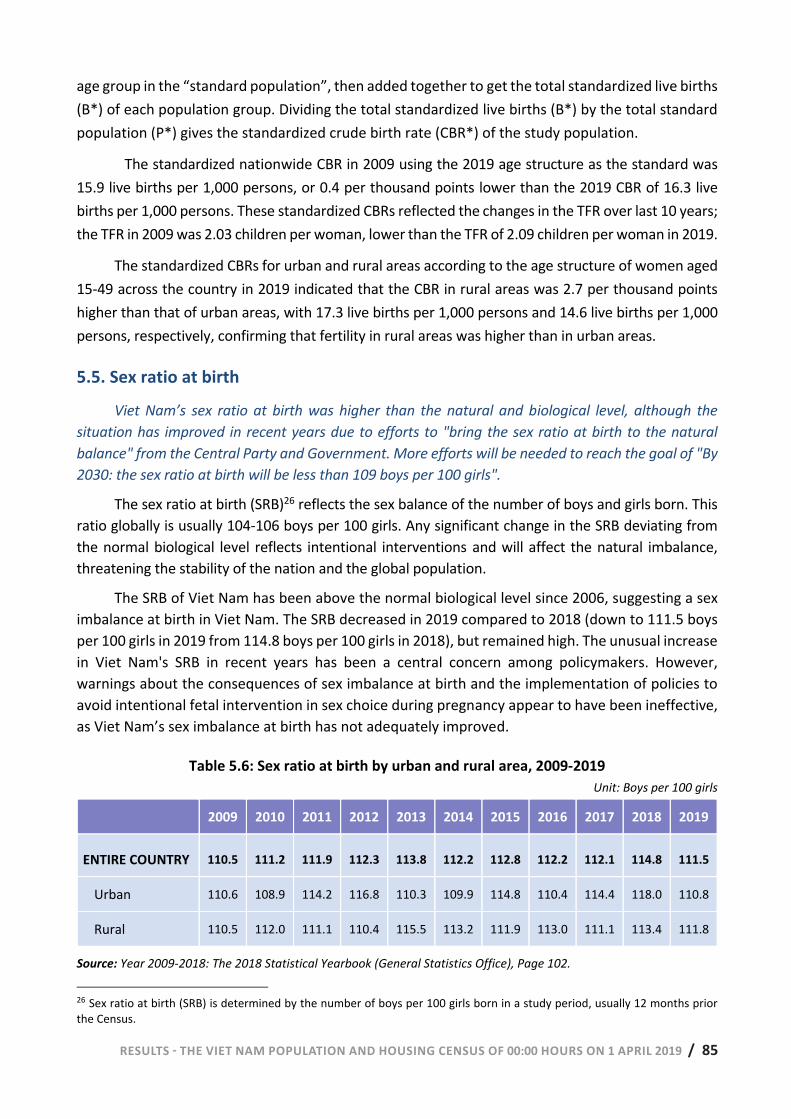
RESULTS - THE VIET NAM POPULATION AND HOUSING CENSUS OF 00:00 HOURS ON 1 APRIL 2019 / 85 RESULTS - THE VIET NAM POPULATION AND HOUSING CENSUS OF 00:00 HOURS ON 1 APRIL 2019 | 83
age group in the “standard population”, then added together to get the total standardized live births (B*) of each population group. Dividing the total standardized live births (B*) by the total standard population (P*) gives the standardized crude birth rate (CBR*) of the study population.
The standardized nationwide CBR in 2009 using the 2019 age structure as the standard was 15.9 live births per 1,000 persons, or 0.4 per thousand points lower than the 2019 CBR of 16.3 live births per 1,000 persons. These standardized CBRs reflected the changes in the TFR over last 10 years; the TFR in 2009 was 2.03 children per woman, lower than the TFR of 2.09 children per woman in 2019.
The standardized CBRs for urban and rural areas according to the age structure of women aged 15-49 across the country in 2019 indicated that the CBR in rural areas was 2.7 per thousand points higher than that of urban areas, with 17.3 live births per 1,000 persons and 14.6 live births per 1,000 persons, respectively, confirming that fertility in rural areas was higher than in urban areas.
5.5. Sex ratio at birth
Viet Nam’s sex ratio at birth was higher than the natural and biological level, although the situation has improved in recent years due to efforts to "bring the sex ratio at birth to the natural balance" from the Central Party and Government. More efforts will be needed to reach the goal of "By 2030: the sex ratio at birth will be less than 109 boys per 100 girls".
The sex ratio at birth (SRB)26 reflects the sex balance of the number of boys and girls born. This ratio globally is usually 104-106 boys per 100 girls. Any significant change in the SRB deviating from the normal biological level reflects intentional interventions and will affect the natural imbalance, threatening the stability of the nation and the global population.
The SRB of Viet Nam has been above the normal biological level since 2006, suggesting a sex imbalance at birth in Viet Nam. The SRB decreased in 2019 compared to 2018 (down to 111.5 boys per 100 girls in 2019 from 114.8 boys per 100 girls in 2018), but remained high. The unusual increase in Viet Nam's SRB in recent years has been a central concern among policymakers. However, warnings about the consequences of sex imbalance at birth and the implementation of policies to avoid intentional fetal intervention in sex choice during pregnancy appear to have been ineffective, as Viet Nam’s sex imbalance at birth has not adequately improved.
Table 5.6: Sex ratio at birth by urban and rural area, 2009-2019 Unit: Boys per 100 girls
2009 2010 2011 2012 2013 2014 2015 2016 2017 2018 2019
ENTIRE COUNTRY 110.5 111.2 111.9 112.3 113.8 112.2 112.8 112.2 112.1 114.8 111.5
Urban 110.6 108.9 114.2 116.8 110.3 109.9 114.8 110.4 114.4 118.0 110.8
Rural 110.5 112.0 111.1 110.4 115.5 113.2 111.9 113.0 111.1 113.4 111.8
Source: Year 2009-2018: The 2018 Statistical Yearbook (General Statistics Office), Page 102. 26 Sex ratio at birth (SRB) is determined by the number of boys per 100 girls born in a study period, usually 12 months prior the Census.
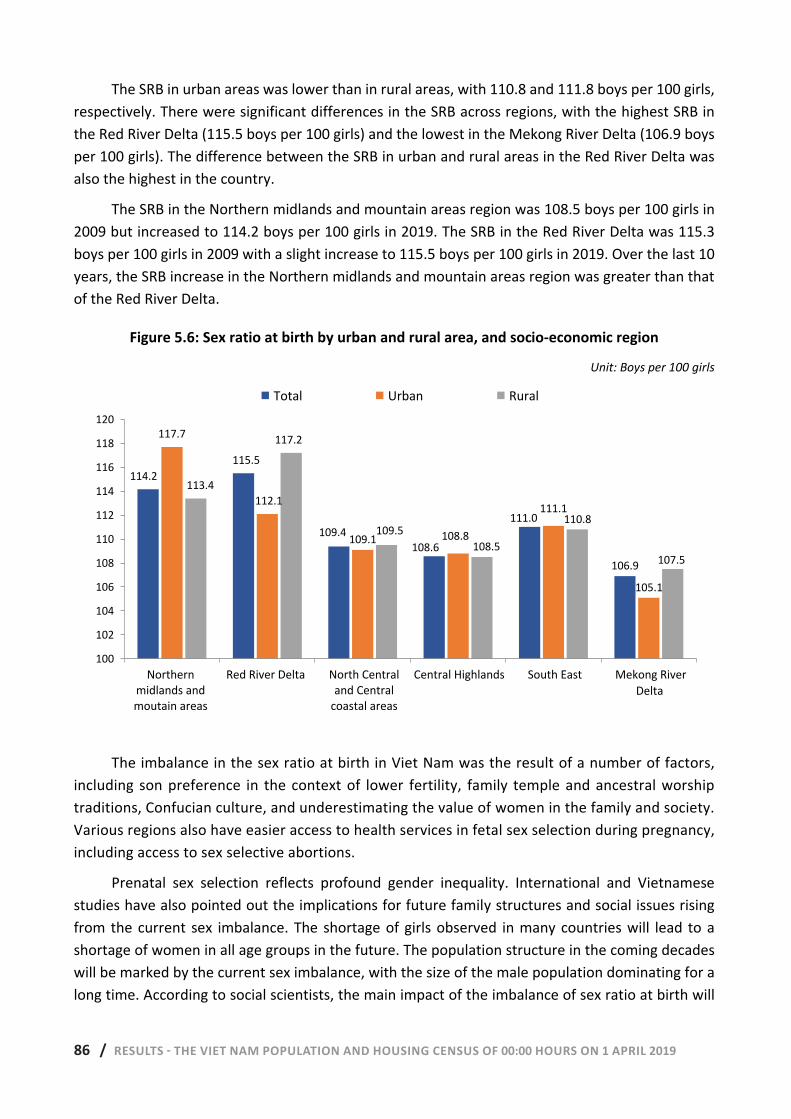
86 / RESULTS - THE VIET NAM POPULATION AND HOUSING CENSUS OF 00:00 HOURS ON 1 APRIL 2019 84 | RESULTS - THE VIET NAM POPULATION AND HOUSING CENSUS OF 00:00 HOURS ON 1 APRIL 2019
The SRB in urban areas was lower than in rural areas, with 110.8 and 111.8 boys per 100 girls, respectively. There were significant differences in the SRB across regions, with the highest SRB in the Red River Delta (115.5 boys per 100 girls) and the lowest in the Mekong River Delta (106.9 boys per 100 girls). The difference between the SRB in urban and rural areas in the Red River Delta was also the highest in the country.
The SRB in the Northern midlands and mountain areas region was 108.5 boys per 100 girls in 2009 but increased to 114.2 boys per 100 girls in 2019. The SRB in the Red River Delta was 115.3 boys per 100 girls in 2009 with a slight increase to 115.5 boys per 100 girls in 2019. Over the last 10 years, the SRB increase in the Northern midlands and mountain areas region was greater than that of the Red River Delta.
Figure 5.6: Sex ratio at birth by urban and rural area, and socio-economic region
Unit: Boys per 100 girls
The imbalance in the sex ratio at birth in Viet Nam was the result of a number of factors, including son preference in the context of lower fertility, family temple and ancestral worship traditions, Confucian culture, and underestimating the value of women in the family and society. Various regions also have easier access to health services in fetal sex selection during pregnancy, including access to sex selective abortions.
Prenatal sex selection reflects profound gender inequality. International and Vietnamese studies have also pointed out the implications for future family structures and social issues rising from the current sex imbalance. The shortage of girls observed in many countries will lead to a shortage of women in all age groups in the future. The population structure in the coming decades will be marked by the current sex imbalance, with the size of the male population dominating for a long time. According to social scientists, the main impact of the imbalance of sex ratio at birth will
114.2115.5
109.4108.6
111.0
106.9
117.7
112.1
109.1 108.8
111.1
105.1
113.4
117.2
109.5108.5
110.8
107.5
100
102
104
106
108
110
112
114
116
118
120
Northern midlandsand moutain areas
Red River Delta North Central andCentral coastal
areas
Central Highlands South East Mekong RiverDelta
Total Urban Rural
114.2115.5
109.4108.6
111.0
106.9
117.7
112.1
109.1 108.8
111.1
105.1
113.4
117.2
109.5108.5
110.8
107.5
100
102
104
106
108
110
112
114
116
118
120
Northern midlands and moutain areas
Red River Delta North Central and Central
coastal areas
Central Highlands South East Mekong RiverDelta
Total Urban Rural
RESULTS - THE VIET NAM POPULATION AND HOUSING CENSUS OF 00:00 HOURS ON 1 APRIL 2019 / 87 RESULTS - THE VIET NAM POPULATION AND HOUSING CENSUS OF 00:00 HOURS ON 1 APRIL 2019 | 85
be related to forming families and the marital system. Younger men will be more abundant than women, as the proportion of women has been decreasing in the same cohort, and as a result, they may face serious difficulties in finding a partner. Delaying marriage in men or increasing the rate of single people is becoming a likely future outcome due to the shortage of women of marital age, with adverse effects on future family systems.
Prenatal sex selection directly affects the sex imbalance at birth. Data to monitor SRB developments will be necessary to provide timely intervention policies and programs.
The Party and Government of Viet Nam have heavily focused on the imbalance in sex at birth. On 25 October 2017, at the Sixth Conference, Session XII, the Party Central Committee issued Resolution No. 21-NQ/TW on population work in the new context. The Resolution stated that “the sex imbalance at birth has increased rapidly and seriously” and set the goal of “bringing the sex ratio at birth to the natural balance”, “By 2030: The sex ratio at birth will be less than 109 boys per 100 girls”. The Party's direction on bringing the sex ratio at birth to the natural balance has been concretized and implemented through Decision No. 1679/QD-TTg of the Prime Minister dated 22 November 2019 on approving the Viet Nam National Population Strategy by 2030.
Photo: UNFPA Viet Nam/ Nguyen Minh Duc
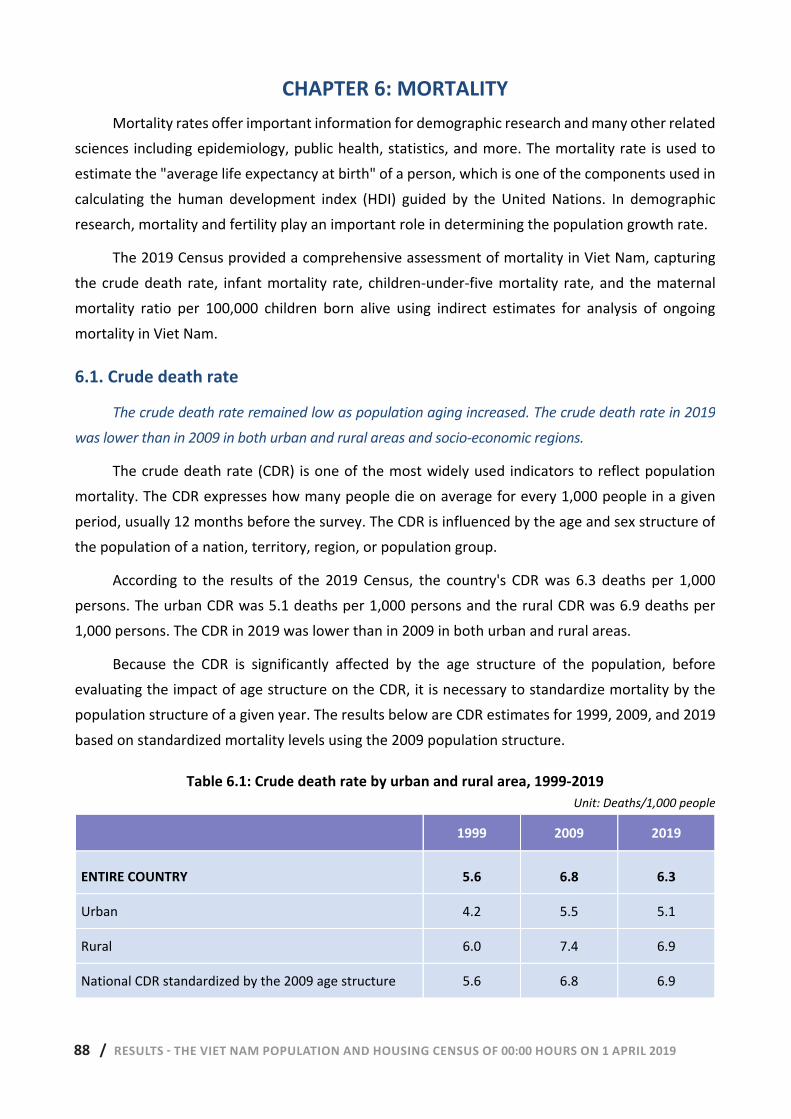
88 / RESULTS - THE VIET NAM POPULATION AND HOUSING CENSUS OF 00:00 HOURS ON 1 APRIL 2019 86 | RESULTS - THE VIET NAM POPULATION AND HOUSING CENSUS OF 00:00 HOURS ON 1 APRIL 2019
CHAPTER 6: MORTALITY
Mortality rates offer important information for demographic research and many other related sciences including epidemiology, public health, statistics, and more. The mortality rate is used to estimate the "average life expectancy at birth" of a person, which is one of the components used in calculating the human development index (HDI) guided by the United Nations. In demographic research, mortality and fertility play an important role in determining the population growth rate.
The 2019 Census provided a comprehensive assessment of mortality in Viet Nam, capturing the crude death rate, infant mortality rate, children-under-five mortality rate, and the maternal mortality ratio per 100,000 children born alive using indirect estimates for analysis of ongoing mortality in Viet Nam.
6.1. Crude death rate
The crude death rate remained low as population aging increased. The crude death rate in 2019 was lower than in 2009 in both urban and rural areas and socio-economic regions.
The crude death rate (CDR) is one of the most widely used indicators to reflect population mortality. The CDR expresses how many people die on average for every 1,000 people in a given period, usually 12 months before the survey. The CDR is influenced by the age and sex structure of the population of a nation, territory, region, or population group.
According to the results of the 2019 Census, the country's CDR was 6.3 deaths per 1,000 persons. The urban CDR was 5.1 deaths per 1,000 persons and the rural CDR was 6.9 deaths per 1,000 persons. The CDR in 2019 was lower than in 2009 in both urban and rural areas.
Because the CDR is significantly affected by the age structure of the population, before evaluating the impact of age structure on the CDR, it is necessary to standardize mortality by the population structure of a given year. The results below are CDR estimates for 1999, 2009, and 2019 based on standardized mortality levels using the 2009 population structure.
Table 6.1: Crude death rate by urban and rural area, 1999-2019 Unit: Deaths/1,000 people
1999 2009 2019
ENTIRE COUNTRY 5.6 6.8 6.3
Urban 4.2 5.5 5.1
Rural 6.0 7.4 6.9
National CDR standardized by the 2009 age structure 5.6 6.8 6.9
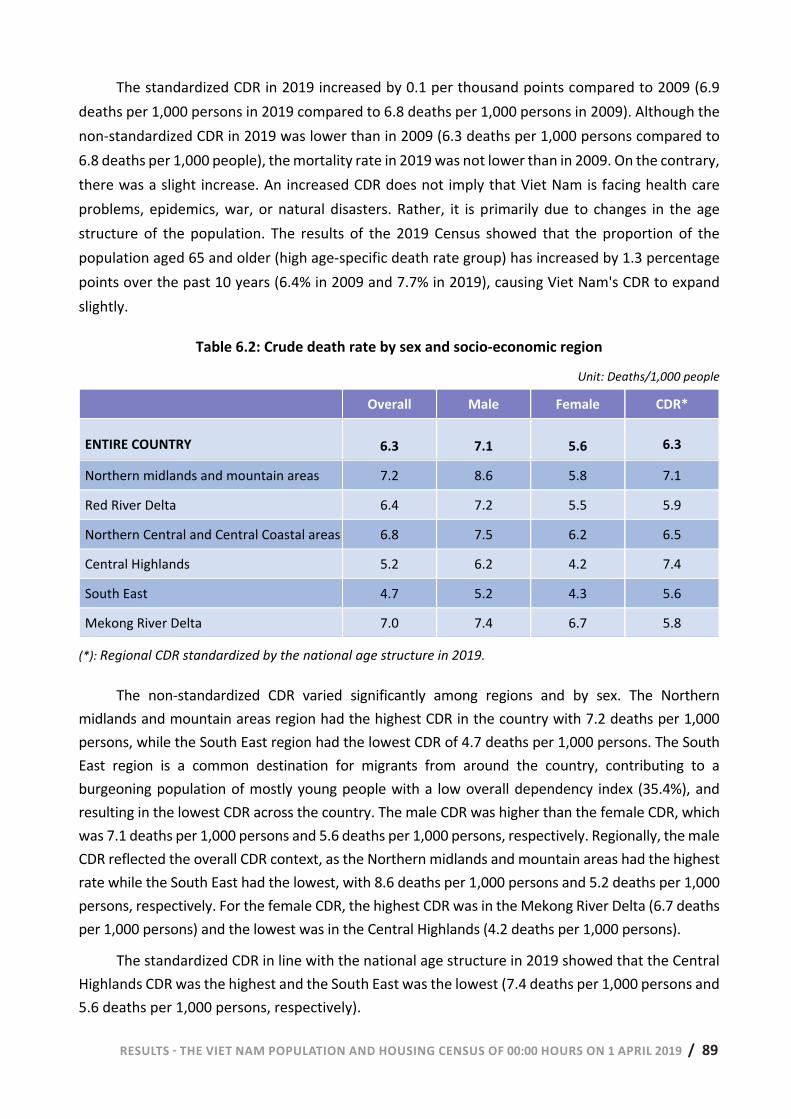
RESULTS - THE VIET NAM POPULATION AND HOUSING CENSUS OF 00:00 HOURS ON 1 APRIL 2019 / 89 RESULTS - THE VIET NAM POPULATION AND HOUSING CENSUS OF 00:00 HOURS ON 1 APRIL 2019 | 87
The standardized CDR in 2019 increased by 0.1 per thousand points compared to 2009 (6.9 deaths per 1,000 persons in 2019 compared to 6.8 deaths per 1,000 persons in 2009). Although the non-standardized CDR in 2019 was lower than in 2009 (6.3 deaths per 1,000 persons compared to 6.8 deaths per 1,000 people), the mortality rate in 2019 was not lower than in 2009. On the contrary, there was a slight increase. An increased CDR does not imply that Viet Nam is facing health care problems, epidemics, war, or natural disasters. Rather, it is primarily due to changes in the age structure of the population. The results of the 2019 Census showed that the proportion of the population aged 65 and older (high age-specific death rate group) has increased by 1.3 percentage points over the past 10 years (6.4% in 2009 and 7.7% in 2019), causing Viet Nam's CDR to expand slightly.
Table 6.2: Crude death rate by sex and socio-economic region
Unit: Deaths/1,000 people
Overall Male Female CDR*
ENTIRE COUNTRY 6.3 7.1 5.6 6.3
Northern midlands and mountain areas 7.2 8.6 5.8 7.1
Red River Delta 6.4 7.2 5.5 5.9
Northern Central and Central Coastal areas 6.8 7.5 6.2 6.5
Central Highlands 5.2 6.2 4.2 7.4
South East 4.7 5.2 4.3 5.6
Mekong River Delta 7.0 7.4 6.7 5.8
(*): Regional CDR standardized by the national age structure in 2019.
The non-standardized CDR varied significantly among regions and by sex. The Northern midlands and mountain areas region had the highest CDR in the country with 7.2 deaths per 1,000 persons, while the South East region had the lowest CDR of 4.7 deaths per 1,000 persons. The South East region is a common destination for migrants from around the country, contributing to a burgeoning population of mostly young people with a low overall dependency index (35.4%), and resulting in the lowest CDR across the country. The male CDR was higher than the female CDR, which was 7.1 deaths per 1,000 persons and 5.6 deaths per 1,000 persons, respectively. Regionally, the male CDR reflected the overall CDR context, as the Northern midlands and mountain areas had the highest rate while the South East had the lowest, with 8.6 deaths per 1,000 persons and 5.2 deaths per 1,000 persons, respectively. For the female CDR, the highest CDR was in the Mekong River Delta (6.7 deaths per 1,000 persons) and the lowest was in the Central Highlands (4.2 deaths per 1,000 persons).
The standardized CDR in line with the national age structure in 2019 showed that the Central Highlands CDR was the highest and the South East was the lowest (7.4 deaths per 1,000 persons and 5.6 deaths per 1,000 persons, respectively).
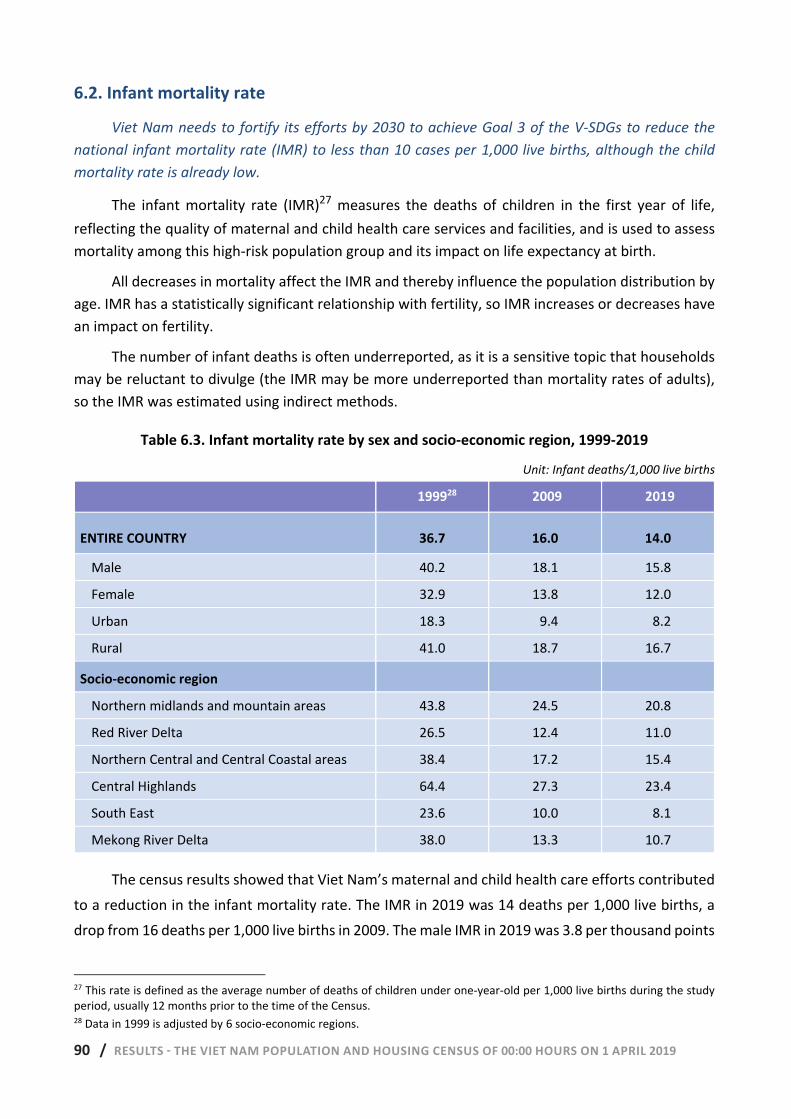
90 / RESULTS - THE VIET NAM POPULATION AND HOUSING CENSUS OF 00:00 HOURS ON 1 APRIL 2019 88 | RESULTS - THE VIET NAM POPULATION AND HOUSING CENSUS OF 00:00 HOURS ON 1 APRIL 2019
6.2. Infant mortality rate
Viet Nam needs to fortify its efforts by 2030 to achieve Goal 3 of the V-SDGs to reduce the national infant mortality rate (IMR) to less than 10 cases per 1,000 live births, although the child mortality rate is already low.
The infant mortality rate (IMR)27 measures the deaths of children in the first year of life, reflecting the quality of maternal and child health care services and facilities, and is used to assess mortality among this high-risk population group and its impact on life expectancy at birth.
All decreases in mortality affect the IMR and thereby influence the population distribution by age. IMR has a statistically significant relationship with fertility, so IMR increases or decreases have an impact on fertility.
The number of infant deaths is often underreported, as it is a sensitive topic that households may be reluctant to divulge (the IMR may be more underreported than mortality rates of adults), so the IMR was estimated using indirect methods.
Table 6.3. Infant mortality rate by sex and socio-economic region, 1999-2019
Unit: Infant deaths/1,000 live births
199928 2009 2019
ENTIRE COUNTRY 36.7 16.0 14.0
Male 40.2 18.1 15.8
Female 32.9 13.8 12.0
Urban 18.3 9.4 8.2
Rural 41.0 18.7 16.7
Socio-economic region
Northern midlands and mountain areas 43.8 24.5 20.8
Red River Delta 26.5 12.4 11.0
Northern Central and Central Coastal areas 38.4 17.2 15.4
Central Highlands 64.4 27.3 23.4
South East 23.6 10.0 8.1
Mekong River Delta 38.0 13.3 10.7
The census results showed that Viet Nam’s maternal and child health care efforts contributed to a reduction in the infant mortality rate. The IMR in 2019 was 14 deaths per 1,000 live births, a drop from 16 deaths per 1,000 live births in 2009. The male IMR in 2019 was 3.8 per thousand points
27 This rate is defined as the average number of deaths of children under one-year-old per 1,000 live births during the study period, usually 12 months prior to the time of the Census. 28 Data in 1999 is adjusted by 6 socio-economic regions.
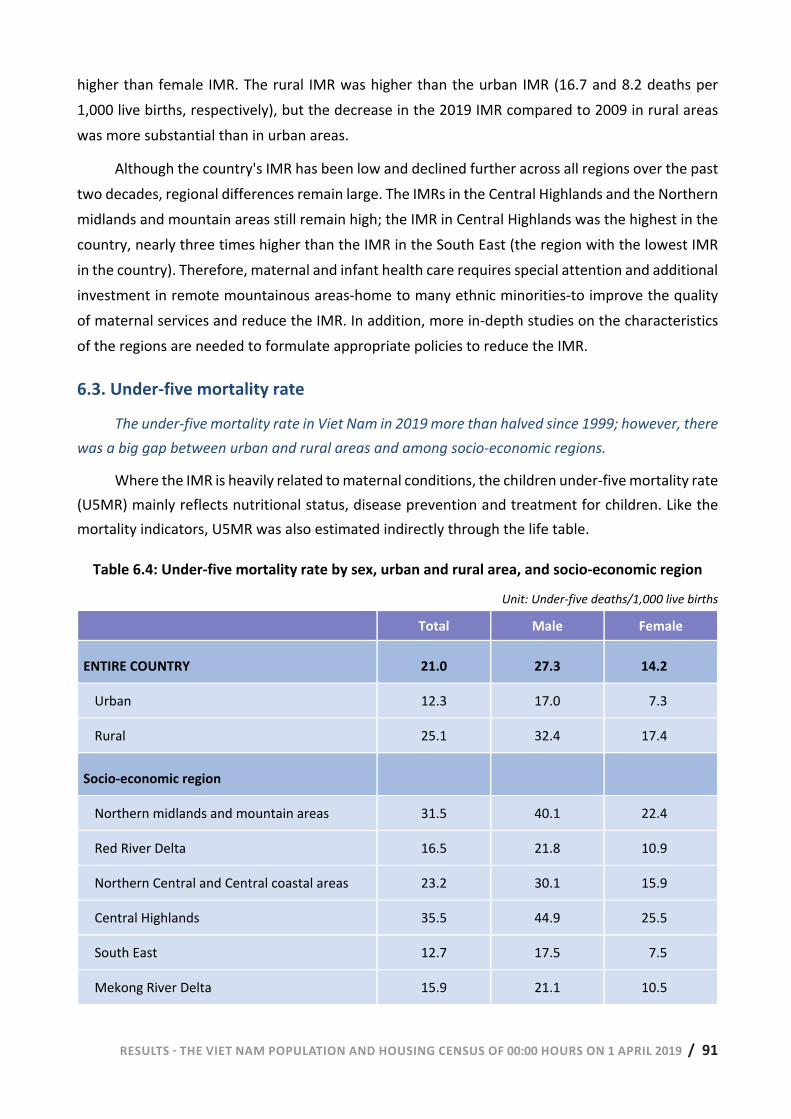
RESULTS - THE VIET NAM POPULATION AND HOUSING CENSUS OF 00:00 HOURS ON 1 APRIL 2019 / 91 RESULTS - THE VIET NAM POPULATION AND HOUSING CENSUS OF 00:00 HOURS ON 1 APRIL 2019 | 89
higher than female IMR. The rural IMR was higher than the urban IMR (16.7 and 8.2 deaths per 1,000 live births, respectively), but the decrease in the 2019 IMR compared to 2009 in rural areas was more substantial than in urban areas.
Although the country's IMR has been low and declined further across all regions over the past two decades, regional differences remain large. The IMRs in the Central Highlands and the Northern midlands and mountain areas still remain high; the IMR in Central Highlands was the highest in the country, nearly three times higher than the IMR in the South East (the region with the lowest IMR in the country). Therefore, maternal and infant health care requires special attention and additional investment in remote mountainous areas-home to many ethnic minorities-to improve the quality of maternal services and reduce the IMR. In addition, more in-depth studies on the characteristics of the regions are needed to formulate appropriate policies to reduce the IMR.
6.3. Under-five mortality rate
The under-five mortality rate in Viet Nam in 2019 more than halved since 1999; however, there was a big gap between urban and rural areas and among socio-economic regions.
Where the IMR is heavily related to maternal conditions, the children under-five mortality rate (U5MR) mainly reflects nutritional status, disease prevention and treatment for children. Like the mortality indicators, U5MR was also estimated indirectly through the life table.
Table 6.4: Under-five mortality rate by sex, urban and rural area, and socio-economic region
Unit: Under-five deaths/1,000 live births
Total Male Female
ENTIRE COUNTRY 21.0 27.3 14.2
Urban 12.3 17.0 7.3
Rural 25.1 32.4 17.4
Socio-economic region
Northern midlands and mountain areas 31.5 40.1 22.4
Red River Delta 16.5 21.8 10.9
Northern Central and Central coastal areas 23.2 30.1 15.9
Central Highlands 35.5 44.9 25.5
South East 12.7 17.5 7.5
Mekong River Delta 15.9 21.1 10.5
92 / RESULTS - THE VIET NAM POPULATION AND HOUSING CENSUS OF 00:00 HOURS ON 1 APRIL 2019 90 | RESULTS - THE VIET NAM POPULATION AND HOUSING CENSUS OF 00:00 HOURS ON 1 APRIL 2019
Over the past two decades, Viet Nam has made remarkable achievements in health care and disease prevention for children, reflected in the rapid reduction in mortality among children under five. Viet Nam's U5MR in 2019 was 21.0 deaths per 1,000 live births, less than half the rate in 1999 (56.9 deaths per 1,000 live births). However, there was still a big gap between urban and rural areas and among socio-economic regions: the U5MR in rural areas was twice as high as in urban areas (25.1 and 12.3 deaths per 1,000 live births, respectively). The U5MR in less developed economic regions, such as the Northern midlands and mountain areas and Central Highlands, remained quite high (31.5 and 35.5 deaths per 1,000 live births, respectively), nearly three times more than that in the South East and twice that in the Red River Delta. Goal 3 of V-SDGs is to, by 2030, reduce the under-five mortality rate to less than 15 cases per 1,000 live births. Based on the results of the 2019 Census, Viet Nam needs to continuously promote the implementation of health policies in disadvantaged, mountainous, and remote areas inhabited by ethnic minorities to reduce disparities in child health care among regions, thereby reducing the U5MR rate across the country toward achieving this goal.
6.4. Maternal mortality ratio
The maternal mortality ratio in 2019 decreased by 23 cases per 100,000 live births compared to that in 2009, suggesting that Viet Nam will achieve its goal of reducing maternal mortality ahead of the timeline stated in the National Action Plan for Agenda 2030.
The maternal mortality ratio (MMR)29 reflects the level of mortality related to pregnancy and childbirth. This indicator assesses health system effectiveness in providing maternal health care before, during, and after childbirth.
This indicator is determined by the correlation between the number of women who die of pregnancy-related causes in the year and the number of newborns in the year. Unlike other demographic indicators, the maternal mortality ratio is not calculated per 1,000 but per 100,000 live births. The MMR indicates how many mothers die of pregnancy-related causes for every 100,000 children born alive in the year.
The MMR in 2019 was 46 cases per 100,000 live births, a drop of 23 cases per 100,000 live births compared to 2009 (69 cases per 100,000 live births). In comparison with other countries in Southeast Asia, Viet Nam's MMR was higher than in Brunei, Malaysia, Singapore, and Thailand and lower than the rest of the region.
The census results show that by 2030, it is feasible to achieve the goal of reducing the MMR to less than 45 cases per 100,000 live births in accordance with Decision No. 622/QD-TTg dated 10 May 2017 by the Prime Minister promulgating the National Action Plan to implement the 2030 Agenda.
29 Maternal mortality ratio (MMR) is the number of women who die of causes related to pregnancy and childbirth (not by accidental causes such as malaria, accidents, suicide ...), which have occurred during the period from pregnancy to 42 days postpartum, an average of over 100,000 live births in the study period.
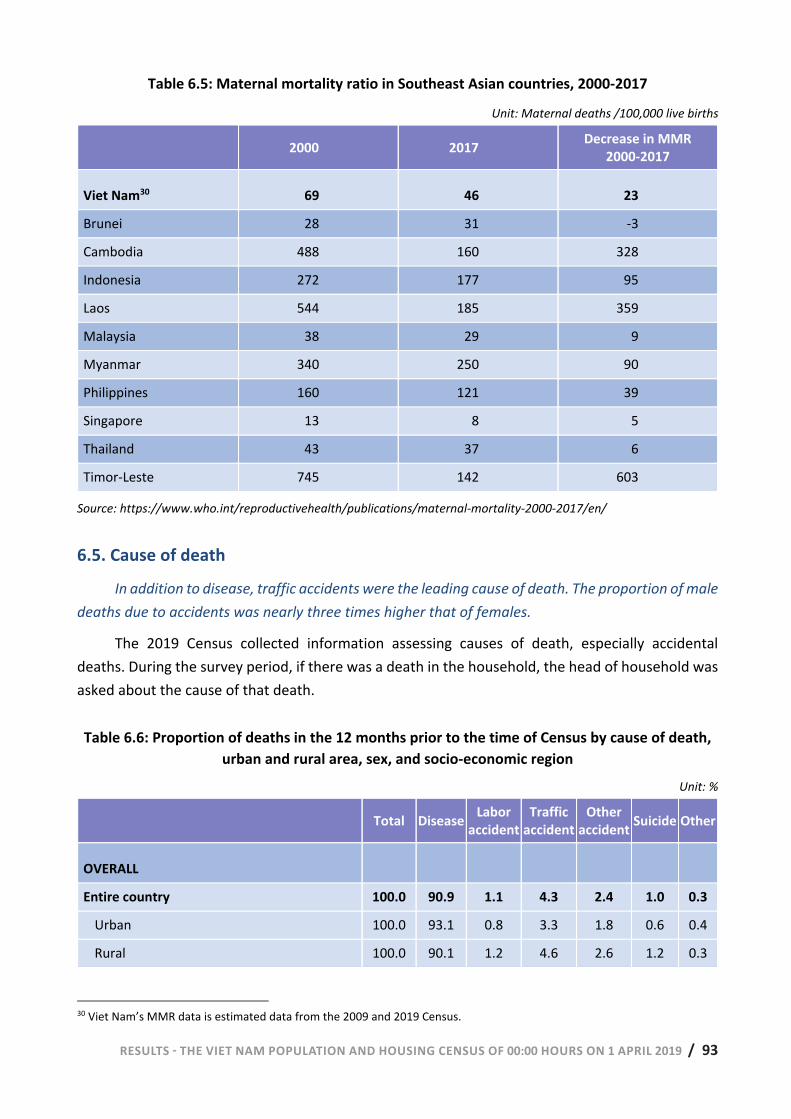
RESULTS - THE VIET NAM POPULATION AND HOUSING CENSUS OF 00:00 HOURS ON 1 APRIL 2019 / 93 RESULTS - THE VIET NAM POPULATION AND HOUSING CENSUS OF 00:00 HOURS ON 1 APRIL 2019 | 91
Table 6.5: Maternal mortality ratio in Southeast Asian countries, 2000-2017
Unit: Maternal deaths /100,000 live births
2000 2017 Decrease in MMR 2000-2017
Viet Nam30 69 46 23
Brunei 28 31 -3
Cambodia 488 160 328
Indonesia 272 177 95
Laos 544 185 359
Malaysia 38 29 9
Myanmar 340 250 90
Philippines 160 121 39
Singapore 13 8 5
Thailand 43 37 6
Timor-Leste 745 142 603
Source: https://www.who.int/reproductivehealth/publications/maternal-mortality-2000-2017/en/
6.5. Cause of death
In addition to disease, traffic accidents were the leading cause of death. The proportion of male deaths due to accidents was nearly three times higher that of females.
The 2019 Census collected information assessing causes of death, especially accidental deaths. During the survey period, if there was a death in the household, the head of household was asked about the cause of that death.
Table 6.6: Proportion of deaths in the 12 months prior to the time of Census by cause of death, urban and rural area, sex, and socio-economic region
Unit: %
Total Disease Labor accident
Traffic accident
Other accident Suicide Other
OVERALL
Entire country 100.0 90.9 1.1 4.3 2.4 1.0 0.3
Urban 100.0 93.1 0.8 3.3 1.8 0.6 0.4
Rural 100.0 90.1 1.2 4.6 2.6 1.2 0.3
30 Viet Nam’s MMR data is estimated data from the 2009 and 2019 Census.
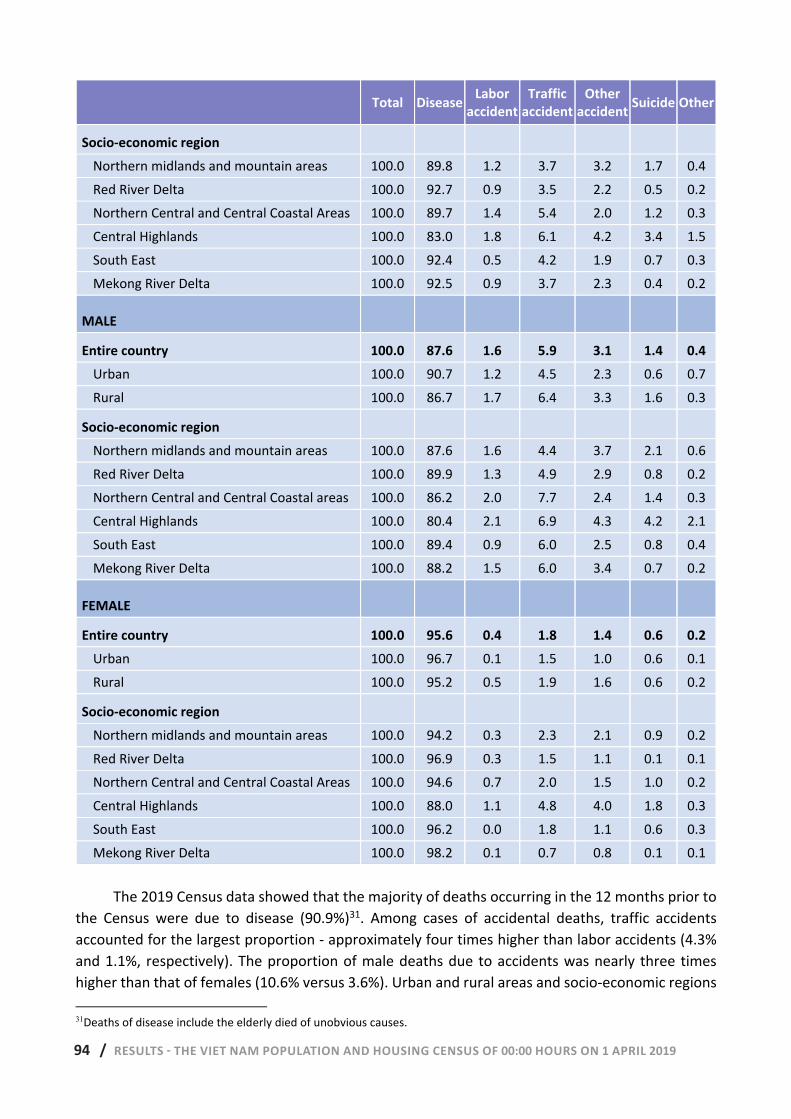
94 / RESULTS - THE VIET NAM POPULATION AND HOUSING CENSUS OF 00:00 HOURS ON 1 APRIL 2019 92 | RESULTS - THE VIET NAM POPULATION AND HOUSING CENSUS OF 00:00 HOURS ON 1 APRIL 2019
Total Disease Labor accident
Traffic accident
Other accident Suicide Other
Socio-economic region Northern midlands and mountain areas 100.0 89.8 1.2 3.7 3.2 1.7 0.4 Red River Delta 100.0 92.7 0.9 3.5 2.2 0.5 0.2 Northern Central and Central Coastal Areas 100.0 89.7 1.4 5.4 2.0 1.2 0.3 Central Highlands 100.0 83.0 1.8 6.1 4.2 3.4 1.5 South East 100.0 92.4 0.5 4.2 1.9 0.7 0.3 Mekong River Delta 100.0 92.5 0.9 3.7 2.3 0.4 0.2
MALE
Entire country 100.0 87.6 1.6 5.9 3.1 1.4 0.4 Urban 100.0 90.7 1.2 4.5 2.3 0.6 0.7 Rural 100.0 86.7 1.7 6.4 3.3 1.6 0.3
Socio-economic region Northern midlands and mountain areas 100.0 87.6 1.6 4.4 3.7 2.1 0.6 Red River Delta 100.0 89.9 1.3 4.9 2.9 0.8 0.2 Northern Central and Central Coastal areas 100.0 86.2 2.0 7.7 2.4 1.4 0.3 Central Highlands 100.0 80.4 2.1 6.9 4.3 4.2 2.1 South East 100.0 89.4 0.9 6.0 2.5 0.8 0.4 Mekong River Delta 100.0 88.2 1.5 6.0 3.4 0.7 0.2
FEMALE
Entire country 100.0 95.6 0.4 1.8 1.4 0.6 0.2 Urban 100.0 96.7 0.1 1.5 1.0 0.6 0.1 Rural 100.0 95.2 0.5 1.9 1.6 0.6 0.2
Socio-economic region Northern midlands and mountain areas 100.0 94.2 0.3 2.3 2.1 0.9 0.2 Red River Delta 100.0 96.9 0.3 1.5 1.1 0.1 0.1 Northern Central and Central Coastal Areas 100.0 94.6 0.7 2.0 1.5 1.0 0.2 Central Highlands 100.0 88.0 1.1 4.8 4.0 1.8 0.3 South East 100.0 96.2 0.0 1.8 1.1 0.6 0.3 Mekong River Delta 100.0 98.2 0.1 0.7 0.8 0.1 0.1
The 2019 Census data showed that the majority of deaths occurring in the 12 months prior to the Census were due to disease (90.9%)31. Among cases of accidental deaths, traffic accidents accounted for the largest proportion - approximately four times higher than labor accidents (4.3% and 1.1%, respectively). The proportion of male deaths due to accidents was nearly three times higher than that of females (10.6% versus 3.6%). Urban and rural areas and socio-economic regions 31Deaths of disease include the elderly died of unobvious causes.
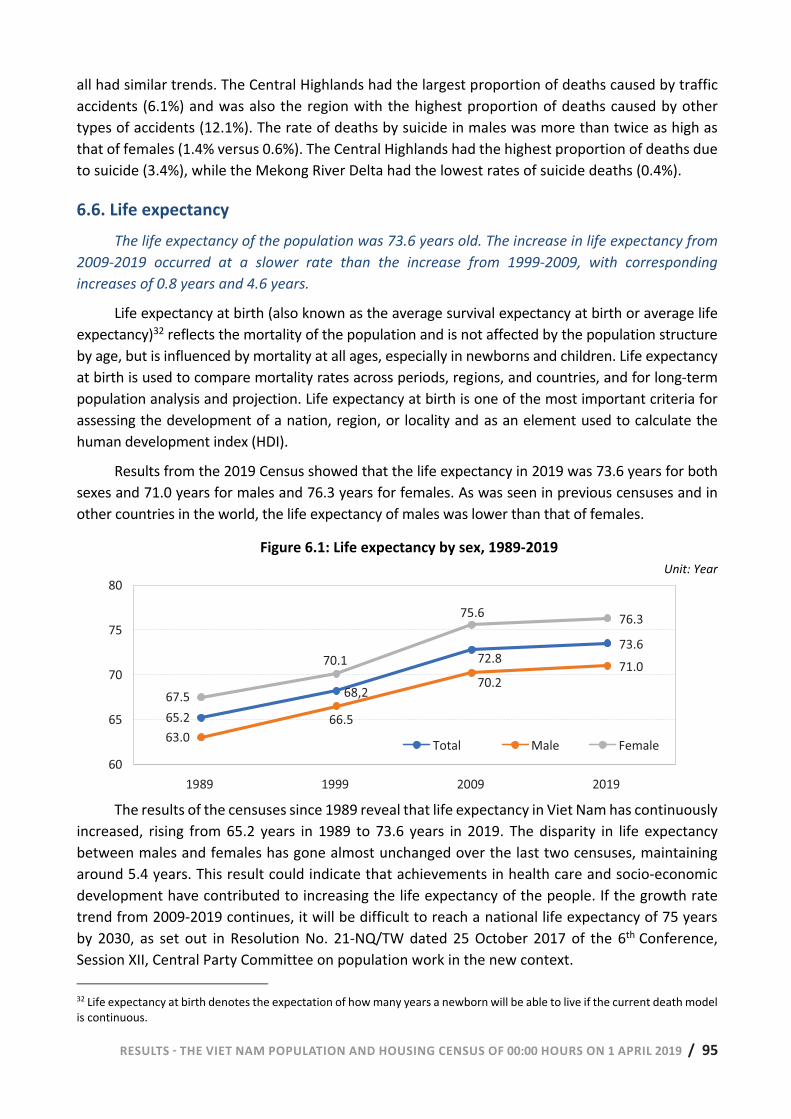
RESULTS - THE VIET NAM POPULATION AND HOUSING CENSUS OF 00:00 HOURS ON 1 APRIL 2019 / 95 RESULTS - THE VIET NAM POPULATION AND HOUSING CENSUS OF 00:00 HOURS ON 1 APRIL 2019 | 93
all had similar trends. The Central Highlands had the largest proportion of deaths caused by traffic accidents (6.1%) and was also the region with the highest proportion of deaths caused by other types of accidents (12.1%). The rate of deaths by suicide in males was more than twice as high as that of females (1.4% versus 0.6%). The Central Highlands had the highest proportion of deaths due to suicide (3.4%), while the Mekong River Delta had the lowest rates of suicide deaths (0.4%).
6.6. Life expectancy The life expectancy of the population was 73.6 years old. The increase in life expectancy from
2009-2019 occurred at a slower rate than the increase from 1999-2009, with corresponding increases of 0.8 years and 4.6 years.
Life expectancy at birth (also known as the average survival expectancy at birth or average life expectancy)32 reflects the mortality of the population and is not affected by the population structure by age, but is influenced by mortality at all ages, especially in newborns and children. Life expectancy at birth is used to compare mortality rates across periods, regions, and countries, and for long-term population analysis and projection. Life expectancy at birth is one of the most important criteria for assessing the development of a nation, region, or locality and as an element used to calculate the human development index (HDI).
Results from the 2019 Census showed that the life expectancy in 2019 was 73.6 years for both sexes and 71.0 years for males and 76.3 years for females. As was seen in previous censuses and in other countries in the world, the life expectancy of males was lower than that of females.
Figure 6.1: Life expectancy by sex, 1989-2019 Unit: Year
The results of the censuses since 1989 reveal that life expectancy in Viet Nam has continuously
increased, rising from 65.2 years in 1989 to 73.6 years in 2019. The disparity in life expectancy between males and females has gone almost unchanged over the last two censuses, maintaining around 5.4 years. This result could indicate that achievements in health care and socio-economic development have contributed to increasing the life expectancy of the people. If the growth rate trend from 2009-2019 continues, it will be difficult to reach a national life expectancy of 75 years by 2030, as set out in Resolution No. 21-NQ/TW dated 25 October 2017 of the 6th Conference, Session XII, Central Party Committee on population work in the new context. 32 Life expectancy at birth denotes the expectation of how many years a newborn will be able to live if the current death model is continuous.
65.2
68.2
72.8 73.6
63
66.5
70.2 71
67.570.1
75.6 76.3
60
65
70
75
80
1989 1999 2009 2019
Total Male Female65.2
68,2
72.873.6
63.066.5
70.271.0
67.5
70.1
75.6 76.3
60
65
70
75
80
1989 1999 2009 2019
Total Male Female
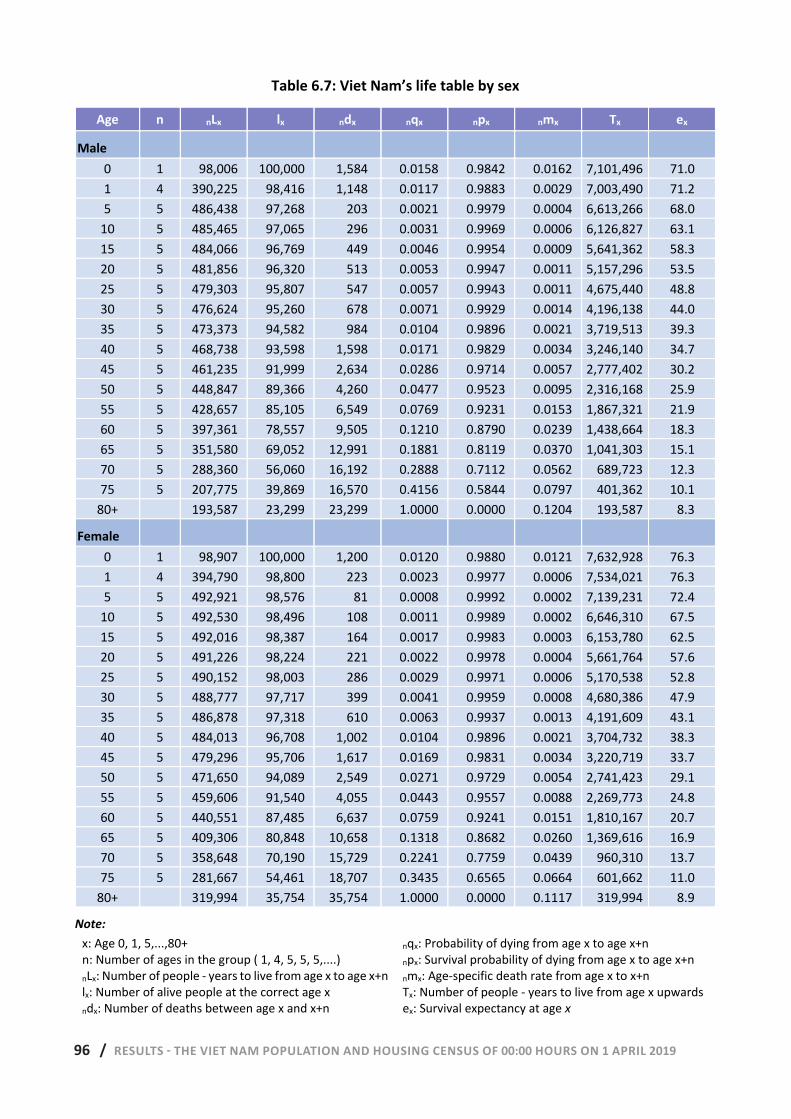
96 / RESULTS - THE VIET NAM POPULATION AND HOUSING CENSUS OF 00:00 HOURS ON 1 APRIL 2019 94 | RESULTS - THE VIET NAM POPULATION AND HOUSING CENSUS OF 00:00 HOURS ON 1 APRIL 2019
Table 6.7: Viet Nam’s life table by sex
Age n nLx lx ndx nqx npx nmx Tx ex
Male 0 1 98,006 100,000 1,584 0.0158 0.9842 0.0162 7,101,496 71.0 1 4 390,225 98,416 1,148 0.0117 0.9883 0.0029 7,003,490 71.2 5 5 486,438 97,268 203 0.0021 0.9979 0.0004 6,613,266 68.0
10 5 485,465 97,065 296 0.0031 0.9969 0.0006 6,126,827 63.1 15 5 484,066 96,769 449 0.0046 0.9954 0.0009 5,641,362 58.3 20 5 481,856 96,320 513 0.0053 0.9947 0.0011 5,157,296 53.5 25 5 479,303 95,807 547 0.0057 0.9943 0.0011 4,675,440 48.8 30 5 476,624 95,260 678 0.0071 0.9929 0.0014 4,196,138 44.0 35 5 473,373 94,582 984 0.0104 0.9896 0.0021 3,719,513 39.3 40 5 468,738 93,598 1,598 0.0171 0.9829 0.0034 3,246,140 34.7 45 5 461,235 91,999 2,634 0.0286 0.9714 0.0057 2,777,402 30.2 50 5 448,847 89,366 4,260 0.0477 0.9523 0.0095 2,316,168 25.9 55 5 428,657 85,105 6,549 0.0769 0.9231 0.0153 1,867,321 21.9 60 5 397,361 78,557 9,505 0.1210 0.8790 0.0239 1,438,664 18.3 65 5 351,580 69,052 12,991 0.1881 0.8119 0.0370 1,041,303 15.1 70 5 288,360 56,060 16,192 0.2888 0.7112 0.0562 689,723 12.3 75 5 207,775 39,869 16,570 0.4156 0.5844 0.0797 401,362 10.1
80+ 193,587 23,299 23,299 1.0000 0.0000 0.1204 193,587 8.3
Female
0 1 98,907 100,000 1,200 0.0120 0.9880 0.0121 7,632,928 76.3 1 4 394,790 98,800 223 0.0023 0.9977 0.0006 7,534,021 76.3 5 5 492,921 98,576 81 0.0008 0.9992 0.0002 7,139,231 72.4
10 5 492,530 98,496 108 0.0011 0.9989 0.0002 6,646,310 67.5 15 5 492,016 98,387 164 0.0017 0.9983 0.0003 6,153,780 62.5 20 5 491,226 98,224 221 0.0022 0.9978 0.0004 5,661,764 57.6 25 5 490,152 98,003 286 0.0029 0.9971 0.0006 5,170,538 52.8 30 5 488,777 97,717 399 0.0041 0.9959 0.0008 4,680,386 47.9 35 5 486,878 97,318 610 0.0063 0.9937 0.0013 4,191,609 43.1 40 5 484,013 96,708 1,002 0.0104 0.9896 0.0021 3,704,732 38.3 45 5 479,296 95,706 1,617 0.0169 0.9831 0.0034 3,220,719 33.7 50 5 471,650 94,089 2,549 0.0271 0.9729 0.0054 2,741,423 29.1 55 5 459,606 91,540 4,055 0.0443 0.9557 0.0088 2,269,773 24.8 60 5 440,551 87,485 6,637 0.0759 0.9241 0.0151 1,810,167 20.7 65 5 409,306 80,848 10,658 0.1318 0.8682 0.0260 1,369,616 16.9 70 5 358,648 70,190 15,729 0.2241 0.7759 0.0439 960,310 13.7 75 5 281,667 54,461 18,707 0.3435 0.6565 0.0664 601,662 11.0
80+ 319,994 35,754 35,754 1.0000 0.0000 0.1117 319,994 8.9
Note: x: Age 0, 1, 5,...,80+ nqx: Probability of dying from age x to age x+n n: Number of ages in the group ( 1, 4, 5, 5, 5,....) npx: Survival probability of dying from age x to age x+nnLx: Number of people - years to live from age x to age x+n nmx: Age-specific death rate from age x to x+n lx: Number of alive people at the correct age x Tx: Number of people - years to live from age x upwardsndx: Number of deaths between age x and x+n ex: Survival expectancy at age x
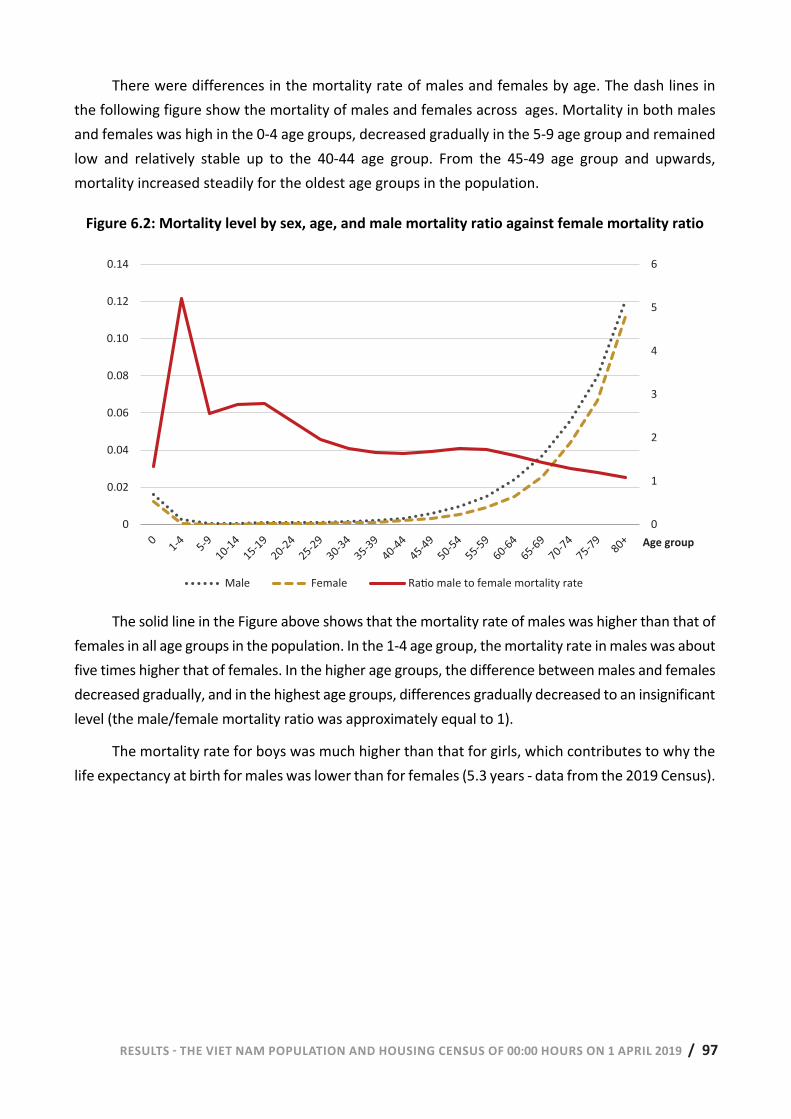
RESULTS - THE VIET NAM POPULATION AND HOUSING CENSUS OF 00:00 HOURS ON 1 APRIL 2019 / 97 RESULTS - THE VIET NAM POPULATION AND HOUSING CENSUS OF 00:00 HOURS ON 1 APRIL 2019 | 95
There were differences in the mortality rate of males and females by age. The dash lines in the following figure show the mortality of males and females across ages. Mortality in both males and females was high in the 0-4 age groups, decreased gradually in the 5-9 age group and remained low and relatively stable up to the 40-44 age group. From the 45-49 age group and upwards, mortality increased steadily for the oldest age groups in the population.
Figure 6.2: Mortality level by sex, age, and male mortality ratio against female mortality ratio
The solid line in the Figure above shows that the mortality rate of males was higher than that of females in all age groups in the population. In the 1-4 age group, the mortality rate in males was about five times higher that of females. In the higher age groups, the difference between males and females decreased gradually, and in the highest age groups, differences gradually decreased to an insignificant level (the male/female mortality ratio was approximately equal to 1).
The mortality rate for boys was much higher than that for girls, which contributes to why the life expectancy at birth for males was lower than for females (5.3 years - data from the 2019 Census).
0
1
2
3
4
5
6
0
0.02
0.04
0.06
0.08
0.1
0.12
0.14
Male Female Ratio male to female mortality rate
0
1
2
3
4
5
6
0
0.02
0.04
0.06
0.08
0.10
0.12
0.14
Male Female Ra�o male to female mortality rate
Age group

98 / RESULTS - THE VIET NAM POPULATION AND HOUSING CENSUS OF 00:00 HOURS ON 1 APRIL 2019
Photo: UNFPA Viet Nam/ Vu Ngoc Dung
RESULTS - THE VIET NAM POPULATION AND HOUSING CENSUS OF 00:00 HOURS ON 1 APRIL 2019 / 99 96 | RESULTS - THE VIET NAM POPULATION AND HOUSING CENSUS OF 00:00 HOURS ON 1 APRIL 2019
CHAPTER 7: MIGRATION AND URBANIZATION
Migration is a change in an individual’s place of residence from one territorial unit to another in a given period. Internal migration is important for population changes, especially in the context of relatively stable fertility and mortality in Viet Nam. Migration is a positive driving force promoting socio-economic development, contributing to population reallocation, restructuring the economy and labor, creating jobs, reducing poverty and ensuring sustainable development.
As with the previous population and housing censuses, the 2019 Census collected information on migration through questions about an individual’s primary place of residence for the five years prior to the Census for people aged 5 years and older to assess internal migration. A person is considered a migrant if his or her current place of residence at the time of the Census and the place of residence five years prior to the time of the Census were not in the same administrative unit at the commune level33. Definitions used to assess and analyze migration within this chapter are listed below.
International migration: The 2019 Census could only estimate the number of international immigrants aged 5 years and older.
Inter-regional migration: Includes people aged five and older living in Viet Nam and who lived in a socio-economic region other than the current socio-economic region where they currently reside any time five years prior to the time of the Census.
Inter-provincial migration: Includes people aged five and older living in Viet Nam and who lived in a province other than the province where they currently reside any time five years prior to the time of the Census.
Inter-district migration: Includes people aged five and older living in Viet Nam and who lived in the same province but in a district other than the district where they currently reside any time five years prior to the time of the Census.
Intra-district migration: Includes people aged five and older living in Viet Nam and who lived in the same district but in a different commune, ward, or town other than the commune, ward, or town where they currently reside any time five years prior to the time of the Census.
Non-migration: Includes people aged five and older living in Viet Nam and who lived in the same commune, ward or town with their current place of usual residence (no inter-communal migration) any time five years prior to the time of the Census.
33 Note: at the time of the Census, if a person is still in their usual residence within a commune-level administrative unit, even though the administrative unit has changed its name (from commune to ward or town, and vice versa) compared to five years prior, that person is not considered a migrant.
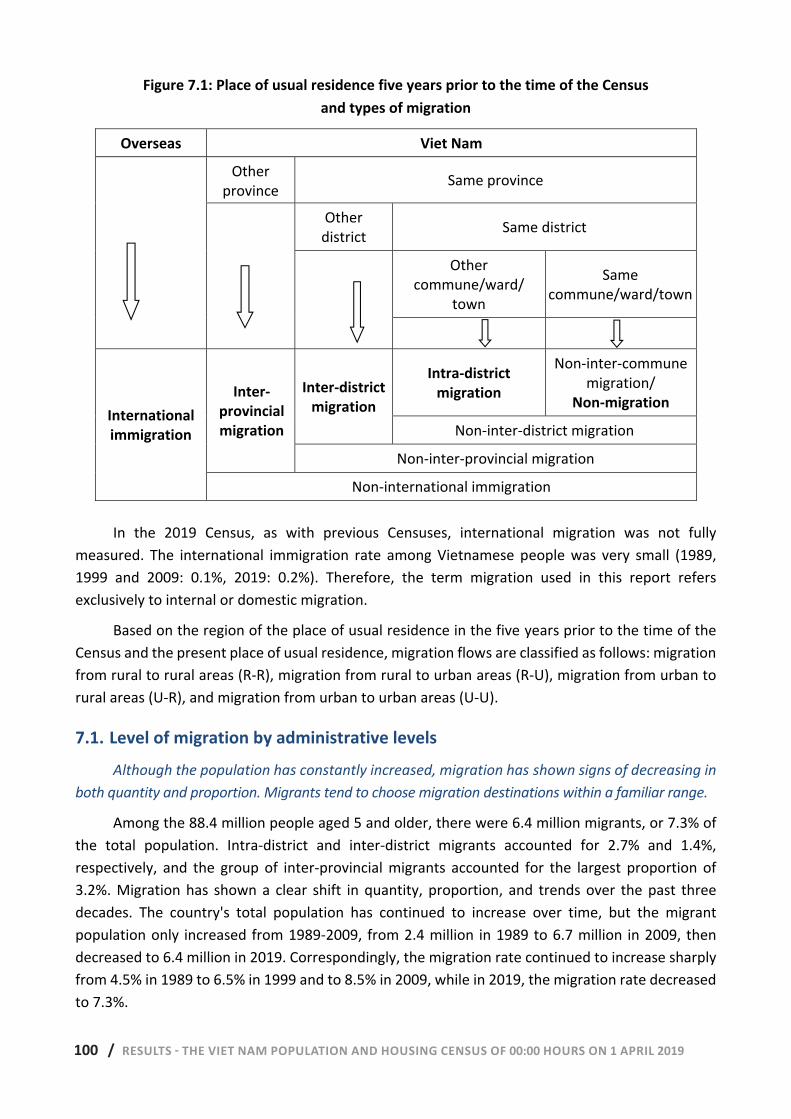
100 / RESULTS - THE VIET NAM POPULATION AND HOUSING CENSUS OF 00:00 HOURS ON 1 APRIL 2019 RESULTS - THE VIET NAM POPULATION AND HOUSING CENSUS OF 00:00 HOURS ON 1 APRIL 2019 | 97
Figure 7.1: Place of usual residence five years prior to the time of the Census and types of migration
Overseas Viet Nam
Other province Same province
Other district Same district
Other commune/ward/
town
Same commune/ward/town
International immigration
Inter-provincial migration
Inter-district migration
Intra-district migration
Non-inter-commune migration/
Non-migration
Non-inter-district migration
Non-inter-provincial migration
Non-international immigration
In the 2019 Census, as with previous Censuses, international migration was not fully measured. The international immigration rate among Vietnamese people was very small (1989, 1999 and 2009: 0.1%, 2019: 0.2%). Therefore, the term migration used in this report refers exclusively to internal or domestic migration.
Based on the region of the place of usual residence in the five years prior to the time of the Census and the present place of usual residence, migration flows are classified as follows: migration from rural to rural areas (R-R), migration from rural to urban areas (R-U), migration from urban to rural areas (U-R), and migration from urban to urban areas (U-U).
7.1. Level of migration by administrative levels Although the population has constantly increased, migration has shown signs of decreasing in
both quantity and proportion. Migrants tend to choose migration destinations within a familiar range.
Among the 88.4 million people aged 5 and older, there were 6.4 million migrants, or 7.3% of the total population. Intra-district and inter-district migrants accounted for 2.7% and 1.4%, respectively, and the group of inter-provincial migrants accounted for the largest proportion of 3.2%. Migration has shown a clear shift in quantity, proportion, and trends over the past three decades. The country's total population has continued to increase over time, but the migrant population only increased from 1989-2009, from 2.4 million in 1989 to 6.7 million in 2009, then decreased to 6.4 million in 2019. Correspondingly, the migration rate continued to increase sharply from 4.5% in 1989 to 6.5% in 1999 and to 8.5% in 2009, while in 2019, the migration rate decreased to 7.3%.
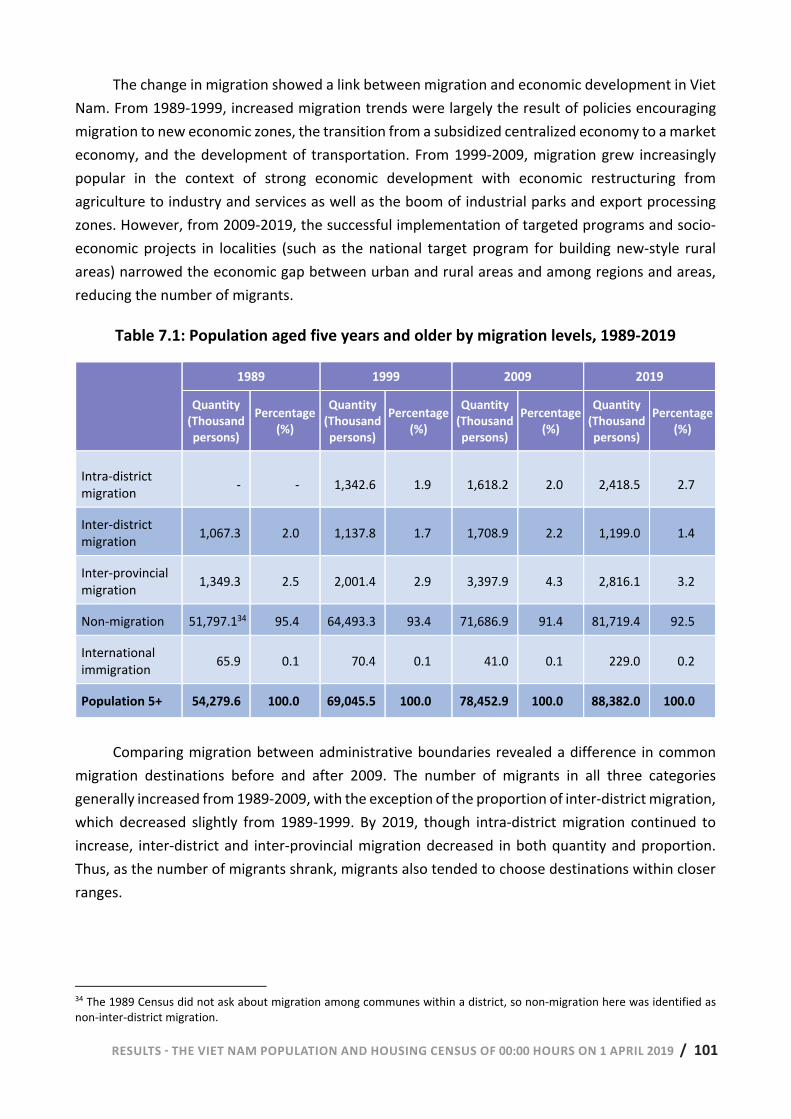
RESULTS - THE VIET NAM POPULATION AND HOUSING CENSUS OF 00:00 HOURS ON 1 APRIL 2019 / 101 98 | RESULTS - THE VIET NAM POPULATION AND HOUSING CENSUS OF 00:00 HOURS ON 1 APRIL 2019
The change in migration showed a link between migration and economic development in Viet Nam. From 1989-1999, increased migration trends were largely the result of policies encouraging migration to new economic zones, the transition from a subsidized centralized economy to a market economy, and the development of transportation. From 1999-2009, migration grew increasingly popular in the context of strong economic development with economic restructuring from agriculture to industry and services as well as the boom of industrial parks and export processing zones. However, from 2009-2019, the successful implementation of targeted programs and socio-economic projects in localities (such as the national target program for building new-style rural areas) narrowed the economic gap between urban and rural areas and among regions and areas, reducing the number of migrants.
Table 7.1: Population aged five years and older by migration levels, 1989-2019
1989 1999 2009 2019
Quantity (Thousand persons)
Percentage (%)
Quantity(Thousand persons)
Percentage (%)
Quantity(Thousand persons)
Percentage (%)
Quantity (Thousand persons)
Percentage (%)
Intra-district migration - - 1,342.6 1.9 1,618.2 2.0 2,418.5 2.7
Inter-district migration 1,067.3 2.0 1,137.8 1.7 1,708.9 2.2 1,199.0 1.4
Inter-provincial migration 1,349.3 2.5 2,001.4 2.9 3,397.9 4.3 2,816.1 3.2
Non-migration 51,797.134 95.4 64,493.3 93.4 71,686.9 91.4 81,719.4 92.5
International immigration 65.9 0.1 70.4 0.1 41.0 0.1 229.0 0.2
Population 5+ 54,279.6 100.0 69,045.5 100.0 78,452.9 100.0 88,382.0 100.0
Comparing migration between administrative boundaries revealed a difference in common migration destinations before and after 2009. The number of migrants in all three categories generally increased from 1989-2009, with the exception of the proportion of inter-district migration, which decreased slightly from 1989-1999. By 2019, though intra-district migration continued to increase, inter-district and inter-provincial migration decreased in both quantity and proportion. Thus, as the number of migrants shrank, migrants also tended to choose destinations within closer ranges.
34 The 1989 Census did not ask about migration among communes within a district, so non-migration here was identified as non-inter-district migration.
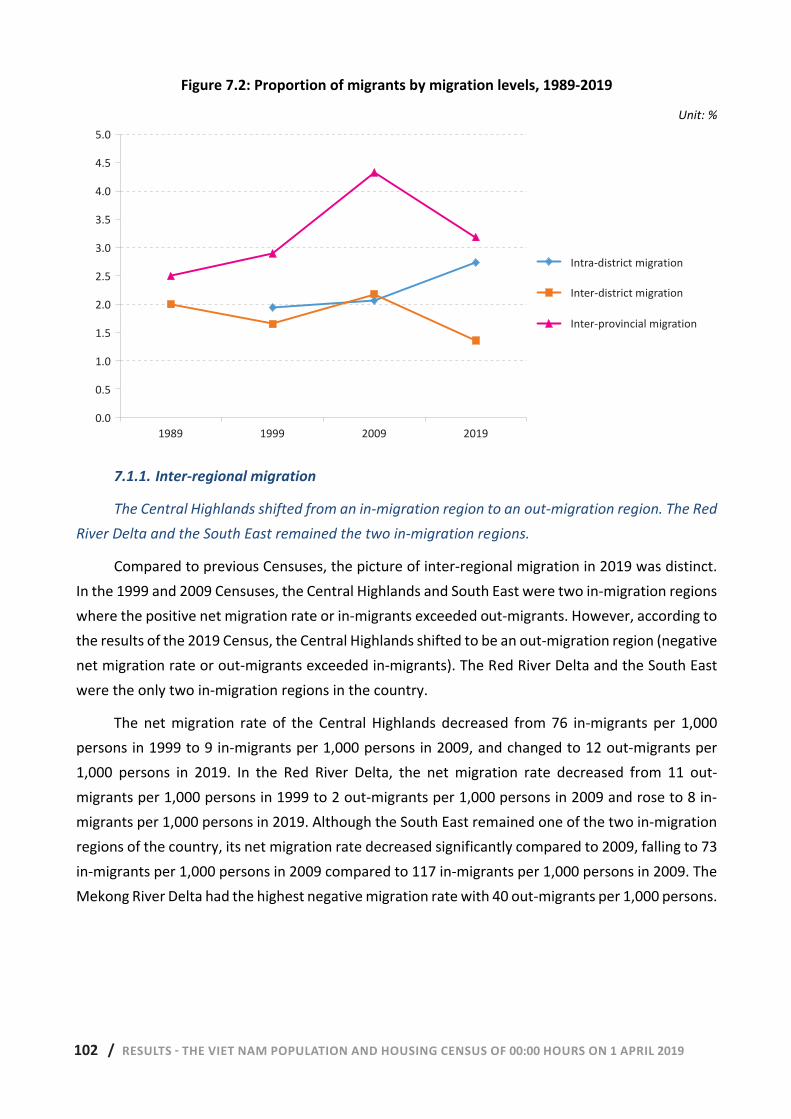
102 / RESULTS - THE VIET NAM POPULATION AND HOUSING CENSUS OF 00:00 HOURS ON 1 APRIL 2019 RESULTS - THE VIET NAM POPULATION AND HOUSING CENSUS OF 00:00 HOURS ON 1 APRIL 2019 | 99
Figure 7.2: Proportion of migrants by migration levels, 1989-2019
Unit: %
7.1.1. Inter-regional migration
The Central Highlands shifted from an in-migration region to an out-migration region. The Red River Delta and the South East remained the two in-migration regions.
Compared to previous Censuses, the picture of inter-regional migration in 2019 was distinct. In the 1999 and 2009 Censuses, the Central Highlands and South East were two in-migration regions where the positive net migration rate or in-migrants exceeded out-migrants. However, according to the results of the 2019 Census, the Central Highlands shifted to be an out-migration region (negative net migration rate or out-migrants exceeded in-migrants). The Red River Delta and the South East were the only two in-migration regions in the country.
The net migration rate of the Central Highlands decreased from 76 in-migrants per 1,000 persons in 1999 to 9 in-migrants per 1,000 persons in 2009, and changed to 12 out-migrants per 1,000 persons in 2019. In the Red River Delta, the net migration rate decreased from 11 out-migrants per 1,000 persons in 1999 to 2 out-migrants per 1,000 persons in 2009 and rose to 8 in-migrants per 1,000 persons in 2019. Although the South East remained one of the two in-migration regions of the country, its net migration rate decreased significantly compared to 2009, falling to 73 in-migrants per 1,000 persons in 2009 compared to 117 in-migrants per 1,000 persons in 2009. The Mekong River Delta had the highest negative migration rate with 40 out-migrants per 1,000 persons.
0.0
0.5
1.0
1.5
2.0
2.5
3.0
3.5
4.0
4.5
5.0
1989 1999 2009 2019
Intra-district migration
Inter-district migration
Inter-provincial migrationDi cư giữa các tỉnh
5.0
4.5
4.0
3.5
3.0
2.5
2.0
1.5
1.0
0.5
0.0
1989 1999 2009 2019
Intra-district migration
Inter-district migration
Inter-provincial migration
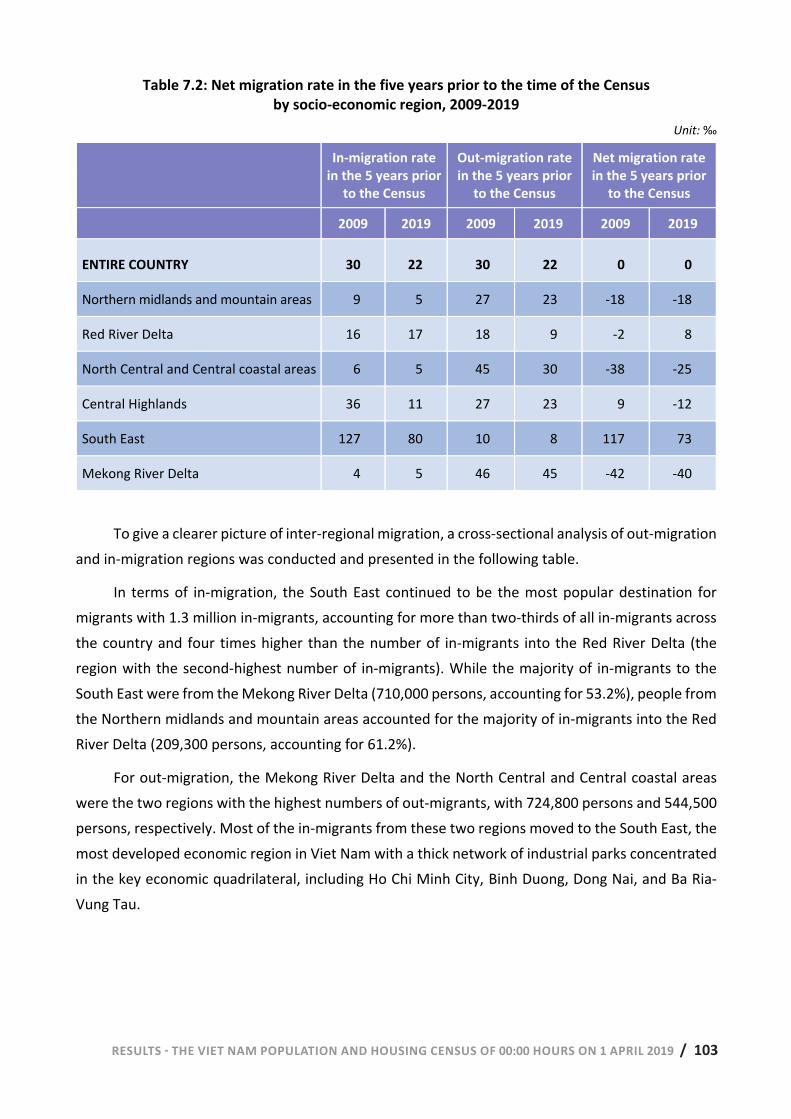
RESULTS - THE VIET NAM POPULATION AND HOUSING CENSUS OF 00:00 HOURS ON 1 APRIL 2019 / 103 100 | RESULTS - THE VIET NAM POPULATION AND HOUSING CENSUS OF 00:00 HOURS ON 1 APRIL 2019
Table 7.2: Net migration rate in the five years prior to the time of the Census by socio-economic region, 2009-2019
Unit: ‰
In-migration rate
in the 5 years prior to the Census
Out-migration rate in the 5 years prior
to the Census
Net migration rate in the 5 years prior
to the Census
2009 2019 2009 2019 2009 2019
ENTIRE COUNTRY 30 22 30 22 0 0
Northern midlands and mountain areas 9 5 27 23 -18 -18
Red River Delta 16 17 18 9 -2 8
North Central and Central coastal areas 6 5 45 30 -38 -25
Central Highlands 36 11 27 23 9 -12
South East 127 80 10 8 117 73
Mekong River Delta 4 5 46 45 -42 -40
To give a clearer picture of inter-regional migration, a cross-sectional analysis of out-migration and in-migration regions was conducted and presented in the following table.
In terms of in-migration, the South East continued to be the most popular destination for migrants with 1.3 million in-migrants, accounting for more than two-thirds of all in-migrants across the country and four times higher than the number of in-migrants into the Red River Delta (the region with the second-highest number of in-migrants). While the majority of in-migrants to the South East were from the Mekong River Delta (710,000 persons, accounting for 53.2%), people from the Northern midlands and mountain areas accounted for the majority of in-migrants into the Red River Delta (209,300 persons, accounting for 61.2%).
For out-migration, the Mekong River Delta and the North Central and Central coastal areas were the two regions with the highest numbers of out-migrants, with 724,800 persons and 544,500 persons, respectively. Most of the in-migrants from these two regions moved to the South East, the most developed economic region in Viet Nam with a thick network of industrial parks concentrated in the key economic quadrilateral, including Ho Chi Minh City, Binh Duong, Dong Nai, and Ba Ria-Vung Tau.
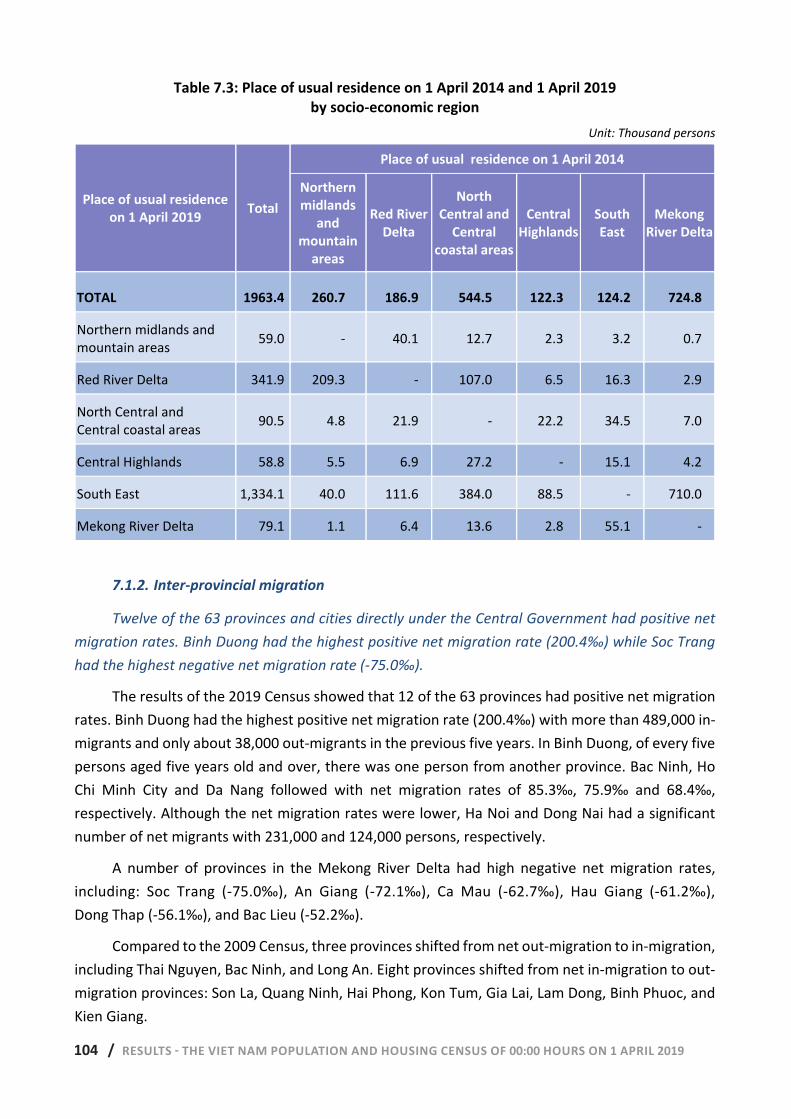
104 / RESULTS - THE VIET NAM POPULATION AND HOUSING CENSUS OF 00:00 HOURS ON 1 APRIL 2019 RESULTS - THE VIET NAM POPULATION AND HOUSING CENSUS OF 00:00 HOURS ON 1 APRIL 2019 | 101
Table 7.3: Place of usual residence on 1 April 2014 and 1 April 2019 by socio-economic region
Unit: Thousand persons
Place of usual residence on 1 April 2019 Total
Place of usual residence on 1 April 2014
Northern midlands
and mountain
areas
Red River Delta
North Central and
Central coastal areas
Central Highlands
South East
Mekong River Delta
TOTAL 1963.4 260.7 186.9 544.5 122.3 124.2 724.8
Northern midlands and mountain areas 59.0 - 40.1 12.7 2.3 3.2 0.7
Red River Delta 341.9 209.3 - 107.0 6.5 16.3 2.9
North Central and Central coastal areas 90.5 4.8 21.9 - 22.2 34.5 7.0
Central Highlands 58.8 5.5 6.9 27.2 - 15.1 4.2
South East 1,334.1 40.0 111.6 384.0 88.5 - 710.0
Mekong River Delta 79.1 1.1 6.4 13.6 2.8 55.1 -
7.1.2. Inter-provincial migration
Twelve of the 63 provinces and cities directly under the Central Government had positive net migration rates. Binh Duong had the highest positive net migration rate (200.4‰) while Soc Trang had the highest negative net migration rate (-75.0‰).
The results of the 2019 Census showed that 12 of the 63 provinces had positive net migration rates. Binh Duong had the highest positive net migration rate (200.4‰) with more than 489,000 in-migrants and only about 38,000 out-migrants in the previous five years. In Binh Duong, of every five persons aged five years old and over, there was one person from another province. Bac Ninh, Ho Chi Minh City and Da Nang followed with net migration rates of 85.3‰, 75.9‰ and 68.4‰, respectively. Although the net migration rates were lower, Ha Noi and Dong Nai had a significant number of net migrants with 231,000 and 124,000 persons, respectively.
A number of provinces in the Mekong River Delta had high negative net migration rates, including: Soc Trang (-75.0‰), An Giang (-72.1‰), Ca Mau (-62.7‰), Hau Giang (-61.2‰), Dong Thap (-56.1‰), and Bac Lieu (-52.2‰).
Compared to the 2009 Census, three provinces shifted from net out-migration to in-migration, including Thai Nguyen, Bac Ninh, and Long An. Eight provinces shifted from net in-migration to out-migration provinces: Son La, Quang Ninh, Hai Phong, Kon Tum, Gia Lai, Lam Dong, Binh Phuoc, and Kien Giang.
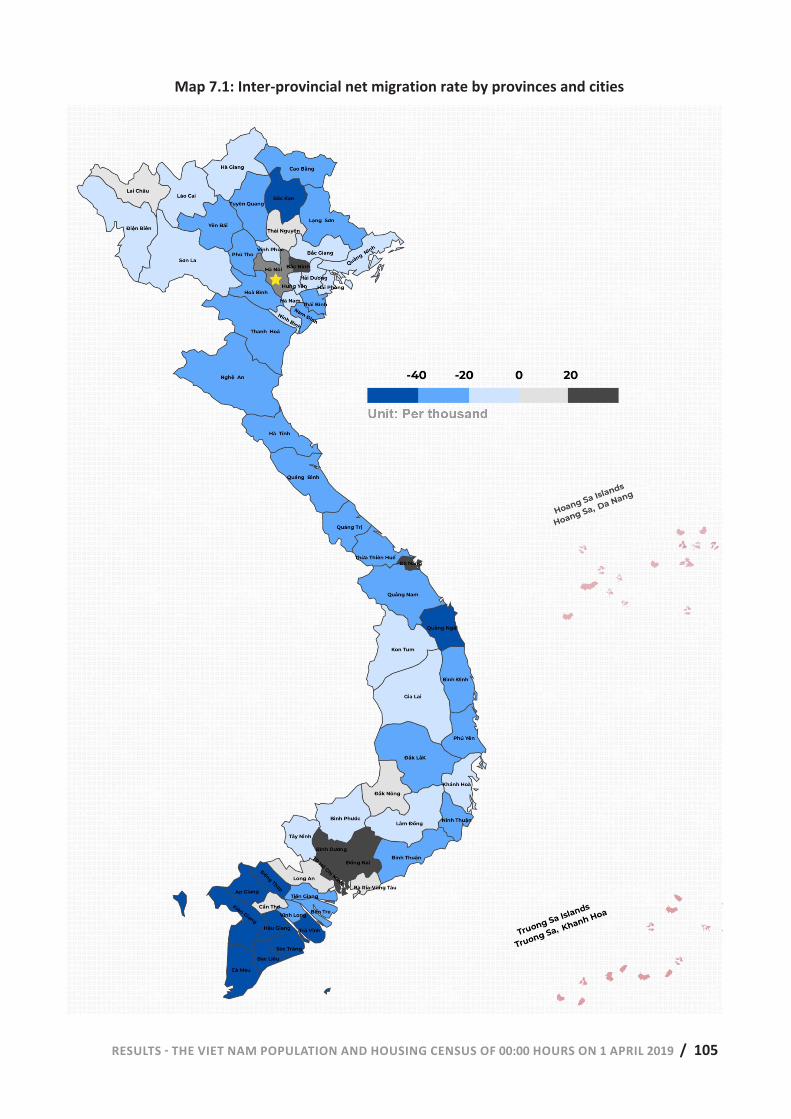
RESULTS - THE VIET NAM POPULATION AND HOUSING CENSUS OF 00:00 HOURS ON 1 APRIL 2019 / 105 102 | RESULTS - THE VIET NAM POPULATION AND HOUSING CENSUS OF 00:00 HOURS ON 1 APRIL 2019
Map 7.1: Inter-provincial net migration rate by provinces and cities directly under the Central Government
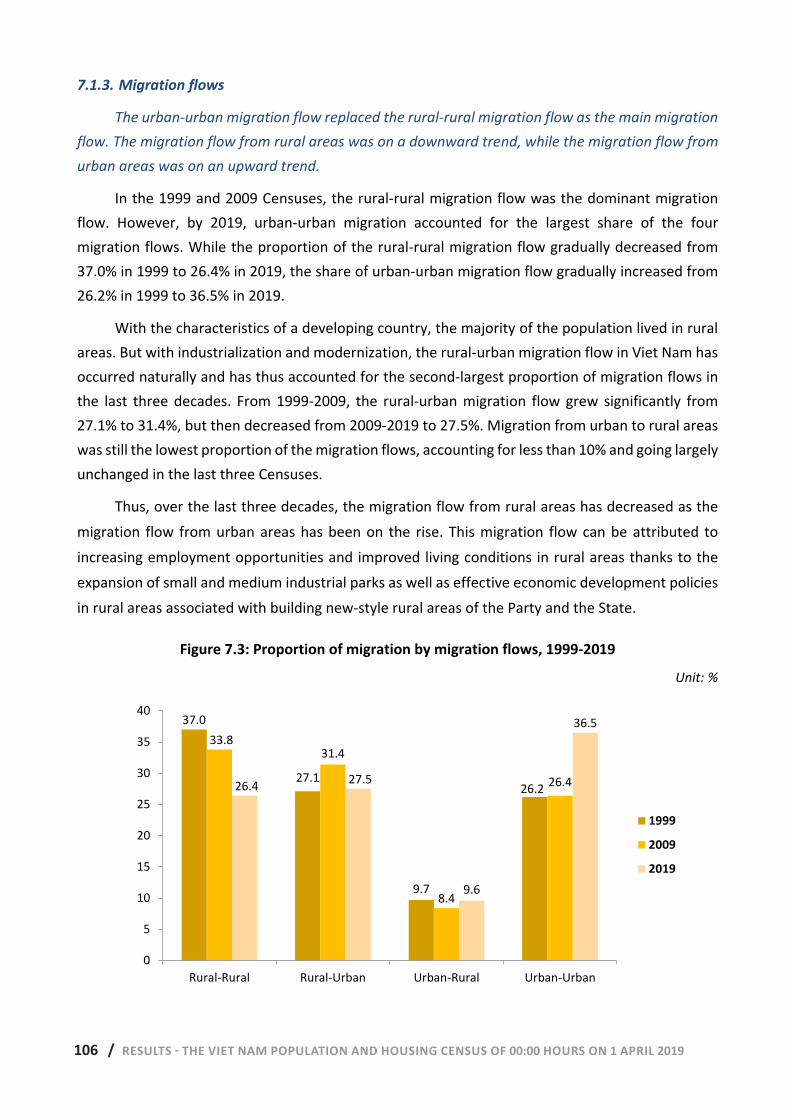
106 / RESULTS - THE VIET NAM POPULATION AND HOUSING CENSUS OF 00:00 HOURS ON 1 APRIL 2019 RESULTS - THE VIET NAM POPULATION AND HOUSING CENSUS OF 00:00 HOURS ON 1 APRIL 2019 | 103
7.1.3. Migration flows
The urban-urban migration flow replaced the rural-rural migration flow as the main migration flow. The migration flow from rural areas was on a downward trend, while the migration flow from urban areas was on an upward trend.
In the 1999 and 2009 Censuses, the rural-rural migration flow was the dominant migration flow. However, by 2019, urban-urban migration accounted for the largest share of the four migration flows. While the proportion of the rural-rural migration flow gradually decreased from 37.0% in 1999 to 26.4% in 2019, the share of urban-urban migration flow gradually increased from 26.2% in 1999 to 36.5% in 2019.
With the characteristics of a developing country, the majority of the population lived in rural areas. But with industrialization and modernization, the rural-urban migration flow in Viet Nam has occurred naturally and has thus accounted for the second-largest proportion of migration flows in the last three decades. From 1999-2009, the rural-urban migration flow grew significantly from 27.1% to 31.4%, but then decreased from 2009-2019 to 27.5%. Migration from urban to rural areas was still the lowest proportion of the migration flows, accounting for less than 10% and going largely unchanged in the last three Censuses.
Thus, over the last three decades, the migration flow from rural areas has decreased as the migration flow from urban areas has been on the rise. This migration flow can be attributed to increasing employment opportunities and improved living conditions in rural areas thanks to the expansion of small and medium industrial parks as well as effective economic development policies in rural areas associated with building new-style rural areas of the Party and the State.
Figure 7.3: Proportion of migration by migration flows, 1999-2019
Unit: %
37.0
27.1
9.7
26.2
33.831.4
8.4
26.426.4 27.5
9.6
36.5
0.0
5.0
10.0
15.0
20.0
25.0
30.0
35.0
40.0
Rural-Rural Rural-Urban Urban-Rural Urban-Urban
1999
2009
2019
37.0
27.1
9.7
26.2
33.831.4
8.4
26.426.4 27.5
9.6
36.5
0
5
10
15
20
25
30
35
40
Rural-Rural Rural-Urban Urban-Rural Urban-Urban
1999
2009
2019
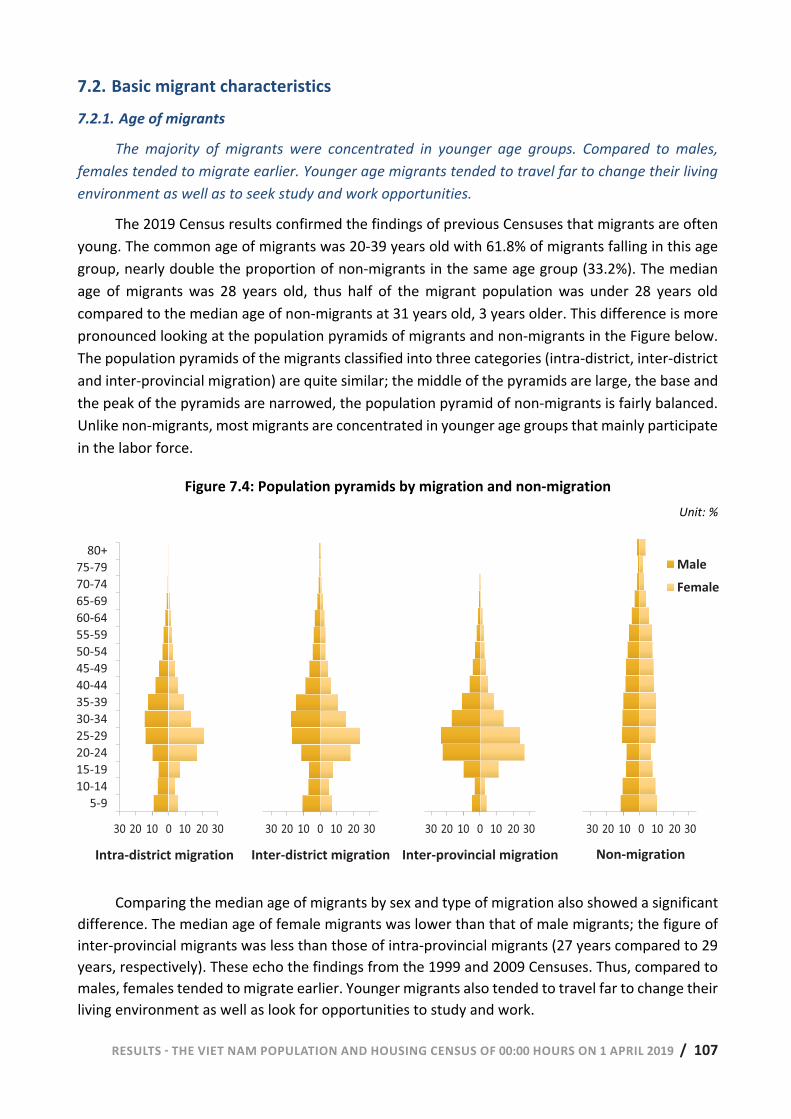
RESULTS - THE VIET NAM POPULATION AND HOUSING CENSUS OF 00:00 HOURS ON 1 APRIL 2019 / 107 104 | RESULTS - THE VIET NAM POPULATION AND HOUSING CENSUS OF 00:00 HOURS ON 1 APRIL 2019
7.2. Basic migrant characteristics 7.2.1. Age of migrants
The majority of migrants were concentrated in younger age groups. Compared to males, females tended to migrate earlier. Younger age migrants tended to travel far to change their living environment as well as to seek study and work opportunities.
The 2019 Census results confirmed the findings of previous Censuses that migrants are often young. The common age of migrants was 20-39 years old with 61.8% of migrants falling in this age group, nearly double the proportion of non-migrants in the same age group (33.2%). The median age of migrants was 28 years old, thus half of the migrant population was under 28 years old compared to the median age of non-migrants at 31 years old, 3 years older. This difference is more pronounced looking at the population pyramids of migrants and non-migrants in the Figure below. The population pyramids of the migrants classified into three categories (intra-district, inter-district and inter-provincial migration) are quite similar; the middle of the pyramids are large, the base and the peak of the pyramids are narrowed, the population pyramid of non-migrants is fairly balanced. Unlike non-migrants, most migrants are concentrated in younger age groups that mainly participate in the labor force.
Figure 7.4: Population pyramids by migration and non-migration Unit: %
Intra-district migration Inter-district migration Inter-provincial migration Non-migration
Comparing the median age of migrants by sex and type of migration also showed a significant difference. The median age of female migrants was lower than that of male migrants; the figure of inter-provincial migrants was less than those of intra-provincial migrants (27 years compared to 29 years, respectively). These echo the findings from the 1999 and 2009 Censuses. Thus, compared to males, females tended to migrate earlier. Younger migrants also tended to travel far to change their living environment as well as look for opportunities to study and work.
30 10 10 30
5-910-1415-1920-2425-2930-3435-3940-4445-4950-5455-5960-6465-6970-7475-79
80+
30 10 10 30 30 10 10 30 30 10 10 30
Male
Female
30 20 10 0 10 20 30 30 20 10 0 10 20 30 30 20 10 0 10 20 30 30 20 10 0 10 20 30
5-9
10-14
15-19
20-24
25-29
30-34
35-39
40-44
45-49
50-54
55-59
60-64
65-69
70-74
75-79
80+Male
Female
Inter-provincial migrationIntra-district migration Inter-district migration Non-migration
108 / RESULTS - THE VIET NAM POPULATION AND HOUSING CENSUS OF 00:00 HOURS ON 1 APRIL 2019 RESULTS - THE VIET NAM POPULATION AND HOUSING CENSUS OF 00:00 HOURS ON 1 APRIL 2019 | 105
Given that two-thirds of the migrant population chose urban areas, this led to increased pressure on cities in construction; implementing policies on education, training, and job creation; and providing basic social services to support young migrants.
7.2.2. Gender of migrants
Although females still constituted the majority of the migrant population, the gender differences in the migrant population have been gradually balancing.
There has been a very noticeable phenomenon in studies on migration commonly known as the “feminization of migration”, which has also been evident in the results of the Viet Nam Census over the years. The results of the 2019 Census showed that among the total migrant population, females accounted for 55.5%, higher than the 50.1% of the non-migrant population. In terms of each type of migration, the proportion of female migrants was significantly higher than that of male migrants, and the gap between these figures was more obvious in lower administrative levels. The proportion of female migrants increased gradually from 1999-2009, however, by the 2019 Census, the proportion of female migrants decreased as the proportion of male migrants increased. This suggests that the migrant population gender differences are gradually adjusting toward equilibrium.
Table 7.4: Proportion of migrants and non-migrants by sex, 1999-2019 Unit: %
1999 2009 2019
Male Female Male Female Male Female
Intra-district migration 41.8 58.2 36.4 63.6 40.7 59.3
Inter-district migration 45.2 54.8 43.4 56.6 43.5 56.5
Inter-provincial migration 50.0 50.0 47.0 53.1 48.2 51.8
Non-migration 49.0 51.0 49.8 50.2 49.9 50.1
7.2.3. Migrant technical and professional qualifications
Migrants had higher technical and professional qualifications than non-migrants. Technical and professional qualifications among migrants to urban areas were higher than that of migrants to rural areas.
Data show that for all types of migrants, migrant technical and professional qualifications were higher than that of non-migrants, evidence of the advantage of human resources with technical and professional qualifications for in-migration points. While less than 20% of non-migrants had technical and professional qualifications, 31.5% of migrants among types of inter-provincial migration had such qualifications, which was the lowest proportion of migrants with technical and professional qualifications, compared to the other three types of migration. The group of inter-district migrants had the highest level of technical and professional qualifications; more than half (50.8%) of the migrants in this group had technical and professional qualifications.
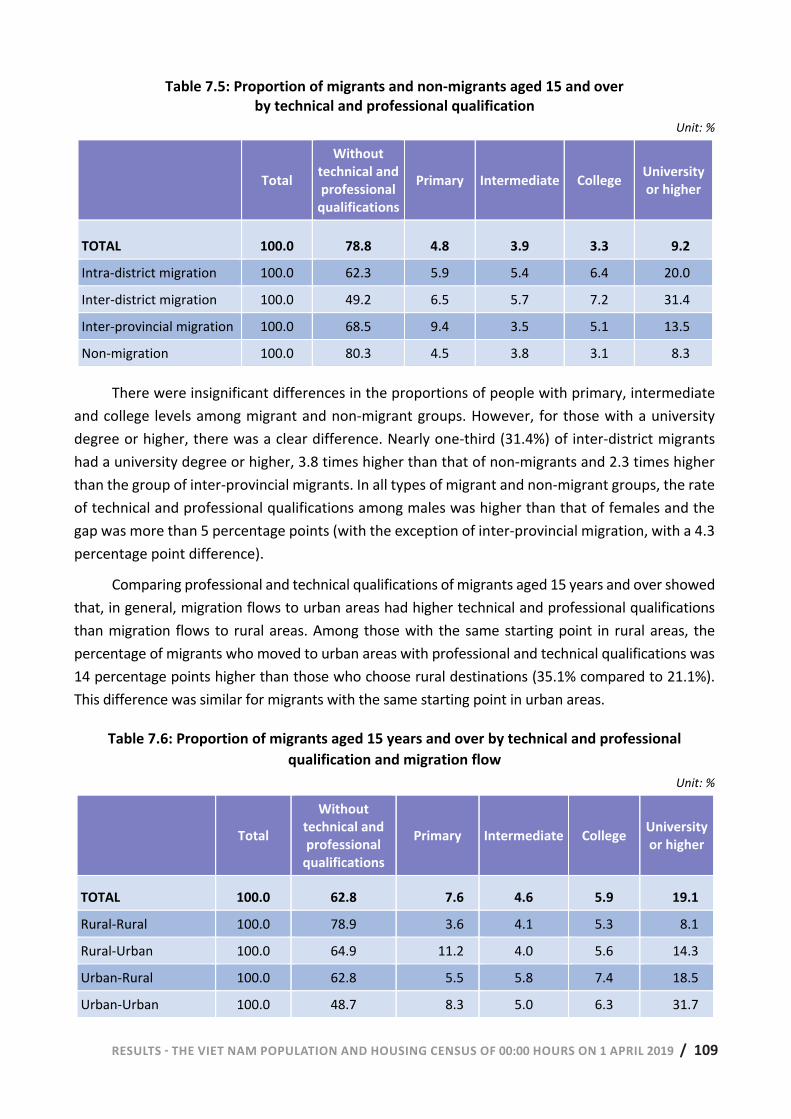
RESULTS - THE VIET NAM POPULATION AND HOUSING CENSUS OF 00:00 HOURS ON 1 APRIL 2019 / 109 106 | RESULTS - THE VIET NAM POPULATION AND HOUSING CENSUS OF 00:00 HOURS ON 1 APRIL 2019
Table 7.5: Proportion of migrants and non-migrants aged 15 and over by technical and professional qualification
Unit: %
Total
Without technical and professional
qualifications
Primary Intermediate College University or higher
TOTAL 100.0 78.8 4.8 3.9 3.3 9.2
Intra-district migration 100.0 62.3 5.9 5.4 6.4 20.0
Inter-district migration 100.0 49.2 6.5 5.7 7.2 31.4
Inter-provincial migration 100.0 68.5 9.4 3.5 5.1 13.5
Non-migration 100.0 80.3 4.5 3.8 3.1 8.3
There were insignificant differences in the proportions of people with primary, intermediate and college levels among migrant and non-migrant groups. However, for those with a university degree or higher, there was a clear difference. Nearly one-third (31.4%) of inter-district migrants had a university degree or higher, 3.8 times higher than that of non-migrants and 2.3 times higher than the group of inter-provincial migrants. In all types of migrant and non-migrant groups, the rate of technical and professional qualifications among males was higher than that of females and the gap was more than 5 percentage points (with the exception of inter-provincial migration, with a 4.3 percentage point difference).
Comparing professional and technical qualifications of migrants aged 15 years and over showed that, in general, migration flows to urban areas had higher technical and professional qualifications than migration flows to rural areas. Among those with the same starting point in rural areas, the percentage of migrants who moved to urban areas with professional and technical qualifications was 14 percentage points higher than those who choose rural destinations (35.1% compared to 21.1%). This difference was similar for migrants with the same starting point in urban areas.
Table 7.6: Proportion of migrants aged 15 years and over by technical and professional qualification and migration flow
Unit: %
Total
Without technical and professional
qualifications
Primary Intermediate College University or higher
TOTAL 100.0 62.8 7.6 4.6 5.9 19.1
Rural-Rural 100.0 78.9 3.6 4.1 5.3 8.1
Rural-Urban 100.0 64.9 11.2 4.0 5.6 14.3
Urban-Rural 100.0 62.8 5.5 5.8 7.4 18.5
Urban-Urban 100.0 48.7 8.3 5.0 6.3 31.7
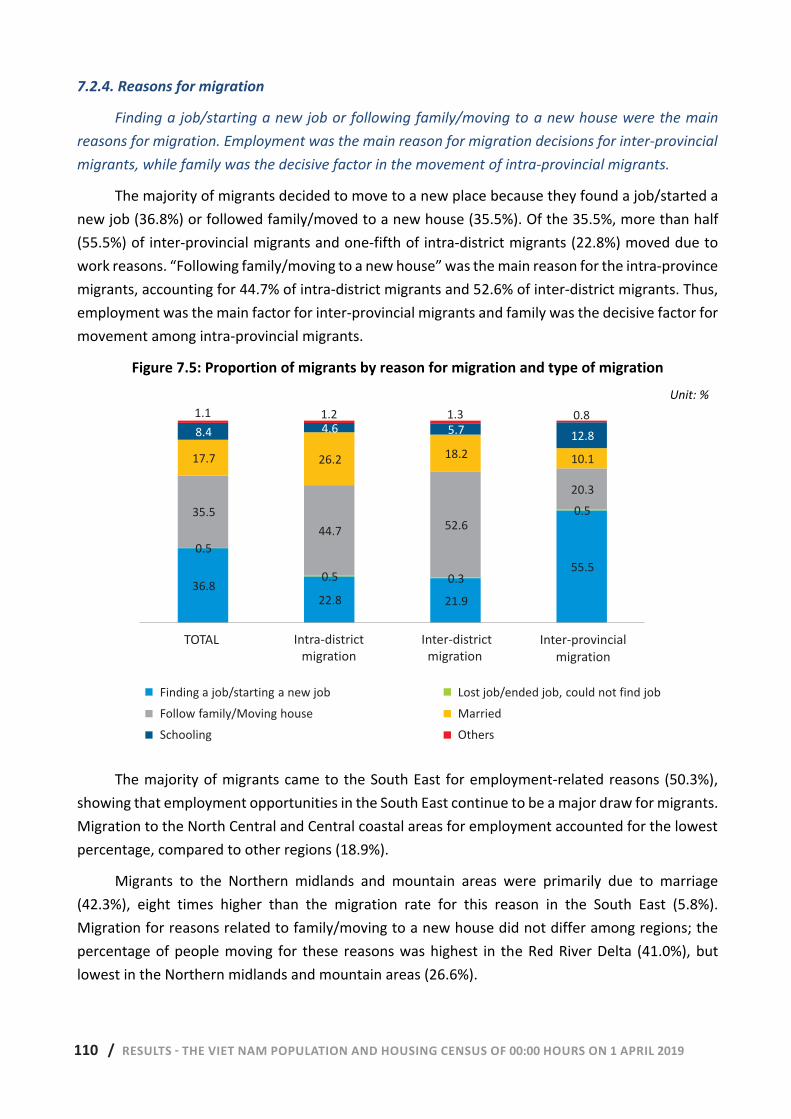
110 / RESULTS - THE VIET NAM POPULATION AND HOUSING CENSUS OF 00:00 HOURS ON 1 APRIL 2019 RESULTS - THE VIET NAM POPULATION AND HOUSING CENSUS OF 00:00 HOURS ON 1 APRIL 2019 | 107
7.2.4. Reasons for migration
Finding a job/starting a new job or following family/moving to a new house were the main reasons for migration. Employment was the main reason for migration decisions for inter-provincial migrants, while family was the decisive factor in the movement of intra-provincial migrants.
The majority of migrants decided to move to a new place because they found a job/started a new job (36.8%) or followed family/moved to a new house (35.5%). Of the 35.5%, more than half (55.5%) of inter-provincial migrants and one-fifth of intra-district migrants (22.8%) moved due to work reasons. “Following family/moving to a new house” was the main reason for the intra-province migrants, accounting for 44.7% of intra-district migrants and 52.6% of inter-district migrants. Thus, employment was the main factor for inter-provincial migrants and family was the decisive factor for movement among intra-provincial migrants.
Figure 7.5: Proportion of migrants by reason for migration and type of migration Unit: %
The majority of migrants came to the South East for employment-related reasons (50.3%), showing that employment opportunities in the South East continue to be a major draw for migrants. Migration to the North Central and Central coastal areas for employment accounted for the lowest percentage, compared to other regions (18.9%).
Migrants to the Northern midlands and mountain areas were primarily due to marriage (42.3%), eight times higher than the migration rate for this reason in the South East (5.8%). Migration for reasons related to family/moving to a new house did not differ among regions; the percentage of people moving for these reasons was highest in the Red River Delta (41.0%), but lowest in the Northern midlands and mountain areas (26.6%).
36.822.8 21.9
55.50.5
0.5 0.3
0.535.544.7 52.6
20.3
17.7 26.2 18.2 10.1
8.4 4.6 5.7 12.8
1.1 1.2 1.3 0.8
0102030405060708090
100
Total Intra-district migration Inter-district migration Inter-provincialmigration
Finding a job/starting a new job Lost job/ended job, could not find jobFollow family/Moving house MarriedSchooling Others
36.822.8 21.9
55.5
0.5
0.5 0.3
0.535.5
44.7 52.6
20.3
17.7 26.2 18.2 10.1
8.4 4.6 5.7 12.8
1.1 1.2 1.3 0.8
TOTAL Intra-district migration
Inter-provincial migration
Finding a job/starting a new job
Follow family/Moving house
Schooling
Lost job/ended job, could not find job
Married
Others
Inter-district migration
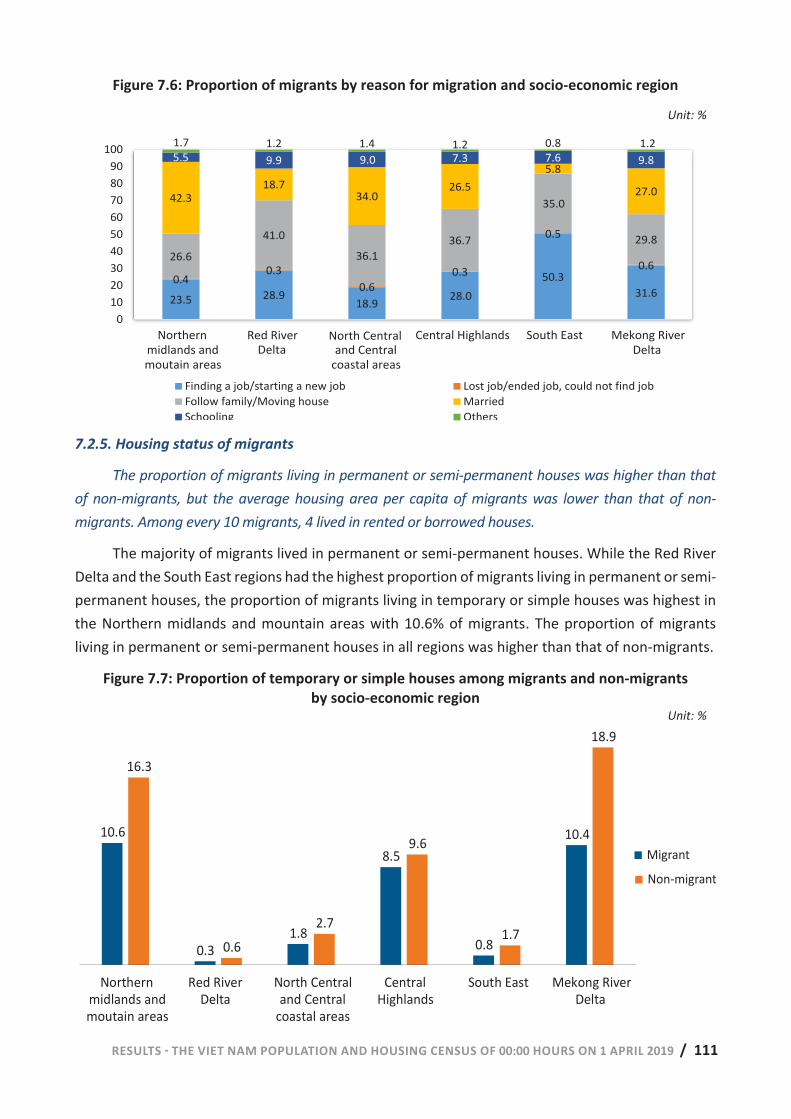
RESULTS - THE VIET NAM POPULATION AND HOUSING CENSUS OF 00:00 HOURS ON 1 APRIL 2019 / 111 108 | RESULTS - THE VIET NAM POPULATION AND HOUSING CENSUS OF 00:00 HOURS ON 1 APRIL 2019
Figure 7.6: Proportion of migrants by reason for migration and socio-economic region
Unit: %
7.2.5. Housing status of migrants
The proportion of migrants living in permanent or semi-permanent houses was higher than that of non-migrants, but the average housing area per capita of migrants was lower than that of non-migrants. Among every 10 migrants, 4 lived in rented or borrowed houses.
The majority of migrants lived in permanent or semi-permanent houses. While the Red River Delta and the South East regions had the highest proportion of migrants living in permanent or semi-permanent houses, the proportion of migrants living in temporary or simple houses was highest in the Northern midlands and mountain areas with 10.6% of migrants. The proportion of migrants living in permanent or semi-permanent houses in all regions was higher than that of non-migrants.
Figure 7.7: Proportion of temporary or simple houses among migrants and non-migrants by socio-economic region
Unit: %
23.5 28.918.9 28
50.331.6
0.40.3
0.60.3
0.5
0.626.6
41.0
36.136.7
35
29.8
42.318.7
34.026.5
5.8
27.0
5.5 9.9 9 7.3 7.6 9.81.7 1.2 1.4 1.2 0.8 1.2
0102030405060708090
100
Northernmidlands andmoutain areas
Red River Delta North Central andCentral coastal
areas
Central Highlands South East Mekong RiverDelta
Finding a job/starting a new job Lost job/ended job, could not find jobFollow family/Moving house MarriedSchooling Others
10.6
0.31.8
8.5
0.8
10.4
16.3
0.6
2.7
9.6
1.7
18.9
02468
101214161820
Northernmidlands andmoutain areas
Red River Delta North Centraland Central
coastal areas
CentralHighlands
South East Mekong RiverDelta
Migrant Non-migrant
23.5 28.918.9 28.0
50.331.6
0.40.3
0.60.3
0.5
0.626.6
41.0
36.136.7
35.0
29.8
42.318.7
34.026.5
5.8
27.0
5.5 9.9 9.0 7.3 7.6 9.81.7 1.2 1.4 1.2 0.8 1.2
0102030405060708090
100
Northernmidlands andmoutain areas
Red River Delta and Central
coastal areas
Central Highlands South East Mekong RiverDelta
Finding a job/starting a new job Lost job/ended job, could not find jobFollow family/Moving house MarriedSchooling Others
North Central
10.6
0.31.8
8.5
0.8
10.4
16.3
0.6
2.7
9.6
1.7
18.9
Northernmidlands andmoutain areas
Red River Delta
North Centraland Central
coastal areas
CentralHighlands
South East Mekong RiverDelta
Migrant
Non-migrant
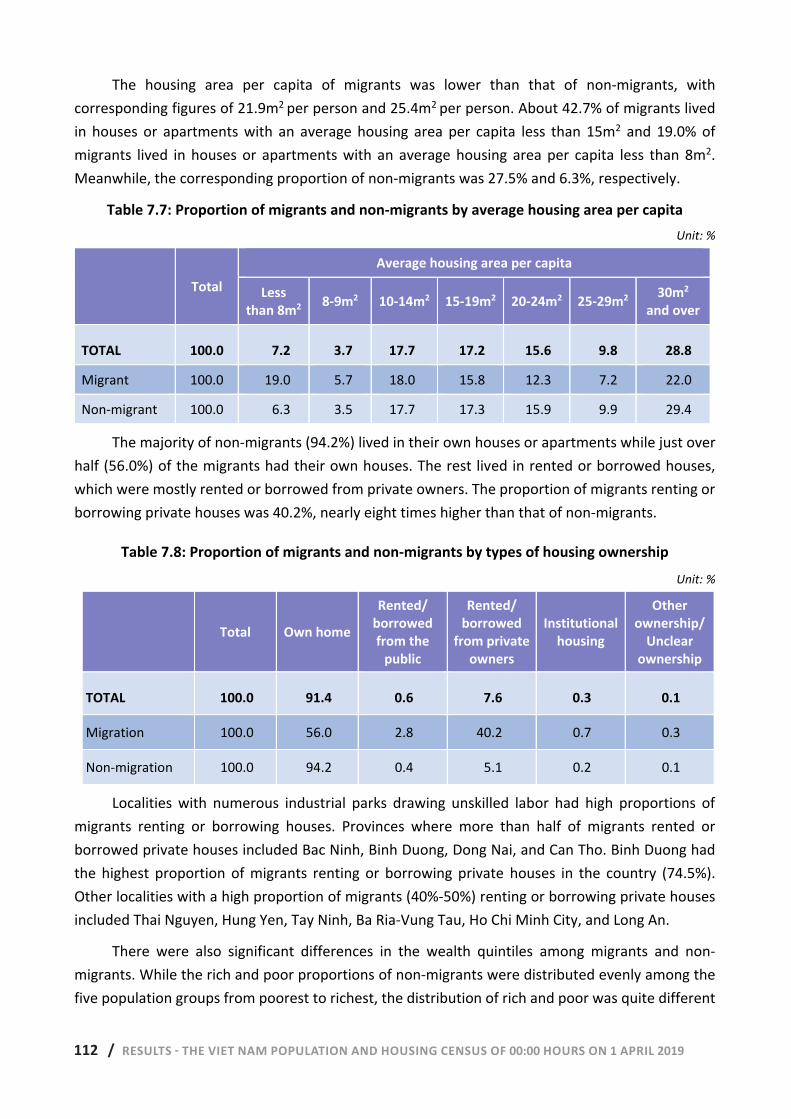
112 / RESULTS - THE VIET NAM POPULATION AND HOUSING CENSUS OF 00:00 HOURS ON 1 APRIL 2019 RESULTS - THE VIET NAM POPULATION AND HOUSING CENSUS OF 00:00 HOURS ON 1 APRIL 2019 | 109
The housing area per capita of migrants was lower than that of non-migrants, with corresponding figures of 21.9m2 per person and 25.4m2 per person. About 42.7% of migrants lived in houses or apartments with an average housing area per capita less than 15m2 and 19.0% of migrants lived in houses or apartments with an average housing area per capita less than 8m2. Meanwhile, the corresponding proportion of non-migrants was 27.5% and 6.3%, respectively.
Table 7.7: Proportion of migrants and non-migrants by average housing area per capita Unit: %
Total Average housing area per capita
Less than 8m2 8-9m2 10-14m2 15-19m2 20-24m2 25-29m2 30m2
and over
TOTAL 100.0 7.2 3.7 17.7 17.2 15.6 9.8 28.8
Migrant 100.0 19.0 5.7 18.0 15.8 12.3 7.2 22.0
Non-migrant 100.0 6.3 3.5 17.7 17.3 15.9 9.9 29.4
The majority of non-migrants (94.2%) lived in their own houses or apartments while just over half (56.0%) of the migrants had their own houses. The rest lived in rented or borrowed houses, which were mostly rented or borrowed from private owners. The proportion of migrants renting or borrowing private houses was 40.2%, nearly eight times higher than that of non-migrants.
Table 7.8: Proportion of migrants and non-migrants by types of housing ownership Unit: %
Total Own home
Rented/ borrowed from the
public
Rented/ borrowed
from private owners
Institutional housing
Other ownership/
Unclear ownership
TOTAL 100.0 91.4 0.6 7.6 0.3 0.1
Migration 100.0 56.0 2.8 40.2 0.7 0.3
Non-migration 100.0 94.2 0.4 5.1 0.2 0.1
Localities with numerous industrial parks drawing unskilled labor had high proportions of migrants renting or borrowing houses. Provinces where more than half of migrants rented or borrowed private houses included Bac Ninh, Binh Duong, Dong Nai, and Can Tho. Binh Duong had the highest proportion of migrants renting or borrowing private houses in the country (74.5%). Other localities with a high proportion of migrants (40%-50%) renting or borrowing private houses included Thai Nguyen, Hung Yen, Tay Ninh, Ba Ria-Vung Tau, Ho Chi Minh City, and Long An.
There were also significant differences in the wealth quintiles among migrants and non-migrants. While the rich and poor proportions of non-migrants were distributed evenly among the five population groups from poorest to richest, the distribution of rich and poor was quite different
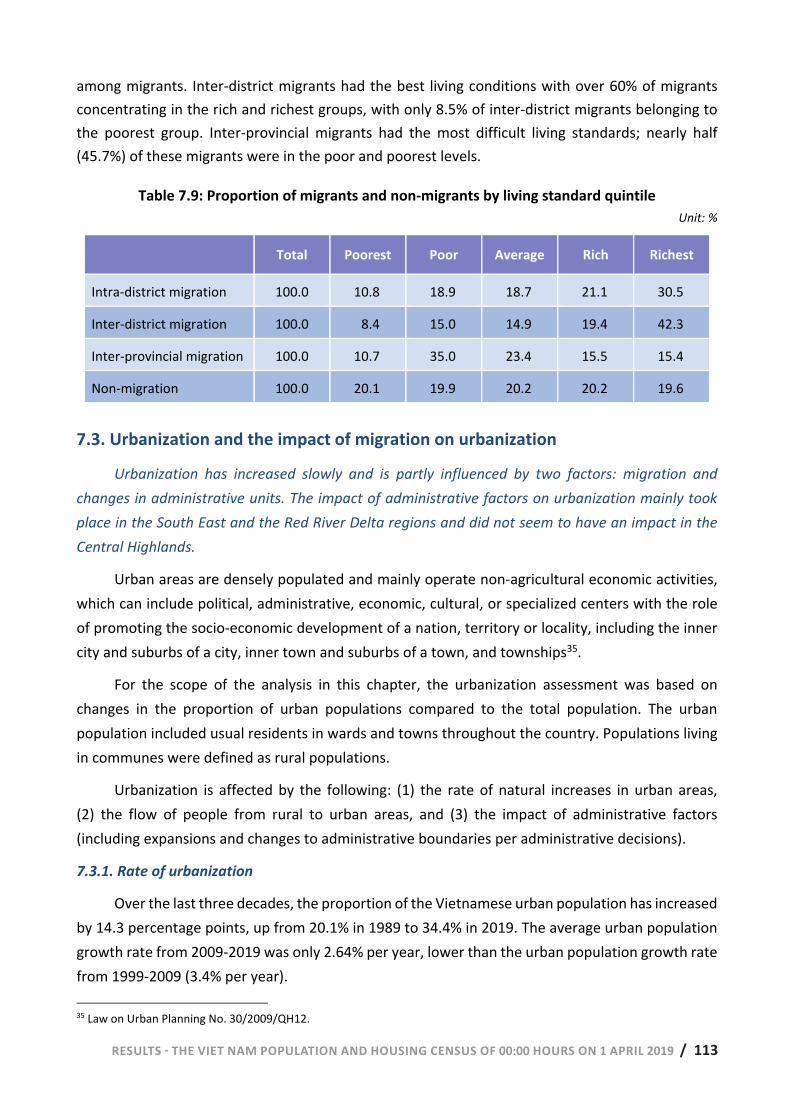
RESULTS - THE VIET NAM POPULATION AND HOUSING CENSUS OF 00:00 HOURS ON 1 APRIL 2019 / 113 110 | RESULTS - THE VIET NAM POPULATION AND HOUSING CENSUS OF 00:00 HOURS ON 1 APRIL 2019
among migrants. Inter-district migrants had the best living conditions with over 60% of migrants concentrating in the rich and richest groups, with only 8.5% of inter-district migrants belonging to the poorest group. Inter-provincial migrants had the most difficult living standards; nearly half (45.7%) of these migrants were in the poor and poorest levels.
Table 7.9: Proportion of migrants and non-migrants by living standard quintile Unit: %
Total Poorest Poor Average Rich Richest
Intra-district migration 100.0 10.8 18.9 18.7 21.1 30.5
Inter-district migration 100.0 8.4 15.0 14.9 19.4 42.3
Inter-provincial migration 100.0 10.7 35.0 23.4 15.5 15.4
Non-migration 100.0 20.1 19.9 20.2 20.2 19.6
7.3. Urbanization and the impact of migration on urbanization
Urbanization has increased slowly and is partly influenced by two factors: migration and changes in administrative units. The impact of administrative factors on urbanization mainly took place in the South East and the Red River Delta regions and did not seem to have an impact in the Central Highlands.
Urban areas are densely populated and mainly operate non-agricultural economic activities, which can include political, administrative, economic, cultural, or specialized centers with the role of promoting the socio-economic development of a nation, territory or locality, including the inner city and suburbs of a city, inner town and suburbs of a town, and townships35.
For the scope of the analysis in this chapter, the urbanization assessment was based on changes in the proportion of urban populations compared to the total population. The urban population included usual residents in wards and towns throughout the country. Populations living in communes were defined as rural populations.
Urbanization is affected by the following: (1) the rate of natural increases in urban areas, (2) the flow of people from rural to urban areas, and (3) the impact of administrative factors (including expansions and changes to administrative boundaries per administrative decisions).
7.3.1. Rate of urbanization
Over the last three decades, the proportion of the Vietnamese urban population has increased by 14.3 percentage points, up from 20.1% in 1989 to 34.4% in 2019. The average urban population growth rate from 2009-2019 was only 2.64% per year, lower than the urban population growth rate from 1999-2009 (3.4% per year). 35 Law on Urban Planning No. 30/2009/QH12.
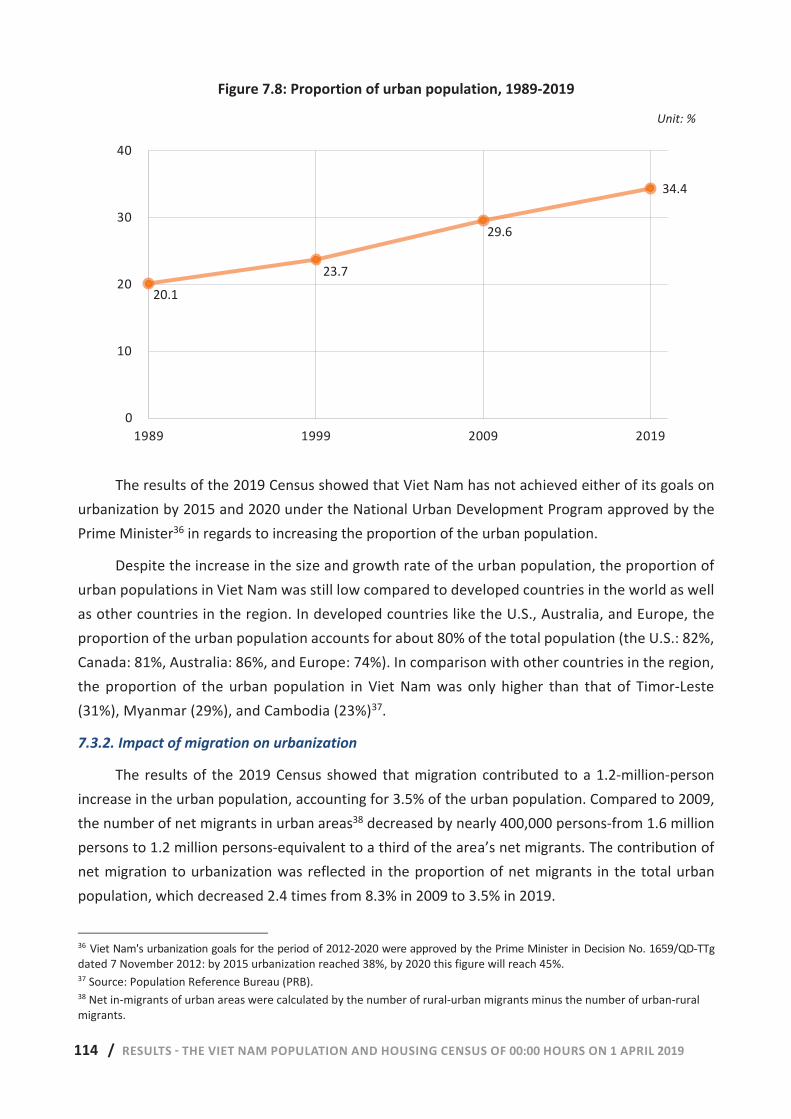
114 / RESULTS - THE VIET NAM POPULATION AND HOUSING CENSUS OF 00:00 HOURS ON 1 APRIL 2019 RESULTS - THE VIET NAM POPULATION AND HOUSING CENSUS OF 00:00 HOURS ON 1 APRIL 2019 | 111
Figure 7.8: Proportion of urban population, 1989-2019
Unit: %
The results of the 2019 Census showed that Viet Nam has not achieved either of its goals on urbanization by 2015 and 2020 under the National Urban Development Program approved by the Prime Minister36 in regards to increasing the proportion of the urban population.
Despite the increase in the size and growth rate of the urban population, the proportion of urban populations in Viet Nam was still low compared to developed countries in the world as well as other countries in the region. In developed countries like the U.S., Australia, and Europe, the proportion of the urban population accounts for about 80% of the total population (the U.S.: 82%, Canada: 81%, Australia: 86%, and Europe: 74%). In comparison with other countries in the region, the proportion of the urban population in Viet Nam was only higher than that of Timor-Leste (31%), Myanmar (29%), and Cambodia (23%)37.
7.3.2. Impact of migration on urbanization
The results of the 2019 Census showed that migration contributed to a 1.2-million-person increase in the urban population, accounting for 3.5% of the urban population. Compared to 2009, the number of net migrants in urban areas38 decreased by nearly 400,000 persons-from 1.6 million persons to 1.2 million persons-equivalent to a third of the area’s net migrants. The contribution of net migration to urbanization was reflected in the proportion of net migrants in the total urban population, which decreased 2.4 times from 8.3% in 2009 to 3.5% in 2019.
36 Viet Nam's urbanization goals for the period of 2012-2020 were approved by the Prime Minister in Decision No. 1659/QD-TTg dated 7 November 2012: by 2015 urbanization reached 38%, by 2020 this figure will reach 45%. 37 Source: Population Reference Bureau (PRB). 38 Net in-migrants of urban areas were calculated by the number of rural-urban migrants minus the number of urban-rural migrants.
20.123.7
29.6
34.4
0
5
10
15
20
25
30
35
40
1984 1989 1994 1999 2004 2009 2014 2019
20.1
23.7
29.6
34.4
0
10
20
30
40
1989 1999 2009 2019
RESULTS - THE VIET NAM POPULATION AND HOUSING CENSUS OF 00:00 HOURS ON 1 APRIL 2019 / 115 112 | RESULTS - THE VIET NAM POPULATION AND HOUSING CENSUS OF 00:00 HOURS ON 1 APRIL 2019
Table 7.10: Number and net migration rate in urban areas, 2009-2019
2009 2019
Rural-Urban (Thousand persons) 2,112.1 1,772.5
Urban-Rural (Thousand persons) 564.9 616.1
Net migration of urban areas (Thousand persons) 1,547.1 1,156.4
Proportion of net migrants in the total urban population (%) 8.3 3.5
The South East region had the highest rate of urbanization in the country with 62.8% of its population in urban areas and an average urban population growth rate from 2009-2019 of 3.31%. The number of net migrants in this region accounted for 63% of the total net migration of urban areas nationwide with nearly 726,500 persons, equivalent to 6.5% of the urban population of the region. The proportion of net migrants in the total urban population of the Mekong River Delta was the lowest, equivalent to 3.2% of the entire country and accounting for only 0.8% of the urban population in the region.
Table 7.11: Number of migrants and net migration rate to urban areas by socio-economic region
Northern midlands
and mountain
areas
Red River Delta
North Central
and Central coastal areas
Central Highlands
South East
Mekong River Delta
Rural-Urban (Thousand persons) 93.9 372.8 176.8 47.0 934.1 147.9
Urban-Rural (Thousand persons) 41.2 122.2 102.2 31.7 207.6 111.2
Net migration of urban areas (Thousand persons) 52.7 250.5 74.6 15.3 726.5 36.7
Proportion of net migrants in the total urban population (%) 2.3 3.2 1.3 0.9 6.5 0.8
7.3.3. Impact of administrative factors on urbanization
In 2009, the country had 11,066 communes, wards, or towns, 1,944 of which were urban areas with a total population of 25.4 million persons, or 29.6% of the population. Ten years later, the total number of communes, wards, or towns across the country was 11,160 (including 2,203 wards or towns), an increase of 94 commune-level administrative units. Compared to 2009, the total number of wards or towns had increased by 259 units; 210 communes were converted into wards or towns and 49 wards and towns were newly established per administrative decisions.
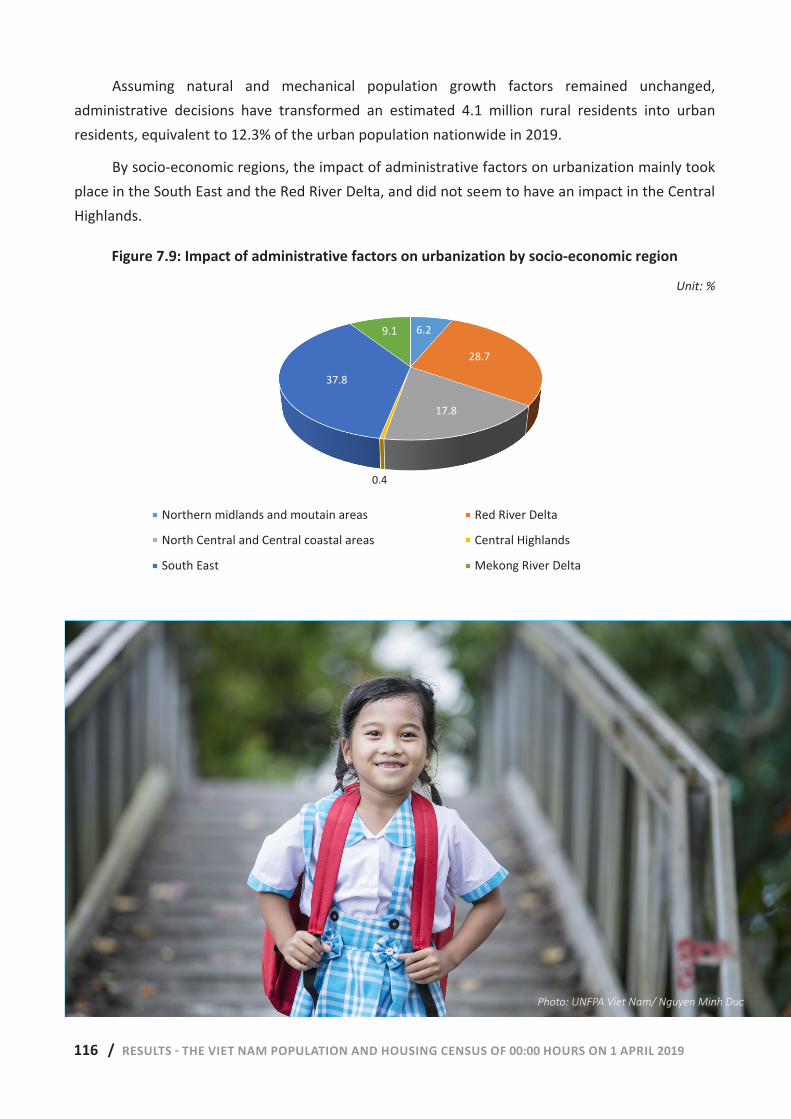
116 / RESULTS - THE VIET NAM POPULATION AND HOUSING CENSUS OF 00:00 HOURS ON 1 APRIL 2019 RESULTS - THE VIET NAM POPULATION AND HOUSING CENSUS OF 00:00 HOURS ON 1 APRIL 2019 | 113
Assuming natural and mechanical population growth factors remained unchanged, administrative decisions have transformed an estimated 4.1 million rural residents into urban residents, equivalent to 12.3% of the urban population nationwide in 2019.
By socio-economic regions, the impact of administrative factors on urbanization mainly took place in the South East and the Red River Delta, and did not seem to have an impact in the Central Highlands.
Figure 7.9: Impact of administrative factors on urbanization by socio-economic region
Unit: %
6.2
28.7
17.8
0.4
37.8
9.1
Northern midlands and moutain areas Red River Delta
North Central and Central coastal areas Central Highlands
South East Mekong River Delta
6.2
28.7
17.8
0.4
37.8
9.1
Northern midlands and moutain areas Red River Delta
North Central and Central coastal areas Central Highlands
South East Mekong River Delta
Photo: UNFPA Viet Nam/ Nguyen Minh Duc
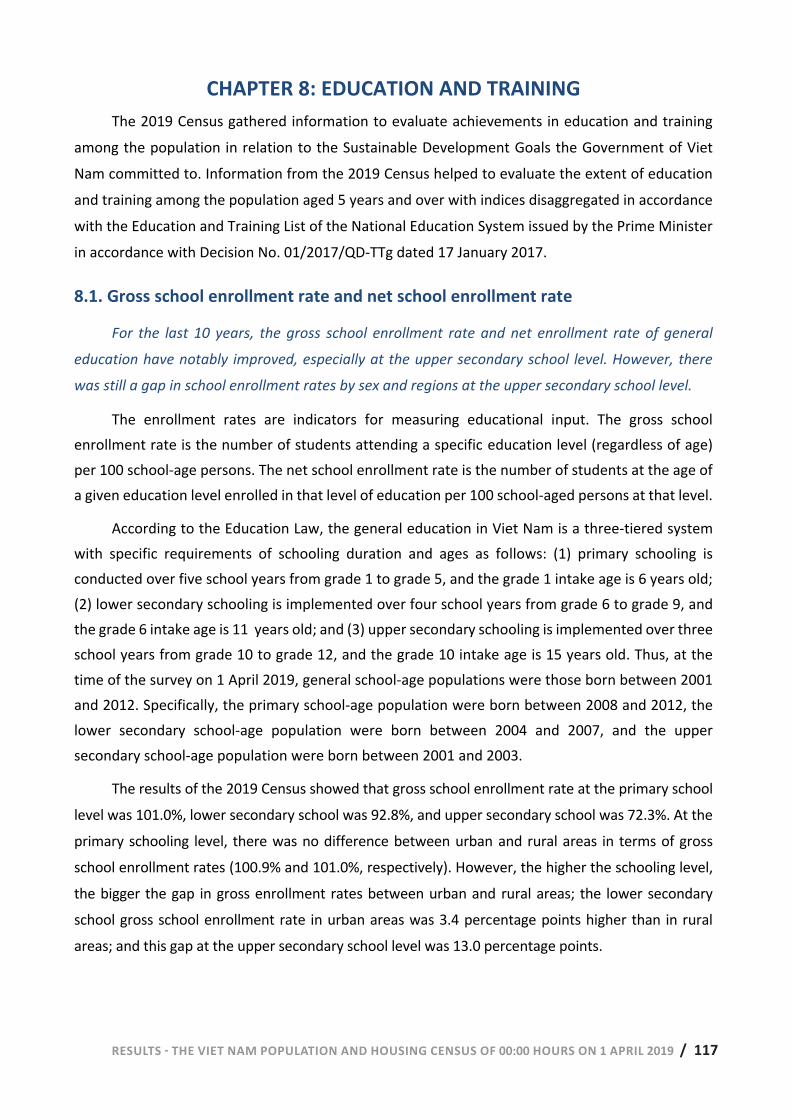
RESULTS - THE VIET NAM POPULATION AND HOUSING CENSUS OF 00:00 HOURS ON 1 APRIL 2019 / 117 114 | RESULTS - THE VIET NAM POPULATION AND HOUSING CENSUS OF 00:00 HOURS ON 1 APRIL 2019
CHAPTER 8: EDUCATION AND TRAINING
The 2019 Census gathered information to evaluate achievements in education and training among the population in relation to the Sustainable Development Goals the Government of Viet Nam committed to. Information from the 2019 Census helped to evaluate the extent of education and training among the population aged 5 years and over with indices disaggregated in accordance with the Education and Training List of the National Education System issued by the Prime Minister in accordance with Decision No. 01/2017/QD-TTg dated 17 January 2017.
8.1. Gross school enrollment rate and net school enrollment rate
For the last 10 years, the gross school enrollment rate and net enrollment rate of general
education have notably improved, especially at the upper secondary school level. However, there
was still a gap in school enrollment rates by sex and regions at the upper secondary school level.
The enrollment rates are indicators for measuring educational input. The gross school enrollment rate is the number of students attending a specific education level (regardless of age) per 100 school-age persons. The net school enrollment rate is the number of students at the age of a given education level enrolled in that level of education per 100 school-aged persons at that level.
According to the Education Law, the general education in Viet Nam is a three-tiered system with specific requirements of schooling duration and ages as follows: (1) primary schooling is conducted over five school years from grade 1 to grade 5, and the grade 1 intake age is 6 years old; (2) lower secondary schooling is implemented over four school years from grade 6 to grade 9, and the grade 6 intake age is 11 years old; and (3) upper secondary schooling is implemented over three school years from grade 10 to grade 12, and the grade 10 intake age is 15 years old. Thus, at the time of the survey on 1 April 2019, general school-age populations were those born between 2001 and 2012. Specifically, the primary school-age population were born between 2008 and 2012, the lower secondary school-age population were born between 2004 and 2007, and the upper secondary school-age population were born between 2001 and 2003.
The results of the 2019 Census showed that gross school enrollment rate at the primary school level was 101.0%, lower secondary school was 92.8%, and upper secondary school was 72.3%. At the primary schooling level, there was no difference between urban and rural areas in terms of gross school enrollment rates (100.9% and 101.0%, respectively). However, the higher the schooling level, the bigger the gap in gross enrollment rates between urban and rural areas; the lower secondary school gross school enrollment rate in urban areas was 3.4 percentage points higher than in rural areas; and this gap at the upper secondary school level was 13.0 percentage points.
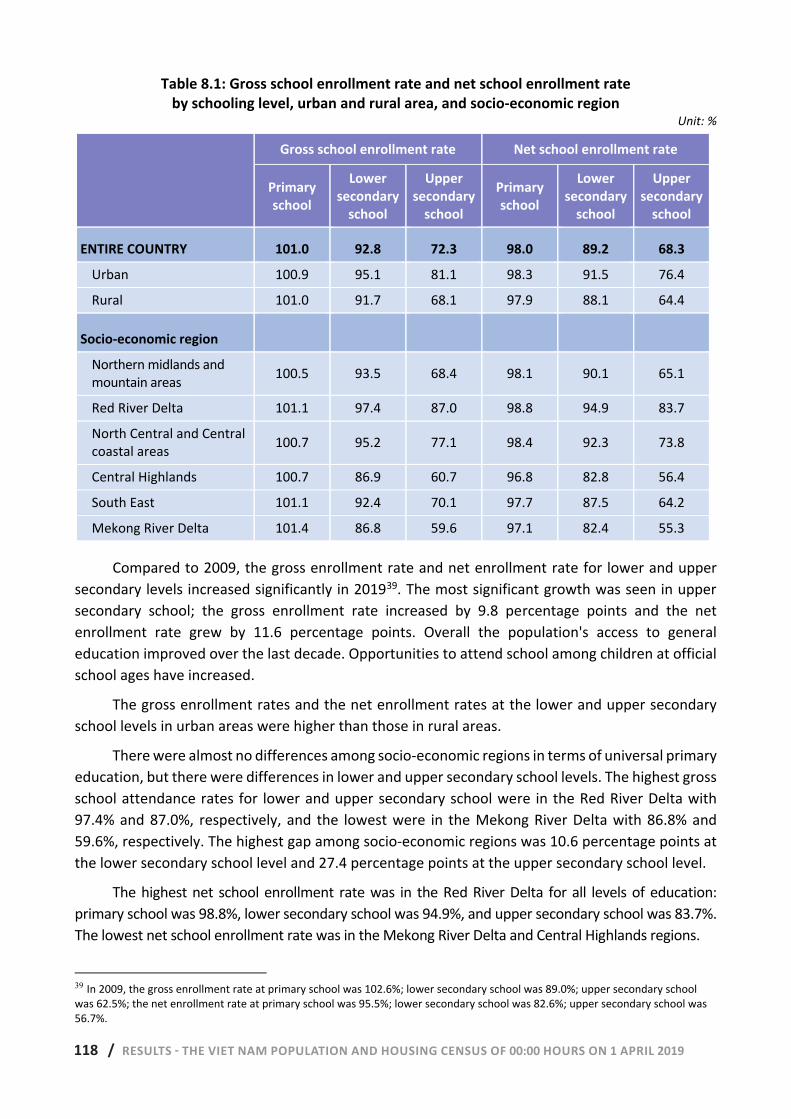
118 / RESULTS - THE VIET NAM POPULATION AND HOUSING CENSUS OF 00:00 HOURS ON 1 APRIL 2019 RESULTS - THE VIET NAM POPULATION AND HOUSING CENSUS OF 00:00 HOURS ON 1 APRIL 2019 | 115
Table 8.1: Gross school enrollment rate and net school enrollment rate by schooling level, urban and rural area, and socio-economic region
Unit: %
Gross school enrollment rate Net school enrollment rate
Primary school
Lower secondary
school
Upper secondary
school
Primary school
Lower secondary
school
Upper secondary
school
ENTIRE COUNTRY 101.0 92.8 72.3 98.0 89.2 68.3
Urban 100.9 95.1 81.1 98.3 91.5 76.4
Rural 101.0 91.7 68.1 97.9 88.1 64.4
Socio-economic region
Northern midlands and mountain areas 100.5 93.5 68.4 98.1 90.1 65.1
Red River Delta 101.1 97.4 87.0 98.8 94.9 83.7
North Central and Central coastal areas 100.7 95.2 77.1 98.4 92.3 73.8
Central Highlands 100.7 86.9 60.7 96.8 82.8 56.4
South East 101.1 92.4 70.1 97.7 87.5 64.2
Mekong River Delta 101.4 86.8 59.6 97.1 82.4 55.3
Compared to 2009, the gross enrollment rate and net enrollment rate for lower and upper secondary levels increased significantly in 201939. The most significant growth was seen in upper secondary school; the gross enrollment rate increased by 9.8 percentage points and the net enrollment rate grew by 11.6 percentage points. Overall the population's access to general education improved over the last decade. Opportunities to attend school among children at official school ages have increased.
The gross enrollment rates and the net enrollment rates at the lower and upper secondary school levels in urban areas were higher than those in rural areas.
There were almost no differences among socio-economic regions in terms of universal primary education, but there were differences in lower and upper secondary school levels. The highest gross school attendance rates for lower and upper secondary school were in the Red River Delta with 97.4% and 87.0%, respectively, and the lowest were in the Mekong River Delta with 86.8% and 59.6%, respectively. The highest gap among socio-economic regions was 10.6 percentage points at the lower secondary school level and 27.4 percentage points at the upper secondary school level.
The highest net school enrollment rate was in the Red River Delta for all levels of education: primary school was 98.8%, lower secondary school was 94.9%, and upper secondary school was 83.7%. The lowest net school enrollment rate was in the Mekong River Delta and Central Highlands regions.
39 In 2009, the gross enrollment rate at primary school was 102.6%; lower secondary school was 89.0%; upper secondary school was 62.5%; the net enrollment rate at primary school was 95.5%; lower secondary school was 82.6%; upper secondary school was 56.7%.
RESULTS - THE VIET NAM POPULATION AND HOUSING CENSUS OF 00:00 HOURS ON 1 APRIL 2019 / 119 116 | RESULTS - THE VIET NAM POPULATION AND HOUSING CENSUS OF 00:00 HOURS ON 1 APRIL 2019
In terms of gross school enrollment rate by sex, there were minimal gaps in school enrollment opportunities between males and females at low levels of education (primary and lower secondary school). At the primary level, the gross school enrollment rate for males was 101.1% and 100.8% for females and the rates in lower secondary school were 92.2% for males and 93.5% for females, while the gross upper secondary school enrollment rate for males was nearly 7.1 percentage points lower than that for females.
Differences by sex also occurred between urban and rural areas and socio-economic regions. The biggest sex gap was in upper secondary schools in the Central Highlands, up to 11.9 percentage points (the gross school enrollment rate for males in the Central Highlands was 54.9% while that for females was 66.8%).
Table 8.2: Gross school enrollment rate by sex, urban and rural area, and socio-economic region Unit: %
Primary school Lower secondary
school Upper secondary
school
Male Female Male Female Male Female
ENTIRE COUNTRY 101.1 100.8 92.2 93.5 68.8 75.9 Urban 101.0 100.9 94.7 95.5 78.4 83.8 Rural 101.2 100.8 91.0 92.5 64.3 72.1
Socio-economic region Northern midlands and mountain areas 100.9 100.2 94.5 92.4 67.2 69.6 Red River Delta 101.2 101.1 97.2 97.7 85.1 89.0 North Central and Central coastal areas 100.8 100.6 94.4 96.2 72.3 82.1 Central Highlands 100.9 100.6 84.1 89.9 54.9 66.8 South East 101.2 101.1 92.0 92.9 67.0 73.4 Mekong River Delta 101.6 101.2 85.5 88.3 55.1 64.3
8.2. Out-of-school children
Over the last two decades, there has been a two-thirds reduction in the number of out-of-school children, a remarkable achievement in education. However, there was still a gap in the rate of out-of-school children between urban and rural areas and among socio-economic regions.
Out-of-school children are those who are of school age (born between 2001 and 2012) and have never attended school or have dropped out of school. The rate of out-of-school children denotes the number of school-aged children not attending school in the total population of this age group.
The results of the 2019 Census showed that 8.3% of general school-age children are out of school, a 12.6 percentage point decrease compared to 1999 and an 8.1 percentage point fall from 2009 (the rate was 20.9% in 1999 and 16.4% in 2009). The proportion of out-of-school boys was 1.7 percentage points higher than that of girls. Thus, the rate of out-of-school children has decreased by nearly two-thirds in the last 20 years, a remarkable educational achievement for Viet Nam.
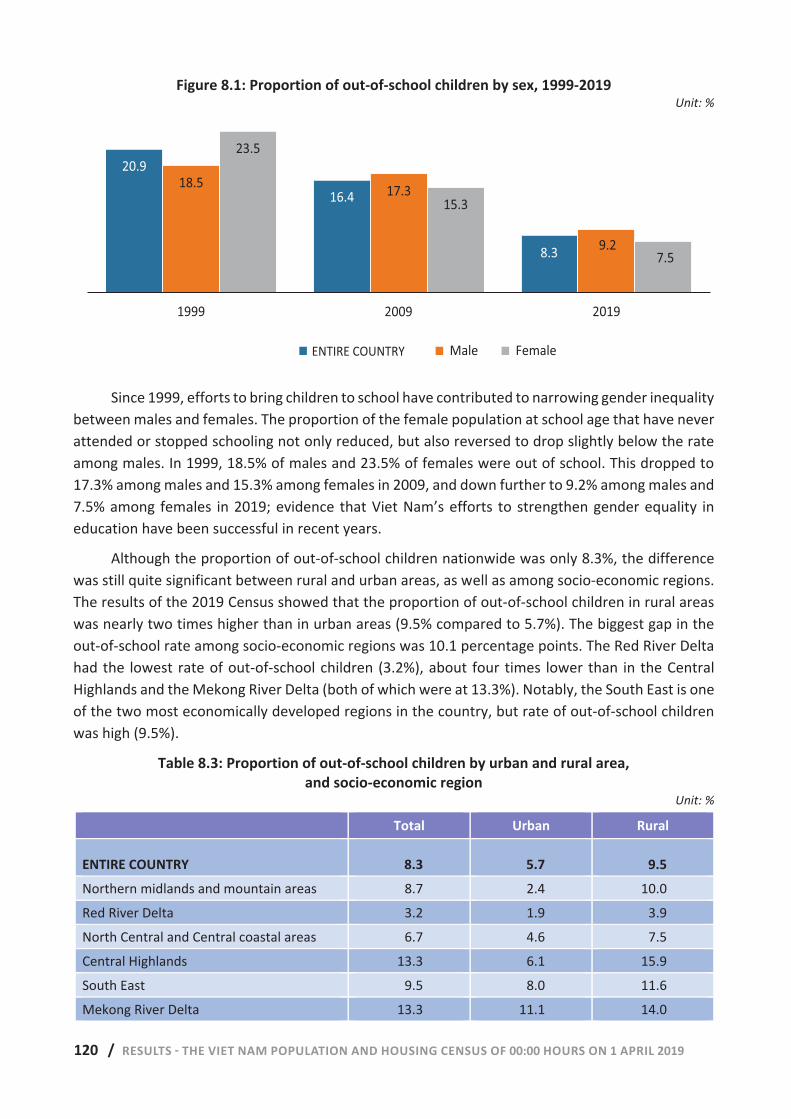
120 / RESULTS - THE VIET NAM POPULATION AND HOUSING CENSUS OF 00:00 HOURS ON 1 APRIL 2019 RESULTS - THE VIET NAM POPULATION AND HOUSING CENSUS OF 00:00 HOURS ON 1 APRIL 2019 | 117
Figure 8.1: Proportion of out-of-school children by sex, 1999-2019 Unit: %
Since 1999, efforts to bring children to school have contributed to narrowing gender inequality between males and females. The proportion of the female population at school age that have never attended or stopped schooling not only reduced, but also reversed to drop slightly below the rate among males. In 1999, 18.5% of males and 23.5% of females were out of school. This dropped to 17.3% among males and 15.3% among females in 2009, and down further to 9.2% among males and 7.5% among females in 2019; evidence that Viet Nam’s efforts to strengthen gender equality in education have been successful in recent years.
Although the proportion of out-of-school children nationwide was only 8.3%, the difference was still quite significant between rural and urban areas, as well as among socio-economic regions. The results of the 2019 Census showed that the proportion of out-of-school children in rural areas was nearly two times higher than in urban areas (9.5% compared to 5.7%). The biggest gap in the out-of-school rate among socio-economic regions was 10.1 percentage points. The Red River Delta had the lowest rate of out-of-school children (3.2%), about four times lower than in the Central Highlands and the Mekong River Delta (both of which were at 13.3%). Notably, the South East is one of the two most economically developed regions in the country, but rate of out-of-school children was high (9.5%).
Table 8.3: Proportion of out-of-school children by urban and rural area, and socio-economic region
Unit: %
Total Urban Rural
ENTIRE COUNTRY 8.3 5.7 9.5 Northern midlands and mountain areas 8.7 2.4 10.0 Red River Delta 3.2 1.9 3.9 North Central and Central coastal areas 6.7 4.6 7.5 Central Highlands 13.3 6.1 15.9 South East 9.5 8.0 11.6 Mekong River Delta 13.3 11.1 14.0
20.9
16.4
8.3
18.517.3
9.2
23.5
15.3
7.5
1999 2019
ENTIRE COUNTRY Male Female
2009
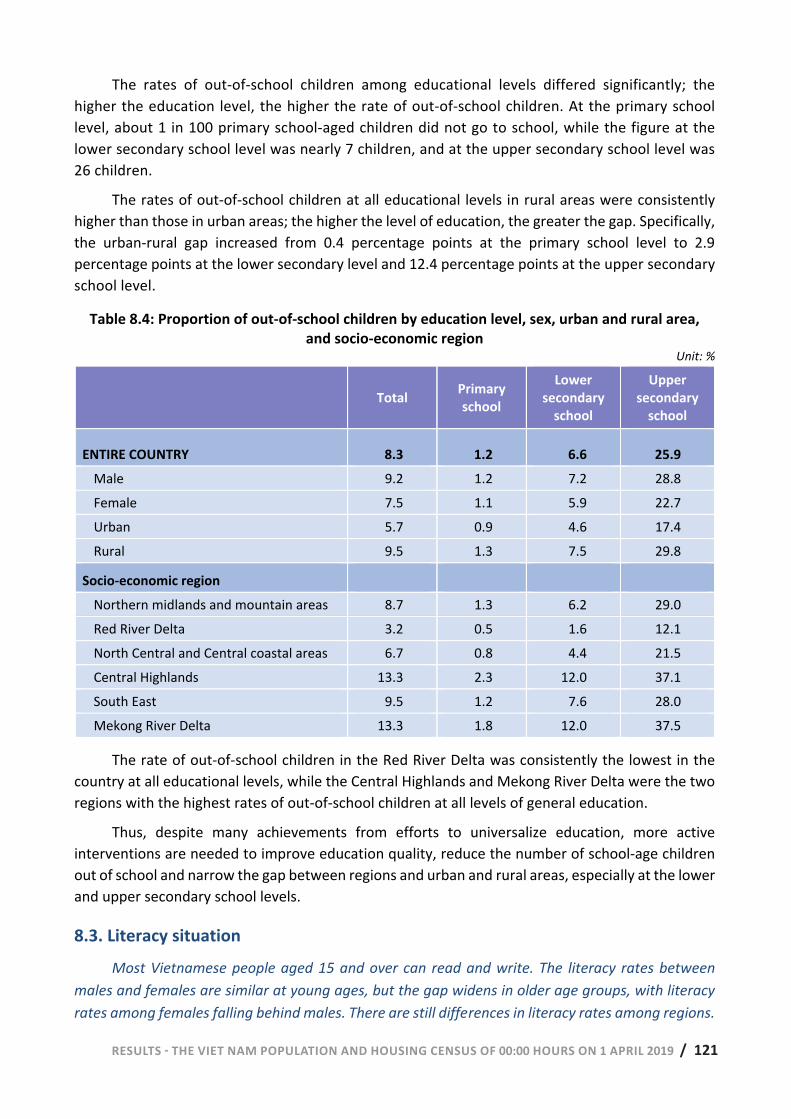
RESULTS - THE VIET NAM POPULATION AND HOUSING CENSUS OF 00:00 HOURS ON 1 APRIL 2019 / 121 118 | RESULTS - THE VIET NAM POPULATION AND HOUSING CENSUS OF 00:00 HOURS ON 1 APRIL 2019
The rates of out-of-school children among educational levels differed significantly; the higher the education level, the higher the rate of out-of-school children. At the primary school level, about 1 in 100 primary school-aged children did not go to school, while the figure at the lower secondary school level was nearly 7 children, and at the upper secondary school level was 26 children.
The rates of out-of-school children at all educational levels in rural areas were consistently higher than those in urban areas; the higher the level of education, the greater the gap. Specifically, the urban-rural gap increased from 0.4 percentage points at the primary school level to 2.9 percentage points at the lower secondary level and 12.4 percentage points at the upper secondary school level.
Table 8.4: Proportion of out-of-school children by education level, sex, urban and rural area, and socio-economic region
Unit: %
Total Primary
school
Lower secondary
school
Upper secondary
school
ENTIRE COUNTRY 8.3 1.2 6.6 25.9 Male 9.2 1.2 7.2 28.8 Female 7.5 1.1 5.9 22.7 Urban 5.7 0.9 4.6 17.4 Rural 9.5 1.3 7.5 29.8
Socio-economic region Northern midlands and mountain areas 8.7 1.3 6.2 29.0 Red River Delta 3.2 0.5 1.6 12.1 North Central and Central coastal areas 6.7 0.8 4.4 21.5 Central Highlands 13.3 2.3 12.0 37.1 South East 9.5 1.2 7.6 28.0 Mekong River Delta 13.3 1.8 12.0 37.5
The rate of out-of-school children in the Red River Delta was consistently the lowest in the country at all educational levels, while the Central Highlands and Mekong River Delta were the two regions with the highest rates of out-of-school children at all levels of general education.
Thus, despite many achievements from efforts to universalize education, more active interventions are needed to improve education quality, reduce the number of school-age children out of school and narrow the gap between regions and urban and rural areas, especially at the lower and upper secondary school levels.
8.3. Literacy situation Most Vietnamese people aged 15 and over can read and write. The literacy rates between
males and females are similar at young ages, but the gap widens in older age groups, with literacy rates among females falling behind males. There are still differences in literacy rates among regions.
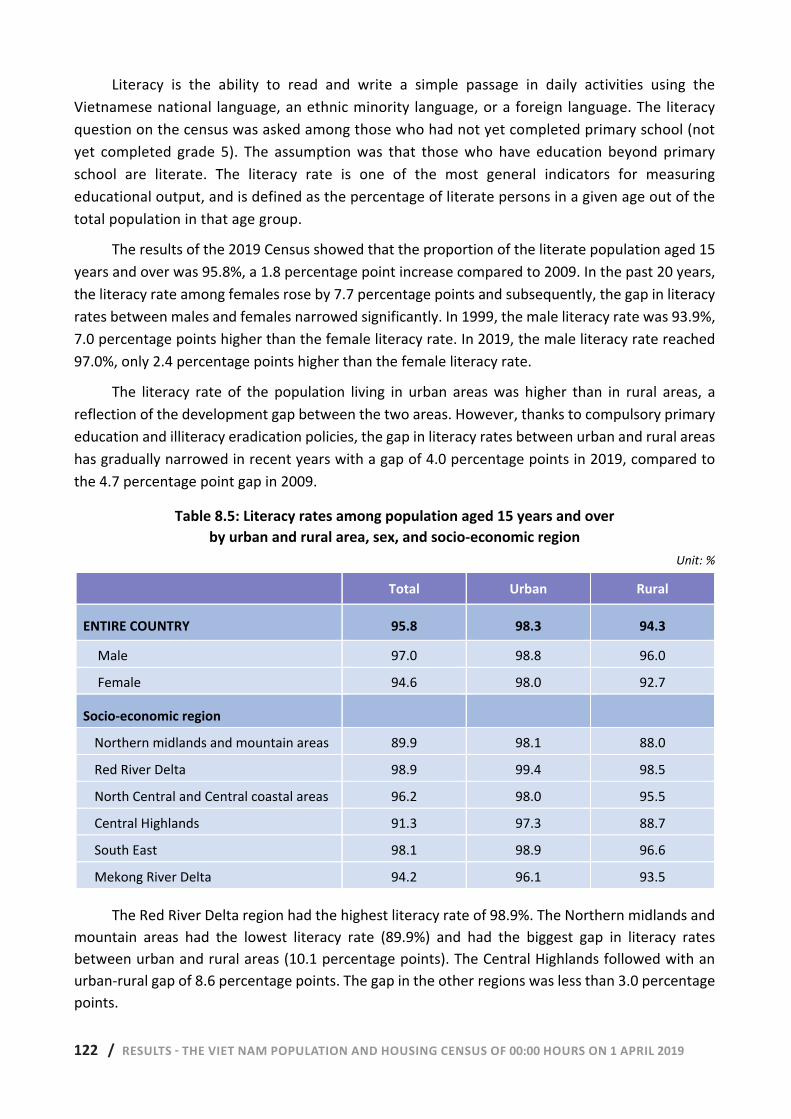
122 / RESULTS - THE VIET NAM POPULATION AND HOUSING CENSUS OF 00:00 HOURS ON 1 APRIL 2019 RESULTS - THE VIET NAM POPULATION AND HOUSING CENSUS OF 00:00 HOURS ON 1 APRIL 2019 | 119
Literacy is the ability to read and write a simple passage in daily activities using the Vietnamese national language, an ethnic minority language, or a foreign language. The literacy question on the census was asked among those who had not yet completed primary school (not yet completed grade 5). The assumption was that those who have education beyond primary school are literate. The literacy rate is one of the most general indicators for measuring educational output, and is defined as the percentage of literate persons in a given age out of the total population in that age group.
The results of the 2019 Census showed that the proportion of the literate population aged 15 years and over was 95.8%, a 1.8 percentage point increase compared to 2009. In the past 20 years, the literacy rate among females rose by 7.7 percentage points and subsequently, the gap in literacy rates between males and females narrowed significantly. In 1999, the male literacy rate was 93.9%, 7.0 percentage points higher than the female literacy rate. In 2019, the male literacy rate reached 97.0%, only 2.4 percentage points higher than the female literacy rate.
The literacy rate of the population living in urban areas was higher than in rural areas, a reflection of the development gap between the two areas. However, thanks to compulsory primary education and illiteracy eradication policies, the gap in literacy rates between urban and rural areas has gradually narrowed in recent years with a gap of 4.0 percentage points in 2019, compared to the 4.7 percentage point gap in 2009.
Table 8.5: Literacy rates among population aged 15 years and over by urban and rural area, sex, and socio-economic region
Unit: %
Total Urban Rural
ENTIRE COUNTRY 95.8 98.3 94.3
Male 97.0 98.8 96.0
Female 94.6 98.0 92.7
Socio-economic region
Northern midlands and mountain areas 89.9 98.1 88.0
Red River Delta 98.9 99.4 98.5
North Central and Central coastal areas 96.2 98.0 95.5
Central Highlands 91.3 97.3 88.7
South East 98.1 98.9 96.6
Mekong River Delta 94.2 96.1 93.5
The Red River Delta region had the highest literacy rate of 98.9%. The Northern midlands and mountain areas had the lowest literacy rate (89.9%) and had the biggest gap in literacy rates between urban and rural areas (10.1 percentage points). The Central Highlands followed with an urban-rural gap of 8.6 percentage points. The gap in the other regions was less than 3.0 percentage points.
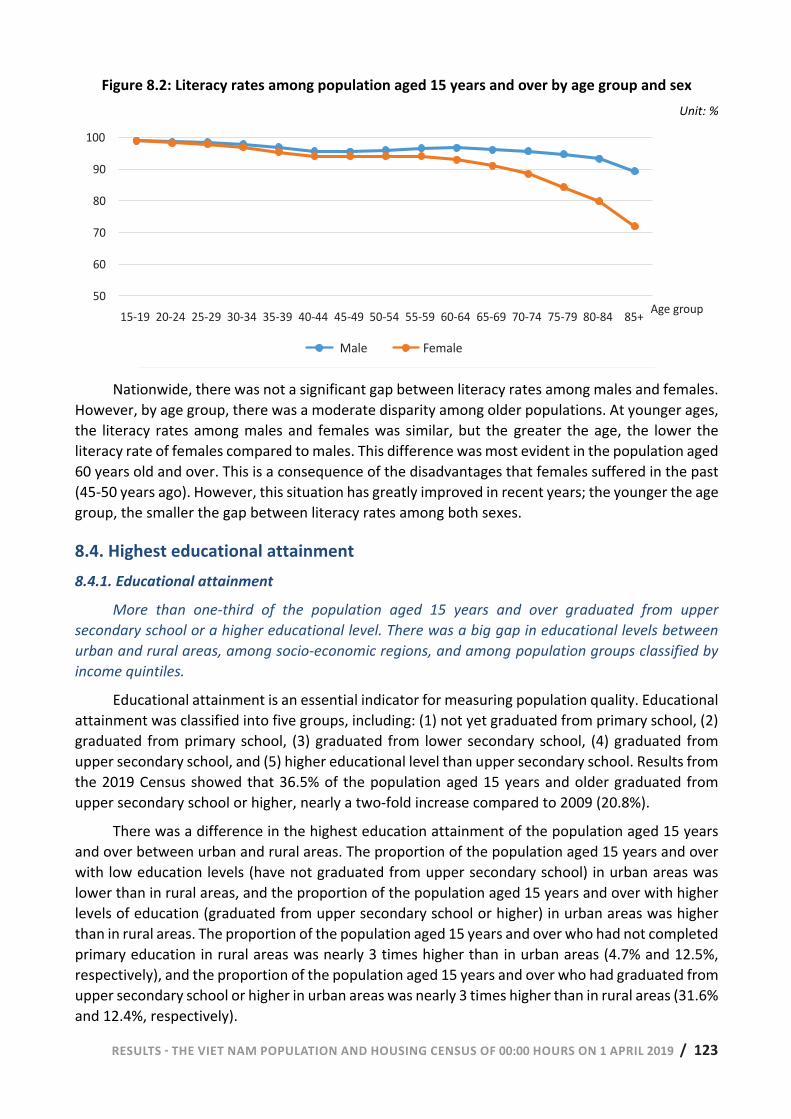
RESULTS - THE VIET NAM POPULATION AND HOUSING CENSUS OF 00:00 HOURS ON 1 APRIL 2019 / 123 120 | RESULTS - THE VIET NAM POPULATION AND HOUSING CENSUS OF 00:00 HOURS ON 1 APRIL 2019
Figure 8.2: Literacy rates among population aged 15 years and over by age group and sex Unit: %
Nationwide, there was not a significant gap between literacy rates among males and females.
However, by age group, there was a moderate disparity among older populations. At younger ages, the literacy rates among males and females was similar, but the greater the age, the lower the literacy rate of females compared to males. This difference was most evident in the population aged 60 years old and over. This is a consequence of the disadvantages that females suffered in the past (45-50 years ago). However, this situation has greatly improved in recent years; the younger the age group, the smaller the gap between literacy rates among both sexes.
8.4. Highest educational attainment 8.4.1. Educational attainment
More than one-third of the population aged 15 years and over graduated from upper secondary school or a higher educational level. There was a big gap in educational levels between urban and rural areas, among socio-economic regions, and among population groups classified by income quintiles.
Educational attainment is an essential indicator for measuring population quality. Educational attainment was classified into five groups, including: (1) not yet graduated from primary school, (2) graduated from primary school, (3) graduated from lower secondary school, (4) graduated from upper secondary school, and (5) higher educational level than upper secondary school. Results from the 2019 Census showed that 36.5% of the population aged 15 years and older graduated from upper secondary school or higher, nearly a two-fold increase compared to 2009 (20.8%).
There was a difference in the highest education attainment of the population aged 15 years and over between urban and rural areas. The proportion of the population aged 15 years and over with low education levels (have not graduated from upper secondary school) in urban areas was lower than in rural areas, and the proportion of the population aged 15 years and over with higher levels of education (graduated from upper secondary school or higher) in urban areas was higher than in rural areas. The proportion of the population aged 15 years and over who had not completed primary education in rural areas was nearly 3 times higher than in urban areas (4.7% and 12.5%, respectively), and the proportion of the population aged 15 years and over who had graduated from upper secondary school or higher in urban areas was nearly 3 times higher than in rural areas (31.6% and 12.4%, respectively).
50
60
70
80
90
100
15-19 20-24 25-29 30-34 35-39 40-44 45-49 50-54 55-59 60-64 65-69 70-74 75-79 80-84 85+
Male Female
Age group
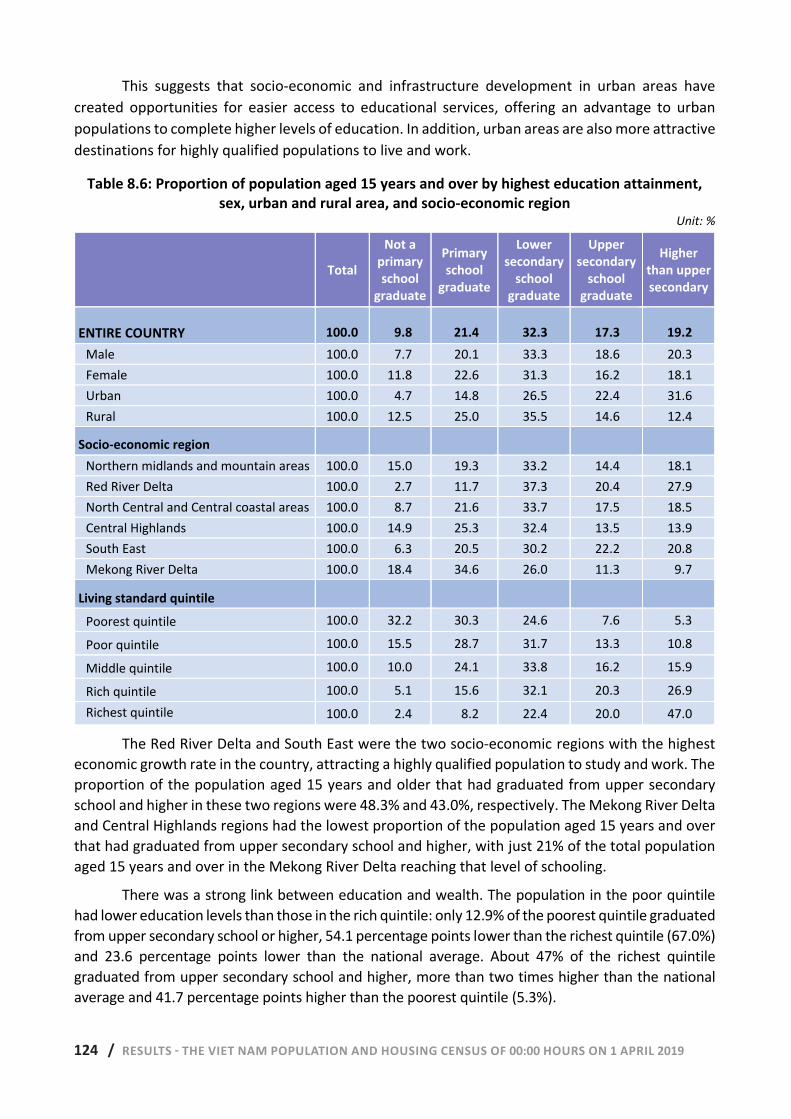
124 / RESULTS - THE VIET NAM POPULATION AND HOUSING CENSUS OF 00:00 HOURS ON 1 APRIL 2019 RESULTS - THE VIET NAM POPULATION AND HOUSING CENSUS OF 00:00 HOURS ON 1 APRIL 2019 | 121
This suggests that socio-economic and infrastructure development in urban areas have created opportunities for easier access to educational services, offering an advantage to urban populations to complete higher levels of education. In addition, urban areas are also more attractive destinations for highly qualified populations to live and work.
Table 8.6: Proportion of population aged 15 years and over by highest education attainment, sex, urban and rural area, and socio-economic region
Unit: %
Total
Not a primary school
graduate
Primary school
graduate
Lower secondary
school graduate
Upper secondary
school graduate
Higher than upper secondary
ENTIRE COUNTRY 100.0 9.8 21.4 32.3 17.3 19.2 Male 100.0 7.7 20.1 33.3 18.6 20.3 Female 100.0 11.8 22.6 31.3 16.2 18.1 Urban 100.0 4.7 14.8 26.5 22.4 31.6 Rural 100.0 12.5 25.0 35.5 14.6 12.4
Socio-economic region Northern midlands and mountain areas 100.0 15.0 19.3 33.2 14.4 18.1 Red River Delta 100.0 2.7 11.7 37.3 20.4 27.9 North Central and Central coastal areas 100.0 8.7 21.6 33.7 17.5 18.5 Central Highlands 100.0 14.9 25.3 32.4 13.5 13.9 South East 100.0 6.3 20.5 30.2 22.2 20.8 Mekong River Delta 100.0 18.4 34.6 26.0 11.3 9.7
Living standard quintile
Poorest quintile 100.0 32.2 30.3 24.6 7.6 5.3
Poor quintile 100.0 15.5 28.7 31.7 13.3 10.8
Middle quintile 100.0 10.0 24.1 33.8 16.2 15.9
Rich quintile 100.0 5.1 15.6 32.1 20.3 26.9 Richest quintile 100.0 2.4 8.2 22.4 20.0 47.0
The Red River Delta and South East were the two socio-economic regions with the highest economic growth rate in the country, attracting a highly qualified population to study and work. The proportion of the population aged 15 years and older that had graduated from upper secondary school and higher in these two regions were 48.3% and 43.0%, respectively. The Mekong River Delta and Central Highlands regions had the lowest proportion of the population aged 15 years and over that had graduated from upper secondary school and higher, with just 21% of the total population aged 15 years and over in the Mekong River Delta reaching that level of schooling.
There was a strong link between education and wealth. The population in the poor quintile had lower education levels than those in the rich quintile: only 12.9% of the poorest quintile graduated from upper secondary school or higher, 54.1 percentage points lower than the richest quintile (67.0%) and 23.6 percentage points lower than the national average. About 47% of the richest quintile graduated from upper secondary school and higher, more than two times higher than the national average and 41.7 percentage points higher than the poorest quintile (5.3%).
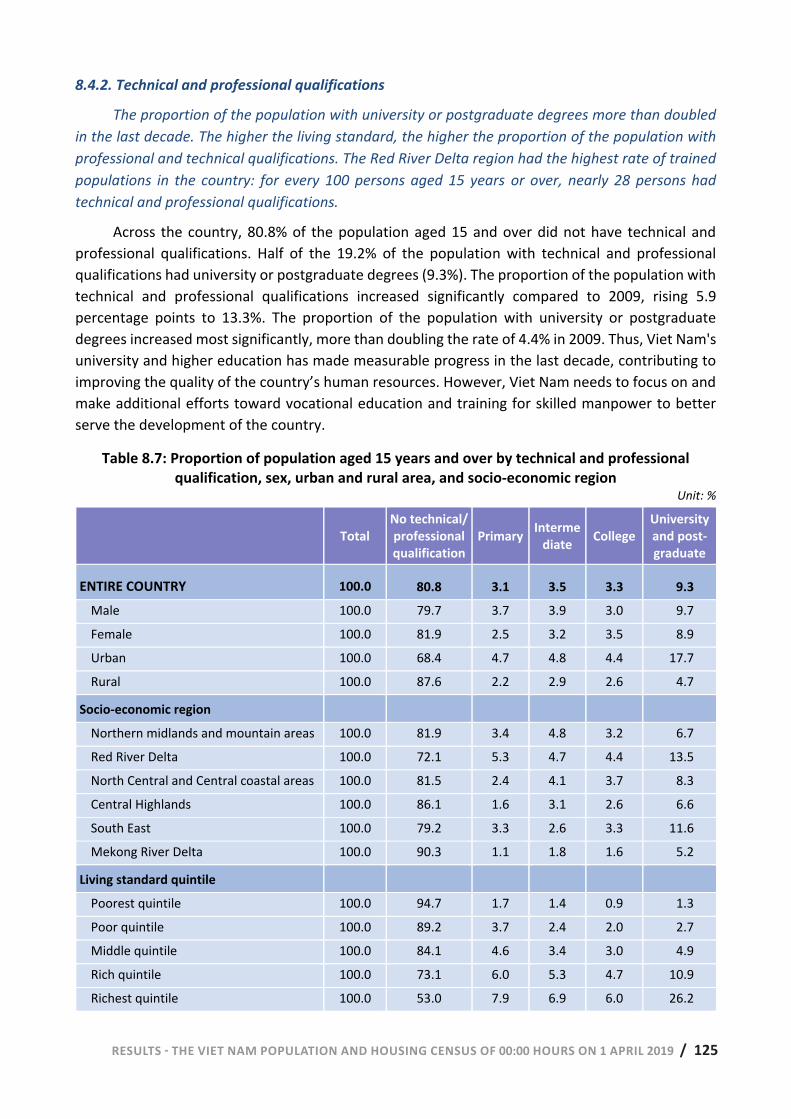
RESULTS - THE VIET NAM POPULATION AND HOUSING CENSUS OF 00:00 HOURS ON 1 APRIL 2019 / 125 122 | RESULTS - THE VIET NAM POPULATION AND HOUSING CENSUS OF 00:00 HOURS ON 1 APRIL 2019
8.4.2. Technical and professional qualifications
The proportion of the population with university or postgraduate degrees more than doubled in the last decade. The higher the living standard, the higher the proportion of the population with professional and technical qualifications. The Red River Delta region had the highest rate of trained populations in the country: for every 100 persons aged 15 years or over, nearly 28 persons had technical and professional qualifications.
Across the country, 80.8% of the population aged 15 and over did not have technical and professional qualifications. Half of the 19.2% of the population with technical and professional qualifications had university or postgraduate degrees (9.3%). The proportion of the population with technical and professional qualifications increased significantly compared to 2009, rising 5.9 percentage points to 13.3%. The proportion of the population with university or postgraduate degrees increased most significantly, more than doubling the rate of 4.4% in 2009. Thus, Viet Nam's university and higher education has made measurable progress in the last decade, contributing to improving the quality of the country’s human resources. However, Viet Nam needs to focus on and make additional efforts toward vocational education and training for skilled manpower to better serve the development of the country.
Table 8.7: Proportion of population aged 15 years and over by technical and professional qualification, sex, urban and rural area, and socio-economic region
Unit: %
Total No technical/ professional qualification
Primary Intermediate College
University and post-graduate
ENTIRE COUNTRY 100.0 80.8 3.1 3.5 3.3 9.3 Male 100.0 79.7 3.7 3.9 3.0 9.7
Female 100.0 81.9 2.5 3.2 3.5 8.9
Urban 100.0 68.4 4.7 4.8 4.4 17.7
Rural 100.0 87.6 2.2 2.9 2.6 4.7
Socio-economic region
Northern midlands and mountain areas 100.0 81.9 3.4 4.8 3.2 6.7
Red River Delta 100.0 72.1 5.3 4.7 4.4 13.5
North Central and Central coastal areas 100.0 81.5 2.4 4.1 3.7 8.3
Central Highlands 100.0 86.1 1.6 3.1 2.6 6.6
South East 100.0 79.2 3.3 2.6 3.3 11.6
Mekong River Delta 100.0 90.3 1.1 1.8 1.6 5.2
Living standard quintile
Poorest quintile 100.0 94.7 1.7 1.4 0.9 1.3
Poor quintile 100.0 89.2 3.7 2.4 2.0 2.7
Middle quintile 100.0 84.1 4.6 3.4 3.0 4.9
Rich quintile 100.0 73.1 6.0 5.3 4.7 10.9
Richest quintile 100.0 53.0 7.9 6.9 6.0 26.2
126 / RESULTS - THE VIET NAM POPULATION AND HOUSING CENSUS OF 00:00 HOURS ON 1 APRIL 2019 RESULTS - THE VIET NAM POPULATION AND HOUSING CENSUS OF 00:00 HOURS ON 1 APRIL 2019 | 123
The percentage of the population aged 15 years and over with technical and professional qualifications in urban areas was higher than in rural areas: the college and lower level rates in urban areas was almost twice as high as that in rural areas, and the university and postgraduate degree rate in urban areas was nearly four times higher than in rural areas. However, there was not a significant difference between sexes; the proportion of males with at least primary vocational education was 20.3%, just 2.2 percentage points higher than females with 18.1%.
The Red River Delta and South East regions had the highest proportion of the population aged 15 years and over with university or postgraduate degrees at 13.5% and 11.6%, respectively. The Mekong River Delta region had the lowest proportion of the population with university or postgraduate degrees, accounting for 5.2%.
The population aged 15 years and older in the richest quintile had the highest rate of trained populations among the income groups with 47.0%, or 27.8 percentage points higher than the percentage of the total population with technical and professional training, and 41.7 percentage points higher than the percentage of the technically trained population aged 15 years and older of the poorest quintile (5.3%). The proportion of the population with university or postgraduate degrees was the lowest in the poorest group and gradually increased in the higher income quintiles, reaching the highest level in the richest quintile.
Although there have been a number of improvements in enhancing technical and professional qualifications, Viet Nam needs to expand its efforts in training human resources to meet labor market needs, including manpower requirements to implement the fourth industrial revolution and effectively take advantage of the demographic window of opportunity.
8.5. Mean years of schooling and expected years of schooling The mean years of schooling and expected years of schooling in Viet Nam were 9.0 years and
12.2 years, respectively. Compared with other countries in Southeast Asia, the mean years of schooling and the expected years of schooling of Viet Nam were average.
Information about education is a component of the human development index (HDI). Before 2013, the educational index used to calculate HDI was the literacy rate, however, along with socio-economic development, the measure of education's contribution to development has also changed. Currently, the educational component used to calculate the HDI is the mean years of schooling and the expected years of schooling.
The mean years of schooling is the total number of years spent in school among the population aged 25 years and over compared with the total population in the birth cohort (rounded by age)40. The expected years of schooling is the total number of years of attending school that children at a given age are expected to receive in the future, assuming that the probability of children going to school at any age is the school enrollment rate of children at that age during the research period41.
The mean years of schooling of the Vietnamese population was 9.0 years. The mean years of schooling for males was 0.7 years higher than that for females (the mean years of schooling for males was 9.4. and females was 8.7 years). This difference between sexes was partially due to
40 2013, Methods of estimating mean years of schooling, United Nations Educational, Scientific and Cultural Organization (UNESCO Institute for Statistics). 41 2013, Estimated expected years of schooling, International Center for Inclusive Growth (IPC-IG), United Nations Development Program.
RESULTS - THE VIET NAM POPULATION AND HOUSING CENSUS OF 00:00 HOURS ON 1 APRIL 2019 / 127 124 | RESULTS - THE VIET NAM POPULATION AND HOUSING CENSUS OF 00:00 HOURS ON 1 APRIL 2019
distinctions in access to education between males and females in the past. People in urban areas also had higher mean years of schooling than people in rural areas. The nationwide mean years of schooling were 9.0 years, corresponding to the last grade in lower secondary school. The Red River Delta region had the highest mean years of schooling (10.6 years), 3.5 years higher than the Mekong River Delta, the region with the lowest mean years of schooling (7.1 years).
Reducing the out-of-school children rate is one solution that can contribute to raising the mean years of schooling of the population, thereby improving the Viet Nam HDI.
Table 8.8: Mean years of schooling and expected years of schooling by sex, urban and rural area, and socio-economic region
Unit: Year
Mean years of schooling Expected years of schooling
Total Male Female Total Male Female
ENTIRE COUNTRY 9.0 9.4 8.7 12.2 12.0 12.4
Urban 10.9 11.2 10.6 13.6 13.4 13.7
Rural 8.1 8.5 7.6 11.4 11.2 11.5
Socio-economic regions
Northern midlands and mountain areas 8.4 8.8 7.9 11.4 11.4 11.4
Red River Delta 10.6 11.0 10.3 13.3 13.2 13.4
North Central and Central coastal areas 9.0 9.5 8.6 12.2 11.9 12.5
Central Highlands 8.1 8.4 7.7 10.9 10.6 11.3
South East 9.8 10.0 9.6 12.6 12.5 12.8
Mekong River Delta 7.1 7.5 6.7 11.4 11.2 11.6
The number of expected years of schooling was 12.2 - surpassing the number of schooling years for all levels of general education. This suggests that the next generation of the Vietnamese population has intensively and extensively engaged in levels of education ranging from general education to professional education and vocational training. The expected years of schooling are a good indication of education and trends in access to intensive professional education.
The expected years of schooling for males and females were similar; the expected years of schooling for females was 0.4 years higher than for males (12.4 years and 12.0 years, respectively). Expected years of schooling in urban areas were higher than in rural areas. The Red River Delta region had the highest expected years of schooling, while the Central Highlands region had the lowest expected years of schooling.
Compared with other countries in Southeast Asia, the mean years of schooling and the expected years of schooling in Viet Nam were average. The mean years of schooling in Viet Nam ranked fifth highest after Singapore (11.5 years), Malaysia (10.2 years), Philippines (9.3 years), and Brunei (9.1 years). Viet Nam’s expected years of schooling ranked seventh in the region42. 42 United Nations Development Program: http://hdr.undp.org/en/indicators/69706#. The country data used for comparison was updated in 2017.

128 / RESULTS - THE VIET NAM POPULATION AND HOUSING CENSUS OF 00:00 HOURS ON 1 APRIL 2019
Photo: UNFPA Viet Nam/ Nguyen Minh Duc
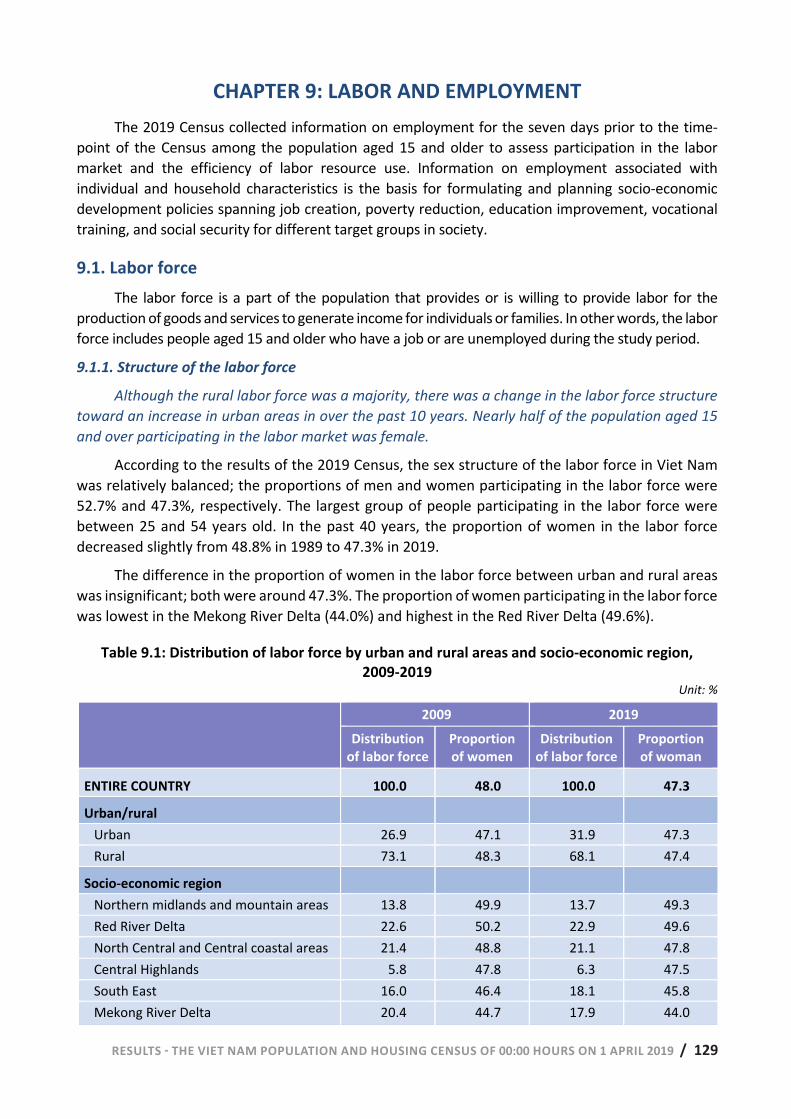
RESULTS - THE VIET NAM POPULATION AND HOUSING CENSUS OF 00:00 HOURS ON 1 APRIL 2019 / 129 RESULTS - THE VIET NAM POPULATION AND HOUSING CENSUS OF 00:00 HOURS ON 1 APRIL 2019 | 125
CHAPTER 9: LABOR AND EMPLOYMENT The 2019 Census collected information on employment for the seven days prior to the time-
point of the Census among the population aged 15 and older to assess participation in the labor market and the efficiency of labor resource use. Information on employment associated with individual and household characteristics is the basis for formulating and planning socio-economic development policies spanning job creation, poverty reduction, education improvement, vocational training, and social security for different target groups in society.
9.1. Labor force The labor force is a part of the population that provides or is willing to provide labor for the
production of goods and services to generate income for individuals or families. In other words, the labor force includes people aged 15 and older who have a job or are unemployed during the study period.
9.1.1. Structure of the labor force
Although the rural labor force was a majority, there was a change in the labor force structure toward an increase in urban areas in over the past 10 years. Nearly half of the population aged 15 and over participating in the labor market was female.
According to the results of the 2019 Census, the sex structure of the labor force in Viet Nam was relatively balanced; the proportions of men and women participating in the labor force were 52.7% and 47.3%, respectively. The largest group of people participating in the labor force were between 25 and 54 years old. In the past 40 years, the proportion of women in the labor force decreased slightly from 48.8% in 1989 to 47.3% in 2019.
The difference in the proportion of women in the labor force between urban and rural areas was insignificant; both were around 47.3%. The proportion of women participating in the labor force was lowest in the Mekong River Delta (44.0%) and highest in the Red River Delta (49.6%).
Table 9.1: Distribution of labor force by urban and rural areas and socio-economic region, 2009-2019
Unit: %
2009 2019
Distribution of labor force
Proportion of women
Distribution of labor force
Proportion of woman
ENTIRE COUNTRY 100.0 48.0 100.0 47.3 Urban/rural
Urban 26.9 47.1 31.9 47.3 Rural 73.1 48.3 68.1 47.4
Socio-economic region Northern midlands and mountain areas 13.8 49.9 13.7 49.3 Red River Delta 22.6 50.2 22.9 49.6 North Central and Central coastal areas 21.4 48.8 21.1 47.8 Central Highlands 5.8 47.8 6.3 47.5 South East 16.0 46.4 18.1 45.8 Mekong River Delta 20.4 44.7 17.9 44.0
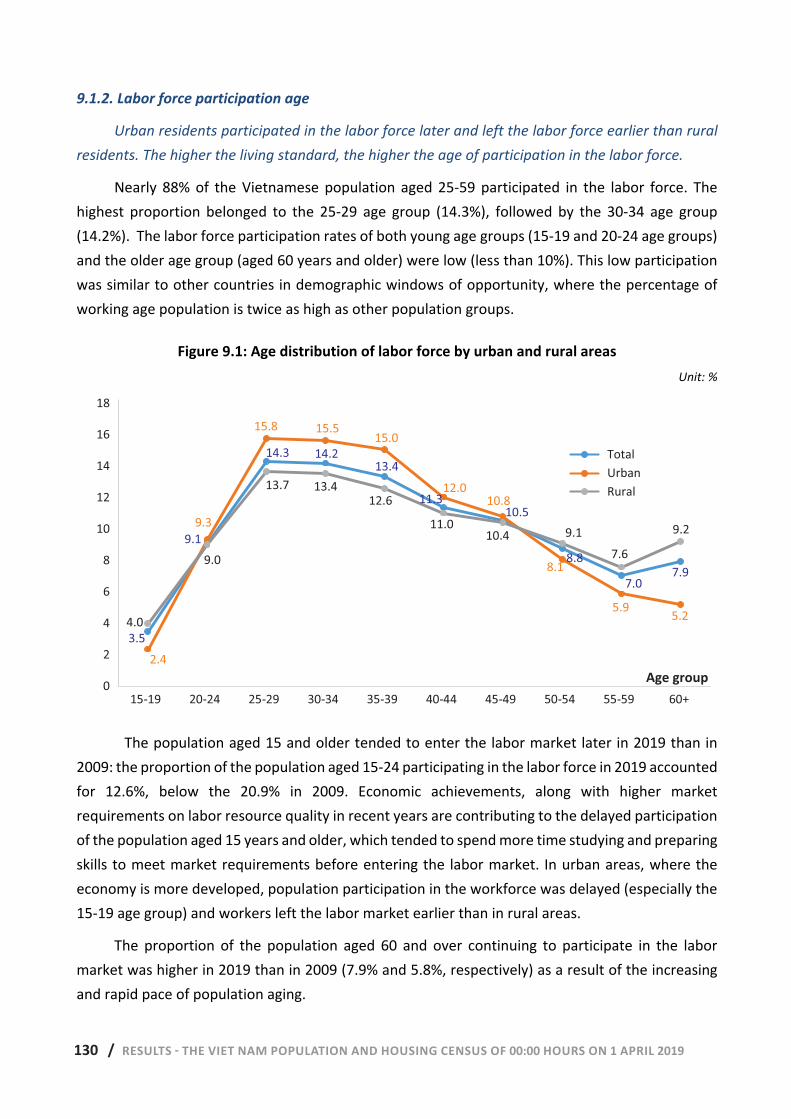
130 / RESULTS - THE VIET NAM POPULATION AND HOUSING CENSUS OF 00:00 HOURS ON 1 APRIL 2019 126 | RESULTS - THE VIET NAM POPULATION AND HOUSING CENSUS OF 00:00 HOURS ON 1 APRIL 2019
9.1.2. Labor force participation age
Urban residents participated in the labor force later and left the labor force earlier than rural residents. The higher the living standard, the higher the age of participation in the labor force.
Nearly 88% of the Vietnamese population aged 25-59 participated in the labor force. The highest proportion belonged to the 25-29 age group (14.3%), followed by the 30-34 age group (14.2%). The labor force participation rates of both young age groups (15-19 and 20-24 age groups) and the older age group (aged 60 years and older) were low (less than 10%). This low participation was similar to other countries in demographic windows of opportunity, where the percentage of working age population is twice as high as other population groups.
Figure 9.1: Age distribution of labor force by urban and rural areas Unit: %
The population aged 15 and older tended to enter the labor market later in 2019 than in 2009: the proportion of the population aged 15-24 participating in the labor force in 2019 accounted for 12.6%, below the 20.9% in 2009. Economic achievements, along with higher market requirements on labor resource quality in recent years are contributing to the delayed participation of the population aged 15 years and older, which tended to spend more time studying and preparing skills to meet market requirements before entering the labor market. In urban areas, where the economy is more developed, population participation in the workforce was delayed (especially the 15-19 age group) and workers left the labor market earlier than in rural areas.
The proportion of the population aged 60 and over continuing to participate in the labor market was higher in 2019 than in 2009 (7.9% and 5.8%, respectively) as a result of the increasing and rapid pace of population aging.
3.5
9.1
14.3 14.2 13.4
11.3 10.5
8.8 7.0 7.9
2.4
9.3
15.8 15.5 15.0
12.0 10.8
8.1
5.9 5.2 4.0
9.0
13.7 13.4
12.6
11.0 10.4 9.1
7.6
9.2
0
2
4
6
8
10
12
14
16
18
15-19 20-24 25-29 30-34 35-39 40-44 45-49 50-54 55-59 60+
Entire country
Urban
Rural3.54.0
9.1
14.3 14.213.4
11.310.5
8.8
7.07.9
2.4
9.3
15.8
15.5 15.0
12.0 10.8
8.1
5.95.2
9.0
13.7 13.4 12.6
11.010.4
7.6
9.1 9.2
0
2
4
6
8
10
12
14
16
18
15-19 20-24 25-29 30-34 35-39 40-44 45-49 50-54 55-59 60+
TotalUrbanRural
Age group
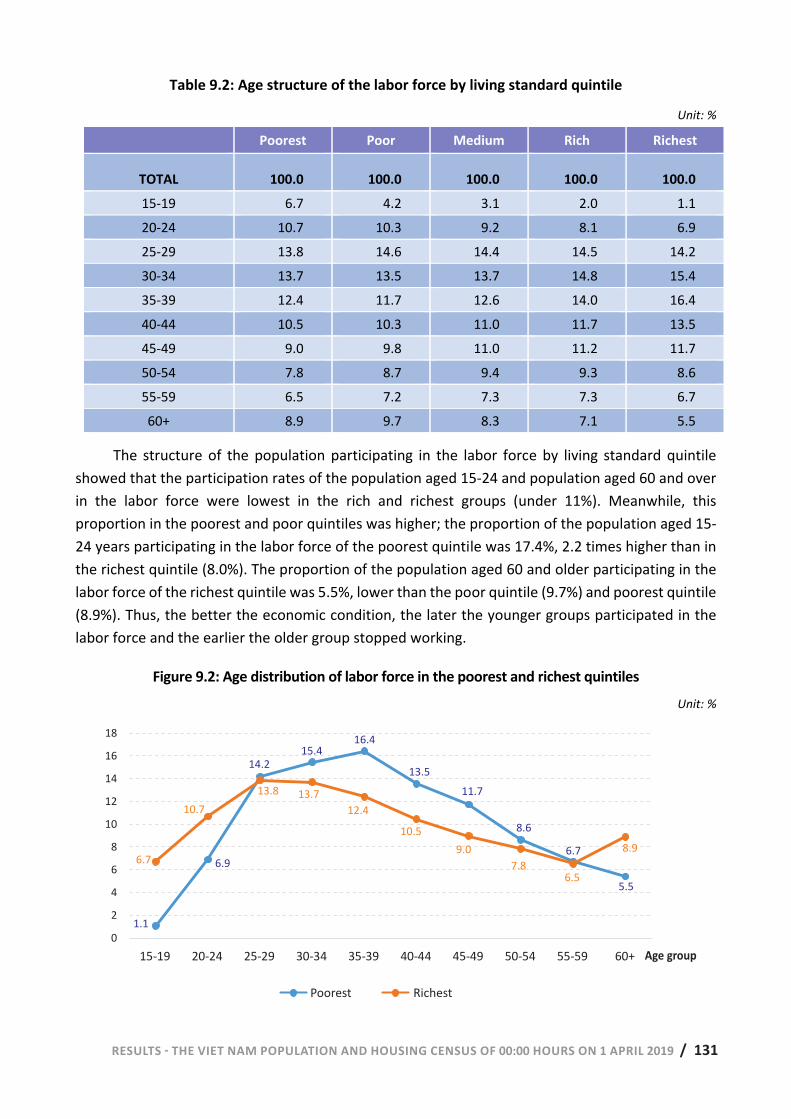
RESULTS - THE VIET NAM POPULATION AND HOUSING CENSUS OF 00:00 HOURS ON 1 APRIL 2019 / 131 RESULTS - THE VIET NAM POPULATION AND HOUSING CENSUS OF 00:00 HOURS ON 1 APRIL 2019 | 127
Table 9.2: Age structure of the labor force by living standard quintile
Unit: %
Poorest Poor Medium Rich Richest
TOTAL 100.0 100.0 100.0 100.0 100.0 15-19 6.7 4.2 3.1 2.0 1.1 20-24 10.7 10.3 9.2 8.1 6.9 25-29 13.8 14.6 14.4 14.5 14.2 30-34 13.7 13.5 13.7 14.8 15.4 35-39 12.4 11.7 12.6 14.0 16.4 40-44 10.5 10.3 11.0 11.7 13.5 45-49 9.0 9.8 11.0 11.2 11.7 50-54 7.8 8.7 9.4 9.3 8.6 55-59 6.5 7.2 7.3 7.3 6.7 60+ 8.9 9.7 8.3 7.1 5.5
The structure of the population participating in the labor force by living standard quintile showed that the participation rates of the population aged 15-24 and population aged 60 and over in the labor force were lowest in the rich and richest groups (under 11%). Meanwhile, this proportion in the poorest and poor quintiles was higher; the proportion of the population aged 15-24 years participating in the labor force of the poorest quintile was 17.4%, 2.2 times higher than in the richest quintile (8.0%). The proportion of the population aged 60 and older participating in the labor force of the richest quintile was 5.5%, lower than the poor quintile (9.7%) and poorest quintile (8.9%). Thus, the better the economic condition, the later the younger groups participated in the labor force and the earlier the older group stopped working.
Figure 9.2: Age distribution of labor force in the poorest and richest quintiles Unit: %
6.7
10.7 13.8 13.7 12.4
10.5 9.0
7.8 6.5
8.9
1.1
6.9
14.2 15.4
16.4
13.5 11.7
8.6
6.7
5.5
02468
1012141618
15-19 20-24 25-29 30-34 35-39 40-44 45-49 50-54 55-59 60+
Poorest Richest
1.1
6.9
14.2 15.4
16.4
13.5
11.7
8.6
6.7
5.5
6.7
10.7
13.8 13.7
12.4
10.5
9.0
7.8
6.5
8.9
0
2
4
6
8
10
12
14
16
18
15-19 20-24 25-29 30-34 35-39 40-44 45-49 50-54 55-59 60+
Poorest Richest
Age group
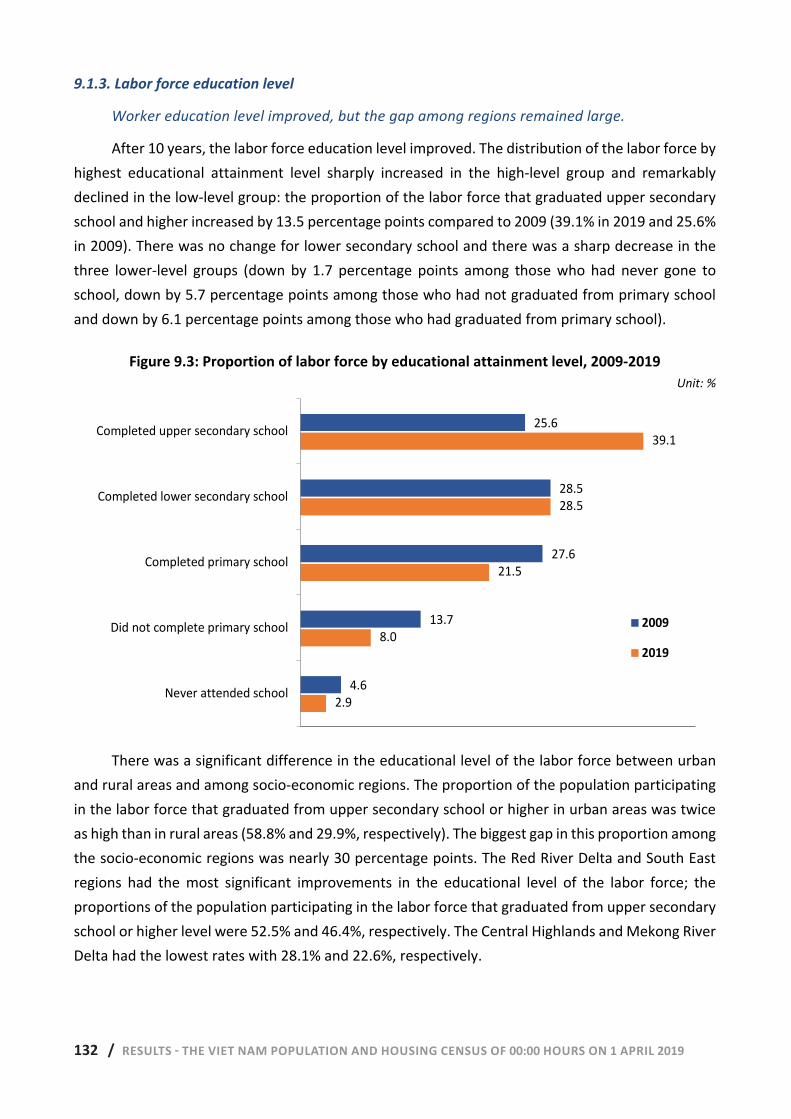
132 / RESULTS - THE VIET NAM POPULATION AND HOUSING CENSUS OF 00:00 HOURS ON 1 APRIL 2019 128 | RESULTS - THE VIET NAM POPULATION AND HOUSING CENSUS OF 00:00 HOURS ON 1 APRIL 2019
9.1.3. Labor force education level
Worker education level improved, but the gap among regions remained large.
After 10 years, the labor force education level improved. The distribution of the labor force by highest educational attainment level sharply increased in the high-level group and remarkably declined in the low-level group: the proportion of the labor force that graduated upper secondary school and higher increased by 13.5 percentage points compared to 2009 (39.1% in 2019 and 25.6% in 2009). There was no change for lower secondary school and there was a sharp decrease in the three lower-level groups (down by 1.7 percentage points among those who had never gone to school, down by 5.7 percentage points among those who had not graduated from primary school and down by 6.1 percentage points among those who had graduated from primary school).
Figure 9.3: Proportion of labor force by educational attainment level, 2009-2019 Unit: %
There was a significant difference in the educational level of the labor force between urban and rural areas and among socio-economic regions. The proportion of the population participating in the labor force that graduated from upper secondary school or higher in urban areas was twice as high than in rural areas (58.8% and 29.9%, respectively). The biggest gap in this proportion among the socio-economic regions was nearly 30 percentage points. The Red River Delta and South East regions had the most significant improvements in the educational level of the labor force; the proportions of the population participating in the labor force that graduated from upper secondary school or higher level were 52.5% and 46.4%, respectively. The Central Highlands and Mekong River Delta had the lowest rates with 28.1% and 22.6%, respectively.
2.9
8.0
21.5
28.5
39.1
4.6
13.7
27.6
28.5
25.6
Never attended school
Did not complete primary school
Completed primary school
Completed lower secondary school
Completed upper secondary school
2009
2019
2.9
8.0
21.5
28.5
39.1
4.6
13.7
27.6
28.5
25.6
Never attended school
Did not complete primary school
Completed primary school
Completed lower secondary school
Completed upper secondary school
2009
2019
RESULTS - THE VIET NAM POPULATION AND HOUSING CENSUS OF 00:00 HOURS ON 1 APRIL 2019 / 133 RESULTS - THE VIET NAM POPULATION AND HOUSING CENSUS OF 00:00 HOURS ON 1 APRIL 2019 | 129
Table 9.3: Proportion of labor force by educational level, urban and rural area, and socio-economic region
Unit: %
Total Never
attended school
Did not complete primary school
Completed primary school
Completed lower
secondary school
Completed upper
secondary school and
higher
ENTIRE COUNTRY 100.0 2.9 8.0 21.5 28.5 39.1
Male 100.0 2.2 7.5 20.9 28.0 41.4
Female 100.0 3.6 8.5 22.1 29.1 36.7
Urban 100.0 0.8 4.5 14.7 21.2 58.8
Rural 100.0 3.9 9.7 24.6 31.9 29.9
Socio-economic region
Northern midlands and mountain areas 100.0 9.1 8.0 19.4 29.5 34.0
Red River Delta 100.0 0.4 1.9 10.6 34.6 52.5
North Central and Central coastal areas 100.0 2.2 6.7 21.8 30.3 39.0
Central Highlands 100.0 6.6 10.2 27.4 27.7 28.1
South East 100.0 1.1 6.9 20.7 24.9 46.4
Mekong River Delta 100.0 2.9 17.8 35.3 21.4 22.6
9.1.4. Labor force technical qualifications
Despite the young and abundant labor force, the level of skills and technical qualifications of the labor force was still very low. There was a positive relationship between the level of technical qualifications and the living standard of the population. The population in the richest quintile had the highest rate of trained workers, nearly 10 times higher than the rate in the poorest quintile.
The proportion of the population aged 15 years and over participating in the labor force who had technical qualifications at a primary vocational level or higher was 23.1%, an 8.2 percentage point increase compared to 2009. This figure in urban areas was 2.5 times higher than in rural areas (39.3% and 15.6%, respectively).
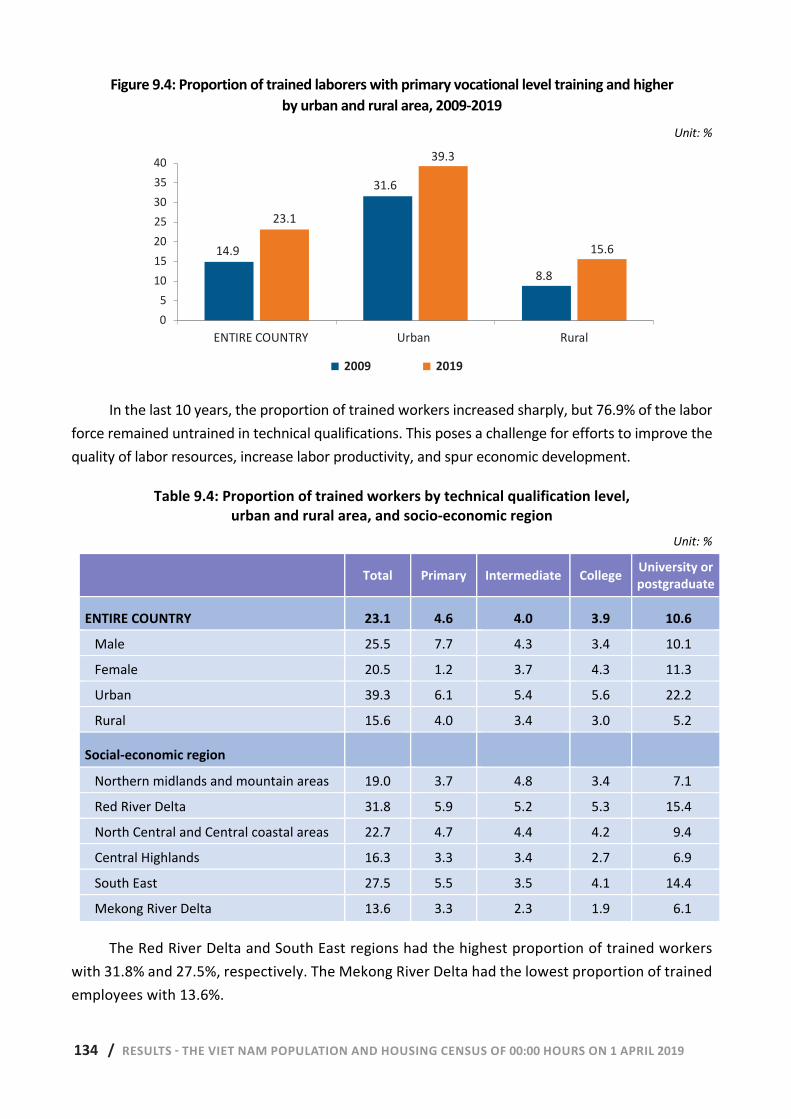
134 / RESULTS - THE VIET NAM POPULATION AND HOUSING CENSUS OF 00:00 HOURS ON 1 APRIL 2019 130 | RESULTS - THE VIET NAM POPULATION AND HOUSING CENSUS OF 00:00 HOURS ON 1 APRIL 2019
Figure 9.4: Proportion of trained laborers with primary vocational level training and higher by urban and rural area, 2009-2019
Unit: %
In the last 10 years, the proportion of trained workers increased sharply, but 76.9% of the labor force remained untrained in technical qualifications. This poses a challenge for efforts to improve the quality of labor resources, increase labor productivity, and spur economic development.
Table 9.4: Proportion of trained workers by technical qualification level, urban and rural area, and socio-economic region
Unit: %
Total Primary Intermediate College University or postgraduate
ENTIRE COUNTRY 23.1 4.6 4.0 3.9 10.6 Male 25.5 7.7 4.3 3.4 10.1 Female 20.5 1.2 3.7 4.3 11.3 Urban 39.3 6.1 5.4 5.6 22.2 Rural 15.6 4.0 3.4 3.0 5.2
Social-economic region Northern midlands and mountain areas 19.0 3.7 4.8 3.4 7.1 Red River Delta 31.8 5.9 5.2 5.3 15.4 North Central and Central coastal areas 22.7 4.7 4.4 4.2 9.4 Central Highlands 16.3 3.3 3.4 2.7 6.9 South East 27.5 5.5 3.5 4.1 14.4 Mekong River Delta 13.6 3.3 2.3 1.9 6.1
The Red River Delta and South East regions had the highest proportion of trained workers with 31.8% and 27.5%, respectively. The Mekong River Delta had the lowest proportion of trained employees with 13.6%.
14.9
31.6
8.8
23.1
39.3
15.6
0.05.0
10.015.020.025.030.035.040.0
Entire country Urban Rural
2009 2019
14.9
31.6
8.8
23.1
39.3
15.6
0
5
10
15
20
25
30
35
40
ENTIRE COUNTRY Urban Rural
2009 2019
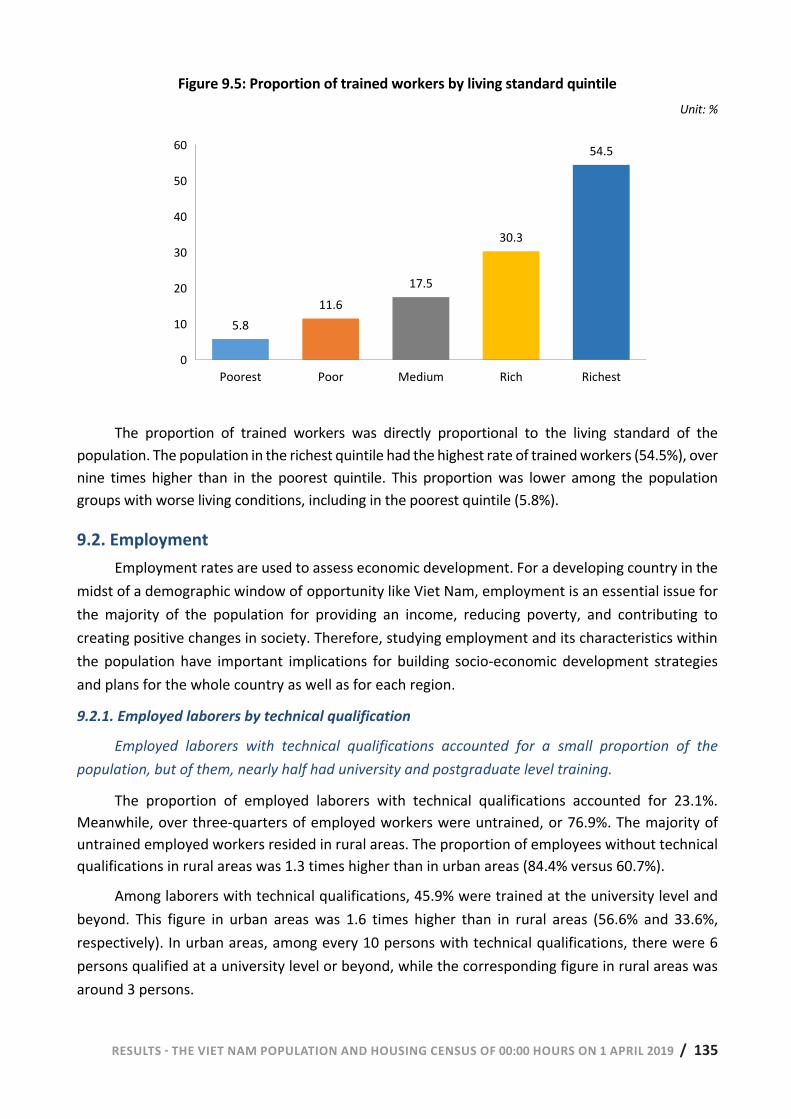
RESULTS - THE VIET NAM POPULATION AND HOUSING CENSUS OF 00:00 HOURS ON 1 APRIL 2019 / 135 RESULTS - THE VIET NAM POPULATION AND HOUSING CENSUS OF 00:00 HOURS ON 1 APRIL 2019 | 131
Figure 9.5: Proportion of trained workers by living standard quintile Unit: %
The proportion of trained workers was directly proportional to the living standard of the population. The population in the richest quintile had the highest rate of trained workers (54.5%), over nine times higher than in the poorest quintile. This proportion was lower among the population groups with worse living conditions, including in the poorest quintile (5.8%).
9.2. Employment
Employment rates are used to assess economic development. For a developing country in the midst of a demographic window of opportunity like Viet Nam, employment is an essential issue for the majority of the population for providing an income, reducing poverty, and contributing to creating positive changes in society. Therefore, studying employment and its characteristics within the population have important implications for building socio-economic development strategies and plans for the whole country as well as for each region.
9.2.1. Employed laborers by technical qualification
Employed laborers with technical qualifications accounted for a small proportion of the population, but of them, nearly half had university and postgraduate level training.
The proportion of employed laborers with technical qualifications accounted for 23.1%. Meanwhile, over three-quarters of employed workers were untrained, or 76.9%. The majority of untrained employed workers resided in rural areas. The proportion of employees without technical qualifications in rural areas was 1.3 times higher than in urban areas (84.4% versus 60.7%).
Among laborers with technical qualifications, 45.9% were trained at the university level and beyond. This figure in urban areas was 1.6 times higher than in rural areas (56.6% and 33.6%, respectively). In urban areas, among every 10 persons with technical qualifications, there were 6 persons qualified at a university level or beyond, while the corresponding figure in rural areas was around 3 persons.
5.811.6
17.5
30.3
54.5
0.0
10.0
20.0
30.0
40.0
50.0
60.0
Poorest Poor Medium Rich Richest
5.811.6
17.5
30.3
54.5
0
10
20
30
40
50
60
Poorest Poor Medium Rich Richest
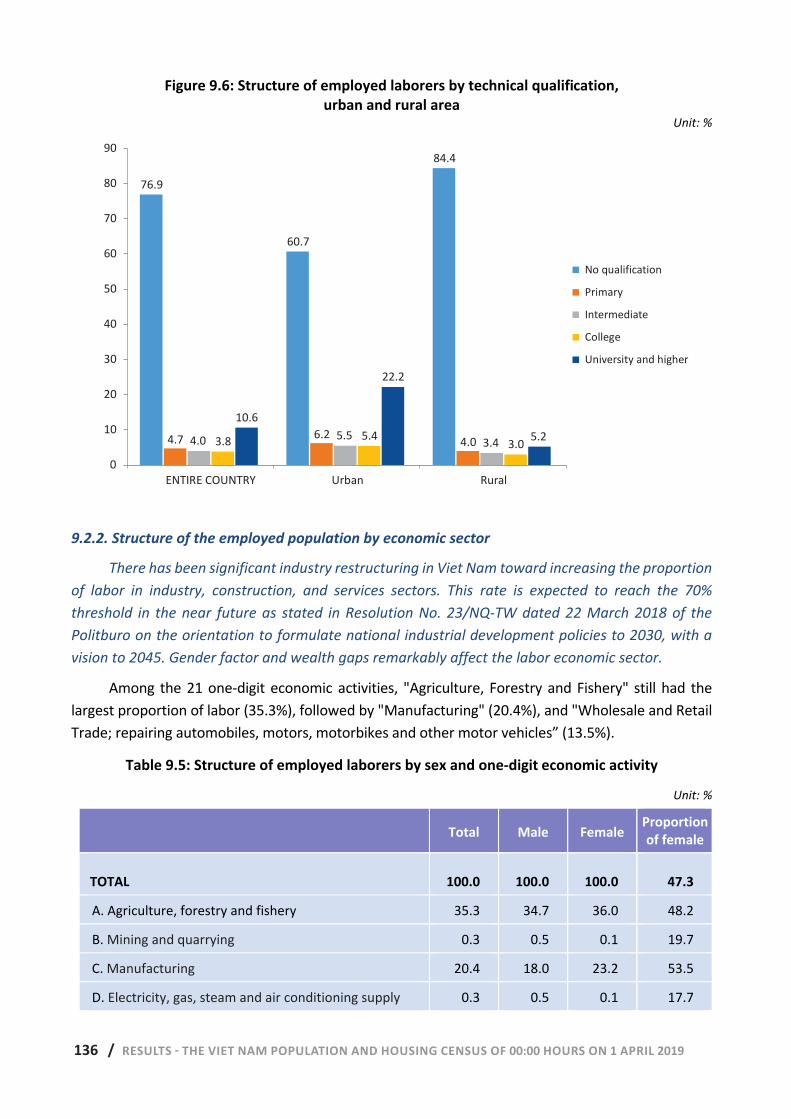
136 / RESULTS - THE VIET NAM POPULATION AND HOUSING CENSUS OF 00:00 HOURS ON 1 APRIL 2019 132 | RESULTS - THE VIET NAM POPULATION AND HOUSING CENSUS OF 00:00 HOURS ON 1 APRIL 2019
Figure 9.6: Structure of employed laborers by technical qualification, urban and rural area
Unit: %
9.2.2. Structure of the employed population by economic sector
There has been significant industry restructuring in Viet Nam toward increasing the proportion of labor in industry, construction, and services sectors. This rate is expected to reach the 70% threshold in the near future as stated in Resolution No. 23/NQ-TW dated 22 March 2018 of the Politburo on the orientation to formulate national industrial development policies to 2030, with a vision to 2045. Gender factor and wealth gaps remarkably affect the labor economic sector.
Among the 21 one-digit economic activities, "Agriculture, Forestry and Fishery" still had the largest proportion of labor (35.3%), followed by "Manufacturing" (20.4%), and "Wholesale and Retail Trade; repairing automobiles, motors, motorbikes and other motor vehicles” (13.5%).
Table 9.5: Structure of employed laborers by sex and one-digit economic activity
Unit: %
Total Male Female Proportion of female
TOTAL 100.0 100.0 100.0 47.3
A. Agriculture, forestry and fishery 35.3 34.7 36.0 48.2
B. Mining and quarrying 0.3 0.5 0.1 19.7
C. Manufacturing 20.4 18.0 23.2 53.5
D. Electricity, gas, steam and air conditioning supply 0.3 0.5 0.1 17.7
76.9
60.7
84.4
4.7 6.2 4.04.0 5.5 3.43.8 5.43.0
10.6
22.2
5.2
0
10
20
30
40
50
60
70
80
90
Entire country Urban Rural
No qualification
Primary
Intermediate
College
University and higher
76.9
60.7
84.4
4.7 6.24.04.0 5.5
3.43.8 5.43.0
10.6
22.2
5.2
0
10
20
30
40
50
60
70
80
90
ENTIRE COUNTRY Urban Rural
No qualification
Primary
Intermediate
College
University and higher
RESULTS - THE VIET NAM POPULATION AND HOUSING CENSUS OF 00:00 HOURS ON 1 APRIL 2019 / 137 RESULTS - THE VIET NAM POPULATION AND HOUSING CENSUS OF 00:00 HOURS ON 1 APRIL 2019 | 133
Total Male Female Proportion of female
E. Water supply; sewage, waste management and remediation activities
0.3 0.3 0.2 40.3
F. Construction 7.9 13.6 1.5 9.0
G. Wholesale and retail trade; repair of motor vehicles and motorcycles
13.5 11.4 15.9 55.3
H. Transportation and storage 3.7 6.2 0.8 10.7
I. Accommodation and food service activities 5.5 3.7 7.5 64.9
J. Information and communication 0.6 0.8 0.5 35.8
K. Financial and insurance activities 0.9 0.8 1 54.8
L. Real estate activities 0.6 0.6 0.6 46
M. Professional, scientific and technical activities 0.5 0.6 0.3 32.4
N. Administrative and support service activities 0.7 0.8 0.5 37.5
O. Public administration and defense; compulsory social security
2.0 2.4 1.5 35.3
P. Education 3.6 1.8 5.7 74.1
Q. Health and social work 1.1 0.8 1.4 62.7
R. Arts, entertainment and recreation 0.5 0.5 0.5 49.9
S. Other service activities 1.9 1.9 1.9 47.4
T. Services of households as employers; 0.4 0.1 0.8 89.6
U. Activities of international organizations and agencies 0.0 0.0 0.0 52.5
From 2009-2019, the proportion of employment by economic sector shifted positively toward reducing the proportion of labor in the “Agriculture, Forestry, and Fishery” sector and increasing employment in the “Industry,” “Construction” and “Services” sectors. The proportion of employed labor in the “Agriculture, Forestry, and Fishery” sector continually decreased from 53.9% in 2009 to 46.3% in 2014, and 35.3% in 2019. In 2019, for the first time, the number of employees working in the service sector was higher than the number working in the “Agriculture, Forestry, and Fishery” sector. Government policies to draw investment and industrial development and to encourage start-up enterprises in recent years created positive shifts in various economic sectors. With the current rate of labor restructuring, it will be possible to reach or exceed the objective of Resolution No. 23/NQ-TW dated 22 March 2018 of the Politburo on the orientation to formulate national industrial development policies to 2030, with a vision to 2045: "By 2030, the proportion of labor working in the industry and service sector will reach over 70%".
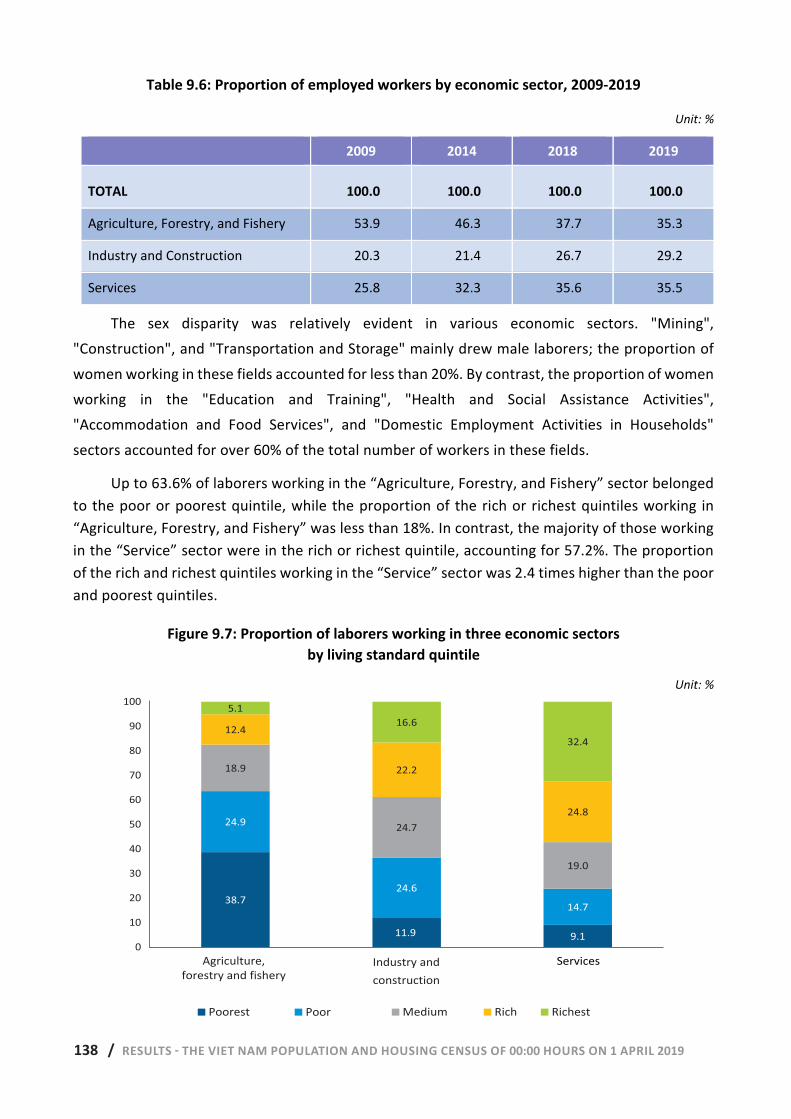
138 / RESULTS - THE VIET NAM POPULATION AND HOUSING CENSUS OF 00:00 HOURS ON 1 APRIL 2019 134 | RESULTS - THE VIET NAM POPULATION AND HOUSING CENSUS OF 00:00 HOURS ON 1 APRIL 2019
Table 9.6: Proportion of employed workers by economic sector, 2009-2019
Unit: %
2009 2014 2018 2019
TOTAL 100.0 100.0 100.0 100.0
Agriculture, Forestry, and Fishery 53.9 46.3 37.7 35.3
Industry and Construction 20.3 21.4 26.7 29.2
Services 25.8 32.3 35.6 35.5
The sex disparity was relatively evident in various economic sectors. "Mining", "Construction", and "Transportation and Storage" mainly drew male laborers; the proportion of women working in these fields accounted for less than 20%. By contrast, the proportion of women working in the "Education and Training", "Health and Social Assistance Activities", "Accommodation and Food Services", and "Domestic Employment Activities in Households" sectors accounted for over 60% of the total number of workers in these fields.
Up to 63.6% of laborers working in the “Agriculture, Forestry, and Fishery” sector belonged to the poor or poorest quintile, while the proportion of the rich or richest quintiles working in “Agriculture, Forestry, and Fishery” was less than 18%. In contrast, the majority of those working in the “Service” sector were in the rich or richest quintile, accounting for 57.2%. The proportion of the rich and richest quintiles working in the “Service” sector was 2.4 times higher than the poor and poorest quintiles.
Figure 9.7: Proportion of laborers working in three economic sectors by living standard quintile
Unit: %
38.7
11.9 9.1
24.9
24.614.7
18.9
24.7
19.0
12.4
22.2
24.8
5.116.6
32.4
Agriculture, forestry and fishery Industry and construction Services
Poorest Poor Medium Rich Richest
38.7
9.1
24.9
24.6
14.7
18.9
24.7
19.0
12.4
22.2
24.8
5.1
16.6
32.4
0
10
20
30
40
50
60
70
80
90
100
Agriculture, forestry and fishery
11.9
Services
Poorest Poor Medium Rich Richest
Industry and construction
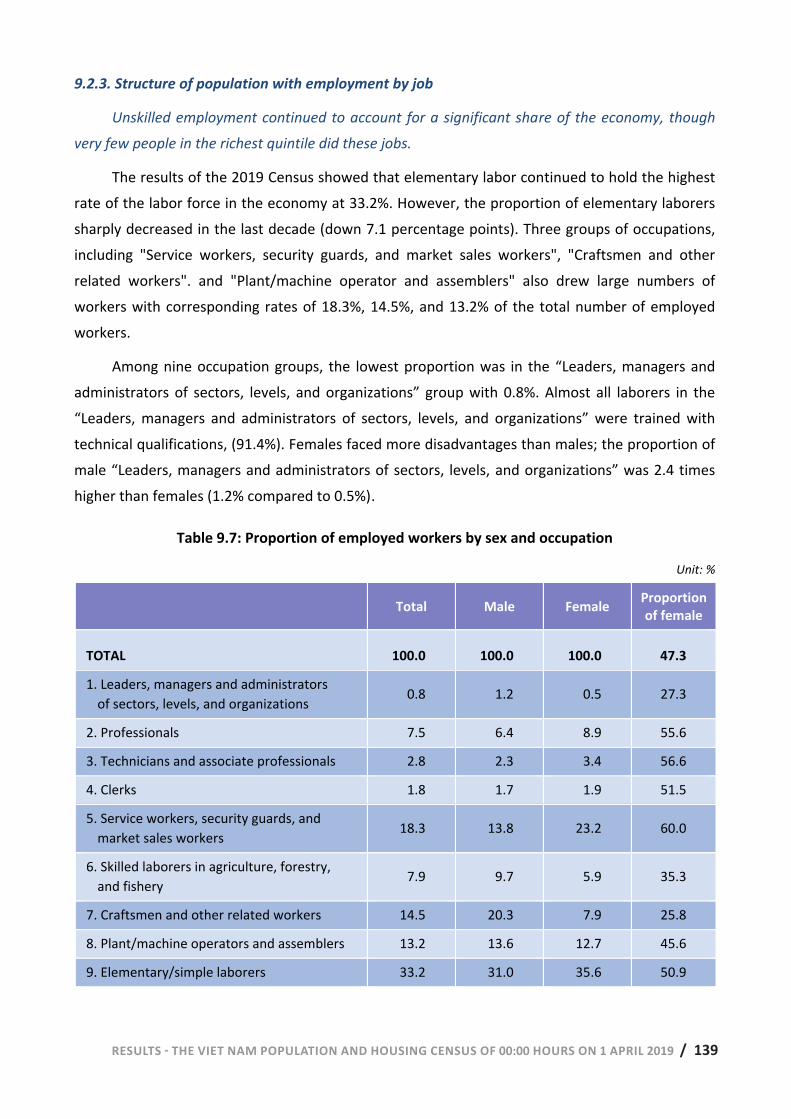
RESULTS - THE VIET NAM POPULATION AND HOUSING CENSUS OF 00:00 HOURS ON 1 APRIL 2019 / 139 RESULTS - THE VIET NAM POPULATION AND HOUSING CENSUS OF 00:00 HOURS ON 1 APRIL 2019 | 135
9.2.3. Structure of population with employment by job
Unskilled employment continued to account for a significant share of the economy, though very few people in the richest quintile did these jobs.
The results of the 2019 Census showed that elementary labor continued to hold the highest rate of the labor force in the economy at 33.2%. However, the proportion of elementary laborers sharply decreased in the last decade (down 7.1 percentage points). Three groups of occupations, including "Service workers, security guards, and market sales workers", "Craftsmen and other related workers". and "Plant/machine operator and assemblers" also drew large numbers of workers with corresponding rates of 18.3%, 14.5%, and 13.2% of the total number of employed workers.
Among nine occupation groups, the lowest proportion was in the “Leaders, managers and administrators of sectors, levels, and organizations” group with 0.8%. Almost all laborers in the “Leaders, managers and administrators of sectors, levels, and organizations” were trained with technical qualifications, (91.4%). Females faced more disadvantages than males; the proportion of male “Leaders, managers and administrators of sectors, levels, and organizations” was 2.4 times higher than females (1.2% compared to 0.5%).
Table 9.7: Proportion of employed workers by sex and occupation
Unit: %
Total Male Female Proportion of female
TOTAL 100.0 100.0 100.0 47.3
1. Leaders, managers and administrators of sectors, levels, and organizations
0.8 1.2 0.5 27.3
2. Professionals 7.5 6.4 8.9 55.6
3. Technicians and associate professionals 2.8 2.3 3.4 56.6
4. Clerks 1.8 1.7 1.9 51.5
5. Service workers, security guards, and market sales workers
18.3 13.8 23.2 60.0
6. Skilled laborers in agriculture, forestry, and fishery
7.9 9.7 5.9 35.3
7. Craftsmen and other related workers 14.5 20.3 7.9 25.8
8. Plant/machine operators and assemblers 13.2 13.6 12.7 45.6
9. Elementary/simple laborers 33.2 31.0 35.6 50.9
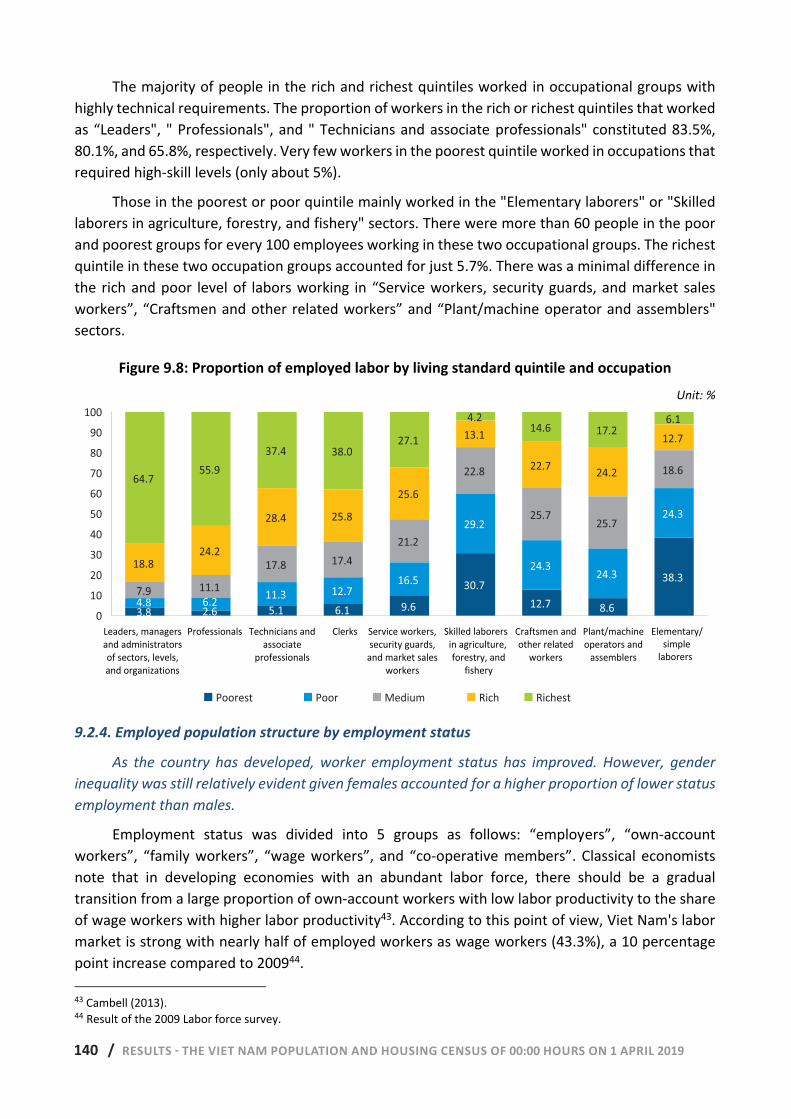
140 / RESULTS - THE VIET NAM POPULATION AND HOUSING CENSUS OF 00:00 HOURS ON 1 APRIL 2019 136 | RESULTS - THE VIET NAM POPULATION AND HOUSING CENSUS OF 00:00 HOURS ON 1 APRIL 2019
The majority of people in the rich and richest quintiles worked in occupational groups with highly technical requirements. The proportion of workers in the rich or richest quintiles that worked as “Leaders", " Professionals", and " Technicians and associate professionals" constituted 83.5%, 80.1%, and 65.8%, respectively. Very few workers in the poorest quintile worked in occupations that required high-skill levels (only about 5%).
Those in the poorest or poor quintile mainly worked in the "Elementary laborers" or "Skilled laborers in agriculture, forestry, and fishery" sectors. There were more than 60 people in the poor and poorest groups for every 100 employees working in these two occupational groups. The richest quintile in these two occupation groups accounted for just 5.7%. There was a minimal difference in the rich and poor level of labors working in “Service workers, security guards, and market sales workers”, “Craftsmen and other related workers” and “Plant/machine operator and assemblers" sectors.
Figure 9.8: Proportion of employed labor by living standard quintile and occupation Unit: %
9.2.4. Employed population structure by employment status
As the country has developed, worker employment status has improved. However, gender inequality was still relatively evident given females accounted for a higher proportion of lower status employment than males.
Employment status was divided into 5 groups as follows: “employers”, “own-account workers”, “family workers”, “wage workers”, and “co-operative members”. Classical economists note that in developing economies with an abundant labor force, there should be a gradual transition from a large proportion of own-account workers with low labor productivity to the share of wage workers with higher labor productivity43. According to this point of view, Viet Nam's labor market is strong with nearly half of employed workers as wage workers (43.3%), a 10 percentage point increase compared to 200944. 43 Cambell (2013). 44 Result of the 2009 Labor force survey.
3.8 2.6 5.1 6.1 9.6
30.712.7 8.6
38.3
4.8 6.211.3 12.7
16.5
29.2
24.324.3
24.3
7.9 11.1
17.8 17.421.2
22.8
25.725.7
18.6
18.824.2
28.4 25.8
25.6
13.1
22.7 24.2
12.7
64.755.9
37.4 38.027.1
4.2 14.6 17.26.1
Leaders, managersand administratorsof sectors, levels,and organizations
Professionals Technicians andassociate
professionals
Clerks Service workers,security guards,
and market salesworkers
Skilled laborers inagriculture,
forestry, andfishery
Craftsmen andother related
workers
Plant/machineoperators and
assemblers
Elementary/simplelaborers
Poorest Poor Medium Rich Richest
3.8 2.6 5.1 6.1 9.6
30.7
12.7 8.6
38.3
4.8 6.2 11.3 12.7
16.5
29.2
24.3 24.3
24.3
7.9 11.1
17.8 17.4
21.2
22.8
25.7 25.7
18.6
18.8 24.2
28.4 25.8
25.6
13.1
22.7 24.2
12.7
64.7 55.9
37.4 38.0 27.1
4.2 14.6 17.2
6.1
0
10
20
30
40
50
60
70
80
90
100
Poorest Poor Medium Rich Richest
Leaders, managersand administratorsof sectors, levels,and organizations
Professionals Technicians andassociate
professionals
Clerks Service workers,security guards,
and market salesworkers
Skilled laborers in agriculture,forestry, and
fishery
Craftsmen andother related
workers
Plant/machineoperators and
assemblers
Elementary/simple
laborers
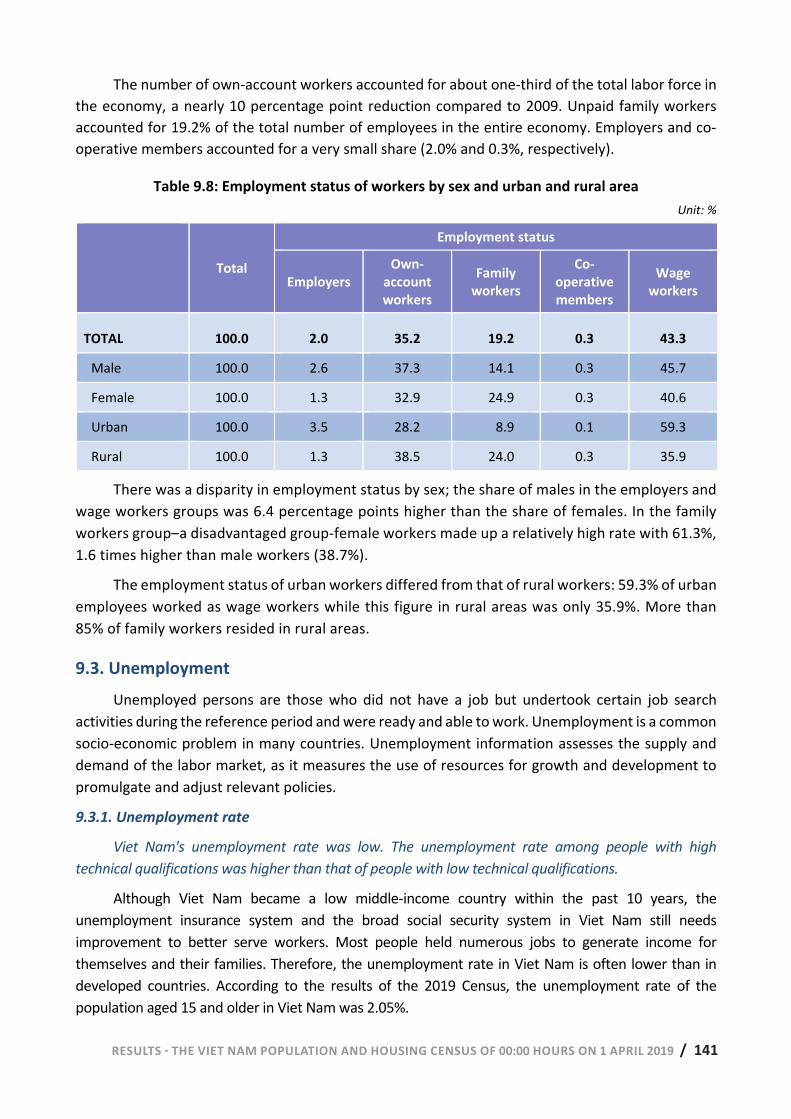
RESULTS - THE VIET NAM POPULATION AND HOUSING CENSUS OF 00:00 HOURS ON 1 APRIL 2019 / 141 RESULTS - THE VIET NAM POPULATION AND HOUSING CENSUS OF 00:00 HOURS ON 1 APRIL 2019 | 137
The number of own-account workers accounted for about one-third of the total labor force in the economy, a nearly 10 percentage point reduction compared to 2009. Unpaid family workers accounted for 19.2% of the total number of employees in the entire economy. Employers and co-operative members accounted for a very small share (2.0% and 0.3%, respectively).
Table 9.8: Employment status of workers by sex and urban and rural area Unit: %
Total
Employment status
Employers Own-
account workers
Family workers
Co-operative members
Wage workers
TOTAL 100.0 2.0 35.2 19.2 0.3 43.3
Male 100.0 2.6 37.3 14.1 0.3 45.7
Female 100.0 1.3 32.9 24.9 0.3 40.6
Urban 100.0 3.5 28.2 8.9 0.1 59.3
Rural 100.0 1.3 38.5 24.0 0.3 35.9
There was a disparity in employment status by sex; the share of males in the employers and wage workers groups was 6.4 percentage points higher than the share of females. In the family workers group–a disadvantaged group-female workers made up a relatively high rate with 61.3%, 1.6 times higher than male workers (38.7%).
The employment status of urban workers differed from that of rural workers: 59.3% of urban employees worked as wage workers while this figure in rural areas was only 35.9%. More than 85% of family workers resided in rural areas.
9.3. Unemployment Unemployed persons are those who did not have a job but undertook certain job search
activities during the reference period and were ready and able to work. Unemployment is a common socio-economic problem in many countries. Unemployment information assesses the supply and demand of the labor market, as it measures the use of resources for growth and development to promulgate and adjust relevant policies.
9.3.1. Unemployment rate
Viet Nam's unemployment rate was low. The unemployment rate among people with high technical qualifications was higher than that of people with low technical qualifications.
Although Viet Nam became a low middle-income country within the past 10 years, the unemployment insurance system and the broad social security system in Viet Nam still needs improvement to better serve workers. Most people held numerous jobs to generate income for themselves and their families. Therefore, the unemployment rate in Viet Nam is often lower than in developed countries. According to the results of the 2019 Census, the unemployment rate of the population aged 15 and older in Viet Nam was 2.05%.
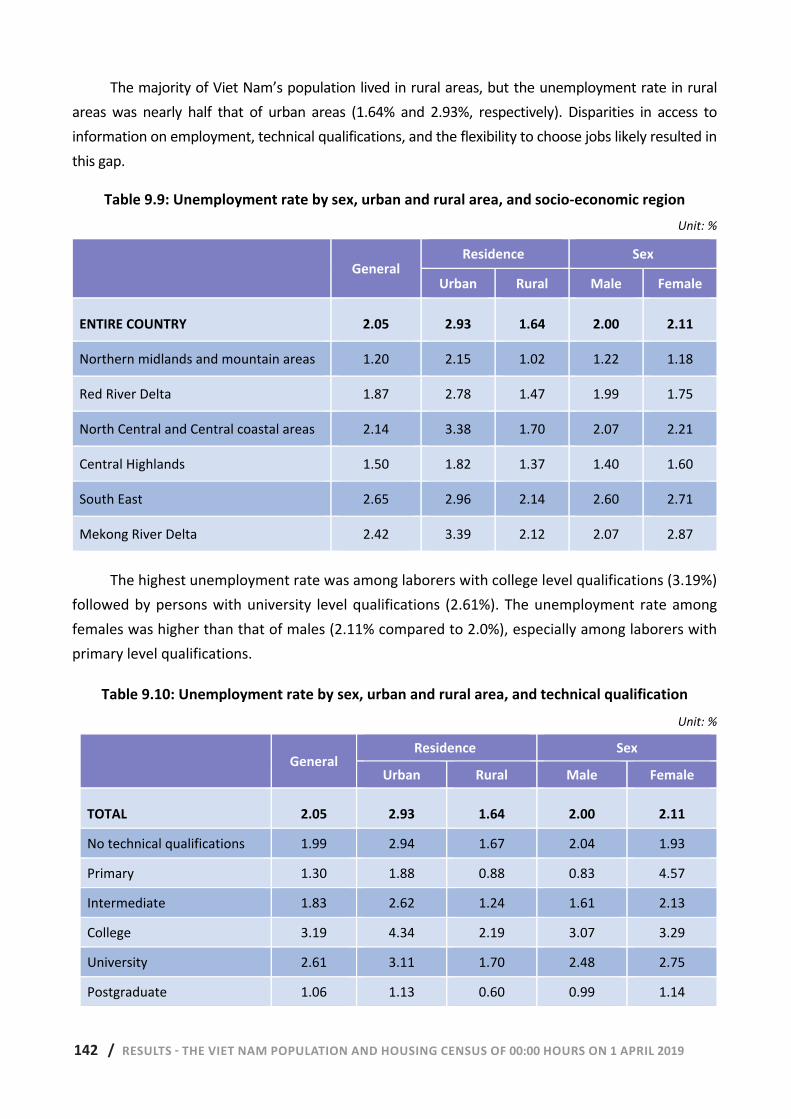
142 / RESULTS - THE VIET NAM POPULATION AND HOUSING CENSUS OF 00:00 HOURS ON 1 APRIL 2019 138 | RESULTS - THE VIET NAM POPULATION AND HOUSING CENSUS OF 00:00 HOURS ON 1 APRIL 2019
The majority of Viet Nam’s population lived in rural areas, but the unemployment rate in rural areas was nearly half that of urban areas (1.64% and 2.93%, respectively). Disparities in access to information on employment, technical qualifications, and the flexibility to choose jobs likely resulted in this gap.
Table 9.9: Unemployment rate by sex, urban and rural area, and socio-economic region Unit: %
General Residence Sex
Urban Rural Male Female
ENTIRE COUNTRY 2.05 2.93 1.64 2.00 2.11
Northern midlands and mountain areas 1.20 2.15 1.02 1.22 1.18
Red River Delta 1.87 2.78 1.47 1.99 1.75
North Central and Central coastal areas 2.14 3.38 1.70 2.07 2.21
Central Highlands 1.50 1.82 1.37 1.40 1.60
South East 2.65 2.96 2.14 2.60 2.71
Mekong River Delta 2.42 3.39 2.12 2.07 2.87
The highest unemployment rate was among laborers with college level qualifications (3.19%) followed by persons with university level qualifications (2.61%). The unemployment rate among females was higher than that of males (2.11% compared to 2.0%), especially among laborers with primary level qualifications.
Table 9.10: Unemployment rate by sex, urban and rural area, and technical qualification Unit: %
General Residence Sex
Urban Rural Male Female
TOTAL 2.05 2.93 1.64 2.00 2.11
No technical qualifications 1.99 2.94 1.67 2.04 1.93
Primary 1.30 1.88 0.88 0.83 4.57
Intermediate 1.83 2.62 1.24 1.61 2.13
College 3.19 4.34 2.19 3.07 3.29
University 2.61 3.11 1.70 2.48 2.75
Postgraduate 1.06 1.13 0.60 0.99 1.14
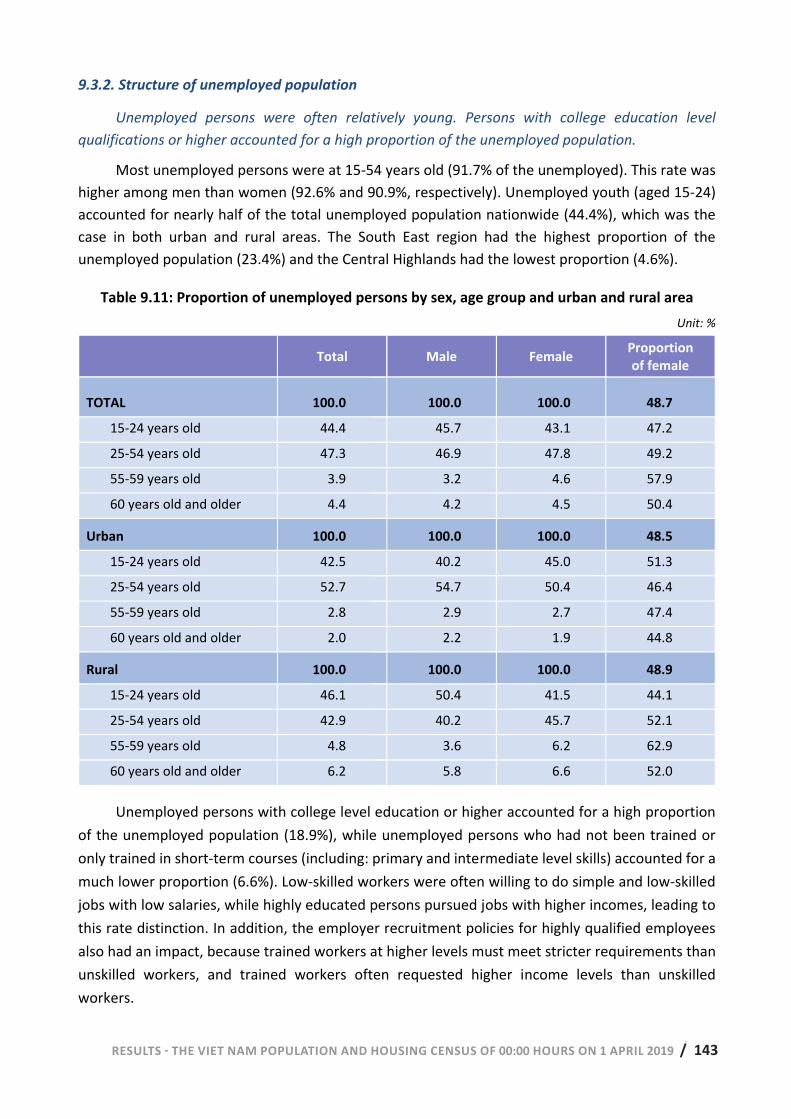
RESULTS - THE VIET NAM POPULATION AND HOUSING CENSUS OF 00:00 HOURS ON 1 APRIL 2019 / 143 RESULTS - THE VIET NAM POPULATION AND HOUSING CENSUS OF 00:00 HOURS ON 1 APRIL 2019 | 139
9.3.2. Structure of unemployed population
Unemployed persons were often relatively young. Persons with college education level qualifications or higher accounted for a high proportion of the unemployed population.
Most unemployed persons were at 15-54 years old (91.7% of the unemployed). This rate was higher among men than women (92.6% and 90.9%, respectively). Unemployed youth (aged 15-24) accounted for nearly half of the total unemployed population nationwide (44.4%), which was the case in both urban and rural areas. The South East region had the highest proportion of the unemployed population (23.4%) and the Central Highlands had the lowest proportion (4.6%).
Table 9.11: Proportion of unemployed persons by sex, age group and urban and rural area Unit: %
Total Male Female Proportion of female
TOTAL 100.0 100.0 100.0 48.7
15-24 years old 44.4 45.7 43.1 47.2
25-54 years old 47.3 46.9 47.8 49.2
55-59 years old 3.9 3.2 4.6 57.9
60 years old and older 4.4 4.2 4.5 50.4
Urban 100.0 100.0 100.0 48.5
15-24 years old 42.5 40.2 45.0 51.3
25-54 years old 52.7 54.7 50.4 46.4
55-59 years old 2.8 2.9 2.7 47.4
60 years old and older 2.0 2.2 1.9 44.8
Rural 100.0 100.0 100.0 48.9
15-24 years old 46.1 50.4 41.5 44.1
25-54 years old 42.9 40.2 45.7 52.1
55-59 years old 4.8 3.6 6.2 62.9
60 years old and older 6.2 5.8 6.6 52.0
Unemployed persons with college level education or higher accounted for a high proportion of the unemployed population (18.9%), while unemployed persons who had not been trained or only trained in short-term courses (including: primary and intermediate level skills) accounted for a much lower proportion (6.6%). Low-skilled workers were often willing to do simple and low-skilled jobs with low salaries, while highly educated persons pursued jobs with higher incomes, leading to this rate distinction. In addition, the employer recruitment policies for highly qualified employees also had an impact, because trained workers at higher levels must meet stricter requirements than unskilled workers, and trained workers often requested higher income levels than unskilled workers.
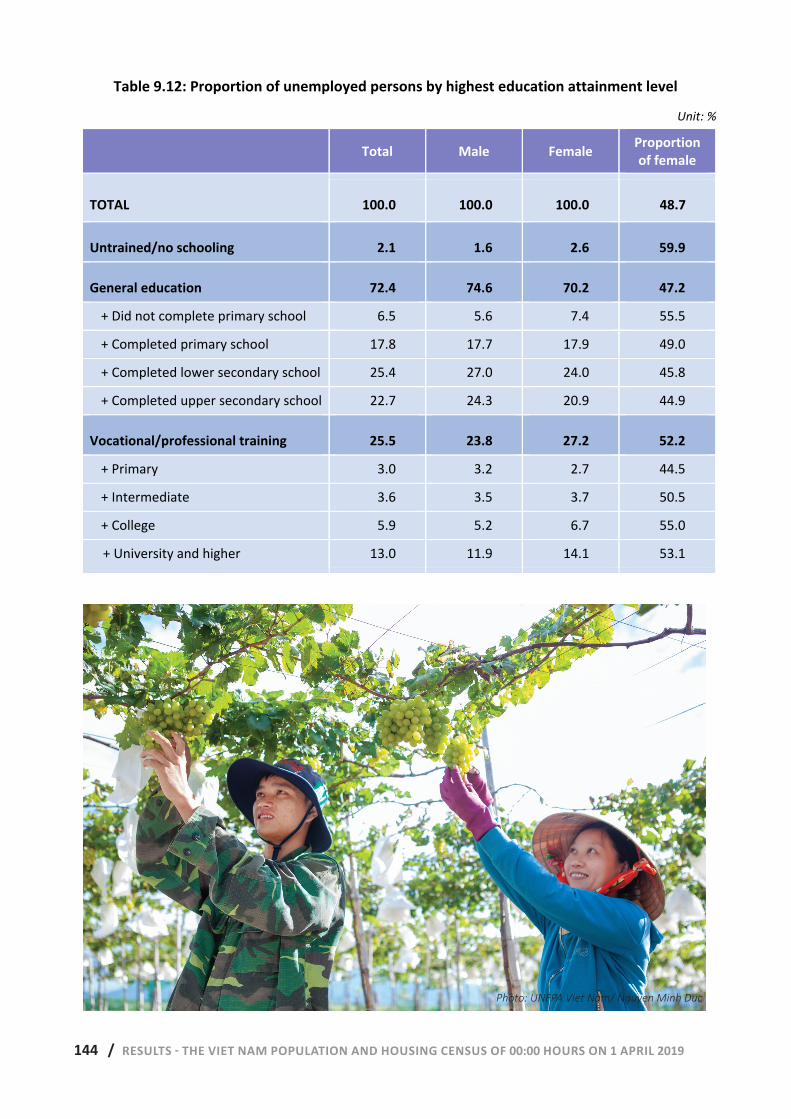
144 / RESULTS - THE VIET NAM POPULATION AND HOUSING CENSUS OF 00:00 HOURS ON 1 APRIL 2019 140 | RESULTS - THE VIET NAM POPULATION AND HOUSING CENSUS OF 00:00 HOURS ON 1 APRIL 2019
Table 9.12: Proportion of unemployed persons by highest education attainment level
Unit: %
Total Male Female Proportion of female
TOTAL 100.0 100.0 100.0 48.7
Untrained/no schooling 2.1 1.6 2.6 59.9
General education 72.4 74.6 70.2 47.2
+ Did not complete primary school 6.5 5.6 7.4 55.5
+ Completed primary school 17.8 17.7 17.9 49.0
+ Completed lower secondary school 25.4 27.0 24.0 45.8
+ Completed upper secondary school 22.7 24.3 20.9 44.9
Vocational/professional training 25.5 23.8 27.2 52.2
+ Primary 3.0 3.2 2.7 44.5
+ Intermediate 3.6 3.5 3.7 50.5
+ College 5.9 5.2 6.7 55.0
+ University and higher 13.0 11.9 14.1 53.1
Photo: UNFPA Viet Nam/ Nguyen Minh Duc
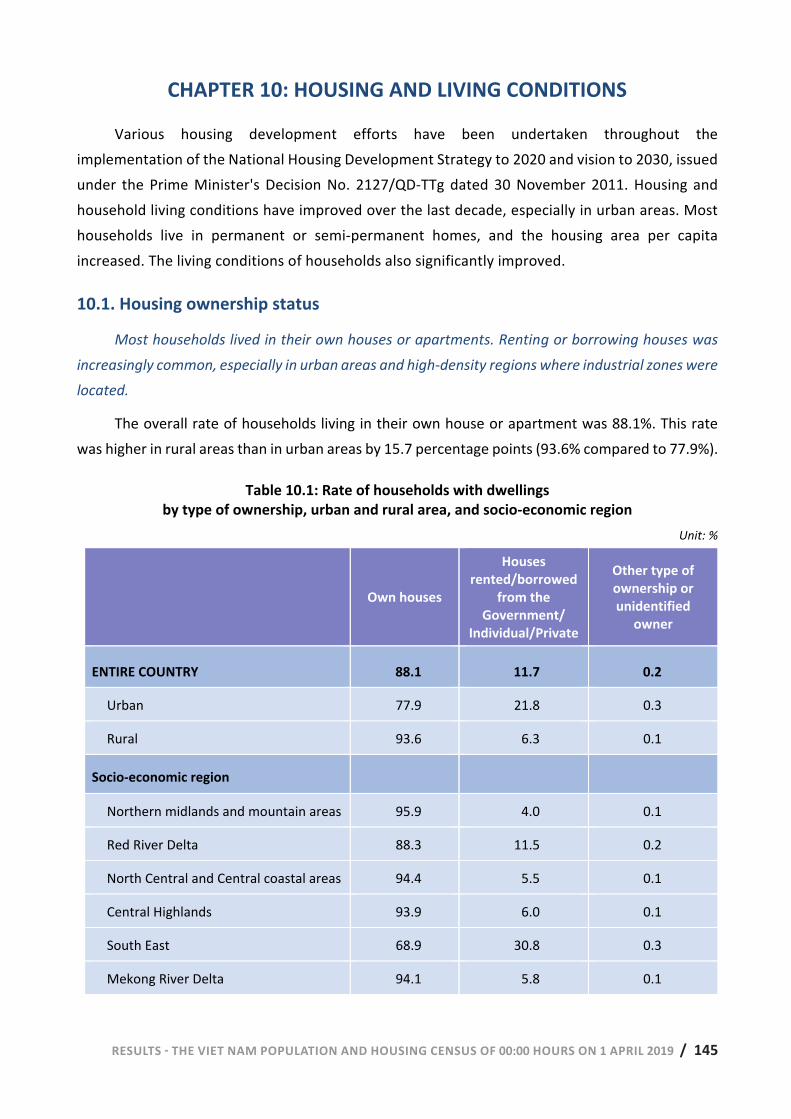
RESULTS - THE VIET NAM POPULATION AND HOUSING CENSUS OF 00:00 HOURS ON 1 APRIL 2019 / 145 RESULTS - THE VIET NAM POPULATION AND HOUSING CENSUS OF 00:00 HOURS ON 1 APRIL 2019 | 141
CHAPTER 10: HOUSING AND LIVING CONDITIONS
Various housing development efforts have been undertaken throughout the implementation of the National Housing Development Strategy to 2020 and vision to 2030, issued under the Prime Minister's Decision No. 2127/QD-TTg dated 30 November 2011. Housing and household living conditions have improved over the last decade, especially in urban areas. Most households live in permanent or semi-permanent homes, and the housing area per capita increased. The living conditions of households also significantly improved.
10.1. Housing ownership status
Most households lived in their own houses or apartments. Renting or borrowing houses was increasingly common, especially in urban areas and high-density regions where industrial zones were located.
The overall rate of households living in their own house or apartment was 88.1%. This rate was higher in rural areas than in urban areas by 15.7 percentage points (93.6% compared to 77.9%).
Table 10.1: Rate of households with dwellings by type of ownership, urban and rural area, and socio-economic region
Unit: %
Own houses
Houses rented/borrowed
from the Government/
Individual/Private
Other type of ownership or unidentified
owner
ENTIRE COUNTRY 88.1 11.7 0.2
Urban 77.9 21.8 0.3
Rural 93.6 6.3 0.1
Socio-economic region
Northern midlands and mountain areas 95.9 4.0 0.1
Red River Delta 88.3 11.5 0.2
North Central and Central coastal areas 94.4 5.5 0.1
Central Highlands 93.9 6.0 0.1
South East 68.9 30.8 0.3
Mekong River Delta 94.1 5.8 0.1
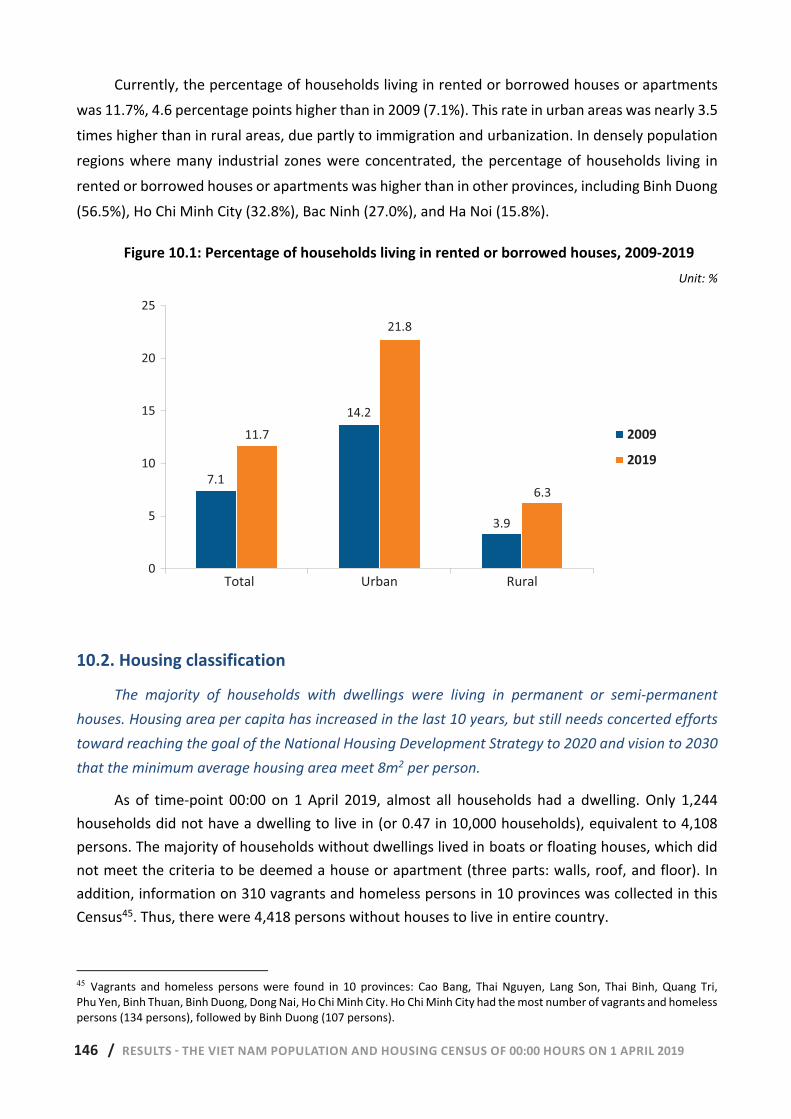
146 / RESULTS - THE VIET NAM POPULATION AND HOUSING CENSUS OF 00:00 HOURS ON 1 APRIL 2019 142 | RESULTS - THE VIET NAM POPULATION AND HOUSING CENSUS OF 00:00 HOURS ON 1 APRIL 2019
Currently, the percentage of households living in rented or borrowed houses or apartments was 11.7%, 4.6 percentage points higher than in 2009 (7.1%). This rate in urban areas was nearly 3.5 times higher than in rural areas, due partly to immigration and urbanization. In densely population regions where many industrial zones were concentrated, the percentage of households living in rented or borrowed houses or apartments was higher than in other provinces, including Binh Duong (56.5%), Ho Chi Minh City (32.8%), Bac Ninh (27.0%), and Ha Noi (15.8%).
Figure 10.1: Percentage of households living in rented or borrowed houses, 2009-2019 Unit: %
10.2. Housing classification
The majority of households with dwellings were living in permanent or semi-permanent houses. Housing area per capita has increased in the last 10 years, but still needs concerted efforts toward reaching the goal of the National Housing Development Strategy to 2020 and vision to 2030 that the minimum average housing area meet 8m2 per person.
As of time-point 00:00 on 1 April 2019, almost all households had a dwelling. Only 1,244 households did not have a dwelling to live in (or 0.47 in 10,000 households), equivalent to 4,108 persons. The majority of households without dwellings lived in boats or floating houses, which did not meet the criteria to be deemed a house or apartment (three parts: walls, roof, and floor). In addition, information on 310 vagrants and homeless persons in 10 provinces was collected in this Census45. Thus, there were 4,418 persons without houses to live in entire country.
45 Vagrants and homeless persons were found in 10 provinces: Cao Bang, Thai Nguyen, Lang Son, Thai Binh, Quang Tri, Phu Yen, Binh Thuan, Binh Duong, Dong Nai, Ho Chi Minh City. Ho Chi Minh City had the most number of vagrants and homeless persons (134 persons), followed by Binh Duong (107 persons).
7.1
14.2
3.9
11.7
21.8
6.3
0
5
10
15
20
25
Entire country Urban Rural
2009 2019
7.1
14.2
3.9
11.7
21.8
6.3
0
5
10
15
20
25
Total Urban Rural
2009
2019
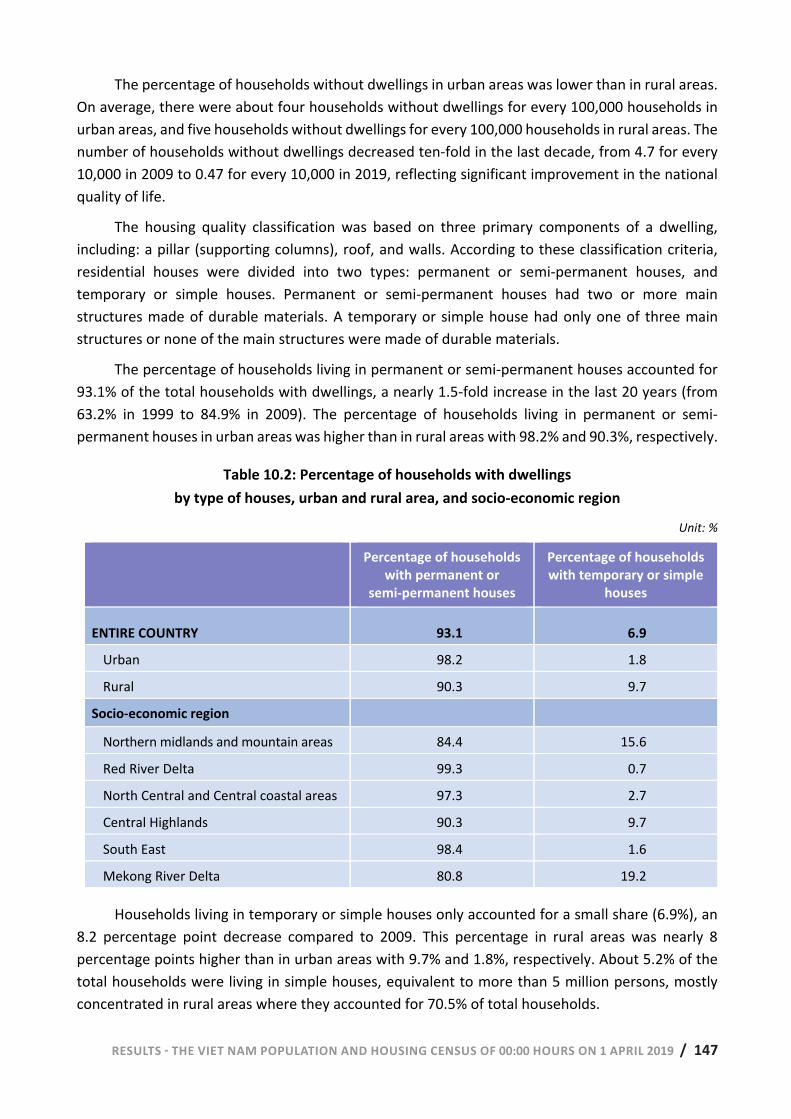
RESULTS - THE VIET NAM POPULATION AND HOUSING CENSUS OF 00:00 HOURS ON 1 APRIL 2019 / 147 RESULTS - THE VIET NAM POPULATION AND HOUSING CENSUS OF 00:00 HOURS ON 1 APRIL 2019 | 143
The percentage of households without dwellings in urban areas was lower than in rural areas. On average, there were about four households without dwellings for every 100,000 households in urban areas, and five households without dwellings for every 100,000 households in rural areas. The number of households without dwellings decreased ten-fold in the last decade, from 4.7 for every 10,000 in 2009 to 0.47 for every 10,000 in 2019, reflecting significant improvement in the national quality of life.
The housing quality classification was based on three primary components of a dwelling, including: a pillar (supporting columns), roof, and walls. According to these classification criteria, residential houses were divided into two types: permanent or semi-permanent houses, and temporary or simple houses. Permanent or semi-permanent houses had two or more main structures made of durable materials. A temporary or simple house had only one of three main structures or none of the main structures were made of durable materials.
The percentage of households living in permanent or semi-permanent houses accounted for 93.1% of the total households with dwellings, a nearly 1.5-fold increase in the last 20 years (from 63.2% in 1999 to 84.9% in 2009). The percentage of households living in permanent or semi-permanent houses in urban areas was higher than in rural areas with 98.2% and 90.3%, respectively.
Table 10.2: Percentage of households with dwellings by type of houses, urban and rural area, and socio-economic region
Unit: %
Percentage of households with permanent or
semi-permanent houses
Percentage of households with temporary or simple
houses
ENTIRE COUNTRY 93.1 6.9 Urban 98.2 1.8
Rural 90.3 9.7
Socio-economic region
Northern midlands and mountain areas 84.4 15.6
Red River Delta 99.3 0.7
North Central and Central coastal areas 97.3 2.7
Central Highlands 90.3 9.7
South East 98.4 1.6
Mekong River Delta 80.8 19.2
Households living in temporary or simple houses only accounted for a small share (6.9%), an 8.2 percentage point decrease compared to 2009. This percentage in rural areas was nearly 8 percentage points higher than in urban areas with 9.7% and 1.8%, respectively. About 5.2% of the total households were living in simple houses, equivalent to more than 5 million persons, mostly concentrated in rural areas where they accounted for 70.5% of total households.
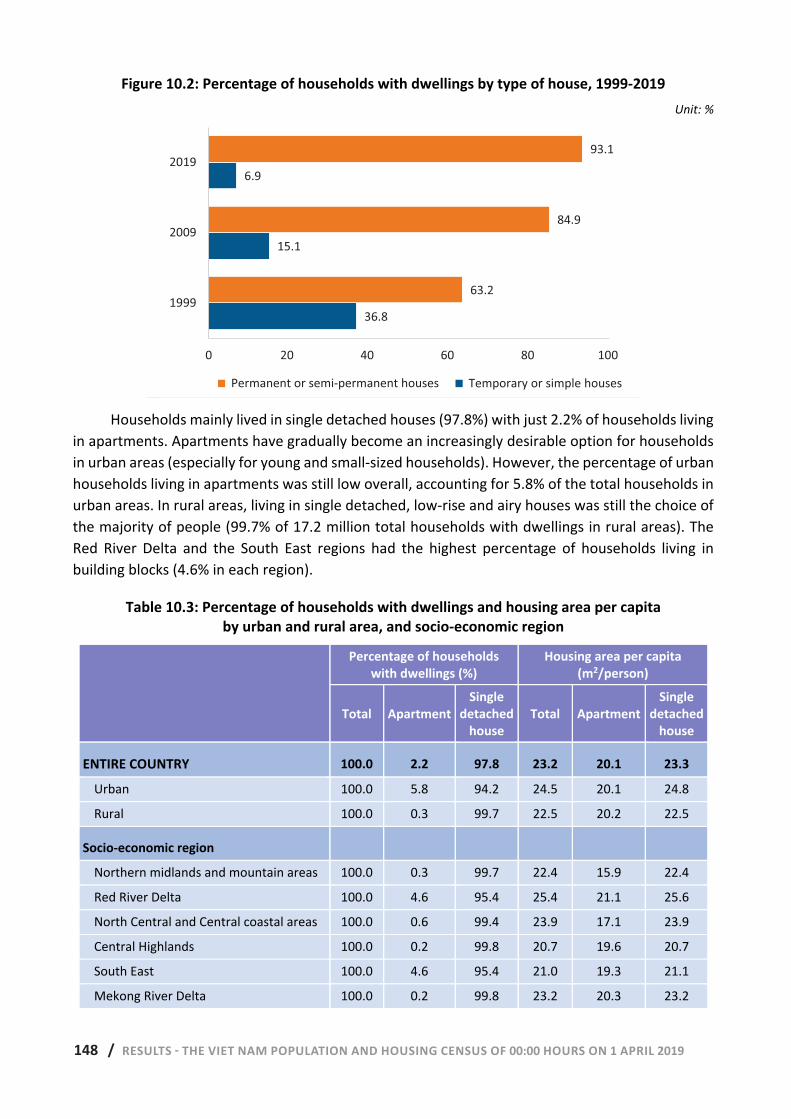
148 / RESULTS - THE VIET NAM POPULATION AND HOUSING CENSUS OF 00:00 HOURS ON 1 APRIL 2019 144 | RESULTS - THE VIET NAM POPULATION AND HOUSING CENSUS OF 00:00 HOURS ON 1 APRIL 2019
Figure 10.2: Percentage of households with dwellings by type of house, 1999-2019 Unit: %
Households mainly lived in single detached houses (97.8%) with just 2.2% of households living
in apartments. Apartments have gradually become an increasingly desirable option for households in urban areas (especially for young and small-sized households). However, the percentage of urban households living in apartments was still low overall, accounting for 5.8% of the total households in urban areas. In rural areas, living in single detached, low-rise and airy houses was still the choice of the majority of people (99.7% of 17.2 million total households with dwellings in rural areas). The Red River Delta and the South East regions had the highest percentage of households living in building blocks (4.6% in each region).
Table 10.3: Percentage of households with dwellings and housing area per capita by urban and rural area, and socio-economic region
Percentage of households with dwellings (%)
Housing area per capita (m2/person)
Total ApartmentSingle
detached house
Total Apartment Single
detached house
ENTIRE COUNTRY 100.0 2.2 97.8 23.2 20.1 23.3
Urban 100.0 5.8 94.2 24.5 20.1 24.8
Rural 100.0 0.3 99.7 22.5 20.2 22.5
Socio-economic region
Northern midlands and mountain areas 100.0 0.3 99.7 22.4 15.9 22.4
Red River Delta 100.0 4.6 95.4 25.4 21.1 25.6
North Central and Central coastal areas 100.0 0.6 99.4 23.9 17.1 23.9
Central Highlands 100.0 0.2 99.8 20.7 19.6 20.7
South East 100.0 4.6 95.4 21.0 19.3 21.1
Mekong River Delta 100.0 0.2 99.8 23.2 20.3 23.2
36.8
15.1
6.9
63.2
84.9
93.1
0 20 40 60 80 100
1999
2009
2019
Permanent or semi-permanent houses Temporary or simple houses
36.8
15.1
6.9
63.2
84.9
93.1
0 20 40 60 80 100
1999
2009
2019
Permanent or semi-permanent houses Temporary or simple houses
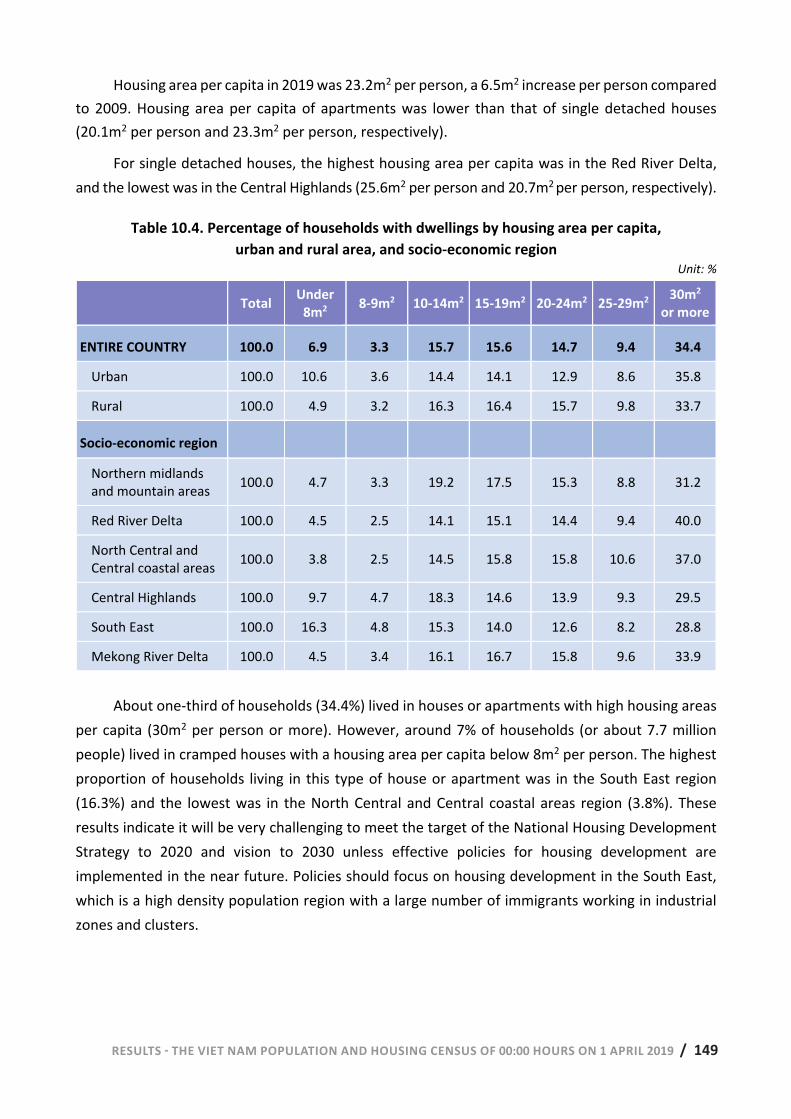
RESULTS - THE VIET NAM POPULATION AND HOUSING CENSUS OF 00:00 HOURS ON 1 APRIL 2019 / 149 RESULTS - THE VIET NAM POPULATION AND HOUSING CENSUS OF 00:00 HOURS ON 1 APRIL 2019 | 145
Housing area per capita in 2019 was 23.2m2 per person, a 6.5m2 increase per person compared to 2009. Housing area per capita of apartments was lower than that of single detached houses (20.1m2 per person and 23.3m2 per person, respectively).
For single detached houses, the highest housing area per capita was in the Red River Delta, and the lowest was in the Central Highlands (25.6m2 per person and 20.7m2 per person, respectively).
Table 10.4. Percentage of households with dwellings by housing area per capita, urban and rural area, and socio-economic region
Unit: %
Total Under8m2 8-9m2 10-14m2 15-19m2 20-24m2 25-29m2 30m2
or more
ENTIRE COUNTRY 100.0 6.9 3.3 15.7 15.6 14.7 9.4 34.4
Urban 100.0 10.6 3.6 14.4 14.1 12.9 8.6 35.8
Rural 100.0 4.9 3.2 16.3 16.4 15.7 9.8 33.7
Socio-economic region
Northern midlands and mountain areas 100.0 4.7 3.3 19.2 17.5 15.3 8.8 31.2
Red River Delta 100.0 4.5 2.5 14.1 15.1 14.4 9.4 40.0
North Central and Central coastal areas 100.0 3.8 2.5 14.5 15.8 15.8 10.6 37.0
Central Highlands 100.0 9.7 4.7 18.3 14.6 13.9 9.3 29.5
South East 100.0 16.3 4.8 15.3 14.0 12.6 8.2 28.8
Mekong River Delta 100.0 4.5 3.4 16.1 16.7 15.8 9.6 33.9
About one-third of households (34.4%) lived in houses or apartments with high housing areas per capita (30m2 per person or more). However, around 7% of households (or about 7.7 million people) lived in cramped houses with a housing area per capita below 8m2 per person. The highest proportion of households living in this type of house or apartment was in the South East region (16.3%) and the lowest was in the North Central and Central coastal areas region (3.8%). These results indicate it will be very challenging to meet the target of the National Housing Development Strategy to 2020 and vision to 2030 unless effective policies for housing development are implemented in the near future. Policies should focus on housing development in the South East, which is a high density population region with a large number of immigrants working in industrial zones and clusters.
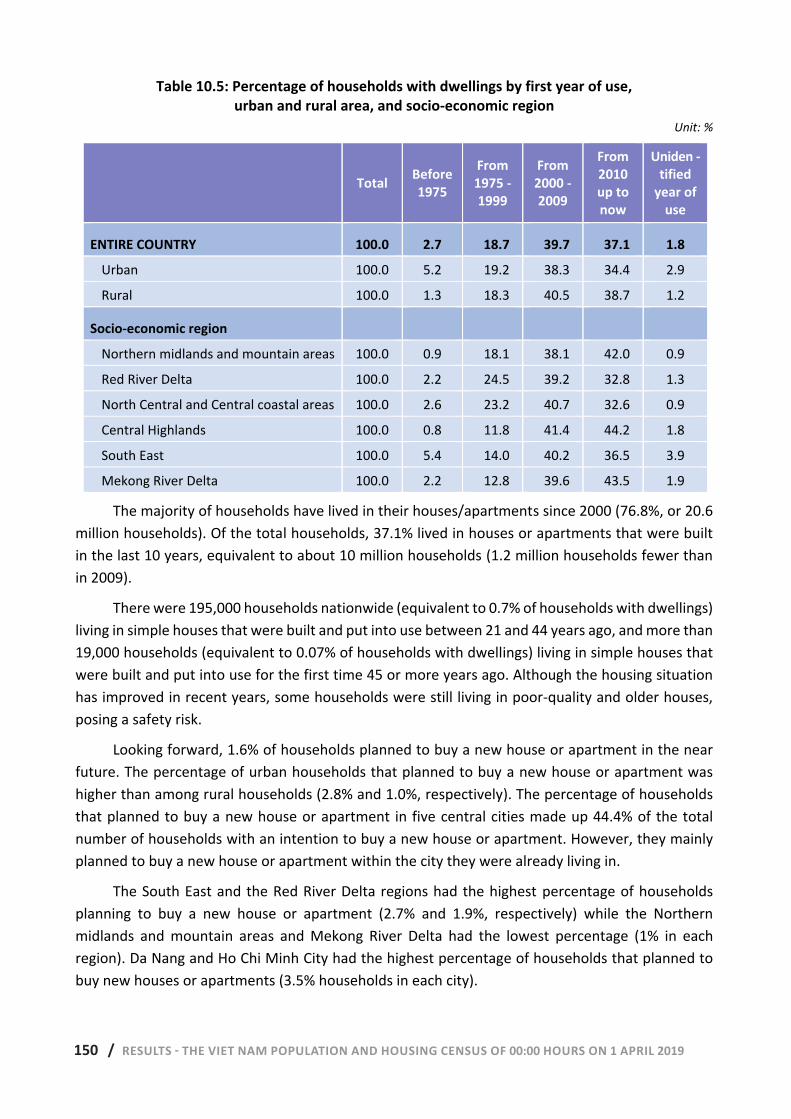
150 / RESULTS - THE VIET NAM POPULATION AND HOUSING CENSUS OF 00:00 HOURS ON 1 APRIL 2019 146 | RESULTS - THE VIET NAM POPULATION AND HOUSING CENSUS OF 00:00 HOURS ON 1 APRIL 2019
Table 10.5: Percentage of households with dwellings by first year of use, urban and rural area, and socio-economic region
Unit: %
Total Before 1975
From 1975 -1999
From 2000 -2009
From 2010 up to now
Uniden - tified
year of use
ENTIRE COUNTRY 100.0 2.7 18.7 39.7 37.1 1.8
Urban 100.0 5.2 19.2 38.3 34.4 2.9
Rural 100.0 1.3 18.3 40.5 38.7 1.2
Socio-economic region
Northern midlands and mountain areas 100.0 0.9 18.1 38.1 42.0 0.9
Red River Delta 100.0 2.2 24.5 39.2 32.8 1.3
North Central and Central coastal areas 100.0 2.6 23.2 40.7 32.6 0.9
Central Highlands 100.0 0.8 11.8 41.4 44.2 1.8
South East 100.0 5.4 14.0 40.2 36.5 3.9
Mekong River Delta 100.0 2.2 12.8 39.6 43.5 1.9
The majority of households have lived in their houses/apartments since 2000 (76.8%, or 20.6 million households). Of the total households, 37.1% lived in houses or apartments that were built in the last 10 years, equivalent to about 10 million households (1.2 million households fewer than in 2009).
There were 195,000 households nationwide (equivalent to 0.7% of households with dwellings) living in simple houses that were built and put into use between 21 and 44 years ago, and more than 19,000 households (equivalent to 0.07% of households with dwellings) living in simple houses that were built and put into use for the first time 45 or more years ago. Although the housing situation has improved in recent years, some households were still living in poor-quality and older houses, posing a safety risk.
Looking forward, 1.6% of households planned to buy a new house or apartment in the near future. The percentage of urban households that planned to buy a new house or apartment was higher than among rural households (2.8% and 1.0%, respectively). The percentage of households that planned to buy a new house or apartment in five central cities made up 44.4% of the total number of households with an intention to buy a new house or apartment. However, they mainly planned to buy a new house or apartment within the city they were already living in.
The South East and the Red River Delta regions had the highest percentage of households planning to buy a new house or apartment (2.7% and 1.9%, respectively) while the Northern midlands and mountain areas and Mekong River Delta had the lowest percentage (1% in each region). Da Nang and Ho Chi Minh City had the highest percentage of households that planned to buy new houses or apartments (3.5% households in each city).
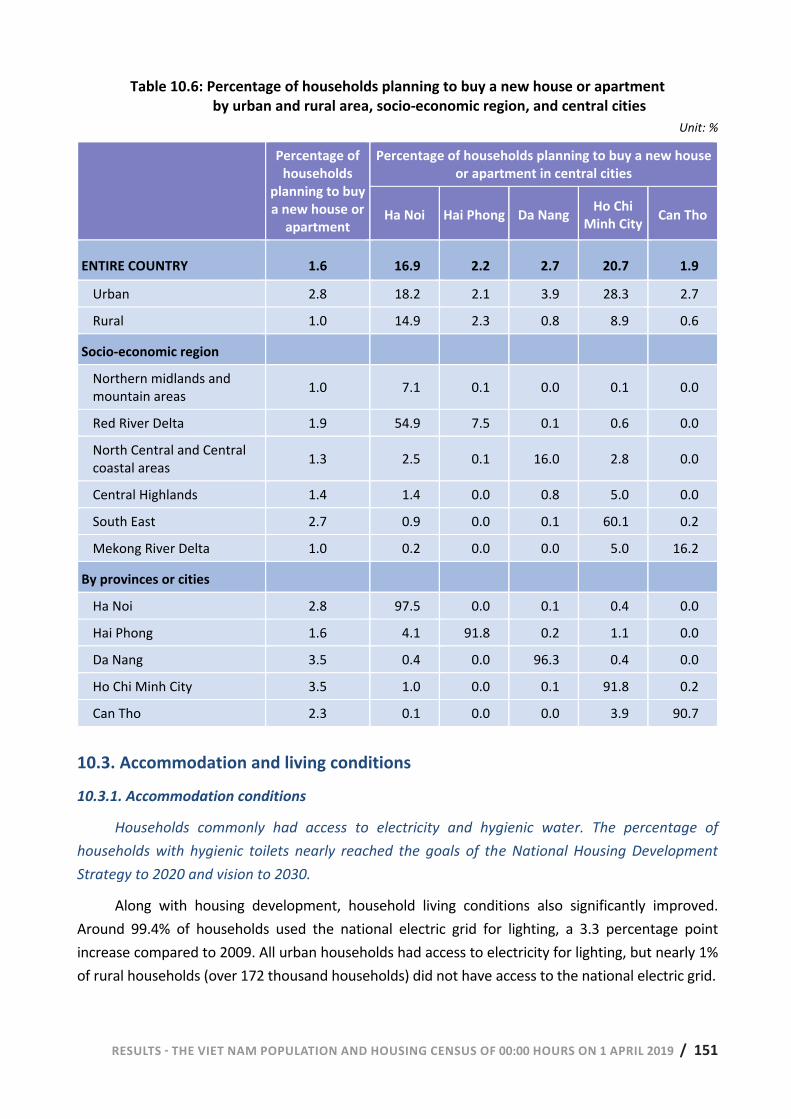
RESULTS - THE VIET NAM POPULATION AND HOUSING CENSUS OF 00:00 HOURS ON 1 APRIL 2019 / 151 RESULTS - THE VIET NAM POPULATION AND HOUSING CENSUS OF 00:00 HOURS ON 1 APRIL 2019 | 147
Table 10.6: Percentage of households planning to buy a new house or apartment by urban and rural area, socio-economic region, and central cities
Unit: %
Percentage of households
planning to buy a new house or
apartment
Percentage of households planning to buy a new house or apartment in central cities
Ha Noi Hai Phong Da Nang Ho Chi Minh City Can Tho
ENTIRE COUNTRY 1.6 16.9 2.2 2.7 20.7 1.9
Urban 2.8 18.2 2.1 3.9 28.3 2.7
Rural 1.0 14.9 2.3 0.8 8.9 0.6
Socio-economic region
Northern midlands and mountain areas 1.0 7.1 0.1 0.0 0.1 0.0
Red River Delta 1.9 54.9 7.5 0.1 0.6 0.0
North Central and Central coastal areas 1.3 2.5 0.1 16.0 2.8 0.0
Central Highlands 1.4 1.4 0.0 0.8 5.0 0.0
South East 2.7 0.9 0.0 0.1 60.1 0.2
Mekong River Delta 1.0 0.2 0.0 0.0 5.0 16.2
By provinces or cities
Ha Noi 2.8 97.5 0.0 0.1 0.4 0.0
Hai Phong 1.6 4.1 91.8 0.2 1.1 0.0
Da Nang 3.5 0.4 0.0 96.3 0.4 0.0
Ho Chi Minh City 3.5 1.0 0.0 0.1 91.8 0.2
Can Tho 2.3 0.1 0.0 0.0 3.9 90.7
10.3. Accommodation and living conditions
10.3.1. Accommodation conditions
Households commonly had access to electricity and hygienic water. The percentage of households with hygienic toilets nearly reached the goals of the National Housing Development Strategy to 2020 and vision to 2030.
Along with housing development, household living conditions also significantly improved. Around 99.4% of households used the national electric grid for lighting, a 3.3 percentage point increase compared to 2009. All urban households had access to electricity for lighting, but nearly 1% of rural households (over 172 thousand households) did not have access to the national electric grid.
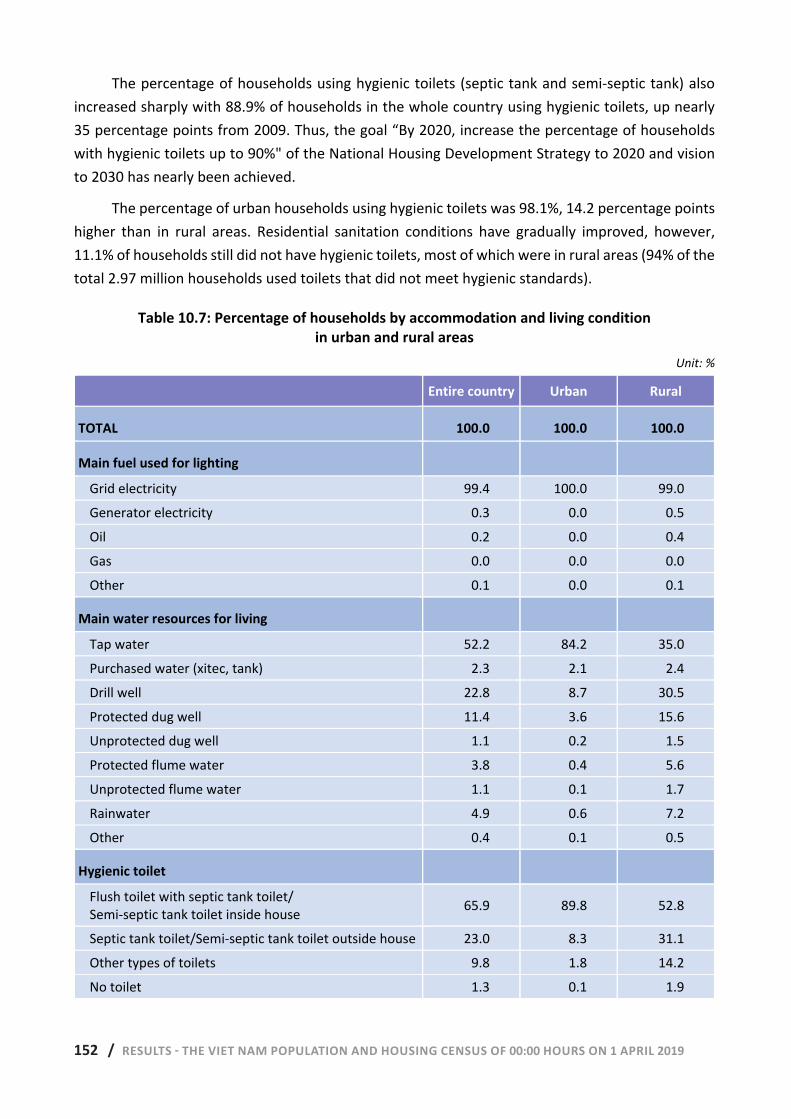
152 / RESULTS - THE VIET NAM POPULATION AND HOUSING CENSUS OF 00:00 HOURS ON 1 APRIL 2019 148 | RESULTS - THE VIET NAM POPULATION AND HOUSING CENSUS OF 00:00 HOURS ON 1 APRIL 2019
The percentage of households using hygienic toilets (septic tank and semi-septic tank) also increased sharply with 88.9% of households in the whole country using hygienic toilets, up nearly 35 percentage points from 2009. Thus, the goal “By 2020, increase the percentage of households with hygienic toilets up to 90%" of the National Housing Development Strategy to 2020 and vision to 2030 has nearly been achieved.
The percentage of urban households using hygienic toilets was 98.1%, 14.2 percentage points higher than in rural areas. Residential sanitation conditions have gradually improved, however, 11.1% of households still did not have hygienic toilets, most of which were in rural areas (94% of the total 2.97 million households used toilets that did not meet hygienic standards).
Table 10.7: Percentage of households by accommodation and living condition in urban and rural areas
Unit: %
Entire country Urban Rural
TOTAL 100.0 100.0 100.0
Main fuel used for lighting
Grid electricity 99.4 100.0 99.0 Generator electricity 0.3 0.0 0.5 Oil 0.2 0.0 0.4 Gas 0.0 0.0 0.0 Other 0.1 0.0 0.1
Main water resources for living
Tap water 52.2 84.2 35.0 Purchased water (xitec, tank) 2.3 2.1 2.4 Drill well 22.8 8.7 30.5 Protected dug well 11.4 3.6 15.6 Unprotected dug well 1.1 0.2 1.5 Protected flume water 3.8 0.4 5.6 Unprotected flume water 1.1 0.1 1.7 Rainwater 4.9 0.6 7.2 Other 0.4 0.1 0.5
Hygienic toilet
Flush toilet with septic tank toilet/ Semi-septic tank toilet inside house 65.9 89.8 52.8
Septic tank toilet/Semi-septic tank toilet outside house 23.0 8.3 31.1 Other types of toilets 9.8 1.8 14.2 No toilet 1.3 0.1 1.9
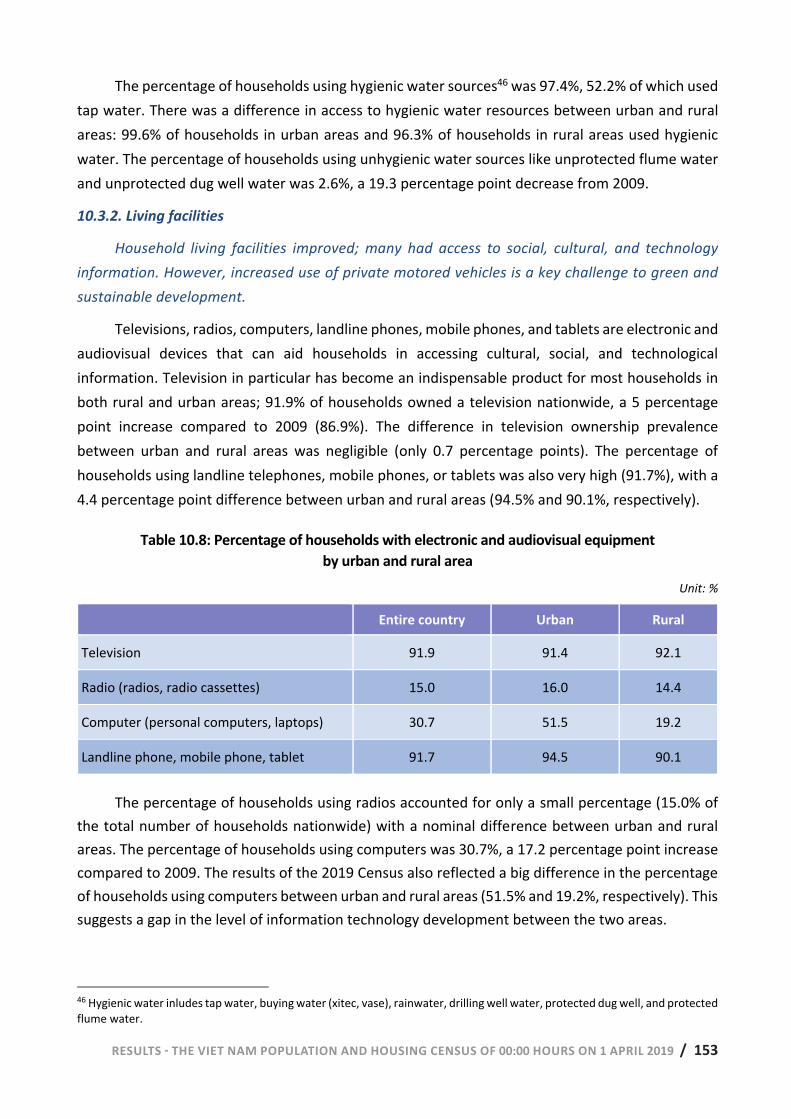
RESULTS - THE VIET NAM POPULATION AND HOUSING CENSUS OF 00:00 HOURS ON 1 APRIL 2019 / 153 RESULTS - THE VIET NAM POPULATION AND HOUSING CENSUS OF 00:00 HOURS ON 1 APRIL 2019 | 149
The percentage of households using hygienic water sources46 was 97.4%, 52.2% of which used tap water. There was a difference in access to hygienic water resources between urban and rural areas: 99.6% of households in urban areas and 96.3% of households in rural areas used hygienic water. The percentage of households using unhygienic water sources like unprotected flume water and unprotected dug well water was 2.6%, a 19.3 percentage point decrease from 2009.
10.3.2. Living facilities
Household living facilities improved; many had access to social, cultural, and technology information. However, increased use of private motored vehicles is a key challenge to green and sustainable development.
Televisions, radios, computers, landline phones, mobile phones, and tablets are electronic and audiovisual devices that can aid households in accessing cultural, social, and technological information. Television in particular has become an indispensable product for most households in both rural and urban areas; 91.9% of households owned a television nationwide, a 5 percentage point increase compared to 2009 (86.9%). The difference in television ownership prevalence between urban and rural areas was negligible (only 0.7 percentage points). The percentage of households using landline telephones, mobile phones, or tablets was also very high (91.7%), with a 4.4 percentage point difference between urban and rural areas (94.5% and 90.1%, respectively).
Table 10.8: Percentage of households with electronic and audiovisual equipment by urban and rural area
Unit: %
Entire country Urban Rural
Television 91.9 91.4 92.1
Radio (radios, radio cassettes) 15.0 16.0 14.4
Computer (personal computers, laptops) 30.7 51.5 19.2
Landline phone, mobile phone, tablet 91.7 94.5 90.1
The percentage of households using radios accounted for only a small percentage (15.0% of the total number of households nationwide) with a nominal difference between urban and rural areas. The percentage of households using computers was 30.7%, a 17.2 percentage point increase compared to 2009. The results of the 2019 Census also reflected a big difference in the percentage of households using computers between urban and rural areas (51.5% and 19.2%, respectively). This suggests a gap in the level of information technology development between the two areas.
46 Hygienic water inludes tap water, buying water (xitec, vase), rainwater, drilling well water, protected dug well, and protected flume water.
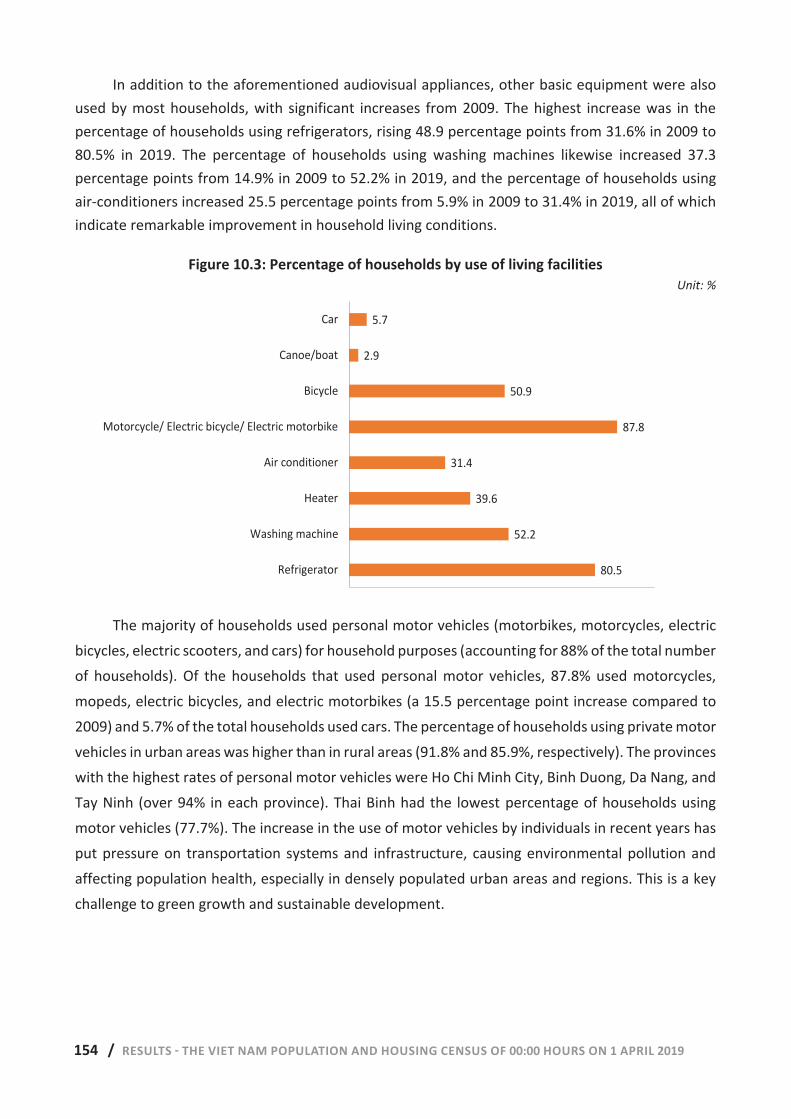
154 / RESULTS - THE VIET NAM POPULATION AND HOUSING CENSUS OF 00:00 HOURS ON 1 APRIL 2019 150 | RESULTS - THE VIET NAM POPULATION AND HOUSING CENSUS OF 00:00 HOURS ON 1 APRIL 2019
In addition to the aforementioned audiovisual appliances, other basic equipment were also used by most households, with significant increases from 2009. The highest increase was in the percentage of households using refrigerators, rising 48.9 percentage points from 31.6% in 2009 to 80.5% in 2019. The percentage of households using washing machines likewise increased 37.3 percentage points from 14.9% in 2009 to 52.2% in 2019, and the percentage of households using air-conditioners increased 25.5 percentage points from 5.9% in 2009 to 31.4% in 2019, all of which indicate remarkable improvement in household living conditions.
Figure 10.3: Percentage of households by use of living facilities Unit: %
The majority of households used personal motor vehicles (motorbikes, motorcycles, electric
bicycles, electric scooters, and cars) for household purposes (accounting for 88% of the total number of households). Of the households that used personal motor vehicles, 87.8% used motorcycles, mopeds, electric bicycles, and electric motorbikes (a 15.5 percentage point increase compared to 2009) and 5.7% of the total households used cars. The percentage of households using private motor vehicles in urban areas was higher than in rural areas (91.8% and 85.9%, respectively). The provinces with the highest rates of personal motor vehicles were Ho Chi Minh City, Binh Duong, Da Nang, and Tay Ninh (over 94% in each province). Thai Binh had the lowest percentage of households using motor vehicles (77.7%). The increase in the use of motor vehicles by individuals in recent years has put pressure on transportation systems and infrastructure, causing environmental pollution and affecting population health, especially in densely populated urban areas and regions. This is a key challenge to green growth and sustainable development.
80.5
52.2
39.6
31.4
87.8
50.9
2.9
5.7
0 10 20 30 40 50 60 70 80 90 100
Refrigerator
Washing machine
Heater
Air conditioner
Motorcycle/ Electric bicycle/ Electric motorbike
Bicycle
Canoe/boat
Car
80.5
52.2
39.6
31.4
87.8
50.9
2.9
5.7
Refrigerator
Washing machine
Heater
Air conditioner
Motorcycle/ Electric bicycle/ Electric motorbike
Bicycle
Canoe/boat
Car

RESULTS - THE VIET NAM POPULATION AND HOUSING CENSUS OF 00:00 HOURS ON 1 APRIL 2019 / 155 RESULTS - THE VIET NAM POPULATION AND HOUSING CENSUS OF 00:00 HOURS ON 1 APRIL 2019 | 151
PART III
DATA TABLES
PART IIIDATA TABLES
Photo: Figures and Events Journal

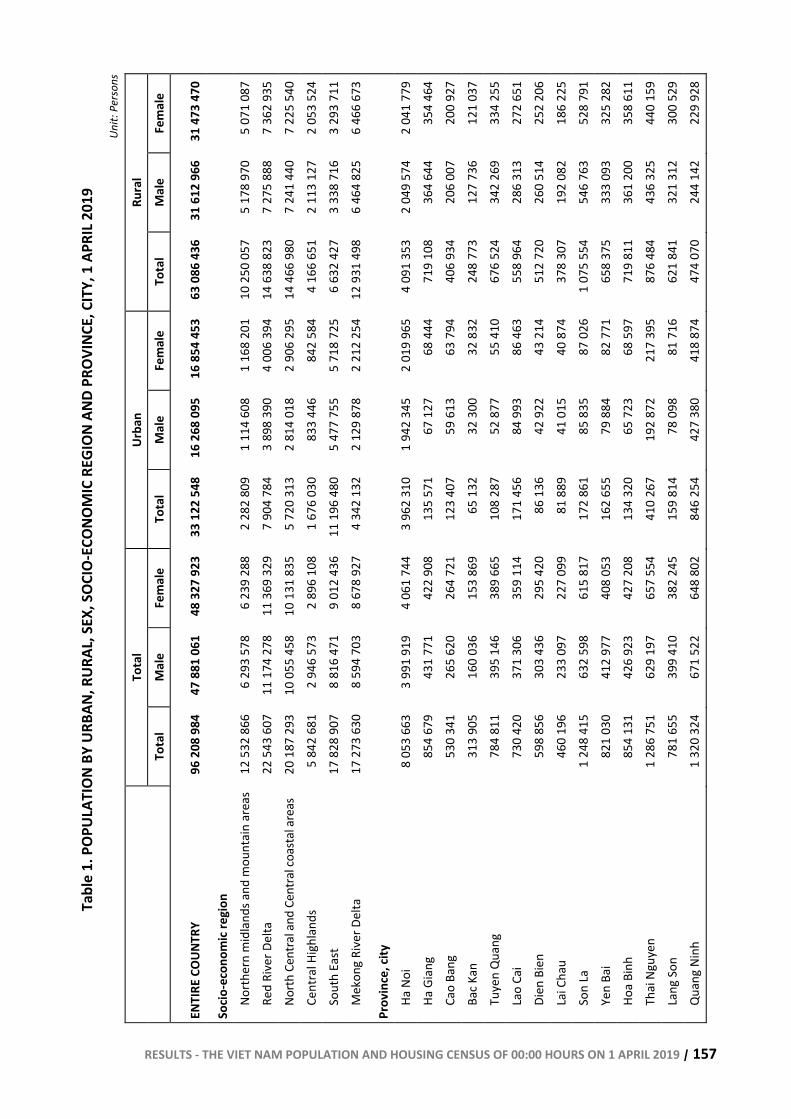
RESULTS - THE VIET NAM POPULATION AND HOUSING CENSUS OF 00:00 HOURS ON 1 APRIL 2019 | 157
Tabl
e 1.
POP
ULAT
ION
BY U
RBAN
, RUR
AL, S
EX, S
OCIO
-ECO
NOM
IC R
EGIO
N AN
D PR
OVIN
CE, C
ITY,
1 A
PRIL
2019
Unit:
Per
sons
To
tal
Urba
n Ru
ral
To
tal
Mal
e Fe
mal
e To
tal
Mal
e Fe
mal
e To
tal
Mal
e Fe
mal
e
ENTI
RE C
OUNT
RY
96 2
08 9
84
47 8
81 0
61
48 3
27 9
23
33 1
22 5
48
16 2
68 0
95
16 8
54 4
53
63 0
86 4
36
31 6
12 9
66
31 4
73 4
70
Socio
-eco
nom
ic re
gion
Nort
hern
mid
land
s and
mou
ntai
n ar
eas
12 5
32 8
66
6 29
3 57
8 6
239
288
2 28
2 80
9 1
114
608
1 16
8 20
1 10
250
057
5
178
970
5 07
1 08
7 Re
d Ri
ver D
elta
22
543
607
11
174
278
11
369
329
7
904
784
3 89
8 39
0 4
006
394
14 6
38 8
23
7 27
5 88
8 7
362
935
North
Cen
tral a
nd C
entra
l coa
stal
are
as
20 1
87 2
93
10 0
55 4
58
10 1
31 8
35
5 72
0 31
3 2
814
018
2 90
6 29
5 14
466
980
7
241
440
7 22
5 54
0 Ce
ntra
l Hig
hlan
ds
5 84
2 68
1 2
946
573
2 89
6 10
8 1
676
030
833
446
842
584
4 16
6 65
1 2
113
127
2 05
3 52
4 So
uth
East
17
828
907
8
816
471
9 01
2 43
6 11
196
480
5
477
755
5 71
8 72
5 6
632
427
3 33
8 71
6 3
293
711
Mek
ong
Rive
r Del
ta
17 2
73 6
30
8 59
4 70
3 8
678
927
4 34
2 13
2 2
129
878
2 21
2 25
4 12
931
498
6
464
825
6 46
6 67
3
Prov
ince
, city
Ha N
oi
8 05
3 66
3 3
991
919
4 06
1 74
4 3
962
310
1 94
2 34
5 2
019
965
4 09
1 35
3 2
049
574
2 04
1 77
9 Ha
Gia
ng
854
679
431
771
422
908
135
571
67 1
27
68 4
44
719
108
364
644
354
464
Cao
Bang
53
0 34
1 26
5 62
0 26
4 72
1 12
3 40
7 59
613
63
794
40
6 93
4 20
6 00
7 20
0 92
7 Ba
c Kan
31
3 90
5 16
0 03
6 15
3 86
9 65
132
32
300
32
832
24
8 77
3 12
7 73
6 12
1 03
7 Tu
yen
Qua
ng
784
811
395
146
389
665
108
287
52 8
77
55 4
10
676
524
342
269
334
255
Lao
Cai
730
420
371
306
359
114
171
456
84 9
93
86 4
63
558
964
286
313
272
651
Dien
Bie
n 59
8 85
6 30
3 43
6 29
5 42
0 86
136
42
922
43
214
51
2 72
0 26
0 51
4 25
2 20
6 La
i Cha
u 46
0 19
6 23
3 09
7 22
7 09
9 81
889
41
015
40
874
37
8 30
7 19
2 08
2 18
6 22
5 So
n La
1
248
415
632
598
615
817
172
861
85 8
35
87 0
26
1 07
5 55
4 54
6 76
3 52
8 79
1 Ye
n Ba
i 82
1 03
0 41
2 97
7 40
8 05
3 16
2 65
5 79
884
82
771
65
8 37
5 33
3 09
3 32
5 28
2 Ho
a Bi
nh
854
131
426
923
427
208
134
320
65 7
23
68 5
97
719
811
361
200
358
611
Thai
Ngu
yen
1 28
6 75
1 62
9 19
7 65
7 55
4 41
0 26
7 19
2 87
2 21
7 39
5 87
6 48
4 43
6 32
5 44
0 15
9 La
ng S
on
781
655
399
410
382
245
159
814
78 0
98
81 7
16
621
841
321
312
300
529
Qua
ng N
inh
1 32
0 32
4 67
1 52
2 64
8 80
2 84
6 25
4 42
7 38
0 41
8 87
4 47
4 07
0 24
4 14
2 22
9 92
8
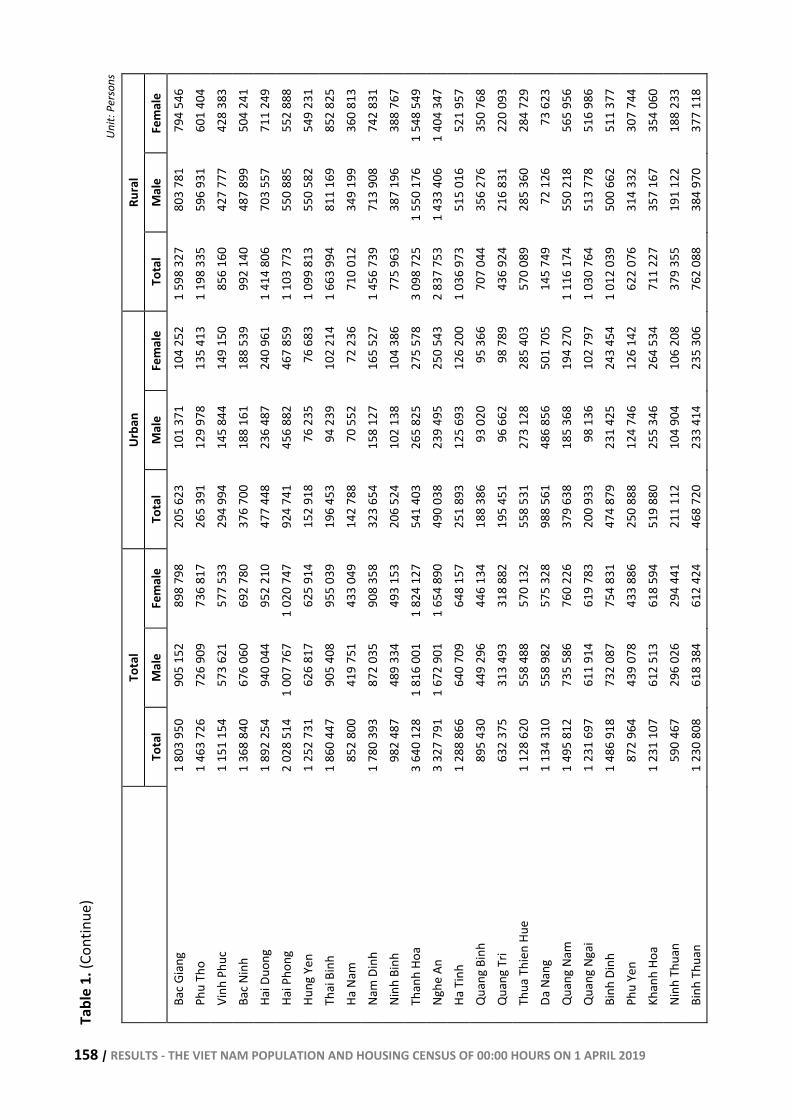
158 | RESULTS - THE VIET NAM POPULATION AND HOUSING CENSUS OF 00:00 HOURS ON 1 APRIL 2019
Tabl
e 1.
(Con
tinue
) Un
it: P
erso
ns
Tota
l Ur
ban
Rura
l
Tota
l M
ale
Fem
ale
Tota
l M
ale
Fem
ale
Tota
l M
ale
Fem
ale
Bac G
iang
1
803
950
905
152
898
798
205
623
101
371
104
252
1 59
8 32
7 80
3 78
1 79
4 54
6 Ph
u Th
o 1
463
726
726
909
736
817
265
391
129
978
135
413
1 19
8 33
5 59
6 93
1 60
1 40
4 Vi
nh P
huc
1 15
1 15
4 57
3 62
1 57
7 53
3 29
4 99
4 14
5 84
4 14
9 15
0 85
6 16
0 42
7 77
7 42
8 38
3 Ba
c Nin
h 1
368
840
676
060
692
780
376
700
188
161
188
539
992
140
487
899
504
241
Hai D
uong
1
892
254
940
044
952
210
477
448
236
487
240
961
1 41
4 80
6 70
3 55
7 71
1 24
9 Ha
i Pho
ng
2 02
8 51
4 1
007
767
1 02
0 74
7 92
4 74
1 45
6 88
2 46
7 85
9 1
103
773
550
885
552
888
Hung
Yen
1
252
731
626
817
625
914
152
918
76 2
35
76 6
83
1 09
9 81
3 55
0 58
2 54
9 23
1 Th
ai B
inh
1 86
0 44
7 90
5 40
8 95
5 03
9 19
6 45
3 94
239
10
2 21
4 1
663
994
811
169
852
825
Ha N
am
852
800
419
751
433
049
142
788
70 5
52
72 2
36
710
012
349
199
360
813
Nam
Din
h 1
780
393
872
035
908
358
323
654
158
127
165
527
1 45
6 73
9 71
3 90
8 74
2 83
1 Ni
nh B
inh
982
487
489
334
493
153
206
524
102
138
104
386
775
963
387
196
388
767
Than
h Ho
a 3
640
128
1 81
6 00
1 1
824
127
541
403
265
825
275
578
3 09
8 72
5 1
550
176
1 54
8 54
9 Ng
he A
n 3
327
791
1 67
2 90
1 1
654
890
490
038
239
495
250
543
2 83
7 75
3 1
433
406
1 40
4 34
7 Ha
Tin
h 1
288
866
640
709
648
157
251
893
125
693
126
200
1 03
6 97
3 51
5 01
6 52
1 95
7 Q
uang
Bin
h 89
5 43
0 44
9 29
6 44
6 13
4 18
8 38
6 93
020
95
366
70
7 04
4 35
6 27
6 35
0 76
8 Q
uang
Tri
632
375
313
493
318
882
195
451
96 6
62
98 7
89
436
924
216
831
220
093
Thua
Thi
en H
ue
1 12
8 62
0 55
8 48
8 57
0 13
2 55
8 53
1 27
3 12
8 28
5 40
3 57
0 08
9 28
5 36
0 28
4 72
9 Da
Nan
g 1
134
310
558
982
575
328
988
561
486
856
501
705
145
749
72 1
26
73 6
23
Qua
ng N
am
1 49
5 81
2 73
5 58
6 76
0 22
6 37
9 63
8 18
5 36
8 19
4 27
0 1
116
174
550
218
565
956
Qua
ng N
gai
1 23
1 69
7 61
1 91
4 61
9 78
3 20
0 93
3 98
136
10
2 79
7 1
030
764
513
778
516
986
Binh
Din
h 1
486
918
732
087
754
831
474
879
231
425
243
454
1 01
2 03
9 50
0 66
2 51
1 37
7 Ph
u Ye
n 87
2 96
4 43
9 07
8 43
3 88
6 25
0 88
8 12
4 74
6 12
6 14
2 62
2 07
6 31
4 33
2 30
7 74
4 Kh
anh
Hoa
1 23
1 10
7 61
2 51
3 61
8 59
4 51
9 88
0 25
5 34
6 26
4 53
4 71
1 22
7 35
7 16
7 35
4 06
0 Ni
nh T
huan
59
0 46
7 29
6 02
6 29
4 44
1 21
1 11
2 10
4 90
4 10
6 20
8 37
9 35
5 19
1 12
2 18
8 23
3 Bi
nh T
huan
1
230
808
618
384
612
424
468
720
233
414
235
306
762
088
384
970
377
118
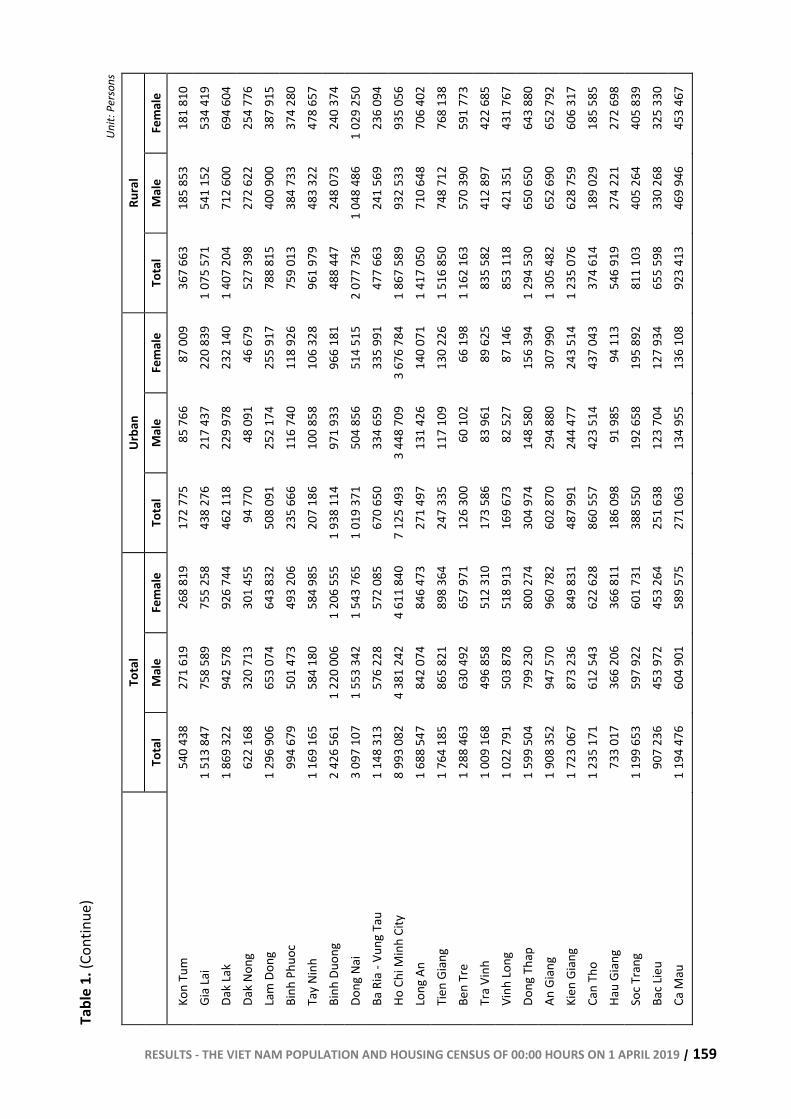
RESULTS - THE VIET NAM POPULATION AND HOUSING CENSUS OF 00:00 HOURS ON 1 APRIL 2019 | 159
Tabl
e 1.
(Con
tinue
) Un
it: P
erso
ns
Tota
l Ur
ban
Rura
l
Tota
l M
ale
Fem
ale
Tota
l M
ale
Fem
ale
Tota
l M
ale
Fem
ale
Kon
Tum
54
0 43
8 27
1 61
9 26
8 81
9 17
2 77
5 85
766
87
009
36
7 66
3 18
5 85
3 18
1 81
0 Gi
a La
i 1
513
847
758
589
755
258
438
276
217
437
220
839
1 07
5 57
1 54
1 15
2 53
4 41
9 Da
k La
k 1
869
322
942
578
926
744
462
118
229
978
232
140
1 40
7 20
4 71
2 60
0 69
4 60
4 Da
k No
ng
622
168
320
713
301
455
94 7
70
48 0
91
46 6
79
527
398
272
622
254
776
Lam
Don
g 1
296
906
653
074
643
832
508
091
252
174
255
917
788
815
400
900
387
915
Binh
Phu
oc
994
679
501
473
493
206
235
666
116
740
118
926
759
013
384
733
374
280
Tay
Ninh
1
169
165
584
180
584
985
207
186
100
858
106
328
961
979
483
322
478
657
Binh
Duo
ng
2 42
6 56
1 1
220
006
1 20
6 55
5 1
938
114
971
933
966
181
488
447
248
073
240
374
Dong
Nai
3
097
107
1 55
3 34
2 1
543
765
1 01
9 37
1 50
4 85
6 51
4 51
5 2
077
736
1 04
8 48
6 1
029
250
Ba R
ia -
Vung
Tau
1
148
313
576
228
572
085
670
650
334
659
335
991
477
663
241
569
236
094
Ho C
hi M
inh
City
8
993
082
4 38
1 24
2 4
611
840
7 12
5 49
3 3
448
709
3 67
6 78
4 1
867
589
932
533
935
056
Long
An
1 68
8 54
7 84
2 07
4 84
6 47
3 27
1 49
7 13
1 42
6 14
0 07
1 1
417
050
710
648
706
402
Tien
Gia
ng
1 76
4 18
5 86
5 82
1 89
8 36
4 24
7 33
5 11
7 10
9 13
0 22
6 1
516
850
748
712
768
138
Ben
Tre
1 28
8 46
3 63
0 49
2 65
7 97
1 12
6 30
0 60
102
66
198
1
162
163
570
390
591
773
Tra
Vinh
1
009
168
496
858
512
310
173
586
83 9
61
89 6
25
835
582
412
897
422
685
Vinh
Long
1
022
791
503
878
518
913
169
673
82 5
27
87 1
46
853
118
421
351
431
767
Dong
Tha
p 1
599
504
799
230
800
274
304
974
148
580
156
394
1 29
4 53
0 65
0 65
0 64
3 88
0 An
Gia
ng
1 90
8 35
2 94
7 57
0 96
0 78
2 60
2 87
0 29
4 88
0 30
7 99
0 1
305
482
652
690
652
792
Kien
Gia
ng
1 72
3 06
7 87
3 23
6 84
9 83
1 48
7 99
1 24
4 47
7 24
3 51
4 1
235
076
628
759
606
317
Can
Tho
1 23
5 17
1 61
2 54
3 62
2 62
8 86
0 55
7 42
3 51
4 43
7 04
3 37
4 61
4 18
9 02
9 18
5 58
5 Ha
u Gi
ang
733
017
366
206
366
811
186
098
91 9
85
94 1
13
546
919
274
221
272
698
Soc T
rang
1
199
653
597
922
601
731
388
550
192
658
195
892
811
103
405
264
405
839
Bac L
ieu
907
236
453
972
453
264
251
638
123
704
127
934
655
598
330
268
325
330
Ca M
au
1 19
4 47
6 60
4 90
1 58
9 57
5 27
1 06
3 13
4 95
5 13
6 10
8 92
3 41
3 46
9 94
6 45
3 46
7
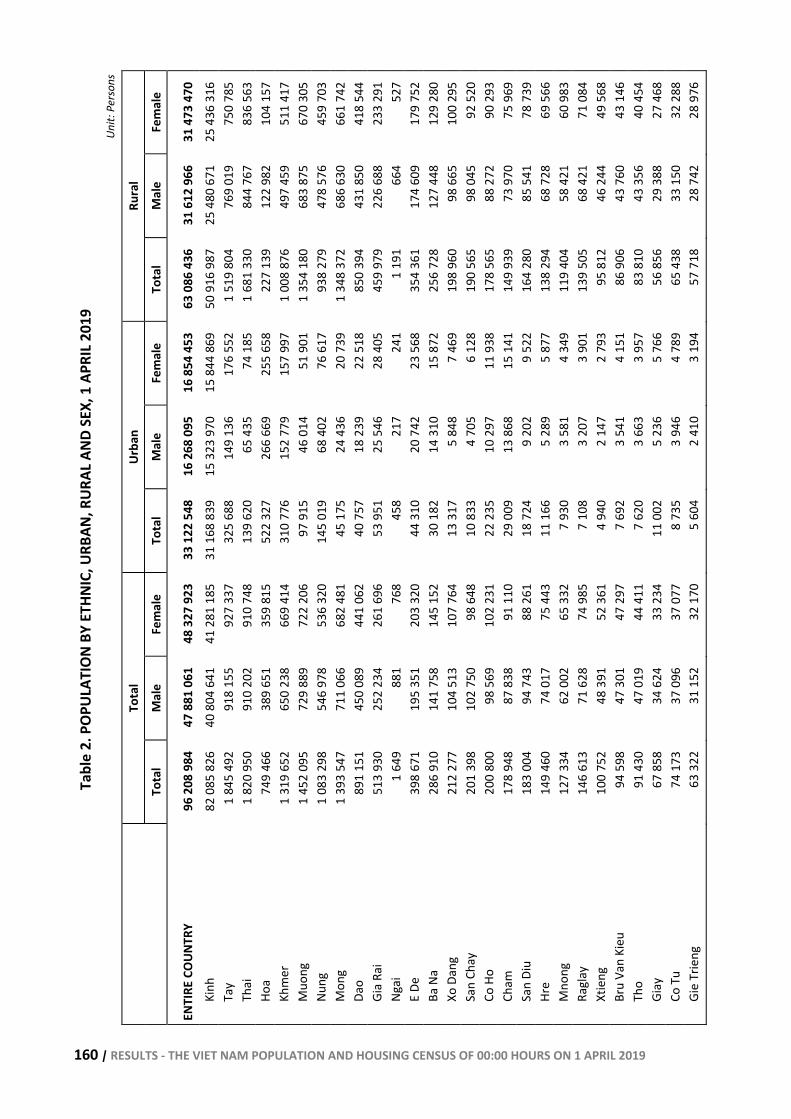
160 | RESULTS - THE VIET NAM POPULATION AND HOUSING CENSUS OF 00:00 HOURS ON 1 APRIL 2019
Tabl
e 2.
POP
ULAT
ION
BY E
THNI
C, U
RBAN
, RUR
AL A
ND S
EX, 1
APR
IL 20
19
Unit:
Per
sons
Tota
l Ur
ban
Rura
l
Tota
l M
ale
Fem
ale
Tota
l M
ale
Fem
ale
Tota
l M
ale
Fem
ale
ENTI
RE C
OUNT
RY
96 2
08 9
84
47 8
81 0
61
48 3
27 9
23
33 1
22 5
48
16 2
68 0
95
16 8
54 4
53
63 0
86 4
36
31 6
12 9
66
31 4
73 4
70
Kinh
82
085
826
40
804
641
41
281
185
31
168
839
15
323
970
15
844
869
50
916
987
25
480
671
25
436
316
Ta
y 1
845
492
918
155
927
337
325
688
149
136
176
552
1 51
9 80
4 76
9 01
9 75
0 78
5 Th
ai
1 82
0 95
0 91
0 20
2 91
0 74
8 13
9 62
0 65
435
74
185
1
681
330
844
767
836
563
Hoa
749
466
389
651
359
815
522
327
266
669
255
658
227
139
122
982
104
157
Khm
er
1 31
9 65
2 65
0 23
8 66
9 41
4 31
0 77
6 15
2 77
9 15
7 99
7 1
008
876
497
459
511
417
Muo
ng
1 45
2 09
5 72
9 88
9 72
2 20
6 97
915
46
014
51
901
1
354
180
683
875
670
305
Nung
1
083
298
546
978
536
320
145
019
68 4
02
76 6
17
938
279
478
576
459
703
Mon
g 1
393
547
711
066
682
481
45 1
75
24 4
36
20 7
39
1 34
8 37
2 68
6 63
0 66
1 74
2 Da
o 89
1 15
1 45
0 08
9 44
1 06
2 40
757
18
239
22
518
85
0 39
4 43
1 85
0 41
8 54
4 Gi
a Ra
i 51
3 93
0 25
2 23
4 26
1 69
6 53
951
25
546
28
405
45
9 97
9 22
6 68
8 23
3 29
1 Ng
ai
1 64
9 88
1 76
8 45
8 21
7 24
1 1
191
664
527
E De
39
8 67
1 19
5 35
1 20
3 32
0 44
310
20
742
23
568
35
4 36
1 17
4 60
9 17
9 75
2 Ba
Na
286
910
141
758
145
152
30 1
82
14 3
10
15 8
72
256
728
127
448
129
280
Xo D
ang
212
277
104
513
107
764
13 3
17
5 84
8 7
469
198
960
98 6
65
100
295
San
Chay
20
1 39
8 10
2 75
0 98
648
10
833
4
705
6 12
8 19
0 56
5 98
045
92
520
Co
Ho
200
800
98 5
69
102
231
22 2
35
10 2
97
11 9
38
178
565
88 2
72
90 2
93
Cham
17
8 94
8 87
838
91
110
29
009
13
868
15
141
14
9 93
9 73
970
75
969
Sa
n Di
u 18
3 00
4 94
743
88
261
18
724
9
202
9 52
2 16
4 28
0 85
541
78
739
Hr
e 14
9 46
0 74
017
75
443
11
166
5
289
5 87
7 13
8 29
4 68
728
69
566
M
nong
12
7 33
4 62
002
65
332
7
930
3 58
1 4
349
119
404
58 4
21
60 9
83
Ragl
ay
146
613
71 6
28
74 9
85
7 10
8 3
207
3 90
1 13
9 50
5 68
421
71
084
Xt
ieng
10
0 75
2 48
391
52
361
4
940
2 14
7 2
793
95 8
12
46 2
44
49 5
68
Bru
Van
Kieu
94
598
47
301
47
297
7
692
3 54
1 4
151
86 9
06
43 7
60
43 1
46
Tho
91 4
30
47 0
19
44 4
11
7 62
0 3
663
3 95
7 83
810
43
356
40
454
Gi
ay
67 8
58
34 6
24
33 2
34
11 0
02
5 23
6 5
766
56 8
56
29 3
88
27 4
68
Co T
u 74
173
37
096
37
077
8
735
3 94
6 4
789
65 4
38
33 1
50
32 2
88
Gie
Trie
ng
63 3
22
31 1
52
32 1
70
5 60
4 2
410
3 19
4 57
718
28
742
28
976
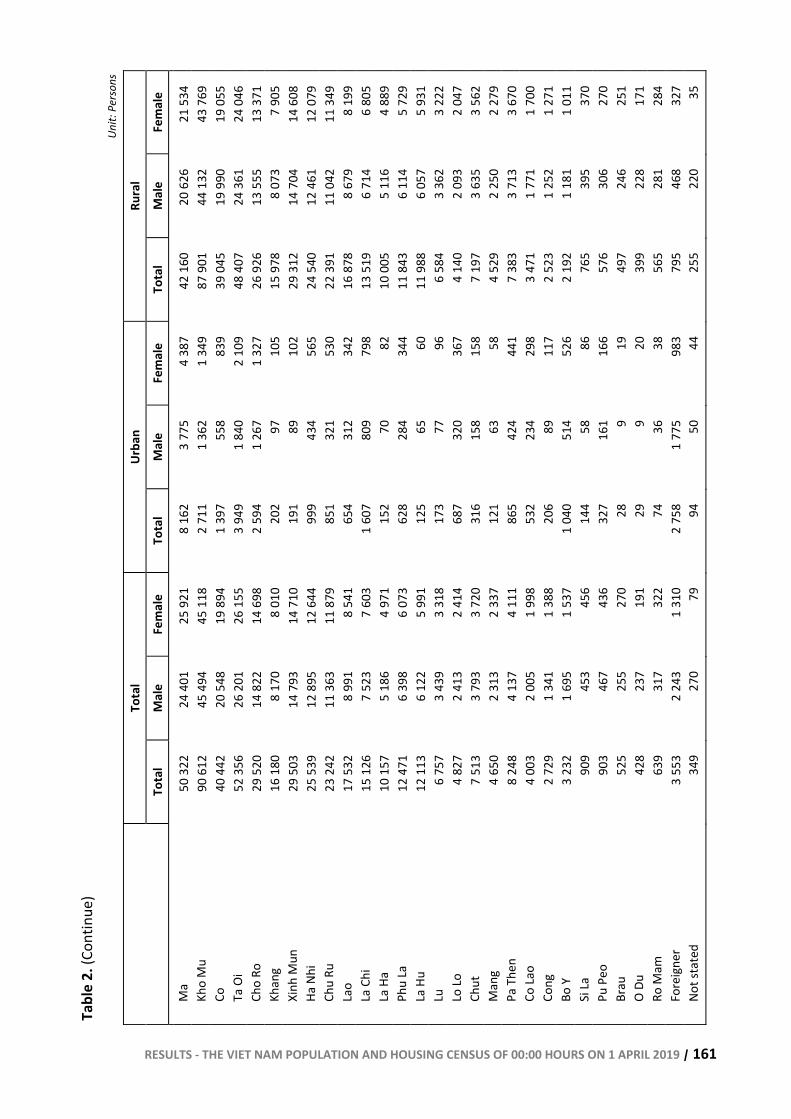
RESULTS - THE VIET NAM POPULATION AND HOUSING CENSUS OF 00:00 HOURS ON 1 APRIL 2019 | 161
Tabl
e 2.
(Con
tinue
) Un
it: P
erso
ns
Tota
l Ur
ban
Rura
l
Tota
l M
ale
Fem
ale
Tota
l M
ale
Fem
ale
Tota
l M
ale
Fem
ale
Ma
50 3
22
24 4
01
25 9
21
8 16
2 3
775
4 38
7 42
160
20
626
21
534
Kh
o M
u 90
612
45
494
45
118
2
711
1 36
2 1
349
87 9
01
44 1
32
43 7
69
Co
40 4
42
20 5
48
19 8
94
1 39
7 55
8 83
9 39
045
19
990
19
055
Ta
Oi
52 3
56
26 2
01
26 1
55
3 94
9 1
840
2 10
9 48
407
24
361
24
046
Ch
o Ro
29
520
14
822
14
698
2
594
1 26
7 1
327
26 9
26
13 5
55
13 3
71
Khan
g 16
180
8
170
8 01
0 20
2 97
10
5 15
978
8
073
7 90
5 Xi
nh M
un
29 5
03
14 7
93
14 7
10
191
89
102
29 3
12
14 7
04
14 6
08
Ha N
hi
25 5
39
12 8
95
12 6
44
999
434
565
24 5
40
12 4
61
12 0
79
Chu
Ru
23 2
42
11 3
63
11 8
79
851
321
530
22 3
91
11 0
42
11 3
49
Lao
17 5
32
8 99
1 8
541
654
312
342
16 8
78
8 67
9 8
199
La C
hi
15 1
26
7 52
3 7
603
1 60
7 80
9 79
8 13
519
6
714
6 80
5 La
Ha
10 1
57
5 18
6 4
971
152
70
82
10 0
05
5 11
6 4
889
Phu
La
12 4
71
6 39
8 6
073
628
284
344
11 8
43
6 11
4 5
729
La H
u 12
113
6
122
5 99
1 12
5 65
60
11
988
6
057
5 93
1 Lu
6
757
3 43
9 3
318
173
77
96
6 58
4 3
362
3 22
2 Lo
Lo
4 82
7 2
413
2 41
4 68
7 32
0 36
7 4
140
2 09
3 2
047
Chut
7
513
3 79
3 3
720
316
158
158
7 19
7 3
635
3 56
2 M
ang
4 65
0 2
313
2 33
7 12
1 63
58
4
529
2 25
0 2
279
Pa T
hen
8 24
8 4
137
4 11
1 86
5 42
4 44
1 7
383
3 71
3 3
670
Co La
o 4
003
2 00
5 1
998
532
234
298
3 47
1 1
771
1 70
0 Co
ng
2 72
9 1
341
1 38
8 20
6 89
11
7 2
523
1 25
2 1
271
Bo Y
3
232
1 69
5 1
537
1 04
0 51
4 52
6 2
192
1 18
1 1
011
Si La
90
9 45
3 45
6 14
4 58
86
76
5 39
5 37
0 Pu
Peo
90
3 46
7 43
6 32
7 16
1 16
6 57
6 30
6 27
0 Br
au
525
255
270
28
9 19
49
7 24
6 25
1 O
Du
428
237
191
29
9 20
39
9 22
8 17
1 Ro
Mam
63
9 31
7 32
2 74
36
38
56
5 28
1 28
4 Fo
reig
ner
3 55
3 2
243
1 31
0 2
758
1 77
5 98
3 79
5 46
8 32
7 No
t sta
ted
349
270
79
94
50
44
255
220
35
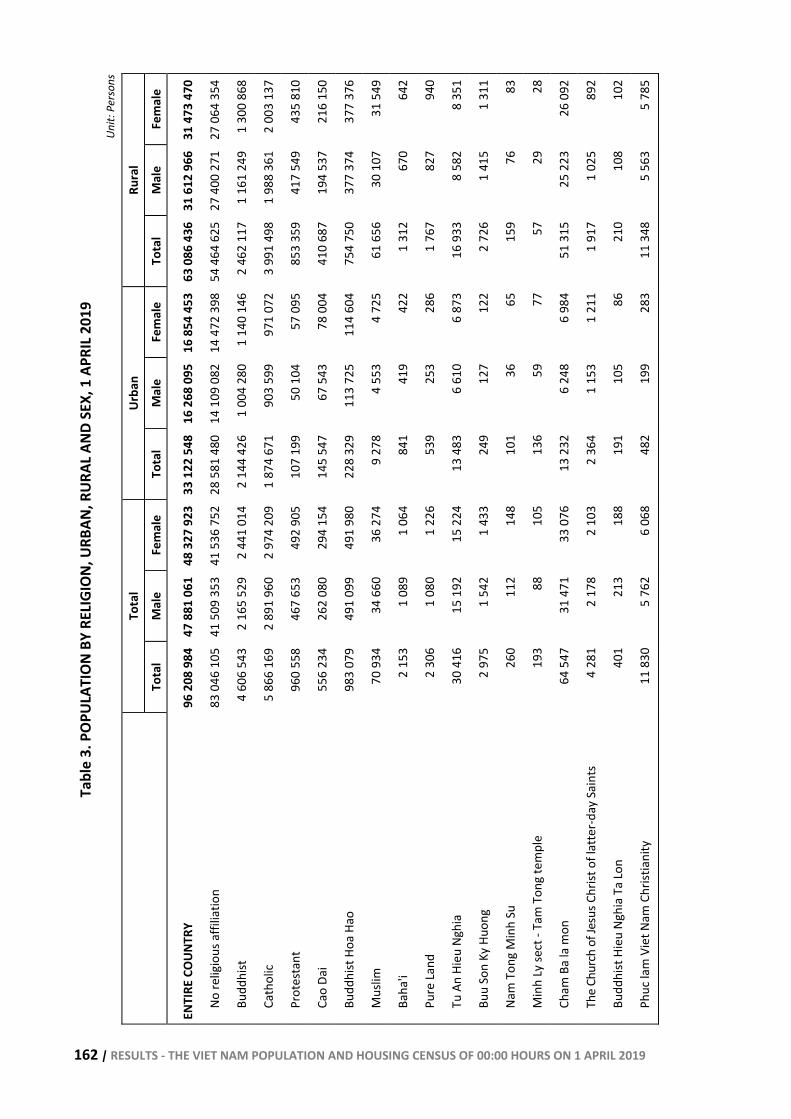
162 | RESULTS - THE VIET NAM POPULATION AND HOUSING CENSUS OF 00:00 HOURS ON 1 APRIL 2019
Tabl
e 3.
POP
ULAT
ION
BY R
ELIG
ION,
URB
AN, R
URAL
AND
SEX
, 1 A
PRIL
2019
Un
it: P
erso
ns
Tota
l Ur
ban
Rura
l
Tota
l M
ale
Fem
ale
Tota
l M
ale
Fem
ale
Tota
l M
ale
Fem
ale
ENTI
RE C
OUNT
RY
96 2
08 9
8447
881
061
48 3
27 9
23
33 1
22 5
4816
268
095
16 8
54 4
5363
086
436
31 6
12 9
6631
473
470
No re
ligio
us a
ffilia
tion
83 0
46 1
0541
509
353
41 5
36 7
52
28 5
81 4
8014
109
082
14 4
72 3
9854
464
625
27 4
00 2
7127
064
354
Budd
hist
4
606
543
2 16
5 52
92
441
014
2 14
4 42
61
004
280
1 14
0 14
62
462
117
1 16
1 24
91
300
868
Cath
olic
5 86
6 16
92
891
960
2 97
4 20
9 1
874
671
903
599
971
072
3 99
1 49
81
988
361
2 00
3 13
7
Prot
esta
nt
960
558
467
653
492
905
107
199
50 1
0457
095
853
359
417
549
435
810
Cao
Dai
556
234
262
080
294
154
145
547
67 5
4378
004
410
687
194
537
216
150
Budd
hist
Hoa
Hao
98
3 07
949
1 09
949
1 98
0 22
8 32
911
3 72
511
4 60
475
4 75
037
7 37
437
7 37
6
Mus
lim
70 9
3434
660
36 2
74
9 27
84
553
4 72
561
656
30 1
0731
549
Baha
'i 2
153
1 08
91
064
841
419
422
1 31
267
064
2
Pure
Land
2
306
1 08
01
226
539
253
286
1 76
782
794
0
Tu A
n Hi
eu N
ghia
30
416
15 1
9215
224
13
483
6 61
06
873
16 9
338
582
8 35
1
Buu
Son
Ky H
uong
2
975
1 54
21
433
249
127
122
2 72
61
415
1 31
1
Nam
Ton
g M
inh
Su
260
112
148
101
3665
159
7683
Min
h Ly
sect
- Ta
m T
ong
tem
ple
193
8810
5 13
659
7757
2928
Cham
Ba
la m
on
64 5
4731
471
33 0
76
13 2
326
248
6 98
451
315
25 2
2326
092
The
Chur
ch o
f Jes
us C
hrist
of l
atte
r-day
Sai
nts
4 28
12
178
2 10
3 2
364
1 15
31
211
1 91
71
025
892
Budd
hist
Hie
u Ng
hia
Ta Lo
n
401
213
188
191
105
8621
010
810
2
Phuc
lam
Vie
t Nam
Chr
istia
nity
11
830
5 76
26
068
482
199
283
11 3
485
563
5 78
5
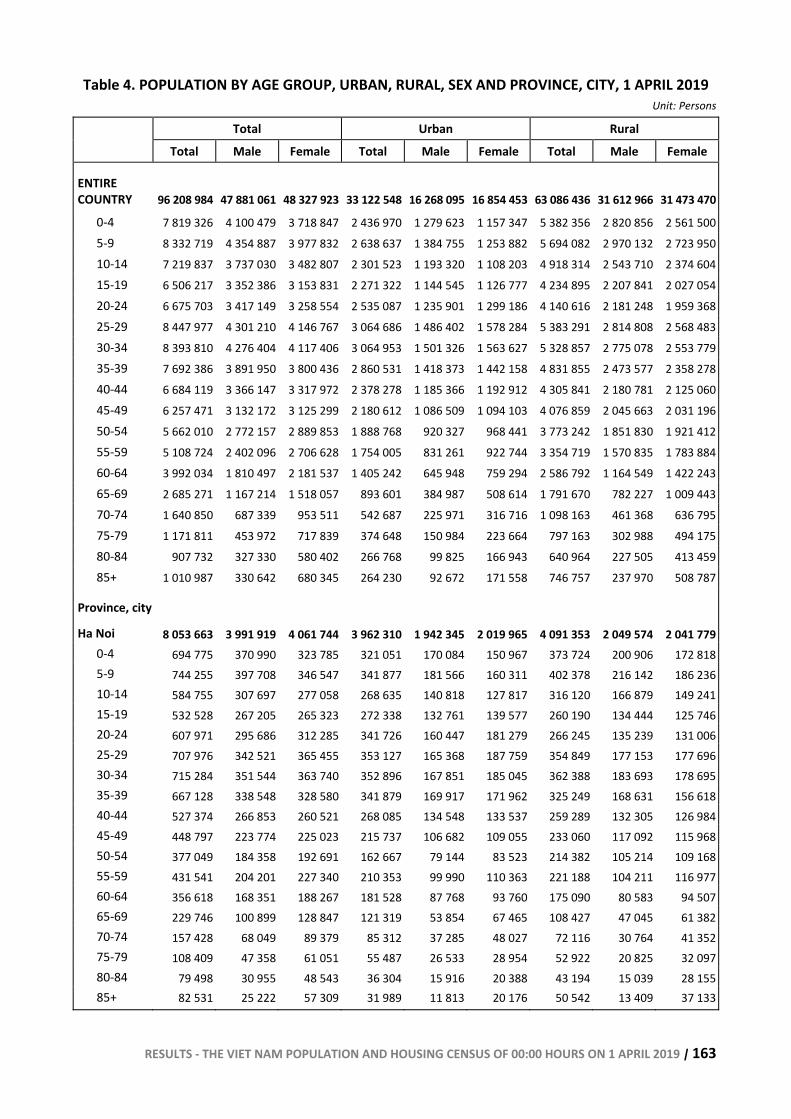
RESULTS - THE VIET NAM POPULATION AND HOUSING CENSUS OF 00:00 HOURS ON 1 APRIL 2019 | 163
Table 4. POPULATION BY AGE GROUP, URBAN, RURAL, SEX AND PROVINCE, CITY, 1 APRIL 2019 Unit: Persons
Total Urban Rural
Total Male Female Total Male Female Total Male Female
ENTIRE COUNTRY 96 208 984 47 881 061 48 327 923 33 122 548 16 268 095 16 854 453 63 086 436 31 612 966 31 473 470
0-4 7 819 326 4 100 479 3 718 847 2 436 970 1 279 623 1 157 347 5 382 356 2 820 856 2 561 5005-9 8 332 719 4 354 887 3 977 832 2 638 637 1 384 755 1 253 882 5 694 082 2 970 132 2 723 95010-14 7 219 837 3 737 030 3 482 807 2 301 523 1 193 320 1 108 203 4 918 314 2 543 710 2 374 60415-19 6 506 217 3 352 386 3 153 831 2 271 322 1 144 545 1 126 777 4 234 895 2 207 841 2 027 05420-24 6 675 703 3 417 149 3 258 554 2 535 087 1 235 901 1 299 186 4 140 616 2 181 248 1 959 36825-29 8 447 977 4 301 210 4 146 767 3 064 686 1 486 402 1 578 284 5 383 291 2 814 808 2 568 48330-34 8 393 810 4 276 404 4 117 406 3 064 953 1 501 326 1 563 627 5 328 857 2 775 078 2 553 77935-39 7 692 386 3 891 950 3 800 436 2 860 531 1 418 373 1 442 158 4 831 855 2 473 577 2 358 27840-44 6 684 119 3 366 147 3 317 972 2 378 278 1 185 366 1 192 912 4 305 841 2 180 781 2 125 06045-49 6 257 471 3 132 172 3 125 299 2 180 612 1 086 509 1 094 103 4 076 859 2 045 663 2 031 19650-54 5 662 010 2 772 157 2 889 853 1 888 768 920 327 968 441 3 773 242 1 851 830 1 921 41255-59 5 108 724 2 402 096 2 706 628 1 754 005 831 261 922 744 3 354 719 1 570 835 1 783 88460-64 3 992 034 1 810 497 2 181 537 1 405 242 645 948 759 294 2 586 792 1 164 549 1 422 24365-69 2 685 271 1 167 214 1 518 057 893 601 384 987 508 614 1 791 670 782 227 1 009 44370-74 1 640 850 687 339 953 511 542 687 225 971 316 716 1 098 163 461 368 636 79575-79 1 171 811 453 972 717 839 374 648 150 984 223 664 797 163 302 988 494 17580-84 907 732 327 330 580 402 266 768 99 825 166 943 640 964 227 505 413 45985+ 1 010 987 330 642 680 345 264 230 92 672 171 558 746 757 237 970 508 787
Province, city
Ha Noi 8 053 663 3 991 919 4 061 744 3 962 310 1 942 345 2 019 965 4 091 353 2 049 574 2 041 7790-4 694 775 370 990 323 785 321 051 170 084 150 967 373 724 200 906 172 8185-9 744 255 397 708 346 547 341 877 181 566 160 311 402 378 216 142 186 23610-14 584 755 307 697 277 058 268 635 140 818 127 817 316 120 166 879 149 24115-19 532 528 267 205 265 323 272 338 132 761 139 577 260 190 134 444 125 74620-24 607 971 295 686 312 285 341 726 160 447 181 279 266 245 135 239 131 00625-29 707 976 342 521 365 455 353 127 165 368 187 759 354 849 177 153 177 69630-34 715 284 351 544 363 740 352 896 167 851 185 045 362 388 183 693 178 69535-39 667 128 338 548 328 580 341 879 169 917 171 962 325 249 168 631 156 61840-44 527 374 266 853 260 521 268 085 134 548 133 537 259 289 132 305 126 98445-49 448 797 223 774 225 023 215 737 106 682 109 055 233 060 117 092 115 96850-54 377 049 184 358 192 691 162 667 79 144 83 523 214 382 105 214 109 16855-59 431 541 204 201 227 340 210 353 99 990 110 363 221 188 104 211 116 97760-64 356 618 168 351 188 267 181 528 87 768 93 760 175 090 80 583 94 50765-69 229 746 100 899 128 847 121 319 53 854 67 465 108 427 47 045 61 38270-74 157 428 68 049 89 379 85 312 37 285 48 027 72 116 30 764 41 35275-79 108 409 47 358 61 051 55 487 26 533 28 954 52 922 20 825 32 09780-84 79 498 30 955 48 543 36 304 15 916 20 388 43 194 15 039 28 15585+ 82 531 25 222 57 309 31 989 11 813 20 176 50 542 13 409 37 133
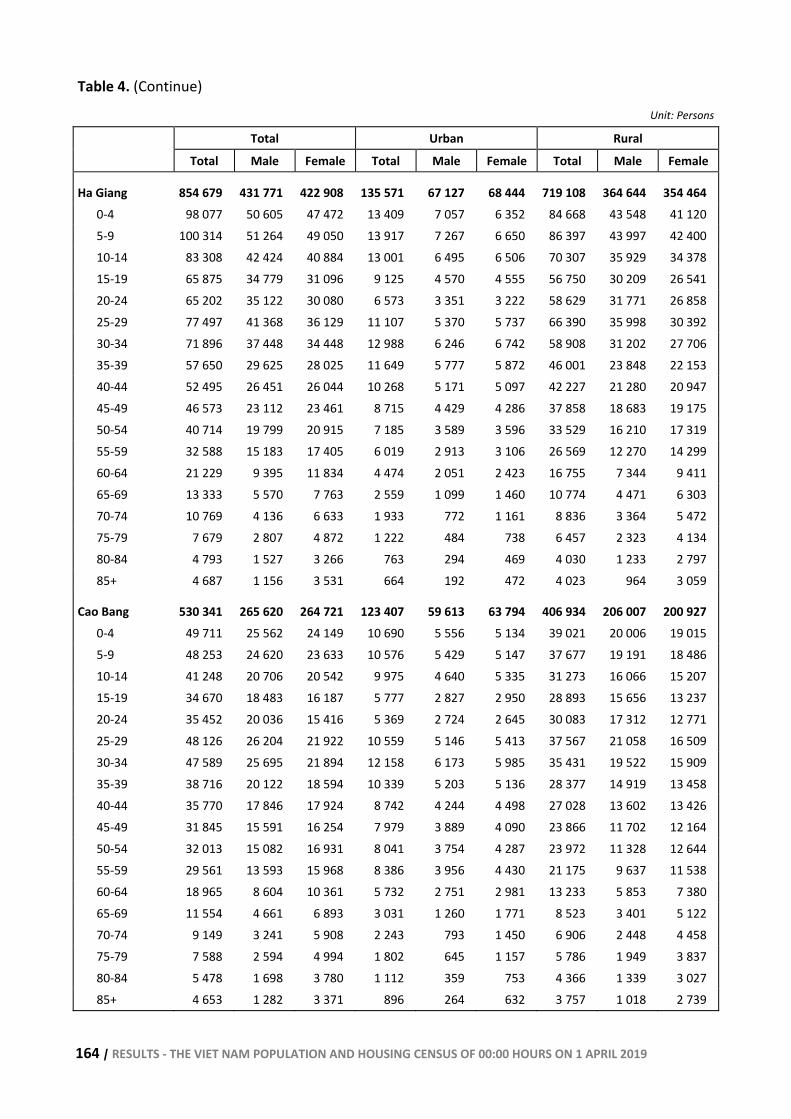
164 | RESULTS - THE VIET NAM POPULATION AND HOUSING CENSUS OF 00:00 HOURS ON 1 APRIL 2019
Table 4. (Continue)
Unit: Persons
Total Urban Rural
Total Male Female Total Male Female Total Male Female
Ha Giang 854 679 431 771 422 908 135 571 67 127 68 444 719 108 364 644 354 464 0-4 98 077 50 605 47 472 13 409 7 057 6 352 84 668 43 548 41 120 5-9 100 314 51 264 49 050 13 917 7 267 6 650 86 397 43 997 42 400 10-14 83 308 42 424 40 884 13 001 6 495 6 506 70 307 35 929 34 378 15-19 65 875 34 779 31 096 9 125 4 570 4 555 56 750 30 209 26 541 20-24 65 202 35 122 30 080 6 573 3 351 3 222 58 629 31 771 26 858 25-29 77 497 41 368 36 129 11 107 5 370 5 737 66 390 35 998 30 392 30-34 71 896 37 448 34 448 12 988 6 246 6 742 58 908 31 202 27 706 35-39 57 650 29 625 28 025 11 649 5 777 5 872 46 001 23 848 22 153 40-44 52 495 26 451 26 044 10 268 5 171 5 097 42 227 21 280 20 947 45-49 46 573 23 112 23 461 8 715 4 429 4 286 37 858 18 683 19 175 50-54 40 714 19 799 20 915 7 185 3 589 3 596 33 529 16 210 17 319 55-59 32 588 15 183 17 405 6 019 2 913 3 106 26 569 12 270 14 299 60-64 21 229 9 395 11 834 4 474 2 051 2 423 16 755 7 344 9 411 65-69 13 333 5 570 7 763 2 559 1 099 1 460 10 774 4 471 6 303 70-74 10 769 4 136 6 633 1 933 772 1 161 8 836 3 364 5 472 75-79 7 679 2 807 4 872 1 222 484 738 6 457 2 323 4 134 80-84 4 793 1 527 3 266 763 294 469 4 030 1 233 2 797 85+ 4 687 1 156 3 531 664 192 472 4 023 964 3 059
Cao Bang 530 341 265 620 264 721 123 407 59 613 63 794 406 934 206 007 200 927 0-4 49 711 25 562 24 149 10 690 5 556 5 134 39 021 20 006 19 015 5-9 48 253 24 620 23 633 10 576 5 429 5 147 37 677 19 191 18 486 10-14 41 248 20 706 20 542 9 975 4 640 5 335 31 273 16 066 15 207 15-19 34 670 18 483 16 187 5 777 2 827 2 950 28 893 15 656 13 237 20-24 35 452 20 036 15 416 5 369 2 724 2 645 30 083 17 312 12 771 25-29 48 126 26 204 21 922 10 559 5 146 5 413 37 567 21 058 16 509 30-34 47 589 25 695 21 894 12 158 6 173 5 985 35 431 19 522 15 909 35-39 38 716 20 122 18 594 10 339 5 203 5 136 28 377 14 919 13 458 40-44 35 770 17 846 17 924 8 742 4 244 4 498 27 028 13 602 13 426 45-49 31 845 15 591 16 254 7 979 3 889 4 090 23 866 11 702 12 164 50-54 32 013 15 082 16 931 8 041 3 754 4 287 23 972 11 328 12 644 55-59 29 561 13 593 15 968 8 386 3 956 4 430 21 175 9 637 11 538 60-64 18 965 8 604 10 361 5 732 2 751 2 981 13 233 5 853 7 380 65-69 11 554 4 661 6 893 3 031 1 260 1 771 8 523 3 401 5 122 70-74 9 149 3 241 5 908 2 243 793 1 450 6 906 2 448 4 458 75-79 7 588 2 594 4 994 1 802 645 1 157 5 786 1 949 3 837 80-84 5 478 1 698 3 780 1 112 359 753 4 366 1 339 3 027 85+ 4 653 1 282 3 371 896 264 632 3 757 1 018 2 739
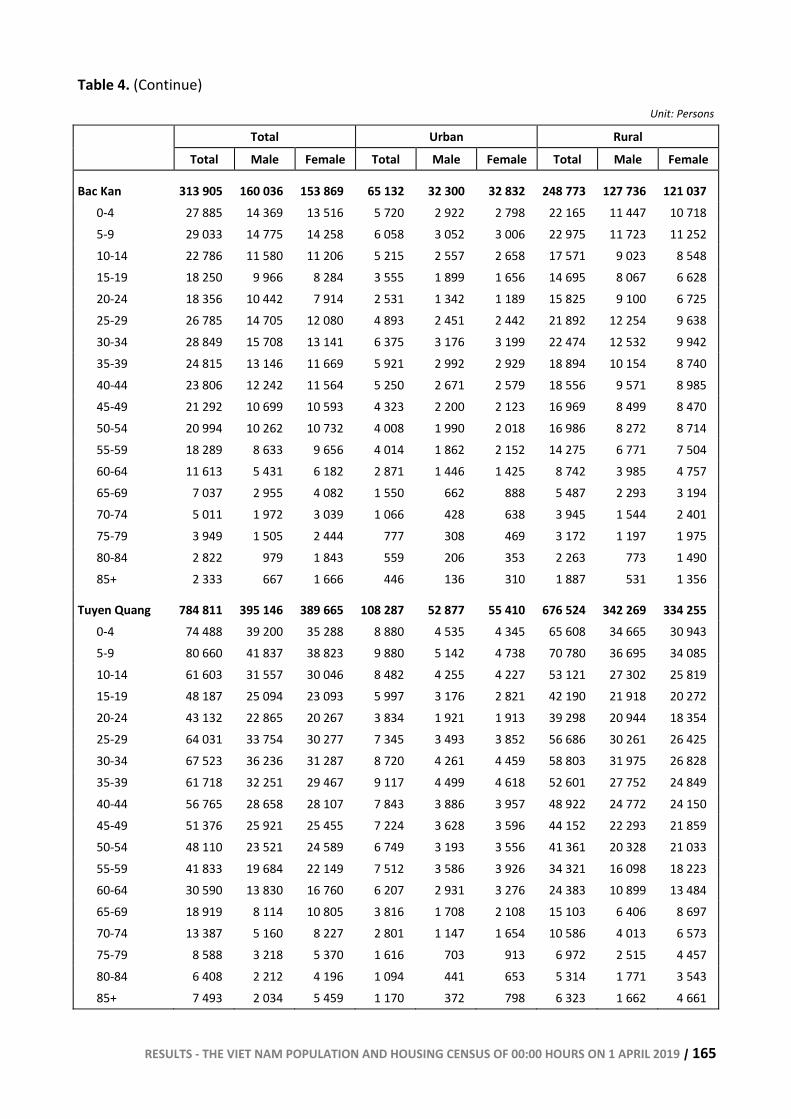
RESULTS - THE VIET NAM POPULATION AND HOUSING CENSUS OF 00:00 HOURS ON 1 APRIL 2019 | 165
Table 4. (Continue)
Unit: Persons
Total Urban Rural
Total Male Female Total Male Female Total Male Female
Bac Kan 313 905 160 036 153 869 65 132 32 300 32 832 248 773 127 736 121 037 0-4 27 885 14 369 13 516 5 720 2 922 2 798 22 165 11 447 10 718 5-9 29 033 14 775 14 258 6 058 3 052 3 006 22 975 11 723 11 252 10-14 22 786 11 580 11 206 5 215 2 557 2 658 17 571 9 023 8 548 15-19 18 250 9 966 8 284 3 555 1 899 1 656 14 695 8 067 6 628 20-24 18 356 10 442 7 914 2 531 1 342 1 189 15 825 9 100 6 725 25-29 26 785 14 705 12 080 4 893 2 451 2 442 21 892 12 254 9 638 30-34 28 849 15 708 13 141 6 375 3 176 3 199 22 474 12 532 9 942 35-39 24 815 13 146 11 669 5 921 2 992 2 929 18 894 10 154 8 740 40-44 23 806 12 242 11 564 5 250 2 671 2 579 18 556 9 571 8 985 45-49 21 292 10 699 10 593 4 323 2 200 2 123 16 969 8 499 8 470 50-54 20 994 10 262 10 732 4 008 1 990 2 018 16 986 8 272 8 714 55-59 18 289 8 633 9 656 4 014 1 862 2 152 14 275 6 771 7 504 60-64 11 613 5 431 6 182 2 871 1 446 1 425 8 742 3 985 4 757 65-69 7 037 2 955 4 082 1 550 662 888 5 487 2 293 3 194 70-74 5 011 1 972 3 039 1 066 428 638 3 945 1 544 2 401 75-79 3 949 1 505 2 444 777 308 469 3 172 1 197 1 975 80-84 2 822 979 1 843 559 206 353 2 263 773 1 490 85+ 2 333 667 1 666 446 136 310 1 887 531 1 356
Tuyen Quang 784 811 395 146 389 665 108 287 52 877 55 410 676 524 342 269 334 255 0-4 74 488 39 200 35 288 8 880 4 535 4 345 65 608 34 665 30 943 5-9 80 660 41 837 38 823 9 880 5 142 4 738 70 780 36 695 34 085 10-14 61 603 31 557 30 046 8 482 4 255 4 227 53 121 27 302 25 819 15-19 48 187 25 094 23 093 5 997 3 176 2 821 42 190 21 918 20 272 20-24 43 132 22 865 20 267 3 834 1 921 1 913 39 298 20 944 18 354 25-29 64 031 33 754 30 277 7 345 3 493 3 852 56 686 30 261 26 425 30-34 67 523 36 236 31 287 8 720 4 261 4 459 58 803 31 975 26 828 35-39 61 718 32 251 29 467 9 117 4 499 4 618 52 601 27 752 24 849 40-44 56 765 28 658 28 107 7 843 3 886 3 957 48 922 24 772 24 150 45-49 51 376 25 921 25 455 7 224 3 628 3 596 44 152 22 293 21 859 50-54 48 110 23 521 24 589 6 749 3 193 3 556 41 361 20 328 21 033 55-59 41 833 19 684 22 149 7 512 3 586 3 926 34 321 16 098 18 223 60-64 30 590 13 830 16 760 6 207 2 931 3 276 24 383 10 899 13 484 65-69 18 919 8 114 10 805 3 816 1 708 2 108 15 103 6 406 8 697 70-74 13 387 5 160 8 227 2 801 1 147 1 654 10 586 4 013 6 573 75-79 8 588 3 218 5 370 1 616 703 913 6 972 2 515 4 457 80-84 6 408 2 212 4 196 1 094 441 653 5 314 1 771 3 543 85+ 7 493 2 034 5 459 1 170 372 798 6 323 1 662 4 661
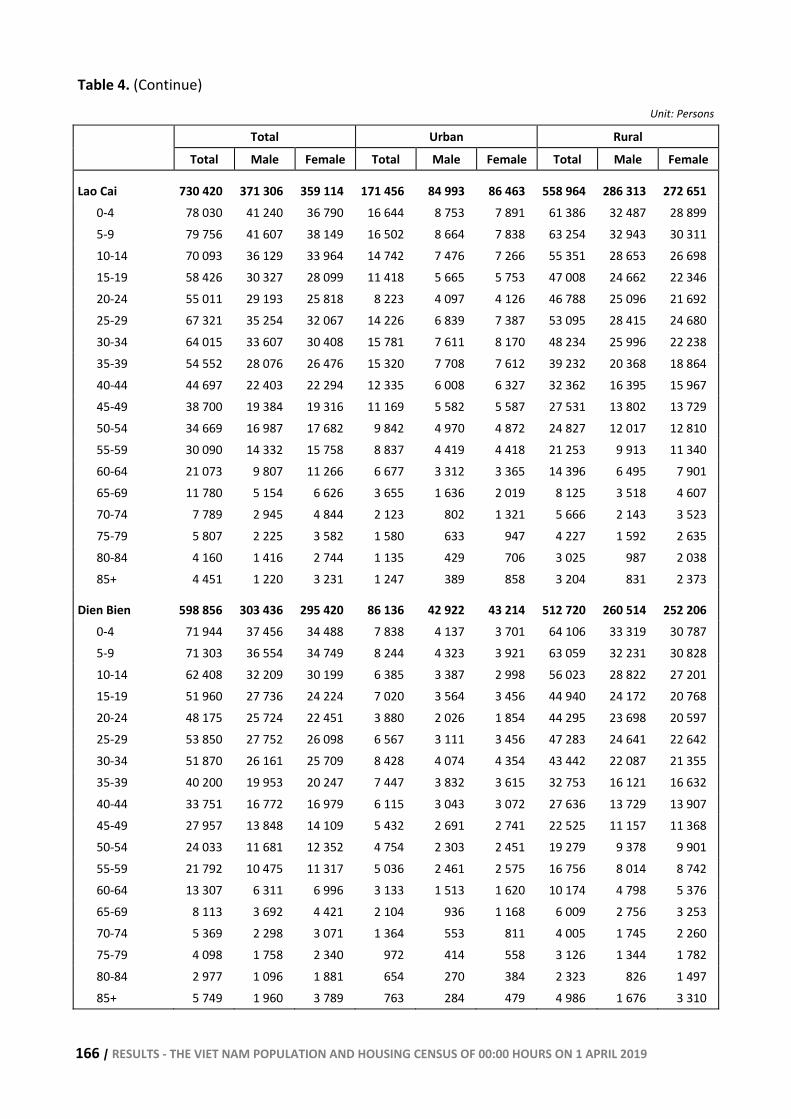
166 | RESULTS - THE VIET NAM POPULATION AND HOUSING CENSUS OF 00:00 HOURS ON 1 APRIL 2019
Table 4. (Continue)
Unit: Persons
Total Urban Rural
Total Male Female Total Male Female Total Male Female
Lao Cai 730 420 371 306 359 114 171 456 84 993 86 463 558 964 286 313 272 651 0-4 78 030 41 240 36 790 16 644 8 753 7 891 61 386 32 487 28 899 5-9 79 756 41 607 38 149 16 502 8 664 7 838 63 254 32 943 30 311 10-14 70 093 36 129 33 964 14 742 7 476 7 266 55 351 28 653 26 698 15-19 58 426 30 327 28 099 11 418 5 665 5 753 47 008 24 662 22 346 20-24 55 011 29 193 25 818 8 223 4 097 4 126 46 788 25 096 21 692 25-29 67 321 35 254 32 067 14 226 6 839 7 387 53 095 28 415 24 680 30-34 64 015 33 607 30 408 15 781 7 611 8 170 48 234 25 996 22 238 35-39 54 552 28 076 26 476 15 320 7 708 7 612 39 232 20 368 18 864 40-44 44 697 22 403 22 294 12 335 6 008 6 327 32 362 16 395 15 967 45-49 38 700 19 384 19 316 11 169 5 582 5 587 27 531 13 802 13 729 50-54 34 669 16 987 17 682 9 842 4 970 4 872 24 827 12 017 12 810 55-59 30 090 14 332 15 758 8 837 4 419 4 418 21 253 9 913 11 340 60-64 21 073 9 807 11 266 6 677 3 312 3 365 14 396 6 495 7 901 65-69 11 780 5 154 6 626 3 655 1 636 2 019 8 125 3 518 4 607 70-74 7 789 2 945 4 844 2 123 802 1 321 5 666 2 143 3 523 75-79 5 807 2 225 3 582 1 580 633 947 4 227 1 592 2 635 80-84 4 160 1 416 2 744 1 135 429 706 3 025 987 2 038 85+ 4 451 1 220 3 231 1 247 389 858 3 204 831 2 373
Dien Bien 598 856 303 436 295 420 86 136 42 922 43 214 512 720 260 514 252 206 0-4 71 944 37 456 34 488 7 838 4 137 3 701 64 106 33 319 30 787 5-9 71 303 36 554 34 749 8 244 4 323 3 921 63 059 32 231 30 828 10-14 62 408 32 209 30 199 6 385 3 387 2 998 56 023 28 822 27 201 15-19 51 960 27 736 24 224 7 020 3 564 3 456 44 940 24 172 20 768 20-24 48 175 25 724 22 451 3 880 2 026 1 854 44 295 23 698 20 597 25-29 53 850 27 752 26 098 6 567 3 111 3 456 47 283 24 641 22 642 30-34 51 870 26 161 25 709 8 428 4 074 4 354 43 442 22 087 21 355 35-39 40 200 19 953 20 247 7 447 3 832 3 615 32 753 16 121 16 632 40-44 33 751 16 772 16 979 6 115 3 043 3 072 27 636 13 729 13 907 45-49 27 957 13 848 14 109 5 432 2 691 2 741 22 525 11 157 11 368 50-54 24 033 11 681 12 352 4 754 2 303 2 451 19 279 9 378 9 901 55-59 21 792 10 475 11 317 5 036 2 461 2 575 16 756 8 014 8 742 60-64 13 307 6 311 6 996 3 133 1 513 1 620 10 174 4 798 5 376 65-69 8 113 3 692 4 421 2 104 936 1 168 6 009 2 756 3 253 70-74 5 369 2 298 3 071 1 364 553 811 4 005 1 745 2 260 75-79 4 098 1 758 2 340 972 414 558 3 126 1 344 1 782 80-84 2 977 1 096 1 881 654 270 384 2 323 826 1 497 85+ 5 749 1 960 3 789 763 284 479 4 986 1 676 3 310
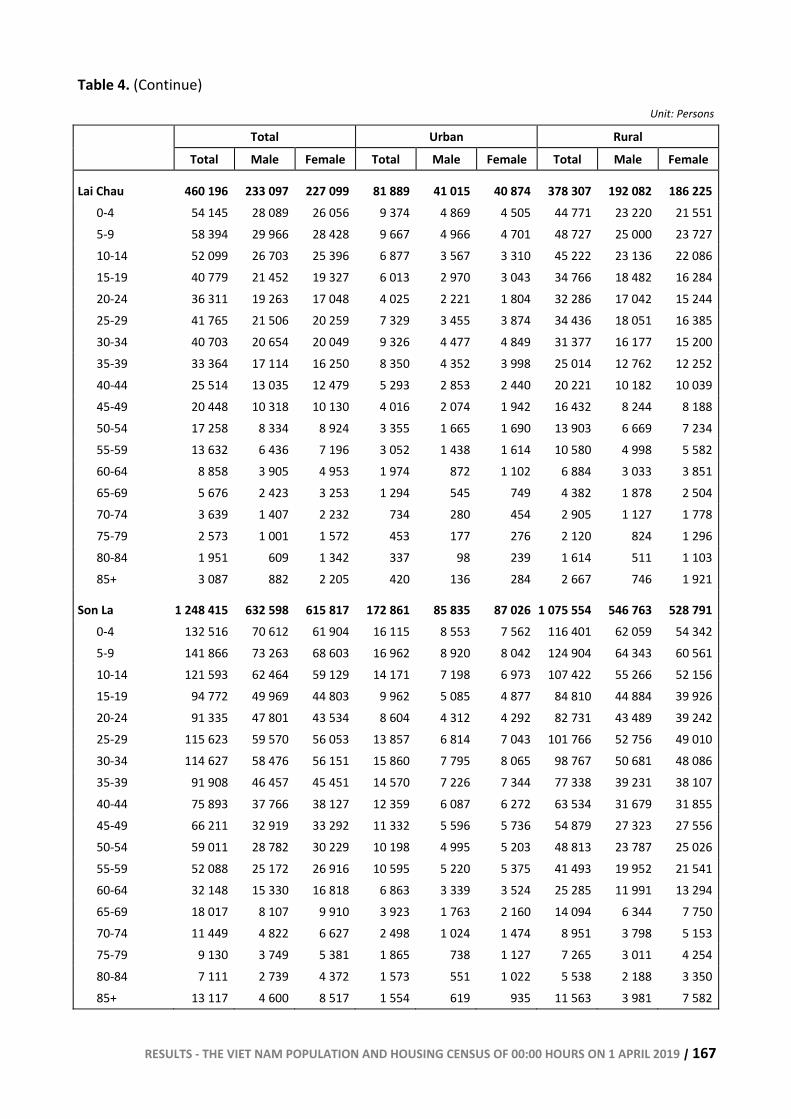
RESULTS - THE VIET NAM POPULATION AND HOUSING CENSUS OF 00:00 HOURS ON 1 APRIL 2019 | 167
Table 4. (Continue)
Unit: Persons
Total Urban Rural
Total Male Female Total Male Female Total Male Female
Lai Chau 460 196 233 097 227 099 81 889 41 015 40 874 378 307 192 082 186 2250-4 54 145 28 089 26 056 9 374 4 869 4 505 44 771 23 220 21 5515-9 58 394 29 966 28 428 9 667 4 966 4 701 48 727 25 000 23 72710-14 52 099 26 703 25 396 6 877 3 567 3 310 45 222 23 136 22 08615-19 40 779 21 452 19 327 6 013 2 970 3 043 34 766 18 482 16 28420-24 36 311 19 263 17 048 4 025 2 221 1 804 32 286 17 042 15 24425-29 41 765 21 506 20 259 7 329 3 455 3 874 34 436 18 051 16 38530-34 40 703 20 654 20 049 9 326 4 477 4 849 31 377 16 177 15 20035-39 33 364 17 114 16 250 8 350 4 352 3 998 25 014 12 762 12 25240-44 25 514 13 035 12 479 5 293 2 853 2 440 20 221 10 182 10 03945-49 20 448 10 318 10 130 4 016 2 074 1 942 16 432 8 244 8 18850-54 17 258 8 334 8 924 3 355 1 665 1 690 13 903 6 669 7 23455-59 13 632 6 436 7 196 3 052 1 438 1 614 10 580 4 998 5 58260-64 8 858 3 905 4 953 1 974 872 1 102 6 884 3 033 3 85165-69 5 676 2 423 3 253 1 294 545 749 4 382 1 878 2 50470-74 3 639 1 407 2 232 734 280 454 2 905 1 127 1 77875-79 2 573 1 001 1 572 453 177 276 2 120 824 1 29680-84 1 951 609 1 342 337 98 239 1 614 511 1 10385+ 3 087 882 2 205 420 136 284 2 667 746 1 921
Son La 1 248 415 632 598 615 817 172 861 85 835 87 026 1 075 554 546 763 528 7910-4 132 516 70 612 61 904 16 115 8 553 7 562 116 401 62 059 54 3425-9 141 866 73 263 68 603 16 962 8 920 8 042 124 904 64 343 60 56110-14 121 593 62 464 59 129 14 171 7 198 6 973 107 422 55 266 52 15615-19 94 772 49 969 44 803 9 962 5 085 4 877 84 810 44 884 39 92620-24 91 335 47 801 43 534 8 604 4 312 4 292 82 731 43 489 39 24225-29 115 623 59 570 56 053 13 857 6 814 7 043 101 766 52 756 49 01030-34 114 627 58 476 56 151 15 860 7 795 8 065 98 767 50 681 48 08635-39 91 908 46 457 45 451 14 570 7 226 7 344 77 338 39 231 38 10740-44 75 893 37 766 38 127 12 359 6 087 6 272 63 534 31 679 31 85545-49 66 211 32 919 33 292 11 332 5 596 5 736 54 879 27 323 27 55650-54 59 011 28 782 30 229 10 198 4 995 5 203 48 813 23 787 25 02655-59 52 088 25 172 26 916 10 595 5 220 5 375 41 493 19 952 21 54160-64 32 148 15 330 16 818 6 863 3 339 3 524 25 285 11 991 13 29465-69 18 017 8 107 9 910 3 923 1 763 2 160 14 094 6 344 7 75070-74 11 449 4 822 6 627 2 498 1 024 1 474 8 951 3 798 5 15375-79 9 130 3 749 5 381 1 865 738 1 127 7 265 3 011 4 25480-84 7 111 2 739 4 372 1 573 551 1 022 5 538 2 188 3 35085+ 13 117 4 600 8 517 1 554 619 935 11 563 3 981 7 582
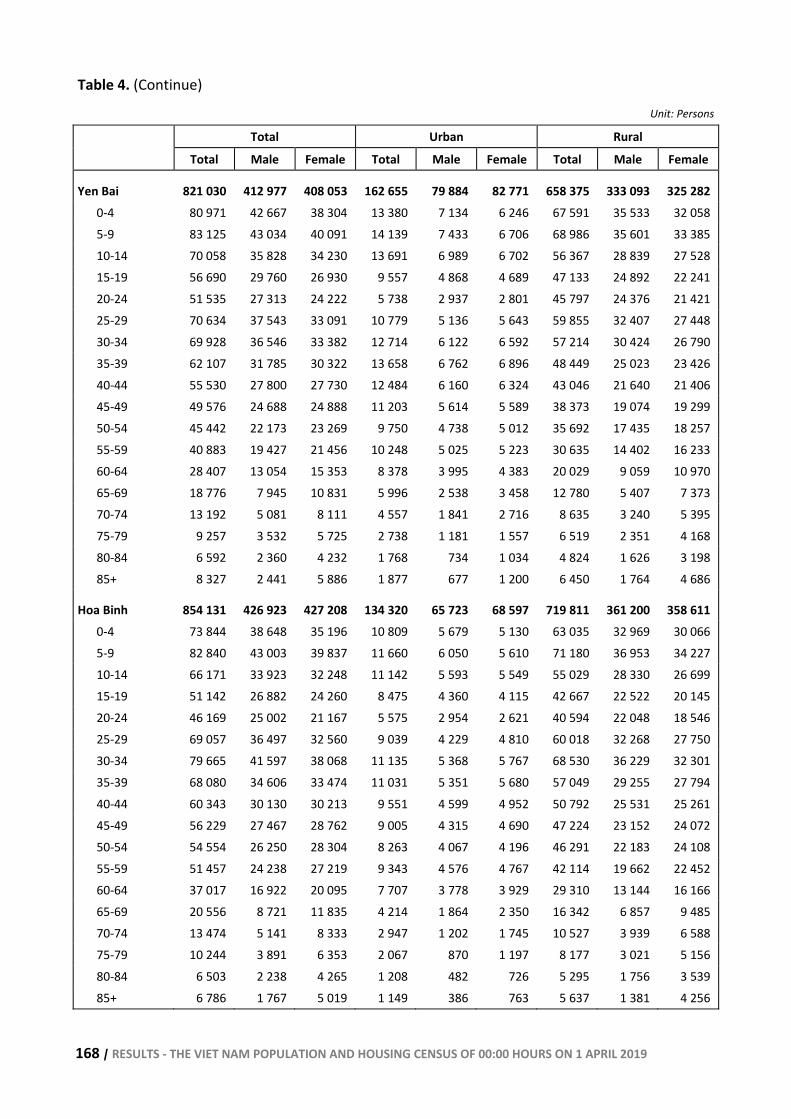
168 | RESULTS - THE VIET NAM POPULATION AND HOUSING CENSUS OF 00:00 HOURS ON 1 APRIL 2019
Table 4. (Continue)
Unit: Persons
Total Urban Rural
Total Male Female Total Male Female Total Male Female
Yen Bai 821 030 412 977 408 053 162 655 79 884 82 771 658 375 333 093 325 282 0-4 80 971 42 667 38 304 13 380 7 134 6 246 67 591 35 533 32 058 5-9 83 125 43 034 40 091 14 139 7 433 6 706 68 986 35 601 33 385 10-14 70 058 35 828 34 230 13 691 6 989 6 702 56 367 28 839 27 528 15-19 56 690 29 760 26 930 9 557 4 868 4 689 47 133 24 892 22 241 20-24 51 535 27 313 24 222 5 738 2 937 2 801 45 797 24 376 21 421 25-29 70 634 37 543 33 091 10 779 5 136 5 643 59 855 32 407 27 448 30-34 69 928 36 546 33 382 12 714 6 122 6 592 57 214 30 424 26 790 35-39 62 107 31 785 30 322 13 658 6 762 6 896 48 449 25 023 23 426 40-44 55 530 27 800 27 730 12 484 6 160 6 324 43 046 21 640 21 406 45-49 49 576 24 688 24 888 11 203 5 614 5 589 38 373 19 074 19 299 50-54 45 442 22 173 23 269 9 750 4 738 5 012 35 692 17 435 18 257 55-59 40 883 19 427 21 456 10 248 5 025 5 223 30 635 14 402 16 233 60-64 28 407 13 054 15 353 8 378 3 995 4 383 20 029 9 059 10 970 65-69 18 776 7 945 10 831 5 996 2 538 3 458 12 780 5 407 7 373 70-74 13 192 5 081 8 111 4 557 1 841 2 716 8 635 3 240 5 395 75-79 9 257 3 532 5 725 2 738 1 181 1 557 6 519 2 351 4 168 80-84 6 592 2 360 4 232 1 768 734 1 034 4 824 1 626 3 198 85+ 8 327 2 441 5 886 1 877 677 1 200 6 450 1 764 4 686
Hoa Binh 854 131 426 923 427 208 134 320 65 723 68 597 719 811 361 200 358 611 0-4 73 844 38 648 35 196 10 809 5 679 5 130 63 035 32 969 30 066 5-9 82 840 43 003 39 837 11 660 6 050 5 610 71 180 36 953 34 227 10-14 66 171 33 923 32 248 11 142 5 593 5 549 55 029 28 330 26 699 15-19 51 142 26 882 24 260 8 475 4 360 4 115 42 667 22 522 20 145 20-24 46 169 25 002 21 167 5 575 2 954 2 621 40 594 22 048 18 546 25-29 69 057 36 497 32 560 9 039 4 229 4 810 60 018 32 268 27 750 30-34 79 665 41 597 38 068 11 135 5 368 5 767 68 530 36 229 32 301 35-39 68 080 34 606 33 474 11 031 5 351 5 680 57 049 29 255 27 794 40-44 60 343 30 130 30 213 9 551 4 599 4 952 50 792 25 531 25 261 45-49 56 229 27 467 28 762 9 005 4 315 4 690 47 224 23 152 24 072 50-54 54 554 26 250 28 304 8 263 4 067 4 196 46 291 22 183 24 108 55-59 51 457 24 238 27 219 9 343 4 576 4 767 42 114 19 662 22 452 60-64 37 017 16 922 20 095 7 707 3 778 3 929 29 310 13 144 16 166 65-69 20 556 8 721 11 835 4 214 1 864 2 350 16 342 6 857 9 485 70-74 13 474 5 141 8 333 2 947 1 202 1 745 10 527 3 939 6 588 75-79 10 244 3 891 6 353 2 067 870 1 197 8 177 3 021 5 156 80-84 6 503 2 238 4 265 1 208 482 726 5 295 1 756 3 539 85+ 6 786 1 767 5 019 1 149 386 763 5 637 1 381 4 256
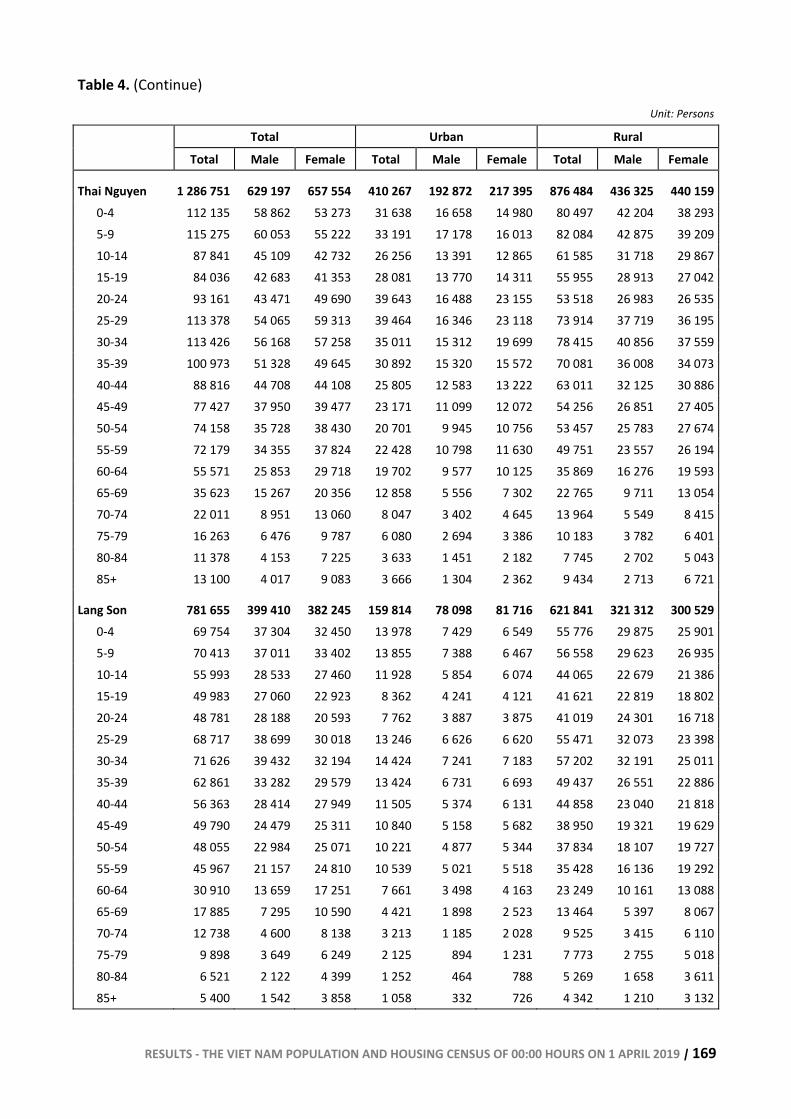
RESULTS - THE VIET NAM POPULATION AND HOUSING CENSUS OF 00:00 HOURS ON 1 APRIL 2019 | 169
Table 4. (Continue)
Unit: Persons
Total Urban Rural
Total Male Female Total Male Female Total Male Female
Thai Nguyen 1 286 751 629 197 657 554 410 267 192 872 217 395 876 484 436 325 440 1590-4 112 135 58 862 53 273 31 638 16 658 14 980 80 497 42 204 38 2935-9 115 275 60 053 55 222 33 191 17 178 16 013 82 084 42 875 39 20910-14 87 841 45 109 42 732 26 256 13 391 12 865 61 585 31 718 29 86715-19 84 036 42 683 41 353 28 081 13 770 14 311 55 955 28 913 27 04220-24 93 161 43 471 49 690 39 643 16 488 23 155 53 518 26 983 26 53525-29 113 378 54 065 59 313 39 464 16 346 23 118 73 914 37 719 36 19530-34 113 426 56 168 57 258 35 011 15 312 19 699 78 415 40 856 37 55935-39 100 973 51 328 49 645 30 892 15 320 15 572 70 081 36 008 34 07340-44 88 816 44 708 44 108 25 805 12 583 13 222 63 011 32 125 30 88645-49 77 427 37 950 39 477 23 171 11 099 12 072 54 256 26 851 27 40550-54 74 158 35 728 38 430 20 701 9 945 10 756 53 457 25 783 27 67455-59 72 179 34 355 37 824 22 428 10 798 11 630 49 751 23 557 26 19460-64 55 571 25 853 29 718 19 702 9 577 10 125 35 869 16 276 19 59365-69 35 623 15 267 20 356 12 858 5 556 7 302 22 765 9 711 13 05470-74 22 011 8 951 13 060 8 047 3 402 4 645 13 964 5 549 8 41575-79 16 263 6 476 9 787 6 080 2 694 3 386 10 183 3 782 6 40180-84 11 378 4 153 7 225 3 633 1 451 2 182 7 745 2 702 5 04385+ 13 100 4 017 9 083 3 666 1 304 2 362 9 434 2 713 6 721
Lang Son 781 655 399 410 382 245 159 814 78 098 81 716 621 841 321 312 300 5290-4 69 754 37 304 32 450 13 978 7 429 6 549 55 776 29 875 25 9015-9 70 413 37 011 33 402 13 855 7 388 6 467 56 558 29 623 26 93510-14 55 993 28 533 27 460 11 928 5 854 6 074 44 065 22 679 21 38615-19 49 983 27 060 22 923 8 362 4 241 4 121 41 621 22 819 18 80220-24 48 781 28 188 20 593 7 762 3 887 3 875 41 019 24 301 16 71825-29 68 717 38 699 30 018 13 246 6 626 6 620 55 471 32 073 23 39830-34 71 626 39 432 32 194 14 424 7 241 7 183 57 202 32 191 25 01135-39 62 861 33 282 29 579 13 424 6 731 6 693 49 437 26 551 22 88640-44 56 363 28 414 27 949 11 505 5 374 6 131 44 858 23 040 21 81845-49 49 790 24 479 25 311 10 840 5 158 5 682 38 950 19 321 19 62950-54 48 055 22 984 25 071 10 221 4 877 5 344 37 834 18 107 19 72755-59 45 967 21 157 24 810 10 539 5 021 5 518 35 428 16 136 19 29260-64 30 910 13 659 17 251 7 661 3 498 4 163 23 249 10 161 13 08865-69 17 885 7 295 10 590 4 421 1 898 2 523 13 464 5 397 8 06770-74 12 738 4 600 8 138 3 213 1 185 2 028 9 525 3 415 6 11075-79 9 898 3 649 6 249 2 125 894 1 231 7 773 2 755 5 01880-84 6 521 2 122 4 399 1 252 464 788 5 269 1 658 3 61185+ 5 400 1 542 3 858 1 058 332 726 4 342 1 210 3 132
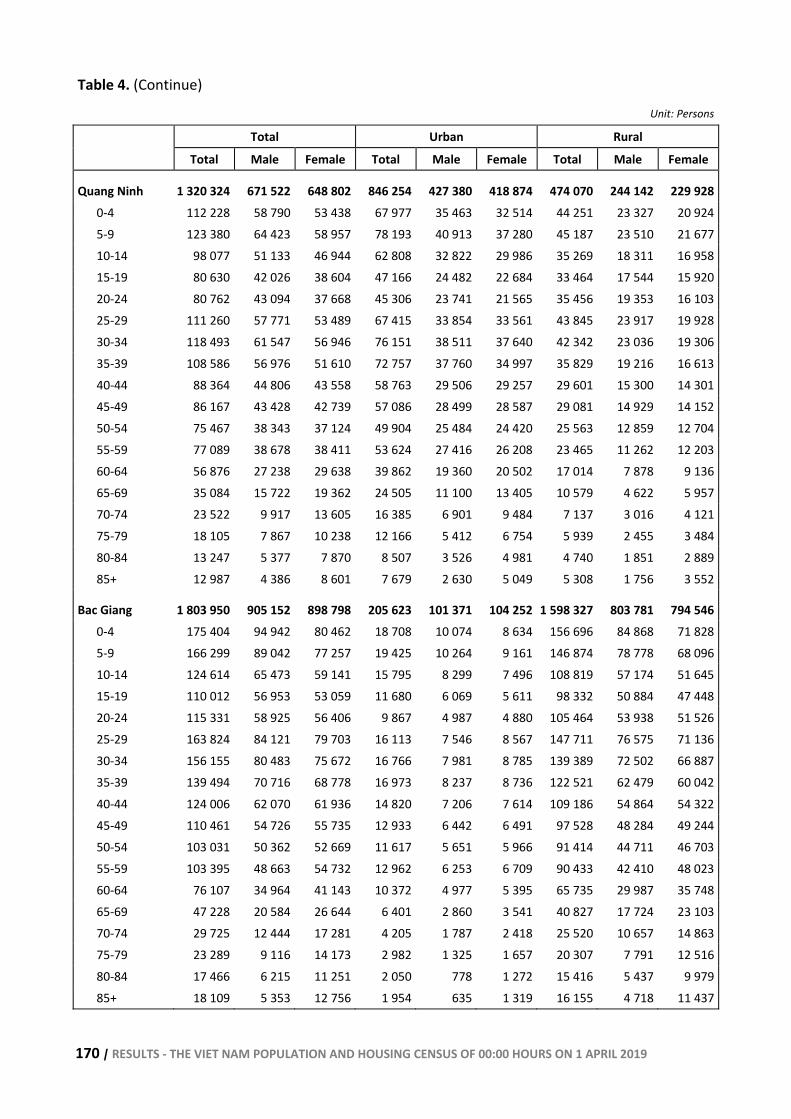
170 | RESULTS - THE VIET NAM POPULATION AND HOUSING CENSUS OF 00:00 HOURS ON 1 APRIL 2019
Table 4. (Continue)
Unit: Persons
Total Urban Rural
Total Male Female Total Male Female Total Male Female
Quang Ninh 1 320 324 671 522 648 802 846 254 427 380 418 874 474 070 244 142 229 9280-4 112 228 58 790 53 438 67 977 35 463 32 514 44 251 23 327 20 9245-9 123 380 64 423 58 957 78 193 40 913 37 280 45 187 23 510 21 67710-14 98 077 51 133 46 944 62 808 32 822 29 986 35 269 18 311 16 95815-19 80 630 42 026 38 604 47 166 24 482 22 684 33 464 17 544 15 92020-24 80 762 43 094 37 668 45 306 23 741 21 565 35 456 19 353 16 10325-29 111 260 57 771 53 489 67 415 33 854 33 561 43 845 23 917 19 92830-34 118 493 61 547 56 946 76 151 38 511 37 640 42 342 23 036 19 30635-39 108 586 56 976 51 610 72 757 37 760 34 997 35 829 19 216 16 61340-44 88 364 44 806 43 558 58 763 29 506 29 257 29 601 15 300 14 30145-49 86 167 43 428 42 739 57 086 28 499 28 587 29 081 14 929 14 15250-54 75 467 38 343 37 124 49 904 25 484 24 420 25 563 12 859 12 70455-59 77 089 38 678 38 411 53 624 27 416 26 208 23 465 11 262 12 20360-64 56 876 27 238 29 638 39 862 19 360 20 502 17 014 7 878 9 13665-69 35 084 15 722 19 362 24 505 11 100 13 405 10 579 4 622 5 95770-74 23 522 9 917 13 605 16 385 6 901 9 484 7 137 3 016 4 12175-79 18 105 7 867 10 238 12 166 5 412 6 754 5 939 2 455 3 48480-84 13 247 5 377 7 870 8 507 3 526 4 981 4 740 1 851 2 88985+ 12 987 4 386 8 601 7 679 2 630 5 049 5 308 1 756 3 552
Bac Giang 1 803 950 905 152 898 798 205 623 101 371 104 252 1 598 327 803 781 794 5460-4 175 404 94 942 80 462 18 708 10 074 8 634 156 696 84 868 71 8285-9 166 299 89 042 77 257 19 425 10 264 9 161 146 874 78 778 68 09610-14 124 614 65 473 59 141 15 795 8 299 7 496 108 819 57 174 51 64515-19 110 012 56 953 53 059 11 680 6 069 5 611 98 332 50 884 47 44820-24 115 331 58 925 56 406 9 867 4 987 4 880 105 464 53 938 51 52625-29 163 824 84 121 79 703 16 113 7 546 8 567 147 711 76 575 71 13630-34 156 155 80 483 75 672 16 766 7 981 8 785 139 389 72 502 66 88735-39 139 494 70 716 68 778 16 973 8 237 8 736 122 521 62 479 60 04240-44 124 006 62 070 61 936 14 820 7 206 7 614 109 186 54 864 54 32245-49 110 461 54 726 55 735 12 933 6 442 6 491 97 528 48 284 49 24450-54 103 031 50 362 52 669 11 617 5 651 5 966 91 414 44 711 46 70355-59 103 395 48 663 54 732 12 962 6 253 6 709 90 433 42 410 48 02360-64 76 107 34 964 41 143 10 372 4 977 5 395 65 735 29 987 35 74865-69 47 228 20 584 26 644 6 401 2 860 3 541 40 827 17 724 23 10370-74 29 725 12 444 17 281 4 205 1 787 2 418 25 520 10 657 14 86375-79 23 289 9 116 14 173 2 982 1 325 1 657 20 307 7 791 12 51680-84 17 466 6 215 11 251 2 050 778 1 272 15 416 5 437 9 97985+ 18 109 5 353 12 756 1 954 635 1 319 16 155 4 718 11 437
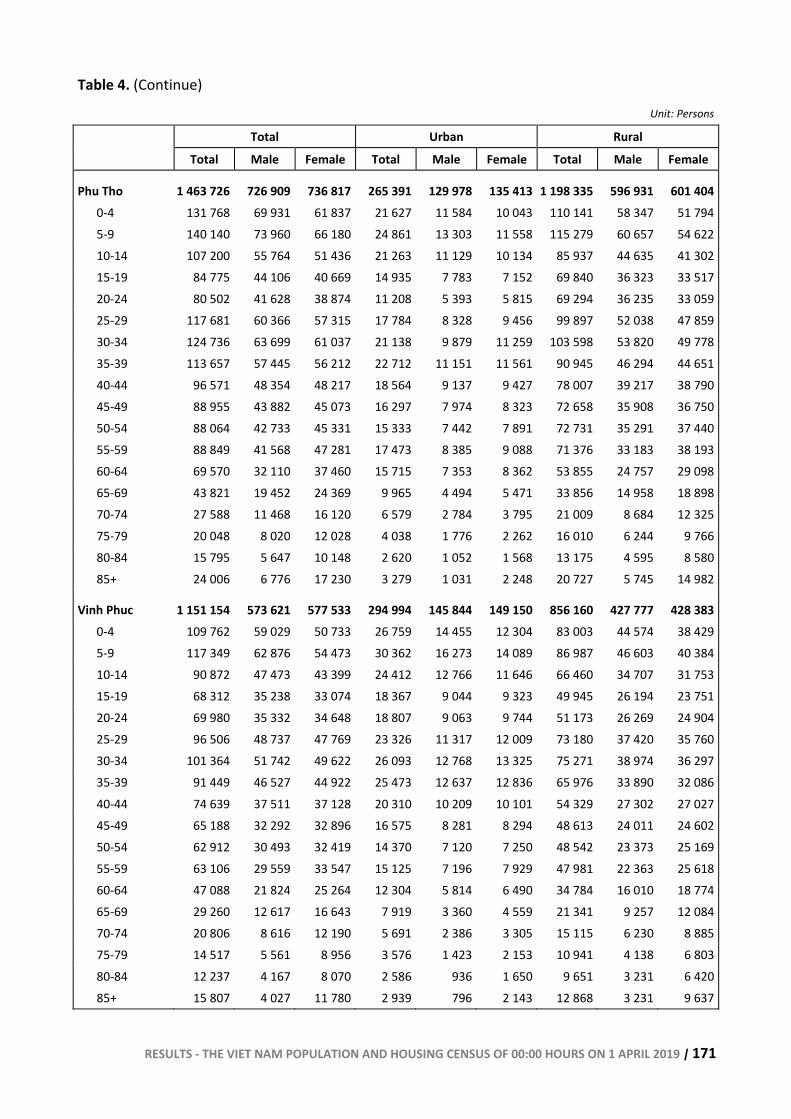
RESULTS - THE VIET NAM POPULATION AND HOUSING CENSUS OF 00:00 HOURS ON 1 APRIL 2019 | 171
Table 4. (Continue)
Unit: Persons
Total Urban Rural
Total Male Female Total Male Female Total Male Female
Phu Tho 1 463 726 726 909 736 817 265 391 129 978 135 413 1 198 335 596 931 601 4040-4 131 768 69 931 61 837 21 627 11 584 10 043 110 141 58 347 51 7945-9 140 140 73 960 66 180 24 861 13 303 11 558 115 279 60 657 54 62210-14 107 200 55 764 51 436 21 263 11 129 10 134 85 937 44 635 41 30215-19 84 775 44 106 40 669 14 935 7 783 7 152 69 840 36 323 33 51720-24 80 502 41 628 38 874 11 208 5 393 5 815 69 294 36 235 33 05925-29 117 681 60 366 57 315 17 784 8 328 9 456 99 897 52 038 47 85930-34 124 736 63 699 61 037 21 138 9 879 11 259 103 598 53 820 49 77835-39 113 657 57 445 56 212 22 712 11 151 11 561 90 945 46 294 44 65140-44 96 571 48 354 48 217 18 564 9 137 9 427 78 007 39 217 38 79045-49 88 955 43 882 45 073 16 297 7 974 8 323 72 658 35 908 36 75050-54 88 064 42 733 45 331 15 333 7 442 7 891 72 731 35 291 37 44055-59 88 849 41 568 47 281 17 473 8 385 9 088 71 376 33 183 38 19360-64 69 570 32 110 37 460 15 715 7 353 8 362 53 855 24 757 29 09865-69 43 821 19 452 24 369 9 965 4 494 5 471 33 856 14 958 18 89870-74 27 588 11 468 16 120 6 579 2 784 3 795 21 009 8 684 12 32575-79 20 048 8 020 12 028 4 038 1 776 2 262 16 010 6 244 9 76680-84 15 795 5 647 10 148 2 620 1 052 1 568 13 175 4 595 8 58085+ 24 006 6 776 17 230 3 279 1 031 2 248 20 727 5 745 14 982
Vinh Phuc 1 151 154 573 621 577 533 294 994 145 844 149 150 856 160 427 777 428 3830-4 109 762 59 029 50 733 26 759 14 455 12 304 83 003 44 574 38 4295-9 117 349 62 876 54 473 30 362 16 273 14 089 86 987 46 603 40 38410-14 90 872 47 473 43 399 24 412 12 766 11 646 66 460 34 707 31 75315-19 68 312 35 238 33 074 18 367 9 044 9 323 49 945 26 194 23 75120-24 69 980 35 332 34 648 18 807 9 063 9 744 51 173 26 269 24 90425-29 96 506 48 737 47 769 23 326 11 317 12 009 73 180 37 420 35 76030-34 101 364 51 742 49 622 26 093 12 768 13 325 75 271 38 974 36 29735-39 91 449 46 527 44 922 25 473 12 637 12 836 65 976 33 890 32 08640-44 74 639 37 511 37 128 20 310 10 209 10 101 54 329 27 302 27 02745-49 65 188 32 292 32 896 16 575 8 281 8 294 48 613 24 011 24 60250-54 62 912 30 493 32 419 14 370 7 120 7 250 48 542 23 373 25 16955-59 63 106 29 559 33 547 15 125 7 196 7 929 47 981 22 363 25 61860-64 47 088 21 824 25 264 12 304 5 814 6 490 34 784 16 010 18 77465-69 29 260 12 617 16 643 7 919 3 360 4 559 21 341 9 257 12 08470-74 20 806 8 616 12 190 5 691 2 386 3 305 15 115 6 230 8 88575-79 14 517 5 561 8 956 3 576 1 423 2 153 10 941 4 138 6 80380-84 12 237 4 167 8 070 2 586 936 1 650 9 651 3 231 6 42085+ 15 807 4 027 11 780 2 939 796 2 143 12 868 3 231 9 637
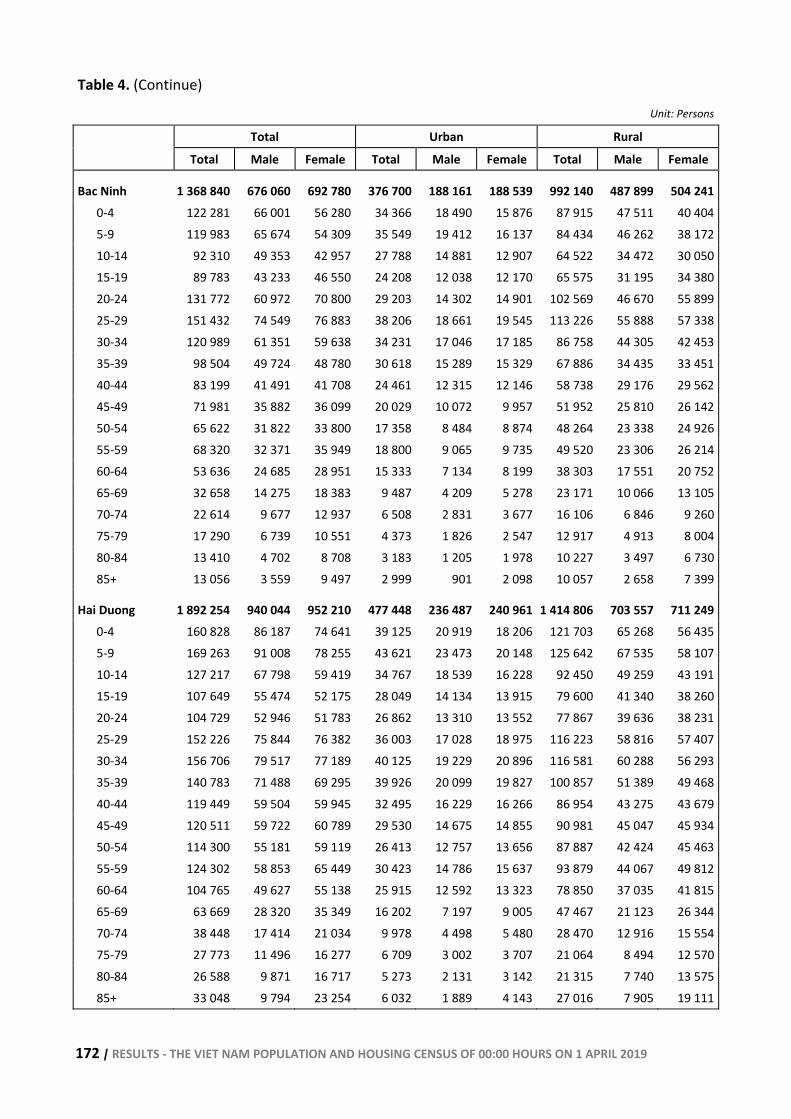
172 | RESULTS - THE VIET NAM POPULATION AND HOUSING CENSUS OF 00:00 HOURS ON 1 APRIL 2019
Table 4. (Continue)
Unit: Persons
Total Urban Rural
Total Male Female Total Male Female Total Male Female
Bac Ninh 1 368 840 676 060 692 780 376 700 188 161 188 539 992 140 487 899 504 2410-4 122 281 66 001 56 280 34 366 18 490 15 876 87 915 47 511 40 4045-9 119 983 65 674 54 309 35 549 19 412 16 137 84 434 46 262 38 17210-14 92 310 49 353 42 957 27 788 14 881 12 907 64 522 34 472 30 05015-19 89 783 43 233 46 550 24 208 12 038 12 170 65 575 31 195 34 38020-24 131 772 60 972 70 800 29 203 14 302 14 901 102 569 46 670 55 89925-29 151 432 74 549 76 883 38 206 18 661 19 545 113 226 55 888 57 33830-34 120 989 61 351 59 638 34 231 17 046 17 185 86 758 44 305 42 45335-39 98 504 49 724 48 780 30 618 15 289 15 329 67 886 34 435 33 45140-44 83 199 41 491 41 708 24 461 12 315 12 146 58 738 29 176 29 56245-49 71 981 35 882 36 099 20 029 10 072 9 957 51 952 25 810 26 14250-54 65 622 31 822 33 800 17 358 8 484 8 874 48 264 23 338 24 92655-59 68 320 32 371 35 949 18 800 9 065 9 735 49 520 23 306 26 21460-64 53 636 24 685 28 951 15 333 7 134 8 199 38 303 17 551 20 75265-69 32 658 14 275 18 383 9 487 4 209 5 278 23 171 10 066 13 10570-74 22 614 9 677 12 937 6 508 2 831 3 677 16 106 6 846 9 26075-79 17 290 6 739 10 551 4 373 1 826 2 547 12 917 4 913 8 00480-84 13 410 4 702 8 708 3 183 1 205 1 978 10 227 3 497 6 73085+ 13 056 3 559 9 497 2 999 901 2 098 10 057 2 658 7 399
Hai Duong 1 892 254 940 044 952 210 477 448 236 487 240 961 1 414 806 703 557 711 2490-4 160 828 86 187 74 641 39 125 20 919 18 206 121 703 65 268 56 4355-9 169 263 91 008 78 255 43 621 23 473 20 148 125 642 67 535 58 10710-14 127 217 67 798 59 419 34 767 18 539 16 228 92 450 49 259 43 19115-19 107 649 55 474 52 175 28 049 14 134 13 915 79 600 41 340 38 26020-24 104 729 52 946 51 783 26 862 13 310 13 552 77 867 39 636 38 23125-29 152 226 75 844 76 382 36 003 17 028 18 975 116 223 58 816 57 40730-34 156 706 79 517 77 189 40 125 19 229 20 896 116 581 60 288 56 29335-39 140 783 71 488 69 295 39 926 20 099 19 827 100 857 51 389 49 46840-44 119 449 59 504 59 945 32 495 16 229 16 266 86 954 43 275 43 67945-49 120 511 59 722 60 789 29 530 14 675 14 855 90 981 45 047 45 93450-54 114 300 55 181 59 119 26 413 12 757 13 656 87 887 42 424 45 46355-59 124 302 58 853 65 449 30 423 14 786 15 637 93 879 44 067 49 81260-64 104 765 49 627 55 138 25 915 12 592 13 323 78 850 37 035 41 81565-69 63 669 28 320 35 349 16 202 7 197 9 005 47 467 21 123 26 34470-74 38 448 17 414 21 034 9 978 4 498 5 480 28 470 12 916 15 55475-79 27 773 11 496 16 277 6 709 3 002 3 707 21 064 8 494 12 57080-84 26 588 9 871 16 717 5 273 2 131 3 142 21 315 7 740 13 57585+ 33 048 9 794 23 254 6 032 1 889 4 143 27 016 7 905 19 111
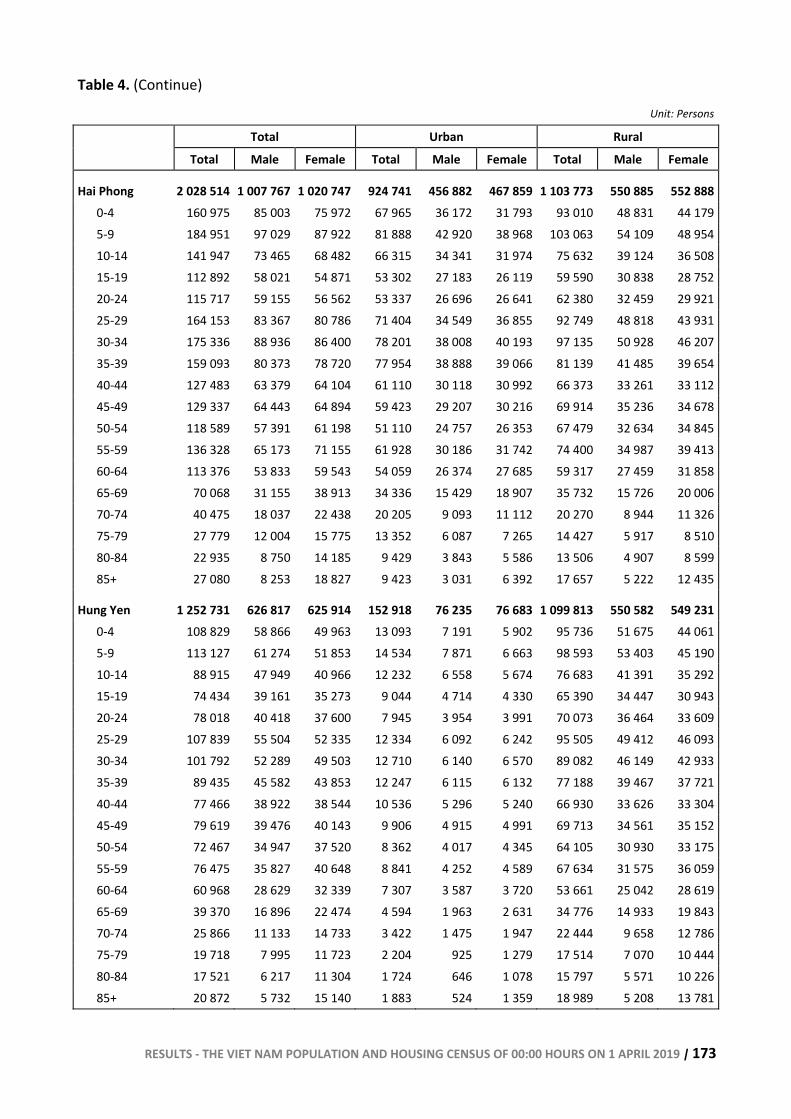
RESULTS - THE VIET NAM POPULATION AND HOUSING CENSUS OF 00:00 HOURS ON 1 APRIL 2019 | 173
Table 4. (Continue)
Unit: Persons
Total Urban Rural
Total Male Female Total Male Female Total Male Female
Hai Phong 2 028 514 1 007 767 1 020 747 924 741 456 882 467 859 1 103 773 550 885 552 8880-4 160 975 85 003 75 972 67 965 36 172 31 793 93 010 48 831 44 1795-9 184 951 97 029 87 922 81 888 42 920 38 968 103 063 54 109 48 95410-14 141 947 73 465 68 482 66 315 34 341 31 974 75 632 39 124 36 50815-19 112 892 58 021 54 871 53 302 27 183 26 119 59 590 30 838 28 75220-24 115 717 59 155 56 562 53 337 26 696 26 641 62 380 32 459 29 92125-29 164 153 83 367 80 786 71 404 34 549 36 855 92 749 48 818 43 93130-34 175 336 88 936 86 400 78 201 38 008 40 193 97 135 50 928 46 20735-39 159 093 80 373 78 720 77 954 38 888 39 066 81 139 41 485 39 65440-44 127 483 63 379 64 104 61 110 30 118 30 992 66 373 33 261 33 11245-49 129 337 64 443 64 894 59 423 29 207 30 216 69 914 35 236 34 67850-54 118 589 57 391 61 198 51 110 24 757 26 353 67 479 32 634 34 84555-59 136 328 65 173 71 155 61 928 30 186 31 742 74 400 34 987 39 41360-64 113 376 53 833 59 543 54 059 26 374 27 685 59 317 27 459 31 85865-69 70 068 31 155 38 913 34 336 15 429 18 907 35 732 15 726 20 00670-74 40 475 18 037 22 438 20 205 9 093 11 112 20 270 8 944 11 32675-79 27 779 12 004 15 775 13 352 6 087 7 265 14 427 5 917 8 51080-84 22 935 8 750 14 185 9 429 3 843 5 586 13 506 4 907 8 59985+ 27 080 8 253 18 827 9 423 3 031 6 392 17 657 5 222 12 435
Hung Yen 1 252 731 626 817 625 914 152 918 76 235 76 683 1 099 813 550 582 549 2310-4 108 829 58 866 49 963 13 093 7 191 5 902 95 736 51 675 44 0615-9 113 127 61 274 51 853 14 534 7 871 6 663 98 593 53 403 45 19010-14 88 915 47 949 40 966 12 232 6 558 5 674 76 683 41 391 35 29215-19 74 434 39 161 35 273 9 044 4 714 4 330 65 390 34 447 30 94320-24 78 018 40 418 37 600 7 945 3 954 3 991 70 073 36 464 33 60925-29 107 839 55 504 52 335 12 334 6 092 6 242 95 505 49 412 46 09330-34 101 792 52 289 49 503 12 710 6 140 6 570 89 082 46 149 42 93335-39 89 435 45 582 43 853 12 247 6 115 6 132 77 188 39 467 37 72140-44 77 466 38 922 38 544 10 536 5 296 5 240 66 930 33 626 33 30445-49 79 619 39 476 40 143 9 906 4 915 4 991 69 713 34 561 35 15250-54 72 467 34 947 37 520 8 362 4 017 4 345 64 105 30 930 33 17555-59 76 475 35 827 40 648 8 841 4 252 4 589 67 634 31 575 36 05960-64 60 968 28 629 32 339 7 307 3 587 3 720 53 661 25 042 28 61965-69 39 370 16 896 22 474 4 594 1 963 2 631 34 776 14 933 19 84370-74 25 866 11 133 14 733 3 422 1 475 1 947 22 444 9 658 12 78675-79 19 718 7 995 11 723 2 204 925 1 279 17 514 7 070 10 44480-84 17 521 6 217 11 304 1 724 646 1 078 15 797 5 571 10 22685+ 20 872 5 732 15 140 1 883 524 1 359 18 989 5 208 13 781
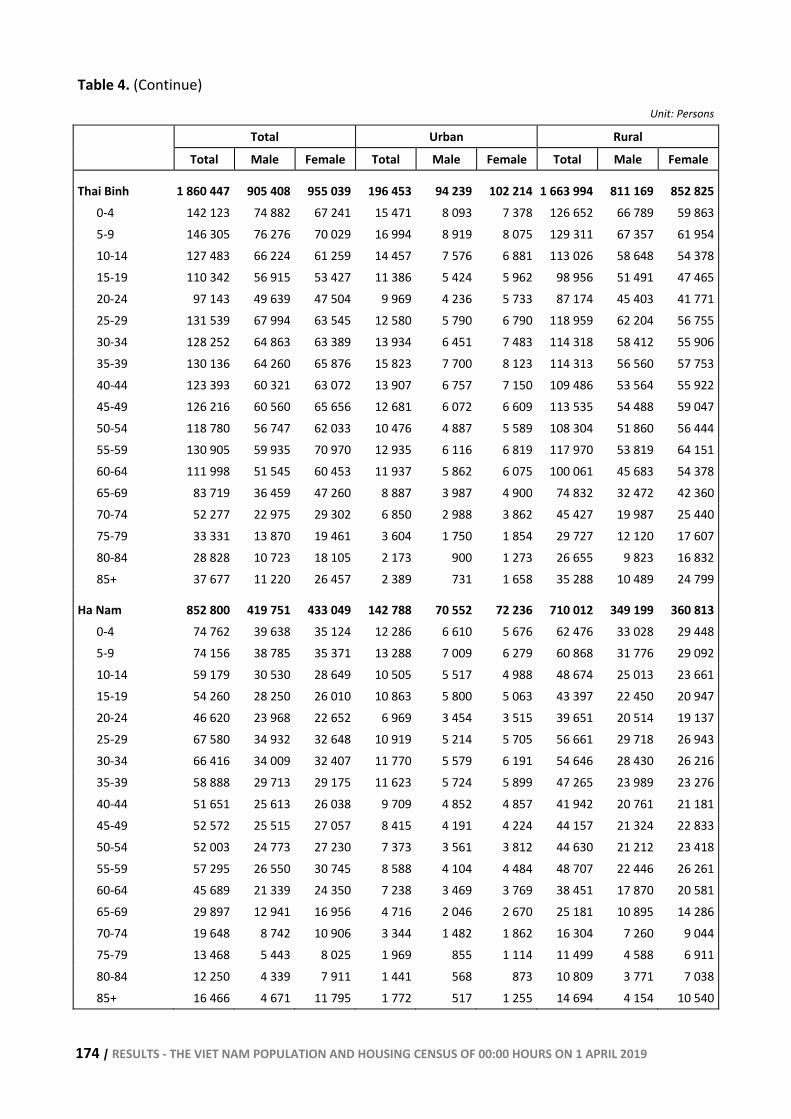
174 | RESULTS - THE VIET NAM POPULATION AND HOUSING CENSUS OF 00:00 HOURS ON 1 APRIL 2019
Table 4. (Continue)
Unit: Persons
Total Urban Rural
Total Male Female Total Male Female Total Male Female
Thai Binh 1 860 447 905 408 955 039 196 453 94 239 102 214 1 663 994 811 169 852 8250-4 142 123 74 882 67 241 15 471 8 093 7 378 126 652 66 789 59 8635-9 146 305 76 276 70 029 16 994 8 919 8 075 129 311 67 357 61 95410-14 127 483 66 224 61 259 14 457 7 576 6 881 113 026 58 648 54 37815-19 110 342 56 915 53 427 11 386 5 424 5 962 98 956 51 491 47 46520-24 97 143 49 639 47 504 9 969 4 236 5 733 87 174 45 403 41 77125-29 131 539 67 994 63 545 12 580 5 790 6 790 118 959 62 204 56 75530-34 128 252 64 863 63 389 13 934 6 451 7 483 114 318 58 412 55 90635-39 130 136 64 260 65 876 15 823 7 700 8 123 114 313 56 560 57 75340-44 123 393 60 321 63 072 13 907 6 757 7 150 109 486 53 564 55 92245-49 126 216 60 560 65 656 12 681 6 072 6 609 113 535 54 488 59 04750-54 118 780 56 747 62 033 10 476 4 887 5 589 108 304 51 860 56 44455-59 130 905 59 935 70 970 12 935 6 116 6 819 117 970 53 819 64 15160-64 111 998 51 545 60 453 11 937 5 862 6 075 100 061 45 683 54 37865-69 83 719 36 459 47 260 8 887 3 987 4 900 74 832 32 472 42 36070-74 52 277 22 975 29 302 6 850 2 988 3 862 45 427 19 987 25 44075-79 33 331 13 870 19 461 3 604 1 750 1 854 29 727 12 120 17 60780-84 28 828 10 723 18 105 2 173 900 1 273 26 655 9 823 16 83285+ 37 677 11 220 26 457 2 389 731 1 658 35 288 10 489 24 799
Ha Nam 852 800 419 751 433 049 142 788 70 552 72 236 710 012 349 199 360 8130-4 74 762 39 638 35 124 12 286 6 610 5 676 62 476 33 028 29 4485-9 74 156 38 785 35 371 13 288 7 009 6 279 60 868 31 776 29 09210-14 59 179 30 530 28 649 10 505 5 517 4 988 48 674 25 013 23 66115-19 54 260 28 250 26 010 10 863 5 800 5 063 43 397 22 450 20 94720-24 46 620 23 968 22 652 6 969 3 454 3 515 39 651 20 514 19 13725-29 67 580 34 932 32 648 10 919 5 214 5 705 56 661 29 718 26 94330-34 66 416 34 009 32 407 11 770 5 579 6 191 54 646 28 430 26 21635-39 58 888 29 713 29 175 11 623 5 724 5 899 47 265 23 989 23 27640-44 51 651 25 613 26 038 9 709 4 852 4 857 41 942 20 761 21 18145-49 52 572 25 515 27 057 8 415 4 191 4 224 44 157 21 324 22 83350-54 52 003 24 773 27 230 7 373 3 561 3 812 44 630 21 212 23 41855-59 57 295 26 550 30 745 8 588 4 104 4 484 48 707 22 446 26 26160-64 45 689 21 339 24 350 7 238 3 469 3 769 38 451 17 870 20 58165-69 29 897 12 941 16 956 4 716 2 046 2 670 25 181 10 895 14 28670-74 19 648 8 742 10 906 3 344 1 482 1 862 16 304 7 260 9 04475-79 13 468 5 443 8 025 1 969 855 1 114 11 499 4 588 6 91180-84 12 250 4 339 7 911 1 441 568 873 10 809 3 771 7 03885+ 16 466 4 671 11 795 1 772 517 1 255 14 694 4 154 10 540
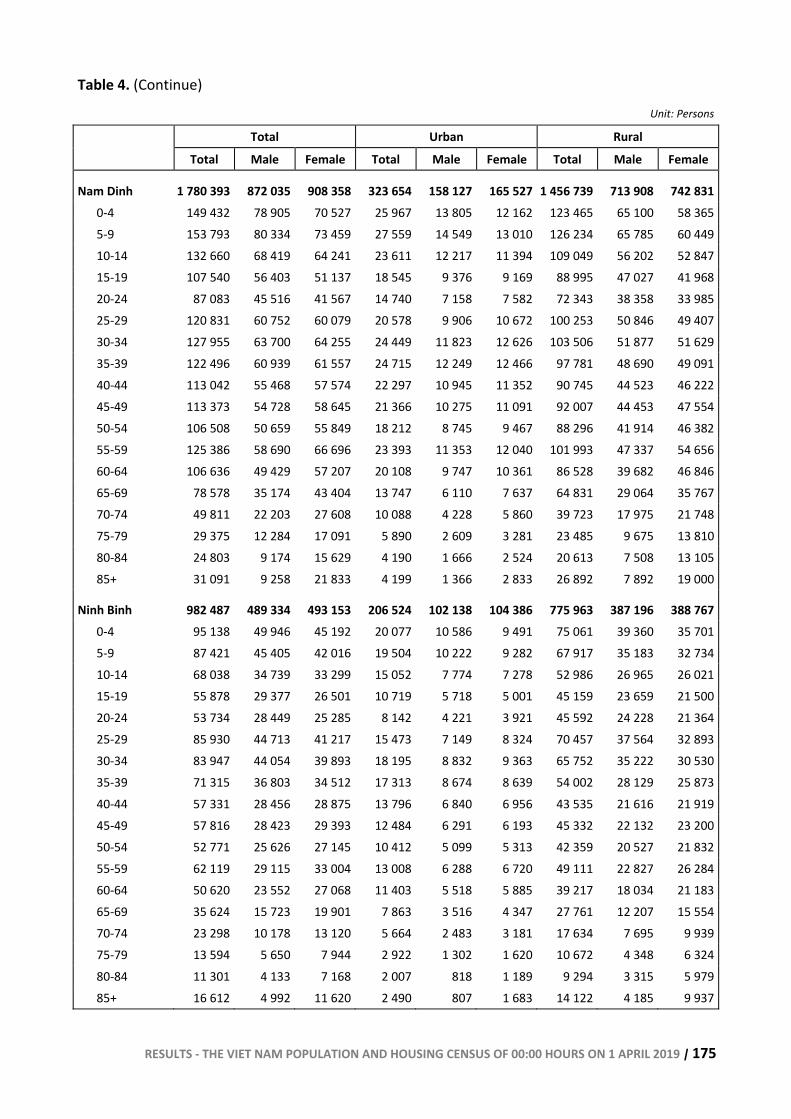
RESULTS - THE VIET NAM POPULATION AND HOUSING CENSUS OF 00:00 HOURS ON 1 APRIL 2019 | 175
Table 4. (Continue)
Unit: Persons
Total Urban Rural
Total Male Female Total Male Female Total Male Female
Nam Dinh 1 780 393 872 035 908 358 323 654 158 127 165 527 1 456 739 713 908 742 8310-4 149 432 78 905 70 527 25 967 13 805 12 162 123 465 65 100 58 3655-9 153 793 80 334 73 459 27 559 14 549 13 010 126 234 65 785 60 44910-14 132 660 68 419 64 241 23 611 12 217 11 394 109 049 56 202 52 84715-19 107 540 56 403 51 137 18 545 9 376 9 169 88 995 47 027 41 96820-24 87 083 45 516 41 567 14 740 7 158 7 582 72 343 38 358 33 98525-29 120 831 60 752 60 079 20 578 9 906 10 672 100 253 50 846 49 40730-34 127 955 63 700 64 255 24 449 11 823 12 626 103 506 51 877 51 62935-39 122 496 60 939 61 557 24 715 12 249 12 466 97 781 48 690 49 09140-44 113 042 55 468 57 574 22 297 10 945 11 352 90 745 44 523 46 22245-49 113 373 54 728 58 645 21 366 10 275 11 091 92 007 44 453 47 55450-54 106 508 50 659 55 849 18 212 8 745 9 467 88 296 41 914 46 38255-59 125 386 58 690 66 696 23 393 11 353 12 040 101 993 47 337 54 65660-64 106 636 49 429 57 207 20 108 9 747 10 361 86 528 39 682 46 84665-69 78 578 35 174 43 404 13 747 6 110 7 637 64 831 29 064 35 76770-74 49 811 22 203 27 608 10 088 4 228 5 860 39 723 17 975 21 74875-79 29 375 12 284 17 091 5 890 2 609 3 281 23 485 9 675 13 81080-84 24 803 9 174 15 629 4 190 1 666 2 524 20 613 7 508 13 10585+ 31 091 9 258 21 833 4 199 1 366 2 833 26 892 7 892 19 000
Ninh Binh 982 487 489 334 493 153 206 524 102 138 104 386 775 963 387 196 388 7670-4 95 138 49 946 45 192 20 077 10 586 9 491 75 061 39 360 35 7015-9 87 421 45 405 42 016 19 504 10 222 9 282 67 917 35 183 32 73410-14 68 038 34 739 33 299 15 052 7 774 7 278 52 986 26 965 26 02115-19 55 878 29 377 26 501 10 719 5 718 5 001 45 159 23 659 21 50020-24 53 734 28 449 25 285 8 142 4 221 3 921 45 592 24 228 21 36425-29 85 930 44 713 41 217 15 473 7 149 8 324 70 457 37 564 32 89330-34 83 947 44 054 39 893 18 195 8 832 9 363 65 752 35 222 30 53035-39 71 315 36 803 34 512 17 313 8 674 8 639 54 002 28 129 25 87340-44 57 331 28 456 28 875 13 796 6 840 6 956 43 535 21 616 21 91945-49 57 816 28 423 29 393 12 484 6 291 6 193 45 332 22 132 23 20050-54 52 771 25 626 27 145 10 412 5 099 5 313 42 359 20 527 21 83255-59 62 119 29 115 33 004 13 008 6 288 6 720 49 111 22 827 26 28460-64 50 620 23 552 27 068 11 403 5 518 5 885 39 217 18 034 21 18365-69 35 624 15 723 19 901 7 863 3 516 4 347 27 761 12 207 15 55470-74 23 298 10 178 13 120 5 664 2 483 3 181 17 634 7 695 9 93975-79 13 594 5 650 7 944 2 922 1 302 1 620 10 672 4 348 6 32480-84 11 301 4 133 7 168 2 007 818 1 189 9 294 3 315 5 97985+ 16 612 4 992 11 620 2 490 807 1 683 14 122 4 185 9 937
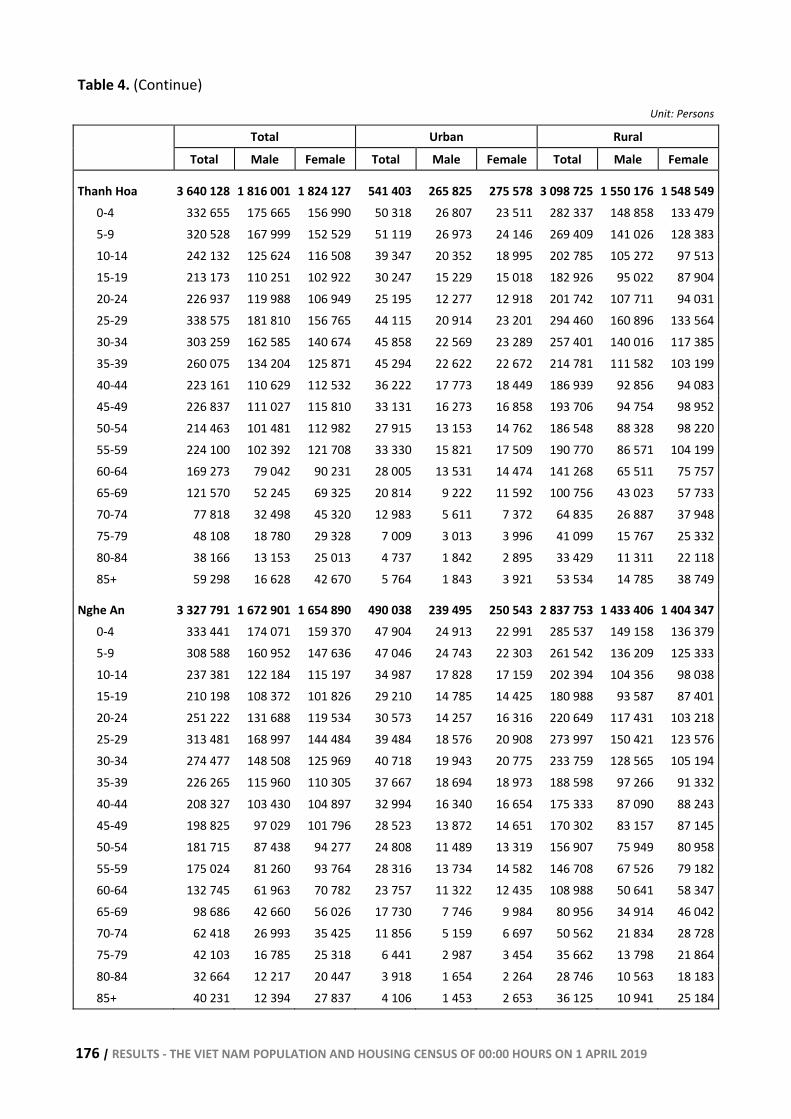
176 | RESULTS - THE VIET NAM POPULATION AND HOUSING CENSUS OF 00:00 HOURS ON 1 APRIL 2019
Table 4. (Continue)
Unit: Persons
Total Urban Rural
Total Male Female Total Male Female Total Male Female
Thanh Hoa 3 640 128 1 816 001 1 824 127 541 403 265 825 275 578 3 098 725 1 550 176 1 548 5490-4 332 655 175 665 156 990 50 318 26 807 23 511 282 337 148 858 133 4795-9 320 528 167 999 152 529 51 119 26 973 24 146 269 409 141 026 128 38310-14 242 132 125 624 116 508 39 347 20 352 18 995 202 785 105 272 97 51315-19 213 173 110 251 102 922 30 247 15 229 15 018 182 926 95 022 87 90420-24 226 937 119 988 106 949 25 195 12 277 12 918 201 742 107 711 94 03125-29 338 575 181 810 156 765 44 115 20 914 23 201 294 460 160 896 133 56430-34 303 259 162 585 140 674 45 858 22 569 23 289 257 401 140 016 117 38535-39 260 075 134 204 125 871 45 294 22 622 22 672 214 781 111 582 103 19940-44 223 161 110 629 112 532 36 222 17 773 18 449 186 939 92 856 94 08345-49 226 837 111 027 115 810 33 131 16 273 16 858 193 706 94 754 98 95250-54 214 463 101 481 112 982 27 915 13 153 14 762 186 548 88 328 98 22055-59 224 100 102 392 121 708 33 330 15 821 17 509 190 770 86 571 104 19960-64 169 273 79 042 90 231 28 005 13 531 14 474 141 268 65 511 75 75765-69 121 570 52 245 69 325 20 814 9 222 11 592 100 756 43 023 57 73370-74 77 818 32 498 45 320 12 983 5 611 7 372 64 835 26 887 37 94875-79 48 108 18 780 29 328 7 009 3 013 3 996 41 099 15 767 25 33280-84 38 166 13 153 25 013 4 737 1 842 2 895 33 429 11 311 22 11885+ 59 298 16 628 42 670 5 764 1 843 3 921 53 534 14 785 38 749
Nghe An 3 327 791 1 672 901 1 654 890 490 038 239 495 250 543 2 837 753 1 433 406 1 404 3470-4 333 441 174 071 159 370 47 904 24 913 22 991 285 537 149 158 136 3795-9 308 588 160 952 147 636 47 046 24 743 22 303 261 542 136 209 125 33310-14 237 381 122 184 115 197 34 987 17 828 17 159 202 394 104 356 98 03815-19 210 198 108 372 101 826 29 210 14 785 14 425 180 988 93 587 87 40120-24 251 222 131 688 119 534 30 573 14 257 16 316 220 649 117 431 103 21825-29 313 481 168 997 144 484 39 484 18 576 20 908 273 997 150 421 123 57630-34 274 477 148 508 125 969 40 718 19 943 20 775 233 759 128 565 105 19435-39 226 265 115 960 110 305 37 667 18 694 18 973 188 598 97 266 91 33240-44 208 327 103 430 104 897 32 994 16 340 16 654 175 333 87 090 88 24345-49 198 825 97 029 101 796 28 523 13 872 14 651 170 302 83 157 87 14550-54 181 715 87 438 94 277 24 808 11 489 13 319 156 907 75 949 80 95855-59 175 024 81 260 93 764 28 316 13 734 14 582 146 708 67 526 79 18260-64 132 745 61 963 70 782 23 757 11 322 12 435 108 988 50 641 58 34765-69 98 686 42 660 56 026 17 730 7 746 9 984 80 956 34 914 46 04270-74 62 418 26 993 35 425 11 856 5 159 6 697 50 562 21 834 28 72875-79 42 103 16 785 25 318 6 441 2 987 3 454 35 662 13 798 21 86480-84 32 664 12 217 20 447 3 918 1 654 2 264 28 746 10 563 18 18385+ 40 231 12 394 27 837 4 106 1 453 2 653 36 125 10 941 25 184
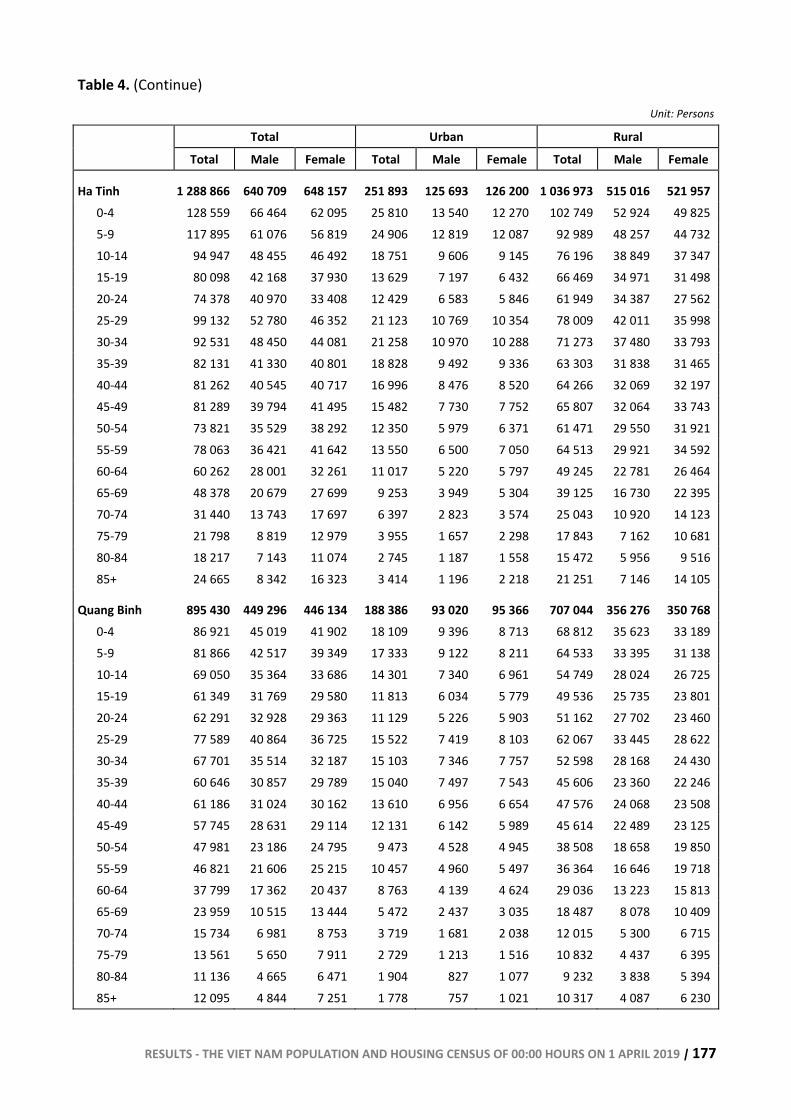
RESULTS - THE VIET NAM POPULATION AND HOUSING CENSUS OF 00:00 HOURS ON 1 APRIL 2019 | 177
Table 4. (Continue)
Unit: Persons
Total Urban Rural
Total Male Female Total Male Female Total Male Female
Ha Tinh 1 288 866 640 709 648 157 251 893 125 693 126 200 1 036 973 515 016 521 957 0-4 128 559 66 464 62 095 25 810 13 540 12 270 102 749 52 924 49 825 5-9 117 895 61 076 56 819 24 906 12 819 12 087 92 989 48 257 44 732 10-14 94 947 48 455 46 492 18 751 9 606 9 145 76 196 38 849 37 347 15-19 80 098 42 168 37 930 13 629 7 197 6 432 66 469 34 971 31 498 20-24 74 378 40 970 33 408 12 429 6 583 5 846 61 949 34 387 27 562 25-29 99 132 52 780 46 352 21 123 10 769 10 354 78 009 42 011 35 998 30-34 92 531 48 450 44 081 21 258 10 970 10 288 71 273 37 480 33 793 35-39 82 131 41 330 40 801 18 828 9 492 9 336 63 303 31 838 31 465 40-44 81 262 40 545 40 717 16 996 8 476 8 520 64 266 32 069 32 197 45-49 81 289 39 794 41 495 15 482 7 730 7 752 65 807 32 064 33 743 50-54 73 821 35 529 38 292 12 350 5 979 6 371 61 471 29 550 31 921 55-59 78 063 36 421 41 642 13 550 6 500 7 050 64 513 29 921 34 592 60-64 60 262 28 001 32 261 11 017 5 220 5 797 49 245 22 781 26 464 65-69 48 378 20 679 27 699 9 253 3 949 5 304 39 125 16 730 22 395 70-74 31 440 13 743 17 697 6 397 2 823 3 574 25 043 10 920 14 123 75-79 21 798 8 819 12 979 3 955 1 657 2 298 17 843 7 162 10 681 80-84 18 217 7 143 11 074 2 745 1 187 1 558 15 472 5 956 9 516 85+ 24 665 8 342 16 323 3 414 1 196 2 218 21 251 7 146 14 105
Quang Binh 895 430 449 296 446 134 188 386 93 020 95 366 707 044 356 276 350 768 0-4 86 921 45 019 41 902 18 109 9 396 8 713 68 812 35 623 33 189 5-9 81 866 42 517 39 349 17 333 9 122 8 211 64 533 33 395 31 138 10-14 69 050 35 364 33 686 14 301 7 340 6 961 54 749 28 024 26 725 15-19 61 349 31 769 29 580 11 813 6 034 5 779 49 536 25 735 23 801 20-24 62 291 32 928 29 363 11 129 5 226 5 903 51 162 27 702 23 460 25-29 77 589 40 864 36 725 15 522 7 419 8 103 62 067 33 445 28 622 30-34 67 701 35 514 32 187 15 103 7 346 7 757 52 598 28 168 24 430 35-39 60 646 30 857 29 789 15 040 7 497 7 543 45 606 23 360 22 246 40-44 61 186 31 024 30 162 13 610 6 956 6 654 47 576 24 068 23 508 45-49 57 745 28 631 29 114 12 131 6 142 5 989 45 614 22 489 23 125 50-54 47 981 23 186 24 795 9 473 4 528 4 945 38 508 18 658 19 850 55-59 46 821 21 606 25 215 10 457 4 960 5 497 36 364 16 646 19 718 60-64 37 799 17 362 20 437 8 763 4 139 4 624 29 036 13 223 15 813 65-69 23 959 10 515 13 444 5 472 2 437 3 035 18 487 8 078 10 409 70-74 15 734 6 981 8 753 3 719 1 681 2 038 12 015 5 300 6 715 75-79 13 561 5 650 7 911 2 729 1 213 1 516 10 832 4 437 6 395 80-84 11 136 4 665 6 471 1 904 827 1 077 9 232 3 838 5 394 85+ 12 095 4 844 7 251 1 778 757 1 021 10 317 4 087 6 230
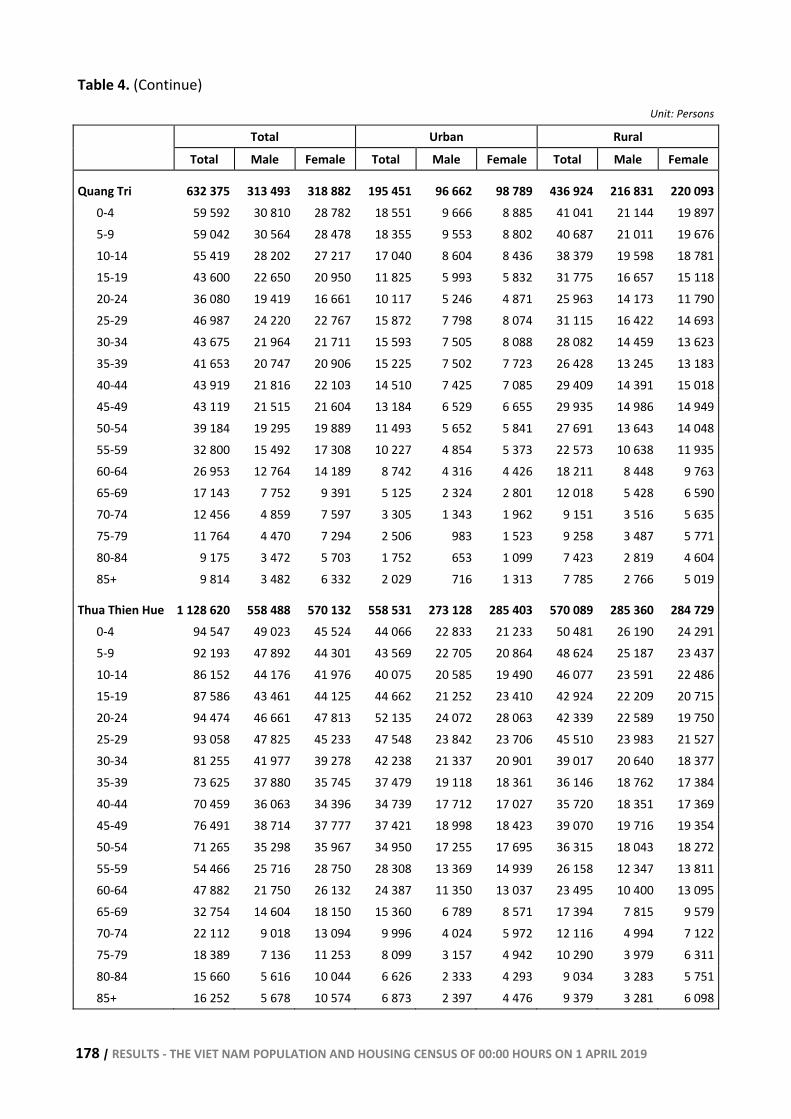
178 | RESULTS - THE VIET NAM POPULATION AND HOUSING CENSUS OF 00:00 HOURS ON 1 APRIL 2019
Table 4. (Continue)
Unit: Persons
Total Urban Rural
Total Male Female Total Male Female Total Male Female
Quang Tri 632 375 313 493 318 882 195 451 96 662 98 789 436 924 216 831 220 0930-4 59 592 30 810 28 782 18 551 9 666 8 885 41 041 21 144 19 8975-9 59 042 30 564 28 478 18 355 9 553 8 802 40 687 21 011 19 67610-14 55 419 28 202 27 217 17 040 8 604 8 436 38 379 19 598 18 78115-19 43 600 22 650 20 950 11 825 5 993 5 832 31 775 16 657 15 11820-24 36 080 19 419 16 661 10 117 5 246 4 871 25 963 14 173 11 79025-29 46 987 24 220 22 767 15 872 7 798 8 074 31 115 16 422 14 69330-34 43 675 21 964 21 711 15 593 7 505 8 088 28 082 14 459 13 62335-39 41 653 20 747 20 906 15 225 7 502 7 723 26 428 13 245 13 18340-44 43 919 21 816 22 103 14 510 7 425 7 085 29 409 14 391 15 01845-49 43 119 21 515 21 604 13 184 6 529 6 655 29 935 14 986 14 94950-54 39 184 19 295 19 889 11 493 5 652 5 841 27 691 13 643 14 04855-59 32 800 15 492 17 308 10 227 4 854 5 373 22 573 10 638 11 93560-64 26 953 12 764 14 189 8 742 4 316 4 426 18 211 8 448 9 76365-69 17 143 7 752 9 391 5 125 2 324 2 801 12 018 5 428 6 59070-74 12 456 4 859 7 597 3 305 1 343 1 962 9 151 3 516 5 63575-79 11 764 4 470 7 294 2 506 983 1 523 9 258 3 487 5 77180-84 9 175 3 472 5 703 1 752 653 1 099 7 423 2 819 4 60485+ 9 814 3 482 6 332 2 029 716 1 313 7 785 2 766 5 019
Thua Thien Hue 1 128 620 558 488 570 132 558 531 273 128 285 403 570 089 285 360 284 7290-4 94 547 49 023 45 524 44 066 22 833 21 233 50 481 26 190 24 2915-9 92 193 47 892 44 301 43 569 22 705 20 864 48 624 25 187 23 43710-14 86 152 44 176 41 976 40 075 20 585 19 490 46 077 23 591 22 48615-19 87 586 43 461 44 125 44 662 21 252 23 410 42 924 22 209 20 71520-24 94 474 46 661 47 813 52 135 24 072 28 063 42 339 22 589 19 75025-29 93 058 47 825 45 233 47 548 23 842 23 706 45 510 23 983 21 52730-34 81 255 41 977 39 278 42 238 21 337 20 901 39 017 20 640 18 37735-39 73 625 37 880 35 745 37 479 19 118 18 361 36 146 18 762 17 38440-44 70 459 36 063 34 396 34 739 17 712 17 027 35 720 18 351 17 36945-49 76 491 38 714 37 777 37 421 18 998 18 423 39 070 19 716 19 35450-54 71 265 35 298 35 967 34 950 17 255 17 695 36 315 18 043 18 27255-59 54 466 25 716 28 750 28 308 13 369 14 939 26 158 12 347 13 81160-64 47 882 21 750 26 132 24 387 11 350 13 037 23 495 10 400 13 09565-69 32 754 14 604 18 150 15 360 6 789 8 571 17 394 7 815 9 57970-74 22 112 9 018 13 094 9 996 4 024 5 972 12 116 4 994 7 12275-79 18 389 7 136 11 253 8 099 3 157 4 942 10 290 3 979 6 31180-84 15 660 5 616 10 044 6 626 2 333 4 293 9 034 3 283 5 75185+ 16 252 5 678 10 574 6 873 2 397 4 476 9 379 3 281 6 098
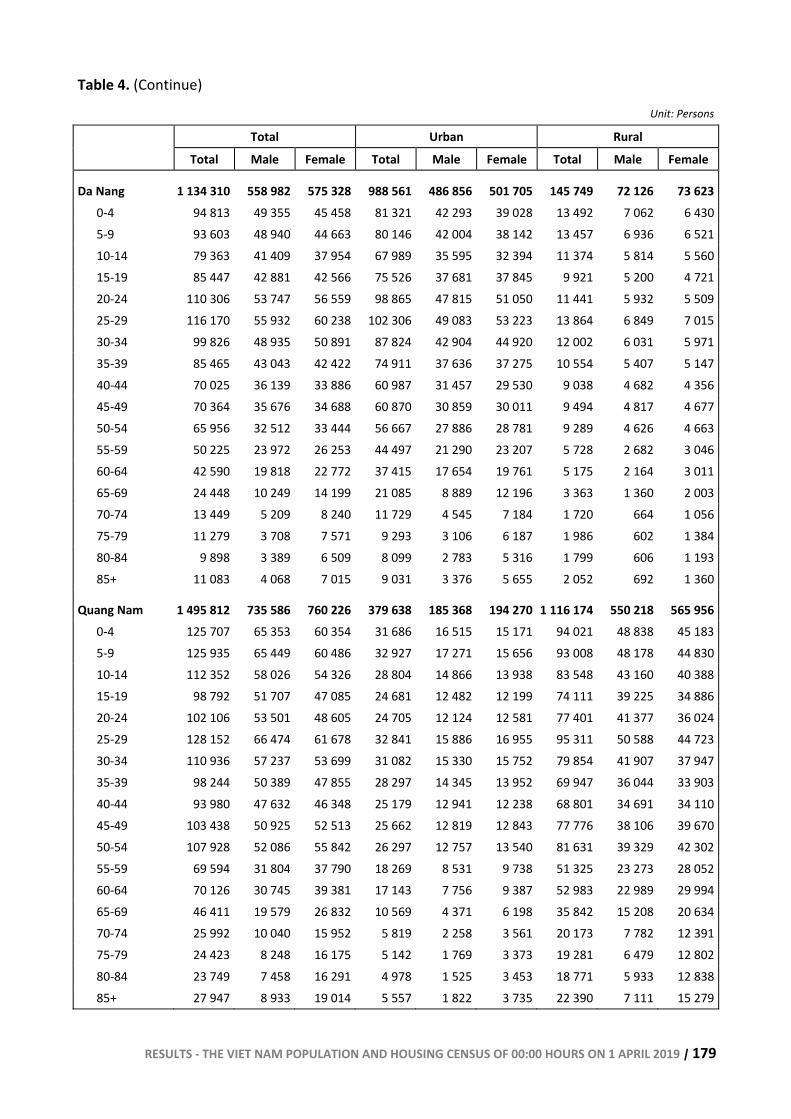
RESULTS - THE VIET NAM POPULATION AND HOUSING CENSUS OF 00:00 HOURS ON 1 APRIL 2019 | 179
Table 4. (Continue)
Unit: Persons
Total Urban Rural
Total Male Female Total Male Female Total Male Female
Da Nang 1 134 310 558 982 575 328 988 561 486 856 501 705 145 749 72 126 73 6230-4 94 813 49 355 45 458 81 321 42 293 39 028 13 492 7 062 6 4305-9 93 603 48 940 44 663 80 146 42 004 38 142 13 457 6 936 6 52110-14 79 363 41 409 37 954 67 989 35 595 32 394 11 374 5 814 5 56015-19 85 447 42 881 42 566 75 526 37 681 37 845 9 921 5 200 4 72120-24 110 306 53 747 56 559 98 865 47 815 51 050 11 441 5 932 5 50925-29 116 170 55 932 60 238 102 306 49 083 53 223 13 864 6 849 7 01530-34 99 826 48 935 50 891 87 824 42 904 44 920 12 002 6 031 5 97135-39 85 465 43 043 42 422 74 911 37 636 37 275 10 554 5 407 5 14740-44 70 025 36 139 33 886 60 987 31 457 29 530 9 038 4 682 4 35645-49 70 364 35 676 34 688 60 870 30 859 30 011 9 494 4 817 4 67750-54 65 956 32 512 33 444 56 667 27 886 28 781 9 289 4 626 4 66355-59 50 225 23 972 26 253 44 497 21 290 23 207 5 728 2 682 3 04660-64 42 590 19 818 22 772 37 415 17 654 19 761 5 175 2 164 3 01165-69 24 448 10 249 14 199 21 085 8 889 12 196 3 363 1 360 2 00370-74 13 449 5 209 8 240 11 729 4 545 7 184 1 720 664 1 05675-79 11 279 3 708 7 571 9 293 3 106 6 187 1 986 602 1 38480-84 9 898 3 389 6 509 8 099 2 783 5 316 1 799 606 1 19385+ 11 083 4 068 7 015 9 031 3 376 5 655 2 052 692 1 360
Quang Nam 1 495 812 735 586 760 226 379 638 185 368 194 270 1 116 174 550 218 565 9560-4 125 707 65 353 60 354 31 686 16 515 15 171 94 021 48 838 45 1835-9 125 935 65 449 60 486 32 927 17 271 15 656 93 008 48 178 44 83010-14 112 352 58 026 54 326 28 804 14 866 13 938 83 548 43 160 40 38815-19 98 792 51 707 47 085 24 681 12 482 12 199 74 111 39 225 34 88620-24 102 106 53 501 48 605 24 705 12 124 12 581 77 401 41 377 36 02425-29 128 152 66 474 61 678 32 841 15 886 16 955 95 311 50 588 44 72330-34 110 936 57 237 53 699 31 082 15 330 15 752 79 854 41 907 37 94735-39 98 244 50 389 47 855 28 297 14 345 13 952 69 947 36 044 33 90340-44 93 980 47 632 46 348 25 179 12 941 12 238 68 801 34 691 34 11045-49 103 438 50 925 52 513 25 662 12 819 12 843 77 776 38 106 39 67050-54 107 928 52 086 55 842 26 297 12 757 13 540 81 631 39 329 42 30255-59 69 594 31 804 37 790 18 269 8 531 9 738 51 325 23 273 28 05260-64 70 126 30 745 39 381 17 143 7 756 9 387 52 983 22 989 29 99465-69 46 411 19 579 26 832 10 569 4 371 6 198 35 842 15 208 20 63470-74 25 992 10 040 15 952 5 819 2 258 3 561 20 173 7 782 12 39175-79 24 423 8 248 16 175 5 142 1 769 3 373 19 281 6 479 12 80280-84 23 749 7 458 16 291 4 978 1 525 3 453 18 771 5 933 12 83885+ 27 947 8 933 19 014 5 557 1 822 3 735 22 390 7 111 15 279
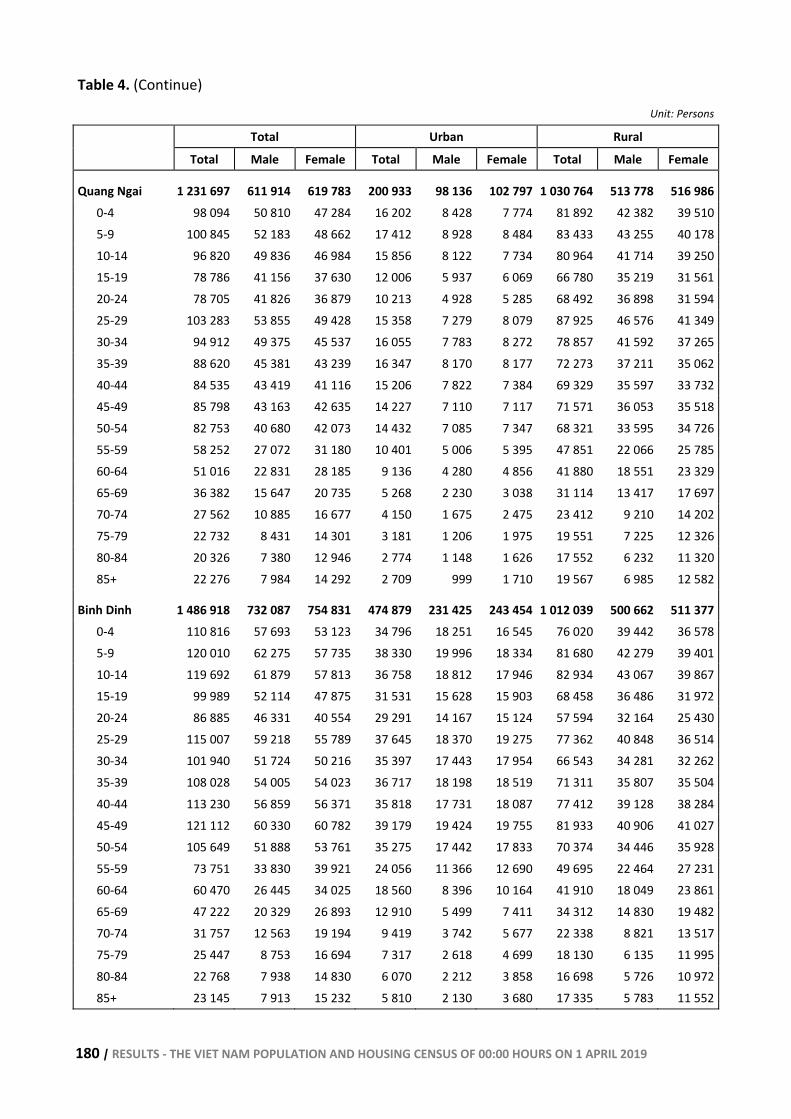
180 | RESULTS - THE VIET NAM POPULATION AND HOUSING CENSUS OF 00:00 HOURS ON 1 APRIL 2019
Table 4. (Continue)
Unit: Persons
Total Urban Rural
Total Male Female Total Male Female Total Male Female
Quang Ngai 1 231 697 611 914 619 783 200 933 98 136 102 797 1 030 764 513 778 516 9860-4 98 094 50 810 47 284 16 202 8 428 7 774 81 892 42 382 39 5105-9 100 845 52 183 48 662 17 412 8 928 8 484 83 433 43 255 40 17810-14 96 820 49 836 46 984 15 856 8 122 7 734 80 964 41 714 39 25015-19 78 786 41 156 37 630 12 006 5 937 6 069 66 780 35 219 31 56120-24 78 705 41 826 36 879 10 213 4 928 5 285 68 492 36 898 31 59425-29 103 283 53 855 49 428 15 358 7 279 8 079 87 925 46 576 41 34930-34 94 912 49 375 45 537 16 055 7 783 8 272 78 857 41 592 37 26535-39 88 620 45 381 43 239 16 347 8 170 8 177 72 273 37 211 35 06240-44 84 535 43 419 41 116 15 206 7 822 7 384 69 329 35 597 33 73245-49 85 798 43 163 42 635 14 227 7 110 7 117 71 571 36 053 35 51850-54 82 753 40 680 42 073 14 432 7 085 7 347 68 321 33 595 34 72655-59 58 252 27 072 31 180 10 401 5 006 5 395 47 851 22 066 25 78560-64 51 016 22 831 28 185 9 136 4 280 4 856 41 880 18 551 23 32965-69 36 382 15 647 20 735 5 268 2 230 3 038 31 114 13 417 17 69770-74 27 562 10 885 16 677 4 150 1 675 2 475 23 412 9 210 14 20275-79 22 732 8 431 14 301 3 181 1 206 1 975 19 551 7 225 12 32680-84 20 326 7 380 12 946 2 774 1 148 1 626 17 552 6 232 11 32085+ 22 276 7 984 14 292 2 709 999 1 710 19 567 6 985 12 582
Binh Dinh 1 486 918 732 087 754 831 474 879 231 425 243 454 1 012 039 500 662 511 3770-4 110 816 57 693 53 123 34 796 18 251 16 545 76 020 39 442 36 5785-9 120 010 62 275 57 735 38 330 19 996 18 334 81 680 42 279 39 40110-14 119 692 61 879 57 813 36 758 18 812 17 946 82 934 43 067 39 86715-19 99 989 52 114 47 875 31 531 15 628 15 903 68 458 36 486 31 97220-24 86 885 46 331 40 554 29 291 14 167 15 124 57 594 32 164 25 43025-29 115 007 59 218 55 789 37 645 18 370 19 275 77 362 40 848 36 51430-34 101 940 51 724 50 216 35 397 17 443 17 954 66 543 34 281 32 26235-39 108 028 54 005 54 023 36 717 18 198 18 519 71 311 35 807 35 50440-44 113 230 56 859 56 371 35 818 17 731 18 087 77 412 39 128 38 28445-49 121 112 60 330 60 782 39 179 19 424 19 755 81 933 40 906 41 02750-54 105 649 51 888 53 761 35 275 17 442 17 833 70 374 34 446 35 92855-59 73 751 33 830 39 921 24 056 11 366 12 690 49 695 22 464 27 23160-64 60 470 26 445 34 025 18 560 8 396 10 164 41 910 18 049 23 86165-69 47 222 20 329 26 893 12 910 5 499 7 411 34 312 14 830 19 48270-74 31 757 12 563 19 194 9 419 3 742 5 677 22 338 8 821 13 51775-79 25 447 8 753 16 694 7 317 2 618 4 699 18 130 6 135 11 99580-84 22 768 7 938 14 830 6 070 2 212 3 858 16 698 5 726 10 97285+ 23 145 7 913 15 232 5 810 2 130 3 680 17 335 5 783 11 552
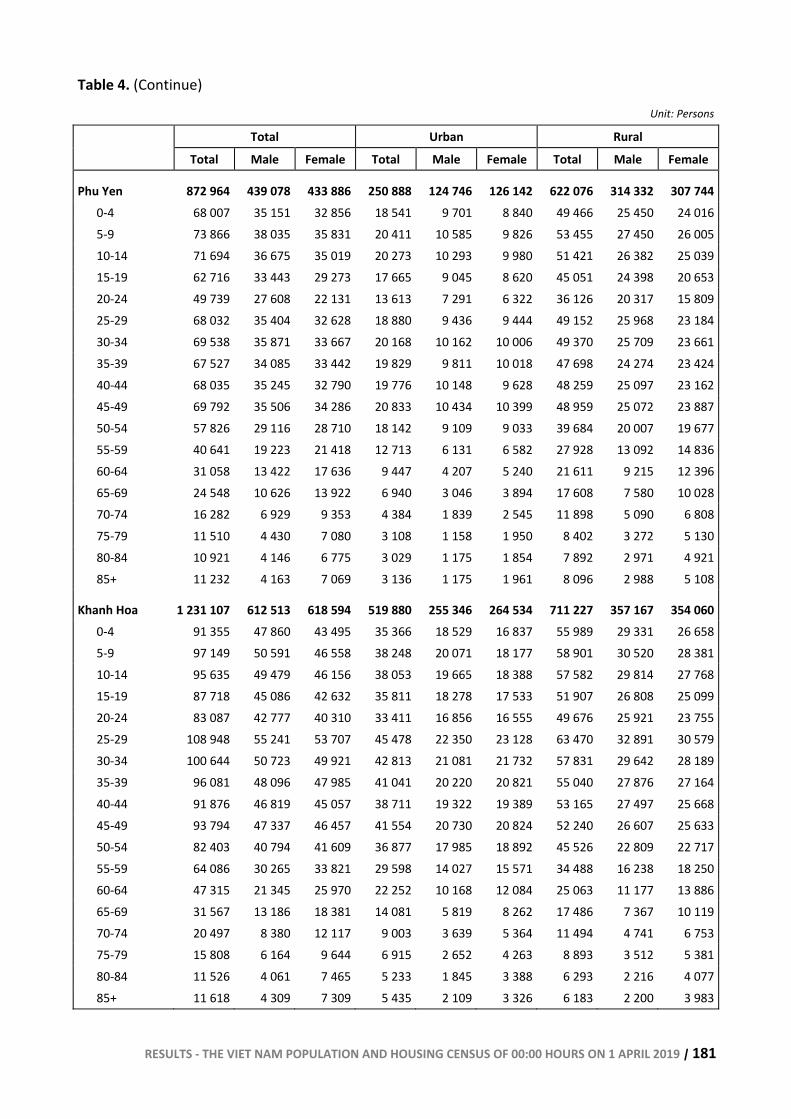
RESULTS - THE VIET NAM POPULATION AND HOUSING CENSUS OF 00:00 HOURS ON 1 APRIL 2019 | 181
Table 4. (Continue)
Unit: Persons
Total Urban Rural
Total Male Female Total Male Female Total Male Female
Phu Yen 872 964 439 078 433 886 250 888 124 746 126 142 622 076 314 332 307 7440-4 68 007 35 151 32 856 18 541 9 701 8 840 49 466 25 450 24 0165-9 73 866 38 035 35 831 20 411 10 585 9 826 53 455 27 450 26 00510-14 71 694 36 675 35 019 20 273 10 293 9 980 51 421 26 382 25 03915-19 62 716 33 443 29 273 17 665 9 045 8 620 45 051 24 398 20 65320-24 49 739 27 608 22 131 13 613 7 291 6 322 36 126 20 317 15 80925-29 68 032 35 404 32 628 18 880 9 436 9 444 49 152 25 968 23 18430-34 69 538 35 871 33 667 20 168 10 162 10 006 49 370 25 709 23 66135-39 67 527 34 085 33 442 19 829 9 811 10 018 47 698 24 274 23 42440-44 68 035 35 245 32 790 19 776 10 148 9 628 48 259 25 097 23 16245-49 69 792 35 506 34 286 20 833 10 434 10 399 48 959 25 072 23 88750-54 57 826 29 116 28 710 18 142 9 109 9 033 39 684 20 007 19 67755-59 40 641 19 223 21 418 12 713 6 131 6 582 27 928 13 092 14 83660-64 31 058 13 422 17 636 9 447 4 207 5 240 21 611 9 215 12 39665-69 24 548 10 626 13 922 6 940 3 046 3 894 17 608 7 580 10 02870-74 16 282 6 929 9 353 4 384 1 839 2 545 11 898 5 090 6 80875-79 11 510 4 430 7 080 3 108 1 158 1 950 8 402 3 272 5 13080-84 10 921 4 146 6 775 3 029 1 175 1 854 7 892 2 971 4 92185+ 11 232 4 163 7 069 3 136 1 175 1 961 8 096 2 988 5 108
Khanh Hoa 1 231 107 612 513 618 594 519 880 255 346 264 534 711 227 357 167 354 0600-4 91 355 47 860 43 495 35 366 18 529 16 837 55 989 29 331 26 6585-9 97 149 50 591 46 558 38 248 20 071 18 177 58 901 30 520 28 38110-14 95 635 49 479 46 156 38 053 19 665 18 388 57 582 29 814 27 76815-19 87 718 45 086 42 632 35 811 18 278 17 533 51 907 26 808 25 09920-24 83 087 42 777 40 310 33 411 16 856 16 555 49 676 25 921 23 75525-29 108 948 55 241 53 707 45 478 22 350 23 128 63 470 32 891 30 57930-34 100 644 50 723 49 921 42 813 21 081 21 732 57 831 29 642 28 18935-39 96 081 48 096 47 985 41 041 20 220 20 821 55 040 27 876 27 16440-44 91 876 46 819 45 057 38 711 19 322 19 389 53 165 27 497 25 66845-49 93 794 47 337 46 457 41 554 20 730 20 824 52 240 26 607 25 63350-54 82 403 40 794 41 609 36 877 17 985 18 892 45 526 22 809 22 71755-59 64 086 30 265 33 821 29 598 14 027 15 571 34 488 16 238 18 25060-64 47 315 21 345 25 970 22 252 10 168 12 084 25 063 11 177 13 88665-69 31 567 13 186 18 381 14 081 5 819 8 262 17 486 7 367 10 11970-74 20 497 8 380 12 117 9 003 3 639 5 364 11 494 4 741 6 75375-79 15 808 6 164 9 644 6 915 2 652 4 263 8 893 3 512 5 38180-84 11 526 4 061 7 465 5 233 1 845 3 388 6 293 2 216 4 07785+ 11 618 4 309 7 309 5 435 2 109 3 326 6 183 2 200 3 983
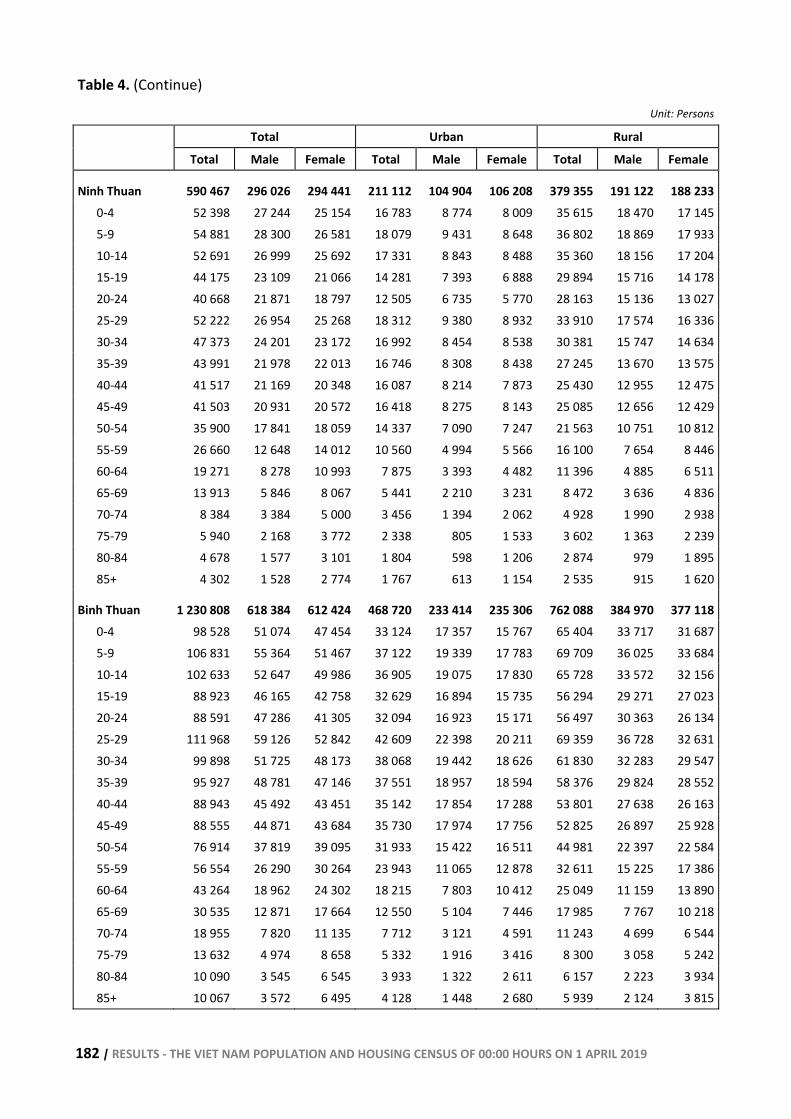
182 | RESULTS - THE VIET NAM POPULATION AND HOUSING CENSUS OF 00:00 HOURS ON 1 APRIL 2019
Table 4. (Continue)
Unit: Persons
Total Urban Rural
Total Male Female Total Male Female Total Male Female
Ninh Thuan 590 467 296 026 294 441 211 112 104 904 106 208 379 355 191 122 188 2330-4 52 398 27 244 25 154 16 783 8 774 8 009 35 615 18 470 17 1455-9 54 881 28 300 26 581 18 079 9 431 8 648 36 802 18 869 17 93310-14 52 691 26 999 25 692 17 331 8 843 8 488 35 360 18 156 17 20415-19 44 175 23 109 21 066 14 281 7 393 6 888 29 894 15 716 14 17820-24 40 668 21 871 18 797 12 505 6 735 5 770 28 163 15 136 13 02725-29 52 222 26 954 25 268 18 312 9 380 8 932 33 910 17 574 16 33630-34 47 373 24 201 23 172 16 992 8 454 8 538 30 381 15 747 14 63435-39 43 991 21 978 22 013 16 746 8 308 8 438 27 245 13 670 13 57540-44 41 517 21 169 20 348 16 087 8 214 7 873 25 430 12 955 12 47545-49 41 503 20 931 20 572 16 418 8 275 8 143 25 085 12 656 12 42950-54 35 900 17 841 18 059 14 337 7 090 7 247 21 563 10 751 10 81255-59 26 660 12 648 14 012 10 560 4 994 5 566 16 100 7 654 8 44660-64 19 271 8 278 10 993 7 875 3 393 4 482 11 396 4 885 6 51165-69 13 913 5 846 8 067 5 441 2 210 3 231 8 472 3 636 4 83670-74 8 384 3 384 5 000 3 456 1 394 2 062 4 928 1 990 2 93875-79 5 940 2 168 3 772 2 338 805 1 533 3 602 1 363 2 23980-84 4 678 1 577 3 101 1 804 598 1 206 2 874 979 1 89585+ 4 302 1 528 2 774 1 767 613 1 154 2 535 915 1 620
Binh Thuan 1 230 808 618 384 612 424 468 720 233 414 235 306 762 088 384 970 377 1180-4 98 528 51 074 47 454 33 124 17 357 15 767 65 404 33 717 31 6875-9 106 831 55 364 51 467 37 122 19 339 17 783 69 709 36 025 33 68410-14 102 633 52 647 49 986 36 905 19 075 17 830 65 728 33 572 32 15615-19 88 923 46 165 42 758 32 629 16 894 15 735 56 294 29 271 27 02320-24 88 591 47 286 41 305 32 094 16 923 15 171 56 497 30 363 26 13425-29 111 968 59 126 52 842 42 609 22 398 20 211 69 359 36 728 32 63130-34 99 898 51 725 48 173 38 068 19 442 18 626 61 830 32 283 29 54735-39 95 927 48 781 47 146 37 551 18 957 18 594 58 376 29 824 28 55240-44 88 943 45 492 43 451 35 142 17 854 17 288 53 801 27 638 26 16345-49 88 555 44 871 43 684 35 730 17 974 17 756 52 825 26 897 25 92850-54 76 914 37 819 39 095 31 933 15 422 16 511 44 981 22 397 22 58455-59 56 554 26 290 30 264 23 943 11 065 12 878 32 611 15 225 17 38660-64 43 264 18 962 24 302 18 215 7 803 10 412 25 049 11 159 13 89065-69 30 535 12 871 17 664 12 550 5 104 7 446 17 985 7 767 10 21870-74 18 955 7 820 11 135 7 712 3 121 4 591 11 243 4 699 6 54475-79 13 632 4 974 8 658 5 332 1 916 3 416 8 300 3 058 5 24280-84 10 090 3 545 6 545 3 933 1 322 2 611 6 157 2 223 3 93485+ 10 067 3 572 6 495 4 128 1 448 2 680 5 939 2 124 3 815
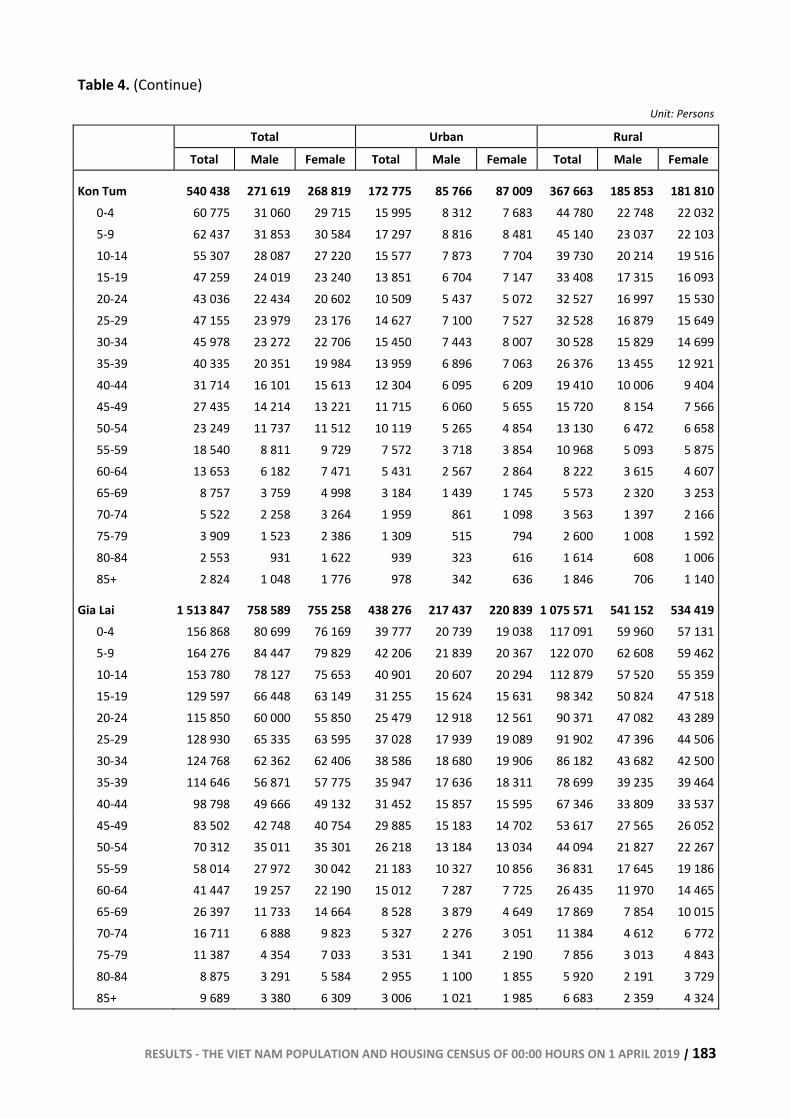
RESULTS - THE VIET NAM POPULATION AND HOUSING CENSUS OF 00:00 HOURS ON 1 APRIL 2019 | 183
Table 4. (Continue)
Unit: Persons
Total Urban Rural
Total Male Female Total Male Female Total Male Female
Kon Tum 540 438 271 619 268 819 172 775 85 766 87 009 367 663 185 853 181 8100-4 60 775 31 060 29 715 15 995 8 312 7 683 44 780 22 748 22 0325-9 62 437 31 853 30 584 17 297 8 816 8 481 45 140 23 037 22 10310-14 55 307 28 087 27 220 15 577 7 873 7 704 39 730 20 214 19 51615-19 47 259 24 019 23 240 13 851 6 704 7 147 33 408 17 315 16 09320-24 43 036 22 434 20 602 10 509 5 437 5 072 32 527 16 997 15 53025-29 47 155 23 979 23 176 14 627 7 100 7 527 32 528 16 879 15 64930-34 45 978 23 272 22 706 15 450 7 443 8 007 30 528 15 829 14 69935-39 40 335 20 351 19 984 13 959 6 896 7 063 26 376 13 455 12 92140-44 31 714 16 101 15 613 12 304 6 095 6 209 19 410 10 006 9 40445-49 27 435 14 214 13 221 11 715 6 060 5 655 15 720 8 154 7 56650-54 23 249 11 737 11 512 10 119 5 265 4 854 13 130 6 472 6 65855-59 18 540 8 811 9 729 7 572 3 718 3 854 10 968 5 093 5 87560-64 13 653 6 182 7 471 5 431 2 567 2 864 8 222 3 615 4 60765-69 8 757 3 759 4 998 3 184 1 439 1 745 5 573 2 320 3 25370-74 5 522 2 258 3 264 1 959 861 1 098 3 563 1 397 2 16675-79 3 909 1 523 2 386 1 309 515 794 2 600 1 008 1 59280-84 2 553 931 1 622 939 323 616 1 614 608 1 00685+ 2 824 1 048 1 776 978 342 636 1 846 706 1 140
Gia Lai 1 513 847 758 589 755 258 438 276 217 437 220 839 1 075 571 541 152 534 4190-4 156 868 80 699 76 169 39 777 20 739 19 038 117 091 59 960 57 1315-9 164 276 84 447 79 829 42 206 21 839 20 367 122 070 62 608 59 46210-14 153 780 78 127 75 653 40 901 20 607 20 294 112 879 57 520 55 35915-19 129 597 66 448 63 149 31 255 15 624 15 631 98 342 50 824 47 51820-24 115 850 60 000 55 850 25 479 12 918 12 561 90 371 47 082 43 28925-29 128 930 65 335 63 595 37 028 17 939 19 089 91 902 47 396 44 50630-34 124 768 62 362 62 406 38 586 18 680 19 906 86 182 43 682 42 50035-39 114 646 56 871 57 775 35 947 17 636 18 311 78 699 39 235 39 46440-44 98 798 49 666 49 132 31 452 15 857 15 595 67 346 33 809 33 53745-49 83 502 42 748 40 754 29 885 15 183 14 702 53 617 27 565 26 05250-54 70 312 35 011 35 301 26 218 13 184 13 034 44 094 21 827 22 26755-59 58 014 27 972 30 042 21 183 10 327 10 856 36 831 17 645 19 18660-64 41 447 19 257 22 190 15 012 7 287 7 725 26 435 11 970 14 46565-69 26 397 11 733 14 664 8 528 3 879 4 649 17 869 7 854 10 01570-74 16 711 6 888 9 823 5 327 2 276 3 051 11 384 4 612 6 77275-79 11 387 4 354 7 033 3 531 1 341 2 190 7 856 3 013 4 84380-84 8 875 3 291 5 584 2 955 1 100 1 855 5 920 2 191 3 72985+ 9 689 3 380 6 309 3 006 1 021 1 985 6 683 2 359 4 324
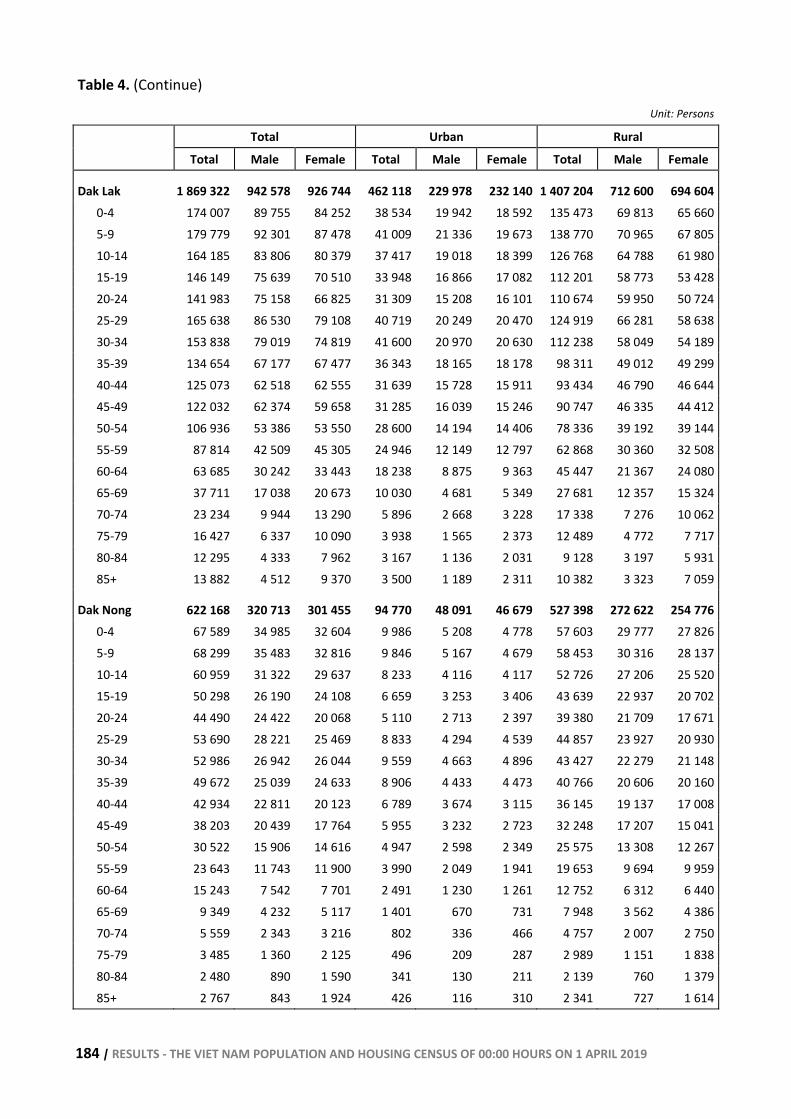
184 | RESULTS - THE VIET NAM POPULATION AND HOUSING CENSUS OF 00:00 HOURS ON 1 APRIL 2019
Table 4. (Continue)
Unit: Persons
Total Urban Rural
Total Male Female Total Male Female Total Male Female
Dak Lak 1 869 322 942 578 926 744 462 118 229 978 232 140 1 407 204 712 600 694 6040-4 174 007 89 755 84 252 38 534 19 942 18 592 135 473 69 813 65 6605-9 179 779 92 301 87 478 41 009 21 336 19 673 138 770 70 965 67 80510-14 164 185 83 806 80 379 37 417 19 018 18 399 126 768 64 788 61 98015-19 146 149 75 639 70 510 33 948 16 866 17 082 112 201 58 773 53 42820-24 141 983 75 158 66 825 31 309 15 208 16 101 110 674 59 950 50 72425-29 165 638 86 530 79 108 40 719 20 249 20 470 124 919 66 281 58 63830-34 153 838 79 019 74 819 41 600 20 970 20 630 112 238 58 049 54 18935-39 134 654 67 177 67 477 36 343 18 165 18 178 98 311 49 012 49 29940-44 125 073 62 518 62 555 31 639 15 728 15 911 93 434 46 790 46 64445-49 122 032 62 374 59 658 31 285 16 039 15 246 90 747 46 335 44 41250-54 106 936 53 386 53 550 28 600 14 194 14 406 78 336 39 192 39 14455-59 87 814 42 509 45 305 24 946 12 149 12 797 62 868 30 360 32 50860-64 63 685 30 242 33 443 18 238 8 875 9 363 45 447 21 367 24 08065-69 37 711 17 038 20 673 10 030 4 681 5 349 27 681 12 357 15 32470-74 23 234 9 944 13 290 5 896 2 668 3 228 17 338 7 276 10 06275-79 16 427 6 337 10 090 3 938 1 565 2 373 12 489 4 772 7 71780-84 12 295 4 333 7 962 3 167 1 136 2 031 9 128 3 197 5 93185+ 13 882 4 512 9 370 3 500 1 189 2 311 10 382 3 323 7 059
Dak Nong 622 168 320 713 301 455 94 770 48 091 46 679 527 398 272 622 254 7760-4 67 589 34 985 32 604 9 986 5 208 4 778 57 603 29 777 27 8265-9 68 299 35 483 32 816 9 846 5 167 4 679 58 453 30 316 28 13710-14 60 959 31 322 29 637 8 233 4 116 4 117 52 726 27 206 25 52015-19 50 298 26 190 24 108 6 659 3 253 3 406 43 639 22 937 20 70220-24 44 490 24 422 20 068 5 110 2 713 2 397 39 380 21 709 17 67125-29 53 690 28 221 25 469 8 833 4 294 4 539 44 857 23 927 20 93030-34 52 986 26 942 26 044 9 559 4 663 4 896 43 427 22 279 21 14835-39 49 672 25 039 24 633 8 906 4 433 4 473 40 766 20 606 20 16040-44 42 934 22 811 20 123 6 789 3 674 3 115 36 145 19 137 17 00845-49 38 203 20 439 17 764 5 955 3 232 2 723 32 248 17 207 15 04150-54 30 522 15 906 14 616 4 947 2 598 2 349 25 575 13 308 12 26755-59 23 643 11 743 11 900 3 990 2 049 1 941 19 653 9 694 9 95960-64 15 243 7 542 7 701 2 491 1 230 1 261 12 752 6 312 6 44065-69 9 349 4 232 5 117 1 401 670 731 7 948 3 562 4 38670-74 5 559 2 343 3 216 802 336 466 4 757 2 007 2 75075-79 3 485 1 360 2 125 496 209 287 2 989 1 151 1 83880-84 2 480 890 1 590 341 130 211 2 139 760 1 37985+ 2 767 843 1 924 426 116 310 2 341 727 1 614
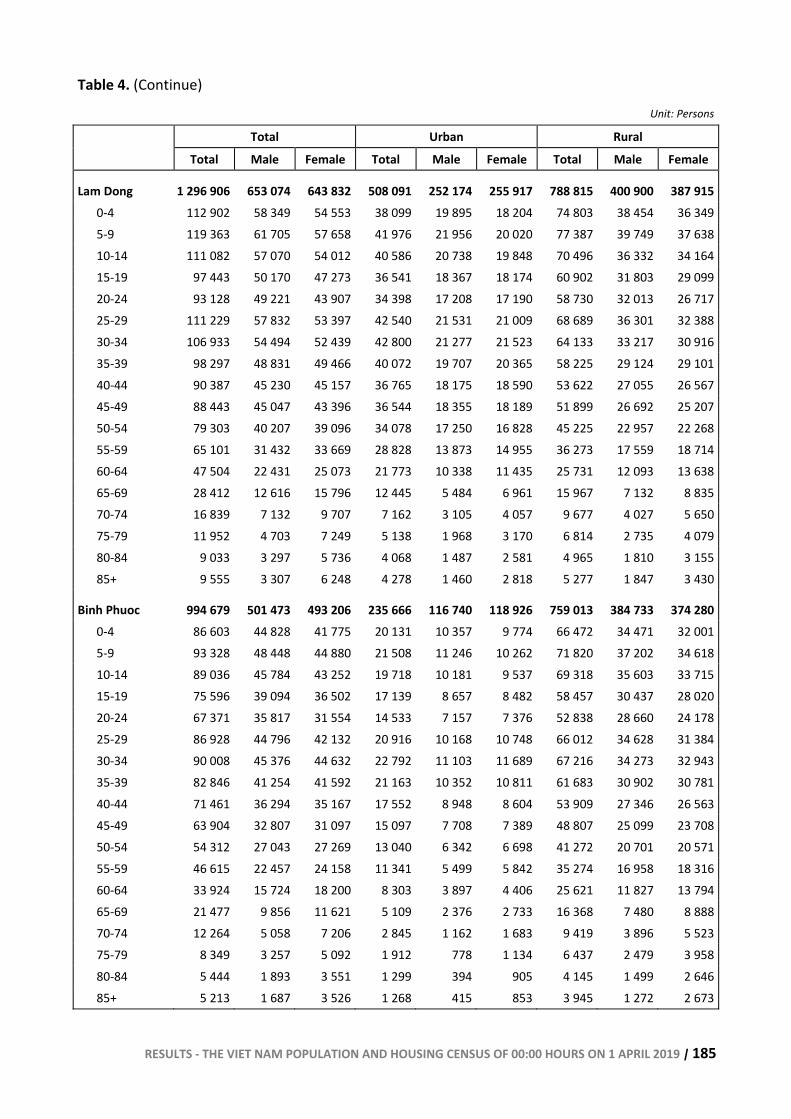
RESULTS - THE VIET NAM POPULATION AND HOUSING CENSUS OF 00:00 HOURS ON 1 APRIL 2019 | 185
Table 4. (Continue)
Unit: Persons
Total Urban Rural
Total Male Female Total Male Female Total Male Female
Lam Dong 1 296 906 653 074 643 832 508 091 252 174 255 917 788 815 400 900 387 9150-4 112 902 58 349 54 553 38 099 19 895 18 204 74 803 38 454 36 3495-9 119 363 61 705 57 658 41 976 21 956 20 020 77 387 39 749 37 63810-14 111 082 57 070 54 012 40 586 20 738 19 848 70 496 36 332 34 16415-19 97 443 50 170 47 273 36 541 18 367 18 174 60 902 31 803 29 09920-24 93 128 49 221 43 907 34 398 17 208 17 190 58 730 32 013 26 71725-29 111 229 57 832 53 397 42 540 21 531 21 009 68 689 36 301 32 38830-34 106 933 54 494 52 439 42 800 21 277 21 523 64 133 33 217 30 91635-39 98 297 48 831 49 466 40 072 19 707 20 365 58 225 29 124 29 10140-44 90 387 45 230 45 157 36 765 18 175 18 590 53 622 27 055 26 56745-49 88 443 45 047 43 396 36 544 18 355 18 189 51 899 26 692 25 20750-54 79 303 40 207 39 096 34 078 17 250 16 828 45 225 22 957 22 26855-59 65 101 31 432 33 669 28 828 13 873 14 955 36 273 17 559 18 71460-64 47 504 22 431 25 073 21 773 10 338 11 435 25 731 12 093 13 63865-69 28 412 12 616 15 796 12 445 5 484 6 961 15 967 7 132 8 83570-74 16 839 7 132 9 707 7 162 3 105 4 057 9 677 4 027 5 65075-79 11 952 4 703 7 249 5 138 1 968 3 170 6 814 2 735 4 07980-84 9 033 3 297 5 736 4 068 1 487 2 581 4 965 1 810 3 15585+ 9 555 3 307 6 248 4 278 1 460 2 818 5 277 1 847 3 430
Binh Phuoc 994 679 501 473 493 206 235 666 116 740 118 926 759 013 384 733 374 2800-4 86 603 44 828 41 775 20 131 10 357 9 774 66 472 34 471 32 0015-9 93 328 48 448 44 880 21 508 11 246 10 262 71 820 37 202 34 61810-14 89 036 45 784 43 252 19 718 10 181 9 537 69 318 35 603 33 71515-19 75 596 39 094 36 502 17 139 8 657 8 482 58 457 30 437 28 02020-24 67 371 35 817 31 554 14 533 7 157 7 376 52 838 28 660 24 17825-29 86 928 44 796 42 132 20 916 10 168 10 748 66 012 34 628 31 38430-34 90 008 45 376 44 632 22 792 11 103 11 689 67 216 34 273 32 94335-39 82 846 41 254 41 592 21 163 10 352 10 811 61 683 30 902 30 78140-44 71 461 36 294 35 167 17 552 8 948 8 604 53 909 27 346 26 56345-49 63 904 32 807 31 097 15 097 7 708 7 389 48 807 25 099 23 70850-54 54 312 27 043 27 269 13 040 6 342 6 698 41 272 20 701 20 57155-59 46 615 22 457 24 158 11 341 5 499 5 842 35 274 16 958 18 31660-64 33 924 15 724 18 200 8 303 3 897 4 406 25 621 11 827 13 79465-69 21 477 9 856 11 621 5 109 2 376 2 733 16 368 7 480 8 88870-74 12 264 5 058 7 206 2 845 1 162 1 683 9 419 3 896 5 52375-79 8 349 3 257 5 092 1 912 778 1 134 6 437 2 479 3 95880-84 5 444 1 893 3 551 1 299 394 905 4 145 1 499 2 64685+ 5 213 1 687 3 526 1 268 415 853 3 945 1 272 2 673
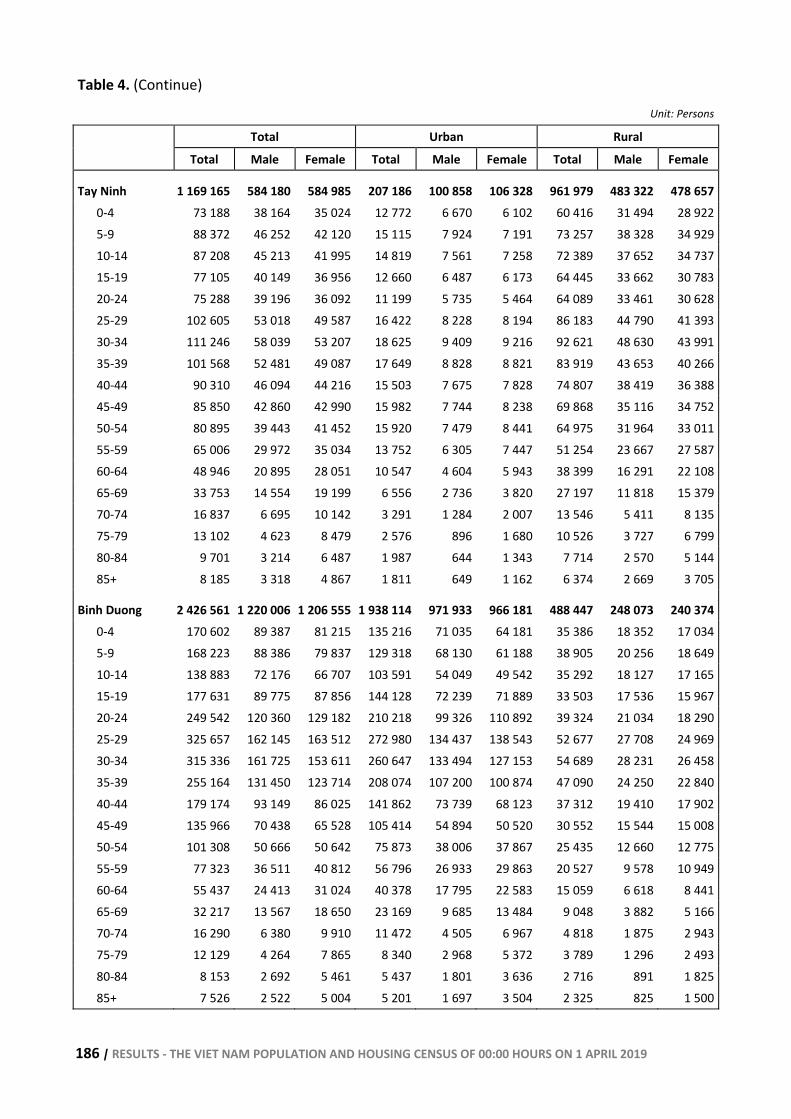
186 | RESULTS - THE VIET NAM POPULATION AND HOUSING CENSUS OF 00:00 HOURS ON 1 APRIL 2019
Table 4. (Continue)
Unit: Persons
Total Urban Rural
Total Male Female Total Male Female Total Male Female
Tay Ninh 1 169 165 584 180 584 985 207 186 100 858 106 328 961 979 483 322 478 6570-4 73 188 38 164 35 024 12 772 6 670 6 102 60 416 31 494 28 9225-9 88 372 46 252 42 120 15 115 7 924 7 191 73 257 38 328 34 92910-14 87 208 45 213 41 995 14 819 7 561 7 258 72 389 37 652 34 73715-19 77 105 40 149 36 956 12 660 6 487 6 173 64 445 33 662 30 78320-24 75 288 39 196 36 092 11 199 5 735 5 464 64 089 33 461 30 62825-29 102 605 53 018 49 587 16 422 8 228 8 194 86 183 44 790 41 39330-34 111 246 58 039 53 207 18 625 9 409 9 216 92 621 48 630 43 99135-39 101 568 52 481 49 087 17 649 8 828 8 821 83 919 43 653 40 26640-44 90 310 46 094 44 216 15 503 7 675 7 828 74 807 38 419 36 38845-49 85 850 42 860 42 990 15 982 7 744 8 238 69 868 35 116 34 75250-54 80 895 39 443 41 452 15 920 7 479 8 441 64 975 31 964 33 01155-59 65 006 29 972 35 034 13 752 6 305 7 447 51 254 23 667 27 58760-64 48 946 20 895 28 051 10 547 4 604 5 943 38 399 16 291 22 10865-69 33 753 14 554 19 199 6 556 2 736 3 820 27 197 11 818 15 37970-74 16 837 6 695 10 142 3 291 1 284 2 007 13 546 5 411 8 13575-79 13 102 4 623 8 479 2 576 896 1 680 10 526 3 727 6 79980-84 9 701 3 214 6 487 1 987 644 1 343 7 714 2 570 5 14485+ 8 185 3 318 4 867 1 811 649 1 162 6 374 2 669 3 705
Binh Duong 2 426 561 1 220 006 1 206 555 1 938 114 971 933 966 181 488 447 248 073 240 3740-4 170 602 89 387 81 215 135 216 71 035 64 181 35 386 18 352 17 0345-9 168 223 88 386 79 837 129 318 68 130 61 188 38 905 20 256 18 64910-14 138 883 72 176 66 707 103 591 54 049 49 542 35 292 18 127 17 16515-19 177 631 89 775 87 856 144 128 72 239 71 889 33 503 17 536 15 96720-24 249 542 120 360 129 182 210 218 99 326 110 892 39 324 21 034 18 29025-29 325 657 162 145 163 512 272 980 134 437 138 543 52 677 27 708 24 96930-34 315 336 161 725 153 611 260 647 133 494 127 153 54 689 28 231 26 45835-39 255 164 131 450 123 714 208 074 107 200 100 874 47 090 24 250 22 84040-44 179 174 93 149 86 025 141 862 73 739 68 123 37 312 19 410 17 90245-49 135 966 70 438 65 528 105 414 54 894 50 520 30 552 15 544 15 00850-54 101 308 50 666 50 642 75 873 38 006 37 867 25 435 12 660 12 77555-59 77 323 36 511 40 812 56 796 26 933 29 863 20 527 9 578 10 94960-64 55 437 24 413 31 024 40 378 17 795 22 583 15 059 6 618 8 44165-69 32 217 13 567 18 650 23 169 9 685 13 484 9 048 3 882 5 16670-74 16 290 6 380 9 910 11 472 4 505 6 967 4 818 1 875 2 94375-79 12 129 4 264 7 865 8 340 2 968 5 372 3 789 1 296 2 49380-84 8 153 2 692 5 461 5 437 1 801 3 636 2 716 891 1 82585+ 7 526 2 522 5 004 5 201 1 697 3 504 2 325 825 1 500
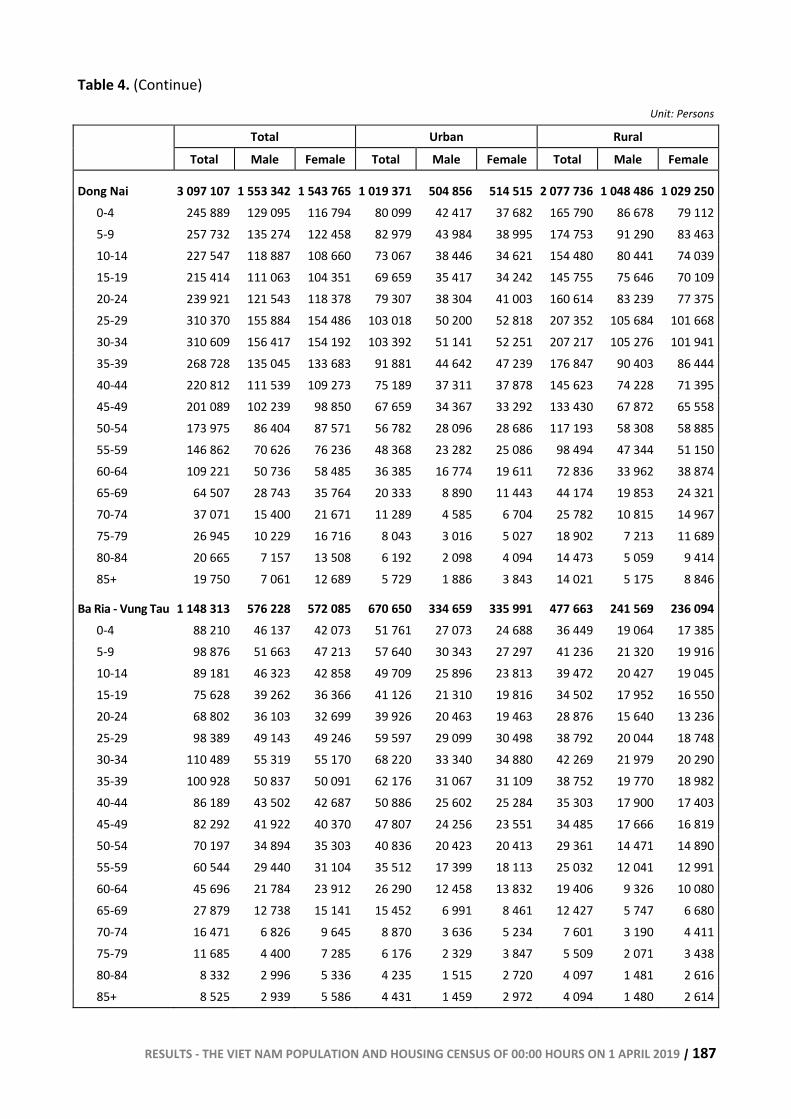
RESULTS - THE VIET NAM POPULATION AND HOUSING CENSUS OF 00:00 HOURS ON 1 APRIL 2019 | 187
Table 4. (Continue)
Unit: Persons
Total Urban Rural
Total Male Female Total Male Female Total Male Female
Dong Nai 3 097 107 1 553 342 1 543 765 1 019 371 504 856 514 515 2 077 736 1 048 486 1 029 2500-4 245 889 129 095 116 794 80 099 42 417 37 682 165 790 86 678 79 1125-9 257 732 135 274 122 458 82 979 43 984 38 995 174 753 91 290 83 46310-14 227 547 118 887 108 660 73 067 38 446 34 621 154 480 80 441 74 03915-19 215 414 111 063 104 351 69 659 35 417 34 242 145 755 75 646 70 10920-24 239 921 121 543 118 378 79 307 38 304 41 003 160 614 83 239 77 37525-29 310 370 155 884 154 486 103 018 50 200 52 818 207 352 105 684 101 66830-34 310 609 156 417 154 192 103 392 51 141 52 251 207 217 105 276 101 94135-39 268 728 135 045 133 683 91 881 44 642 47 239 176 847 90 403 86 44440-44 220 812 111 539 109 273 75 189 37 311 37 878 145 623 74 228 71 39545-49 201 089 102 239 98 850 67 659 34 367 33 292 133 430 67 872 65 55850-54 173 975 86 404 87 571 56 782 28 096 28 686 117 193 58 308 58 88555-59 146 862 70 626 76 236 48 368 23 282 25 086 98 494 47 344 51 15060-64 109 221 50 736 58 485 36 385 16 774 19 611 72 836 33 962 38 87465-69 64 507 28 743 35 764 20 333 8 890 11 443 44 174 19 853 24 32170-74 37 071 15 400 21 671 11 289 4 585 6 704 25 782 10 815 14 96775-79 26 945 10 229 16 716 8 043 3 016 5 027 18 902 7 213 11 68980-84 20 665 7 157 13 508 6 192 2 098 4 094 14 473 5 059 9 41485+ 19 750 7 061 12 689 5 729 1 886 3 843 14 021 5 175 8 846
Ba Ria - Vung Tau 1 148 313 576 228 572 085 670 650 334 659 335 991 477 663 241 569 236 0940-4 88 210 46 137 42 073 51 761 27 073 24 688 36 449 19 064 17 3855-9 98 876 51 663 47 213 57 640 30 343 27 297 41 236 21 320 19 91610-14 89 181 46 323 42 858 49 709 25 896 23 813 39 472 20 427 19 04515-19 75 628 39 262 36 366 41 126 21 310 19 816 34 502 17 952 16 55020-24 68 802 36 103 32 699 39 926 20 463 19 463 28 876 15 640 13 23625-29 98 389 49 143 49 246 59 597 29 099 30 498 38 792 20 044 18 74830-34 110 489 55 319 55 170 68 220 33 340 34 880 42 269 21 979 20 29035-39 100 928 50 837 50 091 62 176 31 067 31 109 38 752 19 770 18 98240-44 86 189 43 502 42 687 50 886 25 602 25 284 35 303 17 900 17 40345-49 82 292 41 922 40 370 47 807 24 256 23 551 34 485 17 666 16 81950-54 70 197 34 894 35 303 40 836 20 423 20 413 29 361 14 471 14 89055-59 60 544 29 440 31 104 35 512 17 399 18 113 25 032 12 041 12 99160-64 45 696 21 784 23 912 26 290 12 458 13 832 19 406 9 326 10 08065-69 27 879 12 738 15 141 15 452 6 991 8 461 12 427 5 747 6 68070-74 16 471 6 826 9 645 8 870 3 636 5 234 7 601 3 190 4 41175-79 11 685 4 400 7 285 6 176 2 329 3 847 5 509 2 071 3 43880-84 8 332 2 996 5 336 4 235 1 515 2 720 4 097 1 481 2 61685+ 8 525 2 939 5 586 4 431 1 459 2 972 4 094 1 480 2 614
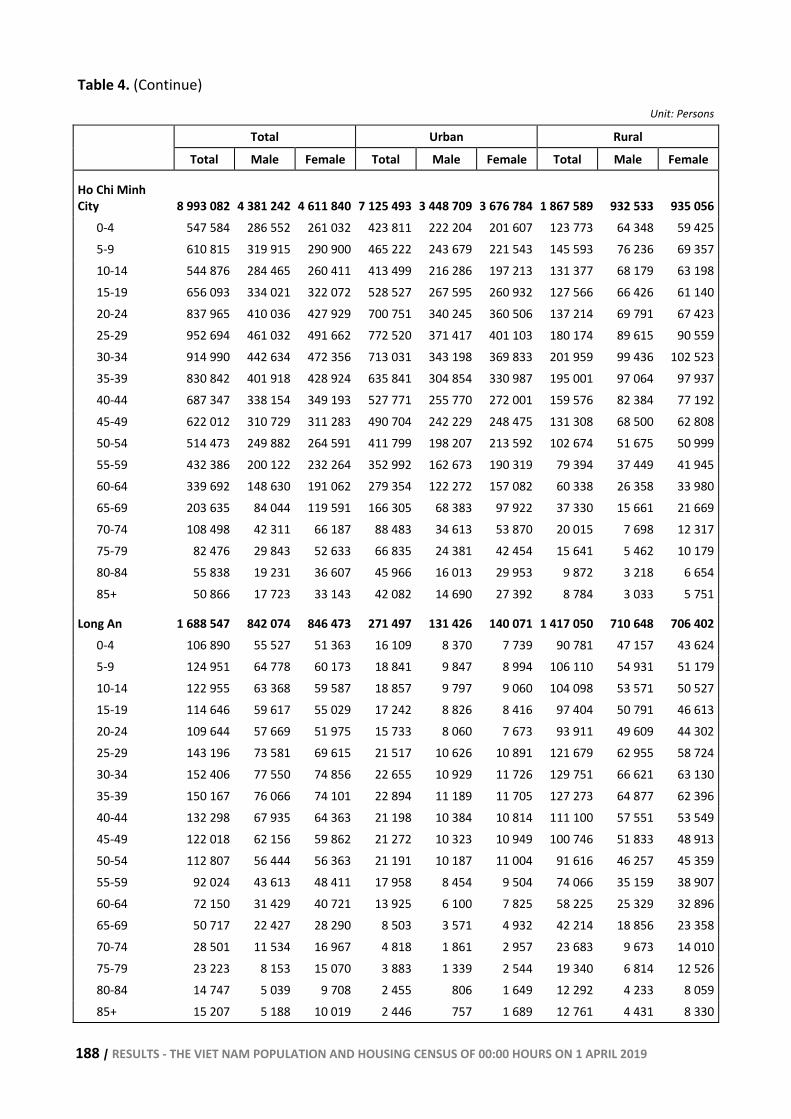
188 | RESULTS - THE VIET NAM POPULATION AND HOUSING CENSUS OF 00:00 HOURS ON 1 APRIL 2019
Table 4. (Continue)
Unit: Persons
Total Urban Rural
Total Male Female Total Male Female Total Male Female
Ho Chi Minh City 8 993 082 4 381 242 4 611 840 7 125 493 3 448 709 3 676 784 1 867 589 932 533 935 056
0-4 547 584 286 552 261 032 423 811 222 204 201 607 123 773 64 348 59 4255-9 610 815 319 915 290 900 465 222 243 679 221 543 145 593 76 236 69 35710-14 544 876 284 465 260 411 413 499 216 286 197 213 131 377 68 179 63 19815-19 656 093 334 021 322 072 528 527 267 595 260 932 127 566 66 426 61 14020-24 837 965 410 036 427 929 700 751 340 245 360 506 137 214 69 791 67 42325-29 952 694 461 032 491 662 772 520 371 417 401 103 180 174 89 615 90 55930-34 914 990 442 634 472 356 713 031 343 198 369 833 201 959 99 436 102 52335-39 830 842 401 918 428 924 635 841 304 854 330 987 195 001 97 064 97 93740-44 687 347 338 154 349 193 527 771 255 770 272 001 159 576 82 384 77 19245-49 622 012 310 729 311 283 490 704 242 229 248 475 131 308 68 500 62 80850-54 514 473 249 882 264 591 411 799 198 207 213 592 102 674 51 675 50 99955-59 432 386 200 122 232 264 352 992 162 673 190 319 79 394 37 449 41 94560-64 339 692 148 630 191 062 279 354 122 272 157 082 60 338 26 358 33 98065-69 203 635 84 044 119 591 166 305 68 383 97 922 37 330 15 661 21 66970-74 108 498 42 311 66 187 88 483 34 613 53 870 20 015 7 698 12 31775-79 82 476 29 843 52 633 66 835 24 381 42 454 15 641 5 462 10 17980-84 55 838 19 231 36 607 45 966 16 013 29 953 9 872 3 218 6 65485+ 50 866 17 723 33 143 42 082 14 690 27 392 8 784 3 033 5 751
Long An 1 688 547 842 074 846 473 271 497 131 426 140 071 1 417 050 710 648 706 4020-4 106 890 55 527 51 363 16 109 8 370 7 739 90 781 47 157 43 6245-9 124 951 64 778 60 173 18 841 9 847 8 994 106 110 54 931 51 17910-14 122 955 63 368 59 587 18 857 9 797 9 060 104 098 53 571 50 52715-19 114 646 59 617 55 029 17 242 8 826 8 416 97 404 50 791 46 61320-24 109 644 57 669 51 975 15 733 8 060 7 673 93 911 49 609 44 30225-29 143 196 73 581 69 615 21 517 10 626 10 891 121 679 62 955 58 72430-34 152 406 77 550 74 856 22 655 10 929 11 726 129 751 66 621 63 13035-39 150 167 76 066 74 101 22 894 11 189 11 705 127 273 64 877 62 39640-44 132 298 67 935 64 363 21 198 10 384 10 814 111 100 57 551 53 54945-49 122 018 62 156 59 862 21 272 10 323 10 949 100 746 51 833 48 91350-54 112 807 56 444 56 363 21 191 10 187 11 004 91 616 46 257 45 35955-59 92 024 43 613 48 411 17 958 8 454 9 504 74 066 35 159 38 90760-64 72 150 31 429 40 721 13 925 6 100 7 825 58 225 25 329 32 89665-69 50 717 22 427 28 290 8 503 3 571 4 932 42 214 18 856 23 35870-74 28 501 11 534 16 967 4 818 1 861 2 957 23 683 9 673 14 01075-79 23 223 8 153 15 070 3 883 1 339 2 544 19 340 6 814 12 52680-84 14 747 5 039 9 708 2 455 806 1 649 12 292 4 233 8 05985+ 15 207 5 188 10 019 2 446 757 1 689 12 761 4 431 8 330
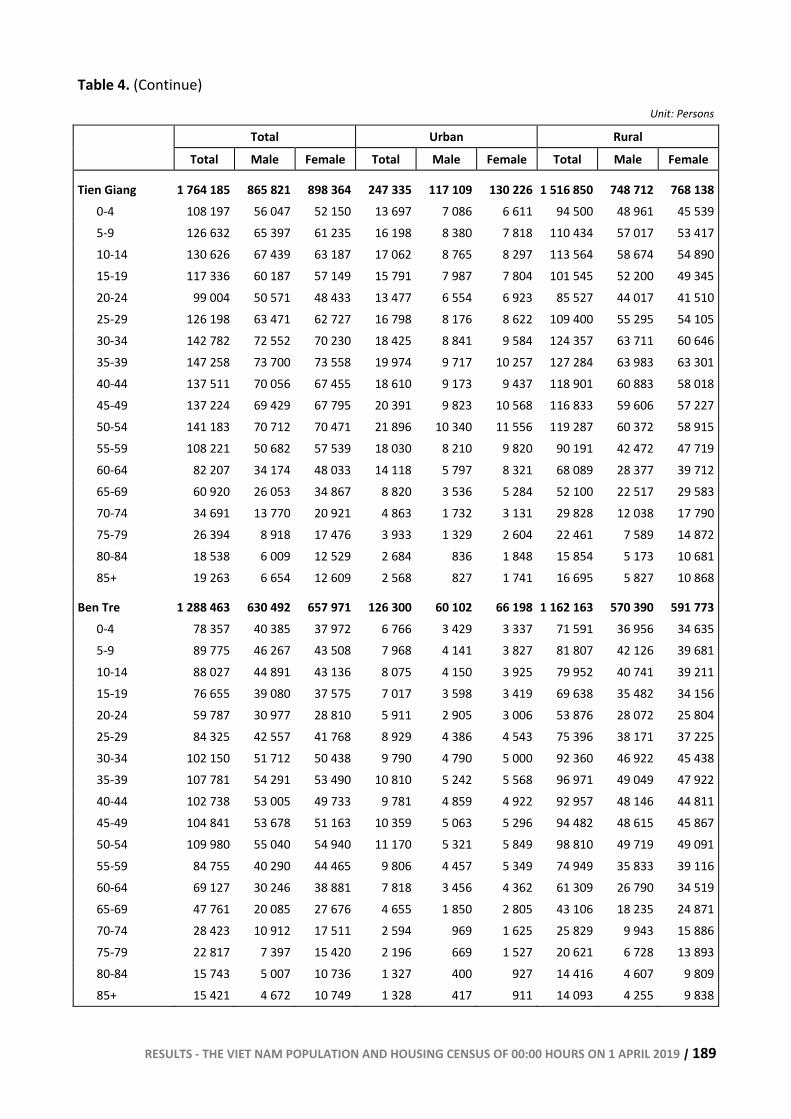
RESULTS - THE VIET NAM POPULATION AND HOUSING CENSUS OF 00:00 HOURS ON 1 APRIL 2019 | 189
Table 4. (Continue)
Unit: Persons
Total Urban Rural
Total Male Female Total Male Female Total Male Female
Tien Giang 1 764 185 865 821 898 364 247 335 117 109 130 226 1 516 850 748 712 768 1380-4 108 197 56 047 52 150 13 697 7 086 6 611 94 500 48 961 45 5395-9 126 632 65 397 61 235 16 198 8 380 7 818 110 434 57 017 53 41710-14 130 626 67 439 63 187 17 062 8 765 8 297 113 564 58 674 54 89015-19 117 336 60 187 57 149 15 791 7 987 7 804 101 545 52 200 49 34520-24 99 004 50 571 48 433 13 477 6 554 6 923 85 527 44 017 41 51025-29 126 198 63 471 62 727 16 798 8 176 8 622 109 400 55 295 54 10530-34 142 782 72 552 70 230 18 425 8 841 9 584 124 357 63 711 60 64635-39 147 258 73 700 73 558 19 974 9 717 10 257 127 284 63 983 63 30140-44 137 511 70 056 67 455 18 610 9 173 9 437 118 901 60 883 58 01845-49 137 224 69 429 67 795 20 391 9 823 10 568 116 833 59 606 57 22750-54 141 183 70 712 70 471 21 896 10 340 11 556 119 287 60 372 58 91555-59 108 221 50 682 57 539 18 030 8 210 9 820 90 191 42 472 47 71960-64 82 207 34 174 48 033 14 118 5 797 8 321 68 089 28 377 39 71265-69 60 920 26 053 34 867 8 820 3 536 5 284 52 100 22 517 29 58370-74 34 691 13 770 20 921 4 863 1 732 3 131 29 828 12 038 17 79075-79 26 394 8 918 17 476 3 933 1 329 2 604 22 461 7 589 14 87280-84 18 538 6 009 12 529 2 684 836 1 848 15 854 5 173 10 68185+ 19 263 6 654 12 609 2 568 827 1 741 16 695 5 827 10 868
Ben Tre 1 288 463 630 492 657 971 126 300 60 102 66 198 1 162 163 570 390 591 7730-4 78 357 40 385 37 972 6 766 3 429 3 337 71 591 36 956 34 6355-9 89 775 46 267 43 508 7 968 4 141 3 827 81 807 42 126 39 68110-14 88 027 44 891 43 136 8 075 4 150 3 925 79 952 40 741 39 21115-19 76 655 39 080 37 575 7 017 3 598 3 419 69 638 35 482 34 15620-24 59 787 30 977 28 810 5 911 2 905 3 006 53 876 28 072 25 80425-29 84 325 42 557 41 768 8 929 4 386 4 543 75 396 38 171 37 22530-34 102 150 51 712 50 438 9 790 4 790 5 000 92 360 46 922 45 43835-39 107 781 54 291 53 490 10 810 5 242 5 568 96 971 49 049 47 92240-44 102 738 53 005 49 733 9 781 4 859 4 922 92 957 48 146 44 81145-49 104 841 53 678 51 163 10 359 5 063 5 296 94 482 48 615 45 86750-54 109 980 55 040 54 940 11 170 5 321 5 849 98 810 49 719 49 09155-59 84 755 40 290 44 465 9 806 4 457 5 349 74 949 35 833 39 11660-64 69 127 30 246 38 881 7 818 3 456 4 362 61 309 26 790 34 51965-69 47 761 20 085 27 676 4 655 1 850 2 805 43 106 18 235 24 87170-74 28 423 10 912 17 511 2 594 969 1 625 25 829 9 943 15 88675-79 22 817 7 397 15 420 2 196 669 1 527 20 621 6 728 13 89380-84 15 743 5 007 10 736 1 327 400 927 14 416 4 607 9 80985+ 15 421 4 672 10 749 1 328 417 911 14 093 4 255 9 838
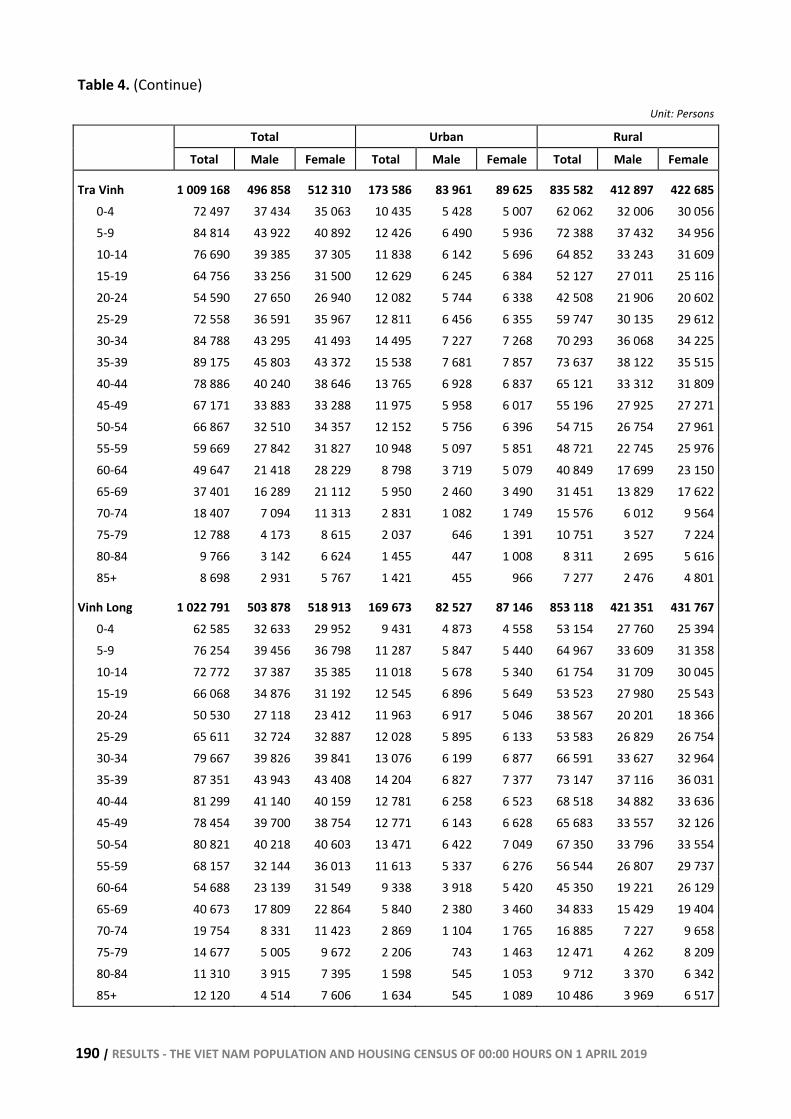
190 | RESULTS - THE VIET NAM POPULATION AND HOUSING CENSUS OF 00:00 HOURS ON 1 APRIL 2019
Table 4. (Continue)
Unit: Persons
Total Urban Rural
Total Male Female Total Male Female Total Male Female
Tra Vinh 1 009 168 496 858 512 310 173 586 83 961 89 625 835 582 412 897 422 6850-4 72 497 37 434 35 063 10 435 5 428 5 007 62 062 32 006 30 0565-9 84 814 43 922 40 892 12 426 6 490 5 936 72 388 37 432 34 95610-14 76 690 39 385 37 305 11 838 6 142 5 696 64 852 33 243 31 60915-19 64 756 33 256 31 500 12 629 6 245 6 384 52 127 27 011 25 11620-24 54 590 27 650 26 940 12 082 5 744 6 338 42 508 21 906 20 60225-29 72 558 36 591 35 967 12 811 6 456 6 355 59 747 30 135 29 61230-34 84 788 43 295 41 493 14 495 7 227 7 268 70 293 36 068 34 22535-39 89 175 45 803 43 372 15 538 7 681 7 857 73 637 38 122 35 51540-44 78 886 40 240 38 646 13 765 6 928 6 837 65 121 33 312 31 80945-49 67 171 33 883 33 288 11 975 5 958 6 017 55 196 27 925 27 27150-54 66 867 32 510 34 357 12 152 5 756 6 396 54 715 26 754 27 96155-59 59 669 27 842 31 827 10 948 5 097 5 851 48 721 22 745 25 97660-64 49 647 21 418 28 229 8 798 3 719 5 079 40 849 17 699 23 15065-69 37 401 16 289 21 112 5 950 2 460 3 490 31 451 13 829 17 62270-74 18 407 7 094 11 313 2 831 1 082 1 749 15 576 6 012 9 56475-79 12 788 4 173 8 615 2 037 646 1 391 10 751 3 527 7 22480-84 9 766 3 142 6 624 1 455 447 1 008 8 311 2 695 5 61685+ 8 698 2 931 5 767 1 421 455 966 7 277 2 476 4 801
Vinh Long 1 022 791 503 878 518 913 169 673 82 527 87 146 853 118 421 351 431 7670-4 62 585 32 633 29 952 9 431 4 873 4 558 53 154 27 760 25 3945-9 76 254 39 456 36 798 11 287 5 847 5 440 64 967 33 609 31 35810-14 72 772 37 387 35 385 11 018 5 678 5 340 61 754 31 709 30 04515-19 66 068 34 876 31 192 12 545 6 896 5 649 53 523 27 980 25 54320-24 50 530 27 118 23 412 11 963 6 917 5 046 38 567 20 201 18 36625-29 65 611 32 724 32 887 12 028 5 895 6 133 53 583 26 829 26 75430-34 79 667 39 826 39 841 13 076 6 199 6 877 66 591 33 627 32 96435-39 87 351 43 943 43 408 14 204 6 827 7 377 73 147 37 116 36 03140-44 81 299 41 140 40 159 12 781 6 258 6 523 68 518 34 882 33 63645-49 78 454 39 700 38 754 12 771 6 143 6 628 65 683 33 557 32 12650-54 80 821 40 218 40 603 13 471 6 422 7 049 67 350 33 796 33 55455-59 68 157 32 144 36 013 11 613 5 337 6 276 56 544 26 807 29 73760-64 54 688 23 139 31 549 9 338 3 918 5 420 45 350 19 221 26 12965-69 40 673 17 809 22 864 5 840 2 380 3 460 34 833 15 429 19 40470-74 19 754 8 331 11 423 2 869 1 104 1 765 16 885 7 227 9 65875-79 14 677 5 005 9 672 2 206 743 1 463 12 471 4 262 8 20980-84 11 310 3 915 7 395 1 598 545 1 053 9 712 3 370 6 34285+ 12 120 4 514 7 606 1 634 545 1 089 10 486 3 969 6 517
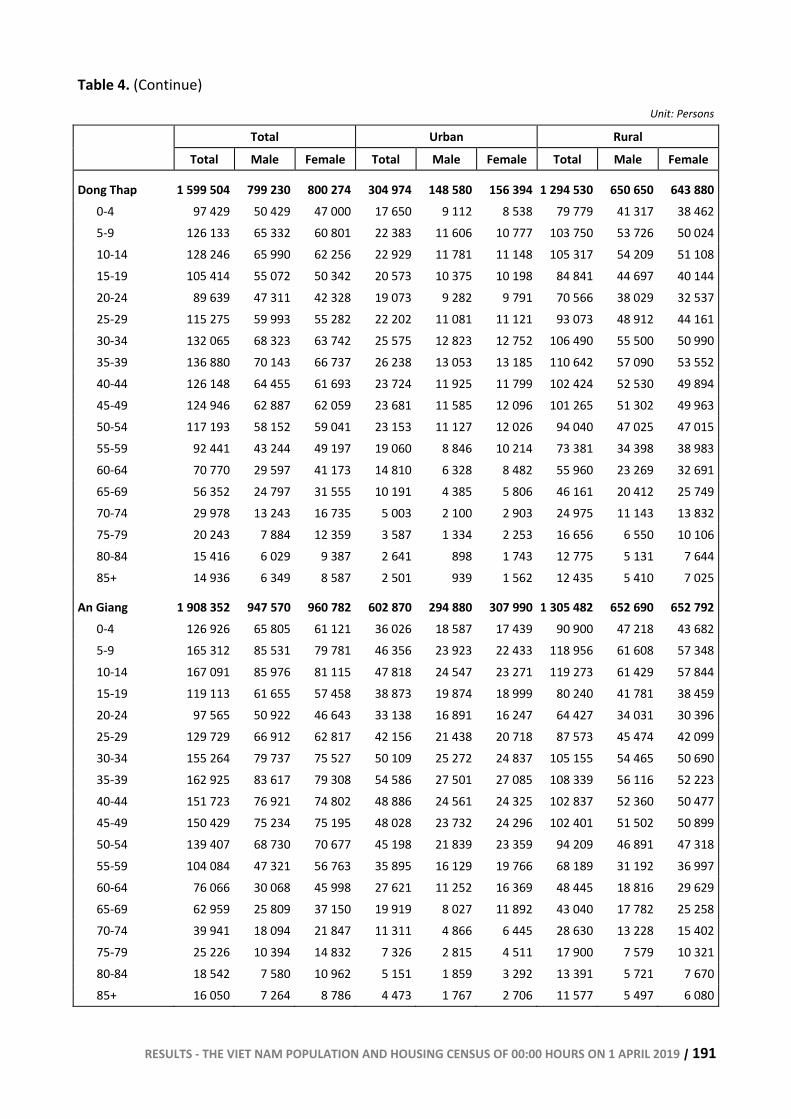
RESULTS - THE VIET NAM POPULATION AND HOUSING CENSUS OF 00:00 HOURS ON 1 APRIL 2019 | 191
Table 4. (Continue)
Unit: Persons
Total Urban Rural
Total Male Female Total Male Female Total Male Female
Dong Thap 1 599 504 799 230 800 274 304 974 148 580 156 394 1 294 530 650 650 643 8800-4 97 429 50 429 47 000 17 650 9 112 8 538 79 779 41 317 38 4625-9 126 133 65 332 60 801 22 383 11 606 10 777 103 750 53 726 50 02410-14 128 246 65 990 62 256 22 929 11 781 11 148 105 317 54 209 51 10815-19 105 414 55 072 50 342 20 573 10 375 10 198 84 841 44 697 40 14420-24 89 639 47 311 42 328 19 073 9 282 9 791 70 566 38 029 32 53725-29 115 275 59 993 55 282 22 202 11 081 11 121 93 073 48 912 44 16130-34 132 065 68 323 63 742 25 575 12 823 12 752 106 490 55 500 50 99035-39 136 880 70 143 66 737 26 238 13 053 13 185 110 642 57 090 53 55240-44 126 148 64 455 61 693 23 724 11 925 11 799 102 424 52 530 49 89445-49 124 946 62 887 62 059 23 681 11 585 12 096 101 265 51 302 49 96350-54 117 193 58 152 59 041 23 153 11 127 12 026 94 040 47 025 47 01555-59 92 441 43 244 49 197 19 060 8 846 10 214 73 381 34 398 38 98360-64 70 770 29 597 41 173 14 810 6 328 8 482 55 960 23 269 32 69165-69 56 352 24 797 31 555 10 191 4 385 5 806 46 161 20 412 25 74970-74 29 978 13 243 16 735 5 003 2 100 2 903 24 975 11 143 13 83275-79 20 243 7 884 12 359 3 587 1 334 2 253 16 656 6 550 10 10680-84 15 416 6 029 9 387 2 641 898 1 743 12 775 5 131 7 64485+ 14 936 6 349 8 587 2 501 939 1 562 12 435 5 410 7 025
An Giang 1 908 352 947 570 960 782 602 870 294 880 307 990 1 305 482 652 690 652 7920-4 126 926 65 805 61 121 36 026 18 587 17 439 90 900 47 218 43 6825-9 165 312 85 531 79 781 46 356 23 923 22 433 118 956 61 608 57 34810-14 167 091 85 976 81 115 47 818 24 547 23 271 119 273 61 429 57 84415-19 119 113 61 655 57 458 38 873 19 874 18 999 80 240 41 781 38 45920-24 97 565 50 922 46 643 33 138 16 891 16 247 64 427 34 031 30 39625-29 129 729 66 912 62 817 42 156 21 438 20 718 87 573 45 474 42 09930-34 155 264 79 737 75 527 50 109 25 272 24 837 105 155 54 465 50 69035-39 162 925 83 617 79 308 54 586 27 501 27 085 108 339 56 116 52 22340-44 151 723 76 921 74 802 48 886 24 561 24 325 102 837 52 360 50 47745-49 150 429 75 234 75 195 48 028 23 732 24 296 102 401 51 502 50 89950-54 139 407 68 730 70 677 45 198 21 839 23 359 94 209 46 891 47 31855-59 104 084 47 321 56 763 35 895 16 129 19 766 68 189 31 192 36 99760-64 76 066 30 068 45 998 27 621 11 252 16 369 48 445 18 816 29 62965-69 62 959 25 809 37 150 19 919 8 027 11 892 43 040 17 782 25 25870-74 39 941 18 094 21 847 11 311 4 866 6 445 28 630 13 228 15 40275-79 25 226 10 394 14 832 7 326 2 815 4 511 17 900 7 579 10 32180-84 18 542 7 580 10 962 5 151 1 859 3 292 13 391 5 721 7 67085+ 16 050 7 264 8 786 4 473 1 767 2 706 11 577 5 497 6 080
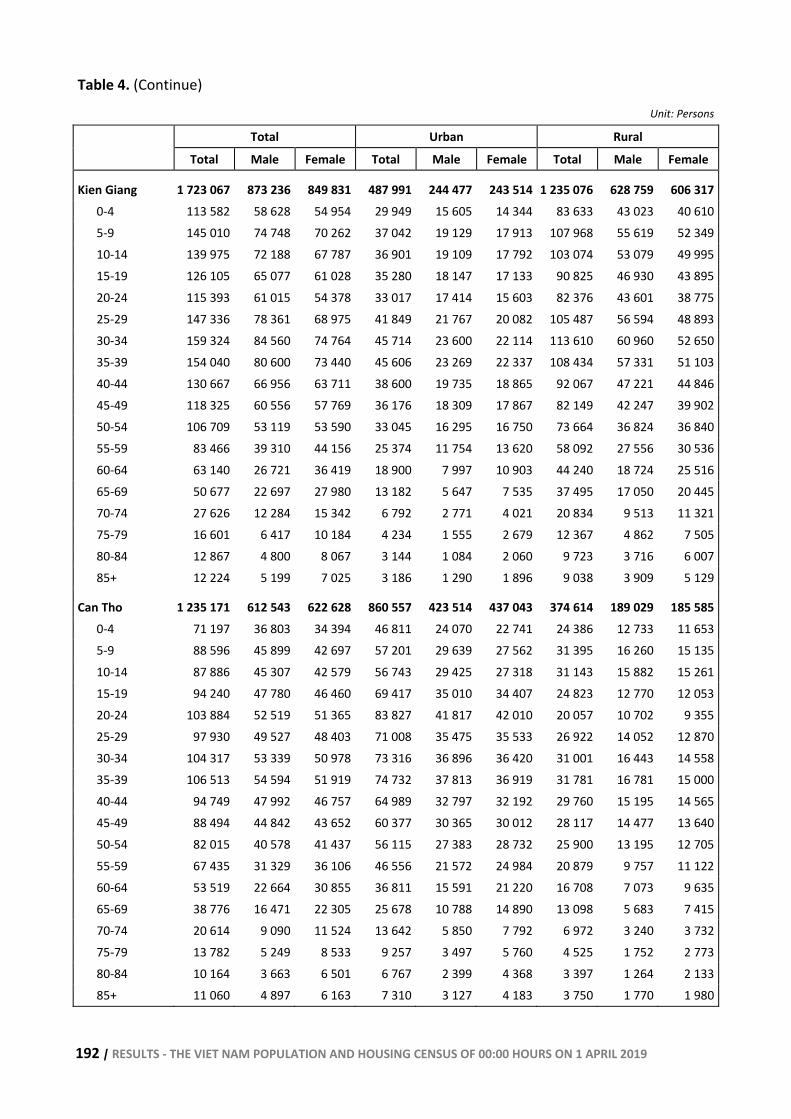
192 | RESULTS - THE VIET NAM POPULATION AND HOUSING CENSUS OF 00:00 HOURS ON 1 APRIL 2019
Table 4. (Continue)
Unit: Persons
Total Urban Rural
Total Male Female Total Male Female Total Male Female
Kien Giang 1 723 067 873 236 849 831 487 991 244 477 243 514 1 235 076 628 759 606 3170-4 113 582 58 628 54 954 29 949 15 605 14 344 83 633 43 023 40 6105-9 145 010 74 748 70 262 37 042 19 129 17 913 107 968 55 619 52 34910-14 139 975 72 188 67 787 36 901 19 109 17 792 103 074 53 079 49 99515-19 126 105 65 077 61 028 35 280 18 147 17 133 90 825 46 930 43 89520-24 115 393 61 015 54 378 33 017 17 414 15 603 82 376 43 601 38 77525-29 147 336 78 361 68 975 41 849 21 767 20 082 105 487 56 594 48 89330-34 159 324 84 560 74 764 45 714 23 600 22 114 113 610 60 960 52 65035-39 154 040 80 600 73 440 45 606 23 269 22 337 108 434 57 331 51 10340-44 130 667 66 956 63 711 38 600 19 735 18 865 92 067 47 221 44 84645-49 118 325 60 556 57 769 36 176 18 309 17 867 82 149 42 247 39 90250-54 106 709 53 119 53 590 33 045 16 295 16 750 73 664 36 824 36 84055-59 83 466 39 310 44 156 25 374 11 754 13 620 58 092 27 556 30 53660-64 63 140 26 721 36 419 18 900 7 997 10 903 44 240 18 724 25 51665-69 50 677 22 697 27 980 13 182 5 647 7 535 37 495 17 050 20 44570-74 27 626 12 284 15 342 6 792 2 771 4 021 20 834 9 513 11 32175-79 16 601 6 417 10 184 4 234 1 555 2 679 12 367 4 862 7 50580-84 12 867 4 800 8 067 3 144 1 084 2 060 9 723 3 716 6 00785+ 12 224 5 199 7 025 3 186 1 290 1 896 9 038 3 909 5 129
Can Tho 1 235 171 612 543 622 628 860 557 423 514 437 043 374 614 189 029 185 5850-4 71 197 36 803 34 394 46 811 24 070 22 741 24 386 12 733 11 6535-9 88 596 45 899 42 697 57 201 29 639 27 562 31 395 16 260 15 13510-14 87 886 45 307 42 579 56 743 29 425 27 318 31 143 15 882 15 26115-19 94 240 47 780 46 460 69 417 35 010 34 407 24 823 12 770 12 05320-24 103 884 52 519 51 365 83 827 41 817 42 010 20 057 10 702 9 35525-29 97 930 49 527 48 403 71 008 35 475 35 533 26 922 14 052 12 87030-34 104 317 53 339 50 978 73 316 36 896 36 420 31 001 16 443 14 55835-39 106 513 54 594 51 919 74 732 37 813 36 919 31 781 16 781 15 00040-44 94 749 47 992 46 757 64 989 32 797 32 192 29 760 15 195 14 56545-49 88 494 44 842 43 652 60 377 30 365 30 012 28 117 14 477 13 64050-54 82 015 40 578 41 437 56 115 27 383 28 732 25 900 13 195 12 70555-59 67 435 31 329 36 106 46 556 21 572 24 984 20 879 9 757 11 12260-64 53 519 22 664 30 855 36 811 15 591 21 220 16 708 7 073 9 63565-69 38 776 16 471 22 305 25 678 10 788 14 890 13 098 5 683 7 41570-74 20 614 9 090 11 524 13 642 5 850 7 792 6 972 3 240 3 73275-79 13 782 5 249 8 533 9 257 3 497 5 760 4 525 1 752 2 77380-84 10 164 3 663 6 501 6 767 2 399 4 368 3 397 1 264 2 13385+ 11 060 4 897 6 163 7 310 3 127 4 183 3 750 1 770 1 980
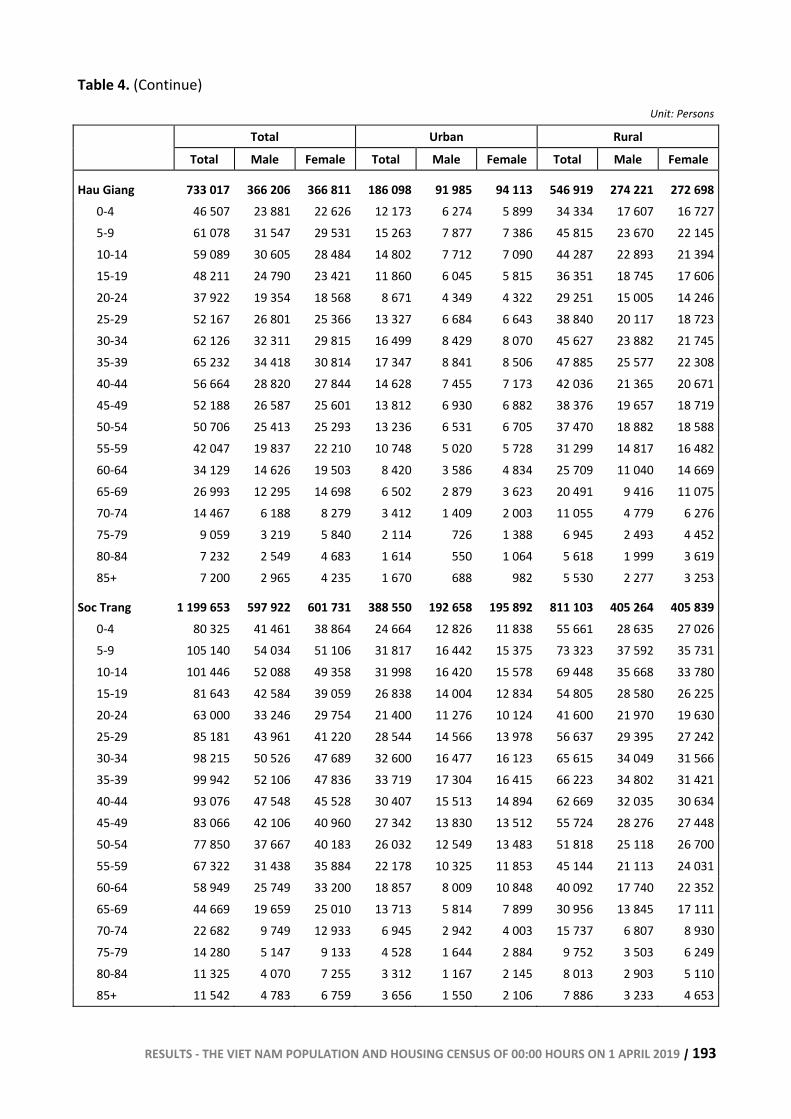
RESULTS - THE VIET NAM POPULATION AND HOUSING CENSUS OF 00:00 HOURS ON 1 APRIL 2019 | 193
Table 4. (Continue)
Unit: Persons
Total Urban Rural
Total Male Female Total Male Female Total Male Female
Hau Giang 733 017 366 206 366 811 186 098 91 985 94 113 546 919 274 221 272 6980-4 46 507 23 881 22 626 12 173 6 274 5 899 34 334 17 607 16 7275-9 61 078 31 547 29 531 15 263 7 877 7 386 45 815 23 670 22 14510-14 59 089 30 605 28 484 14 802 7 712 7 090 44 287 22 893 21 39415-19 48 211 24 790 23 421 11 860 6 045 5 815 36 351 18 745 17 60620-24 37 922 19 354 18 568 8 671 4 349 4 322 29 251 15 005 14 24625-29 52 167 26 801 25 366 13 327 6 684 6 643 38 840 20 117 18 72330-34 62 126 32 311 29 815 16 499 8 429 8 070 45 627 23 882 21 74535-39 65 232 34 418 30 814 17 347 8 841 8 506 47 885 25 577 22 30840-44 56 664 28 820 27 844 14 628 7 455 7 173 42 036 21 365 20 67145-49 52 188 26 587 25 601 13 812 6 930 6 882 38 376 19 657 18 71950-54 50 706 25 413 25 293 13 236 6 531 6 705 37 470 18 882 18 58855-59 42 047 19 837 22 210 10 748 5 020 5 728 31 299 14 817 16 48260-64 34 129 14 626 19 503 8 420 3 586 4 834 25 709 11 040 14 66965-69 26 993 12 295 14 698 6 502 2 879 3 623 20 491 9 416 11 07570-74 14 467 6 188 8 279 3 412 1 409 2 003 11 055 4 779 6 27675-79 9 059 3 219 5 840 2 114 726 1 388 6 945 2 493 4 45280-84 7 232 2 549 4 683 1 614 550 1 064 5 618 1 999 3 61985+ 7 200 2 965 4 235 1 670 688 982 5 530 2 277 3 253
Soc Trang 1 199 653 597 922 601 731 388 550 192 658 195 892 811 103 405 264 405 8390-4 80 325 41 461 38 864 24 664 12 826 11 838 55 661 28 635 27 0265-9 105 140 54 034 51 106 31 817 16 442 15 375 73 323 37 592 35 73110-14 101 446 52 088 49 358 31 998 16 420 15 578 69 448 35 668 33 78015-19 81 643 42 584 39 059 26 838 14 004 12 834 54 805 28 580 26 22520-24 63 000 33 246 29 754 21 400 11 276 10 124 41 600 21 970 19 63025-29 85 181 43 961 41 220 28 544 14 566 13 978 56 637 29 395 27 24230-34 98 215 50 526 47 689 32 600 16 477 16 123 65 615 34 049 31 56635-39 99 942 52 106 47 836 33 719 17 304 16 415 66 223 34 802 31 42140-44 93 076 47 548 45 528 30 407 15 513 14 894 62 669 32 035 30 63445-49 83 066 42 106 40 960 27 342 13 830 13 512 55 724 28 276 27 44850-54 77 850 37 667 40 183 26 032 12 549 13 483 51 818 25 118 26 70055-59 67 322 31 438 35 884 22 178 10 325 11 853 45 144 21 113 24 03160-64 58 949 25 749 33 200 18 857 8 009 10 848 40 092 17 740 22 35265-69 44 669 19 659 25 010 13 713 5 814 7 899 30 956 13 845 17 11170-74 22 682 9 749 12 933 6 945 2 942 4 003 15 737 6 807 8 93075-79 14 280 5 147 9 133 4 528 1 644 2 884 9 752 3 503 6 24980-84 11 325 4 070 7 255 3 312 1 167 2 145 8 013 2 903 5 11085+ 11 542 4 783 6 759 3 656 1 550 2 106 7 886 3 233 4 653
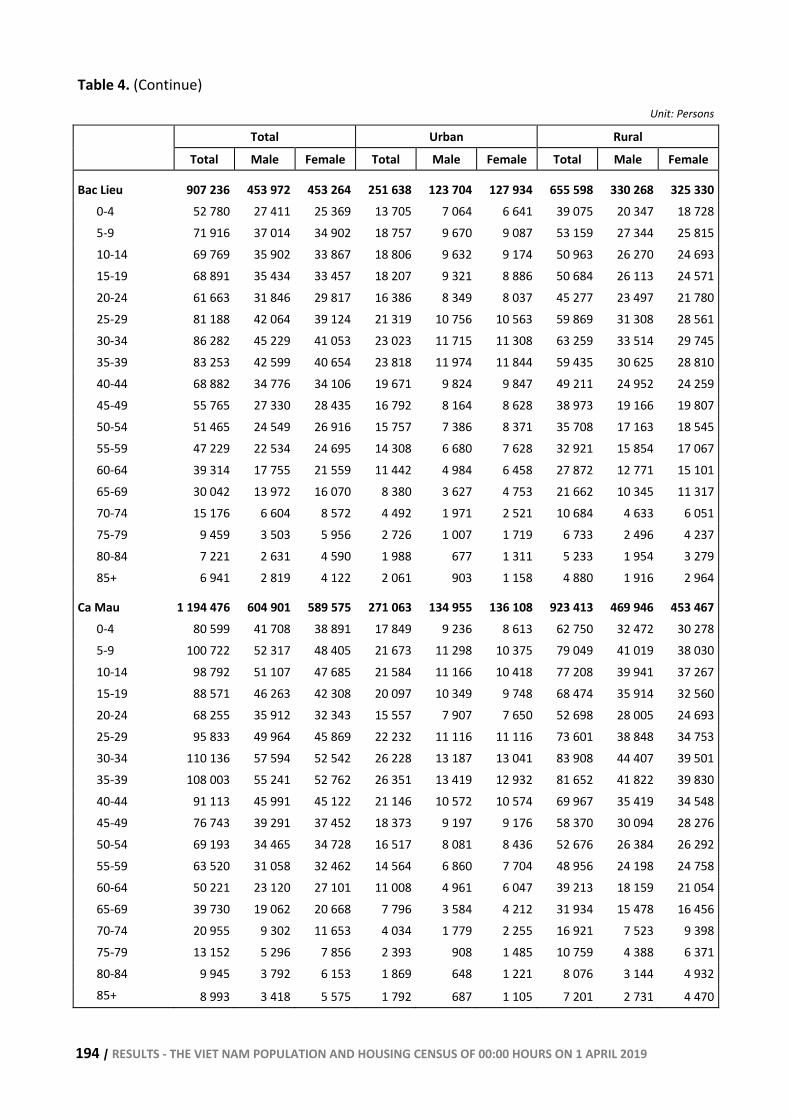
194 | RESULTS - THE VIET NAM POPULATION AND HOUSING CENSUS OF 00:00 HOURS ON 1 APRIL 2019
Table 4. (Continue)
Unit: Persons
Total Urban Rural
Total Male Female Total Male Female Total Male Female
Bac Lieu 907 236 453 972 453 264 251 638 123 704 127 934 655 598 330 268 325 3300-4 52 780 27 411 25 369 13 705 7 064 6 641 39 075 20 347 18 7285-9 71 916 37 014 34 902 18 757 9 670 9 087 53 159 27 344 25 81510-14 69 769 35 902 33 867 18 806 9 632 9 174 50 963 26 270 24 69315-19 68 891 35 434 33 457 18 207 9 321 8 886 50 684 26 113 24 57120-24 61 663 31 846 29 817 16 386 8 349 8 037 45 277 23 497 21 78025-29 81 188 42 064 39 124 21 319 10 756 10 563 59 869 31 308 28 56130-34 86 282 45 229 41 053 23 023 11 715 11 308 63 259 33 514 29 74535-39 83 253 42 599 40 654 23 818 11 974 11 844 59 435 30 625 28 81040-44 68 882 34 776 34 106 19 671 9 824 9 847 49 211 24 952 24 25945-49 55 765 27 330 28 435 16 792 8 164 8 628 38 973 19 166 19 80750-54 51 465 24 549 26 916 15 757 7 386 8 371 35 708 17 163 18 54555-59 47 229 22 534 24 695 14 308 6 680 7 628 32 921 15 854 17 06760-64 39 314 17 755 21 559 11 442 4 984 6 458 27 872 12 771 15 10165-69 30 042 13 972 16 070 8 380 3 627 4 753 21 662 10 345 11 31770-74 15 176 6 604 8 572 4 492 1 971 2 521 10 684 4 633 6 05175-79 9 459 3 503 5 956 2 726 1 007 1 719 6 733 2 496 4 23780-84 7 221 2 631 4 590 1 988 677 1 311 5 233 1 954 3 27985+ 6 941 2 819 4 122 2 061 903 1 158 4 880 1 916 2 964
Ca Mau 1 194 476 604 901 589 575 271 063 134 955 136 108 923 413 469 946 453 4670-4 80 599 41 708 38 891 17 849 9 236 8 613 62 750 32 472 30 2785-9 100 722 52 317 48 405 21 673 11 298 10 375 79 049 41 019 38 03010-14 98 792 51 107 47 685 21 584 11 166 10 418 77 208 39 941 37 26715-19 88 571 46 263 42 308 20 097 10 349 9 748 68 474 35 914 32 56020-24 68 255 35 912 32 343 15 557 7 907 7 650 52 698 28 005 24 69325-29 95 833 49 964 45 869 22 232 11 116 11 116 73 601 38 848 34 75330-34 110 136 57 594 52 542 26 228 13 187 13 041 83 908 44 407 39 50135-39 108 003 55 241 52 762 26 351 13 419 12 932 81 652 41 822 39 83040-44 91 113 45 991 45 122 21 146 10 572 10 574 69 967 35 419 34 54845-49 76 743 39 291 37 452 18 373 9 197 9 176 58 370 30 094 28 27650-54 69 193 34 465 34 728 16 517 8 081 8 436 52 676 26 384 26 29255-59 63 520 31 058 32 462 14 564 6 860 7 704 48 956 24 198 24 75860-64 50 221 23 120 27 101 11 008 4 961 6 047 39 213 18 159 21 05465-69 39 730 19 062 20 668 7 796 3 584 4 212 31 934 15 478 16 45670-74 20 955 9 302 11 653 4 034 1 779 2 255 16 921 7 523 9 39875-79 13 152 5 296 7 856 2 393 908 1 485 10 759 4 388 6 37180-84 9 945 3 792 6 153 1 869 648 1 221 8 076 3 144 4 93285+ 8 993 3 418 5 575 1 792 687 1 105 7 201 2 731 4 470
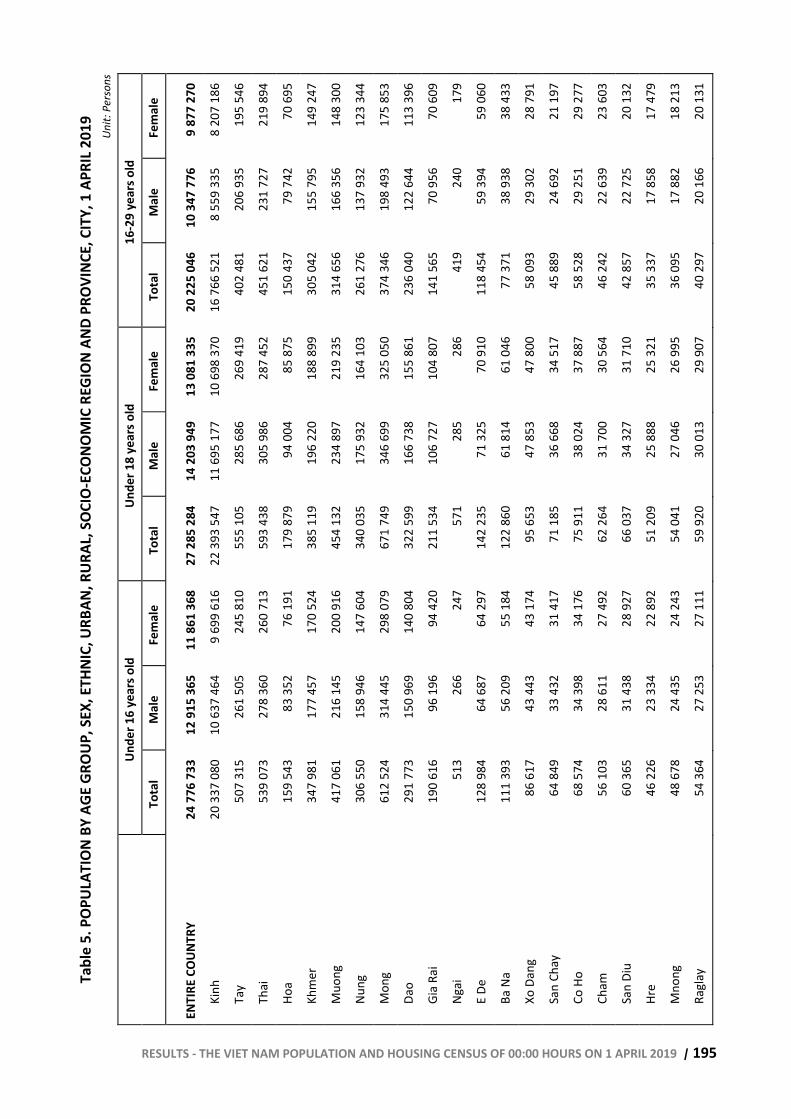
RESULTS - THE VIET NAM POPULATION AND HOUSING CENSUS OF 00:00 HOURS ON 1 APRIL 2019 | 195
Tabl
e 5.
POP
ULAT
ION
BY A
GE G
ROUP
, SEX
, ETH
NIC,
URB
AN, R
URAL
, SOC
IO-E
CONO
MIC
REG
ION
AND
PROV
INCE
, CIT
Y, 1
APR
IL 20
19
Unit:
Per
sons
Un
der 1
6 ye
ars o
ld
Unde
r 18
year
s old
16
-29
year
s old
Tota
l M
ale
Fem
ale
Tota
l M
ale
Fem
ale
Tota
l M
ale
Fem
ale
ENTI
RE C
OUNT
RY
24 7
76 7
33
12 9
15 3
65
11 8
61 3
68
27 2
85 2
84
14 2
03 9
49
13 0
81 3
35
20 2
25 0
46
10 3
47 7
76
9 87
7 27
0
Kinh
20
337
080
10
637
464
9
699
616
22 3
93 5
47
11 6
95 1
77
10 6
98 3
70
16 7
66 5
21
8 55
9 33
5 8
207
186
Tay
507
315
261
505
245
810
555
105
285
686
269
419
402
481
206
935
195
546
Thai
53
9 07
3 27
8 36
0 26
0 71
3 59
3 43
8 30
5 98
6 28
7 45
2 45
1 62
1 23
1 72
7 21
9 89
4
Hoa
159
543
83 3
52
76 1
91
179
879
94 0
04
85 8
75
150
437
79 7
42
70 6
95
Khm
er
347
981
177
457
170
524
385
119
196
220
188
899
305
042
155
795
149
247
Muo
ng
417
061
216
145
200
916
454
132
234
897
219
235
314
656
166
356
148
300
Nung
30
6 55
0 15
8 94
6 14
7 60
4 34
0 03
5 17
5 93
2 16
4 10
3 26
1 27
6 13
7 93
2 12
3 34
4
Mon
g 61
2 52
4 31
4 44
5 29
8 07
9 67
1 74
9 34
6 69
9 32
5 05
0 37
4 34
6 19
8 49
3 17
5 85
3
Dao
291
773
150
969
140
804
322
599
166
738
155
861
236
040
122
644
113
396
Gia
Rai
190
616
96 1
96
94 4
20
211
534
106
727
104
807
141
565
70 9
56
70 6
09
Ngai
51
3 26
6 24
7 57
1 28
5 28
6 41
9 24
0 17
9
E De
12
8 98
4 64
687
64
297
14
2 23
5 71
325
70
910
11
8 45
4 59
394
59
060
Ba N
a 11
1 39
3 56
209
55
184
12
2 86
0 61
814
61
046
77
371
38
938
38
433
Xo D
ang
86 6
17
43 4
43
43 1
74
95 6
53
47 8
53
47 8
00
58 0
93
29 3
02
28 7
91
San
Chay
64
849
33
432
31
417
71
185
36
668
34
517
45
889
24
692
21
197
Co H
o 68
574
34
398
34
176
75
911
38
024
37
887
58
528
29
251
29
277
Cham
56
103
28
611
27
492
62
264
31
700
30
564
46
242
22
639
23
603
San
Diu
60 3
65
31 4
38
28 9
27
66 0
37
34 3
27
31 7
10
42 8
57
22 7
25
20 1
32
Hre
46 2
26
23 3
34
22 8
92
51 2
09
25 8
88
25 3
21
35 3
37
17 8
58
17 4
79
Mno
ng
48 6
78
24 4
35
24 2
43
54 0
41
27 0
46
26 9
95
36 0
95
17 8
82
18 2
13
Ragl
ay
54 3
64
27 2
53
27 1
11
59 9
20
30 0
13
29 9
07
40 2
97
20 1
66
20 1
31
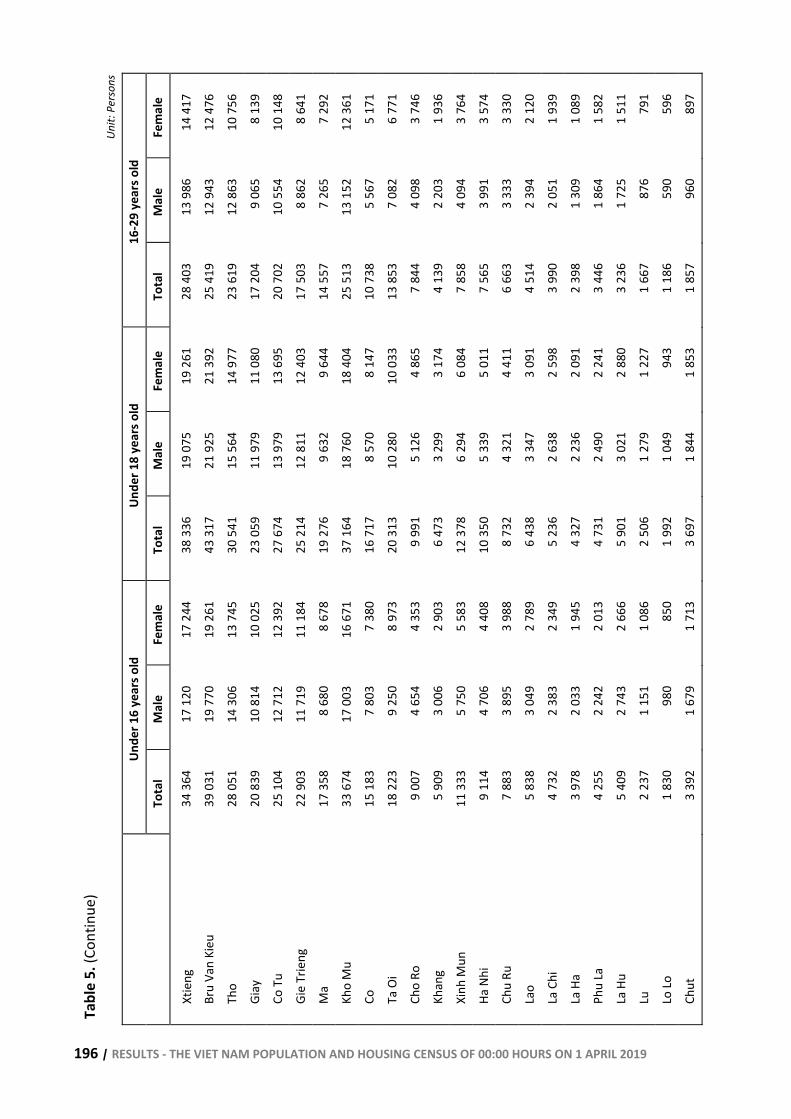
196 | RESULTS - THE VIET NAM POPULATION AND HOUSING CENSUS OF 00:00 HOURS ON 1 APRIL 2019
Tabl
e 5.
(Con
tinue
) Un
it: P
erso
ns
Unde
r 16
year
s old
Un
der 1
8 ye
ars o
ld
16-2
9 ye
ars o
ld
To
tal
Mal
e Fe
mal
e To
tal
Mal
e Fe
mal
e To
tal
Mal
e Fe
mal
e
Xtie
ng
34 3
64
17 1
20
17 2
44
38 3
36
19 0
75
19 2
61
28 4
03
13 9
86
14 4
17
Bru
Van
Kieu
39
031
19
770
19
261
43
317
21
925
21
392
25
419
12
943
12
476
Tho
28 0
51
14 3
06
13 7
45
30 5
41
15 5
64
14 9
77
23 6
19
12 8
63
10 7
56
Giay
20
839
10
814
10
025
23
059
11
979
11
080
17
204
9
065
8 13
9
Co T
u 25
104
12
712
12
392
27
674
13
979
13
695
20
702
10
554
10
148
Gie
Trie
ng
22 9
03
11 7
19
11 1
84
25 2
14
12 8
11
12 4
03
17 5
03
8 86
2 8
641
Ma
17 3
58
8 68
0 8
678
19 2
76
9 63
2 9
644
14 5
57
7 26
5 7
292
Kho
Mu
33 6
74
17 0
03
16 6
71
37 1
64
18 7
60
18 4
04
25 5
13
13 1
52
12 3
61
Co
15 1
83
7 80
3 7
380
16 7
17
8 57
0 8
147
10 7
38
5 56
7 5
171
Ta O
i 18
223
9
250
8 97
3 20
313
10
280
10
033
13
853
7
082
6 77
1
Cho
Ro
9 00
7 4
654
4 35
3 9
991
5 12
6 4
865
7 84
4 4
098
3 74
6
Khan
g 5
909
3 00
6 2
903
6 47
3 3
299
3 17
4 4
139
2 20
3 1
936
Xinh
Mun
11
333
5
750
5 58
3 12
378
6
294
6 08
4 7
858
4 09
4 3
764
Ha N
hi
9 11
4 4
706
4 40
8 10
350
5
339
5 01
1 7
565
3 99
1 3
574
Chu
Ru
7 88
3 3
895
3 98
8 8
732
4 32
1 4
411
6 66
3 3
333
3 33
0
Lao
5 83
8 3
049
2 78
9 6
438
3 34
7 3
091
4 51
4 2
394
2 12
0
La C
hi
4 73
2 2
383
2 34
9 5
236
2 63
8 2
598
3 99
0 2
051
1 93
9
La H
a 3
978
2 03
3 1
945
4 32
7 2
236
2 09
1 2
398
1 30
9 1
089
Phu
La
4 25
5 2
242
2 01
3 4
731
2 49
0 2
241
3 44
6 1
864
1 58
2
La H
u 5
409
2 74
3 2
666
5 90
1 3
021
2 88
0 3
236
1 72
5 1
511
Lu
2 23
7 1
151
1 08
6 2
506
1 27
9 1
227
1 66
7 87
6 79
1
Lo Lo
1
830
980
850
1 99
2 1
049
943
1 18
6 59
0 59
6
Chut
3
392
1 67
9 1
713
3 69
7 1
844
1 85
3 1
857
960
897
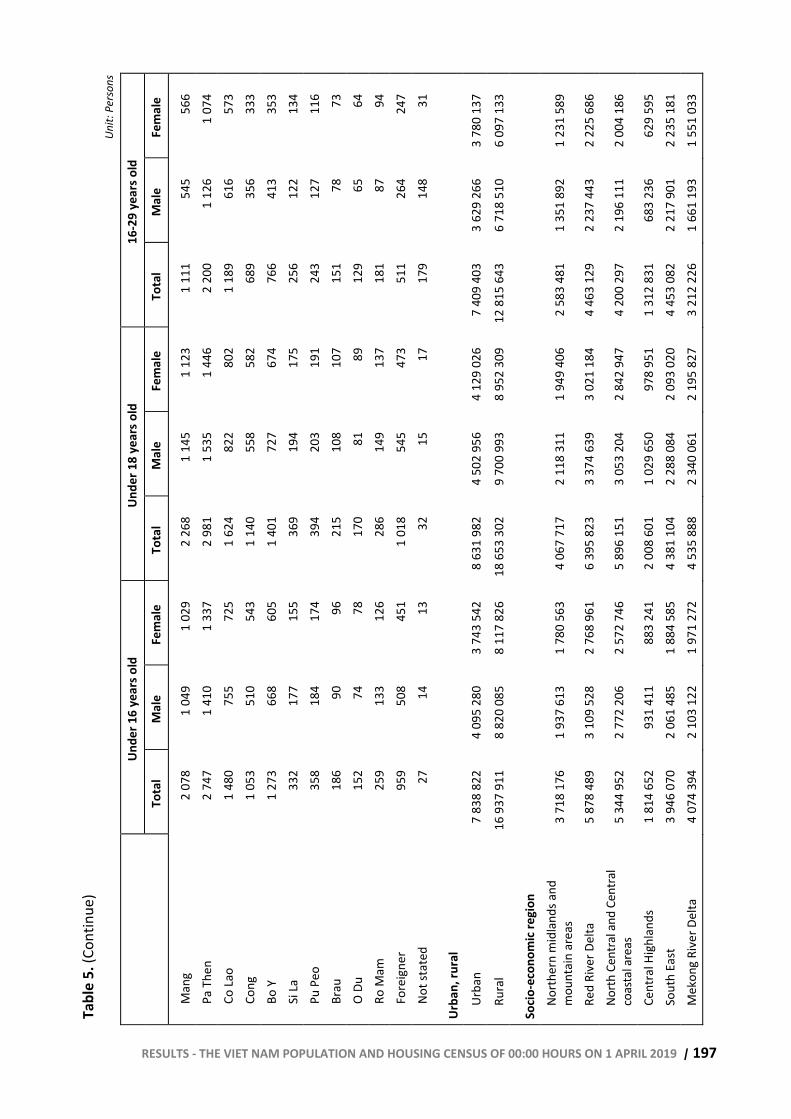
RESULTS - THE VIET NAM POPULATION AND HOUSING CENSUS OF 00:00 HOURS ON 1 APRIL 2019 | 197
Tabl
e 5.
(Con
tinue
) Un
it: P
erso
ns
Unde
r 16
year
s old
Un
der 1
8 ye
ars o
ld
16-2
9 ye
ars o
ld
To
tal
Mal
e Fe
mal
e To
tal
Mal
e Fe
mal
e To
tal
Mal
e Fe
mal
e
Man
g 2
078
1 04
9 1
029
2 26
8 1
145
1 12
3 1
111
545
566
Pa T
hen
2 74
7 1
410
1 33
7 2
981
1 53
5 1
446
2 20
0 1
126
1 07
4 Co
Lao
1 48
0 75
5 72
5 1
624
822
802
1 18
9 61
6 57
3 Co
ng
1 05
3 51
0 54
3 1
140
558
582
689
356
333
Bo Y
1
273
668
605
1 40
1 72
7 67
4 76
6 41
3 35
3 Si
La
332
177
155
369
194
175
256
122
134
Pu P
eo
358
184
174
394
203
191
243
127
116
Brau
18
6 90
96
21
5 10
8 10
7 15
1 78
73
O
Du
152
74
78
170
81
89
129
65
64
Ro M
am
259
133
126
286
149
137
181
87
94
Fore
igne
r 95
9 50
8 45
1 1
018
545
473
511
264
247
Not s
tate
d 27
14
13
32
15
17
17
9 14
8 31
Urba
n, ru
ral
Ur
ban
7 83
8 82
2 4
095
280
3 74
3 54
2 8
631
982
4 50
2 95
6 4
129
026
7 40
9 40
3 3
629
266
3 78
0 13
7
Rura
l 16
937
911
8
820
085
8 11
7 82
6 18
653
302
9
700
993
8 95
2 30
9 12
815
643
6
718
510
6 09
7 13
3
Socio
-eco
nom
ic re
gion
Nort
hern
mid
land
s and
m
ount
ain
area
s 3
718
176
1 93
7 61
3 1
780
563
4 06
7 71
7 2
118
311
1 94
9 40
6 2
583
481
1 35
1 89
2 1
231
589
Red
Rive
r Del
ta
5 87
8 48
9 3
109
528
2 76
8 96
1 6
395
823
3 37
4 63
9 3
021
184
4 46
3 12
9 2
237
443
2 22
5 68
6 No
rth C
entra
l and
Cen
tral
coas
tal a
reas
5
344
952
2 77
2 20
6 2
572
746
5 89
6 15
1 3
053
204
2 84
2 94
7 4
200
297
2 19
6 11
1 2
004
186
Cent
ral H
ighl
ands
1
814
652
931
411
883
241
2 00
8 60
1 1
029
650
978
951
1 31
2 83
1 68
3 23
6 62
9 59
5 So
uth
East
3
946
070
2 06
1 48
5 1
884
585
4 38
1 10
4 2
288
084
2 09
3 02
0 4
453
082
2 21
7 90
1 2
235
181
Mek
ong
Rive
r Del
ta
4 07
4 39
4 2
103
122
1 97
1 27
2 4
535
888
2 34
0 06
1 2
195
827
3 21
2 22
6 1
661
193
1 55
1 03
3
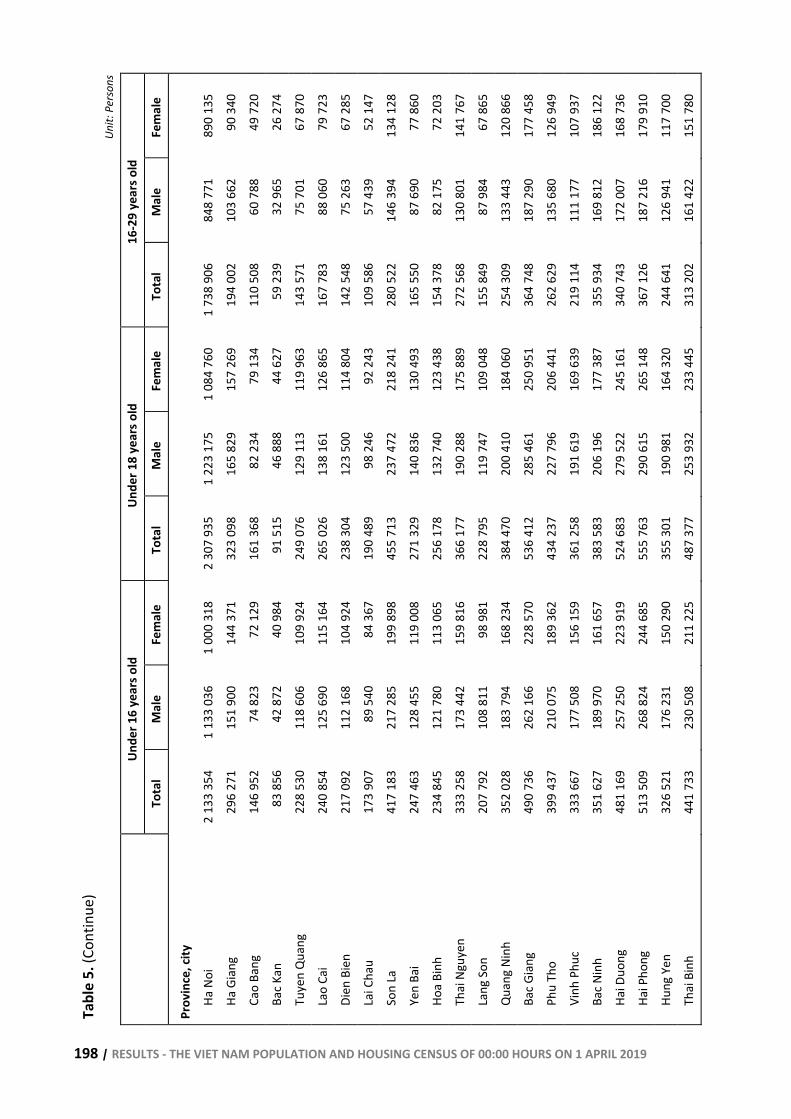
198 | RESULTS - THE VIET NAM POPULATION AND HOUSING CENSUS OF 00:00 HOURS ON 1 APRIL 2019
Tabl
e 5.
(Con
tinue
) Un
it: P
erso
ns
Unde
r 16
year
s old
Un
der 1
8 ye
ars o
ld
16-2
9 ye
ars o
ld
To
tal
Mal
e Fe
mal
e To
tal
Mal
e Fe
mal
e To
tal
Mal
e Fe
mal
e
Prov
ince
, city
Ha N
oi
2 13
3 35
4 1
133
036
1 00
0 31
8 2
307
935
1 22
3 17
5 1
084
760
1 73
8 90
6 84
8 77
1 89
0 13
5
Ha G
iang
29
6 27
1 15
1 90
0 14
4 37
1 32
3 09
8 16
5 82
9 15
7 26
9 19
4 00
2 10
3 66
2 90
340
Cao
Bang
14
6 95
2 74
823
72
129
16
1 36
8 82
234
79
134
11
0 50
8 60
788
49
720
Bac K
an
83 8
56
42 8
72
40 9
84
91 5
15
46 8
88
44 6
27
59 2
39
32 9
65
26 2
74
Tuye
n Q
uang
22
8 53
0 11
8 60
6 10
9 92
4 24
9 07
6 12
9 11
3 11
9 96
3 14
3 57
1 75
701
67
870
Lao
Cai
240
854
125
690
115
164
265
026
138
161
126
865
167
783
88 0
60
79 7
23
Dien
Bie
n 21
7 09
2 11
2 16
8 10
4 92
4 23
8 30
4 12
3 50
0 11
4 80
4 14
2 54
8 75
263
67
285
Lai C
hau
173
907
89 5
40
84 3
67
190
489
98 2
46
92 2
43
109
586
57 4
39
52 1
47
Son
La
417
183
217
285
199
898
455
713
237
472
218
241
280
522
146
394
134
128
Yen
Bai
247
463
128
455
119
008
271
329
140
836
130
493
165
550
87 6
90
77 8
60
Hoa
Binh
23
4 84
5 12
1 78
0 11
3 06
5 25
6 17
8 13
2 74
0 12
3 43
8 15
4 37
8 82
175
72
203
Thai
Ngu
yen
333
258
173
442
159
816
366
177
190
288
175
889
272
568
130
801
141
767
Lang
Son
20
7 79
2 10
8 81
1 98
981
22
8 79
5 11
9 74
7 10
9 04
8 15
5 84
9 87
984
67
865
Qua
ng N
inh
352
028
183
794
168
234
384
470
200
410
184
060
254
309
133
443
120
866
Bac G
iang
49
0 73
6 26
2 16
6 22
8 57
0 53
6 41
2 28
5 46
1 25
0 95
1 36
4 74
8 18
7 29
0 17
7 45
8
Phu
Tho
399
437
210
075
189
362
434
237
227
796
206
441
262
629
135
680
126
949
Vinh
Phu
c 33
3 66
7 17
7 50
8 15
6 15
9 36
1 25
8 19
1 61
9 16
9 63
9 21
9 11
4 11
1 17
7 10
7 93
7
Bac N
inh
351
627
189
970
161
657
383
583
206
196
177
387
355
934
169
812
186
122
Hai D
uong
48
1 16
9 25
7 25
0 22
3 91
9 52
4 68
3 27
9 52
2 24
5 16
1 34
0 74
3 17
2 00
7 16
8 73
6
Hai P
hong
51
3 50
9 26
8 82
4 24
4 68
5 55
5 76
3 29
0 61
5 26
5 14
8 36
7 12
6 18
7 21
6 17
9 91
0
Hung
Yen
32
6 52
1 17
6 23
1 15
0 29
0 35
5 30
1 19
0 98
1 16
4 32
0 24
4 64
1 12
6 94
1 11
7 70
0
Thai
Bin
h 44
1 73
3 23
0 50
8 21
1 22
5 48
7 37
7 25
3 93
2 23
3 44
5 31
3 20
2 16
1 42
2 15
1 78
0
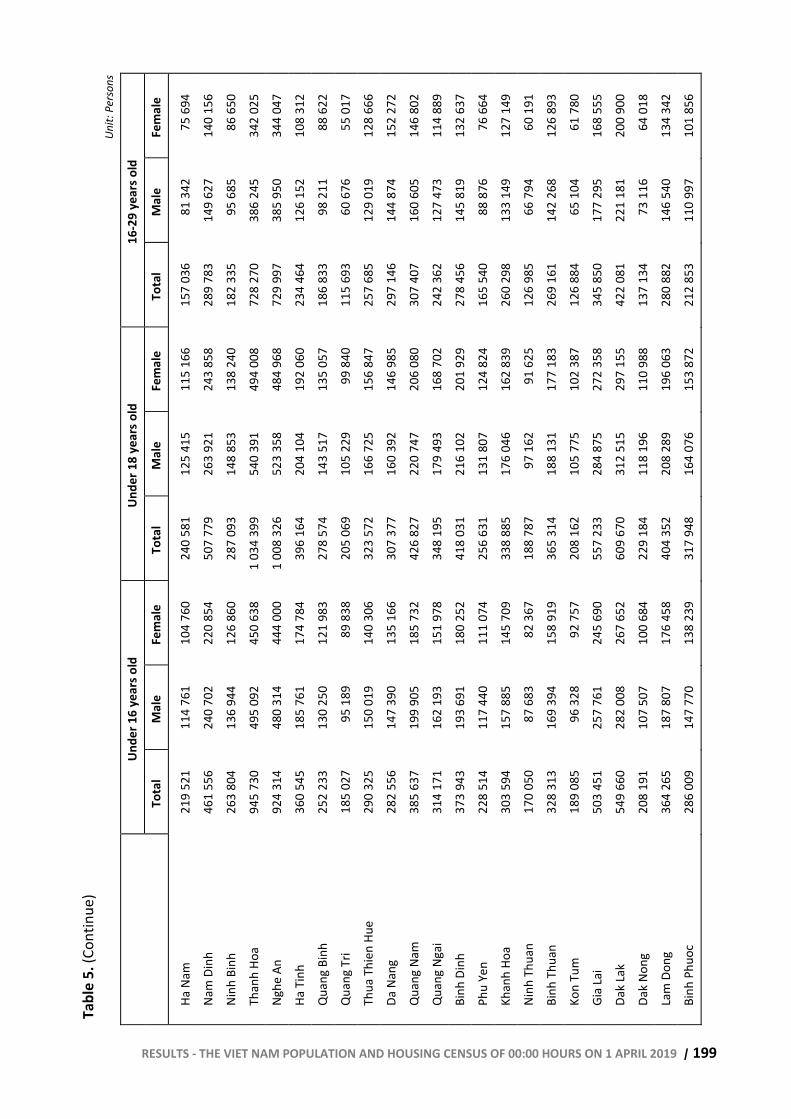
RESULTS - THE VIET NAM POPULATION AND HOUSING CENSUS OF 00:00 HOURS ON 1 APRIL 2019 | 199
Tabl
e 5.
(Con
tinue
) Un
it: P
erso
ns
Unde
r 16
year
s old
Un
der 1
8 ye
ars o
ld
16-2
9 ye
ars o
ld
To
tal
Mal
e Fe
mal
e To
tal
Mal
e Fe
mal
e To
tal
Mal
e Fe
mal
e
Ha N
am
219
521
114
761
104
760
240
581
125
415
115
166
157
036
81 3
42
75 6
94
Nam
Din
h 46
1 55
6 24
0 70
2 22
0 85
4 50
7 77
9 26
3 92
1 24
3 85
8 28
9 78
3 14
9 62
7 14
0 15
6
Ninh
Bin
h 26
3 80
4 13
6 94
4 12
6 86
0 28
7 09
3 14
8 85
3 13
8 24
0 18
2 33
5 95
685
86
650
Than
h Ho
a 94
5 73
0 49
5 09
2 45
0 63
8 1
034
399
540
391
494
008
728
270
386
245
342
025
Nghe
An
924
314
480
314
444
000
1 00
8 32
6 52
3 35
8 48
4 96
8 72
9 99
7 38
5 95
0 34
4 04
7
Ha T
inh
360
545
185
761
174
784
396
164
204
104
192
060
234
464
126
152
108
312
Qua
ng B
inh
252
233
130
250
121
983
278
574
143
517
135
057
186
833
98 2
11
88 6
22
Qua
ng T
ri 18
5 02
7 95
189
89
838
20
5 06
9 10
5 22
9 99
840
11
5 69
3 60
676
55
017
Thua
Thi
en H
ue
290
325
150
019
140
306
323
572
166
725
156
847
257
685
129
019
128
666
Da N
ang
282
556
147
390
135
166
307
377
160
392
146
985
297
146
144
874
152
272
Qua
ng N
am
385
637
199
905
185
732
426
827
220
747
206
080
307
407
160
605
146
802
Qua
ng N
gai
314
171
162
193
151
978
348
195
179
493
168
702
242
362
127
473
114
889
Binh
Din
h 37
3 94
3 19
3 69
1 18
0 25
2 41
8 03
1 21
6 10
2 20
1 92
9 27
8 45
6 14
5 81
9 13
2 63
7
Phu
Yen
228
514
117
440
111
074
256
631
131
807
124
824
165
540
88 8
76
76 6
64
Khan
h Ho
a 30
3 59
4 15
7 88
5 14
5 70
9 33
8 88
5 17
6 04
6 16
2 83
9 26
0 29
8 13
3 14
9 12
7 14
9
Ninh
Thu
an
170
050
87 6
83
82 3
67
188
787
97 1
62
91 6
25
126
985
66 7
94
60 1
91
Binh
Thu
an
328
313
169
394
158
919
365
314
188
131
177
183
269
161
142
268
126
893
Kon
Tum
18
9 08
5 96
328
92
757
20
8 16
2 10
5 77
5 10
2 38
7 12
6 88
4 65
104
61
780
Gia
Lai
503
451
257
761
245
690
557
233
284
875
272
358
345
850
177
295
168
555
Dak
Lak
549
660
282
008
267
652
609
670
312
515
297
155
422
081
221
181
200
900
Dak
Nong
20
8 19
1 10
7 50
7 10
0 68
4 22
9 18
4 11
8 19
6 11
0 98
8 13
7 13
4 73
116
64
018
Lam
Don
g 36
4 26
5 18
7 80
7 17
6 45
8 40
4 35
2 20
8 28
9 19
6 06
3 28
0 88
2 14
6 54
0 13
4 34
2
Binh
Phu
oc
286
009
147
770
138
239
317
948
164
076
153
872
212
853
110
997
101
856
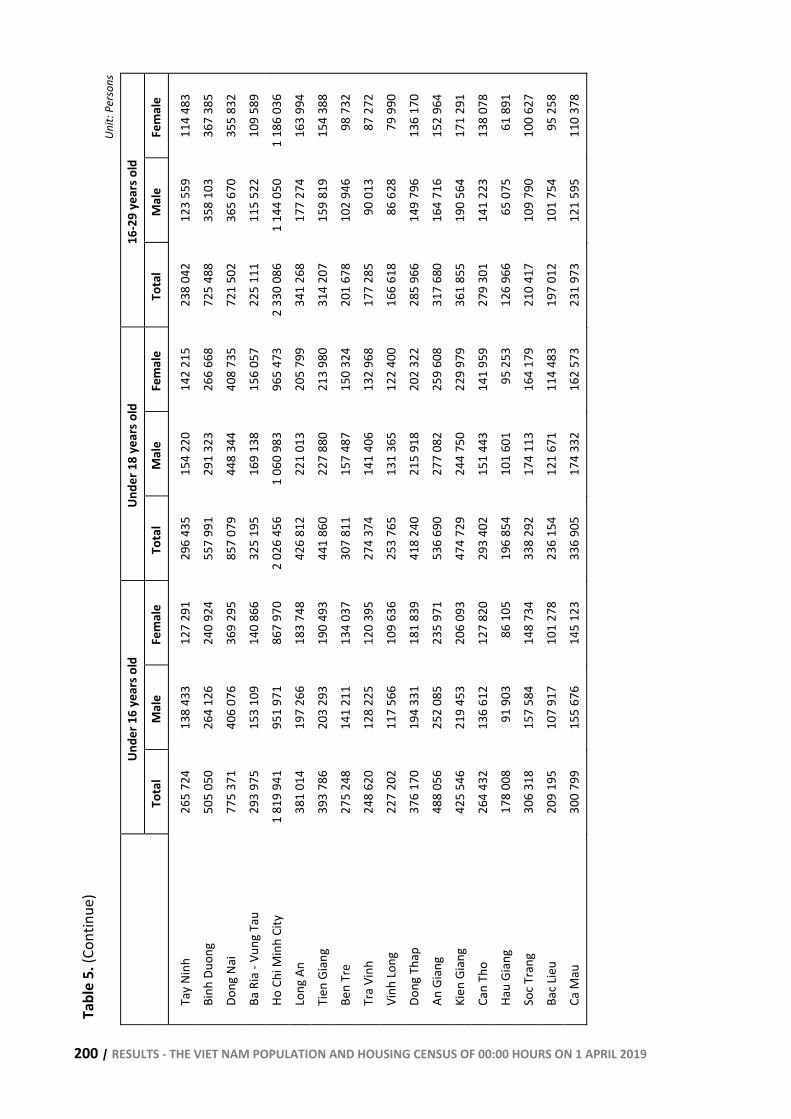
200 | RESULTS - THE VIET NAM POPULATION AND HOUSING CENSUS OF 00:00 HOURS ON 1 APRIL 2019
Tabl
e 5.
(Con
tinue
) Un
it: P
erso
ns
Unde
r 16
year
s old
Un
der 1
8 ye
ars o
ld
16-2
9 ye
ars o
ld
To
tal
Mal
e Fe
mal
e To
tal
Mal
e Fe
mal
e To
tal
Mal
e Fe
mal
e
Tay
Ninh
26
5 72
4 13
8 43
3 12
7 29
1 29
6 43
5 15
4 22
0 14
2 21
5 23
8 04
2 12
3 55
9 11
4 48
3
Binh
Duo
ng
505
050
264
126
240
924
557
991
291
323
266
668
725
488
358
103
367
385
Dong
Nai
77
5 37
1 40
6 07
6 36
9 29
5 85
7 07
9 44
8 34
4 40
8 73
5 72
1 50
2 36
5 67
0 35
5 83
2
Ba R
ia -
Vung
Tau
29
3 97
5 15
3 10
9 14
0 86
6 32
5 19
5 16
9 13
8 15
6 05
7 22
5 11
1 11
5 52
2 10
9 58
9
Ho C
hi M
inh
City
1
819
941
951
971
867
970
2 02
6 45
6 1
060
983
965
473
2 33
0 08
6 1
144
050
1 18
6 03
6
Long
An
381
014
197
266
183
748
426
812
221
013
205
799
341
268
177
274
163
994
Tien
Gia
ng
393
786
203
293
190
493
441
860
227
880
213
980
314
207
159
819
154
388
Ben
Tre
275
248
141
211
134
037
307
811
157
487
150
324
201
678
102
946
98 7
32
Tra
Vinh
24
8 62
0 12
8 22
5 12
0 39
5 27
4 37
4 14
1 40
6 13
2 96
8 17
7 28
5 90
013
87
272
Vinh
Long
22
7 20
2 11
7 56
6 10
9 63
6 25
3 76
5 13
1 36
5 12
2 40
0 16
6 61
8 86
628
79
990
Dong
Tha
p 37
6 17
0 19
4 33
1 18
1 83
9 41
8 24
0 21
5 91
8 20
2 32
2 28
5 96
6 14
9 79
6 13
6 17
0
An G
iang
48
8 05
6 25
2 08
5 23
5 97
1 53
6 69
0 27
7 08
2 25
9 60
8 31
7 68
0 16
4 71
6 15
2 96
4
Kien
Gia
ng
425
546
219
453
206
093
474
729
244
750
229
979
361
855
190
564
171
291
Can
Tho
264
432
136
612
127
820
293
402
151
443
141
959
279
301
141
223
138
078
Hau
Gian
g 17
8 00
8 91
903
86
105
19
6 85
4 10
1 60
1 95
253
12
6 96
6 65
075
61
891
Soc T
rang
30
6 31
8 15
7 58
4 14
8 73
4 33
8 29
2 17
4 11
3 16
4 17
9 21
0 41
7 10
9 79
0 10
0 62
7
Bac L
ieu
209
195
107
917
101
278
236
154
121
671
114
483
197
012
101
754
95 2
58
Ca M
au
300
799
155
676
145
123
336
905
174
332
162
573
231
973
121
595
110
378
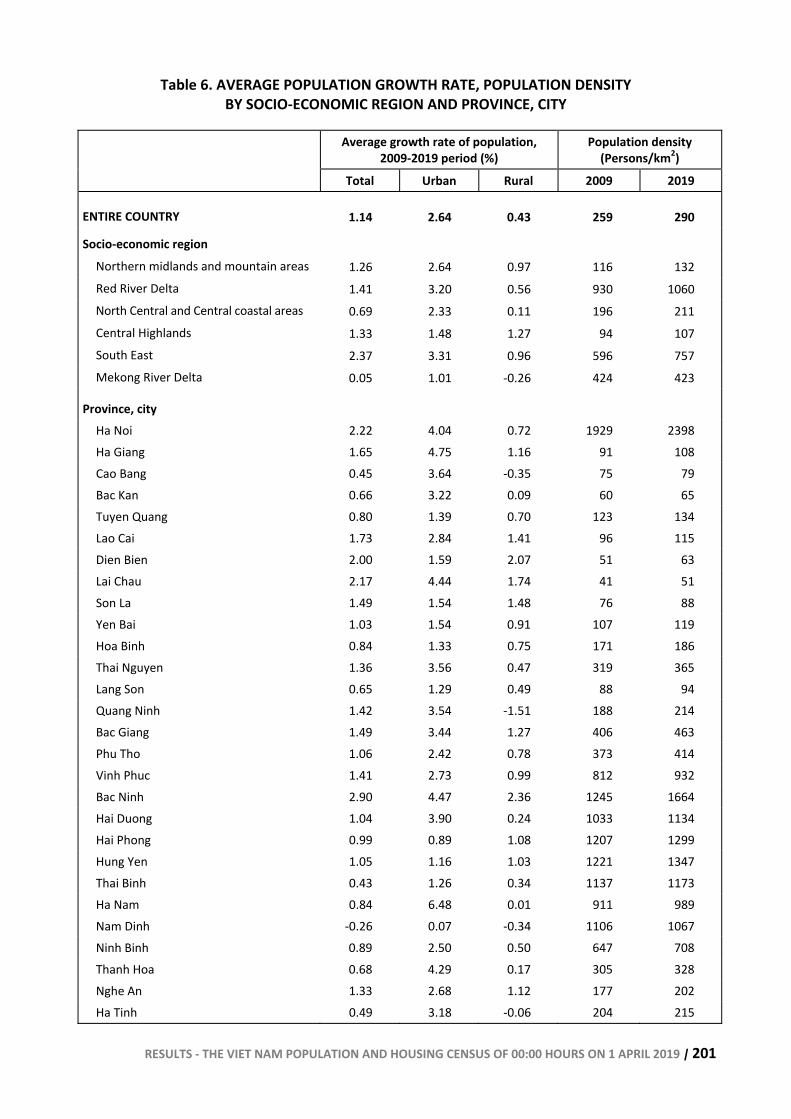
RESULTS - THE VIET NAM POPULATION AND HOUSING CENSUS OF 00:00 HOURS ON 1 APRIL 2019 | 201
Table 6. AVERAGE POPULATION GROWTH RATE, POPULATION DENSITY BY SOCIO-ECONOMIC REGION AND PROVINCE, CITY
Average growth rate of population,
2009-2019 period (%) Population density
(Persons/km2) Total Urban Rural 2009 2019
ENTIRE COUNTRY 1.14 2.64 0.43 259 290
Socio-economic region Northern midlands and mountain areas 1.26 2.64 0.97 116 132 Red River Delta 1.41 3.20 0.56 930 1060 North Central and Central coastal areas 0.69 2.33 0.11 196 211 Central Highlands 1.33 1.48 1.27 94 107 South East 2.37 3.31 0.96 596 757 Mekong River Delta 0.05 1.01 -0.26 424 423
Province, city Ha Noi 2.22 4.04 0.72 1929 2398 Ha Giang 1.65 4.75 1.16 91 108 Cao Bang 0.45 3.64 -0.35 75 79 Bac Kan 0.66 3.22 0.09 60 65 Tuyen Quang 0.80 1.39 0.70 123 134 Lao Cai 1.73 2.84 1.41 96 115 Dien Bien 2.00 1.59 2.07 51 63 Lai Chau 2.17 4.44 1.74 41 51 Son La 1.49 1.54 1.48 76 88 Yen Bai 1.03 1.54 0.91 107 119 Hoa Binh 0.84 1.33 0.75 171 186 Thai Nguyen 1.36 3.56 0.47 319 365 Lang Son 0.65 1.29 0.49 88 94 Quang Ninh 1.42 3.54 -1.51 188 214 Bac Giang 1.49 3.44 1.27 406 463 Phu Tho 1.06 2.42 0.78 373 414 Vinh Phuc 1.41 2.73 0.99 812 932 Bac Ninh 2.90 4.47 2.36 1245 1664 Hai Duong 1.04 3.90 0.24 1033 1134 Hai Phong 0.99 0.89 1.08 1207 1299 Hung Yen 1.05 1.16 1.03 1221 1347 Thai Binh 0.43 1.26 0.34 1137 1173 Ha Nam 0.84 6.48 0.01 911 989 Nam Dinh -0.26 0.07 -0.34 1106 1067 Ninh Binh 0.89 2.50 0.50 647 708 Thanh Hoa 0.68 4.29 0.17 305 328 Nghe An 1.33 2.68 1.12 177 202 Ha Tinh 0.49 3.18 -0.06 204 215
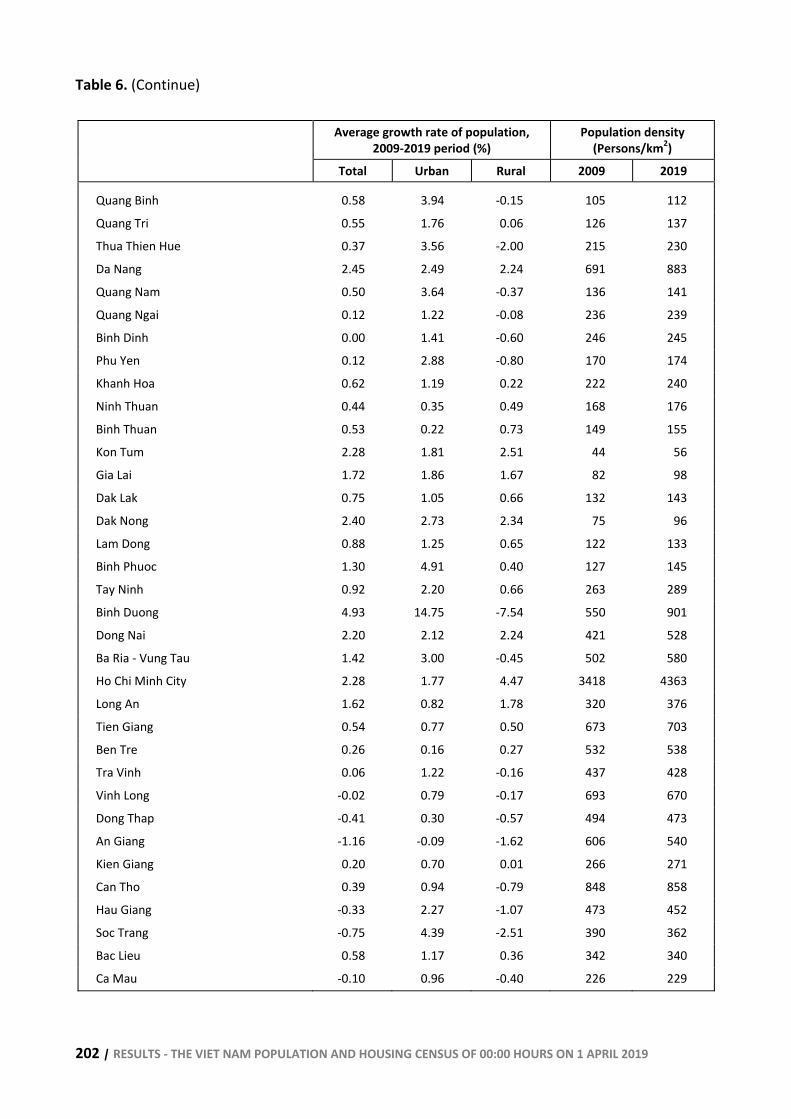
202 | RESULTS - THE VIET NAM POPULATION AND HOUSING CENSUS OF 00:00 HOURS ON 1 APRIL 2019
Table 6. (Continue)
Average growth rate of population, 2009-2019 period (%)
Population density (Persons/km2)
Total Urban Rural 2009 2019
Quang Binh 0.58 3.94 -0.15 105 112
Quang Tri 0.55 1.76 0.06 126 137
Thua Thien Hue 0.37 3.56 -2.00 215 230
Da Nang 2.45 2.49 2.24 691 883
Quang Nam 0.50 3.64 -0.37 136 141
Quang Ngai 0.12 1.22 -0.08 236 239
Binh Dinh 0.00 1.41 -0.60 246 245
Phu Yen 0.12 2.88 -0.80 170 174
Khanh Hoa 0.62 1.19 0.22 222 240
Ninh Thuan 0.44 0.35 0.49 168 176
Binh Thuan 0.53 0.22 0.73 149 155
Kon Tum 2.28 1.81 2.51 44 56
Gia Lai 1.72 1.86 1.67 82 98
Dak Lak 0.75 1.05 0.66 132 143
Dak Nong 2.40 2.73 2.34 75 96
Lam Dong 0.88 1.25 0.65 122 133
Binh Phuoc 1.30 4.91 0.40 127 145
Tay Ninh 0.92 2.20 0.66 263 289
Binh Duong 4.93 14.75 -7.54 550 901
Dong Nai 2.20 2.12 2.24 421 528
Ba Ria - Vung Tau 1.42 3.00 -0.45 502 580
Ho Chi Minh City 2.28 1.77 4.47 3418 4363
Long An 1.62 0.82 1.78 320 376
Tien Giang 0.54 0.77 0.50 673 703
Ben Tre 0.26 0.16 0.27 532 538
Tra Vinh 0.06 1.22 -0.16 437 428
Vinh Long -0.02 0.79 -0.17 693 670
Dong Thap -0.41 0.30 -0.57 494 473
An Giang -1.16 -0.09 -1.62 606 540
Kien Giang 0.20 0.70 0.01 266 271
Can Tho 0.39 0.94 -0.79 848 858
Hau Giang -0.33 2.27 -1.07 473 452
Soc Trang -0.75 4.39 -2.51 390 362
Bac Lieu 0.58 1.17 0.36 342 340
Ca Mau -0.10 0.96 -0.40 226 229
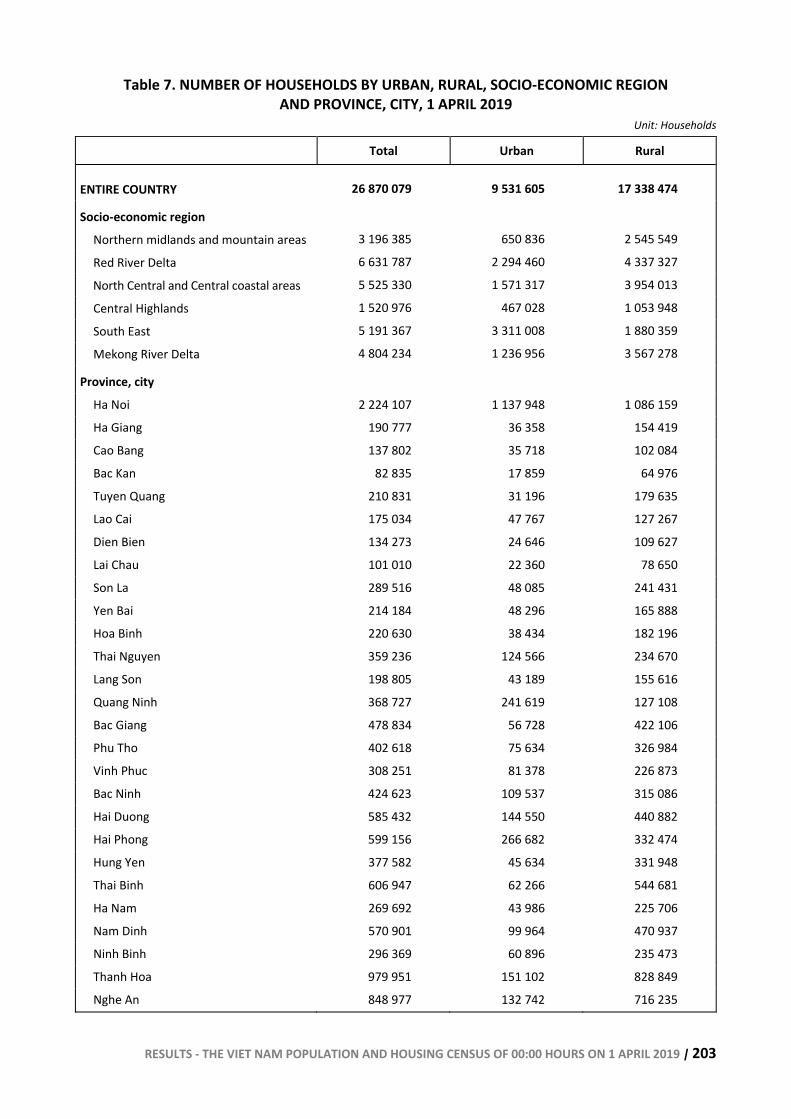
RESULTS - THE VIET NAM POPULATION AND HOUSING CENSUS OF 00:00 HOURS ON 1 APRIL 2019 | 203
Table 7. NUMBER OF HOUSEHOLDS BY URBAN, RURAL, SOCIO-ECONOMIC REGION AND PROVINCE, CITY, 1 APRIL 2019
Unit: Households
Total Urban Rural
ENTIRE COUNTRY 26 870 079 9 531 605 17 338 474
Socio-economic region
Northern midlands and mountain areas 3 196 385 650 836 2 545 549
Red River Delta 6 631 787 2 294 460 4 337 327
North Central and Central coastal areas 5 525 330 1 571 317 3 954 013
Central Highlands 1 520 976 467 028 1 053 948
South East 5 191 367 3 311 008 1 880 359
Mekong River Delta 4 804 234 1 236 956 3 567 278
Province, city Ha Noi 2 224 107 1 137 948 1 086 159
Ha Giang 190 777 36 358 154 419
Cao Bang 137 802 35 718 102 084
Bac Kan 82 835 17 859 64 976
Tuyen Quang 210 831 31 196 179 635
Lao Cai 175 034 47 767 127 267
Dien Bien 134 273 24 646 109 627
Lai Chau 101 010 22 360 78 650
Son La 289 516 48 085 241 431
Yen Bai 214 184 48 296 165 888
Hoa Binh 220 630 38 434 182 196
Thai Nguyen 359 236 124 566 234 670
Lang Son 198 805 43 189 155 616
Quang Ninh 368 727 241 619 127 108
Bac Giang 478 834 56 728 422 106
Phu Tho 402 618 75 634 326 984
Vinh Phuc 308 251 81 378 226 873
Bac Ninh 424 623 109 537 315 086
Hai Duong 585 432 144 550 440 882
Hai Phong 599 156 266 682 332 474
Hung Yen 377 582 45 634 331 948
Thai Binh 606 947 62 266 544 681
Ha Nam 269 692 43 986 225 706
Nam Dinh 570 901 99 964 470 937
Ninh Binh 296 369 60 896 235 473
Thanh Hoa 979 951 151 102 828 849
Nghe An 848 977 132 742 716 235
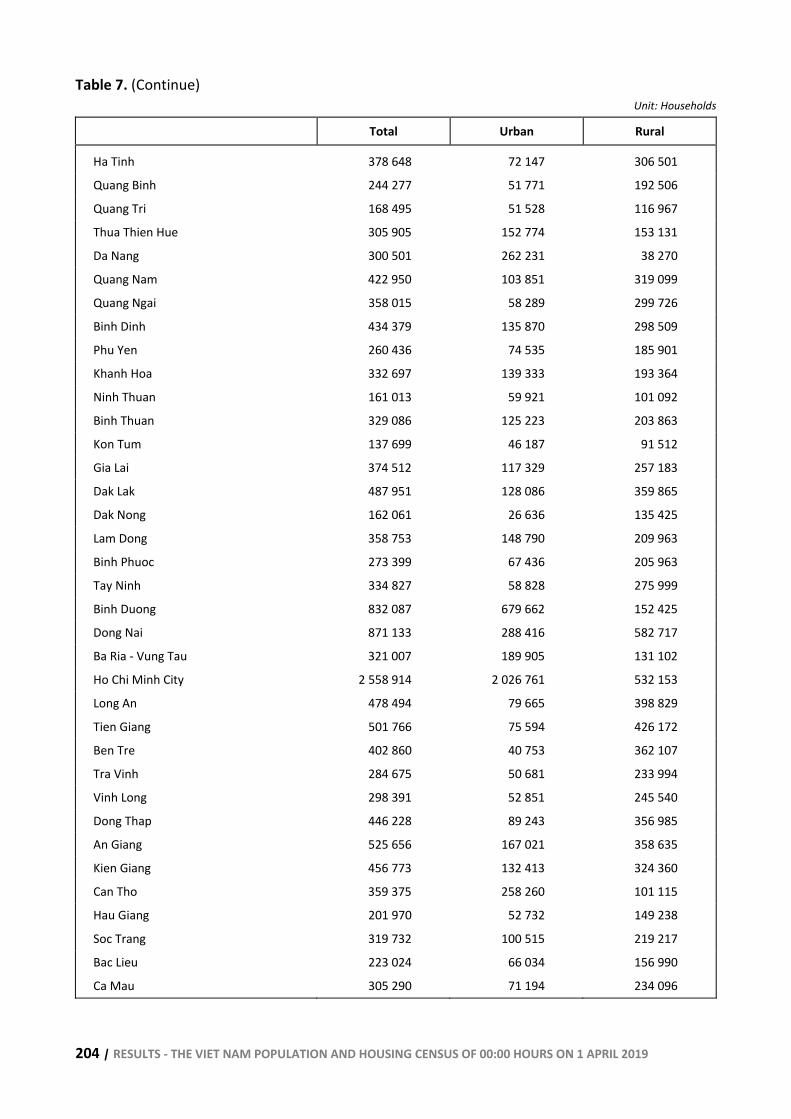
204 | RESULTS - THE VIET NAM POPULATION AND HOUSING CENSUS OF 00:00 HOURS ON 1 APRIL 2019
Table 7. (Continue) Unit: Households
Total Urban Rural
Ha Tinh 378 648 72 147 306 501
Quang Binh 244 277 51 771 192 506
Quang Tri 168 495 51 528 116 967
Thua Thien Hue 305 905 152 774 153 131
Da Nang 300 501 262 231 38 270
Quang Nam 422 950 103 851 319 099
Quang Ngai 358 015 58 289 299 726
Binh Dinh 434 379 135 870 298 509
Phu Yen 260 436 74 535 185 901
Khanh Hoa 332 697 139 333 193 364
Ninh Thuan 161 013 59 921 101 092
Binh Thuan 329 086 125 223 203 863
Kon Tum 137 699 46 187 91 512
Gia Lai 374 512 117 329 257 183
Dak Lak 487 951 128 086 359 865
Dak Nong 162 061 26 636 135 425
Lam Dong 358 753 148 790 209 963
Binh Phuoc 273 399 67 436 205 963
Tay Ninh 334 827 58 828 275 999
Binh Duong 832 087 679 662 152 425
Dong Nai 871 133 288 416 582 717
Ba Ria - Vung Tau 321 007 189 905 131 102
Ho Chi Minh City 2 558 914 2 026 761 532 153
Long An 478 494 79 665 398 829
Tien Giang 501 766 75 594 426 172
Ben Tre 402 860 40 753 362 107
Tra Vinh 284 675 50 681 233 994
Vinh Long 298 391 52 851 245 540
Dong Thap 446 228 89 243 356 985
An Giang 525 656 167 021 358 635
Kien Giang 456 773 132 413 324 360
Can Tho 359 375 258 260 101 115
Hau Giang 201 970 52 732 149 238
Soc Trang 319 732 100 515 219 217
Bac Lieu 223 024 66 034 156 990
Ca Mau 305 290 71 194 234 096
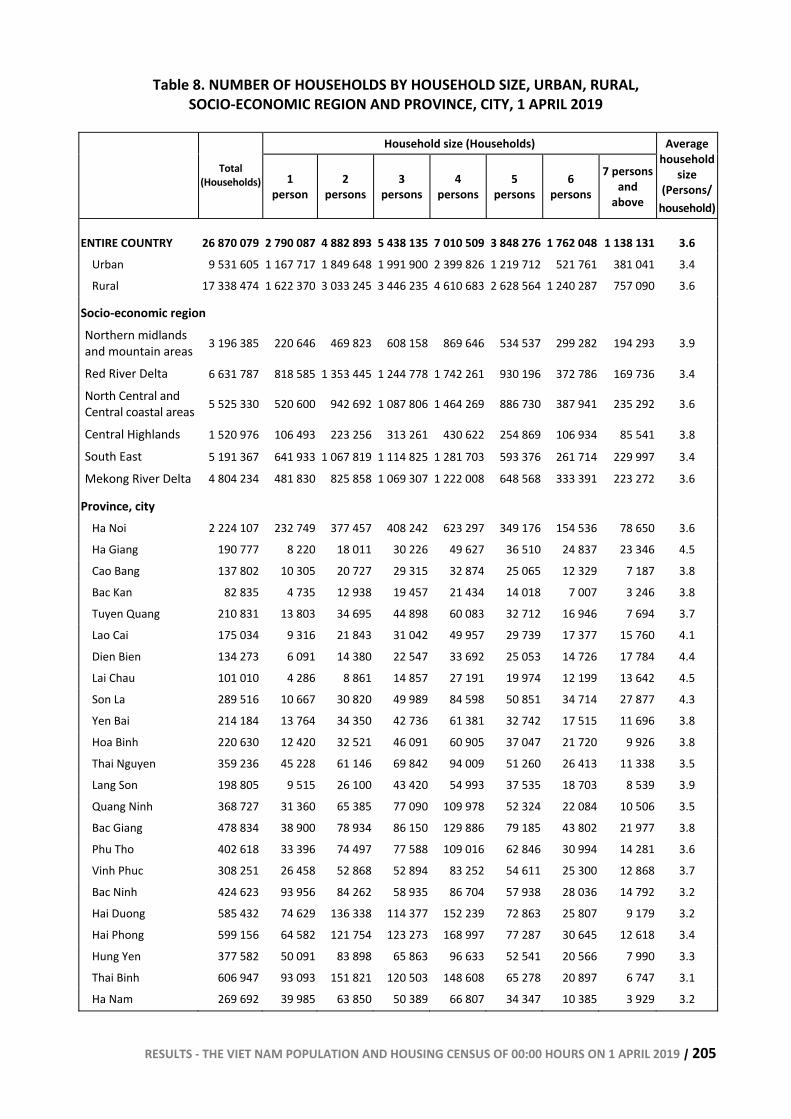
RESULTS - THE VIET NAM POPULATION AND HOUSING CENSUS OF 00:00 HOURS ON 1 APRIL 2019 | 205
Table 8. NUMBER OF HOUSEHOLDS BY HOUSEHOLD SIZE, URBAN, RURAL, SOCIO-ECONOMIC REGION AND PROVINCE, CITY, 1 APRIL 2019
Household size (Households)
Total (Households) 1
person 2
persons 3
persons 4
persons 5
persons 6
persons
7 persons and
above
Average household
size (Persons/
household)
ENTIRE COUNTRY 26 870 079 2 790 087 4 882 893 5 438 135 7 010 509 3 848 276 1 762 048 1 138 131 3.6 Urban 9 531 605 1 167 717 1 849 648 1 991 900 2 399 826 1 219 712 521 761 381 041 3.4
Rural 17 338 474 1 622 370 3 033 245 3 446 235 4 610 683 2 628 564 1 240 287 757 090 3.6
Socio-economic region
Northern midlands and mountain areas 3 196 385 220 646 469 823 608 158 869 646 534 537 299 282 194 293 3.9
Red River Delta 6 631 787 818 585 1 353 445 1 244 778 1 742 261 930 196 372 786 169 736 3.4
North Central and Central coastal areas 5 525 330 520 600 942 692 1 087 806 1 464 269 886 730 387 941 235 292 3.6
Central Highlands 1 520 976 106 493 223 256 313 261 430 622 254 869 106 934 85 541 3.8
South East 5 191 367 641 933 1 067 819 1 114 825 1 281 703 593 376 261 714 229 997 3.4
Mekong River Delta 4 804 234 481 830 825 858 1 069 307 1 222 008 648 568 333 391 223 272 3.6
Province, city
Ha Noi 2 224 107 232 749 377 457 408 242 623 297 349 176 154 536 78 650 3.6
Ha Giang 190 777 8 220 18 011 30 226 49 627 36 510 24 837 23 346 4.5
Cao Bang 137 802 10 305 20 727 29 315 32 874 25 065 12 329 7 187 3.8
Bac Kan 82 835 4 735 12 938 19 457 21 434 14 018 7 007 3 246 3.8
Tuyen Quang 210 831 13 803 34 695 44 898 60 083 32 712 16 946 7 694 3.7
Lao Cai 175 034 9 316 21 843 31 042 49 957 29 739 17 377 15 760 4.1
Dien Bien 134 273 6 091 14 380 22 547 33 692 25 053 14 726 17 784 4.4
Lai Chau 101 010 4 286 8 861 14 857 27 191 19 974 12 199 13 642 4.5
Son La 289 516 10 667 30 820 49 989 84 598 50 851 34 714 27 877 4.3
Yen Bai 214 184 13 764 34 350 42 736 61 381 32 742 17 515 11 696 3.8
Hoa Binh 220 630 12 420 32 521 46 091 60 905 37 047 21 720 9 926 3.8
Thai Nguyen 359 236 45 228 61 146 69 842 94 009 51 260 26 413 11 338 3.5
Lang Son 198 805 9 515 26 100 43 420 54 993 37 535 18 703 8 539 3.9
Quang Ninh 368 727 31 360 65 385 77 090 109 978 52 324 22 084 10 506 3.5
Bac Giang 478 834 38 900 78 934 86 150 129 886 79 185 43 802 21 977 3.8
Phu Tho 402 618 33 396 74 497 77 588 109 016 62 846 30 994 14 281 3.6
Vinh Phuc 308 251 26 458 52 868 52 894 83 252 54 611 25 300 12 868 3.7
Bac Ninh 424 623 93 956 84 262 58 935 86 704 57 938 28 036 14 792 3.2
Hai Duong 585 432 74 629 136 338 114 377 152 239 72 863 25 807 9 179 3.2
Hai Phong 599 156 64 582 121 754 123 273 168 997 77 287 30 645 12 618 3.4
Hung Yen 377 582 50 091 83 898 65 863 96 633 52 541 20 566 7 990 3.3
Thai Binh 606 947 93 093 151 821 120 503 148 608 65 278 20 897 6 747 3.1
Ha Nam 269 692 39 985 63 850 50 389 66 807 34 347 10 385 3 929 3.2
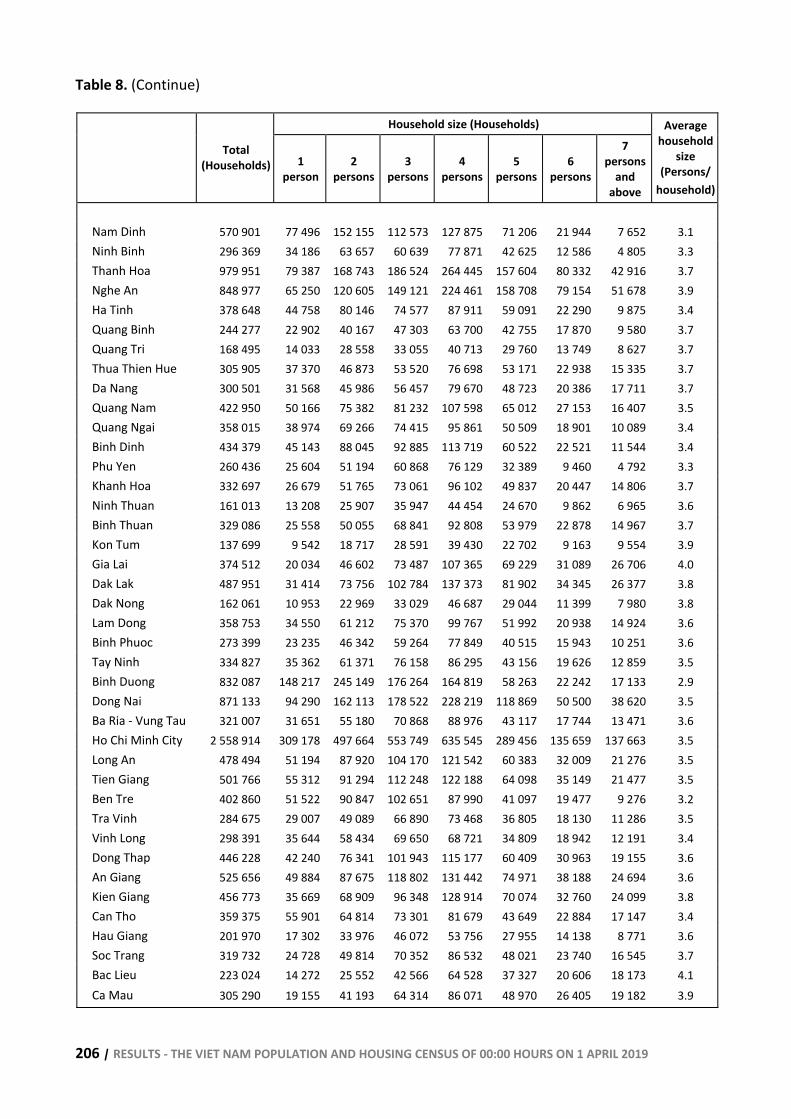
206 | RESULTS - THE VIET NAM POPULATION AND HOUSING CENSUS OF 00:00 HOURS ON 1 APRIL 2019
Table 8. (Continue)
Household size (Households)
Total (Households) 1
person 2
persons3
persons4
persons5
persons 6
persons
7 persons
and above
Average household
size (Persons/
household)
Nam Dinh 570 901 77 496 152 155 112 573 127 875 71 206 21 944 7 652 3.1 Ninh Binh 296 369 34 186 63 657 60 639 77 871 42 625 12 586 4 805 3.3 Thanh Hoa 979 951 79 387 168 743 186 524 264 445 157 604 80 332 42 916 3.7 Nghe An 848 977 65 250 120 605 149 121 224 461 158 708 79 154 51 678 3.9 Ha Tinh 378 648 44 758 80 146 74 577 87 911 59 091 22 290 9 875 3.4 Quang Binh 244 277 22 902 40 167 47 303 63 700 42 755 17 870 9 580 3.7 Quang Tri 168 495 14 033 28 558 33 055 40 713 29 760 13 749 8 627 3.7 Thua Thien Hue 305 905 37 370 46 873 53 520 76 698 53 171 22 938 15 335 3.7 Da Nang 300 501 31 568 45 986 56 457 79 670 48 723 20 386 17 711 3.7 Quang Nam 422 950 50 166 75 382 81 232 107 598 65 012 27 153 16 407 3.5 Quang Ngai 358 015 38 974 69 266 74 415 95 861 50 509 18 901 10 089 3.4 Binh Dinh 434 379 45 143 88 045 92 885 113 719 60 522 22 521 11 544 3.4 Phu Yen 260 436 25 604 51 194 60 868 76 129 32 389 9 460 4 792 3.3 Khanh Hoa 332 697 26 679 51 765 73 061 96 102 49 837 20 447 14 806 3.7 Ninh Thuan 161 013 13 208 25 907 35 947 44 454 24 670 9 862 6 965 3.6 Binh Thuan 329 086 25 558 50 055 68 841 92 808 53 979 22 878 14 967 3.7 Kon Tum 137 699 9 542 18 717 28 591 39 430 22 702 9 163 9 554 3.9 Gia Lai 374 512 20 034 46 602 73 487 107 365 69 229 31 089 26 706 4.0 Dak Lak 487 951 31 414 73 756 102 784 137 373 81 902 34 345 26 377 3.8 Dak Nong 162 061 10 953 22 969 33 029 46 687 29 044 11 399 7 980 3.8 Lam Dong 358 753 34 550 61 212 75 370 99 767 51 992 20 938 14 924 3.6 Binh Phuoc 273 399 23 235 46 342 59 264 77 849 40 515 15 943 10 251 3.6 Tay Ninh 334 827 35 362 61 371 76 158 86 295 43 156 19 626 12 859 3.5 Binh Duong 832 087 148 217 245 149 176 264 164 819 58 263 22 242 17 133 2.9 Dong Nai 871 133 94 290 162 113 178 522 228 219 118 869 50 500 38 620 3.5 Ba Ria - Vung Tau 321 007 31 651 55 180 70 868 88 976 43 117 17 744 13 471 3.6 Ho Chi Minh City 2 558 914 309 178 497 664 553 749 635 545 289 456 135 659 137 663 3.5 Long An 478 494 51 194 87 920 104 170 121 542 60 383 32 009 21 276 3.5 Tien Giang 501 766 55 312 91 294 112 248 122 188 64 098 35 149 21 477 3.5 Ben Tre 402 860 51 522 90 847 102 651 87 990 41 097 19 477 9 276 3.2 Tra Vinh 284 675 29 007 49 089 66 890 73 468 36 805 18 130 11 286 3.5 Vinh Long 298 391 35 644 58 434 69 650 68 721 34 809 18 942 12 191 3.4 Dong Thap 446 228 42 240 76 341 101 943 115 177 60 409 30 963 19 155 3.6 An Giang 525 656 49 884 87 675 118 802 131 442 74 971 38 188 24 694 3.6 Kien Giang 456 773 35 669 68 909 96 348 128 914 70 074 32 760 24 099 3.8 Can Tho 359 375 55 901 64 814 73 301 81 679 43 649 22 884 17 147 3.4 Hau Giang 201 970 17 302 33 976 46 072 53 756 27 955 14 138 8 771 3.6 Soc Trang 319 732 24 728 49 814 70 352 86 532 48 021 23 740 16 545 3.7 Bac Lieu 223 024 14 272 25 552 42 566 64 528 37 327 20 606 18 173 4.1 Ca Mau 305 290 19 155 41 193 64 314 86 071 48 970 26 405 19 182 3.9
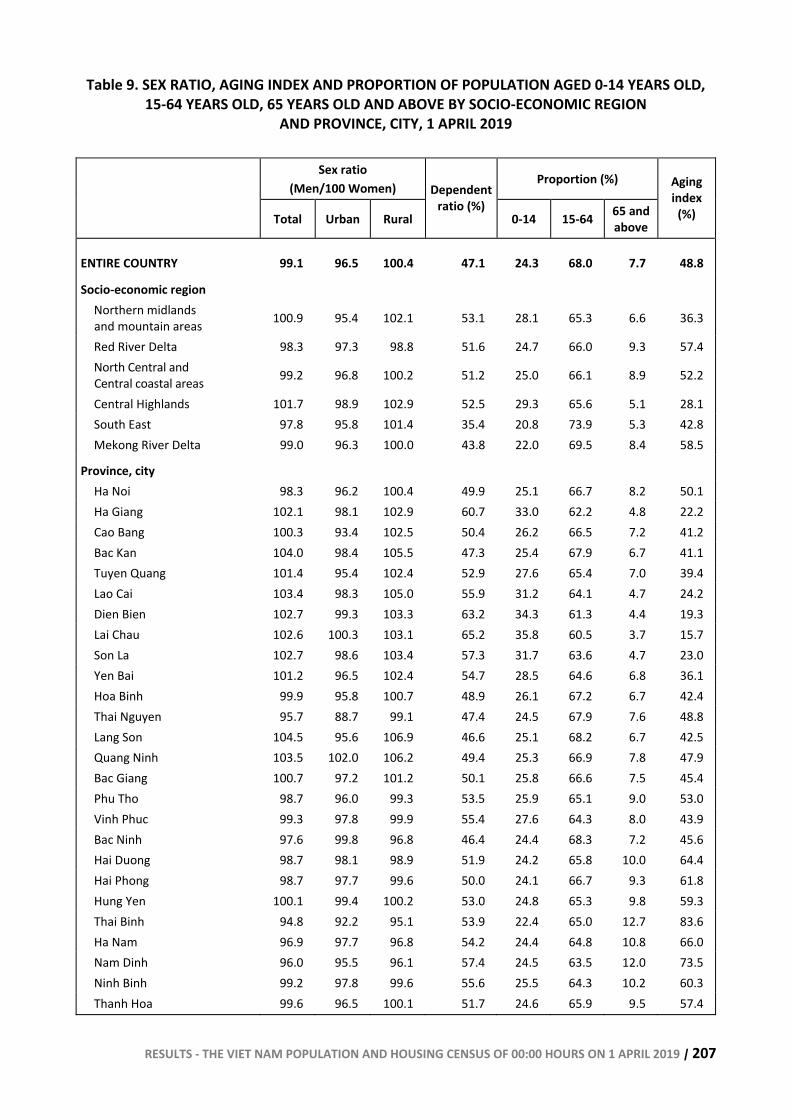
RESULTS - THE VIET NAM POPULATION AND HOUSING CENSUS OF 00:00 HOURS ON 1 APRIL 2019 | 207
Table 9. SEX RATIO, AGING INDEX AND PROPORTION OF POPULATION AGED 0-14 YEARS OLD, 15-64 YEARS OLD, 65 YEARS OLD AND ABOVE BY SOCIO-ECONOMIC REGION
AND PROVINCE, CITY, 1 APRIL 2019
Sex ratio (Men/100 Women)
Proportion (%)
Total Urban Rural
Dependent ratio (%)
0-14 15-64 65 and above
Aging index
(%)
ENTIRE COUNTRY 99.1 96.5 100.4 47.1 24.3 68.0 7.7 48.8
Socio-economic region Northern midlands and mountain areas 100.9 95.4 102.1 53.1 28.1 65.3 6.6 36.3
Red River Delta 98.3 97.3 98.8 51.6 24.7 66.0 9.3 57.4 North Central and Central coastal areas 99.2 96.8 100.2 51.2 25.0 66.1 8.9 52.2
Central Highlands 101.7 98.9 102.9 52.5 29.3 65.6 5.1 28.1 South East 97.8 95.8 101.4 35.4 20.8 73.9 5.3 42.8 Mekong River Delta 99.0 96.3 100.0 43.8 22.0 69.5 8.4 58.5
Province, city Ha Noi 98.3 96.2 100.4 49.9 25.1 66.7 8.2 50.1 Ha Giang 102.1 98.1 102.9 60.7 33.0 62.2 4.8 22.2 Cao Bang 100.3 93.4 102.5 50.4 26.2 66.5 7.2 41.2 Bac Kan 104.0 98.4 105.5 47.3 25.4 67.9 6.7 41.1 Tuyen Quang 101.4 95.4 102.4 52.9 27.6 65.4 7.0 39.4 Lao Cai 103.4 98.3 105.0 55.9 31.2 64.1 4.7 24.2 Dien Bien 102.7 99.3 103.3 63.2 34.3 61.3 4.4 19.3 Lai Chau 102.6 100.3 103.1 65.2 35.8 60.5 3.7 15.7 Son La 102.7 98.6 103.4 57.3 31.7 63.6 4.7 23.0 Yen Bai 101.2 96.5 102.4 54.7 28.5 64.6 6.8 36.1 Hoa Binh 99.9 95.8 100.7 48.9 26.1 67.2 6.7 42.4 Thai Nguyen 95.7 88.7 99.1 47.4 24.5 67.9 7.6 48.8 Lang Son 104.5 95.6 106.9 46.6 25.1 68.2 6.7 42.5 Quang Ninh 103.5 102.0 106.2 49.4 25.3 66.9 7.8 47.9 Bac Giang 100.7 97.2 101.2 50.1 25.8 66.6 7.5 45.4 Phu Tho 98.7 96.0 99.3 53.5 25.9 65.1 9.0 53.0 Vinh Phuc 99.3 97.8 99.9 55.4 27.6 64.3 8.0 43.9 Bac Ninh 97.6 99.8 96.8 46.4 24.4 68.3 7.2 45.6 Hai Duong 98.7 98.1 98.9 51.9 24.2 65.8 10.0 64.4 Hai Phong 98.7 97.7 99.6 50.0 24.1 66.7 9.3 61.8 Hung Yen 100.1 99.4 100.2 53.0 24.8 65.3 9.8 59.3 Thai Binh 94.8 92.2 95.1 53.9 22.4 65.0 12.7 83.6 Ha Nam 96.9 97.7 96.8 54.2 24.4 64.8 10.8 66.0 Nam Dinh 96.0 95.5 96.1 57.4 24.5 63.5 12.0 73.5 Ninh Binh 99.2 97.8 99.6 55.6 25.5 64.3 10.2 60.3 Thanh Hoa 99.6 96.5 100.1 51.7 24.6 65.9 9.5 57.4
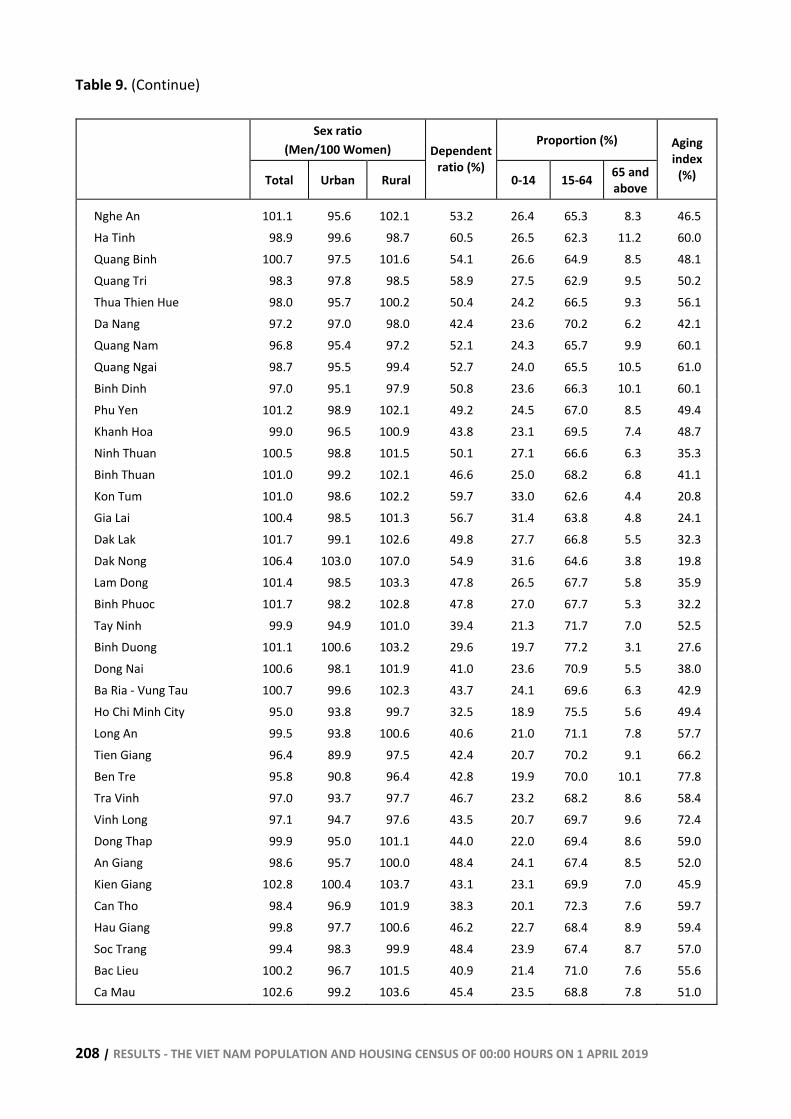
208 | RESULTS - THE VIET NAM POPULATION AND HOUSING CENSUS OF 00:00 HOURS ON 1 APRIL 2019
Table 9. (Continue)
Sex ratio (Men/100 Women)
Proportion (%)
Total Urban Rural
Dependent ratio (%)
0-14 15-64 65 and above
Aging index
(%)
Nghe An 101.1 95.6 102.1 53.2 26.4 65.3 8.3 46.5 Ha Tinh 98.9 99.6 98.7 60.5 26.5 62.3 11.2 60.0 Quang Binh 100.7 97.5 101.6 54.1 26.6 64.9 8.5 48.1 Quang Tri 98.3 97.8 98.5 58.9 27.5 62.9 9.5 50.2 Thua Thien Hue 98.0 95.7 100.2 50.4 24.2 66.5 9.3 56.1 Da Nang 97.2 97.0 98.0 42.4 23.6 70.2 6.2 42.1 Quang Nam 96.8 95.4 97.2 52.1 24.3 65.7 9.9 60.1 Quang Ngai 98.7 95.5 99.4 52.7 24.0 65.5 10.5 61.0 Binh Dinh 97.0 95.1 97.9 50.8 23.6 66.3 10.1 60.1 Phu Yen 101.2 98.9 102.1 49.2 24.5 67.0 8.5 49.4 Khanh Hoa 99.0 96.5 100.9 43.8 23.1 69.5 7.4 48.7 Ninh Thuan 100.5 98.8 101.5 50.1 27.1 66.6 6.3 35.3 Binh Thuan 101.0 99.2 102.1 46.6 25.0 68.2 6.8 41.1 Kon Tum 101.0 98.6 102.2 59.7 33.0 62.6 4.4 20.8 Gia Lai 100.4 98.5 101.3 56.7 31.4 63.8 4.8 24.1 Dak Lak 101.7 99.1 102.6 49.8 27.7 66.8 5.5 32.3 Dak Nong 106.4 103.0 107.0 54.9 31.6 64.6 3.8 19.8 Lam Dong 101.4 98.5 103.3 47.8 26.5 67.7 5.8 35.9 Binh Phuoc 101.7 98.2 102.8 47.8 27.0 67.7 5.3 32.2 Tay Ninh 99.9 94.9 101.0 39.4 21.3 71.7 7.0 52.5 Binh Duong 101.1 100.6 103.2 29.6 19.7 77.2 3.1 27.6 Dong Nai 100.6 98.1 101.9 41.0 23.6 70.9 5.5 38.0 Ba Ria - Vung Tau 100.7 99.6 102.3 43.7 24.1 69.6 6.3 42.9 Ho Chi Minh City 95.0 93.8 99.7 32.5 18.9 75.5 5.6 49.4 Long An 99.5 93.8 100.6 40.6 21.0 71.1 7.8 57.7 Tien Giang 96.4 89.9 97.5 42.4 20.7 70.2 9.1 66.2 Ben Tre 95.8 90.8 96.4 42.8 19.9 70.0 10.1 77.8 Tra Vinh 97.0 93.7 97.7 46.7 23.2 68.2 8.6 58.4 Vinh Long 97.1 94.7 97.6 43.5 20.7 69.7 9.6 72.4 Dong Thap 99.9 95.0 101.1 44.0 22.0 69.4 8.6 59.0 An Giang 98.6 95.7 100.0 48.4 24.1 67.4 8.5 52.0 Kien Giang 102.8 100.4 103.7 43.1 23.1 69.9 7.0 45.9 Can Tho 98.4 96.9 101.9 38.3 20.1 72.3 7.6 59.7 Hau Giang 99.8 97.7 100.6 46.2 22.7 68.4 8.9 59.4 Soc Trang 99.4 98.3 99.9 48.4 23.9 67.4 8.7 57.0 Bac Lieu 100.2 96.7 101.5 40.9 21.4 71.0 7.6 55.6 Ca Mau 102.6 99.2 103.6 45.4 23.5 68.8 7.8 51.0
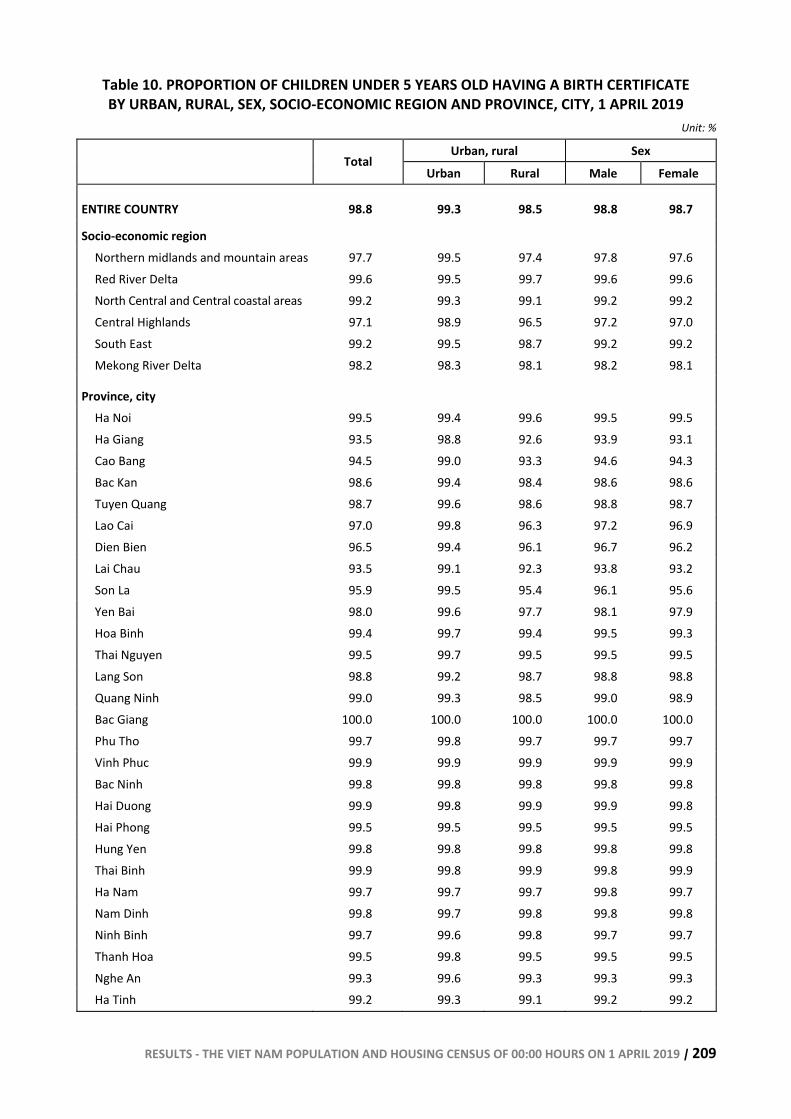
RESULTS - THE VIET NAM POPULATION AND HOUSING CENSUS OF 00:00 HOURS ON 1 APRIL 2019 | 209
Table 10. PROPORTION OF CHILDREN UNDER 5 YEARS OLD HAVING A BIRTH CERTIFICATE BY URBAN, RURAL, SEX, SOCIO-ECONOMIC REGION AND PROVINCE, CITY, 1 APRIL 2019
Unit: %
Urban, rural Sex Total
Urban Rural Male Female
ENTIRE COUNTRY 98.8 99.3 98.5 98.8 98.7
Socio-economic region Northern midlands and mountain areas 97.7 99.5 97.4 97.8 97.6 Red River Delta 99.6 99.5 99.7 99.6 99.6 North Central and Central coastal areas 99.2 99.3 99.1 99.2 99.2 Central Highlands 97.1 98.9 96.5 97.2 97.0 South East 99.2 99.5 98.7 99.2 99.2 Mekong River Delta 98.2 98.3 98.1 98.2 98.1
Province, city Ha Noi 99.5 99.4 99.6 99.5 99.5 Ha Giang 93.5 98.8 92.6 93.9 93.1 Cao Bang 94.5 99.0 93.3 94.6 94.3 Bac Kan 98.6 99.4 98.4 98.6 98.6 Tuyen Quang 98.7 99.6 98.6 98.8 98.7 Lao Cai 97.0 99.8 96.3 97.2 96.9 Dien Bien 96.5 99.4 96.1 96.7 96.2 Lai Chau 93.5 99.1 92.3 93.8 93.2 Son La 95.9 99.5 95.4 96.1 95.6 Yen Bai 98.0 99.6 97.7 98.1 97.9 Hoa Binh 99.4 99.7 99.4 99.5 99.3 Thai Nguyen 99.5 99.7 99.5 99.5 99.5 Lang Son 98.8 99.2 98.7 98.8 98.8 Quang Ninh 99.0 99.3 98.5 99.0 98.9 Bac Giang 100.0 100.0 100.0 100.0 100.0 Phu Tho 99.7 99.8 99.7 99.7 99.7 Vinh Phuc 99.9 99.9 99.9 99.9 99.9 Bac Ninh 99.8 99.8 99.8 99.8 99.8 Hai Duong 99.9 99.8 99.9 99.9 99.8 Hai Phong 99.5 99.5 99.5 99.5 99.5 Hung Yen 99.8 99.8 99.8 99.8 99.8 Thai Binh 99.9 99.8 99.9 99.8 99.9 Ha Nam 99.7 99.7 99.7 99.8 99.7 Nam Dinh 99.8 99.7 99.8 99.8 99.8 Ninh Binh 99.7 99.6 99.8 99.7 99.7 Thanh Hoa 99.5 99.8 99.5 99.5 99.5 Nghe An 99.3 99.6 99.3 99.3 99.3 Ha Tinh 99.2 99.3 99.1 99.2 99.2
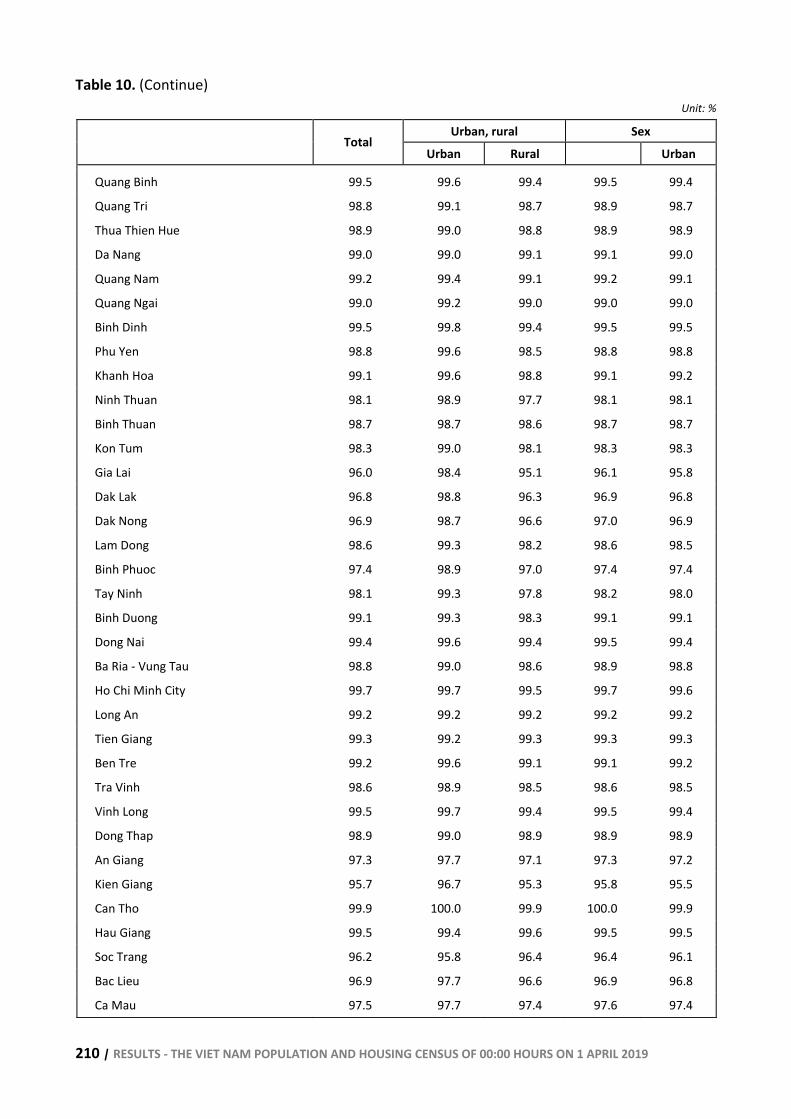
210 | RESULTS - THE VIET NAM POPULATION AND HOUSING CENSUS OF 00:00 HOURS ON 1 APRIL 2019
Table 10. (Continue)
Unit: %
Urban, rural Sex Total
Urban Rural Urban
Quang Binh 99.5 99.6 99.4 99.5 99.4
Quang Tri 98.8 99.1 98.7 98.9 98.7
Thua Thien Hue 98.9 99.0 98.8 98.9 98.9
Da Nang 99.0 99.0 99.1 99.1 99.0
Quang Nam 99.2 99.4 99.1 99.2 99.1
Quang Ngai 99.0 99.2 99.0 99.0 99.0
Binh Dinh 99.5 99.8 99.4 99.5 99.5
Phu Yen 98.8 99.6 98.5 98.8 98.8
Khanh Hoa 99.1 99.6 98.8 99.1 99.2
Ninh Thuan 98.1 98.9 97.7 98.1 98.1
Binh Thuan 98.7 98.7 98.6 98.7 98.7
Kon Tum 98.3 99.0 98.1 98.3 98.3
Gia Lai 96.0 98.4 95.1 96.1 95.8
Dak Lak 96.8 98.8 96.3 96.9 96.8
Dak Nong 96.9 98.7 96.6 97.0 96.9
Lam Dong 98.6 99.3 98.2 98.6 98.5
Binh Phuoc 97.4 98.9 97.0 97.4 97.4
Tay Ninh 98.1 99.3 97.8 98.2 98.0
Binh Duong 99.1 99.3 98.3 99.1 99.1
Dong Nai 99.4 99.6 99.4 99.5 99.4
Ba Ria - Vung Tau 98.8 99.0 98.6 98.9 98.8
Ho Chi Minh City 99.7 99.7 99.5 99.7 99.6
Long An 99.2 99.2 99.2 99.2 99.2
Tien Giang 99.3 99.2 99.3 99.3 99.3
Ben Tre 99.2 99.6 99.1 99.1 99.2
Tra Vinh 98.6 98.9 98.5 98.6 98.5
Vinh Long 99.5 99.7 99.4 99.5 99.4
Dong Thap 98.9 99.0 98.9 98.9 98.9
An Giang 97.3 97.7 97.1 97.3 97.2
Kien Giang 95.7 96.7 95.3 95.8 95.5
Can Tho 99.9 100.0 99.9 100.0 99.9
Hau Giang 99.5 99.4 99.6 99.5 99.5
Soc Trang 96.2 95.8 96.4 96.4 96.1
Bac Lieu 96.9 97.7 96.6 96.9 96.8
Ca Mau 97.5 97.7 97.4 97.6 97.4
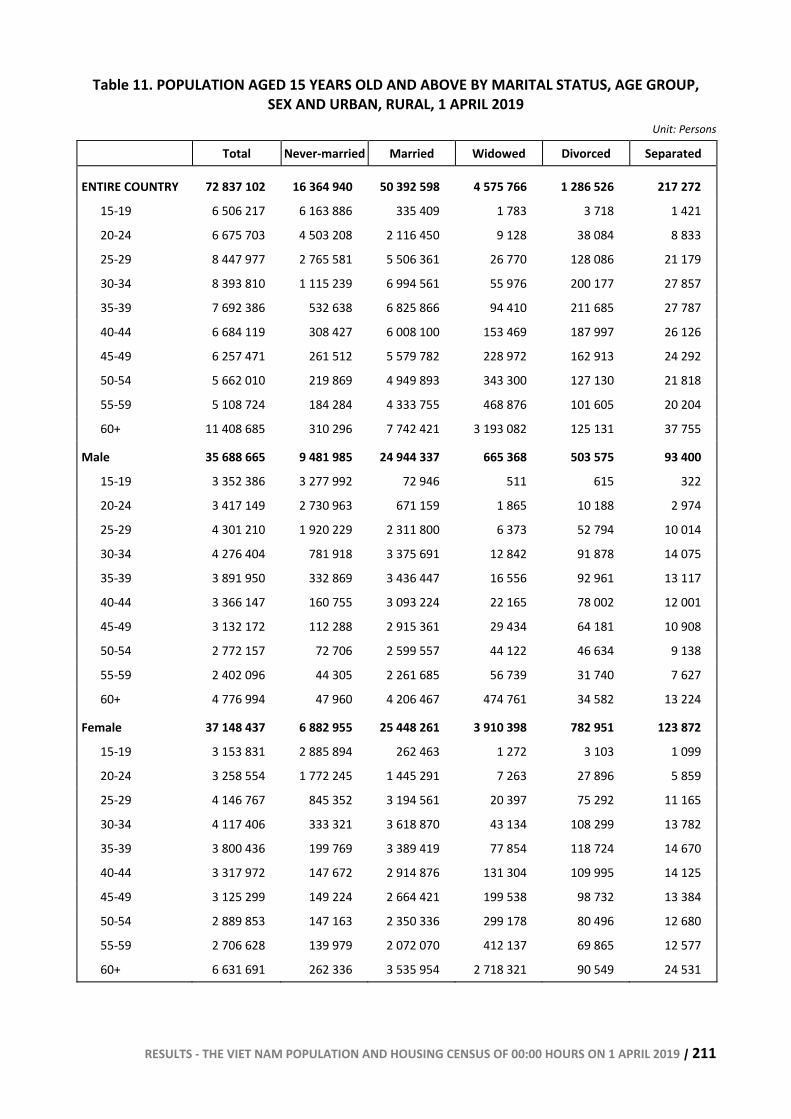
RESULTS - THE VIET NAM POPULATION AND HOUSING CENSUS OF 00:00 HOURS ON 1 APRIL 2019 | 211
Table 11. POPULATION AGED 15 YEARS OLD AND ABOVE BY MARITAL STATUS, AGE GROUP, SEX AND URBAN, RURAL, 1 APRIL 2019
Unit: Persons
Total Never-married Married Widowed Divorced Separated
ENTIRE COUNTRY 72 837 102 16 364 940 50 392 598 4 575 766 1 286 526 217 272
15-19 6 506 217 6 163 886 335 409 1 783 3 718 1 421
20-24 6 675 703 4 503 208 2 116 450 9 128 38 084 8 833
25-29 8 447 977 2 765 581 5 506 361 26 770 128 086 21 179
30-34 8 393 810 1 115 239 6 994 561 55 976 200 177 27 857
35-39 7 692 386 532 638 6 825 866 94 410 211 685 27 787
40-44 6 684 119 308 427 6 008 100 153 469 187 997 26 126
45-49 6 257 471 261 512 5 579 782 228 972 162 913 24 292
50-54 5 662 010 219 869 4 949 893 343 300 127 130 21 818
55-59 5 108 724 184 284 4 333 755 468 876 101 605 20 204
60+ 11 408 685 310 296 7 742 421 3 193 082 125 131 37 755
Male 35 688 665 9 481 985 24 944 337 665 368 503 575 93 400
15-19 3 352 386 3 277 992 72 946 511 615 322
20-24 3 417 149 2 730 963 671 159 1 865 10 188 2 974
25-29 4 301 210 1 920 229 2 311 800 6 373 52 794 10 014
30-34 4 276 404 781 918 3 375 691 12 842 91 878 14 075
35-39 3 891 950 332 869 3 436 447 16 556 92 961 13 117
40-44 3 366 147 160 755 3 093 224 22 165 78 002 12 001
45-49 3 132 172 112 288 2 915 361 29 434 64 181 10 908
50-54 2 772 157 72 706 2 599 557 44 122 46 634 9 138
55-59 2 402 096 44 305 2 261 685 56 739 31 740 7 627
60+ 4 776 994 47 960 4 206 467 474 761 34 582 13 224
Female 37 148 437 6 882 955 25 448 261 3 910 398 782 951 123 872
15-19 3 153 831 2 885 894 262 463 1 272 3 103 1 099
20-24 3 258 554 1 772 245 1 445 291 7 263 27 896 5 859
25-29 4 146 767 845 352 3 194 561 20 397 75 292 11 165
30-34 4 117 406 333 321 3 618 870 43 134 108 299 13 782
35-39 3 800 436 199 769 3 389 419 77 854 118 724 14 670
40-44 3 317 972 147 672 2 914 876 131 304 109 995 14 125
45-49 3 125 299 149 224 2 664 421 199 538 98 732 13 384
50-54 2 889 853 147 163 2 350 336 299 178 80 496 12 680
55-59 2 706 628 139 979 2 072 070 412 137 69 865 12 577
60+ 6 631 691 262 336 3 535 954 2 718 321 90 549 24 531
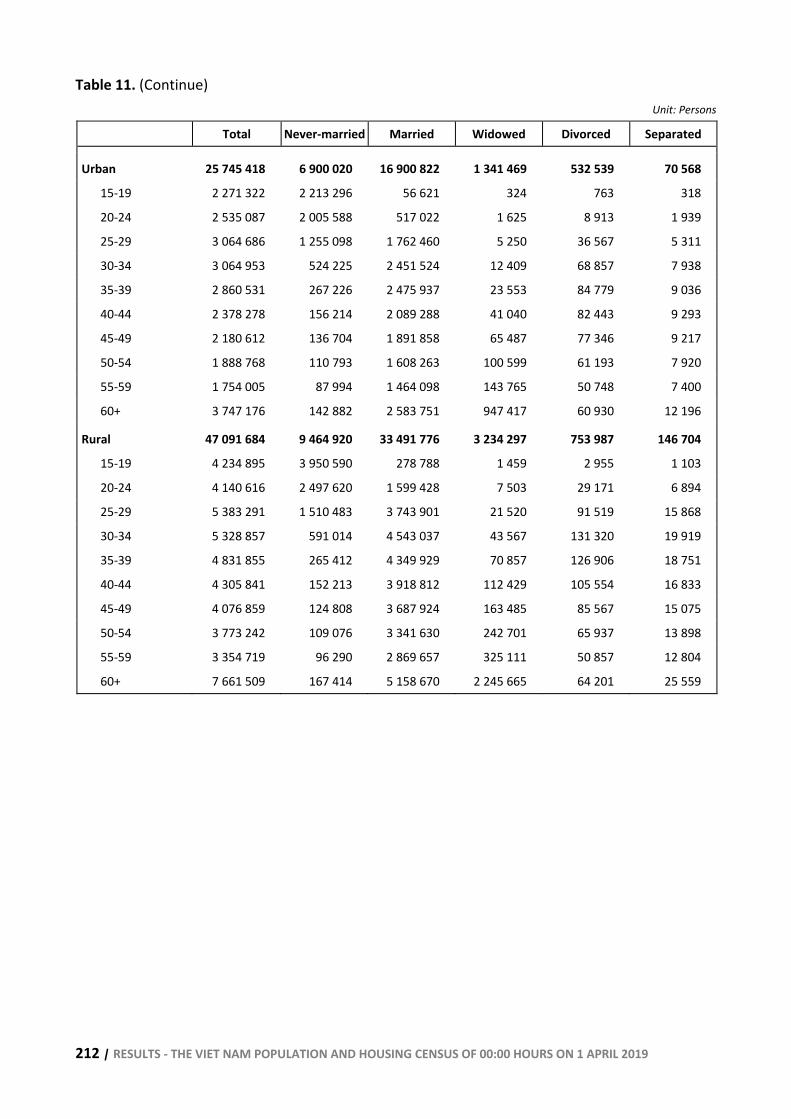
212 | RESULTS - THE VIET NAM POPULATION AND HOUSING CENSUS OF 00:00 HOURS ON 1 APRIL 2019
Table 11. (Continue)
Unit: Persons
Total Never-married Married Widowed Divorced Separated
Urban 25 745 418 6 900 020 16 900 822 1 341 469 532 539 70 568
15-19 2 271 322 2 213 296 56 621 324 763 318
20-24 2 535 087 2 005 588 517 022 1 625 8 913 1 939
25-29 3 064 686 1 255 098 1 762 460 5 250 36 567 5 311
30-34 3 064 953 524 225 2 451 524 12 409 68 857 7 938
35-39 2 860 531 267 226 2 475 937 23 553 84 779 9 036
40-44 2 378 278 156 214 2 089 288 41 040 82 443 9 293
45-49 2 180 612 136 704 1 891 858 65 487 77 346 9 217
50-54 1 888 768 110 793 1 608 263 100 599 61 193 7 920
55-59 1 754 005 87 994 1 464 098 143 765 50 748 7 400
60+ 3 747 176 142 882 2 583 751 947 417 60 930 12 196
Rural 47 091 684 9 464 920 33 491 776 3 234 297 753 987 146 704
15-19 4 234 895 3 950 590 278 788 1 459 2 955 1 103
20-24 4 140 616 2 497 620 1 599 428 7 503 29 171 6 894
25-29 5 383 291 1 510 483 3 743 901 21 520 91 519 15 868
30-34 5 328 857 591 014 4 543 037 43 567 131 320 19 919
35-39 4 831 855 265 412 4 349 929 70 857 126 906 18 751
40-44 4 305 841 152 213 3 918 812 112 429 105 554 16 833
45-49 4 076 859 124 808 3 687 924 163 485 85 567 15 075
50-54 3 773 242 109 076 3 341 630 242 701 65 937 13 898
55-59 3 354 719 96 290 2 869 657 325 111 50 857 12 804
60+ 7 661 509 167 414 5 158 670 2 245 665 64 201 25 559
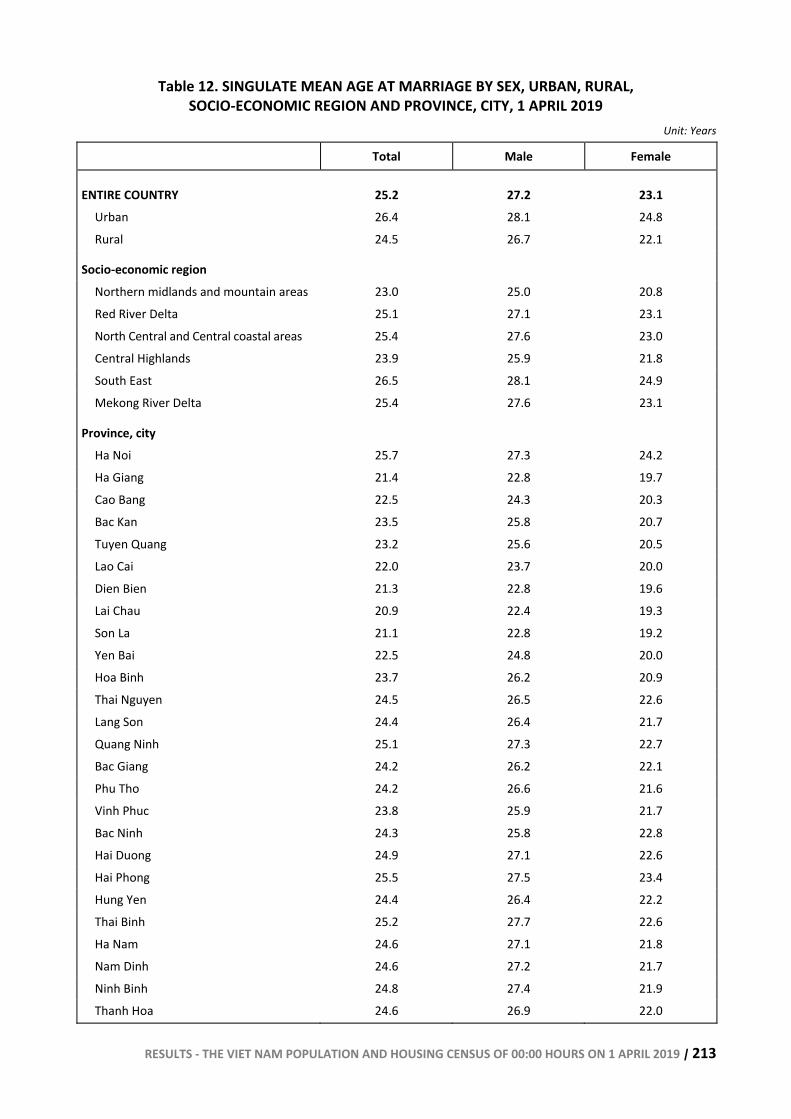
RESULTS - THE VIET NAM POPULATION AND HOUSING CENSUS OF 00:00 HOURS ON 1 APRIL 2019 | 213
Table 12. SINGULATE MEAN AGE AT MARRIAGE BY SEX, URBAN, RURAL, SOCIO-ECONOMIC REGION AND PROVINCE, CITY, 1 APRIL 2019
Unit: Years
Total Male Female
ENTIRE COUNTRY 25.2 27.2 23.1 Urban 26.4 28.1 24.8 Rural 24.5 26.7 22.1
Socio-economic region Northern midlands and mountain areas 23.0 25.0 20.8 Red River Delta 25.1 27.1 23.1 North Central and Central coastal areas 25.4 27.6 23.0 Central Highlands 23.9 25.9 21.8 South East 26.5 28.1 24.9 Mekong River Delta 25.4 27.6 23.1
Province, city Ha Noi 25.7 27.3 24.2 Ha Giang 21.4 22.8 19.7 Cao Bang 22.5 24.3 20.3 Bac Kan 23.5 25.8 20.7 Tuyen Quang 23.2 25.6 20.5 Lao Cai 22.0 23.7 20.0 Dien Bien 21.3 22.8 19.6 Lai Chau 20.9 22.4 19.3 Son La 21.1 22.8 19.2 Yen Bai 22.5 24.8 20.0 Hoa Binh 23.7 26.2 20.9 Thai Nguyen 24.5 26.5 22.6 Lang Son 24.4 26.4 21.7 Quang Ninh 25.1 27.3 22.7 Bac Giang 24.2 26.2 22.1 Phu Tho 24.2 26.6 21.6 Vinh Phuc 23.8 25.9 21.7 Bac Ninh 24.3 25.8 22.8 Hai Duong 24.9 27.1 22.6 Hai Phong 25.5 27.5 23.4 Hung Yen 24.4 26.4 22.2 Thai Binh 25.2 27.7 22.6 Ha Nam 24.6 27.1 21.8 Nam Dinh 24.6 27.2 21.7 Ninh Binh 24.8 27.4 21.9 Thanh Hoa 24.6 26.9 22.0
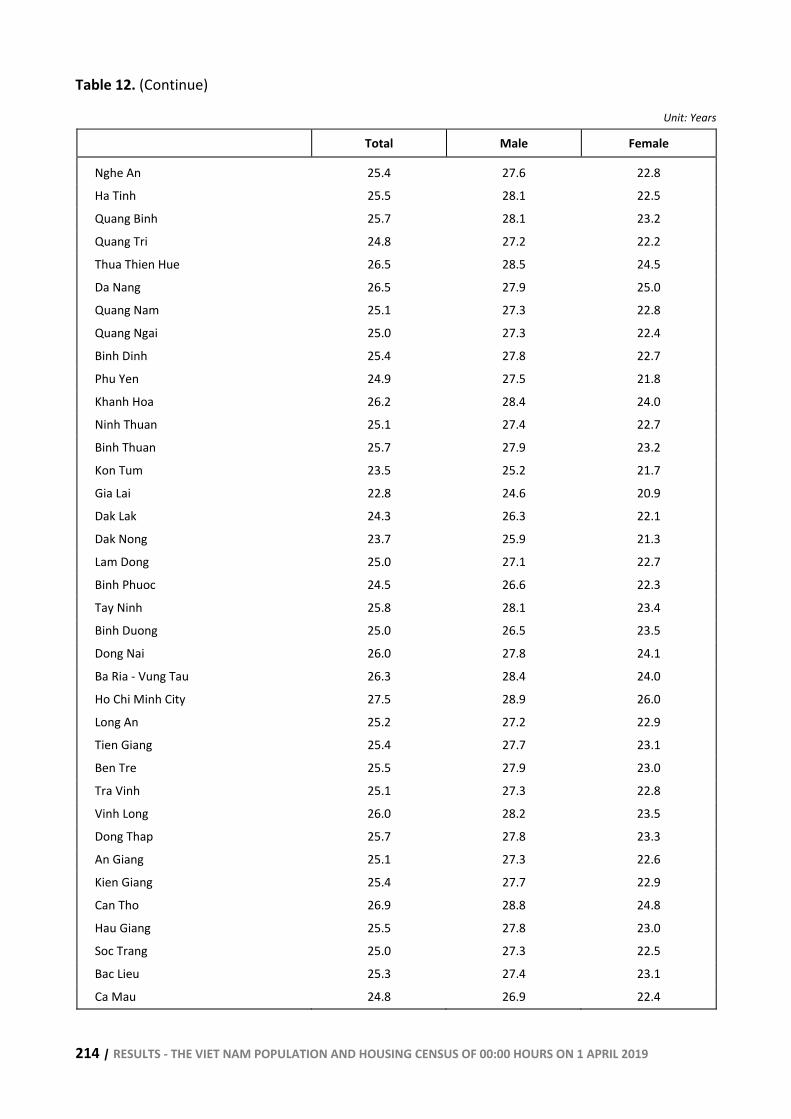
214 | RESULTS - THE VIET NAM POPULATION AND HOUSING CENSUS OF 00:00 HOURS ON 1 APRIL 2019
Table 12. (Continue)
Unit: Years
Total Male Female
Nghe An 25.4 27.6 22.8
Ha Tinh 25.5 28.1 22.5
Quang Binh 25.7 28.1 23.2
Quang Tri 24.8 27.2 22.2
Thua Thien Hue 26.5 28.5 24.5
Da Nang 26.5 27.9 25.0
Quang Nam 25.1 27.3 22.8
Quang Ngai 25.0 27.3 22.4
Binh Dinh 25.4 27.8 22.7
Phu Yen 24.9 27.5 21.8
Khanh Hoa 26.2 28.4 24.0
Ninh Thuan 25.1 27.4 22.7
Binh Thuan 25.7 27.9 23.2
Kon Tum 23.5 25.2 21.7
Gia Lai 22.8 24.6 20.9
Dak Lak 24.3 26.3 22.1
Dak Nong 23.7 25.9 21.3
Lam Dong 25.0 27.1 22.7
Binh Phuoc 24.5 26.6 22.3
Tay Ninh 25.8 28.1 23.4
Binh Duong 25.0 26.5 23.5
Dong Nai 26.0 27.8 24.1
Ba Ria - Vung Tau 26.3 28.4 24.0
Ho Chi Minh City 27.5 28.9 26.0
Long An 25.2 27.2 22.9
Tien Giang 25.4 27.7 23.1
Ben Tre 25.5 27.9 23.0
Tra Vinh 25.1 27.3 22.8
Vinh Long 26.0 28.2 23.5
Dong Thap 25.7 27.8 23.3
An Giang 25.1 27.3 22.6
Kien Giang 25.4 27.7 22.9
Can Tho 26.9 28.8 24.8
Hau Giang 25.5 27.8 23.0
Soc Trang 25.0 27.3 22.5
Bac Lieu 25.3 27.4 23.1
Ca Mau 24.8 26.9 22.4
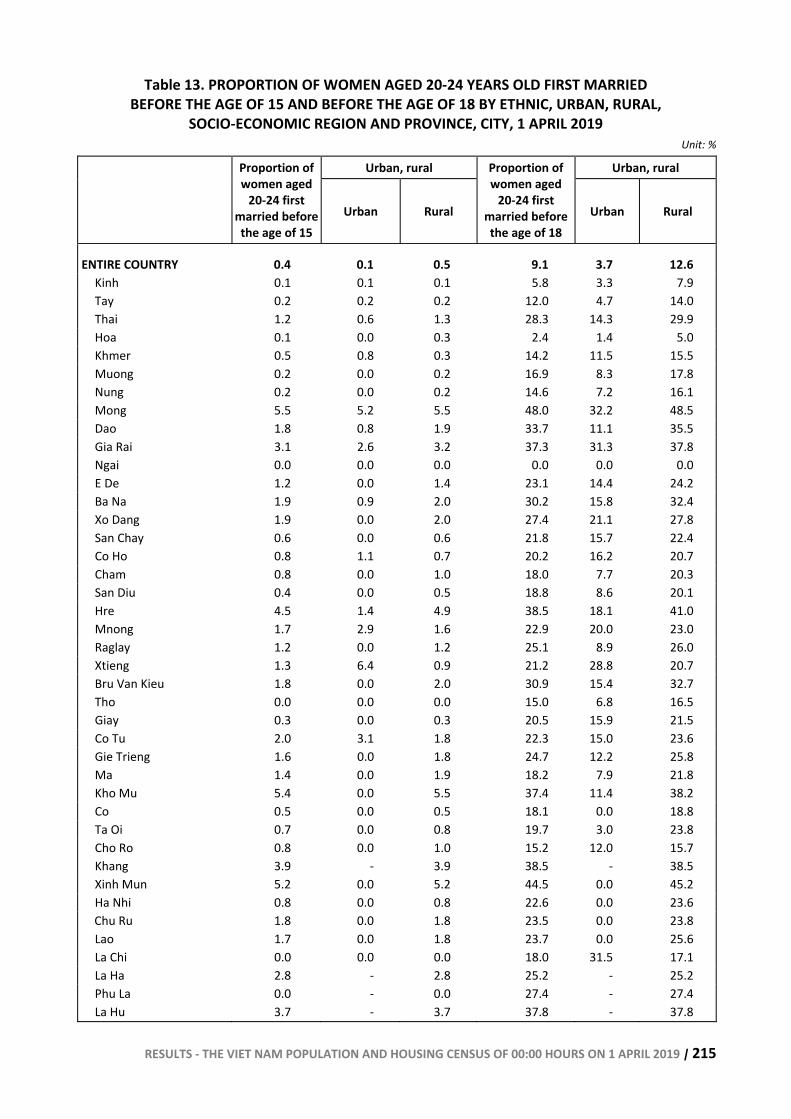
RESULTS - THE VIET NAM POPULATION AND HOUSING CENSUS OF 00:00 HOURS ON 1 APRIL 2019 | 215
Table 13. PROPORTION OF WOMEN AGED 20-24 YEARS OLD FIRST MARRIED BEFORE THE AGE OF 15 AND BEFORE THE AGE OF 18 BY ETHNIC, URBAN, RURAL,
SOCIO-ECONOMIC REGION AND PROVINCE, CITY, 1 APRIL 2019 Unit: %
Urban, rural Urban, rural
Proportion of women aged
20-24 first married before the age of 15
Urban Rural
Proportion of women aged
20-24 first married before the age of 18
Urban Rural
ENTIRE COUNTRY 0.4 0.1 0.5 9.1 3.7 12.6 Kinh 0.1 0.1 0.1 5.8 3.3 7.9 Tay 0.2 0.2 0.2 12.0 4.7 14.0 Thai 1.2 0.6 1.3 28.3 14.3 29.9 Hoa 0.1 0.0 0.3 2.4 1.4 5.0 Khmer 0.5 0.8 0.3 14.2 11.5 15.5 Muong 0.2 0.0 0.2 16.9 8.3 17.8 Nung 0.2 0.0 0.2 14.6 7.2 16.1 Mong 5.5 5.2 5.5 48.0 32.2 48.5 Dao 1.8 0.8 1.9 33.7 11.1 35.5 Gia Rai 3.1 2.6 3.2 37.3 31.3 37.8 Ngai 0.0 0.0 0.0 0.0 0.0 0.0 E De 1.2 0.0 1.4 23.1 14.4 24.2 Ba Na 1.9 0.9 2.0 30.2 15.8 32.4 Xo Dang 1.9 0.0 2.0 27.4 21.1 27.8 San Chay 0.6 0.0 0.6 21.8 15.7 22.4 Co Ho 0.8 1.1 0.7 20.2 16.2 20.7 Cham 0.8 0.0 1.0 18.0 7.7 20.3 San Diu 0.4 0.0 0.5 18.8 8.6 20.1 Hre 4.5 1.4 4.9 38.5 18.1 41.0 Mnong 1.7 2.9 1.6 22.9 20.0 23.0 Raglay 1.2 0.0 1.2 25.1 8.9 26.0 Xtieng 1.3 6.4 0.9 21.2 28.8 20.7 Bru Van Kieu 1.8 0.0 2.0 30.9 15.4 32.7 Tho 0.0 0.0 0.0 15.0 6.8 16.5 Giay 0.3 0.0 0.3 20.5 15.9 21.5 Co Tu 2.0 3.1 1.8 22.3 15.0 23.6 Gie Trieng 1.6 0.0 1.8 24.7 12.2 25.8 Ma 1.4 0.0 1.9 18.2 7.9 21.8 Kho Mu 5.4 0.0 5.5 37.4 11.4 38.2 Co 0.5 0.0 0.5 18.1 0.0 18.8 Ta Oi 0.7 0.0 0.8 19.7 3.0 23.8 Cho Ro 0.8 0.0 1.0 15.2 12.0 15.7 Khang 3.9 - 3.9 38.5 - 38.5 Xinh Mun 5.2 0.0 5.2 44.5 0.0 45.2 Ha Nhi 0.8 0.0 0.8 22.6 0.0 23.6 Chu Ru 1.8 0.0 1.8 23.5 0.0 23.8 Lao 1.7 0.0 1.8 23.7 0.0 25.6 La Chi 0.0 0.0 0.0 18.0 31.5 17.1 La Ha 2.8 - 2.8 25.2 - 25.2 Phu La 0.0 - 0.0 27.4 - 27.4 La Hu 3.7 - 3.7 37.8 - 37.8
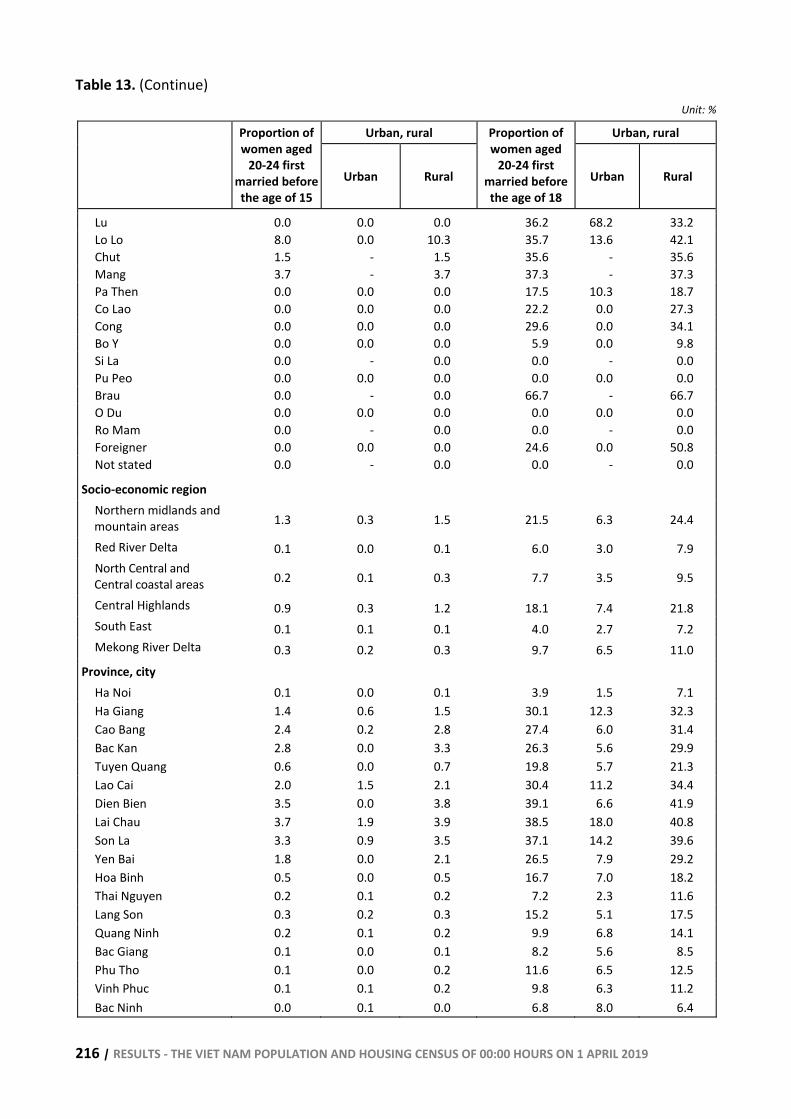
216 | RESULTS - THE VIET NAM POPULATION AND HOUSING CENSUS OF 00:00 HOURS ON 1 APRIL 2019
Table 13. (Continue) Unit: %
Urban, rural Urban, rural
Proportion of women aged
20-24 first married before the age of 15
Urban Rural
Proportion of women aged
20-24 first married before the age of 18
Urban Rural
Lu 0.0 0.0 0.0 36.2 68.2 33.2 Lo Lo 8.0 0.0 10.3 35.7 13.6 42.1 Chut 1.5 - 1.5 35.6 - 35.6 Mang 3.7 - 3.7 37.3 - 37.3 Pa Then 0.0 0.0 0.0 17.5 10.3 18.7 Co Lao 0.0 0.0 0.0 22.2 0.0 27.3 Cong 0.0 0.0 0.0 29.6 0.0 34.1 Bo Y 0.0 0.0 0.0 5.9 0.0 9.8 Si La 0.0 - 0.0 0.0 - 0.0 Pu Peo 0.0 0.0 0.0 0.0 0.0 0.0 Brau 0.0 - 0.0 66.7 - 66.7 O Du 0.0 0.0 0.0 0.0 0.0 0.0 Ro Mam 0.0 - 0.0 0.0 - 0.0 Foreigner 0.0 0.0 0.0 24.6 0.0 50.8 Not stated 0.0 - 0.0 0.0 - 0.0
Socio-economic region Northern midlands and mountain areas 1.3 0.3 1.5 21.5 6.3 24.4
Red River Delta 0.1 0.0 0.1 6.0 3.0 7.9 North Central and Central coastal areas 0.2 0.1 0.3 7.7 3.5 9.5
Central Highlands 0.9 0.3 1.2 18.1 7.4 21.8 South East 0.1 0.1 0.1 4.0 2.7 7.2 Mekong River Delta 0.3 0.2 0.3 9.7 6.5 11.0
Province, city Ha Noi 0.1 0.0 0.1 3.9 1.5 7.1 Ha Giang 1.4 0.6 1.5 30.1 12.3 32.3 Cao Bang 2.4 0.2 2.8 27.4 6.0 31.4 Bac Kan 2.8 0.0 3.3 26.3 5.6 29.9 Tuyen Quang 0.6 0.0 0.7 19.8 5.7 21.3 Lao Cai 2.0 1.5 2.1 30.4 11.2 34.4 Dien Bien 3.5 0.0 3.8 39.1 6.6 41.9 Lai Chau 3.7 1.9 3.9 38.5 18.0 40.8 Son La 3.3 0.9 3.5 37.1 14.2 39.6 Yen Bai 1.8 0.0 2.1 26.5 7.9 29.2 Hoa Binh 0.5 0.0 0.5 16.7 7.0 18.2 Thai Nguyen 0.2 0.1 0.2 7.2 2.3 11.6 Lang Son 0.3 0.2 0.3 15.2 5.1 17.5 Quang Ninh 0.2 0.1 0.2 9.9 6.8 14.1 Bac Giang 0.1 0.0 0.1 8.2 5.6 8.5 Phu Tho 0.1 0.0 0.2 11.6 6.5 12.5 Vinh Phuc 0.1 0.1 0.2 9.8 6.3 11.2 Bac Ninh 0.0 0.1 0.0 6.8 8.0 6.4
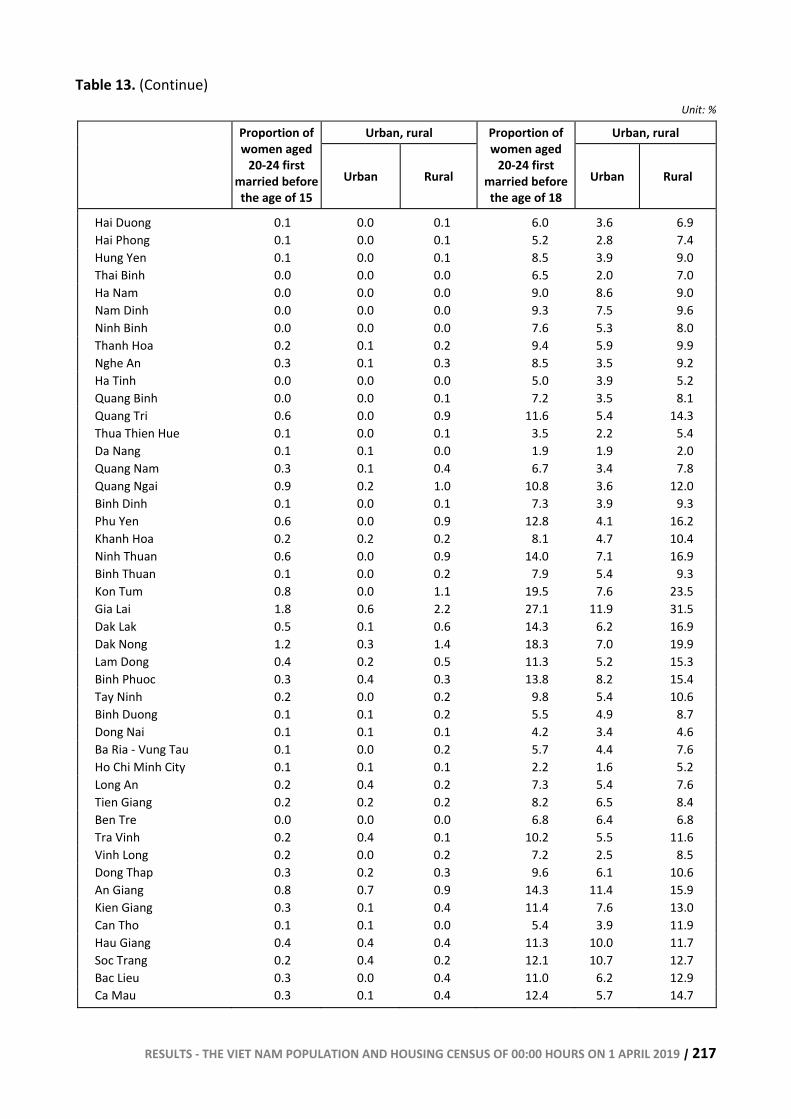
RESULTS - THE VIET NAM POPULATION AND HOUSING CENSUS OF 00:00 HOURS ON 1 APRIL 2019 | 217
Table 13. (Continue) Unit: %
Urban, rural Urban, rural
Proportion of women aged
20-24 first married before the age of 15
Urban Rural
Proportion of women aged
20-24 first married before the age of 18
Urban Rural
Hai Duong 0.1 0.0 0.1 6.0 3.6 6.9 Hai Phong 0.1 0.0 0.1 5.2 2.8 7.4 Hung Yen 0.1 0.0 0.1 8.5 3.9 9.0 Thai Binh 0.0 0.0 0.0 6.5 2.0 7.0 Ha Nam 0.0 0.0 0.0 9.0 8.6 9.0 Nam Dinh 0.0 0.0 0.0 9.3 7.5 9.6 Ninh Binh 0.0 0.0 0.0 7.6 5.3 8.0 Thanh Hoa 0.2 0.1 0.2 9.4 5.9 9.9 Nghe An 0.3 0.1 0.3 8.5 3.5 9.2 Ha Tinh 0.0 0.0 0.0 5.0 3.9 5.2 Quang Binh 0.0 0.0 0.1 7.2 3.5 8.1 Quang Tri 0.6 0.0 0.9 11.6 5.4 14.3 Thua Thien Hue 0.1 0.0 0.1 3.5 2.2 5.4 Da Nang 0.1 0.1 0.0 1.9 1.9 2.0 Quang Nam 0.3 0.1 0.4 6.7 3.4 7.8 Quang Ngai 0.9 0.2 1.0 10.8 3.6 12.0 Binh Dinh 0.1 0.0 0.1 7.3 3.9 9.3 Phu Yen 0.6 0.0 0.9 12.8 4.1 16.2 Khanh Hoa 0.2 0.2 0.2 8.1 4.7 10.4 Ninh Thuan 0.6 0.0 0.9 14.0 7.1 16.9 Binh Thuan 0.1 0.0 0.2 7.9 5.4 9.3 Kon Tum 0.8 0.0 1.1 19.5 7.6 23.5 Gia Lai 1.8 0.6 2.2 27.1 11.9 31.5 Dak Lak 0.5 0.1 0.6 14.3 6.2 16.9 Dak Nong 1.2 0.3 1.4 18.3 7.0 19.9 Lam Dong 0.4 0.2 0.5 11.3 5.2 15.3 Binh Phuoc 0.3 0.4 0.3 13.8 8.2 15.4 Tay Ninh 0.2 0.0 0.2 9.8 5.4 10.6 Binh Duong 0.1 0.1 0.2 5.5 4.9 8.7 Dong Nai 0.1 0.1 0.1 4.2 3.4 4.6 Ba Ria - Vung Tau 0.1 0.0 0.2 5.7 4.4 7.6 Ho Chi Minh City 0.1 0.1 0.1 2.2 1.6 5.2 Long An 0.2 0.4 0.2 7.3 5.4 7.6 Tien Giang 0.2 0.2 0.2 8.2 6.5 8.4 Ben Tre 0.0 0.0 0.0 6.8 6.4 6.8 Tra Vinh 0.2 0.4 0.1 10.2 5.5 11.6 Vinh Long 0.2 0.0 0.2 7.2 2.5 8.5 Dong Thap 0.3 0.2 0.3 9.6 6.1 10.6 An Giang 0.8 0.7 0.9 14.3 11.4 15.9 Kien Giang 0.3 0.1 0.4 11.4 7.6 13.0 Can Tho 0.1 0.1 0.0 5.4 3.9 11.9 Hau Giang 0.4 0.4 0.4 11.3 10.0 11.7 Soc Trang 0.2 0.4 0.2 12.1 10.7 12.7 Bac Lieu 0.3 0.0 0.4 11.0 6.2 12.9 Ca Mau 0.3 0.1 0.4 12.4 5.7 14.7
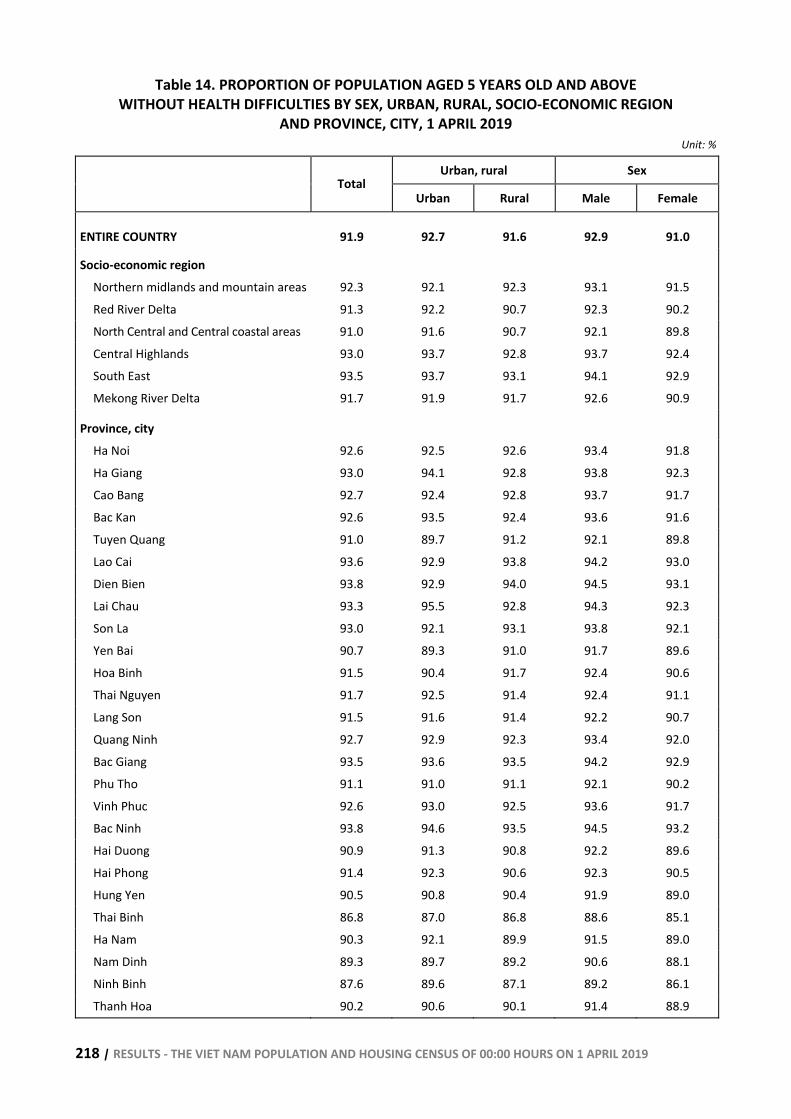
218 | RESULTS - THE VIET NAM POPULATION AND HOUSING CENSUS OF 00:00 HOURS ON 1 APRIL 2019
Table 14. PROPORTION OF POPULATION AGED 5 YEARS OLD AND ABOVE WITHOUT HEALTH DIFFICULTIES BY SEX, URBAN, RURAL, SOCIO-ECONOMIC REGION
AND PROVINCE, CITY, 1 APRIL 2019 Unit: %
Urban, rural Sex Total
Urban Rural Male Female
ENTIRE COUNTRY 91.9 92.7 91.6 92.9 91.0
Socio-economic region Northern midlands and mountain areas 92.3 92.1 92.3 93.1 91.5 Red River Delta 91.3 92.2 90.7 92.3 90.2 North Central and Central coastal areas 91.0 91.6 90.7 92.1 89.8 Central Highlands 93.0 93.7 92.8 93.7 92.4 South East 93.5 93.7 93.1 94.1 92.9 Mekong River Delta 91.7 91.9 91.7 92.6 90.9
Province, city Ha Noi 92.6 92.5 92.6 93.4 91.8 Ha Giang 93.0 94.1 92.8 93.8 92.3 Cao Bang 92.7 92.4 92.8 93.7 91.7 Bac Kan 92.6 93.5 92.4 93.6 91.6 Tuyen Quang 91.0 89.7 91.2 92.1 89.8 Lao Cai 93.6 92.9 93.8 94.2 93.0 Dien Bien 93.8 92.9 94.0 94.5 93.1 Lai Chau 93.3 95.5 92.8 94.3 92.3 Son La 93.0 92.1 93.1 93.8 92.1 Yen Bai 90.7 89.3 91.0 91.7 89.6 Hoa Binh 91.5 90.4 91.7 92.4 90.6 Thai Nguyen 91.7 92.5 91.4 92.4 91.1 Lang Son 91.5 91.6 91.4 92.2 90.7 Quang Ninh 92.7 92.9 92.3 93.4 92.0 Bac Giang 93.5 93.6 93.5 94.2 92.9 Phu Tho 91.1 91.0 91.1 92.1 90.2 Vinh Phuc 92.6 93.0 92.5 93.6 91.7 Bac Ninh 93.8 94.6 93.5 94.5 93.2 Hai Duong 90.9 91.3 90.8 92.2 89.6 Hai Phong 91.4 92.3 90.6 92.3 90.5 Hung Yen 90.5 90.8 90.4 91.9 89.0 Thai Binh 86.8 87.0 86.8 88.6 85.1 Ha Nam 90.3 92.1 89.9 91.5 89.0 Nam Dinh 89.3 89.7 89.2 90.6 88.1 Ninh Binh 87.6 89.6 87.1 89.2 86.1 Thanh Hoa 90.2 90.6 90.1 91.4 88.9
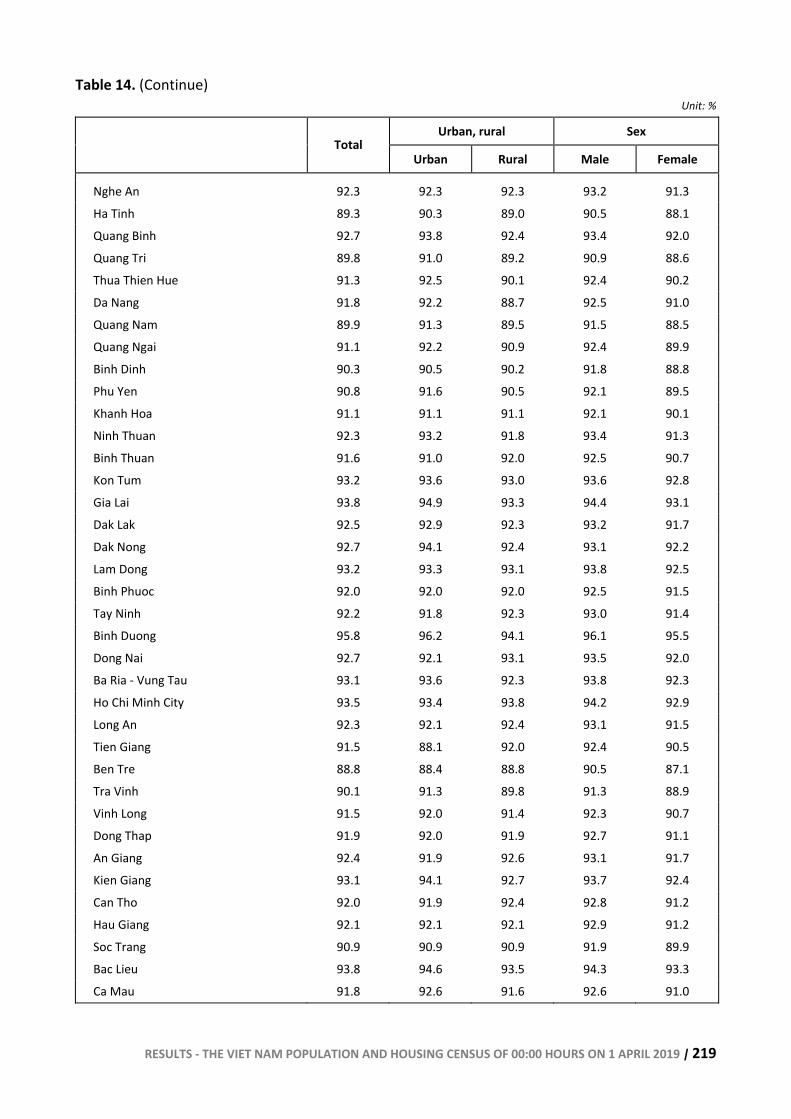
RESULTS - THE VIET NAM POPULATION AND HOUSING CENSUS OF 00:00 HOURS ON 1 APRIL 2019 | 219
Table 14. (Continue) Unit: %
Urban, rural Sex Total
Urban Rural Male Female
Nghe An 92.3 92.3 92.3 93.2 91.3 Ha Tinh 89.3 90.3 89.0 90.5 88.1 Quang Binh 92.7 93.8 92.4 93.4 92.0 Quang Tri 89.8 91.0 89.2 90.9 88.6 Thua Thien Hue 91.3 92.5 90.1 92.4 90.2 Da Nang 91.8 92.2 88.7 92.5 91.0 Quang Nam 89.9 91.3 89.5 91.5 88.5 Quang Ngai 91.1 92.2 90.9 92.4 89.9 Binh Dinh 90.3 90.5 90.2 91.8 88.8 Phu Yen 90.8 91.6 90.5 92.1 89.5 Khanh Hoa 91.1 91.1 91.1 92.1 90.1 Ninh Thuan 92.3 93.2 91.8 93.4 91.3 Binh Thuan 91.6 91.0 92.0 92.5 90.7 Kon Tum 93.2 93.6 93.0 93.6 92.8 Gia Lai 93.8 94.9 93.3 94.4 93.1 Dak Lak 92.5 92.9 92.3 93.2 91.7 Dak Nong 92.7 94.1 92.4 93.1 92.2 Lam Dong 93.2 93.3 93.1 93.8 92.5 Binh Phuoc 92.0 92.0 92.0 92.5 91.5 Tay Ninh 92.2 91.8 92.3 93.0 91.4 Binh Duong 95.8 96.2 94.1 96.1 95.5 Dong Nai 92.7 92.1 93.1 93.5 92.0 Ba Ria - Vung Tau 93.1 93.6 92.3 93.8 92.3 Ho Chi Minh City 93.5 93.4 93.8 94.2 92.9 Long An 92.3 92.1 92.4 93.1 91.5 Tien Giang 91.5 88.1 92.0 92.4 90.5 Ben Tre 88.8 88.4 88.8 90.5 87.1 Tra Vinh 90.1 91.3 89.8 91.3 88.9 Vinh Long 91.5 92.0 91.4 92.3 90.7 Dong Thap 91.9 92.0 91.9 92.7 91.1 An Giang 92.4 91.9 92.6 93.1 91.7 Kien Giang 93.1 94.1 92.7 93.7 92.4 Can Tho 92.0 91.9 92.4 92.8 91.2 Hau Giang 92.1 92.1 92.1 92.9 91.2 Soc Trang 90.9 90.9 90.9 91.9 89.9 Bac Lieu 93.8 94.6 93.5 94.3 93.3 Ca Mau 91.8 92.6 91.6 92.6 91.0
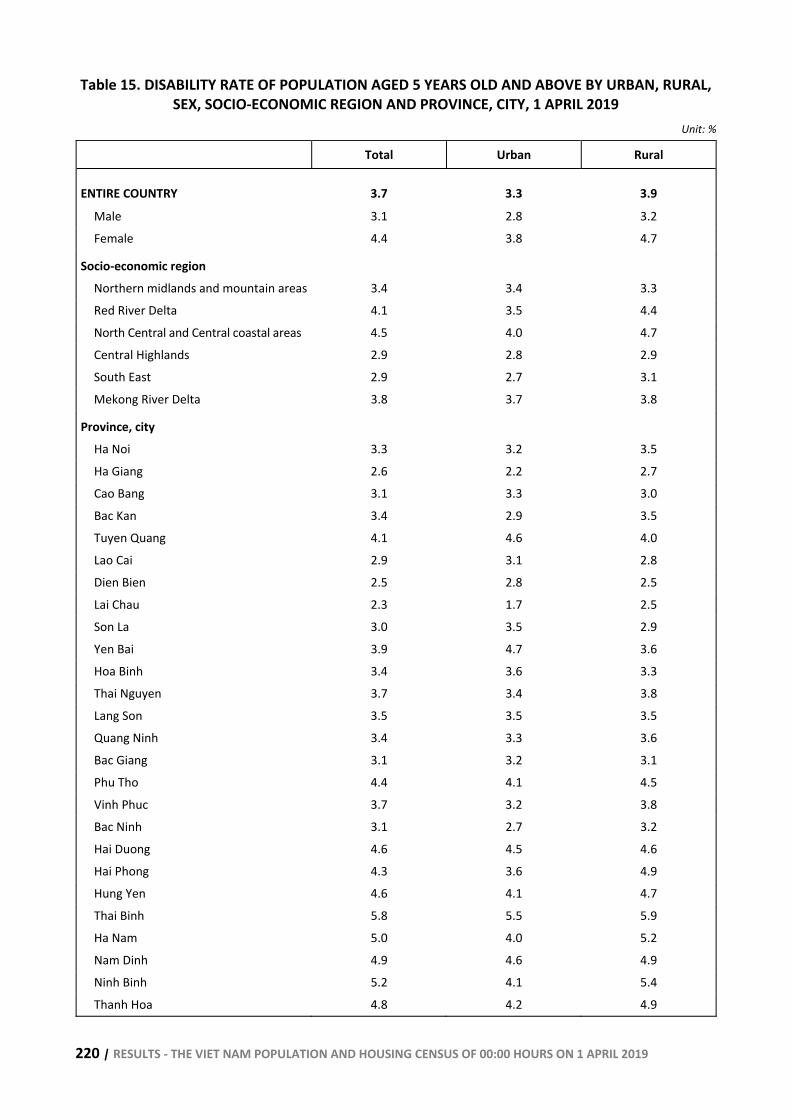
220 | RESULTS - THE VIET NAM POPULATION AND HOUSING CENSUS OF 00:00 HOURS ON 1 APRIL 2019
Table 15. DISABILITY RATE OF POPULATION AGED 5 YEARS OLD AND ABOVE BY URBAN, RURAL, SEX, SOCIO-ECONOMIC REGION AND PROVINCE, CITY, 1 APRIL 2019
Unit: %
Total Urban Rural
ENTIRE COUNTRY 3.7 3.3 3.9 Male 3.1 2.8 3.2 Female 4.4 3.8 4.7
Socio-economic region Northern midlands and mountain areas 3.4 3.4 3.3 Red River Delta 4.1 3.5 4.4 North Central and Central coastal areas 4.5 4.0 4.7 Central Highlands 2.9 2.8 2.9 South East 2.9 2.7 3.1 Mekong River Delta 3.8 3.7 3.8
Province, city Ha Noi 3.3 3.2 3.5 Ha Giang 2.6 2.2 2.7 Cao Bang 3.1 3.3 3.0 Bac Kan 3.4 2.9 3.5 Tuyen Quang 4.1 4.6 4.0 Lao Cai 2.9 3.1 2.8 Dien Bien 2.5 2.8 2.5 Lai Chau 2.3 1.7 2.5 Son La 3.0 3.5 2.9 Yen Bai 3.9 4.7 3.6 Hoa Binh 3.4 3.6 3.3 Thai Nguyen 3.7 3.4 3.8 Lang Son 3.5 3.5 3.5 Quang Ninh 3.4 3.3 3.6 Bac Giang 3.1 3.2 3.1 Phu Tho 4.4 4.1 4.5 Vinh Phuc 3.7 3.2 3.8 Bac Ninh 3.1 2.7 3.2 Hai Duong 4.6 4.5 4.6 Hai Phong 4.3 3.6 4.9 Hung Yen 4.6 4.1 4.7 Thai Binh 5.8 5.5 5.9 Ha Nam 5.0 4.0 5.2 Nam Dinh 4.9 4.6 4.9 Ninh Binh 5.2 4.1 5.4 Thanh Hoa 4.8 4.2 4.9
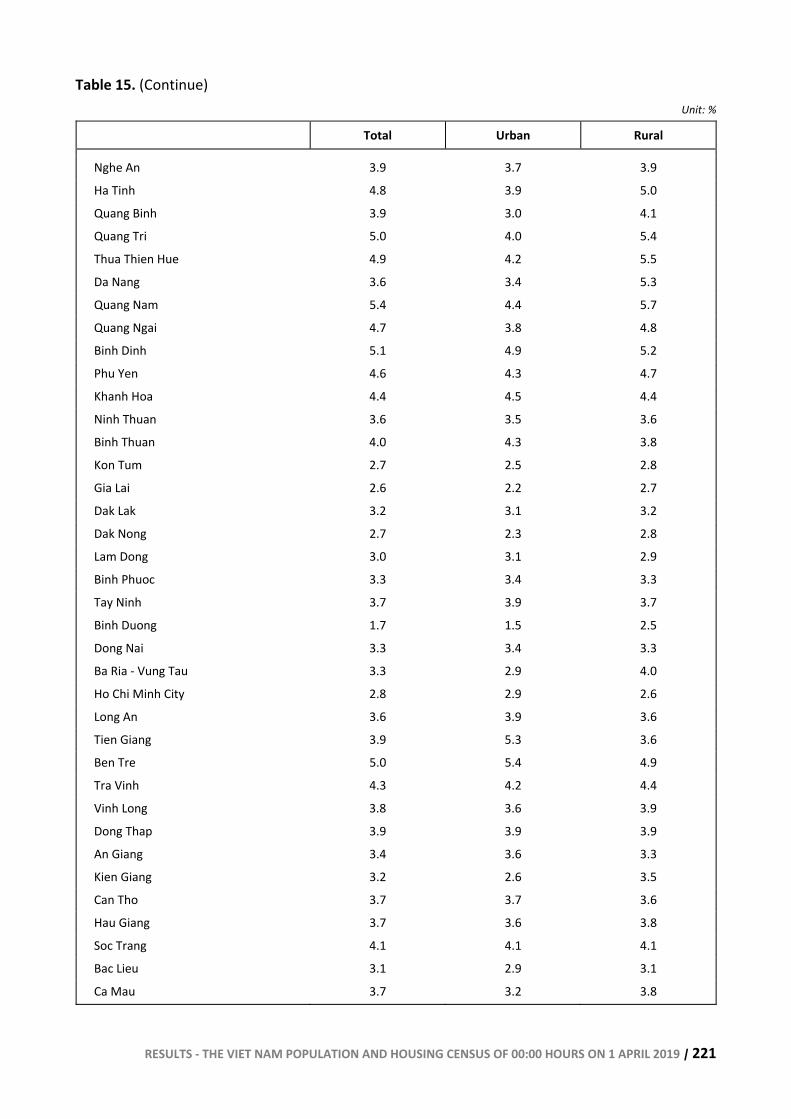
RESULTS - THE VIET NAM POPULATION AND HOUSING CENSUS OF 00:00 HOURS ON 1 APRIL 2019 | 221
Table 15. (Continue) Unit: %
Total Urban Rural
Nghe An 3.9 3.7 3.9
Ha Tinh 4.8 3.9 5.0
Quang Binh 3.9 3.0 4.1
Quang Tri 5.0 4.0 5.4
Thua Thien Hue 4.9 4.2 5.5
Da Nang 3.6 3.4 5.3
Quang Nam 5.4 4.4 5.7
Quang Ngai 4.7 3.8 4.8
Binh Dinh 5.1 4.9 5.2
Phu Yen 4.6 4.3 4.7
Khanh Hoa 4.4 4.5 4.4
Ninh Thuan 3.6 3.5 3.6
Binh Thuan 4.0 4.3 3.8
Kon Tum 2.7 2.5 2.8
Gia Lai 2.6 2.2 2.7
Dak Lak 3.2 3.1 3.2
Dak Nong 2.7 2.3 2.8
Lam Dong 3.0 3.1 2.9
Binh Phuoc 3.3 3.4 3.3
Tay Ninh 3.7 3.9 3.7
Binh Duong 1.7 1.5 2.5
Dong Nai 3.3 3.4 3.3
Ba Ria - Vung Tau 3.3 2.9 4.0
Ho Chi Minh City 2.8 2.9 2.6
Long An 3.6 3.9 3.6
Tien Giang 3.9 5.3 3.6
Ben Tre 5.0 5.4 4.9
Tra Vinh 4.3 4.2 4.4
Vinh Long 3.8 3.6 3.9
Dong Thap 3.9 3.9 3.9
An Giang 3.4 3.6 3.3
Kien Giang 3.2 2.6 3.5
Can Tho 3.7 3.7 3.6
Hau Giang 3.7 3.6 3.8
Soc Trang 4.1 4.1 4.1
Bac Lieu 3.1 2.9 3.1
Ca Mau 3.7 3.2 3.8
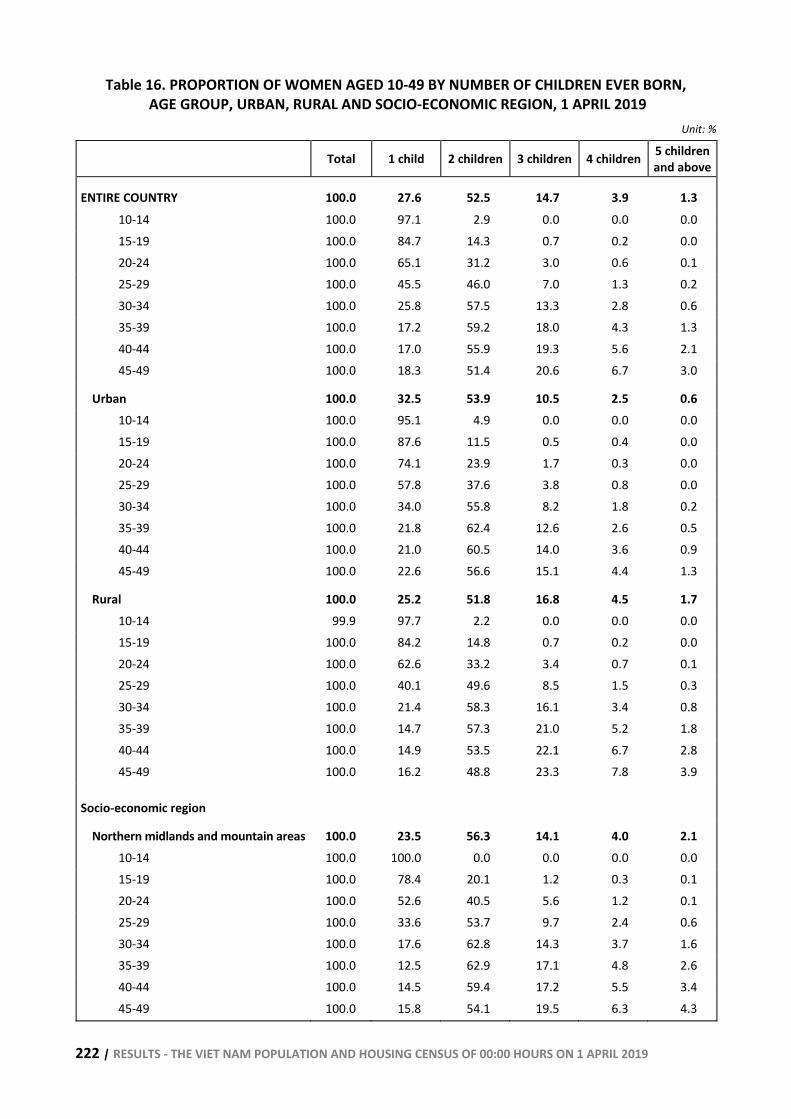
222 | RESULTS - THE VIET NAM POPULATION AND HOUSING CENSUS OF 00:00 HOURS ON 1 APRIL 2019
Table 16. PROPORTION OF WOMEN AGED 10-49 BY NUMBER OF CHILDREN EVER BORN, AGE GROUP, URBAN, RURAL AND SOCIO-ECONOMIC REGION, 1 APRIL 2019
Unit: %
Total 1 child 2 children 3 children 4 children 5 children and above
ENTIRE COUNTRY 100.0 27.6 52.5 14.7 3.9 1.3 10-14 100.0 97.1 2.9 0.0 0.0 0.0 15-19 100.0 84.7 14.3 0.7 0.2 0.0 20-24 100.0 65.1 31.2 3.0 0.6 0.1 25-29 100.0 45.5 46.0 7.0 1.3 0.2 30-34 100.0 25.8 57.5 13.3 2.8 0.6 35-39 100.0 17.2 59.2 18.0 4.3 1.3 40-44 100.0 17.0 55.9 19.3 5.6 2.1 45-49 100.0 18.3 51.4 20.6 6.7 3.0
Urban 100.0 32.5 53.9 10.5 2.5 0.6 10-14 100.0 95.1 4.9 0.0 0.0 0.0 15-19 100.0 87.6 11.5 0.5 0.4 0.0 20-24 100.0 74.1 23.9 1.7 0.3 0.0 25-29 100.0 57.8 37.6 3.8 0.8 0.0 30-34 100.0 34.0 55.8 8.2 1.8 0.2 35-39 100.0 21.8 62.4 12.6 2.6 0.5 40-44 100.0 21.0 60.5 14.0 3.6 0.9 45-49 100.0 22.6 56.6 15.1 4.4 1.3
Rural 100.0 25.2 51.8 16.8 4.5 1.7 10-14 99.9 97.7 2.2 0.0 0.0 0.0 15-19 100.0 84.2 14.8 0.7 0.2 0.0 20-24 100.0 62.6 33.2 3.4 0.7 0.1 25-29 100.0 40.1 49.6 8.5 1.5 0.3 30-34 100.0 21.4 58.3 16.1 3.4 0.8 35-39 100.0 14.7 57.3 21.0 5.2 1.8 40-44 100.0 14.9 53.5 22.1 6.7 2.8 45-49 100.0 16.2 48.8 23.3 7.8 3.9
Socio-economic region
Northern midlands and mountain areas 100.0 23.5 56.3 14.1 4.0 2.1 10-14 100.0 100.0 0.0 0.0 0.0 0.0 15-19 100.0 78.4 20.1 1.2 0.3 0.1 20-24 100.0 52.6 40.5 5.6 1.2 0.1 25-29 100.0 33.6 53.7 9.7 2.4 0.6 30-34 100.0 17.6 62.8 14.3 3.7 1.6 35-39 100.0 12.5 62.9 17.1 4.8 2.6 40-44 100.0 14.5 59.4 17.2 5.5 3.4 45-49 100.0 15.8 54.1 19.5 6.3 4.3
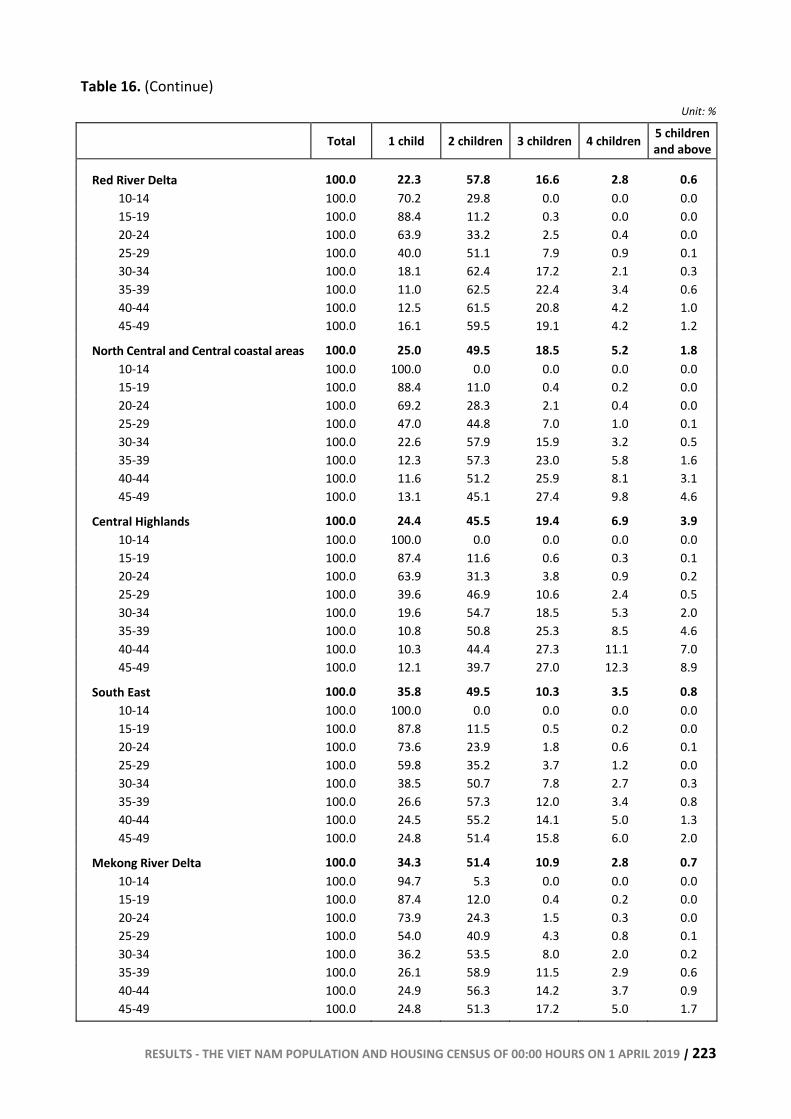
RESULTS - THE VIET NAM POPULATION AND HOUSING CENSUS OF 00:00 HOURS ON 1 APRIL 2019 | 223
Table 16. (Continue) Unit: %
Total 1 child 2 children 3 children 4 children 5 children and above
Red River Delta 100.0 22.3 57.8 16.6 2.8 0.6 10-14 100.0 70.2 29.8 0.0 0.0 0.0 15-19 100.0 88.4 11.2 0.3 0.0 0.0 20-24 100.0 63.9 33.2 2.5 0.4 0.0 25-29 100.0 40.0 51.1 7.9 0.9 0.1 30-34 100.0 18.1 62.4 17.2 2.1 0.3 35-39 100.0 11.0 62.5 22.4 3.4 0.6 40-44 100.0 12.5 61.5 20.8 4.2 1.0 45-49 100.0 16.1 59.5 19.1 4.2 1.2
North Central and Central coastal areas 100.0 25.0 49.5 18.5 5.2 1.8 10-14 100.0 100.0 0.0 0.0 0.0 0.0 15-19 100.0 88.4 11.0 0.4 0.2 0.0 20-24 100.0 69.2 28.3 2.1 0.4 0.0 25-29 100.0 47.0 44.8 7.0 1.0 0.1 30-34 100.0 22.6 57.9 15.9 3.2 0.5 35-39 100.0 12.3 57.3 23.0 5.8 1.6 40-44 100.0 11.6 51.2 25.9 8.1 3.1 45-49 100.0 13.1 45.1 27.4 9.8 4.6
Central Highlands 100.0 24.4 45.5 19.4 6.9 3.9 10-14 100.0 100.0 0.0 0.0 0.0 0.0 15-19 100.0 87.4 11.6 0.6 0.3 0.1 20-24 100.0 63.9 31.3 3.8 0.9 0.2 25-29 100.0 39.6 46.9 10.6 2.4 0.5 30-34 100.0 19.6 54.7 18.5 5.3 2.0 35-39 100.0 10.8 50.8 25.3 8.5 4.6 40-44 100.0 10.3 44.4 27.3 11.1 7.0 45-49 100.0 12.1 39.7 27.0 12.3 8.9
South East 100.0 35.8 49.5 10.3 3.5 0.8 10-14 100.0 100.0 0.0 0.0 0.0 0.0 15-19 100.0 87.8 11.5 0.5 0.2 0.0 20-24 100.0 73.6 23.9 1.8 0.6 0.1 25-29 100.0 59.8 35.2 3.7 1.2 0.0 30-34 100.0 38.5 50.7 7.8 2.7 0.3 35-39 100.0 26.6 57.3 12.0 3.4 0.8 40-44 100.0 24.5 55.2 14.1 5.0 1.3 45-49 100.0 24.8 51.4 15.8 6.0 2.0
Mekong River Delta 100.0 34.3 51.4 10.9 2.8 0.7 10-14 100.0 94.7 5.3 0.0 0.0 0.0 15-19 100.0 87.4 12.0 0.4 0.2 0.0 20-24 100.0 73.9 24.3 1.5 0.3 0.0 25-29 100.0 54.0 40.9 4.3 0.8 0.1 30-34 100.0 36.2 53.5 8.0 2.0 0.2 35-39 100.0 26.1 58.9 11.5 2.9 0.6 40-44 100.0 24.9 56.3 14.2 3.7 0.9 45-49 100.0 24.8 51.3 17.2 5.0 1.7
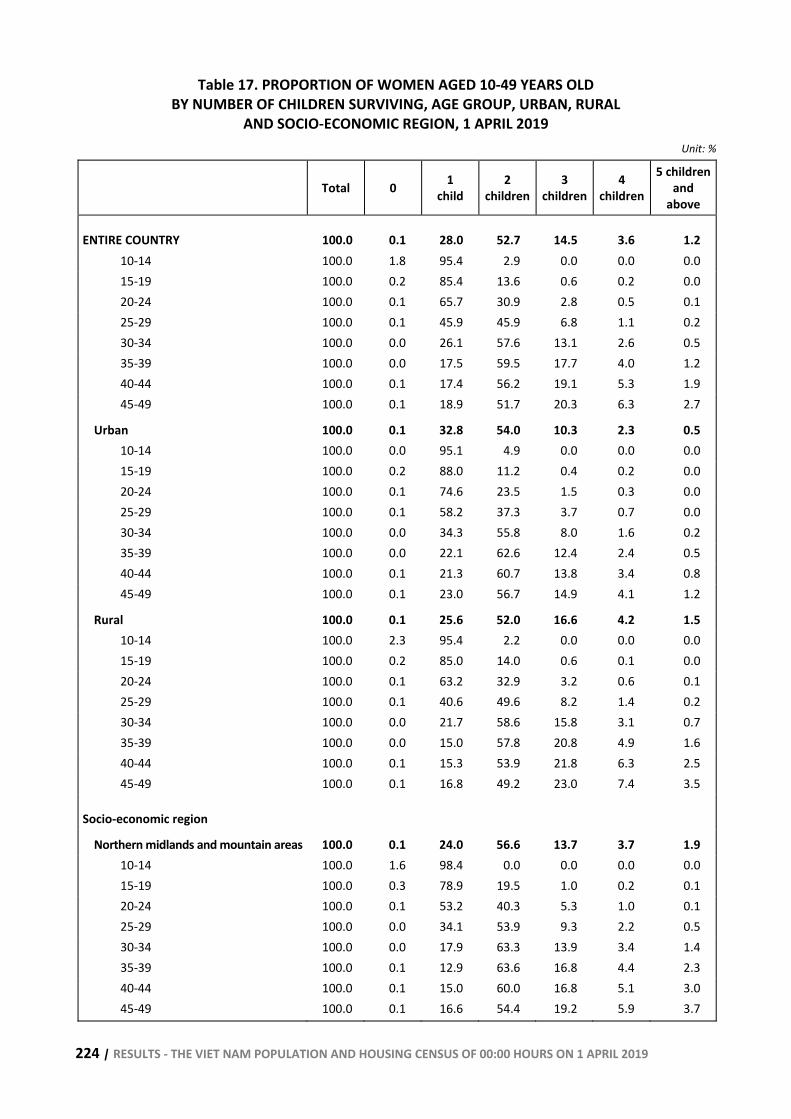
224 | RESULTS - THE VIET NAM POPULATION AND HOUSING CENSUS OF 00:00 HOURS ON 1 APRIL 2019
Table 17. PROPORTION OF WOMEN AGED 10-49 YEARS OLD BY NUMBER OF CHILDREN SURVIVING, AGE GROUP, URBAN, RURAL
AND SOCIO-ECONOMIC REGION, 1 APRIL 2019 Unit: %
Total 0 1 child
2 children
3 children
4 children
5 children and
above
ENTIRE COUNTRY 100.0 0.1 28.0 52.7 14.5 3.6 1.2 10-14 100.0 1.8 95.4 2.9 0.0 0.0 0.0 15-19 100.0 0.2 85.4 13.6 0.6 0.2 0.0 20-24 100.0 0.1 65.7 30.9 2.8 0.5 0.1 25-29 100.0 0.1 45.9 45.9 6.8 1.1 0.2 30-34 100.0 0.0 26.1 57.6 13.1 2.6 0.5 35-39 100.0 0.0 17.5 59.5 17.7 4.0 1.2 40-44 100.0 0.1 17.4 56.2 19.1 5.3 1.9 45-49 100.0 0.1 18.9 51.7 20.3 6.3 2.7
Urban 100.0 0.1 32.8 54.0 10.3 2.3 0.5 10-14 100.0 0.0 95.1 4.9 0.0 0.0 0.0 15-19 100.0 0.2 88.0 11.2 0.4 0.2 0.0 20-24 100.0 0.1 74.6 23.5 1.5 0.3 0.0 25-29 100.0 0.1 58.2 37.3 3.7 0.7 0.0 30-34 100.0 0.0 34.3 55.8 8.0 1.6 0.2 35-39 100.0 0.0 22.1 62.6 12.4 2.4 0.5 40-44 100.0 0.1 21.3 60.7 13.8 3.4 0.8 45-49 100.0 0.1 23.0 56.7 14.9 4.1 1.2
Rural 100.0 0.1 25.6 52.0 16.6 4.2 1.5 10-14 100.0 2.3 95.4 2.2 0.0 0.0 0.0 15-19 100.0 0.2 85.0 14.0 0.6 0.1 0.0 20-24 100.0 0.1 63.2 32.9 3.2 0.6 0.1 25-29 100.0 0.1 40.6 49.6 8.2 1.4 0.2 30-34 100.0 0.0 21.7 58.6 15.8 3.1 0.7 35-39 100.0 0.0 15.0 57.8 20.8 4.9 1.6 40-44 100.0 0.1 15.3 53.9 21.8 6.3 2.5 45-49 100.0 0.1 16.8 49.2 23.0 7.4 3.5
Socio-economic region
Northern midlands and mountain areas 100.0 0.1 24.0 56.6 13.7 3.7 1.9 10-14 100.0 1.6 98.4 0.0 0.0 0.0 0.0 15-19 100.0 0.3 78.9 19.5 1.0 0.2 0.1 20-24 100.0 0.1 53.2 40.3 5.3 1.0 0.1 25-29 100.0 0.0 34.1 53.9 9.3 2.2 0.5 30-34 100.0 0.0 17.9 63.3 13.9 3.4 1.4 35-39 100.0 0.1 12.9 63.6 16.8 4.4 2.3 40-44 100.0 0.1 15.0 60.0 16.8 5.1 3.0 45-49 100.0 0.1 16.6 54.4 19.2 5.9 3.7
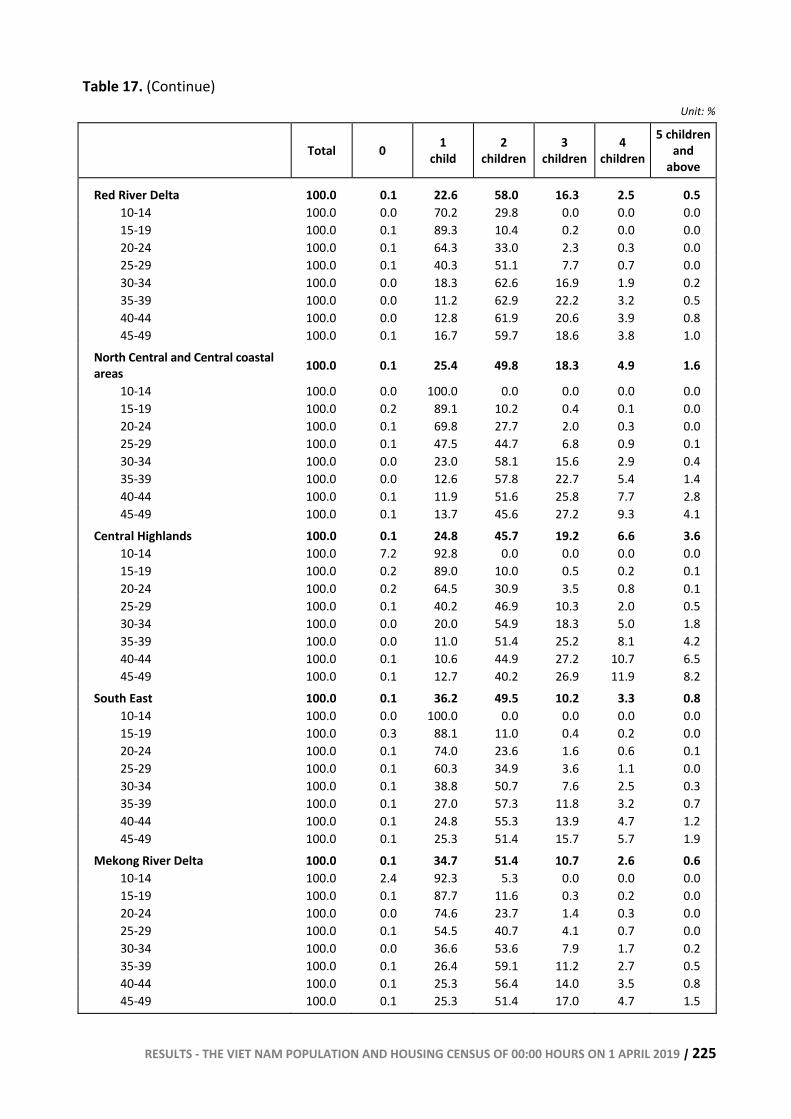
RESULTS - THE VIET NAM POPULATION AND HOUSING CENSUS OF 00:00 HOURS ON 1 APRIL 2019 | 225
Table 17. (Continue) Unit: %
Total 0 1 child
2 children
3 children
4 children
5 children and
above
Red River Delta 100.0 0.1 22.6 58.0 16.3 2.5 0.5 10-14 100.0 0.0 70.2 29.8 0.0 0.0 0.0 15-19 100.0 0.1 89.3 10.4 0.2 0.0 0.0 20-24 100.0 0.1 64.3 33.0 2.3 0.3 0.0 25-29 100.0 0.1 40.3 51.1 7.7 0.7 0.0 30-34 100.0 0.0 18.3 62.6 16.9 1.9 0.2 35-39 100.0 0.0 11.2 62.9 22.2 3.2 0.5 40-44 100.0 0.0 12.8 61.9 20.6 3.9 0.8 45-49 100.0 0.1 16.7 59.7 18.6 3.8 1.0
North Central and Central coastal areas 100.0 0.1 25.4 49.8 18.3 4.9 1.6
10-14 100.0 0.0 100.0 0.0 0.0 0.0 0.0 15-19 100.0 0.2 89.1 10.2 0.4 0.1 0.0 20-24 100.0 0.1 69.8 27.7 2.0 0.3 0.0 25-29 100.0 0.1 47.5 44.7 6.8 0.9 0.1 30-34 100.0 0.0 23.0 58.1 15.6 2.9 0.4 35-39 100.0 0.0 12.6 57.8 22.7 5.4 1.4 40-44 100.0 0.1 11.9 51.6 25.8 7.7 2.8 45-49 100.0 0.1 13.7 45.6 27.2 9.3 4.1
Central Highlands 100.0 0.1 24.8 45.7 19.2 6.6 3.6 10-14 100.0 7.2 92.8 0.0 0.0 0.0 0.0 15-19 100.0 0.2 89.0 10.0 0.5 0.2 0.1 20-24 100.0 0.2 64.5 30.9 3.5 0.8 0.1 25-29 100.0 0.1 40.2 46.9 10.3 2.0 0.5 30-34 100.0 0.0 20.0 54.9 18.3 5.0 1.8 35-39 100.0 0.0 11.0 51.4 25.2 8.1 4.2 40-44 100.0 0.1 10.6 44.9 27.2 10.7 6.5 45-49 100.0 0.1 12.7 40.2 26.9 11.9 8.2
South East 100.0 0.1 36.2 49.5 10.2 3.3 0.8 10-14 100.0 0.0 100.0 0.0 0.0 0.0 0.0 15-19 100.0 0.3 88.1 11.0 0.4 0.2 0.0 20-24 100.0 0.1 74.0 23.6 1.6 0.6 0.1 25-29 100.0 0.1 60.3 34.9 3.6 1.1 0.0 30-34 100.0 0.1 38.8 50.7 7.6 2.5 0.3 35-39 100.0 0.1 27.0 57.3 11.8 3.2 0.7 40-44 100.0 0.1 24.8 55.3 13.9 4.7 1.2 45-49 100.0 0.1 25.3 51.4 15.7 5.7 1.9
Mekong River Delta 100.0 0.1 34.7 51.4 10.7 2.6 0.6 10-14 100.0 2.4 92.3 5.3 0.0 0.0 0.0 15-19 100.0 0.1 87.7 11.6 0.3 0.2 0.0 20-24 100.0 0.0 74.6 23.7 1.4 0.3 0.0 25-29 100.0 0.1 54.5 40.7 4.1 0.7 0.0 30-34 100.0 0.0 36.6 53.6 7.9 1.7 0.2 35-39 100.0 0.1 26.4 59.1 11.2 2.7 0.5 40-44 100.0 0.1 25.3 56.4 14.0 3.5 0.8 45-49 100.0 0.1 25.3 51.4 17.0 4.7 1.5
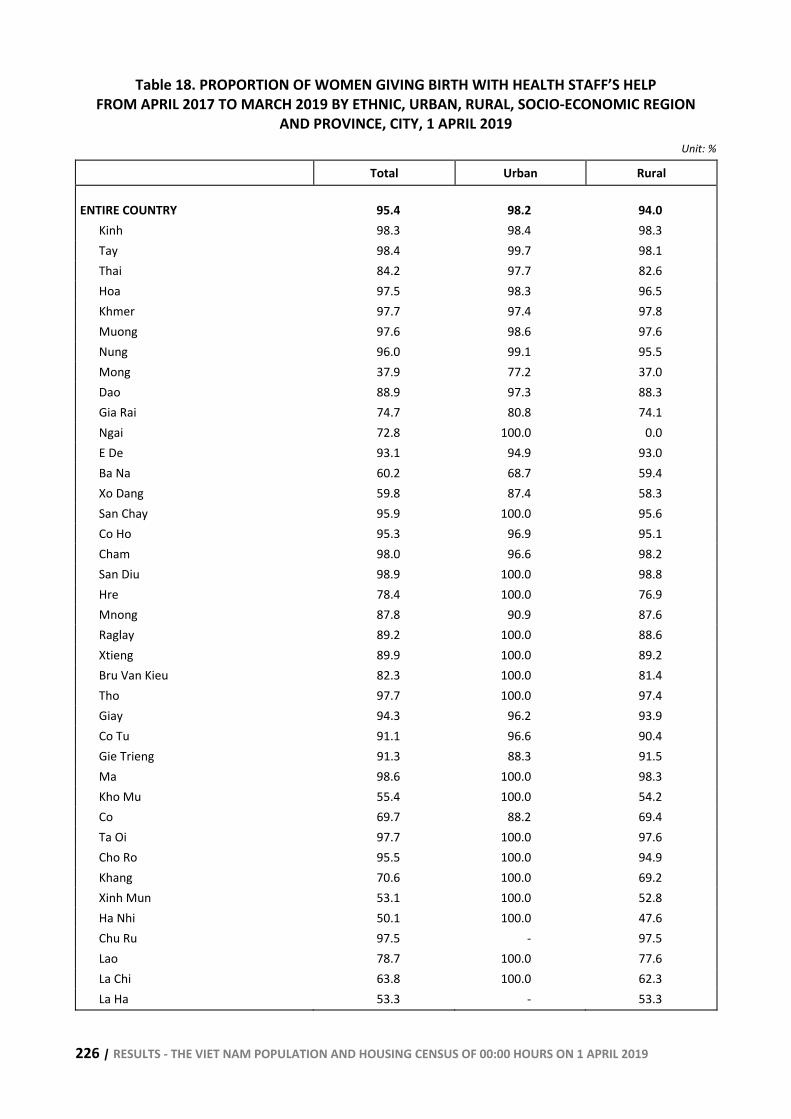
226 | RESULTS - THE VIET NAM POPULATION AND HOUSING CENSUS OF 00:00 HOURS ON 1 APRIL 2019
Table 18. PROPORTION OF WOMEN GIVING BIRTH WITH HEALTH STAFF’S HELP FROM APRIL 2017 TO MARCH 2019 BY ETHNIC, URBAN, RURAL, SOCIO-ECONOMIC REGION
AND PROVINCE, CITY, 1 APRIL 2019 Unit: %
Total Urban Rural
ENTIRE COUNTRY 95.4 98.2 94.0 Kinh 98.3 98.4 98.3 Tay 98.4 99.7 98.1 Thai 84.2 97.7 82.6 Hoa 97.5 98.3 96.5 Khmer 97.7 97.4 97.8 Muong 97.6 98.6 97.6 Nung 96.0 99.1 95.5 Mong 37.9 77.2 37.0 Dao 88.9 97.3 88.3 Gia Rai 74.7 80.8 74.1 Ngai 72.8 100.0 0.0 E De 93.1 94.9 93.0 Ba Na 60.2 68.7 59.4 Xo Dang 59.8 87.4 58.3 San Chay 95.9 100.0 95.6 Co Ho 95.3 96.9 95.1 Cham 98.0 96.6 98.2 San Diu 98.9 100.0 98.8 Hre 78.4 100.0 76.9 Mnong 87.8 90.9 87.6 Raglay 89.2 100.0 88.6 Xtieng 89.9 100.0 89.2 Bru Van Kieu 82.3 100.0 81.4 Tho 97.7 100.0 97.4 Giay 94.3 96.2 93.9 Co Tu 91.1 96.6 90.4 Gie Trieng 91.3 88.3 91.5 Ma 98.6 100.0 98.3 Kho Mu 55.4 100.0 54.2 Co 69.7 88.2 69.4 Ta Oi 97.7 100.0 97.6 Cho Ro 95.5 100.0 94.9 Khang 70.6 100.0 69.2 Xinh Mun 53.1 100.0 52.8 Ha Nhi 50.1 100.0 47.6 Chu Ru 97.5 - 97.5 Lao 78.7 100.0 77.6 La Chi 63.8 100.0 62.3 La Ha 53.3 - 53.3
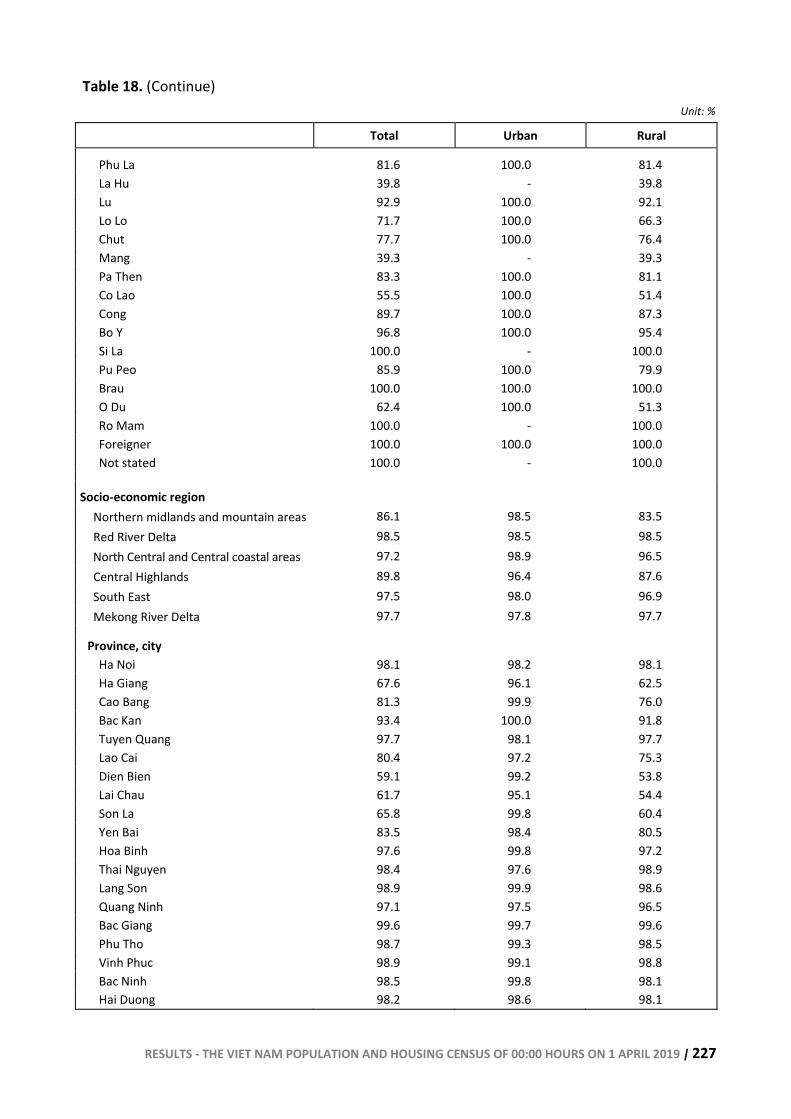
RESULTS - THE VIET NAM POPULATION AND HOUSING CENSUS OF 00:00 HOURS ON 1 APRIL 2019 | 227
Table 18. (Continue) Unit: %
Total Urban Rural
Phu La 81.6 100.0 81.4 La Hu 39.8 - 39.8 Lu 92.9 100.0 92.1 Lo Lo 71.7 100.0 66.3 Chut 77.7 100.0 76.4 Mang 39.3 - 39.3 Pa Then 83.3 100.0 81.1 Co Lao 55.5 100.0 51.4 Cong 89.7 100.0 87.3 Bo Y 96.8 100.0 95.4 Si La 100.0 - 100.0 Pu Peo 85.9 100.0 79.9 Brau 100.0 100.0 100.0 O Du 62.4 100.0 51.3 Ro Mam 100.0 - 100.0 Foreigner 100.0 100.0 100.0 Not stated 100.0 - 100.0
Socio-economic region
Northern midlands and mountain areas 86.1 98.5 83.5 Red River Delta 98.5 98.5 98.5 North Central and Central coastal areas 97.2 98.9 96.5 Central Highlands 89.8 96.4 87.6 South East 97.5 98.0 96.9 Mekong River Delta 97.7 97.8 97.7
Province, city Ha Noi 98.1 98.2 98.1 Ha Giang 67.6 96.1 62.5 Cao Bang 81.3 99.9 76.0 Bac Kan 93.4 100.0 91.8 Tuyen Quang 97.7 98.1 97.7 Lao Cai 80.4 97.2 75.3 Dien Bien 59.1 99.2 53.8 Lai Chau 61.7 95.1 54.4 Son La 65.8 99.8 60.4 Yen Bai 83.5 98.4 80.5 Hoa Binh 97.6 99.8 97.2 Thai Nguyen 98.4 97.6 98.9 Lang Son 98.9 99.9 98.6 Quang Ninh 97.1 97.5 96.5 Bac Giang 99.6 99.7 99.6 Phu Tho 98.7 99.3 98.5 Vinh Phuc 98.9 99.1 98.8 Bac Ninh 98.5 99.8 98.1 Hai Duong 98.2 98.6 98.1
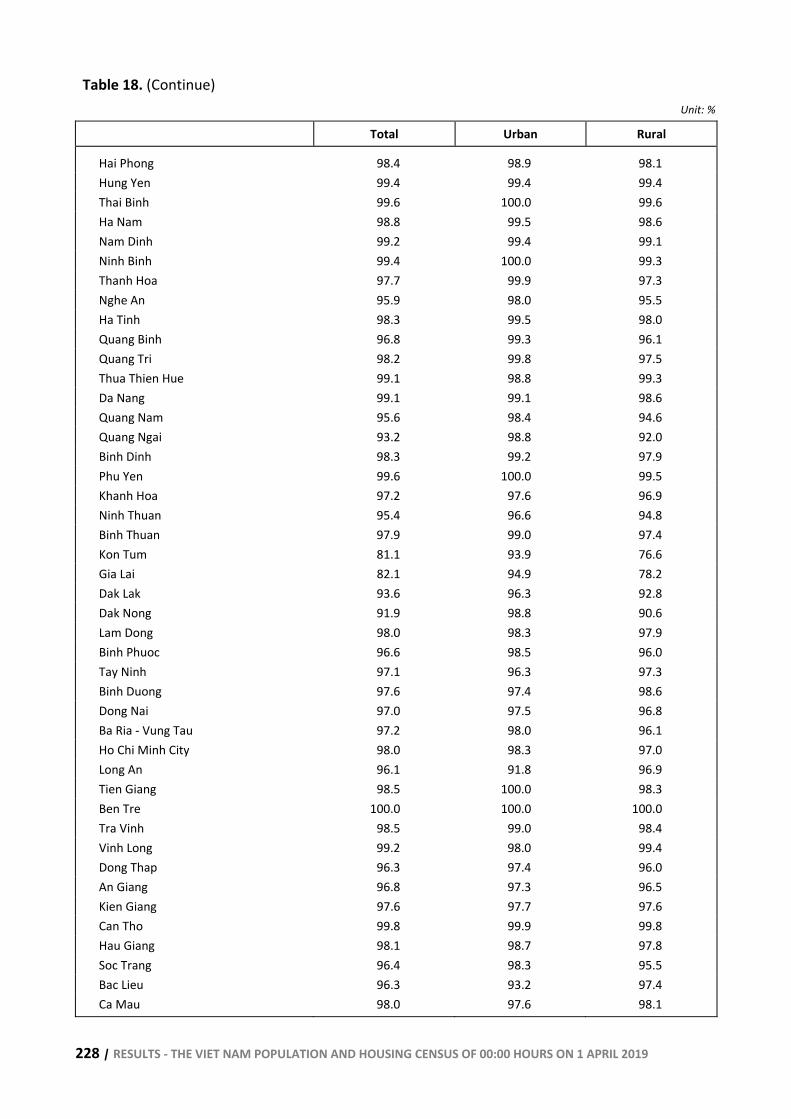
228 | RESULTS - THE VIET NAM POPULATION AND HOUSING CENSUS OF 00:00 HOURS ON 1 APRIL 2019
Table 18. (Continue) Unit: %
Total Urban Rural
Hai Phong 98.4 98.9 98.1 Hung Yen 99.4 99.4 99.4 Thai Binh 99.6 100.0 99.6 Ha Nam 98.8 99.5 98.6 Nam Dinh 99.2 99.4 99.1 Ninh Binh 99.4 100.0 99.3 Thanh Hoa 97.7 99.9 97.3 Nghe An 95.9 98.0 95.5 Ha Tinh 98.3 99.5 98.0 Quang Binh 96.8 99.3 96.1 Quang Tri 98.2 99.8 97.5 Thua Thien Hue 99.1 98.8 99.3 Da Nang 99.1 99.1 98.6 Quang Nam 95.6 98.4 94.6 Quang Ngai 93.2 98.8 92.0 Binh Dinh 98.3 99.2 97.9 Phu Yen 99.6 100.0 99.5 Khanh Hoa 97.2 97.6 96.9 Ninh Thuan 95.4 96.6 94.8 Binh Thuan 97.9 99.0 97.4 Kon Tum 81.1 93.9 76.6 Gia Lai 82.1 94.9 78.2 Dak Lak 93.6 96.3 92.8 Dak Nong 91.9 98.8 90.6 Lam Dong 98.0 98.3 97.9 Binh Phuoc 96.6 98.5 96.0 Tay Ninh 97.1 96.3 97.3 Binh Duong 97.6 97.4 98.6 Dong Nai 97.0 97.5 96.8 Ba Ria - Vung Tau 97.2 98.0 96.1 Ho Chi Minh City 98.0 98.3 97.0 Long An 96.1 91.8 96.9 Tien Giang 98.5 100.0 98.3 Ben Tre 100.0 100.0 100.0 Tra Vinh 98.5 99.0 98.4 Vinh Long 99.2 98.0 99.4 Dong Thap 96.3 97.4 96.0 An Giang 96.8 97.3 96.5 Kien Giang 97.6 97.7 97.6 Can Tho 99.8 99.9 99.8 Hau Giang 98.1 98.7 97.8 Soc Trang 96.4 98.3 95.5 Bac Lieu 96.3 93.2 97.4 Ca Mau 98.0 97.6 98.1
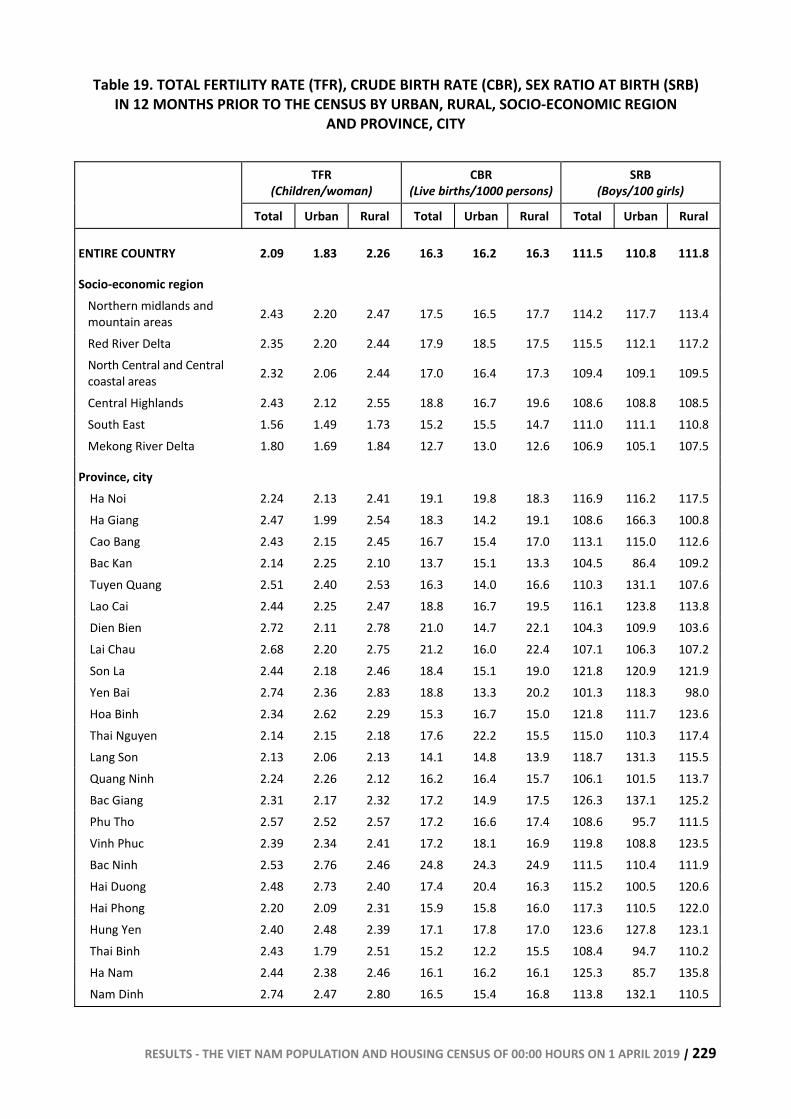
RESULTS - THE VIET NAM POPULATION AND HOUSING CENSUS OF 00:00 HOURS ON 1 APRIL 2019 | 229
Table 19. TOTAL FERTILITY RATE (TFR), CRUDE BIRTH RATE (CBR), SEX RATIO AT BIRTH (SRB) IN 12 MONTHS PRIOR TO THE CENSUS BY URBAN, RURAL, SOCIO-ECONOMIC REGION
AND PROVINCE, CITY
TFR (Children/woman)
CBR (Live births/1000 persons)
SRB (Boys/100 girls)
Total Urban Rural Total Urban Rural Total Urban Rural
ENTIRE COUNTRY 2.09 1.83 2.26 16.3 16.2 16.3 111.5 110.8 111.8
Socio-economic region Northern midlands and mountain areas 2.43 2.20 2.47 17.5 16.5 17.7 114.2 117.7 113.4
Red River Delta 2.35 2.20 2.44 17.9 18.5 17.5 115.5 112.1 117.2 North Central and Central coastal areas 2.32 2.06 2.44 17.0 16.4 17.3 109.4 109.1 109.5
Central Highlands 2.43 2.12 2.55 18.8 16.7 19.6 108.6 108.8 108.5 South East 1.56 1.49 1.73 15.2 15.5 14.7 111.0 111.1 110.8 Mekong River Delta 1.80 1.69 1.84 12.7 13.0 12.6 106.9 105.1 107.5
Province, city Ha Noi 2.24 2.13 2.41 19.1 19.8 18.3 116.9 116.2 117.5 Ha Giang 2.47 1.99 2.54 18.3 14.2 19.1 108.6 166.3 100.8 Cao Bang 2.43 2.15 2.45 16.7 15.4 17.0 113.1 115.0 112.6 Bac Kan 2.14 2.25 2.10 13.7 15.1 13.3 104.5 86.4 109.2 Tuyen Quang 2.51 2.40 2.53 16.3 14.0 16.6 110.3 131.1 107.6 Lao Cai 2.44 2.25 2.47 18.8 16.7 19.5 116.1 123.8 113.8 Dien Bien 2.72 2.11 2.78 21.0 14.7 22.1 104.3 109.9 103.6 Lai Chau 2.68 2.20 2.75 21.2 16.0 22.4 107.1 106.3 107.2 Son La 2.44 2.18 2.46 18.4 15.1 19.0 121.8 120.9 121.9 Yen Bai 2.74 2.36 2.83 18.8 13.3 20.2 101.3 118.3 98.0 Hoa Binh 2.34 2.62 2.29 15.3 16.7 15.0 121.8 111.7 123.6 Thai Nguyen 2.14 2.15 2.18 17.6 22.2 15.5 115.0 110.3 117.4 Lang Son 2.13 2.06 2.13 14.1 14.8 13.9 118.7 131.3 115.5 Quang Ninh 2.24 2.26 2.12 16.2 16.4 15.7 106.1 101.5 113.7 Bac Giang 2.31 2.17 2.32 17.2 14.9 17.5 126.3 137.1 125.2 Phu Tho 2.57 2.52 2.57 17.2 16.6 17.4 108.6 95.7 111.5 Vinh Phuc 2.39 2.34 2.41 17.2 18.1 16.9 119.8 108.8 123.5 Bac Ninh 2.53 2.76 2.46 24.8 24.3 24.9 111.5 110.4 111.9 Hai Duong 2.48 2.73 2.40 17.4 20.4 16.3 115.2 100.5 120.6 Hai Phong 2.20 2.09 2.31 15.9 15.8 16.0 117.3 110.5 122.0 Hung Yen 2.40 2.48 2.39 17.1 17.8 17.0 123.6 127.8 123.1 Thai Binh 2.43 1.79 2.51 15.2 12.2 15.5 108.4 94.7 110.2 Ha Nam 2.44 2.38 2.46 16.1 16.2 16.1 125.3 85.7 135.8 Nam Dinh 2.74 2.47 2.80 16.5 15.4 16.8 113.8 132.1 110.5
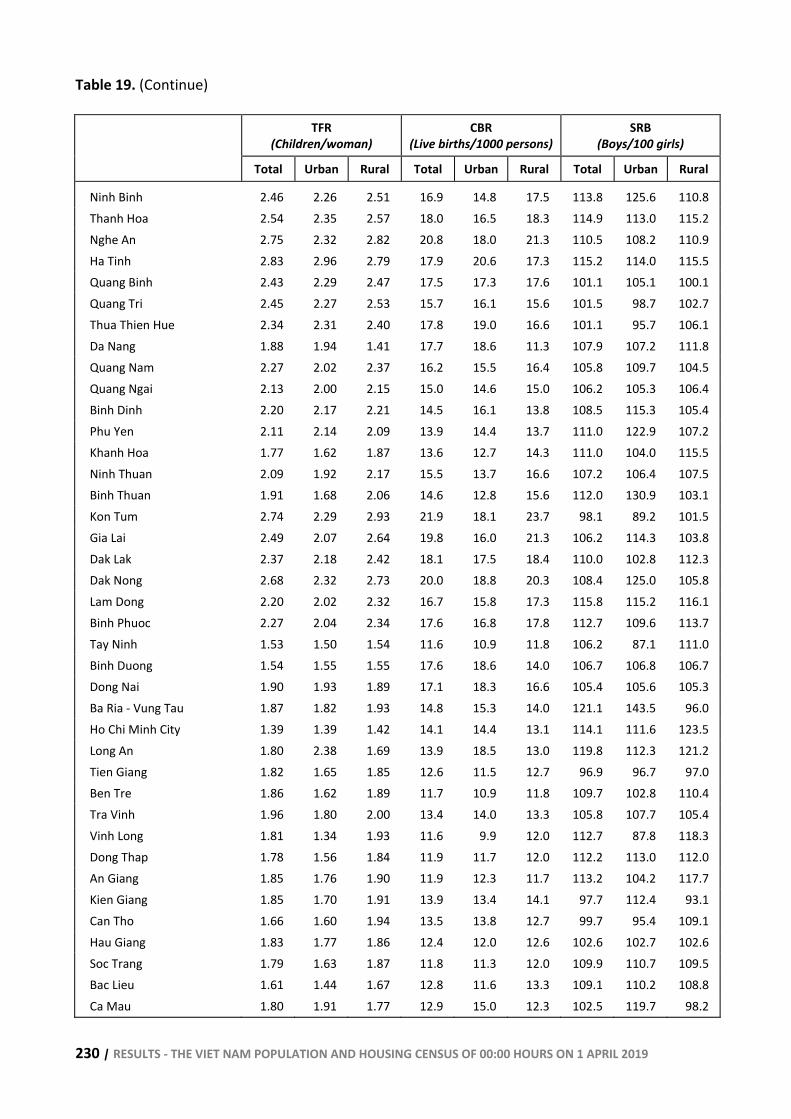
230 | RESULTS - THE VIET NAM POPULATION AND HOUSING CENSUS OF 00:00 HOURS ON 1 APRIL 2019
Table 19. (Continue)
TFR
(Children/woman) CBR
(Live births/1000 persons) SRB
(Boys/100 girls) Total Urban Rural Total Urban Rural Total Urban Rural
Ninh Binh 2.46 2.26 2.51 16.9 14.8 17.5 113.8 125.6 110.8 Thanh Hoa 2.54 2.35 2.57 18.0 16.5 18.3 114.9 113.0 115.2 Nghe An 2.75 2.32 2.82 20.8 18.0 21.3 110.5 108.2 110.9 Ha Tinh 2.83 2.96 2.79 17.9 20.6 17.3 115.2 114.0 115.5 Quang Binh 2.43 2.29 2.47 17.5 17.3 17.6 101.1 105.1 100.1 Quang Tri 2.45 2.27 2.53 15.7 16.1 15.6 101.5 98.7 102.7 Thua Thien Hue 2.34 2.31 2.40 17.8 19.0 16.6 101.1 95.7 106.1 Da Nang 1.88 1.94 1.41 17.7 18.6 11.3 107.9 107.2 111.8 Quang Nam 2.27 2.02 2.37 16.2 15.5 16.4 105.8 109.7 104.5 Quang Ngai 2.13 2.00 2.15 15.0 14.6 15.0 106.2 105.3 106.4 Binh Dinh 2.20 2.17 2.21 14.5 16.1 13.8 108.5 115.3 105.4 Phu Yen 2.11 2.14 2.09 13.9 14.4 13.7 111.0 122.9 107.2 Khanh Hoa 1.77 1.62 1.87 13.6 12.7 14.3 111.0 104.0 115.5 Ninh Thuan 2.09 1.92 2.17 15.5 13.7 16.6 107.2 106.4 107.5 Binh Thuan 1.91 1.68 2.06 14.6 12.8 15.6 112.0 130.9 103.1 Kon Tum 2.74 2.29 2.93 21.9 18.1 23.7 98.1 89.2 101.5 Gia Lai 2.49 2.07 2.64 19.8 16.0 21.3 106.2 114.3 103.8 Dak Lak 2.37 2.18 2.42 18.1 17.5 18.4 110.0 102.8 112.3 Dak Nong 2.68 2.32 2.73 20.0 18.8 20.3 108.4 125.0 105.8 Lam Dong 2.20 2.02 2.32 16.7 15.8 17.3 115.8 115.2 116.1 Binh Phuoc 2.27 2.04 2.34 17.6 16.8 17.8 112.7 109.6 113.7 Tay Ninh 1.53 1.50 1.54 11.6 10.9 11.8 106.2 87.1 111.0 Binh Duong 1.54 1.55 1.55 17.6 18.6 14.0 106.7 106.8 106.7 Dong Nai 1.90 1.93 1.89 17.1 18.3 16.6 105.4 105.6 105.3 Ba Ria - Vung Tau 1.87 1.82 1.93 14.8 15.3 14.0 121.1 143.5 96.0 Ho Chi Minh City 1.39 1.39 1.42 14.1 14.4 13.1 114.1 111.6 123.5 Long An 1.80 2.38 1.69 13.9 18.5 13.0 119.8 112.3 121.2 Tien Giang 1.82 1.65 1.85 12.6 11.5 12.7 96.9 96.7 97.0 Ben Tre 1.86 1.62 1.89 11.7 10.9 11.8 109.7 102.8 110.4 Tra Vinh 1.96 1.80 2.00 13.4 14.0 13.3 105.8 107.7 105.4 Vinh Long 1.81 1.34 1.93 11.6 9.9 12.0 112.7 87.8 118.3 Dong Thap 1.78 1.56 1.84 11.9 11.7 12.0 112.2 113.0 112.0 An Giang 1.85 1.76 1.90 11.9 12.3 11.7 113.2 104.2 117.7 Kien Giang 1.85 1.70 1.91 13.9 13.4 14.1 97.7 112.4 93.1 Can Tho 1.66 1.60 1.94 13.5 13.8 12.7 99.7 95.4 109.1 Hau Giang 1.83 1.77 1.86 12.4 12.0 12.6 102.6 102.7 102.6 Soc Trang 1.79 1.63 1.87 11.8 11.3 12.0 109.9 110.7 109.5 Bac Lieu 1.61 1.44 1.67 12.8 11.6 13.3 109.1 110.2 108.8 Ca Mau 1.80 1.91 1.77 12.9 15.0 12.3 102.5 119.7 98.2
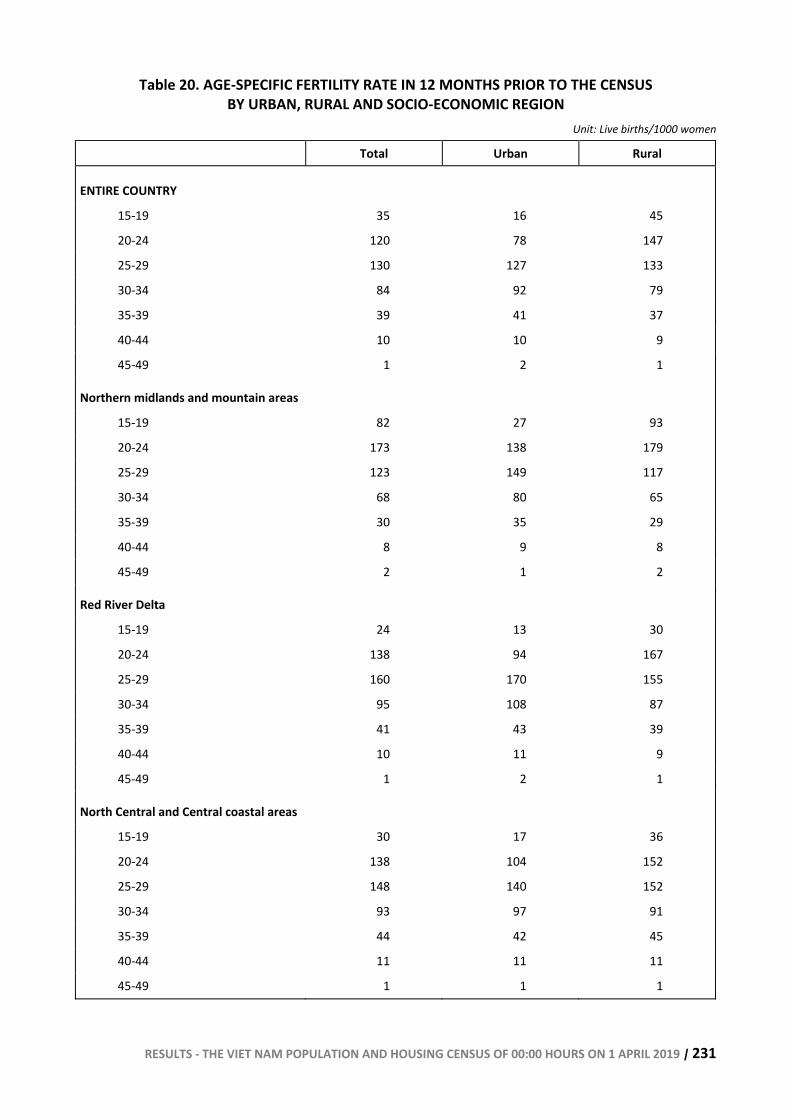
RESULTS - THE VIET NAM POPULATION AND HOUSING CENSUS OF 00:00 HOURS ON 1 APRIL 2019 | 231
Table 20. AGE-SPECIFIC FERTILITY RATE IN 12 MONTHS PRIOR TO THE CENSUS BY URBAN, RURAL AND SOCIO-ECONOMIC REGION
Unit: Live births/1000 women
Total Urban Rural
ENTIRE COUNTRY
15-19 35 16 45
20-24 120 78 147
25-29 130 127 133
30-34 84 92 79
35-39 39 41 37
40-44 10 10 9
45-49 1 2 1
Northern midlands and mountain areas
15-19 82 27 93
20-24 173 138 179
25-29 123 149 117
30-34 68 80 65
35-39 30 35 29
40-44 8 9 8
45-49 2 1 2
Red River Delta
15-19 24 13 30
20-24 138 94 167
25-29 160 170 155
30-34 95 108 87
35-39 41 43 39
40-44 10 11 9
45-49 1 2 1
North Central and Central coastal areas
15-19 30 17 36
20-24 138 104 152
25-29 148 140 152
30-34 93 97 91
35-39 44 42 45
40-44 11 11 11
45-49 1 1 1
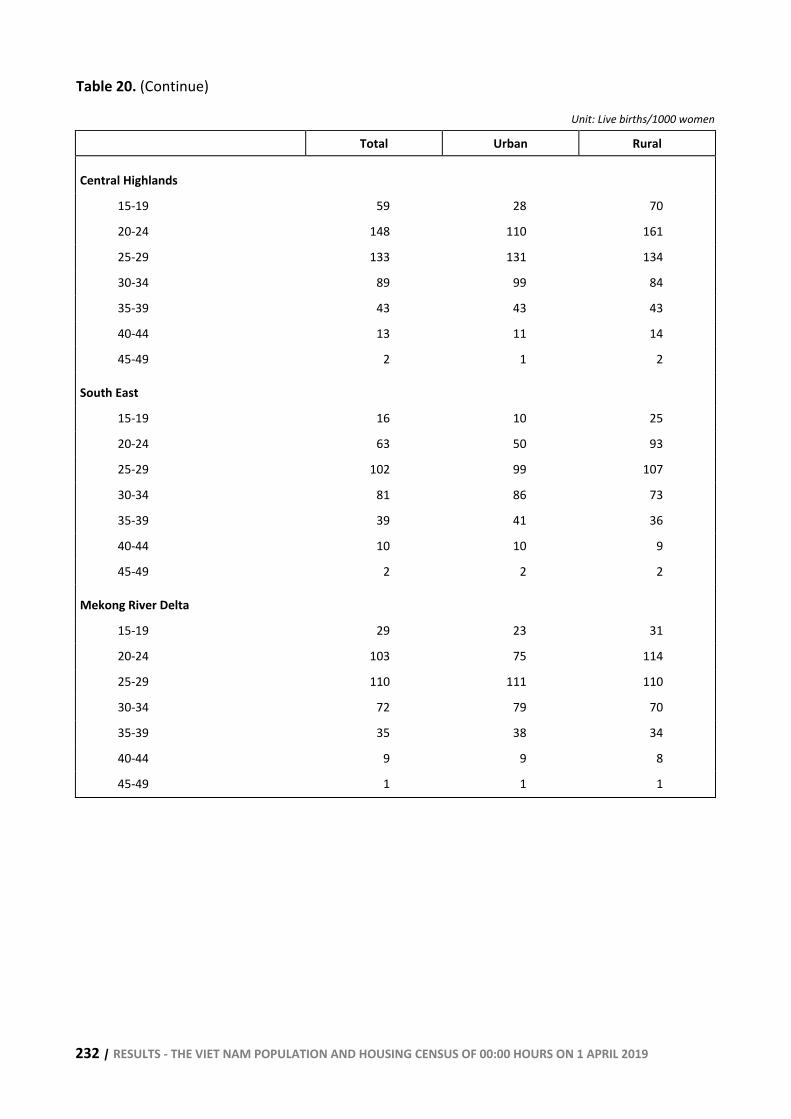
232 | RESULTS - THE VIET NAM POPULATION AND HOUSING CENSUS OF 00:00 HOURS ON 1 APRIL 2019
Table 20. (Continue)
Unit: Live births/1000 women
Total Urban Rural
Central Highlands
15-19 59 28 70
20-24 148 110 161
25-29 133 131 134
30-34 89 99 84
35-39 43 43 43
40-44 13 11 14
45-49 2 1 2
South East
15-19 16 10 25
20-24 63 50 93
25-29 102 99 107
30-34 81 86 73
35-39 39 41 36
40-44 10 10 9
45-49 2 2 2
Mekong River Delta
15-19 29 23 31
20-24 103 75 114
25-29 110 111 110
30-34 72 79 70
35-39 35 38 34
40-44 9 9 8
45-49 1 1 1
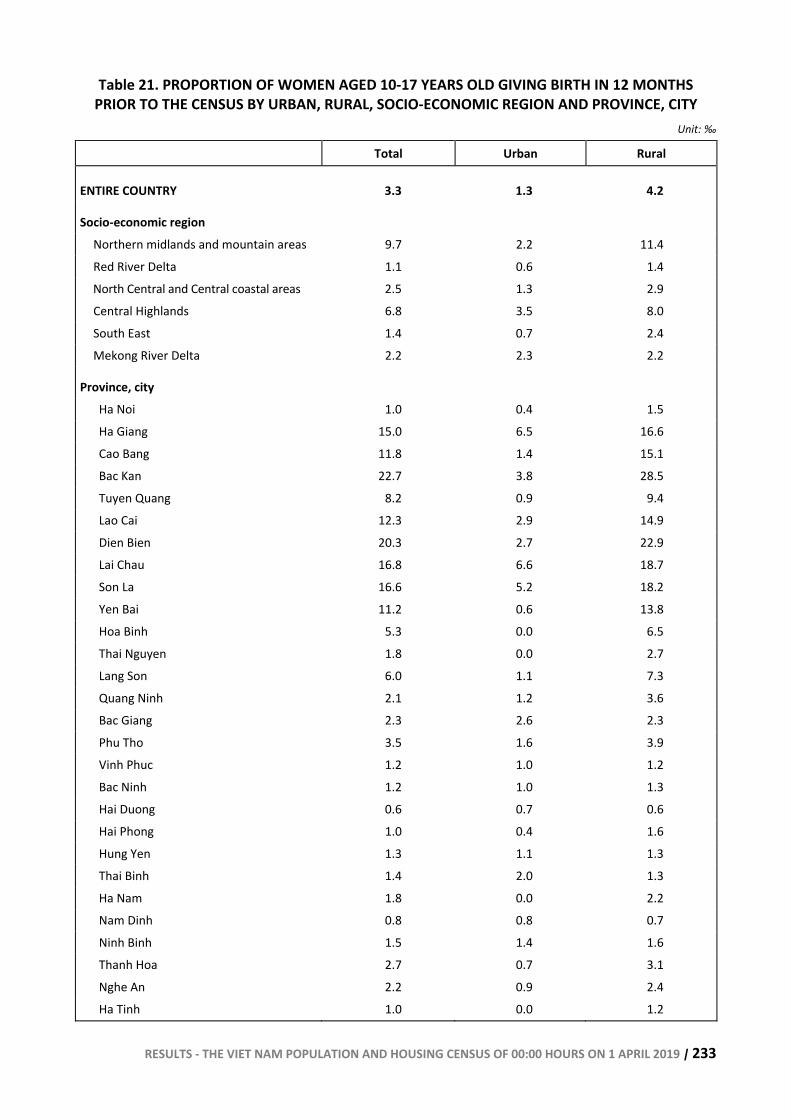
RESULTS - THE VIET NAM POPULATION AND HOUSING CENSUS OF 00:00 HOURS ON 1 APRIL 2019 | 233
Table 21. PROPORTION OF WOMEN AGED 10-17 YEARS OLD GIVING BIRTH IN 12 MONTHS PRIOR TO THE CENSUS BY URBAN, RURAL, SOCIO-ECONOMIC REGION AND PROVINCE, CITY
Unit: ‰
Total Urban Rural
ENTIRE COUNTRY 3.3 1.3 4.2
Socio-economic region Northern midlands and mountain areas 9.7 2.2 11.4 Red River Delta 1.1 0.6 1.4 North Central and Central coastal areas 2.5 1.3 2.9 Central Highlands 6.8 3.5 8.0 South East 1.4 0.7 2.4 Mekong River Delta 2.2 2.3 2.2
Province, city Ha Noi 1.0 0.4 1.5 Ha Giang 15.0 6.5 16.6 Cao Bang 11.8 1.4 15.1 Bac Kan 22.7 3.8 28.5 Tuyen Quang 8.2 0.9 9.4 Lao Cai 12.3 2.9 14.9 Dien Bien 20.3 2.7 22.9 Lai Chau 16.8 6.6 18.7 Son La 16.6 5.2 18.2 Yen Bai 11.2 0.6 13.8 Hoa Binh 5.3 0.0 6.5 Thai Nguyen 1.8 0.0 2.7 Lang Son 6.0 1.1 7.3 Quang Ninh 2.1 1.2 3.6 Bac Giang 2.3 2.6 2.3 Phu Tho 3.5 1.6 3.9 Vinh Phuc 1.2 1.0 1.2 Bac Ninh 1.2 1.0 1.3 Hai Duong 0.6 0.7 0.6 Hai Phong 1.0 0.4 1.6 Hung Yen 1.3 1.1 1.3 Thai Binh 1.4 2.0 1.3 Ha Nam 1.8 0.0 2.2 Nam Dinh 0.8 0.8 0.7 Ninh Binh 1.5 1.4 1.6 Thanh Hoa 2.7 0.7 3.1 Nghe An 2.2 0.9 2.4 Ha Tinh 1.0 0.0 1.2
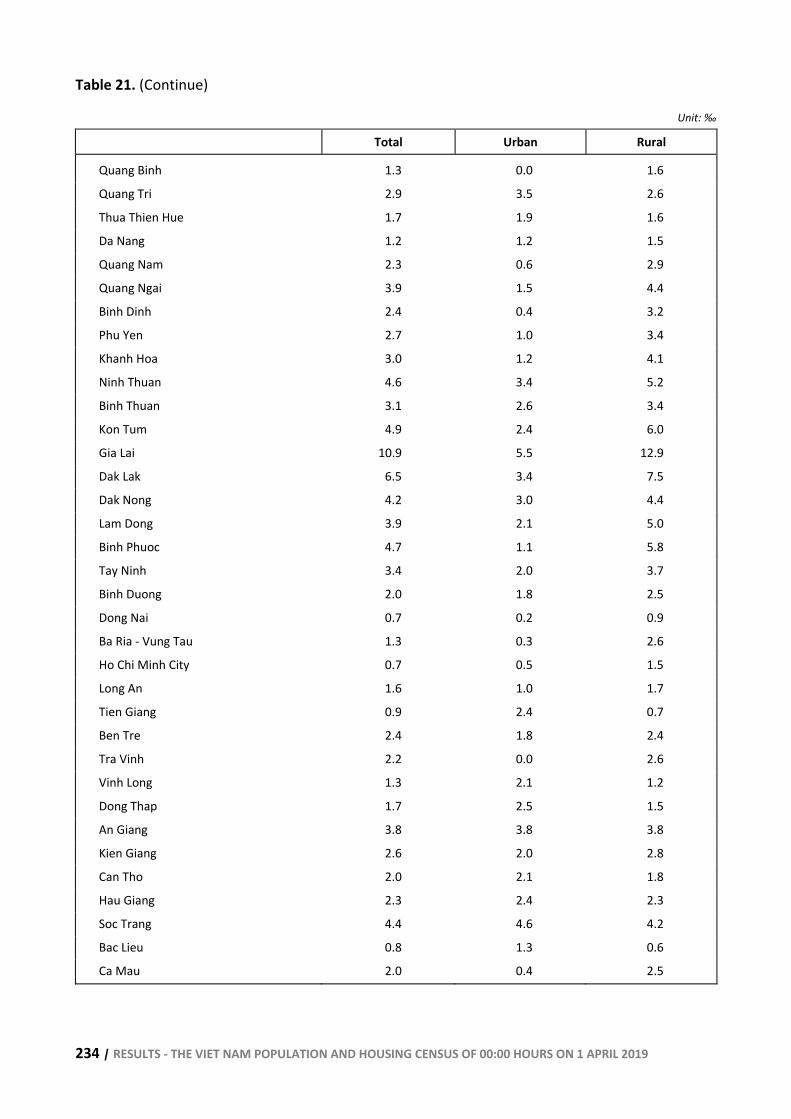
234 | RESULTS - THE VIET NAM POPULATION AND HOUSING CENSUS OF 00:00 HOURS ON 1 APRIL 2019
Table 21. (Continue)
Unit: ‰
Total Urban Rural
Quang Binh 1.3 0.0 1.6
Quang Tri 2.9 3.5 2.6
Thua Thien Hue 1.7 1.9 1.6
Da Nang 1.2 1.2 1.5
Quang Nam 2.3 0.6 2.9
Quang Ngai 3.9 1.5 4.4
Binh Dinh 2.4 0.4 3.2
Phu Yen 2.7 1.0 3.4
Khanh Hoa 3.0 1.2 4.1
Ninh Thuan 4.6 3.4 5.2
Binh Thuan 3.1 2.6 3.4
Kon Tum 4.9 2.4 6.0
Gia Lai 10.9 5.5 12.9
Dak Lak 6.5 3.4 7.5
Dak Nong 4.2 3.0 4.4
Lam Dong 3.9 2.1 5.0
Binh Phuoc 4.7 1.1 5.8
Tay Ninh 3.4 2.0 3.7
Binh Duong 2.0 1.8 2.5
Dong Nai 0.7 0.2 0.9
Ba Ria - Vung Tau 1.3 0.3 2.6
Ho Chi Minh City 0.7 0.5 1.5
Long An 1.6 1.0 1.7
Tien Giang 0.9 2.4 0.7
Ben Tre 2.4 1.8 2.4
Tra Vinh 2.2 0.0 2.6
Vinh Long 1.3 2.1 1.2
Dong Thap 1.7 2.5 1.5
An Giang 3.8 3.8 3.8
Kien Giang 2.6 2.0 2.8
Can Tho 2.0 2.1 1.8
Hau Giang 2.3 2.4 2.3
Soc Trang 4.4 4.6 4.2
Bac Lieu 0.8 1.3 0.6
Ca Mau 2.0 0.4 2.5
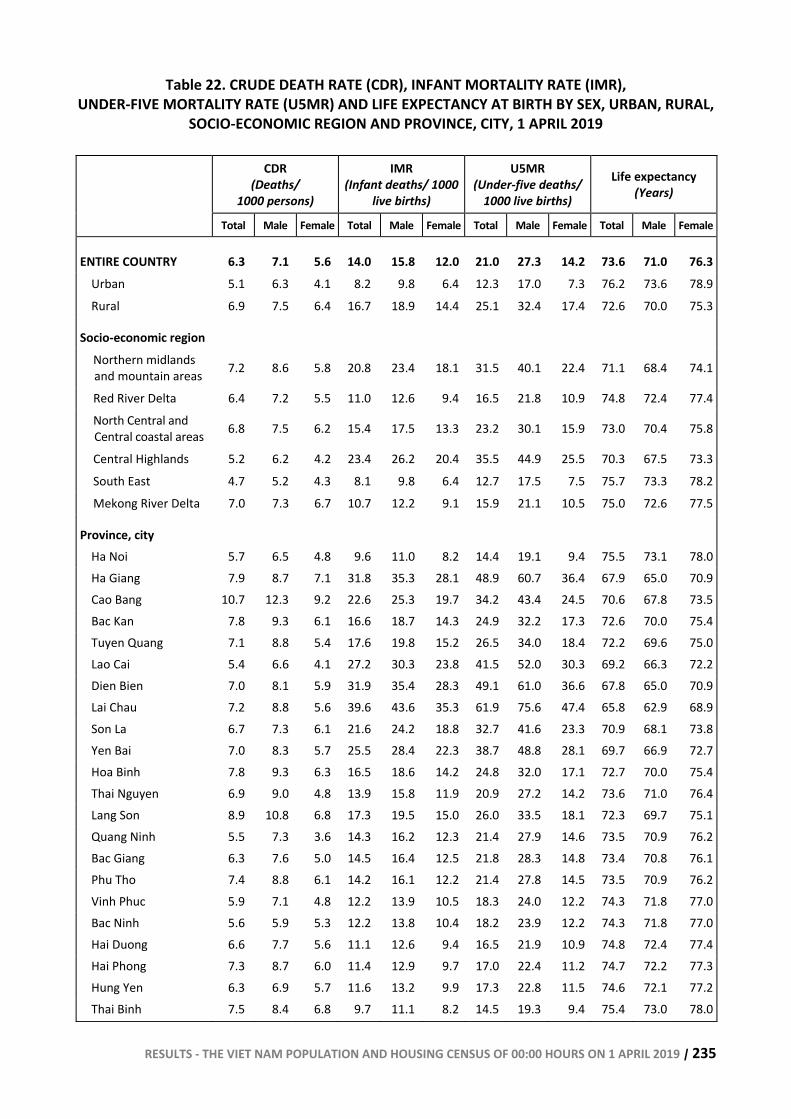
RESULTS - THE VIET NAM POPULATION AND HOUSING CENSUS OF 00:00 HOURS ON 1 APRIL 2019 | 235
Table 22. CRUDE DEATH RATE (CDR), INFANT MORTALITY RATE (IMR), UNDER-FIVE MORTALITY RATE (U5MR) AND LIFE EXPECTANCY AT BIRTH BY SEX, URBAN, RURAL,
SOCIO-ECONOMIC REGION AND PROVINCE, CITY, 1 APRIL 2019
CDR (Deaths/
1000 persons)
IMR (Infant deaths/ 1000
live births)
U5MR (Under-five deaths/
1000 live births)
Life expectancy (Years)
Total Male Female Total Male Female Total Male Female Total Male Female
ENTIRE COUNTRY 6.3 7.1 5.6 14.0 15.8 12.0 21.0 27.3 14.2 73.6 71.0 76.3Urban 5.1 6.3 4.1 8.2 9.8 6.4 12.3 17.0 7.3 76.2 73.6 78.9Rural 6.9 7.5 6.4 16.7 18.9 14.4 25.1 32.4 17.4 72.6 70.0 75.3
Socio-economic region Northern midlands and mountain areas 7.2 8.6 5.8 20.8 23.4 18.1 31.5 40.1 22.4 71.1 68.4 74.1
Red River Delta 6.4 7.2 5.5 11.0 12.6 9.4 16.5 21.8 10.9 74.8 72.4 77.4North Central and Central coastal areas 6.8 7.5 6.2 15.4 17.5 13.3 23.2 30.1 15.9 73.0 70.4 75.8
Central Highlands 5.2 6.2 4.2 23.4 26.2 20.4 35.5 44.9 25.5 70.3 67.5 73.3South East 4.7 5.2 4.3 8.1 9.8 6.4 12.7 17.5 7.5 75.7 73.3 78.2Mekong River Delta 7.0 7.3 6.7 10.7 12.2 9.1 15.9 21.1 10.5 75.0 72.6 77.5
Province, city Ha Noi 5.7 6.5 4.8 9.6 11.0 8.2 14.4 19.1 9.4 75.5 73.1 78.0Ha Giang 7.9 8.7 7.1 31.8 35.3 28.1 48.9 60.7 36.4 67.9 65.0 70.9Cao Bang 10.7 12.3 9.2 22.6 25.3 19.7 34.2 43.4 24.5 70.6 67.8 73.5Bac Kan 7.8 9.3 6.1 16.6 18.7 14.3 24.9 32.2 17.3 72.6 70.0 75.4Tuyen Quang 7.1 8.8 5.4 17.6 19.8 15.2 26.5 34.0 18.4 72.2 69.6 75.0Lao Cai 5.4 6.6 4.1 27.2 30.3 23.8 41.5 52.0 30.3 69.2 66.3 72.2Dien Bien 7.0 8.1 5.9 31.9 35.4 28.3 49.1 61.0 36.6 67.8 65.0 70.9Lai Chau 7.2 8.8 5.6 39.6 43.6 35.3 61.9 75.6 47.4 65.8 62.9 68.9Son La 6.7 7.3 6.1 21.6 24.2 18.8 32.7 41.6 23.3 70.9 68.1 73.8Yen Bai 7.0 8.3 5.7 25.5 28.4 22.3 38.7 48.8 28.1 69.7 66.9 72.7Hoa Binh 7.8 9.3 6.3 16.5 18.6 14.2 24.8 32.0 17.1 72.7 70.0 75.4Thai Nguyen 6.9 9.0 4.8 13.9 15.8 11.9 20.9 27.2 14.2 73.6 71.0 76.4Lang Son 8.9 10.8 6.8 17.3 19.5 15.0 26.0 33.5 18.1 72.3 69.7 75.1Quang Ninh 5.5 7.3 3.6 14.3 16.2 12.3 21.4 27.9 14.6 73.5 70.9 76.2Bac Giang 6.3 7.6 5.0 14.5 16.4 12.5 21.8 28.3 14.8 73.4 70.8 76.1Phu Tho 7.4 8.8 6.1 14.2 16.1 12.2 21.4 27.8 14.5 73.5 70.9 76.2Vinh Phuc 5.9 7.1 4.8 12.2 13.9 10.5 18.3 24.0 12.2 74.3 71.8 77.0Bac Ninh 5.6 5.9 5.3 12.2 13.8 10.4 18.2 23.9 12.2 74.3 71.8 77.0Hai Duong 6.6 7.7 5.6 11.1 12.6 9.4 16.5 21.9 10.9 74.8 72.4 77.4Hai Phong 7.3 8.7 6.0 11.4 12.9 9.7 17.0 22.4 11.2 74.7 72.2 77.3Hung Yen 6.3 6.9 5.7 11.6 13.2 9.9 17.3 22.8 11.5 74.6 72.1 77.2Thai Binh 7.5 8.4 6.8 9.7 11.1 8.2 14.5 19.3 9.4 75.4 73.0 78.0
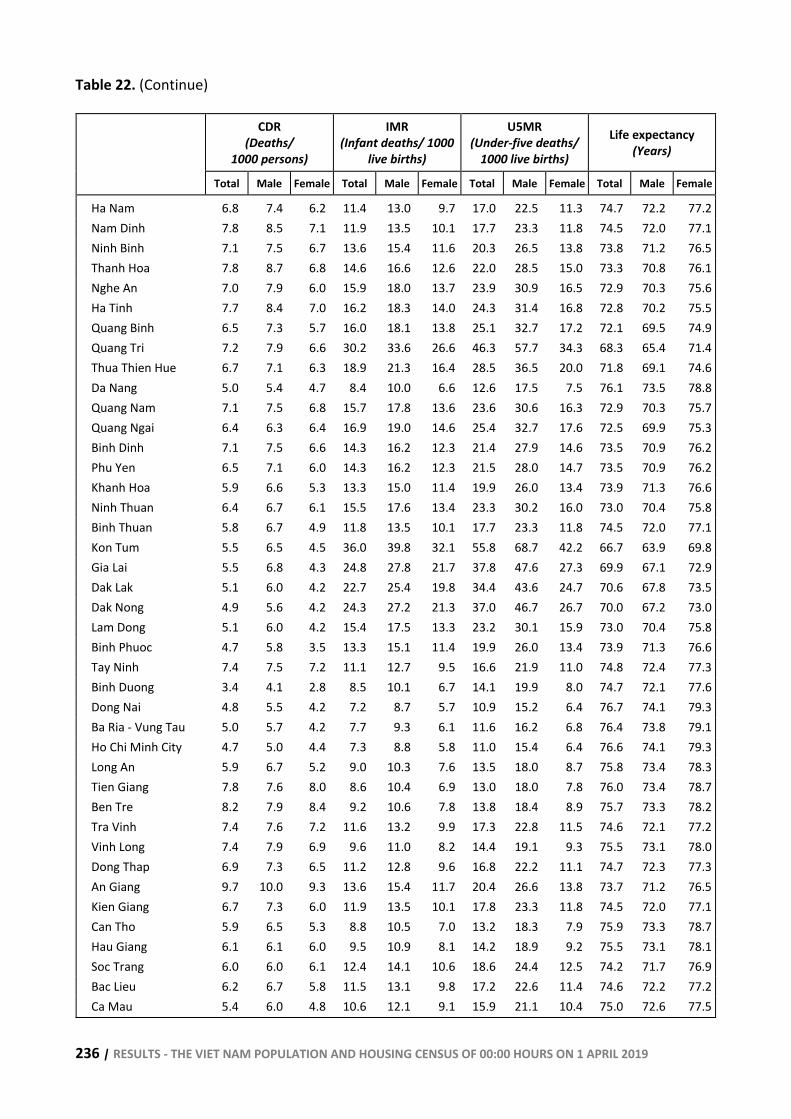
236 | RESULTS - THE VIET NAM POPULATION AND HOUSING CENSUS OF 00:00 HOURS ON 1 APRIL 2019
Table 22. (Continue)
CDR (Deaths/
1000 persons)
IMR (Infant deaths/ 1000
live births)
U5MR (Under-five deaths/
1000 live births)
Life expectancy (Years)
Total Male Female Total Male Female Total Male Female Total Male Female
Ha Nam 6.8 7.4 6.2 11.4 13.0 9.7 17.0 22.5 11.3 74.7 72.2 77.2Nam Dinh 7.8 8.5 7.1 11.9 13.5 10.1 17.7 23.3 11.8 74.5 72.0 77.1Ninh Binh 7.1 7.5 6.7 13.6 15.4 11.6 20.3 26.5 13.8 73.8 71.2 76.5Thanh Hoa 7.8 8.7 6.8 14.6 16.6 12.6 22.0 28.5 15.0 73.3 70.8 76.1Nghe An 7.0 7.9 6.0 15.9 18.0 13.7 23.9 30.9 16.5 72.9 70.3 75.6Ha Tinh 7.7 8.4 7.0 16.2 18.3 14.0 24.3 31.4 16.8 72.8 70.2 75.5Quang Binh 6.5 7.3 5.7 16.0 18.1 13.8 25.1 32.7 17.2 72.1 69.5 74.9Quang Tri 7.2 7.9 6.6 30.2 33.6 26.6 46.3 57.7 34.3 68.3 65.4 71.4Thua Thien Hue 6.7 7.1 6.3 18.9 21.3 16.4 28.5 36.5 20.0 71.8 69.1 74.6Da Nang 5.0 5.4 4.7 8.4 10.0 6.6 12.6 17.5 7.5 76.1 73.5 78.8Quang Nam 7.1 7.5 6.8 15.7 17.8 13.6 23.6 30.6 16.3 72.9 70.3 75.7Quang Ngai 6.4 6.3 6.4 16.9 19.0 14.6 25.4 32.7 17.6 72.5 69.9 75.3Binh Dinh 7.1 7.5 6.6 14.3 16.2 12.3 21.4 27.9 14.6 73.5 70.9 76.2Phu Yen 6.5 7.1 6.0 14.3 16.2 12.3 21.5 28.0 14.7 73.5 70.9 76.2Khanh Hoa 5.9 6.6 5.3 13.3 15.0 11.4 19.9 26.0 13.4 73.9 71.3 76.6Ninh Thuan 6.4 6.7 6.1 15.5 17.6 13.4 23.3 30.2 16.0 73.0 70.4 75.8Binh Thuan 5.8 6.7 4.9 11.8 13.5 10.1 17.7 23.3 11.8 74.5 72.0 77.1Kon Tum 5.5 6.5 4.5 36.0 39.8 32.1 55.8 68.7 42.2 66.7 63.9 69.8Gia Lai 5.5 6.8 4.3 24.8 27.8 21.7 37.8 47.6 27.3 69.9 67.1 72.9Dak Lak 5.1 6.0 4.2 22.7 25.4 19.8 34.4 43.6 24.7 70.6 67.8 73.5Dak Nong 4.9 5.6 4.2 24.3 27.2 21.3 37.0 46.7 26.7 70.0 67.2 73.0Lam Dong 5.1 6.0 4.2 15.4 17.5 13.3 23.2 30.1 15.9 73.0 70.4 75.8Binh Phuoc 4.7 5.8 3.5 13.3 15.1 11.4 19.9 26.0 13.4 73.9 71.3 76.6Tay Ninh 7.4 7.5 7.2 11.1 12.7 9.5 16.6 21.9 11.0 74.8 72.4 77.3Binh Duong 3.4 4.1 2.8 8.5 10.1 6.7 14.1 19.9 8.0 74.7 72.1 77.6Dong Nai 4.8 5.5 4.2 7.2 8.7 5.7 10.9 15.2 6.4 76.7 74.1 79.3Ba Ria - Vung Tau 5.0 5.7 4.2 7.7 9.3 6.1 11.6 16.2 6.8 76.4 73.8 79.1Ho Chi Minh City 4.7 5.0 4.4 7.3 8.8 5.8 11.0 15.4 6.4 76.6 74.1 79.3Long An 5.9 6.7 5.2 9.0 10.3 7.6 13.5 18.0 8.7 75.8 73.4 78.3Tien Giang 7.8 7.6 8.0 8.6 10.4 6.9 13.0 18.0 7.8 76.0 73.4 78.7Ben Tre 8.2 7.9 8.4 9.2 10.6 7.8 13.8 18.4 8.9 75.7 73.3 78.2Tra Vinh 7.4 7.6 7.2 11.6 13.2 9.9 17.3 22.8 11.5 74.6 72.1 77.2Vinh Long 7.4 7.9 6.9 9.6 11.0 8.2 14.4 19.1 9.3 75.5 73.1 78.0Dong Thap 6.9 7.3 6.5 11.2 12.8 9.6 16.8 22.2 11.1 74.7 72.3 77.3An Giang 9.7 10.0 9.3 13.6 15.4 11.7 20.4 26.6 13.8 73.7 71.2 76.5Kien Giang 6.7 7.3 6.0 11.9 13.5 10.1 17.8 23.3 11.8 74.5 72.0 77.1Can Tho 5.9 6.5 5.3 8.8 10.5 7.0 13.2 18.3 7.9 75.9 73.3 78.7Hau Giang 6.1 6.1 6.0 9.5 10.9 8.1 14.2 18.9 9.2 75.5 73.1 78.1Soc Trang 6.0 6.0 6.1 12.4 14.1 10.6 18.6 24.4 12.5 74.2 71.7 76.9Bac Lieu 6.2 6.7 5.8 11.5 13.1 9.8 17.2 22.6 11.4 74.6 72.2 77.2Ca Mau 5.4 6.0 4.8 10.6 12.1 9.1 15.9 21.1 10.4 75.0 72.6 77.5
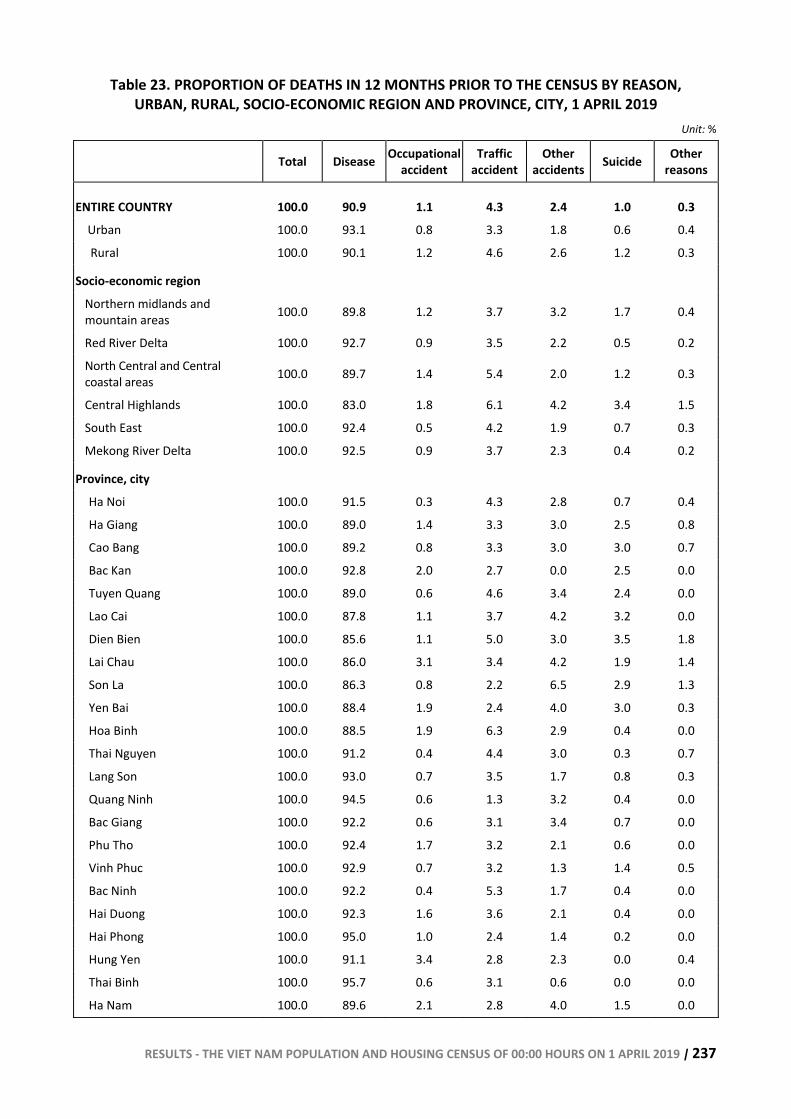
RESULTS - THE VIET NAM POPULATION AND HOUSING CENSUS OF 00:00 HOURS ON 1 APRIL 2019 | 237
Table 23. PROPORTION OF DEATHS IN 12 MONTHS PRIOR TO THE CENSUS BY REASON, URBAN, RURAL, SOCIO-ECONOMIC REGION AND PROVINCE, CITY, 1 APRIL 2019
Unit: %
Total Disease Occupational accident
Traffic accident
Other accidents Suicide Other
reasons
ENTIRE COUNTRY 100.0 90.9 1.1 4.3 2.4 1.0 0.3 Urban 100.0 93.1 0.8 3.3 1.8 0.6 0.4
Rural 100.0 90.1 1.2 4.6 2.6 1.2 0.3
Socio-economic region Northern midlands and mountain areas 100.0 89.8 1.2 3.7 3.2 1.7 0.4
Red River Delta 100.0 92.7 0.9 3.5 2.2 0.5 0.2
North Central and Central coastal areas 100.0 89.7 1.4 5.4 2.0 1.2 0.3
Central Highlands 100.0 83.0 1.8 6.1 4.2 3.4 1.5
South East 100.0 92.4 0.5 4.2 1.9 0.7 0.3
Mekong River Delta 100.0 92.5 0.9 3.7 2.3 0.4 0.2
Province, city
Ha Noi 100.0 91.5 0.3 4.3 2.8 0.7 0.4
Ha Giang 100.0 89.0 1.4 3.3 3.0 2.5 0.8
Cao Bang 100.0 89.2 0.8 3.3 3.0 3.0 0.7
Bac Kan 100.0 92.8 2.0 2.7 0.0 2.5 0.0
Tuyen Quang 100.0 89.0 0.6 4.6 3.4 2.4 0.0
Lao Cai 100.0 87.8 1.1 3.7 4.2 3.2 0.0
Dien Bien 100.0 85.6 1.1 5.0 3.0 3.5 1.8
Lai Chau 100.0 86.0 3.1 3.4 4.2 1.9 1.4
Son La 100.0 86.3 0.8 2.2 6.5 2.9 1.3
Yen Bai 100.0 88.4 1.9 2.4 4.0 3.0 0.3
Hoa Binh 100.0 88.5 1.9 6.3 2.9 0.4 0.0
Thai Nguyen 100.0 91.2 0.4 4.4 3.0 0.3 0.7
Lang Son 100.0 93.0 0.7 3.5 1.7 0.8 0.3
Quang Ninh 100.0 94.5 0.6 1.3 3.2 0.4 0.0
Bac Giang 100.0 92.2 0.6 3.1 3.4 0.7 0.0
Phu Tho 100.0 92.4 1.7 3.2 2.1 0.6 0.0
Vinh Phuc 100.0 92.9 0.7 3.2 1.3 1.4 0.5
Bac Ninh 100.0 92.2 0.4 5.3 1.7 0.4 0.0
Hai Duong 100.0 92.3 1.6 3.6 2.1 0.4 0.0
Hai Phong 100.0 95.0 1.0 2.4 1.4 0.2 0.0
Hung Yen 100.0 91.1 3.4 2.8 2.3 0.0 0.4
Thai Binh 100.0 95.7 0.6 3.1 0.6 0.0 0.0
Ha Nam 100.0 89.6 2.1 2.8 4.0 1.5 0.0
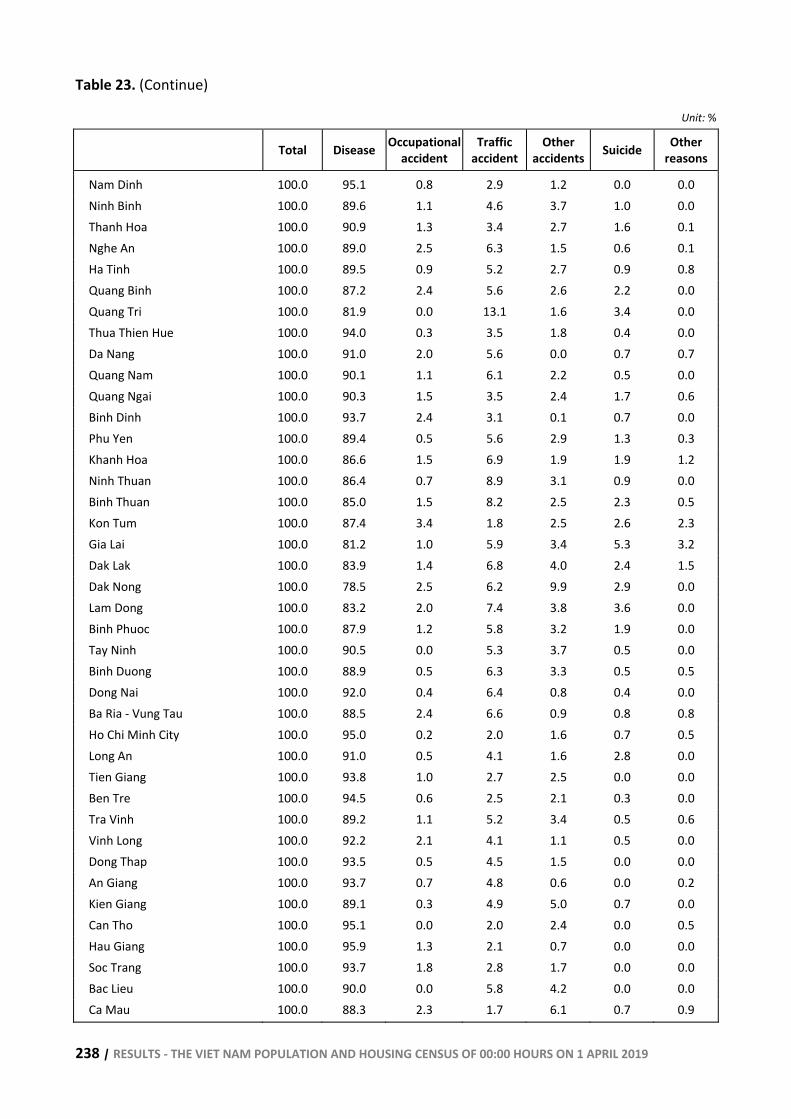
238 | RESULTS - THE VIET NAM POPULATION AND HOUSING CENSUS OF 00:00 HOURS ON 1 APRIL 2019
Table 23. (Continue)
Unit: %
Total Disease Occupational accident
Traffic accident
Other accidents Suicide Other
reasons
Nam Dinh 100.0 95.1 0.8 2.9 1.2 0.0 0.0 Ninh Binh 100.0 89.6 1.1 4.6 3.7 1.0 0.0 Thanh Hoa 100.0 90.9 1.3 3.4 2.7 1.6 0.1 Nghe An 100.0 89.0 2.5 6.3 1.5 0.6 0.1 Ha Tinh 100.0 89.5 0.9 5.2 2.7 0.9 0.8 Quang Binh 100.0 87.2 2.4 5.6 2.6 2.2 0.0 Quang Tri 100.0 81.9 0.0 13.1 1.6 3.4 0.0 Thua Thien Hue 100.0 94.0 0.3 3.5 1.8 0.4 0.0 Da Nang 100.0 91.0 2.0 5.6 0.0 0.7 0.7 Quang Nam 100.0 90.1 1.1 6.1 2.2 0.5 0.0 Quang Ngai 100.0 90.3 1.5 3.5 2.4 1.7 0.6 Binh Dinh 100.0 93.7 2.4 3.1 0.1 0.7 0.0 Phu Yen 100.0 89.4 0.5 5.6 2.9 1.3 0.3 Khanh Hoa 100.0 86.6 1.5 6.9 1.9 1.9 1.2 Ninh Thuan 100.0 86.4 0.7 8.9 3.1 0.9 0.0 Binh Thuan 100.0 85.0 1.5 8.2 2.5 2.3 0.5 Kon Tum 100.0 87.4 3.4 1.8 2.5 2.6 2.3 Gia Lai 100.0 81.2 1.0 5.9 3.4 5.3 3.2 Dak Lak 100.0 83.9 1.4 6.8 4.0 2.4 1.5 Dak Nong 100.0 78.5 2.5 6.2 9.9 2.9 0.0 Lam Dong 100.0 83.2 2.0 7.4 3.8 3.6 0.0 Binh Phuoc 100.0 87.9 1.2 5.8 3.2 1.9 0.0 Tay Ninh 100.0 90.5 0.0 5.3 3.7 0.5 0.0 Binh Duong 100.0 88.9 0.5 6.3 3.3 0.5 0.5 Dong Nai 100.0 92.0 0.4 6.4 0.8 0.4 0.0 Ba Ria - Vung Tau 100.0 88.5 2.4 6.6 0.9 0.8 0.8 Ho Chi Minh City 100.0 95.0 0.2 2.0 1.6 0.7 0.5 Long An 100.0 91.0 0.5 4.1 1.6 2.8 0.0 Tien Giang 100.0 93.8 1.0 2.7 2.5 0.0 0.0 Ben Tre 100.0 94.5 0.6 2.5 2.1 0.3 0.0 Tra Vinh 100.0 89.2 1.1 5.2 3.4 0.5 0.6 Vinh Long 100.0 92.2 2.1 4.1 1.1 0.5 0.0 Dong Thap 100.0 93.5 0.5 4.5 1.5 0.0 0.0 An Giang 100.0 93.7 0.7 4.8 0.6 0.0 0.2 Kien Giang 100.0 89.1 0.3 4.9 5.0 0.7 0.0 Can Tho 100.0 95.1 0.0 2.0 2.4 0.0 0.5 Hau Giang 100.0 95.9 1.3 2.1 0.7 0.0 0.0 Soc Trang 100.0 93.7 1.8 2.8 1.7 0.0 0.0 Bac Lieu 100.0 90.0 0.0 5.8 4.2 0.0 0.0 Ca Mau 100.0 88.3 2.3 1.7 6.1 0.7 0.9
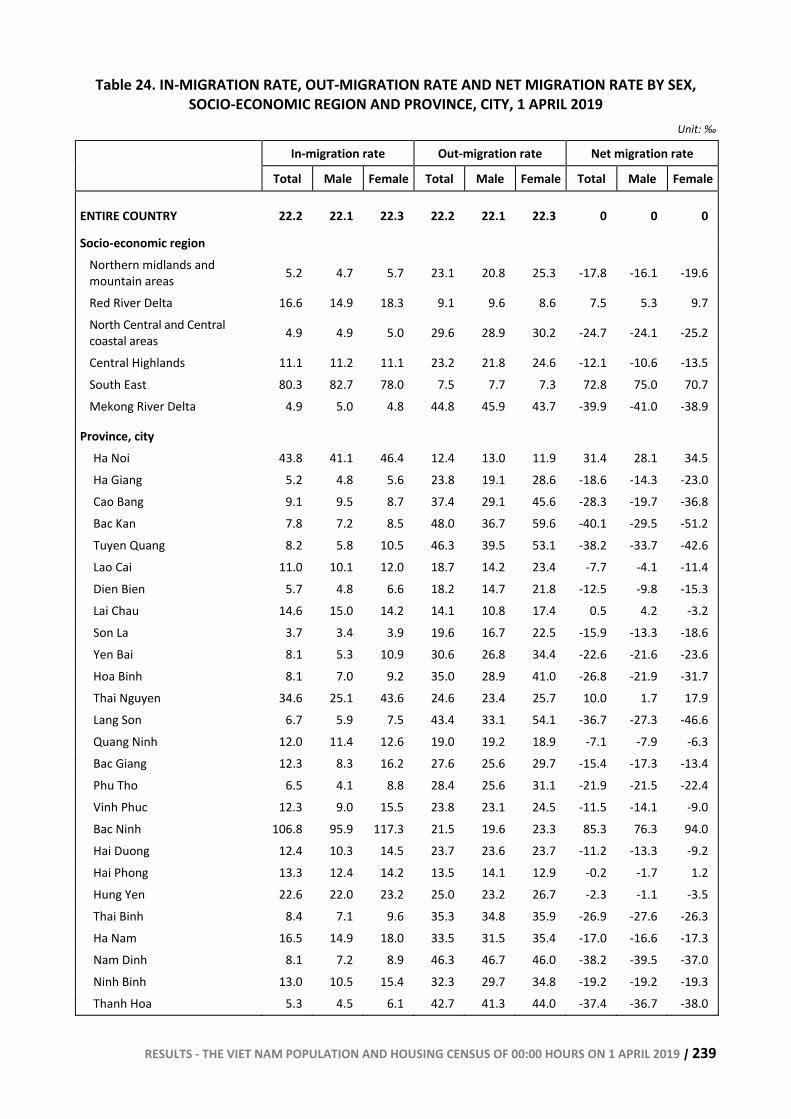
RESULTS - THE VIET NAM POPULATION AND HOUSING CENSUS OF 00:00 HOURS ON 1 APRIL 2019 | 239
Table 24. IN-MIGRATION RATE, OUT-MIGRATION RATE AND NET MIGRATION RATE BY SEX, SOCIO-ECONOMIC REGION AND PROVINCE, CITY, 1 APRIL 2019
Unit: ‰
In-migration rate Out-migration rate Net migration rate
Total Male Female Total Male Female Total Male Female
ENTIRE COUNTRY 22.2 22.1 22.3 22.2 22.1 22.3 0 0 0
Socio-economic region Northern midlands and mountain areas 5.2 4.7 5.7 23.1 20.8 25.3 -17.8 -16.1 -19.6
Red River Delta 16.6 14.9 18.3 9.1 9.6 8.6 7.5 5.3 9.7 North Central and Central coastal areas 4.9 4.9 5.0 29.6 28.9 30.2 -24.7 -24.1 -25.2
Central Highlands 11.1 11.2 11.1 23.2 21.8 24.6 -12.1 -10.6 -13.5 South East 80.3 82.7 78.0 7.5 7.7 7.3 72.8 75.0 70.7 Mekong River Delta 4.9 5.0 4.8 44.8 45.9 43.7 -39.9 -41.0 -38.9
Province, city Ha Noi 43.8 41.1 46.4 12.4 13.0 11.9 31.4 28.1 34.5 Ha Giang 5.2 4.8 5.6 23.8 19.1 28.6 -18.6 -14.3 -23.0 Cao Bang 9.1 9.5 8.7 37.4 29.1 45.6 -28.3 -19.7 -36.8 Bac Kan 7.8 7.2 8.5 48.0 36.7 59.6 -40.1 -29.5 -51.2 Tuyen Quang 8.2 5.8 10.5 46.3 39.5 53.1 -38.2 -33.7 -42.6 Lao Cai 11.0 10.1 12.0 18.7 14.2 23.4 -7.7 -4.1 -11.4 Dien Bien 5.7 4.8 6.6 18.2 14.7 21.8 -12.5 -9.8 -15.3 Lai Chau 14.6 15.0 14.2 14.1 10.8 17.4 0.5 4.2 -3.2 Son La 3.7 3.4 3.9 19.6 16.7 22.5 -15.9 -13.3 -18.6 Yen Bai 8.1 5.3 10.9 30.6 26.8 34.4 -22.6 -21.6 -23.6 Hoa Binh 8.1 7.0 9.2 35.0 28.9 41.0 -26.8 -21.9 -31.7 Thai Nguyen 34.6 25.1 43.6 24.6 23.4 25.7 10.0 1.7 17.9 Lang Son 6.7 5.9 7.5 43.4 33.1 54.1 -36.7 -27.3 -46.6 Quang Ninh 12.0 11.4 12.6 19.0 19.2 18.9 -7.1 -7.9 -6.3 Bac Giang 12.3 8.3 16.2 27.6 25.6 29.7 -15.4 -17.3 -13.4 Phu Tho 6.5 4.1 8.8 28.4 25.6 31.1 -21.9 -21.5 -22.4 Vinh Phuc 12.3 9.0 15.5 23.8 23.1 24.5 -11.5 -14.1 -9.0 Bac Ninh 106.8 95.9 117.3 21.5 19.6 23.3 85.3 76.3 94.0 Hai Duong 12.4 10.3 14.5 23.7 23.6 23.7 -11.2 -13.3 -9.2 Hai Phong 13.3 12.4 14.2 13.5 14.1 12.9 -0.2 -1.7 1.2 Hung Yen 22.6 22.0 23.2 25.0 23.2 26.7 -2.3 -1.1 -3.5 Thai Binh 8.4 7.1 9.6 35.3 34.8 35.9 -26.9 -27.6 -26.3 Ha Nam 16.5 14.9 18.0 33.5 31.5 35.4 -17.0 -16.6 -17.3 Nam Dinh 8.1 7.2 8.9 46.3 46.7 46.0 -38.2 -39.5 -37.0 Ninh Binh 13.0 10.5 15.4 32.3 29.7 34.8 -19.2 -19.2 -19.3 Thanh Hoa 5.3 4.5 6.1 42.7 41.3 44.0 -37.4 -36.7 -38.0
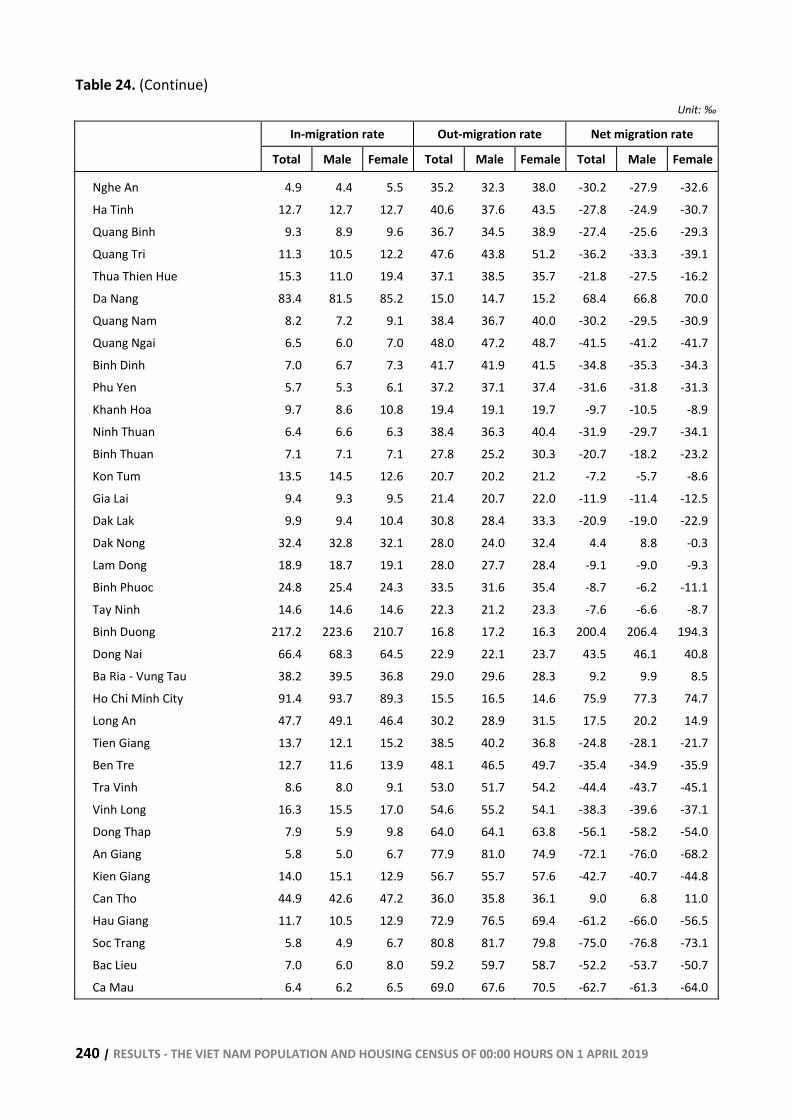
240 | RESULTS - THE VIET NAM POPULATION AND HOUSING CENSUS OF 00:00 HOURS ON 1 APRIL 2019
Table 24. (Continue) Unit: ‰
In-migration rate Out-migration rate Net migration rate
Total Male Female Total Male Female Total Male Female
Nghe An 4.9 4.4 5.5 35.2 32.3 38.0 -30.2 -27.9 -32.6 Ha Tinh 12.7 12.7 12.7 40.6 37.6 43.5 -27.8 -24.9 -30.7 Quang Binh 9.3 8.9 9.6 36.7 34.5 38.9 -27.4 -25.6 -29.3 Quang Tri 11.3 10.5 12.2 47.6 43.8 51.2 -36.2 -33.3 -39.1 Thua Thien Hue 15.3 11.0 19.4 37.1 38.5 35.7 -21.8 -27.5 -16.2 Da Nang 83.4 81.5 85.2 15.0 14.7 15.2 68.4 66.8 70.0 Quang Nam 8.2 7.2 9.1 38.4 36.7 40.0 -30.2 -29.5 -30.9 Quang Ngai 6.5 6.0 7.0 48.0 47.2 48.7 -41.5 -41.2 -41.7 Binh Dinh 7.0 6.7 7.3 41.7 41.9 41.5 -34.8 -35.3 -34.3 Phu Yen 5.7 5.3 6.1 37.2 37.1 37.4 -31.6 -31.8 -31.3 Khanh Hoa 9.7 8.6 10.8 19.4 19.1 19.7 -9.7 -10.5 -8.9 Ninh Thuan 6.4 6.6 6.3 38.4 36.3 40.4 -31.9 -29.7 -34.1 Binh Thuan 7.1 7.1 7.1 27.8 25.2 30.3 -20.7 -18.2 -23.2 Kon Tum 13.5 14.5 12.6 20.7 20.2 21.2 -7.2 -5.7 -8.6 Gia Lai 9.4 9.3 9.5 21.4 20.7 22.0 -11.9 -11.4 -12.5 Dak Lak 9.9 9.4 10.4 30.8 28.4 33.3 -20.9 -19.0 -22.9 Dak Nong 32.4 32.8 32.1 28.0 24.0 32.4 4.4 8.8 -0.3 Lam Dong 18.9 18.7 19.1 28.0 27.7 28.4 -9.1 -9.0 -9.3 Binh Phuoc 24.8 25.4 24.3 33.5 31.6 35.4 -8.7 -6.2 -11.1 Tay Ninh 14.6 14.6 14.6 22.3 21.2 23.3 -7.6 -6.6 -8.7 Binh Duong 217.2 223.6 210.7 16.8 17.2 16.3 200.4 206.4 194.3 Dong Nai 66.4 68.3 64.5 22.9 22.1 23.7 43.5 46.1 40.8 Ba Ria - Vung Tau 38.2 39.5 36.8 29.0 29.6 28.3 9.2 9.9 8.5 Ho Chi Minh City 91.4 93.7 89.3 15.5 16.5 14.6 75.9 77.3 74.7 Long An 47.7 49.1 46.4 30.2 28.9 31.5 17.5 20.2 14.9 Tien Giang 13.7 12.1 15.2 38.5 40.2 36.8 -24.8 -28.1 -21.7 Ben Tre 12.7 11.6 13.9 48.1 46.5 49.7 -35.4 -34.9 -35.9 Tra Vinh 8.6 8.0 9.1 53.0 51.7 54.2 -44.4 -43.7 -45.1 Vinh Long 16.3 15.5 17.0 54.6 55.2 54.1 -38.3 -39.6 -37.1 Dong Thap 7.9 5.9 9.8 64.0 64.1 63.8 -56.1 -58.2 -54.0 An Giang 5.8 5.0 6.7 77.9 81.0 74.9 -72.1 -76.0 -68.2 Kien Giang 14.0 15.1 12.9 56.7 55.7 57.6 -42.7 -40.7 -44.8 Can Tho 44.9 42.6 47.2 36.0 35.8 36.1 9.0 6.8 11.0 Hau Giang 11.7 10.5 12.9 72.9 76.5 69.4 -61.2 -66.0 -56.5 Soc Trang 5.8 4.9 6.7 80.8 81.7 79.8 -75.0 -76.8 -73.1 Bac Lieu 7.0 6.0 8.0 59.2 59.7 58.7 -52.2 -53.7 -50.7 Ca Mau 6.4 6.2 6.5 69.0 67.6 70.5 -62.7 -61.3 -64.0
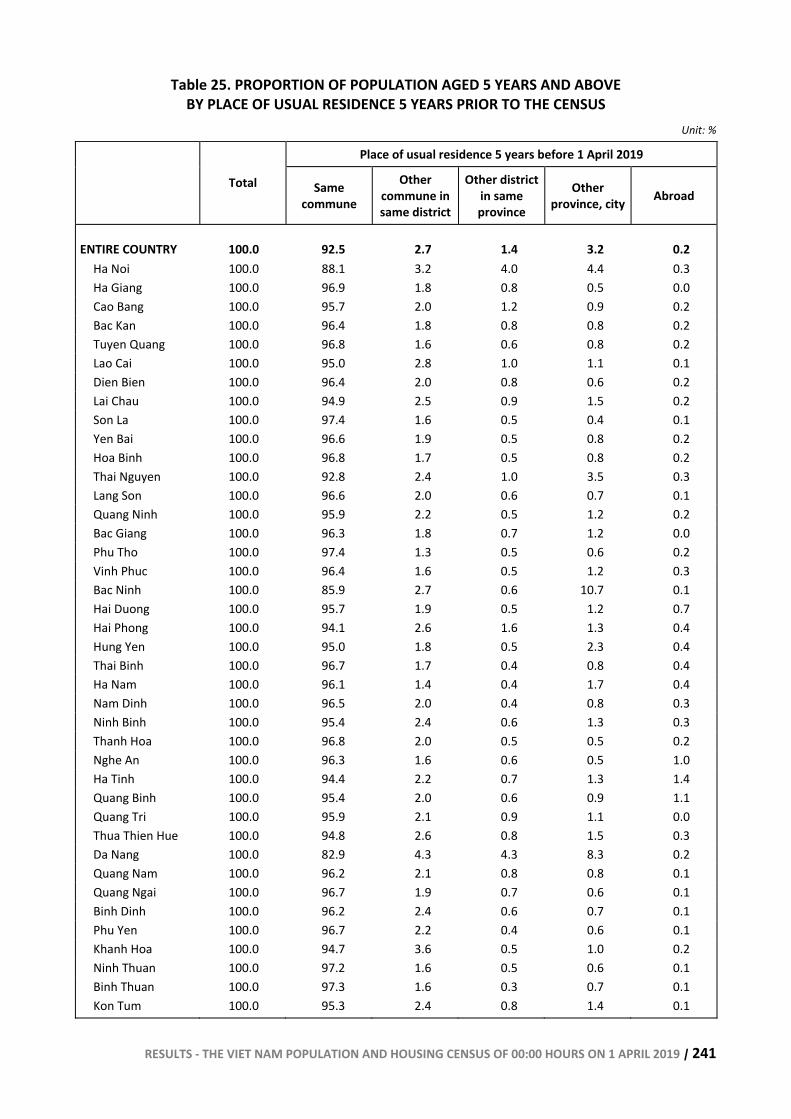
RESULTS - THE VIET NAM POPULATION AND HOUSING CENSUS OF 00:00 HOURS ON 1 APRIL 2019 | 241
Table 25. PROPORTION OF POPULATION AGED 5 YEARS AND ABOVE BY PLACE OF USUAL RESIDENCE 5 YEARS PRIOR TO THE CENSUS
Unit: %
Place of usual residence 5 years before 1 April 2019
Total Same commune
Other commune in same district
Other district in same province
Other province, city Abroad
ENTIRE COUNTRY 100.0 92.5 2.7 1.4 3.2 0.2 Ha Noi 100.0 88.1 3.2 4.0 4.4 0.3 Ha Giang 100.0 96.9 1.8 0.8 0.5 0.0 Cao Bang 100.0 95.7 2.0 1.2 0.9 0.2 Bac Kan 100.0 96.4 1.8 0.8 0.8 0.2 Tuyen Quang 100.0 96.8 1.6 0.6 0.8 0.2 Lao Cai 100.0 95.0 2.8 1.0 1.1 0.1 Dien Bien 100.0 96.4 2.0 0.8 0.6 0.2 Lai Chau 100.0 94.9 2.5 0.9 1.5 0.2 Son La 100.0 97.4 1.6 0.5 0.4 0.1 Yen Bai 100.0 96.6 1.9 0.5 0.8 0.2 Hoa Binh 100.0 96.8 1.7 0.5 0.8 0.2 Thai Nguyen 100.0 92.8 2.4 1.0 3.5 0.3 Lang Son 100.0 96.6 2.0 0.6 0.7 0.1 Quang Ninh 100.0 95.9 2.2 0.5 1.2 0.2 Bac Giang 100.0 96.3 1.8 0.7 1.2 0.0 Phu Tho 100.0 97.4 1.3 0.5 0.6 0.2 Vinh Phuc 100.0 96.4 1.6 0.5 1.2 0.3 Bac Ninh 100.0 85.9 2.7 0.6 10.7 0.1 Hai Duong 100.0 95.7 1.9 0.5 1.2 0.7 Hai Phong 100.0 94.1 2.6 1.6 1.3 0.4 Hung Yen 100.0 95.0 1.8 0.5 2.3 0.4 Thai Binh 100.0 96.7 1.7 0.4 0.8 0.4 Ha Nam 100.0 96.1 1.4 0.4 1.7 0.4 Nam Dinh 100.0 96.5 2.0 0.4 0.8 0.3 Ninh Binh 100.0 95.4 2.4 0.6 1.3 0.3 Thanh Hoa 100.0 96.8 2.0 0.5 0.5 0.2 Nghe An 100.0 96.3 1.6 0.6 0.5 1.0 Ha Tinh 100.0 94.4 2.2 0.7 1.3 1.4 Quang Binh 100.0 95.4 2.0 0.6 0.9 1.1 Quang Tri 100.0 95.9 2.1 0.9 1.1 0.0 Thua Thien Hue 100.0 94.8 2.6 0.8 1.5 0.3 Da Nang 100.0 82.9 4.3 4.3 8.3 0.2 Quang Nam 100.0 96.2 2.1 0.8 0.8 0.1 Quang Ngai 100.0 96.7 1.9 0.7 0.6 0.1 Binh Dinh 100.0 96.2 2.4 0.6 0.7 0.1 Phu Yen 100.0 96.7 2.2 0.4 0.6 0.1 Khanh Hoa 100.0 94.7 3.6 0.5 1.0 0.2 Ninh Thuan 100.0 97.2 1.6 0.5 0.6 0.1 Binh Thuan 100.0 97.3 1.6 0.3 0.7 0.1 Kon Tum 100.0 95.3 2.4 0.8 1.4 0.1
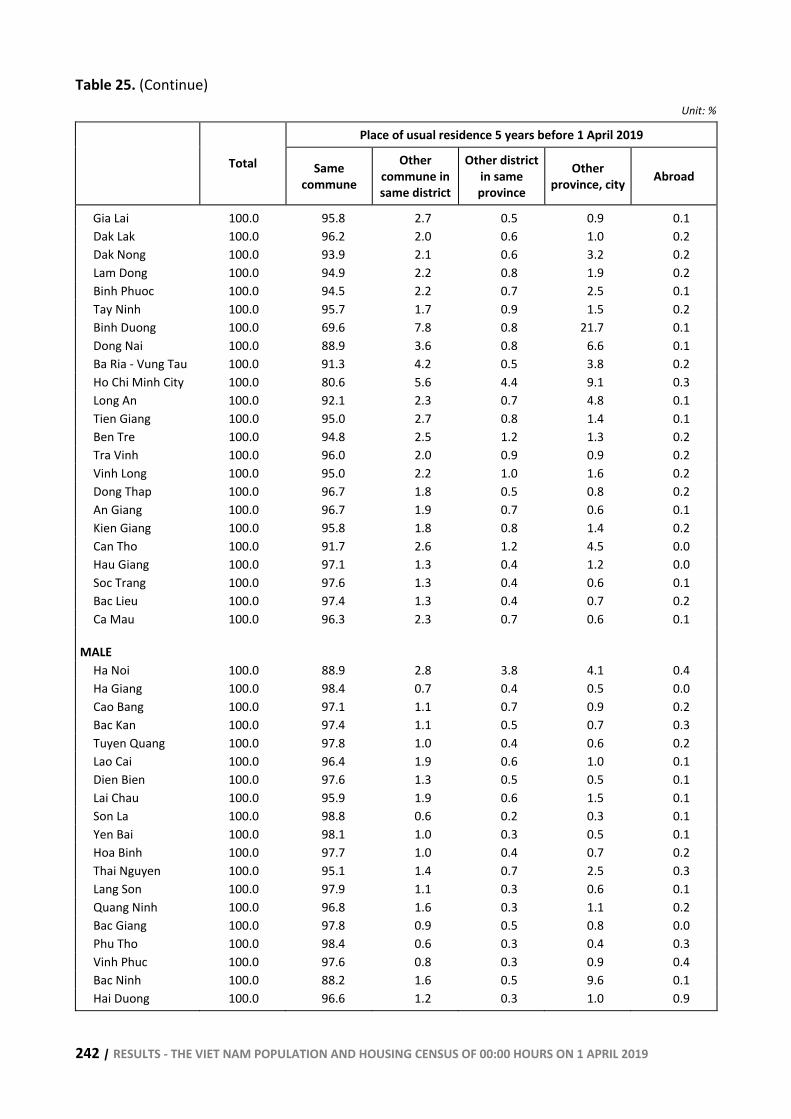
242 | RESULTS - THE VIET NAM POPULATION AND HOUSING CENSUS OF 00:00 HOURS ON 1 APRIL 2019
Table 25. (Continue)
Unit: %
Place of usual residence 5 years before 1 April 2019
Total Same commune
Other commune in same district
Other district in same province
Other province, city Abroad
Gia Lai 100.0 95.8 2.7 0.5 0.9 0.1 Dak Lak 100.0 96.2 2.0 0.6 1.0 0.2 Dak Nong 100.0 93.9 2.1 0.6 3.2 0.2 Lam Dong 100.0 94.9 2.2 0.8 1.9 0.2 Binh Phuoc 100.0 94.5 2.2 0.7 2.5 0.1 Tay Ninh 100.0 95.7 1.7 0.9 1.5 0.2 Binh Duong 100.0 69.6 7.8 0.8 21.7 0.1 Dong Nai 100.0 88.9 3.6 0.8 6.6 0.1 Ba Ria - Vung Tau 100.0 91.3 4.2 0.5 3.8 0.2 Ho Chi Minh City 100.0 80.6 5.6 4.4 9.1 0.3 Long An 100.0 92.1 2.3 0.7 4.8 0.1 Tien Giang 100.0 95.0 2.7 0.8 1.4 0.1 Ben Tre 100.0 94.8 2.5 1.2 1.3 0.2 Tra Vinh 100.0 96.0 2.0 0.9 0.9 0.2 Vinh Long 100.0 95.0 2.2 1.0 1.6 0.2 Dong Thap 100.0 96.7 1.8 0.5 0.8 0.2 An Giang 100.0 96.7 1.9 0.7 0.6 0.1 Kien Giang 100.0 95.8 1.8 0.8 1.4 0.2 Can Tho 100.0 91.7 2.6 1.2 4.5 0.0 Hau Giang 100.0 97.1 1.3 0.4 1.2 0.0 Soc Trang 100.0 97.6 1.3 0.4 0.6 0.1 Bac Lieu 100.0 97.4 1.3 0.4 0.7 0.2 Ca Mau 100.0 96.3 2.3 0.7 0.6 0.1
MALE Ha Noi 100.0 88.9 2.8 3.8 4.1 0.4 Ha Giang 100.0 98.4 0.7 0.4 0.5 0.0 Cao Bang 100.0 97.1 1.1 0.7 0.9 0.2 Bac Kan 100.0 97.4 1.1 0.5 0.7 0.3 Tuyen Quang 100.0 97.8 1.0 0.4 0.6 0.2 Lao Cai 100.0 96.4 1.9 0.6 1.0 0.1 Dien Bien 100.0 97.6 1.3 0.5 0.5 0.1 Lai Chau 100.0 95.9 1.9 0.6 1.5 0.1 Son La 100.0 98.8 0.6 0.2 0.3 0.1 Yen Bai 100.0 98.1 1.0 0.3 0.5 0.1 Hoa Binh 100.0 97.7 1.0 0.4 0.7 0.2 Thai Nguyen 100.0 95.1 1.4 0.7 2.5 0.3 Lang Son 100.0 97.9 1.1 0.3 0.6 0.1 Quang Ninh 100.0 96.8 1.6 0.3 1.1 0.2 Bac Giang 100.0 97.8 0.9 0.5 0.8 0.0 Phu Tho 100.0 98.4 0.6 0.3 0.4 0.3 Vinh Phuc 100.0 97.6 0.8 0.3 0.9 0.4 Bac Ninh 100.0 88.2 1.6 0.5 9.6 0.1 Hai Duong 100.0 96.6 1.2 0.3 1.0 0.9
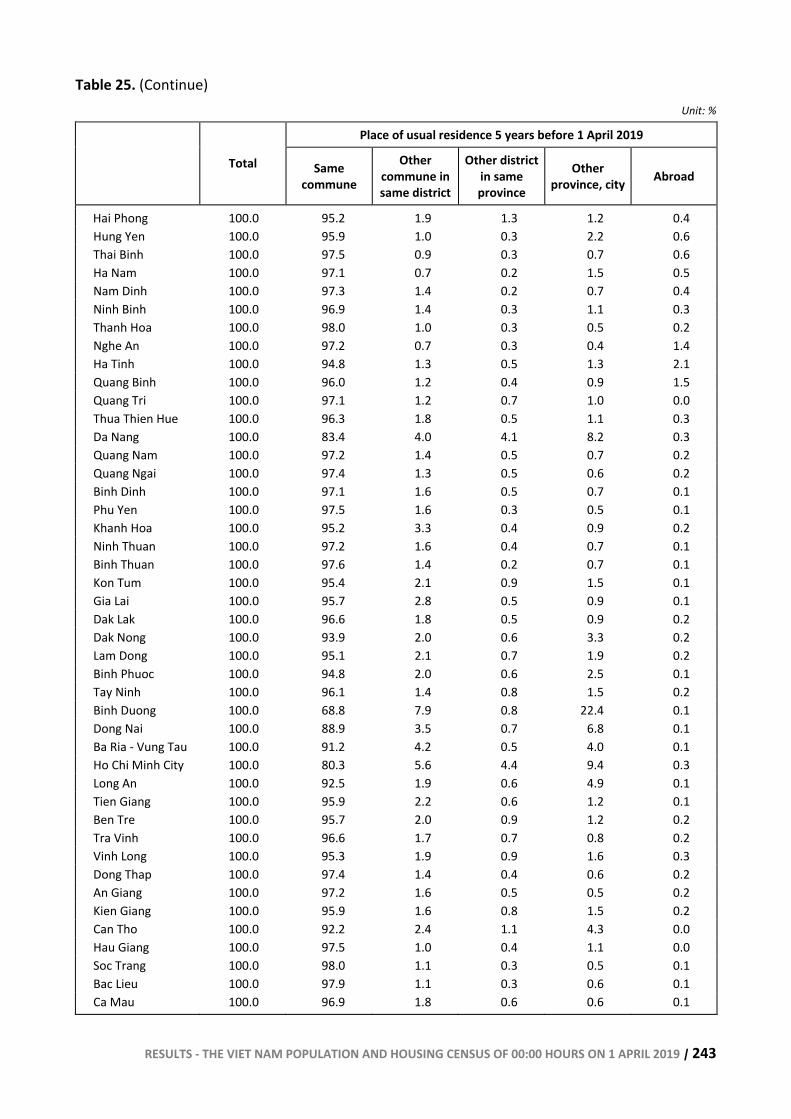
RESULTS - THE VIET NAM POPULATION AND HOUSING CENSUS OF 00:00 HOURS ON 1 APRIL 2019 | 243
Table 25. (Continue)
Unit: %
Place of usual residence 5 years before 1 April 2019
Total Same commune
Other commune in same district
Other district in same province
Other province, city Abroad
Hai Phong 100.0 95.2 1.9 1.3 1.2 0.4 Hung Yen 100.0 95.9 1.0 0.3 2.2 0.6 Thai Binh 100.0 97.5 0.9 0.3 0.7 0.6 Ha Nam 100.0 97.1 0.7 0.2 1.5 0.5 Nam Dinh 100.0 97.3 1.4 0.2 0.7 0.4 Ninh Binh 100.0 96.9 1.4 0.3 1.1 0.3 Thanh Hoa 100.0 98.0 1.0 0.3 0.5 0.2 Nghe An 100.0 97.2 0.7 0.3 0.4 1.4 Ha Tinh 100.0 94.8 1.3 0.5 1.3 2.1 Quang Binh 100.0 96.0 1.2 0.4 0.9 1.5 Quang Tri 100.0 97.1 1.2 0.7 1.0 0.0 Thua Thien Hue 100.0 96.3 1.8 0.5 1.1 0.3 Da Nang 100.0 83.4 4.0 4.1 8.2 0.3 Quang Nam 100.0 97.2 1.4 0.5 0.7 0.2 Quang Ngai 100.0 97.4 1.3 0.5 0.6 0.2 Binh Dinh 100.0 97.1 1.6 0.5 0.7 0.1 Phu Yen 100.0 97.5 1.6 0.3 0.5 0.1 Khanh Hoa 100.0 95.2 3.3 0.4 0.9 0.2 Ninh Thuan 100.0 97.2 1.6 0.4 0.7 0.1 Binh Thuan 100.0 97.6 1.4 0.2 0.7 0.1 Kon Tum 100.0 95.4 2.1 0.9 1.5 0.1 Gia Lai 100.0 95.7 2.8 0.5 0.9 0.1 Dak Lak 100.0 96.6 1.8 0.5 0.9 0.2 Dak Nong 100.0 93.9 2.0 0.6 3.3 0.2 Lam Dong 100.0 95.1 2.1 0.7 1.9 0.2 Binh Phuoc 100.0 94.8 2.0 0.6 2.5 0.1 Tay Ninh 100.0 96.1 1.4 0.8 1.5 0.2 Binh Duong 100.0 68.8 7.9 0.8 22.4 0.1 Dong Nai 100.0 88.9 3.5 0.7 6.8 0.1 Ba Ria - Vung Tau 100.0 91.2 4.2 0.5 4.0 0.1 Ho Chi Minh City 100.0 80.3 5.6 4.4 9.4 0.3 Long An 100.0 92.5 1.9 0.6 4.9 0.1 Tien Giang 100.0 95.9 2.2 0.6 1.2 0.1 Ben Tre 100.0 95.7 2.0 0.9 1.2 0.2 Tra Vinh 100.0 96.6 1.7 0.7 0.8 0.2 Vinh Long 100.0 95.3 1.9 0.9 1.6 0.3 Dong Thap 100.0 97.4 1.4 0.4 0.6 0.2 An Giang 100.0 97.2 1.6 0.5 0.5 0.2 Kien Giang 100.0 95.9 1.6 0.8 1.5 0.2 Can Tho 100.0 92.2 2.4 1.1 4.3 0.0 Hau Giang 100.0 97.5 1.0 0.4 1.1 0.0 Soc Trang 100.0 98.0 1.1 0.3 0.5 0.1 Bac Lieu 100.0 97.9 1.1 0.3 0.6 0.1 Ca Mau 100.0 96.9 1.8 0.6 0.6 0.1
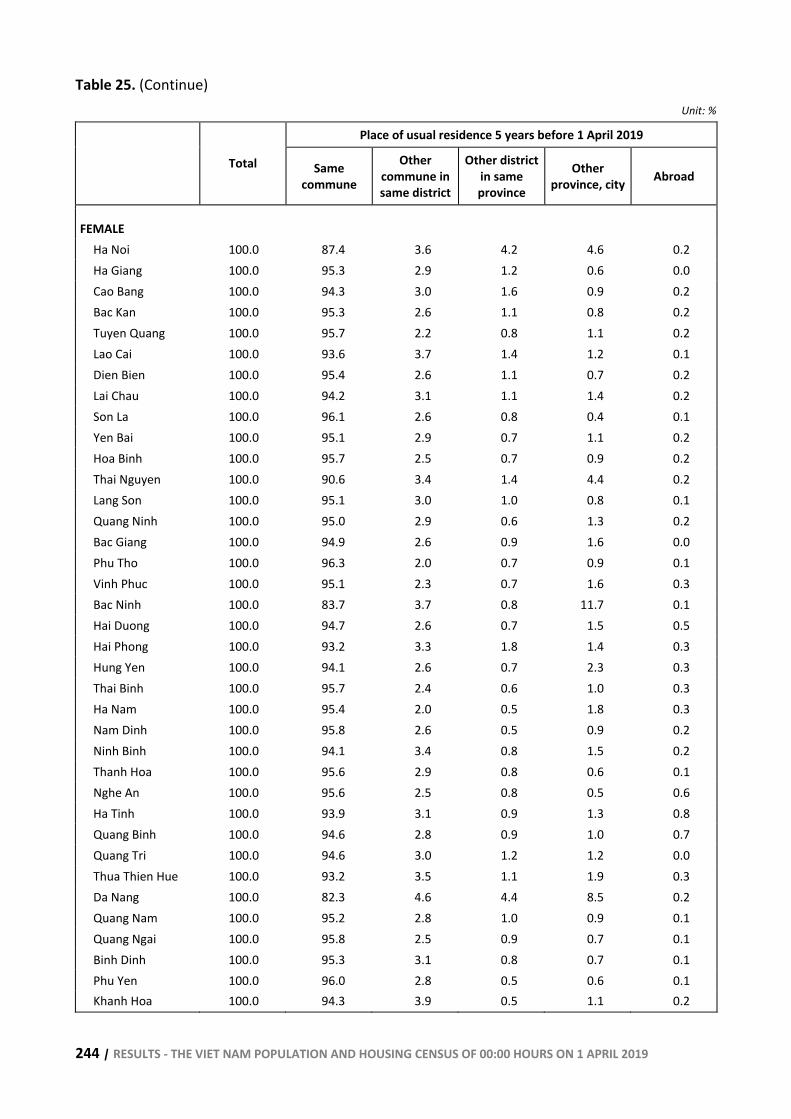
244 | RESULTS - THE VIET NAM POPULATION AND HOUSING CENSUS OF 00:00 HOURS ON 1 APRIL 2019
Table 25. (Continue)
Unit: %
Place of usual residence 5 years before 1 April 2019
Total Same commune
Other commune in same district
Other district in same province
Other province, city Abroad
FEMALE Ha Noi 100.0 87.4 3.6 4.2 4.6 0.2 Ha Giang 100.0 95.3 2.9 1.2 0.6 0.0 Cao Bang 100.0 94.3 3.0 1.6 0.9 0.2 Bac Kan 100.0 95.3 2.6 1.1 0.8 0.2 Tuyen Quang 100.0 95.7 2.2 0.8 1.1 0.2 Lao Cai 100.0 93.6 3.7 1.4 1.2 0.1 Dien Bien 100.0 95.4 2.6 1.1 0.7 0.2 Lai Chau 100.0 94.2 3.1 1.1 1.4 0.2 Son La 100.0 96.1 2.6 0.8 0.4 0.1 Yen Bai 100.0 95.1 2.9 0.7 1.1 0.2 Hoa Binh 100.0 95.7 2.5 0.7 0.9 0.2 Thai Nguyen 100.0 90.6 3.4 1.4 4.4 0.2 Lang Son 100.0 95.1 3.0 1.0 0.8 0.1 Quang Ninh 100.0 95.0 2.9 0.6 1.3 0.2 Bac Giang 100.0 94.9 2.6 0.9 1.6 0.0 Phu Tho 100.0 96.3 2.0 0.7 0.9 0.1 Vinh Phuc 100.0 95.1 2.3 0.7 1.6 0.3 Bac Ninh 100.0 83.7 3.7 0.8 11.7 0.1 Hai Duong 100.0 94.7 2.6 0.7 1.5 0.5 Hai Phong 100.0 93.2 3.3 1.8 1.4 0.3 Hung Yen 100.0 94.1 2.6 0.7 2.3 0.3 Thai Binh 100.0 95.7 2.4 0.6 1.0 0.3 Ha Nam 100.0 95.4 2.0 0.5 1.8 0.3 Nam Dinh 100.0 95.8 2.6 0.5 0.9 0.2 Ninh Binh 100.0 94.1 3.4 0.8 1.5 0.2 Thanh Hoa 100.0 95.6 2.9 0.8 0.6 0.1 Nghe An 100.0 95.6 2.5 0.8 0.5 0.6 Ha Tinh 100.0 93.9 3.1 0.9 1.3 0.8 Quang Binh 100.0 94.6 2.8 0.9 1.0 0.7 Quang Tri 100.0 94.6 3.0 1.2 1.2 0.0 Thua Thien Hue 100.0 93.2 3.5 1.1 1.9 0.3 Da Nang 100.0 82.3 4.6 4.4 8.5 0.2 Quang Nam 100.0 95.2 2.8 1.0 0.9 0.1 Quang Ngai 100.0 95.8 2.5 0.9 0.7 0.1 Binh Dinh 100.0 95.3 3.1 0.8 0.7 0.1 Phu Yen 100.0 96.0 2.8 0.5 0.6 0.1 Khanh Hoa 100.0 94.3 3.9 0.5 1.1 0.2
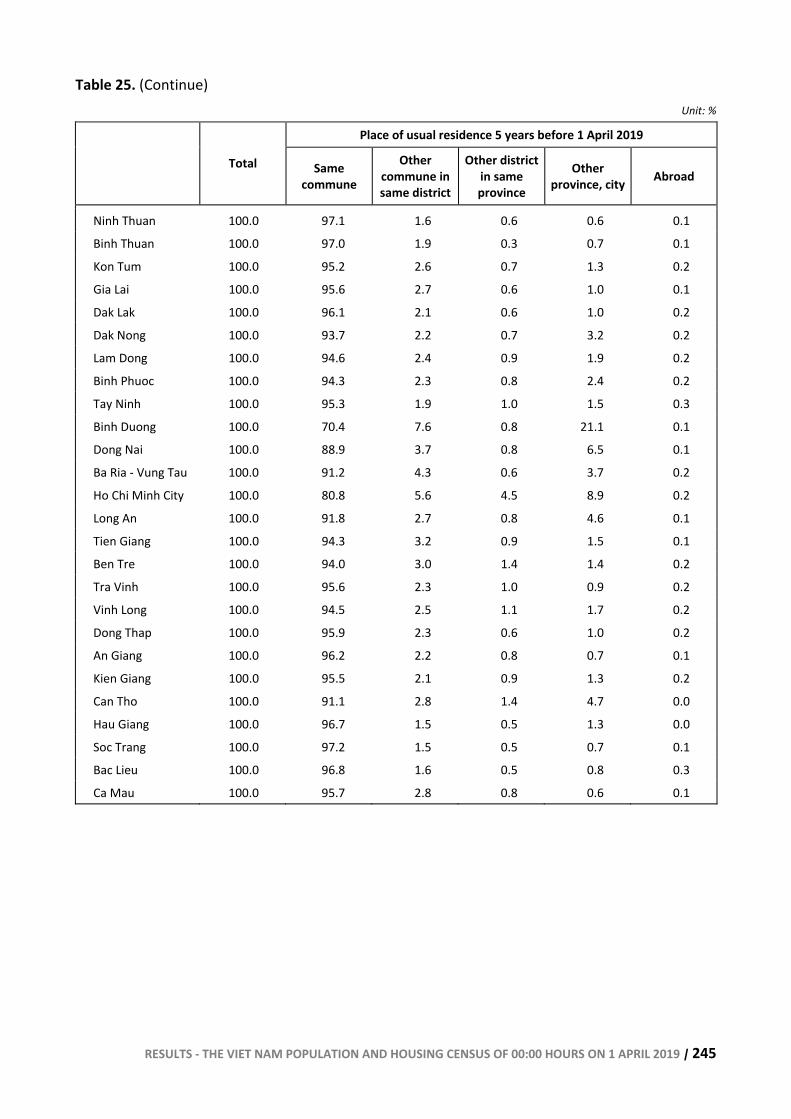
RESULTS - THE VIET NAM POPULATION AND HOUSING CENSUS OF 00:00 HOURS ON 1 APRIL 2019 | 245
Table 25. (Continue)
Unit: %
Place of usual residence 5 years before 1 April 2019
Total Same commune
Other commune in same district
Other district in same province
Other province, city Abroad
Ninh Thuan 100.0 97.1 1.6 0.6 0.6 0.1
Binh Thuan 100.0 97.0 1.9 0.3 0.7 0.1
Kon Tum 100.0 95.2 2.6 0.7 1.3 0.2
Gia Lai 100.0 95.6 2.7 0.6 1.0 0.1
Dak Lak 100.0 96.1 2.1 0.6 1.0 0.2
Dak Nong 100.0 93.7 2.2 0.7 3.2 0.2
Lam Dong 100.0 94.6 2.4 0.9 1.9 0.2
Binh Phuoc 100.0 94.3 2.3 0.8 2.4 0.2
Tay Ninh 100.0 95.3 1.9 1.0 1.5 0.3
Binh Duong 100.0 70.4 7.6 0.8 21.1 0.1
Dong Nai 100.0 88.9 3.7 0.8 6.5 0.1
Ba Ria - Vung Tau 100.0 91.2 4.3 0.6 3.7 0.2
Ho Chi Minh City 100.0 80.8 5.6 4.5 8.9 0.2
Long An 100.0 91.8 2.7 0.8 4.6 0.1
Tien Giang 100.0 94.3 3.2 0.9 1.5 0.1
Ben Tre 100.0 94.0 3.0 1.4 1.4 0.2
Tra Vinh 100.0 95.6 2.3 1.0 0.9 0.2
Vinh Long 100.0 94.5 2.5 1.1 1.7 0.2
Dong Thap 100.0 95.9 2.3 0.6 1.0 0.2
An Giang 100.0 96.2 2.2 0.8 0.7 0.1
Kien Giang 100.0 95.5 2.1 0.9 1.3 0.2
Can Tho 100.0 91.1 2.8 1.4 4.7 0.0
Hau Giang 100.0 96.7 1.5 0.5 1.3 0.0
Soc Trang 100.0 97.2 1.5 0.5 0.7 0.1
Bac Lieu 100.0 96.8 1.6 0.5 0.8 0.3
Ca Mau 100.0 95.7 2.8 0.8 0.6 0.1
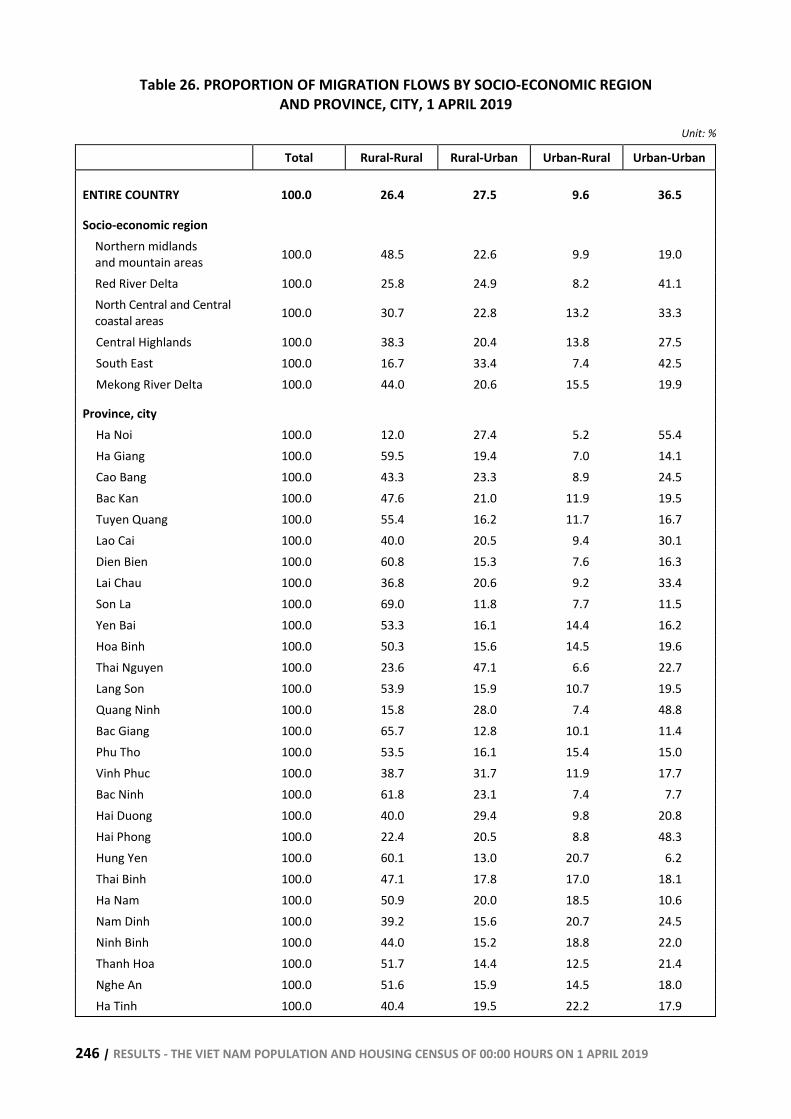
246 | RESULTS - THE VIET NAM POPULATION AND HOUSING CENSUS OF 00:00 HOURS ON 1 APRIL 2019
Table 26. PROPORTION OF MIGRATION FLOWS BY SOCIO-ECONOMIC REGION AND PROVINCE, CITY, 1 APRIL 2019
Unit: %
Total Rural-Rural Rural-Urban Urban-Rural Urban-Urban
ENTIRE COUNTRY 100.0 26.4 27.5 9.6 36.5
Socio-economic region Northern midlands and mountain areas 100.0 48.5 22.6 9.9 19.0
Red River Delta 100.0 25.8 24.9 8.2 41.1 North Central and Central coastal areas 100.0 30.7 22.8 13.2 33.3
Central Highlands 100.0 38.3 20.4 13.8 27.5 South East 100.0 16.7 33.4 7.4 42.5 Mekong River Delta 100.0 44.0 20.6 15.5 19.9
Province, city Ha Noi 100.0 12.0 27.4 5.2 55.4 Ha Giang 100.0 59.5 19.4 7.0 14.1 Cao Bang 100.0 43.3 23.3 8.9 24.5 Bac Kan 100.0 47.6 21.0 11.9 19.5 Tuyen Quang 100.0 55.4 16.2 11.7 16.7 Lao Cai 100.0 40.0 20.5 9.4 30.1 Dien Bien 100.0 60.8 15.3 7.6 16.3 Lai Chau 100.0 36.8 20.6 9.2 33.4 Son La 100.0 69.0 11.8 7.7 11.5 Yen Bai 100.0 53.3 16.1 14.4 16.2 Hoa Binh 100.0 50.3 15.6 14.5 19.6 Thai Nguyen 100.0 23.6 47.1 6.6 22.7 Lang Son 100.0 53.9 15.9 10.7 19.5 Quang Ninh 100.0 15.8 28.0 7.4 48.8 Bac Giang 100.0 65.7 12.8 10.1 11.4 Phu Tho 100.0 53.5 16.1 15.4 15.0 Vinh Phuc 100.0 38.7 31.7 11.9 17.7 Bac Ninh 100.0 61.8 23.1 7.4 7.7 Hai Duong 100.0 40.0 29.4 9.8 20.8 Hai Phong 100.0 22.4 20.5 8.8 48.3 Hung Yen 100.0 60.1 13.0 20.7 6.2 Thai Binh 100.0 47.1 17.8 17.0 18.1 Ha Nam 100.0 50.9 20.0 18.5 10.6 Nam Dinh 100.0 39.2 15.6 20.7 24.5 Ninh Binh 100.0 44.0 15.2 18.8 22.0 Thanh Hoa 100.0 51.7 14.4 12.5 21.4 Nghe An 100.0 51.6 15.9 14.5 18.0 Ha Tinh 100.0 40.4 19.5 22.2 17.9
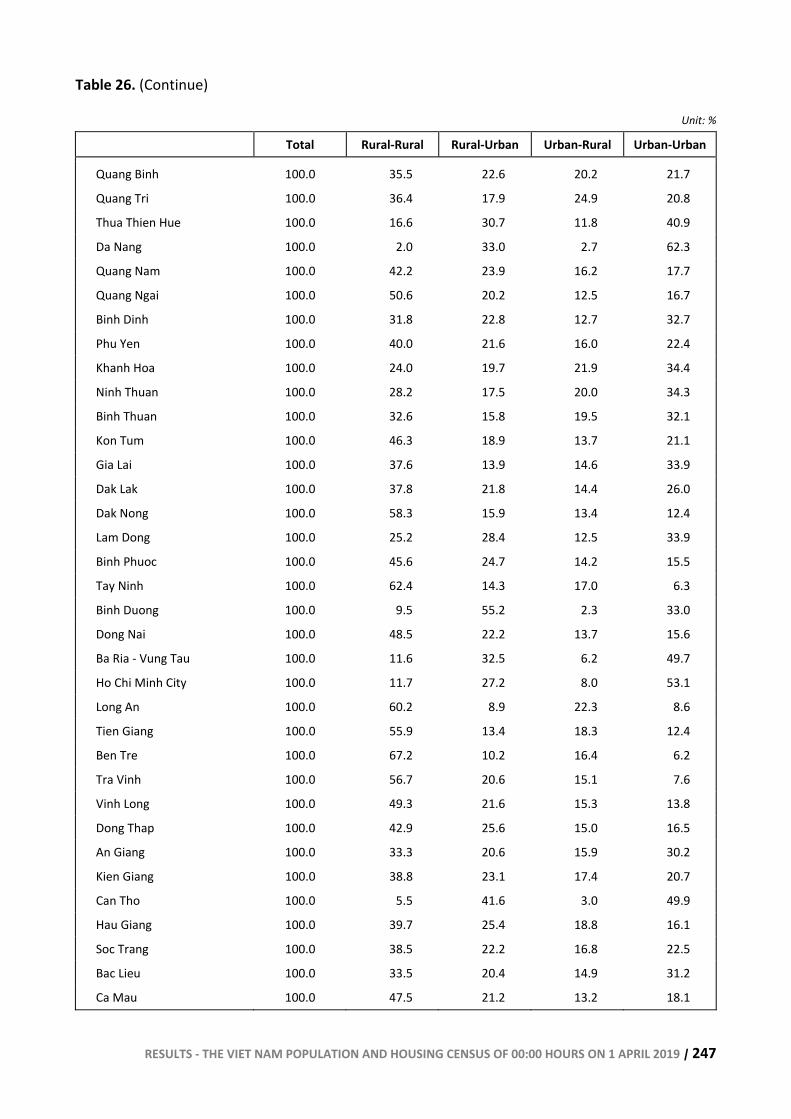
RESULTS - THE VIET NAM POPULATION AND HOUSING CENSUS OF 00:00 HOURS ON 1 APRIL 2019 | 247
Table 26. (Continue)
Unit: %
Total Rural-Rural Rural-Urban Urban-Rural Urban-Urban
Quang Binh 100.0 35.5 22.6 20.2 21.7
Quang Tri 100.0 36.4 17.9 24.9 20.8
Thua Thien Hue 100.0 16.6 30.7 11.8 40.9
Da Nang 100.0 2.0 33.0 2.7 62.3
Quang Nam 100.0 42.2 23.9 16.2 17.7
Quang Ngai 100.0 50.6 20.2 12.5 16.7
Binh Dinh 100.0 31.8 22.8 12.7 32.7
Phu Yen 100.0 40.0 21.6 16.0 22.4
Khanh Hoa 100.0 24.0 19.7 21.9 34.4
Ninh Thuan 100.0 28.2 17.5 20.0 34.3
Binh Thuan 100.0 32.6 15.8 19.5 32.1
Kon Tum 100.0 46.3 18.9 13.7 21.1
Gia Lai 100.0 37.6 13.9 14.6 33.9
Dak Lak 100.0 37.8 21.8 14.4 26.0
Dak Nong 100.0 58.3 15.9 13.4 12.4
Lam Dong 100.0 25.2 28.4 12.5 33.9
Binh Phuoc 100.0 45.6 24.7 14.2 15.5
Tay Ninh 100.0 62.4 14.3 17.0 6.3
Binh Duong 100.0 9.5 55.2 2.3 33.0
Dong Nai 100.0 48.5 22.2 13.7 15.6
Ba Ria - Vung Tau 100.0 11.6 32.5 6.2 49.7
Ho Chi Minh City 100.0 11.7 27.2 8.0 53.1
Long An 100.0 60.2 8.9 22.3 8.6
Tien Giang 100.0 55.9 13.4 18.3 12.4
Ben Tre 100.0 67.2 10.2 16.4 6.2
Tra Vinh 100.0 56.7 20.6 15.1 7.6
Vinh Long 100.0 49.3 21.6 15.3 13.8
Dong Thap 100.0 42.9 25.6 15.0 16.5
An Giang 100.0 33.3 20.6 15.9 30.2
Kien Giang 100.0 38.8 23.1 17.4 20.7
Can Tho 100.0 5.5 41.6 3.0 49.9
Hau Giang 100.0 39.7 25.4 18.8 16.1
Soc Trang 100.0 38.5 22.2 16.8 22.5
Bac Lieu 100.0 33.5 20.4 14.9 31.2
Ca Mau 100.0 47.5 21.2 13.2 18.1
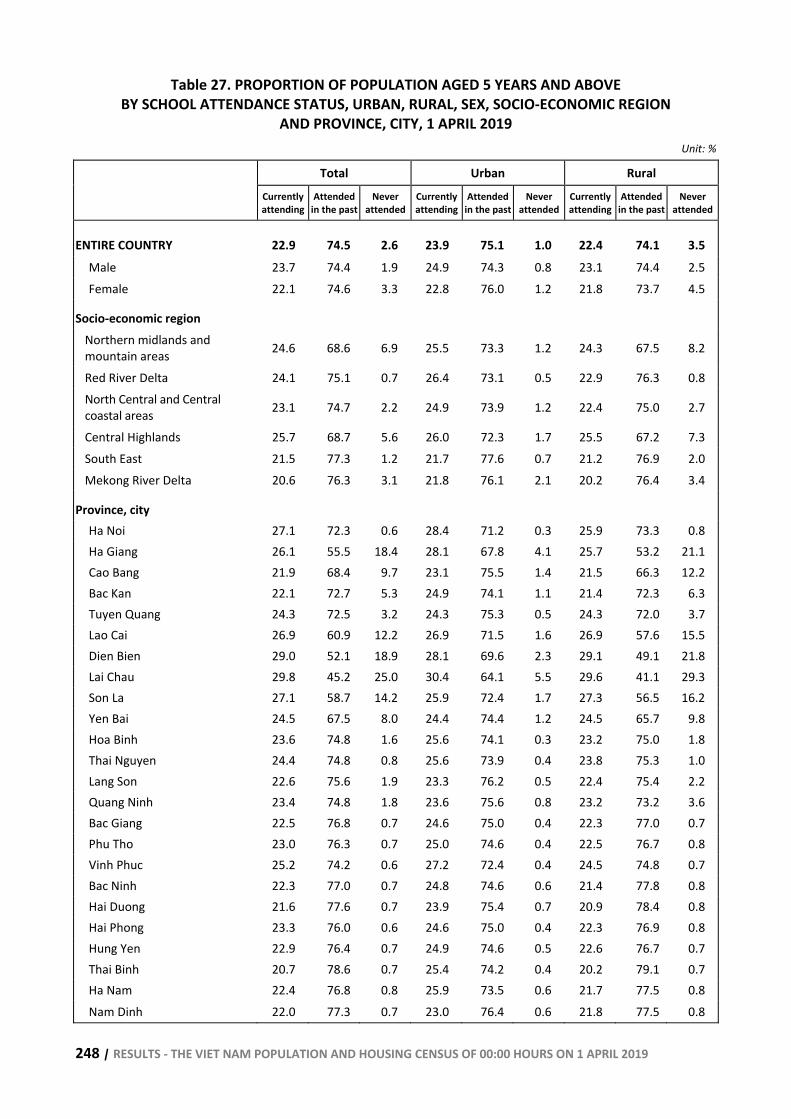
248 | RESULTS - THE VIET NAM POPULATION AND HOUSING CENSUS OF 00:00 HOURS ON 1 APRIL 2019
Table 27. PROPORTION OF POPULATION AGED 5 YEARS AND ABOVE BY SCHOOL ATTENDANCE STATUS, URBAN, RURAL, SEX, SOCIO-ECONOMIC REGION
AND PROVINCE, CITY, 1 APRIL 2019 Unit: %
Total Urban Rural Currently
attending Attended
in the pastNever
attendedCurrently attending
Attended in the past
Never attended
Currently attending
Attended in the past
Never attended
ENTIRE COUNTRY 22.9 74.5 2.6 23.9 75.1 1.0 22.4 74.1 3.5 Male 23.7 74.4 1.9 24.9 74.3 0.8 23.1 74.4 2.5 Female 22.1 74.6 3.3 22.8 76.0 1.2 21.8 73.7 4.5
Socio-economic region Northern midlands and mountain areas 24.6 68.6 6.9 25.5 73.3 1.2 24.3 67.5 8.2
Red River Delta 24.1 75.1 0.7 26.4 73.1 0.5 22.9 76.3 0.8 North Central and Central coastal areas 23.1 74.7 2.2 24.9 73.9 1.2 22.4 75.0 2.7
Central Highlands 25.7 68.7 5.6 26.0 72.3 1.7 25.5 67.2 7.3 South East 21.5 77.3 1.2 21.7 77.6 0.7 21.2 76.9 2.0 Mekong River Delta 20.6 76.3 3.1 21.8 76.1 2.1 20.2 76.4 3.4
Province, city Ha Noi 27.1 72.3 0.6 28.4 71.2 0.3 25.9 73.3 0.8 Ha Giang 26.1 55.5 18.4 28.1 67.8 4.1 25.7 53.2 21.1 Cao Bang 21.9 68.4 9.7 23.1 75.5 1.4 21.5 66.3 12.2 Bac Kan 22.1 72.7 5.3 24.9 74.1 1.1 21.4 72.3 6.3 Tuyen Quang 24.3 72.5 3.2 24.3 75.3 0.5 24.3 72.0 3.7 Lao Cai 26.9 60.9 12.2 26.9 71.5 1.6 26.9 57.6 15.5 Dien Bien 29.0 52.1 18.9 28.1 69.6 2.3 29.1 49.1 21.8 Lai Chau 29.8 45.2 25.0 30.4 64.1 5.5 29.6 41.1 29.3 Son La 27.1 58.7 14.2 25.9 72.4 1.7 27.3 56.5 16.2 Yen Bai 24.5 67.5 8.0 24.4 74.4 1.2 24.5 65.7 9.8 Hoa Binh 23.6 74.8 1.6 25.6 74.1 0.3 23.2 75.0 1.8 Thai Nguyen 24.4 74.8 0.8 25.6 73.9 0.4 23.8 75.3 1.0 Lang Son 22.6 75.6 1.9 23.3 76.2 0.5 22.4 75.4 2.2 Quang Ninh 23.4 74.8 1.8 23.6 75.6 0.8 23.2 73.2 3.6 Bac Giang 22.5 76.8 0.7 24.6 75.0 0.4 22.3 77.0 0.7 Phu Tho 23.0 76.3 0.7 25.0 74.6 0.4 22.5 76.7 0.8 Vinh Phuc 25.2 74.2 0.6 27.2 72.4 0.4 24.5 74.8 0.7 Bac Ninh 22.3 77.0 0.7 24.8 74.6 0.6 21.4 77.8 0.8 Hai Duong 21.6 77.6 0.7 23.9 75.4 0.7 20.9 78.4 0.8 Hai Phong 23.3 76.0 0.6 24.6 75.0 0.4 22.3 76.9 0.8 Hung Yen 22.9 76.4 0.7 24.9 74.6 0.5 22.6 76.7 0.7 Thai Binh 20.7 78.6 0.7 25.4 74.2 0.4 20.2 79.1 0.7 Ha Nam 22.4 76.8 0.8 25.9 73.5 0.6 21.7 77.5 0.8 Nam Dinh 22.0 77.3 0.7 23.0 76.4 0.6 21.8 77.5 0.8
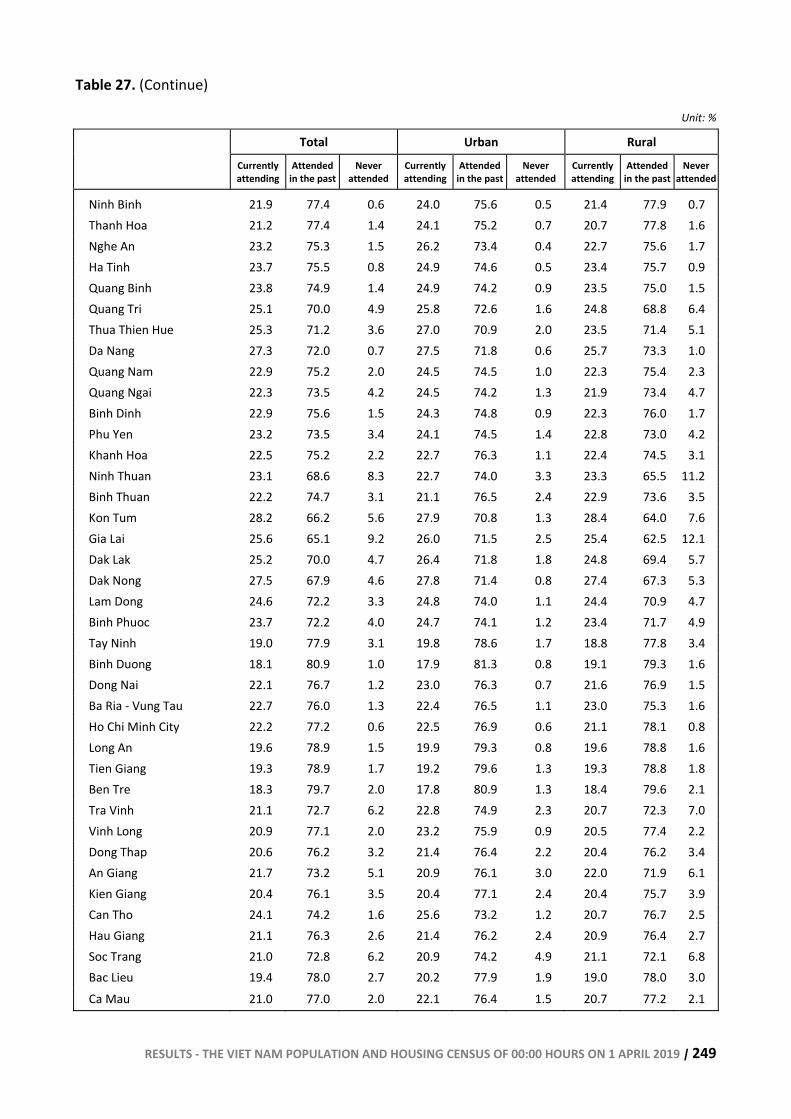
RESULTS - THE VIET NAM POPULATION AND HOUSING CENSUS OF 00:00 HOURS ON 1 APRIL 2019 | 249
Table 27. (Continue)
Unit: %
Total Urban Rural Currently
attending Attended
in the pastNever
attended Currently attending
Attended in the past
Never attended
Currently attending
Attended in the past
Never attended
Ninh Binh 21.9 77.4 0.6 24.0 75.6 0.5 21.4 77.9 0.7 Thanh Hoa 21.2 77.4 1.4 24.1 75.2 0.7 20.7 77.8 1.6 Nghe An 23.2 75.3 1.5 26.2 73.4 0.4 22.7 75.6 1.7 Ha Tinh 23.7 75.5 0.8 24.9 74.6 0.5 23.4 75.7 0.9 Quang Binh 23.8 74.9 1.4 24.9 74.2 0.9 23.5 75.0 1.5 Quang Tri 25.1 70.0 4.9 25.8 72.6 1.6 24.8 68.8 6.4 Thua Thien Hue 25.3 71.2 3.6 27.0 70.9 2.0 23.5 71.4 5.1 Da Nang 27.3 72.0 0.7 27.5 71.8 0.6 25.7 73.3 1.0 Quang Nam 22.9 75.2 2.0 24.5 74.5 1.0 22.3 75.4 2.3 Quang Ngai 22.3 73.5 4.2 24.5 74.2 1.3 21.9 73.4 4.7 Binh Dinh 22.9 75.6 1.5 24.3 74.8 0.9 22.3 76.0 1.7 Phu Yen 23.2 73.5 3.4 24.1 74.5 1.4 22.8 73.0 4.2 Khanh Hoa 22.5 75.2 2.2 22.7 76.3 1.1 22.4 74.5 3.1 Ninh Thuan 23.1 68.6 8.3 22.7 74.0 3.3 23.3 65.5 11.2 Binh Thuan 22.2 74.7 3.1 21.1 76.5 2.4 22.9 73.6 3.5 Kon Tum 28.2 66.2 5.6 27.9 70.8 1.3 28.4 64.0 7.6 Gia Lai 25.6 65.1 9.2 26.0 71.5 2.5 25.4 62.5 12.1 Dak Lak 25.2 70.0 4.7 26.4 71.8 1.8 24.8 69.4 5.7 Dak Nong 27.5 67.9 4.6 27.8 71.4 0.8 27.4 67.3 5.3 Lam Dong 24.6 72.2 3.3 24.8 74.0 1.1 24.4 70.9 4.7 Binh Phuoc 23.7 72.2 4.0 24.7 74.1 1.2 23.4 71.7 4.9 Tay Ninh 19.0 77.9 3.1 19.8 78.6 1.7 18.8 77.8 3.4 Binh Duong 18.1 80.9 1.0 17.9 81.3 0.8 19.1 79.3 1.6 Dong Nai 22.1 76.7 1.2 23.0 76.3 0.7 21.6 76.9 1.5 Ba Ria - Vung Tau 22.7 76.0 1.3 22.4 76.5 1.1 23.0 75.3 1.6 Ho Chi Minh City 22.2 77.2 0.6 22.5 76.9 0.6 21.1 78.1 0.8 Long An 19.6 78.9 1.5 19.9 79.3 0.8 19.6 78.8 1.6 Tien Giang 19.3 78.9 1.7 19.2 79.6 1.3 19.3 78.8 1.8 Ben Tre 18.3 79.7 2.0 17.8 80.9 1.3 18.4 79.6 2.1 Tra Vinh 21.1 72.7 6.2 22.8 74.9 2.3 20.7 72.3 7.0 Vinh Long 20.9 77.1 2.0 23.2 75.9 0.9 20.5 77.4 2.2 Dong Thap 20.6 76.2 3.2 21.4 76.4 2.2 20.4 76.2 3.4 An Giang 21.7 73.2 5.1 20.9 76.1 3.0 22.0 71.9 6.1 Kien Giang 20.4 76.1 3.5 20.4 77.1 2.4 20.4 75.7 3.9 Can Tho 24.1 74.2 1.6 25.6 73.2 1.2 20.7 76.7 2.5 Hau Giang 21.1 76.3 2.6 21.4 76.2 2.4 20.9 76.4 2.7 Soc Trang 21.0 72.8 6.2 20.9 74.2 4.9 21.1 72.1 6.8 Bac Lieu 19.4 78.0 2.7 20.2 77.9 1.9 19.0 78.0 3.0 Ca Mau 21.0 77.0 2.0 22.1 76.4 1.5 20.7 77.2 2.1
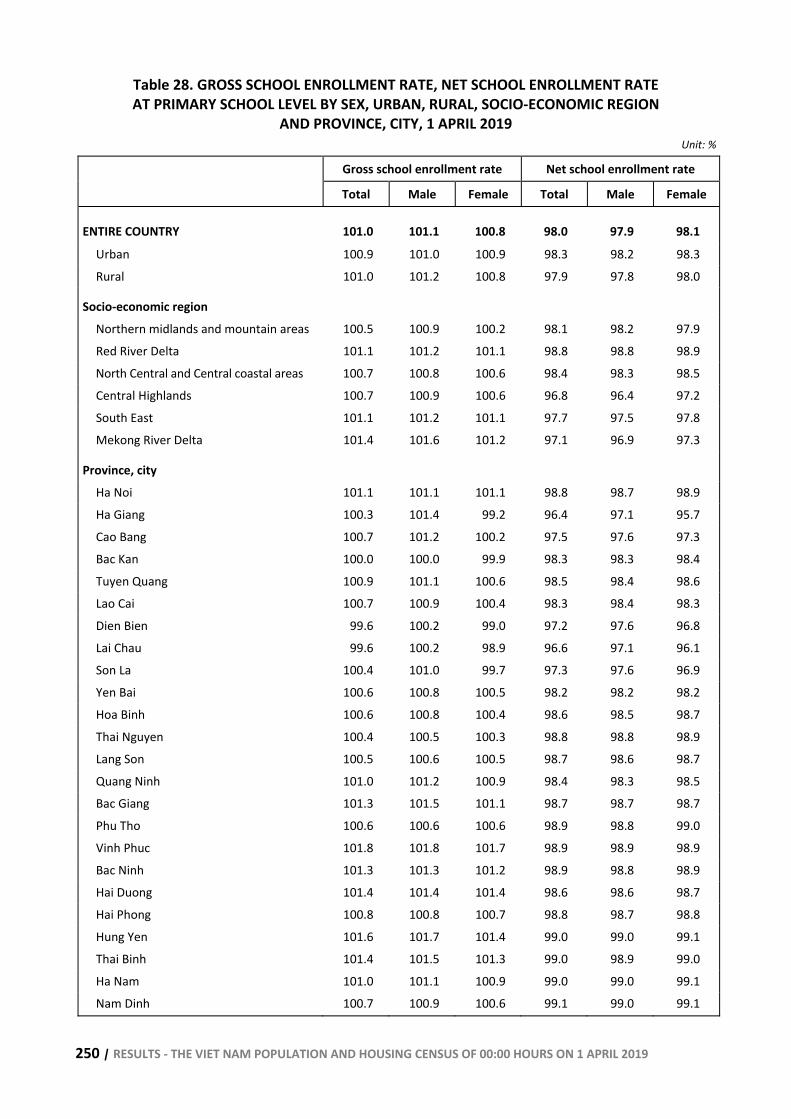
250 | RESULTS - THE VIET NAM POPULATION AND HOUSING CENSUS OF 00:00 HOURS ON 1 APRIL 2019
Table 28. GROSS SCHOOL ENROLLMENT RATE, NET SCHOOL ENROLLMENT RATE AT PRIMARY SCHOOL LEVEL BY SEX, URBAN, RURAL, SOCIO-ECONOMIC REGION
AND PROVINCE, CITY, 1 APRIL 2019 Unit: %
Gross school enrollment rate Net school enrollment rate
Total Male Female Total Male Female
ENTIRE COUNTRY 101.0 101.1 100.8 98.0 97.9 98.1 Urban 100.9 101.0 100.9 98.3 98.2 98.3 Rural 101.0 101.2 100.8 97.9 97.8 98.0
Socio-economic region Northern midlands and mountain areas 100.5 100.9 100.2 98.1 98.2 97.9 Red River Delta 101.1 101.2 101.1 98.8 98.8 98.9 North Central and Central coastal areas 100.7 100.8 100.6 98.4 98.3 98.5 Central Highlands 100.7 100.9 100.6 96.8 96.4 97.2 South East 101.1 101.2 101.1 97.7 97.5 97.8 Mekong River Delta 101.4 101.6 101.2 97.1 96.9 97.3
Province, city Ha Noi 101.1 101.1 101.1 98.8 98.7 98.9 Ha Giang 100.3 101.4 99.2 96.4 97.1 95.7 Cao Bang 100.7 101.2 100.2 97.5 97.6 97.3 Bac Kan 100.0 100.0 99.9 98.3 98.3 98.4 Tuyen Quang 100.9 101.1 100.6 98.5 98.4 98.6 Lao Cai 100.7 100.9 100.4 98.3 98.4 98.3 Dien Bien 99.6 100.2 99.0 97.2 97.6 96.8 Lai Chau 99.6 100.2 98.9 96.6 97.1 96.1 Son La 100.4 101.0 99.7 97.3 97.6 96.9 Yen Bai 100.6 100.8 100.5 98.2 98.2 98.2 Hoa Binh 100.6 100.8 100.4 98.6 98.5 98.7 Thai Nguyen 100.4 100.5 100.3 98.8 98.8 98.9 Lang Son 100.5 100.6 100.5 98.7 98.6 98.7 Quang Ninh 101.0 101.2 100.9 98.4 98.3 98.5 Bac Giang 101.3 101.5 101.1 98.7 98.7 98.7 Phu Tho 100.6 100.6 100.6 98.9 98.8 99.0 Vinh Phuc 101.8 101.8 101.7 98.9 98.9 98.9 Bac Ninh 101.3 101.3 101.2 98.9 98.8 98.9 Hai Duong 101.4 101.4 101.4 98.6 98.6 98.7 Hai Phong 100.8 100.8 100.7 98.8 98.7 98.8 Hung Yen 101.6 101.7 101.4 99.0 99.0 99.1 Thai Binh 101.4 101.5 101.3 99.0 98.9 99.0 Ha Nam 101.0 101.1 100.9 99.0 99.0 99.1 Nam Dinh 100.7 100.9 100.6 99.1 99.0 99.1
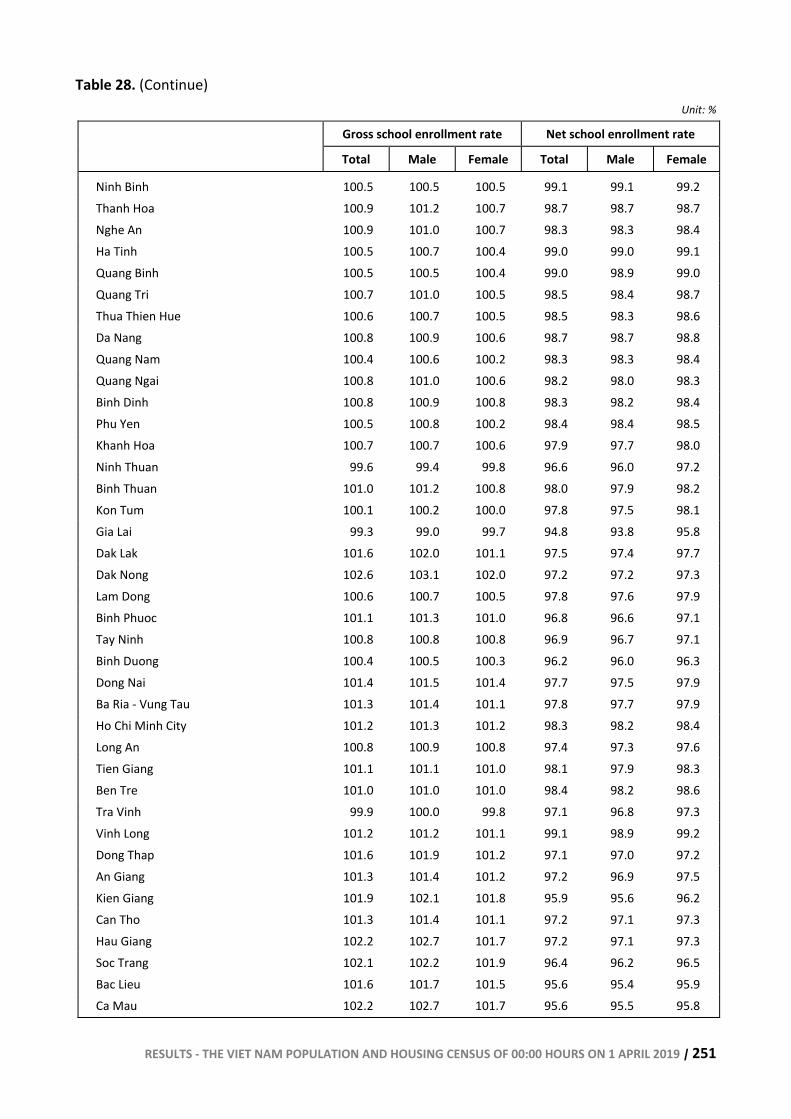
RESULTS - THE VIET NAM POPULATION AND HOUSING CENSUS OF 00:00 HOURS ON 1 APRIL 2019 | 251
Table 28. (Continue)
Unit: %
Gross school enrollment rate Net school enrollment rate
Total Male Female Total Male Female
Ninh Binh 100.5 100.5 100.5 99.1 99.1 99.2 Thanh Hoa 100.9 101.2 100.7 98.7 98.7 98.7 Nghe An 100.9 101.0 100.7 98.3 98.3 98.4 Ha Tinh 100.5 100.7 100.4 99.0 99.0 99.1 Quang Binh 100.5 100.5 100.4 99.0 98.9 99.0 Quang Tri 100.7 101.0 100.5 98.5 98.4 98.7 Thua Thien Hue 100.6 100.7 100.5 98.5 98.3 98.6 Da Nang 100.8 100.9 100.6 98.7 98.7 98.8 Quang Nam 100.4 100.6 100.2 98.3 98.3 98.4 Quang Ngai 100.8 101.0 100.6 98.2 98.0 98.3 Binh Dinh 100.8 100.9 100.8 98.3 98.2 98.4 Phu Yen 100.5 100.8 100.2 98.4 98.4 98.5 Khanh Hoa 100.7 100.7 100.6 97.9 97.7 98.0 Ninh Thuan 99.6 99.4 99.8 96.6 96.0 97.2 Binh Thuan 101.0 101.2 100.8 98.0 97.9 98.2 Kon Tum 100.1 100.2 100.0 97.8 97.5 98.1 Gia Lai 99.3 99.0 99.7 94.8 93.8 95.8 Dak Lak 101.6 102.0 101.1 97.5 97.4 97.7 Dak Nong 102.6 103.1 102.0 97.2 97.2 97.3 Lam Dong 100.6 100.7 100.5 97.8 97.6 97.9 Binh Phuoc 101.1 101.3 101.0 96.8 96.6 97.1 Tay Ninh 100.8 100.8 100.8 96.9 96.7 97.1 Binh Duong 100.4 100.5 100.3 96.2 96.0 96.3 Dong Nai 101.4 101.5 101.4 97.7 97.5 97.9 Ba Ria - Vung Tau 101.3 101.4 101.1 97.8 97.7 97.9 Ho Chi Minh City 101.2 101.3 101.2 98.3 98.2 98.4 Long An 100.8 100.9 100.8 97.4 97.3 97.6 Tien Giang 101.1 101.1 101.0 98.1 97.9 98.3 Ben Tre 101.0 101.0 101.0 98.4 98.2 98.6 Tra Vinh 99.9 100.0 99.8 97.1 96.8 97.3 Vinh Long 101.2 101.2 101.1 99.1 98.9 99.2 Dong Thap 101.6 101.9 101.2 97.1 97.0 97.2 An Giang 101.3 101.4 101.2 97.2 96.9 97.5 Kien Giang 101.9 102.1 101.8 95.9 95.6 96.2 Can Tho 101.3 101.4 101.1 97.2 97.1 97.3 Hau Giang 102.2 102.7 101.7 97.2 97.1 97.3 Soc Trang 102.1 102.2 101.9 96.4 96.2 96.5 Bac Lieu 101.6 101.7 101.5 95.6 95.4 95.9 Ca Mau 102.2 102.7 101.7 95.6 95.5 95.8
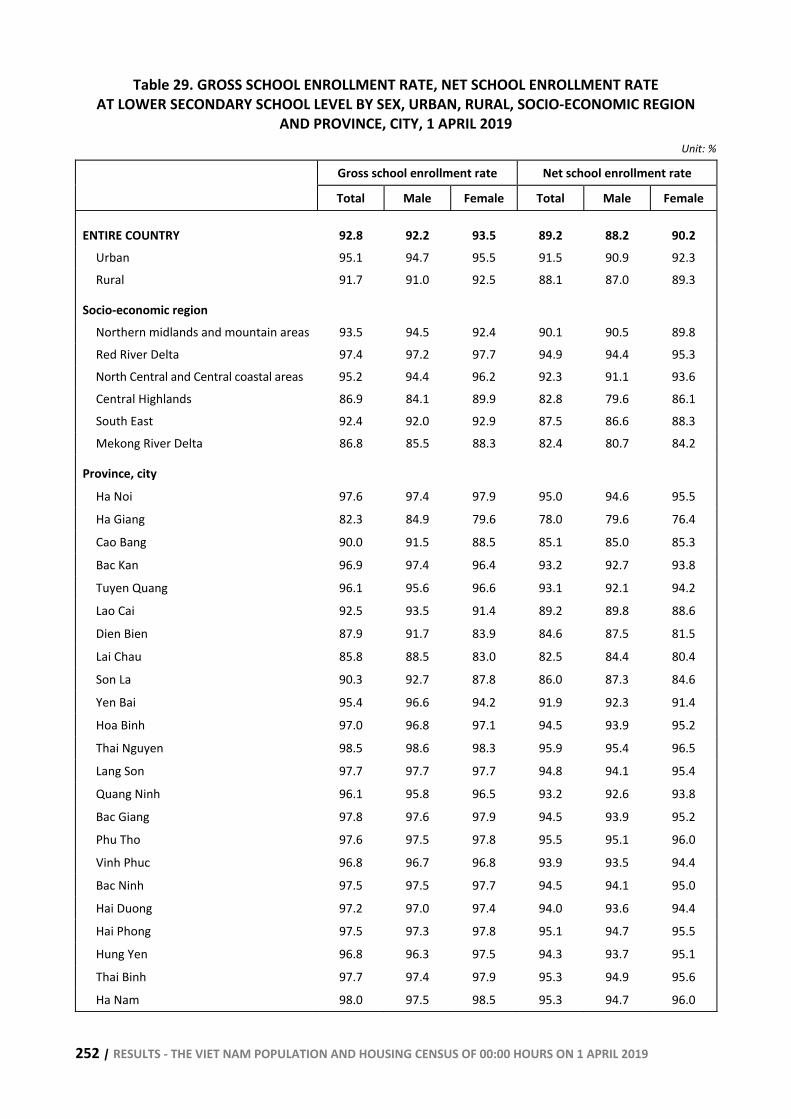
252 | RESULTS - THE VIET NAM POPULATION AND HOUSING CENSUS OF 00:00 HOURS ON 1 APRIL 2019
Table 29. GROSS SCHOOL ENROLLMENT RATE, NET SCHOOL ENROLLMENT RATE AT LOWER SECONDARY SCHOOL LEVEL BY SEX, URBAN, RURAL, SOCIO-ECONOMIC REGION
AND PROVINCE, CITY, 1 APRIL 2019 Unit: %
Gross school enrollment rate Net school enrollment rate
Total Male Female Total Male Female
ENTIRE COUNTRY 92.8 92.2 93.5 89.2 88.2 90.2 Urban 95.1 94.7 95.5 91.5 90.9 92.3 Rural 91.7 91.0 92.5 88.1 87.0 89.3
Socio-economic region Northern midlands and mountain areas 93.5 94.5 92.4 90.1 90.5 89.8 Red River Delta 97.4 97.2 97.7 94.9 94.4 95.3 North Central and Central coastal areas 95.2 94.4 96.2 92.3 91.1 93.6 Central Highlands 86.9 84.1 89.9 82.8 79.6 86.1 South East 92.4 92.0 92.9 87.5 86.6 88.3 Mekong River Delta 86.8 85.5 88.3 82.4 80.7 84.2
Province, city
Ha Noi 97.6 97.4 97.9 95.0 94.6 95.5
Ha Giang 82.3 84.9 79.6 78.0 79.6 76.4
Cao Bang 90.0 91.5 88.5 85.1 85.0 85.3
Bac Kan 96.9 97.4 96.4 93.2 92.7 93.8
Tuyen Quang 96.1 95.6 96.6 93.1 92.1 94.2
Lao Cai 92.5 93.5 91.4 89.2 89.8 88.6
Dien Bien 87.9 91.7 83.9 84.6 87.5 81.5
Lai Chau 85.8 88.5 83.0 82.5 84.4 80.4
Son La 90.3 92.7 87.8 86.0 87.3 84.6
Yen Bai 95.4 96.6 94.2 91.9 92.3 91.4
Hoa Binh 97.0 96.8 97.1 94.5 93.9 95.2
Thai Nguyen 98.5 98.6 98.3 95.9 95.4 96.5
Lang Son 97.7 97.7 97.7 94.8 94.1 95.4
Quang Ninh 96.1 95.8 96.5 93.2 92.6 93.8
Bac Giang 97.8 97.6 97.9 94.5 93.9 95.2
Phu Tho 97.6 97.5 97.8 95.5 95.1 96.0
Vinh Phuc 96.8 96.7 96.8 93.9 93.5 94.4
Bac Ninh 97.5 97.5 97.7 94.5 94.1 95.0
Hai Duong 97.2 97.0 97.4 94.0 93.6 94.4
Hai Phong 97.5 97.3 97.8 95.1 94.7 95.5
Hung Yen 96.8 96.3 97.5 94.3 93.7 95.1
Thai Binh 97.7 97.4 97.9 95.3 94.9 95.6
Ha Nam 98.0 97.5 98.5 95.3 94.7 96.0
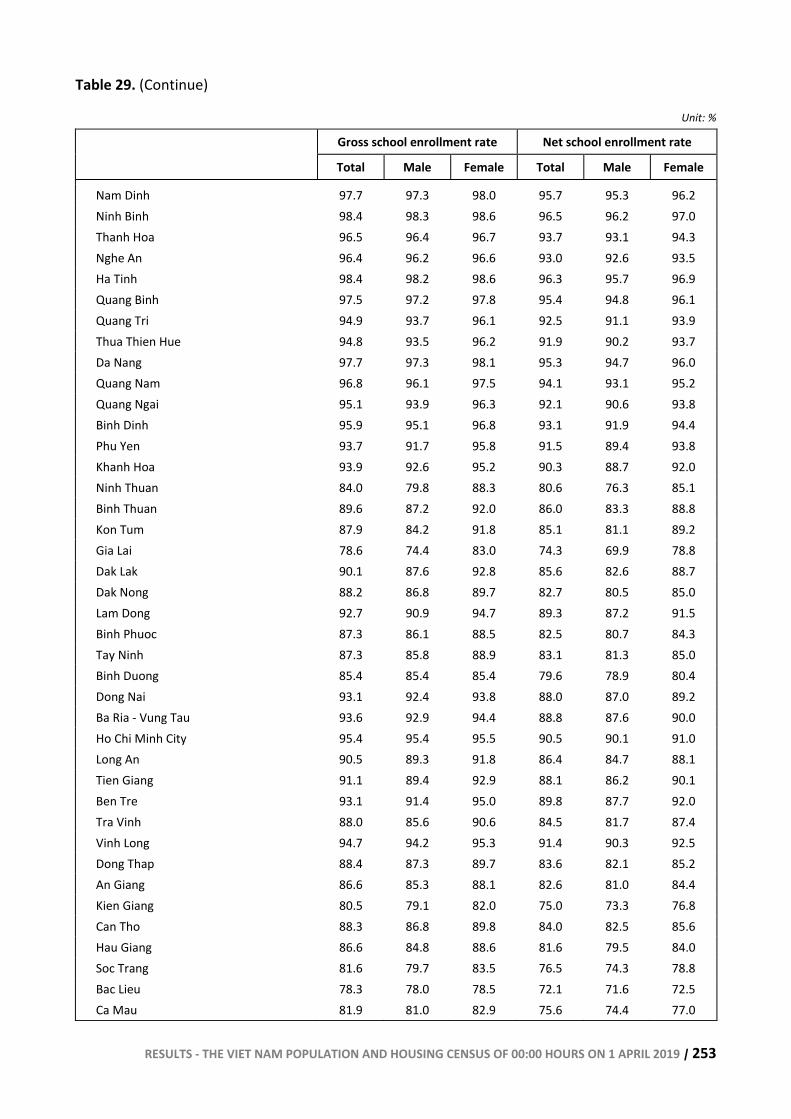
RESULTS - THE VIET NAM POPULATION AND HOUSING CENSUS OF 00:00 HOURS ON 1 APRIL 2019 | 253
Table 29. (Continue)
Unit: %
Gross school enrollment rate Net school enrollment rate
Total Male Female Total Male Female
Nam Dinh 97.7 97.3 98.0 95.7 95.3 96.2 Ninh Binh 98.4 98.3 98.6 96.5 96.2 97.0 Thanh Hoa 96.5 96.4 96.7 93.7 93.1 94.3 Nghe An 96.4 96.2 96.6 93.0 92.6 93.5 Ha Tinh 98.4 98.2 98.6 96.3 95.7 96.9 Quang Binh 97.5 97.2 97.8 95.4 94.8 96.1 Quang Tri 94.9 93.7 96.1 92.5 91.1 93.9 Thua Thien Hue 94.8 93.5 96.2 91.9 90.2 93.7 Da Nang 97.7 97.3 98.1 95.3 94.7 96.0 Quang Nam 96.8 96.1 97.5 94.1 93.1 95.2 Quang Ngai 95.1 93.9 96.3 92.1 90.6 93.8 Binh Dinh 95.9 95.1 96.8 93.1 91.9 94.4 Phu Yen 93.7 91.7 95.8 91.5 89.4 93.8 Khanh Hoa 93.9 92.6 95.2 90.3 88.7 92.0 Ninh Thuan 84.0 79.8 88.3 80.6 76.3 85.1 Binh Thuan 89.6 87.2 92.0 86.0 83.3 88.8 Kon Tum 87.9 84.2 91.8 85.1 81.1 89.2 Gia Lai 78.6 74.4 83.0 74.3 69.9 78.8 Dak Lak 90.1 87.6 92.8 85.6 82.6 88.7 Dak Nong 88.2 86.8 89.7 82.7 80.5 85.0 Lam Dong 92.7 90.9 94.7 89.3 87.2 91.5 Binh Phuoc 87.3 86.1 88.5 82.5 80.7 84.3 Tay Ninh 87.3 85.8 88.9 83.1 81.3 85.0 Binh Duong 85.4 85.4 85.4 79.6 78.9 80.4 Dong Nai 93.1 92.4 93.8 88.0 87.0 89.2 Ba Ria - Vung Tau 93.6 92.9 94.4 88.8 87.6 90.0 Ho Chi Minh City 95.4 95.4 95.5 90.5 90.1 91.0 Long An 90.5 89.3 91.8 86.4 84.7 88.1 Tien Giang 91.1 89.4 92.9 88.1 86.2 90.1 Ben Tre 93.1 91.4 95.0 89.8 87.7 92.0 Tra Vinh 88.0 85.6 90.6 84.5 81.7 87.4 Vinh Long 94.7 94.2 95.3 91.4 90.3 92.5 Dong Thap 88.4 87.3 89.7 83.6 82.1 85.2 An Giang 86.6 85.3 88.1 82.6 81.0 84.4 Kien Giang 80.5 79.1 82.0 75.0 73.3 76.8 Can Tho 88.3 86.8 89.8 84.0 82.5 85.6 Hau Giang 86.6 84.8 88.6 81.6 79.5 84.0 Soc Trang 81.6 79.7 83.5 76.5 74.3 78.8 Bac Lieu 78.3 78.0 78.5 72.1 71.6 72.5 Ca Mau 81.9 81.0 82.9 75.6 74.4 77.0

254 | RESULTS - THE VIET NAM POPULATION AND HOUSING CENSUS OF 00:00 HOURS ON 1 APRIL 2019
Table 30. GROSS SCHOOL ENROLLMENT RATE, NET SCHOOL ENROLLMENT RATE AT UPPER SECONDARY SCHOOL LEVEL BY SEX, URBAN, RURAL, SOCIO-ECONOMIC REGION
AND PROVINCE, CITY, 1 APRIL 2019
Unit: %
Gross school enrollment rate Net school enrollment rate
Total Male Female Total Male Female
ENTIRE COUNTRY 72.3 68.8 75.9 68.3 64.5 72.2 Urban 81.1 78.4 83.8 76.4 73.5 79.5 Rural 68.1 64.3 72.1 64.4 60.2 68.8
Socio-economic region Northern midlands and mountain areas 68.4 67.2 69.6 65.1 63.0 67.4 Red River Delta 87.0 85.1 89.0 83.7 81.4 86.1 North Central and Central coastal areas 77.1 72.3 82.1 73.8 68.8 79.1 Central Highlands 60.7 54.9 66.8 56.4 50.2 62.8 South East 70.1 67.0 73.4 64.2 61.0 67.7 Mekong River Delta 59.6 55.1 64.3 55.3 50.7 60.2
Province, city Ha Noi 90.3 88.2 92.6 86.8 84.3 89.5 Ha Giang 41.4 42.0 40.7 38.5 38.1 39.0 Cao Bang 60.7 57.7 63.9 56.4 52.0 61.2 Bac Kan 71.9 69.3 74.8 67.7 63.5 72.4 Tuyen Quang 76.3 73.7 79.0 73.4 69.8 77.1 Lao Cai 56.3 57.3 55.4 54.0 54.1 53.8 Dien Bien 53.2 58.1 47.7 49.3 52.5 45.6 Lai Chau 42.1 44.2 39.9 39.0 39.9 38.1 Son La 56.2 58.9 53.2 52.3 53.4 51.1 Yen Bai 61.0 60.4 61.8 58.5 56.9 60.2 Hoa Binh 78.7 75.0 82.5 75.5 71.1 80.1 Thai Nguyen 86.7 84.0 89.5 83.6 80.2 87.2 Lang Son 80.4 74.5 86.7 76.8 70.0 84.0 Quang Ninh 85.3 84.1 86.4 81.9 80.4 83.6 Bac Giang 85.8 82.4 89.3 82.0 78.1 86.1 Phu Tho 81.0 78.6 83.5 78.7 75.9 81.6 Vinh Phuc 86.6 85.5 87.8 83.3 81.7 85.1 Bac Ninh 86.5 85.6 87.5 82.4 80.9 84.1 Hai Duong 86.4 85.1 87.9 83.0 81.2 84.8 Hai Phong 90.2 88.4 92.2 86.5 84.6 88.6 Hung Yen 85.3 83.2 87.5 81.6 79.0 84.2 Thai Binh 87.8 86.2 89.4 84.7 83.1 86.4 Ha Nam 81.6 78.0 85.2 78.5 74.5 82.6 Nam Dinh 78.8 76.8 80.8 76.8 74.5 79.1 Ninh Binh 81.1 76.9 85.6 78.8 74.4 83.5
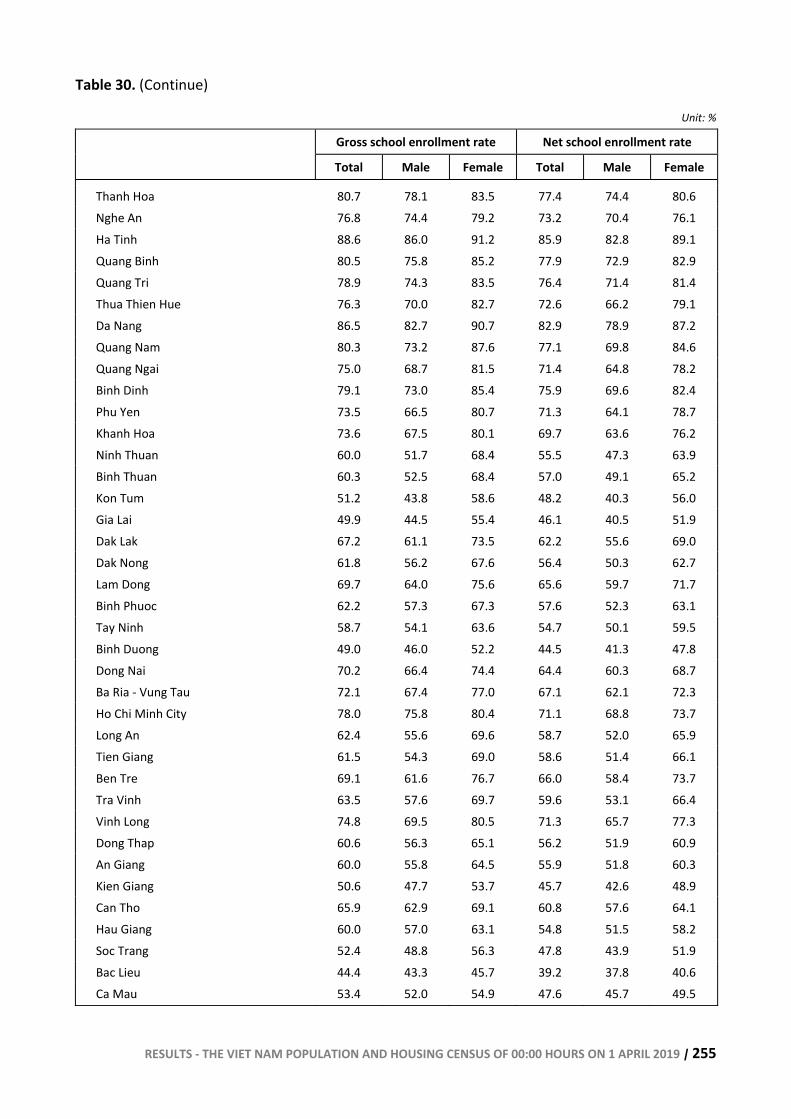
RESULTS - THE VIET NAM POPULATION AND HOUSING CENSUS OF 00:00 HOURS ON 1 APRIL 2019 | 255
Table 30. (Continue)
Unit: %
Gross school enrollment rate Net school enrollment rate
Total Male Female Total Male Female
Thanh Hoa 80.7 78.1 83.5 77.4 74.4 80.6 Nghe An 76.8 74.4 79.2 73.2 70.4 76.1 Ha Tinh 88.6 86.0 91.2 85.9 82.8 89.1 Quang Binh 80.5 75.8 85.2 77.9 72.9 82.9 Quang Tri 78.9 74.3 83.5 76.4 71.4 81.4 Thua Thien Hue 76.3 70.0 82.7 72.6 66.2 79.1 Da Nang 86.5 82.7 90.7 82.9 78.9 87.2 Quang Nam 80.3 73.2 87.6 77.1 69.8 84.6 Quang Ngai 75.0 68.7 81.5 71.4 64.8 78.2 Binh Dinh 79.1 73.0 85.4 75.9 69.6 82.4 Phu Yen 73.5 66.5 80.7 71.3 64.1 78.7 Khanh Hoa 73.6 67.5 80.1 69.7 63.6 76.2 Ninh Thuan 60.0 51.7 68.4 55.5 47.3 63.9 Binh Thuan 60.3 52.5 68.4 57.0 49.1 65.2 Kon Tum 51.2 43.8 58.6 48.2 40.3 56.0 Gia Lai 49.9 44.5 55.4 46.1 40.5 51.9 Dak Lak 67.2 61.1 73.5 62.2 55.6 69.0 Dak Nong 61.8 56.2 67.6 56.4 50.3 62.7 Lam Dong 69.7 64.0 75.6 65.6 59.7 71.7 Binh Phuoc 62.2 57.3 67.3 57.6 52.3 63.1 Tay Ninh 58.7 54.1 63.6 54.7 50.1 59.5 Binh Duong 49.0 46.0 52.2 44.5 41.3 47.8 Dong Nai 70.2 66.4 74.4 64.4 60.3 68.7 Ba Ria - Vung Tau 72.1 67.4 77.0 67.1 62.1 72.3 Ho Chi Minh City 78.0 75.8 80.4 71.1 68.8 73.7 Long An 62.4 55.6 69.6 58.7 52.0 65.9 Tien Giang 61.5 54.3 69.0 58.6 51.4 66.1 Ben Tre 69.1 61.6 76.7 66.0 58.4 73.7 Tra Vinh 63.5 57.6 69.7 59.6 53.1 66.4 Vinh Long 74.8 69.5 80.5 71.3 65.7 77.3 Dong Thap 60.6 56.3 65.1 56.2 51.9 60.9 An Giang 60.0 55.8 64.5 55.9 51.8 60.3 Kien Giang 50.6 47.7 53.7 45.7 42.6 48.9 Can Tho 65.9 62.9 69.1 60.8 57.6 64.1 Hau Giang 60.0 57.0 63.1 54.8 51.5 58.2 Soc Trang 52.4 48.8 56.3 47.8 43.9 51.9 Bac Lieu 44.4 43.3 45.7 39.2 37.8 40.6 Ca Mau 53.4 52.0 54.9 47.6 45.7 49.5
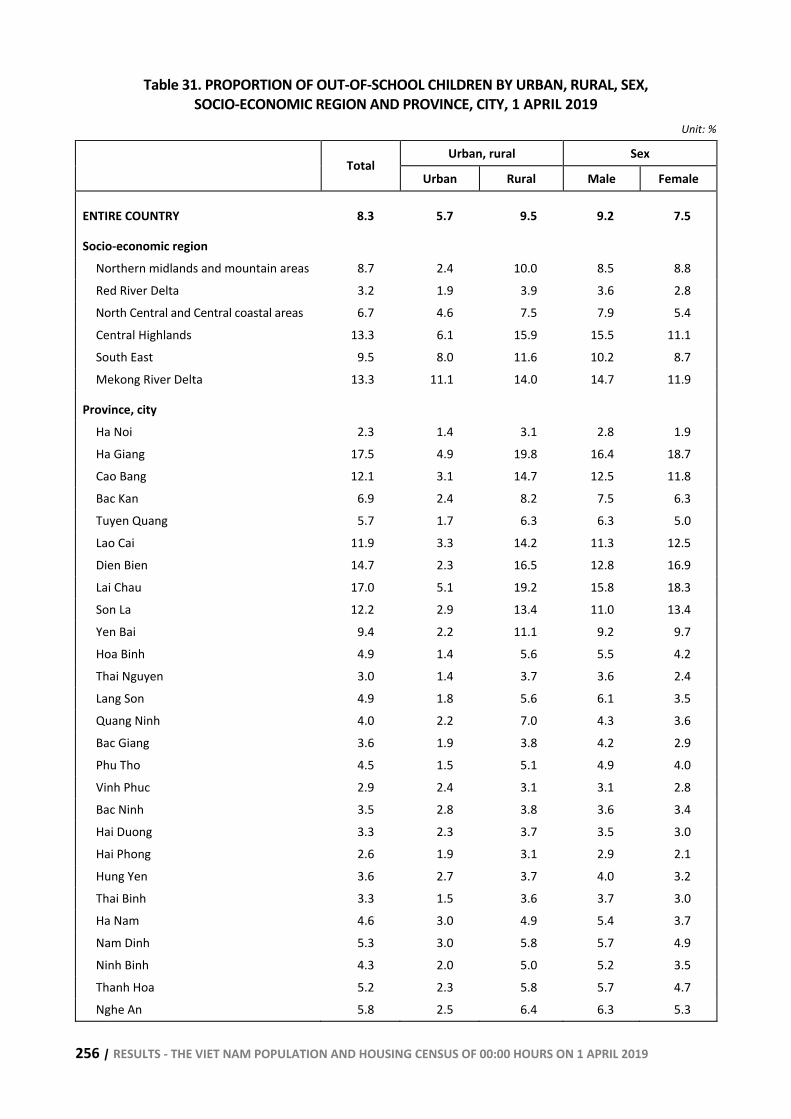
256 | RESULTS - THE VIET NAM POPULATION AND HOUSING CENSUS OF 00:00 HOURS ON 1 APRIL 2019
Table 31. PROPORTION OF OUT-OF-SCHOOL CHILDREN BY URBAN, RURAL, SEX, SOCIO-ECONOMIC REGION AND PROVINCE, CITY, 1 APRIL 2019
Unit: %
Urban, rural Sex Total
Urban Rural Male Female
ENTIRE COUNTRY 8.3 5.7 9.5 9.2 7.5
Socio-economic region Northern midlands and mountain areas 8.7 2.4 10.0 8.5 8.8 Red River Delta 3.2 1.9 3.9 3.6 2.8 North Central and Central coastal areas 6.7 4.6 7.5 7.9 5.4 Central Highlands 13.3 6.1 15.9 15.5 11.1 South East 9.5 8.0 11.6 10.2 8.7 Mekong River Delta 13.3 11.1 14.0 14.7 11.9
Province, city Ha Noi 2.3 1.4 3.1 2.8 1.9 Ha Giang 17.5 4.9 19.8 16.4 18.7 Cao Bang 12.1 3.1 14.7 12.5 11.8 Bac Kan 6.9 2.4 8.2 7.5 6.3 Tuyen Quang 5.7 1.7 6.3 6.3 5.0 Lao Cai 11.9 3.3 14.2 11.3 12.5 Dien Bien 14.7 2.3 16.5 12.8 16.9 Lai Chau 17.0 5.1 19.2 15.8 18.3 Son La 12.2 2.9 13.4 11.0 13.4 Yen Bai 9.4 2.2 11.1 9.2 9.7 Hoa Binh 4.9 1.4 5.6 5.5 4.2 Thai Nguyen 3.0 1.4 3.7 3.6 2.4 Lang Son 4.9 1.8 5.6 6.1 3.5 Quang Ninh 4.0 2.2 7.0 4.3 3.6 Bac Giang 3.6 1.9 3.8 4.2 2.9 Phu Tho 4.5 1.5 5.1 4.9 4.0 Vinh Phuc 2.9 2.4 3.1 3.1 2.8 Bac Ninh 3.5 2.8 3.8 3.6 3.4 Hai Duong 3.3 2.3 3.7 3.5 3.0 Hai Phong 2.6 1.9 3.1 2.9 2.1 Hung Yen 3.6 2.7 3.7 4.0 3.2 Thai Binh 3.3 1.5 3.6 3.7 3.0 Ha Nam 4.6 3.0 4.9 5.4 3.7 Nam Dinh 5.3 3.0 5.8 5.7 4.9 Ninh Binh 4.3 2.0 5.0 5.2 3.5 Thanh Hoa 5.2 2.3 5.8 5.7 4.7 Nghe An 5.8 2.5 6.4 6.3 5.3
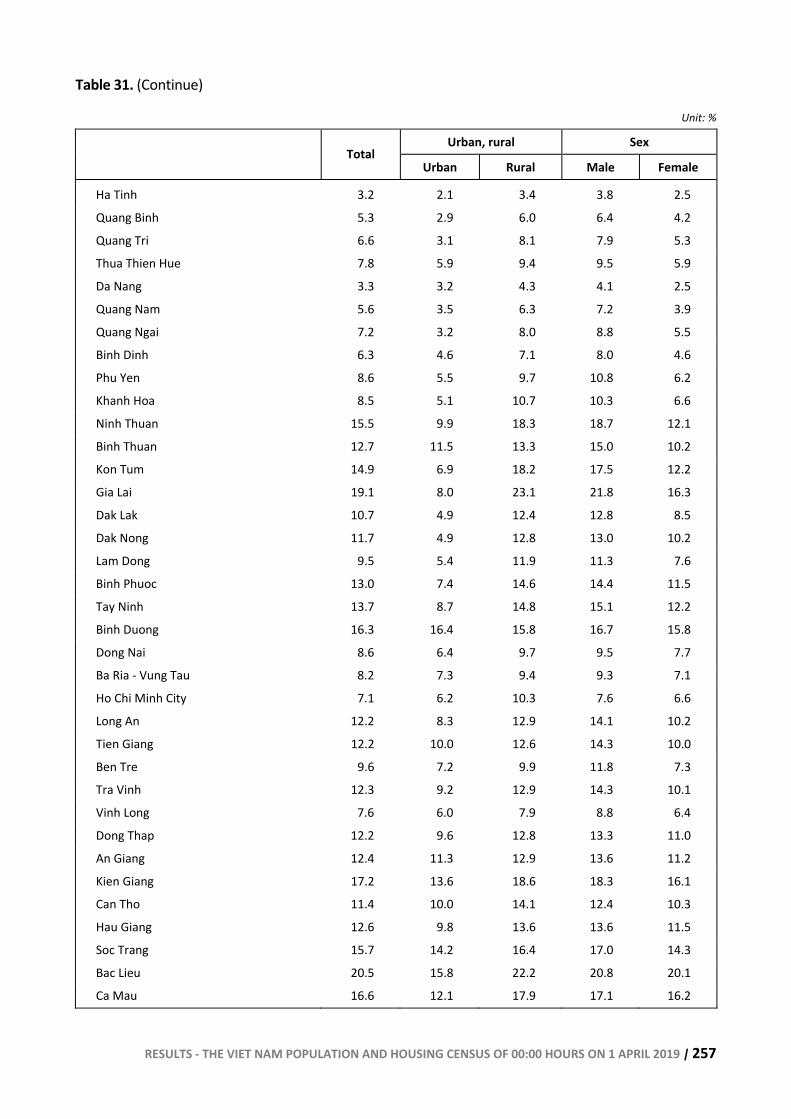
RESULTS - THE VIET NAM POPULATION AND HOUSING CENSUS OF 00:00 HOURS ON 1 APRIL 2019 | 257
Table 31. (Continue)
Unit: %
Urban, rural Sex Total
Urban Rural Male Female
Ha Tinh 3.2 2.1 3.4 3.8 2.5
Quang Binh 5.3 2.9 6.0 6.4 4.2
Quang Tri 6.6 3.1 8.1 7.9 5.3
Thua Thien Hue 7.8 5.9 9.4 9.5 5.9
Da Nang 3.3 3.2 4.3 4.1 2.5
Quang Nam 5.6 3.5 6.3 7.2 3.9
Quang Ngai 7.2 3.2 8.0 8.8 5.5
Binh Dinh 6.3 4.6 7.1 8.0 4.6
Phu Yen 8.6 5.5 9.7 10.8 6.2
Khanh Hoa 8.5 5.1 10.7 10.3 6.6
Ninh Thuan 15.5 9.9 18.3 18.7 12.1
Binh Thuan 12.7 11.5 13.3 15.0 10.2
Kon Tum 14.9 6.9 18.2 17.5 12.2
Gia Lai 19.1 8.0 23.1 21.8 16.3
Dak Lak 10.7 4.9 12.4 12.8 8.5
Dak Nong 11.7 4.9 12.8 13.0 10.2
Lam Dong 9.5 5.4 11.9 11.3 7.6
Binh Phuoc 13.0 7.4 14.6 14.4 11.5
Tay Ninh 13.7 8.7 14.8 15.1 12.2
Binh Duong 16.3 16.4 15.8 16.7 15.8
Dong Nai 8.6 6.4 9.7 9.5 7.7
Ba Ria - Vung Tau 8.2 7.3 9.4 9.3 7.1
Ho Chi Minh City 7.1 6.2 10.3 7.6 6.6
Long An 12.2 8.3 12.9 14.1 10.2
Tien Giang 12.2 10.0 12.6 14.3 10.0
Ben Tre 9.6 7.2 9.9 11.8 7.3
Tra Vinh 12.3 9.2 12.9 14.3 10.1
Vinh Long 7.6 6.0 7.9 8.8 6.4
Dong Thap 12.2 9.6 12.8 13.3 11.0
An Giang 12.4 11.3 12.9 13.6 11.2
Kien Giang 17.2 13.6 18.6 18.3 16.1
Can Tho 11.4 10.0 14.1 12.4 10.3
Hau Giang 12.6 9.8 13.6 13.6 11.5
Soc Trang 15.7 14.2 16.4 17.0 14.3
Bac Lieu 20.5 15.8 22.2 20.8 20.1
Ca Mau 16.6 12.1 17.9 17.1 16.2
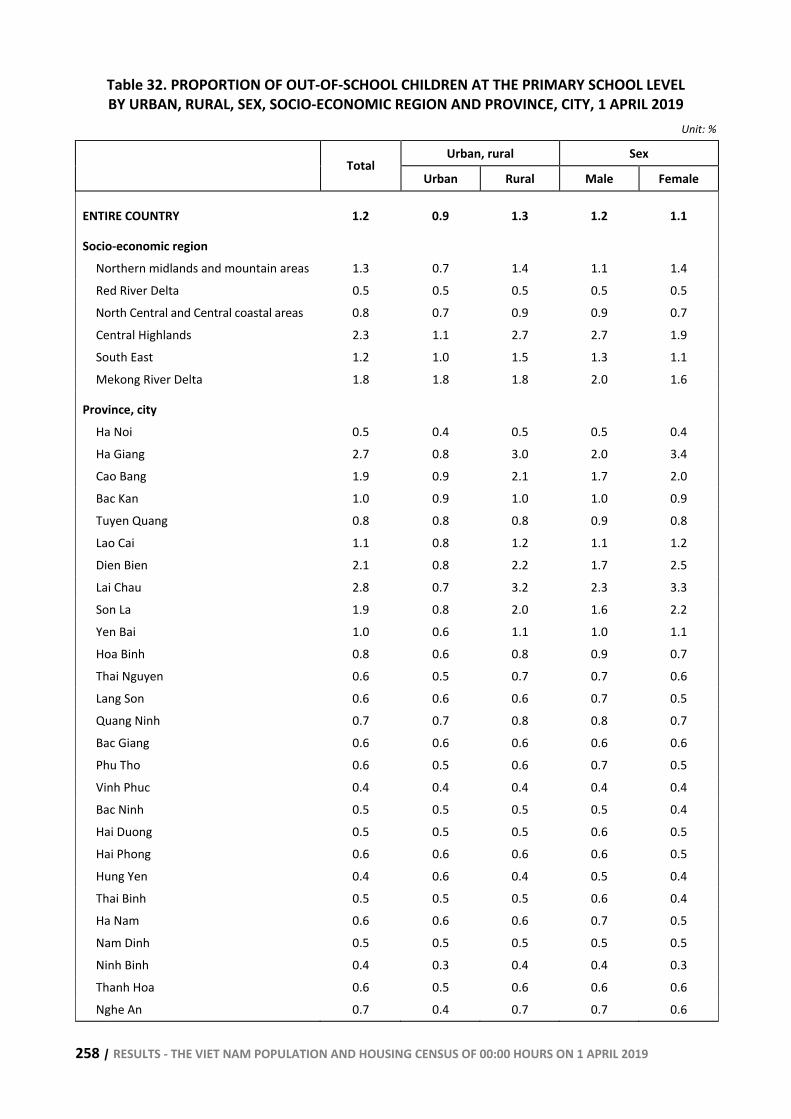
258 | RESULTS - THE VIET NAM POPULATION AND HOUSING CENSUS OF 00:00 HOURS ON 1 APRIL 2019
Table 32. PROPORTION OF OUT-OF-SCHOOL CHILDREN AT THE PRIMARY SCHOOL LEVEL BY URBAN, RURAL, SEX, SOCIO-ECONOMIC REGION AND PROVINCE, CITY, 1 APRIL 2019
Unit: %
Urban, rural Sex Total
Urban Rural Male Female
ENTIRE COUNTRY 1.2 0.9 1.3 1.2 1.1
Socio-economic region Northern midlands and mountain areas 1.3 0.7 1.4 1.1 1.4 Red River Delta 0.5 0.5 0.5 0.5 0.5 North Central and Central coastal areas 0.8 0.7 0.9 0.9 0.7 Central Highlands 2.3 1.1 2.7 2.7 1.9 South East 1.2 1.0 1.5 1.3 1.1 Mekong River Delta 1.8 1.8 1.8 2.0 1.6
Province, city Ha Noi 0.5 0.4 0.5 0.5 0.4 Ha Giang 2.7 0.8 3.0 2.0 3.4 Cao Bang 1.9 0.9 2.1 1.7 2.0 Bac Kan 1.0 0.9 1.0 1.0 0.9 Tuyen Quang 0.8 0.8 0.8 0.9 0.8 Lao Cai 1.1 0.8 1.2 1.1 1.2 Dien Bien 2.1 0.8 2.2 1.7 2.5 Lai Chau 2.8 0.7 3.2 2.3 3.3 Son La 1.9 0.8 2.0 1.6 2.2 Yen Bai 1.0 0.6 1.1 1.0 1.1 Hoa Binh 0.8 0.6 0.8 0.9 0.7 Thai Nguyen 0.6 0.5 0.7 0.7 0.6 Lang Son 0.6 0.6 0.6 0.7 0.5 Quang Ninh 0.7 0.7 0.8 0.8 0.7 Bac Giang 0.6 0.6 0.6 0.6 0.6 Phu Tho 0.6 0.5 0.6 0.7 0.5 Vinh Phuc 0.4 0.4 0.4 0.4 0.4 Bac Ninh 0.5 0.5 0.5 0.5 0.4 Hai Duong 0.5 0.5 0.5 0.6 0.5 Hai Phong 0.6 0.6 0.6 0.6 0.5 Hung Yen 0.4 0.6 0.4 0.5 0.4 Thai Binh 0.5 0.5 0.5 0.6 0.4 Ha Nam 0.6 0.6 0.6 0.7 0.5 Nam Dinh 0.5 0.5 0.5 0.5 0.5 Ninh Binh 0.4 0.3 0.4 0.4 0.3 Thanh Hoa 0.6 0.5 0.6 0.6 0.6 Nghe An 0.7 0.4 0.7 0.7 0.6
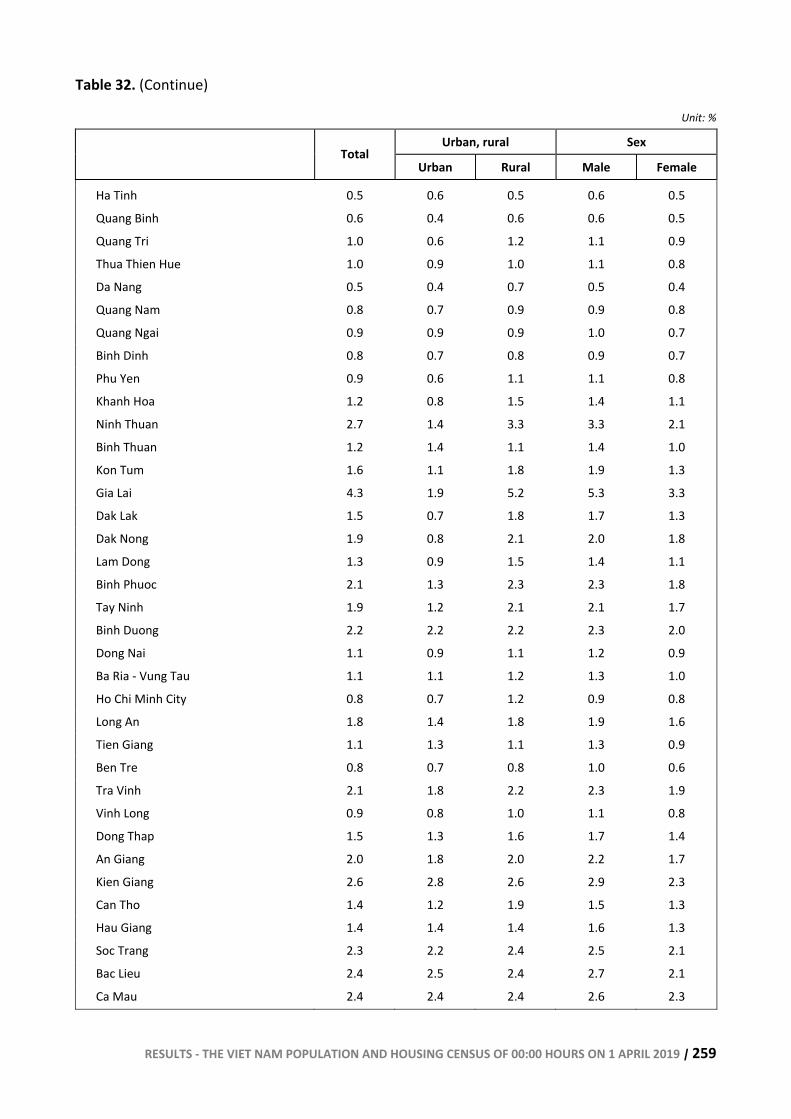
RESULTS - THE VIET NAM POPULATION AND HOUSING CENSUS OF 00:00 HOURS ON 1 APRIL 2019 | 259
Table 32. (Continue)
Unit: %
Urban, rural Sex Total
Urban Rural Male Female
Ha Tinh 0.5 0.6 0.5 0.6 0.5
Quang Binh 0.6 0.4 0.6 0.6 0.5
Quang Tri 1.0 0.6 1.2 1.1 0.9
Thua Thien Hue 1.0 0.9 1.0 1.1 0.8
Da Nang 0.5 0.4 0.7 0.5 0.4
Quang Nam 0.8 0.7 0.9 0.9 0.8
Quang Ngai 0.9 0.9 0.9 1.0 0.7
Binh Dinh 0.8 0.7 0.8 0.9 0.7
Phu Yen 0.9 0.6 1.1 1.1 0.8
Khanh Hoa 1.2 0.8 1.5 1.4 1.1
Ninh Thuan 2.7 1.4 3.3 3.3 2.1
Binh Thuan 1.2 1.4 1.1 1.4 1.0
Kon Tum 1.6 1.1 1.8 1.9 1.3
Gia Lai 4.3 1.9 5.2 5.3 3.3
Dak Lak 1.5 0.7 1.8 1.7 1.3
Dak Nong 1.9 0.8 2.1 2.0 1.8
Lam Dong 1.3 0.9 1.5 1.4 1.1
Binh Phuoc 2.1 1.3 2.3 2.3 1.8
Tay Ninh 1.9 1.2 2.1 2.1 1.7
Binh Duong 2.2 2.2 2.2 2.3 2.0
Dong Nai 1.1 0.9 1.1 1.2 0.9
Ba Ria - Vung Tau 1.1 1.1 1.2 1.3 1.0
Ho Chi Minh City 0.8 0.7 1.2 0.9 0.8
Long An 1.8 1.4 1.8 1.9 1.6
Tien Giang 1.1 1.3 1.1 1.3 0.9
Ben Tre 0.8 0.7 0.8 1.0 0.6
Tra Vinh 2.1 1.8 2.2 2.3 1.9
Vinh Long 0.9 0.8 1.0 1.1 0.8
Dong Thap 1.5 1.3 1.6 1.7 1.4
An Giang 2.0 1.8 2.0 2.2 1.7
Kien Giang 2.6 2.8 2.6 2.9 2.3
Can Tho 1.4 1.2 1.9 1.5 1.3
Hau Giang 1.4 1.4 1.4 1.6 1.3
Soc Trang 2.3 2.2 2.4 2.5 2.1
Bac Lieu 2.4 2.5 2.4 2.7 2.1
Ca Mau 2.4 2.4 2.4 2.6 2.3
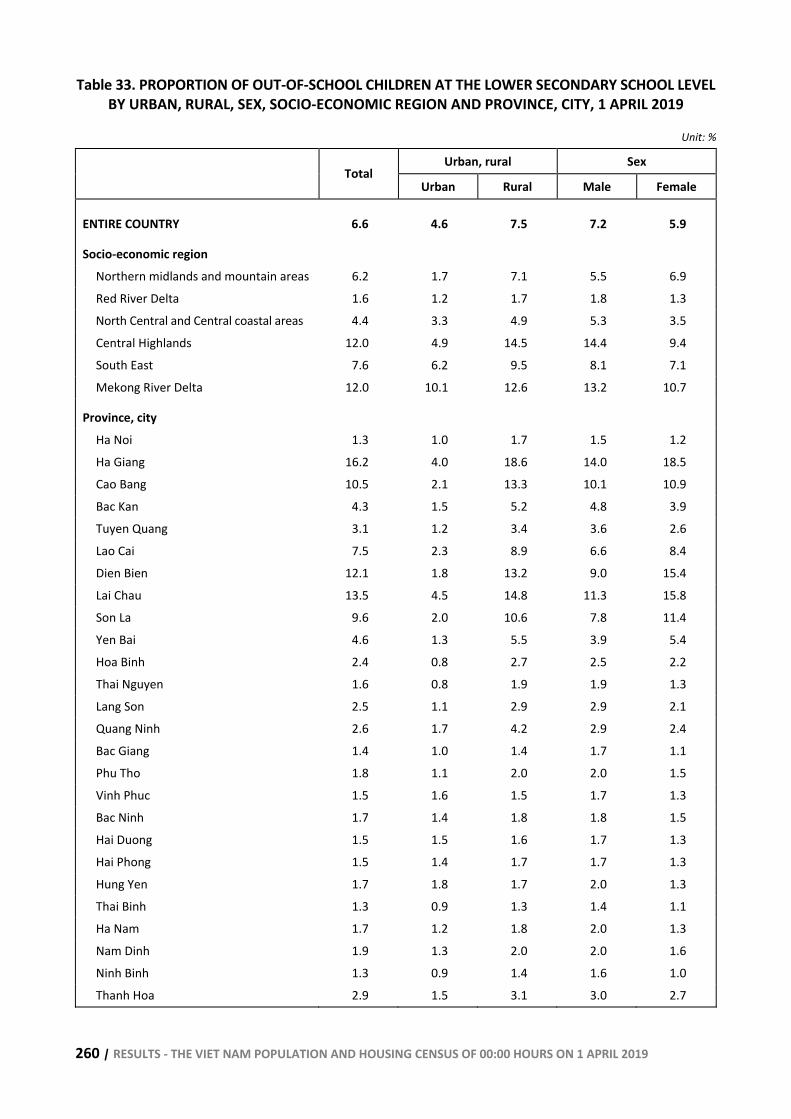
260 | RESULTS - THE VIET NAM POPULATION AND HOUSING CENSUS OF 00:00 HOURS ON 1 APRIL 2019
Table 33. PROPORTION OF OUT-OF-SCHOOL CHILDREN AT THE LOWER SECONDARY SCHOOL LEVEL BY URBAN, RURAL, SEX, SOCIO-ECONOMIC REGION AND PROVINCE, CITY, 1 APRIL 2019
Unit: %
Urban, rural Sex Total
Urban Rural Male Female
ENTIRE COUNTRY 6.6 4.6 7.5 7.2 5.9
Socio-economic region Northern midlands and mountain areas 6.2 1.7 7.1 5.5 6.9 Red River Delta 1.6 1.2 1.7 1.8 1.3 North Central and Central coastal areas 4.4 3.3 4.9 5.3 3.5 Central Highlands 12.0 4.9 14.5 14.4 9.4 South East 7.6 6.2 9.5 8.1 7.1 Mekong River Delta 12.0 10.1 12.6 13.2 10.7
Province, city Ha Noi 1.3 1.0 1.7 1.5 1.2 Ha Giang 16.2 4.0 18.6 14.0 18.5 Cao Bang 10.5 2.1 13.3 10.1 10.9 Bac Kan 4.3 1.5 5.2 4.8 3.9 Tuyen Quang 3.1 1.2 3.4 3.6 2.6 Lao Cai 7.5 2.3 8.9 6.6 8.4 Dien Bien 12.1 1.8 13.2 9.0 15.4 Lai Chau 13.5 4.5 14.8 11.3 15.8 Son La 9.6 2.0 10.6 7.8 11.4 Yen Bai 4.6 1.3 5.5 3.9 5.4 Hoa Binh 2.4 0.8 2.7 2.5 2.2 Thai Nguyen 1.6 0.8 1.9 1.9 1.3 Lang Son 2.5 1.1 2.9 2.9 2.1 Quang Ninh 2.6 1.7 4.2 2.9 2.4 Bac Giang 1.4 1.0 1.4 1.7 1.1 Phu Tho 1.8 1.1 2.0 2.0 1.5 Vinh Phuc 1.5 1.6 1.5 1.7 1.3 Bac Ninh 1.7 1.4 1.8 1.8 1.5 Hai Duong 1.5 1.5 1.6 1.7 1.3 Hai Phong 1.5 1.4 1.7 1.7 1.3 Hung Yen 1.7 1.8 1.7 2.0 1.3 Thai Binh 1.3 0.9 1.3 1.4 1.1 Ha Nam 1.7 1.2 1.8 2.0 1.3 Nam Dinh 1.9 1.3 2.0 2.0 1.6 Ninh Binh 1.3 0.9 1.4 1.6 1.0 Thanh Hoa 2.9 1.5 3.1 3.0 2.7
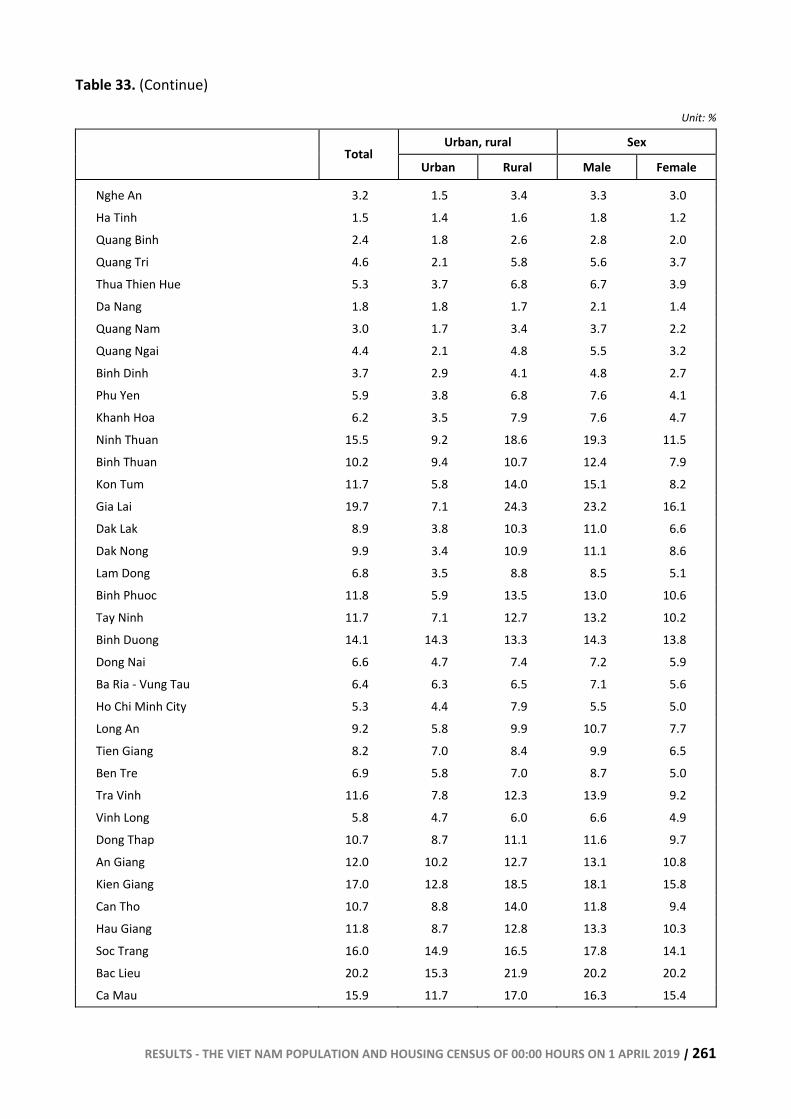
RESULTS - THE VIET NAM POPULATION AND HOUSING CENSUS OF 00:00 HOURS ON 1 APRIL 2019 | 261
Table 33. (Continue)
Unit: %
Urban, rural Sex Total
Urban Rural Male Female
Nghe An 3.2 1.5 3.4 3.3 3.0 Ha Tinh 1.5 1.4 1.6 1.8 1.2 Quang Binh 2.4 1.8 2.6 2.8 2.0 Quang Tri 4.6 2.1 5.8 5.6 3.7 Thua Thien Hue 5.3 3.7 6.8 6.7 3.9 Da Nang 1.8 1.8 1.7 2.1 1.4 Quang Nam 3.0 1.7 3.4 3.7 2.2 Quang Ngai 4.4 2.1 4.8 5.5 3.2 Binh Dinh 3.7 2.9 4.1 4.8 2.7 Phu Yen 5.9 3.8 6.8 7.6 4.1 Khanh Hoa 6.2 3.5 7.9 7.6 4.7 Ninh Thuan 15.5 9.2 18.6 19.3 11.5 Binh Thuan 10.2 9.4 10.7 12.4 7.9 Kon Tum 11.7 5.8 14.0 15.1 8.2 Gia Lai 19.7 7.1 24.3 23.2 16.1 Dak Lak 8.9 3.8 10.3 11.0 6.6 Dak Nong 9.9 3.4 10.9 11.1 8.6 Lam Dong 6.8 3.5 8.8 8.5 5.1 Binh Phuoc 11.8 5.9 13.5 13.0 10.6 Tay Ninh 11.7 7.1 12.7 13.2 10.2 Binh Duong 14.1 14.3 13.3 14.3 13.8 Dong Nai 6.6 4.7 7.4 7.2 5.9 Ba Ria - Vung Tau 6.4 6.3 6.5 7.1 5.6 Ho Chi Minh City 5.3 4.4 7.9 5.5 5.0 Long An 9.2 5.8 9.9 10.7 7.7 Tien Giang 8.2 7.0 8.4 9.9 6.5 Ben Tre 6.9 5.8 7.0 8.7 5.0 Tra Vinh 11.6 7.8 12.3 13.9 9.2 Vinh Long 5.8 4.7 6.0 6.6 4.9 Dong Thap 10.7 8.7 11.1 11.6 9.7 An Giang 12.0 10.2 12.7 13.1 10.8 Kien Giang 17.0 12.8 18.5 18.1 15.8 Can Tho 10.7 8.8 14.0 11.8 9.4 Hau Giang 11.8 8.7 12.8 13.3 10.3 Soc Trang 16.0 14.9 16.5 17.8 14.1 Bac Lieu 20.2 15.3 21.9 20.2 20.2 Ca Mau 15.9 11.7 17.0 16.3 15.4
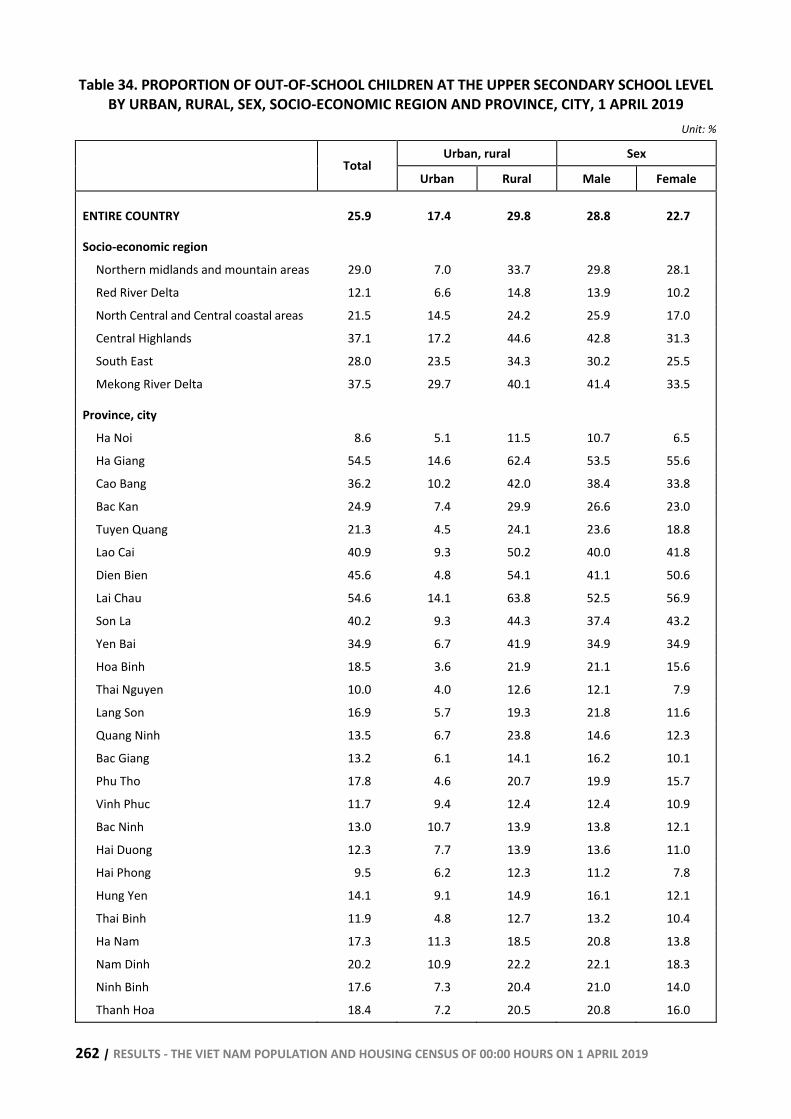
262 | RESULTS - THE VIET NAM POPULATION AND HOUSING CENSUS OF 00:00 HOURS ON 1 APRIL 2019
Table 34. PROPORTION OF OUT-OF-SCHOOL CHILDREN AT THE UPPER SECONDARY SCHOOL LEVEL BY URBAN, RURAL, SEX, SOCIO-ECONOMIC REGION AND PROVINCE, CITY, 1 APRIL 2019
Unit: %
Urban, rural Sex Total
Urban Rural Male Female
ENTIRE COUNTRY 25.9 17.4 29.8 28.8 22.7
Socio-economic region Northern midlands and mountain areas 29.0 7.0 33.7 29.8 28.1
Red River Delta 12.1 6.6 14.8 13.9 10.2
North Central and Central coastal areas 21.5 14.5 24.2 25.9 17.0
Central Highlands 37.1 17.2 44.6 42.8 31.3
South East 28.0 23.5 34.3 30.2 25.5
Mekong River Delta 37.5 29.7 40.1 41.4 33.5
Province, city
Ha Noi 8.6 5.1 11.5 10.7 6.5
Ha Giang 54.5 14.6 62.4 53.5 55.6
Cao Bang 36.2 10.2 42.0 38.4 33.8
Bac Kan 24.9 7.4 29.9 26.6 23.0
Tuyen Quang 21.3 4.5 24.1 23.6 18.8
Lao Cai 40.9 9.3 50.2 40.0 41.8
Dien Bien 45.6 4.8 54.1 41.1 50.6
Lai Chau 54.6 14.1 63.8 52.5 56.9
Son La 40.2 9.3 44.3 37.4 43.2
Yen Bai 34.9 6.7 41.9 34.9 34.9
Hoa Binh 18.5 3.6 21.9 21.1 15.6
Thai Nguyen 10.0 4.0 12.6 12.1 7.9
Lang Son 16.9 5.7 19.3 21.8 11.6
Quang Ninh 13.5 6.7 23.8 14.6 12.3
Bac Giang 13.2 6.1 14.1 16.2 10.1
Phu Tho 17.8 4.6 20.7 19.9 15.7
Vinh Phuc 11.7 9.4 12.4 12.4 10.9
Bac Ninh 13.0 10.7 13.9 13.8 12.1
Hai Duong 12.3 7.7 13.9 13.6 11.0
Hai Phong 9.5 6.2 12.3 11.2 7.8
Hung Yen 14.1 9.1 14.9 16.1 12.1
Thai Binh 11.9 4.8 12.7 13.2 10.4
Ha Nam 17.3 11.3 18.5 20.8 13.8
Nam Dinh 20.2 10.9 22.2 22.1 18.3
Ninh Binh 17.6 7.3 20.4 21.0 14.0
Thanh Hoa 18.4 7.2 20.5 20.8 16.0
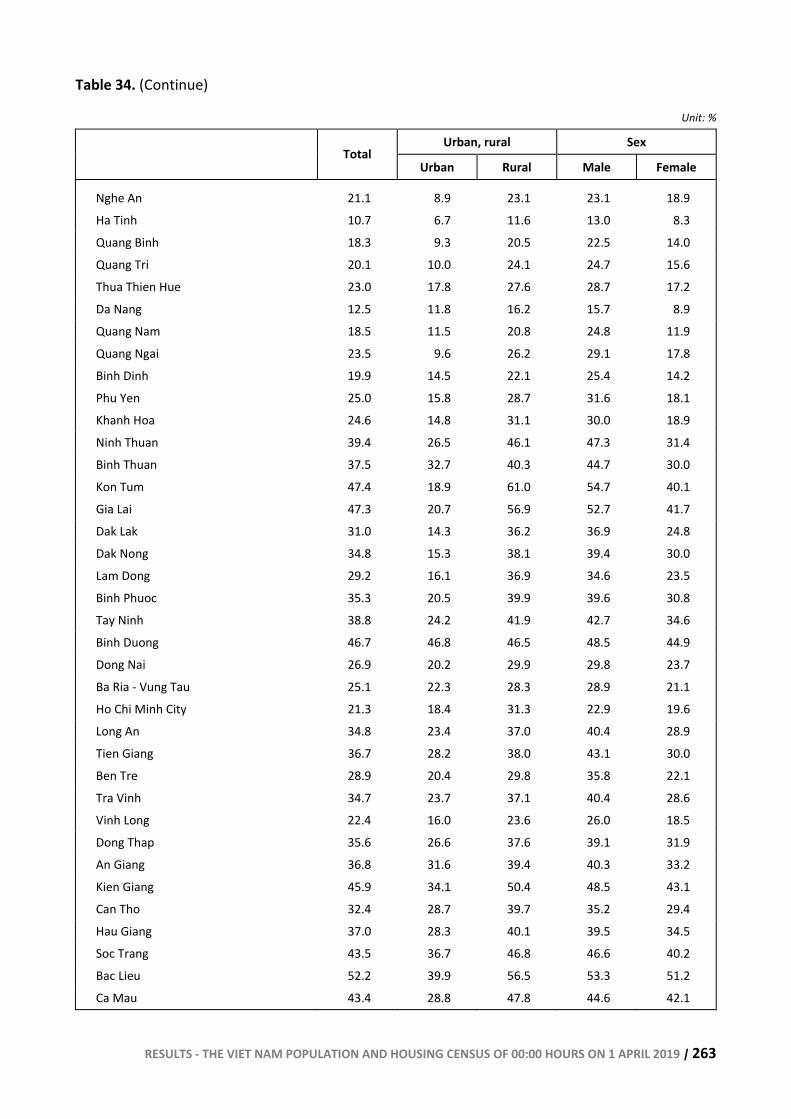
RESULTS - THE VIET NAM POPULATION AND HOUSING CENSUS OF 00:00 HOURS ON 1 APRIL 2019 | 263
Table 34. (Continue)
Unit: %
Urban, rural Sex Total
Urban Rural Male Female
Nghe An 21.1 8.9 23.1 23.1 18.9 Ha Tinh 10.7 6.7 11.6 13.0 8.3 Quang Binh 18.3 9.3 20.5 22.5 14.0 Quang Tri 20.1 10.0 24.1 24.7 15.6 Thua Thien Hue 23.0 17.8 27.6 28.7 17.2 Da Nang 12.5 11.8 16.2 15.7 8.9 Quang Nam 18.5 11.5 20.8 24.8 11.9 Quang Ngai 23.5 9.6 26.2 29.1 17.8 Binh Dinh 19.9 14.5 22.1 25.4 14.2 Phu Yen 25.0 15.8 28.7 31.6 18.1 Khanh Hoa 24.6 14.8 31.1 30.0 18.9 Ninh Thuan 39.4 26.5 46.1 47.3 31.4 Binh Thuan 37.5 32.7 40.3 44.7 30.0 Kon Tum 47.4 18.9 61.0 54.7 40.1 Gia Lai 47.3 20.7 56.9 52.7 41.7 Dak Lak 31.0 14.3 36.2 36.9 24.8 Dak Nong 34.8 15.3 38.1 39.4 30.0 Lam Dong 29.2 16.1 36.9 34.6 23.5 Binh Phuoc 35.3 20.5 39.9 39.6 30.8 Tay Ninh 38.8 24.2 41.9 42.7 34.6 Binh Duong 46.7 46.8 46.5 48.5 44.9 Dong Nai 26.9 20.2 29.9 29.8 23.7 Ba Ria - Vung Tau 25.1 22.3 28.3 28.9 21.1 Ho Chi Minh City 21.3 18.4 31.3 22.9 19.6 Long An 34.8 23.4 37.0 40.4 28.9 Tien Giang 36.7 28.2 38.0 43.1 30.0 Ben Tre 28.9 20.4 29.8 35.8 22.1 Tra Vinh 34.7 23.7 37.1 40.4 28.6 Vinh Long 22.4 16.0 23.6 26.0 18.5 Dong Thap 35.6 26.6 37.6 39.1 31.9 An Giang 36.8 31.6 39.4 40.3 33.2 Kien Giang 45.9 34.1 50.4 48.5 43.1 Can Tho 32.4 28.7 39.7 35.2 29.4 Hau Giang 37.0 28.3 40.1 39.5 34.5 Soc Trang 43.5 36.7 46.8 46.6 40.2 Bac Lieu 52.2 39.9 56.5 53.3 51.2 Ca Mau 43.4 28.8 47.8 44.6 42.1
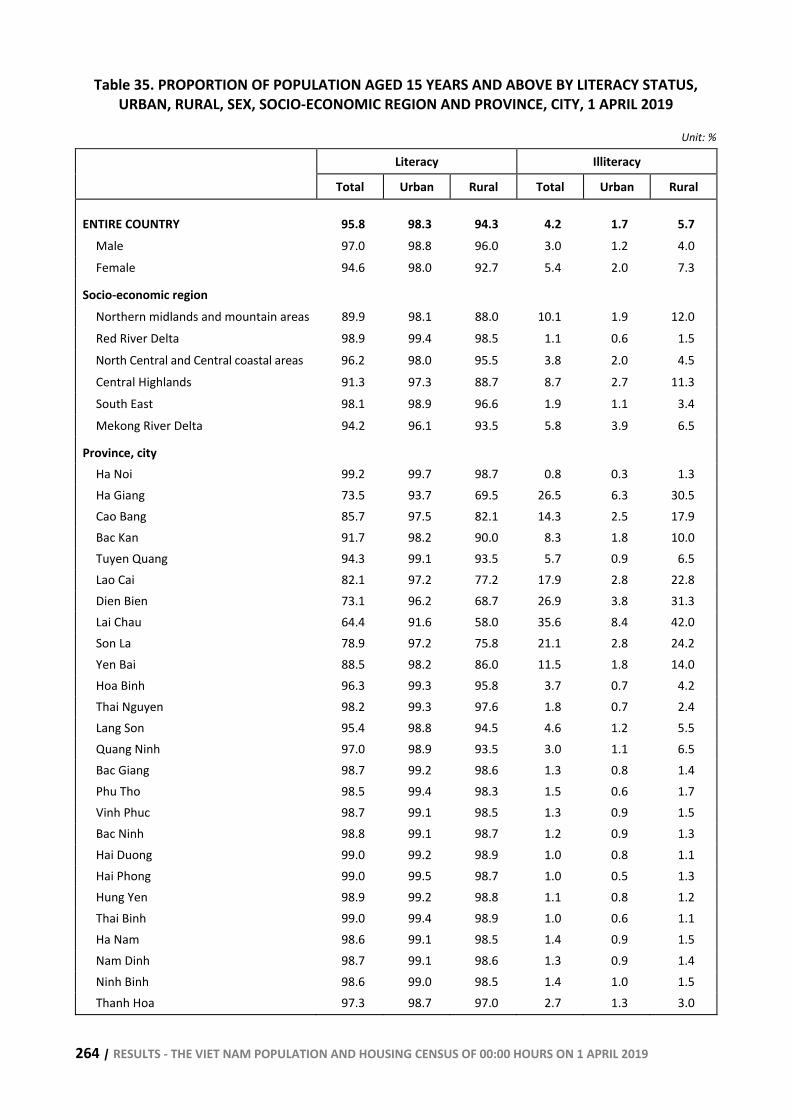
264 | RESULTS - THE VIET NAM POPULATION AND HOUSING CENSUS OF 00:00 HOURS ON 1 APRIL 2019
Table 35. PROPORTION OF POPULATION AGED 15 YEARS AND ABOVE BY LITERACY STATUS, URBAN, RURAL, SEX, SOCIO-ECONOMIC REGION AND PROVINCE, CITY, 1 APRIL 2019
Unit: %
Literacy Illiteracy
Total Urban Rural Total Urban Rural
ENTIRE COUNTRY 95.8 98.3 94.3 4.2 1.7 5.7 Male 97.0 98.8 96.0 3.0 1.2 4.0 Female 94.6 98.0 92.7 5.4 2.0 7.3
Socio-economic region Northern midlands and mountain areas 89.9 98.1 88.0 10.1 1.9 12.0 Red River Delta 98.9 99.4 98.5 1.1 0.6 1.5 North Central and Central coastal areas 96.2 98.0 95.5 3.8 2.0 4.5 Central Highlands 91.3 97.3 88.7 8.7 2.7 11.3 South East 98.1 98.9 96.6 1.9 1.1 3.4 Mekong River Delta 94.2 96.1 93.5 5.8 3.9 6.5
Province, city Ha Noi 99.2 99.7 98.7 0.8 0.3 1.3 Ha Giang 73.5 93.7 69.5 26.5 6.3 30.5 Cao Bang 85.7 97.5 82.1 14.3 2.5 17.9 Bac Kan 91.7 98.2 90.0 8.3 1.8 10.0 Tuyen Quang 94.3 99.1 93.5 5.7 0.9 6.5 Lao Cai 82.1 97.2 77.2 17.9 2.8 22.8 Dien Bien 73.1 96.2 68.7 26.9 3.8 31.3 Lai Chau 64.4 91.6 58.0 35.6 8.4 42.0 Son La 78.9 97.2 75.8 21.1 2.8 24.2 Yen Bai 88.5 98.2 86.0 11.5 1.8 14.0 Hoa Binh 96.3 99.3 95.8 3.7 0.7 4.2 Thai Nguyen 98.2 99.3 97.6 1.8 0.7 2.4 Lang Son 95.4 98.8 94.5 4.6 1.2 5.5 Quang Ninh 97.0 98.9 93.5 3.0 1.1 6.5 Bac Giang 98.7 99.2 98.6 1.3 0.8 1.4 Phu Tho 98.5 99.4 98.3 1.5 0.6 1.7 Vinh Phuc 98.7 99.1 98.5 1.3 0.9 1.5 Bac Ninh 98.8 99.1 98.7 1.2 0.9 1.3 Hai Duong 99.0 99.2 98.9 1.0 0.8 1.1 Hai Phong 99.0 99.5 98.7 1.0 0.5 1.3 Hung Yen 98.9 99.2 98.8 1.1 0.8 1.2 Thai Binh 99.0 99.4 98.9 1.0 0.6 1.1 Ha Nam 98.6 99.1 98.5 1.4 0.9 1.5 Nam Dinh 98.7 99.1 98.6 1.3 0.9 1.4 Ninh Binh 98.6 99.0 98.5 1.4 1.0 1.5 Thanh Hoa 97.3 98.7 97.0 2.7 1.3 3.0
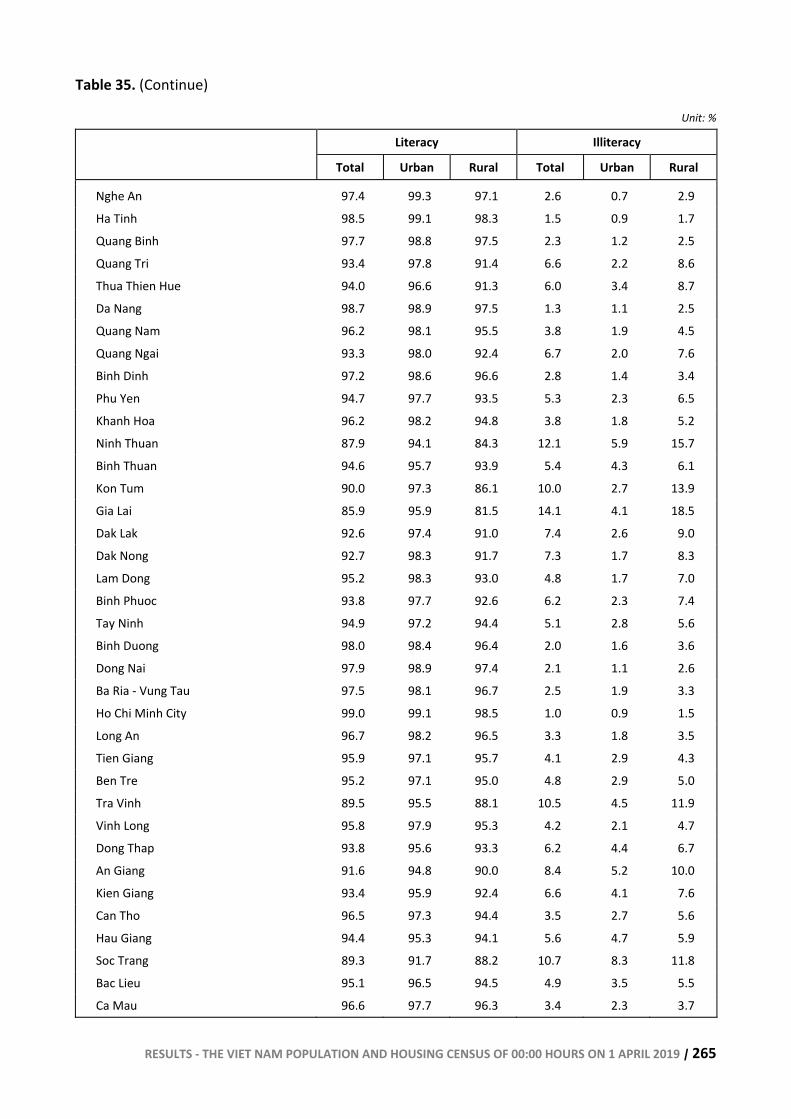
RESULTS - THE VIET NAM POPULATION AND HOUSING CENSUS OF 00:00 HOURS ON 1 APRIL 2019 | 265
Table 35. (Continue)
Unit: %
Literacy Illiteracy
Total Urban Rural Total Urban Rural
Nghe An 97.4 99.3 97.1 2.6 0.7 2.9
Ha Tinh 98.5 99.1 98.3 1.5 0.9 1.7
Quang Binh 97.7 98.8 97.5 2.3 1.2 2.5
Quang Tri 93.4 97.8 91.4 6.6 2.2 8.6
Thua Thien Hue 94.0 96.6 91.3 6.0 3.4 8.7
Da Nang 98.7 98.9 97.5 1.3 1.1 2.5
Quang Nam 96.2 98.1 95.5 3.8 1.9 4.5
Quang Ngai 93.3 98.0 92.4 6.7 2.0 7.6
Binh Dinh 97.2 98.6 96.6 2.8 1.4 3.4
Phu Yen 94.7 97.7 93.5 5.3 2.3 6.5
Khanh Hoa 96.2 98.2 94.8 3.8 1.8 5.2
Ninh Thuan 87.9 94.1 84.3 12.1 5.9 15.7
Binh Thuan 94.6 95.7 93.9 5.4 4.3 6.1
Kon Tum 90.0 97.3 86.1 10.0 2.7 13.9
Gia Lai 85.9 95.9 81.5 14.1 4.1 18.5
Dak Lak 92.6 97.4 91.0 7.4 2.6 9.0
Dak Nong 92.7 98.3 91.7 7.3 1.7 8.3
Lam Dong 95.2 98.3 93.0 4.8 1.7 7.0
Binh Phuoc 93.8 97.7 92.6 6.2 2.3 7.4
Tay Ninh 94.9 97.2 94.4 5.1 2.8 5.6
Binh Duong 98.0 98.4 96.4 2.0 1.6 3.6
Dong Nai 97.9 98.9 97.4 2.1 1.1 2.6
Ba Ria - Vung Tau 97.5 98.1 96.7 2.5 1.9 3.3
Ho Chi Minh City 99.0 99.1 98.5 1.0 0.9 1.5
Long An 96.7 98.2 96.5 3.3 1.8 3.5
Tien Giang 95.9 97.1 95.7 4.1 2.9 4.3
Ben Tre 95.2 97.1 95.0 4.8 2.9 5.0
Tra Vinh 89.5 95.5 88.1 10.5 4.5 11.9
Vinh Long 95.8 97.9 95.3 4.2 2.1 4.7
Dong Thap 93.8 95.6 93.3 6.2 4.4 6.7
An Giang 91.6 94.8 90.0 8.4 5.2 10.0
Kien Giang 93.4 95.9 92.4 6.6 4.1 7.6
Can Tho 96.5 97.3 94.4 3.5 2.7 5.6
Hau Giang 94.4 95.3 94.1 5.6 4.7 5.9
Soc Trang 89.3 91.7 88.2 10.7 8.3 11.8
Bac Lieu 95.1 96.5 94.5 4.9 3.5 5.5
Ca Mau 96.6 97.7 96.3 3.4 2.3 3.7
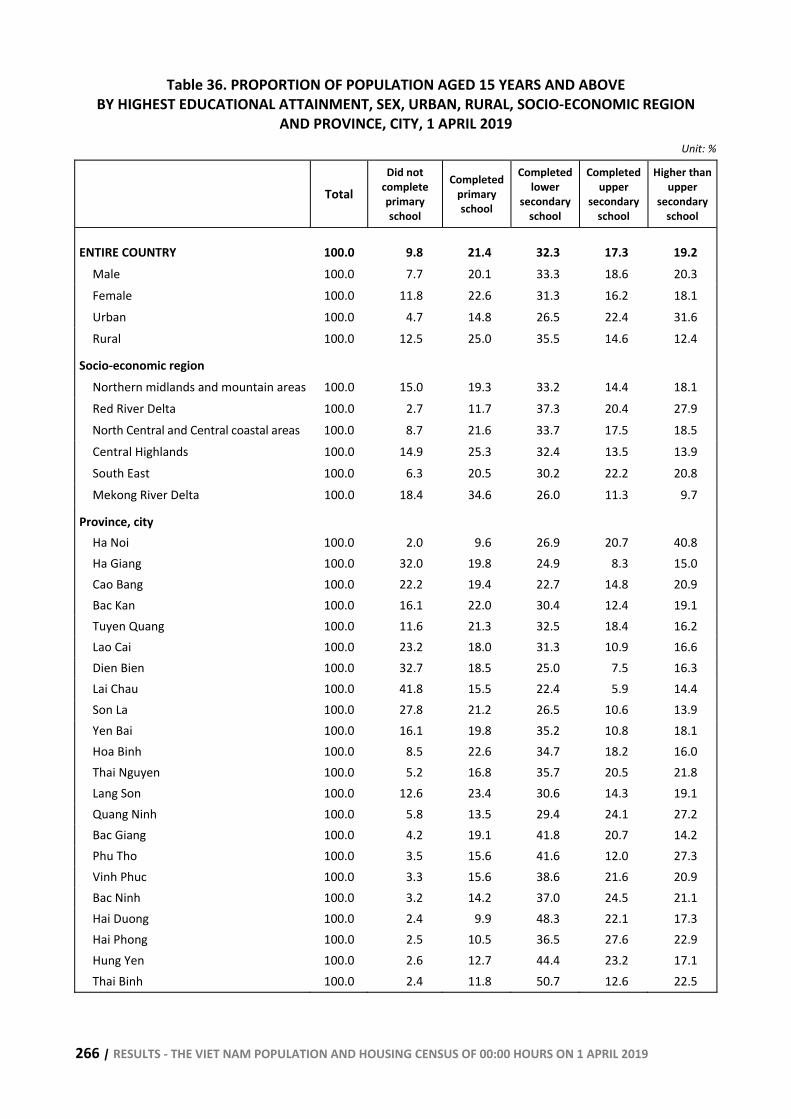
266 | RESULTS - THE VIET NAM POPULATION AND HOUSING CENSUS OF 00:00 HOURS ON 1 APRIL 2019
Table 36. PROPORTION OF POPULATION AGED 15 YEARS AND ABOVE BY HIGHEST EDUCATIONAL ATTAINMENT, SEX, URBAN, RURAL, SOCIO-ECONOMIC REGION
AND PROVINCE, CITY, 1 APRIL 2019 Unit: %
Total Did not
complete primary school
Completed primary school
Completed lower
secondary school
Completed upper
secondary school
Higher than upper
secondary school
ENTIRE COUNTRY 100.0 9.8 21.4 32.3 17.3 19.2 Male 100.0 7.7 20.1 33.3 18.6 20.3 Female 100.0 11.8 22.6 31.3 16.2 18.1 Urban 100.0 4.7 14.8 26.5 22.4 31.6 Rural 100.0 12.5 25.0 35.5 14.6 12.4
Socio-economic region Northern midlands and mountain areas 100.0 15.0 19.3 33.2 14.4 18.1 Red River Delta 100.0 2.7 11.7 37.3 20.4 27.9 North Central and Central coastal areas 100.0 8.7 21.6 33.7 17.5 18.5 Central Highlands 100.0 14.9 25.3 32.4 13.5 13.9 South East 100.0 6.3 20.5 30.2 22.2 20.8 Mekong River Delta 100.0 18.4 34.6 26.0 11.3 9.7
Province, city Ha Noi 100.0 2.0 9.6 26.9 20.7 40.8 Ha Giang 100.0 32.0 19.8 24.9 8.3 15.0 Cao Bang 100.0 22.2 19.4 22.7 14.8 20.9 Bac Kan 100.0 16.1 22.0 30.4 12.4 19.1 Tuyen Quang 100.0 11.6 21.3 32.5 18.4 16.2 Lao Cai 100.0 23.2 18.0 31.3 10.9 16.6 Dien Bien 100.0 32.7 18.5 25.0 7.5 16.3 Lai Chau 100.0 41.8 15.5 22.4 5.9 14.4 Son La 100.0 27.8 21.2 26.5 10.6 13.9 Yen Bai 100.0 16.1 19.8 35.2 10.8 18.1 Hoa Binh 100.0 8.5 22.6 34.7 18.2 16.0 Thai Nguyen 100.0 5.2 16.8 35.7 20.5 21.8 Lang Son 100.0 12.6 23.4 30.6 14.3 19.1 Quang Ninh 100.0 5.8 13.5 29.4 24.1 27.2 Bac Giang 100.0 4.2 19.1 41.8 20.7 14.2 Phu Tho 100.0 3.5 15.6 41.6 12.0 27.3 Vinh Phuc 100.0 3.3 15.6 38.6 21.6 20.9 Bac Ninh 100.0 3.2 14.2 37.0 24.5 21.1 Hai Duong 100.0 2.4 9.9 48.3 22.1 17.3 Hai Phong 100.0 2.5 10.5 36.5 27.6 22.9 Hung Yen 100.0 2.6 12.7 44.4 23.2 17.1 Thai Binh 100.0 2.4 11.8 50.7 12.6 22.5
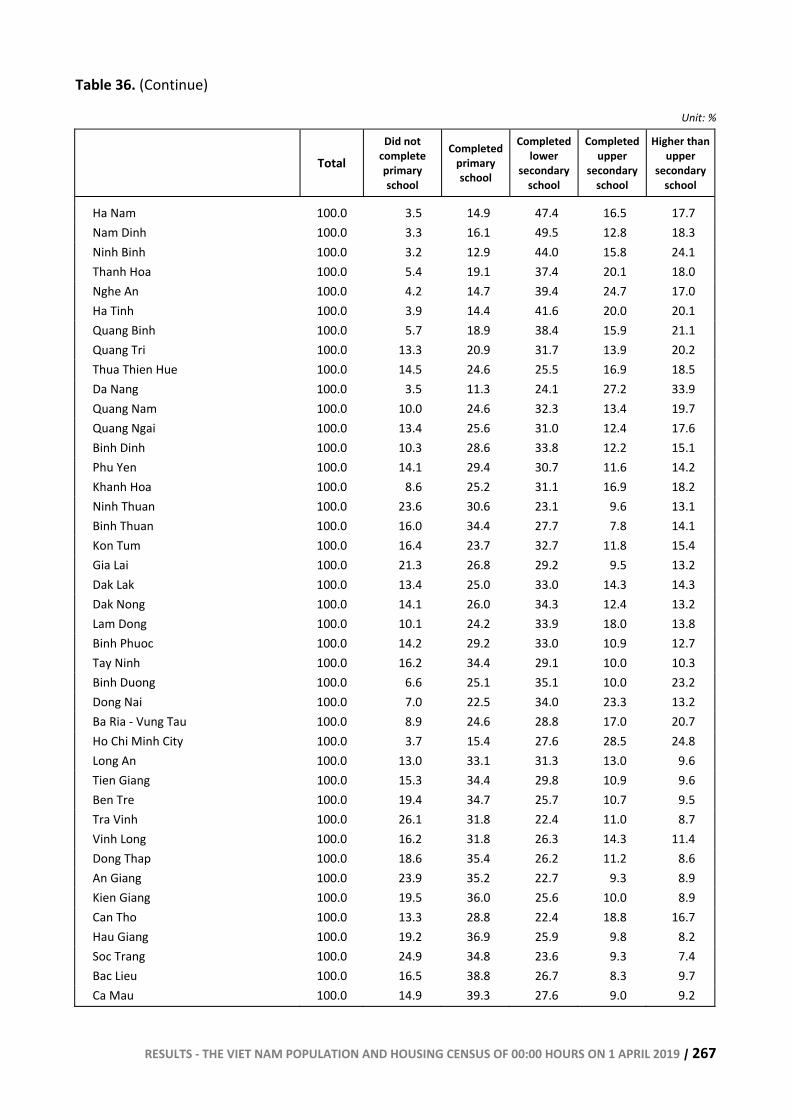
RESULTS - THE VIET NAM POPULATION AND HOUSING CENSUS OF 00:00 HOURS ON 1 APRIL 2019 | 267
Table 36. (Continue)
Unit: %
Total Did not
complete primary school
Completed primary school
Completed lower
secondary school
Completed upper
secondary school
Higher than upper
secondary school
Ha Nam 100.0 3.5 14.9 47.4 16.5 17.7 Nam Dinh 100.0 3.3 16.1 49.5 12.8 18.3 Ninh Binh 100.0 3.2 12.9 44.0 15.8 24.1 Thanh Hoa 100.0 5.4 19.1 37.4 20.1 18.0 Nghe An 100.0 4.2 14.7 39.4 24.7 17.0 Ha Tinh 100.0 3.9 14.4 41.6 20.0 20.1 Quang Binh 100.0 5.7 18.9 38.4 15.9 21.1 Quang Tri 100.0 13.3 20.9 31.7 13.9 20.2 Thua Thien Hue 100.0 14.5 24.6 25.5 16.9 18.5 Da Nang 100.0 3.5 11.3 24.1 27.2 33.9 Quang Nam 100.0 10.0 24.6 32.3 13.4 19.7 Quang Ngai 100.0 13.4 25.6 31.0 12.4 17.6 Binh Dinh 100.0 10.3 28.6 33.8 12.2 15.1 Phu Yen 100.0 14.1 29.4 30.7 11.6 14.2 Khanh Hoa 100.0 8.6 25.2 31.1 16.9 18.2 Ninh Thuan 100.0 23.6 30.6 23.1 9.6 13.1 Binh Thuan 100.0 16.0 34.4 27.7 7.8 14.1 Kon Tum 100.0 16.4 23.7 32.7 11.8 15.4 Gia Lai 100.0 21.3 26.8 29.2 9.5 13.2 Dak Lak 100.0 13.4 25.0 33.0 14.3 14.3 Dak Nong 100.0 14.1 26.0 34.3 12.4 13.2 Lam Dong 100.0 10.1 24.2 33.9 18.0 13.8 Binh Phuoc 100.0 14.2 29.2 33.0 10.9 12.7 Tay Ninh 100.0 16.2 34.4 29.1 10.0 10.3 Binh Duong 100.0 6.6 25.1 35.1 10.0 23.2 Dong Nai 100.0 7.0 22.5 34.0 23.3 13.2 Ba Ria - Vung Tau 100.0 8.9 24.6 28.8 17.0 20.7 Ho Chi Minh City 100.0 3.7 15.4 27.6 28.5 24.8 Long An 100.0 13.0 33.1 31.3 13.0 9.6 Tien Giang 100.0 15.3 34.4 29.8 10.9 9.6 Ben Tre 100.0 19.4 34.7 25.7 10.7 9.5 Tra Vinh 100.0 26.1 31.8 22.4 11.0 8.7 Vinh Long 100.0 16.2 31.8 26.3 14.3 11.4 Dong Thap 100.0 18.6 35.4 26.2 11.2 8.6 An Giang 100.0 23.9 35.2 22.7 9.3 8.9 Kien Giang 100.0 19.5 36.0 25.6 10.0 8.9 Can Tho 100.0 13.3 28.8 22.4 18.8 16.7 Hau Giang 100.0 19.2 36.9 25.9 9.8 8.2 Soc Trang 100.0 24.9 34.8 23.6 9.3 7.4 Bac Lieu 100.0 16.5 38.8 26.7 8.3 9.7 Ca Mau 100.0 14.9 39.3 27.6 9.0 9.2
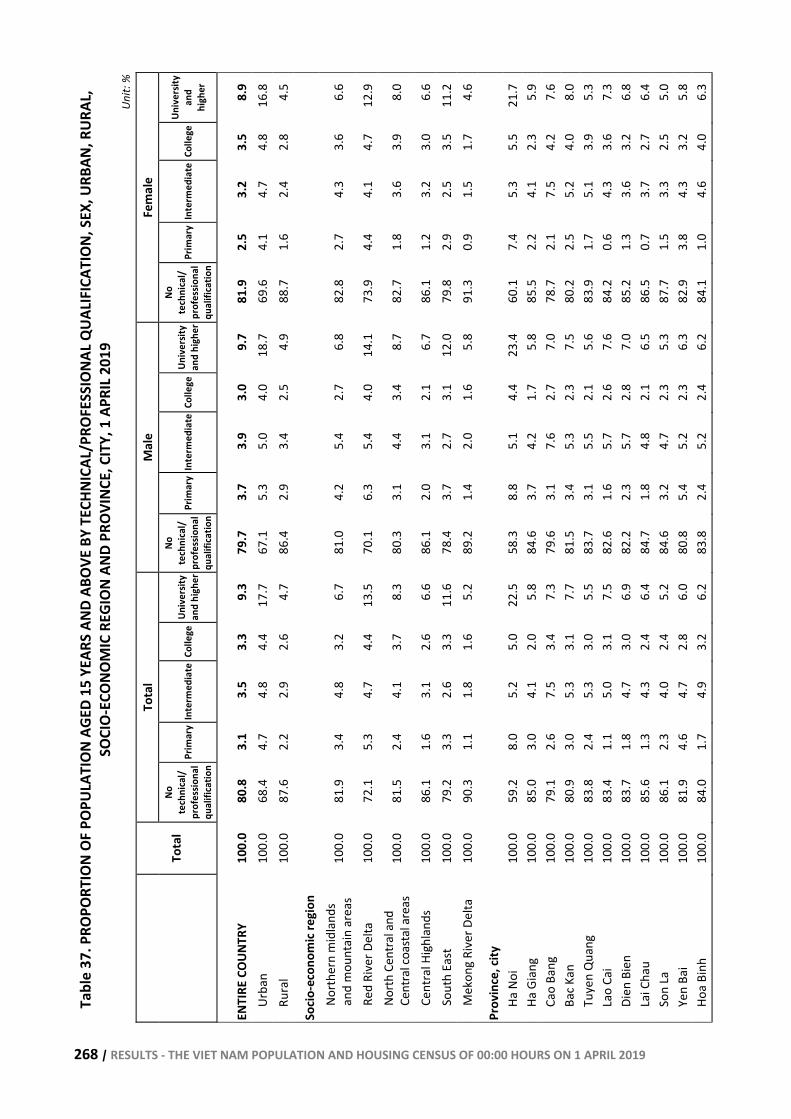
268 | RESULTS - THE VIET NAM POPULATION AND HOUSING CENSUS OF 00:00 HOURS ON 1 APRIL 2019
Tabl
e 37
. PRO
PORT
ION
OF P
OPUL
ATIO
N AG
ED 1
5 YE
ARS
AND
ABOV
E BY
TEC
HNIC
AL/P
ROFE
SSIO
NAL Q
UALIF
ICAT
ION,
SEX
, URB
AN, R
URAL
, SO
CIO-
ECON
OMIC
REG
ION
AND
PROV
INCE
, CIT
Y, 1
APR
IL 20
19
Unit:
%
Tota
l M
ale
Fem
ale
To
tal
No
tech
nica
l/pr
ofes
siona
l qu
alifi
catio
n
Prim
ary
Inte
rmed
iate
Colle
geUn
iver
sity
and
high
er
No
tech
nica
l/pr
ofes
siona
lqu
alifi
catio
n
Prim
ary
Inte
rmed
iate
Colle
geUn
iver
sity
and
high
er
No
tech
nica
l/pr
ofes
siona
l qu
alifi
catio
n
Prim
ary
Inte
rmed
iate
Colle
ge Un
iver
sity
and
high
er
ENTI
RE C
OUNT
RY
100.
0 80
.8
3.1
3.5
3.3
9.3
79.7
3.
7 3.
9 3.
0 9.
7 81
.9
2.5
3.2
3.5
8.9
Urba
n 10
0.0
68.4
4.
7 4.
8 4.
4 17
.7
67.1
5.
3 5.
0 4.
0 18
.7
69.6
4.
1 4.
7 4.
8 16
.8
Rura
l 10
0.0
87.6
2.
2 2.
9 2.
6 4.
7 86
.4
2.9
3.4
2.5
4.9
88.7
1.
6 2.
4 2.
8 4.
5
Socio
-eco
nom
ic re
gion
No
rthe
rn m
idla
nds
and
mou
ntai
n ar
eas
100.
0 81
.9
3.4
4.8
3.2
6.7
81.0
4.
2 5.
4 2.
7 6.
8 82
.8
2.7
4.3
3.6
6.6
Red
Rive
r Del
ta
100.
0 72
.1
5.3
4.7
4.4
13.5
70
.1
6.3
5.4
4.0
14.1
73
.9
4.4
4.1
4.7
12.9
No
rth C
entra
l and
Ce
ntra
l coa
stal
are
as
100.
0 81
.5
2.4
4.1
3.7
8.3
80.3
3.
1 4.
4 3.
4 8.
7 82
.7
1.8
3.6
3.9
8.0
Cent
ral H
ighl
ands
10
0.0
86.1
1.
6 3.
1 2.
6 6.
6 86
.1
2.0
3.1
2.1
6.7
86.1
1.
2 3.
2 3.
0 6.
6 So
uth
East
10
0.0
79.2
3.
3 2.
6 3.
3 11
.6
78.4
3.
7 2.
7 3.
1 12
.0
79.8
2.
9 2.
5 3.
5 11
.2
Mek
ong
Rive
r Del
ta
100.
0 90
.3
1.1
1.8
1.6
5.2
89.2
1.
4 2.
0 1.
6 5.
8 91
.3
0.9
1.5
1.7
4.6
Prov
ince
, city
Ha
Noi
10
0.0
59.2
8.
0 5.
2 5.
0 22
.5
58.3
8.
8 5.
1 4.
4 23
.4
60.1
7.
4 5.
3 5.
5 21
.7
Ha G
iang
10
0.0
85.0
3.
0 4.
1 2.
0 5.
8 84
.6
3.7
4.2
1.7
5.8
85.5
2.
2 4.
1 2.
3 5.
9 Ca
o Ba
ng
100.
0 79
.1
2.6
7.5
3.4
7.3
79.6
3.
1 7.
6 2.
7 7.
0 78
.7
2.1
7.5
4.2
7.6
Bac K
an
100.
0 80
.9
3.0
5.3
3.1
7.7
81.5
3.
4 5.
3 2.
3 7.
5 80
.2
2.5
5.2
4.0
8.0
Tuye
n Q
uang
10
0.0
83.8
2.
4 5.
3 3.
0 5.
5 83
.7
3.1
5.5
2.1
5.6
83.9
1.
7 5.
1 3.
9 5.
3 La
o Ca
i 10
0.0
83.4
1.
1 5.
0 3.
1 7.
5 82
.6
1.6
5.7
2.6
7.6
84.2
0.
6 4.
3 3.
6 7.
3 Di
en B
ien
100.
0 83
.7
1.8
4.7
3.0
6.9
82.2
2.
3 5.
7 2.
8 7.
0 85
.2
1.3
3.6
3.2
6.8
Lai C
hau
100.
0 85
.6
1.3
4.3
2.4
6.4
84.7
1.
8 4.
8 2.
1 6.
5 86
.5
0.7
3.7
2.7
6.4
Son
La
100.
0 86
.1
2.3
4.0
2.4
5.2
84.6
3.
2 4.
7 2.
3 5.
3 87
.7
1.5
3.3
2.5
5.0
Yen
Bai
100.
0 81
.9
4.6
4.7
2.8
6.0
80.8
5.
4 5.
2 2.
3 6.
3 82
.9
3.8
4.3
3.2
5.8
Hoa
Binh
10
0.0
84.0
1.
7 4.
9 3.
2 6.
2 83
.8
2.4
5.2
2.4
6.2
84.1
1.
0 4.
6 4.
0 6.
3
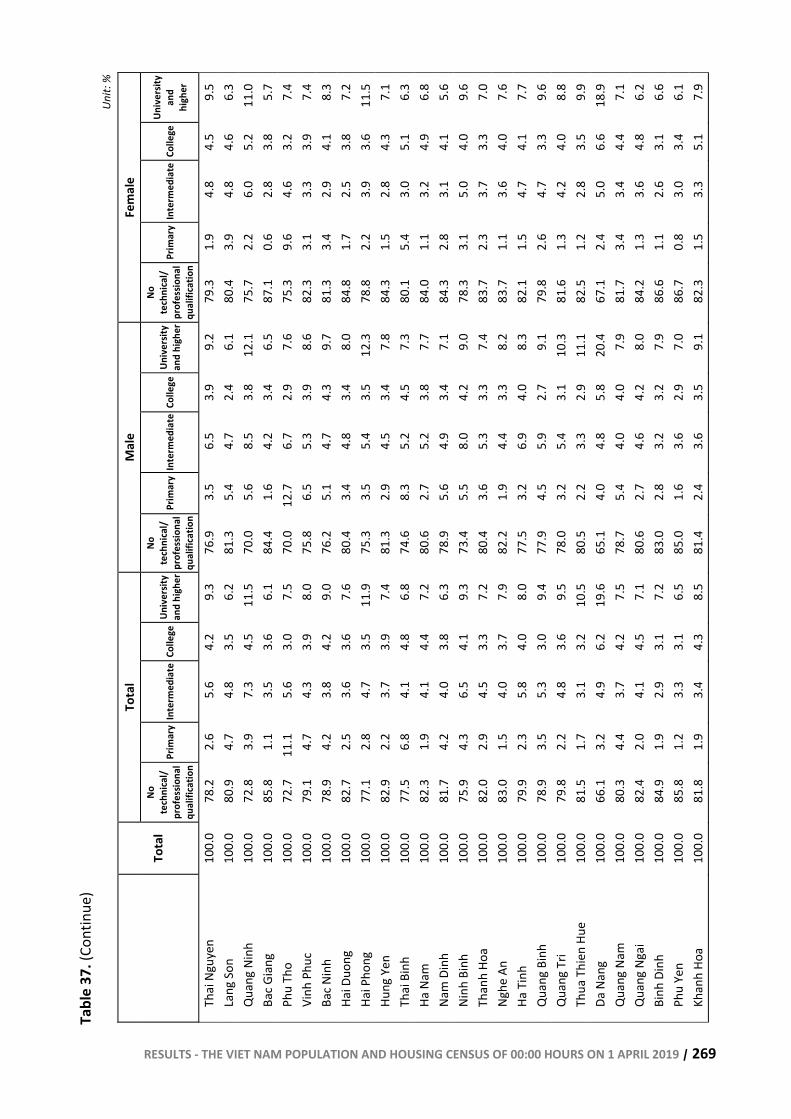
RESULTS - THE VIET NAM POPULATION AND HOUSING CENSUS OF 00:00 HOURS ON 1 APRIL 2019 | 269
Tabl
e 37
. (Co
ntin
ue)
Unit:
%
Tota
l M
ale
Fem
ale
To
tal
No
tech
nica
l/pr
ofes
siona
l qu
alifi
catio
n
Prim
ary
Inte
rmed
iate
Colle
geUn
iver
sity
and
high
er
No
tech
nica
l/pr
ofes
siona
lqu
alifi
catio
n
Prim
ary
Inte
rmed
iate
Colle
geUn
iver
sity
and
high
er
No
tech
nica
l/pr
ofes
siona
l qu
alifi
catio
n
Prim
ary
Inte
rmed
iate
Colle
ge Un
iver
sity
and
high
er
Thai
Ngu
yen
100.
0 78
.2
2.6
5.6
4.2
9.3
76.9
3.
5 6.
5 3.
9 9.
2 79
.3
1.9
4.8
4.5
9.5
Lang
Son
10
0.0
80.9
4.
7 4.
8 3.
5 6.
2 81
.3
5.4
4.7
2.4
6.1
80.4
3.
9 4.
8 4.
6 6.
3 Q
uang
Nin
h 10
0.0
72.8
3.
9 7.
3 4.
5 11
.5
70.0
5.
6 8.
5 3.
8 12
.1
75.7
2.
2 6.
0 5.
2 11
.0
Bac G
iang
10
0.0
85.8
1.
1 3.
5 3.
6 6.
1 84
.4
1.6
4.2
3.4
6.5
87.1
0.
6 2.
8 3.
8 5.
7 Ph
u Th
o 10
0.0
72.7
11
.1
5.6
3.0
7.5
70.0
12
.7
6.7
2.9
7.6
75.3
9.
6 4.
6 3.
2 7.
4 Vi
nh P
huc
100.
0 79
.1
4.7
4.3
3.9
8.0
75.8
6.
5 5.
3 3.
9 8.
6 82
.3
3.1
3.3
3.9
7.4
Bac N
inh
100.
0 78
.9
4.2
3.8
4.2
9.0
76.2
5.
1 4.
7 4.
3 9.
7 81
.3
3.4
2.9
4.1
8.3
Hai D
uong
10
0.0
82.7
2.
5 3.
6 3.
6 7.
6 80
.4
3.4
4.8
3.4
8.0
84.8
1.
7 2.
5 3.
8 7.
2 Ha
i Pho
ng
100.
0 77
.1
2.8
4.7
3.5
11.9
75
.3
3.5
5.4
3.5
12.3
78
.8
2.2
3.9
3.6
11.5
Hu
ng Y
en
100.
0 82
.9
2.2
3.7
3.9
7.4
81.3
2.
9 4.
5 3.
4 7.
8 84
.3
1.5
2.8
4.3
7.1
Thai
Bin
h 10
0.0
77.5
6.
8 4.
1 4.
8 6.
8 74
.6
8.3
5.2
4.5
7.3
80.1
5.
4 3.
0 5.
1 6.
3 Ha
Nam
10
0.0
82.3
1.
9 4.
1 4.
4 7.
2 80
.6
2.7
5.2
3.8
7.7
84.0
1.
1 3.
2 4.
9 6.
8 Na
m D
inh
100.
0 81
.7
4.2
4.0
3.8
6.3
78.9
5.
6 4.
9 3.
4 7.
1 84
.3
2.8
3.1
4.1
5.6
Ninh
Bin
h 10
0.0
75.9
4.
3 6.
5 4.
1 9.
3 73
.4
5.5
8.0
4.2
9.0
78.3
3.
1 5.
0 4.
0 9.
6 Th
anh
Hoa
100.
0 82
.0
2.9
4.5
3.3
7.2
80.4
3.
6 5.
3 3.
3 7.
4 83
.7
2.3
3.7
3.3
7.0
Nghe
An
100.
0 83
.0
1.5
4.0
3.7
7.9
82.2
1.
9 4.
4 3.
3 8.
2 83
.7
1.1
3.6
4.0
7.6
Ha T
inh
100.
0 79
.9
2.3
5.8
4.0
8.0
77.5
3.
2 6.
9 4.
0 8.
3 82
.1
1.5
4.7
4.1
7.7
Qua
ng B
inh
100.
0 78
.9
3.5
5.3
3.0
9.4
77.9
4.
5 5.
9 2.
7 9.
1 79
.8
2.6
4.7
3.3
9.6
Qua
ng T
ri 10
0.0
79.8
2.
2 4.
8 3.
6 9.
5 78
.0
3.2
5.4
3.1
10.3
81
.6
1.3
4.2
4.0
8.8
Thua
Thi
en H
ue
100.
0 81
.5
1.7
3.1
3.2
10.5
80
.5
2.2
3.3
2.9
11.1
82
.5
1.2
2.8
3.5
9.9
Da N
ang
100.
0 66
.1
3.2
4.9
6.2
19.6
65
.1
4.0
4.8
5.8
20.4
67
.1
2.4
5.0
6.6
18.9
Q
uang
Nam
10
0.0
80.3
4.
4 3.
7 4.
2 7.
5 78
.7
5.4
4.0
4.0
7.9
81.7
3.
4 3.
4 4.
4 7.
1 Q
uang
Nga
i 10
0.0
82.4
2.
0 4.
1 4.
5 7.
1 80
.6
2.7
4.6
4.2
8.0
84.2
1.
3 3.
6 4.
8 6.
2 Bi
nh D
inh
100.
0 84
.9
1.9
2.9
3.1
7.2
83.0
2.
8 3.
2 3.
2 7.
9 86
.6
1.1
2.6
3.1
6.6
Phu
Yen
100.
0 85
.8
1.2
3.3
3.1
6.5
85.0
1.
6 3.
6 2.
9 7.
0 86
.7
0.8
3.0
3.4
6.1
Khan
h Ho
a 10
0.0
81.8
1.
9 3.
4 4.
3 8.
5 81
.4
2.4
3.6
3.5
9.1
82.3
1.
5 3.
3 5.
1 7.
9
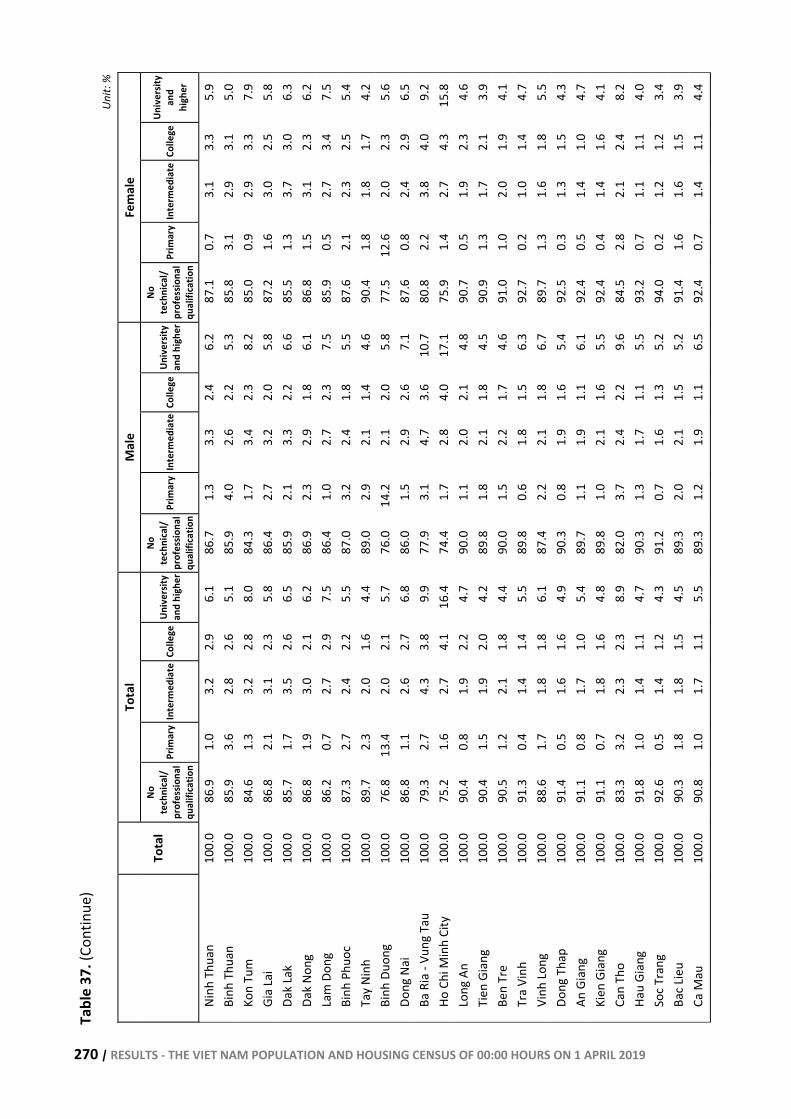
270 | RESULTS - THE VIET NAM POPULATION AND HOUSING CENSUS OF 00:00 HOURS ON 1 APRIL 2019
Tabl
e 37
. (Co
ntin
ue)
Unit:
%
Tota
l M
ale
Fem
ale
To
tal
No
tech
nica
l/pr
ofes
siona
l qu
alifi
catio
n
Prim
ary
Inte
rmed
iate
Colle
geUn
iver
sity
and
high
er
No
tech
nica
l/pr
ofes
siona
lqu
alifi
catio
n
Prim
ary
Inte
rmed
iate
Colle
geUn
iver
sity
and
high
er
No
tech
nica
l/pr
ofes
siona
l qu
alifi
catio
n
Prim
ary
Inte
rmed
iate
Colle
ge Un
iver
sity
and
high
er
Ninh
Thu
an
100.
0 86
.9
1.0
3.2
2.9
6.1
86.7
1.
3 3.
3 2.
4 6.
2 87
.1
0.7
3.1
3.3
5.9
Binh
Thu
an
100.
0 85
.9
3.6
2.8
2.6
5.1
85.9
4.
0 2.
6 2.
2 5.
3 85
.8
3.1
2.9
3.1
5.0
Kon
Tum
10
0.0
84.6
1.
3 3.
2 2.
8 8.
0 84
.3
1.7
3.4
2.3
8.2
85.0
0.
9 2.
9 3.
3 7.
9 Gi
a La
i 10
0.0
86.8
2.
1 3.
1 2.
3 5.
8 86
.4
2.7
3.2
2.0
5.8
87.2
1.
6 3.
0 2.
5 5.
8 Da
k La
k 10
0.0
85.7
1.
7 3.
5 2.
6 6.
5 85
.9
2.1
3.3
2.2
6.6
85.5
1.
3 3.
7 3.
0 6.
3 Da
k No
ng
100.
0 86
.8
1.9
3.0
2.1
6.2
86.9
2.
3 2.
9 1.
8 6.
1 86
.8
1.5
3.1
2.3
6.2
Lam
Don
g 10
0.0
86.2
0.
7 2.
7 2.
9 7.
5 86
.4
1.0
2.7
2.3
7.5
85.9
0.
5 2.
7 3.
4 7.
5 Bi
nh P
huoc
10
0.0
87.3
2.
7 2.
4 2.
2 5.
5 87
.0
3.2
2.4
1.8
5.5
87.6
2.
1 2.
3 2.
5 5.
4 Ta
y Ni
nh
100.
0 89
.7
2.3
2.0
1.6
4.4
89.0
2.
9 2.
1 1.
4 4.
6 90
.4
1.8
1.8
1.7
4.2
Binh
Duo
ng
100.
0 76
.8
13.4
2.
0 2.
1 5.
7 76
.0
14.2
2.
1 2.
0 5.
8 77
.5
12.6
2.
0 2.
3 5.
6 Do
ng N
ai
100.
0 86
.8
1.1
2.6
2.7
6.8
86.0
1.
5 2.
9 2.
6 7.
1 87
.6
0.8
2.4
2.9
6.5
Ba R
ia -
Vung
Tau
10
0.0
79.3
2.
7 4.
3 3.
8 9.
9 77
.9
3.1
4.7
3.6
10.7
80
.8
2.2
3.8
4.0
9.2
Ho C
hi M
inh
City
10
0.0
75.2
1.
6 2.
7 4.
1 16
.4
74.4
1.
7 2.
8 4.
0 17
.1
75.9
1.
4 2.
7 4.
3 15
.8
Long
An
100.
0 90
.4
0.8
1.9
2.2
4.7
90.0
1.
1 2.
0 2.
1 4.
8 90
.7
0.5
1.9
2.3
4.6
Tien
Gia
ng
100.
0 90
.4
1.5
1.9
2.0
4.2
89.8
1.
8 2.
1 1.
8 4.
5 90
.9
1.3
1.7
2.1
3.9
Ben
Tre
100.
0 90
.5
1.2
2.1
1.8
4.4
90.0
1.
5 2.
2 1.
7 4.
6 91
.0
1.0
2.0
1.9
4.1
Tra
Vinh
10
0.0
91.3
0.
4 1.
4 1.
4 5.
5 89
.8
0.6
1.8
1.5
6.3
92.7
0.
2 1.
0 1.
4 4.
7 Vi
nh Lo
ng
100.
0 88
.6
1.7
1.8
1.8
6.1
87.4
2.
2 2.
1 1.
8 6.
7 89
.7
1.3
1.6
1.8
5.5
Dong
Tha
p 10
0.0
91.4
0.
5 1.
6 1.
6 4.
9 90
.3
0.8
1.9
1.6
5.4
92.5
0.
3 1.
3 1.
5 4.
3 An
Gia
ng
100.
0 91
.1
0.8
1.7
1.0
5.4
89.7
1.
1 1.
9 1.
1 6.
1 92
.4
0.5
1.4
1.0
4.7
Kien
Gia
ng
100.
0 91
.1
0.7
1.8
1.6
4.8
89.8
1.
0 2.
1 1.
6 5.
5 92
.4
0.4
1.4
1.6
4.1
Can
Tho
100.
0 83
.3
3.2
2.3
2.3
8.9
82.0
3.
7 2.
4 2.
2 9.
6 84
.5
2.8
2.1
2.4
8.2
Hau
Gian
g 10
0.0
91.8
1.
0 1.
4 1.
1 4.
7 90
.3
1.3
1.7
1.1
5.5
93.2
0.
7 1.
1 1.
1 4.
0 So
c Tra
ng
100.
0 92
.6
0.5
1.4
1.2
4.3
91.2
0.
7 1.
6 1.
3 5.
2 94
.0
0.2
1.2
1.2
3.4
Bac L
ieu
100.
0 90
.3
1.8
1.8
1.5
4.5
89.3
2.
0 2.
1 1.
5 5.
2 91
.4
1.6
1.6
1.5
3.9
Ca M
au
100.
0 90
.8
1.0
1.7
1.1
5.5
89.3
1.
2 1.
9 1.
1 6.
5 92
.4
0.7
1.4
1.1
4.4
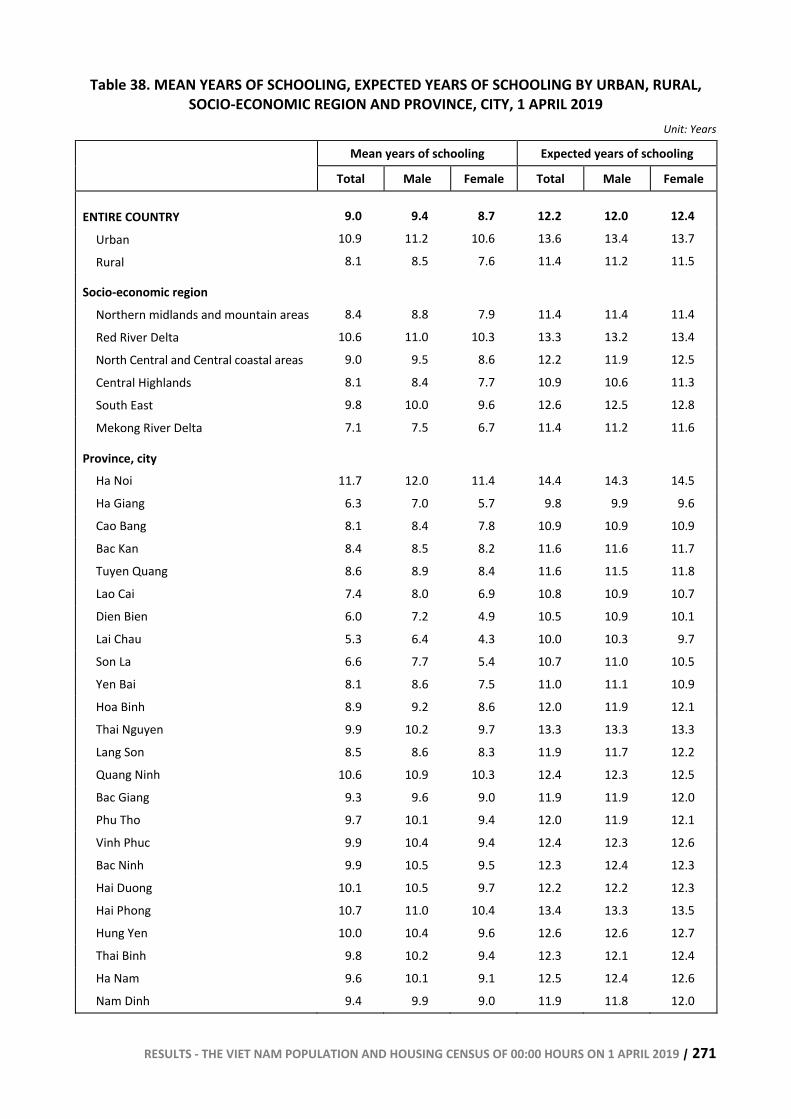
RESULTS - THE VIET NAM POPULATION AND HOUSING CENSUS OF 00:00 HOURS ON 1 APRIL 2019 | 271
Table 38. MEAN YEARS OF SCHOOLING, EXPECTED YEARS OF SCHOOLING BY URBAN, RURAL, SOCIO-ECONOMIC REGION AND PROVINCE, CITY, 1 APRIL 2019
Unit: Years
Mean years of schooling Expected years of schooling
Total Male Female Total Male Female
ENTIRE COUNTRY 9.0 9.4 8.7 12.2 12.0 12.4
Urban 10.9 11.2 10.6 13.6 13.4 13.7
Rural 8.1 8.5 7.6 11.4 11.2 11.5
Socio-economic region
Northern midlands and mountain areas 8.4 8.8 7.9 11.4 11.4 11.4
Red River Delta 10.6 11.0 10.3 13.3 13.2 13.4
North Central and Central coastal areas 9.0 9.5 8.6 12.2 11.9 12.5
Central Highlands 8.1 8.4 7.7 10.9 10.6 11.3
South East 9.8 10.0 9.6 12.6 12.5 12.8
Mekong River Delta 7.1 7.5 6.7 11.4 11.2 11.6
Province, city
Ha Noi 11.7 12.0 11.4 14.4 14.3 14.5
Ha Giang 6.3 7.0 5.7 9.8 9.9 9.6
Cao Bang 8.1 8.4 7.8 10.9 10.9 10.9
Bac Kan 8.4 8.5 8.2 11.6 11.6 11.7
Tuyen Quang 8.6 8.9 8.4 11.6 11.5 11.8
Lao Cai 7.4 8.0 6.9 10.8 10.9 10.7
Dien Bien 6.0 7.2 4.9 10.5 10.9 10.1
Lai Chau 5.3 6.4 4.3 10.0 10.3 9.7
Son La 6.6 7.7 5.4 10.7 11.0 10.5
Yen Bai 8.1 8.6 7.5 11.0 11.1 10.9
Hoa Binh 8.9 9.2 8.6 12.0 11.9 12.1
Thai Nguyen 9.9 10.2 9.7 13.3 13.3 13.3
Lang Son 8.5 8.6 8.3 11.9 11.7 12.2
Quang Ninh 10.6 10.9 10.3 12.4 12.3 12.5
Bac Giang 9.3 9.6 9.0 11.9 11.9 12.0
Phu Tho 9.7 10.1 9.4 12.0 11.9 12.1
Vinh Phuc 9.9 10.4 9.4 12.4 12.3 12.6
Bac Ninh 9.9 10.5 9.5 12.3 12.4 12.3
Hai Duong 10.1 10.5 9.7 12.2 12.2 12.3
Hai Phong 10.7 11.0 10.4 13.4 13.3 13.5
Hung Yen 10.0 10.4 9.6 12.6 12.6 12.7
Thai Binh 9.8 10.2 9.4 12.3 12.1 12.4
Ha Nam 9.6 10.1 9.1 12.5 12.4 12.6
Nam Dinh 9.4 9.9 9.0 11.9 11.8 12.0
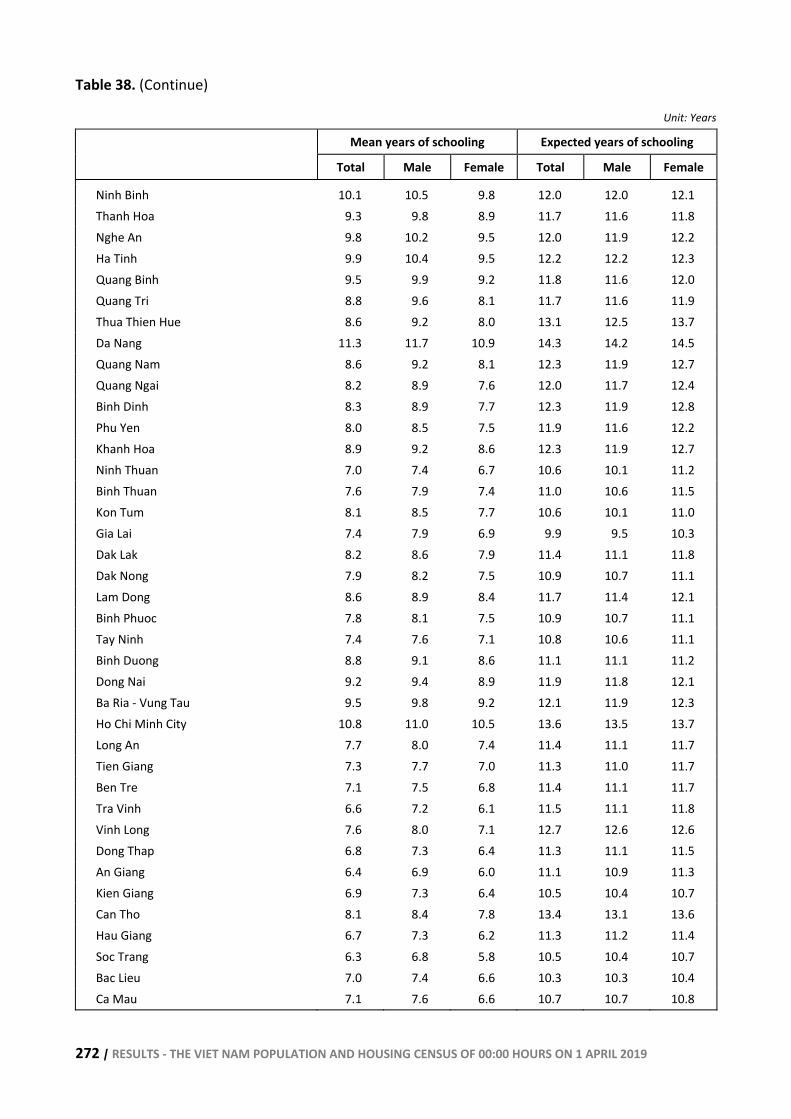
272 | RESULTS - THE VIET NAM POPULATION AND HOUSING CENSUS OF 00:00 HOURS ON 1 APRIL 2019
Table 38. (Continue)
Unit: Years
Mean years of schooling Expected years of schooling
Total Male Female Total Male Female
Ninh Binh 10.1 10.5 9.8 12.0 12.0 12.1 Thanh Hoa 9.3 9.8 8.9 11.7 11.6 11.8 Nghe An 9.8 10.2 9.5 12.0 11.9 12.2 Ha Tinh 9.9 10.4 9.5 12.2 12.2 12.3 Quang Binh 9.5 9.9 9.2 11.8 11.6 12.0 Quang Tri 8.8 9.6 8.1 11.7 11.6 11.9 Thua Thien Hue 8.6 9.2 8.0 13.1 12.5 13.7 Da Nang 11.3 11.7 10.9 14.3 14.2 14.5 Quang Nam 8.6 9.2 8.1 12.3 11.9 12.7 Quang Ngai 8.2 8.9 7.6 12.0 11.7 12.4 Binh Dinh 8.3 8.9 7.7 12.3 11.9 12.8 Phu Yen 8.0 8.5 7.5 11.9 11.6 12.2 Khanh Hoa 8.9 9.2 8.6 12.3 11.9 12.7 Ninh Thuan 7.0 7.4 6.7 10.6 10.1 11.2 Binh Thuan 7.6 7.9 7.4 11.0 10.6 11.5 Kon Tum 8.1 8.5 7.7 10.6 10.1 11.0 Gia Lai 7.4 7.9 6.9 9.9 9.5 10.3 Dak Lak 8.2 8.6 7.9 11.4 11.1 11.8 Dak Nong 7.9 8.2 7.5 10.9 10.7 11.1 Lam Dong 8.6 8.9 8.4 11.7 11.4 12.1 Binh Phuoc 7.8 8.1 7.5 10.9 10.7 11.1 Tay Ninh 7.4 7.6 7.1 10.8 10.6 11.1 Binh Duong 8.8 9.1 8.6 11.1 11.1 11.2 Dong Nai 9.2 9.4 8.9 11.9 11.8 12.1 Ba Ria - Vung Tau 9.5 9.8 9.2 12.1 11.9 12.3 Ho Chi Minh City 10.8 11.0 10.5 13.6 13.5 13.7 Long An 7.7 8.0 7.4 11.4 11.1 11.7 Tien Giang 7.3 7.7 7.0 11.3 11.0 11.7 Ben Tre 7.1 7.5 6.8 11.4 11.1 11.7 Tra Vinh 6.6 7.2 6.1 11.5 11.1 11.8 Vinh Long 7.6 8.0 7.1 12.7 12.6 12.6 Dong Thap 6.8 7.3 6.4 11.3 11.1 11.5 An Giang 6.4 6.9 6.0 11.1 10.9 11.3 Kien Giang 6.9 7.3 6.4 10.5 10.4 10.7 Can Tho 8.1 8.4 7.8 13.4 13.1 13.6 Hau Giang 6.7 7.3 6.2 11.3 11.2 11.4 Soc Trang 6.3 6.8 5.8 10.5 10.4 10.7 Bac Lieu 7.0 7.4 6.6 10.3 10.3 10.4 Ca Mau 7.1 7.6 6.6 10.7 10.7 10.8
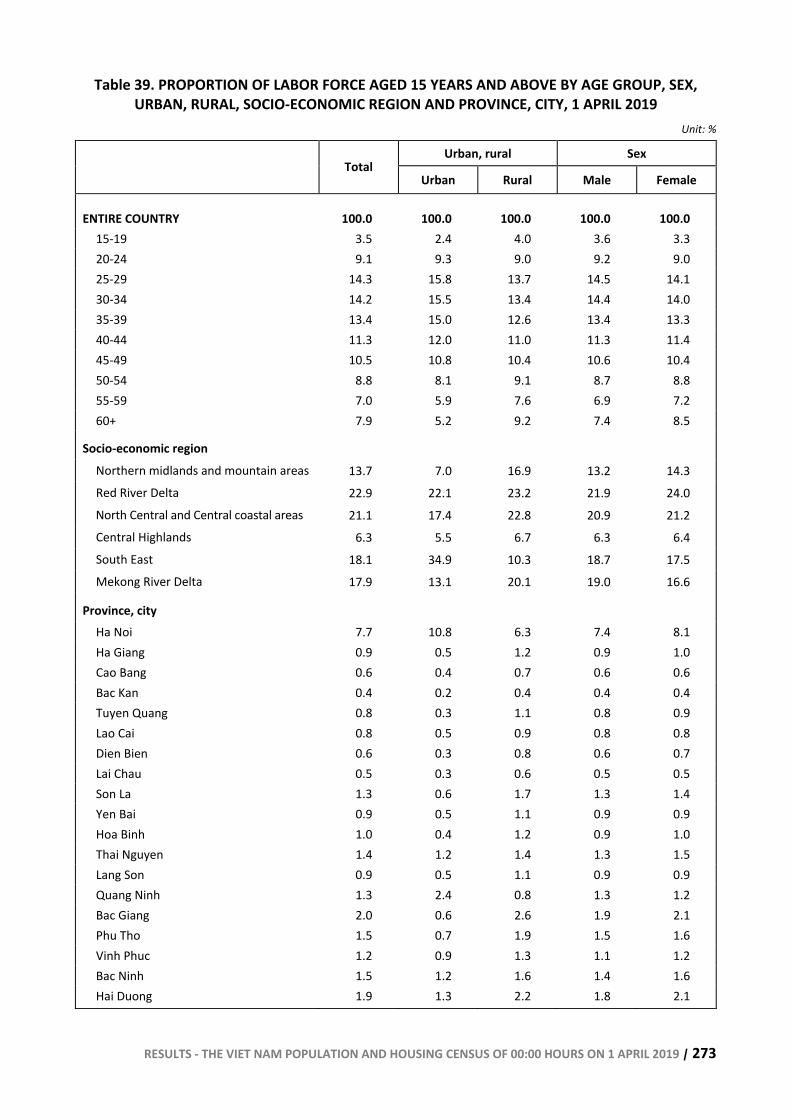
RESULTS - THE VIET NAM POPULATION AND HOUSING CENSUS OF 00:00 HOURS ON 1 APRIL 2019 | 273
Table 39. PROPORTION OF LABOR FORCE AGED 15 YEARS AND ABOVE BY AGE GROUP, SEX, URBAN, RURAL, SOCIO-ECONOMIC REGION AND PROVINCE, CITY, 1 APRIL 2019
Unit: %
Urban, rural Sex Total
Urban Rural Male Female
ENTIRE COUNTRY 100.0 100.0 100.0 100.0 100.0 15-19 3.5 2.4 4.0 3.6 3.3 20-24 9.1 9.3 9.0 9.2 9.0 25-29 14.3 15.8 13.7 14.5 14.1 30-34 14.2 15.5 13.4 14.4 14.0 35-39 13.4 15.0 12.6 13.4 13.3 40-44 11.3 12.0 11.0 11.3 11.4 45-49 10.5 10.8 10.4 10.6 10.4 50-54 8.8 8.1 9.1 8.7 8.8 55-59 7.0 5.9 7.6 6.9 7.2 60+ 7.9 5.2 9.2 7.4 8.5
Socio-economic region Northern midlands and mountain areas 13.7 7.0 16.9 13.2 14.3 Red River Delta 22.9 22.1 23.2 21.9 24.0 North Central and Central coastal areas 21.1 17.4 22.8 20.9 21.2 Central Highlands 6.3 5.5 6.7 6.3 6.4 South East 18.1 34.9 10.3 18.7 17.5 Mekong River Delta 17.9 13.1 20.1 19.0 16.6
Province, city Ha Noi 7.7 10.8 6.3 7.4 8.1 Ha Giang 0.9 0.5 1.2 0.9 1.0 Cao Bang 0.6 0.4 0.7 0.6 0.6 Bac Kan 0.4 0.2 0.4 0.4 0.4 Tuyen Quang 0.8 0.3 1.1 0.8 0.9 Lao Cai 0.8 0.5 0.9 0.8 0.8 Dien Bien 0.6 0.3 0.8 0.6 0.7 Lai Chau 0.5 0.3 0.6 0.5 0.5 Son La 1.3 0.6 1.7 1.3 1.4 Yen Bai 0.9 0.5 1.1 0.9 0.9 Hoa Binh 1.0 0.4 1.2 0.9 1.0 Thai Nguyen 1.4 1.2 1.4 1.3 1.5 Lang Son 0.9 0.5 1.1 0.9 0.9 Quang Ninh 1.3 2.4 0.8 1.3 1.2 Bac Giang 2.0 0.6 2.6 1.9 2.1 Phu Tho 1.5 0.7 1.9 1.5 1.6 Vinh Phuc 1.2 0.9 1.3 1.1 1.2 Bac Ninh 1.5 1.2 1.6 1.4 1.6 Hai Duong 1.9 1.3 2.2 1.8 2.1
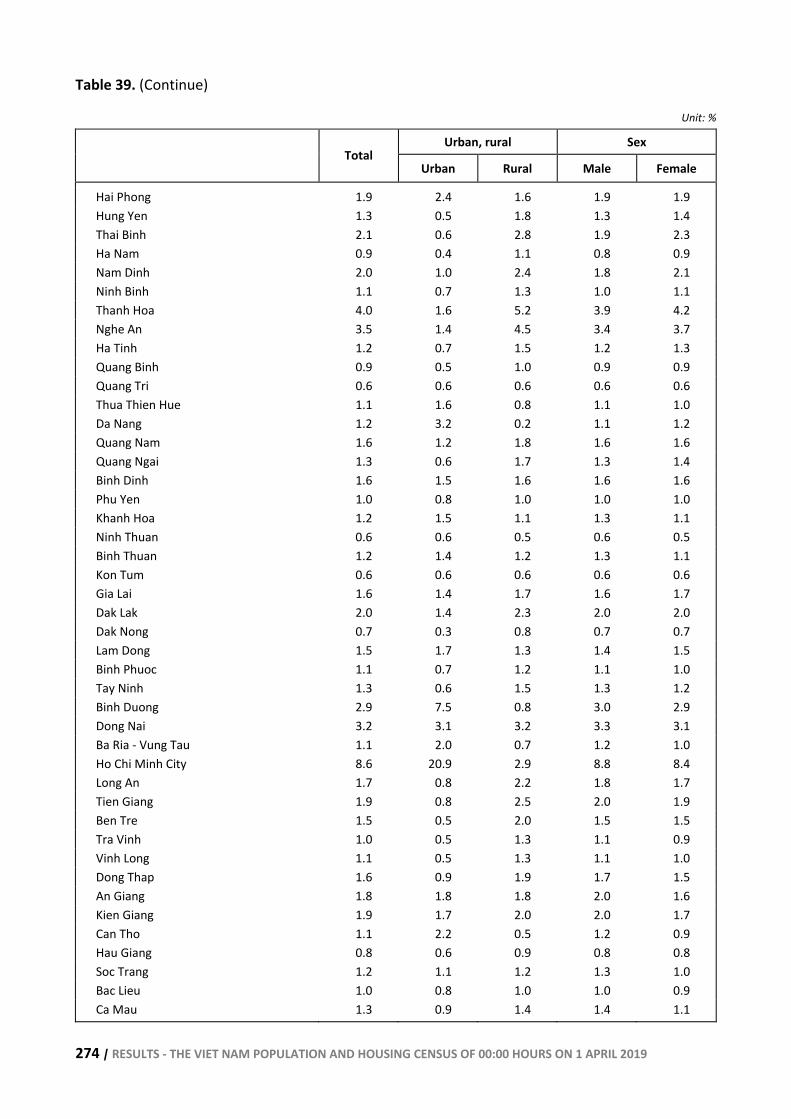
274 | RESULTS - THE VIET NAM POPULATION AND HOUSING CENSUS OF 00:00 HOURS ON 1 APRIL 2019
Table 39. (Continue)
Unit: %
Urban, rural Sex Total
Urban Rural Male Female
Hai Phong 1.9 2.4 1.6 1.9 1.9 Hung Yen 1.3 0.5 1.8 1.3 1.4 Thai Binh 2.1 0.6 2.8 1.9 2.3 Ha Nam 0.9 0.4 1.1 0.8 0.9 Nam Dinh 2.0 1.0 2.4 1.8 2.1 Ninh Binh 1.1 0.7 1.3 1.0 1.1 Thanh Hoa 4.0 1.6 5.2 3.9 4.2 Nghe An 3.5 1.4 4.5 3.4 3.7 Ha Tinh 1.2 0.7 1.5 1.2 1.3 Quang Binh 0.9 0.5 1.0 0.9 0.9 Quang Tri 0.6 0.6 0.6 0.6 0.6 Thua Thien Hue 1.1 1.6 0.8 1.1 1.0 Da Nang 1.2 3.2 0.2 1.1 1.2 Quang Nam 1.6 1.2 1.8 1.6 1.6 Quang Ngai 1.3 0.6 1.7 1.3 1.4 Binh Dinh 1.6 1.5 1.6 1.6 1.6 Phu Yen 1.0 0.8 1.0 1.0 1.0 Khanh Hoa 1.2 1.5 1.1 1.3 1.1 Ninh Thuan 0.6 0.6 0.5 0.6 0.5 Binh Thuan 1.2 1.4 1.2 1.3 1.1 Kon Tum 0.6 0.6 0.6 0.6 0.6 Gia Lai 1.6 1.4 1.7 1.6 1.7 Dak Lak 2.0 1.4 2.3 2.0 2.0 Dak Nong 0.7 0.3 0.8 0.7 0.7 Lam Dong 1.5 1.7 1.3 1.4 1.5 Binh Phuoc 1.1 0.7 1.2 1.1 1.0 Tay Ninh 1.3 0.6 1.5 1.3 1.2 Binh Duong 2.9 7.5 0.8 3.0 2.9 Dong Nai 3.2 3.1 3.2 3.3 3.1 Ba Ria - Vung Tau 1.1 2.0 0.7 1.2 1.0 Ho Chi Minh City 8.6 20.9 2.9 8.8 8.4 Long An 1.7 0.8 2.2 1.8 1.7 Tien Giang 1.9 0.8 2.5 2.0 1.9 Ben Tre 1.5 0.5 2.0 1.5 1.5 Tra Vinh 1.0 0.5 1.3 1.1 0.9 Vinh Long 1.1 0.5 1.3 1.1 1.0 Dong Thap 1.6 0.9 1.9 1.7 1.5 An Giang 1.8 1.8 1.8 2.0 1.6 Kien Giang 1.9 1.7 2.0 2.0 1.7 Can Tho 1.1 2.2 0.5 1.2 0.9 Hau Giang 0.8 0.6 0.9 0.8 0.8 Soc Trang 1.2 1.1 1.2 1.3 1.0 Bac Lieu 1.0 0.8 1.0 1.0 0.9 Ca Mau 1.3 0.9 1.4 1.4 1.1
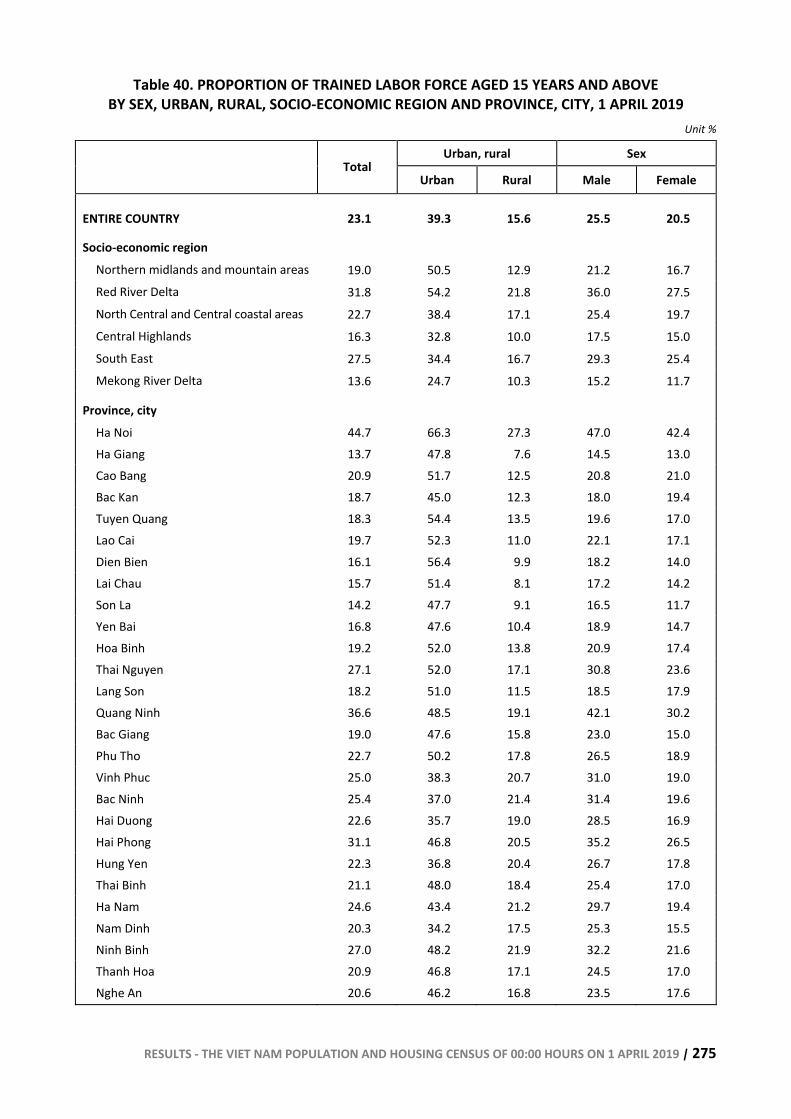
RESULTS - THE VIET NAM POPULATION AND HOUSING CENSUS OF 00:00 HOURS ON 1 APRIL 2019 | 275
Table 40. PROPORTION OF TRAINED LABOR FORCE AGED 15 YEARS AND ABOVE BY SEX, URBAN, RURAL, SOCIO-ECONOMIC REGION AND PROVINCE, CITY, 1 APRIL 2019
Unit %
Urban, rural Sex Total
Urban Rural Male Female
ENTIRE COUNTRY 23.1 39.3 15.6 25.5 20.5
Socio-economic region Northern midlands and mountain areas 19.0 50.5 12.9 21.2 16.7 Red River Delta 31.8 54.2 21.8 36.0 27.5 North Central and Central coastal areas 22.7 38.4 17.1 25.4 19.7 Central Highlands 16.3 32.8 10.0 17.5 15.0 South East 27.5 34.4 16.7 29.3 25.4 Mekong River Delta 13.6 24.7 10.3 15.2 11.7
Province, city Ha Noi 44.7 66.3 27.3 47.0 42.4 Ha Giang 13.7 47.8 7.6 14.5 13.0 Cao Bang 20.9 51.7 12.5 20.8 21.0 Bac Kan 18.7 45.0 12.3 18.0 19.4 Tuyen Quang 18.3 54.4 13.5 19.6 17.0 Lao Cai 19.7 52.3 11.0 22.1 17.1 Dien Bien 16.1 56.4 9.9 18.2 14.0 Lai Chau 15.7 51.4 8.1 17.2 14.2 Son La 14.2 47.7 9.1 16.5 11.7 Yen Bai 16.8 47.6 10.4 18.9 14.7 Hoa Binh 19.2 52.0 13.8 20.9 17.4 Thai Nguyen 27.1 52.0 17.1 30.8 23.6 Lang Son 18.2 51.0 11.5 18.5 17.9 Quang Ninh 36.6 48.5 19.1 42.1 30.2 Bac Giang 19.0 47.6 15.8 23.0 15.0 Phu Tho 22.7 50.2 17.8 26.5 18.9 Vinh Phuc 25.0 38.3 20.7 31.0 19.0 Bac Ninh 25.4 37.0 21.4 31.4 19.6 Hai Duong 22.6 35.7 19.0 28.5 16.9 Hai Phong 31.1 46.8 20.5 35.2 26.5 Hung Yen 22.3 36.8 20.4 26.7 17.8 Thai Binh 21.1 48.0 18.4 25.4 17.0 Ha Nam 24.6 43.4 21.2 29.7 19.4 Nam Dinh 20.3 34.2 17.5 25.3 15.5 Ninh Binh 27.0 48.2 21.9 32.2 21.6 Thanh Hoa 20.9 46.8 17.1 24.5 17.0 Nghe An 20.6 46.2 16.8 23.5 17.6
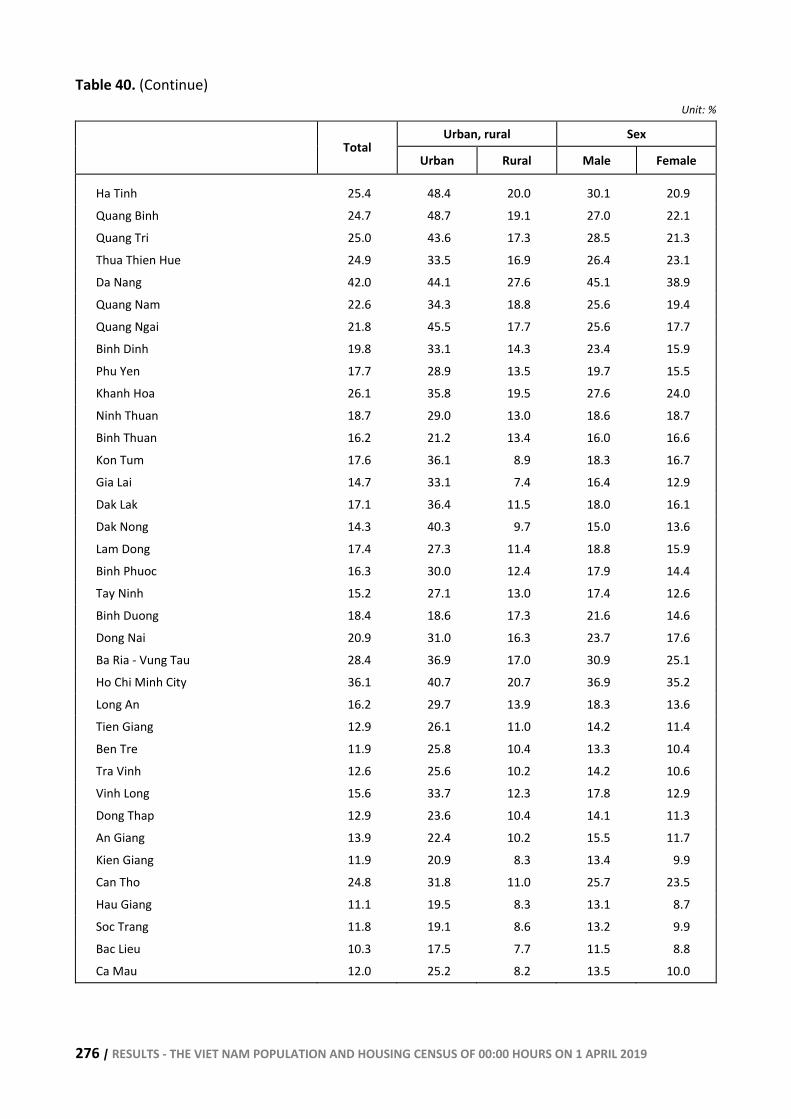
276 | RESULTS - THE VIET NAM POPULATION AND HOUSING CENSUS OF 00:00 HOURS ON 1 APRIL 2019
Table 40. (Continue)
Unit: %
Urban, rural Sex Total
Urban Rural Male Female
Ha Tinh 25.4 48.4 20.0 30.1 20.9 Quang Binh 24.7 48.7 19.1 27.0 22.1 Quang Tri 25.0 43.6 17.3 28.5 21.3 Thua Thien Hue 24.9 33.5 16.9 26.4 23.1 Da Nang 42.0 44.1 27.6 45.1 38.9 Quang Nam 22.6 34.3 18.8 25.6 19.4 Quang Ngai 21.8 45.5 17.7 25.6 17.7 Binh Dinh 19.8 33.1 14.3 23.4 15.9 Phu Yen 17.7 28.9 13.5 19.7 15.5 Khanh Hoa 26.1 35.8 19.5 27.6 24.0 Ninh Thuan 18.7 29.0 13.0 18.6 18.7 Binh Thuan 16.2 21.2 13.4 16.0 16.6 Kon Tum 17.6 36.1 8.9 18.3 16.7 Gia Lai 14.7 33.1 7.4 16.4 12.9 Dak Lak 17.1 36.4 11.5 18.0 16.1 Dak Nong 14.3 40.3 9.7 15.0 13.6 Lam Dong 17.4 27.3 11.4 18.8 15.9 Binh Phuoc 16.3 30.0 12.4 17.9 14.4 Tay Ninh 15.2 27.1 13.0 17.4 12.6 Binh Duong 18.4 18.6 17.3 21.6 14.6 Dong Nai 20.9 31.0 16.3 23.7 17.6 Ba Ria - Vung Tau 28.4 36.9 17.0 30.9 25.1 Ho Chi Minh City 36.1 40.7 20.7 36.9 35.2 Long An 16.2 29.7 13.9 18.3 13.6 Tien Giang 12.9 26.1 11.0 14.2 11.4 Ben Tre 11.9 25.8 10.4 13.3 10.4 Tra Vinh 12.6 25.6 10.2 14.2 10.6 Vinh Long 15.6 33.7 12.3 17.8 12.9 Dong Thap 12.9 23.6 10.4 14.1 11.3 An Giang 13.9 22.4 10.2 15.5 11.7 Kien Giang 11.9 20.9 8.3 13.4 9.9 Can Tho 24.8 31.8 11.0 25.7 23.5 Hau Giang 11.1 19.5 8.3 13.1 8.7 Soc Trang 11.8 19.1 8.6 13.2 9.9 Bac Lieu 10.3 17.5 7.7 11.5 8.8 Ca Mau 12.0 25.2 8.2 13.5 10.0
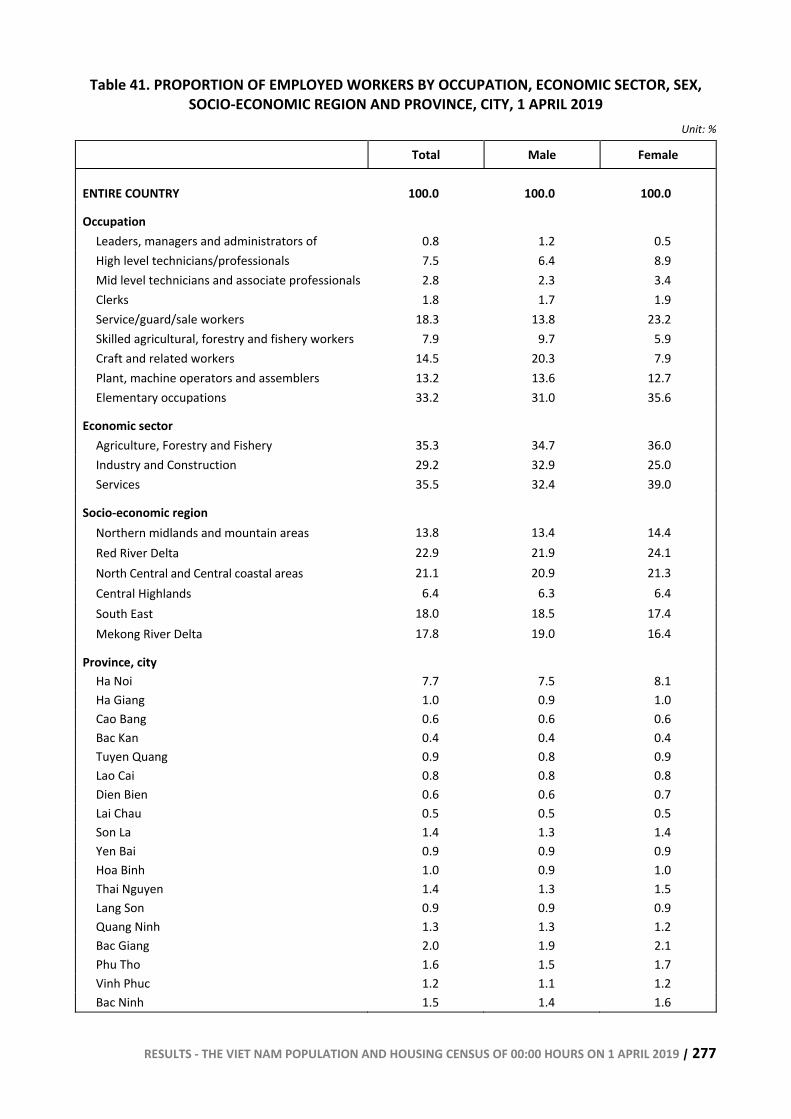
RESULTS - THE VIET NAM POPULATION AND HOUSING CENSUS OF 00:00 HOURS ON 1 APRIL 2019 | 277
Table 41. PROPORTION OF EMPLOYED WORKERS BY OCCUPATION, ECONOMIC SECTOR, SEX, SOCIO-ECONOMIC REGION AND PROVINCE, CITY, 1 APRIL 2019
Unit: %
Total Male Female
ENTIRE COUNTRY 100.0 100.0 100.0
Occupation Leaders, managers and administrators of 0.8 1.2 0.5 High level technicians/professionals 7.5 6.4 8.9 Mid level technicians and associate professionals 2.8 2.3 3.4 Clerks 1.8 1.7 1.9 Service/guard/sale workers 18.3 13.8 23.2 Skilled agricultural, forestry and fishery workers 7.9 9.7 5.9 Craft and related workers 14.5 20.3 7.9 Plant, machine operators and assemblers 13.2 13.6 12.7 Elementary occupations 33.2 31.0 35.6
Economic sector Agriculture, Forestry and Fishery 35.3 34.7 36.0 Industry and Construction 29.2 32.9 25.0 Services 35.5 32.4 39.0
Socio-economic region Northern midlands and mountain areas 13.8 13.4 14.4 Red River Delta 22.9 21.9 24.1 North Central and Central coastal areas 21.1 20.9 21.3 Central Highlands 6.4 6.3 6.4 South East 18.0 18.5 17.4 Mekong River Delta 17.8 19.0 16.4
Province, city Ha Noi 7.7 7.5 8.1 Ha Giang 1.0 0.9 1.0 Cao Bang 0.6 0.6 0.6 Bac Kan 0.4 0.4 0.4 Tuyen Quang 0.9 0.8 0.9 Lao Cai 0.8 0.8 0.8 Dien Bien 0.6 0.6 0.7 Lai Chau 0.5 0.5 0.5 Son La 1.4 1.3 1.4 Yen Bai 0.9 0.9 0.9 Hoa Binh 1.0 0.9 1.0 Thai Nguyen 1.4 1.3 1.5 Lang Son 0.9 0.9 0.9 Quang Ninh 1.3 1.3 1.2 Bac Giang 2.0 1.9 2.1 Phu Tho 1.6 1.5 1.7 Vinh Phuc 1.2 1.1 1.2 Bac Ninh 1.5 1.4 1.6
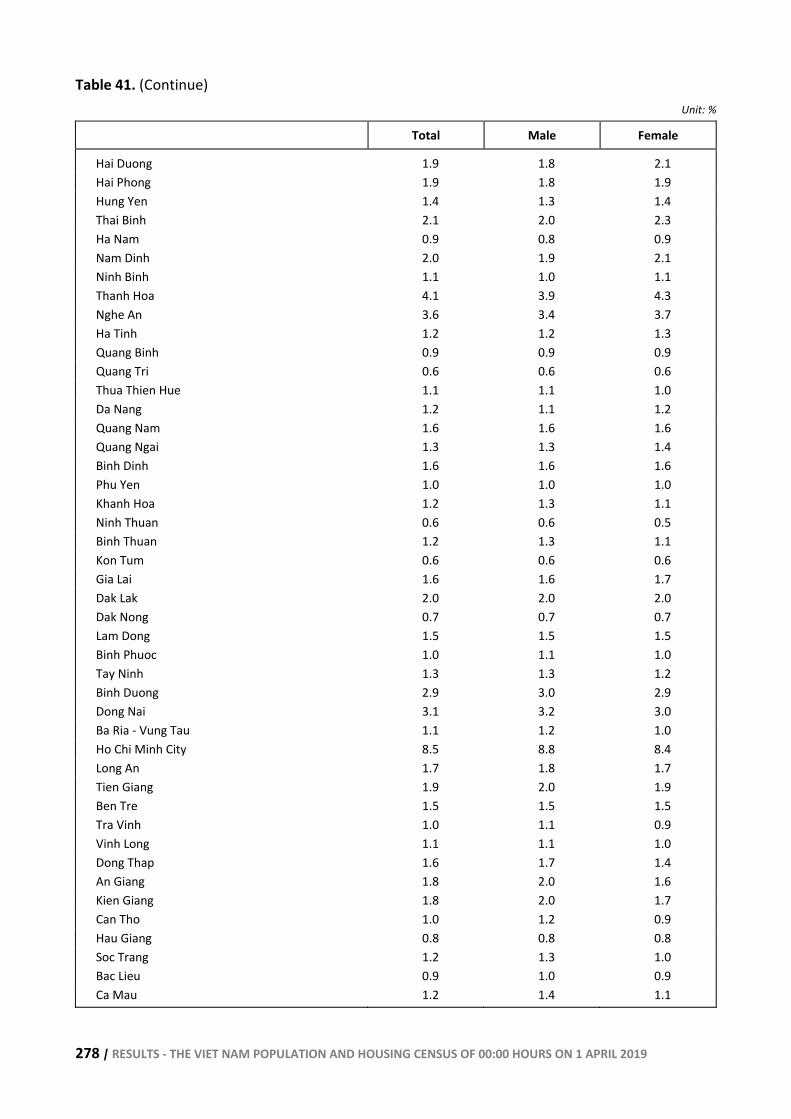
278 | RESULTS - THE VIET NAM POPULATION AND HOUSING CENSUS OF 00:00 HOURS ON 1 APRIL 2019
Table 41. (Continue)
Unit: %
Total Male Female
Hai Duong 1.9 1.8 2.1 Hai Phong 1.9 1.8 1.9 Hung Yen 1.4 1.3 1.4 Thai Binh 2.1 2.0 2.3 Ha Nam 0.9 0.8 0.9 Nam Dinh 2.0 1.9 2.1 Ninh Binh 1.1 1.0 1.1 Thanh Hoa 4.1 3.9 4.3 Nghe An 3.6 3.4 3.7 Ha Tinh 1.2 1.2 1.3 Quang Binh 0.9 0.9 0.9 Quang Tri 0.6 0.6 0.6 Thua Thien Hue 1.1 1.1 1.0 Da Nang 1.2 1.1 1.2 Quang Nam 1.6 1.6 1.6 Quang Ngai 1.3 1.3 1.4 Binh Dinh 1.6 1.6 1.6 Phu Yen 1.0 1.0 1.0 Khanh Hoa 1.2 1.3 1.1 Ninh Thuan 0.6 0.6 0.5 Binh Thuan 1.2 1.3 1.1 Kon Tum 0.6 0.6 0.6 Gia Lai 1.6 1.6 1.7 Dak Lak 2.0 2.0 2.0 Dak Nong 0.7 0.7 0.7 Lam Dong 1.5 1.5 1.5 Binh Phuoc 1.0 1.1 1.0 Tay Ninh 1.3 1.3 1.2 Binh Duong 2.9 3.0 2.9 Dong Nai 3.1 3.2 3.0 Ba Ria - Vung Tau 1.1 1.2 1.0 Ho Chi Minh City 8.5 8.8 8.4 Long An 1.7 1.8 1.7 Tien Giang 1.9 2.0 1.9 Ben Tre 1.5 1.5 1.5 Tra Vinh 1.0 1.1 0.9 Vinh Long 1.1 1.1 1.0 Dong Thap 1.6 1.7 1.4 An Giang 1.8 2.0 1.6 Kien Giang 1.8 2.0 1.7 Can Tho 1.0 1.2 0.9 Hau Giang 0.8 0.8 0.8 Soc Trang 1.2 1.3 1.0 Bac Lieu 0.9 1.0 0.9 Ca Mau 1.2 1.4 1.1
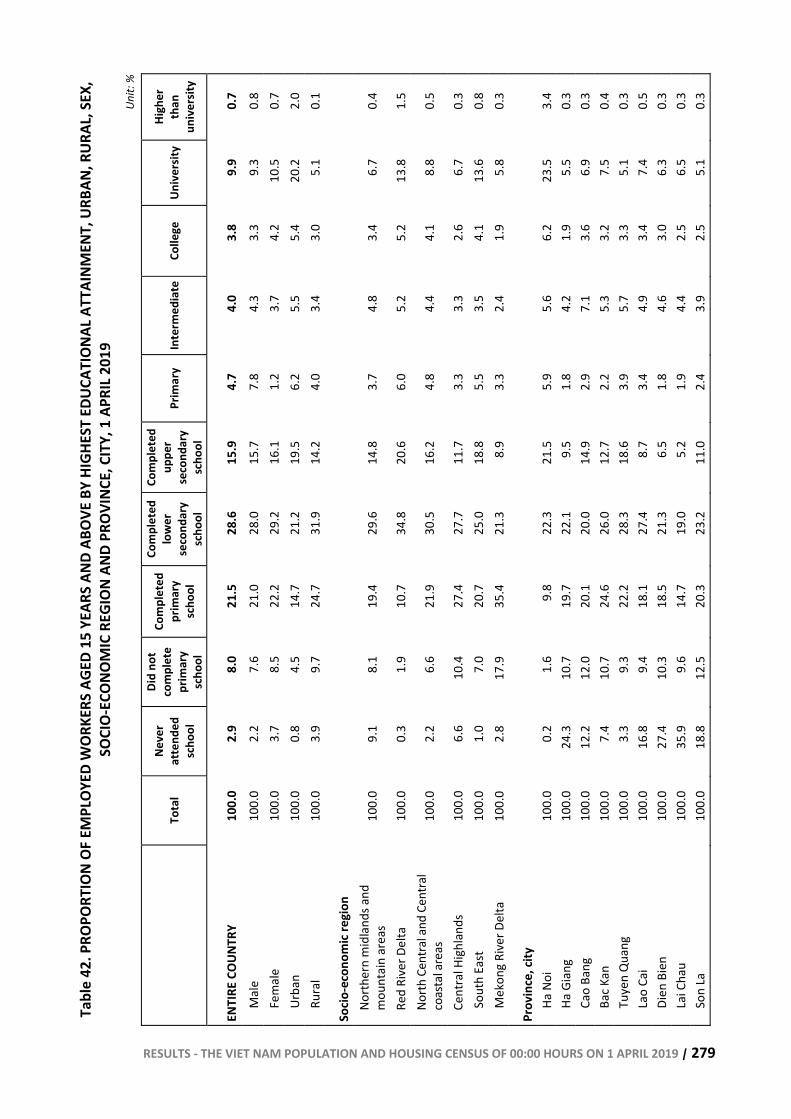
RESULTS - THE VIET NAM POPULATION AND HOUSING CENSUS OF 00:00 HOURS ON 1 APRIL 2019 | 279
Tabl
e 42
. PRO
PORT
ION
OF E
MPL
OYED
WOR
KERS
AGE
D 15
YEA
RS A
ND A
BOVE
BY
HIGH
EST
EDUC
ATIO
NAL A
TTAI
NMEN
T, U
RBAN
, RUR
AL, S
EX,
SOCI
O-EC
ONOM
IC R
EGIO
N AN
D PR
OVIN
CE, C
ITY,
1 A
PRIL
2019
Un
it: %
To
tal
Neve
r at
tend
ed
scho
ol
Did
not
com
plet
e pr
imar
y sc
hool
Com
plet
ed
prim
ary
scho
ol
Com
plet
ed
low
er
seco
ndar
y sc
hool
Com
plet
ed
uppe
r se
cond
ary
scho
ol
Prim
ary
Inte
rmed
iate
Colle
ge
Univ
ersit
yHi
gher
th
an
univ
ersit
y
ENTI
RE C
OUNT
RY
100.
0 2.
9 8.
0 21
.5
28.6
15
.9
4.7
4.0
3.8
9.9
0.7
Mal
e 10
0.0
2.2
7.6
21.0
28
.0
15.7
7.
8 4.
3 3.
3 9.
3 0.
8 Fe
mal
e 10
0.0
3.7
8.5
22.2
29
.2
16.1
1.
2 3.
7 4.
2 10
.5
0.7
Urba
n 10
0.0
0.8
4.5
14.7
21
.2
19.5
6.
2 5.
5 5.
4 20
.2
2.0
Rura
l 10
0.0
3.9
9.7
24.7
31
.9
14.2
4.
0 3.
4 3.
0 5.
1 0.
1
Socio
-eco
nom
ic re
gion
Nort
hern
mid
land
s and
m
ount
ain
area
s 10
0.0
9.1
8.1
19.4
29
.6
14.8
3.
7 4.
8 3.
4 6.
7 0.
4
Red
Rive
r Del
ta
100.
0 0.
3 1.
9 10
.7
34.8
20
.6
6.0
5.2
5.2
13.8
1.
5 No
rth C
entra
l and
Cen
tral
coas
tal a
reas
10
0.0
2.2
6.6
21.9
30
.5
16.2
4.
8 4.
4 4.
1 8.
8 0.
5
Cent
ral H
ighl
ands
10
0.0
6.6
10.4
27
.4
27.7
11
.7
3.3
3.3
2.6
6.7
0.3
Sout
h Ea
st
100.
0 1.
0 7.
0 20
.7
25.0
18
.8
5.5
3.5
4.1
13.6
0.
8 M
ekon
g Ri
ver D
elta
10
0.0
2.8
17.9
35
.4
21.3
8.
9 3.
3 2.
4 1.
9 5.
8 0.
3
Prov
ince
, city
Ha N
oi
100.
0 0.
2 1.
6 9.
8 22
.3
21.5
5.
9 5.
6 6.
2 23
.5
3.4
Ha G
iang
10
0.0
24.3
10
.7
19.7
22
.1
9.5
1.8
4.2
1.9
5.5
0.3
Cao
Bang
10
0.0
12.2
12
.0
20.1
20
.0
14.9
2.
9 7.
1 3.
6 6.
9 0.
3 Ba
c Kan
10
0.0
7.4
10.7
24
.6
26.0
12
.7
2.2
5.3
3.2
7.5
0.4
Tuye
n Q
uang
10
0.0
3.3
9.3
22.2
28
.3
18.6
3.
9 5.
7 3.
3 5.
1 0.
3 La
o Ca
i 10
0.0
16.8
9.
4 18
.1
27.4
8.
7 3.
4 4.
9 3.
4 7.
4 0.
5 Di
en B
ien
100.
0 27
.4
10.3
18
.5
21.3
6.
5 1.
8 4.
6 3.
0 6.
3 0.
3 La
i Cha
u 10
0.0
35.9
9.
6 14
.7
19.0
5.
2 1.
9 4.
4 2.
5 6.
5 0.
3 So
n La
10
0.0
18.8
12
.5
20.3
23
.2
11.0
2.
4 3.
9 2.
5 5.
1 0.
3
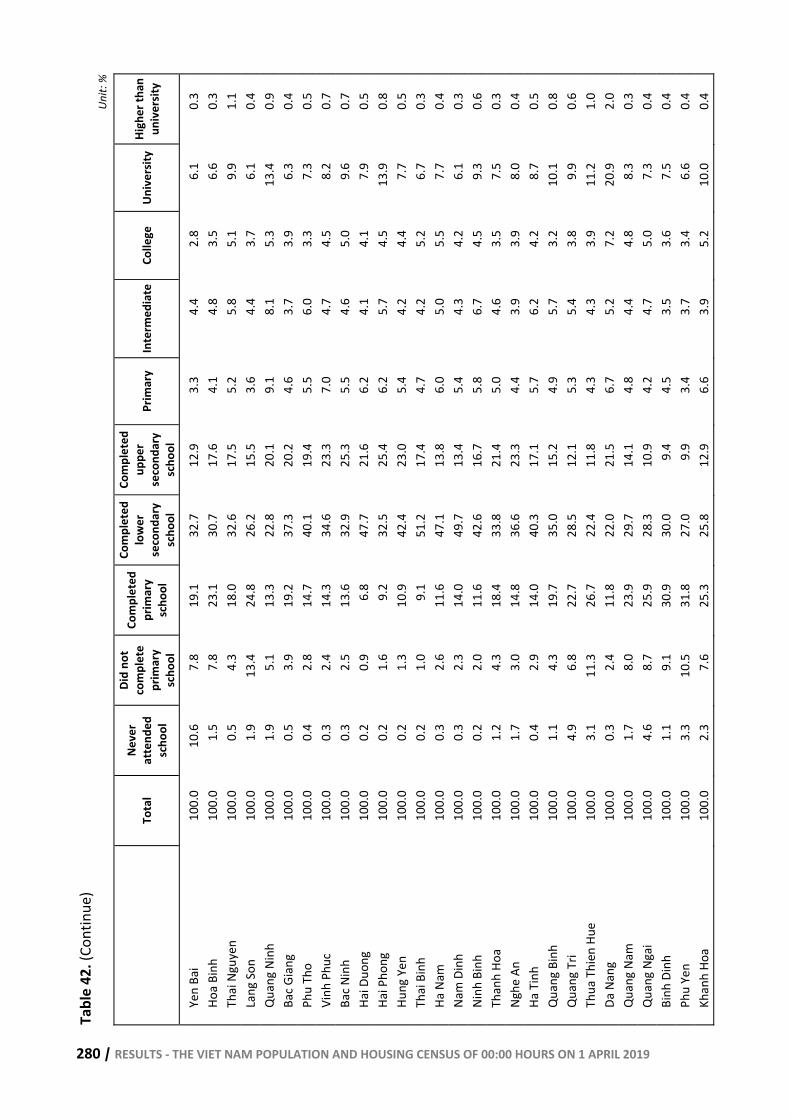
280 | RESULTS - THE VIET NAM POPULATION AND HOUSING CENSUS OF 00:00 HOURS ON 1 APRIL 2019
Tabl
e 42
. (Co
ntin
ue)
Unit:
%
To
tal
Neve
r at
tend
ed
scho
ol
Did
not
com
plet
e pr
imar
y sc
hool
Com
plet
ed
prim
ary
scho
ol
Com
plet
ed
low
er
seco
ndar
y sc
hool
Com
plet
ed
uppe
r se
cond
ary
scho
ol
Prim
ary
Inte
rmed
iate
Colle
ge
Univ
ersit
y Hi
gher
than
un
iver
sity
Yen
Bai
100.
0 10
.6
7.8
19.1
32
.7
12.9
3.
3 4.
4 2.
8 6.
1 0.
3 Ho
a Bi
nh
100.
0 1.
5 7.
8 23
.1
30.7
17
.6
4.1
4.8
3.5
6.6
0.3
Thai
Ngu
yen
100.
0 0.
5 4.
3 18
.0
32.6
17
.5
5.2
5.8
5.1
9.9
1.1
Lang
Son
10
0.0
1.9
13.4
24
.8
26.2
15
.5
3.6
4.4
3.7
6.1
0.4
Qua
ng N
inh
100.
0 1.
9 5.
1 13
.3
22.8
20
.1
9.1
8.1
5.3
13.4
0.
9 Ba
c Gia
ng
100.
0 0.
5 3.
9 19
.2
37.3
20
.2
4.6
3.7
3.9
6.3
0.4
Phu
Tho
100.
0 0.
4 2.
8 14
.7
40.1
19
.4
5.5
6.0
3.3
7.3
0.5
Vinh
Phu
c 10
0.0
0.3
2.4
14.3
34
.6
23.3
7.
0 4.
7 4.
5 8.
2 0.
7 Ba
c Nin
h 10
0.0
0.3
2.5
13.6
32
.9
25.3
5.
5 4.
6 5.
0 9.
6 0.
7 Ha
i Duo
ng
100.
0 0.
2 0.
9 6.
8 47
.7
21.6
6.
2 4.
1 4.
1 7.
9 0.
5 Ha
i Pho
ng
100.
0 0.
2 1.
6 9.
2 32
.5
25.4
6.
2 5.
7 4.
5 13
.9
0.8
Hung
Yen
10
0.0
0.2
1.3
10.9
42
.4
23.0
5.
4 4.
2 4.
4 7.
7 0.
5 Th
ai B
inh
100.
0 0.
2 1.
0 9.
1 51
.2
17.4
4.
7 4.
2 5.
2 6.
7 0.
3 Ha
Nam
10
0.0
0.3
2.6
11.6
47
.1
13.8
6.
0 5.
0 5.
5 7.
7 0.
4 Na
m D
inh
100.
0 0.
3 2.
3 14
.0
49.7
13
.4
5.4
4.3
4.2
6.1
0.3
Ninh
Bin
h 10
0.0
0.2
2.0
11.6
42
.6
16.7
5.
8 6.
7 4.
5 9.
3 0.
6 Th
anh
Hoa
100.
0 1.
2 4.
3 18
.4
33.8
21
.4
5.0
4.6
3.5
7.5
0.3
Nghe
An
100.
0 1.
7 3.
0 14
.8
36.6
23
.3
4.4
3.9
3.9
8.0
0.4
Ha T
inh
100.
0 0.
4 2.
9 14
.0
40.3
17
.1
5.7
6.2
4.2
8.7
0.5
Qua
ng B
inh
100.
0 1.
1 4.
3 19
.7
35.0
15
.2
4.9
5.7
3.2
10.1
0.
8 Q
uang
Tri
100.
0 4.
9 6.
8 22
.7
28.5
12
.1
5.3
5.4
3.8
9.9
0.6
Thua
Thi
en H
ue
100.
0 3.
1 11
.3
26.7
22
.4
11.8
4.
3 4.
3 3.
9 11
.2
1.0
Da N
ang
100.
0 0.
3 2.
4 11
.8
22.0
21
.5
6.7
5.2
7.2
20.9
2.
0 Q
uang
Nam
10
0.0
1.7
8.0
23.9
29
.7
14.1
4.
8 4.
4 4.
8 8.
3 0.
3 Q
uang
Nga
i 10
0.0
4.6
8.7
25.9
28
.3
10.9
4.
2 4.
7 5.
0 7.
3 0.
4 Bi
nh D
inh
100.
0 1.
1 9.
1 30
.9
30.0
9.
4 4.
5 3.
5 3.
6 7.
5 0.
4 Ph
u Ye
n 10
0.0
3.3
10.5
31
.8
27.0
9.
9 3.
4 3.
7 3.
4 6.
6 0.
4 Kh
anh
Hoa
100.
0 2.
3 7.
6 25
.3
25.8
12
.9
6.6
3.9
5.2
10.0
0.
4
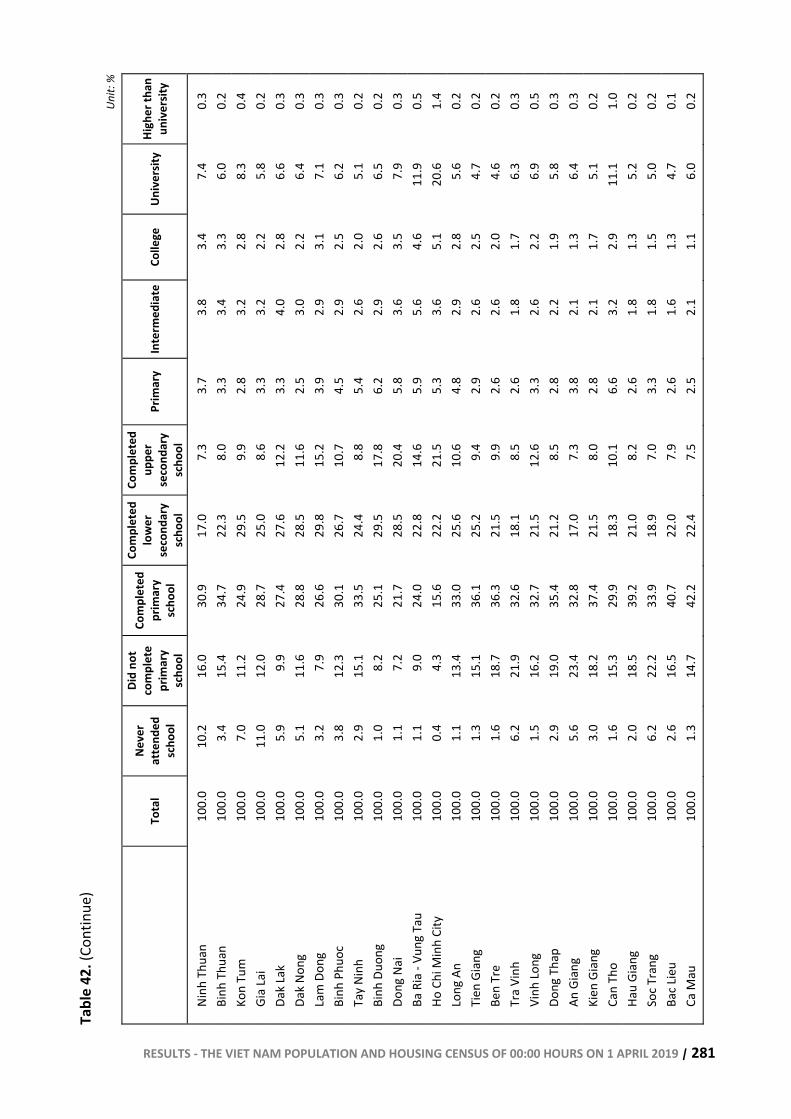
RESULTS - THE VIET NAM POPULATION AND HOUSING CENSUS OF 00:00 HOURS ON 1 APRIL 2019 | 281
Tabl
e 42
. (Co
ntin
ue)
Unit:
%
To
tal
Neve
r at
tend
ed
scho
ol
Did
not
com
plet
e pr
imar
y sc
hool
Com
plet
ed
prim
ary
scho
ol
Com
plet
ed
low
er
seco
ndar
y sc
hool
Com
plet
ed
uppe
r se
cond
ary
scho
ol
Prim
ary
Inte
rmed
iate
Colle
ge
Univ
ersit
y Hi
gher
than
un
iver
sity
Ninh
Thu
an
100.
0 10
.2
16.0
30
.9
17.0
7.
3 3.
7 3.
8 3.
4 7.
4 0.
3 Bi
nh T
huan
10
0.0
3.4
15.4
34
.7
22.3
8.
0 3.
3 3.
4 3.
3 6.
0 0.
2 Ko
n Tu
m
100.
0 7.
0 11
.2
24.9
29
.5
9.9
2.8
3.2
2.8
8.3
0.4
Gia
Lai
100.
0 11
.0
12.0
28
.7
25.0
8.
6 3.
3 3.
2 2.
2 5.
8 0.
2 Da
k La
k 10
0.0
5.9
9.9
27.4
27
.6
12.2
3.
3 4.
0 2.
8 6.
6 0.
3 Da
k No
ng
100.
0 5.
1 11
.6
28.8
28
.5
11.6
2.
5 3.
0 2.
2 6.
4 0.
3 La
m D
ong
100.
0 3.
2 7.
9 26
.6
29.8
15
.2
3.9
2.9
3.1
7.1
0.3
Binh
Phu
oc
100.
0 3.
8 12
.3
30.1
26
.7
10.7
4.
5 2.
9 2.
5 6.
2 0.
3 Ta
y Ni
nh
100.
0 2.
9 15
.1
33.5
24
.4
8.8
5.4
2.6
2.0
5.1
0.2
Binh
Duo
ng
100.
0 1.
0 8.
2 25
.1
29.5
17
.8
6.2
2.9
2.6
6.5
0.2
Dong
Nai
10
0.0
1.1
7.2
21.7
28
.5
20.4
5.
8 3.
6 3.
5 7.
9 0.
3 Ba
Ria
- Vu
ng T
au
100.
0 1.
1 9.
0 24
.0
22.8
14
.6
5.9
5.6
4.6
11.9
0.
5 Ho
Chi
Min
h Ci
ty
100.
0 0.
4 4.
3 15
.6
22.2
21
.5
5.3
3.6
5.1
20.6
1.
4 Lo
ng A
n 10
0.0
1.1
13.4
33
.0
25.6
10
.6
4.8
2.9
2.8
5.6
0.2
Tien
Gia
ng
100.
0 1.
3 15
.1
36.1
25
.2
9.4
2.9
2.6
2.5
4.7
0.2
Ben
Tre
100.
0 1.
6 18
.7
36.3
21
.5
9.9
2.6
2.6
2.0
4.6
0.2
Tra
Vinh
10
0.0
6.2
21.9
32
.6
18.1
8.
5 2.
6 1.
8 1.
7 6.
3 0.
3 Vi
nh Lo
ng
100.
0 1.
5 16
.2
32.7
21
.5
12.6
3.
3 2.
6 2.
2 6.
9 0.
5 Do
ng T
hap
100.
0 2.
9 19
.0
35.4
21
.2
8.5
2.8
2.2
1.9
5.8
0.3
An G
iang
10
0.0
5.6
23.4
32
.8
17.0
7.
3 3.
8 2.
1 1.
3 6.
4 0.
3 Ki
en G
iang
10
0.0
3.0
18.2
37
.4
21.5
8.
0 2.
8 2.
1 1.
7 5.
1 0.
2 Ca
n Th
o 10
0.0
1.6
15.3
29
.9
18.3
10
.1
6.6
3.2
2.9
11.1
1.
0 Ha
u Gi
ang
100.
0 2.
0 18
.5
39.2
21
.0
8.2
2.6
1.8
1.3
5.2
0.2
Soc T
rang
10
0.0
6.2
22.2
33
.9
18.9
7.
0 3.
3 1.
8 1.
5 5.
0 0.
2 Ba
c Lie
u 10
0.0
2.6
16.5
40
.7
22.0
7.
9 2.
6 1.
6 1.
3 4.
7 0.
1 Ca
Mau
10
0.0
1.3
14.7
42
.2
22.4
7.
5 2.
5 2.
1 1.
1 6.
0 0.
2
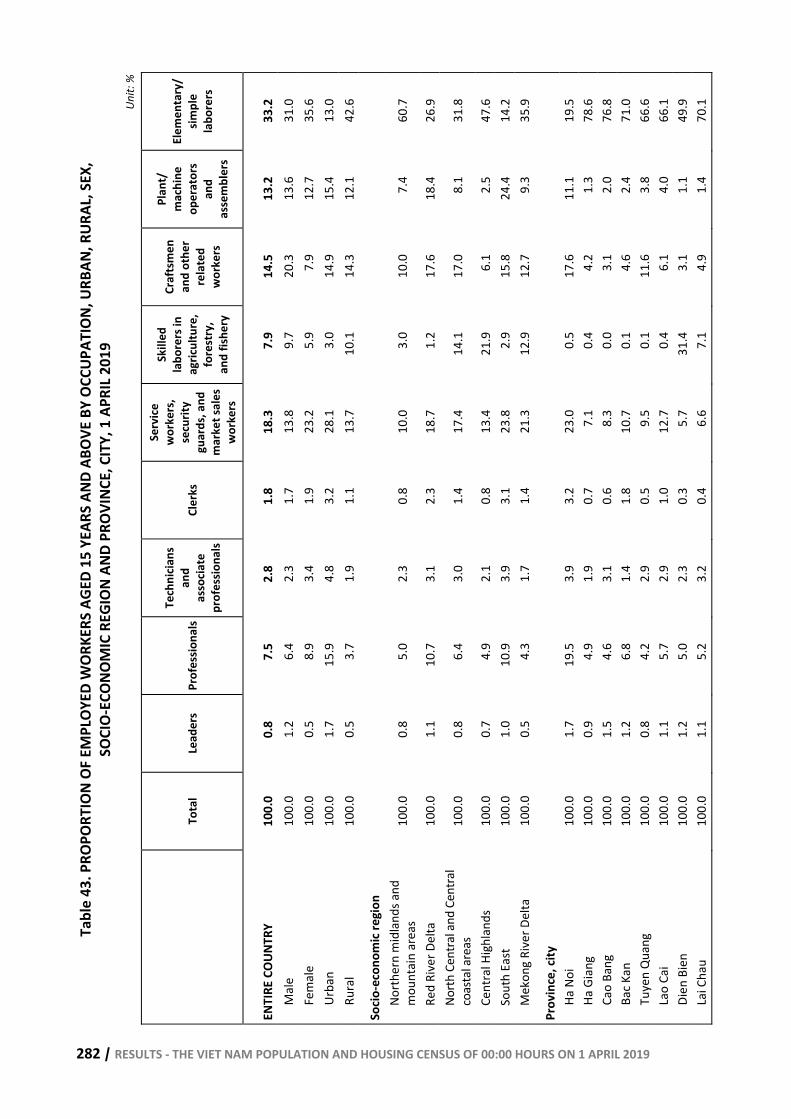
282 | RESULTS - THE VIET NAM POPULATION AND HOUSING CENSUS OF 00:00 HOURS ON 1 APRIL 2019
Tabl
e 43
. PRO
PORT
ION
OF E
MPL
OYED
WOR
KERS
AGE
D 15
YEA
RS A
ND A
BOVE
BY
OCCU
PATI
ON, U
RBAN
, RUR
AL, S
EX,
SOCI
O-EC
ONOM
IC R
EGIO
N AN
D PR
OVIN
CE, C
ITY,
1 A
PRIL
2019
Un
it: %
To
tal
Lead
ers
Prof
essio
nals
Tech
nicia
ns
and
asso
ciate
pr
ofes
siona
ls
Cler
ks
Serv
ice
wor
kers
, se
curit
y gu
ards
, and
m
arke
t sal
es
wor
kers
Skill
ed
labo
rers
in
agric
ultu
re,
fore
stry
, an
d fis
hery
Craf
tsm
en
and
othe
r re
late
d w
orke
rs
Plan
t/
mac
hine
op
erat
ors
and
asse
mbl
ers
Elem
enta
ry/
simpl
e la
bore
rs
ENTI
RE C
OUNT
RY
100.
0 0.
8 7.
5 2.
8 1.
8 18
.3
7.9
14.5
13
.2
33.2
M
ale
100.
0 1.
2 6.
4 2.
3 1.
7 13
.8
9.7
20.3
13
.6
31.0
Fe
mal
e 10
0.0
0.5
8.9
3.4
1.9
23.2
5.
9 7.
9 12
.7
35.6
Ur
ban
100.
0 1.
7 15
.9
4.8
3.2
28.1
3.
0 14
.9
15.4
13
.0
Rura
l 10
0.0
0.5
3.7
1.9
1.1
13.7
10
.1
14.3
12
.1
42.6
Socio
-eco
nom
ic re
gion
No
rthe
rn m
idla
nds a
nd
mou
ntai
n ar
eas
100.
0 0.
8 5.
0 2.
3 0.
8 10
.0
3.0
10.0
7.
4 60
.7
Red
Rive
r Del
ta
100.
0 1.
1 10
.7
3.1
2.3
18.7
1.
2 17
.6
18.4
26
.9
North
Cen
tral a
nd C
entra
l co
asta
l are
as
100.
0 0.
8 6.
4 3.
0 1.
4 17
.4
14.1
17
.0
8.1
31.8
Cent
ral H
ighl
ands
10
0.0
0.7
4.9
2.1
0.8
13.4
21
.9
6.1
2.5
47.6
So
uth
East
10
0.0
1.0
10.9
3.
9 3.
1 23
.8
2.9
15.8
24
.4
14.2
M
ekon
g Ri
ver D
elta
10
0.0
0.5
4.3
1.7
1.4
21.3
12
.9
12.7
9.
3 35
.9
Prov
ince
, city
Ha
Noi
10
0.0
1.7
19.5
3.
9 3.
2 23
.0
0.5
17.6
11
.1
19.5
Ha
Gia
ng
100.
0 0.
9 4.
9 1.
9 0.
7 7.
1 0.
4 4.
2 1.
3 78
.6
Cao
Bang
10
0.0
1.5
4.6
3.1
0.6
8.3
0.0
3.1
2.0
76.8
Ba
c Kan
10
0.0
1.2
6.8
1.4
1.8
10.7
0.
1 4.
6 2.
4 71
.0
Tuye
n Q
uang
10
0.0
0.8
4.2
2.9
0.5
9.5
0.1
11.6
3.
8 66
.6
Lao
Cai
100.
0 1.
1 5.
7 2.
9 1.
0 12
.7
0.4
6.1
4.0
66.1
Di
en B
ien
100.
0 1.
2 5.
0 2.
3 0.
3 5.
7 31
.4
3.1
1.1
49.9
La
i Cha
u 10
0.0
1.1
5.2
3.2
0.4
6.6
7.1
4.9
1.4
70.1
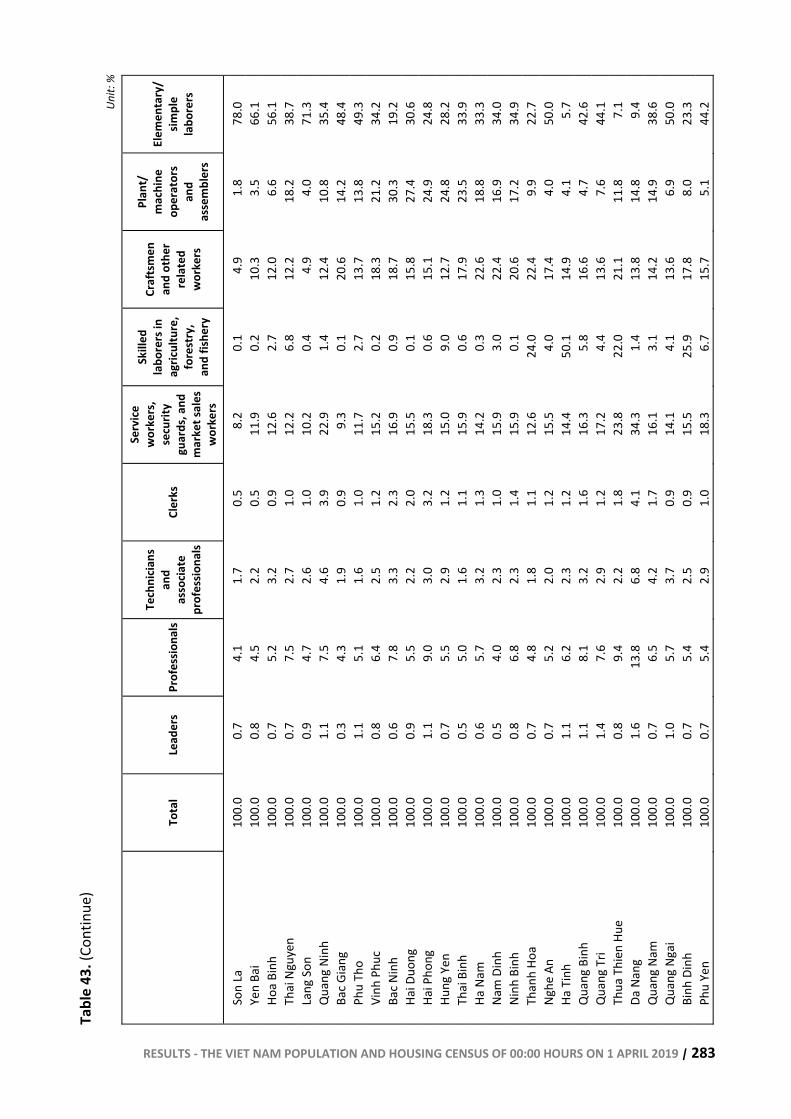
RESULTS - THE VIET NAM POPULATION AND HOUSING CENSUS OF 00:00 HOURS ON 1 APRIL 2019 | 283
Tabl
e 43
. (Co
ntin
ue)
Unit:
%
To
tal
Lead
ers
Prof
essio
nals
Tech
nicia
ns
and
asso
ciate
pr
ofes
siona
ls
Cler
ks
Serv
ice
wor
kers
, se
curit
y gu
ards
, and
m
arke
t sal
es
wor
kers
Skill
ed
labo
rers
in
agric
ultu
re,
fore
stry
, an
d fis
hery
Craf
tsm
en
and
othe
r re
late
d w
orke
rs
Plan
t/
mac
hine
op
erat
ors
and
asse
mbl
ers
Elem
enta
ry/
simpl
e la
bore
rs
Son
La
100.
0 0.
7 4.
1 1.
7 0.
5 8.
2 0.
1 4.
9 1.
8 78
.0
Yen
Bai
100.
0 0.
8 4.
5 2.
2 0.
5 11
.9
0.2
10.3
3.
5 66
.1
Hoa
Binh
10
0.0
0.7
5.2
3.2
0.9
12.6
2.
7 12
.0
6.6
56.1
Th
ai N
guye
n 10
0.0
0.7
7.5
2.7
1.0
12.2
6.
8 12
.2
18.2
38
.7
Lang
Son
10
0.0
0.9
4.7
2.6
1.0
10.2
0.
4 4.
9 4.
0 71
.3
Qua
ng N
inh
100.
0 1.
1 7.
5 4.
6 3.
9 22
.9
1.4
12.4
10
.8
35.4
Ba
c Gia
ng
100.
0 0.
3 4.
3 1.
9 0.
9 9.
3 0.
1 20
.6
14.2
48
.4
Phu
Tho
100.
0 1.
1 5.
1 1.
6 1.
0 11
.7
2.7
13.7
13
.8
49.3
Vi
nh P
huc
100.
0 0.
8 6.
4 2.
5 1.
2 15
.2
0.2
18.3
21
.2
34.2
Ba
c Nin
h 10
0.0
0.6
7.8
3.3
2.3
16.9
0.
9 18
.7
30.3
19
.2
Hai D
uong
10
0.0
0.9
5.5
2.2
2.0
15.5
0.
1 15
.8
27.4
30
.6
Hai P
hong
10
0.0
1.1
9.0
3.0
3.2
18.3
0.
6 15
.1
24.9
24
.8
Hung
Yen
10
0.0
0.7
5.5
2.9
1.2
15.0
9.
0 12
.7
24.8
28
.2
Thai
Bin
h 10
0.0
0.5
5.0
1.6
1.1
15.9
0.
6 17
.9
23.5
33
.9
Ha N
am
100.
0 0.
6 5.
7 3.
2 1.
3 14
.2
0.3
22.6
18
.8
33.3
Na
m D
inh
100.
0 0.
5 4.
0 2.
3 1.
0 15
.9
3.0
22.4
16
.9
34.0
Ni
nh B
inh
100.
0 0.
8 6.
8 2.
3 1.
4 15
.9
0.1
20.6
17
.2
34.9
Th
anh
Hoa
100.
0 0.
7 4.
8 1.
8 1.
1 12
.6
24.0
22
.4
9.9
22.7
Ng
he A
n 10
0.0
0.7
5.2
2.0
1.2
15.5
4.
0 17
.4
4.0
50.0
Ha
Tin
h 10
0.0
1.1
6.2
2.3
1.2
14.4
50
.1
14.9
4.
1 5.
7 Q
uang
Bin
h 10
0.0
1.1
8.1
3.2
1.6
16.3
5.
8 16
.6
4.7
42.6
Q
uang
Tri
100.
0 1.
4 7.
6 2.
9 1.
2 17
.2
4.4
13.6
7.
6 44
.1
Thua
Thi
en H
ue
100.
0 0.
8 9.
4 2.
2 1.
8 23
.8
22.0
21
.1
11.8
7.
1 Da
Nan
g 10
0.0
1.6
13.8
6.
8 4.
1 34
.3
1.4
13.8
14
.8
9.4
Qua
ng N
am
100.
0 0.
7 6.
5 4.
2 1.
7 16
.1
3.1
14.2
14
.9
38.6
Q
uang
Nga
i 10
0.0
1.0
5.7
3.7
0.9
14.1
4.
1 13
.6
6.9
50.0
Bi
nh D
inh
100.
0 0.
7 5.
4 2.
5 0.
9 15
.5
25.9
17
.8
8.0
23.3
Ph
u Ye
n 10
0.0
0.7
5.4
2.9
1.0
18.3
6.
7 15
.7
5.1
44.2
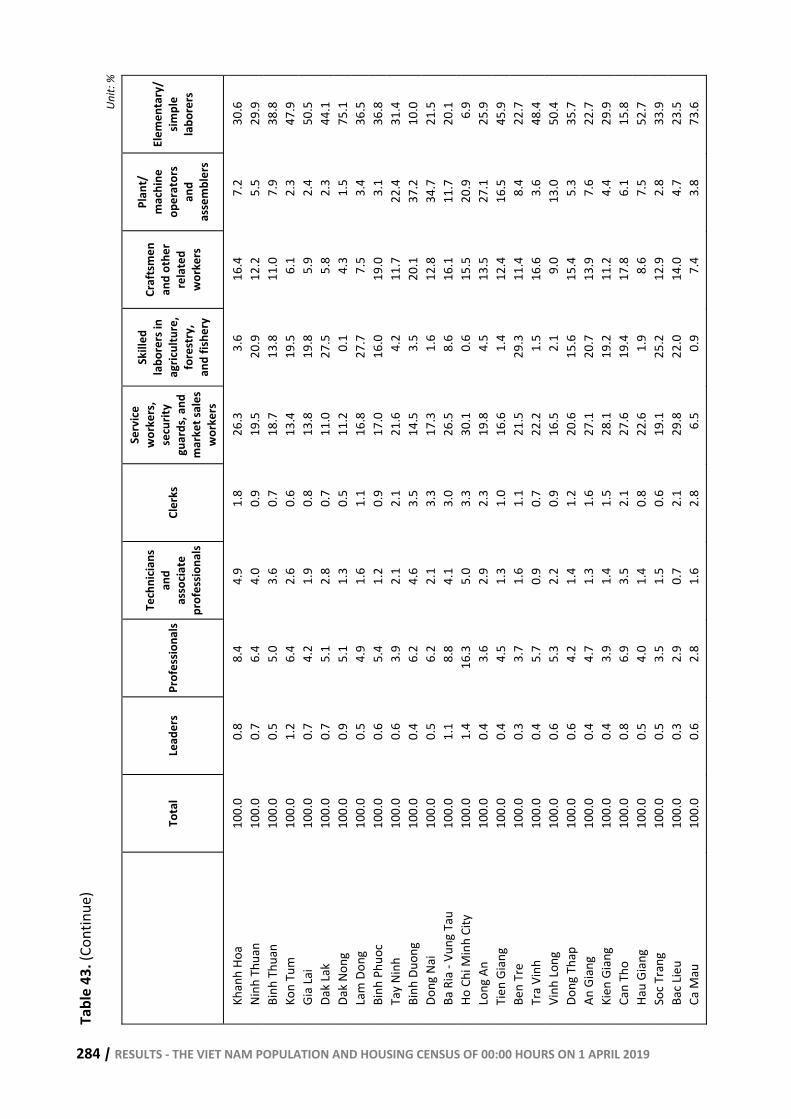
284 | RESULTS - THE VIET NAM POPULATION AND HOUSING CENSUS OF 00:00 HOURS ON 1 APRIL 2019
Tabl
e 43
. (Co
ntin
ue)
Unit:
%
To
tal
Lead
ers
Prof
essio
nals
Tech
nicia
ns
and
asso
ciate
pr
ofes
siona
ls
Cler
ks
Serv
ice
wor
kers
, se
curit
y gu
ards
, and
m
arke
t sal
es
wor
kers
Skill
ed
labo
rers
in
agric
ultu
re,
fore
stry
, an
d fis
hery
Craf
tsm
en
and
othe
r re
late
d w
orke
rs
Plan
t/
mac
hine
op
erat
ors
and
asse
mbl
ers
Elem
enta
ry/
simpl
e la
bore
rs
Khan
h Ho
a 10
0.0
0.8
8.4
4.9
1.8
26.3
3.
6 16
.4
7.2
30.6
Ni
nh T
huan
10
0.0
0.7
6.4
4.0
0.9
19.5
20
.9
12.2
5.
5 29
.9
Binh
Thu
an
100.
0 0.
5 5.
0 3.
6 0.
7 18
.7
13.8
11
.0
7.9
38.8
Ko
n Tu
m
100.
0 1.
2 6.
4 2.
6 0.
6 13
.4
19.5
6.
1 2.
3 47
.9
Gia
Lai
100.
0 0.
7 4.
2 1.
9 0.
8 13
.8
19.8
5.
9 2.
4 50
.5
Dak
Lak
100.
0 0.
7 5.
1 2.
8 0.
7 11
.0
27.5
5.
8 2.
3 44
.1
Dak
Nong
10
0.0
0.9
5.1
1.3
0.5
11.2
0.
1 4.
3 1.
5 75
.1
Lam
Don
g 10
0.0
0.5
4.9
1.6
1.1
16.8
27
.7
7.5
3.4
36.5
Bi
nh P
huoc
10
0.0
0.6
5.4
1.2
0.9
17.0
16
.0
19.0
3.
1 36
.8
Tay
Ninh
10
0.0
0.6
3.9
2.1
2.1
21.6
4.
2 11
.7
22.4
31
.4
Binh
Duo
ng
100.
0 0.
4 6.
2 4.
6 3.
5 14
.5
3.5
20.1
37
.2
10.0
Do
ng N
ai
100.
0 0.
5 6.
2 2.
1 3.
3 17
.3
1.6
12.8
34
.7
21.5
Ba
Ria
- Vu
ng T
au
100.
0 1.
1 8.
8 4.
1 3.
0 26
.5
8.6
16.1
11
.7
20.1
Ho
Chi
Min
h Ci
ty
100.
0 1.
4 16
.3
5.0
3.3
30.1
0.
6 15
.5
20.9
6.
9 Lo
ng A
n 10
0.0
0.4
3.6
2.9
2.3
19.8
4.
5 13
.5
27.1
25
.9
Tien
Gia
ng
100.
0 0.
4 4.
5 1.
3 1.
0 16
.6
1.4
12.4
16
.5
45.9
Be
n Tr
e 10
0.0
0.3
3.7
1.6
1.1
21.5
29
.3
11.4
8.
4 22
.7
Tra
Vinh
10
0.0
0.4
5.7
0.9
0.7
22.2
1.
5 16
.6
3.6
48.4
Vi
nh Lo
ng
100.
0 0.
6 5.
3 2.
2 0.
9 16
.5
2.1
9.0
13.0
50
.4
Dong
Tha
p 10
0.0
0.6
4.2
1.4
1.2
20.6
15
.6
15.4
5.
3 35
.7
An G
iang
10
0.0
0.4
4.7
1.3
1.6
27.1
20
.7
13.9
7.
6 22
.7
Kien
Gia
ng
100.
0 0.
4 3.
9 1.
4 1.
5 28
.1
19.2
11
.2
4.4
29.9
Ca
n Th
o 10
0.0
0.8
6.9
3.5
2.1
27.6
19
.4
17.8
6.
1 15
.8
Hau
Gian
g 10
0.0
0.5
4.0
1.4
0.8
22.6
1.
9 8.
6 7.
5 52
.7
Soc T
rang
10
0.0
0.5
3.5
1.5
0.6
19.1
25
.2
12.9
2.
8 33
.9
Bac L
ieu
100.
0 0.
3 2.
9 0.
7 2.
1 29
.8
22.0
14
.0
4.7
23.5
Ca
Mau
10
0.0
0.6
2.8
1.6
2.8
6.5
0.9
7.4
3.8
73.6
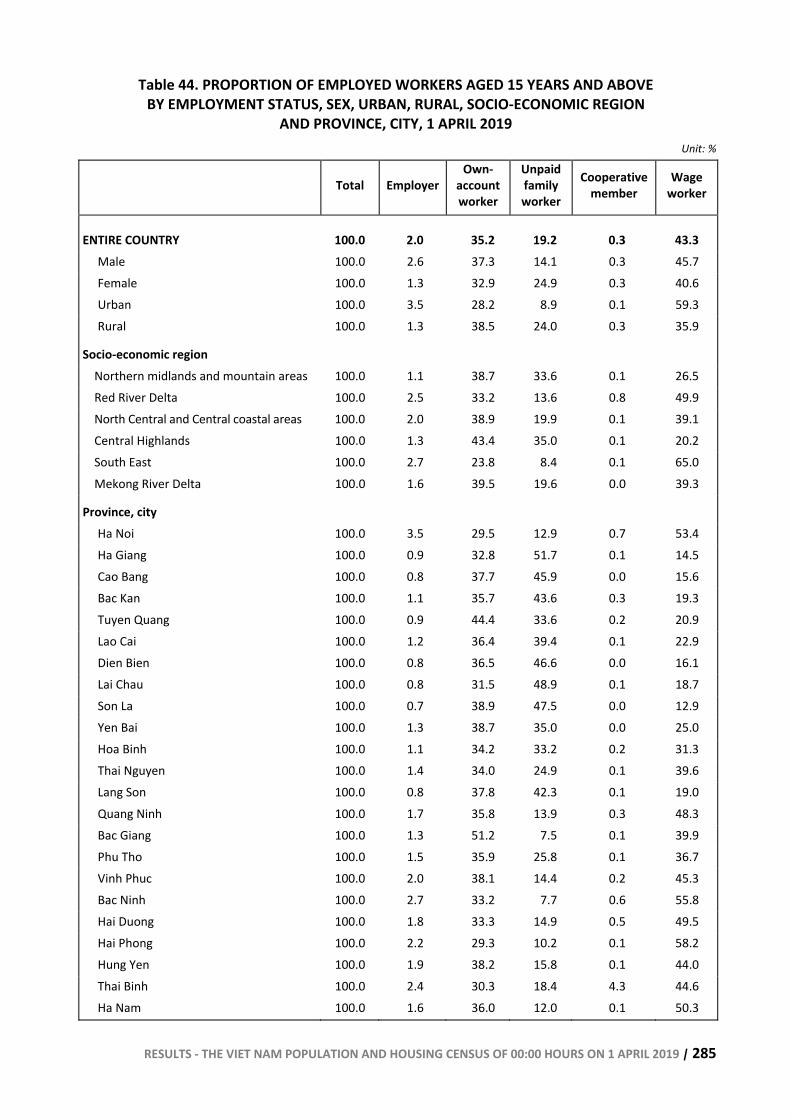
RESULTS - THE VIET NAM POPULATION AND HOUSING CENSUS OF 00:00 HOURS ON 1 APRIL 2019 | 285
Table 44. PROPORTION OF EMPLOYED WORKERS AGED 15 YEARS AND ABOVE BY EMPLOYMENT STATUS, SEX, URBAN, RURAL, SOCIO-ECONOMIC REGION
AND PROVINCE, CITY, 1 APRIL 2019 Unit: %
Total Employer Own-
account worker
Unpaid family worker
Cooperative member
Wage worker
ENTIRE COUNTRY 100.0 2.0 35.2 19.2 0.3 43.3 Male 100.0 2.6 37.3 14.1 0.3 45.7 Female 100.0 1.3 32.9 24.9 0.3 40.6 Urban 100.0 3.5 28.2 8.9 0.1 59.3 Rural 100.0 1.3 38.5 24.0 0.3 35.9
Socio-economic region Northern midlands and mountain areas 100.0 1.1 38.7 33.6 0.1 26.5 Red River Delta 100.0 2.5 33.2 13.6 0.8 49.9 North Central and Central coastal areas 100.0 2.0 38.9 19.9 0.1 39.1 Central Highlands 100.0 1.3 43.4 35.0 0.1 20.2 South East 100.0 2.7 23.8 8.4 0.1 65.0 Mekong River Delta 100.0 1.6 39.5 19.6 0.0 39.3
Province, city Ha Noi 100.0 3.5 29.5 12.9 0.7 53.4 Ha Giang 100.0 0.9 32.8 51.7 0.1 14.5 Cao Bang 100.0 0.8 37.7 45.9 0.0 15.6 Bac Kan 100.0 1.1 35.7 43.6 0.3 19.3 Tuyen Quang 100.0 0.9 44.4 33.6 0.2 20.9 Lao Cai 100.0 1.2 36.4 39.4 0.1 22.9 Dien Bien 100.0 0.8 36.5 46.6 0.0 16.1 Lai Chau 100.0 0.8 31.5 48.9 0.1 18.7 Son La 100.0 0.7 38.9 47.5 0.0 12.9 Yen Bai 100.0 1.3 38.7 35.0 0.0 25.0 Hoa Binh 100.0 1.1 34.2 33.2 0.2 31.3 Thai Nguyen 100.0 1.4 34.0 24.9 0.1 39.6 Lang Son 100.0 0.8 37.8 42.3 0.1 19.0 Quang Ninh 100.0 1.7 35.8 13.9 0.3 48.3 Bac Giang 100.0 1.3 51.2 7.5 0.1 39.9 Phu Tho 100.0 1.5 35.9 25.8 0.1 36.7 Vinh Phuc 100.0 2.0 38.1 14.4 0.2 45.3 Bac Ninh 100.0 2.7 33.2 7.7 0.6 55.8 Hai Duong 100.0 1.8 33.3 14.9 0.5 49.5 Hai Phong 100.0 2.2 29.3 10.2 0.1 58.2 Hung Yen 100.0 1.9 38.2 15.8 0.1 44.0 Thai Binh 100.0 2.4 30.3 18.4 4.3 44.6 Ha Nam 100.0 1.6 36.0 12.0 0.1 50.3
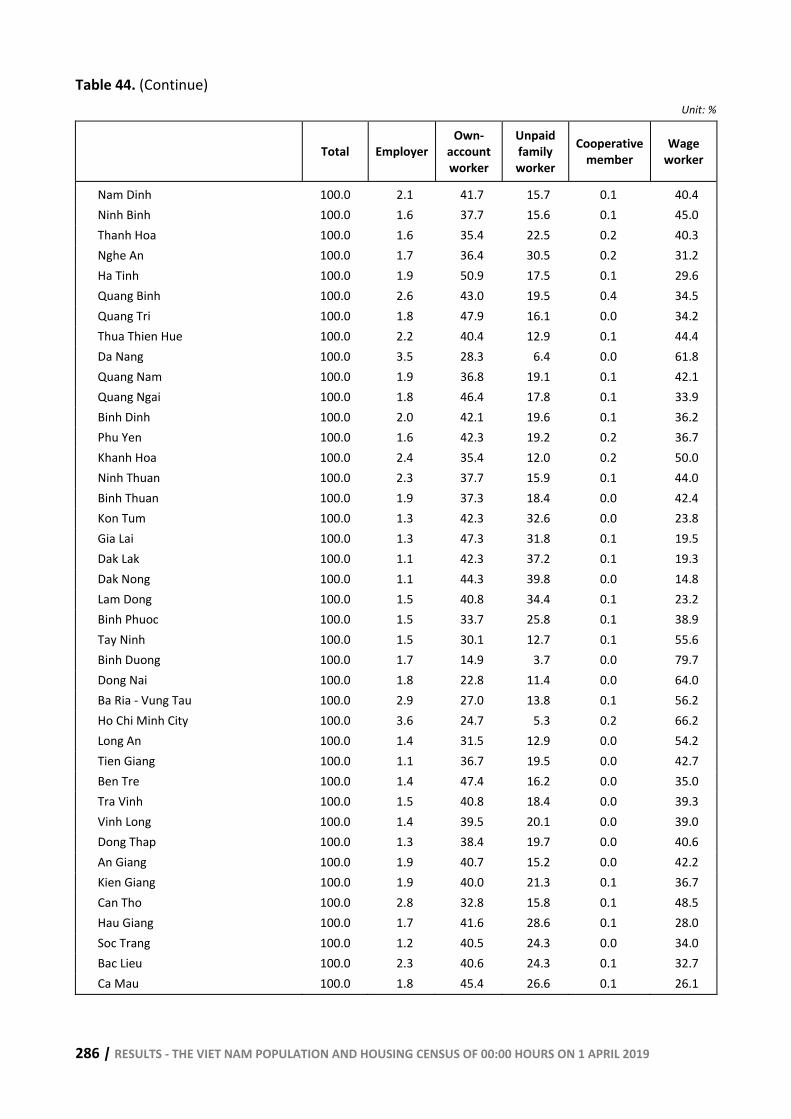
286 | RESULTS - THE VIET NAM POPULATION AND HOUSING CENSUS OF 00:00 HOURS ON 1 APRIL 2019
Table 44. (Continue) Unit: %
Total Employer Own-
account worker
Unpaid family worker
Cooperative member
Wage worker
Nam Dinh 100.0 2.1 41.7 15.7 0.1 40.4 Ninh Binh 100.0 1.6 37.7 15.6 0.1 45.0 Thanh Hoa 100.0 1.6 35.4 22.5 0.2 40.3 Nghe An 100.0 1.7 36.4 30.5 0.2 31.2 Ha Tinh 100.0 1.9 50.9 17.5 0.1 29.6 Quang Binh 100.0 2.6 43.0 19.5 0.4 34.5 Quang Tri 100.0 1.8 47.9 16.1 0.0 34.2 Thua Thien Hue 100.0 2.2 40.4 12.9 0.1 44.4 Da Nang 100.0 3.5 28.3 6.4 0.0 61.8 Quang Nam 100.0 1.9 36.8 19.1 0.1 42.1 Quang Ngai 100.0 1.8 46.4 17.8 0.1 33.9 Binh Dinh 100.0 2.0 42.1 19.6 0.1 36.2 Phu Yen 100.0 1.6 42.3 19.2 0.2 36.7 Khanh Hoa 100.0 2.4 35.4 12.0 0.2 50.0 Ninh Thuan 100.0 2.3 37.7 15.9 0.1 44.0 Binh Thuan 100.0 1.9 37.3 18.4 0.0 42.4 Kon Tum 100.0 1.3 42.3 32.6 0.0 23.8 Gia Lai 100.0 1.3 47.3 31.8 0.1 19.5 Dak Lak 100.0 1.1 42.3 37.2 0.1 19.3 Dak Nong 100.0 1.1 44.3 39.8 0.0 14.8 Lam Dong 100.0 1.5 40.8 34.4 0.1 23.2 Binh Phuoc 100.0 1.5 33.7 25.8 0.1 38.9 Tay Ninh 100.0 1.5 30.1 12.7 0.1 55.6 Binh Duong 100.0 1.7 14.9 3.7 0.0 79.7 Dong Nai 100.0 1.8 22.8 11.4 0.0 64.0 Ba Ria - Vung Tau 100.0 2.9 27.0 13.8 0.1 56.2 Ho Chi Minh City 100.0 3.6 24.7 5.3 0.2 66.2 Long An 100.0 1.4 31.5 12.9 0.0 54.2 Tien Giang 100.0 1.1 36.7 19.5 0.0 42.7 Ben Tre 100.0 1.4 47.4 16.2 0.0 35.0 Tra Vinh 100.0 1.5 40.8 18.4 0.0 39.3 Vinh Long 100.0 1.4 39.5 20.1 0.0 39.0 Dong Thap 100.0 1.3 38.4 19.7 0.0 40.6 An Giang 100.0 1.9 40.7 15.2 0.0 42.2 Kien Giang 100.0 1.9 40.0 21.3 0.1 36.7 Can Tho 100.0 2.8 32.8 15.8 0.1 48.5 Hau Giang 100.0 1.7 41.6 28.6 0.1 28.0 Soc Trang 100.0 1.2 40.5 24.3 0.0 34.0 Bac Lieu 100.0 2.3 40.6 24.3 0.1 32.7 Ca Mau 100.0 1.8 45.4 26.6 0.1 26.1
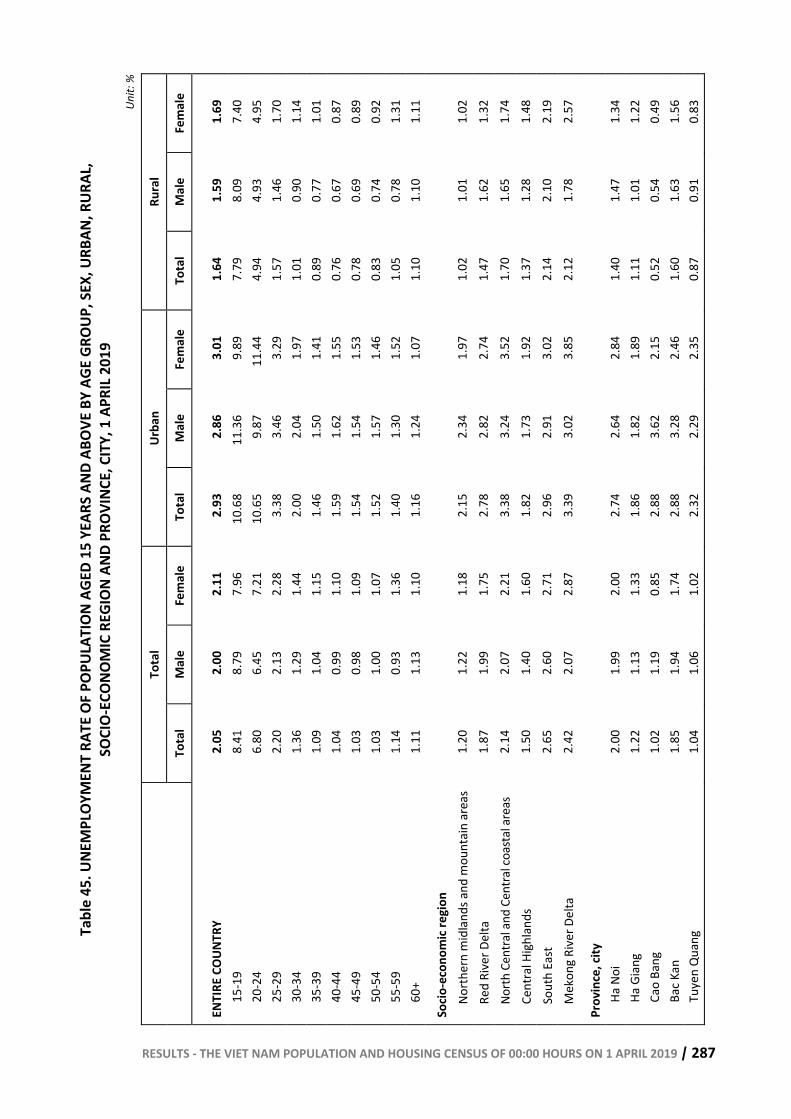
RESULTS - THE VIET NAM POPULATION AND HOUSING CENSUS OF 00:00 HOURS ON 1 APRIL 2019 | 287
Tabl
e 45
. UNE
MPL
OYM
ENT
RATE
OF P
OPUL
ATIO
N AG
ED 1
5 YE
ARS
AND
ABOV
E BY
AGE
GRO
UP, S
EX, U
RBAN
, RUR
AL,
SOCI
O-EC
ONOM
IC R
EGIO
N AN
D PR
OVIN
CE, C
ITY,
1 A
PRIL
2019
Un
it: %
Tota
l Ur
ban
Rura
l
Tota
l M
ale
Fem
ale
Tota
l M
ale
Fem
ale
Tota
l M
ale
Fem
ale
ENTI
RE C
OUNT
RY
2.05
2.
00
2.11
2.
93
2.86
3.
01
1.64
1.
59
1.69
15
-19
8.41
8.
79
7.96
10
.68
11.3
6 9.
89
7.79
8.
09
7.40
20
-24
6.80
6.
45
7.21
10
.65
9.87
11
.44
4.94
4.
93
4.95
25
-29
2.20
2.
13
2.28
3.
38
3.46
3.
29
1.57
1.
46
1.70
30
-34
1.36
1.
29
1.44
2.
00
2.04
1.
97
1.01
0.
90
1.14
35
-39
1.09
1.
04
1.15
1.
46
1.50
1.
41
0.89
0.
77
1.01
40
-44
1.04
0.
99
1.10
1.
59
1.62
1.
55
0.76
0.
67
0.87
45
-49
1.03
0.
98
1.09
1.
54
1.54
1.
53
0.78
0.
69
0.89
50
-54
1.03
1.
00
1.07
1.
52
1.57
1.
46
0.83
0.
74
0.92
55
-59
1.14
0.
93
1.36
1.
40
1.30
1.
52
1.05
0.
78
1.31
60
+ 1.
11
1.13
1.
10
1.16
1.
24
1.07
1.
10
1.10
1.
11
Socio
-eco
nom
ic re
gion
Nort
hern
mid
land
s and
mou
ntai
n ar
eas
1.20
1.
22
1.18
2.
15
2.34
1.
97
1.02
1.
01
1.02
Re
d Ri
ver D
elta
1.
87
1.99
1.
75
2.78
2.
82
2.74
1.
47
1.62
1.
32
North
Cen
tral a
nd C
entra
l coa
stal
are
as
2.14
2.
07
2.21
3.
38
3.24
3.
52
1.70
1.
65
1.74
Ce
ntra
l Hig
hlan
ds
1.50
1.
40
1.60
1.
82
1.73
1.
92
1.37
1.
28
1.48
So
uth
East
2.
65
2.60
2.
71
2.96
2.
91
3.02
2.
14
2.10
2.
19
Mek
ong
Rive
r Del
ta
2.42
2.
07
2.87
3.
39
3.02
3.
85
2.12
1.
78
2.57
Prov
ince
, city
Ha N
oi
2.00
1.
99
2.00
2.
74
2.64
2.
84
1.40
1.
47
1.34
Ha
Gia
ng
1.22
1.
13
1.33
1.
86
1.82
1.
89
1.11
1.
01
1.22
Ca
o Ba
ng
1.02
1.
19
0.85
2.
88
3.62
2.
15
0.52
0.
54
0.49
Ba
c Kan
1.
85
1.94
1.
74
2.88
3.
28
2.46
1.
60
1.63
1.
56
Tuye
n Q
uang
1.
04
1.06
1.
02
2.32
2.
29
2.35
0.
87
0.91
0.
83
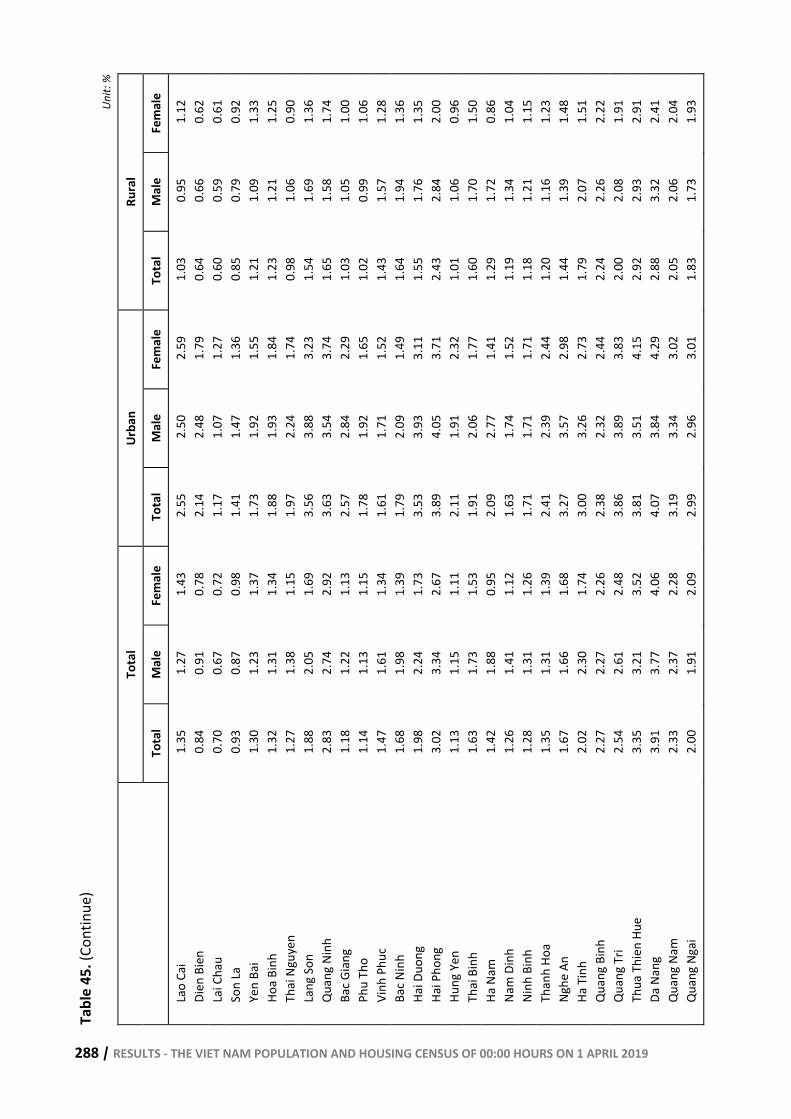
288 | RESULTS - THE VIET NAM POPULATION AND HOUSING CENSUS OF 00:00 HOURS ON 1 APRIL 2019
Tabl
e 45
. (Co
ntin
ue)
Unit:
%
Tota
l Ur
ban
Rura
l
Tota
l M
ale
Fem
ale
Tota
l M
ale
Fem
ale
Tota
l M
ale
Fem
ale
Lao
Cai
1.35
1.
27
1.43
2.
55
2.50
2.
59
1.03
0.
95
1.12
Di
en B
ien
0.84
0.
91
0.78
2.
14
2.48
1.
79
0.64
0.
66
0.62
La
i Cha
u 0.
70
0.67
0.
72
1.17
1.
07
1.27
0.
60
0.59
0.
61
Son
La
0.93
0.
87
0.98
1.
41
1.47
1.
36
0.85
0.
79
0.92
Ye
n Ba
i 1.
30
1.23
1.
37
1.73
1.
92
1.55
1.
21
1.09
1.
33
Hoa
Binh
1.
32
1.31
1.
34
1.88
1.
93
1.84
1.
23
1.21
1.
25
Thai
Ngu
yen
1.27
1.
38
1.15
1.
97
2.24
1.
74
0.98
1.
06
0.90
La
ng S
on
1.88
2.
05
1.69
3.
56
3.88
3.
23
1.54
1.
69
1.36
Q
uang
Nin
h 2.
83
2.74
2.
92
3.63
3.
54
3.74
1.
65
1.58
1.
74
Bac G
iang
1.
18
1.22
1.
13
2.57
2.
84
2.29
1.
03
1.05
1.
00
Phu
Tho
1.14
1.
13
1.15
1.
78
1.92
1.
65
1.02
0.
99
1.06
Vi
nh P
huc
1.47
1.
61
1.34
1.
61
1.71
1.
52
1.43
1.
57
1.28
Ba
c Nin
h 1.
68
1.98
1.
39
1.79
2.
09
1.49
1.
64
1.94
1.
36
Hai D
uong
1.
98
2.24
1.
73
3.53
3.
93
3.11
1.
55
1.76
1.
35
Hai P
hong
3.
02
3.34
2.
67
3.89
4.
05
3.71
2.
43
2.84
2.
00
Hung
Yen
1.
13
1.15
1.
11
2.11
1.
91
2.32
1.
01
1.06
0.
96
Thai
Bin
h 1.
63
1.73
1.
53
1.91
2.
06
1.77
1.
60
1.70
1.
50
Ha N
am
1.42
1.
88
0.95
2.
09
2.77
1.
41
1.29
1.
72
0.86
Na
m D
inh
1.26
1.
41
1.12
1.
63
1.74
1.
52
1.19
1.
34
1.04
Ni
nh B
inh
1.28
1.
31
1.26
1.
71
1.71
1.
71
1.18
1.
21
1.15
Th
anh
Hoa
1.35
1.
31
1.39
2.
41
2.39
2.
44
1.20
1.
16
1.23
Ng
he A
n 1.
67
1.66
1.
68
3.27
3.
57
2.98
1.
44
1.39
1.
48
Ha T
inh
2.02
2.
30
1.74
3.
00
3.26
2.
73
1.79
2.
07
1.51
Q
uang
Bin
h 2.
27
2.27
2.
26
2.38
2.
32
2.44
2.
24
2.26
2.
22
Qua
ng T
ri 2.
54
2.61
2.
48
3.86
3.
89
3.83
2.
00
2.08
1.
91
Thua
Thi
en H
ue
3.35
3.
21
3.52
3.
81
3.51
4.
15
2.92
2.
93
2.91
Da
Nan
g 3.
91
3.77
4.
06
4.07
3.
84
4.29
2.
88
3.32
2.
41
Qua
ng N
am
2.33
2.
37
2.28
3.
19
3.34
3.
02
2.05
2.
06
2.04
Q
uang
Nga
i 2.
00
1.91
2.
09
2.99
2.
96
3.01
1.
83
1.73
1.
93
RESULTS - THE VIET NAM POPULATION AND HOUSING CENSUS OF 00:00 HOURS ON 1 APRIL 2019 | 289
Tabl
e 45
. (Co
ntin
ue)
Unit:
%
Tota
l Ur
ban
Rura
l
Tota
l M
ale
Fem
ale
Tota
l M
ale
Fem
ale
Tota
l M
ale
Fem
ale
Binh
Din
h 2.
06
1.97
2.
17
3.17
3.
14
3.21
1.
60
1.48
1.
74
Phu
Yen
1.43
1.
23
1.65
2.
25
1.94
2.
61
1.11
0.
96
1.28
Kh
anh
Hoa
3.10
2.
65
3.67
3.
78
3.22
4.
47
2.65
2.
28
3.13
Ni
nh T
huan
3.
19
2.45
4.
16
3.91
3.
02
5.05
2.
79
2.14
3.
66
Binh
Thu
an
2.28
2.
22
2.36
3.
41
3.35
3.
49
1.63
1.
57
1.72
Ko
n Tu
m
1.82
1.
80
1.85
2.
63
2.53
2.
74
1.45
1.
47
1.43
Gi
a La
i 1.
61
1.54
1.
69
1.39
1.
22
1.57
1.
70
1.66
1.
73
Dak
Lak
1.85
1.
73
1.98
2.
72
2.75
2.
69
1.59
1.
43
1.78
Da
k No
ng
1.23
1.
08
1.40
1.
56
1.52
1.
60
1.17
1.
00
1.36
La
m D
ong
0.88
0.
80
0.98
1.
23
1.07
1.
41
0.67
0.
64
0.70
Bi
nh P
huoc
2.
61
2.48
2.
76
2.83
2.
88
2.77
2.
54
2.36
2.
76
Tay
Ninh
1.
45
1.26
1.
69
1.54
1.
24
1.90
1.
43
1.27
1.
64
Binh
Duo
ng
2.11
2.
16
2.06
2.
06
2.14
1.
98
2.33
2.
24
2.43
Do
ng N
ai
2.84
2.
82
2.87
3.
19
2.95
3.
46
2.68
2.
76
2.59
Ba
Ria
- Vu
ng T
au
2.37
2.
12
2.68
3.
01
2.66
3.
47
1.50
1.
40
1.64
Ho
Chi
Min
h Ci
ty
2.97
2.
94
3.00
3.
29
3.26
3.
34
1.86
1.
86
1.85
Lo
ng A
n 2.
32
2.37
2.
25
2.84
2.
97
2.70
2.
23
2.27
2.
17
Tien
Gia
ng
1.60
1.
49
1.74
3.
30
2.80
3.
87
1.36
1.
30
1.42
Be
n Tr
e 1.
01
0.93
1.
09
0.78
0.
81
0.76
1.
03
0.94
1.
13
Tra
Vinh
2.
53
2.24
2.
90
3.23
3.
04
3.48
2.
40
2.09
2.
80
Vinh
Long
1.
97
1.76
2.
22
3.00
2.
85
3.17
1.
79
1.57
2.
05
Dong
Tha
p 3.
27
2.65
4.
08
4.41
3.
48
5.56
3.
01
2.47
3.
73
An G
iang
1.
88
1.54
2.
36
3.04
2.
72
3.49
1.
36
1.02
1.
84
Kien
Gia
ng
2.90
2.
36
3.61
2.
76
2.37
3.
22
2.96
2.
35
3.77
Ca
n Th
o 3.
63
3.15
4.
33
4.28
3.
87
4.86
2.
35
1.79
3.
21
Hau
Gian
g 2.
45
2.15
2.
81
3.41
3.
42
3.40
2.
13
1.73
2.
62
Soc T
rang
2.
54
1.87
3.
48
4.36
3.
27
5.88
1.
73
1.24
2.
41
Bac L
ieu
3.58
2.
92
4.41
2.
90
2.77
3.
05
3.82
2.
97
4.94
Ca
Mau
2.
78
2.07
3.
72
3.40
3.
16
3.70
2.
60
1.78
3.
73
290 | RESULTS - THE VIET NAM POPULATION AND HOUSING CENSUS OF 00:00 HOURS ON 1 APRIL 2019
Tabl
e 46
. UNE
MPL
OYM
ENT
RATE
OF W
ORKI
NG A
GE P
OPUL
ATIO
N BY
AGE
GRO
UP, S
EX, U
RBAN
, RUR
AL, S
OCIO
-ECO
NOM
IC R
EGIO
N
AND
PROV
INCE
, CIT
Y, 1
APR
IL 20
19
Unit:
%
Tota
l Ur
ban
Rura
l
Tota
l M
ale
Fem
ale
Tota
l M
ale
Fem
ale
Tota
l M
ale
Fem
ale
ENTI
RE C
OUNT
RY
2.16
2.
07
2.28
3.
07
2.95
3.
21
1.71
1.
64
1.80
15
-19
8.41
8.
79
7.96
10
.68
11.3
6 9.
89
7.79
8.
09
7.40
20
-24
6.80
6.
45
7.21
10
.65
9.87
11
.44
4.94
4.
93
4.95
25
-29
2.20
2.
13
2.28
3.
38
3.46
3.
29
1.57
1.
46
1.70
30
-34
1.36
1.
29
1.44
2.
00
2.04
1.
97
1.01
0.
90
1.14
35
-39
1.09
1.
04
1.15
1.
46
1.50
1.
41
0.89
0.
77
1.01
40
-44
1.04
0.
99
1.10
1.
59
1.62
1.
55
0.76
0.
67
0.87
45
-49
1.03
0.
98
1.09
1.
54
1.54
1.
53
0.78
0.
69
0.89
50
-54
1.03
1.
00
1.07
1.
52
1.57
1.
46
0.83
0.
74
0.92
55
-59
0.93
0.
93
- 1.
30
1.30
-
0.78
0.
78
- So
cio-e
cono
mic
regi
on
No
rthe
rn m
idla
nds a
nd m
ount
ain
area
s 1.
24
1.25
1.
22
2.27
2.
43
2.09
1.
03
1.02
1.
04
Red
Rive
r Del
ta
1.99
2.
07
1.89
2.
90
2.90
2.
90
1.54
1.
67
1.39
No
rth C
entra
l and
Cen
tral c
oast
al a
reas
2.
34
2.20
2.
51
3.65
3.
40
3.94
1.
84
1.75
1.
96
Cent
ral H
ighl
ands
1.
54
1.42
1.
68
1.93
1.
79
2.09
1.
39
1.27
1.
53
Sout
h Ea
st
2.72
2.
65
2.81
3.
04
2.96
3.
14
2.20
2.
15
2.26
M
ekon
g Ri
ver D
elta
2.
51
2.12
3.
06
3.58
3.
13
4.20
2.
18
1.81
2.
69
Prov
ince
, city
Ha N
oi
2.05
2.
01
2.10
2.
79
2.67
2.
92
1.42
1.
47
1.37
Ha
Gia
ng
1.22
1.
10
1.36
1.
95
1.89
2.
03
1.09
0.
97
1.23
Ca
o Ba
ng
1.13
1.
27
0.97
3.
21
3.85
2.
52
0.55
0.
58
0.52
Ba
c Kan
1.
89
1.97
1.
78
3.12
3.
46
2.74
1.
58
1.62
1.
54
Tuye
n Q
uang
1.
07
1.07
1.
07
2.41
2.
34
2.49
0.
89
0.91
0.
87
Lao
Cai
1.34
1.
26
1.43
2.
62
2.51
2.
73
0.99
0.
92
1.06
Di
en B
ien
0.90
0.
94
0.84
2.
31
2.58
2.
01
0.68
0.
69
0.66
RESULTS - THE VIET NAM POPULATION AND HOUSING CENSUS OF 00:00 HOURS ON 1 APRIL 2019 | 291
Tabl
e 46
. (Co
ntin
ue)
Unit:
%
Tota
l Ur
ban
Rura
l
Tota
l M
ale
Fem
ale
Tota
l M
ale
Fem
ale
Tota
l M
ale
Fem
ale
Lai C
hau
0.72
0.
68
0.76
1.
26
1.11
1.
41
0.60
0.
59
0.62
So
n La
0.
94
0.88
1.
00
1.47
1.
49
1.45
0.
86
0.79
0.
93
Yen
Bai
1.34
1.
25
1.45
1.
91
2.06
1.
74
1.23
1.
09
1.39
Ho
a Bi
nh
1.34
1.
32
1.36
1.
94
2.04
1.
82
1.24
1.
21
1.28
Th
ai N
guye
n 1.
29
1.42
1.
16
2.03
2.
33
1.75
0.
98
1.07
0.
88
Lang
Son
1.
98
2.09
1.
83
3.77
4.
01
3.52
1.
60
1.72
1.
44
Qua
ng N
inh
2.97
2.
82
3.16
3.
81
3.64
4.
01
1.69
1.
59
1.83
Ba
c Gia
ng
1.21
1.
26
1.16
2.
69
3.00
2.
36
1.05
1.
07
1.02
Ph
u Th
o 1.
19
1.18
1.
21
1.88
2.
00
1.74
1.
06
1.03
1.
10
Vinh
Phu
c 1.
58
1.67
1.
47
1.74
1.
79
1.69
1.
52
1.63
1.
40
Bac N
inh
1.76
2.
04
1.48
1.
87
2.12
1.
60
1.73
2.
01
1.43
Ha
i Duo
ng
2.06
2.
33
1.75
3.
67
4.09
3.
20
1.58
1.
81
1.32
Ha
i Pho
ng
3.34
3.
55
3.09
4.
20
4.27
4.
11
2.72
3.
02
2.34
Hu
ng Y
en
1.17
1.
18
1.16
2.
23
2.00
2.
48
1.03
1.
08
0.98
Th
ai B
inh
1.69
1.
79
1.59
2.
01
2.16
1.
86
1.66
1.
75
1.56
Ha
Nam
1.
61
2.03
1.
12
2.32
2.
96
1.62
1.
48
1.86
1.
02
Nam
Din
h 1.
33
1.49
1.
14
1.72
1.
85
1.58
1.
24
1.42
1.
05
Ninh
Bin
h 1.
42
1.41
1.
44
1.93
1.
86
2.01
1.
30
1.30
1.
29
Than
h Ho
a 1.
38
1.34
1.
43
2.43
2.
41
2.45
1.
22
1.18
1.
27
Nghe
An
1.74
1.
71
1.78
3.
47
3.72
3.
22
1.48
1.
42
1.55
Ha
Tin
h 2.
48
2.65
2.
28
3.44
3.
57
3.29
2.
23
2.42
2.
01
Qua
ng B
inh
2.41
2.
34
2.50
2.
51
2.39
2.
63
2.39
2.
33
2.46
Q
uang
Tri
2.89
2.
85
2.92
4.
19
4.11
4.
29
2.29
2.
30
2.28
Th
ua T
hien
Hue
3.
72
3.45
4.
07
4.22
3.
74
4.81
3.
24
3.17
3.
32
Da N
ang
4.26
3.
98
4.56
4.
41
4.04
4.
81
3.19
3.
54
2.79
Q
uang
Nam
2.
64
2.58
2.
71
3.55
3.
58
3.51
2.
32
2.25
2.
42
Qua
ng N
gai
2.27
2.
10
2.49
3.
29
3.17
3.
43
2.08
1.
91
2.30
Bi
nh D
inh
2.34
2.
16
2.56
3.
50
3.34
3.
69
1.82
1.
63
2.05
292 | RESULTS - THE VIET NAM POPULATION AND HOUSING CENSUS OF 00:00 HOURS ON 1 APRIL 2019
Tabl
e 46
. (Co
ntin
ue)
Unit:
%
Tota
l Ur
ban
Rura
l
Tota
l M
ale
Fem
ale
Tota
l M
ale
Fem
ale
Tota
l M
ale
Fem
ale
Phu
Yen
1.51
1.
29
1.80
2.
40
2.05
2.
84
1.17
1.
00
1.38
Kh
anh
Hoa
3.28
2.
73
4.03
4.
00
3.32
4.
92
2.79
2.
35
3.41
Ni
nh T
huan
3.
40
2.56
4.
60
4.21
3.
18
5.64
2.
95
2.23
4.
00
Binh
Thu
an
2.34
2.
23
2.49
3.
54
3.39
3.
75
1.64
1.
55
1.76
Ko
n Tu
m
1.87
1.
82
1.94
2.
73
2.59
2.
89
1.47
1.
46
1.48
Gi
a La
i 1.
63
1.54
1.
73
1.46
1.
26
1.69
1.
70
1.65
1.
75
Dak
Lak
1.90
1.
74
2.09
2.
88
2.85
2.
93
1.60
1.
41
1.84
Da
k No
ng
1.27
1.
09
1.49
1.
65
1.56
1.
76
1.20
1.
00
1.44
La
m D
ong
0.93
0.
82
1.06
1.
31
1.10
1.
55
0.69
0.
65
0.74
Bi
nh P
huoc
2.
68
2.53
2.
88
2.87
2.
88
2.85
2.
63
2.43
2.
89
Tay
Ninh
1.
42
1.25
1.
64
1.64
1.
32
2.07
1.
37
1.24
1.
55
Binh
Duo
ng
2.16
2.
20
2.11
2.
12
2.18
2.
04
2.34
2.
27
2.44
Do
ng N
ai
2.99
2.
93
3.06
3.
35
3.05
3.
71
2.81
2.
87
2.74
Ba
Ria
- Vu
ng T
au
2.44
2.
15
2.84
3.
08
2.68
3.
62
1.55
1.
42
1.72
Ho
Chi
Min
h Ci
ty
3.04
2.
98
3.12
3.
38
3.31
3.
46
1.89
1.
87
1.92
Lo
ng A
n 2.
32
2.37
2.
25
3.01
3.
08
2.93
2.
20
2.26
2.
13
Tien
Gia
ng
1.78
1.
60
2.03
3.
73
3.01
4.
64
1.50
1.
39
1.63
Be
n Tr
e 1.
09
1.00
1.
22
0.92
0.
91
0.93
1.
11
1.00
1.
25
Tra
Vinh
2.
71
2.34
3.
23
3.31
3.
13
3.57
2.
59
2.19
3.
16
Vinh
Long
2.
19
1.90
2.
58
3.38
3.
07
3.78
1.
96
1.68
2.
34
Dong
Tha
p 3.
48
2.81
4.
46
4.83
3.
73
6.31
3.
17
2.60
4.
00
An G
iang
1.
91
1.53
2.
49
3.23
2.
81
3.85
1.
31
0.97
1.
85
Kien
Gia
ng
2.91
2.
37
3.69
2.
92
2.47
3.
51
2.91
2.
33
3.77
Ca
n Th
o 3.
76
3.24
4.
56
4.44
3.
98
5.14
2.
33
1.80
3.
25
Hau
Gian
g 2.
52
2.21
2.
94
3.70
3.
66
3.76
2.
13
1.73
2.
66
Soc T
rang
2.
59
1.87
3.
70
4.62
3.
37
6.52
1.
64
1.17
2.
37
Bac L
ieu
3.46
2.
84
4.32
2.
75
2.64
2.
90
3.72
2.
91
4.87
Ca
Mau
2.
80
2.10
3.
81
3.29
3.
12
3.51
2.
66
1.82
3.
90
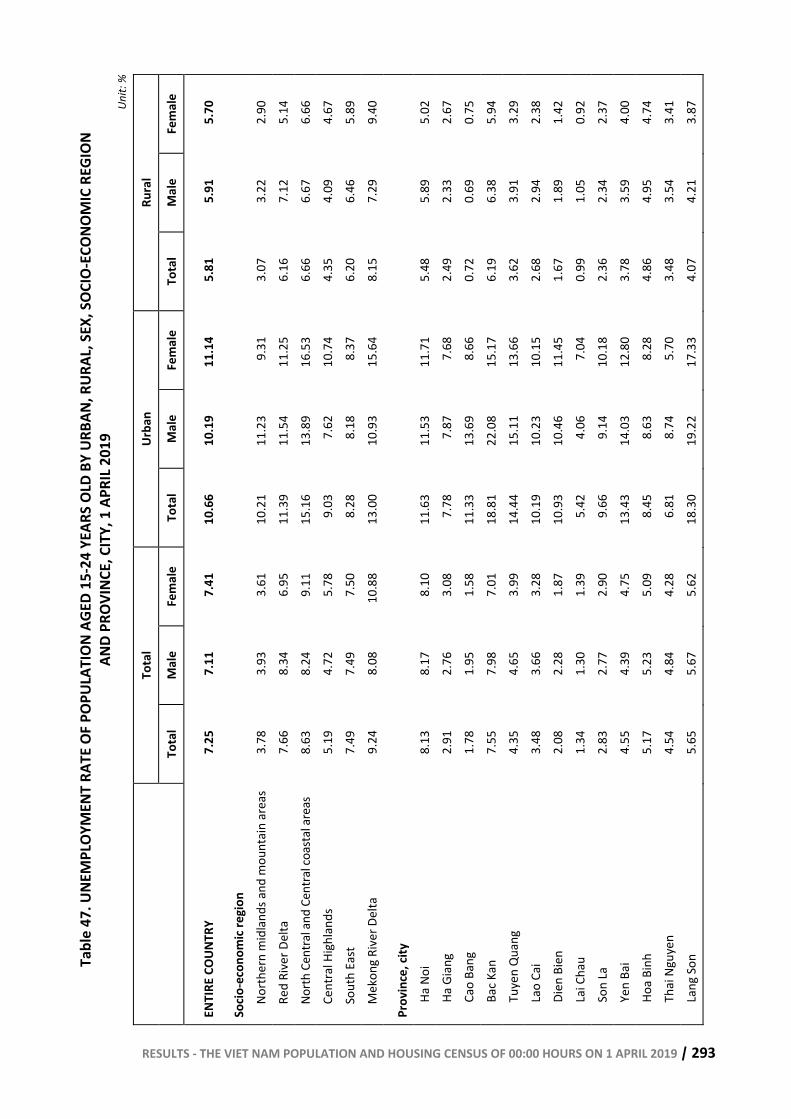
RESULTS - THE VIET NAM POPULATION AND HOUSING CENSUS OF 00:00 HOURS ON 1 APRIL 2019 | 293
Tabl
e 47
. UNE
MPL
OYM
ENT
RATE
OF P
OPUL
ATIO
N AG
ED 1
5-24
YEA
RS O
LD B
Y UR
BAN,
RUR
AL, S
EX, S
OCIO
-ECO
NOM
IC R
EGIO
N
AND
PROV
INCE
, CIT
Y, 1
APR
IL 20
19
Unit:
%
Tota
l Ur
ban
Rura
l
Tota
l M
ale
Fem
ale
Tota
l M
ale
Fem
ale
Tota
l M
ale
Fem
ale
ENTI
RE C
OUNT
RY
7.25
7.
11
7.41
10
.66
10.1
9 11
.14
5.81
5.
91
5.70
Socio
-eco
nom
ic re
gion
Nort
hern
mid
land
s and
mou
ntai
n ar
eas
3.78
3.
93
3.61
10
.21
11.2
3 9.
31
3.07
3.
22
2.90
Re
d Ri
ver D
elta
7.
66
8.34
6.
95
11.3
9 11
.54
11.2
5 6.
16
7.12
5.
14
North
Cen
tral a
nd C
entra
l coa
stal
are
as
8.63
8.
24
9.11
15
.16
13.8
9 16
.53
6.66
6.
67
6.66
Ce
ntra
l Hig
hlan
ds
5.19
4.
72
5.78
9.
03
7.62
10
.74
4.35
4.
09
4.67
So
uth
East
7.
49
7.49
7.
50
8.28
8.
18
8.37
6.
20
6.46
5.
89
Mek
ong
Rive
r Del
ta
9.24
8.
08
10.8
8 13
.00
10.9
3 15
.64
8.15
7.
29
9.40
Prov
ince
, city
Ha N
oi
8.13
8.
17
8.10
11
.63
11.5
3 11
.71
5.48
5.
89
5.02
Ha
Gia
ng
2.91
2.
76
3.08
7.
78
7.87
7.
68
2.49
2.
33
2.67
Ca
o Ba
ng
1.78
1.
95
1.58
11
.33
13.6
9 8.
66
0.72
0.
69
0.75
Ba
c Kan
7.
55
7.98
7.
01
18.8
1 22
.08
15.1
7 6.
19
6.38
5.
94
Tuye
n Q
uang
4.
35
4.65
3.
99
14.4
4 15
.11
13.6
6 3.
62
3.91
3.
29
Lao
Cai
3.48
3.
66
3.28
10
.19
10.2
3 10
.15
2.68
2.
94
2.38
Di
en B
ien
2.08
2.
28
1.87
10
.93
10.4
6 11
.45
1.67
1.
89
1.42
La
i Cha
u 1.
34
1.30
1.
39
5.42
4.
06
7.04
0.
99
1.05
0.
92
Son
La
2.83
2.
77
2.90
9.
66
9.14
10
.18
2.36
2.
34
2.37
Ye
n Ba
i 4.
55
4.39
4.
75
13.4
3 14
.03
12.8
0 3.
78
3.59
4.
00
Hoa
Binh
5.
17
5.23
5.
09
8.45
8.
63
8.28
4.
86
4.95
4.
74
Thai
Ngu
yen
4.54
4.
84
4.28
6.
81
8.74
5.
70
3.48
3.
54
3.41
La
ng S
on
5.65
5.
67
5.62
18
.30
19.2
2 17
.33
4.07
4.
21
3.87
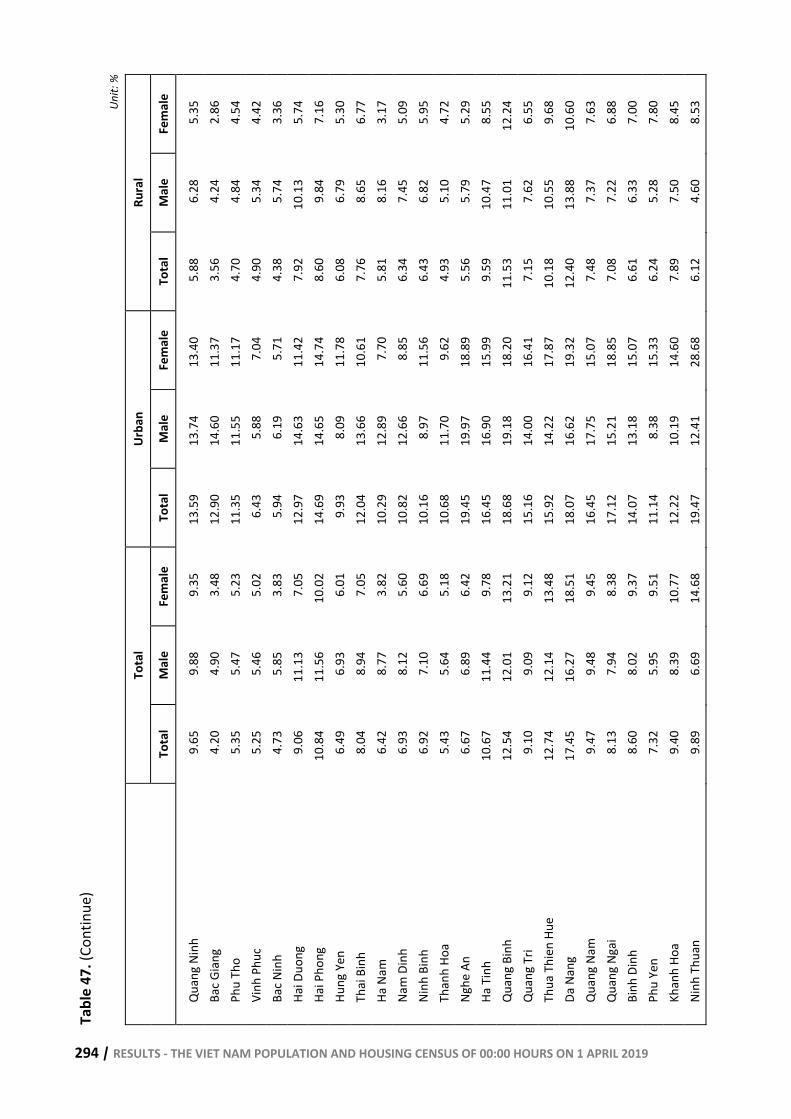
294 | RESULTS - THE VIET NAM POPULATION AND HOUSING CENSUS OF 00:00 HOURS ON 1 APRIL 2019
Tabl
e 47
. (Co
ntin
ue)
Un
it: %
Tota
l Ur
ban
Rura
l
Tota
l M
ale
Fem
ale
Tota
l M
ale
Fem
ale
Tota
l M
ale
Fem
ale
Qua
ng N
inh
9.65
9.
88
9.35
13
.59
13.7
4 13
.40
5.88
6.
28
5.35
Ba
c Gia
ng
4.20
4.
90
3.48
12
.90
14.6
0 11
.37
3.56
4.
24
2.86
Ph
u Th
o 5.
35
5.47
5.
23
11.3
5 11
.55
11.1
7 4.
70
4.84
4.
54
Vinh
Phu
c 5.
25
5.46
5.
02
6.43
5.
88
7.04
4.
90
5.34
4.
42
Bac N
inh
4.73
5.
85
3.83
5.
94
6.19
5.
71
4.38
5.
74
3.36
Ha
i Duo
ng
9.06
11
.13
7.05
12
.97
14.6
3 11
.42
7.92
10
.13
5.74
Ha
i Pho
ng
10.8
4 11
.56
10.0
2 14
.69
14.6
5 14
.74
8.60
9.
84
7.16
Hu
ng Y
en
6.49
6.
93
6.01
9.
93
8.09
11
.78
6.08
6.
79
5.30
Th
ai B
inh
8.04
8.
94
7.05
12
.04
13.6
6 10
.61
7.76
8.
65
6.77
Ha
Nam
6.
42
8.77
3.
82
10.2
9 12
.89
7.70
5.
81
8.16
3.
17
Nam
Din
h 6.
93
8.12
5.
60
10.8
2 12
.66
8.85
6.
34
7.45
5.
09
Ninh
Bin
h 6.
92
7.10
6.
69
10.1
6 8.
97
11.5
6 6.
43
6.82
5.
95
Than
h Ho
a 5.
43
5.64
5.
18
10.6
8 11
.70
9.62
4.
93
5.10
4.
72
Nghe
An
6.67
6.
89
6.42
19
.45
19.9
7 18
.89
5.56
5.
79
5.29
Ha
Tin
h 10
.67
11.4
4 9.
78
16.4
5 16
.90
15.9
9 9.
59
10.4
7 8.
55
Qua
ng B
inh
12.5
4 12
.01
13.2
1 18
.68
19.1
8 18
.20
11.5
3 11
.01
12.2
4 Q
uang
Tri
9.10
9.
09
9.12
15
.16
14.0
0 16
.41
7.15
7.
62
6.55
Th
ua T
hien
Hue
12
.74
12.1
4 13
.48
15.9
2 14
.22
17.8
7 10
.18
10.5
5 9.
68
Da N
ang
17.4
5 16
.27
18.5
1 18
.07
16.6
2 19
.32
12.4
0 13
.88
10.6
0 Q
uang
Nam
9.
47
9.48
9.
45
16.4
5 17
.75
15.0
7 7.
48
7.37
7.
63
Qua
ng N
gai
8.13
7.
94
8.38
17
.12
15.2
1 18
.85
7.08
7.
22
6.88
Bi
nh D
inh
8.60
8.
02
9.37
14
.07
13.1
8 15
.07
6.61
6.
33
7.00
Ph
u Ye
n 7.
32
5.95
9.
51
11.1
4 8.
38
15.3
3 6.
24
5.28
7.
80
Khan
h Ho
a 9.
40
8.39
10
.77
12.2
2 10
.19
14.6
0 7.
89
7.50
8.
45
Ninh
Thu
an
9.89
6.
69
14.6
8 19
.47
12.4
1 28
.68
6.12
4.
60
8.53
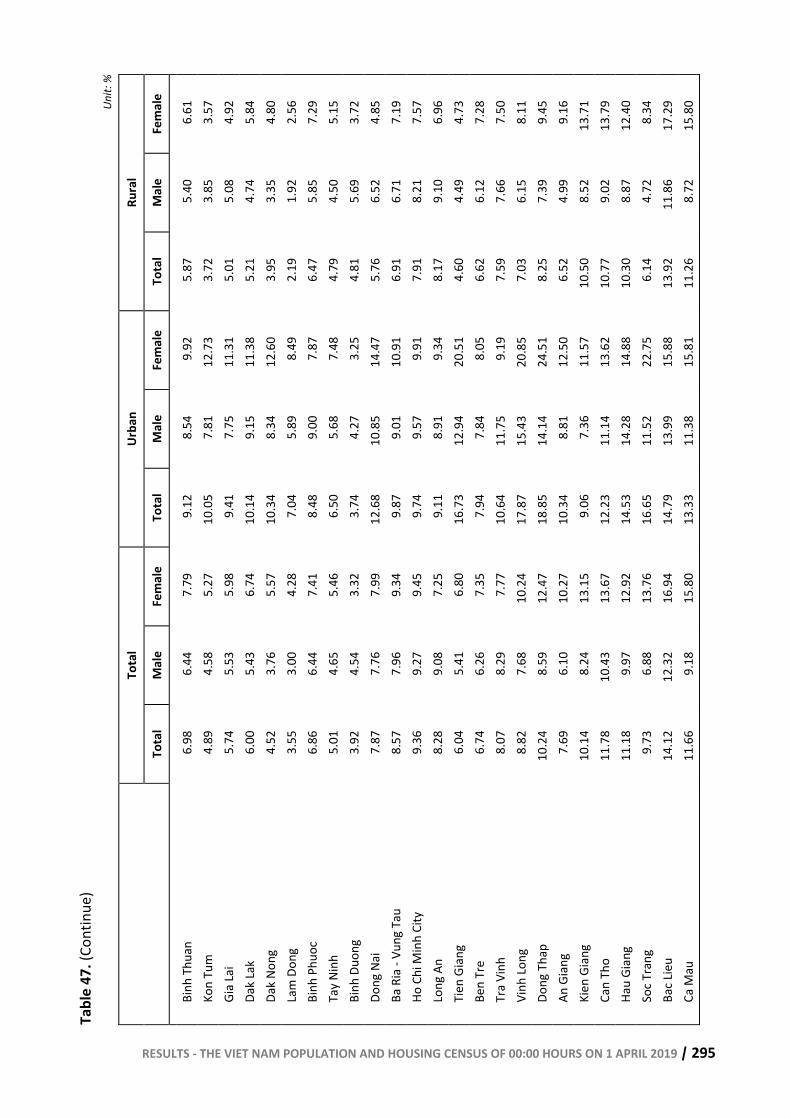
RESULTS - THE VIET NAM POPULATION AND HOUSING CENSUS OF 00:00 HOURS ON 1 APRIL 2019 | 295
Tabl
e 47
. (Co
ntin
ue)
Unit:
%
Tota
l Ur
ban
Rura
l
Tota
l M
ale
Fem
ale
Tota
l M
ale
Fem
ale
Tota
l M
ale
Fem
ale
Binh
Thu
an
6.98
6.
44
7.79
9.
12
8.54
9.
92
5.87
5.
40
6.61
Ko
n Tu
m
4.89
4.
58
5.27
10
.05
7.81
12
.73
3.72
3.
85
3.57
Gi
a La
i 5.
74
5.53
5.
98
9.41
7.
75
11.3
1 5.
01
5.08
4.
92
Dak
Lak
6.00
5.
43
6.74
10
.14
9.15
11
.38
5.21
4.
74
5.84
Da
k No
ng
4.52
3.
76
5.57
10
.34
8.34
12
.60
3.95
3.
35
4.80
La
m D
ong
3.55
3.
00
4.28
7.
04
5.89
8.
49
2.19
1.
92
2.56
Bi
nh P
huoc
6.
86
6.44
7.
41
8.48
9.
00
7.87
6.
47
5.85
7.
29
Tay
Ninh
5.
01
4.65
5.
46
6.50
5.
68
7.48
4.
79
4.50
5.
15
Binh
Duo
ng
3.92
4.
54
3.32
3.
74
4.27
3.
25
4.81
5.
69
3.72
Do
ng N
ai
7.87
7.
76
7.99
12
.68
10.8
5 14
.47
5.76
6.
52
4.85
Ba
Ria
- Vu
ng T
au
8.57
7.
96
9.34
9.
87
9.01
10
.91
6.91
6.
71
7.19
Ho
Chi
Min
h Ci
ty
9.36
9.
27
9.45
9.
74
9.57
9.
91
7.91
8.
21
7.57
Lo
ng A
n 8.
28
9.08
7.
25
9.11
8.
91
9.34
8.
17
9.10
6.
96
Tien
Gia
ng
6.04
5.
41
6.80
16
.73
12.9
4 20
.51
4.60
4.
49
4.73
Be
n Tr
e 6.
74
6.26
7.
35
7.94
7.
84
8.05
6.
62
6.12
7.
28
Tra
Vinh
8.
07
8.29
7.
77
10.6
4 11
.75
9.19
7.
59
7.66
7.
50
Vinh
Long
8.
82
7.68
10
.24
17.8
7 15
.43
20.8
5 7.
03
6.15
8.
11
Dong
Tha
p 10
.24
8.59
12
.47
18.8
5 14
.14
24.5
1 8.
25
7.39
9.
45
An G
iang
7.
69
6.10
10
.27
10.3
4 8.
81
12.5
0 6.
52
4.99
9.
16
Kien
Gia
ng
10.1
4 8.
24
13.1
5 9.
06
7.36
11
.57
10.5
0 8.
52
13.7
1 Ca
n Th
o 11
.78
10.4
3 13
.67
12.2
3 11
.14
13.6
2 10
.77
9.02
13
.79
Hau
Gian
g 11
.18
9.97
12
.92
14.5
3 14
.28
14.8
8 10
.30
8.87
12
.40
Soc T
rang
9.
73
6.88
13
.76
16.6
5 11
.52
22.7
5 6.
14
4.72
8.
34
Bac L
ieu
14.1
2 12
.32
16.9
4 14
.79
13.9
9 15
.88
13.9
2 11
.86
17.2
9 Ca
Mau
11
.66
9.18
15
.80
13.3
3 11
.38
15.8
1 11
.26
8.72
15
.80
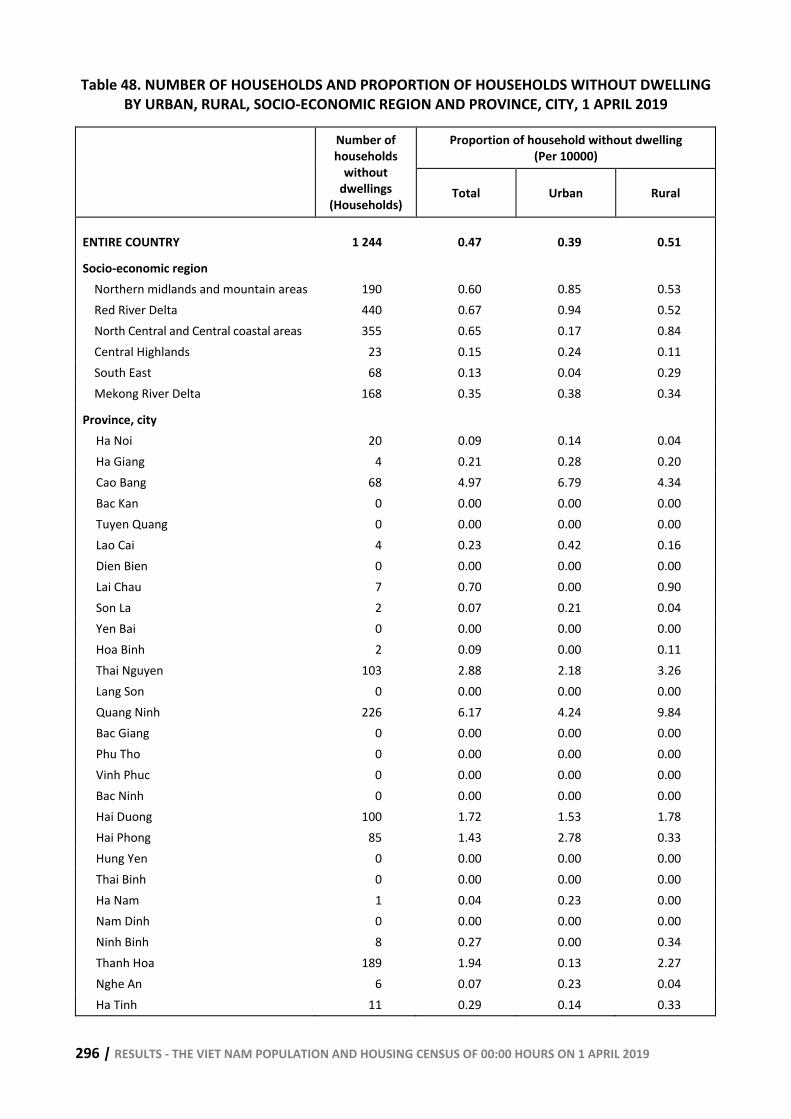
296 | RESULTS - THE VIET NAM POPULATION AND HOUSING CENSUS OF 00:00 HOURS ON 1 APRIL 2019
Table 48. NUMBER OF HOUSEHOLDS AND PROPORTION OF HOUSEHOLDS WITHOUT DWELLING BY URBAN, RURAL, SOCIO-ECONOMIC REGION AND PROVINCE, CITY, 1 APRIL 2019
Proportion of household without dwelling (Per 10000)
Number of households
without dwellings
(Households) Total Urban Rural
ENTIRE COUNTRY 1 244 0.47 0.39 0.51
Socio-economic region Northern midlands and mountain areas 190 0.60 0.85 0.53 Red River Delta 440 0.67 0.94 0.52 North Central and Central coastal areas 355 0.65 0.17 0.84 Central Highlands 23 0.15 0.24 0.11 South East 68 0.13 0.04 0.29 Mekong River Delta 168 0.35 0.38 0.34
Province, city Ha Noi 20 0.09 0.14 0.04 Ha Giang 4 0.21 0.28 0.20 Cao Bang 68 4.97 6.79 4.34 Bac Kan 0 0.00 0.00 0.00 Tuyen Quang 0 0.00 0.00 0.00 Lao Cai 4 0.23 0.42 0.16 Dien Bien 0 0.00 0.00 0.00 Lai Chau 7 0.70 0.00 0.90 Son La 2 0.07 0.21 0.04 Yen Bai 0 0.00 0.00 0.00 Hoa Binh 2 0.09 0.00 0.11 Thai Nguyen 103 2.88 2.18 3.26 Lang Son 0 0.00 0.00 0.00 Quang Ninh 226 6.17 4.24 9.84 Bac Giang 0 0.00 0.00 0.00 Phu Tho 0 0.00 0.00 0.00 Vinh Phuc 0 0.00 0.00 0.00 Bac Ninh 0 0.00 0.00 0.00 Hai Duong 100 1.72 1.53 1.78 Hai Phong 85 1.43 2.78 0.33 Hung Yen 0 0.00 0.00 0.00 Thai Binh 0 0.00 0.00 0.00 Ha Nam 1 0.04 0.23 0.00 Nam Dinh 0 0.00 0.00 0.00 Ninh Binh 8 0.27 0.00 0.34 Thanh Hoa 189 1.94 0.13 2.27 Nghe An 6 0.07 0.23 0.04 Ha Tinh 11 0.29 0.14 0.33
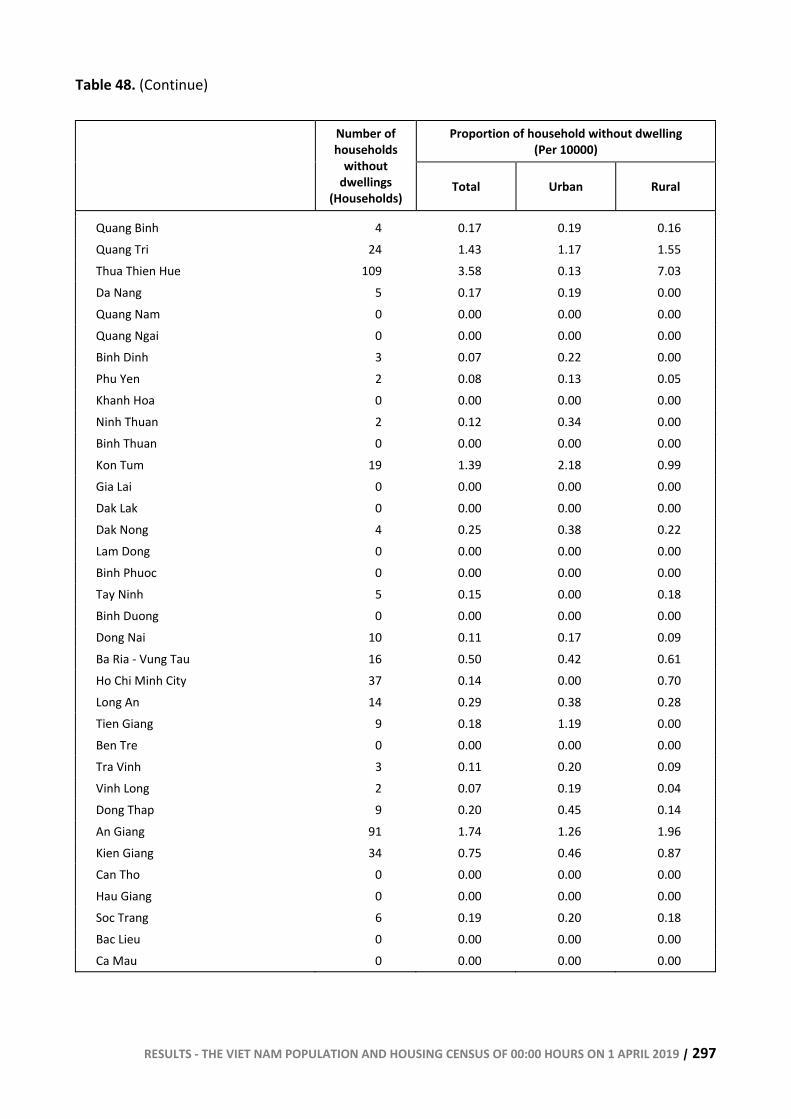
RESULTS - THE VIET NAM POPULATION AND HOUSING CENSUS OF 00:00 HOURS ON 1 APRIL 2019 | 297
Table 48. (Continue)
Proportion of household without dwelling (Per 10000)
Number of households
without dwellings
(Households) Total Urban Rural
Quang Binh 4 0.17 0.19 0.16 Quang Tri 24 1.43 1.17 1.55 Thua Thien Hue 109 3.58 0.13 7.03 Da Nang 5 0.17 0.19 0.00 Quang Nam 0 0.00 0.00 0.00 Quang Ngai 0 0.00 0.00 0.00 Binh Dinh 3 0.07 0.22 0.00 Phu Yen 2 0.08 0.13 0.05 Khanh Hoa 0 0.00 0.00 0.00 Ninh Thuan 2 0.12 0.34 0.00 Binh Thuan 0 0.00 0.00 0.00 Kon Tum 19 1.39 2.18 0.99 Gia Lai 0 0.00 0.00 0.00 Dak Lak 0 0.00 0.00 0.00 Dak Nong 4 0.25 0.38 0.22 Lam Dong 0 0.00 0.00 0.00 Binh Phuoc 0 0.00 0.00 0.00 Tay Ninh 5 0.15 0.00 0.18 Binh Duong 0 0.00 0.00 0.00 Dong Nai 10 0.11 0.17 0.09 Ba Ria - Vung Tau 16 0.50 0.42 0.61 Ho Chi Minh City 37 0.14 0.00 0.70 Long An 14 0.29 0.38 0.28 Tien Giang 9 0.18 1.19 0.00 Ben Tre 0 0.00 0.00 0.00 Tra Vinh 3 0.11 0.20 0.09 Vinh Long 2 0.07 0.19 0.04 Dong Thap 9 0.20 0.45 0.14 An Giang 91 1.74 1.26 1.96 Kien Giang 34 0.75 0.46 0.87 Can Tho 0 0.00 0.00 0.00 Hau Giang 0 0.00 0.00 0.00 Soc Trang 6 0.19 0.20 0.18 Bac Lieu 0 0.00 0.00 0.00 Ca Mau 0 0.00 0.00 0.00
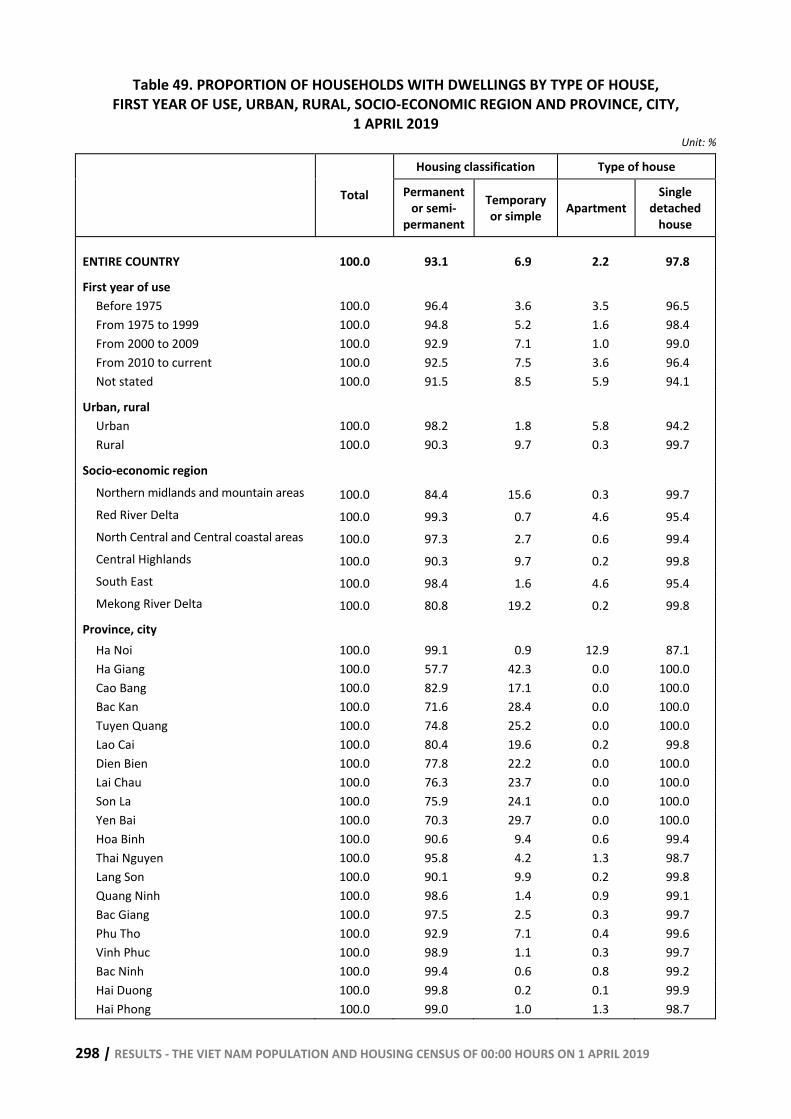
298 | RESULTS - THE VIET NAM POPULATION AND HOUSING CENSUS OF 00:00 HOURS ON 1 APRIL 2019
Table 49. PROPORTION OF HOUSEHOLDS WITH DWELLINGS BY TYPE OF HOUSE, FIRST YEAR OF USE, URBAN, RURAL, SOCIO-ECONOMIC REGION AND PROVINCE, CITY,
1 APRIL 2019
Unit: %
Housing classification Type of house
Total Permanent or semi-
permanent
Temporary or simple Apartment
Single detached
house
ENTIRE COUNTRY 100.0 93.1 6.9 2.2 97.8
First year of use Before 1975 100.0 96.4 3.6 3.5 96.5 From 1975 to 1999 100.0 94.8 5.2 1.6 98.4 From 2000 to 2009 100.0 92.9 7.1 1.0 99.0 From 2010 to current 100.0 92.5 7.5 3.6 96.4 Not stated 100.0 91.5 8.5 5.9 94.1
Urban, rural Urban 100.0 98.2 1.8 5.8 94.2 Rural 100.0 90.3 9.7 0.3 99.7
Socio-economic region Northern midlands and mountain areas 100.0 84.4 15.6 0.3 99.7 Red River Delta 100.0 99.3 0.7 4.6 95.4 North Central and Central coastal areas 100.0 97.3 2.7 0.6 99.4 Central Highlands 100.0 90.3 9.7 0.2 99.8 South East 100.0 98.4 1.6 4.6 95.4 Mekong River Delta 100.0 80.8 19.2 0.2 99.8
Province, city Ha Noi 100.0 99.1 0.9 12.9 87.1 Ha Giang 100.0 57.7 42.3 0.0 100.0 Cao Bang 100.0 82.9 17.1 0.0 100.0 Bac Kan 100.0 71.6 28.4 0.0 100.0 Tuyen Quang 100.0 74.8 25.2 0.0 100.0 Lao Cai 100.0 80.4 19.6 0.2 99.8 Dien Bien 100.0 77.8 22.2 0.0 100.0 Lai Chau 100.0 76.3 23.7 0.0 100.0 Son La 100.0 75.9 24.1 0.0 100.0 Yen Bai 100.0 70.3 29.7 0.0 100.0 Hoa Binh 100.0 90.6 9.4 0.6 99.4 Thai Nguyen 100.0 95.8 4.2 1.3 98.7 Lang Son 100.0 90.1 9.9 0.2 99.8 Quang Ninh 100.0 98.6 1.4 0.9 99.1 Bac Giang 100.0 97.5 2.5 0.3 99.7 Phu Tho 100.0 92.9 7.1 0.4 99.6 Vinh Phuc 100.0 98.9 1.1 0.3 99.7 Bac Ninh 100.0 99.4 0.6 0.8 99.2 Hai Duong 100.0 99.8 0.2 0.1 99.9 Hai Phong 100.0 99.0 1.0 1.3 98.7
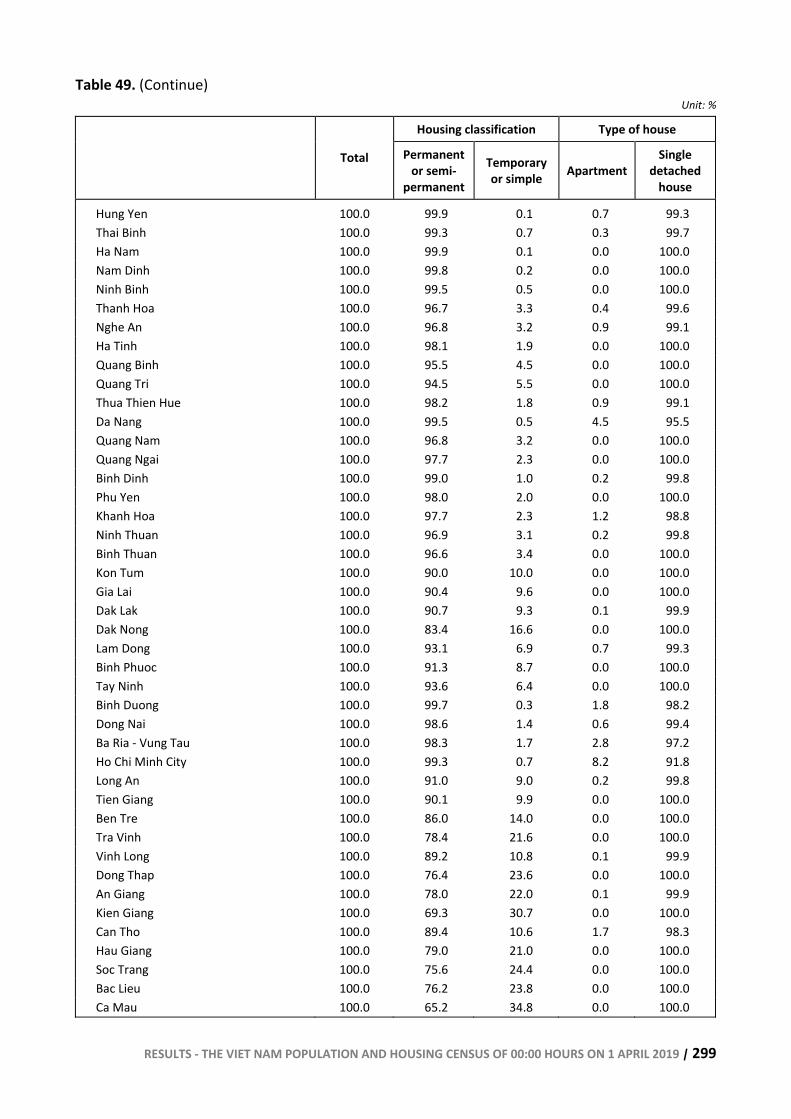
RESULTS - THE VIET NAM POPULATION AND HOUSING CENSUS OF 00:00 HOURS ON 1 APRIL 2019 | 299
Table 49. (Continue)
Unit: %
Housing classification Type of house
Total Permanent or semi-
permanent
Temporary or simple Apartment
Single detached
house
Hung Yen 100.0 99.9 0.1 0.7 99.3 Thai Binh 100.0 99.3 0.7 0.3 99.7 Ha Nam 100.0 99.9 0.1 0.0 100.0 Nam Dinh 100.0 99.8 0.2 0.0 100.0 Ninh Binh 100.0 99.5 0.5 0.0 100.0 Thanh Hoa 100.0 96.7 3.3 0.4 99.6 Nghe An 100.0 96.8 3.2 0.9 99.1 Ha Tinh 100.0 98.1 1.9 0.0 100.0 Quang Binh 100.0 95.5 4.5 0.0 100.0 Quang Tri 100.0 94.5 5.5 0.0 100.0 Thua Thien Hue 100.0 98.2 1.8 0.9 99.1 Da Nang 100.0 99.5 0.5 4.5 95.5 Quang Nam 100.0 96.8 3.2 0.0 100.0 Quang Ngai 100.0 97.7 2.3 0.0 100.0 Binh Dinh 100.0 99.0 1.0 0.2 99.8 Phu Yen 100.0 98.0 2.0 0.0 100.0 Khanh Hoa 100.0 97.7 2.3 1.2 98.8 Ninh Thuan 100.0 96.9 3.1 0.2 99.8 Binh Thuan 100.0 96.6 3.4 0.0 100.0 Kon Tum 100.0 90.0 10.0 0.0 100.0 Gia Lai 100.0 90.4 9.6 0.0 100.0 Dak Lak 100.0 90.7 9.3 0.1 99.9 Dak Nong 100.0 83.4 16.6 0.0 100.0 Lam Dong 100.0 93.1 6.9 0.7 99.3 Binh Phuoc 100.0 91.3 8.7 0.0 100.0 Tay Ninh 100.0 93.6 6.4 0.0 100.0 Binh Duong 100.0 99.7 0.3 1.8 98.2 Dong Nai 100.0 98.6 1.4 0.6 99.4 Ba Ria - Vung Tau 100.0 98.3 1.7 2.8 97.2 Ho Chi Minh City 100.0 99.3 0.7 8.2 91.8 Long An 100.0 91.0 9.0 0.2 99.8 Tien Giang 100.0 90.1 9.9 0.0 100.0 Ben Tre 100.0 86.0 14.0 0.0 100.0 Tra Vinh 100.0 78.4 21.6 0.0 100.0 Vinh Long 100.0 89.2 10.8 0.1 99.9 Dong Thap 100.0 76.4 23.6 0.0 100.0 An Giang 100.0 78.0 22.0 0.1 99.9 Kien Giang 100.0 69.3 30.7 0.0 100.0 Can Tho 100.0 89.4 10.6 1.7 98.3 Hau Giang 100.0 79.0 21.0 0.0 100.0 Soc Trang 100.0 75.6 24.4 0.0 100.0 Bac Lieu 100.0 76.2 23.8 0.0 100.0 Ca Mau 100.0 65.2 34.8 0.0 100.0
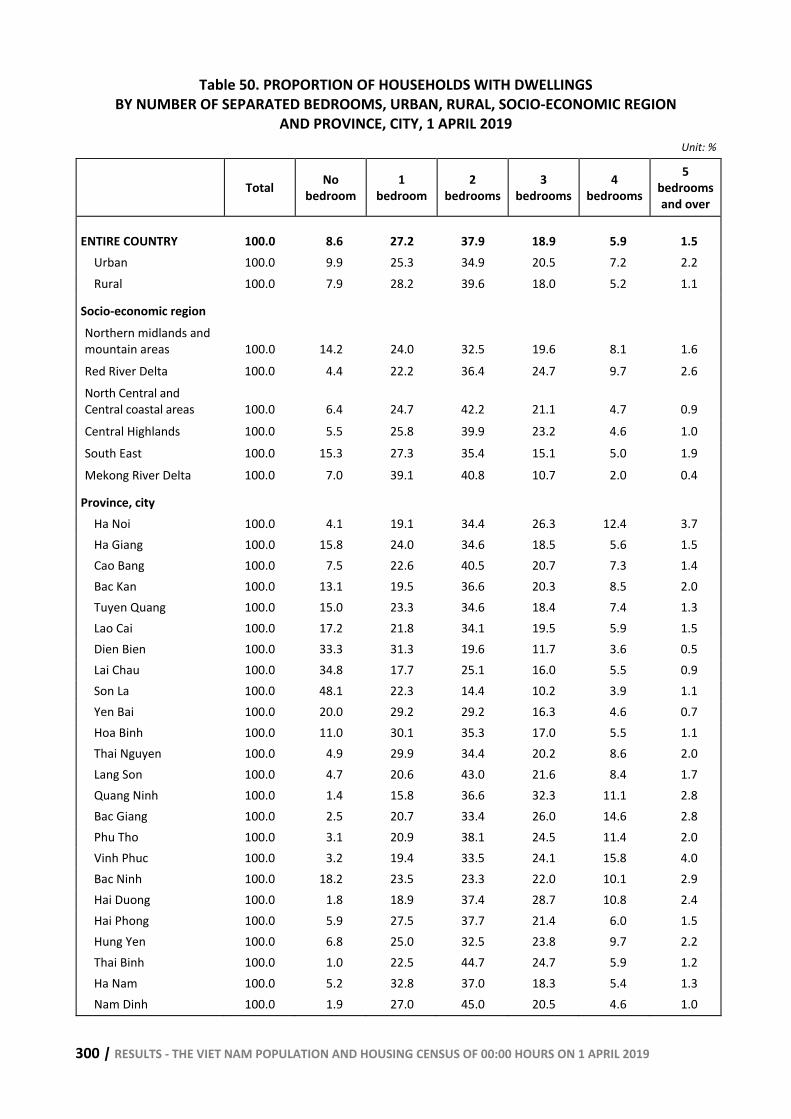
300 | RESULTS - THE VIET NAM POPULATION AND HOUSING CENSUS OF 00:00 HOURS ON 1 APRIL 2019
Table 50. PROPORTION OF HOUSEHOLDS WITH DWELLINGS BY NUMBER OF SEPARATED BEDROOMS, URBAN, RURAL, SOCIO-ECONOMIC REGION
AND PROVINCE, CITY, 1 APRIL 2019
Unit: %
Total No bedroom
1 bedroom
2 bedrooms
3 bedrooms
4 bedrooms
5 bedrooms and over
ENTIRE COUNTRY 100.0 8.6 27.2 37.9 18.9 5.9 1.5 Urban 100.0 9.9 25.3 34.9 20.5 7.2 2.2 Rural 100.0 7.9 28.2 39.6 18.0 5.2 1.1
Socio-economic region Northern midlands and mountain areas 100.0 14.2 24.0 32.5 19.6 8.1 1.6 Red River Delta 100.0 4.4 22.2 36.4 24.7 9.7 2.6 North Central and Central coastal areas 100.0 6.4 24.7 42.2 21.1 4.7 0.9 Central Highlands 100.0 5.5 25.8 39.9 23.2 4.6 1.0 South East 100.0 15.3 27.3 35.4 15.1 5.0 1.9 Mekong River Delta 100.0 7.0 39.1 40.8 10.7 2.0 0.4
Province, city Ha Noi 100.0 4.1 19.1 34.4 26.3 12.4 3.7 Ha Giang 100.0 15.8 24.0 34.6 18.5 5.6 1.5 Cao Bang 100.0 7.5 22.6 40.5 20.7 7.3 1.4 Bac Kan 100.0 13.1 19.5 36.6 20.3 8.5 2.0 Tuyen Quang 100.0 15.0 23.3 34.6 18.4 7.4 1.3 Lao Cai 100.0 17.2 21.8 34.1 19.5 5.9 1.5 Dien Bien 100.0 33.3 31.3 19.6 11.7 3.6 0.5 Lai Chau 100.0 34.8 17.7 25.1 16.0 5.5 0.9 Son La 100.0 48.1 22.3 14.4 10.2 3.9 1.1 Yen Bai 100.0 20.0 29.2 29.2 16.3 4.6 0.7 Hoa Binh 100.0 11.0 30.1 35.3 17.0 5.5 1.1 Thai Nguyen 100.0 4.9 29.9 34.4 20.2 8.6 2.0 Lang Son 100.0 4.7 20.6 43.0 21.6 8.4 1.7 Quang Ninh 100.0 1.4 15.8 36.6 32.3 11.1 2.8 Bac Giang 100.0 2.5 20.7 33.4 26.0 14.6 2.8 Phu Tho 100.0 3.1 20.9 38.1 24.5 11.4 2.0 Vinh Phuc 100.0 3.2 19.4 33.5 24.1 15.8 4.0 Bac Ninh 100.0 18.2 23.5 23.3 22.0 10.1 2.9 Hai Duong 100.0 1.8 18.9 37.4 28.7 10.8 2.4 Hai Phong 100.0 5.9 27.5 37.7 21.4 6.0 1.5 Hung Yen 100.0 6.8 25.0 32.5 23.8 9.7 2.2 Thai Binh 100.0 1.0 22.5 44.7 24.7 5.9 1.2 Ha Nam 100.0 5.2 32.8 37.0 18.3 5.4 1.3 Nam Dinh 100.0 1.9 27.0 45.0 20.5 4.6 1.0
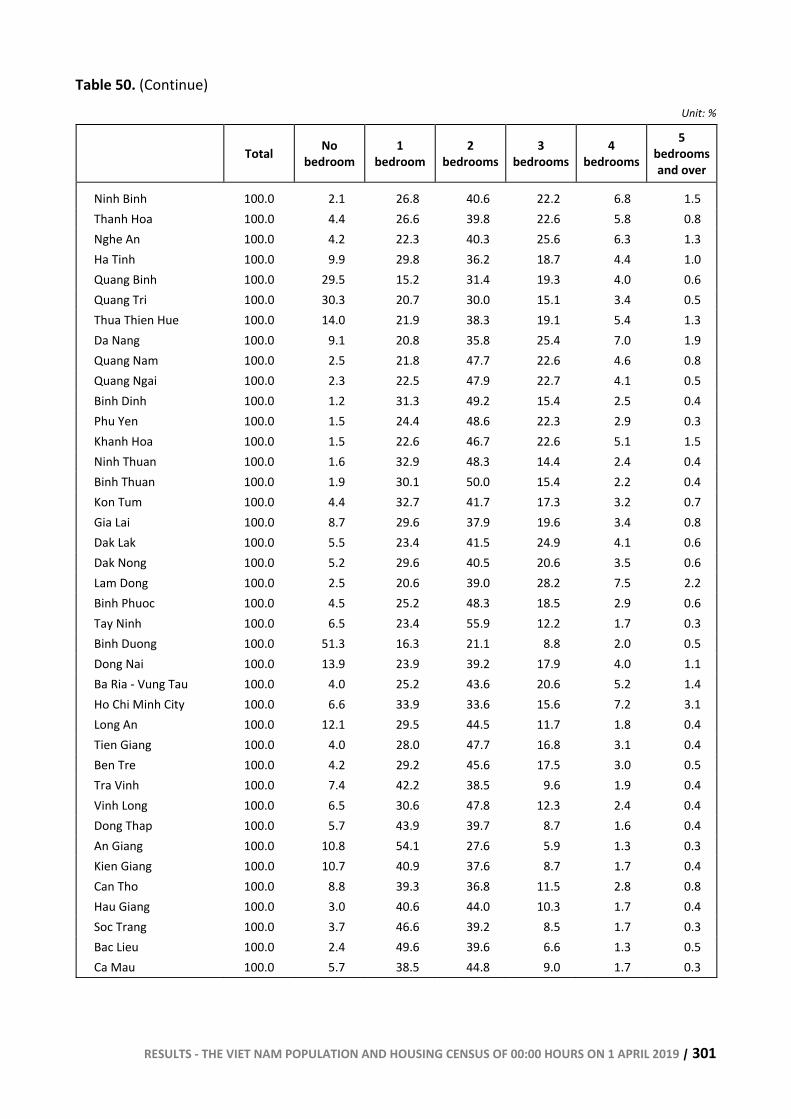
RESULTS - THE VIET NAM POPULATION AND HOUSING CENSUS OF 00:00 HOURS ON 1 APRIL 2019 | 301
Table 50. (Continue)
Unit: %
Total No bedroom
1 bedroom
2 bedrooms
3 bedrooms
4 bedrooms
5 bedrooms and over
Ninh Binh 100.0 2.1 26.8 40.6 22.2 6.8 1.5 Thanh Hoa 100.0 4.4 26.6 39.8 22.6 5.8 0.8 Nghe An 100.0 4.2 22.3 40.3 25.6 6.3 1.3 Ha Tinh 100.0 9.9 29.8 36.2 18.7 4.4 1.0 Quang Binh 100.0 29.5 15.2 31.4 19.3 4.0 0.6 Quang Tri 100.0 30.3 20.7 30.0 15.1 3.4 0.5 Thua Thien Hue 100.0 14.0 21.9 38.3 19.1 5.4 1.3 Da Nang 100.0 9.1 20.8 35.8 25.4 7.0 1.9 Quang Nam 100.0 2.5 21.8 47.7 22.6 4.6 0.8 Quang Ngai 100.0 2.3 22.5 47.9 22.7 4.1 0.5 Binh Dinh 100.0 1.2 31.3 49.2 15.4 2.5 0.4 Phu Yen 100.0 1.5 24.4 48.6 22.3 2.9 0.3 Khanh Hoa 100.0 1.5 22.6 46.7 22.6 5.1 1.5 Ninh Thuan 100.0 1.6 32.9 48.3 14.4 2.4 0.4 Binh Thuan 100.0 1.9 30.1 50.0 15.4 2.2 0.4 Kon Tum 100.0 4.4 32.7 41.7 17.3 3.2 0.7 Gia Lai 100.0 8.7 29.6 37.9 19.6 3.4 0.8 Dak Lak 100.0 5.5 23.4 41.5 24.9 4.1 0.6 Dak Nong 100.0 5.2 29.6 40.5 20.6 3.5 0.6 Lam Dong 100.0 2.5 20.6 39.0 28.2 7.5 2.2 Binh Phuoc 100.0 4.5 25.2 48.3 18.5 2.9 0.6 Tay Ninh 100.0 6.5 23.4 55.9 12.2 1.7 0.3 Binh Duong 100.0 51.3 16.3 21.1 8.8 2.0 0.5 Dong Nai 100.0 13.9 23.9 39.2 17.9 4.0 1.1 Ba Ria - Vung Tau 100.0 4.0 25.2 43.6 20.6 5.2 1.4 Ho Chi Minh City 100.0 6.6 33.9 33.6 15.6 7.2 3.1 Long An 100.0 12.1 29.5 44.5 11.7 1.8 0.4 Tien Giang 100.0 4.0 28.0 47.7 16.8 3.1 0.4 Ben Tre 100.0 4.2 29.2 45.6 17.5 3.0 0.5 Tra Vinh 100.0 7.4 42.2 38.5 9.6 1.9 0.4 Vinh Long 100.0 6.5 30.6 47.8 12.3 2.4 0.4 Dong Thap 100.0 5.7 43.9 39.7 8.7 1.6 0.4 An Giang 100.0 10.8 54.1 27.6 5.9 1.3 0.3 Kien Giang 100.0 10.7 40.9 37.6 8.7 1.7 0.4 Can Tho 100.0 8.8 39.3 36.8 11.5 2.8 0.8 Hau Giang 100.0 3.0 40.6 44.0 10.3 1.7 0.4 Soc Trang 100.0 3.7 46.6 39.2 8.5 1.7 0.3 Bac Lieu 100.0 2.4 49.6 39.6 6.6 1.3 0.5 Ca Mau 100.0 5.7 38.5 44.8 9.0 1.7 0.3
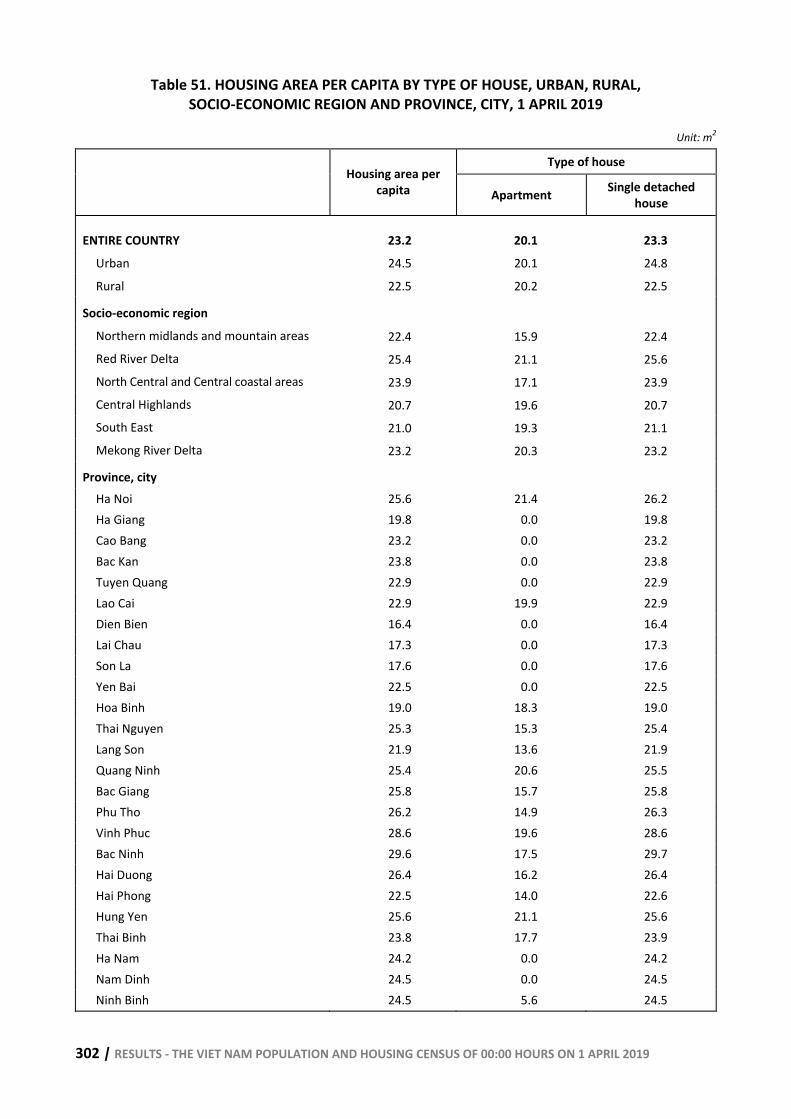
302 | RESULTS - THE VIET NAM POPULATION AND HOUSING CENSUS OF 00:00 HOURS ON 1 APRIL 2019
Table 51. HOUSING AREA PER CAPITA BY TYPE OF HOUSE, URBAN, RURAL, SOCIO-ECONOMIC REGION AND PROVINCE, CITY, 1 APRIL 2019
Unit: m2
Type of house Housing area per
capita Apartment Single detached house
ENTIRE COUNTRY 23.2 20.1 23.3 Urban 24.5 20.1 24.8
Rural 22.5 20.2 22.5
Socio-economic region Northern midlands and mountain areas 22.4 15.9 22.4 Red River Delta 25.4 21.1 25.6 North Central and Central coastal areas 23.9 17.1 23.9 Central Highlands 20.7 19.6 20.7 South East 21.0 19.3 21.1 Mekong River Delta 23.2 20.3 23.2
Province, city Ha Noi 25.6 21.4 26.2 Ha Giang 19.8 0.0 19.8 Cao Bang 23.2 0.0 23.2 Bac Kan 23.8 0.0 23.8 Tuyen Quang 22.9 0.0 22.9 Lao Cai 22.9 19.9 22.9 Dien Bien 16.4 0.0 16.4 Lai Chau 17.3 0.0 17.3 Son La 17.6 0.0 17.6 Yen Bai 22.5 0.0 22.5 Hoa Binh 19.0 18.3 19.0 Thai Nguyen 25.3 15.3 25.4 Lang Son 21.9 13.6 21.9 Quang Ninh 25.4 20.6 25.5 Bac Giang 25.8 15.7 25.8 Phu Tho 26.2 14.9 26.3 Vinh Phuc 28.6 19.6 28.6 Bac Ninh 29.6 17.5 29.7 Hai Duong 26.4 16.2 26.4 Hai Phong 22.5 14.0 22.6 Hung Yen 25.6 21.1 25.6 Thai Binh 23.8 17.7 23.9 Ha Nam 24.2 0.0 24.2 Nam Dinh 24.5 0.0 24.5 Ninh Binh 24.5 5.6 24.5
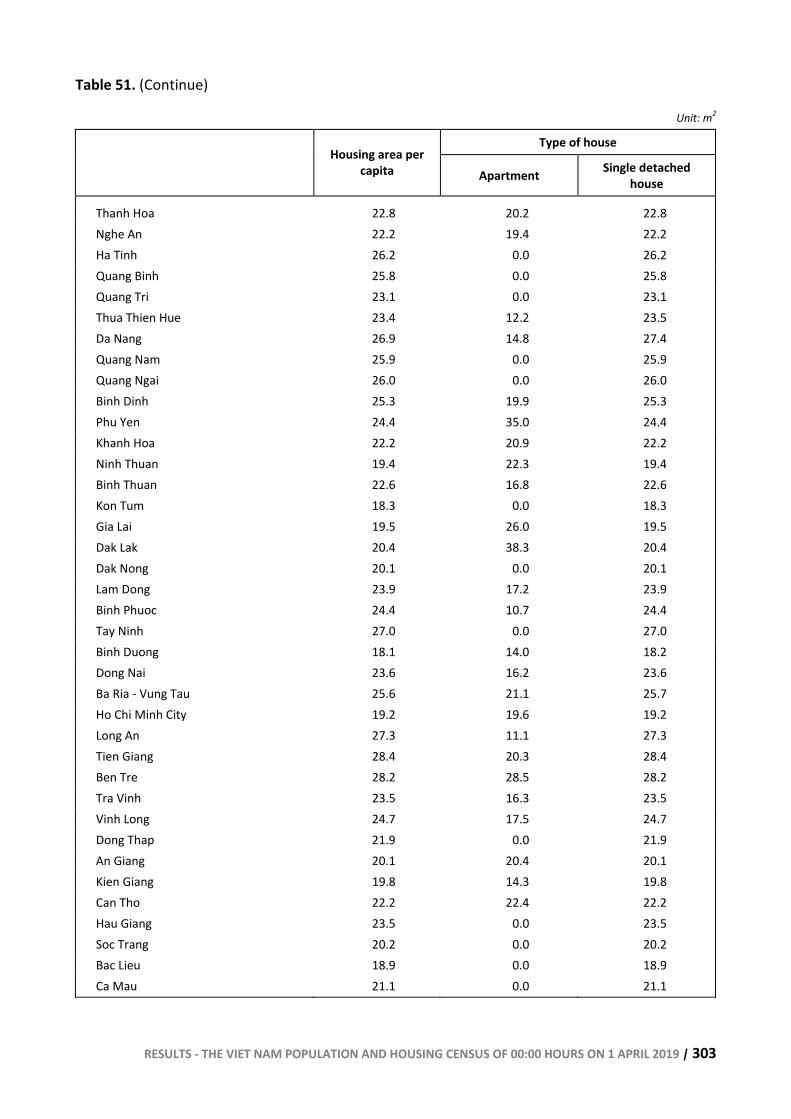
RESULTS - THE VIET NAM POPULATION AND HOUSING CENSUS OF 00:00 HOURS ON 1 APRIL 2019 | 303
Table 51. (Continue)
Unit: m2
Type of house Housing area per
capita Apartment Single detached house
Thanh Hoa 22.8 20.2 22.8 Nghe An 22.2 19.4 22.2 Ha Tinh 26.2 0.0 26.2 Quang Binh 25.8 0.0 25.8 Quang Tri 23.1 0.0 23.1 Thua Thien Hue 23.4 12.2 23.5 Da Nang 26.9 14.8 27.4 Quang Nam 25.9 0.0 25.9 Quang Ngai 26.0 0.0 26.0 Binh Dinh 25.3 19.9 25.3 Phu Yen 24.4 35.0 24.4 Khanh Hoa 22.2 20.9 22.2 Ninh Thuan 19.4 22.3 19.4 Binh Thuan 22.6 16.8 22.6 Kon Tum 18.3 0.0 18.3 Gia Lai 19.5 26.0 19.5 Dak Lak 20.4 38.3 20.4 Dak Nong 20.1 0.0 20.1 Lam Dong 23.9 17.2 23.9 Binh Phuoc 24.4 10.7 24.4 Tay Ninh 27.0 0.0 27.0 Binh Duong 18.1 14.0 18.2 Dong Nai 23.6 16.2 23.6 Ba Ria - Vung Tau 25.6 21.1 25.7 Ho Chi Minh City 19.2 19.6 19.2 Long An 27.3 11.1 27.3 Tien Giang 28.4 20.3 28.4 Ben Tre 28.2 28.5 28.2 Tra Vinh 23.5 16.3 23.5 Vinh Long 24.7 17.5 24.7 Dong Thap 21.9 0.0 21.9 An Giang 20.1 20.4 20.1 Kien Giang 19.8 14.3 19.8 Can Tho 22.2 22.4 22.2 Hau Giang 23.5 0.0 23.5 Soc Trang 20.2 0.0 20.2 Bac Lieu 18.9 0.0 18.9 Ca Mau 21.1 0.0 21.1
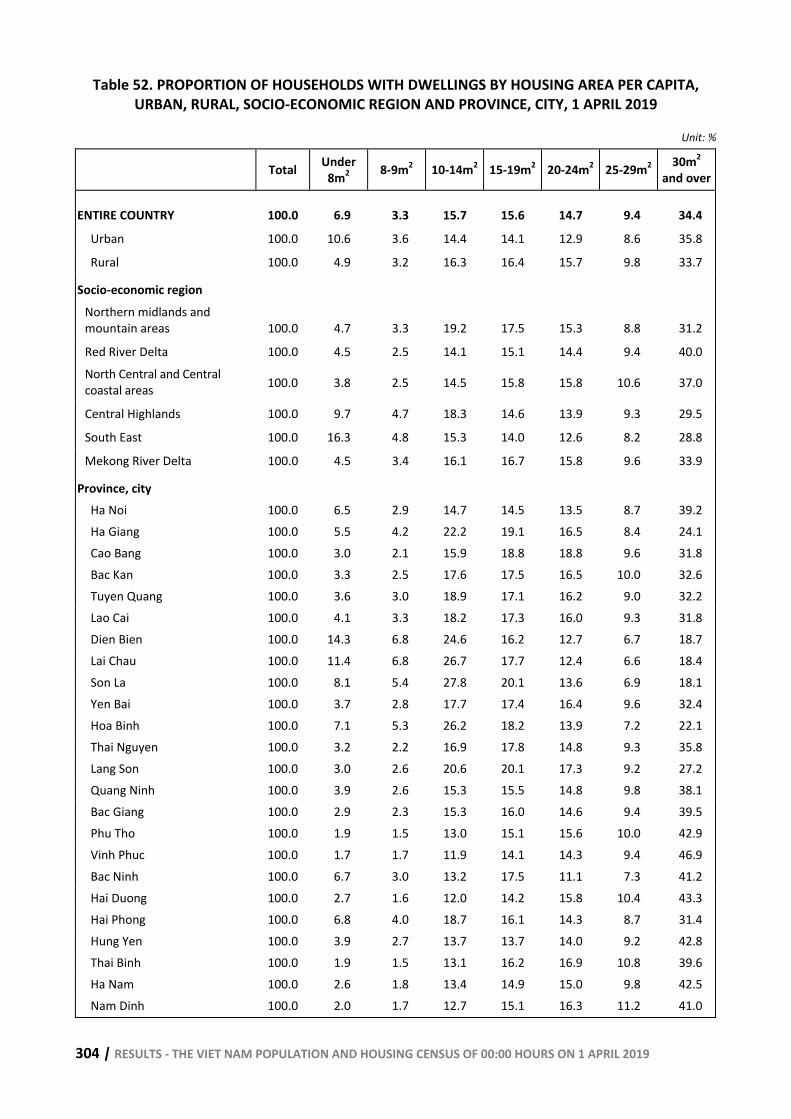
304 | RESULTS - THE VIET NAM POPULATION AND HOUSING CENSUS OF 00:00 HOURS ON 1 APRIL 2019
Table 52. PROPORTION OF HOUSEHOLDS WITH DWELLINGS BY HOUSING AREA PER CAPITA, URBAN, RURAL, SOCIO-ECONOMIC REGION AND PROVINCE, CITY, 1 APRIL 2019
Unit: %
Total Under 8m2 8-9m2 10-14m2 15-19m2 20-24m2 25-29m2 30m2
and over
ENTIRE COUNTRY 100.0 6.9 3.3 15.7 15.6 14.7 9.4 34.4
Urban 100.0 10.6 3.6 14.4 14.1 12.9 8.6 35.8
Rural 100.0 4.9 3.2 16.3 16.4 15.7 9.8 33.7
Socio-economic region Northern midlands and mountain areas 100.0 4.7 3.3 19.2 17.5 15.3 8.8 31.2
Red River Delta 100.0 4.5 2.5 14.1 15.1 14.4 9.4 40.0 North Central and Central coastal areas 100.0 3.8 2.5 14.5 15.8 15.8 10.6 37.0
Central Highlands 100.0 9.7 4.7 18.3 14.6 13.9 9.3 29.5
South East 100.0 16.3 4.8 15.3 14.0 12.6 8.2 28.8
Mekong River Delta 100.0 4.5 3.4 16.1 16.7 15.8 9.6 33.9
Province, city Ha Noi 100.0 6.5 2.9 14.7 14.5 13.5 8.7 39.2 Ha Giang 100.0 5.5 4.2 22.2 19.1 16.5 8.4 24.1 Cao Bang 100.0 3.0 2.1 15.9 18.8 18.8 9.6 31.8 Bac Kan 100.0 3.3 2.5 17.6 17.5 16.5 10.0 32.6 Tuyen Quang 100.0 3.6 3.0 18.9 17.1 16.2 9.0 32.2 Lao Cai 100.0 4.1 3.3 18.2 17.3 16.0 9.3 31.8 Dien Bien 100.0 14.3 6.8 24.6 16.2 12.7 6.7 18.7 Lai Chau 100.0 11.4 6.8 26.7 17.7 12.4 6.6 18.4 Son La 100.0 8.1 5.4 27.8 20.1 13.6 6.9 18.1 Yen Bai 100.0 3.7 2.8 17.7 17.4 16.4 9.6 32.4 Hoa Binh 100.0 7.1 5.3 26.2 18.2 13.9 7.2 22.1 Thai Nguyen 100.0 3.2 2.2 16.9 17.8 14.8 9.3 35.8 Lang Son 100.0 3.0 2.6 20.6 20.1 17.3 9.2 27.2 Quang Ninh 100.0 3.9 2.6 15.3 15.5 14.8 9.8 38.1 Bac Giang 100.0 2.9 2.3 15.3 16.0 14.6 9.4 39.5 Phu Tho 100.0 1.9 1.5 13.0 15.1 15.6 10.0 42.9 Vinh Phuc 100.0 1.7 1.7 11.9 14.1 14.3 9.4 46.9 Bac Ninh 100.0 6.7 3.0 13.2 17.5 11.1 7.3 41.2 Hai Duong 100.0 2.7 1.6 12.0 14.2 15.8 10.4 43.3 Hai Phong 100.0 6.8 4.0 18.7 16.1 14.3 8.7 31.4 Hung Yen 100.0 3.9 2.7 13.7 13.7 14.0 9.2 42.8 Thai Binh 100.0 1.9 1.5 13.1 16.2 16.9 10.8 39.6 Ha Nam 100.0 2.6 1.8 13.4 14.9 15.0 9.8 42.5 Nam Dinh 100.0 2.0 1.7 12.7 15.1 16.3 11.2 41.0
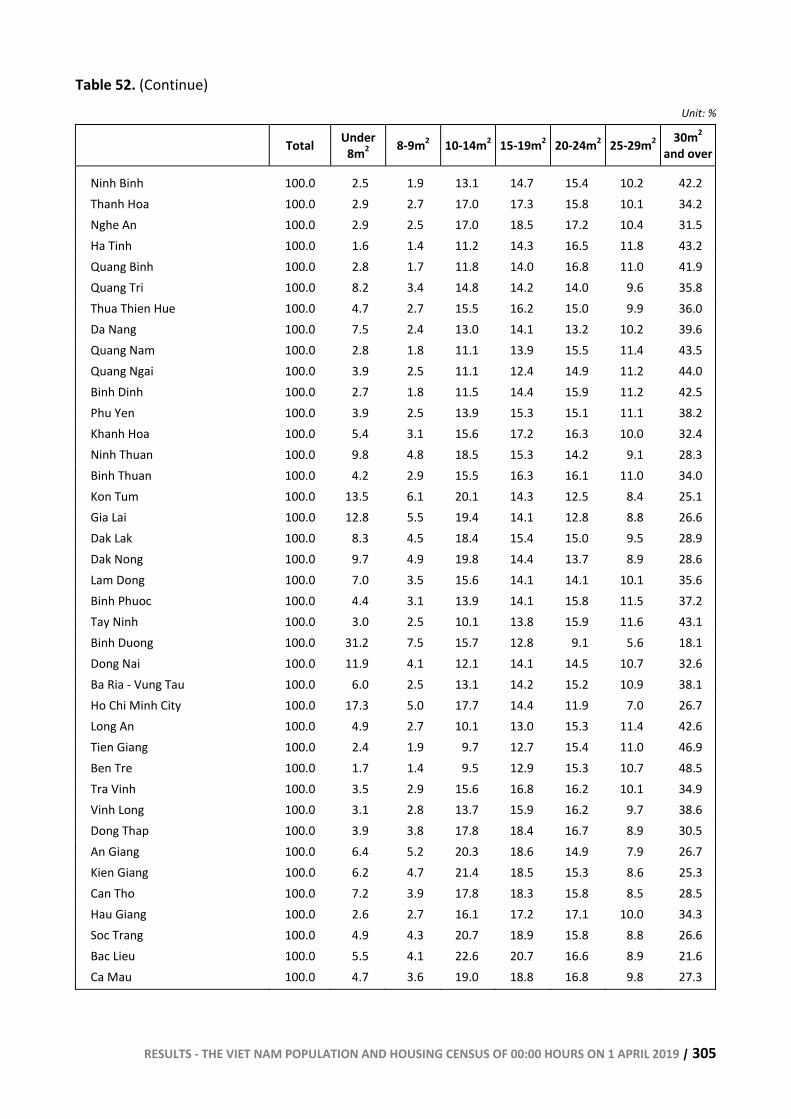
RESULTS - THE VIET NAM POPULATION AND HOUSING CENSUS OF 00:00 HOURS ON 1 APRIL 2019 | 305
Table 52. (Continue)
Unit: %
Total Under 8m2 8-9m2 10-14m2 15-19m2 20-24m2 25-29m2 30m2
and over
Ninh Binh 100.0 2.5 1.9 13.1 14.7 15.4 10.2 42.2 Thanh Hoa 100.0 2.9 2.7 17.0 17.3 15.8 10.1 34.2 Nghe An 100.0 2.9 2.5 17.0 18.5 17.2 10.4 31.5 Ha Tinh 100.0 1.6 1.4 11.2 14.3 16.5 11.8 43.2 Quang Binh 100.0 2.8 1.7 11.8 14.0 16.8 11.0 41.9 Quang Tri 100.0 8.2 3.4 14.8 14.2 14.0 9.6 35.8 Thua Thien Hue 100.0 4.7 2.7 15.5 16.2 15.0 9.9 36.0 Da Nang 100.0 7.5 2.4 13.0 14.1 13.2 10.2 39.6 Quang Nam 100.0 2.8 1.8 11.1 13.9 15.5 11.4 43.5 Quang Ngai 100.0 3.9 2.5 11.1 12.4 14.9 11.2 44.0 Binh Dinh 100.0 2.7 1.8 11.5 14.4 15.9 11.2 42.5 Phu Yen 100.0 3.9 2.5 13.9 15.3 15.1 11.1 38.2 Khanh Hoa 100.0 5.4 3.1 15.6 17.2 16.3 10.0 32.4 Ninh Thuan 100.0 9.8 4.8 18.5 15.3 14.2 9.1 28.3 Binh Thuan 100.0 4.2 2.9 15.5 16.3 16.1 11.0 34.0 Kon Tum 100.0 13.5 6.1 20.1 14.3 12.5 8.4 25.1 Gia Lai 100.0 12.8 5.5 19.4 14.1 12.8 8.8 26.6 Dak Lak 100.0 8.3 4.5 18.4 15.4 15.0 9.5 28.9 Dak Nong 100.0 9.7 4.9 19.8 14.4 13.7 8.9 28.6 Lam Dong 100.0 7.0 3.5 15.6 14.1 14.1 10.1 35.6 Binh Phuoc 100.0 4.4 3.1 13.9 14.1 15.8 11.5 37.2 Tay Ninh 100.0 3.0 2.5 10.1 13.8 15.9 11.6 43.1 Binh Duong 100.0 31.2 7.5 15.7 12.8 9.1 5.6 18.1 Dong Nai 100.0 11.9 4.1 12.1 14.1 14.5 10.7 32.6 Ba Ria - Vung Tau 100.0 6.0 2.5 13.1 14.2 15.2 10.9 38.1 Ho Chi Minh City 100.0 17.3 5.0 17.7 14.4 11.9 7.0 26.7 Long An 100.0 4.9 2.7 10.1 13.0 15.3 11.4 42.6 Tien Giang 100.0 2.4 1.9 9.7 12.7 15.4 11.0 46.9 Ben Tre 100.0 1.7 1.4 9.5 12.9 15.3 10.7 48.5 Tra Vinh 100.0 3.5 2.9 15.6 16.8 16.2 10.1 34.9 Vinh Long 100.0 3.1 2.8 13.7 15.9 16.2 9.7 38.6 Dong Thap 100.0 3.9 3.8 17.8 18.4 16.7 8.9 30.5 An Giang 100.0 6.4 5.2 20.3 18.6 14.9 7.9 26.7 Kien Giang 100.0 6.2 4.7 21.4 18.5 15.3 8.6 25.3 Can Tho 100.0 7.2 3.9 17.8 18.3 15.8 8.5 28.5 Hau Giang 100.0 2.6 2.7 16.1 17.2 17.1 10.0 34.3 Soc Trang 100.0 4.9 4.3 20.7 18.9 15.8 8.8 26.6 Bac Lieu 100.0 5.5 4.1 22.6 20.7 16.6 8.9 21.6 Ca Mau 100.0 4.7 3.6 19.0 18.8 16.8 9.8 27.3
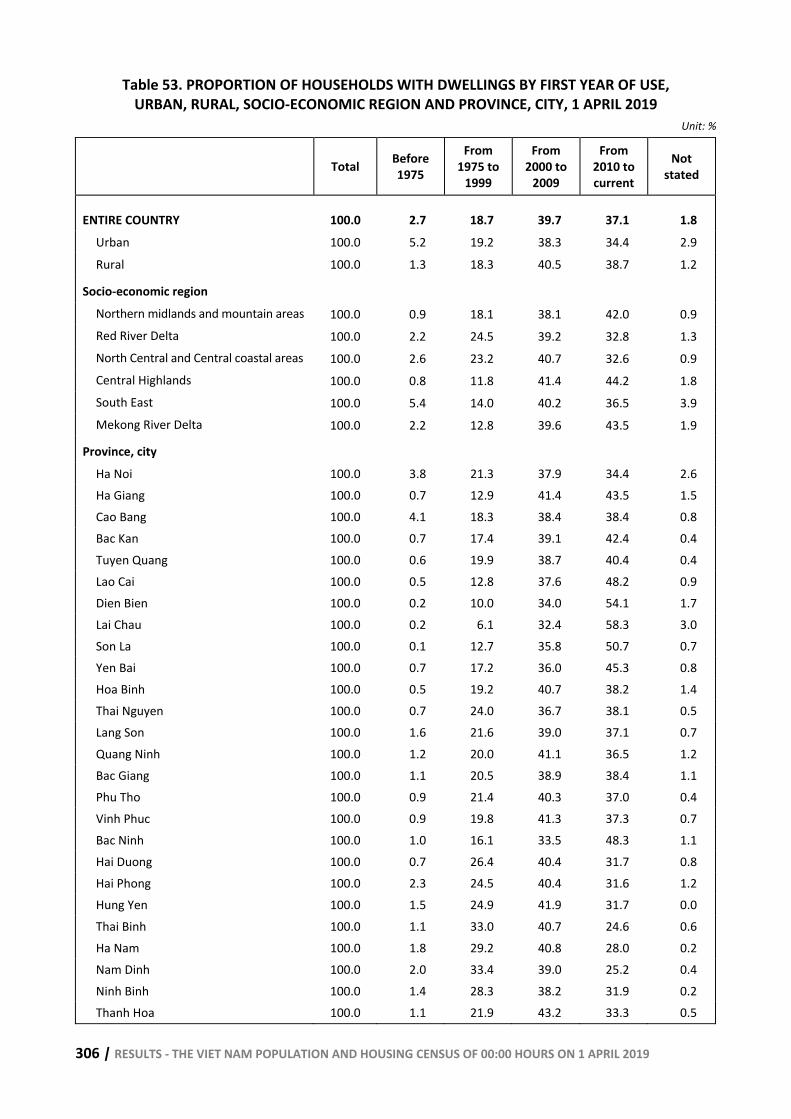
306 | RESULTS - THE VIET NAM POPULATION AND HOUSING CENSUS OF 00:00 HOURS ON 1 APRIL 2019
Table 53. PROPORTION OF HOUSEHOLDS WITH DWELLINGS BY FIRST YEAR OF USE, URBAN, RURAL, SOCIO-ECONOMIC REGION AND PROVINCE, CITY, 1 APRIL 2019
Unit: %
Total Before 1975
From 1975 to
1999
From 2000 to
2009
From 2010 to current
Not stated
ENTIRE COUNTRY 100.0 2.7 18.7 39.7 37.1 1.8 Urban 100.0 5.2 19.2 38.3 34.4 2.9 Rural 100.0 1.3 18.3 40.5 38.7 1.2
Socio-economic region Northern midlands and mountain areas 100.0 0.9 18.1 38.1 42.0 0.9 Red River Delta 100.0 2.2 24.5 39.2 32.8 1.3 North Central and Central coastal areas 100.0 2.6 23.2 40.7 32.6 0.9 Central Highlands 100.0 0.8 11.8 41.4 44.2 1.8 South East 100.0 5.4 14.0 40.2 36.5 3.9 Mekong River Delta 100.0 2.2 12.8 39.6 43.5 1.9
Province, city Ha Noi 100.0 3.8 21.3 37.9 34.4 2.6 Ha Giang 100.0 0.7 12.9 41.4 43.5 1.5 Cao Bang 100.0 4.1 18.3 38.4 38.4 0.8 Bac Kan 100.0 0.7 17.4 39.1 42.4 0.4 Tuyen Quang 100.0 0.6 19.9 38.7 40.4 0.4 Lao Cai 100.0 0.5 12.8 37.6 48.2 0.9 Dien Bien 100.0 0.2 10.0 34.0 54.1 1.7 Lai Chau 100.0 0.2 6.1 32.4 58.3 3.0 Son La 100.0 0.1 12.7 35.8 50.7 0.7 Yen Bai 100.0 0.7 17.2 36.0 45.3 0.8 Hoa Binh 100.0 0.5 19.2 40.7 38.2 1.4 Thai Nguyen 100.0 0.7 24.0 36.7 38.1 0.5 Lang Son 100.0 1.6 21.6 39.0 37.1 0.7 Quang Ninh 100.0 1.2 20.0 41.1 36.5 1.2 Bac Giang 100.0 1.1 20.5 38.9 38.4 1.1 Phu Tho 100.0 0.9 21.4 40.3 37.0 0.4 Vinh Phuc 100.0 0.9 19.8 41.3 37.3 0.7 Bac Ninh 100.0 1.0 16.1 33.5 48.3 1.1 Hai Duong 100.0 0.7 26.4 40.4 31.7 0.8 Hai Phong 100.0 2.3 24.5 40.4 31.6 1.2 Hung Yen 100.0 1.5 24.9 41.9 31.7 0.0 Thai Binh 100.0 1.1 33.0 40.7 24.6 0.6 Ha Nam 100.0 1.8 29.2 40.8 28.0 0.2 Nam Dinh 100.0 2.0 33.4 39.0 25.2 0.4 Ninh Binh 100.0 1.4 28.3 38.2 31.9 0.2 Thanh Hoa 100.0 1.1 21.9 43.2 33.3 0.5
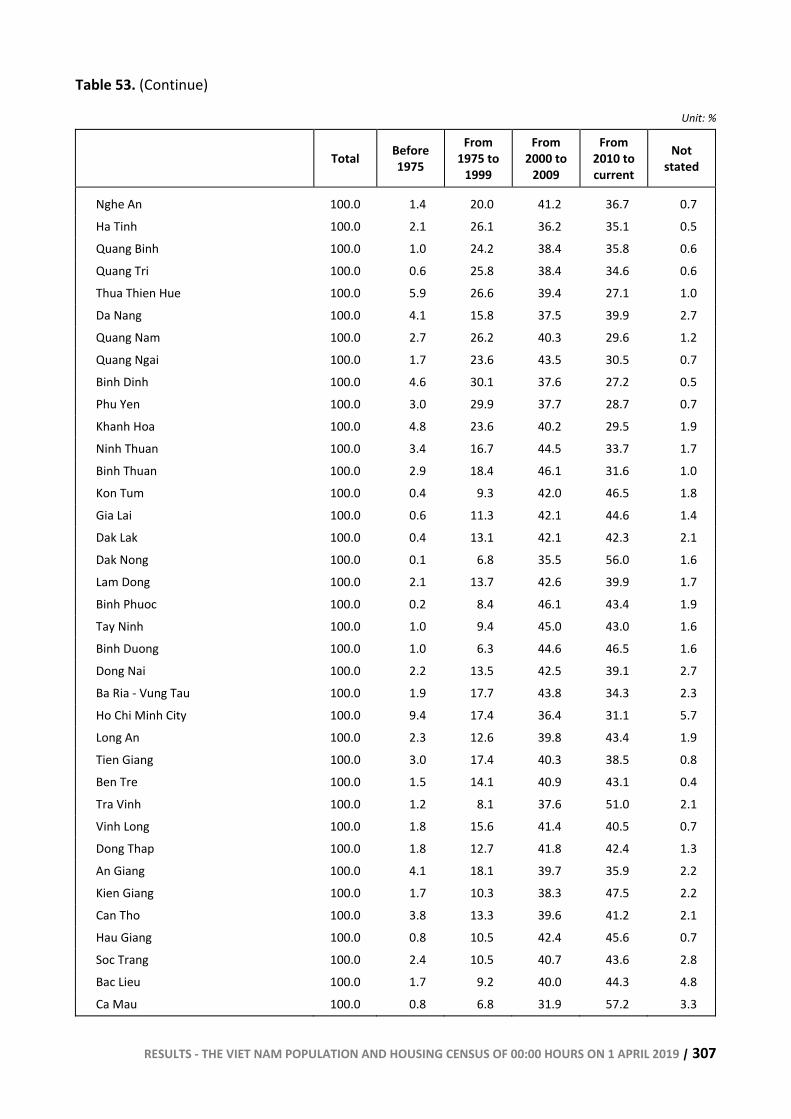
RESULTS - THE VIET NAM POPULATION AND HOUSING CENSUS OF 00:00 HOURS ON 1 APRIL 2019 | 307
Table 53. (Continue)
Unit: %
Total Before 1975
From 1975 to
1999
From 2000 to
2009
From 2010 to current
Not stated
Nghe An 100.0 1.4 20.0 41.2 36.7 0.7 Ha Tinh 100.0 2.1 26.1 36.2 35.1 0.5 Quang Binh 100.0 1.0 24.2 38.4 35.8 0.6 Quang Tri 100.0 0.6 25.8 38.4 34.6 0.6 Thua Thien Hue 100.0 5.9 26.6 39.4 27.1 1.0 Da Nang 100.0 4.1 15.8 37.5 39.9 2.7 Quang Nam 100.0 2.7 26.2 40.3 29.6 1.2 Quang Ngai 100.0 1.7 23.6 43.5 30.5 0.7 Binh Dinh 100.0 4.6 30.1 37.6 27.2 0.5 Phu Yen 100.0 3.0 29.9 37.7 28.7 0.7 Khanh Hoa 100.0 4.8 23.6 40.2 29.5 1.9 Ninh Thuan 100.0 3.4 16.7 44.5 33.7 1.7 Binh Thuan 100.0 2.9 18.4 46.1 31.6 1.0 Kon Tum 100.0 0.4 9.3 42.0 46.5 1.8 Gia Lai 100.0 0.6 11.3 42.1 44.6 1.4 Dak Lak 100.0 0.4 13.1 42.1 42.3 2.1 Dak Nong 100.0 0.1 6.8 35.5 56.0 1.6 Lam Dong 100.0 2.1 13.7 42.6 39.9 1.7 Binh Phuoc 100.0 0.2 8.4 46.1 43.4 1.9 Tay Ninh 100.0 1.0 9.4 45.0 43.0 1.6 Binh Duong 100.0 1.0 6.3 44.6 46.5 1.6 Dong Nai 100.0 2.2 13.5 42.5 39.1 2.7 Ba Ria - Vung Tau 100.0 1.9 17.7 43.8 34.3 2.3 Ho Chi Minh City 100.0 9.4 17.4 36.4 31.1 5.7 Long An 100.0 2.3 12.6 39.8 43.4 1.9 Tien Giang 100.0 3.0 17.4 40.3 38.5 0.8 Ben Tre 100.0 1.5 14.1 40.9 43.1 0.4 Tra Vinh 100.0 1.2 8.1 37.6 51.0 2.1 Vinh Long 100.0 1.8 15.6 41.4 40.5 0.7 Dong Thap 100.0 1.8 12.7 41.8 42.4 1.3 An Giang 100.0 4.1 18.1 39.7 35.9 2.2 Kien Giang 100.0 1.7 10.3 38.3 47.5 2.2 Can Tho 100.0 3.8 13.3 39.6 41.2 2.1 Hau Giang 100.0 0.8 10.5 42.4 45.6 0.7 Soc Trang 100.0 2.4 10.5 40.7 43.6 2.8 Bac Lieu 100.0 1.7 9.2 40.0 44.3 4.8 Ca Mau 100.0 0.8 6.8 31.9 57.2 3.3
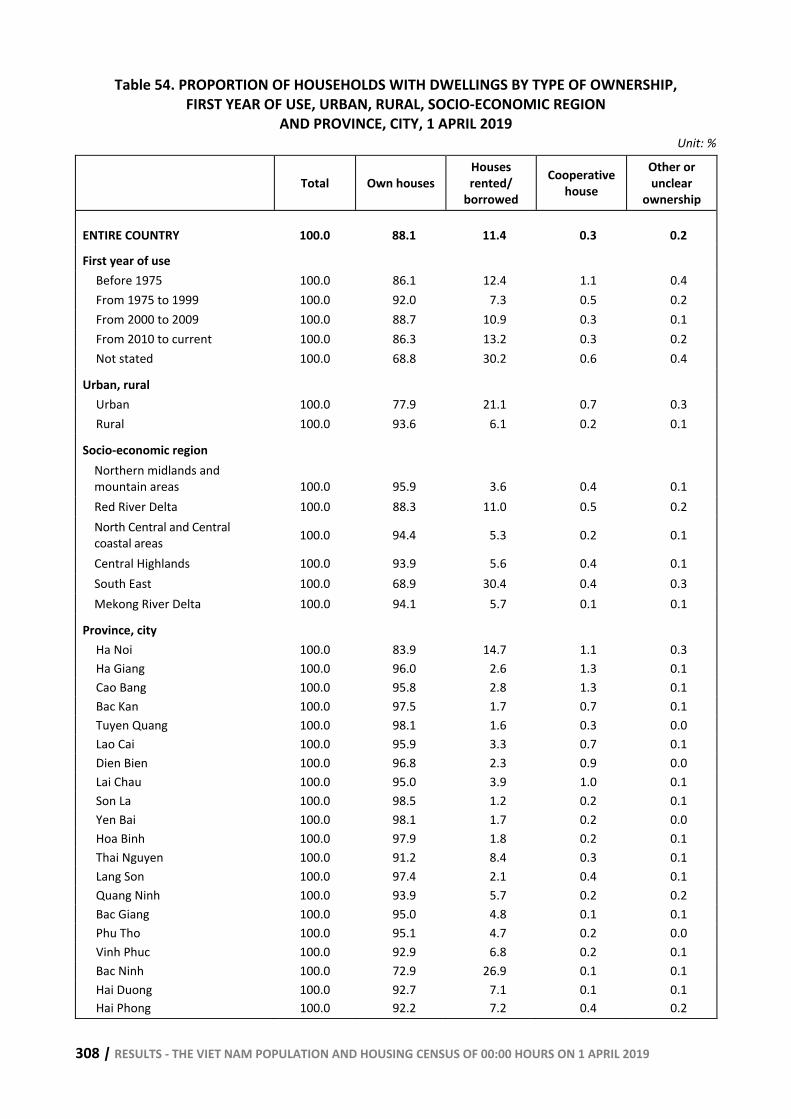
308 | RESULTS - THE VIET NAM POPULATION AND HOUSING CENSUS OF 00:00 HOURS ON 1 APRIL 2019
Table 54. PROPORTION OF HOUSEHOLDS WITH DWELLINGS BY TYPE OF OWNERSHIP, FIRST YEAR OF USE, URBAN, RURAL, SOCIO-ECONOMIC REGION
AND PROVINCE, CITY, 1 APRIL 2019
Unit: %
Total Own houses Houses rented/
borrowed
Cooperative house
Other or unclear
ownership
ENTIRE COUNTRY 100.0 88.1 11.4 0.3 0.2
First year of use Before 1975 100.0 86.1 12.4 1.1 0.4 From 1975 to 1999 100.0 92.0 7.3 0.5 0.2 From 2000 to 2009 100.0 88.7 10.9 0.3 0.1 From 2010 to current 100.0 86.3 13.2 0.3 0.2 Not stated 100.0 68.8 30.2 0.6 0.4
Urban, rural Urban 100.0 77.9 21.1 0.7 0.3 Rural 100.0 93.6 6.1 0.2 0.1
Socio-economic region Northern midlands and mountain areas 100.0 95.9 3.6 0.4 0.1 Red River Delta 100.0 88.3 11.0 0.5 0.2 North Central and Central coastal areas 100.0 94.4 5.3 0.2 0.1
Central Highlands 100.0 93.9 5.6 0.4 0.1 South East 100.0 68.9 30.4 0.4 0.3 Mekong River Delta 100.0 94.1 5.7 0.1 0.1
Province, city Ha Noi 100.0 83.9 14.7 1.1 0.3 Ha Giang 100.0 96.0 2.6 1.3 0.1 Cao Bang 100.0 95.8 2.8 1.3 0.1 Bac Kan 100.0 97.5 1.7 0.7 0.1 Tuyen Quang 100.0 98.1 1.6 0.3 0.0 Lao Cai 100.0 95.9 3.3 0.7 0.1 Dien Bien 100.0 96.8 2.3 0.9 0.0 Lai Chau 100.0 95.0 3.9 1.0 0.1 Son La 100.0 98.5 1.2 0.2 0.1 Yen Bai 100.0 98.1 1.7 0.2 0.0 Hoa Binh 100.0 97.9 1.8 0.2 0.1 Thai Nguyen 100.0 91.2 8.4 0.3 0.1 Lang Son 100.0 97.4 2.1 0.4 0.1 Quang Ninh 100.0 93.9 5.7 0.2 0.2 Bac Giang 100.0 95.0 4.8 0.1 0.1 Phu Tho 100.0 95.1 4.7 0.2 0.0 Vinh Phuc 100.0 92.9 6.8 0.2 0.1 Bac Ninh 100.0 72.9 26.9 0.1 0.1 Hai Duong 100.0 92.7 7.1 0.1 0.1 Hai Phong 100.0 92.2 7.2 0.4 0.2
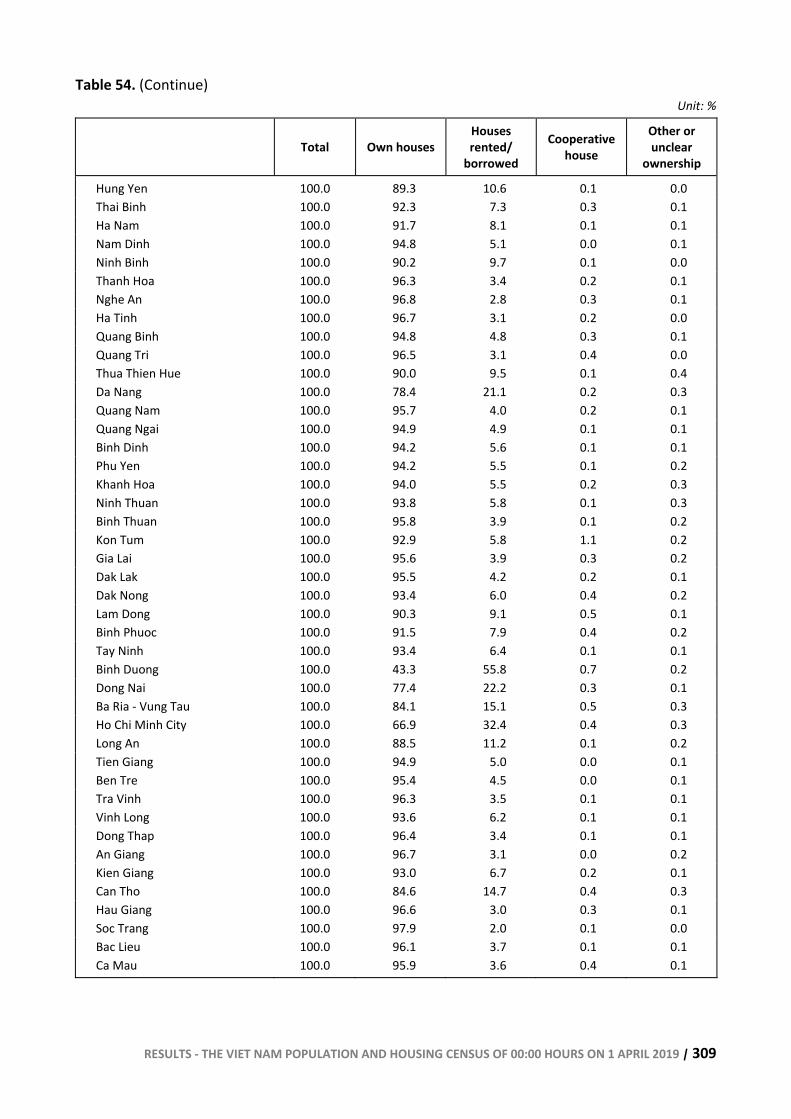
RESULTS - THE VIET NAM POPULATION AND HOUSING CENSUS OF 00:00 HOURS ON 1 APRIL 2019 | 309
Table 54. (Continue)
Unit: %
Total Own houses Houses rented/
borrowed
Cooperative house
Other or unclear
ownership
Hung Yen 100.0 89.3 10.6 0.1 0.0 Thai Binh 100.0 92.3 7.3 0.3 0.1 Ha Nam 100.0 91.7 8.1 0.1 0.1 Nam Dinh 100.0 94.8 5.1 0.0 0.1 Ninh Binh 100.0 90.2 9.7 0.1 0.0 Thanh Hoa 100.0 96.3 3.4 0.2 0.1 Nghe An 100.0 96.8 2.8 0.3 0.1 Ha Tinh 100.0 96.7 3.1 0.2 0.0 Quang Binh 100.0 94.8 4.8 0.3 0.1 Quang Tri 100.0 96.5 3.1 0.4 0.0 Thua Thien Hue 100.0 90.0 9.5 0.1 0.4 Da Nang 100.0 78.4 21.1 0.2 0.3 Quang Nam 100.0 95.7 4.0 0.2 0.1 Quang Ngai 100.0 94.9 4.9 0.1 0.1 Binh Dinh 100.0 94.2 5.6 0.1 0.1 Phu Yen 100.0 94.2 5.5 0.1 0.2 Khanh Hoa 100.0 94.0 5.5 0.2 0.3 Ninh Thuan 100.0 93.8 5.8 0.1 0.3 Binh Thuan 100.0 95.8 3.9 0.1 0.2 Kon Tum 100.0 92.9 5.8 1.1 0.2 Gia Lai 100.0 95.6 3.9 0.3 0.2 Dak Lak 100.0 95.5 4.2 0.2 0.1 Dak Nong 100.0 93.4 6.0 0.4 0.2 Lam Dong 100.0 90.3 9.1 0.5 0.1 Binh Phuoc 100.0 91.5 7.9 0.4 0.2 Tay Ninh 100.0 93.4 6.4 0.1 0.1 Binh Duong 100.0 43.3 55.8 0.7 0.2 Dong Nai 100.0 77.4 22.2 0.3 0.1 Ba Ria - Vung Tau 100.0 84.1 15.1 0.5 0.3 Ho Chi Minh City 100.0 66.9 32.4 0.4 0.3 Long An 100.0 88.5 11.2 0.1 0.2 Tien Giang 100.0 94.9 5.0 0.0 0.1 Ben Tre 100.0 95.4 4.5 0.0 0.1 Tra Vinh 100.0 96.3 3.5 0.1 0.1 Vinh Long 100.0 93.6 6.2 0.1 0.1 Dong Thap 100.0 96.4 3.4 0.1 0.1 An Giang 100.0 96.7 3.1 0.0 0.2 Kien Giang 100.0 93.0 6.7 0.2 0.1 Can Tho 100.0 84.6 14.7 0.4 0.3 Hau Giang 100.0 96.6 3.0 0.3 0.1 Soc Trang 100.0 97.9 2.0 0.1 0.0 Bac Lieu 100.0 96.1 3.7 0.1 0.1 Ca Mau 100.0 95.9 3.6 0.4 0.1
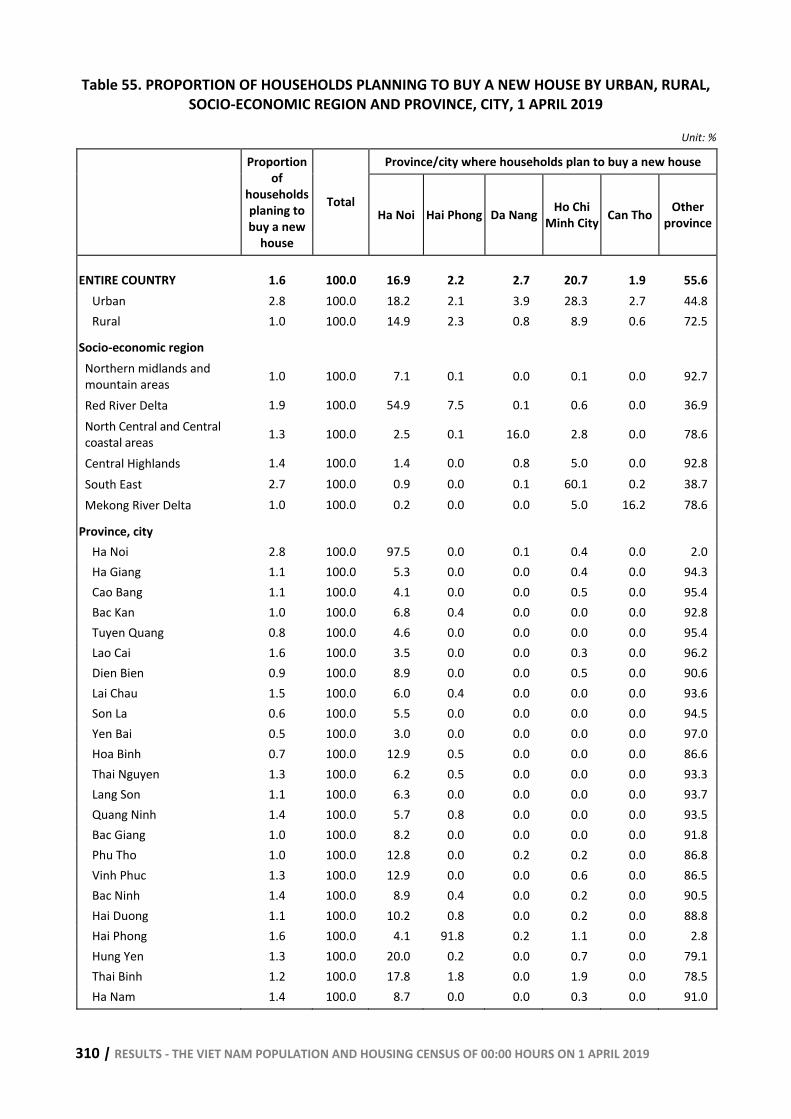
310 | RESULTS - THE VIET NAM POPULATION AND HOUSING CENSUS OF 00:00 HOURS ON 1 APRIL 2019
Table 55. PROPORTION OF HOUSEHOLDS PLANNING TO BUY A NEW HOUSE BY URBAN, RURAL, SOCIO-ECONOMIC REGION AND PROVINCE, CITY, 1 APRIL 2019
Unit: %
Province/city where households plan to buy a new house
Proportion of
households planing to buy a new
house
Total Ha Noi Hai Phong Da Nang Ho Chi
Minh City Can Tho Other province
ENTIRE COUNTRY 1.6 100.0 16.9 2.2 2.7 20.7 1.9 55.6 Urban 2.8 100.0 18.2 2.1 3.9 28.3 2.7 44.8 Rural 1.0 100.0 14.9 2.3 0.8 8.9 0.6 72.5
Socio-economic region Northern midlands and mountain areas 1.0 100.0 7.1 0.1 0.0 0.1 0.0 92.7
Red River Delta 1.9 100.0 54.9 7.5 0.1 0.6 0.0 36.9 North Central and Central coastal areas 1.3 100.0 2.5 0.1 16.0 2.8 0.0 78.6
Central Highlands 1.4 100.0 1.4 0.0 0.8 5.0 0.0 92.8 South East 2.7 100.0 0.9 0.0 0.1 60.1 0.2 38.7 Mekong River Delta 1.0 100.0 0.2 0.0 0.0 5.0 16.2 78.6
Province, city Ha Noi 2.8 100.0 97.5 0.0 0.1 0.4 0.0 2.0 Ha Giang 1.1 100.0 5.3 0.0 0.0 0.4 0.0 94.3 Cao Bang 1.1 100.0 4.1 0.0 0.0 0.5 0.0 95.4 Bac Kan 1.0 100.0 6.8 0.4 0.0 0.0 0.0 92.8 Tuyen Quang 0.8 100.0 4.6 0.0 0.0 0.0 0.0 95.4 Lao Cai 1.6 100.0 3.5 0.0 0.0 0.3 0.0 96.2 Dien Bien 0.9 100.0 8.9 0.0 0.0 0.5 0.0 90.6 Lai Chau 1.5 100.0 6.0 0.4 0.0 0.0 0.0 93.6 Son La 0.6 100.0 5.5 0.0 0.0 0.0 0.0 94.5 Yen Bai 0.5 100.0 3.0 0.0 0.0 0.0 0.0 97.0 Hoa Binh 0.7 100.0 12.9 0.5 0.0 0.0 0.0 86.6 Thai Nguyen 1.3 100.0 6.2 0.5 0.0 0.0 0.0 93.3 Lang Son 1.1 100.0 6.3 0.0 0.0 0.0 0.0 93.7 Quang Ninh 1.4 100.0 5.7 0.8 0.0 0.0 0.0 93.5 Bac Giang 1.0 100.0 8.2 0.0 0.0 0.0 0.0 91.8 Phu Tho 1.0 100.0 12.8 0.0 0.2 0.2 0.0 86.8 Vinh Phuc 1.3 100.0 12.9 0.0 0.0 0.6 0.0 86.5 Bac Ninh 1.4 100.0 8.9 0.4 0.0 0.2 0.0 90.5 Hai Duong 1.1 100.0 10.2 0.8 0.0 0.2 0.0 88.8 Hai Phong 1.6 100.0 4.1 91.8 0.2 1.1 0.0 2.8 Hung Yen 1.3 100.0 20.0 0.2 0.0 0.7 0.0 79.1 Thai Binh 1.2 100.0 17.8 1.8 0.0 1.9 0.0 78.5 Ha Nam 1.4 100.0 8.7 0.0 0.0 0.3 0.0 91.0
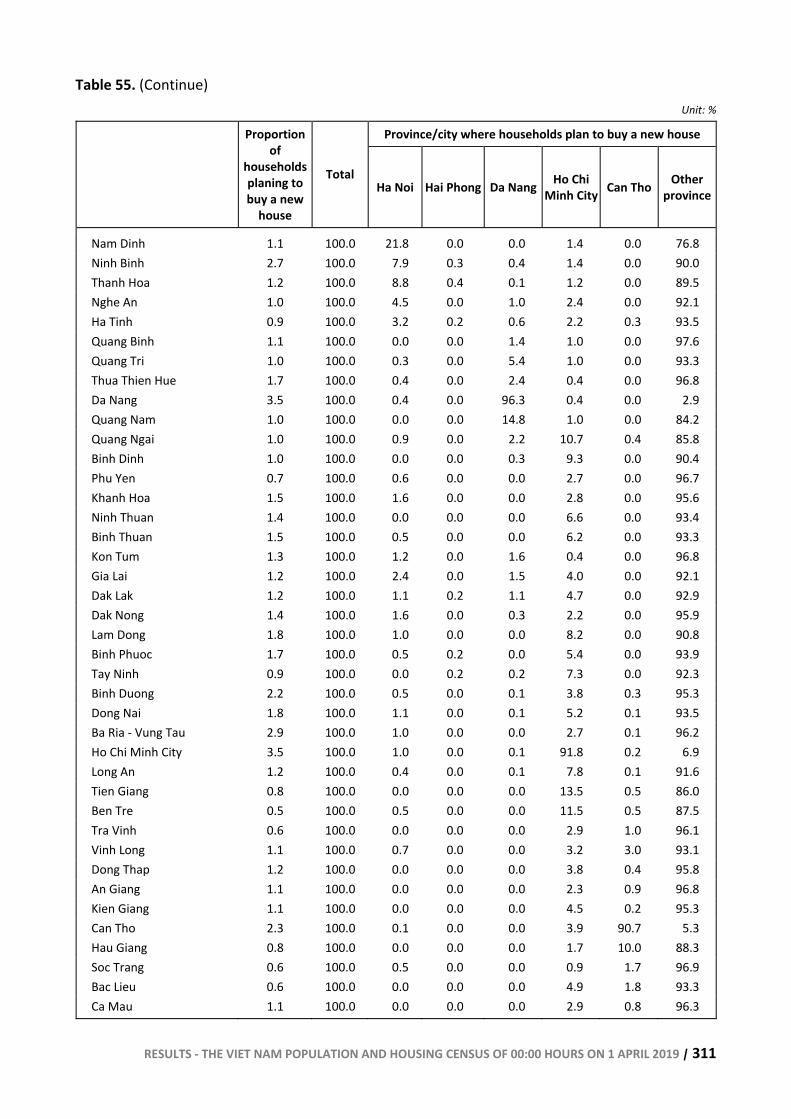
RESULTS - THE VIET NAM POPULATION AND HOUSING CENSUS OF 00:00 HOURS ON 1 APRIL 2019 | 311
Table 55. (Continue)
Unit: %
Province/city where households plan to buy a new house
Proportion of
households planing to buy a new
house
Total Ha Noi Hai Phong Da Nang Ho Chi
Minh City Can Tho Other province
Nam Dinh 1.1 100.0 21.8 0.0 0.0 1.4 0.0 76.8 Ninh Binh 2.7 100.0 7.9 0.3 0.4 1.4 0.0 90.0 Thanh Hoa 1.2 100.0 8.8 0.4 0.1 1.2 0.0 89.5 Nghe An 1.0 100.0 4.5 0.0 1.0 2.4 0.0 92.1 Ha Tinh 0.9 100.0 3.2 0.2 0.6 2.2 0.3 93.5 Quang Binh 1.1 100.0 0.0 0.0 1.4 1.0 0.0 97.6 Quang Tri 1.0 100.0 0.3 0.0 5.4 1.0 0.0 93.3 Thua Thien Hue 1.7 100.0 0.4 0.0 2.4 0.4 0.0 96.8 Da Nang 3.5 100.0 0.4 0.0 96.3 0.4 0.0 2.9 Quang Nam 1.0 100.0 0.0 0.0 14.8 1.0 0.0 84.2 Quang Ngai 1.0 100.0 0.9 0.0 2.2 10.7 0.4 85.8 Binh Dinh 1.0 100.0 0.0 0.0 0.3 9.3 0.0 90.4 Phu Yen 0.7 100.0 0.6 0.0 0.0 2.7 0.0 96.7 Khanh Hoa 1.5 100.0 1.6 0.0 0.0 2.8 0.0 95.6 Ninh Thuan 1.4 100.0 0.0 0.0 0.0 6.6 0.0 93.4 Binh Thuan 1.5 100.0 0.5 0.0 0.0 6.2 0.0 93.3 Kon Tum 1.3 100.0 1.2 0.0 1.6 0.4 0.0 96.8 Gia Lai 1.2 100.0 2.4 0.0 1.5 4.0 0.0 92.1 Dak Lak 1.2 100.0 1.1 0.2 1.1 4.7 0.0 92.9 Dak Nong 1.4 100.0 1.6 0.0 0.3 2.2 0.0 95.9 Lam Dong 1.8 100.0 1.0 0.0 0.0 8.2 0.0 90.8 Binh Phuoc 1.7 100.0 0.5 0.2 0.0 5.4 0.0 93.9 Tay Ninh 0.9 100.0 0.0 0.2 0.2 7.3 0.0 92.3 Binh Duong 2.2 100.0 0.5 0.0 0.1 3.8 0.3 95.3 Dong Nai 1.8 100.0 1.1 0.0 0.1 5.2 0.1 93.5 Ba Ria - Vung Tau 2.9 100.0 1.0 0.0 0.0 2.7 0.1 96.2 Ho Chi Minh City 3.5 100.0 1.0 0.0 0.1 91.8 0.2 6.9 Long An 1.2 100.0 0.4 0.0 0.1 7.8 0.1 91.6 Tien Giang 0.8 100.0 0.0 0.0 0.0 13.5 0.5 86.0 Ben Tre 0.5 100.0 0.5 0.0 0.0 11.5 0.5 87.5 Tra Vinh 0.6 100.0 0.0 0.0 0.0 2.9 1.0 96.1 Vinh Long 1.1 100.0 0.7 0.0 0.0 3.2 3.0 93.1 Dong Thap 1.2 100.0 0.0 0.0 0.0 3.8 0.4 95.8 An Giang 1.1 100.0 0.0 0.0 0.0 2.3 0.9 96.8 Kien Giang 1.1 100.0 0.0 0.0 0.0 4.5 0.2 95.3 Can Tho 2.3 100.0 0.1 0.0 0.0 3.9 90.7 5.3 Hau Giang 0.8 100.0 0.0 0.0 0.0 1.7 10.0 88.3 Soc Trang 0.6 100.0 0.5 0.0 0.0 0.9 1.7 96.9 Bac Lieu 0.6 100.0 0.0 0.0 0.0 4.9 1.8 93.3 Ca Mau 1.1 100.0 0.0 0.0 0.0 2.9 0.8 96.3
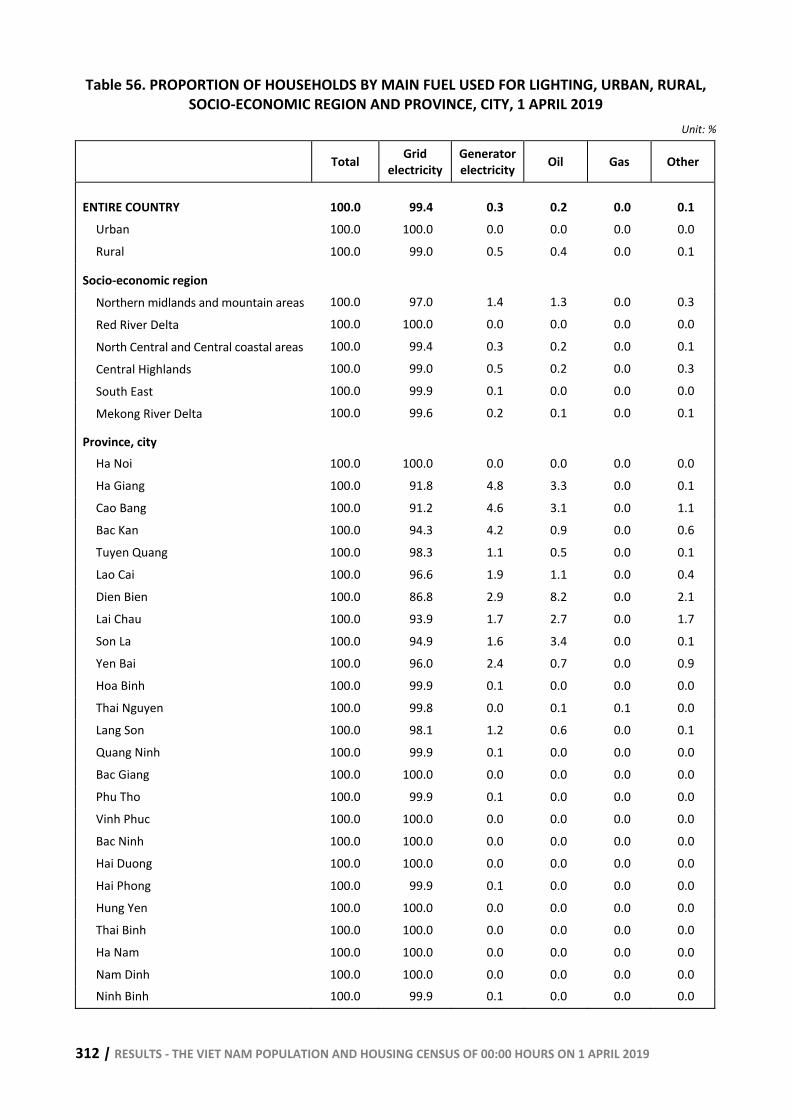
312 | RESULTS - THE VIET NAM POPULATION AND HOUSING CENSUS OF 00:00 HOURS ON 1 APRIL 2019
Table 56. PROPORTION OF HOUSEHOLDS BY MAIN FUEL USED FOR LIGHTING, URBAN, RURAL, SOCIO-ECONOMIC REGION AND PROVINCE, CITY, 1 APRIL 2019
Unit: %
Total Grid electricity
Generator electricity Oil Gas Other
ENTIRE COUNTRY 100.0 99.4 0.3 0.2 0.0 0.1 Urban 100.0 100.0 0.0 0.0 0.0 0.0 Rural 100.0 99.0 0.5 0.4 0.0 0.1
Socio-economic region
Northern midlands and mountain areas 100.0 97.0 1.4 1.3 0.0 0.3
Red River Delta 100.0 100.0 0.0 0.0 0.0 0.0
North Central and Central coastal areas 100.0 99.4 0.3 0.2 0.0 0.1
Central Highlands 100.0 99.0 0.5 0.2 0.0 0.3
South East 100.0 99.9 0.1 0.0 0.0 0.0
Mekong River Delta 100.0 99.6 0.2 0.1 0.0 0.1
Province, city Ha Noi 100.0 100.0 0.0 0.0 0.0 0.0 Ha Giang 100.0 91.8 4.8 3.3 0.0 0.1 Cao Bang 100.0 91.2 4.6 3.1 0.0 1.1 Bac Kan 100.0 94.3 4.2 0.9 0.0 0.6 Tuyen Quang 100.0 98.3 1.1 0.5 0.0 0.1 Lao Cai 100.0 96.6 1.9 1.1 0.0 0.4 Dien Bien 100.0 86.8 2.9 8.2 0.0 2.1 Lai Chau 100.0 93.9 1.7 2.7 0.0 1.7 Son La 100.0 94.9 1.6 3.4 0.0 0.1 Yen Bai 100.0 96.0 2.4 0.7 0.0 0.9 Hoa Binh 100.0 99.9 0.1 0.0 0.0 0.0 Thai Nguyen 100.0 99.8 0.0 0.1 0.1 0.0 Lang Son 100.0 98.1 1.2 0.6 0.0 0.1 Quang Ninh 100.0 99.9 0.1 0.0 0.0 0.0 Bac Giang 100.0 100.0 0.0 0.0 0.0 0.0 Phu Tho 100.0 99.9 0.1 0.0 0.0 0.0 Vinh Phuc 100.0 100.0 0.0 0.0 0.0 0.0 Bac Ninh 100.0 100.0 0.0 0.0 0.0 0.0 Hai Duong 100.0 100.0 0.0 0.0 0.0 0.0 Hai Phong 100.0 99.9 0.1 0.0 0.0 0.0 Hung Yen 100.0 100.0 0.0 0.0 0.0 0.0 Thai Binh 100.0 100.0 0.0 0.0 0.0 0.0 Ha Nam 100.0 100.0 0.0 0.0 0.0 0.0 Nam Dinh 100.0 100.0 0.0 0.0 0.0 0.0 Ninh Binh 100.0 99.9 0.1 0.0 0.0 0.0
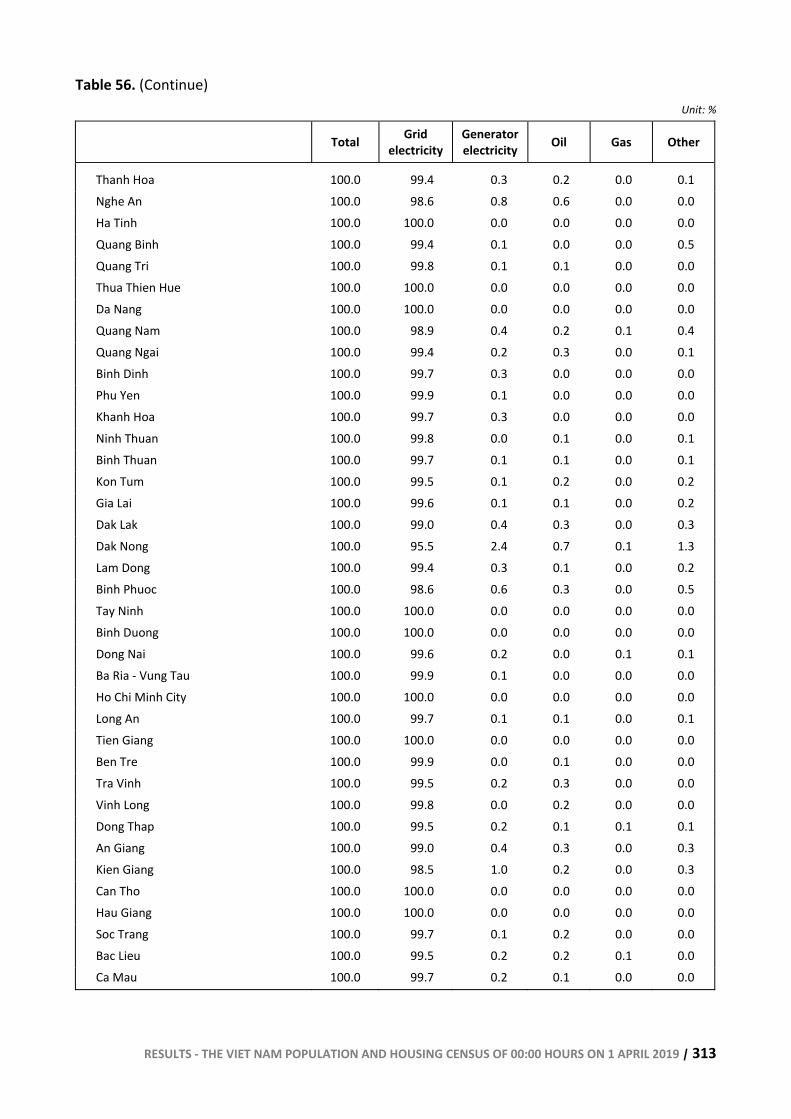
RESULTS - THE VIET NAM POPULATION AND HOUSING CENSUS OF 00:00 HOURS ON 1 APRIL 2019 | 313
Table 56. (Continue)
Unit: %
Total Grid electricity
Generator electricity Oil Gas Other
Thanh Hoa 100.0 99.4 0.3 0.2 0.0 0.1 Nghe An 100.0 98.6 0.8 0.6 0.0 0.0 Ha Tinh 100.0 100.0 0.0 0.0 0.0 0.0 Quang Binh 100.0 99.4 0.1 0.0 0.0 0.5 Quang Tri 100.0 99.8 0.1 0.1 0.0 0.0 Thua Thien Hue 100.0 100.0 0.0 0.0 0.0 0.0 Da Nang 100.0 100.0 0.0 0.0 0.0 0.0 Quang Nam 100.0 98.9 0.4 0.2 0.1 0.4 Quang Ngai 100.0 99.4 0.2 0.3 0.0 0.1 Binh Dinh 100.0 99.7 0.3 0.0 0.0 0.0 Phu Yen 100.0 99.9 0.1 0.0 0.0 0.0 Khanh Hoa 100.0 99.7 0.3 0.0 0.0 0.0 Ninh Thuan 100.0 99.8 0.0 0.1 0.0 0.1 Binh Thuan 100.0 99.7 0.1 0.1 0.0 0.1 Kon Tum 100.0 99.5 0.1 0.2 0.0 0.2 Gia Lai 100.0 99.6 0.1 0.1 0.0 0.2 Dak Lak 100.0 99.0 0.4 0.3 0.0 0.3 Dak Nong 100.0 95.5 2.4 0.7 0.1 1.3 Lam Dong 100.0 99.4 0.3 0.1 0.0 0.2 Binh Phuoc 100.0 98.6 0.6 0.3 0.0 0.5 Tay Ninh 100.0 100.0 0.0 0.0 0.0 0.0 Binh Duong 100.0 100.0 0.0 0.0 0.0 0.0 Dong Nai 100.0 99.6 0.2 0.0 0.1 0.1 Ba Ria - Vung Tau 100.0 99.9 0.1 0.0 0.0 0.0 Ho Chi Minh City 100.0 100.0 0.0 0.0 0.0 0.0 Long An 100.0 99.7 0.1 0.1 0.0 0.1 Tien Giang 100.0 100.0 0.0 0.0 0.0 0.0 Ben Tre 100.0 99.9 0.0 0.1 0.0 0.0 Tra Vinh 100.0 99.5 0.2 0.3 0.0 0.0 Vinh Long 100.0 99.8 0.0 0.2 0.0 0.0 Dong Thap 100.0 99.5 0.2 0.1 0.1 0.1 An Giang 100.0 99.0 0.4 0.3 0.0 0.3 Kien Giang 100.0 98.5 1.0 0.2 0.0 0.3 Can Tho 100.0 100.0 0.0 0.0 0.0 0.0 Hau Giang 100.0 100.0 0.0 0.0 0.0 0.0 Soc Trang 100.0 99.7 0.1 0.2 0.0 0.0 Bac Lieu 100.0 99.5 0.2 0.2 0.1 0.0 Ca Mau 100.0 99.7 0.2 0.1 0.0 0.0
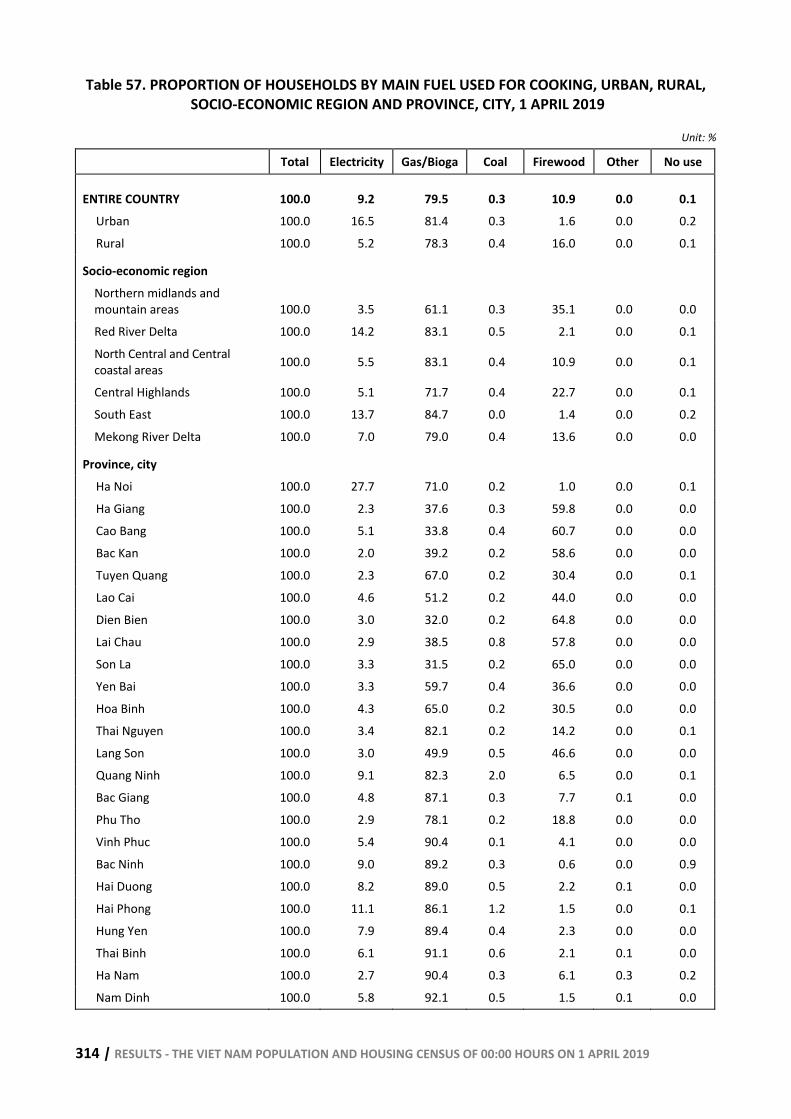
314 | RESULTS - THE VIET NAM POPULATION AND HOUSING CENSUS OF 00:00 HOURS ON 1 APRIL 2019
Table 57. PROPORTION OF HOUSEHOLDS BY MAIN FUEL USED FOR COOKING, URBAN, RURAL, SOCIO-ECONOMIC REGION AND PROVINCE, CITY, 1 APRIL 2019
Unit: %
Total Electricity Gas/Bioga Coal Firewood Other No use
ENTIRE COUNTRY 100.0 9.2 79.5 0.3 10.9 0.0 0.1 Urban 100.0 16.5 81.4 0.3 1.6 0.0 0.2 Rural 100.0 5.2 78.3 0.4 16.0 0.0 0.1
Socio-economic region Northern midlands and mountain areas 100.0 3.5 61.1 0.3 35.1 0.0 0.0 Red River Delta 100.0 14.2 83.1 0.5 2.1 0.0 0.1 North Central and Central coastal areas 100.0 5.5 83.1 0.4 10.9 0.0 0.1
Central Highlands 100.0 5.1 71.7 0.4 22.7 0.0 0.1 South East 100.0 13.7 84.7 0.0 1.4 0.0 0.2 Mekong River Delta 100.0 7.0 79.0 0.4 13.6 0.0 0.0
Province, city Ha Noi 100.0 27.7 71.0 0.2 1.0 0.0 0.1 Ha Giang 100.0 2.3 37.6 0.3 59.8 0.0 0.0 Cao Bang 100.0 5.1 33.8 0.4 60.7 0.0 0.0 Bac Kan 100.0 2.0 39.2 0.2 58.6 0.0 0.0 Tuyen Quang 100.0 2.3 67.0 0.2 30.4 0.0 0.1 Lao Cai 100.0 4.6 51.2 0.2 44.0 0.0 0.0 Dien Bien 100.0 3.0 32.0 0.2 64.8 0.0 0.0 Lai Chau 100.0 2.9 38.5 0.8 57.8 0.0 0.0 Son La 100.0 3.3 31.5 0.2 65.0 0.0 0.0 Yen Bai 100.0 3.3 59.7 0.4 36.6 0.0 0.0 Hoa Binh 100.0 4.3 65.0 0.2 30.5 0.0 0.0 Thai Nguyen 100.0 3.4 82.1 0.2 14.2 0.0 0.1 Lang Son 100.0 3.0 49.9 0.5 46.6 0.0 0.0 Quang Ninh 100.0 9.1 82.3 2.0 6.5 0.0 0.1 Bac Giang 100.0 4.8 87.1 0.3 7.7 0.1 0.0 Phu Tho 100.0 2.9 78.1 0.2 18.8 0.0 0.0 Vinh Phuc 100.0 5.4 90.4 0.1 4.1 0.0 0.0 Bac Ninh 100.0 9.0 89.2 0.3 0.6 0.0 0.9 Hai Duong 100.0 8.2 89.0 0.5 2.2 0.1 0.0 Hai Phong 100.0 11.1 86.1 1.2 1.5 0.0 0.1 Hung Yen 100.0 7.9 89.4 0.4 2.3 0.0 0.0 Thai Binh 100.0 6.1 91.1 0.6 2.1 0.1 0.0 Ha Nam 100.0 2.7 90.4 0.3 6.1 0.3 0.2 Nam Dinh 100.0 5.8 92.1 0.5 1.5 0.1 0.0
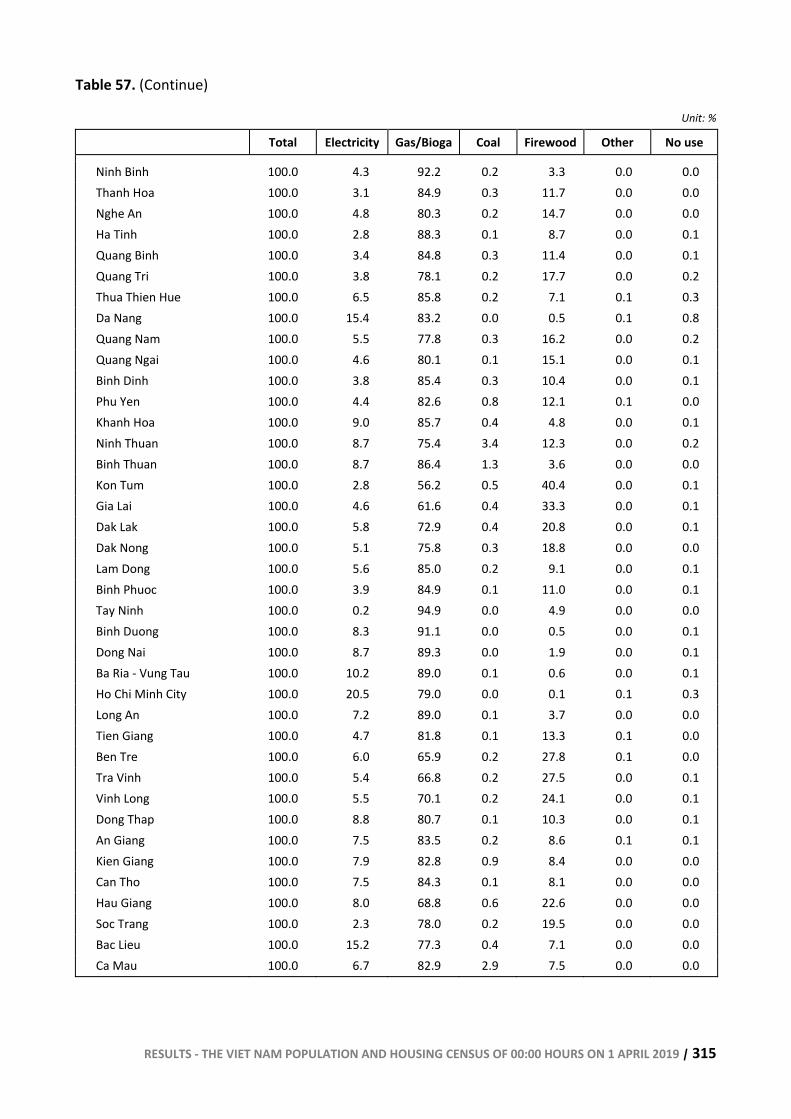
RESULTS - THE VIET NAM POPULATION AND HOUSING CENSUS OF 00:00 HOURS ON 1 APRIL 2019 | 315
Table 57. (Continue)
Unit: %
Total Electricity Gas/Bioga Coal Firewood Other No use
Ninh Binh 100.0 4.3 92.2 0.2 3.3 0.0 0.0 Thanh Hoa 100.0 3.1 84.9 0.3 11.7 0.0 0.0 Nghe An 100.0 4.8 80.3 0.2 14.7 0.0 0.0 Ha Tinh 100.0 2.8 88.3 0.1 8.7 0.0 0.1 Quang Binh 100.0 3.4 84.8 0.3 11.4 0.0 0.1 Quang Tri 100.0 3.8 78.1 0.2 17.7 0.0 0.2 Thua Thien Hue 100.0 6.5 85.8 0.2 7.1 0.1 0.3 Da Nang 100.0 15.4 83.2 0.0 0.5 0.1 0.8 Quang Nam 100.0 5.5 77.8 0.3 16.2 0.0 0.2 Quang Ngai 100.0 4.6 80.1 0.1 15.1 0.0 0.1 Binh Dinh 100.0 3.8 85.4 0.3 10.4 0.0 0.1 Phu Yen 100.0 4.4 82.6 0.8 12.1 0.1 0.0 Khanh Hoa 100.0 9.0 85.7 0.4 4.8 0.0 0.1 Ninh Thuan 100.0 8.7 75.4 3.4 12.3 0.0 0.2 Binh Thuan 100.0 8.7 86.4 1.3 3.6 0.0 0.0 Kon Tum 100.0 2.8 56.2 0.5 40.4 0.0 0.1 Gia Lai 100.0 4.6 61.6 0.4 33.3 0.0 0.1 Dak Lak 100.0 5.8 72.9 0.4 20.8 0.0 0.1 Dak Nong 100.0 5.1 75.8 0.3 18.8 0.0 0.0 Lam Dong 100.0 5.6 85.0 0.2 9.1 0.0 0.1 Binh Phuoc 100.0 3.9 84.9 0.1 11.0 0.0 0.1 Tay Ninh 100.0 0.2 94.9 0.0 4.9 0.0 0.0 Binh Duong 100.0 8.3 91.1 0.0 0.5 0.0 0.1 Dong Nai 100.0 8.7 89.3 0.0 1.9 0.0 0.1 Ba Ria - Vung Tau 100.0 10.2 89.0 0.1 0.6 0.0 0.1 Ho Chi Minh City 100.0 20.5 79.0 0.0 0.1 0.1 0.3 Long An 100.0 7.2 89.0 0.1 3.7 0.0 0.0 Tien Giang 100.0 4.7 81.8 0.1 13.3 0.1 0.0 Ben Tre 100.0 6.0 65.9 0.2 27.8 0.1 0.0 Tra Vinh 100.0 5.4 66.8 0.2 27.5 0.0 0.1 Vinh Long 100.0 5.5 70.1 0.2 24.1 0.0 0.1 Dong Thap 100.0 8.8 80.7 0.1 10.3 0.0 0.1 An Giang 100.0 7.5 83.5 0.2 8.6 0.1 0.1 Kien Giang 100.0 7.9 82.8 0.9 8.4 0.0 0.0 Can Tho 100.0 7.5 84.3 0.1 8.1 0.0 0.0 Hau Giang 100.0 8.0 68.8 0.6 22.6 0.0 0.0 Soc Trang 100.0 2.3 78.0 0.2 19.5 0.0 0.0 Bac Lieu 100.0 15.2 77.3 0.4 7.1 0.0 0.0 Ca Mau 100.0 6.7 82.9 2.9 7.5 0.0 0.0
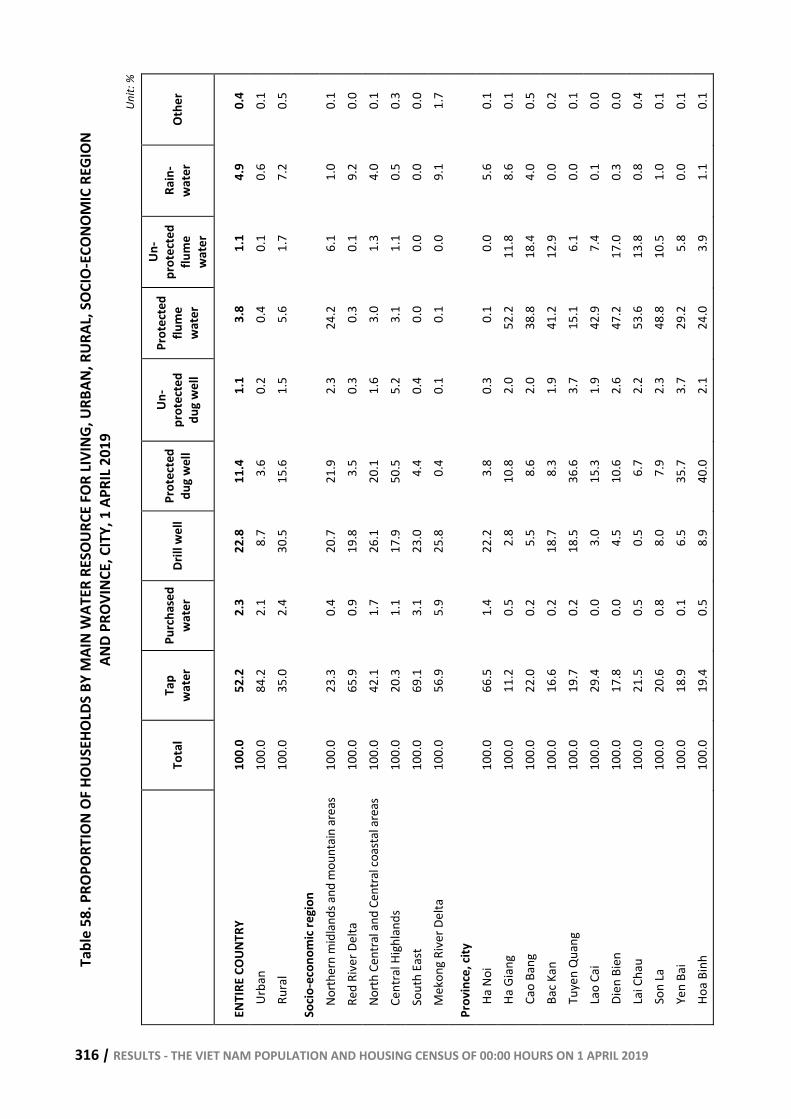
316 | RESULTS - THE VIET NAM POPULATION AND HOUSING CENSUS OF 00:00 HOURS ON 1 APRIL 2019
Tabl
e 58
. PRO
PORT
ION
OF H
OUSE
HOLD
S BY
MAI
N W
ATER
RES
OURC
E FO
R LIV
ING,
URB
AN, R
URAL
, SOC
IO-E
CONO
MIC
REG
ION
AN
D PR
OVIN
CE, C
ITY,
1 A
PRIL
2019
Unit:
%
To
tal
Tap
wat
er
Purc
hase
d w
ater
Dr
ill w
ell
Prot
ecte
d du
g w
ell
Un-
prot
ecte
d du
g w
ell
Prot
ecte
d flu
me
wat
er
Un-
prot
ecte
d
flum
e w
ater
Rain
-w
ater
Ot
her
ENTI
RE C
OUNT
RY
100.
0 52
.2
2.3
22.8
11
.4
1.1
3.8
1.1
4.9
0.4
Urba
n 10
0.0
84.2
2.
1 8.
7 3.
6 0.
2 0.
4 0.
1 0.
6 0.
1 Ru
ral
100.
0 35
.0
2.4
30.5
15
.6
1.5
5.6
1.7
7.2
0.5
Socio
-eco
nom
ic re
gion
No
rther
n m
idla
nds a
nd m
ount
ain
area
s 10
0.0
23.3
0.
4 20
.7
21.9
2.
3 24
.2
6.1
1.0
0.1
Red
Rive
r Del
ta
100.
0 65
.9
0.9
19.8
3.
5 0.
3 0.
3 0.
1 9.
2 0.
0 No
rth C
entra
l and
Cen
tral c
oast
al a
reas
10
0.0
42.1
1.
7 26
.1
20.1
1.
6 3.
0 1.
3 4.
0 0.
1 Ce
ntra
l Hig
hlan
ds
100.
0 20
.3
1.1
17.9
50
.5
5.2
3.1
1.1
0.5
0.3
Sout
h Ea
st
100.
0 69
.1
3.1
23.0
4.
4 0.
4 0.
0 0.
0 0.
0 0.
0 M
ekon
g Ri
ver D
elta
10
0.0
56.9
5.
9 25
.8
0.4
0.1
0.1
0.0
9.1
1.7
Prov
ince
, city
Ha
Noi
10
0.0
66.5
1.
4 22
.2
3.8
0.3
0.1
0.0
5.6
0.1
Ha G
iang
10
0.0
11.2
0.
5 2.
8 10
.8
2.0
52.2
11
.8
8.6
0.1
Cao
Bang
10
0.0
22.0
0.
2 5.
5 8.
6 2.
0 38
.8
18.4
4.
0 0.
5 Ba
c Kan
10
0.0
16.6
0.
2 18
.7
8.3
1.9
41.2
12
.9
0.0
0.2
Tuye
n Q
uang
10
0.0
19.7
0.
2 18
.5
36.6
3.
7 15
.1
6.1
0.0
0.1
Lao
Cai
100.
0 29
.4
0.0
3.0
15.3
1.
9 42
.9
7.4
0.1
0.0
Dien
Bie
n 10
0.0
17.8
0.
0 4.
5 10
.6
2.6
47.2
17
.0
0.3
0.0
Lai C
hau
100.
0 21
.5
0.5
0.5
6.7
2.2
53.6
13
.8
0.8
0.4
Son
La
100.
0 20
.6
0.8
8.0
7.9
2.3
48.8
10
.5
1.0
0.1
Yen
Bai
100.
0 18
.9
0.1
6.5
35.7
3.
7 29
.2
5.8
0.0
0.1
Hoa
Binh
10
0.0
19.4
0.
5 8.
9 40
.0
2.1
24.0
3.
9 1.
1 0.
1
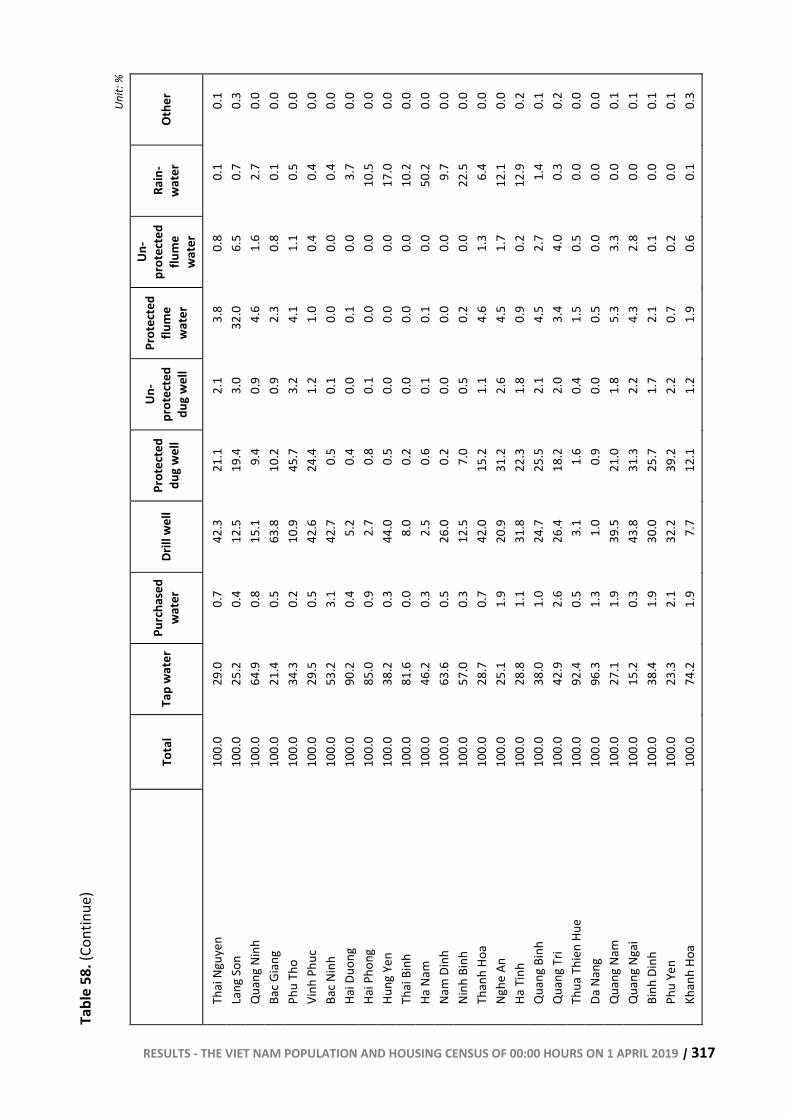
RESULTS - THE VIET NAM POPULATION AND HOUSING CENSUS OF 00:00 HOURS ON 1 APRIL 2019 | 317
Tabl
e 58
. (Co
ntin
ue)
Un
it: %
To
tal
Tap
wat
er
Purc
hase
d w
ater
Dr
ill w
ell
Prot
ecte
d du
g w
ell
Un-
prot
ecte
d du
g w
ell
Prot
ecte
d flu
me
wat
er
Un-
prot
ecte
d
flum
e w
ater
Rain
-w
ater
Ot
her
Thai
Ngu
yen
100.
0 29
.0
0.7
42.3
21
.1
2.1
3.8
0.8
0.1
0.1
Lang
Son
10
0.0
25.2
0.
4 12
.5
19.4
3.
0 32
.0
6.5
0.7
0.3
Qua
ng N
inh
100.
0 64
.9
0.8
15.1
9.
4 0.
9 4.
6 1.
6 2.
7 0.
0 Ba
c Gia
ng
100.
0 21
.4
0.5
63.8
10
.2
0.9
2.3
0.8
0.1
0.0
Phu
Tho
100.
0 34
.3
0.2
10.9
45
.7
3.2
4.1
1.1
0.5
0.0
Vinh
Phu
c 10
0.0
29.5
0.
5 42
.6
24.4
1.
2 1.
0 0.
4 0.
4 0.
0 Ba
c Nin
h 10
0.0
53.2
3.
1 42
.7
0.5
0.1
0.0
0.0
0.4
0.0
Hai D
uong
10
0.0
90.2
0.
4 5.
2 0.
4 0.
0 0.
1 0.
0 3.
7 0.
0 Ha
i Pho
ng
100.
0 85
.0
0.9
2.7
0.8
0.1
0.0
0.0
10.5
0.
0 Hu
ng Y
en
100.
0 38
.2
0.3
44.0
0.
5 0.
0 0.
0 0.
0 17
.0
0.0
Thai
Bin
h 10
0.0
81.6
0.
0 8.
0 0.
2 0.
0 0.
0 0.
0 10
.2
0.0
Ha N
am
100.
0 46
.2
0.3
2.5
0.6
0.1
0.1
0.0
50.2
0.
0 Na
m D
inh
100.
0 63
.6
0.5
26.0
0.
2 0.
0 0.
0 0.
0 9.
7 0.
0 Ni
nh B
inh
100.
0 57
.0
0.3
12.5
7.
0 0.
5 0.
2 0.
0 22
.5
0.0
Than
h Ho
a 10
0.0
28.7
0.
7 42
.0
15.2
1.
1 4.
6 1.
3 6.
4 0.
0 Ng
he A
n 10
0.0
25.1
1.
9 20
.9
31.2
2.
6 4.
5 1.
7 12
.1
0.0
Ha T
inh
100.
0 28
.8
1.1
31.8
22
.3
1.8
0.9
0.2
12.9
0.
2 Q
uang
Bin
h 10
0.0
38.0
1.
0 24
.7
25.5
2.
1 4.
5 2.
7 1.
4 0.
1 Q
uang
Tri
100.
0 42
.9
2.6
26.4
18
.2
2.0
3.4
4.0
0.3
0.2
Thua
Thi
en H
ue
100.
0 92
.4
0.5
3.1
1.6
0.4
1.5
0.5
0.0
0.0
Da N
ang
100.
0 96
.3
1.3
1.0
0.9
0.0
0.5
0.0
0.0
0.0
Qua
ng N
am
100.
0 27
.1
1.9
39.5
21
.0
1.8
5.3
3.3
0.0
0.1
Qua
ng N
gai
100.
0 15
.2
0.3
43.8
31
.3
2.2
4.3
2.8
0.0
0.1
Binh
Din
h 10
0.0
38.4
1.
9 30
.0
25.7
1.
7 2.
1 0.
1 0.
0 0.
1 Ph
u Ye
n 10
0.0
23.3
2.
1 32
.2
39.2
2.
2 0.
7 0.
2 0.
0 0.
1 Kh
anh
Hoa
100.
0 74
.2
1.9
7.7
12.1
1.
2 1.
9 0.
6 0.
1 0.
3
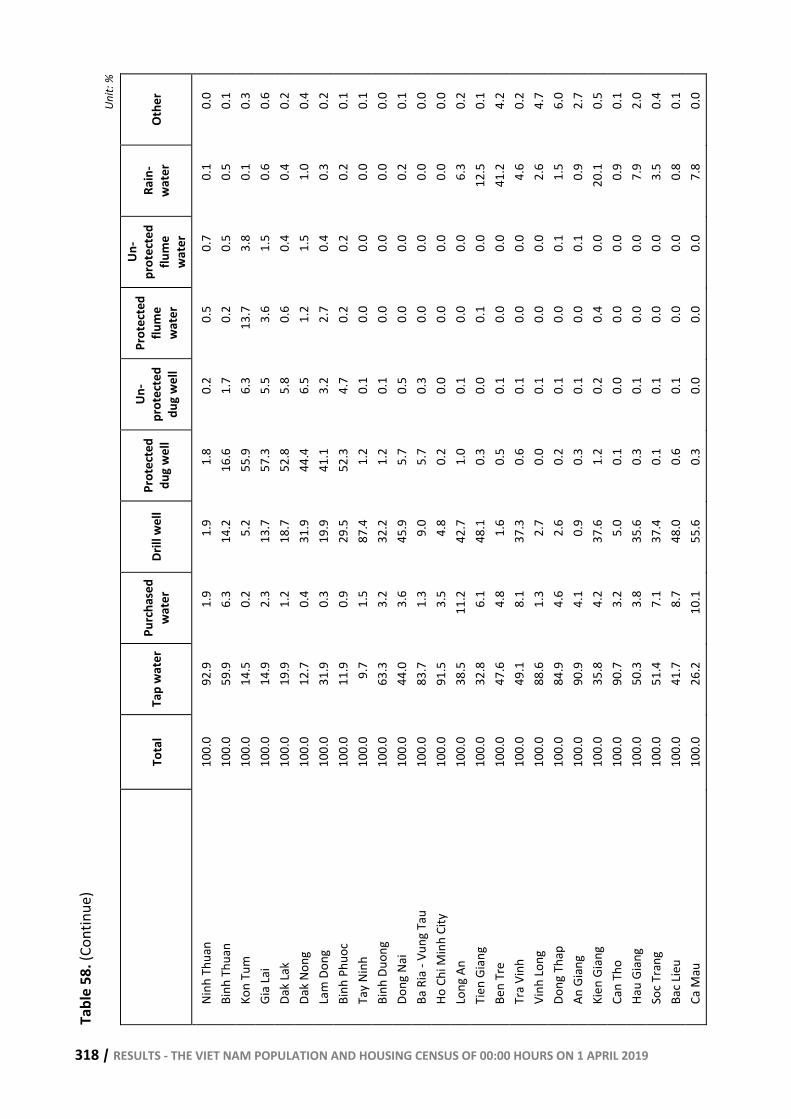
318 | RESULTS - THE VIET NAM POPULATION AND HOUSING CENSUS OF 00:00 HOURS ON 1 APRIL 2019
Tabl
e 58
. (Co
ntin
ue)
Unit:
%
To
tal
Tap
wat
er
Purc
hase
d w
ater
Dr
ill w
ell
Prot
ecte
d du
g w
ell
Un-
prot
ecte
d du
g w
ell
Prot
ecte
d flu
me
wat
er
Un-
prot
ecte
d
flum
e w
ater
Rain
-w
ater
Ot
her
Ninh
Thu
an
100.
0 92
.9
1.9
1.9
1.8
0.2
0.5
0.7
0.1
0.0
Binh
Thu
an
100.
0 59
.9
6.3
14.2
16
.6
1.7
0.2
0.5
0.5
0.1
Kon
Tum
10
0.0
14.5
0.
2 5.
2 55
.9
6.3
13.7
3.
8 0.
1 0.
3 Gi
a La
i 10
0.0
14.9
2.
3 13
.7
57.3
5.
5 3.
6 1.
5 0.
6 0.
6 Da
k La
k 10
0.0
19.9
1.
2 18
.7
52.8
5.
8 0.
6 0.
4 0.
4 0.
2 Da
k No
ng
100.
0 12
.7
0.4
31.9
44
.4
6.5
1.2
1.5
1.0
0.4
Lam
Don
g 10
0.0
31.9
0.
3 19
.9
41.1
3.
2 2.
7 0.
4 0.
3 0.
2 Bi
nh P
huoc
10
0.0
11.9
0.
9 29
.5
52.3
4.
7 0.
2 0.
2 0.
2 0.
1 Ta
y Ni
nh
100.
0 9.
7 1.
5 87
.4
1.2
0.1
0.0
0.0
0.0
0.1
Binh
Duo
ng
100.
0 63
.3
3.2
32.2
1.
2 0.
1 0.
0 0.
0 0.
0 0.
0 Do
ng N
ai
100.
0 44
.0
3.6
45.9
5.
7 0.
5 0.
0 0.
0 0.
2 0.
1 Ba
Ria
- Vu
ng T
au
100.
0 83
.7
1.3
9.0
5.7
0.3
0.0
0.0
0.0
0.0
Ho C
hi M
inh
City
10
0.0
91.5
3.
5 4.
8 0.
2 0.
0 0.
0 0.
0 0.
0 0.
0 Lo
ng A
n 10
0.0
38.5
11
.2
42.7
1.
0 0.
1 0.
0 0.
0 6.
3 0.
2 Ti
en G
iang
10
0.0
32.8
6.
1 48
.1
0.3
0.0
0.1
0.0
12.5
0.
1 Be
n Tr
e 10
0.0
47.6
4.
8 1.
6 0.
5 0.
1 0.
0 0.
0 41
.2
4.2
Tra
Vinh
10
0.0
49.1
8.
1 37
.3
0.6
0.1
0.0
0.0
4.6
0.2
Vinh
Long
10
0.0
88.6
1.
3 2.
7 0.
0 0.
1 0.
0 0.
0 2.
6 4.
7 Do
ng T
hap
100.
0 84
.9
4.6
2.6
0.2
0.1
0.0
0.1
1.5
6.0
An G
iang
10
0.0
90.9
4.
1 0.
9 0.
3 0.
1 0.
0 0.
1 0.
9 2.
7 Ki
en G
iang
10
0.0
35.8
4.
2 37
.6
1.2
0.2
0.4
0.0
20.1
0.
5 Ca
n Th
o 10
0.0
90.7
3.
2 5.
0 0.
1 0.
0 0.
0 0.
0 0.
9 0.
1 Ha
u Gi
ang
100.
0 50
.3
3.8
35.6
0.
3 0.
1 0.
0 0.
0 7.
9 2.
0 So
c Tra
ng
100.
0 51
.4
7.1
37.4
0.
1 0.
1 0.
0 0.
0 3.
5 0.
4 Ba
c Lie
u 10
0.0
41.7
8.
7 48
.0
0.6
0.1
0.0
0.0
0.8
0.1
Ca M
au
100.
0 26
.2
10.1
55
.6
0.3
0.0
0.0
0.0
7.8
0.0
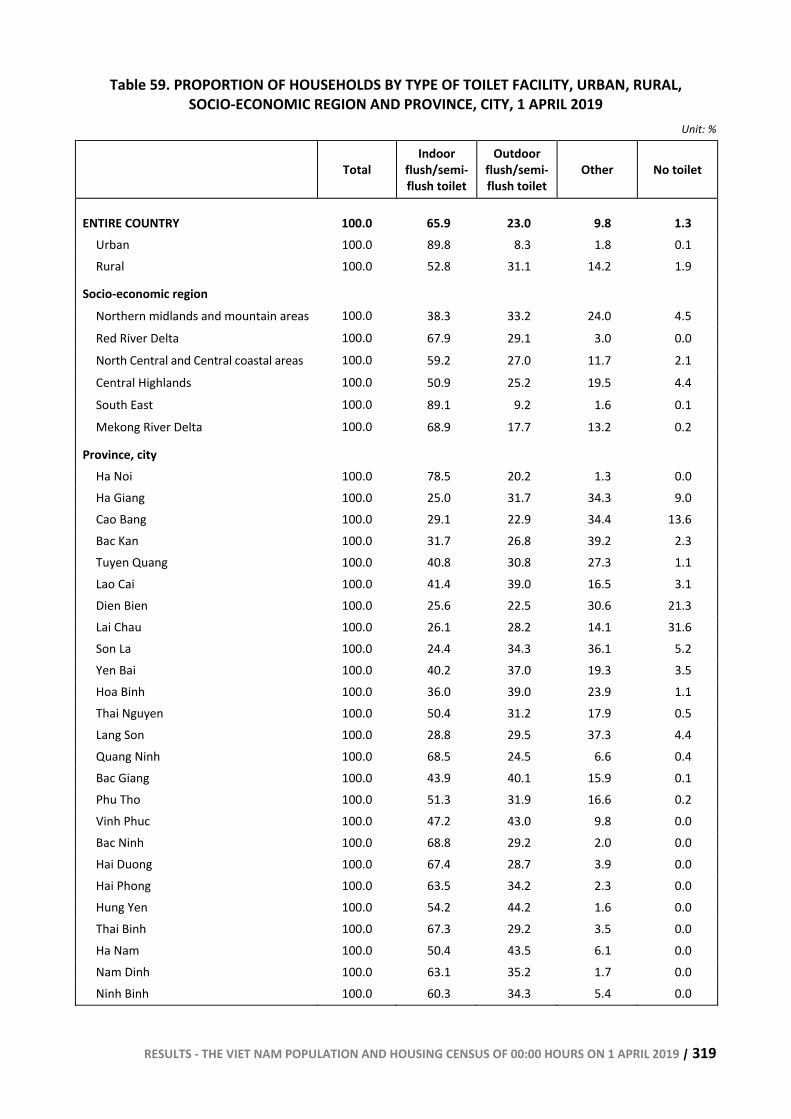
RESULTS - THE VIET NAM POPULATION AND HOUSING CENSUS OF 00:00 HOURS ON 1 APRIL 2019 | 319
Table 59. PROPORTION OF HOUSEHOLDS BY TYPE OF TOILET FACILITY, URBAN, RURAL, SOCIO-ECONOMIC REGION AND PROVINCE, CITY, 1 APRIL 2019
Unit: %
Total Indoor
flush/semi-flush toilet
Outdoor flush/semi-flush toilet
Other No toilet
ENTIRE COUNTRY 100.0 65.9 23.0 9.8 1.3 Urban 100.0 89.8 8.3 1.8 0.1 Rural 100.0 52.8 31.1 14.2 1.9
Socio-economic region Northern midlands and mountain areas 100.0 38.3 33.2 24.0 4.5 Red River Delta 100.0 67.9 29.1 3.0 0.0 North Central and Central coastal areas 100.0 59.2 27.0 11.7 2.1 Central Highlands 100.0 50.9 25.2 19.5 4.4 South East 100.0 89.1 9.2 1.6 0.1 Mekong River Delta 100.0 68.9 17.7 13.2 0.2
Province, city Ha Noi 100.0 78.5 20.2 1.3 0.0 Ha Giang 100.0 25.0 31.7 34.3 9.0 Cao Bang 100.0 29.1 22.9 34.4 13.6 Bac Kan 100.0 31.7 26.8 39.2 2.3 Tuyen Quang 100.0 40.8 30.8 27.3 1.1 Lao Cai 100.0 41.4 39.0 16.5 3.1 Dien Bien 100.0 25.6 22.5 30.6 21.3 Lai Chau 100.0 26.1 28.2 14.1 31.6 Son La 100.0 24.4 34.3 36.1 5.2 Yen Bai 100.0 40.2 37.0 19.3 3.5 Hoa Binh 100.0 36.0 39.0 23.9 1.1 Thai Nguyen 100.0 50.4 31.2 17.9 0.5 Lang Son 100.0 28.8 29.5 37.3 4.4 Quang Ninh 100.0 68.5 24.5 6.6 0.4 Bac Giang 100.0 43.9 40.1 15.9 0.1 Phu Tho 100.0 51.3 31.9 16.6 0.2 Vinh Phuc 100.0 47.2 43.0 9.8 0.0 Bac Ninh 100.0 68.8 29.2 2.0 0.0 Hai Duong 100.0 67.4 28.7 3.9 0.0 Hai Phong 100.0 63.5 34.2 2.3 0.0 Hung Yen 100.0 54.2 44.2 1.6 0.0 Thai Binh 100.0 67.3 29.2 3.5 0.0 Ha Nam 100.0 50.4 43.5 6.1 0.0 Nam Dinh 100.0 63.1 35.2 1.7 0.0 Ninh Binh 100.0 60.3 34.3 5.4 0.0
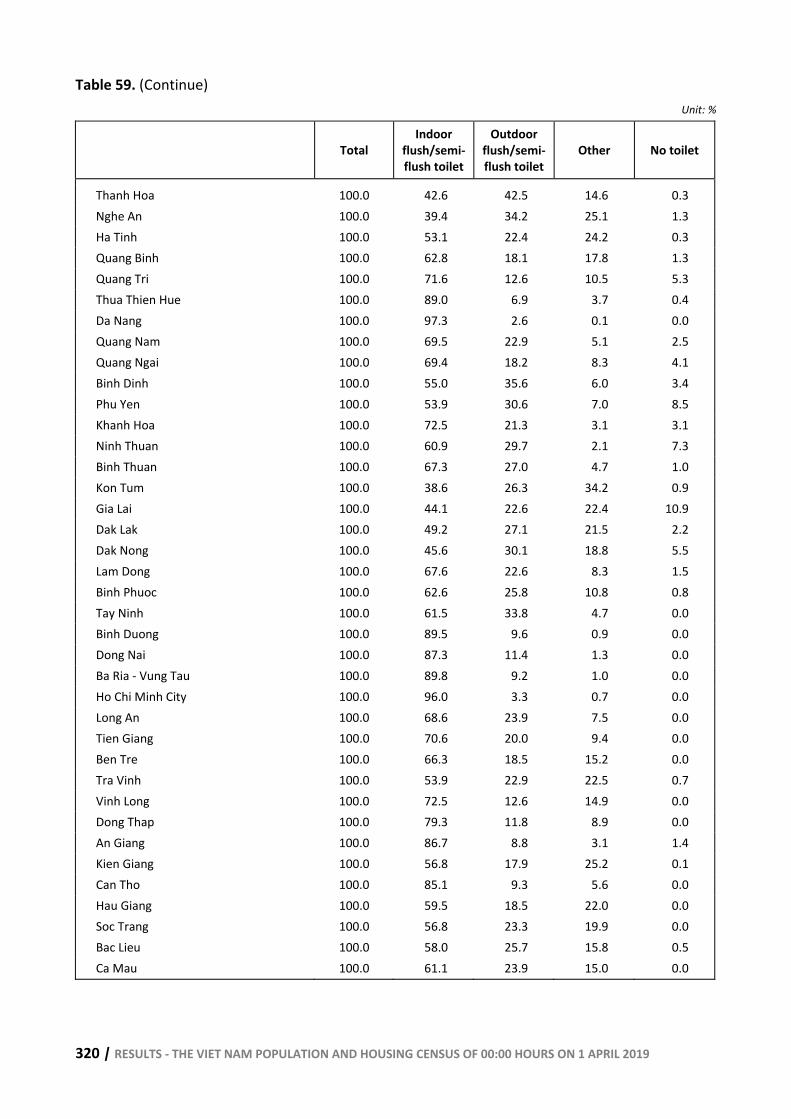
320 | RESULTS - THE VIET NAM POPULATION AND HOUSING CENSUS OF 00:00 HOURS ON 1 APRIL 2019
Table 59. (Continue) Unit: %
Total Indoor
flush/semi-flush toilet
Outdoor flush/semi-flush toilet
Other No toilet
Thanh Hoa 100.0 42.6 42.5 14.6 0.3 Nghe An 100.0 39.4 34.2 25.1 1.3 Ha Tinh 100.0 53.1 22.4 24.2 0.3 Quang Binh 100.0 62.8 18.1 17.8 1.3 Quang Tri 100.0 71.6 12.6 10.5 5.3 Thua Thien Hue 100.0 89.0 6.9 3.7 0.4 Da Nang 100.0 97.3 2.6 0.1 0.0 Quang Nam 100.0 69.5 22.9 5.1 2.5 Quang Ngai 100.0 69.4 18.2 8.3 4.1 Binh Dinh 100.0 55.0 35.6 6.0 3.4 Phu Yen 100.0 53.9 30.6 7.0 8.5 Khanh Hoa 100.0 72.5 21.3 3.1 3.1 Ninh Thuan 100.0 60.9 29.7 2.1 7.3 Binh Thuan 100.0 67.3 27.0 4.7 1.0 Kon Tum 100.0 38.6 26.3 34.2 0.9 Gia Lai 100.0 44.1 22.6 22.4 10.9 Dak Lak 100.0 49.2 27.1 21.5 2.2 Dak Nong 100.0 45.6 30.1 18.8 5.5 Lam Dong 100.0 67.6 22.6 8.3 1.5 Binh Phuoc 100.0 62.6 25.8 10.8 0.8 Tay Ninh 100.0 61.5 33.8 4.7 0.0 Binh Duong 100.0 89.5 9.6 0.9 0.0 Dong Nai 100.0 87.3 11.4 1.3 0.0 Ba Ria - Vung Tau 100.0 89.8 9.2 1.0 0.0 Ho Chi Minh City 100.0 96.0 3.3 0.7 0.0 Long An 100.0 68.6 23.9 7.5 0.0 Tien Giang 100.0 70.6 20.0 9.4 0.0 Ben Tre 100.0 66.3 18.5 15.2 0.0 Tra Vinh 100.0 53.9 22.9 22.5 0.7 Vinh Long 100.0 72.5 12.6 14.9 0.0 Dong Thap 100.0 79.3 11.8 8.9 0.0 An Giang 100.0 86.7 8.8 3.1 1.4 Kien Giang 100.0 56.8 17.9 25.2 0.1 Can Tho 100.0 85.1 9.3 5.6 0.0 Hau Giang 100.0 59.5 18.5 22.0 0.0 Soc Trang 100.0 56.8 23.3 19.9 0.0 Bac Lieu 100.0 58.0 25.7 15.8 0.5 Ca Mau 100.0 61.1 23.9 15.0 0.0
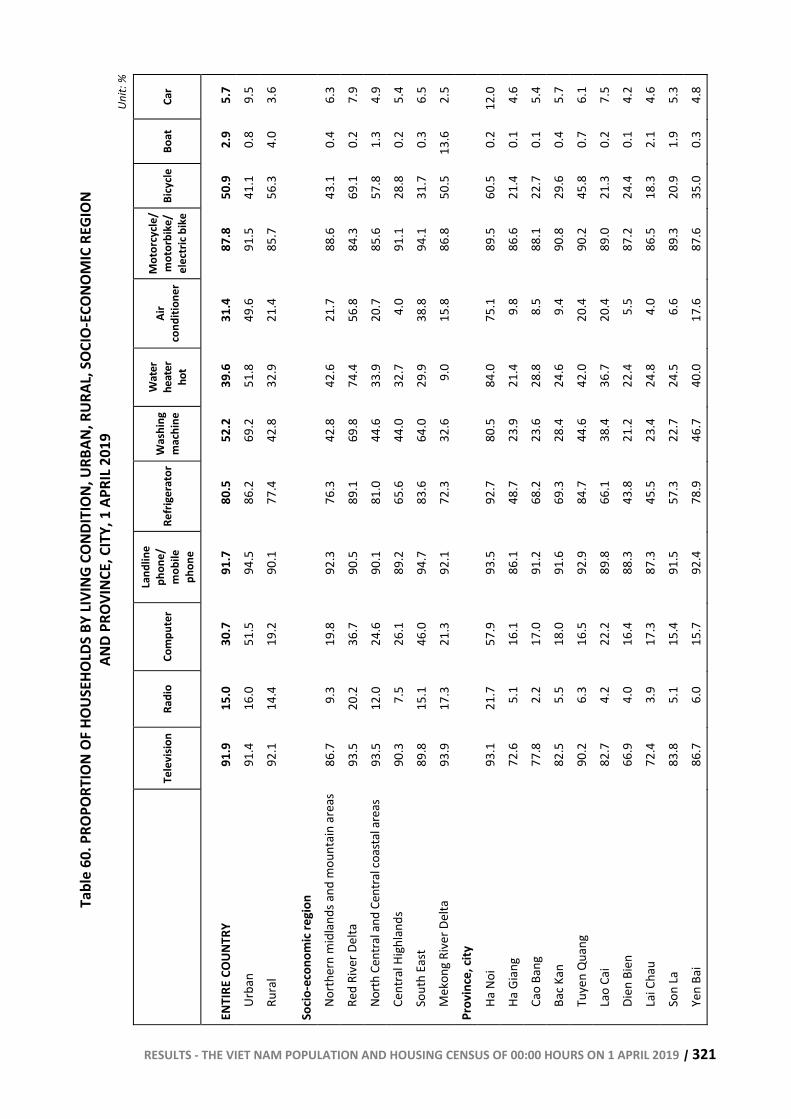
RESULTS - THE VIET NAM POPULATION AND HOUSING CENSUS OF 00:00 HOURS ON 1 APRIL 2019 | 321
Tabl
e 60
. PRO
PORT
ION
OF H
OUSE
HOLD
S BY
LIVI
NG C
ONDI
TION
, URB
AN, R
URAL
, SOC
IO-E
CONO
MIC
REG
ION
AN
D PR
OVIN
CE, C
ITY,
1 A
PRIL
2019
Un
it: %
Te
levi
sion
Radi
o
Com
pute
r
Land
line
phon
e/
mob
ile
phon
e
Refri
gera
tor
Was
hing
m
achi
ne
Wat
er
heat
er
hot
Air
cond
ition
er
Mot
orcy
cle/
mot
orbi
ke/
elec
tric
bike
Bicy
cleBo
at
Car
ENTI
RE C
OUNT
RY
91.9
15
.0
30.7
91
.7
80.5
52
.2
39.6
31
.4
87.8
50
.9
2.9
5.7
Urba
n 91
.4
16.0
51
.5
94.5
86
.2
69.2
51
.8
49.6
91
.5
41.1
0.
8 9.
5
Rura
l 92
.1
14.4
19
.2
90.1
77
.4
42.8
32
.9
21.4
85
.7
56.3
4.
0 3.
6
Socio
-eco
nom
ic re
gion
No
rthe
rn m
idla
nds a
nd m
ount
ain
area
s 86
.7
9.3
19.8
92
.3
76.3
42
.8
42.6
21
.7
88.6
43
.1
0.4
6.3
Red
Rive
r Del
ta
93.5
20
.2
36.7
90
.5
89.1
69
.8
74.4
56
.8
84.3
69
.1
0.2
7.9
North
Cen
tral a
nd C
entra
l coa
stal
are
as
93.5
12
.0
24.6
90
.1
81.0
44
.6
33.9
20
.7
85.6
57
.8
1.3
4.9
Cent
ral H
ighl
ands
90
.3
7.5
26.1
89
.2
65.6
44
.0
32.7
4.
0 91
.1
28.8
0.
2 5.
4 So
uth
East
89
.8
15.1
46
.0
94.7
83
.6
64.0
29
.9
38.8
94
.1
31.7
0.
3 6.
5 M
ekon
g Ri
ver D
elta
93
.9
17.3
21
.3
92.1
72
.3
32.6
9.
0 15
.8
86.8
50
.5
13.6
2.
5 Pr
ovin
ce, c
ity
Ha N
oi
93.1
21
.7
57.9
93
.5
92.7
80
.5
84.0
75
.1
89.5
60
.5
0.2
12.0
Ha G
iang
72
.6
5.1
16.1
86
.1
48.7
23
.9
21.4
9.
8 86
.6
21.4
0.
1 4.
6
Cao
Bang
77
.8
2.2
17.0
91
.2
68.2
23
.6
28.8
8.
5 88
.1
22.7
0.
1 5.
4
Bac K
an
82.5
5.
5 18
.0
91.6
69
.3
28.4
24
.6
9.4
90.8
29
.6
0.4
5.7
Tuye
n Q
uang
90
.2
6.3
16.5
92
.9
84.7
44
.6
42.0
20
.4
90.2
45
.8
0.7
6.1
Lao
Cai
82.7
4.
2 22
.2
89.8
66
.1
38.4
36
.7
20.4
89
.0
21.3
0.
2 7.
5
Dien
Bie
n 66
.9
4.0
16.4
88
.3
43.8
21
.2
22.4
5.
5 87
.2
24.4
0.
1 4.
2
Lai C
hau
72.4
3.
9 17
.3
87.3
45
.5
23.4
24
.8
4.0
86.5
18
.3
2.1
4.6
Son
La
83.8
5.
1 15
.4
91.5
57
.3
22.7
24
.5
6.6
89.3
20
.9
1.9
5.3
Yen
Bai
86.7
6.
0 15
.7
92.4
78
.9
46.7
40
.0
17.6
87
.6
35.0
0.
3 4.
8
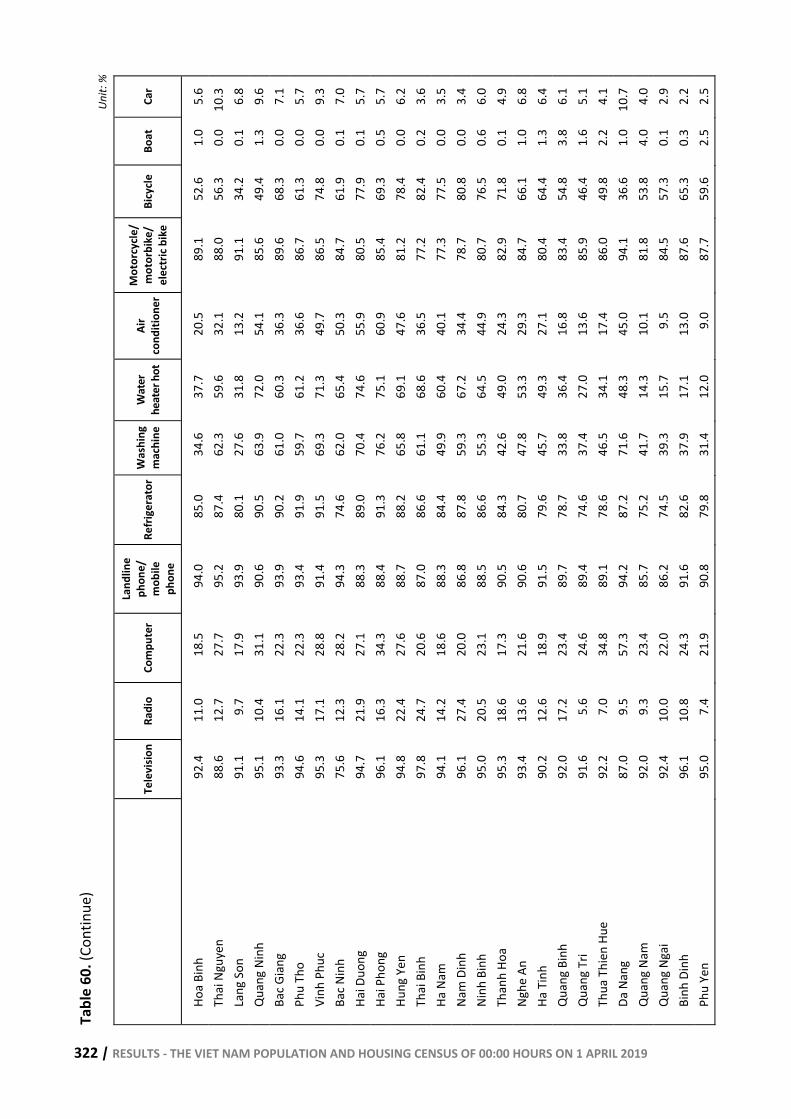
322 | RESULTS - THE VIET NAM POPULATION AND HOUSING CENSUS OF 00:00 HOURS ON 1 APRIL 2019
Tabl
e 60
. (Co
ntin
ue)
Unit:
%
Te
levi
sion
Radi
o
Com
pute
r
Land
line
phon
e/
mob
ile
phon
e
Refri
gera
tor
Was
hing
m
achi
neW
ater
he
ater
hot
Ai
r co
nditi
oner
Mot
orcy
cle/
mot
orbi
ke/
elec
tric
bike
Bi
cycle
Bo
at
Car
Hoa
Binh
92
.4
11.0
18
.5
94.0
85
.0
34.6
37
.7
20.5
89
.1
52.6
1.
0 5.
6 Th
ai N
guye
n 88
.6
12.7
27
.7
95.2
87
.4
62.3
59
.6
32.1
88
.0
56.3
0.
0 10
.3
Lang
Son
91
.1
9.7
17.9
93
.9
80.1
27
.6
31.8
13
.2
91.1
34
.2
0.1
6.8
Qua
ng N
inh
95.1
10
.4
31.1
90
.6
90.5
63
.9
72.0
54
.1
85.6
49
.4
1.3
9.6
Bac G
iang
93
.3
16.1
22
.3
93.9
90
.2
61.0
60
.3
36.3
89
.6
68.3
0.
0 7.
1 Ph
u Th
o 94
.6
14.1
22
.3
93.4
91
.9
59.7
61
.2
36.6
86
.7
61.3
0.
0 5.
7 Vi
nh P
huc
95.3
17
.1
28.8
91
.4
91.5
69
.3
71.3
49
.7
86.5
74
.8
0.0
9.3
Bac N
inh
75.6
12
.3
28.2
94
.3
74.6
62
.0
65.4
50
.3
84.7
61
.9
0.1
7.0
Hai D
uong
94
.7
21.9
27
.1
88.3
89
.0
70.4
74
.6
55.9
80
.5
77.9
0.
1 5.
7 Ha
i Pho
ng
96.1
16
.3
34.3
88
.4
91.3
76
.2
75.1
60
.9
85.4
69
.3
0.5
5.7
Hung
Yen
94
.8
22.4
27
.6
88.7
88
.2
65.8
69
.1
47.6
81
.2
78.4
0.
0 6.
2 Th
ai B
inh
97.8
24
.7
20.6
87
.0
86.6
61
.1
68.6
36
.5
77.2
82
.4
0.2
3.6
Ha N
am
94.1
14
.2
18.6
88
.3
84.4
49
.9
60.4
40
.1
77.3
77
.5
0.0
3.5
Nam
Din
h 96
.1
27.4
20
.0
86.8
87
.8
59.3
67
.2
34.4
78
.7
80.8
0.
0 3.
4 Ni
nh B
inh
95.0
20
.5
23.1
88
.5
86.6
55
.3
64.5
44
.9
80.7
76
.5
0.6
6.0
Than
h Ho
a 95
.3
18.6
17
.3
90.5
84
.3
42.6
49
.0
24.3
82
.9
71.8
0.
1 4.
9 Ng
he A
n 93
.4
13.6
21
.6
90.6
80
.7
47.8
53
.3
29.3
84
.7
66.1
1.
0 6.
8 Ha
Tin
h 90
.2
12.6
18
.9
91.5
79
.6
45.7
49
.3
27.1
80
.4
64.4
1.
3 6.
4 Q
uang
Bin
h 92
.0
17.2
23
.4
89.7
78
.7
33.8
36
.4
16.8
83
.4
54.8
3.
8 6.
1 Q
uang
Tri
91.6
5.
6 24
.6
89.4
74
.6
37.4
27
.0
13.6
85
.9
46.4
1.
6 5.
1 Th
ua T
hien
Hue
92
.2
7.0
34.8
89
.1
78.6
46
.5
34.1
17
.4
86.0
49
.8
2.2
4.1
Da N
ang
87.0
9.
5 57
.3
94.2
87
.2
71.6
48
.3
45.0
94
.1
36.6
1.
0 10
.7
Qua
ng N
am
92.0
9.
3 23
.4
85.7
75
.2
41.7
14
.3
10.1
81
.8
53.8
4.
0 4.
0 Q
uang
Nga
i 92
.4
10.0
22
.0
86.2
74
.5
39.3
15
.7
9.5
84.5
57
.3
0.1
2.9
Binh
Din
h 96
.1
10.8
24
.3
91.6
82
.6
37.9
17
.1
13.0
87
.6
65.3
0.
3 2.
2 Ph
u Ye
n 95
.0
7.4
21.9
90
.8
79.8
31
.4
12.0
9.
0 87
.7
59.6
2.
5 2.
5
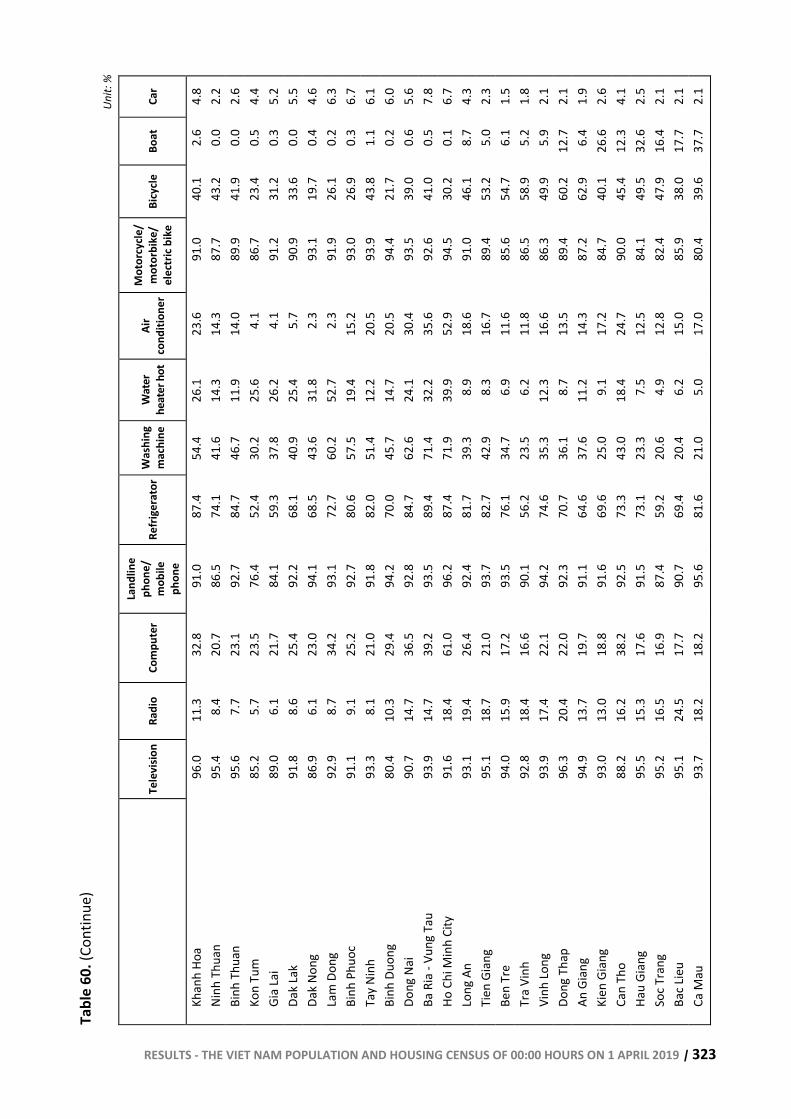
RESULTS - THE VIET NAM POPULATION AND HOUSING CENSUS OF 00:00 HOURS ON 1 APRIL 2019 | 323
Tabl
e 60
. (Co
ntin
ue)
Unit:
%
Te
levi
sion
Radi
o
Com
pute
r
Land
line
phon
e/
mob
ile
phon
e
Refri
gera
tor
Was
hing
m
achi
neW
ater
he
ater
hot
Ai
r co
nditi
oner
Mot
orcy
cle/
mot
orbi
ke/
elec
tric
bike
Bi
cycle
Bo
at
Car
Khan
h Ho
a 96
.0
11.3
32
.8
91.0
87
.4
54.4
26
.1
23.6
91
.0
40.1
2.
6 4.
8 Ni
nh T
huan
95
.4
8.4
20.7
86
.5
74.1
41
.6
14.3
14
.3
87.7
43
.2
0.0
2.2
Binh
Thu
an
95.6
7.
7 23
.1
92.7
84
.7
46.7
11
.9
14.0
89
.9
41.9
0.
0 2.
6 Ko
n Tu
m
85.2
5.
7 23
.5
76.4
52
.4
30.2
25
.6
4.1
86.7
23
.4
0.5
4.4
Gia
Lai
89.0
6.
1 21
.7
84.1
59
.3
37.8
26
.2
4.1
91.2
31
.2
0.3
5.2
Dak
Lak
91.8
8.
6 25
.4
92.2
68
.1
40.9
25
.4
5.7
90.9
33
.6
0.0
5.5
Dak
Nong
86
.9
6.1
23.0
94
.1
68.5
43
.6
31.8
2.
3 93
.1
19.7
0.
4 4.
6 La
m D
ong
92.9
8.
7 34
.2
93.1
72
.7
60.2
52
.7
2.3
91.9
26
.1
0.2
6.3
Binh
Phu
oc
91.1
9.
1 25
.2
92.7
80
.6
57.5
19
.4
15.2
93
.0
26.9
0.
3 6.
7 Ta
y Ni
nh
93.3
8.
1 21
.0
91.8
82
.0
51.4
12
.2
20.5
93
.9
43.8
1.
1 6.
1 Bi
nh D
uong
80
.4
10.3
29
.4
94.2
70
.0
45.7
14
.7
20.5
94
.4
21.7
0.
2 6.
0 Do
ng N
ai
90.7
14
.7
36.5
92
.8
84.7
62
.6
24.1
30
.4
93.5
39
.0
0.6
5.6
Ba R
ia -
Vung
Tau
93
.9
14.7
39
.2
93.5
89
.4
71.4
32
.2
35.6
92
.6
41.0
0.
5 7.
8 Ho
Chi
Min
h Ci
ty
91.6
18
.4
61.0
96
.2
87.4
71
.9
39.9
52
.9
94.5
30
.2
0.1
6.7
Long
An
93.1
19
.4
26.4
92
.4
81.7
39
.3
8.9
18.6
91
.0
46.1
8.
7 4.
3 Ti
en G
iang
95
.1
18.7
21
.0
93.7
82
.7
42.9
8.
3 16
.7
89.4
53
.2
5.0
2.3
Ben
Tre
94.0
15
.9
17.2
93
.5
76.1
34
.7
6.9
11.6
85
.6
54.7
6.
1 1.
5 Tr
a Vi
nh
92.8
18
.4
16.6
90
.1
56.2
23
.5
6.2
11.8
86
.5
58.9
5.
2 1.
8 Vi
nh Lo
ng
93.9
17
.4
22.1
94
.2
74.6
35
.3
12.3
16
.6
86.3
49
.9
5.9
2.1
Dong
Tha
p 96
.3
20.4
22
.0
92.3
70
.7
36.1
8.
7 13
.5
89.4
60
.2
12.7
2.
1 An
Gia
ng
94.9
13
.7
19.7
91
.1
64.6
37
.6
11.2
14
.3
87.2
62
.9
6.4
1.9
Kien
Gia
ng
93.0
13
.0
18.8
91
.6
69.6
25
.0
9.1
17.2
84
.7
40.1
26
.6
2.6
Can
Tho
88.2
16
.2
38.2
92
.5
73.3
43
.0
18.4
24
.7
90.0
45
.4
12.3
4.
1 Ha
u Gi
ang
95.5
15
.3
17.6
91
.5
73.1
23
.3
7.5
12.5
84
.1
49.5
32
.6
2.5
Soc T
rang
95
.2
16.5
16
.9
87.4
59
.2
20.6
4.
9 12
.8
82.4
47
.9
16.4
2.
1 Ba
c Lie
u 95
.1
24.5
17
.7
90.7
69
.4
20.4
6.
2 15
.0
85.9
38
.0
17.7
2.
1 Ca
Mau
93
.7
18.2
18
.2
95.6
81
.6
21.0
5.
0 17
.0
80.4
39
.6
37.7
2.
1


RESULTS - THE VIET NAM POPULATION AND HOUSING CENSUS OF 00:00 HOURS ON 1 APRIL 2019 | 325
ANNEX

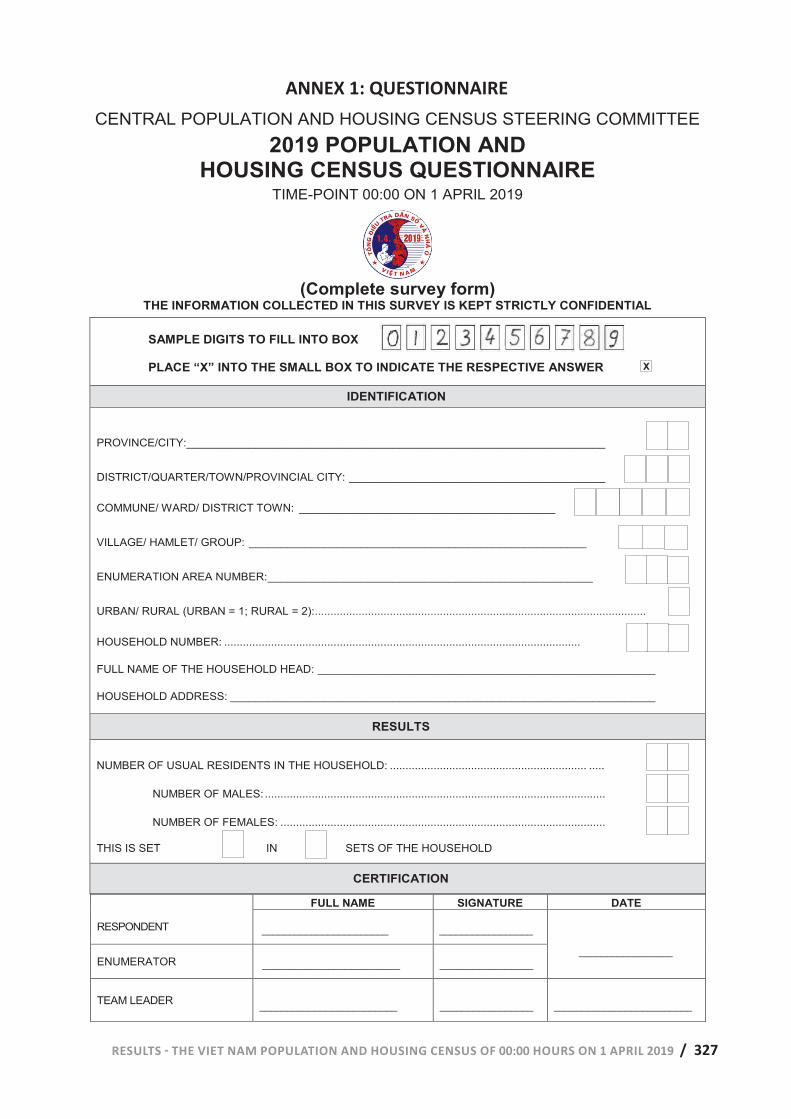
RESULTS - THE VIET NAM POPULATION AND HOUSING CENSUS OF 00:00 HOURS ON 1 APRIL 2019 / 327
CENTRAL POPULATION AND HOUSING CENSUS STEERING COMMITTEE 2019 POPULATION AND
HOUSING CENSUS QUESTIONNAIRE TIME-POINT 00:00 ON 1 APRIL 2019
(Complete survey form)
THE INFORMATION COLLECTED IN THIS SURVEY IS KEPT STRICTLY CONFIDENTIAL
SAMPLE DIGITS TO FILL INTO BOX PLACE “X” INTO THE SMALL BOX TO INDICATE THE RESPECTIVE ANSWER
IDENTIFICATION
PROVINCE/CITY:___________________________________________________________________
DISTRICT/QUARTER/TOWN/PROVINCIAL CITY: _________________________________________
COMMUNE/ WARD/ DISTRICT TOWN: _________________________________________
VILLAGE/ HAMLET/ GROUP: ______________________________________________________
ENUMERATION AREA NUMBER: ____________________________________________________
URBAN/ RURAL (URBAN = 1; RURAL = 2): ..........................................................................................................
HOUSEHOLD NUMBER: ..................................................................................................................
FULL NAME OF THE HOUSEHOLD HEAD: ______________________________________________________
HOUSEHOLD ADDRESS: ____________________________________________________________________
RESULTS
NUMBER OF USUAL RESIDENTS IN THE HOUSEHOLD: ............................................................... .....
NUMBER OF MALES: .............................................................................................................
NUMBER OF FEMALES: ........................................................................................................
THIS IS SET IN SETS OF THE HOUSEHOLD
CERTIFICATION
RESPONDENT
FULL NAME SIGNATURE DATE
_______________________ _________________
_________________ ENUMERATOR _________________________ _________________
TEAM LEADER _________________________ _________________ _________________________
X
ANNEX 1: QUESTIONNAIRE
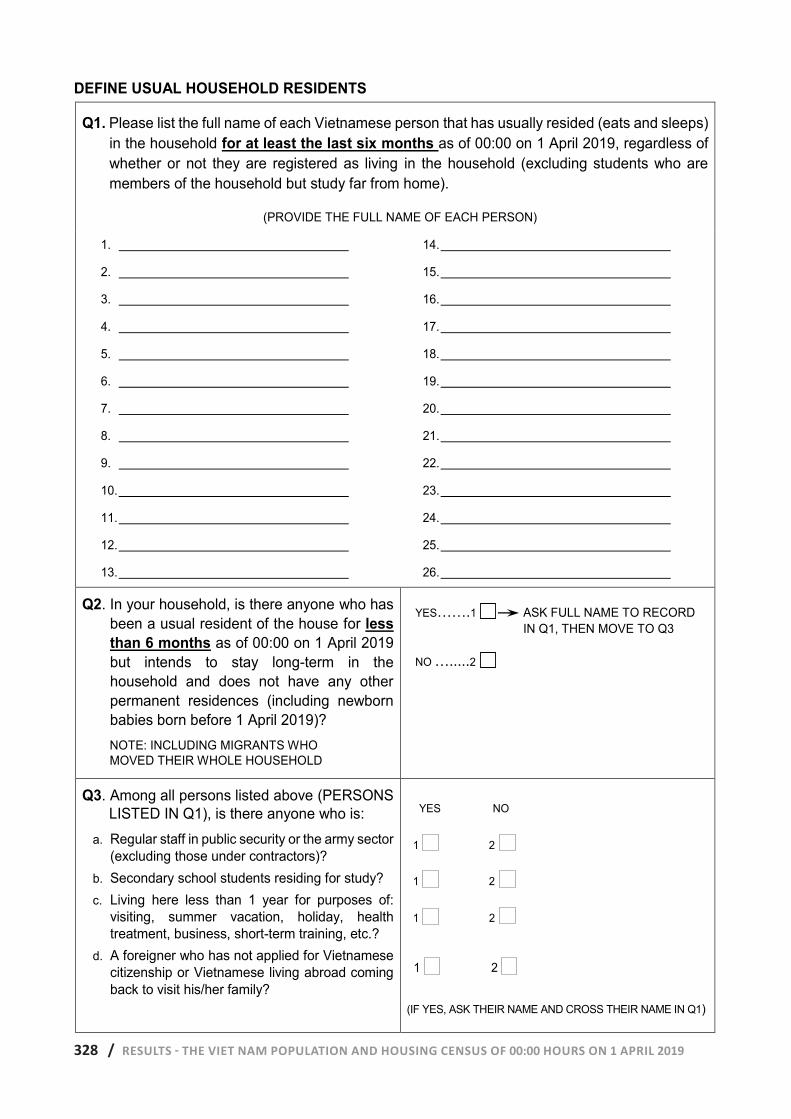
328 / RESULTS - THE VIET NAM POPULATION AND HOUSING CENSUS OF 00:00 HOURS ON 1 APRIL 2019
DEFINE USUAL HOUSEHOLD RESIDENTS
Q1. Please list the full name of each Vietnamese person that has usually resided (eats and sleeps) in the household for at least the last six months as of 00:00 on 1 April 2019, regardless of whether or not they are registered as living in the household (excluding students who are members of the household but study far from home).
(PROVIDE THE FULL NAME OF EACH PERSON)
1.
2.
3.
4.
5.
6.
7.
8.
9.
10.
11.
12.
13.
14.
15.
16.
17.
18.
19.
20.
21.
22.
23.
24.
25.
26.
Q2. In your household, is there anyone who has been a usual resident of the house for less than 6 months as of 00:00 on 1 April 2019 but intends to stay long-term in the household and does not have any other permanent residences (including newborn babies born before 1 April 2019)? NOTE: INCLUDING MIGRANTS WHO MOVED THEIR WHOLE HOUSEHOLD
YES…….1 ASK FULL NAME TO RECORD IN Q1, THEN MOVE TO Q3
NO ….....2
Q3. Among all persons listed above (PERSONS LISTED IN Q1), is there anyone who is:
a. Regular staff in public security or the army sector (excluding those under contractors)?
b. Secondary school students residing for study? c. Living here less than 1 year for purposes of:
visiting, summer vacation, holiday, health treatment, business, short-term training, etc.?
d. A foreigner who has not applied for Vietnamese citizenship or Vietnamese living abroad coming back to visit his/her family?
YES NO
1 2
1 2
1 2
1 2
(IF YES, ASK THEIR NAME AND CROSS THEIR NAME IN Q1)
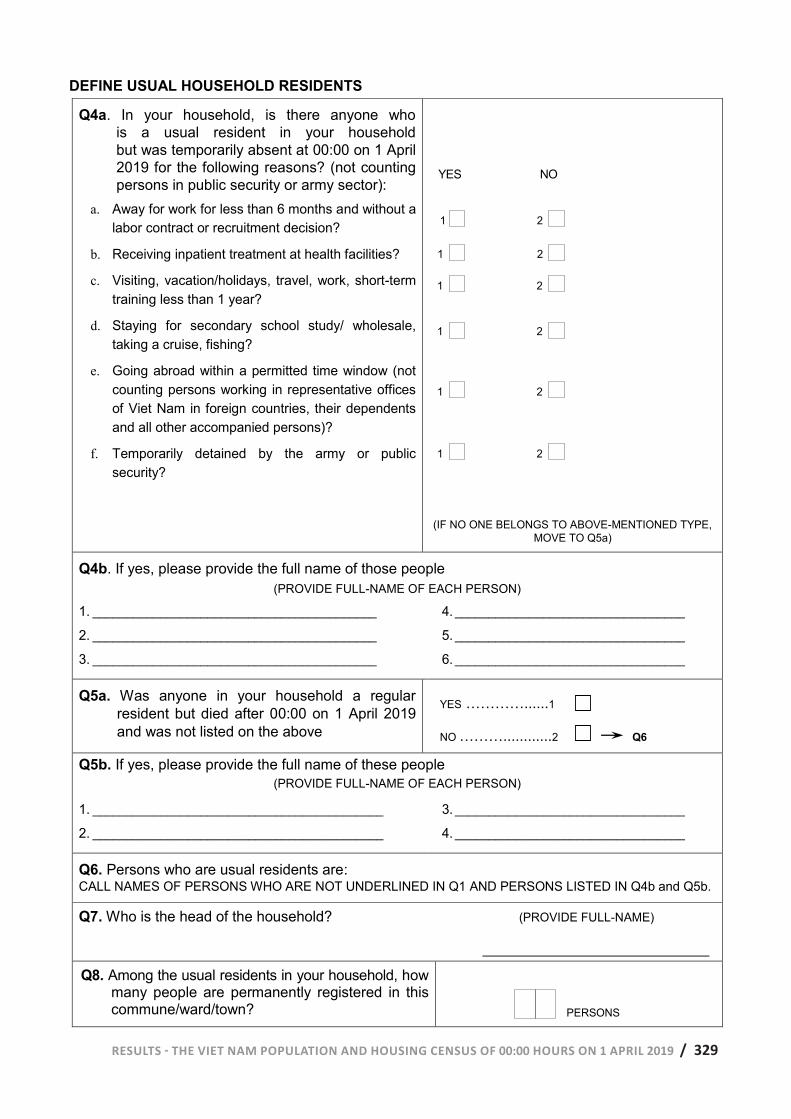
RESULTS - THE VIET NAM POPULATION AND HOUSING CENSUS OF 00:00 HOURS ON 1 APRIL 2019 / 329
DEFINE USUAL HOUSEHOLD RESIDENTS
Q4a. In your household, is there anyone who is a usual resident in your household but was temporarily absent at 00:00 on 1 April 2019 for the following reasons? (not counting persons in public security or army sector):
a. Away for work for less than 6 months and without a labor contract or recruitment decision?
b. Receiving inpatient treatment at health facilities?
c. Visiting, vacation/holidays, travel, work, short-term training less than 1 year?
d. Staying for secondary school study/ wholesale, taking a cruise, fishing?
e. Going abroad within a permitted time window (not counting persons working in representative offices of Viet Nam in foreign countries, their dependents and all other accompanied persons)?
f. Temporarily detained by the army or public security?
YES NO
1 2
1 2
1 2 1 2
1 2
1 2
(IF NO ONE BELONGS TO ABOVE-MENTIONED TYPE, MOVE TO Q5a)
Q4b. If yes, please provide the full name of those people (PROVIDE FULL-NAME OF EACH PERSON)
1. __________________________________________
2. __________________________________________
3. __________________________________________
4. __________________________________
5. __________________________________
6. __________________________________
Q5a. Was anyone in your household a regular resident but died after 00:00 on 1 April 2019 and was not listed on the above
YES …………......1
NO ………............2 Q6
Q5b. If yes, please provide the full name of these people (PROVIDE FULL-NAME OF EACH PERSON)
1. ___________________________________________
2. ___________________________________________
3. __________________________________
4. __________________________________
Q6. Persons who are usual residents are: CALL NAMES OF PERSONS WHO ARE NOT UNDERLINED IN Q1 AND PERSONS LISTED IN Q4b and Q5b.
Q7. Who is the head of the household? (PROVIDE FULL-NAME)
Q8. Among the usual residents in your household, how many people are permanently registered in this commune/ward/town? PERSONS
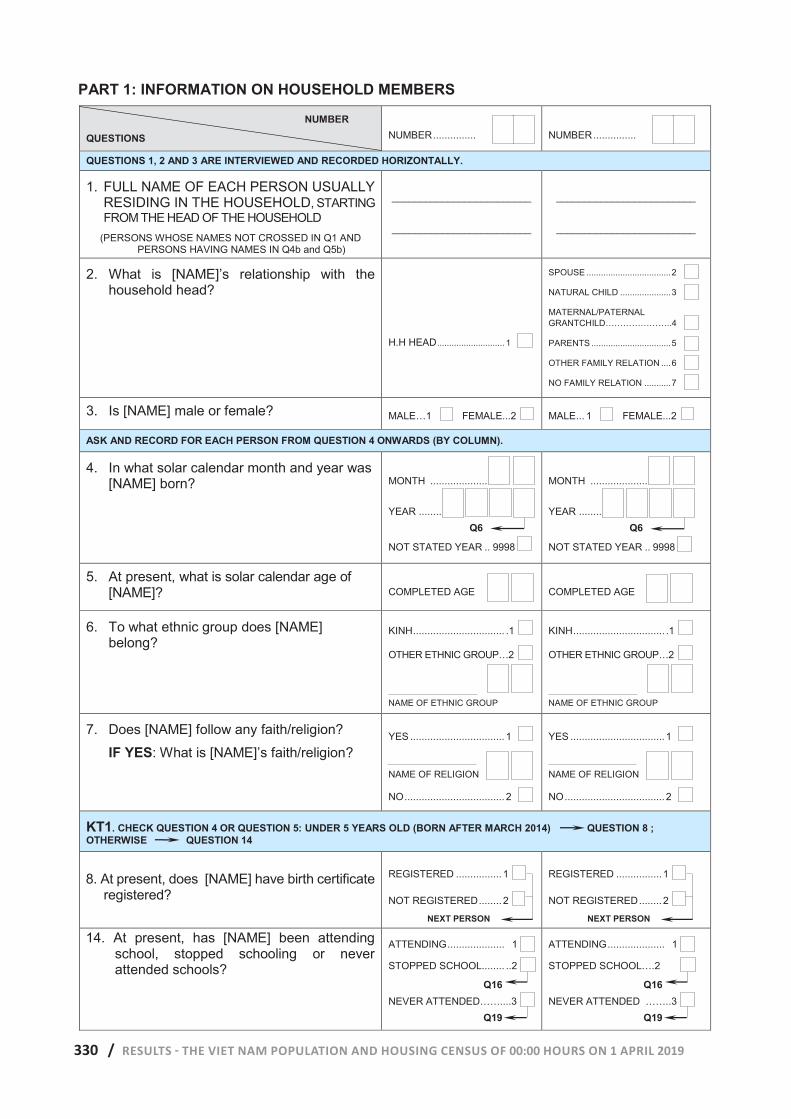
330 / RESULTS - THE VIET NAM POPULATION AND HOUSING CENSUS OF 00:00 HOURS ON 1 APRIL 2019
NUMBER
QUESTIONS
NUMBER ...............
NUMBER ...............
QUESTIONS 1, 2 AND 3 ARE INTERVIEWED AND RECORDED HORIZONTALLY.
1. FULL NAME OF EACH PERSON USUALLY RESIDING IN THE HOUSEHOLD, STARTING FROM THE HEAD OF THE HOUSEHOLD
(PERSONS WHOSE NAMES NOT CROSSED IN Q1 AND PERSONS HAVING NAMES IN Q4b and Q5b)
_________________________
_________________________
_________________________
_________________________
2. What is [NAME]’s relationship with the household head?
H.H HEAD ............................ 1
SPOUSE ................................... 2
NATURAL CHILD ..................... 3
MATERNAL/PATERNAL GRANTCHILD…………………..4
PARENTS ................................. 5
OTHER FAMILY RELATION .... 6
NO FAMILY RELATION ........... 7
3. Is [NAME] male or female? MALE…1 FEMALE...2 MALE ... 1 FEMALE...2
ASK AND RECORD FOR EACH PERSON FROM QUESTION 4 ONWARDS (BY COLUMN).
4. In what solar calendar month and year was [NAME] born?
MONTH ..........................
YEAR ............... Q6
NOT STATED YEAR .. 9998
MONTH ..........................
YEAR ............ Q6
NOT STATED YEAR .. 9998
5. At present, what is solar calendar age of [NAME]? COMPLETED AGE COMPLETED AGE
6. To what ethnic group does [NAME] belong?
KINH ................................ .1
OTHER ETHNIC GROUP…2
NAME OF ETHNIC GROUP
KINH ................................ .1
OTHER ETHNIC GROUP…2
NAME OF ETHNIC GROUP
7. Does [NAME] follow any faith/religion?
IF YES: What is [NAME]’s faith/religion?
YES ................................. 1
NAME OF RELIGION
NO ................................... 2
YES ................................. 1
NAME OF RELIGION
NO ................................... 2
KT1. CHECK QUESTION 4 OR QUESTION 5: UNDER 5 YEARS OLD (BORN AFTER MARCH 2014) QUESTION 8 ; OTHERWISE QUESTION 14
8. At present, does [NAME] have birth certificate registered?
REGISTERED ................ 1
NOT REGISTERED ........ 2
NEXT PERSON
REGISTERED ................ 1
NOT REGISTERED ........ 2
NEXT PERSON
14. At present, has [NAME] been attending school, stopped schooling or never attended schools?
ATTENDING .................... 1
STOPPED SCHOOL........ ..2
Q16 NEVER ATTENDED……....3 Q19
ATTENDING .................... 1
STOPPED SCHOOL….2
Q16 NEVER ATTENDED ……..3 Q19
PART 1: INFORMATION ON HOUSEHOLD MEMBERS
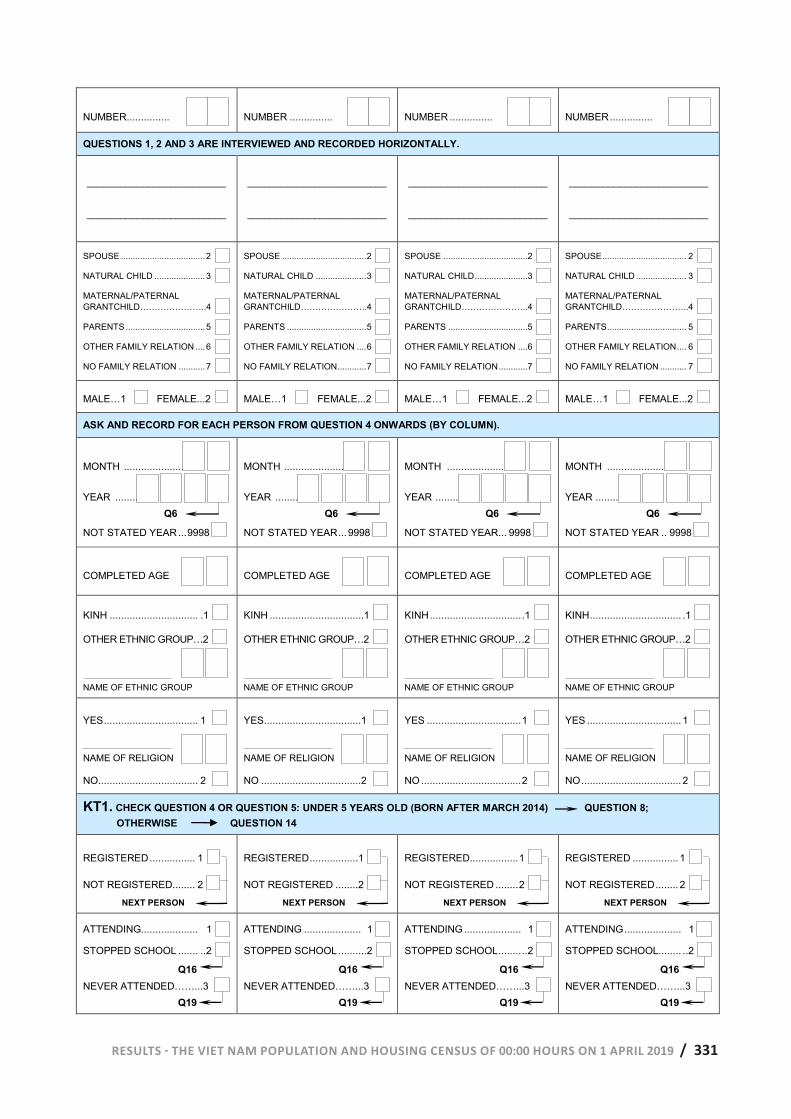
RESULTS - THE VIET NAM POPULATION AND HOUSING CENSUS OF 00:00 HOURS ON 1 APRIL 2019 / 331
NUMBER ...............
NUMBER ...............
NUMBER ...............
NUMBER ...............
QUESTIONS 1, 2 AND 3 ARE INTERVIEWED AND RECORDED HORIZONTALLY.
_________________________
_________________________
_________________________
_________________________
_________________________
_________________________
_________________________
_________________________
SPOUSE ................................... 2
NATURAL CHILD ..................... 3
MATERNAL/PATERNAL GRANTCHILD…………………..4
PARENTS ................................. 5
OTHER FAMILY RELATION .... 6
NO FAMILY RELATION ........... 7
SPOUSE ................................... 2
NATURAL CHILD ..................... 3
MATERNAL/PATERNAL GRANTCHILD…………………..4
PARENTS ................................. 5
OTHER FAMILY RELATION .... 6
NO FAMILY RELATION ............ 7
SPOUSE ...................................2
NATURAL CHILD ......................3
MATERNAL/PATERNAL GRANTCHILD…………………..4
PARENTS .................................5
OTHER FAMILY RELATION ....6
NO FAMILY RELATION ............7
SPOUSE ................................... 2
NATURAL CHILD ..................... 3
MATERNAL/PATERNAL GRANTCHILD…………………..4
PARENTS ................................. 5
OTHER FAMILY RELATION .... 6
NO FAMILY RELATION ........... 7
MALE…1 FEMALE...2 MALE…1 FEMALE...2 MALE…1 FEMALE...2 MALE…1 FEMALE...2
ASK AND RECORD FOR EACH PERSON FROM QUESTION 4 ONWARDS (BY COLUMN).
MONTH ..........................
YEAR ............... Q6
NOT STATED YEAR ... 9998
MONTH ...........................
YEAR ............... Q6
NOT STATED YEAR ... 9998
MONTH ..........................
YEAR ............... Q6
NOT STATED YEAR ... 9998
MONTH ..........................
YEAR ............... Q6
NOT STATED YEAR .. 9998
COMPLETED AGE COMPLETED AGE COMPLETED AGE COMPLETED AGE
KINH ............................... .1
OTHER ETHNIC GROUP…2
NAME OF ETHNIC GROUP
KINH .................................1
OTHER ETHNIC GROUP…2
NAME OF ETHNIC GROUP
KINH ................................ .1
OTHER ETHNIC GROUP…2
NAME OF ETHNIC GROUP
KINH ................................ .1
OTHER ETHNIC GROUP…2
NAME OF ETHNIC GROUP
YES ................................. 1
NAME OF RELIGION
NO................................... 2
YES ..................................1
NAME OF RELIGION
NO ...................................2
YES ................................. 1
NAME OF RELIGION
NO ................................... 2
YES ................................. 1
NAME OF RELIGION
NO ................................... 2
KT1. CHECK QUESTION 4 OR QUESTION 5: UNDER 5 YEARS OLD (BORN AFTER MARCH 2014) QUESTION 8; OTHERWISE QUESTION 14
REGISTERED ................ 1
NOT REGISTERED ........ 2
NEXT PERSON
REGISTERED .................1
NOT REGISTERED ........2
NEXT PERSON
REGISTERED................. 1
NOT REGISTERED ........ 2
NEXT PERSON
REGISTERED ................ 1
NOT REGISTERED ........ 2
NEXT PERSON
ATTENDING.................... 1
STOPPED SCHOOL ....... ..2
Q16 NEVER ATTENDED……...3 Q19
ATTENDING .................... 1
STOPPED SCHOOL ..........2
Q16 NEVER ATTENDED……...3 Q19
ATTENDING .................... 1
STOPPED SCHOOL ........ ..2
Q16 NEVER ATTENDED……...3 Q19
ATTENDING .................... 1
STOPPED SCHOOL........ ..2
Q16 NEVER ATTENDED……...3 Q19
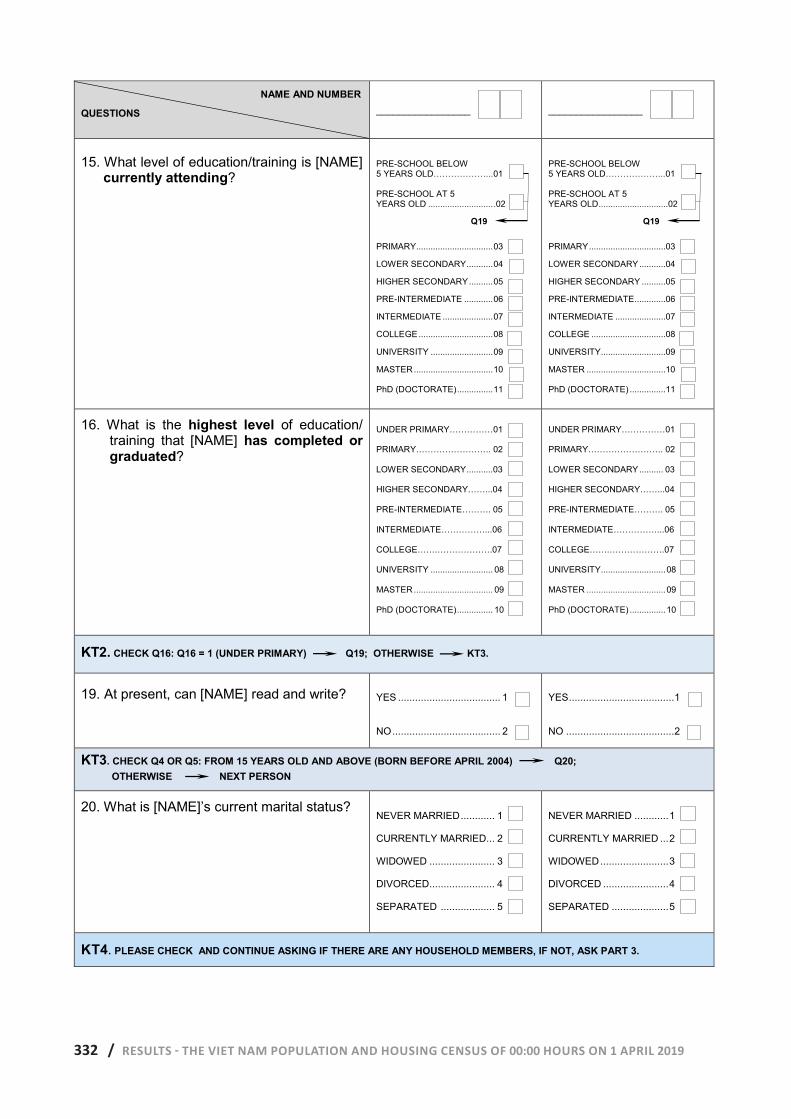
332 / RESULTS - THE VIET NAM POPULATION AND HOUSING CENSUS OF 00:00 HOURS ON 1 APRIL 2019
NAME AND NUMBER
QUESTIONS
_________________
_________________
15. What level of education/training is [NAME] currently attending?
PRE-SCHOOL BELOW 5 YEARS OLD………………...01 PRE-SCHOOL AT 5 YEARS OLD ........................... .02
Q19
PRIMARY................................ 03
LOWER SECONDARY ........... 04
HIGHER SECONDARY .......... 05
PRE-INTERMEDIATE ............ 06
INTERMEDIATE ..................... 07
COLLEGE ............................... 08
UNIVERSITY .......................... 09
MASTER ................................. 10
PhD (DOCTORATE) ............... 11
PRE-SCHOOL BELOW 5 YEARS OLD………………...01 PRE-SCHOOL AT 5 YEARS OLD.............................02
Q19
PRIMARY ................................03
LOWER SECONDARY ...........04
HIGHER SECONDARY ..........05
PRE-INTERMEDIATE.............06
INTERMEDIATE .....................07
COLLEGE ...............................08
UNIVERSITY...........................09
MASTER .................................10
PhD (DOCTORATE) ...............11
16. What is the highest level of education/ training that [NAME] has completed or graduated?
UNDER PRIMARY……………01
PRIMARY…………………….. 02
LOWER SECONDARY ........... 03
HIGHER SECONDARY……...04
PRE-INTERMEDIATE………. 05
INTERMEDIATE……………...06
COLLEGE…….……………….07
UNIVERSITY .......................... 08
MASTER ................................. 09
PhD (DOCTORATE) ............... 10
UNDER PRIMARY……………01
PRIMARY…………………….. 02
LOWER SECONDARY .......... 03
HIGHER SECONDARY……...04
PRE-INTERMEDIATE………. 05
INTERMEDIATE……………...06
COLLEGE…….……………….07
UNIVERSITY........................... 08
MASTER ................................. 09
PhD (DOCTORATE) ............... 10
KT2. CHECK Q16: Q16 = 1 (UNDER PRIMARY) Q19; OTHERWISE KT3.
19. At present, can [NAME] read and write?
YES .................................... 1
NO ...................................... 2
YES ..................................... 1
NO ...................................... 2
KT3. CHECK Q4 OR Q5: FROM 15 YEARS OLD AND ABOVE (BORN BEFORE APRIL 2004) Q20; OTHERWISE NEXT PERSON
20. What is [NAME]’s current marital status? NEVER MARRIED ............ 1
CURRENTLY MARRIED ... 2
WIDOWED ....................... 3
DIVORCED ....................... 4
SEPARATED ................... 5
NEVER MARRIED ............ 1
CURRENTLY MARRIED ... 2
WIDOWED ........................ 3
DIVORCED ....................... 4
SEPARATED .................... 5
KT4. PLEASE CHECK AND CONTINUE ASKING IF THERE ARE ANY HOUSEHOLD MEMBERS, IF NOT, ASK PART 3.
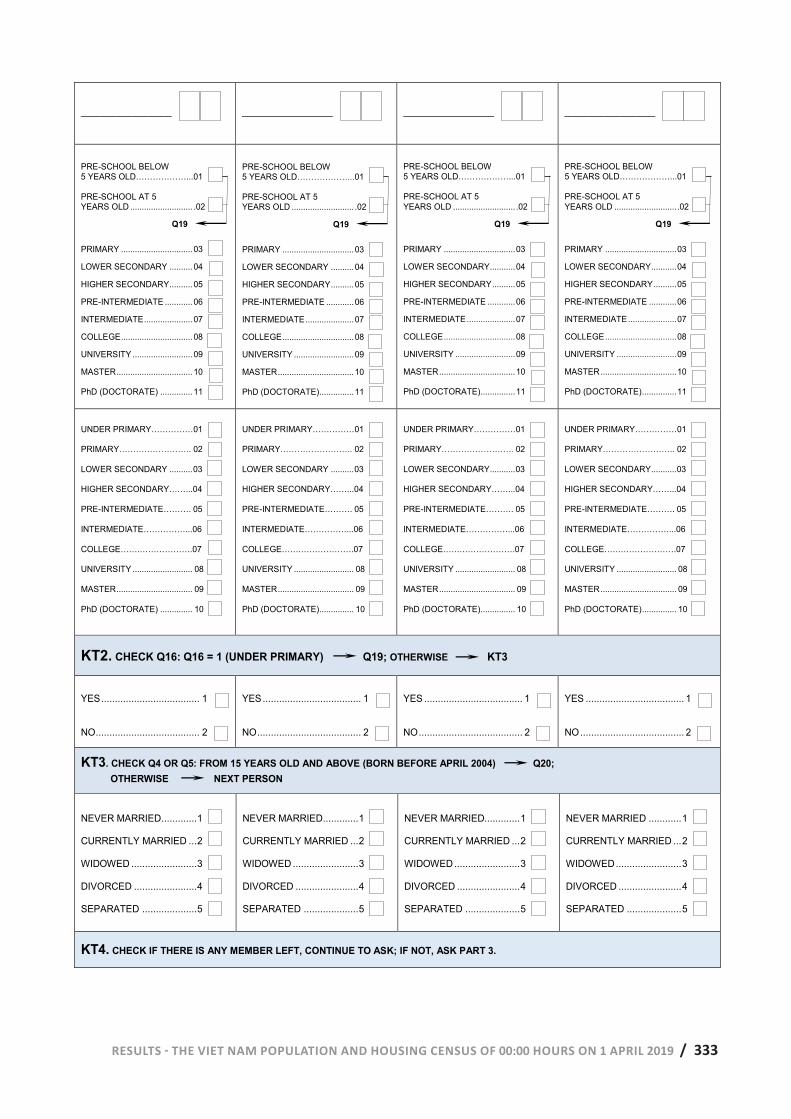
RESULTS - THE VIET NAM POPULATION AND HOUSING CENSUS OF 00:00 HOURS ON 1 APRIL 2019 / 333
_________________
_________________
_________________
_________________
PRE-SCHOOL BELOW 5 YEARS OLD………………...01 PRE-SCHOOL AT 5 YEARS OLD ........................... .02
Q19
PRIMARY ............................... 03
LOWER SECONDARY .......... 04
HIGHER SECONDARY .......... 05
PRE-INTERMEDIATE ............ 06
INTERMEDIATE ..................... 07
COLLEGE ............................... 08
UNIVERSITY .......................... 09
MASTER ................................. 10
PhD (DOCTORATE) .............. 11
PRE-SCHOOL BELOW 5 YEARS OLD………………...01 PRE-SCHOOL AT 5 YEARS OLD ........................... .02
Q19
PRIMARY ............................... 03
LOWER SECONDARY .......... 04
HIGHER SECONDARY .......... 05
PRE-INTERMEDIATE ............ 06
INTERMEDIATE ..................... 07
COLLEGE ............................... 08
UNIVERSITY .......................... 09
MASTER ................................. 10
PhD (DOCTORATE)............... 11
PRE-SCHOOL BELOW 5 YEARS OLD………………...01 PRE-SCHOOL AT 5 YEARS OLD ........................... .02
Q19
PRIMARY ............................... 03
LOWER SECONDARY........... 04
HIGHER SECONDARY .......... 05
PRE-INTERMEDIATE ............ 06
INTERMEDIATE ..................... 07
COLLEGE ............................... 08
UNIVERSITY .......................... 09
MASTER ................................. 10
PhD (DOCTORATE) ............... 11
PRE-SCHOOL BELOW 5 YEARS OLD………………...01 PRE-SCHOOL AT 5 YEARS OLD ........................... .02
Q19
PRIMARY ............................... 03
LOWER SECONDARY ........... 04
HIGHER SECONDARY .......... 05
PRE-INTERMEDIATE ............ 06
INTERMEDIATE ..................... 07
COLLEGE ............................... 08
UNIVERSITY .......................... 09
MASTER ................................. 10
PhD (DOCTORATE) ............... 11
UNDER PRIMARY……………01
PRIMARY…………………….. 02
LOWER SECONDARY .......... 03
HIGHER SECONDARY……...04
PRE-INTERMEDIATE………. 05
INTERMEDIATE……………...06
COLLEGE…….……………….07
UNIVERSITY .......................... 08
MASTER ................................. 09
PhD (DOCTORATE) .............. 10
UNDER PRIMARY……………01
PRIMARY…………………….. 02
LOWER SECONDARY .......... 03
HIGHER SECONDARY……...04
PRE-INTERMEDIATE………. 05
INTERMEDIATE……………...06
COLLEGE…….……………….07
UNIVERSITY .......................... 08
MASTER ................................. 09
PhD (DOCTORATE)............... 10
UNDER PRIMARY……………01
PRIMARY…………………….. 02
LOWER SECONDARY........... 03
HIGHER SECONDARY……...04
PRE-INTERMEDIATE………. 05
INTERMEDIATE……………...06
COLLEGE…….……………….07
UNIVERSITY .......................... 08
MASTER ................................. 09
PhD (DOCTORATE) ............... 10
UNDER PRIMARY……………01
PRIMARY…………………….. 02
LOWER SECONDARY ........... 03
HIGHER SECONDARY……...04
PRE-INTERMEDIATE………. 05
INTERMEDIATE……………...06
COLLEGE…….……………….07
UNIVERSITY .......................... 08
MASTER ................................. 09
PhD (DOCTORATE) ............... 10
KT2. CHECK Q16: Q16 = 1 (UNDER PRIMARY) Q19; OTHERWISE KT3
YES .................................... 1
NO ...................................... 2
YES .................................... 1
NO ...................................... 2
YES .................................... 1
NO ...................................... 2
YES .................................... 1
NO ...................................... 2
KT3. CHECK Q4 OR Q5: FROM 15 YEARS OLD AND ABOVE (BORN BEFORE APRIL 2004) Q20; OTHERWISE NEXT PERSON
NEVER MARRIED ............. 1
CURRENTLY MARRIED ... 2
WIDOWED ........................ 3
DIVORCED ....................... 4
SEPARATED .................... 5
NEVER MARRIED ............. 1
CURRENTLY MARRIED ... 2
WIDOWED ........................ 3
DIVORCED ....................... 4
SEPARATED .................... 5
NEVER MARRIED............. 1
CURRENTLY MARRIED ... 2
WIDOWED ........................ 3
DIVORCED ....................... 4
SEPARATED .................... 5
NEVER MARRIED ............ 1
CURRENTLY MARRIED ... 2
WIDOWED ........................ 3
DIVORCED ....................... 4
SEPARATED .................... 5
KT4. CHECK IF THERE IS ANY MEMBER LEFT, CONTINUE TO ASK; IF NOT, ASK PART 3.
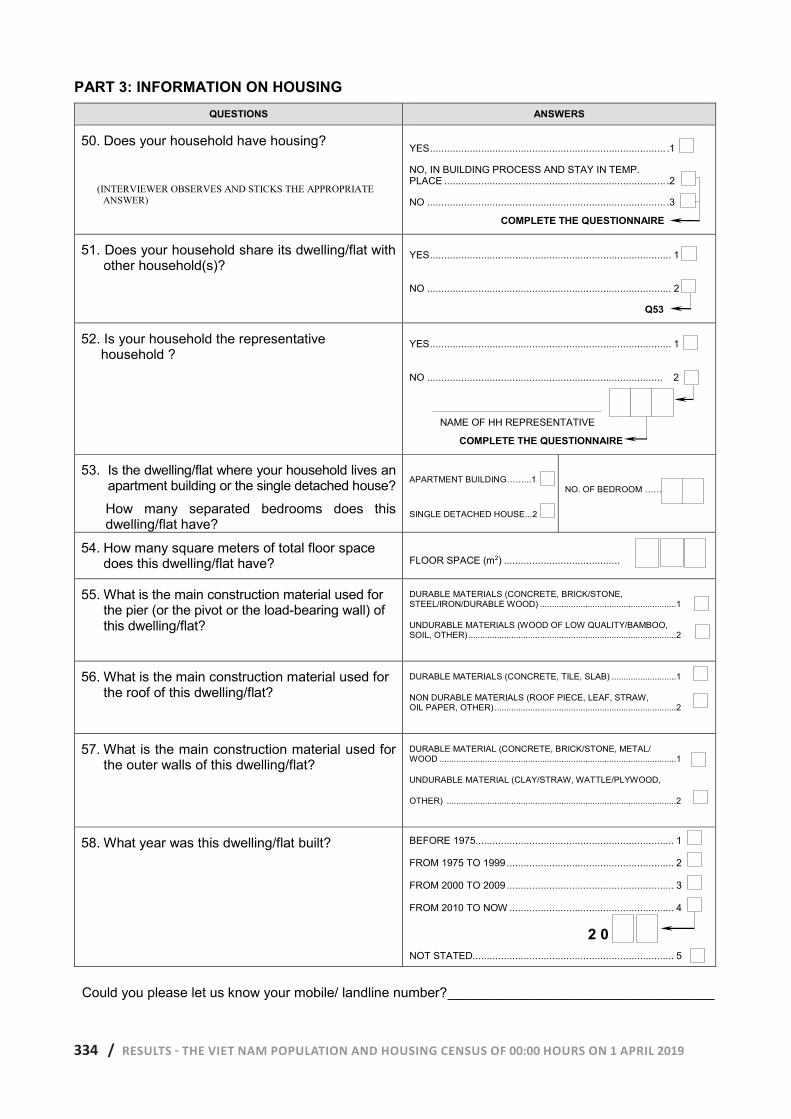
334 / RESULTS - THE VIET NAM POPULATION AND HOUSING CENSUS OF 00:00 HOURS ON 1 APRIL 2019
PART 3: INFORMATION ON HOUSING QUESTIONS ANSWERS
50. Does your household have housing?
(INTERVIEWER OBSERVES AND STICKS THE APPROPRIATE ANSWER)
YES ................................................................................... .1
NO, IN BUILDING PROCESS AND STAY IN TEMP. PLACE .............................................................................. .2
NO .................................................................................... .3
COMPLETE THE QUESTIONNAIRE
51. Does your household share its dwelling/flat with other household(s)?
YES ..................................................................................... 1
NO ...................................................................................... 2
Q53
52. Is your household the representative household ?
YES ..................................................................................... 1
NO ................................................................................... 2
NAME OF HH REPRESENTATIVE
COMPLETE THE QUESTIONNAIRE
53. Is the dwelling/flat where your household lives an apartment building or the single detached house?
How many separated bedrooms does this dwelling/flat have?
APARTMENT BUILDING……...1
SINGLE DETACHED HOUSE...2
NO. OF BEDROOM ………...
54. How many square meters of total floor space does this dwelling/flat have? FLOOR SPACE (m2) .........................................
55. What is the main construction material used for the pier (or the pivot or the load-bearing wall) of this dwelling/flat?
DURABLE MATERIALS (CONCRETE, BRICK/STONE, STEEL/IRON/DURABLE WOOD) ......................................................... 1
UNDURABLE MATERIALS (WOOD OF LOW QUALITY/BAMBOO, SOIL, OTHER) ....................................................................................... 2
56. What is the main construction material used for the roof of this dwelling/flat?
DURABLE MATERIALS (CONCRETE, TILE, SLAB) ........................... 1
NON DURABLE MATERIALS (ROOF PIECE, LEAF, STRAW, OIL PAPER, OTHER) ............................................................................ 2
57. What is the main construction material used for the outer walls of this dwelling/flat?
DURABLE MATERIAL (CONCRETE, BRICK/STONE, METAL/ WOOD ................................................................................................... 1
UNDURABLE MATERIAL (CLAY/STRAW, WATTLE/PLYWOOD,
OTHER) ................................................................................................ 2
58. What year was this dwelling/flat built?
BEFORE 1975...................................................................... 1
FROM 1975 TO 1999 ........................................................... 2
FROM 2000 TO 2009 ........................................................... 3
FROM 2010 TO NOW .......................................................... 4
2 0 NOT STATED....................................................................... 5
Could you please let us know your mobile/ landline number? ___________________________________
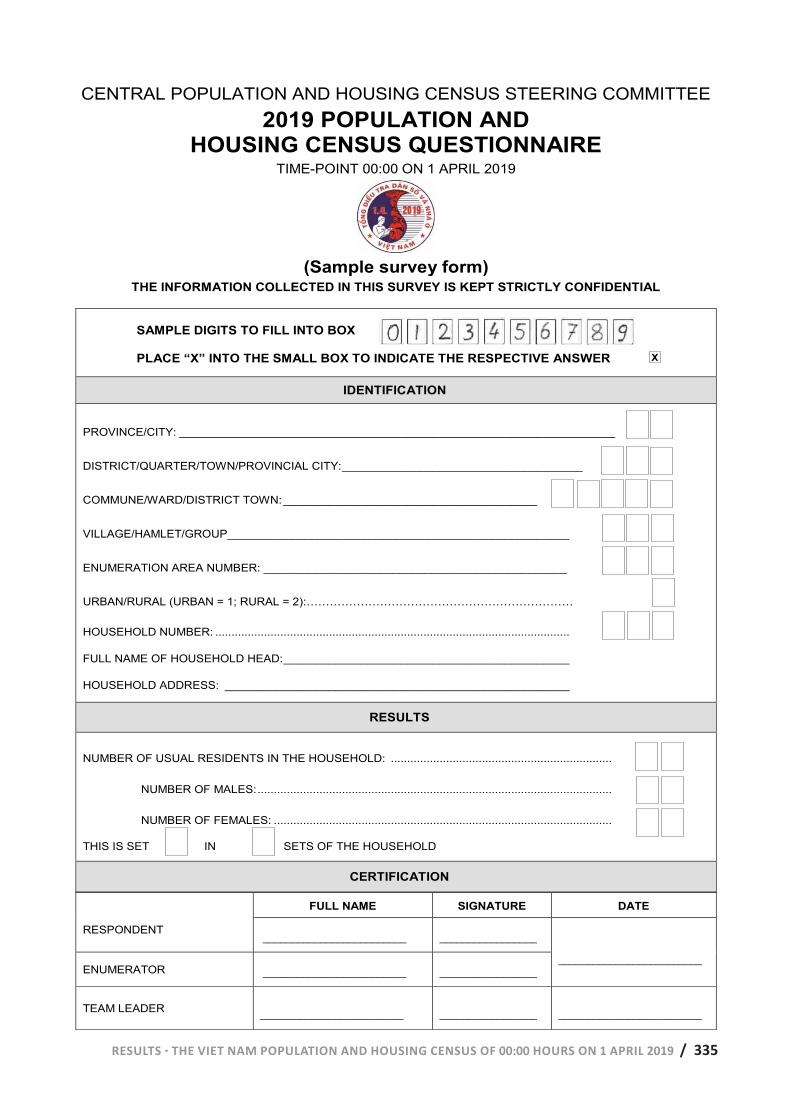
RESULTS - THE VIET NAM POPULATION AND HOUSING CENSUS OF 00:00 HOURS ON 1 APRIL 2019 / 335
CENTRAL POPULATION AND HOUSING CENSUS STEERING COMMITTEE
2019 POPULATION AND HOUSING CENSUS QUESTIONNAIRE
TIME-POINT 00:00 ON 1 APRIL 2019
(Sample survey form)
THE INFORMATION COLLECTED IN THIS SURVEY IS KEPT STRICTLY CONFIDENTIAL
SAMPLE DIGITS TO FILL INTO BOX PLACE “X” INTO THE SMALL BOX TO INDICATE THE RESPECTIVE ANSWER
IDENTIFICATION
PROVINCE/CITY: ___________________________________________________________________
DISTRICT/QUARTER/TOWN/PROVINCIAL CITY: _____________________________________
COMMUNE/WARD/DISTRICT TOWN: _______________________________________
VILLAGE/HAMLET/GROUP_____________________________________________________
ENUMERATION AREA NUMBER: _______________________________________________
URBAN/RURAL (URBAN = 1; RURAL = 2):……………………………………………………………
HOUSEHOLD NUMBER: .............................................................................................................
FULL NAME OF HOUSEHOLD HEAD: ____________________________________________
HOUSEHOLD ADDRESS: _____________________________________________________
RESULTS
NUMBER OF USUAL RESIDENTS IN THE HOUSEHOLD: ....................................................................
NUMBER OF MALES: .............................................................................................................
NUMBER OF FEMALES: ........................................................................................................
THIS IS SET IN SETS OF THE HOUSEHOLD
CERTIFICATION
RESPONDENT
FULL NAME SIGNATURE DATE
_________________________ _________________
_________________________ ENUMERATOR _________________________ _________________
TEAM LEADER _________________________ _________________ _________________________
X
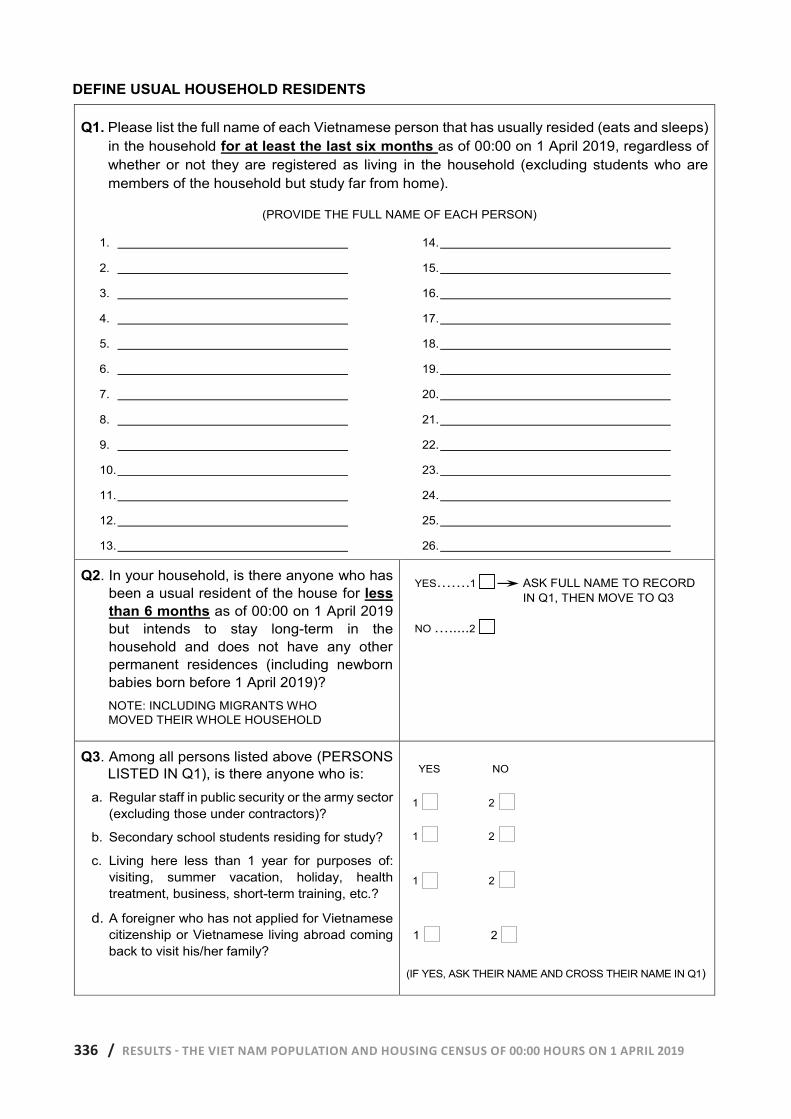
336 / RESULTS - THE VIET NAM POPULATION AND HOUSING CENSUS OF 00:00 HOURS ON 1 APRIL 2019
DEFINE USUAL HOUSEHOLD RESIDENTS
Q1. Please list the full name of each Vietnamese person that has usually resided (eats and sleeps) in the household for at least the last six months as of 00:00 on 1 April 2019, regardless of whether or not they are registered as living in the household (excluding students who are members of the household but study far from home).
(PROVIDE THE FULL NAME OF EACH PERSON)
1.
2.
3.
4.
5.
6.
7.
8.
9.
10.
11.
12.
13.
14.
15.
16.
17.
18.
19.
20.
21.
22.
23.
24.
25.
26.
Q2. In your household, is there anyone who has been a usual resident of the house for less than 6 months as of 00:00 on 1 April 2019 but intends to stay long-term in the household and does not have any other permanent residences (including newborn babies born before 1 April 2019)? NOTE: INCLUDING MIGRANTS WHO MOVED THEIR WHOLE HOUSEHOLD
YES…….1 ASK FULL NAME TO RECORD IN Q1, THEN MOVE TO Q3
NO ….....2
Q3. Among all persons listed above (PERSONS LISTED IN Q1), is there anyone who is:
a. Regular staff in public security or the army sector (excluding those under contractors)?
b. Secondary school students residing for study?
c. Living here less than 1 year for purposes of: visiting, summer vacation, holiday, health treatment, business, short-term training, etc.?
d. A foreigner who has not applied for Vietnamese citizenship or Vietnamese living abroad coming back to visit his/her family?
YES NO
1 2
1 2
1 2
1 2
(IF YES, ASK THEIR NAME AND CROSS THEIR NAME IN Q1)
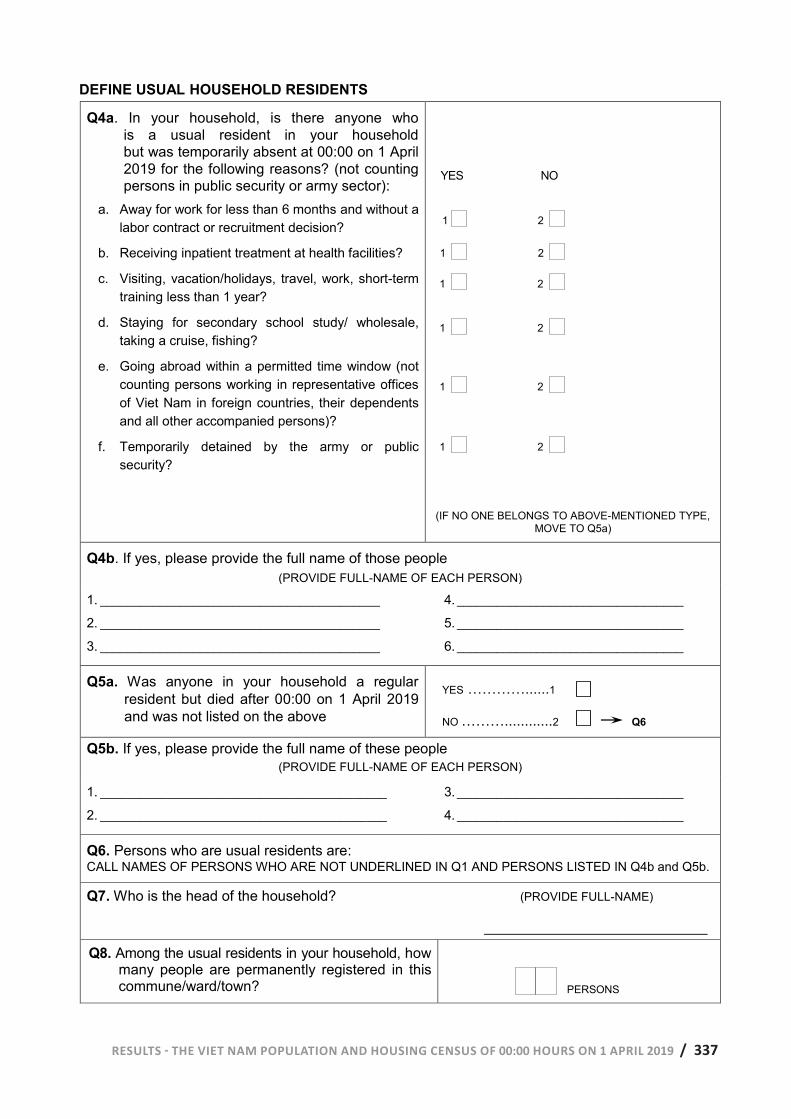
RESULTS - THE VIET NAM POPULATION AND HOUSING CENSUS OF 00:00 HOURS ON 1 APRIL 2019 / 337
DEFINE USUAL HOUSEHOLD RESIDENTS
Q4a. In your household, is there anyone who is a usual resident in your household but was temporarily absent at 00:00 on 1 April 2019 for the following reasons? (not counting persons in public security or army sector):
a. Away for work for less than 6 months and without a labor contract or recruitment decision?
b. Receiving inpatient treatment at health facilities?
c. Visiting, vacation/holidays, travel, work, short-term training less than 1 year?
d. Staying for secondary school study/ wholesale, taking a cruise, fishing?
e. Going abroad within a permitted time window (not counting persons working in representative offices of Viet Nam in foreign countries, their dependents and all other accompanied persons)?
f. Temporarily detained by the army or public security?
YES NO
1 2
1 2
1 2 1 2
1 2
1 2
(IF NO ONE BELONGS TO ABOVE-MENTIONED TYPE, MOVE TO Q5a)
Q4b. If yes, please provide the full name of those people (PROVIDE FULL-NAME OF EACH PERSON)
1. __________________________________________
2. __________________________________________
3. __________________________________________
4. __________________________________
5. __________________________________
6. __________________________________
Q5a. Was anyone in your household a regular resident but died after 00:00 on 1 April 2019 and was not listed on the above
YES …………......1
NO ………............2 Q6
Q5b. If yes, please provide the full name of these people (PROVIDE FULL-NAME OF EACH PERSON)
1. ___________________________________________
2. ___________________________________________
3. __________________________________
4. __________________________________
Q6. Persons who are usual residents are: CALL NAMES OF PERSONS WHO ARE NOT UNDERLINED IN Q1 AND PERSONS LISTED IN Q4b and Q5b.
Q7. Who is the head of the household? (PROVIDE FULL-NAME)
Q8. Among the usual residents in your household, how many people are permanently registered in this commune/ward/town? PERSONS
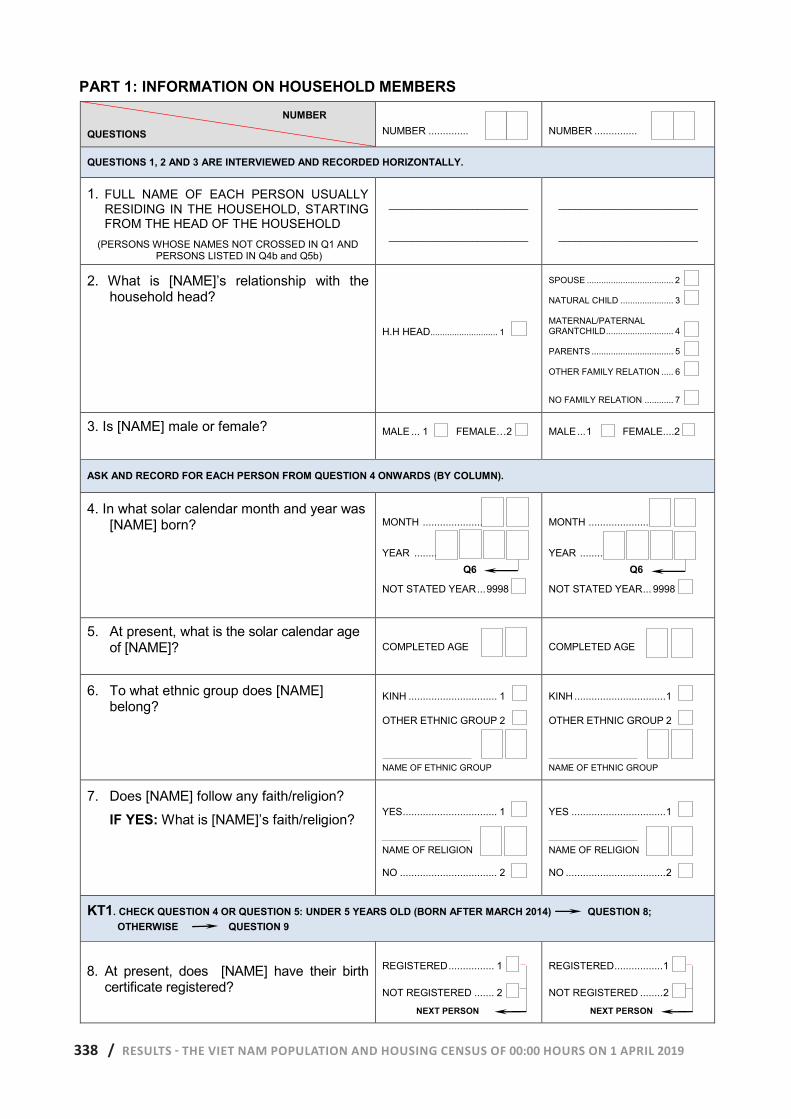
338 / RESULTS - THE VIET NAM POPULATION AND HOUSING CENSUS OF 00:00 HOURS ON 1 APRIL 2019
PART 1: INFORMATION ON HOUSEHOLD MEMBERS
NUMBER
QUESTIONS
NUMBER ..............
NUMBER ...............
QUESTIONS 1, 2 AND 3 ARE INTERVIEWED AND RECORDED HORIZONTALLY.
1. FULL NAME OF EACH PERSON USUALLY RESIDING IN THE HOUSEHOLD, STARTING FROM THE HEAD OF THE HOUSEHOLD
(PERSONS WHOSE NAMES NOT CROSSED IN Q1 AND PERSONS LISTED IN Q4b and Q5b)
_________________________
_________________________
_________________________
_________________________
2. What is [NAME]’s relationship with the household head?
H.H HEAD............................ 1
SPOUSE .................................... 2
NATURAL CHILD ...................... 3
MATERNAL/PATERNAL GRANTCHILD ............................ 4
PARENTS .................................. 5
OTHER FAMILY RELATION ..... 6
NO FAMILY RELATION ............ 7
3. Is [NAME] male or female? MALE ... 1 FEMALE…2 MALE ... 1 FEMALE ....2
ASK AND RECORD FOR EACH PERSON FROM QUESTION 4 ONWARDS (BY COLUMN).
4. In what solar calendar month and year was [NAME] born?
MONTH ...........................
YEAR ............... Q6
NOT STATED YEAR ... 9998
MONTH ...........................
YEAR ............... Q6
NOT STATED YEAR ... 9998
5. At present, what is the solar calendar age of [NAME]? COMPLETED AGE COMPLETED AGE
6. To what ethnic group does [NAME] belong?
KINH ............................... 1
OTHER ETHNIC GROUP 2
NAME OF ETHNIC GROUP
KINH ................................ 1
OTHER ETHNIC GROUP 2
NAME OF ETHNIC GROUP
7. Does [NAME] follow any faith/religion?
IF YES: What is [NAME]’s faith/religion?
YES ................................. 1
NAME OF RELIGION
NO .................................. 2
YES ................................. 1
NAME OF RELIGION
NO ................................... 2
KT1. CHECK QUESTION 4 OR QUESTION 5: UNDER 5 YEARS OLD (BORN AFTER MARCH 2014) QUESTION 8; OTHERWISE QUESTION 9
8. At present, does [NAME] have their birth certificate registered?
REGISTERED ................ 1
NOT REGISTERED ....... 2
NEXT PERSON
REGISTERED ................. 1
NOT REGISTERED ........ 2
NEXT PERSON
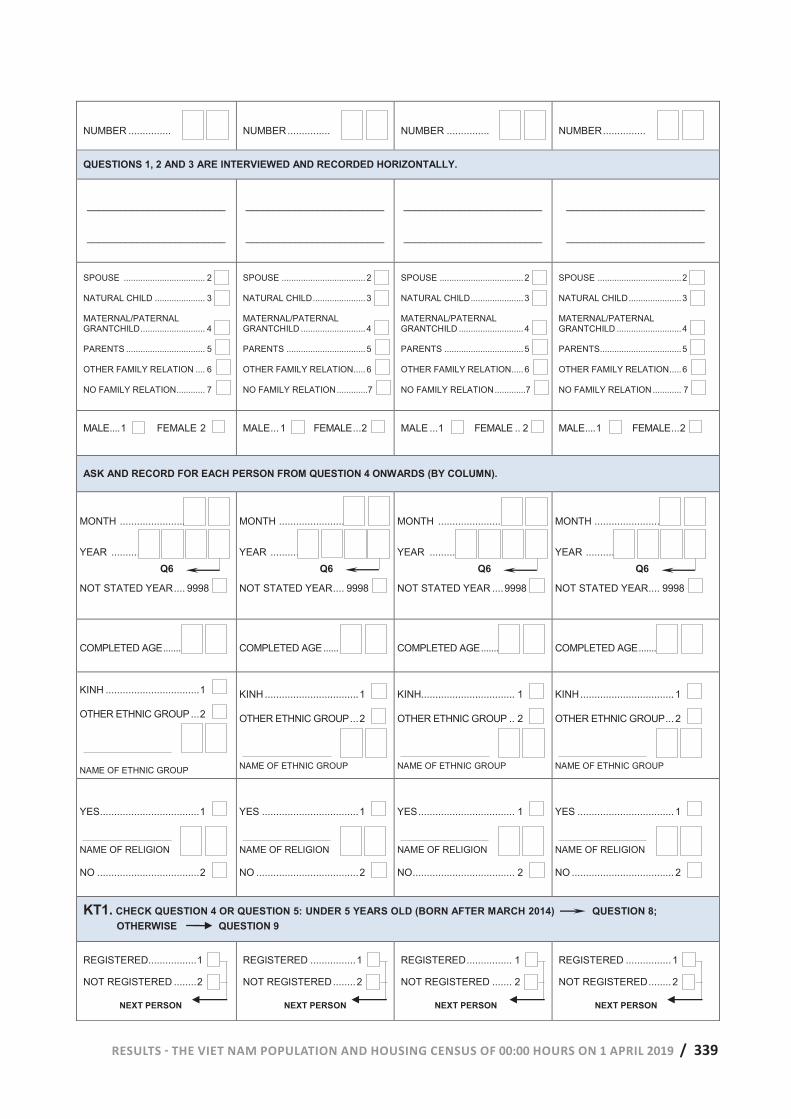
RESULTS - THE VIET NAM POPULATION AND HOUSING CENSUS OF 00:00 HOURS ON 1 APRIL 2019 / 339
NUMBER ...............
NUMBER ...............
NUMBER ...............
NUMBER ...............
QUESTIONS 1, 2 AND 3 ARE INTERVIEWED AND RECORDED HORIZONTALLY.
_________________________
_________________________
_________________________
_________________________
_________________________
_________________________
_________________________
_________________________
SPOUSE .................................. 2
NATURAL CHILD ..................... 3
MATERNAL/PATERNAL GRANTCHILD ........................... 4
PARENTS ................................. 5
OTHER FAMILY RELATION .... 6
NO FAMILY RELATION............ 7
SPOUSE ................................... 2
NATURAL CHILD ...................... 3
MATERNAL/PATERNAL GRANTCHILD ........................... 4
PARENTS ................................. 5
OTHER FAMILY RELATION..... 6
NO FAMILY RELATION .............7
SPOUSE ................................... 2
NATURAL CHILD ...................... 3
MATERNAL/PATERNAL GRANTCHILD ........................... 4
PARENTS ................................. 5
OTHER FAMILY RELATION..... 6
NO FAMILY RELATION .............7
SPOUSE ................................... 2
NATURAL CHILD ...................... 3
MATERNAL/PATERNAL GRANTCHILD ........................... 4
PARENTS.................................. 5
OTHER FAMILY RELATION ..... 6
NO FAMILY RELATION ............ 7
MALE .... 1 FEMALE 2 MALE ... 1 FEMALE ... 2 MALE ... 1 FEMALE .. 2 MALE .... 1 FEMALE ... 2
ASK AND RECORD FOR EACH PERSON FROM QUESTION 4 ONWARDS (BY COLUMN).
MONTH ............................
YEAR ............... Q6
NOT STATED YEAR .... 9998
MONTH ............................
YEAR ............... Q6
NOT STATED YEAR .... 9998
MONTH ............................
YEAR ............... Q6
NOT STATED YEAR .... 9998
MONTH ............................
YEAR ................ Q6
NOT STATED YEAR .... 9998
COMPLETED AGE ....... COMPLETED AGE ...... COMPLETED AGE ....... COMPLETED AGE .......
KINH ................................. 1
OTHER ETHNIC GROUP ... 2
NAME OF ETHNIC GROUP
KINH ................................. 1
OTHER ETHNIC GROUP ... 2
NAME OF ETHNIC GROUP
KINH................................. 1
OTHER ETHNIC GROUP .. 2
NAME OF ETHNIC GROUP
KINH ................................. 1
OTHER ETHNIC GROUP ... 2
NAME OF ETHNIC GROUP
YES ................................... 1
NAME OF RELIGION
NO .................................... 2
YES .................................. 1
NAME OF RELIGION
NO .................................... 2
YES .................................. 1
NAME OF RELIGION
NO .................................... 2
YES .................................. 1
NAME OF RELIGION
NO .................................... 2
KT1. CHECK QUESTION 4 OR QUESTION 5: UNDER 5 YEARS OLD (BORN AFTER MARCH 2014) QUESTION 8; OTHERWISE QUESTION 9
REGISTERED ................. 1
NOT REGISTERED ........ 2
NEXT PERSON
REGISTERED ................ 1
NOT REGISTERED ........ 2
NEXT PERSON
REGISTERED ................ 1
NOT REGISTERED ....... 2
NEXT PERSON
REGISTERED ................ 1
NOT REGISTERED ........ 2
NEXT PERSON
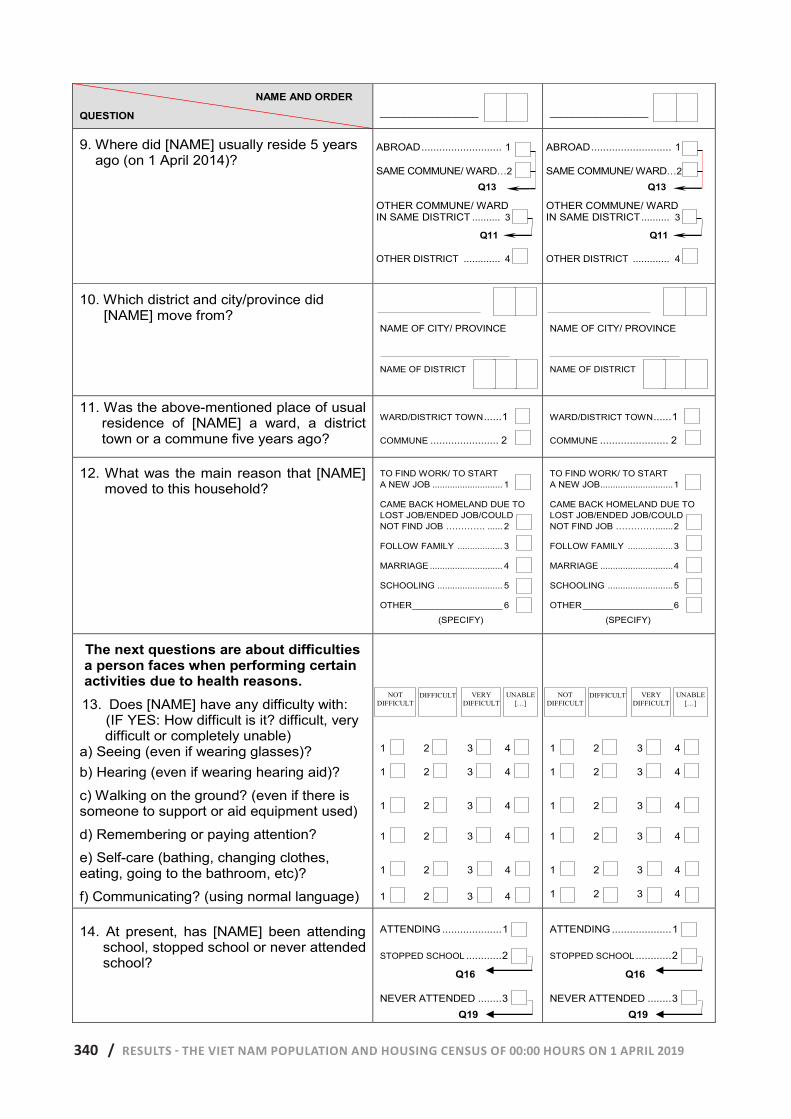
340 / RESULTS - THE VIET NAM POPULATION AND HOUSING CENSUS OF 00:00 HOURS ON 1 APRIL 2019
NAME AND ORDER
QUESTION
_________________
_________________
9. Where did [NAME] usually reside 5 years ago (on 1 April 2014)?
ABROAD ........................... 1
SAME COMMUNE/ WARD…2
Q13
OTHER COMMUNE/ WARD IN SAME DISTRICT .......... 3
Q11
OTHER DISTRICT ............. 4
ABROAD ........................... 1
SAME COMMUNE/ WARD…2
Q13
OTHER COMMUNE/ WARD IN SAME DISTRICT .......... 3
Q11
OTHER DISTRICT ............. 4
10. Which district and city/province did [NAME] move from?
NAME OF CITY/ PROVINCE
NAME OF DISTRICT
NAME OF CITY/ PROVINCE
NAME OF DISTRICT
11. Was the above-mentioned place of usual residence of [NAME] a ward, a district town or a commune five years ago?
WARD/DISTRICT TOWN ...... 1
COMMUNE ....................... 2
WARD/DISTRICT TOWN ...... 1
COMMUNE ....................... 2
12. What was the main reason that [NAME] moved to this household?
TO FIND WORK/ TO START A NEW JOB ............................ 1
CAME BACK HOMELAND DUE TO LOST JOB/ENDED JOB/COULD NOT FIND JOB …………. ...... 2
FOLLOW FAMILY .................. 3
MARRIAGE ............................. 4
SCHOOLING .......................... 5
OTHER __________________ 6
(SPECIFY)
TO FIND WORK/ TO START A NEW JOB ............................. 1
CAME BACK HOMELAND DUE TO LOST JOB/ENDED JOB/COULD NOT FIND JOB …………. ....... 2
FOLLOW FAMILY .................. 3
MARRIAGE ............................. 4
SCHOOLING .......................... 5
OTHER __________________ 6
(SPECIFY)
The next questions are about difficulties a person faces when performing certain activities due to health reasons. 13. Does [NAME] have any difficulty with: (IF YES: How difficult is it? difficult, very
difficult or completely unable) a) Seeing (even if wearing glasses)? b) Hearing (even if wearing hearing aid)?
c) Walking on the ground? (even if there is someone to support or aid equipment used)
d) Remembering or paying attention?
e) Self-care (bathing, changing clothes, eating, going to the bathroom, etc)?
f) Communicating? (using normal language)
1 2 3 4
1 2 3 4
1 2 3 4
1 2 3 4
1 2 3 4
1 2 3 4
1 2 3 4
1 2 3 4
1 2 3 4
1 2 3 4
1 2 3 4
1 2 3 4
14. At present, has [NAME] been attending school, stopped school or never attended school?
ATTENDING .................... 1
STOPPED SCHOOL ............ 2
Q16
NEVER ATTENDED ........ 3 Q19
ATTENDING .................... 1
STOPPED SCHOOL ............ 2
Q16
NEVER ATTENDED ........ 3 Q19
NOT DIFFICULT
DIFFICULT VERY DIFFICULT
UNABLE […]
NOT DIFFICULT
DIFFICULT VERY DIFFICULT
UNABLE […]
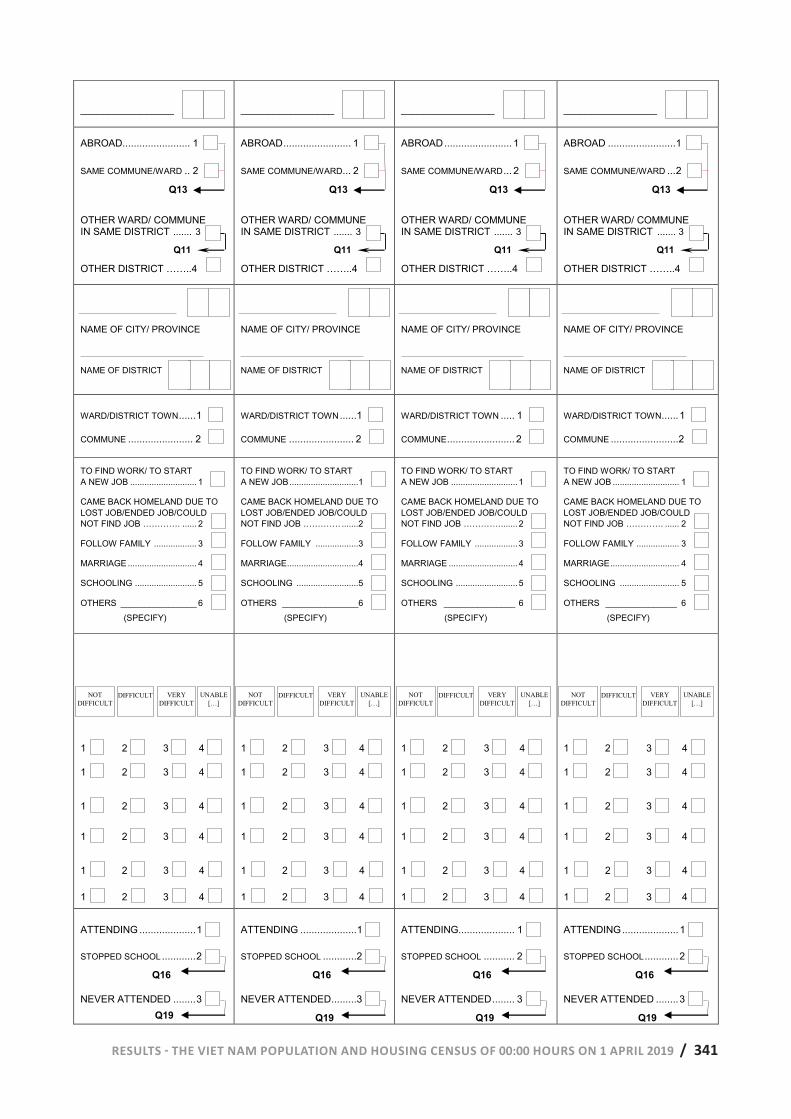
RESULTS - THE VIET NAM POPULATION AND HOUSING CENSUS OF 00:00 HOURS ON 1 APRIL 2019 / 341
_________________
_________________
_________________
_________________
ABROAD........................ 1
SAME COMMUNE/WARD .. 2
Q13
OTHER WARD/ COMMUNE IN SAME DISTRICT ....... 3
Q11
OTHER DISTRICT ……..4
ABROAD ........................ 1
SAME COMMUNE/WARD ... 2
Q13
OTHER WARD/ COMMUNE IN SAME DISTRICT ....... 3
Q11
OTHER DISTRICT ……..4
ABROAD ........................ 1
SAME COMMUNE/WARD ... 2
Q13
OTHER WARD/ COMMUNE IN SAME DISTRICT ....... 3
Q11
OTHER DISTRICT ……..4
ABROAD ........................ 1
SAME COMMUNE/WARD ... 2
Q13
OTHER WARD/ COMMUNE IN SAME DISTRICT ....... 3
Q11
OTHER DISTRICT ……..4
NAME OF CITY/ PROVINCE
NAME OF DISTRICT
NAME OF CITY/ PROVINCE
NAME OF DISTRICT
NAME OF CITY/ PROVINCE
NAME OF DISTRICT
NAME OF CITY/ PROVINCE
NAME OF DISTRICT
WARD/DISTRICT TOWN ...... 1
COMMUNE ....................... 2
WARD/DISTRICT TOWN ......1
COMMUNE ....................... 2
WARD/DISTRICT TOWN ..... 1
COMMUNE ........................ 2
WARD/DISTRICT TOWN ...... 1
COMMUNE ........................ 2
TO FIND WORK/ TO START A NEW JOB ............................ 1
CAME BACK HOMELAND DUE TO LOST JOB/ENDED JOB/COULD NOT FIND JOB …………. ...... 2
FOLLOW FAMILY .................. 3
MARRIAGE ............................. 4
SCHOOLING .......................... 5
OTHERS ________________ 6
(SPECIFY)
TO FIND WORK/ TO START A NEW JOB ............................. 1
CAME BACK HOMELAND DUE TO LOST JOB/ENDED JOB/COULD NOT FIND JOB …………. ....... 2
FOLLOW FAMILY .................. 3
MARRIAGE.............................. 4
SCHOOLING .......................... 5
OTHERS ________________ 6
(SPECIFY)
TO FIND WORK/ TO START A NEW JOB ............................ 1
CAME BACK HOMELAND DUE TO LOST JOB/ENDED JOB/COULD NOT FIND JOB …………. ....... 2
FOLLOW FAMILY .................. 3
MARRIAGE ............................. 4
SCHOOLING .......................... 5
OTHERS _______________ 6
(SPECIFY)
TO FIND WORK/ TO START A NEW JOB ............................ 1
CAME BACK HOMELAND DUE TO LOST JOB/ENDED JOB/COULD NOT FIND JOB …………. ...... 2
FOLLOW FAMILY .................. 3
MARRIAGE ............................. 4
SCHOOLING ......................... 5
OTHERS _______________ 6
(SPECIFY)
1 2 3 4
1 2 3 4
1 2 3 4
1 2 3 4
1 2 3 4
1 2 3 4
1 2 3 4
1 2 3 4
1 2 3 4
1 2 3 4
1 2 3 4
1 2 3 4
1 2 3 4
1 2 3 4
1 2 3 4
1 2 3 4
1 2 3 4
1 2 3 4
1 2 3 4
1 2 3 4
1 2 3 4
1 2 3 4
1 2 3 4
1 2 3 4
ATTENDING .................... 1
STOPPED SCHOOL ............ 2
Q16
NEVER ATTENDED ........ 3 Q19
ATTENDING .................... 1
STOPPED SCHOOL ............2
Q16
NEVER ATTENDED .........3
Q19
ATTENDING.................... 1
STOPPED SCHOOL ........... 2
Q16
NEVER ATTENDED ........ 3
Q19
ATTENDING .................... 1
STOPPED SCHOOL ............ 2
Q16
NEVER ATTENDED ........ 3
Q19
NOT DIFFICULT
DIFFICULT VERY DIFFICULT
UNABLE […]
NOT DIFFICULT
DIFFICULT VERY DIFFICULT
UNABLE […]
NOT DIFFICULT
DIFFICULT VERY DIFFICULT
UNABLE […]
NOT DIFFICULT
DIFFICULT VERY DIFFICULT
UNABLE […]
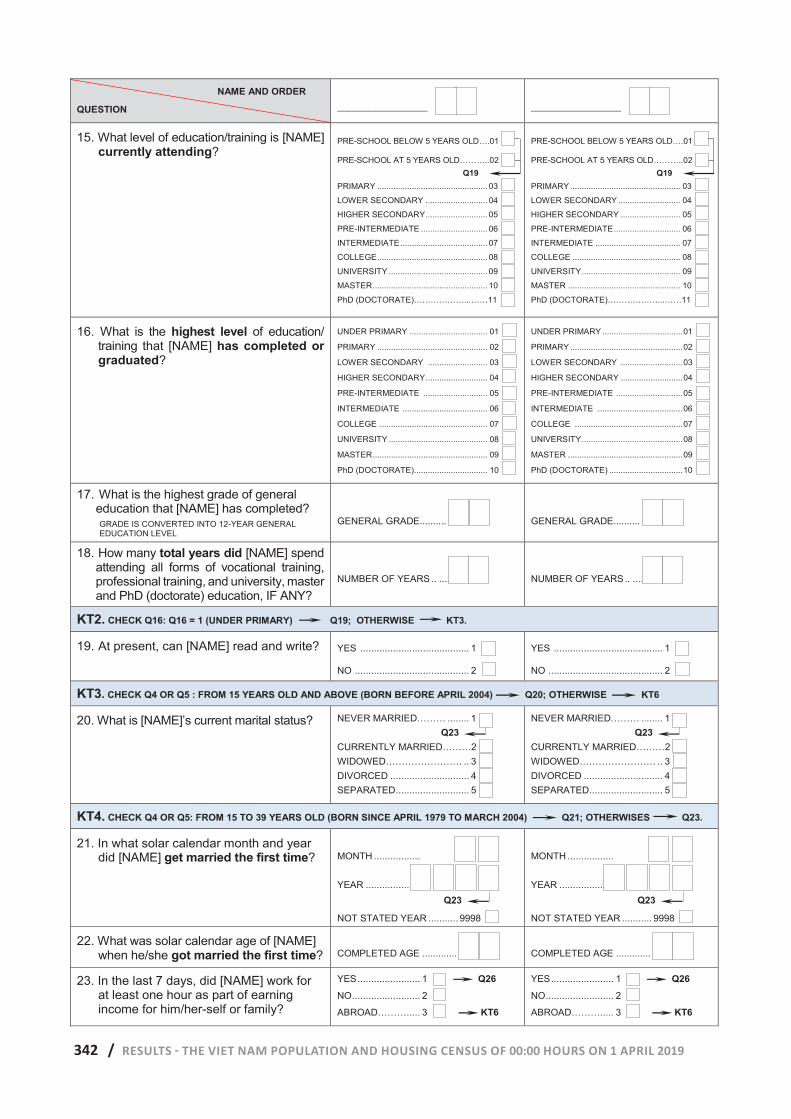
342 / RESULTS - THE VIET NAM POPULATION AND HOUSING CENSUS OF 00:00 HOURS ON 1 APRIL 2019
NAME AND ORDER
QUESTION
_________________
_________________
15. What level of education/training is [NAME] currently attending?
PRE-SCHOOL BELOW 5 YEARS OLD….01 PRE-SCHOOL AT 5 YEARS OLD………..02 Q19 PRIMARY ................................................ 03
LOWER SECONDARY ........................... 04
HIGHER SECONDARY ........................... 05
PRE-INTERMEDIATE ............................. 06
INTERMEDIATE ...................................... 07
COLLEGE ................................................ 08
UNIVERSITY ........................................... 09
MASTER .................................................. 10
PhD (DOCTORATE)………………...……11
PRE-SCHOOL BELOW 5 YEARS OLD….01 PRE-SCHOOL AT 5 YEARS OLD………..02 Q19 PRIMARY ................................................ 03
LOWER SECONDARY ........................... 04
HIGHER SECONDARY .......................... 05
PRE-INTERMEDIATE ............................. 06
INTERMEDIATE ..................................... 07
COLLEGE ............................................... 08
UNIVERSITY ........................................... 09
MASTER ................................................. 10
PhD (DOCTORATE)………………...……11
16. What is the highest level of education/ training that [NAME] has completed or graduated?
UNDER PRIMARY .................................. 01
PRIMARY ................................................ 02
LOWER SECONDARY .......................... 03
HIGHER SECONDARY ........................... 04
PRE-INTERMEDIATE ............................ 05
INTERMEDIATE ..................................... 06
COLLEGE ............................................... 07
UNIVERSITY ........................................... 08
MASTER .................................................. 09
PhD (DOCTORATE)................................ 10
UNDER PRIMARY ................................... 01
PRIMARY ................................................. 02
LOWER SECONDARY ........................... 03
HIGHER SECONDARY ........................... 04
PRE-INTERMEDIATE ............................. 05
INTERMEDIATE ..................................... 06
COLLEGE ............................................... 07
UNIVERSITY ............................................ 08
MASTER .................................................. 09
PhD (DOCTORATE) ................................ 10
17. What is the highest grade of general education that [NAME] has completed?
GRADE IS CONVERTED INTO 12-YEAR GENERAL EDUCATION LEVEL
GENERAL GRADE..........
GENERAL GRADE..........
18. How many total years did [NAME] spend attending all forms of vocational training, professional training, and university, master and PhD (doctorate) education, IF ANY?
NUMBER OF YEARS .. ........
NUMBER OF YEARS .. ........
KT2. CHECK Q16: Q16 = 1 (UNDER PRIMARY) Q19; OTHERWISE KT3.
19. At present, can [NAME] read and write? YES ........................................ 1
NO .......................................... 2
YES ........................................ 1
NO .......................................... 2
KT3. CHECK Q4 OR Q5 : FROM 15 YEARS OLD AND ABOVE (BORN BEFORE APRIL 2004) Q20; OTHERWISE KT6
20. What is [NAME]’s current marital status? NEVER MARRIED……… ........ 1 Q23 CURRENTLY MARRIED………2 WIDOWED…………………… .. 3 DIVORCED ............................. 4 SEPARATED ........................... 5
NEVER MARRIED……… ........ 1 Q23 CURRENTLY MARRIED………2 WIDOWED…………………… .. 3 DIVORCED ............................. 4 SEPARATED ........................... 5
KT4. CHECK Q4 OR Q5: FROM 15 TO 39 YEARS OLD (BORN SINCE APRIL 1979 TO MARCH 2004) Q21; OTHERWISES Q23.
21. In what solar calendar month and year did [NAME] get married the first time?
MONTH .................
YEAR .................. Q23
NOT STATED YEAR ........... 9998
MONTH .................
YEAR .................. Q23
NOT STATED YEAR ........... 9998
22. What was solar calendar age of [NAME] when he/she got married the first time? COMPLETED AGE ............. COMPLETED AGE .............
23. In the last 7 days, did [NAME] work for at least one hour as part of earning income for him/her-self or family?
YES ....................... 1 Q26
NO ......................... 2
ABROAD……… ..... 3 KT6
YES ....................... 1 Q26
NO ......................... 2
ABROAD………..... 3 KT6
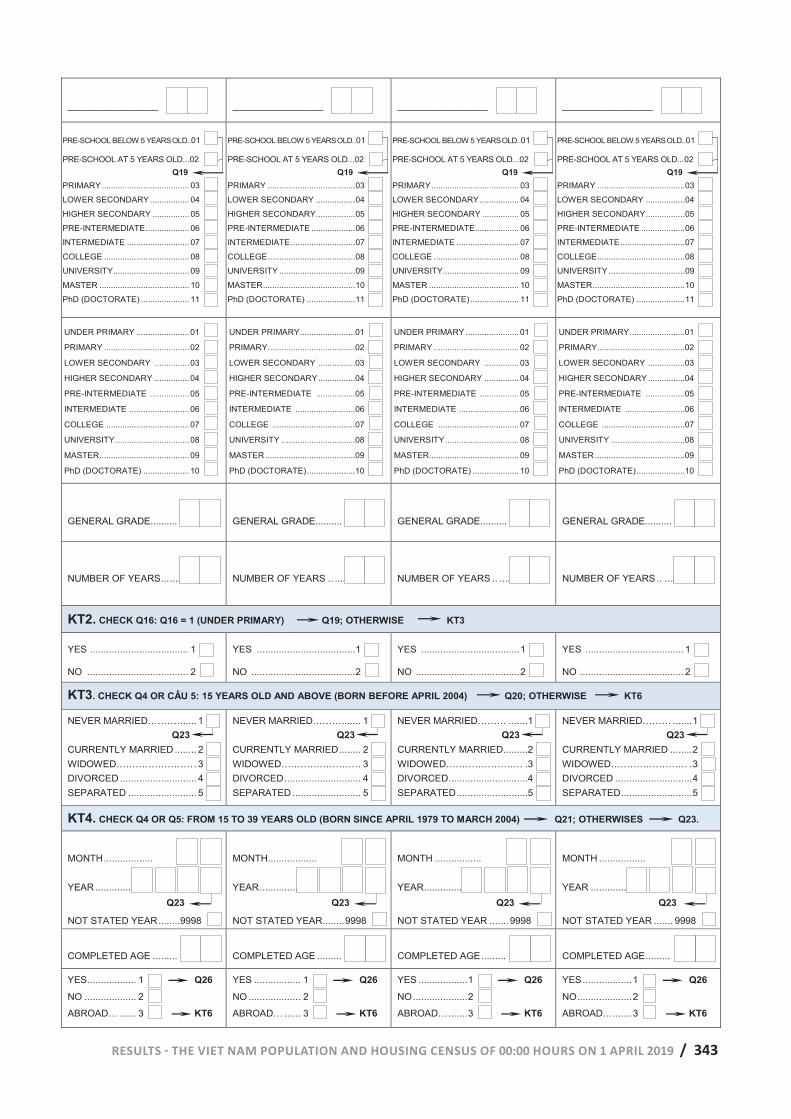
RESULTS - THE VIET NAM POPULATION AND HOUSING CENSUS OF 00:00 HOURS ON 1 APRIL 2019 / 343
_________________
_________________
_________________
_________________
PRE-SCHOOL BELOW 5 YEARS OLD..01 PRE-SCHOOL AT 5 YEARS OLD...02 Q19 PRIMARY ...................................... 03
LOWER SECONDARY ................. 04
HIGHER SECONDARY ................ 05
PRE-INTERMEDIATE ................... 06
INTERMEDIATE ........................... 07
COLLEGE ..................................... 08
UNIVERSITY ................................. 09
MASTER ....................................... 10
PhD (DOCTORATE) ..................... 11
PRE-SCHOOL BELOW 5 YEARS OLD..01 PRE-SCHOOL AT 5 YEARS OLD...02 Q19 PRIMARY ...................................... 03
LOWER SECONDARY ................. 04
HIGHER SECONDARY ................. 05
PRE-INTERMEDIATE ................... 06
INTERMEDIATE ............................ 07
COLLEGE ...................................... 08
UNIVERSITY ................................. 09
MASTER ........................................ 10
PhD (DOCTORATE) ..................... 11
PRE-SCHOOL BELOW 5 YEARS OLD..01 PRE-SCHOOL AT 5 YEARS OLD...02 Q19 PRIMARY ...................................... 03
LOWER SECONDARY ................. 04
HIGHER SECONDARY ................ 05
PRE-INTERMEDIATE................... 06
INTERMEDIATE ........................... 07
COLLEGE ..................................... 08
UNIVERSITY................................. 09
MASTER ....................................... 10
PhD (DOCTORATE) ..................... 11
PRE-SCHOOL BELOW 5 YEARS OLD..01 PRE-SCHOOL AT 5 YEARS OLD...02 Q19 PRIMARY ...................................... 03
LOWER SECONDARY ................. 04
HIGHER SECONDARY ................. 05
PRE-INTERMEDIATE ................... 06
INTERMEDIATE ............................ 07
COLLEGE ...................................... 08
UNIVERSITY ................................. 09
MASTER ........................................ 10
PhD (DOCTORATE) ..................... 11
UNDER PRIMARY ....................... 01
PRIMARY ..................................... 02
LOWER SECONDARY ............... 03
HIGHER SECONDARY ............... 04
PRE-INTERMEDIATE ................. 05
INTERMEDIATE .......................... 06
COLLEGE .................................... 07
UNIVERSITY ................................ 08
MASTER ....................................... 09
PhD (DOCTORATE) .................... 10
UNDER PRIMARY ........................01
PRIMARY ......................................02
LOWER SECONDARY ................03
HIGHER SECONDARY ................04
PRE-INTERMEDIATE .................05
INTERMEDIATE ..........................06
COLLEGE ....................................07
UNIVERSITY ................................08
MASTER .......................................09
PhD (DOCTORATE) .....................10
UNDER PRIMARY ....................... 01
PRIMARY ..................................... 02
LOWER SECONDARY ............... 03
HIGHER SECONDARY ............... 04
PRE-INTERMEDIATE ................. 05
INTERMEDIATE .......................... 06
COLLEGE ................................... 07
UNIVERSITY ................................ 08
MASTER....................................... 09
PhD (DOCTORATE) .................... 10
UNDER PRIMARY ........................01
PRIMARY ......................................02
LOWER SECONDARY ................03
HIGHER SECONDARY ................04
PRE-INTERMEDIATE .................05
INTERMEDIATE ..........................06
COLLEGE ....................................07
UNIVERSITY ................................08
MASTER .......................................09
PhD (DOCTORATE) .....................10
GENERAL GRADE..........
GENERAL GRADE..........
GENERAL GRADE..........
GENERAL GRADE..........
NUMBER OF YEARS ... ........
NUMBER OF YEARS .. ........
NUMBER OF YEARS .. ........
NUMBER OF YEARS .. ........
KT2. CHECK Q16: Q16 = 1 (UNDER PRIMARY) Q19; OTHERWISE KT3
YES .................................... 1
NO ..................................... 2
YES .................................... 1
NO ...................................... 2
YES .................................... 1
NO ...................................... 2
YES .................................... 1
NO ...................................... 2
KT3. CHECK Q4 OR CÂU 5: 15 YEARS OLD AND ABOVE (BORN BEFORE APRIL 2004) Q20; OTHERWISE KT6
NEVER MARRIED……… ....... 1 Q23 CURRENTLY MARRIED ........ 2 WIDOWED…………………… . 3 DIVORCED ............................ 4 SEPARATED ......................... 5
NEVER MARRIED……… ....... 1 Q23 CURRENTLY MARRIED ........ 2 WIDOWED…………………… . 3 DIVORCED ............................ 4 SEPARATED ......................... 5
NEVER MARRIED……… .......1 Q23 CURRENTLY MARRIED .........2 WIDOWED…………………… .3 DIVORCED .............................4 SEPARATED ..........................5
NEVER MARRIED……… ....... 1 Q23 CURRENTLY MARRIED ........ 2 WIDOWED…………………… . 3 DIVORCED ............................ 4 SEPARATED .......................... 5
KT4. CHECK Q4 OR Q5: FROM 15 TO 39 YEARS OLD (BORN SINCE APRIL 1979 TO MARCH 2004) Q21; OTHERWISES Q23.
MONTH ..................
YEAR .................. Q23
NOT STATED YEAR ........9998
MONTH..................
YEAR .................. Q23
NOT STATED YEAR ........ 9998
MONTH .................
YEAR ................... Q23
NOT STATED YEAR ....... 9998
MONTH .................
YEAR .................. Q23
NOT STATED YEAR ....... 9998
COMPLETED AGE ......... COMPLETED AGE ......... COMPLETED AGE ......... COMPLETED AGE .........
YES .................. 1 Q26
NO ................... 2
ABROAD… ...... 3 KT6
YES ................. 1 Q26
NO ................... 2
ABROAD… ...... 3 KT6
YES .................. 1 Q26
NO .................... 2
ABROAD… ....... 3 KT6
YES .................. 1 Q26
NO .................... 2
ABROAD… ....... 3 KT6
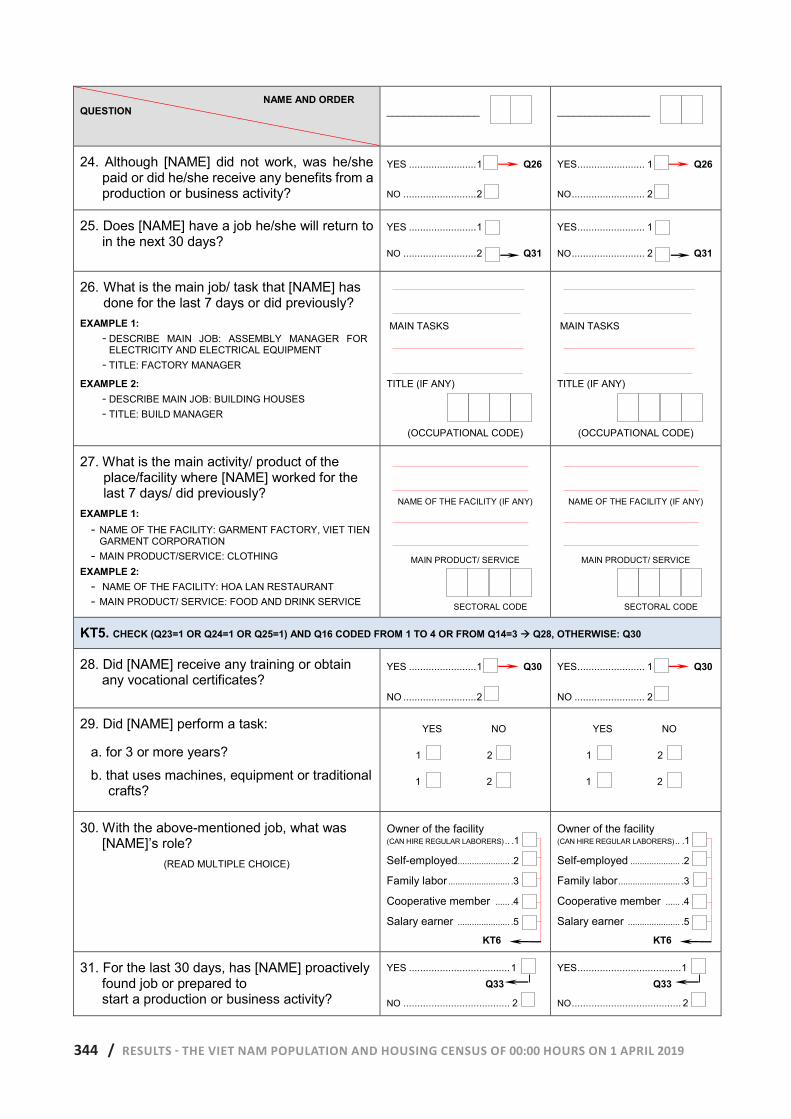
344 / RESULTS - THE VIET NAM POPULATION AND HOUSING CENSUS OF 00:00 HOURS ON 1 APRIL 2019
NAME AND ORDER QUESTION
_________________
_________________
24. Although [NAME] did not work, was he/she paid or did he/she receive any benefits from a production or business activity?
YES ........................ 1 Q26
NO .......................... 2
YES ........................ 1 Q26
NO .......................... 2
25. Does [NAME] have a job he/she will return to in the next 30 days?
YES ........................ 1
NO .......................... 2 Q31
YES ........................ 1
NO .......................... 2 Q31
26. What is the main job/ task that [NAME] has done for the last 7 days or did previously?
EXAMPLE 1: - DESCRIBE MAIN JOB: ASSEMBLY MANAGER FOR
ELECTRICITY AND ELECTRICAL EQUIPMENT - TITLE: FACTORY MANAGER
EXAMPLE 2: - DESCRIBE MAIN JOB: BUILDING HOUSES - TITLE: BUILD MANAGER
MAIN TASKS
TITLE (IF ANY)
(OCCUPATIONAL CODE)
MAIN TASKS
TITLE (IF ANY)
(OCCUPATIONAL CODE)
27. What is the main activity/ product of the place/facility where [NAME] worked for the last 7 days/ did previously?
EXAMPLE 1: - NAME OF THE FACILITY: GARMENT FACTORY, VIET TIEN
GARMENT CORPORATION - MAIN PRODUCT/SERVICE: CLOTHING
EXAMPLE 2: - NAME OF THE FACILITY: HOA LAN RESTAURANT - MAIN PRODUCT/ SERVICE: FOOD AND DRINK SERVICE
NAME OF THE FACILITY (IF ANY)
MAIN PRODUCT/ SERVICE
SECTORAL CODE
NAME OF THE FACILITY (IF ANY)
MAIN PRODUCT/ SERVICE
SECTORAL CODE
KT5. CHECK (Q23=1 OR Q24=1 OR Q25=1) AND Q16 CODED FROM 1 TO 4 OR FROM Q14=3 Q28, OTHERWISE: Q30
28. Did [NAME] receive any training or obtain any vocational certificates?
YES ........................ 1 Q30
NO .......................... 2
YES ........................ 1 Q30
NO ......................... 2
29. Did [NAME] perform a task:
a. for 3 or more years?
b. that uses machines, equipment or traditional crafts?
YES NO
1 2
1 2
YES NO
1 2
1 2
30. With the above-mentioned job, what was [NAME]’s role?
(READ MULTIPLE CHOICE)
Owner of the facility (CAN HIRE REGULAR LABORERS) .. .1
Self-employed ...................... .2
Family labor .......................... .3
Cooperative member ...... .4
Salary earner ...................... .5
KT6
Owner of the facility (CAN HIRE REGULAR LABORERS) .. .1
Self-employed ..................... .2
Family labor .......................... .3
Cooperative member ...... .4
Salary earner ...................... .5
KT6
31. For the last 30 days, has [NAME] proactively found job or prepared to start a production or business activity?
YES .................................... 1 Q33
NO ...................................... 2
YES ..................................... 1 Q33
NO ....................................... 2
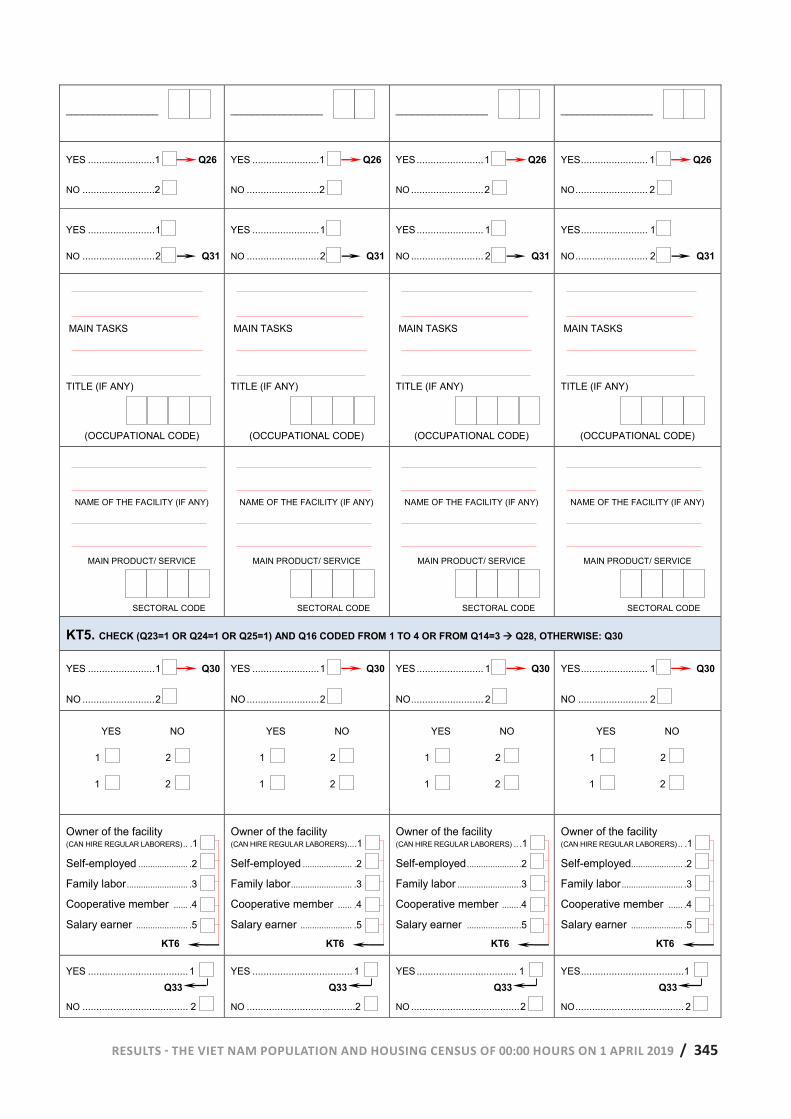
RESULTS - THE VIET NAM POPULATION AND HOUSING CENSUS OF 00:00 HOURS ON 1 APRIL 2019 / 345
12 | RESULTS - THE VIET NAM POPULATION AND HOUSING CENSUS OF 00:00 HOURS ON 1 APRIL 2019
_________________
_________________
_________________
_________________
YES ........................1 Q26
NO ..........................2
YES ........................ 1 Q26
NO .......................... 2
YES ........................ 1 Q26
NO .......................... 2
YES ........................ 1 Q26
NO .......................... 2
YES ........................ 1
NO .......................... 2 Q31
YES ........................ 1
NO .......................... 2 Q31
YES ........................ 1
NO .......................... 2 Q31
YES ........................ 1
NO .......................... 2 Q31
MAIN TASKS
TITLE (IF ANY)
(OCCUPATIONAL CODE)
MAIN TASKS
TITLE (IF ANY)
(OCCUPATIONAL CODE)
MAIN TASKS
TITLE (IF ANY)
(OCCUPATIONAL CODE)
MAIN TASKS
TITLE (IF ANY)
(OCCUPATIONAL CODE)
NAME OF THE FACILITY (IF ANY)
MAIN PRODUCT/ SERVICE
SECTORAL CODE
NAME OF THE FACILITY (IF ANY)
MAIN PRODUCT/ SERVICE
SECTORAL CODE
NAME OF THE FACILITY (IF ANY)
MAIN PRODUCT/ SERVICE
SECTORAL CODE
NAME OF THE FACILITY (IF ANY)
MAIN PRODUCT/ SERVICE
SECTORAL CODE
KT5. CHECK (Q23=1 OR Q24=1 OR Q25=1) AND Q16 CODED FROM 1 TO 4 OR FROM Q14=3 Q28, OTHERWISE: Q30
YES ........................ 1 Q30
NO .......................... 2
YES ........................ 1 Q30
NO .......................... 2
YES ........................ 1 Q30
NO .......................... 2
YES ........................ 1 Q30
NO ......................... 2
YES NO
1 2
1 2
YES NO
1 2
1 2
YES NO
1 2
1 2
YES NO
1 2
1 2
Owner of the facility (CAN HIRE REGULAR LABORERS) .. .1
Self-employed ..................... .2
Family labor .......................... .3
Cooperative member ...... .4
Salary earner ...................... .5
KT6
Owner of the facility (CAN HIRE REGULAR LABORERS) ... .1
Self-employed ..................... .2
Family labor .......................... .3
Cooperative member ...... .4
Salary earner ...................... .5
KT6
Owner of the facility (CAN HIRE REGULAR LABORERS) .. .1
Self-employed ...................... .2
Family labor .......................... .3
Cooperative member ....... .4
Salary earner ...................... .5
KT6
Owner of the facility (CAN HIRE REGULAR LABORERS) .. .1
Self-employed...................... .2
Family labor .......................... .3
Cooperative member ...... .4
Salary earner ...................... .5
KT6
YES .................................... 1 Q33
NO ...................................... 2
YES .................................... 1 Q33
NO .......................................2
YES .................................... 1 Q33
NO ....................................... 2
YES ..................................... 1 Q33
NO ....................................... 2
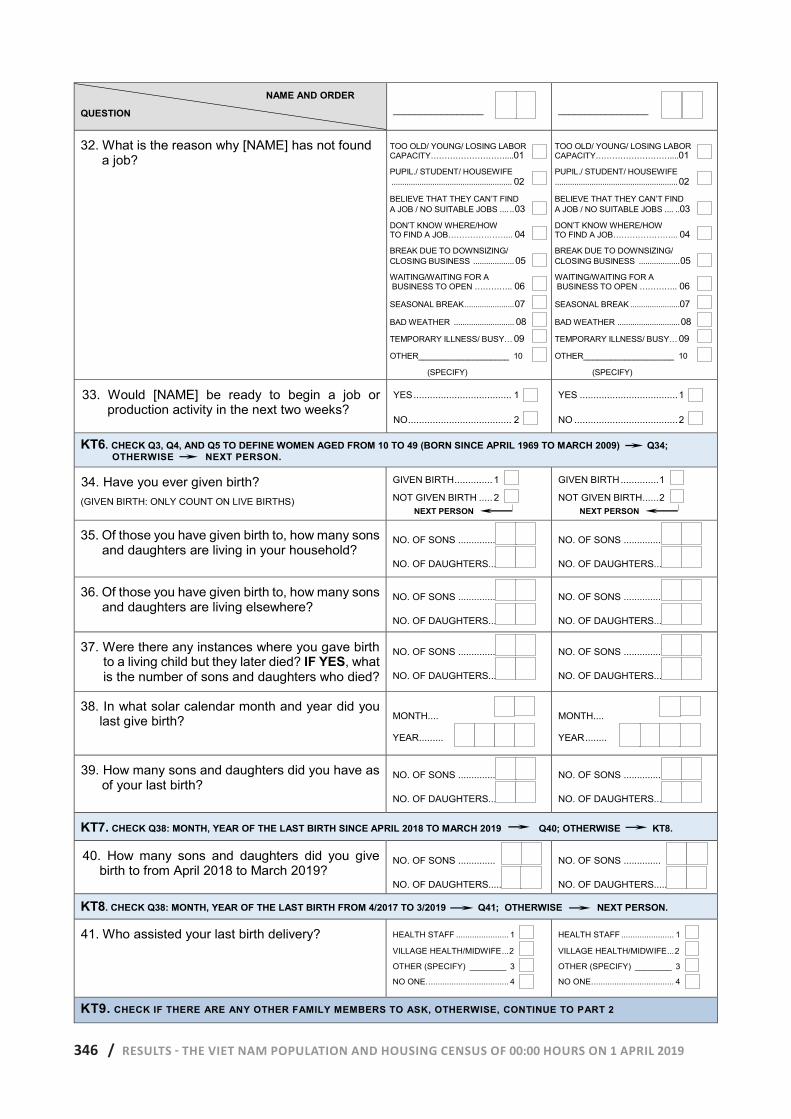
346 / RESULTS - THE VIET NAM POPULATION AND HOUSING CENSUS OF 00:00 HOURS ON 1 APRIL 2019
NAME AND ORDER
QUESTION
_________________
_________________
32. What is the reason why [NAME] has not found a job?
TOO OLD/ YOUNG/ LOSING LABOR CAPACITY………………………....01
PUPIL./ STUDENT/ HOUSEWIFE ........................................................ 02
BELIEVE THAT THEY CAN’T FIND A JOB / NO SUITABLE JOBS .... .. 03
DON’T KNOW WHERE/HOW TO FIND A JOB…………………... 04
BREAK DUE TO DOWNSIZING/ CLOSING BUSINESS ................... 05
WAITING/WAITING FOR A BUSINESS TO OPEN ………….. 06
SEASONAL BREAK ....................... 07
BAD WEATHER ............................ 08
TEMPORARY ILLNESS/ BUSY… 09
OTHER____________________ 10
(SPECIFY)
TOO OLD/ YOUNG/ LOSING LABOR CAPACITY………………………....01
PUPIL./ STUDENT/ HOUSEWIFE ......................................................... 02
BELIEVE THAT THEY CAN’T FIND A JOB / NO SUITABLE JOBS .... ..03
DON’T KNOW WHERE/HOW TO FIND A JOB…………………... 04
BREAK DUE TO DOWNSIZING/ CLOSING BUSINESS ................... 05
WAITING/WAITING FOR A BUSINESS TO OPEN ………….. 06
SEASONAL BREAK .......................07
BAD WEATHER ............................. 08
TEMPORARY ILLNESS/ BUSY… 09
OTHER____________________ 10
(SPECIFY)
33. Would [NAME] be ready to begin a job or production activity in the next two weeks?
YES .................................... 1
NO ...................................... 2
YES .................................... 1
NO ...................................... 2
KT6. CHECK Q3, Q4, AND Q5 TO DEFINE WOMEN AGED FROM 10 TO 49 (BORN SINCE APRIL 1969 TO MARCH 2009) Q34; OTHERWISE NEXT PERSON.
34. Have you ever given birth? (GIVEN BIRTH: ONLY COUNT ON LIVE BIRTHS)
GIVEN BIRTH .............. 1
NOT GIVEN BIRTH ..... 2 NEXT PERSON
GIVEN BIRTH .............. 1
NOT GIVEN BIRTH ...... 2 NEXT PERSON
35. Of those you have given birth to, how many sons and daughters are living in your household?
NO. OF SONS .............. NO. OF DAUGHTERS................
NO. OF SONS .............. NO. OF DAUGHTERS................
36. Of those you have given birth to, how many sons and daughters are living elsewhere?
NO. OF SONS .............. NO. OF DAUGHTERS................
NO. OF SONS .............. NO. OF DAUGHTERS................
37. Were there any instances where you gave birth to a living child but they later died? IF YES, what is the number of sons and daughters who died?
NO. OF SONS .............. NO. OF DAUGHTERS................
NO. OF SONS .............. NO. OF DAUGHTERS................
38. In what solar calendar month and year did you last give birth?
MONTH.... YEAR .........
MONTH.... YEAR ........
39. How many sons and daughters did you have as of your last birth?
NO. OF SONS .............. NO. OF DAUGHTERS................
NO. OF SONS .............. NO. OF DAUGHTERS................
KT7. CHECK Q38: MONTH, YEAR OF THE LAST BIRTH SINCE APRIL 2018 TO MARCH 2019 Q40; OTHERWISE KT8.
40. How many sons and daughters did you give birth to from April 2018 to March 2019?
NO. OF SONS .............. NO. OF DAUGHTERS................
NO. OF SONS .............. NO. OF DAUGHTERS................
KT8. CHECK Q38: MONTH, YEAR OF THE LAST BIRTH FROM 4/2017 TO 3/2019 Q41; OTHERWISE NEXT PERSON.
41. Who assisted your last birth delivery?
HEALTH STAFF ....................... 1
VILLAGE HEALTH/MIDWIFE ... 2
OTHER (SPECIFY) ________ 3
NO ONE. ................................... 4
HEALTH STAFF ....................... 1
VILLAGE HEALTH/MIDWIFE... 2
OTHER (SPECIFY) ________ 3
NO ONE. ................................... 4
KT9. CHECK IF THERE ARE ANY OTHER FAMILY MEMBERS TO ASK, OTHERWISE, CONTINUE TO PART 2
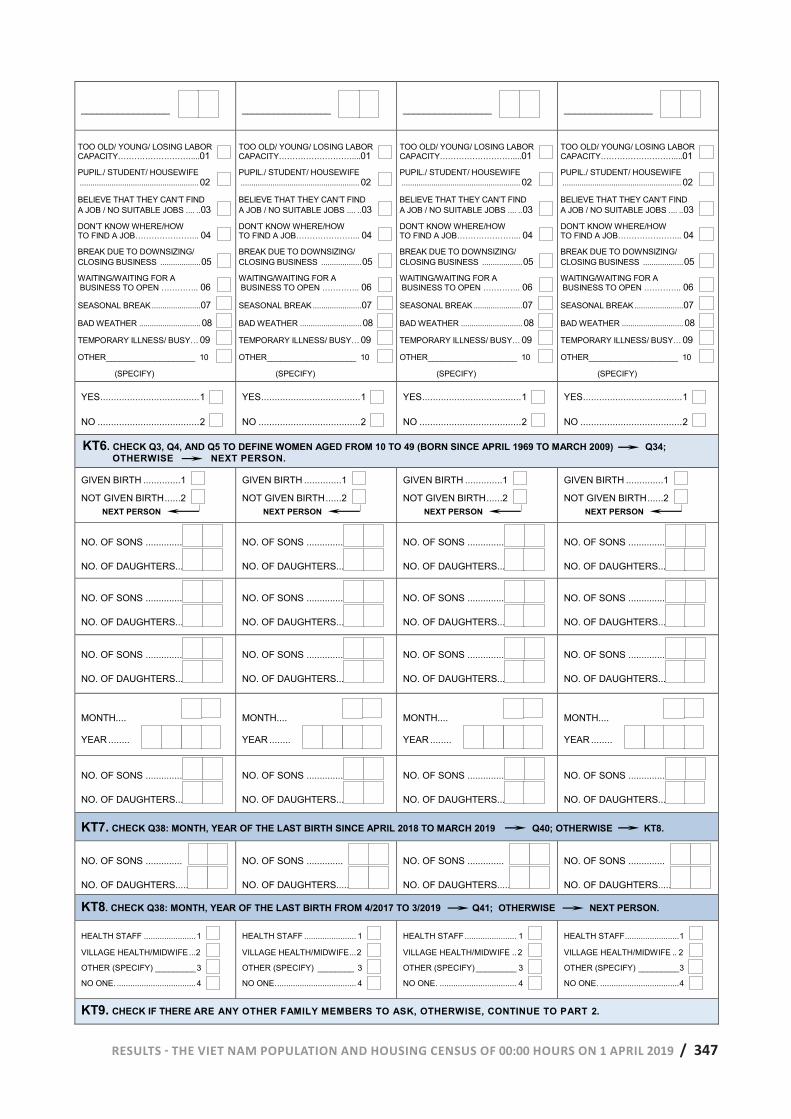
RESULTS - THE VIET NAM POPULATION AND HOUSING CENSUS OF 00:00 HOURS ON 1 APRIL 2019 / 347
_________________
_________________
_________________
_________________
TOO OLD/ YOUNG/ LOSING LABOR CAPACITY………………………....01
PUPIL./ STUDENT/ HOUSEWIFE ........................................................ 02
BELIEVE THAT THEY CAN’T FIND A JOB / NO SUITABLE JOBS .... .. 03
DON’T KNOW WHERE/HOW TO FIND A JOB…………………... 04
BREAK DUE TO DOWNSIZING/ CLOSING BUSINESS ................... 05
WAITING/WAITING FOR A BUSINESS TO OPEN ………….. 06
SEASONAL BREAK ....................... 07
BAD WEATHER ............................. 08
TEMPORARY ILLNESS/ BUSY… 09
OTHER____________________ 10
(SPECIFY)
YES ..................................... 1
NO ...................................... 2
YES ..................................... 1
NO ...................................... 2
YES ..................................... 1
NO ...................................... 2
YES ..................................... 1
NO ...................................... 2
KT6. CHECK Q3, Q4, AND Q5 TO DEFINE WOMEN AGED FROM 10 TO 49 (BORN SINCE APRIL 1969 TO MARCH 2009) Q34; OTHERWISE NEXT PERSON.
GIVEN BIRTH ..............1
NOT GIVEN BIRTH ......2 NEXT PERSON
GIVEN BIRTH ..............1
NOT GIVEN BIRTH ......2 NEXT PERSON
GIVEN BIRTH ..............1
NOT GIVEN BIRTH ......2 NEXT PERSON
GIVEN BIRTH ..............1
NOT GIVEN BIRTH ......2 NEXT PERSON
NO. OF SONS .............. NO. OF DAUGHTERS................
NO. OF SONS .............. NO. OF DAUGHTERS................
NO. OF SONS .............. NO. OF DAUGHTERS................
NO. OF SONS .............. NO. OF DAUGHTERS................
NO. OF SONS .............. NO. OF DAUGHTERS................
NO. OF SONS .............. NO. OF DAUGHTERS................
NO. OF SONS .............. NO. OF DAUGHTERS................
NO. OF SONS .............. NO. OF DAUGHTERS................
NO. OF SONS .............. NO. OF DAUGHTERS................
NO. OF SONS .............. NO. OF DAUGHTERS................
NO. OF SONS .............. NO. OF DAUGHTERS................
NO. OF SONS .............. NO. OF DAUGHTERS................
MONTH.... YEAR ........
MONTH.... YEAR ........
MONTH.... YEAR ........
MONTH.... YEAR ........
NO. OF SONS .............. NO. OF DAUGHTERS................
NO. OF SONS .............. NO. OF DAUGHTERS................
NO. OF SONS .............. NO. OF DAUGHTERS................
NO. OF SONS .............. NO. OF DAUGHTERS................
KT7. CHECK Q38: MONTH, YEAR OF THE LAST BIRTH SINCE APRIL 2018 TO MARCH 2019 Q40; OTHERWISE KT8.
NO. OF SONS .............. NO. OF DAUGHTERS................
NO. OF SONS .............. NO. OF DAUGHTERS................
NO. OF SONS .............. NO. OF DAUGHTERS................
NO. OF SONS .............. NO. OF DAUGHTERS................
KT8. CHECK Q38: MONTH, YEAR OF THE LAST BIRTH FROM 4/2017 TO 3/2019 Q41; OTHERWISE NEXT PERSON.
HEALTH STAFF ....................... 1
VILLAGE HEALTH/MIDWIFE ... 2
OTHER (SPECIFY) _________ 3
NO ONE. ................................... 4
HEALTH STAFF ....................... 1
VILLAGE HEALTH/MIDWIFE ... 2
OTHER (SPECIFY) ________ 3
NO ONE. ................................... 4
HEALTH STAFF ....................... 1
VILLAGE HEALTH/MIDWIFE .. 2
OTHER (SPECIFY) _________ 3
NO ONE. .................................. 4
HEALTH STAFF ........................ 1
VILLAGE HEALTH/MIDWIFE .. 2
OTHER (SPECIFY) _________ 3
NO ONE. ................................... 4
KT9. CHECK IF THERE ARE ANY OTHER FAMILY MEMBERS TO ASK, OTHERWISE, CONTINUE TO PART 2.
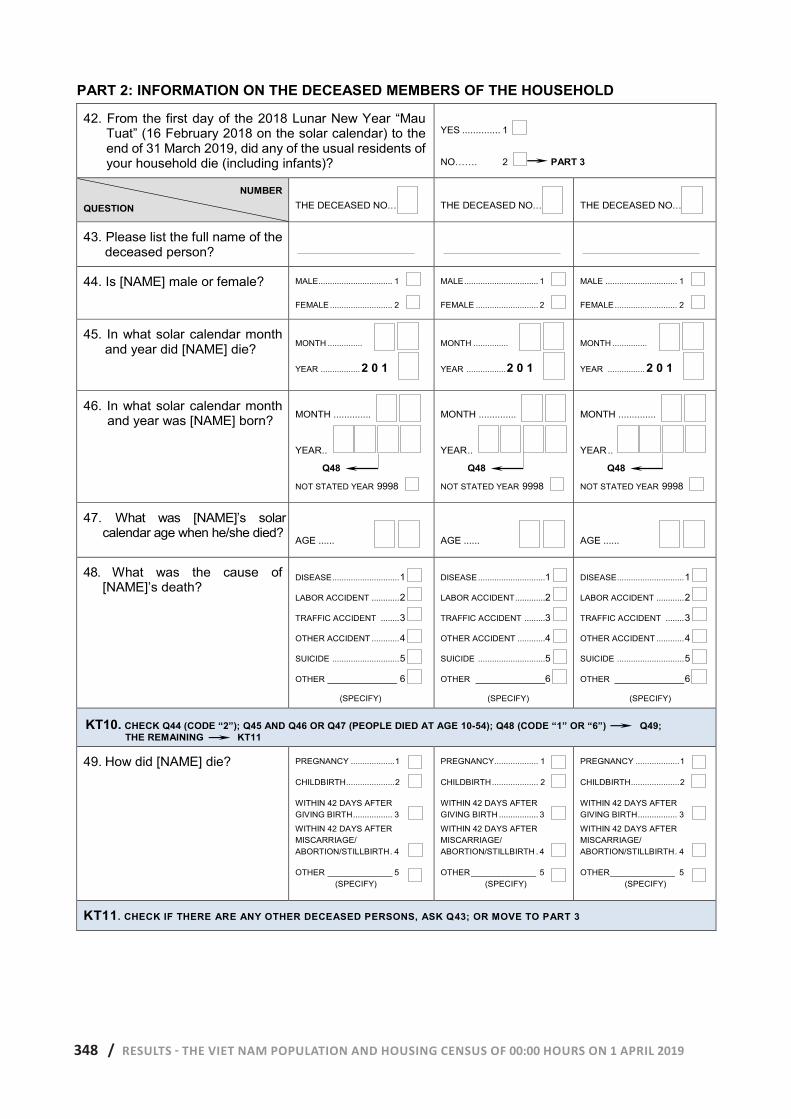
348 / RESULTS - THE VIET NAM POPULATION AND HOUSING CENSUS OF 00:00 HOURS ON 1 APRIL 2019
PART 2: INFORMATION ON THE DECEASED MEMBERS OF THE HOUSEHOLD
42. From the first day of the 2018 Lunar New Year “Mau Tuat” (16 February 2018 on the solar calendar) to the end of 31 March 2019, did any of the usual residents of your household die (including infants)?
YES .............. 1
NO……. 2 PART 3
NUMBER
QUESTION
THE DECEASED NO.….
THE DECEASED NO.….
THE DECEASED NO.….
43. Please list the full name of the deceased person?
44. Is [NAME] male or female? MALE................................ 1
FEMALE ........................... 2
MALE ................................ 1
FEMALE ........................... 2
MALE ............................... 1
FEMALE ........................... 2
45. In what solar calendar month and year did [NAME] die?
MONTH ...............
YEAR ................. 2 0 1
MONTH ...............
YEAR ................. 2 0 1
MONTH ...............
YEAR ................ 2 0 1
46. In what solar calendar month and year was [NAME] born?
MONTH ..............
YEAR ..
Q48
NOT STATED YEAR 9998
MONTH ..............
YEAR ..
Q48
NOT STATED YEAR 9998
MONTH ..............
YEAR ..
Q48
NOT STATED YEAR 9998
47. What was [NAME]’s solar calendar age when he/she died?
AGE ......
AGE ......
AGE ......
48. What was the cause of [NAME]’s death?
DISEASE ............................. 1
LABOR ACCIDENT ............ 2
TRAFFIC ACCIDENT ........ 3
OTHER ACCIDENT ............ 4
SUICIDE ............................. 5
OTHER _______________ 6
(SPECIFY)
DISEASE .............................1
LABOR ACCIDENT .............2
TRAFFIC ACCIDENT .........3
OTHER ACCIDENT ............4
SUICIDE .............................5
OTHER _______________6
(SPECIFY)
DISEASE ............................. 1
LABOR ACCIDENT ............ 2
TRAFFIC ACCIDENT ........ 3
OTHER ACCIDENT ............ 4
SUICIDE ............................. 5
OTHER _______________ 6
(SPECIFY)
KT10. CHECK Q44 (CODE “2”); Q45 AND Q46 OR Q47 (PEOPLE DIED AT AGE 10-54); Q48 (CODE “1” OR “6”) Q49; THE REMAINING KT11
49. How did [NAME] die?
PREGNANCY ................... 1 CHILDBIRTH ..................... 2 WITHIN 42 DAYS AFTER GIVING BIRTH ................. 3
WITHIN 42 DAYS AFTER MISCARRIAGE/ ABORTION/STILLBIRTH . 4 OTHER ______________ 5 (SPECIFY)
PREGNANCY ................... 1 CHILDBIRTH .................... 2 WITHIN 42 DAYS AFTER GIVING BIRTH ................. 3
WITHIN 42 DAYS AFTER MISCARRIAGE/ ABORTION/STILLBIRTH . 4 OTHER ______________ 5 (SPECIFY)
PREGNANCY ................... 1 CHILDBIRTH..................... 2 WITHIN 42 DAYS AFTER GIVING BIRTH ................. 3
WITHIN 42 DAYS AFTER MISCARRIAGE/ ABORTION/STILLBIRTH . 4 OTHER ______________ 5 (SPECIFY)
KT11. CHECK IF THERE ARE ANY OTHER DECEASED PERSONS, ASK Q43; OR MOVE TO PART 3
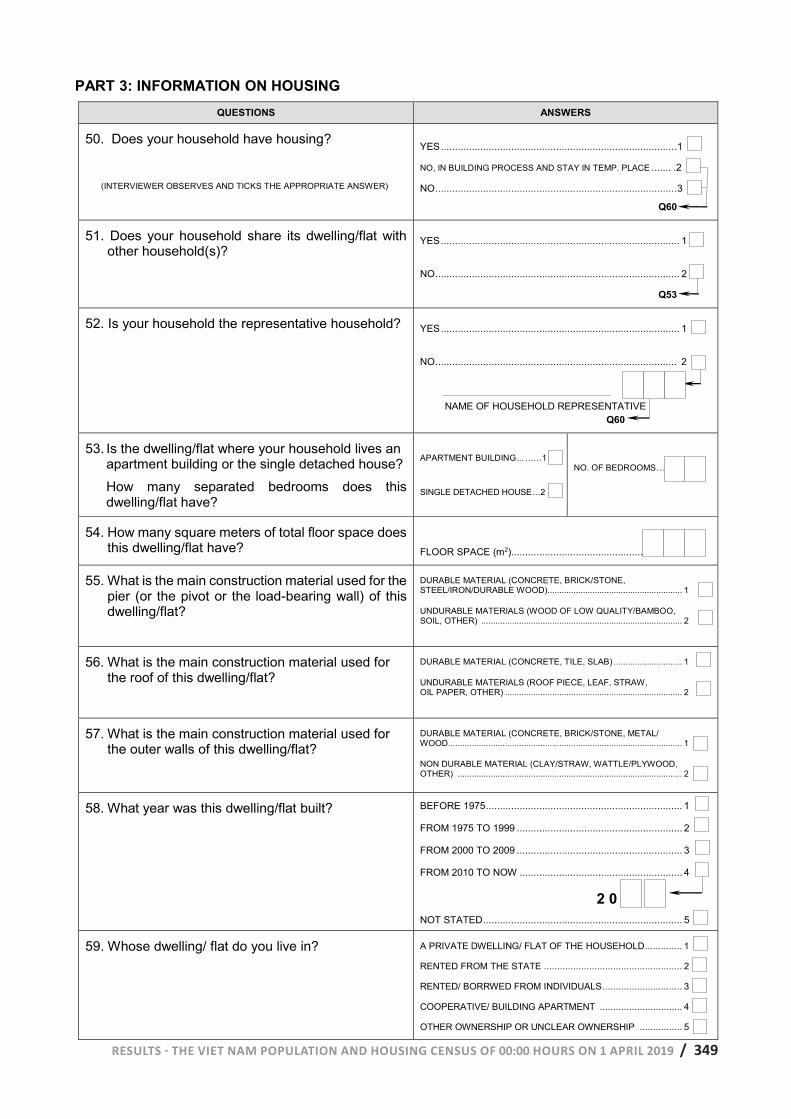
RESULTS - THE VIET NAM POPULATION AND HOUSING CENSUS OF 00:00 HOURS ON 1 APRIL 2019 / 349
PART 3: INFORMATION ON HOUSING
QUESTIONS ANSWERS
50. Does your household have housing?
(INTERVIEWER OBSERVES AND TICKS THE APPROPRIATE ANSWER)
YES ................................................................................... .1
NO, IN BUILDING PROCESS AND STAY IN TEMP. PLACE ....... .2
NO ..................................................................................... .3
Q60
51. Does your household share its dwelling/flat with other household(s)?
YES ..................................................................................... 1
NO ....................................................................................... 2
Q53
52. Is your household the representative household? YES ..................................................................................... 1
NO ...................................................................................... 2
NAME OF HOUSEHOLD REPRESENTATIVE Q60
53. Is the dwelling/flat where your household lives an apartment building or the single detached house?
How many separated bedrooms does this dwelling/flat have?
APARTMENT BUILDING ... ……1
SINGLE DETACHED HOUSE…2
NO. OF BEDROOMS…….
54. How many square meters of total floor space does this dwelling/flat have? FLOOR SPACE (m2)............................................... …
55. What is the main construction material used for the pier (or the pivot or the load-bearing wall) of this dwelling/flat?
DURABLE MATERIAL (CONCRETE, BRICK/STONE, STEEL/IRON/DURABLE WOOD)......................................................... 1
UNDURABLE MATERIALS (WOOD OF LOW QUALITY/BAMBOO, SOIL, OTHER) ..................................................................................... 2
56. What is the main construction material used for the roof of this dwelling/flat?
DURABLE MATERIAL (CONCRETE, TILE, SLAB) ............................. 1
UNDURABLE MATERIALS (ROOF PIECE, LEAF, STRAW, OIL PAPER, OTHER) ........................................................................... 2
57. What is the main construction material used for the outer walls of this dwelling/flat?
DURABLE MATERIAL (CONCRETE, BRICK/STONE, METAL/ WOOD ................................................................................................... 1
NON DURABLE MATERIAL (CLAY/STRAW, WATTLE/PLYWOOD, OTHER) ............................................................................................... 2
58. What year was this dwelling/flat built?
BEFORE 1975 ...................................................................... 1
FROM 1975 TO 1999 ........................................................... 2
FROM 2000 TO 2009 ........................................................... 3
FROM 2010 TO NOW .......................................................... 4
2 0 NOT STATED ....................................................................... 5
59. Whose dwelling/ flat do you live in? A PRIVATE DWELLING/ FLAT OF THE HOUSEHOLD .............. 1
RENTED FROM THE STATE .................................................... 2
RENTED/ BORRWED FROM INDIVIDUALS .............................. 3
COOPERATIVE/ BUILDING APARTMENT ............................... 4
OTHER OWNERSHIP OR UNCLEAR OWNERSHIP ................ 5
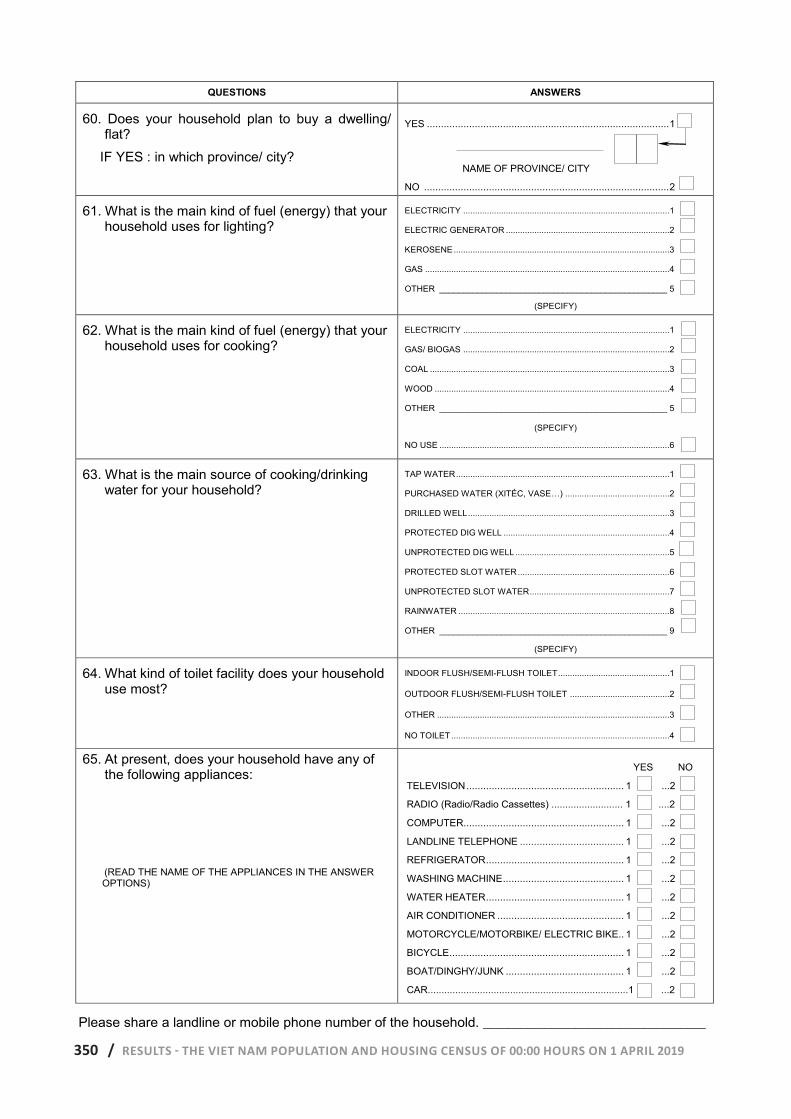
350 / RESULTS - THE VIET NAM POPULATION AND HOUSING CENSUS OF 00:00 HOURS ON 1 APRIL 2019
QUESTIONS ANSWERS
60. Does your household plan to buy a dwelling/ flat?
IF YES : in which province/ city?
YES ...................................................................................... 1
NAME OF PROVINCE/ CITY
NO ....................................................................................... 2
61. What is the main kind of fuel (energy) that your household uses for lighting?
ELECTRICITY .......................................................................................1
ELECTRIC GENERATOR .....................................................................2
KEROSENE ...........................................................................................3
GAS .......................................................................................................4
OTHER ________________________________________________ 5
(SPECIFY)
62. What is the main kind of fuel (energy) that your household uses for cooking?
ELECTRICITY .......................................................................................1
GAS/ BIOGAS .......................................................................................2
COAL .....................................................................................................3
WOOD ...................................................................................................4
OTHER ________________________________________________ 5
(SPECIFY)
NO USE .................................................................................................6
63. What is the main source of cooking/drinking water for your household?
TAP WATER ..........................................................................................1
PURCHASED WATER (XITÉC, VASE…) ............................................2
DRILLED WELL .....................................................................................3
PROTECTED DIG WELL ......................................................................4
UNPROTECTED DIG WELL .................................................................5
PROTECTED SLOT WATER ................................................................6
UNPROTECTED SLOT WATER ...........................................................7
RAINWATER .........................................................................................8
OTHER ________________________________________________ 9
(SPECIFY)
64. What kind of toilet facility does your household use most?
INDOOR FLUSH/SEMI-FLUSH TOILET ...............................................1
OUTDOOR FLUSH/SEMI-FLUSH TOILET ..........................................2
OTHER ..................................................................................................3
NO TOILET ............................................................................................4
65. At present, does your household have any of the following appliances: (READ THE NAME OF THE APPLIANCES IN THE ANSWER OPTIONS)
YES NO
TELEVISION ........................................................ 1 ...2
RADIO (Radio/Radio Cassettes) .......................... 1 ....2
COMPUTER......................................................... 1 ...2
LANDLINE TELEPHONE ..................................... 1 ...2
REFRIGERATOR ................................................. 1 ...2
WASHING MACHINE ........................................... 1 ...2
WATER HEATER ................................................. 1 ...2
AIR CONDITIONER ............................................. 1 ...2
MOTORCYCLE/MOTORBIKE/ ELECTRIC BIKE.. 1 ...2
BICYCLE .............................................................. 1 ...2
BOAT/DINGHY/JUNK .......................................... 1 ...2
CAR.........................................................................1 ...2
Please share a landline or mobile phone number of the household. ____________________________________
RESULTS - THE VIET NAM POPULATION AND HOUSING CENSUS OF 00:00 HOURS ON 1 APRIL 2019 | 351
ANNEX 2: SOME DEFINITIONS AND CONCEPTS IN THE CENSUS
1. Population size and structure
The total population is the number of usual residents at time-point 00:00 on 1 April 2019. A person is considered a “usual resident” of a household if he/she has lived in that household for 6 or more months at the time-point of the Census enumeration. Residents that moved to a household less than 6 months ago but who intend to live there permanently, children born at any time before the Census and those who temporarily absent were also considered usual residents, irrespective of whether or not they were registered as permanent residents.
A usual household resident includes:
a) Persons who eat and live permanently in the household and had been doing so for at least 6 months as of the time-point of the Census enumeration, irrespective of whether or not they were registered as permanent residents;
b) Persons who moved to the household less than 6 months preceding the Census time-point but intend to live permanently, including newborn babies;
c) Persons who live permanently in the household but have been temporarily absent, including Vietnamese persons permitted by authorities to go overseas for an assigned duration of time;
In addition to household “usual residents”, the total population also included "specific residents”, including:
- Persons living in nursing homes, orphanages, SOS villages, charity schools, leprosy centers, centers, schools, camps, and other social facilities located within the boundaries of communes, wards and towns, as well as patients living in leprosy centers, centers for the care and nurturing of mentally ill people, people undergoing detoxification in drug rehabilitation camps, etc;
- Pupils and students (excluding boarding school pupils, staying in residential households) living in youth schools, ethnic boarding schools, work-study and vocational-training schools, professional secondary schools, colleges, universities, deaf and dumb schools; those pursuing religious degrees in monasteries; and monks or religious devotees living in pagodas and community houses;
- Persons living in worker housing areas on the premises of companies, factories, and enterprises, as these buildings are large and often managed by enterprises, posing challenges for enumerators to access the residents. The residents are mostly single persons and these buildings are managed and secured by management units, located within the boundaries of communes, wards or towns;
- Wanderers and homeless persons; persons who earn a living on the water without a house on the shore and without registration of the original wharf; patients in inpatient treatment in hospitals who do not have any other place of usual residence.
352 | RESULTS - THE VIET NAM POPULATION AND HOUSING CENSUS OF 00:00 HOURS ON 1 APRIL 2019
A household comprises either one person living alone or a group of people living in the same dwelling and sharing meals together. For households with 2 or more persons, its members may or may not share a common budget; may or may not be related by blood; or both or neither. A household head is the representative of the household as denoted by household members.
The average annual population growth rate is the average yearly increase or decrease during the 10-year period between the 2009 and 2019 Censuses.
Population density is the average population per square kilometer of the given territory.
The sex ratio is the number of males per 100 females.
The urban population rate is the percentage of urban population per total population. Urban areas consist of downtown districts, in-town wards and towns. All remaining grassroots administrative units (communes) are considered rural areas.
The aging index is the number of persons aged 60 and over per every 100 persons aged less than 15.
The overall dependency ratio is the percentage of the population under 15 years old and 65 years and older per 100 people aged 15-64. Broken down further, the child dependency ratio is the percentage of the population under 15 years old per 100 people aged 15-64, and the elderly dependency ratio is the percentage of the population aged 65 years and older per 100 people in the 15-64 age group.
A person’s marital status at the time of the survey fell within one of the following five categories:
- A never married (unmarried) person is someone who has never been married or never cohabited with the opposite sex.
- A married person is someone recognized by law or custom as married or cohabitating with the opposite sex.
- A widow is someone whose spouse died and who is not currently remarried.
- A divorced person is someone who was married at some point, but for reasons other than death, they legally divorced that partner and is not currently remarried.
- A separated person is nominally married, but for reasons other than death, does not live with their spouse as husband and wife.
Singulate Mean Age at Marriage is the average number of years that each person of a given generation will remain single throughout his or her life, if this generation has the level of single by age as the single proportion obtained at the survey time.
Disability: A person is defined as a disabled if he or she faces difficulty or is unable to perform a function in one of the six domains: seeing, hearing, walking or climbing stairs, remembering or concentrating, self-care (washing or dressing), or communicating (understanding or being understood by others).
RESULTS - THE VIET NAM POPULATION AND HOUSING CENSUS OF 00:00 HOURS ON 1 APRIL 2019 | 353
2. Fertility
Total fertility rate (TFR) is the average number of live births a woman has during her child-bearing years (15-49 years) if the woman is to pass through the child-bearing years according to an age-specific fertility rate (ASFR) observed during the study period, usually the 12 months prior to the time of Census.
Age specific fertility rate (ASFR) indicates the average number of children born alive to every 1,000 women at a given age (or age group) in the study period, usually the 12 months before the survey.
Crude birth rate (CBR) measures the number of live births during the study period, usually 12 months prior to the time of the Census, taking an average over 1,000 people at the time of the Census. It a “crude” birth rate because it is calculated for the entire population (i.e. including those who are both able and unable to have children).
Sex ratio at birth (SRB) is determined by the number of boys per 100 girls born in a study period, usually the 12 months prior the time of the Census.
3. Mortality
Crude death rate indicates the number of deaths per 1,000 persons during the study period, usually the 12 months prior to the time of the Census.
Infant mortality rate is a measure of child deaths in their first year of life. This rate is the average number of deaths among children under one year old per 1,000 live births during the study period, usually the 12 months prior to the time of the Census.
Under-5 mortality rate is the average number of deaths among children under 5 years old per 1,000 live births during the study period, usually the 12 months prior to the time of the Census.
Maternal mortality rate (MMR) is the number of women who die of causes related to pregnancy and childbirth, which occurred during pregnancy or within 42 days postpartum, post-miscarriage, or post-abortion, calculated as an average over 100,000 live births in the study period, usually the 12 months prior to the survey.
Life expectancy at birth is defined as how long, on average, a newborn can expect to live, if the current death model is maintained.
4. Education and training
The gross school enrollment rate is the number of pupils or students attending a specific general education level (regardless of age) per 100 school-age persons.
The net school enrollment rate is the number of pupils or students at the age of a given general educational level that are enrolled in that level of education, per 100 school-aged persons at that level.
354 | RESULTS - THE VIET NAM POPULATION AND HOUSING CENSUS OF 00:00 HOURS ON 1 APRIL 2019
Out-of-school children are school-aged children who have never attended school or who dropped out of school.
The proportion of out-of-school children at a given general education level (primary, lower secondary, upper secondary school) are the percentage of school-age children at the education level who have never attended school or who dropped out of school in the total number of school-age children at the education level.
Literacy is the ability to read and write a simple passage in the context of everyday life in the national language, an ethnic language or a foreign language. The literacy rate is the number of people aged 15 and over who are literate relative to the total of 100 people aged 15 and over.
Persons with technical qualifications are those who are trained on and received a vocational degree from the primary level upwards.
The average schooling years is the total number of years spent in school among the population aged 25 years and over compared with the total population in the birth cohort (rounded by year of birth).
Expected schooling years is total years of schooling that children at a given age are expected to receive in the future, assuming that the probability of children going to school at any age is the school attendance rate of children at that age in the research period.
5. Labor and employment
The labor force is composed of people aged 15 and over who were employed or unemployed during the reference period (7 days prior to the time of observation).
The employed population are all persons aged 15 years and over performing any kind work (not prohibited by law) for one hour or more to create products or goods or to provide services for the purpose of generating income for themselves and their family, during the reference period.
The unemployed population refers to all persons aged 15 years and over who met the following criteria during the reference period: not currently working, looking for work and willing to work.
The unemployment rate is the percentage of the unemployed population aged 15 and over among the labor force aged 15 years and over.
The proportion of unemployed persons in the working age group is the percentage of unemployed workers of working age (males aged 15-59 years old; females aged 15 -54 years old) compared against the total working age labor force.
Trained workers are people in the labor force who have been trained and awarded an elementary or higher degree.
The proportion of trained workers is the percentage of trained workers among the total labor force.
RESULTS - THE VIET NAM POPULATION AND HOUSING CENSUS OF 00:00 HOURS ON 1 APRIL 2019 | 355
6. Migration
Immigration rate denotes the number of migrants coming from other territorial units and immigrating into their current territorial unit per 1,000 persons in the observation period.
Out-migration rate denotes the number of migrants emigrating to other territorial units per 1,000 persons in the observation period.
Net migration rate refers to the difference between the immigration rate and the out-migration rate. The net migration rate is positive if the number of immigrants is larger than the number of out-migrants, and if the number of out-migrants is larger, the net migration rate is negative.
7. Housing and living conditions
A dwelling is a finished construction with three main structures-a wall, roof, and floor-and is used for habitating.
The type of house is defined according to the main construction material of three important components: the pier (the pivot or the load-bearing wall), the roof and the outer walls.
The Pier is determined to be solid if it is made with reinforced concrete, brick/stone, or steel/iron/durable wood.
The Roof is determined to be solid if it is made with reinforced concrete or tile. Roofs made with corrugated iron with tile patterns, cold corrugated iron, heat-insulated corrugated iron, or other corrugated iron with firm supporting structures (iron, wooden frames, etc.), and firmly associated with masonry walls and reinforced concrete poles are considered durable.
The Outer wall is determined to be solid if it is made with reinforced concrete, brick/stone, or wood/metal.
Permanent houses are those with all three main structures made of at least durable materials.
Semi-permanent houses are those with two-thirds of the main structures made of durable materials.
Temporary houses have only one of the three important components defined as solid.
Simple houses do not have any of the three important components defined as solid.
Hygienic water consists of tap water, buying water (cisterns, tanks), rainwater, protected drill wells, dug wells, and protected slot/pore water.
Hygienic toilets are flush or semi-flush toilets.
8. Wealth index by quintile
The 2019 Population and Housing Census collected information on the quality of housing, amenities, and living facilities of each citizen to assess population housing and living conditions. This information is used in multivariate correlation analysis models to estimate a Wealth index for
356 | RESULTS - THE VIET NAM POPULATION AND HOUSING CENSUS OF 00:00 HOURS ON 1 APRIL 2019
assessing the wealth and poverty of households, establishing five levels of living standards (quintiles). Accordingly, the total number of households nationwide was divided into 5 groups with approximately 20% of the total population with different levels of housing and living conditions, including: 20% of the richest population (with the best housing and living conditions); 20% of the rich population (with relatively good housing and living conditions); 20% of the population with median living standards (with reasonable housing conditions and activities); 20% of the poor population (with poor housing and living conditions) and 20% of the poorest population (with the worst housing and living conditions). People living in the same household were categorized equally in terms of their wealth and poverty.
Variables used to estimate the Wealth index by quintile in the 2019 Census included:
- Whether or not a household had housing;
- Whether or not a household shared its dwelling with other household(s);
- The number of separated rooms in the dwelling;
- Housing area per capita;
- The main construction material used on the roof, outer walls, and pivot or the load-bearing wall of the dwelling;
- What year the dwelling was built;
- The main kind of fuel (energy) the household uses for lighting;
- The main kind of fuel (energy) the household uses for cooking;
- The main source of cooking/drinking water for the household;
- The kind of toilet facility used by the household;
- The existence of living appliances in households: televisions, radios, computers, phones, refrigerators, washing machines, hot water heaters, air-conditioners, motorbikes, motorcycles, electric bicycles, electric scooters, and cars.
RESULTS - THE VIET NAM POPULATION AND HOUSING CENSUS OF 00:00 HOURS ON 1 APRIL 2019 | 357
ANNEX 3: ESTIMATION METHODS OF FERTILITY AND MORTALITY
1. Fertility estimation methods and information quality evaluation 1.1. Fertility estimation methods
The total fertility rate (TFR) is one of the main fertility measures. The TFR is not dependent on population structures by age, so it can also be used as a tool to compare fertility among different population cohorts or over different periods. In demography, TFRs are usually estimated indirectly through the Trussell P/F model of the Brass P/F Ratio technique, assuming that the number of children born in the 12 months prior to the survey time to women aged 15-49 may be underreported. This omission usually occurs with cases of children who have died or left their parents.
The age-specific fertility rate (ASFR) is estimated indirectly along with the indirect estimation of the TFR through the Brass P/F Ratio technique. Births in the 12 months prior to the survey are also indirectly adjusted when estimating TFR and ASFR using the Brass P/F Ratio technique. The number of children born alive in the 12 months prior to the Census divided by the population up to the time of the Census results in a crude birth rate (CBR); this indicator depends on the population structure by age. The CBR is estimated indirectly by taking the CBR calculated directly from the survey data multiplied by the Trussell P/F adjustment coefficient in the Brass P/F Ratio technique due to the presumed underreporting in the number of births.
1.2. Information quality evaluation
The aggregated result of the number of children born alive in the 12 months prior to the 2019 Census shows an overall picture of the characteristics related to the fertility pattern of women in Viet Nam. Studying this aggregated data reveals similarities with the population in the 0-1 year old age group.
The skewed sex ratio (more males than females) in the population under 15 years old indicates the persistence of a nationwide sex imbalance at birth. In general, the fertility data obtained through the 2019 Census is reliable, correctly reflecting Viet Nam's fertility levels and trends in recent years.
2. Mortality estimation methods and information quality evaluation
Collecting sufficient information on mortality poses a substantial challenge for any demographic survey in any country. Therefore, indirect estimation methods are commonly used to assess mortality.
2.1. Crude death rate (CDR) estimation method
- Data requirement and hypothesis
According to international research and recommendations, collecting information on the number of deaths is reliably insufficient for demographic surveys, necessitating the use of indirect methods to study and estimate mortality.
358 | RESULTS - THE VIET NAM POPULATION AND HOUSING CENSUS OF 00:00 HOURS ON 1 APRIL 2019
The "Growth Balance Method" was used to estimate the CDR for the 2019 Census, which requires the following stipulations and components:
- Population data from the two most recent censuses by age group;
- Data on the number of deaths between two censuses (the number of deaths reported in annual surveys);
- No international migration or a negligible amount of international migration is reported in the previous two Censuses;
- The information completeness on the number of deaths is consistent for all ages and enumerators.
- Method content:
The equation for balancing the population between two censuses is as follows:
P2 = P1 + B - D
Where P1 and P2 are the population of the two Censuses, B is the number of births between the two censuses, and D is the number of deaths between two censuses.
Thus, the number of deaths is calculated with:
D = P1 + B - P2
The population equilibrium equation applies to the entire population as well as is calculated for a population aged certain x or older (P (x +)) such that:
D(x+) = P1(x+) + N(x+) - P2(x+)
Where: P1(x+) and P2(x+) are population aged x and older, and N(x+) is the number of living people at the age of study period. N(x+) is estimated by the following formula:
N(x+) = t*0.2*[P1(x-5,5) * P2(x,5)]0.5
The above formula is used because: P1 (x-5,5) includes people who died before reaching age x, and P2 (x, 5) does not include those who died before reaching age x in the later (second) census. Therefore, the above formula will estimate the average number of people living to age x between the two Censuses; t is the length of time between two censuses; multiplied by 0.2. This is the average number of people living to the age of x at any one year during the period between the two Censuses.
Then, D*(x+) and Dc(x+) are the number of deaths at the age of x collected, and the number of deaths from the population balance equation applied between the two Censuses, respectively. Thus, the estimated death ratio for each age uses the formula:
c = D*(x+)/ Dc(x+)
This ratio will vary with age, the median of c values must be calculated and used as a constant to estimate the number of deaths.
RESULTS - THE VIET NAM POPULATION AND HOUSING CENSUS OF 00:00 HOURS ON 1 APRIL 2019 | 359
Estimating the number of deaths between the two censuses uses the formula:
AjD = c * (the number of deaths reported between the two Censuses)
Using the number of years a person lives between the two Censuses to estimate mortality rate by age is as follows:
PYL(x+) = t * [P1(x+) * P2(x+)]0.5
Mortality rate by age is estimated using the following formula:
RD = AjD(x)/PYL(x)
These rates allow for an estimate of the total number of deaths in the latest Census. Accordingly, a crude death rate for the Census can be estimated using the formula as follows:
CDR = D/P
Where D is the number of deaths estimated using the growth balance method and P is the total population of the latest Census.
2.2. Infant mortality rate (IMR) estimation method
The indirect estimation method for determining the infant mortality rate (IMR), pioneered by Brass and Coale (1968), estimates child mortality based on information on the total number of births and children still living as reported by women, by age group.
Brass, a demographer, proved that the probability of death from birth to age a, denoted by q(a), can be estimated using: q(a) = 5Mx. 5Dx, in which 5Dx is the proportion of dead children of mothers of the age group (x, x+5) and 5Mx serves as the age-specific coefficient, called the multiplier. There are four regression equations built corresponding to four life table models from Coale and Demeny (Trussell regression) to estimate q(a). The regression equation is used to calculate the infant mortality rate of 1q0 and the probability of death between 1 and 5 years old 4q1 and the life expectancy e0 corresponding to the value of q(a) in each life table model (for both sexes).
The United Nations computerized its indirect estimates of mortality using the MORTPAK software. In this software, there is a CEBCS procedure for estimating 1q0 and a MATCH procedure for estimating e0. After using the CEBCS procedure, some of the coefficients of the estimation regression equation q(a) mentioned above were adjusted, and a software program called QFIVE was built to calculate 1q0 and 4q1. The United Nations Population Fund (UNFPA) then developed demographic estimation tools where child mortality estimations are carried out in excel1.
2.3. Life expectancy at birth (e0) and under-5 children mortality rate (U5MR) estimation methods
The life expectancy at birth (also known as the "Average Life Expectancy from Birth") is estimated indirectly using the Feeney Life Table, an estimation method studied and proposed by
1 Source: http://demographicestimation.iussp.org/content/indirect-estimation-child-mortality.
360 | RESULTS - THE VIET NAM POPULATION AND HOUSING CENSUS OF 00:00 HOURS ON 1 APRIL 2019
American demographer Dr. Griffith Feeney. This method uses a spreadsheet to estimate the average expected life expectancy of a person at birth.
This method involves creating a synthetic population (usually 1,000, 10,000, or 100,000 people) and calculating and a survival probability (or probability of death = 1 - survival probability) across ages. Through research, Dr. Griffith Feeney has built 4 models of survival probability (or probability of death) that can be used in all countries and territories. The four survival probability models are called East, Western, South, and North. Which model to use depends on the socio-economic development conditions and demographic transition process of each country or territory.
The Griffith Feeney Life Table is designed to estimate the life expectancy at birth for males and females separately. After the results for each sex are tabulated, the nationwide life expectancy at birth is estimated proportionally to the sex ratio at birth.
This method is used to estimate the life expectancy at birth in Viet Nam. Through studies of demographic characteristics and international recommendations, the North survival probability model is most suitable for Viet Nam.
The under-5 child mortality rate is the probability of death among children less than five years old estimated using the life table.
2.4. Maternal mortality rate (MMR) estimation method
The maternal mortality rate is calculated using guidelines for estimating maternal mortality from the World Health Organization (WHO). Specifically, the methods used to estimate this indicator were as follows:
The General Growth Balance (GGB) method and the Synthetic Extinct Generation (SEG) method were used to evaluate and adjust data on reported deaths. The GGB method is based on three main assumptions: (1) it is a closed population, meaning the population is minimally or not affected by migration, (2) the population survey coverage and the number of deaths by age are constant; and (3) there is accurate information on age and population.
The SEG method uses one more hypothesis, apart from the three assumptions of the GGB method: there is no change in the coverage of the two surveys. The basic principle of these two methods is to assess the adequacy of the number of deaths reported by comparing the age distribution of the living population with the age distribution of the reported deaths.
The issue of changing census coverage (distorting population growth rates across all ages) can be addressed by combining the SEG and GGB methods: first use the GGB method to estimate the change in the coverage of the census, readjust the data given the determined changes in the census coverage, then use the SEG method.
Neither the GGB method nor the SEG method systematically assess the different types of errors, nor do they reach consensus on which method to use or which age range can be used as a final estimate.
RESULTS - THE VIET NAM POPULATION AND HOUSING CENSUS OF 00:00 HOURS ON 1 APRIL 2019 | 361
The results are confirmed when the appropriate method and its assumptions are met, and the method has convincing arguments for age omission models. However, the results will have errors if the method is not appropriate, the adequacy varies with age and when the population is affected by migration. If there is no reliable information to adequately evaluate the errors, it is best to use a combination of the two methods (GGB and SEG). Many demographers consider the GGB-SEG combination method to be the safest approach when information on the death reporting error is lacking2. Therefore, the estimated number of maternal deaths in 2019 was based on the combined GGB-SEG method adjusting the number of maternal deaths and the P / F ratio method to adjust the number of live births. The results from these two methods was used to calculate maternal mortality.
The following data were also used to estimate maternal mortality:
- Distribution of age and sex of the female population according to the 2009 and 2019 Population and Housing Census.
- Distribution of age and sex of the deaths among females in the 12 months prior to the Census according to the 2009 and 2019 Population and Housing Census.
- Number of children ever born and the number of children born alive divided by women's ages according to the 2009 and 2019 Census.
2 Kenneth Hill, Danzhen You and Yoonjoung Choi “Death distribution methods for estimating adult mortality: Sensitivity analysis with simulated data errors” in Demographic Research, 21(9), published on 25 August 2009, download via: http://www.demographic-research.org/Volumes/Vol21/9/
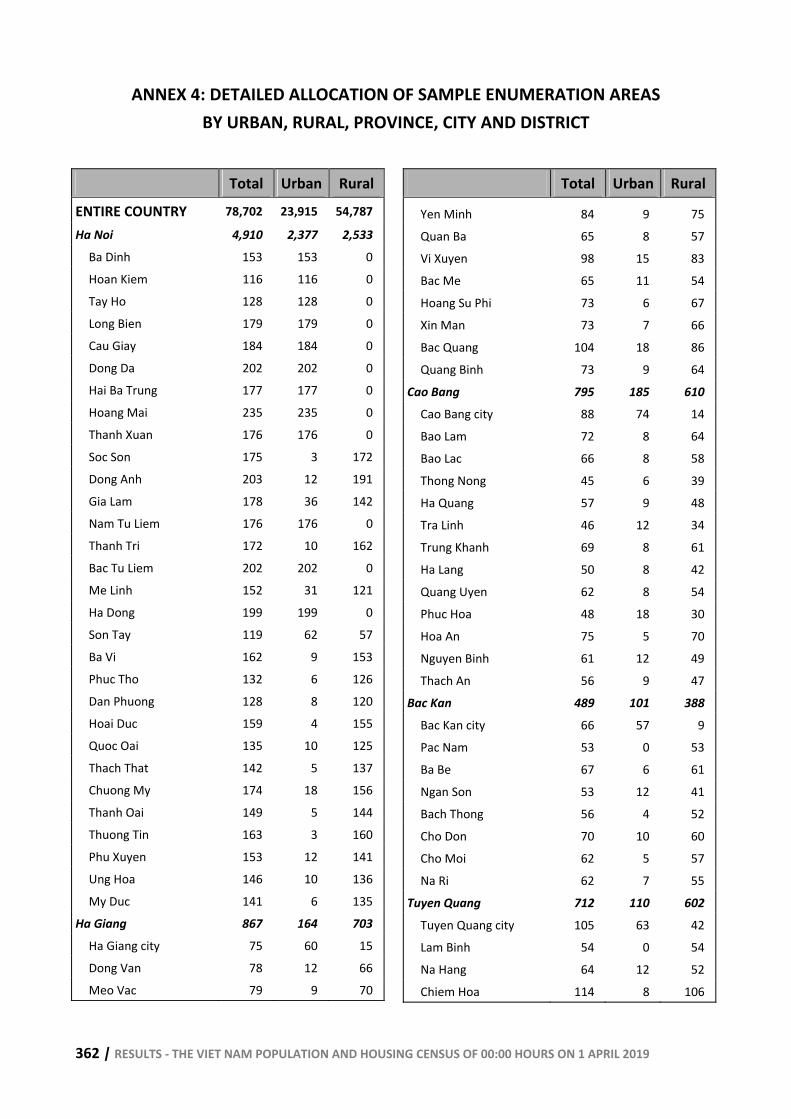
362 | RESULTS - THE VIET NAM POPULATION AND HOUSING CENSUS OF 00:00 HOURS ON 1 APRIL 2019
ANNEX 4: DETAILED ALLOCATION OF SAMPLE ENUMERATION AREAS BY URBAN, RURAL, PROVINCE, CITY AND DISTRICT
Total Urban Rural
ENTIRE COUNTRY 78,702 23,915 54,787
Ha Noi 4,910 2,377 2,533 Ba Dinh 153 153 0 Hoan Kiem 116 116 0 Tay Ho 128 128 0 Long Bien 179 179 0 Cau Giay 184 184 0 Dong Da 202 202 0 Hai Ba Trung 177 177 0 Hoang Mai 235 235 0 Thanh Xuan 176 176 0 Soc Son 175 3 172 Dong Anh 203 12 191 Gia Lam 178 36 142 Nam Tu Liem 176 176 0 Thanh Tri 172 10 162 Bac Tu Liem 202 202 0 Me Linh 152 31 121 Ha Dong 199 199 0 Son Tay 119 62 57 Ba Vi 162 9 153 Phuc Tho 132 6 126 Dan Phuong 128 8 120 Hoai Duc 159 4 155 Quoc Oai 135 10 125 Thach That 142 5 137 Chuong My 174 18 156 Thanh Oai 149 5 144 Thuong Tin 163 3 160 Phu Xuyen 153 12 141 Ung Hoa 146 10 136 My Duc 141 6 135
Ha Giang 867 164 703 Ha Giang city 75 60 15 Dong Van 78 12 66 Meo Vac 79 9 70
Total Urban Rural
Yen Minh 84 9 75 Quan Ba 65 8 57 Vi Xuyen 98 15 83 Bac Me 65 11 54 Hoang Su Phi 73 6 67 Xin Man 73 7 66 Bac Quang 104 18 86 Quang Binh 73 9 64
Cao Bang 795 185 610 Cao Bang city 88 74 14 Bao Lam 72 8 64 Bao Lac 66 8 58 Thong Nong 45 6 39 Ha Quang 57 9 48 Tra Linh 46 12 34 Trung Khanh 69 8 61 Ha Lang 50 8 42 Quang Uyen 62 8 54 Phuc Hoa 48 18 30 Hoa An 75 5 70 Nguyen Binh 61 12 49 Thach An 56 9 47
Bac Kan 489 101 388 Bac Kan city 66 57 9 Pac Nam 53 0 53 Ba Be 67 6 61 Ngan Son 53 12 41 Bach Thong 56 4 52 Cho Don 70 10 60 Cho Moi 62 5 57 Na Ri 62 7 55
Tuyen Quang 712 110 602 Tuyen Quang city 105 63 42 Lam Binh 54 0 54 Na Hang 64 12 52 Chiem Hoa 114 8 106
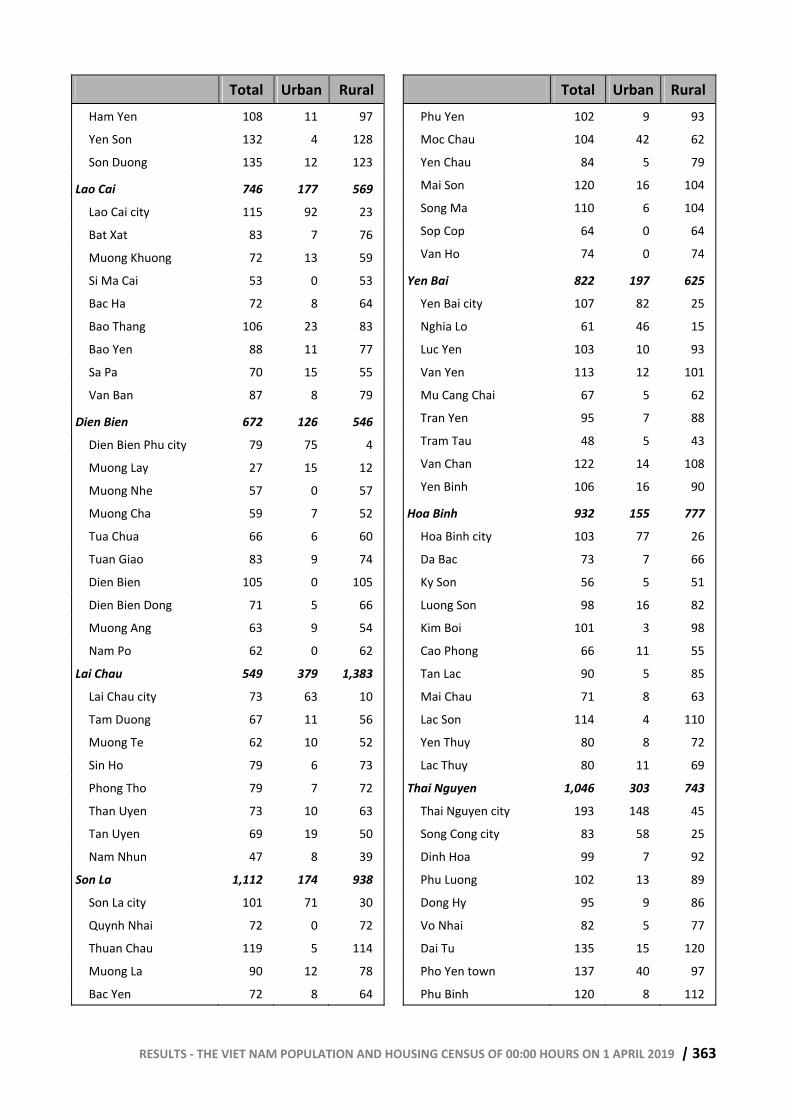
RESULTS - THE VIET NAM POPULATION AND HOUSING CENSUS OF 00:00 HOURS ON 1 APRIL 2019 | 363
Total Urban Rural Ham Yen 108 11 97
Yen Son 132 4 128
Son Duong 135 12 123
Lao Cai 746 177 569
Lao Cai city 115 92 23
Bat Xat 83 7 76
Muong Khuong 72 13 59
Si Ma Cai 53 0 53
Bac Ha 72 8 64
Bao Thang 106 23 83
Bao Yen 88 11 77
Sa Pa 70 15 55
Van Ban 87 8 79
Dien Bien 672 126 546
Dien Bien Phu city 79 75 4
Muong Lay 27 15 12
Muong Nhe 57 0 57
Muong Cha 59 7 52
Tua Chua 66 6 60
Tuan Giao 83 9 74
Dien Bien 105 0 105
Dien Bien Dong 71 5 66
Muong Ang 63 9 54
Nam Po 62 0 62
Lai Chau 549 379 1,383
Lai Chau city 73 63 10
Tam Duong 67 11 56
Muong Te 62 10 52
Sin Ho 79 6 73
Phong Tho 79 7 72
Than Uyen 73 10 63
Tan Uyen 69 19 50
Nam Nhun 47 8 39
Son La 1,112 174 938
Son La city 101 71 30
Quynh Nhai 72 0 72
Thuan Chau 119 5 114
Muong La 90 12 78
Bac Yen 72 8 64
Total Urban Rural Phu Yen 102 9 93
Moc Chau 104 42 62
Yen Chau 84 5 79
Mai Son 120 16 104
Song Ma 110 6 104
Sop Cop 64 0 64
Van Ho 74 0 74
Yen Bai 822 197 625
Yen Bai city 107 82 25
Nghia Lo 61 46 15
Luc Yen 103 10 93
Van Yen 113 12 101
Mu Cang Chai 67 5 62
Tran Yen 95 7 88
Tram Tau 48 5 43
Van Chan 122 14 108
Yen Binh 106 16 90
Hoa Binh 932 155 777
Hoa Binh city 103 77 26
Da Bac 73 7 66
Ky Son 56 5 51
Luong Son 98 16 82
Kim Boi 101 3 98
Cao Phong 66 11 55
Tan Lac 90 5 85
Mai Chau 71 8 63
Lac Son 114 4 110
Yen Thuy 80 8 72
Lac Thuy 80 11 69
Thai Nguyen 1,046 303 743
Thai Nguyen city 193 148 45
Song Cong city 83 58 25
Dinh Hoa 99 7 92
Phu Luong 102 13 89
Dong Hy 95 9 86
Vo Nhai 82 5 77
Dai Tu 135 15 120
Pho Yen town 137 40 97
Phu Binh 120 8 112
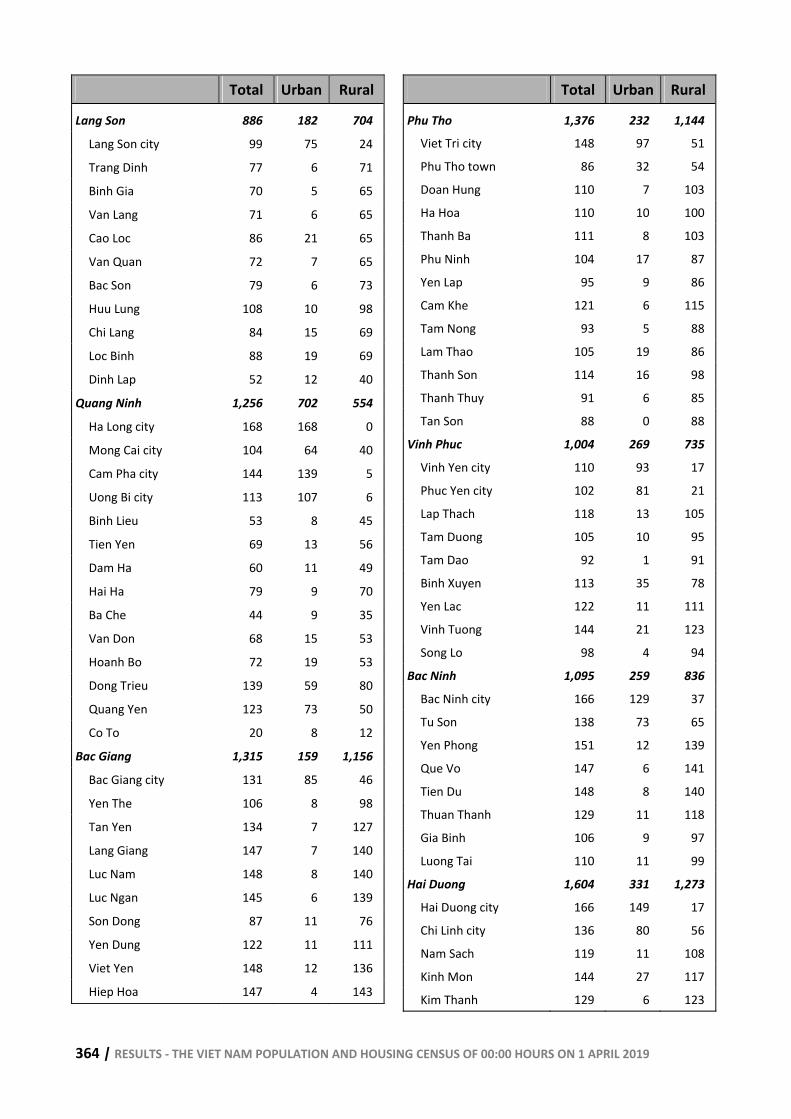
364 | RESULTS - THE VIET NAM POPULATION AND HOUSING CENSUS OF 00:00 HOURS ON 1 APRIL 2019
Total Urban Rural
Lang Son 886 182 704
Lang Son city 99 75 24
Trang Dinh 77 6 71
Binh Gia 70 5 65
Van Lang 71 6 65
Cao Loc 86 21 65
Van Quan 72 7 65
Bac Son 79 6 73
Huu Lung 108 10 98
Chi Lang 84 15 69
Loc Binh 88 19 69
Dinh Lap 52 12 40
Quang Ninh 1,256 702 554
Ha Long city 168 168 0
Mong Cai city 104 64 40
Cam Pha city 144 139 5
Uong Bi city 113 107 6
Binh Lieu 53 8 45
Tien Yen 69 13 56
Dam Ha 60 11 49
Hai Ha 79 9 70
Ba Che 44 9 35
Van Don 68 15 53
Hoanh Bo 72 19 53
Dong Trieu 139 59 80
Quang Yen 123 73 50
Co To 20 8 12
Bac Giang 1,315 159 1,156
Bac Giang city 131 85 46
Yen The 106 8 98
Tan Yen 134 7 127
Lang Giang 147 7 140
Luc Nam 148 8 140
Luc Ngan 145 6 139
Son Dong 87 11 76
Yen Dung 122 11 111
Viet Yen 148 12 136
Hiep Hoa 147 4 143
Total Urban Rural
Phu Tho 1,376 232 1,144
Viet Tri city 148 97 51
Phu Tho town 86 32 54
Doan Hung 110 7 103
Ha Hoa 110 10 100
Thanh Ba 111 8 103
Phu Ninh 104 17 87
Yen Lap 95 9 86
Cam Khe 121 6 115
Tam Nong 93 5 88
Lam Thao 105 19 86
Thanh Son 114 16 98
Thanh Thuy 91 6 85
Tan Son 88 0 88
Vinh Phuc 1,004 269 735
Vinh Yen city 110 93 17
Phuc Yen city 102 81 21
Lap Thach 118 13 105
Tam Duong 105 10 95
Tam Dao 92 1 91
Binh Xuyen 113 35 78
Yen Lac 122 11 111
Vinh Tuong 144 21 123
Song Lo 98 4 94
Bac Ninh 1,095 259 836
Bac Ninh city 166 129 37
Tu Son 138 73 65
Yen Phong 151 12 139
Que Vo 147 6 141
Tien Du 148 8 140
Thuan Thanh 129 11 118
Gia Binh 106 9 97
Luong Tai 110 11 99
Hai Duong 1,604 331 1,273
Hai Duong city 166 149 17
Chi Linh city 136 80 56
Nam Sach 119 11 108
Kinh Mon 144 27 117
Kim Thanh 129 6 123
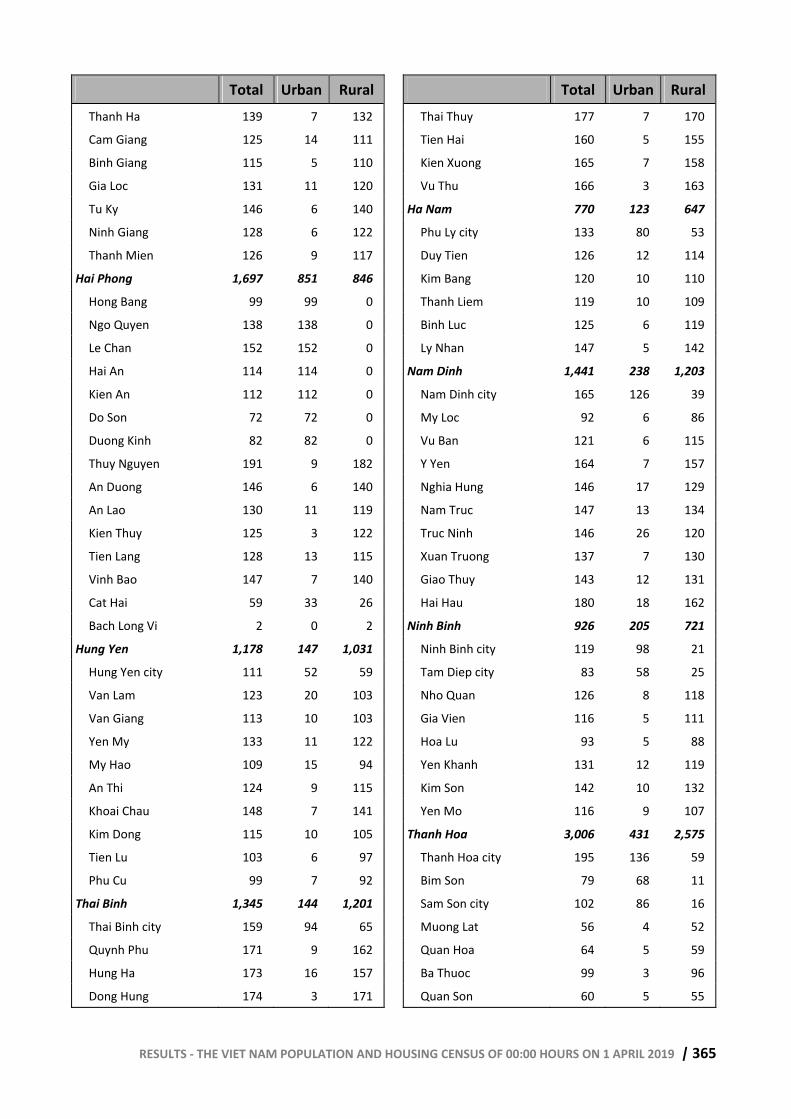
RESULTS - THE VIET NAM POPULATION AND HOUSING CENSUS OF 00:00 HOURS ON 1 APRIL 2019 | 365
Total Urban Rural Thanh Ha 139 7 132
Cam Giang 125 14 111
Binh Giang 115 5 110
Gia Loc 131 11 120
Tu Ky 146 6 140
Ninh Giang 128 6 122
Thanh Mien 126 9 117
Hai Phong 1,697 851 846
Hong Bang 99 99 0
Ngo Quyen 138 138 0
Le Chan 152 152 0
Hai An 114 114 0
Kien An 112 112 0
Do Son 72 72 0
Duong Kinh 82 82 0
Thuy Nguyen 191 9 182
An Duong 146 6 140
An Lao 130 11 119
Kien Thuy 125 3 122
Tien Lang 128 13 115
Vinh Bao 147 7 140
Cat Hai 59 33 26
Bach Long Vi 2 0 2
Hung Yen 1,178 147 1,031
Hung Yen city 111 52 59
Van Lam 123 20 103
Van Giang 113 10 103
Yen My 133 11 122
My Hao 109 15 94
An Thi 124 9 115
Khoai Chau 148 7 141
Kim Dong 115 10 105
Tien Lu 103 6 97
Phu Cu 99 7 92
Thai Binh 1,345 144 1,201
Thai Binh city 159 94 65
Quynh Phu 171 9 162
Hung Ha 173 16 157
Dong Hung 174 3 171
Total Urban Rural Thai Thuy 177 7 170
Tien Hai 160 5 155
Kien Xuong 165 7 158
Vu Thu 166 3 163
Ha Nam 770 123 647
Phu Ly city 133 80 53
Duy Tien 126 12 114
Kim Bang 120 10 110
Thanh Liem 119 10 109
Binh Luc 125 6 119
Ly Nhan 147 5 142
Nam Dinh 1,441 238 1,203
Nam Dinh city 165 126 39
My Loc 92 6 86
Vu Ban 121 6 115
Y Yen 164 7 157
Nghia Hung 146 17 129
Nam Truc 147 13 134
Truc Ninh 146 26 120
Xuan Truong 137 7 130
Giao Thuy 143 12 131
Hai Hau 180 18 162
Ninh Binh 926 205 721
Ninh Binh city 119 98 21
Tam Diep city 83 58 25
Nho Quan 126 8 118
Gia Vien 116 5 111
Hoa Lu 93 5 88
Yen Khanh 131 12 119
Kim Son 142 10 132
Yen Mo 116 9 107
Thanh Hoa 3,006 431 2,575
Thanh Hoa city 195 136 59
Bim Son 79 68 11
Sam Son city 102 86 16
Muong Lat 56 4 52
Quan Hoa 64 5 59
Ba Thuoc 99 3 96
Quan Son 60 5 55
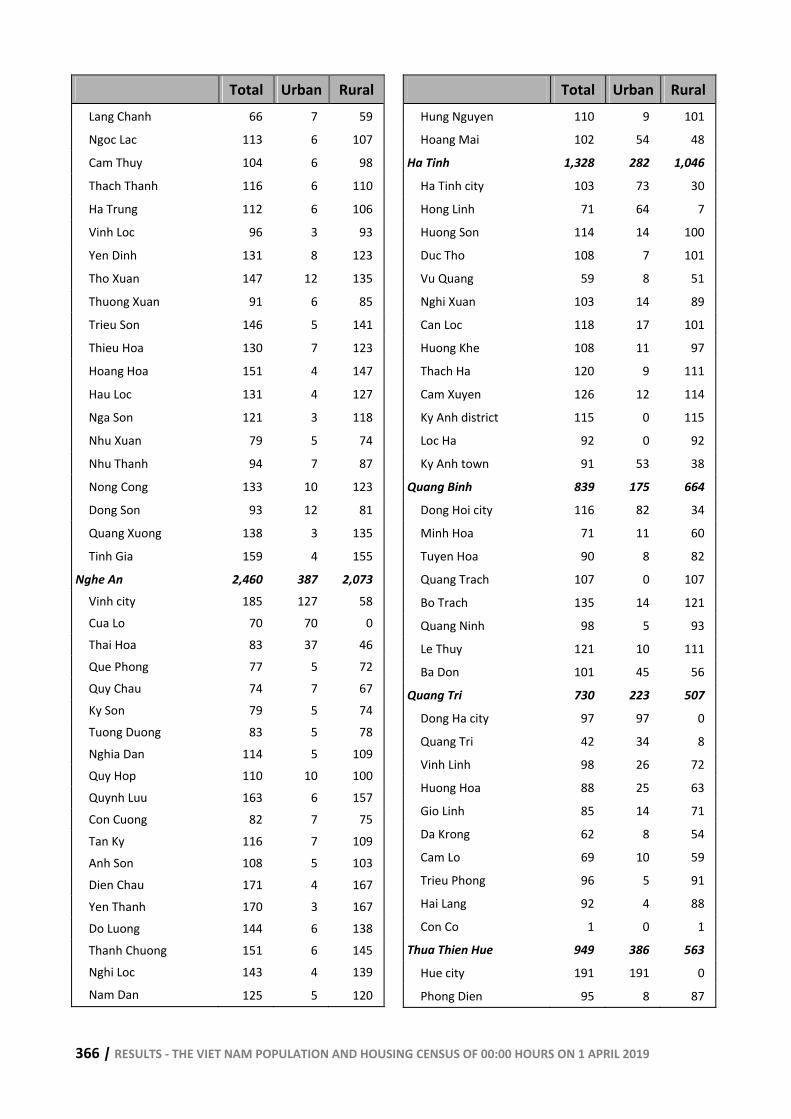
366 | RESULTS - THE VIET NAM POPULATION AND HOUSING CENSUS OF 00:00 HOURS ON 1 APRIL 2019
Total Urban Rural Lang Chanh 66 7 59
Ngoc Lac 113 6 107
Cam Thuy 104 6 98
Thach Thanh 116 6 110
Ha Trung 112 6 106
Vinh Loc 96 3 93
Yen Dinh 131 8 123
Tho Xuan 147 12 135
Thuong Xuan 91 6 85
Trieu Son 146 5 141
Thieu Hoa 130 7 123
Hoang Hoa 151 4 147
Hau Loc 131 4 127
Nga Son 121 3 118
Nhu Xuan 79 5 74
Nhu Thanh 94 7 87
Nong Cong 133 10 123
Dong Son 93 12 81
Quang Xuong 138 3 135
Tinh Gia 159 4 155
Nghe An 2,460 387 2,073 Vinh city 185 127 58 Cua Lo 70 70 0 Thai Hoa 83 37 46 Que Phong 77 5 72 Quy Chau 74 7 67 Ky Son 79 5 74 Tuong Duong 83 5 78 Nghia Dan 114 5 109 Quy Hop 110 10 100 Quynh Luu 163 6 157 Con Cuong 82 7 75 Tan Ky 116 7 109 Anh Son 108 5 103 Dien Chau 171 4 167 Yen Thanh 170 3 167 Do Luong 144 6 138 Thanh Chuong 151 6 145 Nghi Loc 143 4 139
Nam Dan 125 5 120
Total Urban Rural Hung Nguyen 110 9 101
Hoang Mai 102 54 48
Ha Tinh 1,328 282 1,046
Ha Tinh city 103 73 30
Hong Linh 71 64 7
Huong Son 114 14 100
Duc Tho 108 7 101
Vu Quang 59 8 51
Nghi Xuan 103 14 89
Can Loc 118 17 101
Huong Khe 108 11 97
Thach Ha 120 9 111
Cam Xuyen 126 12 114
Ky Anh district 115 0 115
Loc Ha 92 0 92
Ky Anh town 91 53 38
Quang Binh 839 175 664
Dong Hoi city 116 82 34
Minh Hoa 71 11 60
Tuyen Hoa 90 8 82
Quang Trach 107 0 107
Bo Trach 135 14 121
Quang Ninh 98 5 93
Le Thuy 121 10 111
Ba Don 101 45 56
Quang Tri 730 223 507
Dong Ha city 97 97 0
Quang Tri 42 34 8
Vinh Linh 98 26 72
Huong Hoa 88 25 63
Gio Linh 85 14 71
Da Krong 62 8 54
Cam Lo 69 10 59
Trieu Phong 96 5 91
Hai Lang 92 4 88
Con Co 1 0 1
Thua Thien Hue 949 386 563
Hue city 191 191 0
Phong Dien 95 8 87
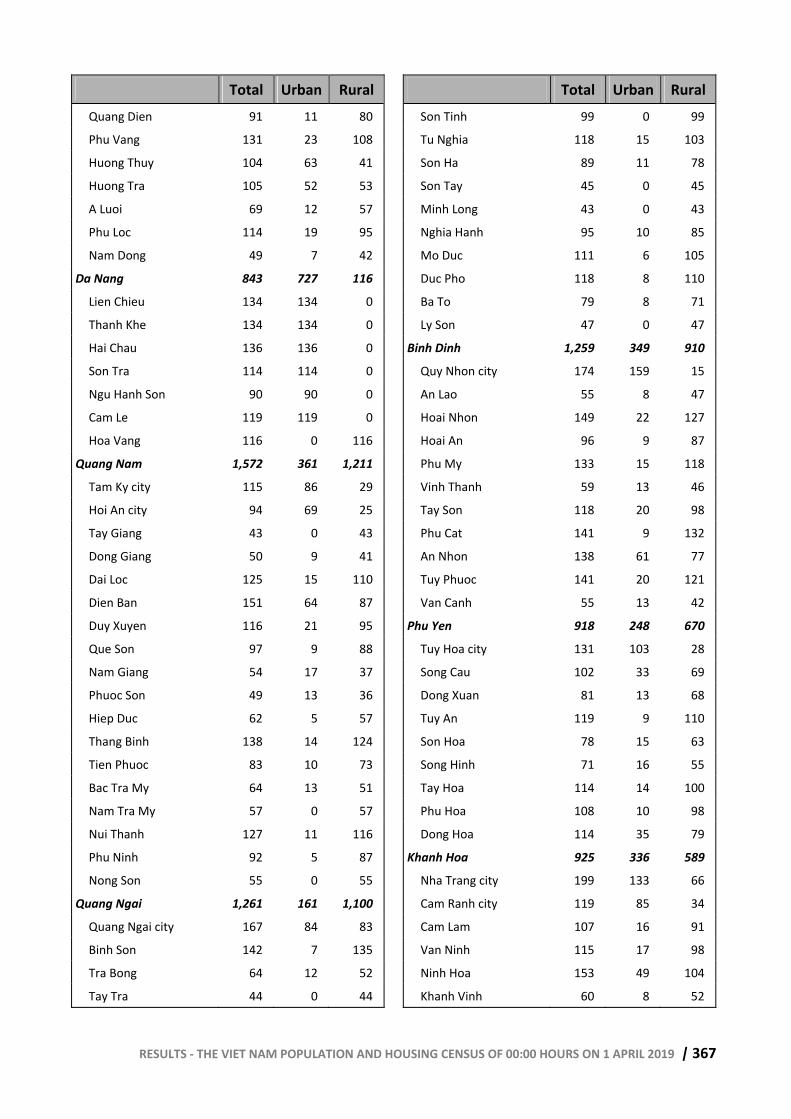
RESULTS - THE VIET NAM POPULATION AND HOUSING CENSUS OF 00:00 HOURS ON 1 APRIL 2019 | 367
Total Urban Rural Quang Dien 91 11 80
Phu Vang 131 23 108
Huong Thuy 104 63 41
Huong Tra 105 52 53
A Luoi 69 12 57
Phu Loc 114 19 95
Nam Dong 49 7 42
Da Nang 843 727 116
Lien Chieu 134 134 0
Thanh Khe 134 134 0
Hai Chau 136 136 0
Son Tra 114 114 0
Ngu Hanh Son 90 90 0
Cam Le 119 119 0
Hoa Vang 116 0 116
Quang Nam 1,572 361 1,211
Tam Ky city 115 86 29
Hoi An city 94 69 25
Tay Giang 43 0 43
Dong Giang 50 9 41
Dai Loc 125 15 110
Dien Ban 151 64 87
Duy Xuyen 116 21 95
Que Son 97 9 88
Nam Giang 54 17 37
Phuoc Son 49 13 36
Hiep Duc 62 5 57
Thang Binh 138 14 124
Tien Phuoc 83 10 73
Bac Tra My 64 13 51
Nam Tra My 57 0 57
Nui Thanh 127 11 116
Phu Ninh 92 5 87
Nong Son 55 0 55
Quang Ngai 1,261 161 1,100
Quang Ngai city 167 84 83
Binh Son 142 7 135
Tra Bong 64 12 52
Tay Tra 44 0 44
Total Urban Rural Son Tinh 99 0 99
Tu Nghia 118 15 103
Son Ha 89 11 78
Son Tay 45 0 45
Minh Long 43 0 43
Nghia Hanh 95 10 85
Mo Duc 111 6 105
Duc Pho 118 8 110
Ba To 79 8 71
Ly Son 47 0 47
Binh Dinh 1,259 349 910
Quy Nhon city 174 159 15
An Lao 55 8 47
Hoai Nhon 149 22 127
Hoai An 96 9 87
Phu My 133 15 118
Vinh Thanh 59 13 46
Tay Son 118 20 98
Phu Cat 141 9 132
An Nhon 138 61 77
Tuy Phuoc 141 20 121
Van Canh 55 13 42
Phu Yen 918 248 670
Tuy Hoa city 131 103 28
Song Cau 102 33 69
Dong Xuan 81 13 68
Tuy An 119 9 110
Son Hoa 78 15 63
Song Hinh 71 16 55
Tay Hoa 114 14 100
Phu Hoa 108 10 98
Dong Hoa 114 35 79
Khanh Hoa 925 336 589
Nha Trang city 199 133 66
Cam Ranh city 119 85 34
Cam Lam 107 16 91
Van Ninh 115 17 98
Ninh Hoa 153 49 104
Khanh Vinh 60 8 52
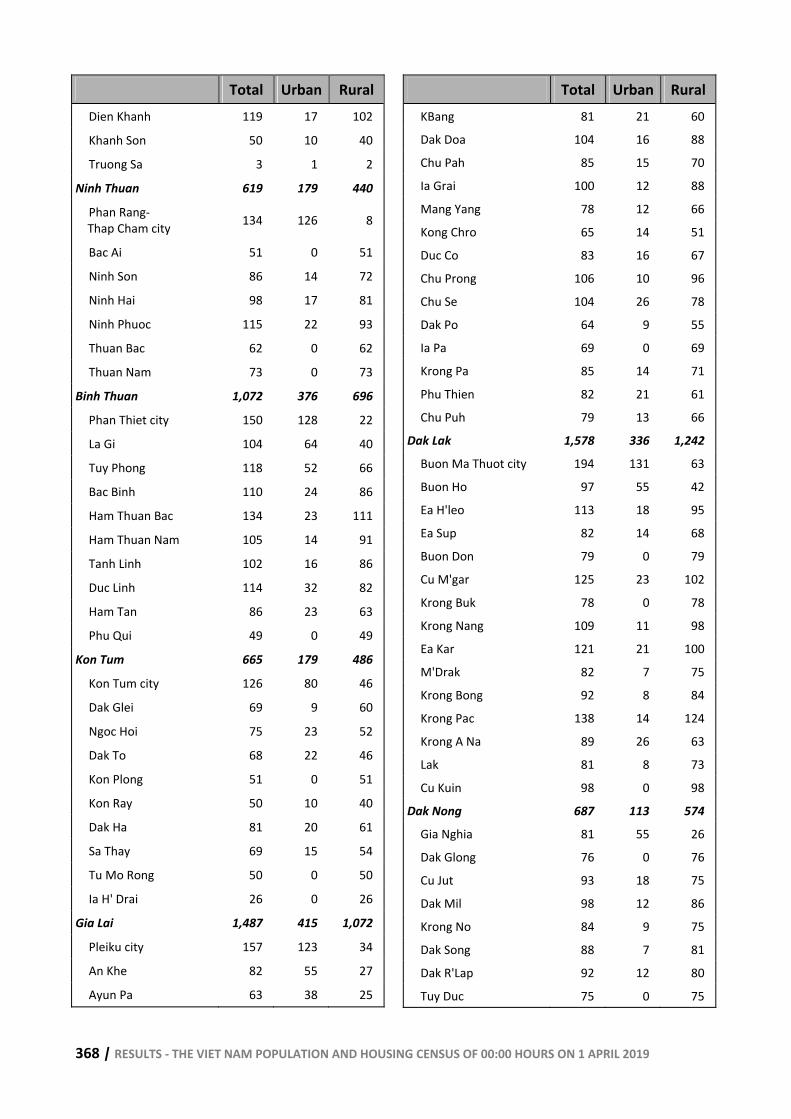
368 | RESULTS - THE VIET NAM POPULATION AND HOUSING CENSUS OF 00:00 HOURS ON 1 APRIL 2019
Total Urban Rural Dien Khanh 119 17 102
Khanh Son 50 10 40
Truong Sa 3 1 2
Ninh Thuan 619 179 440
Phan Rang- Thap Cham city 134 126 8
Bac Ai 51 0 51
Ninh Son 86 14 72
Ninh Hai 98 17 81
Ninh Phuoc 115 22 93
Thuan Bac 62 0 62
Thuan Nam 73 0 73
Binh Thuan 1,072 376 696
Phan Thiet city 150 128 22
La Gi 104 64 40
Tuy Phong 118 52 66
Bac Binh 110 24 86
Ham Thuan Bac 134 23 111
Ham Thuan Nam 105 14 91
Tanh Linh 102 16 86
Duc Linh 114 32 82
Ham Tan 86 23 63
Phu Qui 49 0 49
Kon Tum 665 179 486
Kon Tum city 126 80 46
Dak Glei 69 9 60
Ngoc Hoi 75 23 52
Dak To 68 22 46
Kon Plong 51 0 51
Kon Ray 50 10 40
Dak Ha 81 20 61
Sa Thay 69 15 54
Tu Mo Rong 50 0 50
Ia H' Drai 26 0 26
Gia Lai 1,487 415 1,072
Pleiku city 157 123 34
An Khe 82 55 27
Ayun Pa 63 38 25
Total Urban Rural KBang 81 21 60
Dak Doa 104 16 88
Chu Pah 85 15 70
Ia Grai 100 12 88
Mang Yang 78 12 66
Kong Chro 65 14 51
Duc Co 83 16 67
Chu Prong 106 10 96
Chu Se 104 26 78
Dak Po 64 9 55
Ia Pa 69 0 69
Krong Pa 85 14 71
Phu Thien 82 21 61
Chu Puh 79 13 66
Dak Lak 1,578 336 1,242
Buon Ma Thuot city 194 131 63
Buon Ho 97 55 42
Ea H'leo 113 18 95
Ea Sup 82 14 68
Buon Don 79 0 79
Cu M'gar 125 23 102
Krong Buk 78 0 78
Krong Nang 109 11 98
Ea Kar 121 21 100
M'Drak 82 7 75
Krong Bong 92 8 84
Krong Pac 138 14 124
Krong A Na 89 26 63
Lak 81 8 73
Cu Kuin 98 0 98
Dak Nong 687 113 574
Gia Nghia 81 55 26
Dak Glong 76 0 76
Cu Jut 93 18 75
Dak Mil 98 12 86
Krong No 84 9 75
Dak Song 88 7 81
Dak R'Lap 92 12 80
Tuy Duc 75 0 75
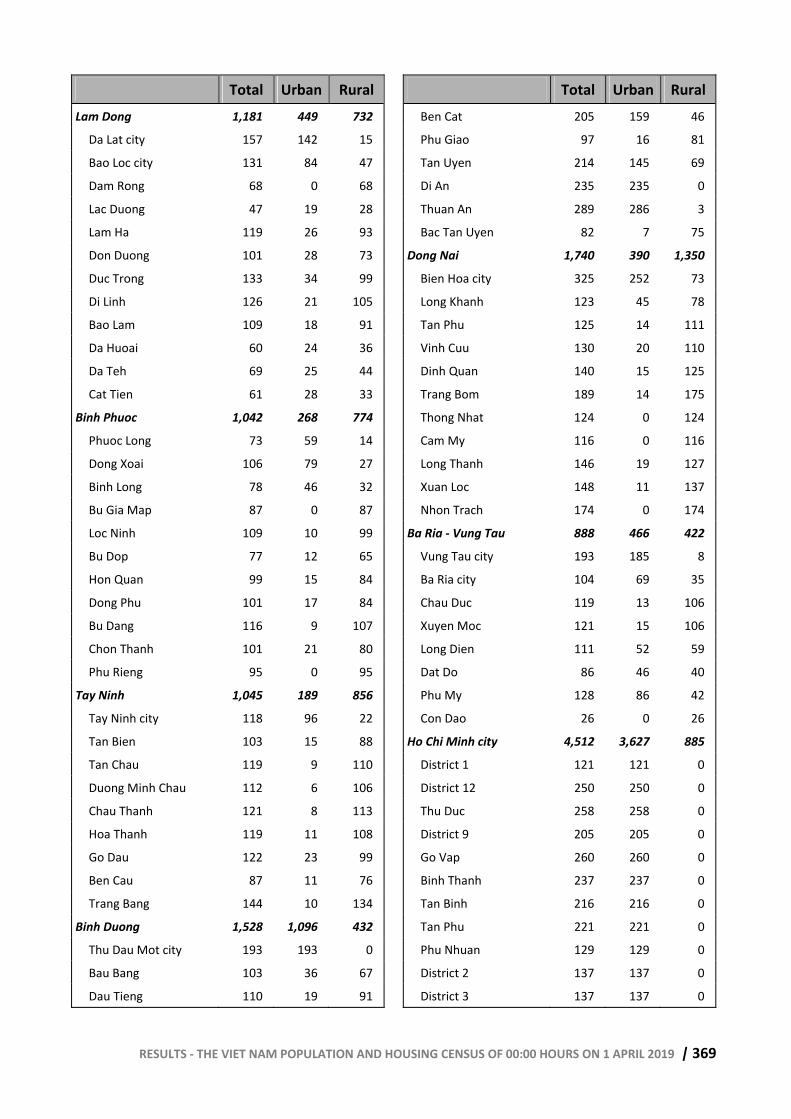
RESULTS - THE VIET NAM POPULATION AND HOUSING CENSUS OF 00:00 HOURS ON 1 APRIL 2019 | 369
Total Urban Rural Lam Dong 1,181 449 732
Da Lat city 157 142 15
Bao Loc city 131 84 47
Dam Rong 68 0 68
Lac Duong 47 19 28
Lam Ha 119 26 93
Don Duong 101 28 73
Duc Trong 133 34 99
Di Linh 126 21 105
Bao Lam 109 18 91
Da Huoai 60 24 36
Da Teh 69 25 44
Cat Tien 61 28 33
Binh Phuoc 1,042 268 774
Phuoc Long 73 59 14
Dong Xoai 106 79 27
Binh Long 78 46 32
Bu Gia Map 87 0 87
Loc Ninh 109 10 99
Bu Dop 77 12 65
Hon Quan 99 15 84
Dong Phu 101 17 84
Bu Dang 116 9 107
Chon Thanh 101 21 80
Phu Rieng 95 0 95
Tay Ninh 1,045 189 856
Tay Ninh city 118 96 22
Tan Bien 103 15 88
Tan Chau 119 9 110
Duong Minh Chau 112 6 106
Chau Thanh 121 8 113
Hoa Thanh 119 11 108
Go Dau 122 23 99
Ben Cau 87 11 76
Trang Bang 144 10 134
Binh Duong 1,528 1,096 432
Thu Dau Mot city 193 193 0
Bau Bang 103 36 67
Dau Tieng 110 19 91
Total Urban Rural Ben Cat 205 159 46
Phu Giao 97 16 81
Tan Uyen 214 145 69
Di An 235 235 0
Thuan An 289 286 3
Bac Tan Uyen 82 7 75
Dong Nai 1,740 390 1,350
Bien Hoa city 325 252 73
Long Khanh 123 45 78
Tan Phu 125 14 111
Vinh Cuu 130 20 110
Dinh Quan 140 15 125
Trang Bom 189 14 175
Thong Nhat 124 0 124
Cam My 116 0 116
Long Thanh 146 19 127
Xuan Loc 148 11 137
Nhon Trach 174 0 174
Ba Ria - Vung Tau 888 466 422
Vung Tau city 193 185 8
Ba Ria city 104 69 35
Chau Duc 119 13 106
Xuyen Moc 121 15 106
Long Dien 111 52 59
Dat Do 86 46 40
Phu My 128 86 42
Con Dao 26 0 26
Ho Chi Minh city 4,512 3,627 885
District 1 121 121 0
District 12 250 250 0
Thu Duc 258 258 0
District 9 205 205 0
Go Vap 260 260 0
Binh Thanh 237 237 0
Tan Binh 216 216 0
Tan Phu 221 221 0
Phu Nhuan 129 129 0
District 2 137 137 0
District 3 137 137 0
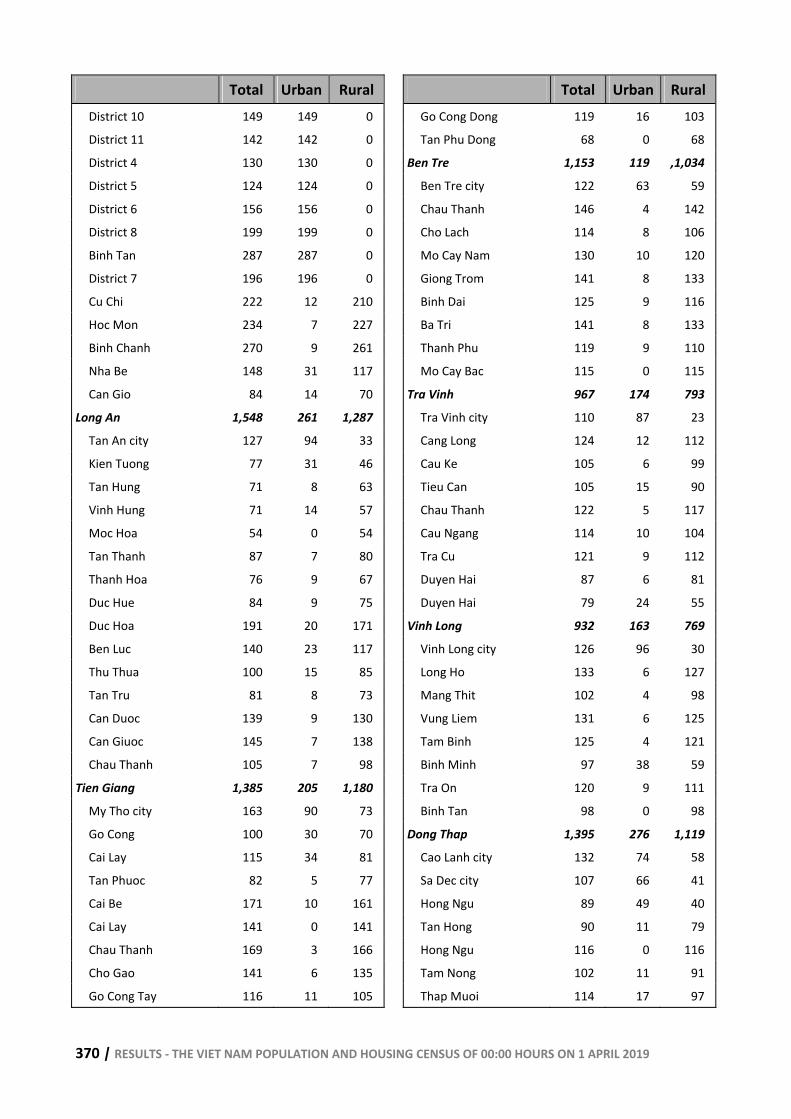
370 | RESULTS - THE VIET NAM POPULATION AND HOUSING CENSUS OF 00:00 HOURS ON 1 APRIL 2019
Total Urban Rural District 10 149 149 0
District 11 142 142 0
District 4 130 130 0
District 5 124 124 0
District 6 156 156 0
District 8 199 199 0
Binh Tan 287 287 0
District 7 196 196 0
Cu Chi 222 12 210
Hoc Mon 234 7 227
Binh Chanh 270 9 261
Nha Be 148 31 117
Can Gio 84 14 70
Long An 1,548 261 1,287
Tan An city 127 94 33
Kien Tuong 77 31 46
Tan Hung 71 8 63
Vinh Hung 71 14 57
Moc Hoa 54 0 54
Tan Thanh 87 7 80
Thanh Hoa 76 9 67
Duc Hue 84 9 75
Duc Hoa 191 20 171
Ben Luc 140 23 117
Thu Thua 100 15 85
Tan Tru 81 8 73
Can Duoc 139 9 130
Can Giuoc 145 7 138
Chau Thanh 105 7 98
Tien Giang 1,385 205 1,180
My Tho city 163 90 73
Go Cong 100 30 70
Cai Lay 115 34 81
Tan Phuoc 82 5 77
Cai Be 171 10 161
Cai Lay 141 0 141
Chau Thanh 169 3 166
Cho Gao 141 6 135
Go Cong Tay 116 11 105
Total Urban Rural Go Cong Dong 119 16 103
Tan Phu Dong 68 0 68
Ben Tre 1,153 119 ,1,034
Ben Tre city 122 63 59
Chau Thanh 146 4 142
Cho Lach 114 8 106
Mo Cay Nam 130 10 120
Giong Trom 141 8 133
Binh Dai 125 9 116
Ba Tri 141 8 133
Thanh Phu 119 9 110
Mo Cay Bac 115 0 115
Tra Vinh 967 174 793
Tra Vinh city 110 87 23
Cang Long 124 12 112
Cau Ke 105 6 99
Tieu Can 105 15 90
Chau Thanh 122 5 117
Cau Ngang 114 10 104
Tra Cu 121 9 112
Duyen Hai 87 6 81
Duyen Hai 79 24 55
Vinh Long 932 163 769
Vinh Long city 126 96 30
Long Ho 133 6 127
Mang Thit 102 4 98
Vung Liem 131 6 125
Tam Binh 125 4 121
Binh Minh 97 38 59
Tra On 120 9 111
Binh Tan 98 0 98
Dong Thap 1,395 276 1,119
Cao Lanh city 132 74 58
Sa Dec city 107 66 41
Hong Ngu 89 49 40
Tan Hong 90 11 79
Hong Ngu 116 0 116
Tam Nong 102 11 91
Thap Muoi 114 17 97
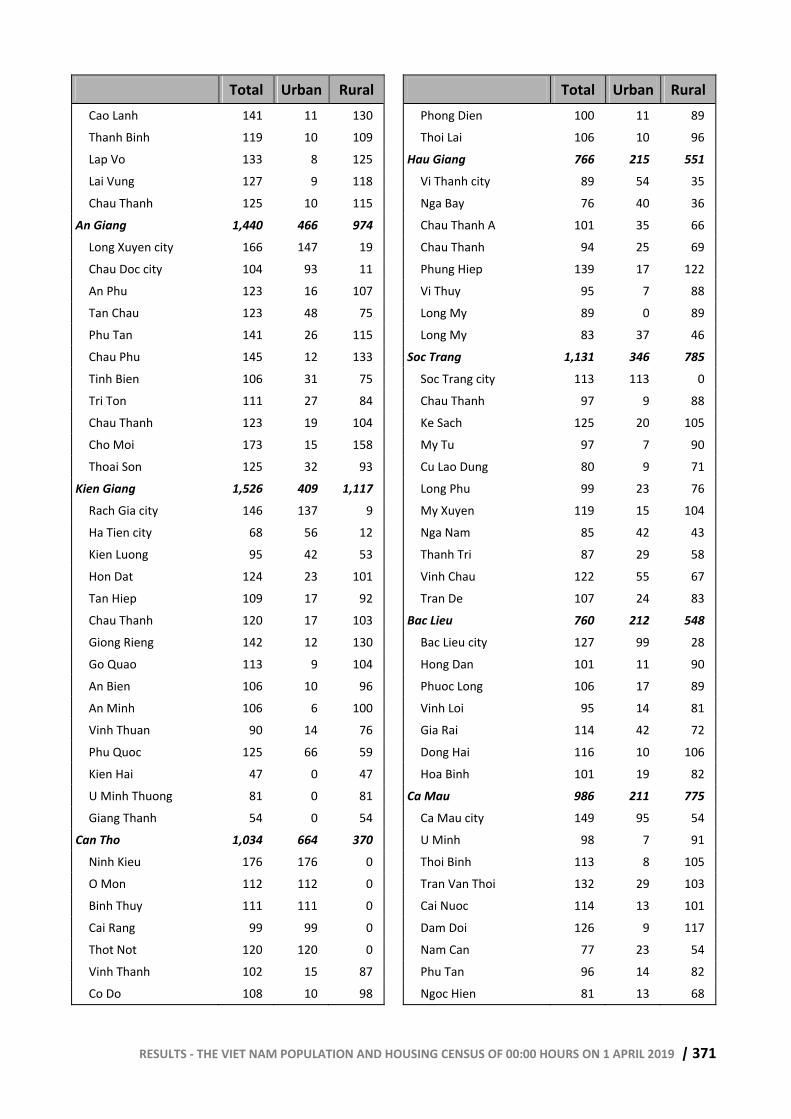
RESULTS - THE VIET NAM POPULATION AND HOUSING CENSUS OF 00:00 HOURS ON 1 APRIL 2019 | 371
Total Urban Rural Cao Lanh 141 11 130 Thanh Binh 119 10 109 Lap Vo 133 8 125 Lai Vung 127 9 118 Chau Thanh 125 10 115
An Giang 1,440 466 974 Long Xuyen city 166 147 19 Chau Doc city 104 93 11 An Phu 123 16 107 Tan Chau 123 48 75 Phu Tan 141 26 115 Chau Phu 145 12 133 Tinh Bien 106 31 75 Tri Ton 111 27 84 Chau Thanh 123 19 104 Cho Moi 173 15 158 Thoai Son 125 32 93
Kien Giang 1,526 409 1,117 Rach Gia city 146 137 9 Ha Tien city 68 56 12 Kien Luong 95 42 53 Hon Dat 124 23 101 Tan Hiep 109 17 92 Chau Thanh 120 17 103 Giong Rieng 142 12 130 Go Quao 113 9 104 An Bien 106 10 96 An Minh 106 6 100 Vinh Thuan 90 14 76 Phu Quoc 125 66 59 Kien Hai 47 0 47 U Minh Thuong 81 0 81 Giang Thanh 54 0 54
Can Tho 1,034 664 370 Ninh Kieu 176 176 0 O Mon 112 112 0 Binh Thuy 111 111 0 Cai Rang 99 99 0 Thot Not 120 120 0 Vinh Thanh 102 15 87 Co Do 108 10 98
Total Urban Rural Phong Dien 100 11 89 Thoi Lai 106 10 96
Hau Giang 766 215 551 Vi Thanh city 89 54 35 Nga Bay 76 40 36 Chau Thanh A 101 35 66 Chau Thanh 94 25 69 Phung Hiep 139 17 122 Vi Thuy 95 7 88 Long My 89 0 89 Long My 83 37 46
Soc Trang 1,131 346 785 Soc Trang city 113 113 0 Chau Thanh 97 9 88 Ke Sach 125 20 105 My Tu 97 7 90 Cu Lao Dung 80 9 71 Long Phu 99 23 76 My Xuyen 119 15 104 Nga Nam 85 42 43 Thanh Tri 87 29 58 Vinh Chau 122 55 67 Tran De 107 24 83
Bac Lieu 760 212 548 Bac Lieu city 127 99 28 Hong Dan 101 11 90 Phuoc Long 106 17 89 Vinh Loi 95 14 81 Gia Rai 114 42 72 Dong Hai 116 10 106 Hoa Binh 101 19 82
Ca Mau 986 211 775 Ca Mau city 149 95 54 U Minh 98 7 91 Thoi Binh 113 8 105 Tran Van Thoi 132 29 103 Cai Nuoc 114 13 101 Dam Doi 126 9 117 Nam Can 77 23 54 Phu Tan 96 14 82 Ngoc Hien 81 13 68
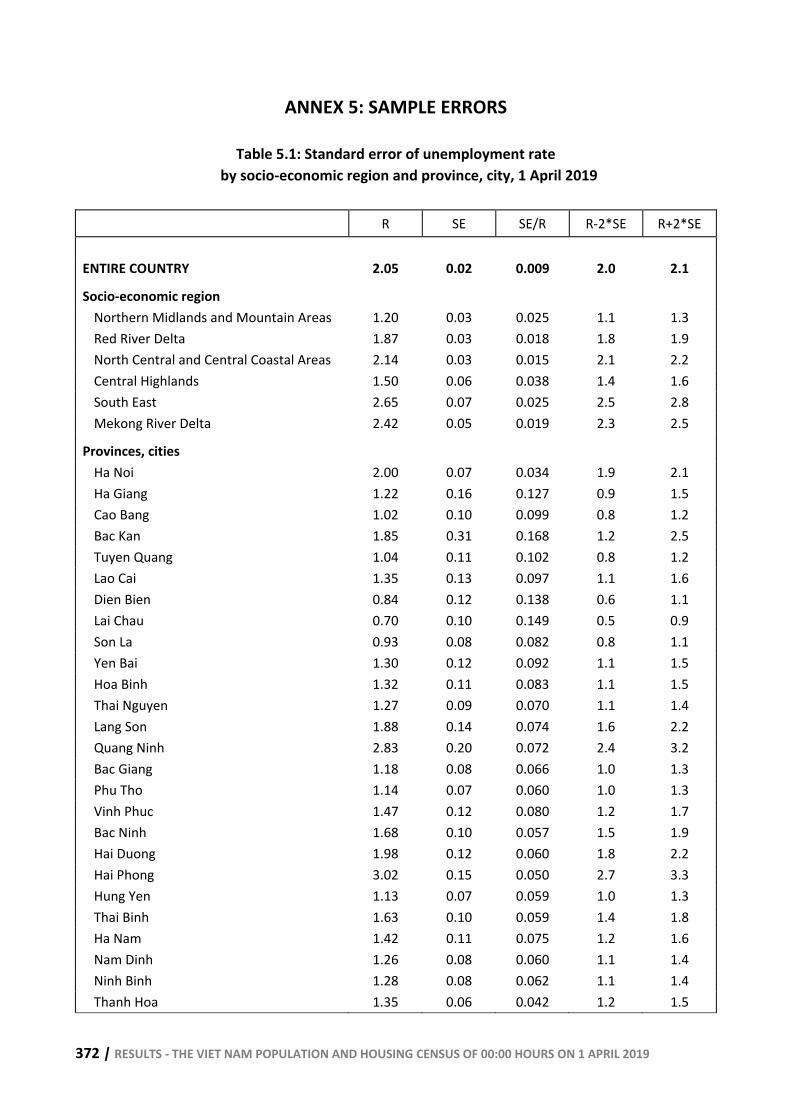
372 | RESULTS - THE VIET NAM POPULATION AND HOUSING CENSUS OF 00:00 HOURS ON 1 APRIL 2019
ANNEX 5: SAMPLE ERRORS
Table 5.1: Standard error of unemployment rate by socio-economic region and province, city, 1 April 2019
R SE SE/R R-2*SE R+2*SE
ENTIRE COUNTRY 2.05 0.02 0.009 2.0 2.1
Socio-economic region Northern Midlands and Mountain Areas 1.20 0.03 0.025 1.1 1.3 Red River Delta 1.87 0.03 0.018 1.8 1.9 North Central and Central Coastal Areas 2.14 0.03 0.015 2.1 2.2 Central Highlands 1.50 0.06 0.038 1.4 1.6 South East 2.65 0.07 0.025 2.5 2.8 Mekong River Delta 2.42 0.05 0.019 2.3 2.5
Provinces, cities Ha Noi 2.00 0.07 0.034 1.9 2.1 Ha Giang 1.22 0.16 0.127 0.9 1.5 Cao Bang 1.02 0.10 0.099 0.8 1.2 Bac Kan 1.85 0.31 0.168 1.2 2.5 Tuyen Quang 1.04 0.11 0.102 0.8 1.2 Lao Cai 1.35 0.13 0.097 1.1 1.6 Dien Bien 0.84 0.12 0.138 0.6 1.1 Lai Chau 0.70 0.10 0.149 0.5 0.9 Son La 0.93 0.08 0.082 0.8 1.1 Yen Bai 1.30 0.12 0.092 1.1 1.5 Hoa Binh 1.32 0.11 0.083 1.1 1.5 Thai Nguyen 1.27 0.09 0.070 1.1 1.4 Lang Son 1.88 0.14 0.074 1.6 2.2 Quang Ninh 2.83 0.20 0.072 2.4 3.2 Bac Giang 1.18 0.08 0.066 1.0 1.3 Phu Tho 1.14 0.07 0.060 1.0 1.3 Vinh Phuc 1.47 0.12 0.080 1.2 1.7 Bac Ninh 1.68 0.10 0.057 1.5 1.9 Hai Duong 1.98 0.12 0.060 1.8 2.2 Hai Phong 3.02 0.15 0.050 2.7 3.3 Hung Yen 1.13 0.07 0.059 1.0 1.3 Thai Binh 1.63 0.10 0.059 1.4 1.8 Ha Nam 1.42 0.11 0.075 1.2 1.6 Nam Dinh 1.26 0.08 0.060 1.1 1.4 Ninh Binh 1.28 0.08 0.062 1.1 1.4 Thanh Hoa 1.35 0.06 0.042 1.2 1.5
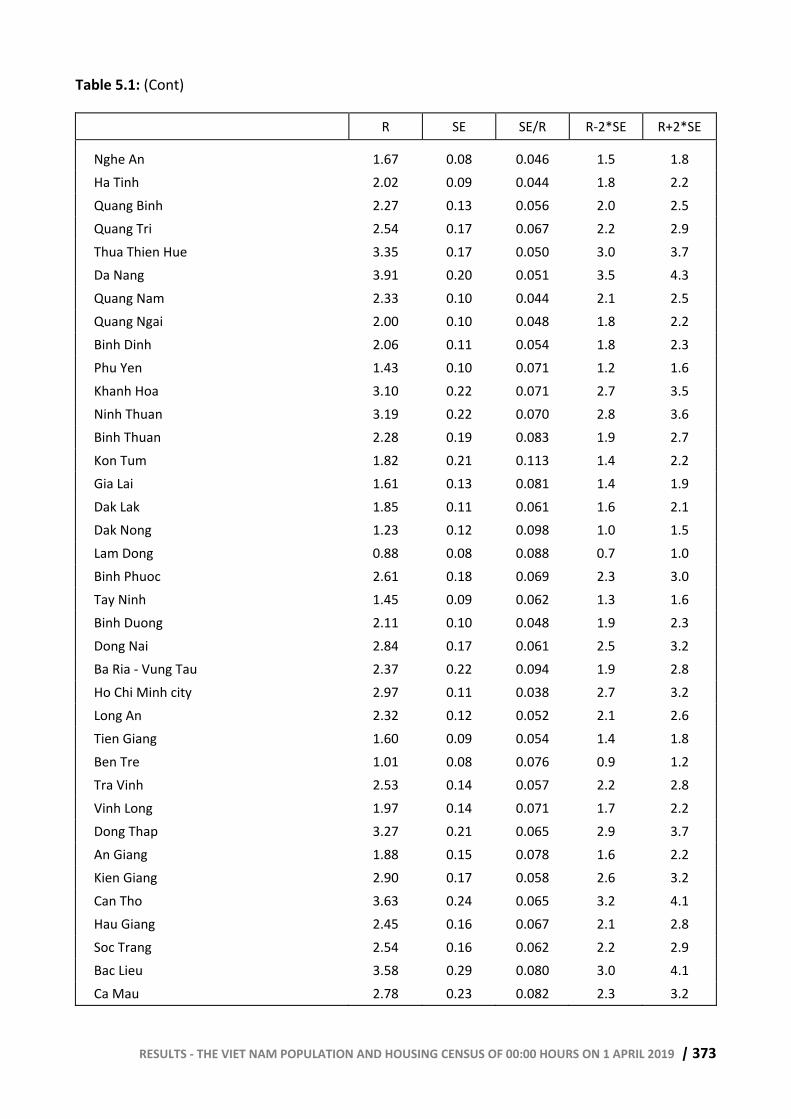
RESULTS - THE VIET NAM POPULATION AND HOUSING CENSUS OF 00:00 HOURS ON 1 APRIL 2019 | 373
Table 5.1: (Cont)
R SE SE/R R-2*SE R+2*SE
Nghe An 1.67 0.08 0.046 1.5 1.8 Ha Tinh 2.02 0.09 0.044 1.8 2.2 Quang Binh 2.27 0.13 0.056 2.0 2.5 Quang Tri 2.54 0.17 0.067 2.2 2.9 Thua Thien Hue 3.35 0.17 0.050 3.0 3.7 Da Nang 3.91 0.20 0.051 3.5 4.3 Quang Nam 2.33 0.10 0.044 2.1 2.5 Quang Ngai 2.00 0.10 0.048 1.8 2.2 Binh Dinh 2.06 0.11 0.054 1.8 2.3 Phu Yen 1.43 0.10 0.071 1.2 1.6 Khanh Hoa 3.10 0.22 0.071 2.7 3.5 Ninh Thuan 3.19 0.22 0.070 2.8 3.6 Binh Thuan 2.28 0.19 0.083 1.9 2.7 Kon Tum 1.82 0.21 0.113 1.4 2.2 Gia Lai 1.61 0.13 0.081 1.4 1.9 Dak Lak 1.85 0.11 0.061 1.6 2.1 Dak Nong 1.23 0.12 0.098 1.0 1.5 Lam Dong 0.88 0.08 0.088 0.7 1.0 Binh Phuoc 2.61 0.18 0.069 2.3 3.0 Tay Ninh 1.45 0.09 0.062 1.3 1.6 Binh Duong 2.11 0.10 0.048 1.9 2.3 Dong Nai 2.84 0.17 0.061 2.5 3.2 Ba Ria - Vung Tau 2.37 0.22 0.094 1.9 2.8 Ho Chi Minh city 2.97 0.11 0.038 2.7 3.2 Long An 2.32 0.12 0.052 2.1 2.6 Tien Giang 1.60 0.09 0.054 1.4 1.8 Ben Tre 1.01 0.08 0.076 0.9 1.2 Tra Vinh 2.53 0.14 0.057 2.2 2.8 Vinh Long 1.97 0.14 0.071 1.7 2.2 Dong Thap 3.27 0.21 0.065 2.9 3.7 An Giang 1.88 0.15 0.078 1.6 2.2 Kien Giang 2.90 0.17 0.058 2.6 3.2 Can Tho 3.63 0.24 0.065 3.2 4.1 Hau Giang 2.45 0.16 0.067 2.1 2.8 Soc Trang 2.54 0.16 0.062 2.2 2.9 Bac Lieu 3.58 0.29 0.080 3.0 4.1 Ca Mau 2.78 0.23 0.082 2.3 3.2
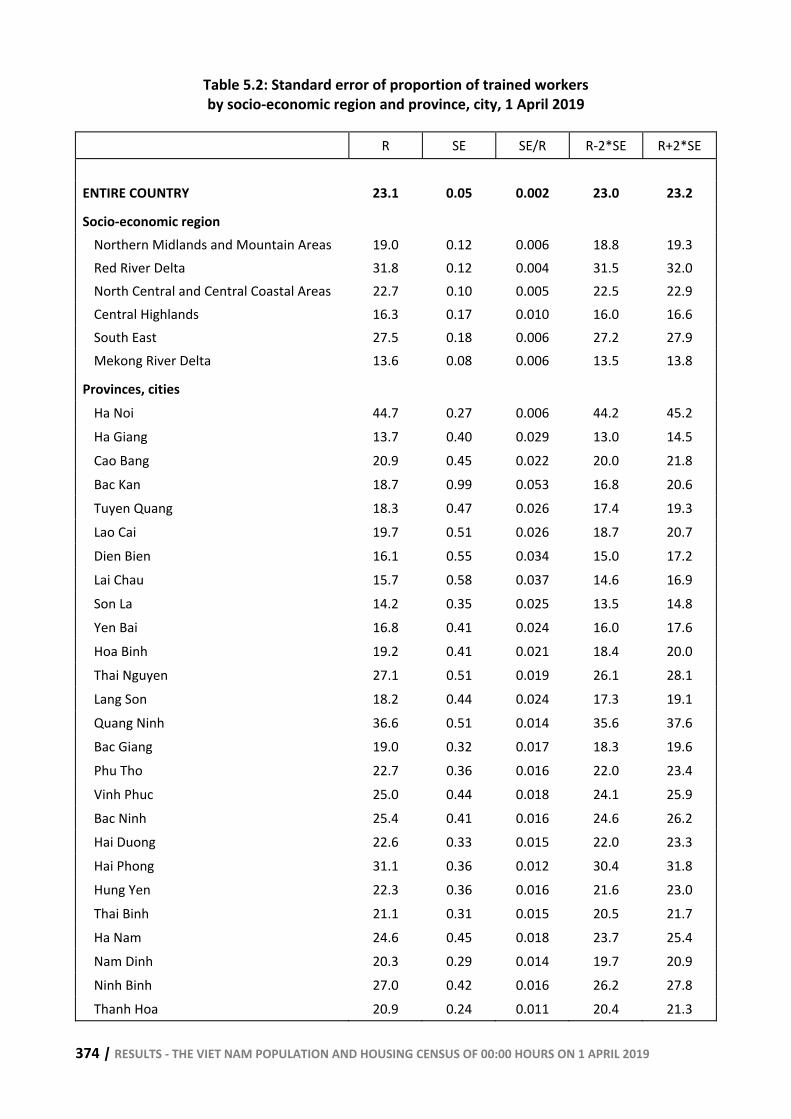
374 | RESULTS - THE VIET NAM POPULATION AND HOUSING CENSUS OF 00:00 HOURS ON 1 APRIL 2019
Table 5.2: Standard error of proportion of trained workers by socio-economic region and province, city, 1 April 2019
R SE SE/R R-2*SE R+2*SE ENTIRE COUNTRY 23.1 0.05 0.002 23.0 23.2
Socio-economic region Northern Midlands and Mountain Areas 19.0 0.12 0.006 18.8 19.3 Red River Delta 31.8 0.12 0.004 31.5 32.0 North Central and Central Coastal Areas 22.7 0.10 0.005 22.5 22.9 Central Highlands 16.3 0.17 0.010 16.0 16.6 South East 27.5 0.18 0.006 27.2 27.9 Mekong River Delta 13.6 0.08 0.006 13.5 13.8
Provinces, cities Ha Noi 44.7 0.27 0.006 44.2 45.2 Ha Giang 13.7 0.40 0.029 13.0 14.5 Cao Bang 20.9 0.45 0.022 20.0 21.8 Bac Kan 18.7 0.99 0.053 16.8 20.6 Tuyen Quang 18.3 0.47 0.026 17.4 19.3 Lao Cai 19.7 0.51 0.026 18.7 20.7 Dien Bien 16.1 0.55 0.034 15.0 17.2 Lai Chau 15.7 0.58 0.037 14.6 16.9 Son La 14.2 0.35 0.025 13.5 14.8 Yen Bai 16.8 0.41 0.024 16.0 17.6 Hoa Binh 19.2 0.41 0.021 18.4 20.0 Thai Nguyen 27.1 0.51 0.019 26.1 28.1 Lang Son 18.2 0.44 0.024 17.3 19.1 Quang Ninh 36.6 0.51 0.014 35.6 37.6 Bac Giang 19.0 0.32 0.017 18.3 19.6 Phu Tho 22.7 0.36 0.016 22.0 23.4 Vinh Phuc 25.0 0.44 0.018 24.1 25.9 Bac Ninh 25.4 0.41 0.016 24.6 26.2 Hai Duong 22.6 0.33 0.015 22.0 23.3 Hai Phong 31.1 0.36 0.012 30.4 31.8 Hung Yen 22.3 0.36 0.016 21.6 23.0 Thai Binh 21.1 0.31 0.015 20.5 21.7 Ha Nam 24.6 0.45 0.018 23.7 25.4 Nam Dinh 20.3 0.29 0.014 19.7 20.9 Ninh Binh 27.0 0.42 0.016 26.2 27.8 Thanh Hoa 20.9 0.24 0.011 20.4 21.3
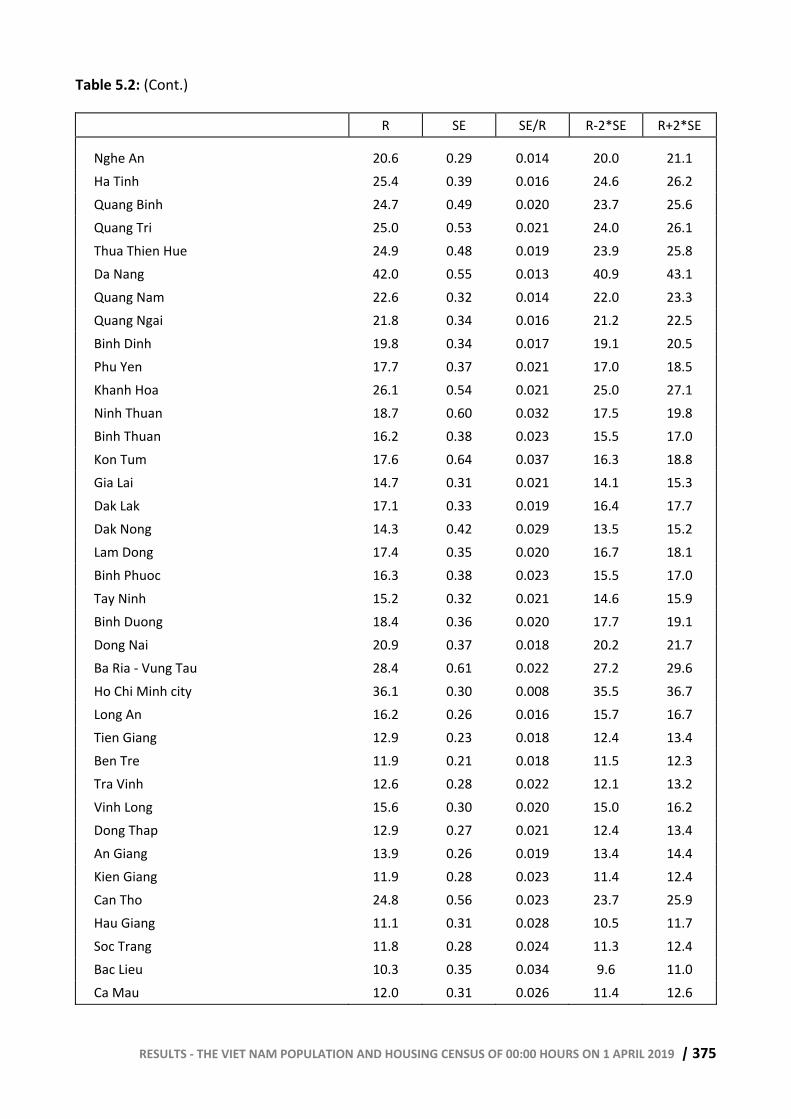
RESULTS - THE VIET NAM POPULATION AND HOUSING CENSUS OF 00:00 HOURS ON 1 APRIL 2019 | 375
Table 5.2: (Cont.)
R SE SE/R R-2*SE R+2*SE
Nghe An 20.6 0.29 0.014 20.0 21.1 Ha Tinh 25.4 0.39 0.016 24.6 26.2 Quang Binh 24.7 0.49 0.020 23.7 25.6 Quang Tri 25.0 0.53 0.021 24.0 26.1 Thua Thien Hue 24.9 0.48 0.019 23.9 25.8 Da Nang 42.0 0.55 0.013 40.9 43.1 Quang Nam 22.6 0.32 0.014 22.0 23.3 Quang Ngai 21.8 0.34 0.016 21.2 22.5 Binh Dinh 19.8 0.34 0.017 19.1 20.5 Phu Yen 17.7 0.37 0.021 17.0 18.5 Khanh Hoa 26.1 0.54 0.021 25.0 27.1 Ninh Thuan 18.7 0.60 0.032 17.5 19.8 Binh Thuan 16.2 0.38 0.023 15.5 17.0 Kon Tum 17.6 0.64 0.037 16.3 18.8 Gia Lai 14.7 0.31 0.021 14.1 15.3 Dak Lak 17.1 0.33 0.019 16.4 17.7 Dak Nong 14.3 0.42 0.029 13.5 15.2 Lam Dong 17.4 0.35 0.020 16.7 18.1 Binh Phuoc 16.3 0.38 0.023 15.5 17.0 Tay Ninh 15.2 0.32 0.021 14.6 15.9 Binh Duong 18.4 0.36 0.020 17.7 19.1 Dong Nai 20.9 0.37 0.018 20.2 21.7 Ba Ria - Vung Tau 28.4 0.61 0.022 27.2 29.6 Ho Chi Minh city 36.1 0.30 0.008 35.5 36.7 Long An 16.2 0.26 0.016 15.7 16.7 Tien Giang 12.9 0.23 0.018 12.4 13.4 Ben Tre 11.9 0.21 0.018 11.5 12.3 Tra Vinh 12.6 0.28 0.022 12.1 13.2 Vinh Long 15.6 0.30 0.020 15.0 16.2 Dong Thap 12.9 0.27 0.021 12.4 13.4 An Giang 13.9 0.26 0.019 13.4 14.4 Kien Giang 11.9 0.28 0.023 11.4 12.4 Can Tho 24.8 0.56 0.023 23.7 25.9 Hau Giang 11.1 0.31 0.028 10.5 11.7 Soc Trang 11.8 0.28 0.024 11.3 12.4 Bac Lieu 10.3 0.35 0.034 9.6 11.0 Ca Mau 12.0 0.31 0.026 11.4 12.6
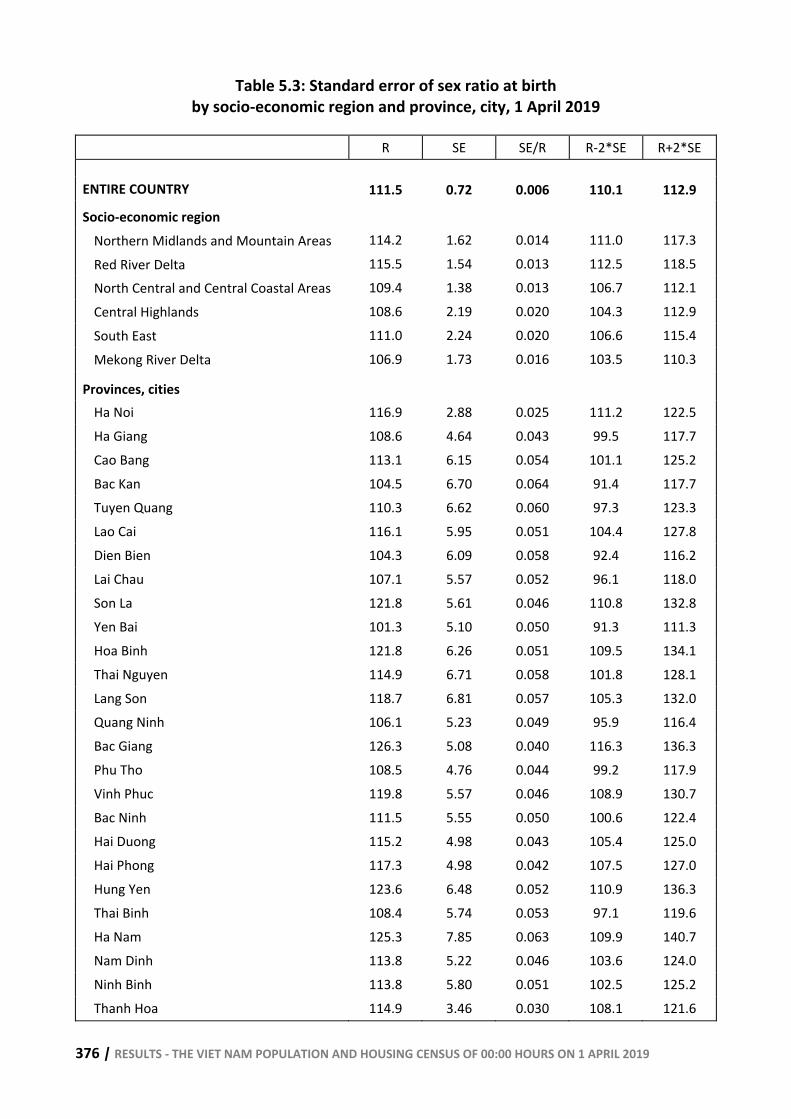
376 | RESULTS - THE VIET NAM POPULATION AND HOUSING CENSUS OF 00:00 HOURS ON 1 APRIL 2019
Table 5.3: Standard error of sex ratio at birth by socio-economic region and province, city, 1 April 2019
R SE SE/R R-2*SE R+2*SE
ENTIRE COUNTRY 111.5 0.72 0.006 110.1 112.9
Socio-economic region Northern Midlands and Mountain Areas 114.2 1.62 0.014 111.0 117.3
Red River Delta 115.5 1.54 0.013 112.5 118.5 North Central and Central Coastal Areas 109.4 1.38 0.013 106.7 112.1 Central Highlands 108.6 2.19 0.020 104.3 112.9 South East 111.0 2.24 0.020 106.6 115.4 Mekong River Delta 106.9 1.73 0.016 103.5 110.3
Provinces, cities Ha Noi 116.9 2.88 0.025 111.2 122.5 Ha Giang 108.6 4.64 0.043 99.5 117.7 Cao Bang 113.1 6.15 0.054 101.1 125.2 Bac Kan 104.5 6.70 0.064 91.4 117.7 Tuyen Quang 110.3 6.62 0.060 97.3 123.3 Lao Cai 116.1 5.95 0.051 104.4 127.8 Dien Bien 104.3 6.09 0.058 92.4 116.2 Lai Chau 107.1 5.57 0.052 96.1 118.0 Son La 121.8 5.61 0.046 110.8 132.8 Yen Bai 101.3 5.10 0.050 91.3 111.3 Hoa Binh 121.8 6.26 0.051 109.5 134.1 Thai Nguyen 114.9 6.71 0.058 101.8 128.1 Lang Son 118.7 6.81 0.057 105.3 132.0 Quang Ninh 106.1 5.23 0.049 95.9 116.4 Bac Giang 126.3 5.08 0.040 116.3 136.3 Phu Tho 108.5 4.76 0.044 99.2 117.9 Vinh Phuc 119.8 5.57 0.046 108.9 130.7 Bac Ninh 111.5 5.55 0.050 100.6 122.4 Hai Duong 115.2 4.98 0.043 105.4 125.0 Hai Phong 117.3 4.98 0.042 107.5 127.0 Hung Yen 123.6 6.48 0.052 110.9 136.3 Thai Binh 108.4 5.74 0.053 97.1 119.6 Ha Nam 125.3 7.85 0.063 109.9 140.7 Nam Dinh 113.8 5.22 0.046 103.6 124.0 Ninh Binh 113.8 5.80 0.051 102.5 125.2 Thanh Hoa 114.9 3.46 0.030 108.1 121.6
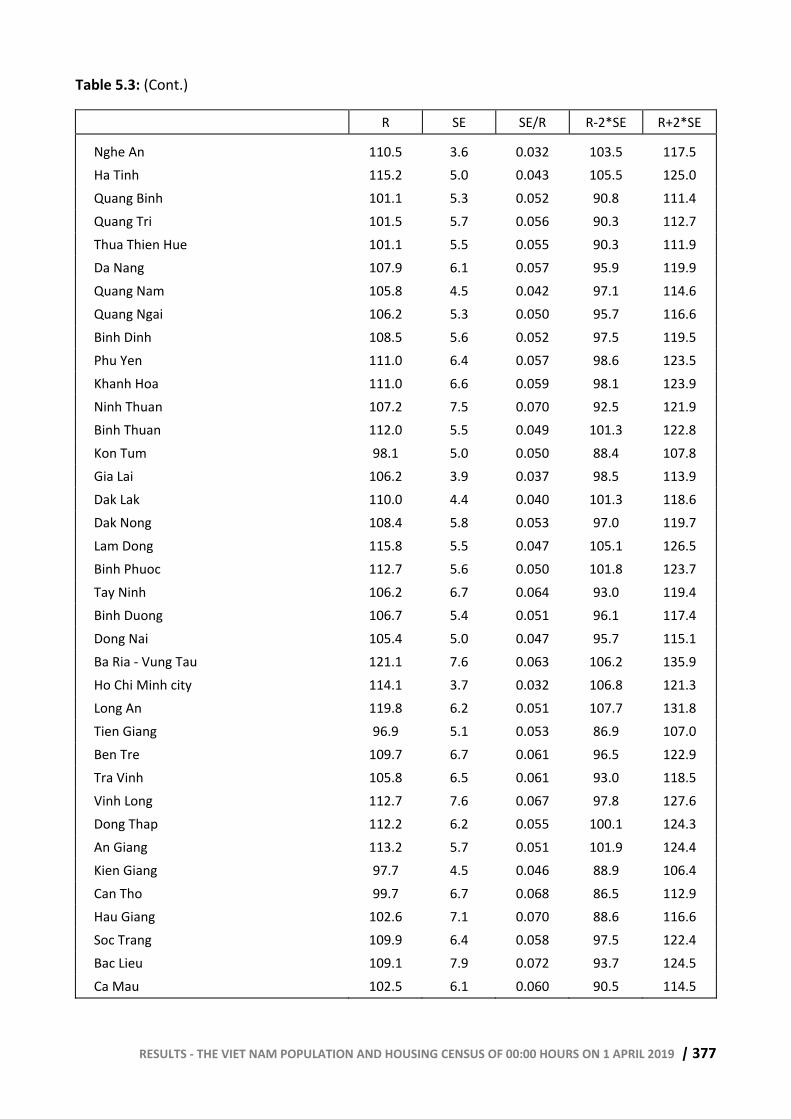
RESULTS - THE VIET NAM POPULATION AND HOUSING CENSUS OF 00:00 HOURS ON 1 APRIL 2019 | 377
Table 5.3: (Cont.)
R SE SE/R R-2*SE R+2*SE
Nghe An 110.5 3.6 0.032 103.5 117.5 Ha Tinh 115.2 5.0 0.043 105.5 125.0 Quang Binh 101.1 5.3 0.052 90.8 111.4 Quang Tri 101.5 5.7 0.056 90.3 112.7 Thua Thien Hue 101.1 5.5 0.055 90.3 111.9 Da Nang 107.9 6.1 0.057 95.9 119.9 Quang Nam 105.8 4.5 0.042 97.1 114.6 Quang Ngai 106.2 5.3 0.050 95.7 116.6 Binh Dinh 108.5 5.6 0.052 97.5 119.5 Phu Yen 111.0 6.4 0.057 98.6 123.5 Khanh Hoa 111.0 6.6 0.059 98.1 123.9 Ninh Thuan 107.2 7.5 0.070 92.5 121.9 Binh Thuan 112.0 5.5 0.049 101.3 122.8 Kon Tum 98.1 5.0 0.050 88.4 107.8 Gia Lai 106.2 3.9 0.037 98.5 113.9 Dak Lak 110.0 4.4 0.040 101.3 118.6 Dak Nong 108.4 5.8 0.053 97.0 119.7 Lam Dong 115.8 5.5 0.047 105.1 126.5 Binh Phuoc 112.7 5.6 0.050 101.8 123.7 Tay Ninh 106.2 6.7 0.064 93.0 119.4 Binh Duong 106.7 5.4 0.051 96.1 117.4 Dong Nai 105.4 5.0 0.047 95.7 115.1 Ba Ria - Vung Tau 121.1 7.6 0.063 106.2 135.9 Ho Chi Minh city 114.1 3.7 0.032 106.8 121.3 Long An 119.8 6.2 0.051 107.7 131.8 Tien Giang 96.9 5.1 0.053 86.9 107.0 Ben Tre 109.7 6.7 0.061 96.5 122.9 Tra Vinh 105.8 6.5 0.061 93.0 118.5 Vinh Long 112.7 7.6 0.067 97.8 127.6 Dong Thap 112.2 6.2 0.055 100.1 124.3 An Giang 113.2 5.7 0.051 101.9 124.4 Kien Giang 97.7 4.5 0.046 88.9 106.4 Can Tho 99.7 6.7 0.068 86.5 112.9 Hau Giang 102.6 7.1 0.070 88.6 116.6 Soc Trang 109.9 6.4 0.058 97.5 122.4 Bac Lieu 109.1 7.9 0.072 93.7 124.5 Ca Mau 102.5 6.1 0.060 90.5 114.5
378 | RESULTS - THE VIET NAM POPULATION AND HOUSING CENSUS OF 00:00 HOURS ON 1 APRIL 2019
ANNEX 6: PUBLICATIONS FROM THE 2019 CENSUS
The 2019 Census collected information about the population and its housing as of time-point 00:00 on 1 April 2019. Information was collected from 1 April to 25 April 2019. After data collection, the 2019 Census data were checked and synthesized before compiling and designing Census publications. During Census preparation, a number of communications were also published. Said publications were designed and compiled in specific stages and published in two forms: printed publications and electronic products. All 2019 Census publications are posted on the Census Website and available to the public, at "http://tongdieutradanso.vn".
1. Communications about the 2019 Census
(1) Question and answer materials about the 2019 Census: awareness raising campaigns for the Census were carried out in many forms, including recording the Census Q&A content in four ethnic minority languages3 in CD, MP3, and MP4 format.
(2) Documentary film about the preparation of the 2019 Census: The Population and Housing Census is the largest census ever undertaken in Viet Nam, with a lengthy preparation and implementation process. The documentary film covering the Census preparation process captured many such preparatory stages at central and local levels.
2. Preliminary results of the 2019 Census
The preliminary results of the 2019 Census were compiled immediately after the completion of data collection in the enumeration areas. Preliminary results were published on July 11, 2019, at the Online Conference on the preliminary release of the 2019 Census results. Publications include:
(1) Implementation Organization and Preliminary Results of the 2019 Census: which presents the implementation organization of the Census and a few key indicators synthesized from the complete questionnaire data, available in both English and Vietnamese.
(2) Documentary film about the EA data collection process during the 2019 Census: the documentary is in Vietnamese with English subtitles.
(3) Video of preliminary results of the 2019 Census.
(4) Summary report on preliminary results of the 2019 Census.
(5) Press release for preliminary results of the 2019 Census.
3. Final results of the 2019 Census
The final results of the 2019 Census were compiled after releasing the preliminary results of the 2019 Census. A number of publications were published at the Final Results Dissemination Workshop summarizing the 2019 Census held in Ha Noi on December 19, 2019, including: 3 Including the Kinh language-North and South accent, Kinh-Mong, Kinh-E Đe and Kinh-Khmer languages.
RESULTS - THE VIET NAM POPULATION AND HOUSING CENSUS OF 00:00 HOURS ON 1 APRIL 2019 | 379
(1) Results of the 2019 Census: apart from the Census design, implementation organization, and evaluation of survey results and lessons learned, the final results of the 2009 Census presented all key findings synthesized from the complete questionnaire survey data and the sample survey data.
(2) Key indicators booklet: to meet the need to quickly reference a few important indicators from the Census results, a small publication was developed including concepts and indicators broken down by provincial and city levels.
(3) Video of the 2019 Census results.
(4) Summary report of the 2019 census results.
(5) Press release for the 2019 Census results.
In addition to the aforementioned publications, the following documents will be compiled, synthesized and published to meet Census information demands:
(6) 2019 Census data: includes summary tables presenting the main results of the 2019 census by administrative units at all levels: national, six socio-economic regions, four key economic regions, 63 provinces and cities; including a number of indicators disaggregated to districts, towns and provincial cities. Data on the total population will be provided down to the commune level.
(7) 2019-2059 Viet Nam population projection: population projections for the whole country, six socio-economic regions and 63 provinces and cities by sex and age group.
(8) Administrative reports: summaries of documents, decisions, directives, preparations, organization methods, and publications related to the 2019 Census.
(9) Monographs: Along with the aforementioned publications, a number of publications providing an in-depth analysis of important topics to inform policy development as part of adapting to population changes and outstanding population issues will be researched, designed and published including: monographs on youth, aging populations and the elderly, fertility, sex imbalance ratio at birth, employment, migration and urbanization, marriage and family, etc.
(10) The 2019 Census Data Warehouse: In addition to publications providing disaggregated information on certain indicators, the Census database will be used to build a data warehouse to allow users to create their own open tables according to their specific research needs.
Publishing responsibility:
DIRECTOR - EDITOR-IN-CHIEF
DO VAN CHIEN
Editor and print correction:
NGUYEN THUY QUYNH
Prepress:
MANH HA - DUNG THANG
- In 170 cuốn, khổ 20,5 × 29cm, tại Nhà xuất bản Thống kê - Công ty Cổ phần In Đông Bắc, Địa chỉ: Số 15, ngõ 14, phố Pháo Đài Láng, quận Đống Đa, thành phố Hà Nội. - Số xác nhận ĐKXB: 453-2020/CXBIPH/07-03/TK do Cục Xuất bản - In và Phát hành. - QĐXB số 23/QĐ-NXBTK ngày 28/2/2020 của Giám đốc - Tổng biên tập NXB Thống kê. - In xong, nộp lưu chiểu: tháng 3 năm 2020. ISBN: 978-604-75-1489-2
- Print out 170 copies, size 20.5 x 29 cm at Statistical Publishing House - Dong Bac Printing and Trade company, Address: No. 15, lane 14, Phao Dai Lang street, Dong Da district, Ha Noi city. - License of publish No: 453-2020/CXBIPH/07-03/TK by the Authority of Publication, Printing and Distribution. - Publishing decision No: 23/QD-NXBTK dated 28/2/2020 by Director - Editor-in-chief, Statistical Publishing House. - Finishing printing and submitting in March 2020. ISBN: 978-604-75-1489-2
Top Related
Copyright © 2022 FDOKUMEN

