


Bahasa
Halaman
Hukum

phlD-basedgeneticdiversityanddetectionofgenotypesof2,4-diacetylphloroglucinol-producingPseudomonas£uorescensLeonardo De La Fuente1, Dmitri V. Mavrodi1, Blanca B. Landa2, Linda S. Thomashow3 & David M. Weller3
1Department of Plant Pathology, Washington State University, Pullman, WA, USA; 2Departamento de Agronomıa, Escuela Tecnica Superior de
Ingenieros Agronomos y de Montes, Universidad de Cordoba, Cordoba, Spain; and 3United States Department of Agriculture, Agricultural Research
Service, Root Disease and Biological Control Research Unit, Pullman, WA, USA
Correspondence: David M. Weller, United
States Department of Agriculture,
Agricultural Research Service, Root Disease
and Biological Control Research Unit, P.O. Box
646430, Washington State University,
Pullman, WA 99164-6430, USA. Tel.: 11 509
335 6210; fax: 11 509 335 7674;
e-mail: [email protected]
Received 15 March 2005; revised 26 October
2005; accepted 27 October 2005.
First published online 24 January 2006.
doi:10.1111/j.1574-6941.2006.00074.x
Editor: Kornelia Smalla
Keywords
Pseudomonas; rhizosphere colonization;
2,4-diacetylphloroglucinol; biological control;
phlD; allele-specific PCR.
Abstract
Diversity within a worldwide collection of 2,4-diacetylphloroglucinol-producing
Pseudomonas fluorescens strains was assessed by sequencing the phlD gene.
Phylogenetic analyses based on the phlD sequences of 70 isolates supported the
previous classification into 18 BOX-PCR genotypes (A–Q and T). Exploiting
polymorphisms within the sequence of phlD, we designed and used allele-specific
PCR primers with a PCR-based dilution endpoint assay to quantify the population
sizes of A-, B-, D-, K-, L- and P-genotype strains grown individually or in pairs in
vitro, in the rhizosphere of wheat and in bulk soil. Except for P. fluorescens Q8r1-
96, which strongly inhibited the growth of P. fluorescens Q2-87, inhibition between
pairs of strains grown in vitro did not affect the accuracy of the method. The allele-
specific primer-based technique is a rapid method for studies of the interactions
between genotypes of 2,4-diacetylphloroglucinol producers in natural environ-
ments.
Introduction
Isolates of Pseudomonas fluorescens producing the antibiotic
2,4-diacetylphloroglucinol (2,4-DAPG) have been recovered
from soil, the rhizosphere of many crop species (Thoma-
show & Weller, 1995; Keel et al., 1996; McSpadden Gardener
et al., 2000; Lee & Kim, 2001; Weller et al., 2002; De La
Fuente et al., 2004) and marine environments (Isnansetyo
et al., 2003). These bacteria have been studied intensively
because they are responsible for the suppressiveness of some
soils against take-all disease of wheat caused by Gaeuman-
nomyces graminis var. tritici (Weller et al., 2002; de Souza
et al., 2003b) and black root rot of tobacco caused by
Thielaviopsis basicola (Stutz et al., 1986; Weller et al., 2002).
They are also highly effective biocontrol agents of a wide
variety of plant diseases when applied as seed or soil
treatments (Stutz et al., 1986; Fenton et al., 1992; Keel et al.,
1992; Shanahan et al., 1992; Schnider et al., 1995; Cronin
et al., 1997a, b; Duffy & Defago, 1997; Lee & Kim, 2001;
Raaijmakers & Weller, 2001; de Souza et al., 2003b; De La
Fuente et al., 2004). Disease suppression is associated with
the production of 2,4-DAPG, which has broad antiviral,
antibacterial, antifungal, antihelminthic and phytotoxic
properties (Shanahan et al., 1992; Bangera & Thomashow,
1999; Isnansetyo et al., 2003; Kamei & Isnansetyo, 2003).
2,4-DAPG may either inhibit soil-borne pathogens directly
(Thomashow & Weller, 1995; Bonsall et al., 1997; Cronin
et al., 1997a,b; Raaijmakers & Weller, 1998; Kamei & Isnan-
setyo, 2003; de Souza et al., 2003a) or induce systemic
resistance in the host plant (Iavicoli et al., 2003).
Considerable genetic diversity exists amongst 2,4-DAPG-
producing P. fluorescens isolates, and has been characterized
by amplified ribosomal DNA restriction analysis (ARDRA)
(Keel et al., 1996; McSpadden Gardener et al., 2000;
Picard et al., 2000), random amplified polymorphic DNA
(RAPD) analysis (Mavrodi et al., 2001), whole-cell repeti-
tive sequence-based PCR (rep-PCR) (McSpadden Gardener
et al., 2000; Landa et al., 2002a, 2005), restriction fragment
length polymorphism (RFLP) analysis of phlD, a key gene in
the 2,4-DAPG biosynthetic operon (Mavrodi et al., 2001;
McSpadden Gardener et al., 2001; Ramette et al., 2001;
Wang et al., 2001; Landa et al., 2002a, 2005), sequence
analysis of phlD (Ramette et al., 2001; Mazzola et al., 2004)
and denaturing gradient gel electrophoresis (DGGE)
FEMS Microbiol Ecol 56 (2006) 64–78c� 2006 Federation of European Microbiological SocietiesPublished by Blackwell Publishing Ltd. No claim to original US government works.
(Bergsma-Vlami et al., 2005). Because phlD is highly con-
served (Keel et al., 1996), it is a reliable marker for producers
of 2,4-DAPG (phlD1). We distinguished 18 genotypes (A–Q
and T) by rep-PCR with the BOXA1R primer (BOX-PCR)
in a worldwide collection of over 200 phlD1 isolates
(McSpadden Gardener et al., 2000; Landa et al., 2002a,
2005), and these correlate closely with groupings revealed
by RFLP analysis of phlD (Mavrodi et al., 2001; McSpadden
Gardener et al., 2001; Landa et al., 2002a, 2005). Additional
genotypes have been described recently by Mazzola et al.
(2004) (PfY and PfZ) and by McSpadden Gardener et al.
(2005) (R and S). Most genotypes distinguished by BOX-
PCR produce similar quantities of 2,4-DAPG in vitro
(Mavrodi et al., 2001) and in situ (Raaijmakers & Weller,
2001), have similar substrate utilization profiles (McSpad-
den Gardener et al., 2000; Raaijmakers & Weller, 2001) and
do not differ markedly when compared by classical bacter-
iological tests (McSpadden Gardener et al., 2000; Raaij-
makers & Weller, 2001). However, they differ significantly
in their competitiveness in the rhizosphere, and, at least on
pea and wheat, the genotype of an isolate is predictive of its
ability to establish and maintain population densities suffi-
cient to suppress disease (Landa et al., 2002a, 2003). How-
ever, the basis of the relationship between genotype and
colonization is not known. 2,4-DAPG is not a rhizosphere
competence factor (Raaijmakers & Weller, 2001), and bac-
terial traits and genes previously shown to contribute to root
colonizing ability (Lugtenberg et al., 2001) do not appear to
be unique to certain genotypes. Mavrodi et al. (2002) used
suppression subtractive hybridization to show that D-geno-
type isolates, known for aggressive colonization of wheat
and pea, have sequences not found in other genotypes with
average rhizosphere colonization ability. The role of these
sequences, including one encoding for the synthesis of
bacteriocins (Validov et al., 2005), is still under investiga-
tion.
Interactions amongst 2,4-DAPG-producing genotypes in
situ remain poorly understood, because it is difficult to
simultaneously distinguish and quantify multiple genotypes
in soil and rhizosphere samples. Different techniques have
been described for the quantification of total phlD1 popula-
tions in situ. Raaijmakers et al. (1997) used colony hybridi-
zation to detect and quantify indigenous phlD1 populations
in the wheat rhizosphere. This technique is accurate but
labour intensive, and does not discriminate between 2,4-
DAPG genotypes. McSpadden Gardener et al. (2001) have
developed a quantitative PCR-based dilution endpoint assay
that detects phlD1 population sizes essentially identical to
those obtained by colony hybridization (Landa et al.,
2002b), but is more rapid and the dominant phlD1 geno-
type can be identified by RFLP analysis of the amplified phlD
fragments. Landa et al. (2002a, 2003) used the dilution
endpoint method to demonstrate that certain genotypes
displace others in the same rhizosphere. However, a signifi-
cant limitation of the assay is that, when strains of two or
more genotypes are present, the subordinate strains are
difficult to detect by RFLP analysis (McSpadden Gardener
et al., 2001; Landa et al., 2003).
The objectives of this study were: (1) to assess the
diversity of 2,4-DAPG producers based on phlD sequence
data; and (2) to expand the ability of the dilution endpoint
assay (McSpadden Gardener et al., 2001) to trace the
population dynamics of phlD1 genotypes competing in the
rhizosphere. Using phlD sequences from strains of 20 BOX-
PCR genotypes, we demonstrated that sequence analysis
supports genotypes that have been previously defined using
molecular fingerprinting methods. We then used the se-
quence information to design phlD allele-specific primers
for A-, B-, D-, K-, L- and P-genotype strains. Using these
primers, we were able to monitor two competing genotypes
in mixed cultures in rhizosphere and soil samples even when
one genotype was up to 1000-fold less abundant than the
other.
Materials andmethods
Bacteria and culture conditions
Table 1 shows the bacterial strains and phlD gene sequences
used in this study. Included were 79 phlD1 strains represent-
ing 18 of the 22 described BOX-PCR genotypes (McSpadden
Gardener et al., 2000; Landa et al., 2002a, 2005) and 70 phlD
sequences from isolates of 20 genotypes. Because all phlD1
fluorescent pseudomonads belong to ARDRA groups 1, 2 or
3 (Keel et al., 1996; McSpadden Gardener et al., 2000), and
all such isolates that have been identified to species are
Pseudomonas fluorescens (Shanahan et al., 1992; Keel et al.,
1996; Lee & Kim, 2001; Raaijmakers & Weller, 2001; Ramette
et al., 2001; Weller et al., 2002), we refer to all strains used in
this study as P. fluorescens. Except for Phl1C2, provided by
P. Lemanceau (Universite de Bourgogne, Dijon, France), all
of the strains have been described previously (Table 1).
Unless indicated (Table 1), genotypes were determined
previously by BOX-PCR and/or RFLP analysis of phlD
(McSpadden Gardener et al., 2000; Mavrodi et al., 2001;
Landa et al., 2002a, 2005). Because both approaches provide
similar results (Mavrodi et al., 2001; McSpadden Gardener
et al., 2001; Landa et al., 2002a, 2005), we commonly use the
term BOX-PCR genotype to refer to genotypes determined
by either approach.
All strains were cultured at 28 1C on one-third strength
King’s medium B (1/3� KMB) agar (King et al., 1954).
Stock cultures were stored in 1/3�KMB broth plus 20%
glycerol at � 80 1C. When appropriate, kanamycin (25
mg mL�1) and gentamicin (12mg mL�1) were added to the
medium.
FEMS Microbiol Ecol 56 (2006) 64–78 c� 2006 Federation of European Microbiological SocietiesPublished by Blackwell Publishing Ltd. No claim to original US government works.
65Diversity and detection of genotypes of Pseudomonas fluorescens
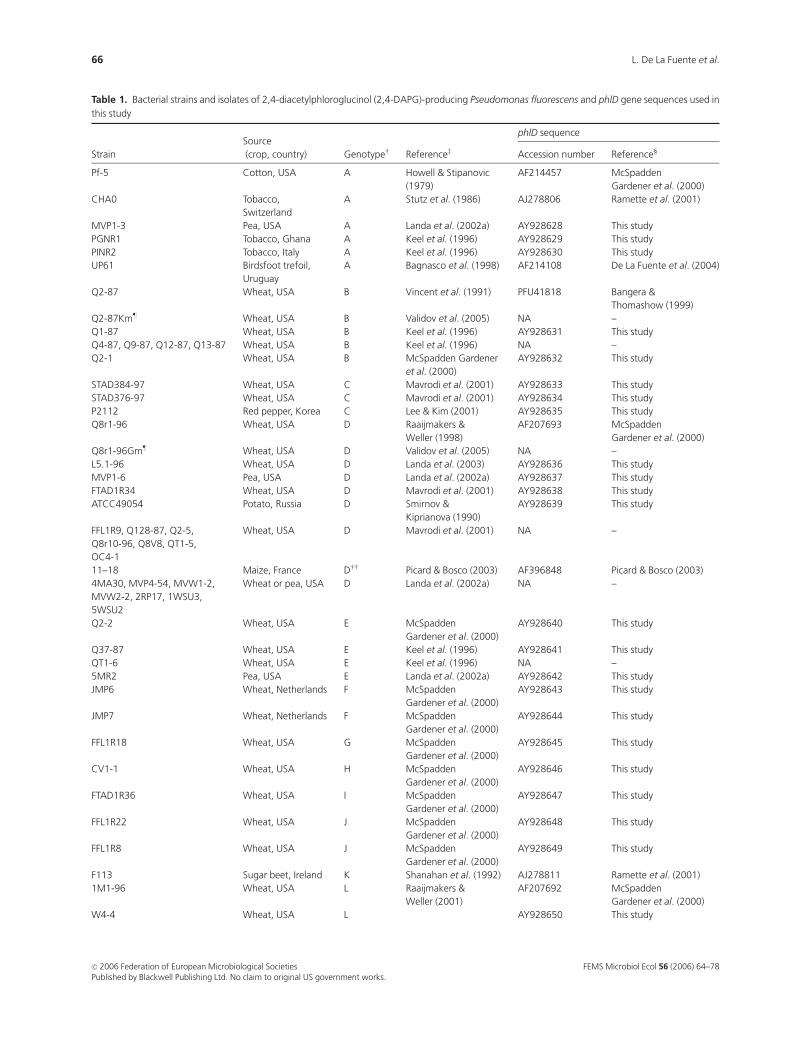
Table 1. Bacterial strains and isolates of 2,4-diacetylphloroglucinol (2,4-DAPG)-producing Pseudomonas fluorescens and phlD gene sequences used in
this study
Strain
Source�
(crop, country) Genotypew Referencez
phlD sequence
Accession number Reference‰
Pf-5 Cotton, USA A Howell & Stipanovic
(1979)
AF214457 McSpadden
Gardener et al. (2000)
CHA0 Tobacco,
Switzerland
A Stutz et al. (1986) AJ278806 Ramette et al. (2001)
MVP1-3 Pea, USA A Landa et al. (2002a) AY928628 This study
PGNR1 Tobacco, Ghana A Keel et al. (1996) AY928629 This study
PINR2 Tobacco, Italy A Keel et al. (1996) AY928630 This study
UP61 Birdsfoot trefoil,
Uruguay
A Bagnasco et al. (1998) AF214108 De La Fuente et al. (2004)
Q2-87 Wheat, USA B Vincent et al. (1991) PFU41818 Bangera &
Thomashow (1999)
Q2-87Kmz Wheat, USA B Validov et al. (2005) NA�� –
Q1-87 Wheat, USA B Keel et al. (1996) AY928631 This study
Q4-87, Q9-87, Q12-87, Q13-87 Wheat, USA B Keel et al. (1996) NA –
Q2-1 Wheat, USA B McSpadden Gardener
et al. (2000)
AY928632 This study
STAD384-97 Wheat, USA C Mavrodi et al. (2001) AY928633 This study
STAD376-97 Wheat, USA C Mavrodi et al. (2001) AY928634 This study
P2112 Red pepper, Korea C Lee & Kim (2001) AY928635 This study
Q8r1-96 Wheat, USA D Raaijmakers &
Weller (1998)
AF207693 McSpadden
Gardener et al. (2000)
Q8r1-96Gmz Wheat, USA D Validov et al. (2005) NA –
L5.1-96 Wheat, USA D Landa et al. (2003) AY928636 This study
MVP1-6 Pea, USA D Landa et al. (2002a) AY928637 This study
FTAD1R34 Wheat, USA D Mavrodi et al. (2001) AY928638 This study
ATCC49054 Potato, Russia D Smirnov &
Kiprianova (1990)
AY928639 This study
FFL1R9, Q128-87, Q2-5,
Q8r10-96, Q8V8, QT1-5,
OC4-1
Wheat, USA D Mavrodi et al. (2001) NA –
11–18 Maize, France Dww Picard & Bosco (2003) AF396848 Picard & Bosco (2003)
4MA30, MVP4-54, MVW1-2,
MVW2-2, 2RP17, 1WSU3,
5WSU2
Wheat or pea, USA D Landa et al. (2002a) NA –
Q2-2 Wheat, USA E McSpadden
Gardener et al. (2000)
AY928640 This study
Q37-87 Wheat, USA E Keel et al. (1996) AY928641 This study
QT1-6 Wheat, USA E Keel et al. (1996) NA –
5MR2 Pea, USA E Landa et al. (2002a) AY928642 This study
JMP6 Wheat, Netherlands F McSpadden
Gardener et al. (2000)
AY928643 This study
JMP7 Wheat, Netherlands F McSpadden
Gardener et al. (2000)
AY928644 This study
FFL1R18 Wheat, USA G McSpadden
Gardener et al. (2000)
AY928645 This study
CV1-1 Wheat, USA H McSpadden
Gardener et al. (2000)
AY928646 This study
FTAD1R36 Wheat, USA I McSpadden
Gardener et al. (2000)
AY928647 This study
FFL1R22 Wheat, USA J McSpadden
Gardener et al. (2000)
AY928648 This study
FFL1R8 Wheat, USA J McSpadden
Gardener et al. (2000)
AY928649 This study
F113 Sugar beet, Ireland K Shanahan et al. (1992) AJ278811 Ramette et al. (2001)
1M1-96 Wheat, USA L Raaijmakers &
Weller (2001)
AF207692 McSpadden
Gardener et al. (2000)
W4-4 Wheat, USA L AY928650 This study
FEMS Microbiol Ecol 56 (2006) 64–78c� 2006 Federation of European Microbiological SocietiesPublished by Blackwell Publishing Ltd. No claim to original US government works.
66 L. De La Fuente et al.
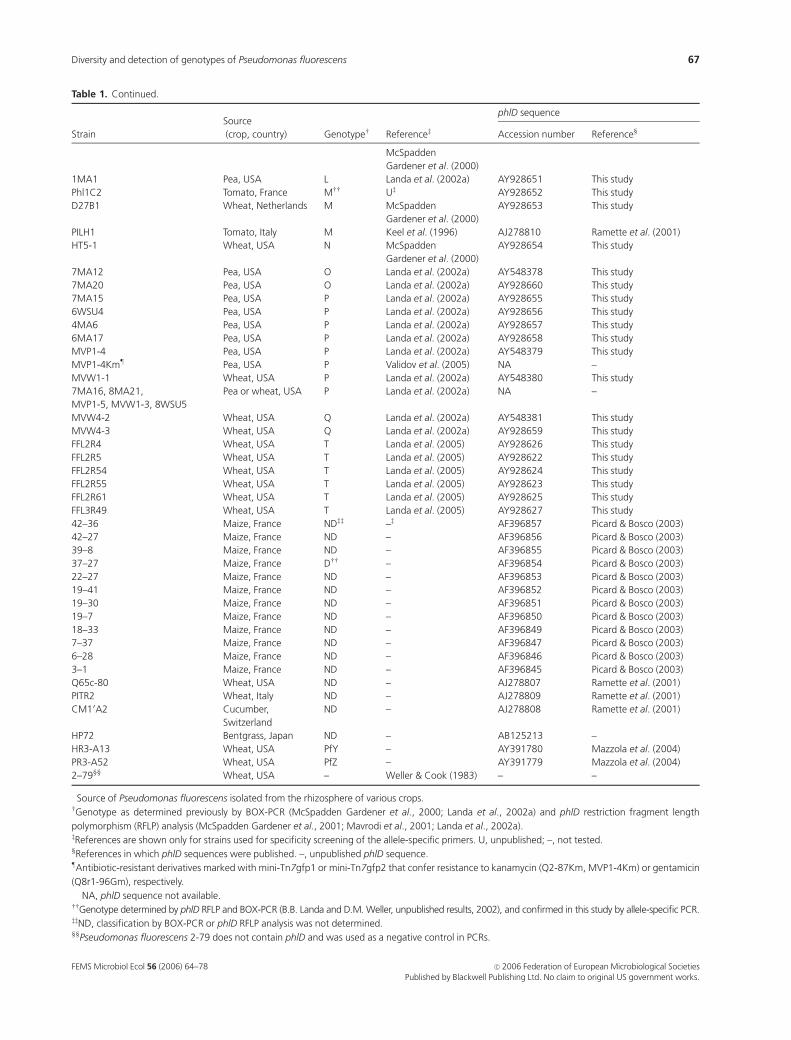
Table 1. Continued.
Strain
Source�
(crop, country) Genotypew Referencez
phlD sequence
Accession number Reference‰
McSpadden
Gardener et al. (2000)
1MA1 Pea, USA L Landa et al. (2002a) AY928651 This study
Phl1C2 Tomato, France Mww Uz AY928652 This study
D27B1 Wheat, Netherlands M McSpadden
Gardener et al. (2000)
AY928653 This study
PILH1 Tomato, Italy M Keel et al. (1996) AJ278810 Ramette et al. (2001)
HT5-1 Wheat, USA N McSpadden
Gardener et al. (2000)
AY928654 This study
7MA12 Pea, USA O Landa et al. (2002a) AY548378 This study
7MA20 Pea, USA O Landa et al. (2002a) AY928660 This study
7MA15 Pea, USA P Landa et al. (2002a) AY928655 This study
6WSU4 Pea, USA P Landa et al. (2002a) AY928656 This study
4MA6 Pea, USA P Landa et al. (2002a) AY928657 This study
6MA17 Pea, USA P Landa et al. (2002a) AY928658 This study
MVP1-4 Pea, USA P Landa et al. (2002a) AY548379 This study
MVP1-4Kmz Pea, USA P Validov et al. (2005) NA –
MVW1-1 Wheat, USA P Landa et al. (2002a) AY548380 This study
7MA16, 8MA21,
MVP1-5, MVW1-3, 8WSU5
Pea or wheat, USA P Landa et al. (2002a) NA –
MVW4-2 Wheat, USA Q Landa et al. (2002a) AY548381 This study
MVW4-3 Wheat, USA Q Landa et al. (2002a) AY928659 This study
FFL2R4 Wheat, USA T Landa et al. (2005) AY928626 This study
FFL2R5 Wheat, USA T Landa et al. (2005) AY928622 This study
FFL2R54 Wheat, USA T Landa et al. (2005) AY928624 This study
FFL2R55 Wheat, USA T Landa et al. (2005) AY928623 This study
FFL2R61 Wheat, USA T Landa et al. (2005) AY928625 This study
FFL3R49 Wheat, USA T Landa et al. (2005) AY928627 This study
42–36 Maize, France NDzz –z AF396857 Picard & Bosco (2003)
42–27 Maize, France ND – AF396856 Picard & Bosco (2003)
39–8 Maize, France ND – AF396855 Picard & Bosco (2003)
37–27 Maize, France Dww – AF396854 Picard & Bosco (2003)
22–27 Maize, France ND – AF396853 Picard & Bosco (2003)
19–41 Maize, France ND – AF396852 Picard & Bosco (2003)
19–30 Maize, France ND – AF396851 Picard & Bosco (2003)
19–7 Maize, France ND – AF396850 Picard & Bosco (2003)
18–33 Maize, France ND – AF396849 Picard & Bosco (2003)
7–37 Maize, France ND – AF396847 Picard & Bosco (2003)
6–28 Maize, France ND – AF396846 Picard & Bosco (2003)
3–1 Maize, France ND – AF396845 Picard & Bosco (2003)
Q65c-80 Wheat, USA ND – AJ278807 Ramette et al. (2001)
PITR2 Wheat, Italy ND – AJ278809 Ramette et al. (2001)
CM10A2 Cucumber,
Switzerland
ND – AJ278808 Ramette et al. (2001)
HP72 Bentgrass, Japan ND – AB125213 –
HR3-A13 Wheat, USA PfY – AY391780 Mazzola et al. (2004)
PR3-A52 Wheat, USA PfZ – AY391779 Mazzola et al. (2004)
2–79‰‰ Wheat, USA – Weller & Cook (1983) – –
�Source of Pseudomonas fluorescens isolated from the rhizosphere of various crops.wGenotype as determined previously by BOX-PCR (McSpadden Gardener et al., 2000; Landa et al., 2002a) and phlD restriction fragment length
polymorphism (RFLP) analysis (McSpadden Gardener et al., 2001; Mavrodi et al., 2001; Landa et al., 2002a).zReferences are shown only for strains used for specificity screening of the allele-specific primers. U, unpublished; –, not tested.‰References in which phlD sequences were published. –, unpublished phlD sequence.zAntibiotic-resistant derivatives marked with mini-Tn7gfp1 or mini-Tn7gfp2 that confer resistance to kanamycin (Q2-87Km, MVP1-4Km) or gentamicin
(Q8r1-96Gm), respectively.��NA, phlD sequence not available.wwGenotype determined by phlD RFLP and BOX-PCR (B.B. Landa and D.M. Weller, unpublished results, 2002), and confirmed in this study by allele-specific PCR.zzND, classification by BOX-PCR or phlD RFLP analysis was not determined.‰‰Pseudomonas fluorescens 2-79 does not contain phlD and was used as a negative control in PCRs.
FEMS Microbiol Ecol 56 (2006) 64–78 c� 2006 Federation of European Microbiological SocietiesPublished by Blackwell Publishing Ltd. No claim to original US government works.
67Diversity and detection of genotypes of Pseudomonas fluorescens
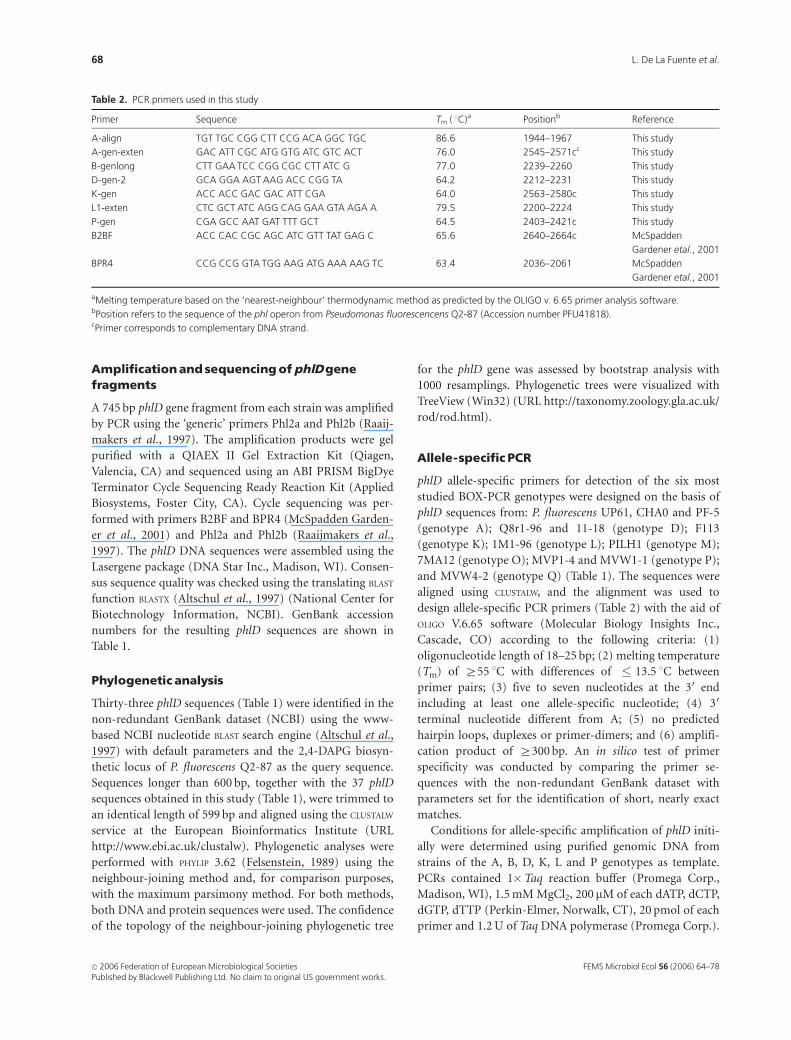
Amplificationandsequencingof phlDgenefragments
A 745 bp phlD gene fragment from each strain was amplified
by PCR using the ‘generic’ primers Phl2a and Phl2b (Raaij-
makers et al., 1997). The amplification products were gel
purified with a QIAEX II Gel Extraction Kit (Qiagen,
Valencia, CA) and sequenced using an ABI PRISM BigDye
Terminator Cycle Sequencing Ready Reaction Kit (Applied
Biosystems, Foster City, CA). Cycle sequencing was per-
formed with primers B2BF and BPR4 (McSpadden Garden-
er et al., 2001) and Phl2a and Phl2b (Raaijmakers et al.,
1997). The phlD DNA sequences were assembled using the
Lasergene package (DNA Star Inc., Madison, WI). Consen-
sus sequence quality was checked using the translating BLAST
function BLASTX (Altschul et al., 1997) (National Center for
Biotechnology Information, NCBI). GenBank accession
numbers for the resulting phlD sequences are shown in
Table 1.
Phylogenetic analysis
Thirty-three phlD sequences (Table 1) were identified in the
non-redundant GenBank dataset (NCBI) using the www-
based NCBI nucleotide BLAST search engine (Altschul et al.,
1997) with default parameters and the 2,4-DAPG biosyn-
thetic locus of P. fluorescens Q2-87 as the query sequence.
Sequences longer than 600 bp, together with the 37 phlD
sequences obtained in this study (Table 1), were trimmed to
an identical length of 599 bp and aligned using the CLUSTALW
service at the European Bioinformatics Institute (URL
http://www.ebi.ac.uk/clustalw). Phylogenetic analyses were
performed with PHYLIP 3.62 (Felsenstein, 1989) using the
neighbour-joining method and, for comparison purposes,
with the maximum parsimony method. For both methods,
both DNA and protein sequences were used. The confidence
of the topology of the neighbour-joining phylogenetic tree
for the phlD gene was assessed by bootstrap analysis with
1000 resamplings. Phylogenetic trees were visualized with
TreeView (Win32) (URL http://taxonomy.zoology.gla.ac.uk/
rod/rod.html).
Allele-specific PCR
phlD allele-specific primers for detection of the six most
studied BOX-PCR genotypes were designed on the basis of
phlD sequences from: P. fluorescens UP61, CHA0 and PF-5
(genotype A); Q8r1-96 and 11-18 (genotype D); F113
(genotype K); 1M1-96 (genotype L); PILH1 (genotype M);
7MA12 (genotype O); MVP1-4 and MVW1-1 (genotype P);
and MVW4-2 (genotype Q) (Table 1). The sequences were
aligned using CLUSTALW, and the alignment was used to
design allele-specific PCR primers (Table 2) with the aid of
OLIGO V.6.65 software (Molecular Biology Insights Inc.,
Cascade, CO) according to the following criteria: (1)
oligonucleotide length of 18–25 bp; (2) melting temperature
(Tm) of Z55 1C with differences of � 13.5 1C between
primer pairs; (3) five to seven nucleotides at the 30 end
including at least one allele-specific nucleotide; (4) 30
terminal nucleotide different from A; (5) no predicted
hairpin loops, duplexes or primer-dimers; and (6) amplifi-
cation product of Z300 bp. An in silico test of primer
specificity was conducted by comparing the primer se-
quences with the non-redundant GenBank dataset with
parameters set for the identification of short, nearly exact
matches.
Conditions for allele-specific amplification of phlD initi-
ally were determined using purified genomic DNA from
strains of the A, B, D, K, L and P genotypes as template.
PCRs contained 1�Taq reaction buffer (Promega Corp.,
Madison, WI), 1.5 mM MgCl2, 200 mM of each dATP, dCTP,
dGTP, dTTP (Perkin-Elmer, Norwalk, CT), 20 pmol of each
primer and 1.2 U of Taq DNA polymerase (Promega Corp.).
Table 2. PCR primers used in this study
Primer Sequence Tm ( 1C)a Positionb Reference
A-align TGT TGC CGG CTT CCG ACA GGC TGC 86.6 1944–1967 This study
A-gen-exten GAC ATT CGC ATG GTG ATC GTC ACT 76.0 2545–2571cc This study
B-genlong CTT GAA TCC CGG CGC CTT ATC G 77.0 2239–2260 This study
D-gen-2 GCA GGA AGT AAG ACC CGG TA 64.2 2212–2231 This study
K-gen ACC ACC GAC GAC ATT CGA 64.0 2563–2580c This study
L1-exten CTC GCT ATC AGG CAG GAA GTA AGA A 79.5 2200–2224 This study
P-gen CGA GCC AAT GAT TTT GCT 64.5 2403–2421c This study
B2BF ACC CAC CGC AGC ATC GTT TAT GAG C 65.6 2640–2664c McSpadden
Gardener etal., 2001
BPR4 CCG CCG GTA TGG AAG ATG AAA AAG TC 63.4 2036–2061 McSpadden
Gardener etal., 2001
aMelting temperature based on the ‘nearest-neighbour’ thermodynamic method as predicted by the OLIGO v. 6.65 primer analysis software.bPosition refers to the sequence of the phl operon from Pseudomonas fluorescencens Q2-87 (Accession number PFU41818).cPrimer corresponds to complementary DNA strand.
FEMS Microbiol Ecol 56 (2006) 64–78c� 2006 Federation of European Microbiological SocietiesPublished by Blackwell Publishing Ltd. No claim to original US government works.
68 L. De La Fuente et al.

Amplification was performed with a PTC-200 thermal cycler
(MJ Research, Watertown, MA). The cycling programme
consisted of initial melting at 95 1C for 180 s, followed by 35
cycles of melting at 94 1C for 60 s, annealing at 60 1C for 60 s
and extension at 72 1C for 60 s, and a final extension at 72 1C
for 300 s. The annealing temperature and MgCl2 and
dimethylsulphoxide (DMSO) concentrations subsequently
were adjusted as shown in Table 3. Specificity was evaluated
by whole-cell PCR from 1-day-old single colonies of
70 strains (Table 1) representative of all 18 genotypes.
Freeze–thawed cell suspensions (2.5mL) were used as tem-
plates when samples from serial dilution plates or broth
cultures were analysed. PCR amplification products
were separated in 0.8% agarose gels containing ethidium
bromide (0.5mg mL�1).
Detectionofgenotypes inmixedbroth culturesbyallele-specific PCR
Strains were grown individually and in pairwise combina-
tions in vitro using a protocol similar to that of Landa et al.
(2003) in order to determine the detection limit of each
genotype by phlD-directed allele-specific PCR. Analyses
included P. fluorescens Pf-5, Q2-87, Q8r1-96, F113, 1M1-96
and MVP1-4 alone; P. fluorescens Q8r1-96 plus Pf-5, Q2-87,
F113, 1M1-96 or MVP1-4; and P. fluorescens F113 plus
MVP1-4. All strains have previously been characterized with
regard to their rhizosphere colonization (Landa et al., 2002a,
2003), and strain pairs were chosen based on competition
studies performed in the rhizosphere in this study and
others (L. De La Fuente and D.M. Weller, unpublished data,
2003). Overnight cultures of each strain were harvested by
centrifugation in a microfuge (10 000 g, 5 min), suspended
in 1/3�KMB to an absorbance at 600 nm (OD600 nm) of 0.1
(c. 1� 108 CFU mL�1) using a SAFIRE microplate reader
(Tecan Systems, Inc., San Jose, CA) and added (250mL per
well) to 96-well microtitre plates. For pairs of strains, 125 mL
of appropriate tenfold serial dilutions was added to the wells
to obtain mixture ratios of 1 : 1, 1 : 10, 10 : 1, 1 : 100 and
100 : 1. Samples were replicated three times and the entire
experiment was conducted twice. The plates were incubated
at room temperature for 72 h and bacterial growth was
monitored at 24 h intervals by measuring OD600 nm. Samples
(20mL) were taken at 0, 24, 48 and 72 h from each well, and
freeze–thawed prior to analysis by PCR with primers specific
for each genotype in the culture.
Inhibition betweengenotypes inmixedbrothcultures
Viable population sizes were determined as plate counts in
order to establish whether the failure to detect certain
genotypes by PCR when they were grown in combination
resulted from the inhibition of one strain by another or from
ineffective PCR amplification with the allele-specific pri-
mers. The experiment was performed with derivatives of
strains Q2-87, Q8r1-96 and MVP1-4 marked with mini-
Tn7gfp1 or mini-Tn7gfp2 (Koch et al., 2001), which confer
resistance to kanamycin (Q2-87Km, MVP1-4Km) or genta-
micin (Q8r1-96Gm), respectively (Validov et al., 2005). The
use of tagged derivatives allowed us to differentiate between
the competing strains by plating on selective media contain-
ing the corresponding antibiotics. Cultures (4 mL) of in-
dividual strains or mixtures (Q8r1-96Gm plus Q2-87Km or
MVP1-4Km) at ratios of 1 : 1, 1 : 10 and 10 : 1 in 1/3� KMB
broth were incubated on a rotary shaker (200 r.p.m.) at
28 1C for 72 h, and viable cell numbers were scored at 24-h
intervals by plating on 1/3� KMB agar amended with either
kanamycin or gentamicin. Three repetitions were used for
each measurement, and the experiment was repeated three
times.
Genotypedetection byallele-specific PCR in soiland rhizospheresamples
Materials from a previous study (Landa et al., 2003) were
employed to demonstrate that allele-specific primers can
Table 3. PCR conditions for the detection of different genotypes of 2,4-diacetylphloroglucinol (2,4-DAPG)-producing Pseudomonas species using
allele-specific primers
Target BOX-PCR genotype
Allele-specific primers
DTm ( 1C)a Tann ( 1C)b Optimal reaction conditions Amplicon size (bp)Upper Lower
A A-align A-gen-exten 10.6 62.2 1.5 mM MgCl2 628
B B-genlong B2BF 2.5 60.0 1.5 mM MgCl2 421
D D-gen-2 B2BF 1.4 66.0 1.5 mM MgCl2 428
K BPR4 K-gen 13.5 63.0 1.5 mM MgCl214% DMSOc 544
L L1-exten B2BF 0.0 66.0 1.0 mM MgCl2 460
P BPR4 P-gen 13.0 65.0 1.5 mM MgCl2 385
aDifference between melting temperatures (Tm) within a given primer pair based on the ‘nearest-neighbour’ thermodynamic method as predicted by
the OLIGO primer analysis software.bOptimal annealing temperature found experimentally.cDMSO, dimethylsulphoxide.
FEMS Microbiol Ecol 56 (2006) 64–78 c� 2006 Federation of European Microbiological SocietiesPublished by Blackwell Publishing Ltd. No claim to original US government works.
69Diversity and detection of genotypes of Pseudomonas fluorescens

quantify 2,4-DAPG producers of multiple genotypes in soil
and on roots. These materials were selected because they
allowed a direct comparison of population sizes detected by
the original PCR-based dilution endpoint assay (McSpad-
den Gardener et al., 2001) and our new approach with allele-
specific primers. In the original experiment (Landa et al.,
2003), a Shano silt loam was inoculated with rifampicin-
resistant derivatives of Q8r1-96 and F113, individually
or as a 1 : 1 mixture, each at c. log 4 CFU per gram of soil.
Three treatments were then established. The first consisted
of pots filled with soil inoculated with the bacteria and sown
with wheat (Triticum aestivum L. cv. Penawawa) seeds. After
3 weeks (referred to as one ‘cycle’), the plants were
harvested, roots with adhering rhizosphere soil (designated
RRS) were assayed for the introduced bacteria, and the soil
and remaining roots were returned to the pots and sown
again to begin the next cycle. Wheat was grown for a
total of five 3-week cycles and the roots were assayed for
the introduced bacteria after each cycle (see below).
The second treatment was identical to the first, except that
the roots were not incorporated into the soil after each
cycle, and the soil without roots (designated non-rhizo-
sphere soil, NRS) was assayed for the introduced bacteria.
The third treatment consisted of pots filled with inoculated
soil and watered weekly, but in which no plants were
sown. At 3-week intervals, the soil was removed, shaken
and returned to the pots, and the samples (designated bulk
soil, BS) were processed as described previously (Landa
et al., 2003).
Densities of Q8r1-96 and F113 in all three sets of samples
were determined by Landa et al. (2003) using the PCR-based
dilution endpoint technique (McSpadden Gardener et al.,
2001) on six randomly selected roots (repetitions) from each
treatment. Briefly, root samples were vortexed in water,
three-fold serial dilutions were made in microtitre dishes,
and aliquots from each well were transferred to another dish
containing 1/3� KMB1111 broth amended with chloram-
phenicol, ampicillin, cycloheximide and rifampicin. Growth
in the last turbid well (terminal dilution culture, TDC),
detected by measuring OD600 nm, is considered to have
originated from a single cell. The presence of phlD in the
TDC was confirmed by PCR with ‘generic’ primers B2BF/
BPR4, and the most abundant genotype was identified by
phlD RFLP analysis. The population sizes were calculated by
applying the formula [Vi� 200� 3n/fresh weight root (g)],
where Vi is the volume of water used to suspend the root
system and n is the number of dilutions corresponding to
the TDC. McSpadden Gardener et al. (2001) discussed the
mathematical basis of the assay. Population sizes of phlD1
isolates quantified by the dilution endpoint assay were
identical to those determined by dilution plating (Landa
et al., 2002b). Thus, we continue to express population sizes
as CFU for convenience.
As reported by Landa et al. (2003), amplification pro-
ducts from treatments in which strain Q8r1-96 or F113 had
been introduced individually produced the phlD RFLP
profiles expected for each strain. However, in mixed treat-
ments of Q8r1-96 plus F113, only the F113 profile was
detected because the density of Q8r1-96 was lower than that
of F113. Here, we used the allele-specific primers and the
original broth cultures that had been assayed previously
(Landa et al., 2003), and stored at � 80 1C for over 18
months, to determine the population sizes of both F113 and
Q8r1-96. Validation of the utility of the primers would
require that the allele-specific primers would detect the
same population sizes of Q8r1-96 and F113 as the original
dilution endpoint assay.
Dataanalysis
Population data from the soil studies were converted to log
CFU per gram of soil or root fresh weight to satisfy the
assumptions of analysis of variance (ANOVA). The coloniza-
tion of the rhizosphere or soil by each strain introduced
individually, or as a mixture, was determined by two
methods. The area under the colonization progress curve
(AUCPC) (Landa et al., 2002a) was calculated by using the
trapezoidal integration method (Campbell & Madden,
1990). The mean colonization was calculated as the mean
population density across all cycles (Landa et al., 2002a).
Differences in population densities between treatments were
determined by ANOVA and mean comparisons between treat-
ments were performed by Fischer’s protected least signifi-
cant difference (LSD) test at P = 0.05 using STATISTIX 8.0
software (Analytical Software, St. Paul, MN). For soil or
rhizosphere samples in which no PCR signal was detected,
the population density was set at the detection limit of the
allele-specific PCR assay (log 3.26 CFU per gram of sample).
Results
phlD sequences and phylogenetic analyses
The 37 2,4-DAPG-producing Pseudomonas fluorescens
strains from which phlD was sequenced in this study are of
diverse host crop and geographical origins (Table 1). These
sequences, together with those from other studies (McSpad-
den-Gardener et al., 2000; Mavrodi et al., 2001; Landa et al.,
2002a, 2005; Mazzola et al., 2004), were used for phyloge-
netic analysis of 20 of the 22 BOX-PCR genotypes described
to date (A–Q, T, PfY, PfZ). When available, phlD sequences
from at least three strains from each genotype were in-
cluded, although genotypes G, H, I, K and N currently are
represented by a single strain. Comparison of sequences
from the 20 BOX-PCR genotypes revealed identities ranging
from 76.0 to 99.7%, confirming previous observations (Keel
FEMS Microbiol Ecol 56 (2006) 64–78c� 2006 Federation of European Microbiological SocietiesPublished by Blackwell Publishing Ltd. No claim to original US government works.
70 L. De La Fuente et al.
et al., 1996; McSpadden Gardener et al., 2001; Ramette et al.,
2001) that phlD is highly conserved amongst 2,4-DAPG-
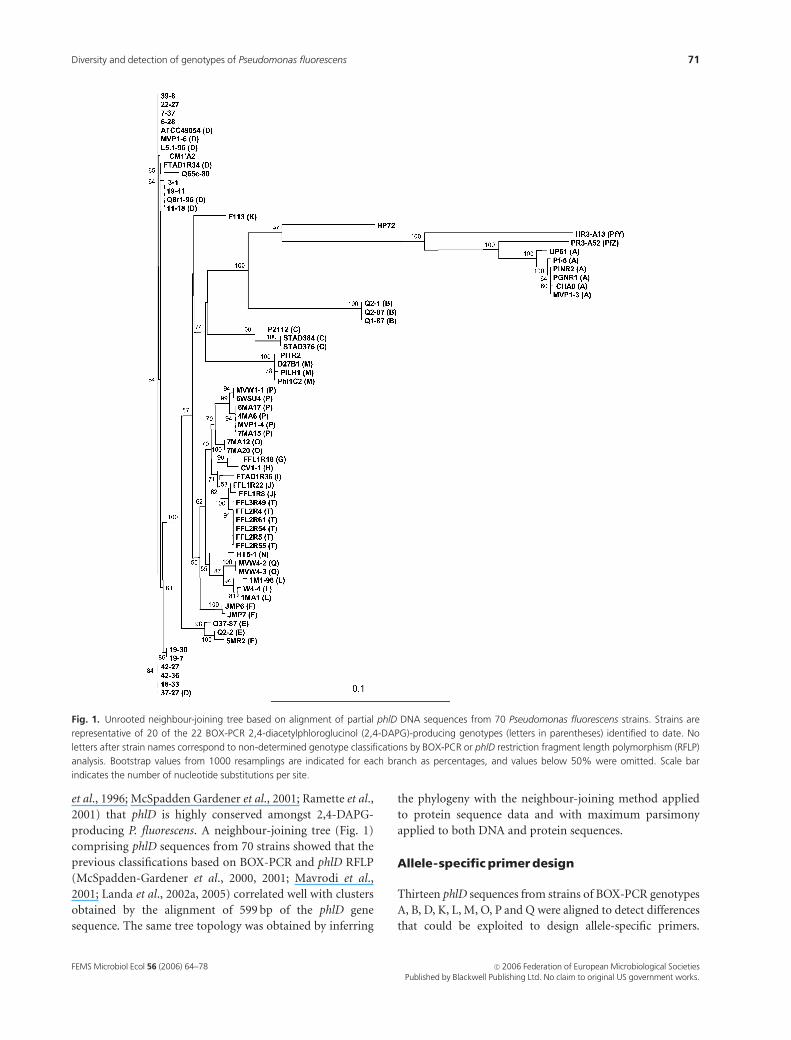
producing P. fluorescens. A neighbour-joining tree (Fig. 1)
comprising phlD sequences from 70 strains showed that the
previous classifications based on BOX-PCR and phlD RFLP
(McSpadden-Gardener et al., 2000, 2001; Mavrodi et al.,
2001; Landa et al., 2002a, 2005) correlated well with clusters
obtained by the alignment of 599 bp of the phlD gene
sequence. The same tree topology was obtained by inferring
the phylogeny with the neighbour-joining method applied
to protein sequence data and with maximum parsimony
applied to both DNA and protein sequences.
Allele-specific primerdesign
Thirteen phlD sequences from strains of BOX-PCR genotypes
A, B, D, K, L, M, O, P and Q were aligned to detect differences
that could be exploited to design allele-specific primers.
Fig. 1. Unrooted neighbour-joining tree based on alignment of partial phlD DNA sequences from 70 Pseudomonas fluorescens strains. Strains are
representative of 20 of the 22 BOX-PCR 2,4-diacetylphloroglucinol (2,4-DAPG)-producing genotypes (letters in parentheses) identified to date. No
letters after strain names correspond to non-determined genotype classifications by BOX-PCR or phlD restriction fragment length polymorphism (RFLP)
analysis. Bootstrap values from 1000 resamplings are indicated for each branch as percentages, and values below 50% were omitted. Scale bar
indicates the number of nucleotide substitutions per site.
FEMS Microbiol Ecol 56 (2006) 64–78 c� 2006 Federation of European Microbiological SocietiesPublished by Blackwell Publishing Ltd. No claim to original US government works.
71Diversity and detection of genotypes of Pseudomonas fluorescens
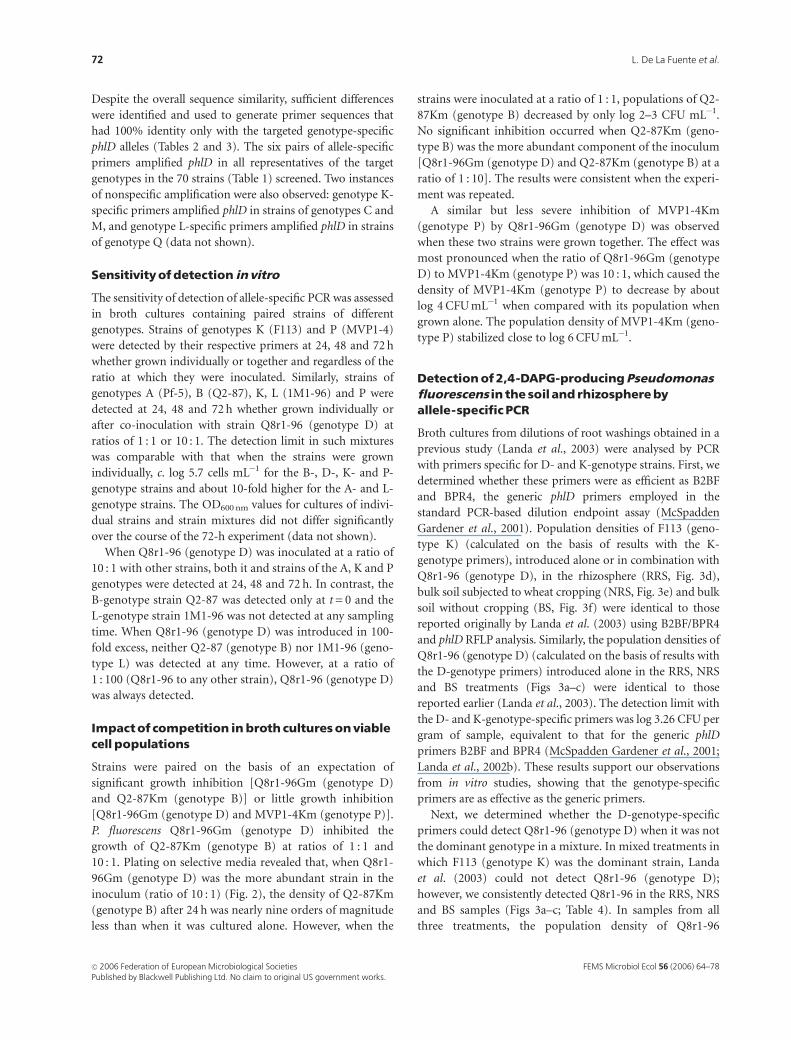
Despite the overall sequence similarity, sufficient differences
were identified and used to generate primer sequences that
had 100% identity only with the targeted genotype-specific
phlD alleles (Tables 2 and 3). The six pairs of allele-specific
primers amplified phlD in all representatives of the target
genotypes in the 70 strains (Table 1) screened. Two instances
of nonspecific amplification were also observed: genotype K-
specific primers amplified phlD in strains of genotypes C and
M, and genotype L-specific primers amplified phlD in strains
of genotype Q (data not shown).
Sensitivityofdetection invitro
The sensitivity of detection of allele-specific PCR was assessed
in broth cultures containing paired strains of different
genotypes. Strains of genotypes K (F113) and P (MVP1-4)
were detected by their respective primers at 24, 48 and 72 h
whether grown individually or together and regardless of the
ratio at which they were inoculated. Similarly, strains of
genotypes A (Pf-5), B (Q2-87), K, L (1M1-96) and P were
detected at 24, 48 and 72 h whether grown individually or
after co-inoculation with strain Q8r1-96 (genotype D) at
ratios of 1 : 1 or 10 : 1. The detection limit in such mixtures
was comparable with that when the strains were grown
individually, c. log 5.7 cells mL�1 for the B-, D-, K- and P-
genotype strains and about 10-fold higher for the A- and L-
genotype strains. The OD600 nm values for cultures of indivi-
dual strains and strain mixtures did not differ significantly
over the course of the 72-h experiment (data not shown).
When Q8r1-96 (genotype D) was inoculated at a ratio of
10 : 1 with other strains, both it and strains of the A, K and P
genotypes were detected at 24, 48 and 72 h. In contrast, the
B-genotype strain Q2-87 was detected only at t = 0 and the
L-genotype strain 1M1-96 was not detected at any sampling
time. When Q8r1-96 (genotype D) was introduced in 100-
fold excess, neither Q2-87 (genotype B) nor 1M1-96 (geno-
type L) was detected at any time. However, at a ratio of
1 : 100 (Q8r1-96 to any other strain), Q8r1-96 (genotype D)
was always detected.
Impactof competition in broth culturesonviablecell populations
Strains were paired on the basis of an expectation of
significant growth inhibition [Q8r1-96Gm (genotype D)
and Q2-87Km (genotype B)] or little growth inhibition
[Q8r1-96Gm (genotype D) and MVP1-4Km (genotype P)].
P. fluorescens Q8r1-96Gm (genotype D) inhibited the
growth of Q2-87Km (genotype B) at ratios of 1 : 1 and
10 : 1. Plating on selective media revealed that, when Q8r1-
96Gm (genotype D) was the more abundant strain in the
inoculum (ratio of 10 : 1) (Fig. 2), the density of Q2-87Km
(genotype B) after 24 h was nearly nine orders of magnitude
less than when it was cultured alone. However, when the
strains were inoculated at a ratio of 1 : 1, populations of Q2-
87Km (genotype B) decreased by only log 2–3 CFU mL�1.
No significant inhibition occurred when Q2-87Km (geno-
type B) was the more abundant component of the inoculum
[Q8r1-96Gm (genotype D) and Q2-87Km (genotype B) at a
ratio of 1 : 10]. The results were consistent when the experi-
ment was repeated.
A similar but less severe inhibition of MVP1-4Km
(genotype P) by Q8r1-96Gm (genotype D) was observed
when these two strains were grown together. The effect was
most pronounced when the ratio of Q8r1-96Gm (genotype
D) to MVP1-4Km (genotype P) was 10 : 1, which caused the
density of MVP1-4Km (genotype P) to decrease by about
log 4 CFU mL�1 when compared with its population when
grown alone. The population density of MVP1-4Km (geno-
type P) stabilized close to log 6 CFU mL�1.
Detectionof2,4-DAPG-producingPseudomonasfluorescens in the soil and rhizospherebyallele-specificPCR
Broth cultures from dilutions of root washings obtained in a
previous study (Landa et al., 2003) were analysed by PCR
with primers specific for D- and K-genotype strains. First, we
determined whether these primers were as efficient as B2BF
and BPR4, the generic phlD primers employed in the
standard PCR-based dilution endpoint assay (McSpadden
Gardener et al., 2001). Population densities of F113 (geno-
type K) (calculated on the basis of results with the K-
genotype primers), introduced alone or in combination with
Q8r1-96 (genotype D), in the rhizosphere (RRS, Fig. 3d),
bulk soil subjected to wheat cropping (NRS, Fig. 3e) and bulk
soil without cropping (BS, Fig. 3f) were identical to those
reported originally by Landa et al. (2003) using B2BF/BPR4
and phlD RFLP analysis. Similarly, the population densities of
Q8r1-96 (genotype D) (calculated on the basis of results with
the D-genotype primers) introduced alone in the RRS, NRS
and BS treatments (Figs 3a–c) were identical to those
reported earlier (Landa et al., 2003). The detection limit with
the D- and K-genotype-specific primers was log 3.26 CFU per
gram of sample, equivalent to that for the generic phlD
primers B2BF and BPR4 (McSpadden Gardener et al., 2001;
Landa et al., 2002b). These results support our observations
from in vitro studies, showing that the genotype-specific
primers are as effective as the generic primers.
Next, we determined whether the D-genotype-specific
primers could detect Q8r1-96 (genotype D) when it was not
the dominant genotype in a mixture. In mixed treatments in
which F113 (genotype K) was the dominant strain, Landa
et al. (2003) could not detect Q8r1-96 (genotype D);
however, we consistently detected Q8r1-96 in the RRS, NRS
and BS samples (Figs 3a–c; Table 4). In samples from all
three treatments, the population density of Q8r1-96
FEMS Microbiol Ecol 56 (2006) 64–78c� 2006 Federation of European Microbiological SocietiesPublished by Blackwell Publishing Ltd. No claim to original US government works.
72 L. De La Fuente et al.
(genotype D) was significantly reduced by about 10- to
1000-fold in the presence of F113 (genotype K). Further-
more, the AUCPC for Q8r1-96 introduced in combination
with F113 was significantly smaller (Po 0.05) than when it
was introduced alone (Table 4). The negative effects of F113
(genotype K) on the density of Q8r1-96 (genotype D) were
greater in RRS samples than in NRS and BS samples (Fig. 3).
In contrast, population densities of F113 were not affected
by the presence of Q8r1-96 (Figs 3a–c; Table 4) in samples
from any of the three treatments, and were identical to those
reported by Landa et al. (2003). These results further
validate the utility of the genotype-specific primers in
detecting and quantifying subordinate genotypes in mixed
populations.
Discussion
With the 37 strains sequenced in this study (Table 1), a
comprehensive collection of 70 phlD sequences from 2,4-
DAPG producers of diverse origin is now available. As in
previous studies based on phlD RFLP (Mavrodi et al., 2001;
Ramette et al., 2001), clusters identified with our phlD
sequence-based phylogenetic tree (Fig. 1) did not correlate
with the geographical origin or the host crop from which the
strains were isolated (Table 1). More importantly, however,
the clusters correspond to the BOX-PCR genotype classifi-
cation previously described by our laboratory (McSpadden
Gardener et al., 2000, 2001; Mavrodi et al., 2001; Landa
et al., 2002a, 2005). Therefore, it is reasonable to assume that
strains not previously characterized by BOX-PCR, but
found in the same sequence cluster with well-defined strains,
can be considered members of the same genotype. For
example, strains 11-18, 37-27, 42-27, 22-27, 7-37, 6-28, 18-
33, 39-8, 42-36, 19-41 and 3-1, isolated in France from
maize (Picard & Bosco, 2003), most probably belong to
BOX-PCR genotype D. This prediction is supported by the
fact that strains 11-18 and 37-27 were confirmed to be
genotype D by allele-specific PCR and phlD RFLP analyses
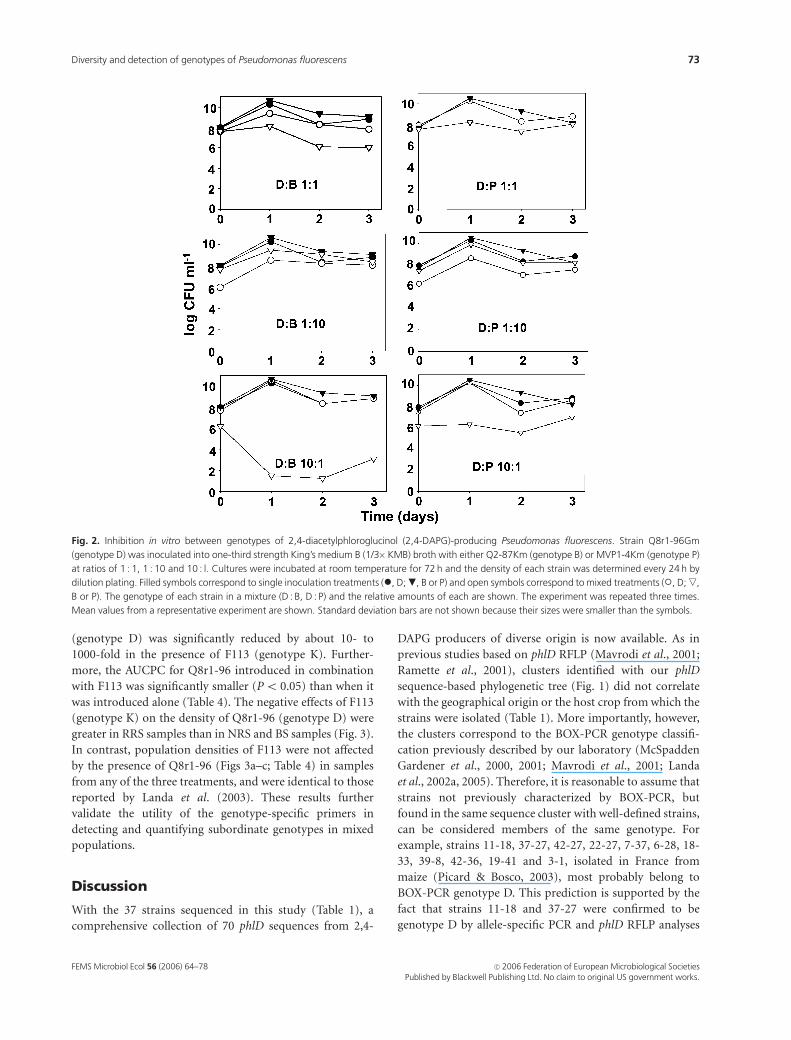
Fig. 2. Inhibition in vitro between genotypes of 2,4-diacetylphloroglucinol (2,4-DAPG)-producing Pseudomonas fluorescens. Strain Q8r1-96Gm
(genotype D) was inoculated into one-third strength King’s medium B (1/3�KMB) broth with either Q2-87Km (genotype B) or MVP1-4Km (genotype P)
at ratios of 1 : 1, 1 : 10 and 10 : l. Cultures were incubated at room temperature for 72 h and the density of each strain was determined every 24 h by
dilution plating. Filled symbols correspond to single inoculation treatments (�, D; ., B or P) and open symbols correspond to mixed treatments (�, D; ,,
B or P). The genotype of each strain in a mixture (D : B, D : P) and the relative amounts of each are shown. The experiment was repeated three times.
Mean values from a representative experiment are shown. Standard deviation bars are not shown because their sizes were smaller than the symbols.
FEMS Microbiol Ecol 56 (2006) 64–78 c� 2006 Federation of European Microbiological SocietiesPublished by Blackwell Publishing Ltd. No claim to original US government works.
73Diversity and detection of genotypes of Pseudomonas fluorescens
(B.B. Landa and D.M. Weller, unpublished results, 2004).
Therefore, to our knowledge, these are the first D-genotype
isolates found in Europe. Previously, D-genotype strains had
only appeared in US collections (McSpadden-Gardener
et al., 2000, 2005; Landa et al., 2002a, 2005); thus, they
appear to be more widely distributed than previously
thought. In addition, according to the neighbour-joining
tree topology, strain PITR2 may belong to the M genotype
(Fig. 1). On the other hand, a strain such as HP72 appears to
define an independent branch of the tree (Fig. 1), and most
probably represents a new genotype.
Ramette et al. (2001) used phlD sequences from seven 2,4-
DAPG-producing strains to describe three clusters, two of
which correspond to the A- and B-genotype strains, respec-
tively, and a third cluster encompassing strains from K, M
and unidentified BOX-PCR genotypes. Recently, Bergsma-
Vlami et al. (2005) have defined six clusters amongst 37 2,4-
DAPG-producing strains using sequence data from a shorter
fragment (325 bp) of the phlD sequence. Their clustering did
not match their genotype classification by DGGE. In our
study, the use of a larger 599-bp fragment from 70 strains
allowed the differentiation of a larger number of clusters
that do match our BOX-PCR classification (McSpadden-
Gardener et al., 2000; Landa et al., 2002a, 2005). Mazzola
et al. (2004) used a phlD sequence-based tree of 25 strains to
identify two new genotypes, PfY and PfZ. Our tree (Fig. 1)
establishes the sequence of phlD as a valid criterion for
classifying 2,4-DAPG producers according to the BOX-PCR
genotype previously defined in our laboratory (McSpadden-
Gardener et al., 2000; Mavrodi et al., 2001; Landa et al.,
2002a, 2005). This is especially important, as it has pre-
viously been shown that the genotype is predictive of the
colonization ability of a strain on at least some host plants
(Raaijmakers & Weller, 2001; Landa et al., 2002a, 2003).
We exploited naturally occurring variation within the
sequence of phlD to develop allele-specific PCR primers for
the detection of A-, B-, D-, K-, L- and P-genotype strains of
2,4-DAPG-producing Pseudomonas. Using these primers, we
significantly improved the technique developed by McSpad-
den Gardener et al. (2001) by making it suitable for fine-
scale studies of interactions between 2,4-DAPG producers in
the rhizosphere, whilst retaining its high-throughput
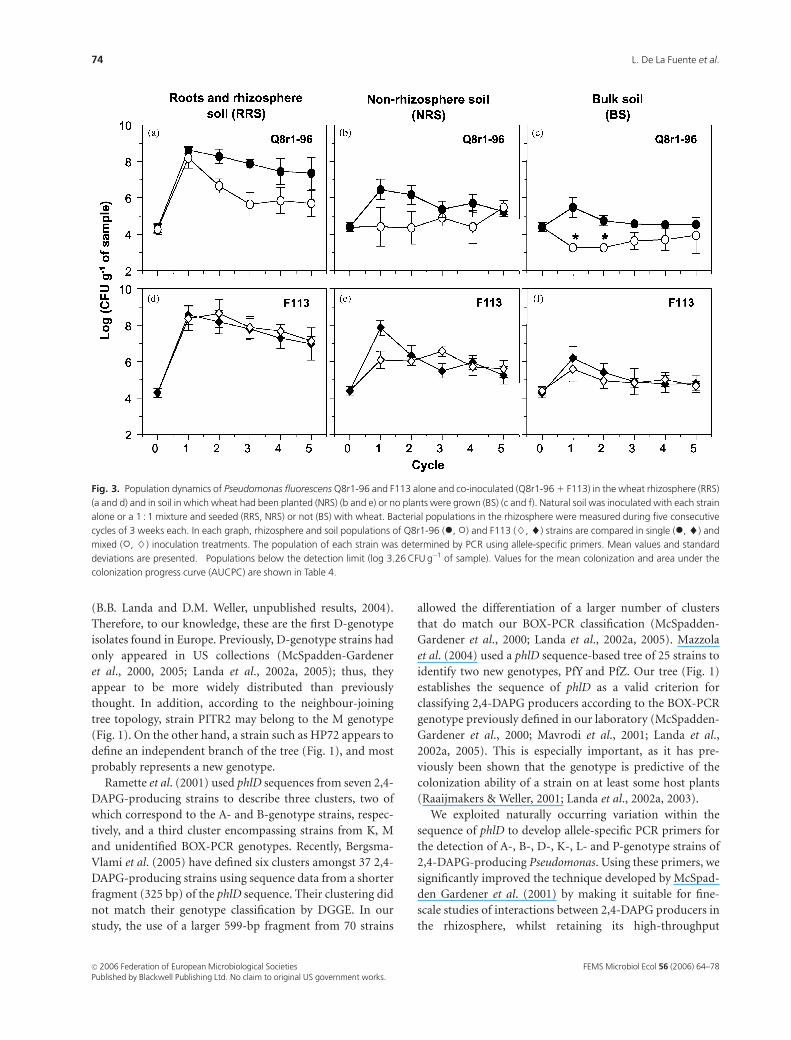
Fig. 3. Population dynamics of Pseudomonas fluorescens Q8r1-96 and F113 alone and co-inoculated (Q8r1-96 1 F113) in the wheat rhizosphere (RRS)
(a and d) and in soil in which wheat had been planted (NRS) (b and e) or no plants were grown (BS) (c and f). Natural soil was inoculated with each strain
alone or a 1 : 1 mixture and seeded (RRS, NRS) or not (BS) with wheat. Bacterial populations in the rhizosphere were measured during five consecutive
cycles of 3 weeks each. In each graph, rhizosphere and soil populations of Q8r1-96 (�, �) and F113 (}, ~) strains are compared in single (�, ~) and
mixed (�, }) inoculation treatments. The population of each strain was determined by PCR using allele-specific primers. Mean values and standard
deviations are presented. �Populations below the detection limit (log 3.26 CFU g�1 of sample). Values for the mean colonization and area under the
colonization progress curve (AUCPC) are shown in Table 4.
FEMS Microbiol Ecol 56 (2006) 64–78c� 2006 Federation of European Microbiological SocietiesPublished by Blackwell Publishing Ltd. No claim to original US government works.
74 L. De La Fuente et al.
capabilities. With few exceptions, the allele-specific primers
gave highly specific amplification of the target genotypes.
Amongst the exceptions were the K-genotype primers,
which also detected C- and M-genotype strains, and the
L-genotype primer, which amplified phlD from Q-genotype
strains. Both a perfect match at the 30 end of the primer and
the nature of the terminal base are critical for the specificity
of Taq polymerase-based amplification (Green, 2002). Ac-
cording to Ayyadevara et al. (2000), placement of an A at the
30 end of the oligonucleotide often leads to the lowest
possible degree of discrimination in allele-specific PCR.
Unfortunately, we were forced to use A in the terminal
position in both the K- and L-genotype primers because of
the absence of polymorphic sites within phlD, which may
explain their more limited specificity.
This study refers to two different detection limits in the
allele-specific PCR-based dilution endpoint assay. We first
described the detection limit in broth cultures, which was c.
log 5.7 CFU mL�1 for strains of genotypes B, D, K and P, and
log 6.7 CFU mL�1 for strains of genotypes A and L. McSpad-
den Gardener et al. (2001) found a similar detection limit in
vitro (log 5 CFU mL�1) using the generic primers B2BF and
BPR4. It is difficult to assess exactly how much template
DNA corresponds to these large numbers of cells, because
templates are prepared from freeze–thawed broth cultures in
which only a fraction of the total bacterial population
releases DNA. The fact that the bacterial cultures used in
our study were in the stationary phase of growth when the
PCR was performed may also have influenced the detection
limit (Rezzonico et al., 2003).
We further defined a detection limit of log 3.26 CFU g�1
of root by allele-specific PCR of samples from the rhizo-
sphere. This value is identical to that found by Landa et al.
(2003), who analysed the same samples by PCR with generic
phlD primers. Previous comparisons of three different
techniques to quantify 2,4-DAPG producers in the rhizo-
sphere (Landa et al., 2002b) showed that the detection limit
of the original PCR-based dilution endpoint assay was
comparable with that of traditional dilution plating and
colony hybridization (log 4.0 CFU g�1 of root). Recently, a
proposed alternative technique using DGGE (Bergsma-
Vlami et al., 2005) was shown to have a similar detection
limit (log 3.7 CFU g�1 of root). For our purposes, the speed
and robustness of the dilution endpoint assay outweigh the
drawbacks of a detection limit of about 1000 cells g�1 of
sample.
Given the overall similarity between genotypes of 2,4-
DAPG producers (Keel et al., 1996; McSpadden-Gardener
et al., 2000; Mavrodi et al., 2001), we were surprised to
detect significant inhibition in broth cultures of the B-
genotype strain Q2-87 by the D-genotype strain Q8r1-96.
For example, when Q8r1-96 and Q2-87 were combined in a
ratio of 10 : 1, the density of viable cells of Q2-87 decreased
precipitously from log 6 to log 2 CFU mL�1 after 24 h (Fig.
2). This low density may explain why we could not detect
Q2-87 by PCR when Q8r1-96 was the most abundant
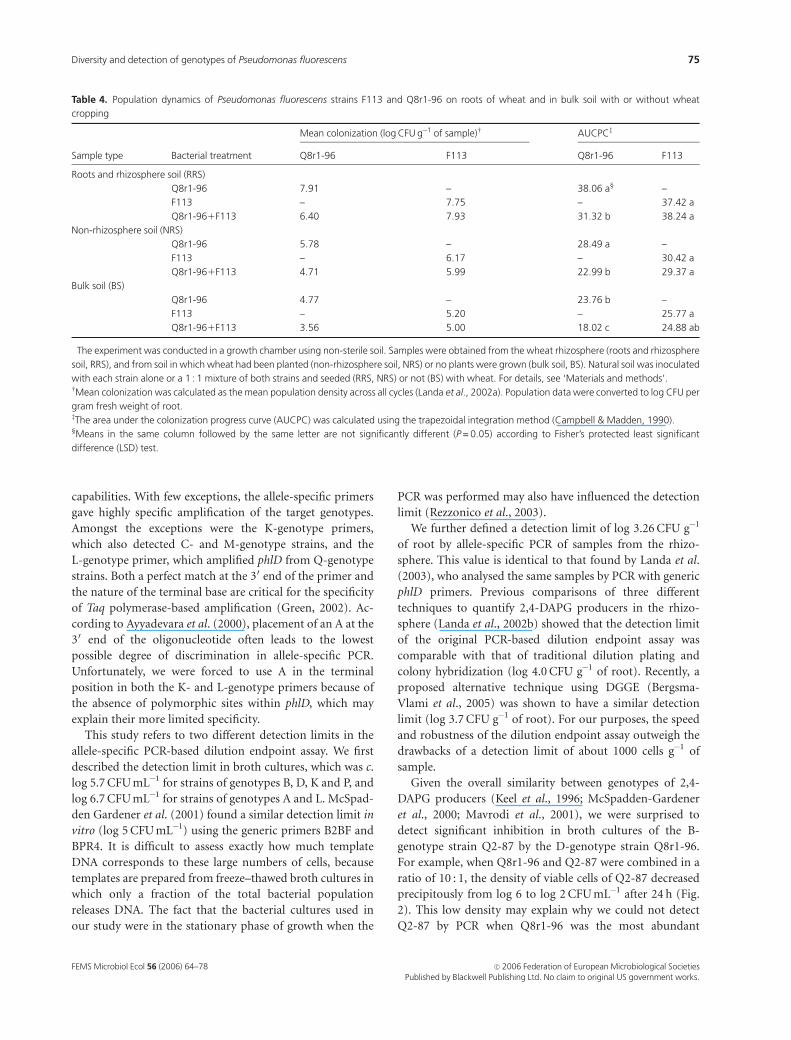
Table 4. Population dynamics of Pseudomonas fluorescens strains F113 and Q8r1-96 on roots of wheat and in bulk soil with or without wheat
cropping�
Sample type Bacterial treatment
Mean colonization (log CFU g�1 of sample)w AUCPCz
Q8r1-96 F113 Q8r1-96 F113
Roots and rhizosphere soil (RRS)
Q8r1-96 7.91 – 38.06 a‰ –
F113 – 7.75 – 37.42 a
Q8r1-961F113 6.40 7.93 31.32 b 38.24 a
Non-rhizosphere soil (NRS)
Q8r1-96 5.78 – 28.49 a –
F113 – 6.17 – 30.42 a
Q8r1-961F113 4.71 5.99 22.99 b 29.37 a
Bulk soil (BS)
Q8r1-96 4.77 – 23.76 b –
F113 – 5.20 – 25.77 a
Q8r1-961F113 3.56 5.00 18.02 c 24.88 ab
�The experiment was conducted in a growth chamber using non-sterile soil. Samples were obtained from the wheat rhizosphere (roots and rhizosphere
soil, RRS), and from soil in which wheat had been planted (non-rhizosphere soil, NRS) or no plants were grown (bulk soil, BS). Natural soil was inoculated
with each strain alone or a 1 : 1 mixture of both strains and seeded (RRS, NRS) or not (BS) with wheat. For details, see ‘Materials and methods’.wMean colonization was calculated as the mean population density across all cycles (Landa et al., 2002a). Population data were converted to log CFU per
gram fresh weight of root.zThe area under the colonization progress curve (AUCPC) was calculated using the trapezoidal integration method (Campbell & Madden, 1990).‰Means in the same column followed by the same letter are not significantly different (P = 0.05) according to Fisher’s protected least significant
difference (LSD) test.
FEMS Microbiol Ecol 56 (2006) 64–78 c� 2006 Federation of European Microbiological SocietiesPublished by Blackwell Publishing Ltd. No claim to original US government works.
75Diversity and detection of genotypes of Pseudomonas fluorescens
component of the mixture. The inhibition of Q2-87 by
Q8r1-96 also occurs in the wheat rhizosphere. Using a de
Wit replacement series, Landa et al. (2003) demonstrated a
competitive disadvantage for strain Q2-87 or strong antag-
onism by Q8r1-96 against Q2-87 in the wheat rhizosphere.
Q8r1-96 produces bacteriocin-like inhibitors active against
Q2-87 (Validov et al., 2005). Theoretical models of interac-
tions between bacteriocin-producing and sensitive strains
have shown that inhibition depends on the relative strain
concentrations (Durret & Levin, 1997). If both are present at
equal densities, the bacteriocin-producing strain cannot
prevail, but, when it is the more abundant strain, it will
antagonize the sensitive strain. This model is consistent with
the observed patterns of inhibition of Q2-87 by strain Q8r1-
96, and reveals a limitation of the allele-specific and dilution
endpoint PCR assays; the results of competition studies can
be compromised if one genotype inhibits the growth of
another during the growth step in the PCR-based dilution
endpoint assay, when dilutions of root washings are trans-
ferred into 1/3� KMB111. In such cases, the density of the
antagonized strain will be underestimated. During mild
inhibition, as in mixed cultures of Q8r1-96 and MVP1-4
(genotype P) (Fig. 2), both strains remained at detectable
levels even though population sizes of MVP1-4 declined
significantly. No bias of allele-specific PCR amplification
occurred when strains were cultured in mixtures unless
strong specific inhibition occurred. Ultimately, it will be
necessary to test specific strains of all of the genotypes in
combination to identify those that are especially sensitive to
inhibition by others.
The most interesting application of allele-specific PCR is
the detection and quantification of two (this study) or more
(L. De La Fuente, B.B. Landa and D.M. Weller, unpublished
results, 2004) strains of different genotypes of 2,4-DAPG
producers competing in soil or on roots. Allele-specific PCR
has a clear advantage over the well-tested original PCR-
based dilution endpoint assay (McSpadden Gardener et al.,
2001, 2005; Landa et al., 2002a, 2003, 2005), which is limited
by its inability to detect less abundant genotypes when their
densities are three- to six-fold less than the dominant
genotype (McSpadden Gardener et al., 2001; Landa et al.,
2003). This is due to the generic nature of primers B2BF/
BPR4, which amplify all BOX-PCR genotypes (McSpadden
Gardener et al., 2001, 2005; Mazzola et al., 2004; Landa et al.,
2005). In our current study with samples from previous
work (Landa et al., 2003), we demonstrated the utility of our
allele-specific primers by quantifying the density of Q8r1-96
in competition with F113 in three different types of rhizo-
sphere and soil samples (Fig. 3; Table 4). Studies to date
(Weller et al., 2002; de Souza et al., 2003b) suggest that
disease-suppressive and crop monoculture soils contain
multiple genotypes, with one genotype often dominant.
However, how interactions between the genotypes contri-
bute to pathogen or competing genotype suppression, and
whether strains of different genotypes inhabit different
niches in the soil and rhizosphere environment, are ques-
tions that have been difficult to address with previously
available techniques.
Acknowledgements
This project was supported by the National Research In-
itiative of the United States Department of Agriculture
Cooperative State Research, Education and Extension Ser-
vice, grant number 2003-35107-13777. B.B. Landa is a
recipient of a Ramon y Cajal grant from the Ministerio de
Educacion y Ciencia of Spain. We thank Olga Mavrodi for
helpful comments.
References
Altschul SF, Madden TL, Schaffer AA, Zhang J, Zhang Z, Mille W
& Lipman DJ (1997) Gapped BLAST and PSI-BLAST: a new
generation of protein database search programs. Nucleic Acids
Res 25: 3389–3401.
Ayyadevara S, Thaden JJ & Shmookler-Reis RJ (2000)
Discrimination of primer 30-nucleotide mismatch by Taq
DNA polymerase during polymerase chain reaction. Anal
Biochem 284: 11–18.
Bangera MG & Thomashow LS (1999) Identification and
characterization of a gene cluster for synthesis of the
polyketide antibiotic 2,4-diacetylphloroglucinol from
Pseudomonas fluorescens Q2-87. J Bacteriol 181: 3155–3163.
Bagnasco P, De La Fuente L, Gualtieri G, Noya F & Arias A (1998)
Fluorescent Pseudomonas spp. as biocontrol agents against
forage legume root pathogenic fungi. Soil Biol Biochem 30:
1317–1322.
Bergsma-Vlami M, Prins ME, Staatzs M & Raaijmakers JM
(2005) Assessment of genotypic diversity of antibiotic-
producing Pseudomonas species in the rhizosphere by
denaturing gradient gel electrophoresis. Appl Environ
Microbiol 71: 993–1003.
Bonsall RF, Weller DM & Thomashow LS (1997) Quantification
of 2,4-diacetylphloroglucinol produced by fluorescent
Pseudomonas spp. in vitro and in the rhizosphere of wheat.
Appl Environ Microbiol 63: 951–955.
Campbell CL & Madden LV (1990) Introduction to Plant Disease
Epidemiology. John Wiley, New York.
Cronin D, Moenne-Loccoz Y, Fenton A, Dunne C, Dowling DN &
O’Gara F (1997a) Role of 2,4-diacetylphloroglucinol in the
interaction of the biocontrol pseudomonad strain F113 with
the potato cyst nematode Globodera rostochiensis. Appl Environ
Microbiol 63: 1357–1361.
Cronin D, Moenne-Loccoz Y, Fenton A, Dunne C, Dowling DN &
O’Gara F (1997b) Ecological interaction of a biocontrol
Pseudomonas fluorescens strain producing 2,4-
diacetylphloroglucinol with the soft rot potato pathogen
FEMS Microbiol Ecol 56 (2006) 64–78c� 2006 Federation of European Microbiological SocietiesPublished by Blackwell Publishing Ltd. No claim to original US government works.
76 L. De La Fuente et al.
Erwinia carotovora subsp. atroseptica. FEMS Microbiol Ecol 23:
95–106.
Duffy BK & Defago G (1997) Zinc improves biocontrol of
Fusarium crown and root rot of tomato by Pseudomonas
fluorescens and represses the production of pathogen
metabolites inhibitory to bacterial antibiotic biosynthesis.
Phytopathology 87: 1250–1257.
Durret R & Levin S (1997) Allelopathy in spatially distributed
populations. J Theor Biol 185: 165–171.
Felsenstein J (1989) Phylip – phylogeny inference package
(version 3.2). Cladistics 5: 164–166.
Fenton AM, Stephens PM, Crowley J, O’Callaghan M & O’Gara F
(1992) Exploitation of gene(s) involved in 2,4-
diacetylphloroglucinol biosynthesis to confer a new biocontrol
capability to a Pseudomonas strain. Appl Environ Microbiol 58:
3873–3878.
De La Fuente L, Thomashow LS, Weller DM, Bajsa N, Quagliotto
L, Chernin L & Arias A (2004) Pseudomonas fluorescens UP61
isolated from birdsfoot trefoil rhizosphere produces multiple
antibiotics and exerts a broad spectrum of biocontrol activity.
Eur J Plant Pathol 110: 671–681.
Green EK (2002) Allele-specific oligonucleotide PCR. PCR
Mutation Detection Protocols (Theophilus BDM & Rapley R,
eds), pp. 47–50. Humana Press, Totowa, NJ.
Howell CR & Stipanovic RD (1979) Control of Rhizoctonia solani
on cotton seedlings with Pseudomonas fluorescens and with an
antibiotic produced by the bacterium. Phytopathology 69:
480–482.
Iavicoli A, Boutet E, Buchala A & Metraux JP (2003) Induced
systemic resistance in Arabidopsis thaliana in response to root
inoculation with Pseudomonas fluorescens CHA0. Mol
Plant–Microbe Interact 16: 851–858.
Isnansetyo A, Cui L, Hiramatsu K & Kamei Y (2003) Antibacterial
activity of 2,4-diacetylphloroglucinol produced by
Pseudomonas sp. AMSN isolated from a marine alga against
vancomycin-resistant Staphylococcus aureus. Int J Antimicrob
Agents 22: 545–547.
Kamei Y & Isnansetyo A (2003) Lysis of methicillin-resistant
Staphylococcus aureus by 2,4-diacetylphloroglucinol produced
by Pseudomonas sp. AMSN isolated from a marine alga. Int J
Antimicrob Agents 21: 71–74.
Keel C, Schnider U, Maurhofer M, Voisard C, Burger D, Haas D &
Defago G (1992) Suppression of root diseases by Pseudomonas
fluorescens CHA0: importance of the bacterial secondary
metabolite 2,4-diacetylphloroglucinol. Mol Plant–Microbe
Interact 5: 4–13.
Keel C, Weller DM, Natsch A, Defago G, Cook RJ & Thomashow
LS (1996) Conservation of the 2,4-diacetylphloroglucinol
biosynthesis locus among fluorescent Pseudomonas strains
from diverse geographic locations. Appl Environ Microbiol 62:
552–563.
King EO, Ward MK & Raney DE (1954) Two simple media for the
demonstration of pyocianin and fluorescein. J Lab Clin Med
44: 301–307.
Koch B, Jensen LE & Nybroe O (2001) A panel of Tn7-based
vectors for insertion of the gfp marker gene or for delivery of
cloned DNA into Gram-negative bacteria at a neutral
chromosomal site. J Microbiol Methods 45: 187–195.
Landa BB, Mavrodi OV, Raaijmakers JM, McSpadden Gardener
BB, Thomashow LS & Weller DM (2002a) Differential ability
of genotypes of 2,4-diacetylphloroglucinol-producing
Pseudomonas fluorescens strains to colonize the roots of pea
plants. Appl Environ Microbiol 68: 3226–3237.
Landa BB, de Werd HAE, McSpadden-Gardener BB & Weller DM
(2002b) Comparison of three methods for monitoring
populations of different genotypes of 2,4-
diacetylphloroglucinol-producing Pseudomonas fluorescens in
the rhizosphere. Phytopathology 92: 129–137.
Landa BB, Mavrodi DV, Thomashow LS & Weller DM (2003)
Interactions between strains of 2,4-diacetylphloroglucinol-
producing Pseudomonas fluorescens in the rhizosphere of
wheat. Phytopathology 93: 982–994.
Landa BB, Mavrodi OV, Schroeder KL, Allende-Molar R & Weller
DM (2005) Enrichment and genotypic diversity of phlD-
containing fluorescent Pseudomonas spp. in two soils after a
century of wheat and flax monoculture. FEMS Microbiol Ecol
in press.
Lee E-T & Kim S-D (2001) An antifungal substance, 2,4-
diacetylphloroglucinol, produced from antagonistic bacterium
Pseudomonas fluorescens 2112 against Phytophthora capsici. Kor
J Appl Microbiol Biotechnol 29: 37–42.
Lugtenberg BJJ, Dekkers L & Bloemberg GV (2001) Molecular
determinants of rhizosphere colonization by Pseudomonas.
Annu Rev Phytopathol 39: 461–490.
Mavrodi OV, McSpadden-Gardener BB, Mavrodi DV, Bonsall RF,
Weller DM & Thomashow LS (2001) Genetic diversity of phlD
from 2,4-diacetylphloroglucinol-producing fluorescent
Pseudomonas spp. Phytopathology 91: 35–43.
Mavrodi DV, Mavrodi OV, McSpadden-Gardener BB, Landa BB,
Weller DM & Thomashow LS (2002) Identification of
differences in genome content among phlD-positive
Pseudomonas fluorescens strains by using PCR-based
subtractive hybridization. Appl Environ Microbiol 68:
5170–5176.
Mazzola M, Funnell DL & Raaijmakers JM (2004) Wheat
cultivar-specific selection of 2,4-diacetylphloroglucinol-
producing fluorescent Pseudomonas species from resident soil
populations. Microbial Ecol 48: 338–348.
McSpadden Gardener BB, Schroeder KL, Kalloger SE,
Raaijmakers JM, Thomashow LS & Weller DM (2000)
Genotypic and phenotypic diversity of phlD-containing
Pseudomonas strains isolated from the rhizosphere of wheat.
Appl Environ Microbiol 66: 1939–1946.
McSpadden Gardener BB, Mavrodi DV, Thomashow LS & Weller
DM (2001) A rapid polymerase chain reaction-based assay
characterizing rhizosphere populations of 2,4-
diacetylphloroglucinol-producing bacteria. Phytopathology 91:
44–54.
FEMS Microbiol Ecol 56 (2006) 64–78 c� 2006 Federation of European Microbiological SocietiesPublished by Blackwell Publishing Ltd. No claim to original US government works.
77Diversity and detection of genotypes of Pseudomonas fluorescens
McSpadden-Gardener B, Gutierrez LJ, Raghavendra J, Edema R &
Lutton E (2005) Distribution and biocontrol potential of
phlD1 pseudomonads in corn and soybean fields.
Phytopathology 95: 715–724.
Picard C & Bosco M (2003) Genetic diversity of phld gene from
2,4-diacetylphloroglucinol-producing Pseudomonas spp.
Strains from the maize rhizosphere. FEMS Microbiol Lett 219:
167–172.
Picard C, Di Cello F, Ventura M, Fani R & Guckert A (2000)
Frequency and biodiversity of 2,4-diacetylphloroglucinol-
producing bacteria isolated from the maize rhizosphere at
different stages of plant growth. Appl Environ Microbiol 66:
948–955.
Raaijmakers JM & Weller DM (1998) Natural plant protection by
2,4-diacetylphloroglucinol-producing Pseudomonas spp. in
take-all decline soils. Mol Plant–Microbe Interact 11: 144–152.
Raaijmakers JM & Weller DM (2001) Exploiting genotypic
diversity of 2,4-diacetylphloroglucinol-producing
Pseudomonas spp: characterization of superior root-colonizing
P. fluorescens strain Q8r1-96. Appl Environ Microbiol 67:
2545–2554.
Raaijmakers JM, Weller DM & Thomashow LS (1997) Frequency
of antibiotic-producing Pseudomonas spp. in natural
environments. Appl Environ Microbiol 63: 881–887.
Ramette A, Moenne-Locoz Y & Defago G (2001) Polymorphism
of the polyketide synthase gene phlD in biocontrol fluorescent
pseudomonads producing 2,4-diacetylphloroglucoinol and
comparison of phlD with plant polyketide synthases. Mol
Plant–Microbe Interact 14: 639–652.
Rezzonico F, Moenne-Locoz Y & Defago G (2003) Effect of stress
on the ability of a phlA-based quantitative competitive PCR
assay to monitor biocontrol strain Pseudomonas fluorescens
CHA0. Appl Environ Microbiol 69: 686–690.
Schnider U, Keel C, Blumer C, Troxler J, Defago G & Haas D
(1995) Amplification of the housekeeping sigma factor in
Pseudomonas fluorescens CHA0 enhances antibiotic
production and improves biocontrol abilities. J Bacteriol 177:
5387–5392.
Shanahan P, O’Sullivan DJ, Simpson P, Glennon JD & O’Gara F
(1992) Isolation of 2,4-diacetylphloroglucinol from a
fluorescent pseudomonad and investigation of physiological
parameters influencing its production. Appl Environ Microbiol
58: 353–358.
Smirnov VV & Kiprianova EA (1990) Bacteria of Pseudomonas
Genus. Naukova Dumka, Kiev, Ukraine.
de Souza JT, Arnould C, Deulvot C, Lemanceau P, Gianinazzi-
Pearson V & Raaijmakers JM (2003a) Effect of 2,4-
diacetylphloroglucinol on Pythium: cellular responses and
variation in sensitivity among propagules and species.
Phytopathology 93: 966–975.
de Souza JT, Weller DM & Raaijmakers JM (2003b) Frequency,
diversity, and activity of 2,4-diacetylphloroglucinol-producing
fluorescent Pseudomonas spp. in Dutch take-all decline soils.
Phytopathology 93: 54–63.
Stutz EW, Defago G & Kern H (1986) Naturally occurring
fluorescent pseudomonads involved in suppression of black
root rot of tobacco. Phytopathology 76: 181–185.
Thomashow LS & Weller DM (1995) Current concepts in the use
of introduced bacteria for biological disease control:
mechanisms and antifungal metabolites. Plant–Microbe
Interactions, Vol. 1 (Stacey G & Keen N, eds), pp. 187–235.
Chapman & Hall, New York, NY.
Validov S, Mavrodi OV, De La Fuente L, Boronin A, Weller DM,
Thomashow LS & Mavrodi DM (2005) Antagonistic activity
among 2,4-diacetylphloroglucinol-producing fluorescent
Pseudomonas spp. FEMS Microbiol Lett 242: 249–356.
Vincent MN, Harrison LA, Brackin JM, Kovacevich PA, Mukerji
P, Weller DM & Pierson EA (1991) Genetic analysis of the
antifungal activity of a soilborne Pseudomonas aureofaciens
strain. Appl Environ Microbiol 57: 2928–2934.
Wang C, Ramette A, Punjasamarnwong P, Zala M, Natsch A,
Moenne-Loccoz Y & Defago G (2001) Cosmopolitan
distribution of phlD-containing dicotyledonous crop-
associated biocontrol pseudomonads of world wide origin.
FEMS Microbiol Ecol 37: 105–116.
Weller DM & Cook RJ (1983) Suppression of take-all of wheat by
seed treatment with fluorescent pseudomonads.
Phytopathology 73: 463–469.
Weller DM, Raaijmakers JM, McSpadden-Gardener BB &
Thomashow LS (2002) Microbial populations responsible for
specific soil suppressiveness to plant pathogens. Annu Rev
Phytopathol 40: 309–348.
FEMS Microbiol Ecol 56 (2006) 64–78c� 2006 Federation of European Microbiological SocietiesPublished by Blackwell Publishing Ltd. No claim to original US government works.
78 L. De La Fuente et al.
Top Related
Copyright © 2022 FDOKUMEN

